0 2 4 6 8 10 12 Assessed Acceptable Risk reduction delivered by available risk management options Level of risk ALOP Appropriate level of protection A-PDF Split DEMO : Purchase from www.A-PDF.com to remove the watermark A-PDF Split DEMO : Purchase from www.A-PDF.com to remove the watermark

Welcome message from author
This document is posted to help you gain knowledge. Please leave a comment to let me know what you think about it! Share it to your friends and learn new things together.
Transcript
0
2
4
6
8
10
12
Assessed Acceptable
Risk reduction delivered by available risk management options
Lev
el o
f ris
kALOPALOP
Appropriate level of protection
A-P
DF
Split D
EM
O : P
urchase from w
ww
.A-P
DF
.com to rem
ove the waterm
arkA
-PD
F S
plit DE
MO
: Purchase from
ww
w.A
-PD
F.com
to remove the w
atermark
Supported by:ASEAN-Australia Development Cooperation Program Stream.
Strengthening ASEAN Risk Assessment
Capability toSupport Food Safety
Measures
2007
Technical coordinator: FSANZ Australia
CHEMICAL RISK ASSESSMENTCASE STUDY
Prepared by ASEAN Countries
AFLATOXINS IN PEANUTS AND OTHER FOODS
CASE STUDY

Potency Values
HbsAg+• 0.3 cancers/year
per 100,000 population per ng aflatoxin/kg bw per day
• Uncertainty range 0.05 to 0.5
HBsAg-• 0.01 cancers/year per
100,000 population per ng aflatoxin/kg bw per day
• Uncertainty range 0.002 to 0.03
Source: JECFA

Exposure to aflatoxins from peanuts and other foods for ASEAN countries
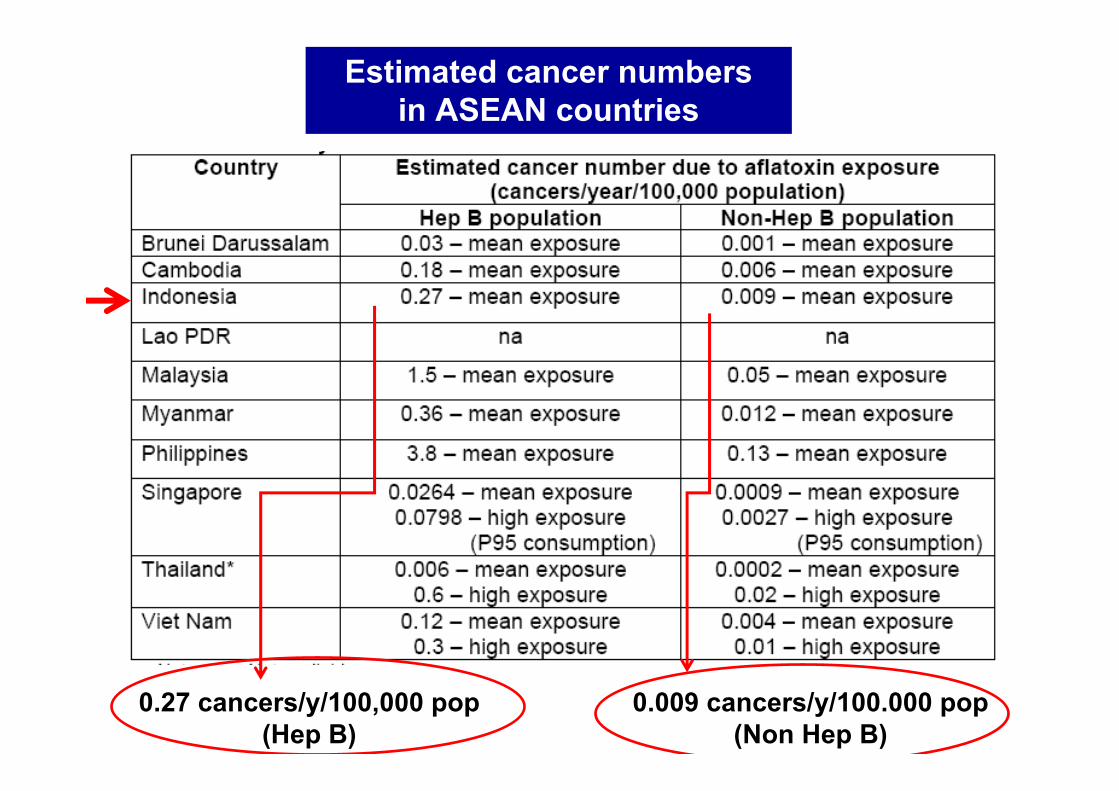
Estimated cancer numbers in ASEAN countries
0.27 cancers/y/100,000 pop (Hep B)
0.009 cancers/y/100.000 pop (Non Hep B)

Food Group Number of
samples
Number (%) of samples
contaminated with aflatoxin
Range (mean) of total aflatoxin content
(µg/kg)
Bumbu pecel/gado-gado (peanut dressing, almost similar with sate sauce)
29 29 (100) 5 – 221 (25.5)TLC -AOAC Official
Method(LOD 5 ppb)
Peanut 141 141 (100) 1.7 - 124 (5.83)ELISA Methods
(LOD 1.7 ppb)
Aflatoxin B1 concentration in peanut and peanut sauce in Indonesia
Source: Ambarwati (2007) in ASEAN- Australia Development Cooperation Program Stream
Source: Ambarwati (2007) in ASEAN- Australia Development Cooperation Program Stream
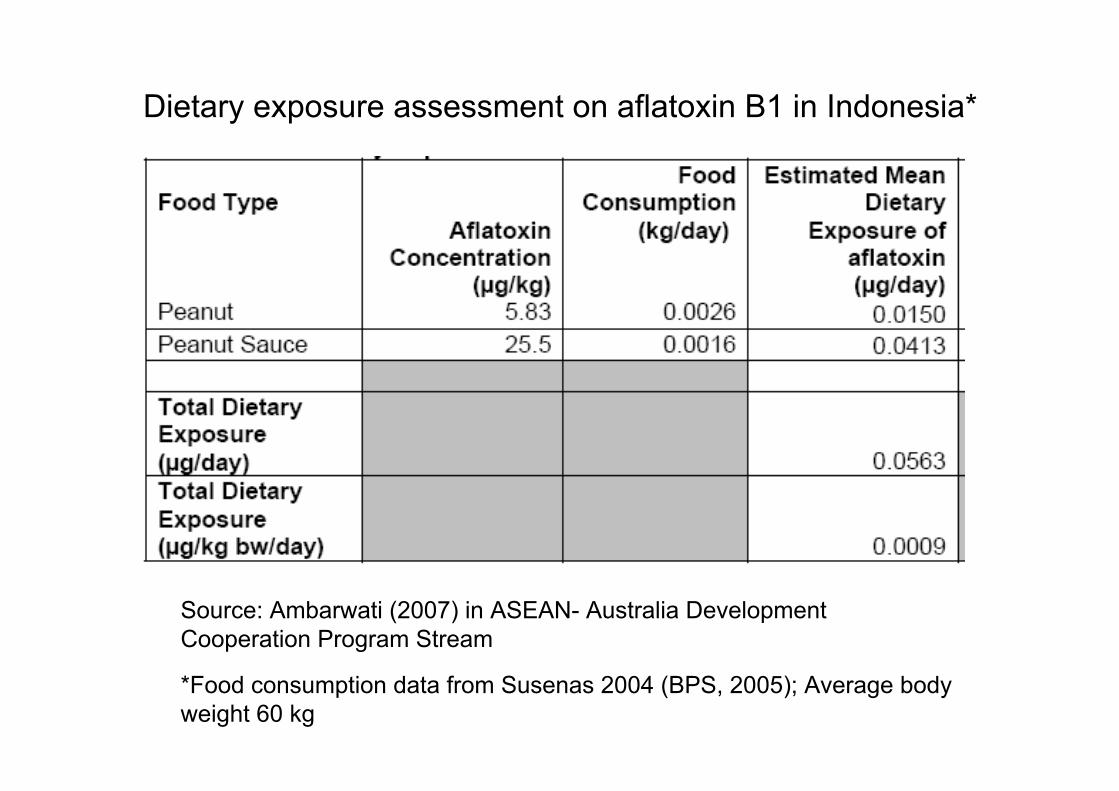
Dietary exposure assessment on aflatoxin B1 in Indonesia*
*Food consumption data from Susenas 2004 (BPS, 2005); Average body weight 60 kg
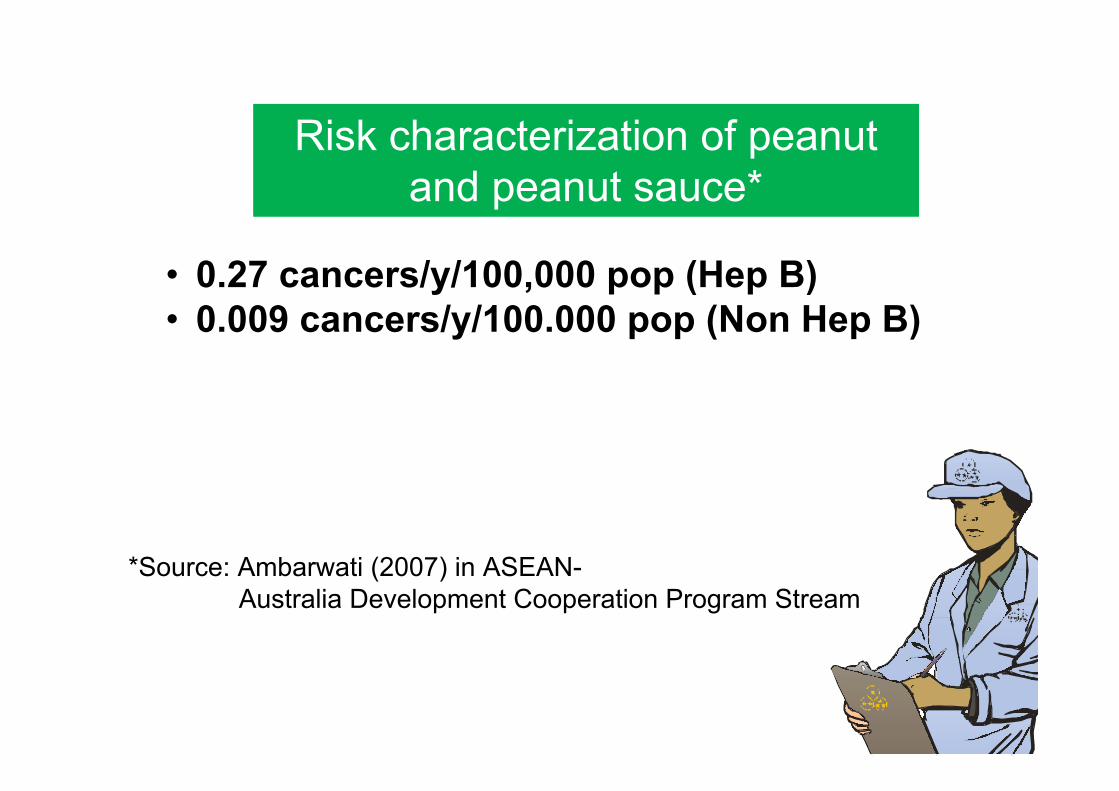
• 0.27 cancers/y/100,000 pop (Hep B)• 0.009 cancers/y/100.000 pop (Non Hep B)
Risk characterization of peanut and peanut sauce*
*Source: Ambarwati (2007) in ASEAN-Australia Development Cooperation Program Stream

Food Type
PeanutsPeanut Sauce
Total dietary exposure (µg/day)
Total dietary exposure (µg/kg bw/day)
Aflatoxin concentration (µg/kg)**
5.8325.5
Food consumption (kg/day)
0.0033 0.0067
Estimated mean dietary exposure of aflatoxin
0.01920.1696
0.1887
0.0032
Dietary intake of aflatoxin B1 in Indonesia from peanut and peanut sauce*
*Sparringa (2008) based on food consumption data 2007; average body weight 60kg; 50 g peanuts in each portion of pecel/gado-gado/ketoprak
**Aflatoxin concentration as reported by Ambarwati (2007)
Food
Consumption
2007
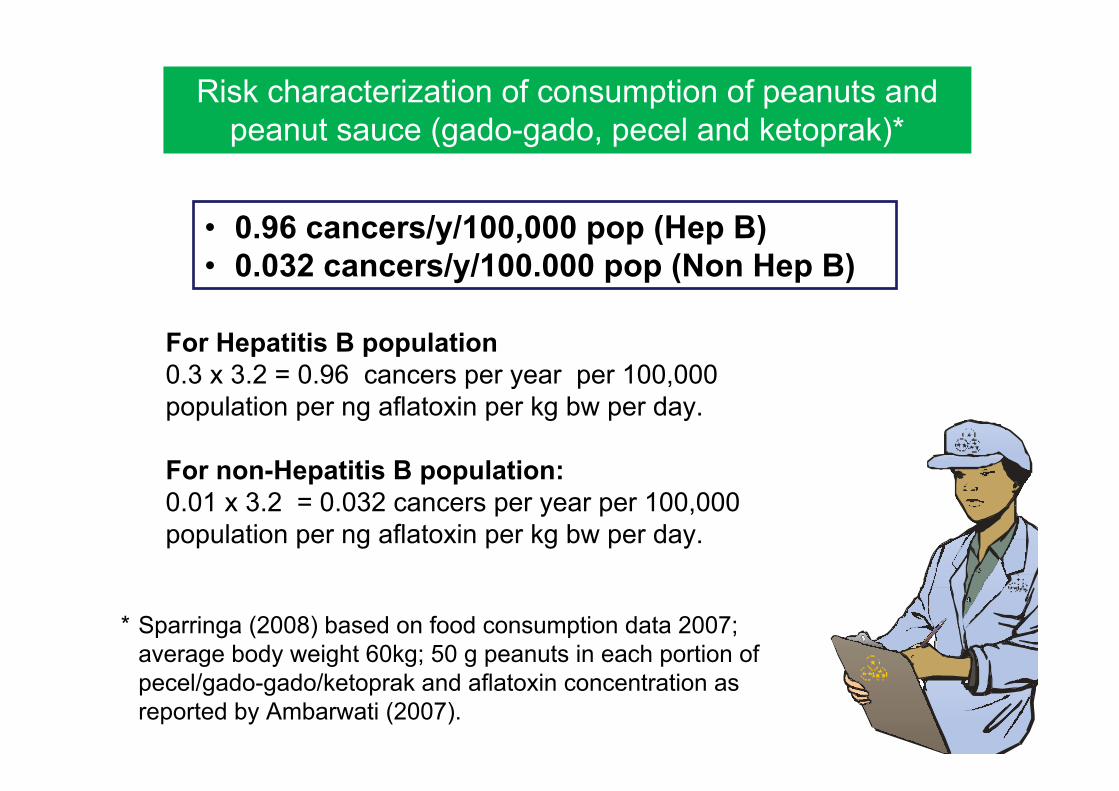
• 0.96 cancers/y/100,000 pop (Hep B)• 0.032 cancers/y/100.000 pop (Non Hep B)
Risk characterization of consumption of peanuts and peanut sauce (gado-gado, pecel and ketoprak)*
For Hepatitis B population 0.3 x 3.2 = 0.96 cancers per year per 100,000 population per ng aflatoxin per kg bw per day.
For non-Hepatitis B population:0.01 x 3.2 = 0.032 cancers per year per 100,000 population per ng aflatoxin per kg bw per day.
* Sparringa (2008) based on food consumption data 2007; average body weight 60kg; 50 g peanuts in each portion of pecel/gado-gado/ketoprak and aflatoxin concentration as reported by Ambarwati (2007).
Related Documents


![ALOP GUBITAK BUDU]EG PROFITA - BosnaRe | Naslovna · 2015-12-26 · • ALOP pokriće je pokriće visokog rizika i nije ga uvijek lako dobiti. Većina klijenate će cijeniti ovakvu](https://static.cupdf.com/doc/110x72/5e3b3412d216aa05d9072c45/alop-gubitak-budueg-profita-bosnare-2015-12-26-a-alop-pokrie-je-pokrie.jpg)