APPRAISAL DOCUMENT OF TWELFTH FIVE YEAR PLAN 2012-17 NITI Aayog National Institution for Transforming India www.niti.gov.in

Welcome message from author
This document is posted to help you gain knowledge. Please leave a comment to let me know what you think about it! Share it to your friends and learn new things together.
Transcript
APPRAISAL DOCUMENT OF
TWELFTH FIVE YEAR PLAN
2012-17
NITI AayogNational Institution for Transforming India
www.niti.gov.in

The exercise of appraisal of the Twelfth Five Year Plan (2012-17) was undertaken as a follow up ofthe decisions taken at the first meeting of the Governing Council of NITI Aayog on 8th February 2015.ThisAppraisal assesses the performance during the first four years of the plan and spells out policy-or implementation-related changes aimed at furthering the development agenda of the nation. It broadly covers physical andfinancial achievements during the first four years of the Plan (2012-13 to 2015-16) vis-à-vis the targets.Where appropriate, it also discusses Budget Estimates for the terminal financial year (2016-17).
In a significant departure from the past, this appraisal does not take a chapter-by-chapter approach.Instead, it selects nine major thematic areas encompassing the economy and elaborates upon them. Theemphasis is on gleaning lessons and chartering the way forward.
The opening Theme Chapter titled ‘The Economy & Policies: An Overview’ assesses theperformance of the economy against the targets at the aggregate level and discusses the policy initiatives ofthe present government in the context of the overall objective of poverty alleviation. The Theme Chapter on‘Macro Economic Factors’ offers the overall background and Plan financing, while the chapter on‘Governance’ discusses a variety of measures aimed at improving the efficiency of the economy. Issuesrelated to growth with inter-generational equity are addressed in the chapter devoted to the study of‘Environmental Sustainability’. The development of human capital, which cuts across all sectors of theeconomy, is spread over two chapters: ‘Employment & Skill Development’ and ‘Human Resource Development’.The former chapter focuses on skill creation, vocational education and labour-market issues while the latterconcentrates on education, health and woman and child development. The all-important issues of infrastructureincluding those relating to energy are taken up in the chapter entitled ‘Physical Infrastructure’. Two remainingchapters are devoted to overall ‘Agriculture and Rural Transformation’ and ‘Urban Transformation’.
To revive growth and overcome structural constraints in the economy, key policy reforms havebeen undertaken by the Government, while many more like the Goods and Services Tax (GST) are in thepipeline. In the spirit of cooperative federalism, States and the Central Government have joined hands intaking the reform process forward in the important area of labour, which is in the Concurrent List of theConstitution. Rajasthan, Madhya Pradesh, Andhra Pradesh and Gujarat have introduced far-reaching reforms
Arvind PanagariyaVice Chairman, NITI Aayog
Foreword
in this area that the central government has approved. These reforms and initiatives would give further pushto the economy, which is already on a higher growth path, inspite of two consecutive droughts.
The current financial year (2016-17) is the terminal year of the Twelfth Five-year Plan.When thepresent Government took charge, it was tentatively decided that the remaining period of the current FiveYear Plan would serve as a transition period. At the time, it was felt that a call on the question of whatought to replace Five Year Plans may be taken later. This call has now been taken and NITI Aayog hasbeen tasked with preparing the following documents:
(i) A vision document keeping in view the social goals set and/or proposed for a period of 15years;
(ii) A 7-year strategy document spanning 2017-18 to 2023-24 to convert the longer-term vision intoimplementable policy and action as a part of a “National Development Agenda”; and
(iii) A 3-year Action document for 2017-18 to 2019-20 aligned to the predictability of financial resourcesduring the 14th Finance Commission Award period. This is also to help translate into actions thegoals of the government to be achieved by 2019.
To carry out formulation of these documents NITI Aayog has initiated consultations with the UnionMiniseries, State Governments and experts from all walks of life.
The decision to discontinue Five Year Plans has also meant that the distinction between plan andnon-plan expenditures conventionally made will no longer be made in the future Budgets beginning 2017-18.This is a suggestion that has long been made by economists. The principal distinction will now be betweenrevenue and capital expenditures.
A document such as this requires a massive effort and is the result of efforts of many. The bulk ofthe work on it was done when Smt. Sindhushree Khullar was the CEO, NITI Aayog. Her guidance and hardwork were critical to the completion of the document. The document also benefited greatly from guidanceand comments provided at various stages by NITI Aayog Members Shri Bibek Debroy, Dr. V.K Saraswatand Prof. Ramesh Chand. Shri Amitabh Kant, CEO, NITI Aayog, who joined the NITI Aayog as the CEOin January 2016, has been a constant source of encouragement and guidance to the team in the course ofupdating and finalizing the document. My sincere thanks are also due to our two very able AdditionalSecretaries, all the nodal advisers, group advisers and their teams for preparation of their theme chaptersand their valuable support in completing the exercise. Special thanks go to Dr. P.K Anand, Senior Consultant,for coordinating the work on the document and Shri B.B. Sharma, Director and Shri R.B.Tyagi, ResearchAssociate for assisting Dr. Anand from beginning to end. Finally, I wish to acknowledge the contribution ofstaff of all the Verticals/Divisions, NITI Aayog.
(Arvind Panagariya)
Contents
List of Figures i - ii
List of Tables iii - v
List of Boxes vi - vii
List of Acronyms viii - xxiii
List of Annexures xxiv
Chapters
1. The Economy & Policies: An Overview 1-13
2. Macroeconomic Factors 14-45
3. Employment and Skill Development 46-67
4. Governance 68-92
5. Human Resource Development 93-139
6. Physical Infrastructure 140-185
7. Environmental Sustainability 186-206
8. Agriculture and Rural Transformation 207-239
9. Urban Transformation 240-266

Figures
1.1 Shares of Manufacturing, Other Industry, Agriculture and Services in the GDP atConstant (Base 2004-05) Prices 4
1.2 Exports of Clothing and Accessories by China and India, 1997 to 2013 5
1.3 Employment in Apparel by Firm Size and Number of Workers- India v/s China 7
2.1 Composition of Household Sector Savings 23
2.2 India’s Trade Deficit and Current Account Deficit 30
5.1 Infant Mortality Rate 94
5.2 Maternal Mortality Rate 94
5.3 Total Fertility Rate 94
5.4 Major Education Indicators in Primary and Upper Primary Levels 109
5.5 Trend in Child Sex Ratio (0-6 years by Residence) (Rural Urban Disaggregation) 133
6.1 Targets/ Achievements for Capacity Addition in Five Year Plans (MW) 141
6.2 Gap between Average Cost of Supply (ACS) and Average Tariff, 2007-08 to 2012-13 144
6.3(a) Twelfth Plan Targets & Actual Production from Coal India Limited (CIL) (in MTS) 148
6.3(b) Targets & Achievements-Overall (in MTS) 148
6.4 Solar and Wind Power: Targets and Achievements 149
6.5 Crude Oil and Natural Gas: Twelfth Plan Targets and Achievements 154
6.6 Uncovered Villages (Mobile) 159
8.1 GDP and Agriculture Sector Growth 209
8.2 Expenditure Pattern of Ministry of Agriculture 210
8.3 Achievements Against Targets of Foodgrains Production During Twelfth Plan 212
8.4 Total Expenditure and Works Undertaken Under MGNREGA 226
8.5 Status of Rural Habitations Covered w.r.t. 40 Ipcd Drinking Water Supply 230

ii
8.6 Number of Beneficiaries and Expenditure Under NSAP 233
9.1 Key Constituents of India’s Urban Future 242
9.2 Inter-State Variation in Progress of Reforms 246
9.3 Shortage of Urban Housing (2012) 250
FIGURES
iii
Tables
1.1 Growth Rates of Gross Value Added (GVA) and GDP at Market Prices 2(Constant 2011-12 Prices)
2.1 Growth Rates of GDP and GVA 16
2.2 Annual Growth Rate of GVA by Economic Activity at Constant (2011-12) Basic Prices 16
2.3 Sectoral Contribution to GVA at Current Prices 17
2.4 Growth Rates of State Domestic Product at 2004-05 Prices 19
2.5 Comparative Growth Rates in GSDP for Selected Low-Income States 20
2.6 Sectoral Growth Rates of State Domestic Product at 2004-05 Prices 21
2.7 The Saving and Investment Rates at Current Prices 22
2.8 Composition of Fixed Investment 22
2.9 Composition of Savings 23
2.10 Fiscal Position of Centre 25
2.11 Fiscal Position of the State Governments 25
2.12 Total Liabilities of the Central and State Governments 26
2.13 Wholesale Price Index, Annual Variation (Base 2004-05=100; per cent Change) 27
2.14 Consumer Price Index, Annual Variation (per cent Change) 28
2.15 Top Five Commodities Exported and Imported (April 2015-January 2016) 30
2.16 External Payments – Current and Capital Account 31
2.17 Twelfth Plan Projection and Realization of Resources of the Centre (per cent of GDP) 34
2.18 Twelfth Plan Projection and Realization of Resources of the Centre(Rs. crore at current prices) 35
2.19 Twelfth Plan Projection and Realization of Resources of the States(including Delhi & Puducherry) (per cent of GDP) 36
iv TABLES
2.20 Twelfth Plan Projection and Realization of Resources of the States(including Delhi & Puducherry) (Rs. crore at current prices) 37
2.21 Summary of the Grants-in-Aid to the States for 2015-20 38
2.22 Phasing of Budget/Expenditure 39
2.23 Summary of Budget and Expenditure of PFMS for the 12th Five Year Plan 39
2.24 Composition of Plan and Non-Plan Expenditure 41
3.1 Labour Market Scenario 47
3.2 Female Labour Force Participation Rate Per 1000 47
3.3 Net Increase in Employment Over the NSSO Rounds 48
3.4 Sector-wise Distribution of Employed Persons 48
3.5 Formal and Informal Employment Across Organized and Unorganized Sectors 49
3.6 Change in Estimated Employment in Selected Sectors 49
3.7 Contribution of Tourism to Total Gross Domestic Product and Employment 50
3.8 Distribution of Establishment by Size and Class of Employment 53
3.9 Annual Skilling Targets and Achievements 59
4.1 Financial Progress of Plan Schemes of Disaster Management during Twelfth Plan 87
5.1 Twelfth Plan Achievements: Monitorable National Goals 93
5.2 Achievement of Goals: Communicable Diseases 99
5.3 Financing for Health: Twelfth Plan Funding 106
5.4 Physical Target and Achievement of Flagship ICDS Scheme 2012-13 to 2015-16 109
5.5 Twelfth Plan Outlay and Expenditure of Ministry of Women and Child Development 139
7.1 Monitorable Targets, Sub-sectoral Targets and Achievements 192
7.2 Targets of Namami Gange 193
7.3 Horizontal Devolution Formula in the Recent Finance Commissions 196
7.4 Royalty Revision for States 203
8.1 Physical Progress Under MGNREGA During Twelfth Plan (2012-17) 226
8.2 Plan Allocation & Expenditure of Major Programmes Under Ministry of Rural Development 234
9.1 Urban Reforms and Their Broad Objectives 243
9.2 Progress under JNNURM as on April, 2016 245
9.3 State/ UT-wise Achievement of Urban Reforms 246
9.4 Progress of In compete Projects Under UIG, UIDSSMT, BSUP, IHSDP & RAY 247
v
9.5 Central Assistance in Water & Sanitation 252
9.6 Status of City-wise Metro Rail Projects 256
9.7 Non-Farm Job Creation in Villages 259
9.8 Education Status for Migrants (Male) from Rural to Urban Areas by Duration of Stay(in per cent) 261
9.9 Education Status for Seasonal Migrants from Rural to Urban Areas by Duration of Stay(in per cent) 261
9.10 PPP Projects 262
TABLES
vi
Boxes
4.1 Recommendations of the Fourteenth Finance Commission 69
4.2 Panchayat Devolution Index 70
4.3 Efficient Management of Public Expenditure 72
4.4 NGO-Partnership System Portal 73
4.5 The Voluntary Sector: The Way Forward 74
4.6 IT-enabled Monitoring of Projects and Programmes 75
4.7 Mission Mode Projects under National e-Governance Plan 76
4.8 The Nine Pillars of Digital India 77
4.9 New Mission Mode Projects under e-Kranti 77
4.10 e-Governance Initiatives: The Way Forward 78
4.11 Aadhaar: The Way Forward 84
5.1 Best Practices of Convergence 101
5.2 Best Practices for Information Technology in Health 103
5.3 Best Practices for Public Private Partnership 107
5.4 Evaluation of KGBV 110
5.5 Educational Achievements from 2010-11 to 2014-15 111
5.6 Narayana Murthy Committee’s Recommenda-tions on Corporate SectorParticipation in Higher Education 120
5.7 Summary of National Family Health Survey 4 (2015-16) Findings inPhase-I-States and UTs 127
5.8 Checking Anganwadi Centres 129
5.9 ICDS Best Practices 129
vii
5.10 Maharashtra’s Use of Technology to Monitor ICDS Outcome 130
5.11 Improving the Child Sex Ratio: Best Practices from States 133
6.1 RE-INVEST 2015 152
6.2 Petroleum and Natural Gas Schemes 156
6.3 Major Telecom Policy Measures since 2012 158
6.4 Digital India 160
6.5 Communication Sector: Near-Future Tasks 161
6.6 The Financing of Infrastructure 175
7.1 National Water Policy, 2012 191
7.2 Mobile-based Governance in Water Management 194
7.3 Water Regulatory Authorities 195
7.4 Sustainable Development Goals 201
9.1 Recommendations of 14th Finance Commission, accepted by Government 248
9.2 Reforms in Urban Water and Sanitation and Desired Outcomes 252
9.3 Sanitation: Current Challenges 253
BOXES
viii ACRONYMS
AAI Airports Authority of India
AAY Antyodaya Anna Yojana
ABL Activity-Based Learning
ACA Additional Central Assistance
ACQ Annual Contracted Quantity
ACRA Accounting and Corporate RegulatoryAuthority
ACS Average Cost of Supply
AD Accelerated Depreciation
AE Advance Estimates
AEGR Annual Exponential Growth Rate
AePS Aadhaar-enabled Payment System
AGs Accountant Generals
AIATSL Air India Air Transport Services Ltd
AIBP Accelerated Irrigation BenefitsProgramme
AICTE All India Council for TechnicalEducation
AIESL Air India Engineering Services Ltd.
AIIMS All India Institute of Medical Sciences
AIM Atal Innovation Mission
AISHE All India Survey on Higher Education
AMRUT Atal Mission of Rejuvenation andUrban Transformation
AMS Aggregate Measure of Support
ANC Ante Natal Care
ANM Auxiliary Nurse & Midwife
ANSCI Air Navigation Services Corporation ofIndia
AP Andhra Pradesh
AP Annual Plan
APB Aadhaar Payment Bridge
APMC Agricultural Produce MarketingCommittee
APY Atal Pension Yojana
ARC Administrative Reforms Commission
ASA Authentication Service Agencies
ASER Annual Status of Education Report
ASHA Accredited Social Health Activist
ASU&H Ayurveda, Siddha, Unani andHomoeopathy
Acronyms
ACRONYMS ix
AT&C Aggregate Technical & Commercial
ATFC Agriculture Technology ForecastCentre
ATIs Advanced Training Institutes
ATIF Agritech Infrastructure Fund
AUA Authentication User Agencies
AWCs Anganwadi Centres
AWW Anganwadi Workers
AYUSH Ayurveda, Yoga and Naturopathy,Unani, Siddha and Homoeopathy
B.Sc Bachelor of Nursing Science(Nursing)
BCC Behavior Change Communication.
BCM Billion Cubic Metre
BCR Balance from Current Revenues
BE Budget Estimates
BGREI Bringing Green Revolution to EasternIndia
BOT Build–operate–transfer
BPL Below Poverty Line
BPO Business Process Outsourcing
BRC Block Resource Centre
BRGF Backward Region Grant Funds
BSI Botanical Survey of India
BSNL Bharat Sanchar Nigam Limited
BSR Basic Science Research
BSUP Basic Services to the Urban Poor
BU Billion Units
CAA Constitution Amendment Act
CABE Central Advisory Board of Education
CAD Command Area Development
CAD Current Account Deficit
CAGR Compound Annual Growth Rate
CAL Computer Aided Learning
CAMPA Compensatory Afforestation FundManagement and Planning Authority
CAPEX Capital Expenditure
CAS Central Assistance to States
CASP Central Assistance to State & UT Plans
CBD Convention on Biological Diversity
CBDM Community Based DisasterManagement
CBDT Central Board of Direct Taxes
CBHI Central Bureau of Health Intelligence
CBS Core Banking Solution
CCEA Cabinet Committee on EconomicAffairs
CCTNS Crime & Criminal Tracking Networkand Systems
C-DAP Comprehensive District AgriculturalPlan
CDB Coconut Development Board
CDSCO Central Drugs Standard ControlOrganization
CEA Central Electricity Authority
CELC Child Enrolment Lite Client
CETP Common Effluent Treatment Plant
CEZ Coastal Economic Zone
CFPI Consumer Food Price Indices
CFSD Credit Framework for SkillDevelopment
CGA Controller General of Accounts
CGHS Central Government Health Scheme
CGSSD Credit Guarantee Fund Scheme forSkill Development
x ACRONYMS
CHC Custom Hiring Centre
CHC Community Health Centre
CHP City HRIDAY Plans
CIDR Central Identity Repository
CIL Coal India Limited
CIS Changes in Stock
CITS Craftsman Instructor Training Scheme
CSR Child Sex Ratio
CSW Civil Society Window
CMP Comprehensive Mobility Plan
CNG Compressed Natural Gas
COBSE Council of Boards of School Education
CoE Centre of Excellence
CoP Conference of the Parties
COS Committee of Secretaries
CPE Colleges with Potential for Excellence
CPEPA Centre with Potential for Excellence inParticular Area
CPGRAMS Centralised Public Grievance Redressaland Monitoring System
CPHEEO Central Public Health & EnvironmentalEngineering Organisation
CPI Consumer Price Index
CPI-AL Consumer Price Index- AgriculturalLabourers
CPI-IW Consumer Price Index- IndustrialWorkers
CPMU Central Project Monitoring Unit
CPSE Central Public Sector Enterprise
CPSMS Central Plan Scheme MonitoringSystem
CRC Cluster Resource Centre
CRF Central Road Fund
CRS Civil Registration System
CRZ Coastal Regulation Zone
CSC Common Service Centre
CSO Central Statistics Office
CSR Corporate Social Responsibility
CSS Centrally Sponsored Schemes
CSU Central Surveillance Unit
CTET Central Teacher Eligibility Test
CTSA Central Tibetan Schools Administration
CWCs Child Welfare Committees
CWIP Cumulative Work in Progress
CWSN Children With Special Needs
DAE Department of Atomic Energy
DBFOT Design Build Finance Operate Transfer
DBT Direct Benefit Transfer
DBTL Direct Benefit Transfer of LPG
DCPUs District Child Protection Units
DDSVP Demographic Data Standards andVerification Committee Report
DDUGJY Deendayal Upadhyaya Gram JyotiYojna
DDU-GKY Deen Dayal Upadhyaya GrameenKaushalya Yojana
DEA Department of Economic Affairs
DEC Distance Education Council
DeitY Department of Electronics,Information & Technology
DFC Dedicated Freight Corridor
DFPD Department of Food and PublicDistribution
DGET Directorate General of Employment &Training
DGHS Directorate General of Health Services

ACRONYMS xi
DGMS Directorate General of Mines Safety
DGT Directorate General of Training
DIPP Department of Industrial Policy andPromotion
DH District Hospital
DHR Department of Health Research
DIET District Institute of Education andTraining
DISE District Information System ofEducation
DLHS District Level Health Survey
DLVMC District Level Vigilance and MonitoringSystem
DMEO Development Monitoring EvaluationOffice
DMIC Delhi-Mumbai Industrial Corridor
DMRC Delhi Metro Rail Corporation
DoE Department of Expenditure
DoT Department of Telecommunications
DOTS Directly Observed Treatment – ShortCourse
DPMUs District Project Monitoring Units
DPR Detailed Project Report
DRDA District Rural Development Agency
DSS Decision Support System
DSU District Surveillance Unit
DTCK Direct Transfer of Cash Subsidy onPDS Kerosene
DU Dwelling Units
EAG Empowered Action Group
EBB Educationally Backward Blocks
EC Economic Census / EnvironmentalClearance
ECCE Early Childhood Care and Education
EDFC Eastern Dedicated Freight Corridor
EDL Essential Drug List
EDS Electronic Delivery of Services
EFC Expenditure Finance Committee
e-FMS Electronic Fund Management System
EID Enrolment Identity
EMP Environment Management Plan
e-MR Electronic Muster Roll
EMR Electronic Medical Record
EPC Engineering Procurement andConstruction
EPF Employees’ Provident Fund
EPFO Employees’ Provident FundOrganisation
EPS Employees’ Pension Scheme
ERM Extension, Renovation andModernization
ESI Employees’ State Insurance
ESIC Employees’ State InsuranceCorporation
ESSO Earth System Science Organization
EST&P Employment through Skills Training &Placement
EWS Economically Weaker Sections
FAO Food and Agriculture Organization
FAR Floor Area Ratio
FC Forest Clearance
FC Finance Commission
FCI Food Corporation of India
FDI Foreign Direct Investment
FFC Fourteenth Finance Commission
xii ACRONYMS
FICCI Federation of Indian Chambers ofCommerce & Industry
FII Foreign Institutional Investment
FIPB Foreign Investment Promotion Board
FPI Foreign Portfolio Investment
FPOs Farmer Producer Organisations
FPS Fair Price Shop
FR Feasibility Report
FRBM Fiscal Responsibility and BudgetManagement
FRP Financial Restructuring Plan
FRU First Referral Unit
FSA Fuel Supply Agreement
FSI Floor Space Index
FSSAI Food Safety and Standards Authorityof India
FTA Foreign Tourist Arrivals
FTAs Free Trade Agreements
FY Financial Year
GAD General Arrangement Drawings
GAK Gram Aarogya Kendra
GBS Gross Budgetary Support
GCA Gross Cropped Area
GCF Gross Capital Formation
GDP Gross Domestic Product
GDPfc Gross Domestic Product at FactorCost
GDPmp Gross Domestic Product at MarketPrices
GER Gross Enrolment Ratio
GFCF Gross Fixed Capital Formation
GIM National Mission for a Green India
GIS Geographical Information System
GMO Genetically Modified Organism
GOI Government of India
GP Gram Panchayat
GPR Government Process Re-engineering
GPS Global Positioning System
GPs Gram Pachayats
GSDP Gross State Domestic Product
GSI Geological Survey of India
GST Goods and Services Tax
GVA Gross Value Added
HBNC Home Based New Born Care
HEFA Higher Education Financing Agency
HEMM Heavy Earth Moving Machinery
HELP Hydrocarbon Exploration andLicensing Policy
HIS Health Information System
HIV/AIDS Human Immunodeficiency Virus /Acquired Immune DeficiencySyndrome
HLC High Level Committee
HLEC High Level Expert Committee
HMIS Health Management InformationSystem
HNEC HRIDAY National EmpoweredCommittee
HP Himachal Pradesh
HPEC High Powered Expert Committee
HR Human Resource
HRD Human Resource Development
HRIDAY National Heritage City Developmentand Augmentation Yojana
HSD High-Speed Diesel
ACRONYMS xiii
HSRT Hunar Se Rozgar Tak
HW (F) Health Worker (Female)
IAP Integrated Action Plan
IARI Indian Agricultural Research Institute
IAY Indira Awaas Yojana
IBA Indian Banks Association
IBM Indian Bureau of Mines
ICAR Indian Council of AgriculturalResearch
ICDS Integrated Child Development Services
ICMR Indian Council of Medical Research
ICOR Incremental Capital Output Ratio
ICPS Integrated Child Protection Services
ICRIER Indian Council for Research onInternational Economic Relations
ICT Information and CommunicationTechnology
IDSP Integrated Disease SurveillanceProgramme
IEBR Internal and Extra BudgetaryResources
IEC Information, Education andCommunication
IEM Industrial Entrepreneur Memorandum
IFMR Institute for Financial Management andResearch
IGMSY Indira Gandhi Matritva Sahyog Yojana
IGNDPS Indira Gandhi National DisabledPension Scheme
IGNOAPS Indira Gandhi National Old AgePension Scheme
IGNWPS Indira Gandhi National Widow PensionScheme
IGRUA Indira Gandhi Rashtriya Uran Akademi
IHHL Individual Household Latrines
IHM Institute of Hotel Management
IHSDP Integrated Housing & SlumDevelopment Programme
IIAN Indian Institute of Advanced Nursing
IIFCL India Infrastructure Finance CompanyLtd.
IIIT Indian Institute of InformationTechnology
IIM Indian Institute of Management
IISC Indian Institute of Science
IISER Indian Institute of Science Educationand Research
IIT Indian Institute of Technology
IL Industrial License
ILO International Labour Organization
IMC Inter Ministerial Committee
IMF International Monetary Fund
IMR Infant Mortality Rate
INAP India Newborn Action Plan
INIs Institutions of National Importance
INSTAL Identification and Nurturing ofSporting Talent
INVIT Infrastructure Investment Trust
IOR International Offshore Rule
IPC Irrigation Potential Created / InterPersonal Communication / InternalPlanning Commission
IPDS Integrated Power DevelopmentScheme
IPHS Indian Public Health Standard
IPU Irrigation Potential Utilized
IREDA Indian Renewable Energy DevelopmentAgency Ltd.
xiv ACRONYMS
IRDA Insurance Regulatory andDevelopment Authority
IRFC Indian Railway Finance Corporation
ISM Indian System of Medicines
ISPs Internet Service Providers
ISSNIP ICDS Systems Strengthening &Nutrition Improvement Project
ISWP Integrated State Water Plan
IT Information technology
ITCS Information Technology andCommunication Services
ITES Information Technology EnabledServices
ITI Industrial Training Institutes
ITR Income Tax Return
IUCD Intra Uterine Contraceptive Device
IVRS Interactive Voice Response System
IWAI Inland Waterways Authority of India
IWMP Integrated Watershed ManagementProgramme
IWT Inland Water Transport
JAM Jan-dhan, Aadhaar and Mobilenumbers
JDY Jan Dhan Yojana
JFMC Joint Forest Management Committees
JIPMER Jawaharlal Institute of Post GraduateMedical Education and Research
JJBs Juvenile Justice Boards
JMC Joint Management Committee
JNPT Jawaharlal Nehru Port Trust
JNNSM Jawaharlal Nehru National SolarMission
JNNURM Jawaharlal Nehru National UrbanRenewal Mission
JNV Jawahar Navodaya Vidyalaya
JPMC Joint Programme ManagementCommittee
JVC Joint Venture Company
KGBV Kasturba Gandhi BalikaVidyalaya
Km Kilometer
KMC Kangaroo Mother Care
KSA e-KYC Service Agency
KVA e-KYC User Agency
KVKs Krishi Vigyan Kendras
KVS Kendriya Vidyalaya Sangathan
KYC Know Your Customer
LAN Local Area Net Work
LBFL Local Bodies Finance List
LCC Low-Cost Carriers
LE Latest Estimates
LFPR Labour Force Participation Rate
LHVs Lady Health Visitors
LIGs Low Income Group
LIN Labour Identification Number
LMIS Labour Market Information System
LNG Liquid Natural Gas
LPCD Litres Per Capita Per Day
LPG Liquefied Petroleum Gas
LR Land Readjustment
LRT Light Metro Rail
LWE Left Wing Extremism
MA Mukhyamantri Amrutam
MANAS Maulana Azad National Academy forSkills
MBBS Bachelor of Medicine, Bachelor ofSurgery
ACRONYMS xv
MC Mentor Councils
MCA Model Concession Agreement
MCCs Model Career Centres
MCDR Mineral Conservation and DevelopmentRules
MCI Medical Council of India
MCR Miscellaneous Capital Receipts
MCTS Mother and Child Tracking System
MDG Millennium Development Goal
MDM Mid-Day Meal
MDMS Mid-Day Meals in Schools
MDWS Ministry of Drinking Water andSanitation
MEA Ministry of External Affairs
MEP Minimum Export Price
MES Modular Employable Scheme
MGNREGA Mahatma Gandhi National RuralEmployment Guarantee Act
MGNREGS Mahatma Gandhi National RuralEmployment Guarantee Scheme
Mha Million hectare
MHRD Ministry of Human ResourcesDevelopment
MIDH Mission for Integrated Development ofHorticulture
MIS Management Information System
MIS Market Intervention Scheme
MKSP MahilaKisanSashaktikaranPariyojana
MLA Members of Legislative Assembly
MLD Million Litres per Day
MMDR Mines and Minerals (Development &Regulation)
MMI Major & Medium Irrigation
MMP Mission Mode Project
MMR Maternal Mortality Ratio
MMS Mid-day Meal Scheme
MMSCMD Million Metric Standard Cubic MeterPer Day
MMTPA Million Metric Tonnes Per Annum
MoCA Ministry of Civil Aviation
MoDWS Ministry of Drinking Water Supply
MoEF&CC Ministry of Environment, Forest &Climate Change
MoH&FW Ministry of Health and Family Welfare
MoHUPA Ministry of Housing and UrbanPoverty Alleviation
MoLEM Ministry of Labour and Employment
MOOC Massive Open Online Course
MoPR Ministry of Panchayati Raj
MoRD Ministry of Rural Development
MoRTH Ministry of Road Transport andHighways
MOSPI Ministry of Statistics & ProgrammeImplementation
MoU Memorandum of Understanding
MoUD Ministry of Urban Development
MoWR Ministry of Water Resources
MoWR, Ministry of Water Resources, RiverRD&GR Development and Ganga Rejuvenation
MP Madhya Pradesh / Member ofParliament
MPLADS Member of Parliament Local AreaDevelopment Scheme
MRO Maintenance, Repair & Overhaul
MRP Maximum Retail Price

xvi ACRONYMS
MRTS Metro Rail Transit System
MS Mahila Samakhya
MSDE Ministry of Skill Development andEntrepreneurship
MSI Multi-Skill Institutes
MSG Mission Steering Group
MSME Micro Small & Medium Enterprises
MSPs Minimum Support Prices
MT Million Tonne
MTNL Mahanagar Telephone Nigam Limited
MTPA Million Tonne Per Annum
MTS Mining Tenement System
MUDRA Micro Units Development RefinanceAgency
MVA Microsoft Virtual Academy
MW Megawatts
MW Mega Watt
MWCD Ministry of Women and ChildDevelopment
MYS Mean Year of Schooling
NAAC National Assessment & AccreditationCouncil
NABARD National Bank for Agricuture and RuralDevelopment
NAM National Agriculture Market
NAMP National Air Quality MonitoringProgramme
NAPCC National Action Plan on ClimateChange
NASSCOM National Association of Software andServices Companies
NBA Nirmal Bharat Abhiyan
NBCC Newborn Care Corner
NBS Nutrient-Based Subsidy
NBSU Newborn Stabilisation Unit
NCAP National Civil Aviation Policy
NCC Nagarjuna Construction Company
NCDC National Centre for Disease Control
NCDHR National Campaign on Dalit HumanRights
NCEF National Clean Energy Fund
NCERT National Council of EducationalResearch & Training
NCEUS National Commission for Enterprises inthe Unorganized Sector
NCIIPC National Critical InformationInfrastructure Protection Centre
NCGTC National Credit Guarantee TrusteeCompany
NCHER National Commission for HigherEducation and Research
NCHMCT National Council for HotelManagement and Catering Technology
NCR National Capital Region
NCS National Career Service
NCSL National Centre for School Leadership
NCSP National Career Service Project
NCTE National Council of Teacher Education
NCVT National Council of Vocational Training
NDA National Democratic Alliance
NDMA National Disaster ManagementAuthority
NEAMA National Environment Assessment andMonitoring Authority
NEFC National Environment and ForestryCouncil
ACRONYMS xvii
NeGAP National e-Governance Action Plan
NeGP National e-Governance Plan
NELP New Exploration Licensing Policy
NER North Eastern Region
NERF National Environment RestorationFund
NERIST North Eastern Regional Institute ofScience & Technology
NFBS National Family Benefit Scheme
NFDB National Fisheries Development Board
NFHS National Family Health Survey
NFS Network For Spectrum
NFSA National Food Security Act
NFSM National Food Security Mission
NGIS National Geographical InformationSystem
NGO Non-Government Organisation
NGOs Non-Governmental Organisations
NHAI National Highways Authority of India
NHB National Housing Bank
NHB National Horticulture Board
NHIDC National Highway InfrastructureDevelopment Corporation
NHDP National Highways DevelopmentProject
NHM National Health Mission
NHM National Horticulture Mission
NIC National Informatics Centre
NICRA National Initiatives on Climate ResilientAgriculture
NIHI National Institute of Health Intelligence
NII National Information Infrastructure
NIIF National Investment and InfrastructureFund
NIOS National Institute of Open Schooling
NIP National Institute of Paramedics
NIPFP National Institute of Public Financeand Policy
NIPS National Institute of ParamedicalSciences
NIT National Institute of Technology
NITI National Institution for TransformingIndia
NITSER National Institutes of Technology,Science Education and Research
NIUA National Institute of Urban Affairs
NKN National Knowledge Network
NLCP National Lake Conservation Plan
NLCPR Non-Lapsable Central Pool ofResoures
NLM National Livelihood Mission
NLRMP National Land Records ModernizationProgramme
NMAET National Mission for AgriculturalExtension & Technology
NMCG National Mission on Clean Ganga
NMEICT National Mission on Education throughICT
NME-ICT National Mission on Education throughInformation and CommunicationTechnology
NMEW National Mission for Empowerment ofWomen
NMF-W National Mission for Empowerment ofWomen
NMOOP National Mission for Oilseeds and OilPalm
NMPB National Medicine Plant Board
xviii ACRONYMS
NMSA National Mission for SustainableAgriculture
NMT Non-Motorised Transport
NNCC NRHM-NACP Coordination Committee
NNM National Nutrition Mission
NOC National Oil Companies
NOFN National Optical Fibre Network Project
NOS National Occupational Standards
NPA Non-Performing Assets
NPBBDD National Programme for BovineBreeding and Dairy Development
NPCA National Plan for Conservation ofAquatic Eco-Systems
NPCDCS National Programme for the Preventionand Control of Cancer, Diabetes,Cardiovascular Diseases and Stroke
NPHCE National Programme for Health Care
NPISHs Non-Profit Institutions ServingHouseholds
NPR National Population Register
NPS New Pension Scheme
NPSD New Policy on Seed Development
NPTEL National Programme on TechnologyEnhanced Learning
NQRI National Quality Renaissance Initiative
NRCP National River Conservation Plan
NRDWP National Rural Drinking WaterProgramme
NRHM National Rural Health Mission
NRLM National Rural Livelihoods Mission
NRSC National Remote Sensing Centre
NRSTMB National Road Safety TransportManagement Board
NSAP National Social Assistance Programme
NSDA National Skill Development Agency
NSDC National Skill DevelopmentCorporation
NSDCB National Skill DevelopmentCoordination Board
NSDF National Skill Development Fund
NSQC National Skills Qualification Committee
NSQF National Skill Qualification Framework
NSTSS National Sport Talent Search Scheme
NSS National Sample Survey
NSSO National Sample Survey Organisation
NTDPC National Transport DevelopmentPolicy Committee
NTFP Non-Timber Forest Produce
NTKM Net Tonne Kilometer
NTP-2012 National Telecom Policy-2012
NTPC National Thermal Power CorporationLtd.
NUEPA National University of EducationalPlanning and Administration
NUHM National Urban Health Mission
NULM National Urban Livelihood Mission
NV NavodayaVidyalaya
NVBDCP National Vector Borne Disease ControlProgramme
NVEQF National Vocational EducationQualification Framework
NVS NavodayaVidyalayaSamiti
NVVN NTPC Vidyut Vyapar Nigam Ltd.
NWCP National Wetland ConservationProgramme
NWDA National Water Development Agency
NWRs Negotiable Warehouse Receipts
ACRONYMS xix
NYLP National Young Leader Programme
NYK Nehru Yuva Kendras
NYKS National Youth Corps
O&M Operation & Maintenance
OBCs Other Backward Castes
OCBIS Online Core Business IntegratedSystem
OECD Organisation for EconomicCooperation and Development
OFC Optical Fiber Cable
OMS Output per Man Shift
OMSS Open Market Sales Scheme
OMT Operate, Maintain and Transfer
ONGC Oil and Natural Gas Commission
OIL Oil India Ltd.
OoSC Out of School Children
OROP One Rank One Pension
OSS Open Source Software
OTACA Additional Central Assistance for OtherProjects
PAB Project Appraisal Board
PAN Permanent Account Number
PBL Project-Based Learning
PCC Peripheral Cancer Centre
PCI Per Capita Income
PCPNDT Pre Conception, Pre Natal DiagnosticAct
PDI Panchayat Devolution Index
PDS Public Distribution System
PE Provisional Estimates
PE Permanent Establishment
PECs Permanent Enrolment Centres
PEO Programme Evaluation Organisation
PFMS Project Financial Management System
PFMS Public Finance Management System
PG Postgraduate
PGIMER Post Graduate Institute of MedicalEducation and Research
PHCs Primary Health Centres
PhD Doctor of Philosophy
PHPDT Peak Hour Per Direction Traffic
PIB Public Investment Board
PINDICS Performance Indicators for ElementarySchool Teachers
PIP Participatory Identification of Poor
PIP Programme Implementation Plan
PIU Project Implementation Units
PKM Passenger Kilometer
PLB Permanently Lubricated
PLF Plant Load Factor
PMAY Pradhan Mantri Awaas Yojana
PMDT Programmatic Management of Drug-resistant Tuberculosis
PMFBY Pradhan Mantri Fasal Bima Yojana
PMG Project Monitoring Group
PMGSY Pradhan Mantri Gram Sadak Yojana
PMJDY Prime Minister’s Jan Dhan Yojana
PMJDY Pradhan Mantri Jan-DhanYojna
PMJJBY Pradhan Mantri Jeevan Jyoti BimaYojana
PMKSY Pradhan Mantri Krishi SinchayeeYojana
PMKSY Pradhan Mantri Krishi Sichai Yojana
PMKVY Pradhan Mantri Kaushal Vikas Yojana
xx ACRONYMS
PMMMNMTT Pandit Madan Mohan MalaviyaNational Mission on Teachers andTeaching
PMO Prime Minister Office
PMRDF Prime Minister’s Rural DevelopmentFellows
PMSBY Pradhan Mantri Suraksha Bima Yojana
PMSSY Pradhan Mantri Swasthya SurakshaYojana
PNG Piped Netural Gas
POA Proof of Address
POI Proof of Identity
POL Petroleum, Oil and Lubricant
PoS Point of Sale
PPP Public Private Partnership
PRAGATI Pro-Active Governance and TimelyImplementation
PRASAD Pilgrimage Rejuvenation and SpiritualAugmentation Drive
PRI Panchayati Raj Institutions
PRIA Participatory Research in Asia
PS Primary School
PSEs Public Sector Enterprises
PSF Price Stabilization Fund
PSK Passport Sewa Kendra
PSU Public Sector Undertaking
PSUs Public Sector Undertakings
PTR Pupil Teacher Ratio
PURA Provision of Urban Amenities in RuralAreas
PV Photovoltaics
PwD Person with Disability
PYKKA Panchayat Yuva Krida Aur KhelAbhiyan
QCI Quality Council of India
QP Qualification Packs
R&D Research & Development
R&R Resettlement & Rehabilitation
RAA Rashtriya Aavishkar Abhiyan
RAHI Roads and Highways InformationSystem
R-APDRP Restructured Accelerated powerDevelopment Scheme
RAY Rajiv Awas Yojana
RBI Reserve Bank of India
RBSK Rashtriya Bal Swasthya Karyakram
RCH Reproductive and Child Health
RDA Rail Development Authority
RDG Route Dispersal Guidelines
RE Revised Estimates
RETT Regional Education Technology Team /Revewable Energy Task Team
RFCTLAR&R Right to Fair Compensation andTransparency in Land Acquisition,Rehabilitation and Resettlement
RFD Result Framework Documents
RGGVY Rajiv Gandhi Grameen VidyutikaranYojana
RGI Registrar General of India
RGKA Rajiv Gandhi Khel Abhiyan
RGPSA Rajiv Gandhi PanchayatSashaktikaranAbhiyan
RIDF Rural Infrastructure DevelopmentFund
RIP Regional Institute of Paramedics
ACRONYMS xxi
RIPS Regional Institute of ParamedicalSciences
RKS Rogi Kalyan Samitis
RKVY RashtriyaKrishiVikas Yojana
RLNG Re-gasified Liquefied Natural Gas
RMK Rashtriya Mahila Kosh
RMNCH+A Reproductive, Maternal Newborn,Child Health plus Adolescent
RMSA Rashtriya Madhyamik Shiksha Abhiyan
RNTCB Revised National Tuberculosis ControlProgramme
ROB Robotic Operating Buddy / Road OverBridges
RoR Record of Rights
ROU Right of Use
ROW Rest of the World
RPL Recognition of Prior Learning
RPO Renewable Purchase Obligations
RRB Regional Rural Bank
RRR Repair, Renovation and Restoration
RS Remote Sensing
Rs Rupees
RSBY Rashtriya Swasthya Bima Yojana
RSETI Rural Self-Employment TrainingInstitute
RTA Rail Tariff Authority
RTAs Regional Trade Agreements
RTE Right to Education
RTPV Rooftop Photo voltaic
RUBs Road Under Bridges
RUSA Rashtriya Uchhatar Siksha Abhiyan
RVTI Regional Vocational Training Institute
SAAP State Annual Action plans
SAARC South Asian Association for RegionalCooperation
SAGY Sansad Aadarsh Gram Yojana
SAMVAY Skill Assessment Matrix for VocationalAdvancement of Youth
SAP State Agricultural Plan
SAPCC State Action Plan on Climate Change
SARDPNE Special Accelerated Road DevelopmentProgramme in the North East
SAUs State Agricultural Universities
SBA Skilled Birth Attendants
SBM Swachh Bharat Mission
SBM (G) Swachh Bharat Mission (Gramin)
SC Schedule Caste
SC Scheduled Caste
SCA Special Central Assistance
SCADA Supervisory Control And DataAcquisition
SCCL Singareni Colleries Company Ltd.
SCPS State Child Protection Societies
SCR Student Classroom Ratio
SCs Sub Centres
SDC State Data Centre
SDG Sustainable Development Goal
SDH Sub Divisional Hospital
SECC Socio Economic Caste Census
SECI Solar Energy Corporation of India
SEFC State Environment and ForestryCouncil
SEIAA State Environment Impact AssessmentAuthority
xxii ACRONYMS
SERC State Electricity RegulatoryCommission
SETU Self-Employment and Talent Utilization
SEZ Special Economic Zone
SFAC Small Farmers Agri-businessConsortium
SFC State Finance Commission
SGSY Swarnajayanti Grameen SwarozgarYojana
SHEPs State Higher Education Plans
SHGs Self Help Groups
SIDBI Small Industries Development Bank ofIndia
SIFTI Scheme for Financing ViableInfrastructure Projects
SIM Subscriber Identity Module
SJSRY Swarna Jayanti Shahari Rozgar Yojana
SKO Superior Kerosene
SLWM Solid and Liquid Waste Management
SLNAs State Level Nodal Agencies
SMA State Mission Authority
SMIS Store Management InformationSystem
SN Staff Nurse
SNCU Special NewBorn Care Units
SPCA Society for Prevention of Cruelty toAnimals
SPCB State Pollution Control Board
SPMUs State Project Monitoring Units
SPV Special Purpose Vehicle
sq km Squre Kilometer
SRCWs State Resources Centres for Women
SRR Seed Replacement Rate
SRS Sample Registration System
SSA Sarva Shiksha Abhiyan
SSC Sector Skill Council
SSC State Skill Corporations
SSDMs State Skill Development Missions
SSM State Skill Missions
SSUP Self Service Update Portal
SSU State Surveillance Unit
ST Schedule Tribes
STG Standard Treatment Guidelines
STP Sewarage Treatment Plant
SWAN State Wide Area Network
SWAYAM Study Webs of Active Learning forYoung Aspiring Minds
SWM Solid Waste Management
SWOT Strengths, Weaknesses, Opportunitiesand Threats
T&D Transmission and Distribution
TAMP Tariff Authority for Major Ports
TAP Turn Around Plan
TB Tuberculosis
TBOs Tree Borne Oilseeds
TDET Technology Development Extensionand Training
TEQIP Technical Education QualityImprovement Programme
TFR Total Fertility Rate
TISS Tata Institute of Social Sciences
TOD Transit Oriented Development
ToT Transfer of Technology
TPC Total Project Cost
ACRONYMS xxiii
TPDS Targeted Public Distribution System
TSDSI Telecommunications StandardsDevelopment Society, India
TSPs Telecom Service Providers
TRAI Telecom Regulatory Authority of India
UA Urban Agglomerations
UEE Universalization of ElementaryEducation
UEN Unique Entity Number
UG Under Graduate
UGC University Grants Commission
UDAY Ujwal Discom Assurance Yojana
U-DISE Unified-District Information Systemfor Education
UID Unique Identification
UIDAI Unique Identification Authority of India
UIDSSMT Urban Infrastructure Development forSmall & Medium Towns
UIG Urban Infrastructure and Governance
ULBs Urban Local Bodies
ULCRA Urban Land Ceiling Restriction Act
UMPP Ultra Mega Power Projects
UN United Nations
UNICEF United Nations Children’s Fund
UP Uttar Pradesh
UPE University with Potential forExcellence
UPS Upper Primary School
UPSS Usual Principal and Subsidiary Status
URM Urban Rejuvenation Mission
USHA Urban Statistics for HR andAssessments
USOF Universal Service Obligation Fund
USTTAD Upgrading the Skills and Training inTraditional Arts/ Crafts forDevelopment
USV Support to Urban Street Vendors
UTs Union Territories
VAT Value Added Tax
VDP Village Development Plan
VGF Viability Gap Funding
VHSNC Village Health Sanitation & NutritionCommittee
VOs Voluntary Organizations
VTP Vocational Training Programes
WB World Bank
WCD Women Child Development
WDFC Western Dedicated Freight Corridor
WEO World Economic Outlook
WNTA Wada Na Todo Abhiyan
WPI Wholesale Price Index
WRA Water Regulatory Authority
WTO World Trade Organisation
WWH Working Women Hostel
ZSI Zoological Survey of India
xxiv ACRONYMS
Annexure
4.1 State-wise Aadhaar Generated Data Until 30th April 2016 89
4.2 Aadhaar Saturation Among Adults 90
4.3 Aadhaar Saturation Among Children (below 18 years) 91
4.4 Aadhaar Saturation in > 18 years (30th September, 2016) 92
5.1 Twelfth Plan Outlay and Expenditure of Ministry of HRD 139
5.2 Twelfth Plan Outlay and Expenditure of Ministry of Youth Affairs and Sports 139
6.1 Revised Projections of Investment in Infrastruc-ture in Twelfth Plan 178
6.2 Integrated Power Development Scheme 182
6.3 Deendayal Upadhyaya Gram Jyoti Yojana 183
9.1 Growth Rates of Urban Agglomerations/Cities with a Population of 1 Million andAbove by Common Base 265
9.2 Population in Cities of India 266
9.3 Percent Urban Population in Cities of Different Size 266
1The Economy & Policies: An Overview
1.1 The Strategy for Inclusive Growth
1.1.1 Rather than project a single average growth rateover the five-year period, the Twelfth Five Year Plan(2012-17) envisaged three scenarios termed as “stronginclusive growth”, “insufficient action” and “policylogjam”. The Plan pegged the average annual growthrate of the Gross Domestic Product (GDP) under thethree scenarios at 8 per cent, 6 to 6.5 per cent and 5 to5.5 per cent, respectively.1 More than four years intothe Plan, where do we stand?
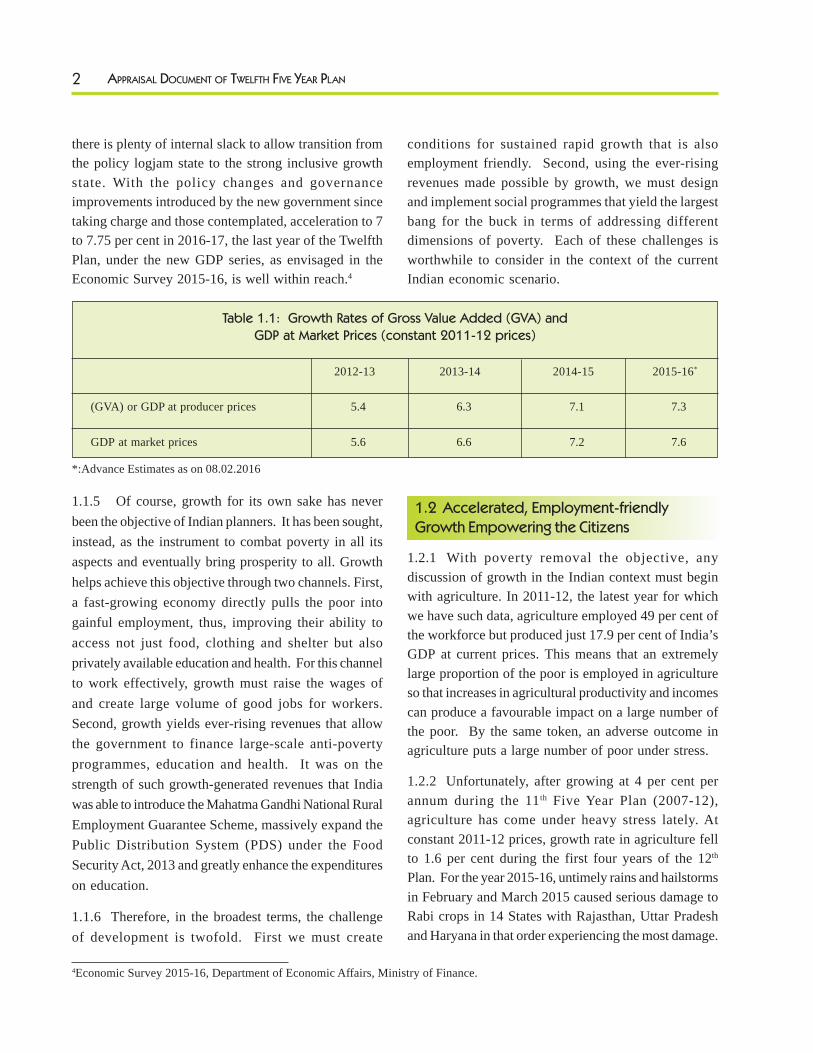
1.1.2 Answer to this question requires spelling out firstsome key revisions to the methodology of estimatingthe GDP that the Central Statistical Office (CSO) hasrecently introduced. Revisions have been made alongthree dimensions:2 (a) The base year has been changedfrom 2004-05 to 2011-12; (b) For the corporate sector,financial corporations and local bodies and autonomousinstitutions, more reliable sources of data have replacedthose previously used; and (c) In conformity with theinternational practice, the GDP is now measured atmarket prices (broadly equivalent to consumer prices)instead of factor costs (broadly equivalent to producerprices). Table 1.1 shows the performance of the economyduring the first four years of the Twelfth Plan accordingto the revised series.
1.1.3 Methodologically, the new series representssubstantial improvement over the previous series. But
the shift also means that the GDP growth rates in Table1 are not comparable to the GDP growth rates calculatedusing the old methodology. Had it been the simple questionof changing the base year from 2004-05 to 2011-12 orswitching from factor cost to market prices, appropriateadjustments could have been made to achievecomparability across the two series. Unfortunately, thechange described in (b) above represents a switch inthe sources of data that are not readily available for yearspreceding 2011-12. Because the GDP had been estimatedunder the old methodology only up to the year 2013-14,we have the growth rates associated with both the oldand new methodology for years 2012-13 and 2013-14only. When measured at factor cost, the real GDP growthunder the old methodology turns out to be 4.5 per centin 2012-13 and 4.7 per cent in 2013-14.3
1.1.4 Because the Twelfth Plan projections were basedon the old series, it may be reasonably concluded that atleast in 2012-13 and 2013-14, India has performed worsethan the “policy logjam” scenario. The argument thatthis is because of deterioration of the global economy isat best partially valid. The major shock to the globaleconomy dates back to September 2008 after whichthe Indian economy had recovered handsomely. Buteven ignoring this fact, the projections are presumed tofactor the expected changes in the global economy. It isnobody’s case that India will not benefit from a turnaroundin the global economy. But it is indeed the case that
1Twelfth Five Year Plan, 2012-2017, Faster, More Inclusive and Sustainable Growth, Planning Commission, Government of India, 2013.2 See, Changes in Methodology and Data Sources in the New Series of National Accounts, Base Year 2011-12, Ministry of Statistics andProgramme Implementation, http://mospi.nic.in/Mospi_New/upload/Methodology_NABase11_12_11mar15.pdf, for a detailedexplanation of how the methodology has changed.3Growth rates at market pricesare marginally higher at 4.7 per cent and 5.0 per cent respectively.
2 APPRAISAL DOCUMENT OF TWELFTH FIVE YEAR PLAN
there is plenty of internal slack to allow transition fromthe policy logjam state to the strong inclusive growthstate. With the policy changes and governanceimprovements introduced by the new government sincetaking charge and those contemplated, acceleration to 7to 7.75 per cent in 2016-17, the last year of the TwelfthPlan, under the new GDP series, as envisaged in theEconomic Survey 2015-16, is well within reach.4
1.1.5 Of course, growth for its own sake has neverbeen the objective of Indian planners. It has been sought,instead, as the instrument to combat poverty in all itsaspects and eventually bring prosperity to all. Growthhelps achieve this objective through two channels. First,a fast-growing economy directly pulls the poor intogainful employment, thus, improving their ability toaccess not just food, clothing and shelter but alsoprivately available education and health. For this channelto work effectively, growth must raise the wages ofand create large volume of good jobs for workers.Second, growth yields ever-rising revenues that allowthe government to finance large-scale anti-povertyprogrammes, education and health. It was on thestrength of such growth-generated revenues that Indiawas able to introduce the Mahatma Gandhi National RuralEmployment Guarantee Scheme, massively expand thePublic Distribution System (PDS) under the FoodSecurity Act, 2013 and greatly enhance the expenditureson education.
1.1.6 Therefore, in the broadest terms, the challengeof development is twofold. First we must create
conditions for sustained rapid growth that is alsoemployment friendly. Second, using the ever-risingrevenues made possible by growth, we must designand implement social programmes that yield the largestbang for the buck in terms of addressing differentdimensions of poverty. Each of these challenges isworthwhile to consider in the context of the currentIndian economic scenario.
1.2 Accelerated, Employment-friendlyGrowth Empowering the Citizens
1.2.1 With poverty removal the objective, anydiscussion of growth in the Indian context must beginwith agriculture. In 2011-12, the latest year for whichwe have such data, agriculture employed 49 per cent ofthe workforce but produced just 17.9 per cent of India’sGDP at current prices. This means that an extremelylarge proportion of the poor is employed in agricultureso that increases in agricultural productivity and incomescan produce a favourable impact on a large number ofthe poor. By the same token, an adverse outcome inagriculture puts a large number of poor under stress.
1.2.2 Unfortunately, after growing at 4 per cent perannum during the 11th Five Year Plan (2007-12),agriculture has come under heavy stress lately. Atconstant 2011-12 prices, growth rate in agriculture fellto 1.6 per cent during the first four years of the 12th
Plan. For the year 2015-16, untimely rains and hailstormsin February and March 2015 caused serious damage toRabi crops in 14 States with Rajasthan, Uttar Pradeshand Haryana in that order experiencing the most damage.
Table 1.1: Growth Rates of Gross Value Added (GVA) andGDP at Market Prices (constant 2011-12 prices)
2012-13 2013-14 2014-15 2015-16*
(GVA) or GDP at producer prices 5.4 6.3 7.1 7.3
GDP at market prices 5.6 6.6 7.2 7.6
*:Advance Estimates as on 08.02.2016
4Economic Survey 2015-16, Department of Economic Affairs, Ministry of Finance.
3THE ECONOMY & POLICIES: AN OVERVIEW
The government responded by bringing quick relief tothe affected farmers through the State Disaster ResponseFund and the National Disaster Response Fund.
1.2.3 Apart from this immediate stress, agriculture alsofaces a long-term challenge. Over the last severaldecades, irrigation has been expanded primarily throughgreater and greater extraction of ground water. Theresult has been a significant erosion of water tables.Additionally, prolonged overuse of urea has also hadadverse impact on the health of soil in many statesparticularly in north-western region. Finally, productivityin agriculture has not seen significant rise in most of thecrops.
1.2.4 Going forward, India needs to take several stepsto revive and sustain growth in agriculture. The recentOccasional Paper based on the work by the NITI AayogTask Force on Agricultural Development provides adetailed roadmap for rejuvenation of this important sector.Here we touch on a few selected measures.
1.2.5 First, to address the issue of declining watertables, we must promote economy in the use of thisscarce water resource. Expansion of micro irrigationemphasized by the Prime Minister is one part of thesolution. But given that rice is highly water intensiveand it is overwhelmingly grown in Punjab where watertables have declined the most, rice production must moveto the eastern part of India where water is plentiful andsoil is conducive to rice production.
1.2.6 We also need to take fuller advantage ofincomplete major, medium and minor irrigation schemes.The total irrigation potential created through theseschemes had increased from 22.6 million hectares duringpre-plan period to 113 million hectares at the end of the11th Plan. India’s ultimate irrigation potential beingestimated at 140 million hectares, there is at best limitedremaining scope for further expansion of irrigationinfrastructure. Therefore, priority must be given toimproving the irrigation potential utilized (IPU) of theirrigation potential created (IPC). Currently, IPU isapproximately 77 per cent (87 million hectares) of theIPC (113 million hectares). The underutilization of IPC
is due to the slow pace of the Command AreaDevelopment Programme, depletion of professional staffin state irrigation agencies and paucity of non-plan fundsavailable to irrigation departments. This necessitatesCommand Area Development and review andrestructuring of the underlying institutional setup.
1.2.7 Second, we need a shift towards high valuecommodities such as horticulture, fisheries and livestock.For its size, India still does not produce enough fruitsand vegetables. Correspondingly, food-processingindustry in the country remains in infancy. Contractfarming could be the link that could solve the twinproblems. Likewise, steps need to be taken to facilitategrowth of fisheries and livestock. This shift will helpreduce the dependence on conventional crops that tendto show greater volatility.
1.2.8 Third, with many small and marginal farmersseeking non-farm employment, fallow land has shownthe tendency to rise. Under the current land leasing laws,these farmers fear risking leasing their land to otherfarmers. Reforming land leasing laws to allow legalcontracts will help reduce the volume of fallow land aswell as consolidate land holdings. NITI Aayog hadconstituted an Expert Group to prepare a model landleasing act to enable the States to enact their own leasingActs. The expert Group has submitted its report, whichcontains a model land-leasing act.
1.2.9 Fourth, the Agricultural Produce MarketingCommittees (APMC) Act reform needs to be deepenedto ensure that the farmer gets a higher proportion of theprice paid by the consumer. This requires freeing upentirely the purchase and sales of all agriculturalcommodities. This will create competition at both thebuyer and the seller end. Currently, intermediaries takeaway the lion’s share of the price paid by the consumer.A complementary step in this direction is the developmentof supply chain with good storage facilities.
1.2.10 Finally, we also need to take advantage of ourown past experience. The key to the Green Revolutionwas the high-yielding varieties of seeds. It is time forus to return to that lesson and allow massive research
4 APPRAISAL DOCUMENT OF TWELFTH FIVE YEAR PLAN
into improving seed varieties including geneticallymodified ones. Elsewhere in the world, most notablythe United States, GMO seeds have been in use forover two decades with no adverse effects on eitherother crops or those consuming the products of thoseseeds. China has been far ahead of us in this regard.Our own experience with BT Cotton seeds has beena success.
1.3 Sustained Rapid and Employment-intensive Growth
1.3.1 A key lacuna in the Indian growth story has beenslow growth of manufactures in general and labour-intensive manufacturing in particular. In the following,we touch on some of these issues.
1.3.2 In every country that has achieved rapidtransformation from traditional, rural to modern, urbanstructure, manufacturing has led the way. In Taiwanand South Korea in the 1960s and 1970s and in China inthe 1980s, 1990s and 2000s, manufactures grew at ratesapproaching or exceeding 15 per cent, with labour-intensive manufactures growing especially rapidly. The
accompanying increase in incomes led to increaseddemand for and hence accelerated growth in servicesas well. In turn, workers in agriculture migrated to thesesectors to take advantage of the employmentopportunities so created. Within a matter of two to threedecades, this process led to the countries transformingfrom primarily agrarian and rural character to modernurban ones.
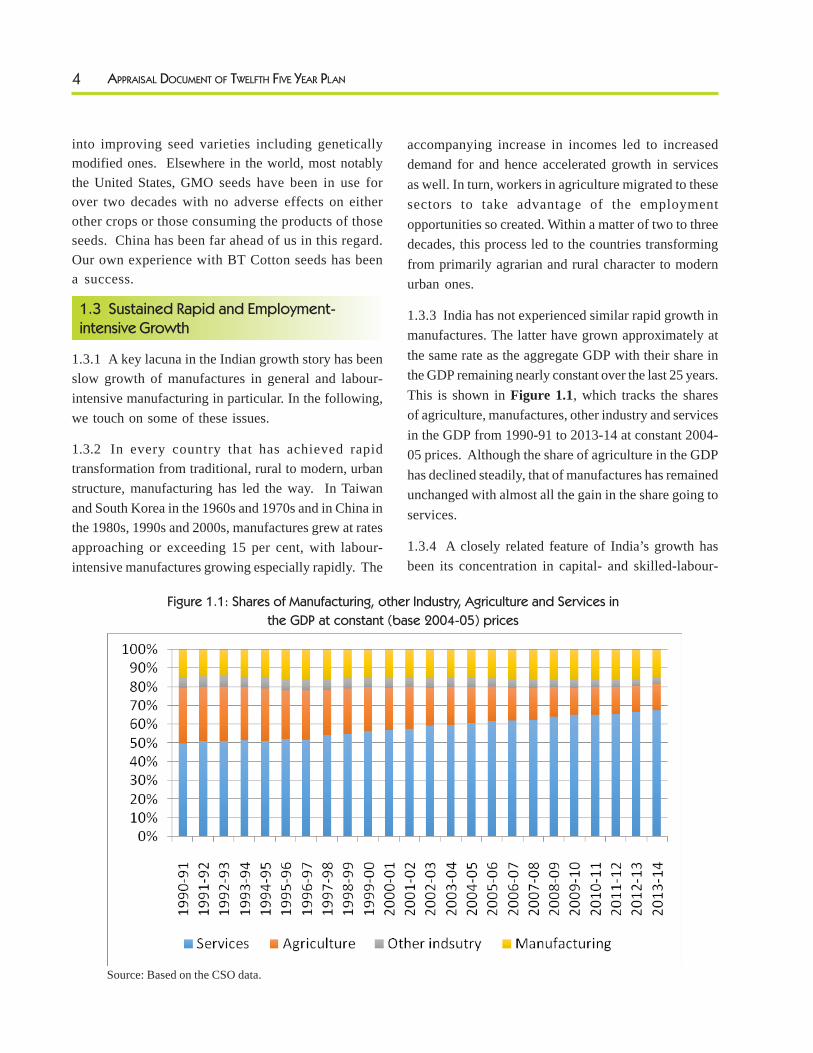
1.3.3 India has not experienced similar rapid growth inmanufactures. The latter have grown approximately atthe same rate as the aggregate GDP with their share inthe GDP remaining nearly constant over the last 25 years.This is shown in Figure 1.1, which tracks the sharesof agriculture, manufactures, other industry and servicesin the GDP from 1990-91 to 2013-14 at constant 2004-05 prices. Although the share of agriculture in the GDPhas declined steadily, that of manufactures has remainedunchanged with almost all the gain in the share going toservices.
1.3.4 A closely related feature of India’s growth hasbeen its concentration in capital- and skilled-labour-
Figure 1.1: Shares of Manufacturing, other Industry, Agriculture and Services in
the GDP at constant (base 2004-05) prices
Source: Based on the CSO data.
5THE ECONOMY & POLICIES: AN OVERVIEW
intensive sectors. The fast growing sectors have beenauto and auto parts, two wheelers, machinery, chemicals,petroleum refining, telecommunications, software andpharmaceuticals. None of these sectors employs low-skilled workers in large numbers. As a result, the vastmajority of Indian workers remain concentrated inagriculture, unorganized industry or low-paying services.The movement of workers out of agriculture intoindustry and services jobs has been especially slow. Inturn, this means that despite 65 years of developmentefforts, a little less than half of Indian workers stillremain in agriculture. As noted earlier, in 2011-12, 49per cent of the workforce was in agriculture (includingallied activities), which contributed only 17.9 per centof the GDP at current prices. Raising productivity inagriculture is the immediate means to bring relief to thevast number of poor. But bringing genuine prosperityto them in the long run would require the creation ofgood jobs in industry and services.
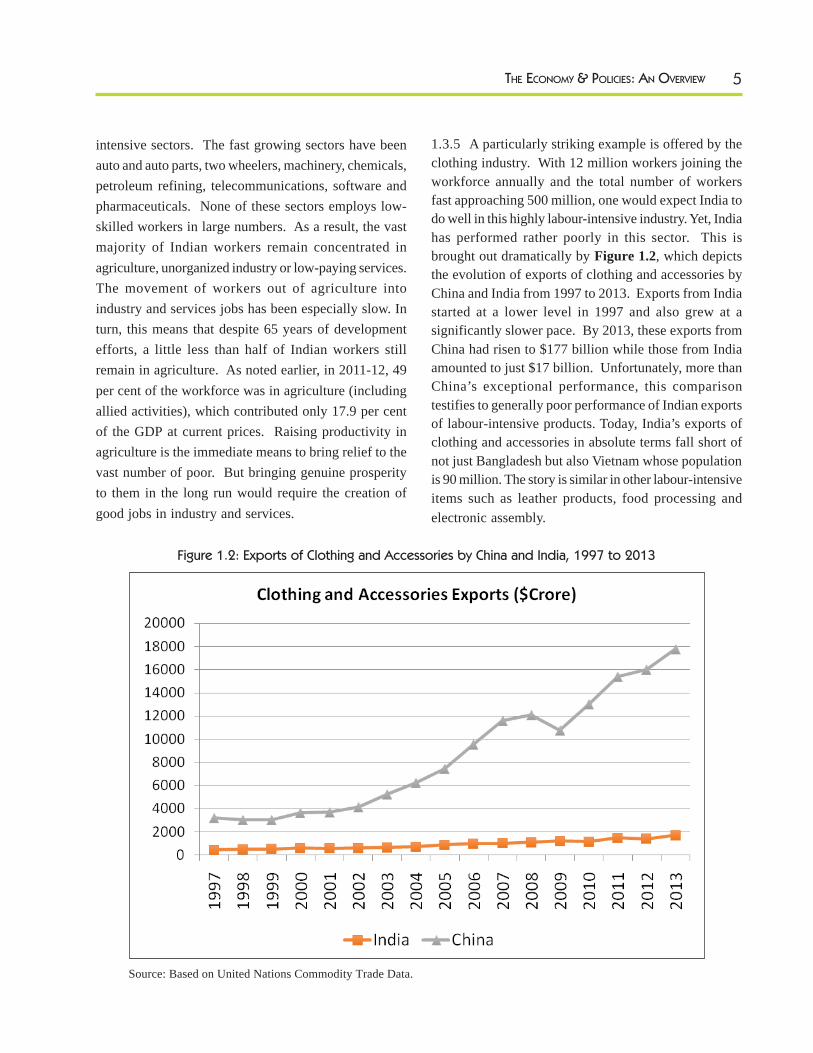
1.3.5 A particularly striking example is offered by theclothing industry. With 12 million workers joining theworkforce annually and the total number of workersfast approaching 500 million, one would expect India todo well in this highly labour-intensive industry. Yet, Indiahas performed rather poorly in this sector. This isbrought out dramatically by Figure 1.2, which depictsthe evolution of exports of clothing and accessories byChina and India from 1997 to 2013. Exports from Indiastarted at a lower level in 1997 and also grew at asignificantly slower pace. By 2013, these exports fromChina had risen to $177 billion while those from Indiaamounted to just $17 billion. Unfortunately, more thanChina’s exceptional performance, this comparisontestifies to generally poor performance of Indian exportsof labour-intensive products. Today, India’s exports ofclothing and accessories in absolute terms fall short ofnot just Bangladesh but also Vietnam whose populationis 90 million. The story is similar in other labour-intensiveitems such as leather products, food processing andelectronic assembly.
Figure 1.2: Exports of Clothing and Accessories by China and India, 1997 to 2013
Source: Based on United Nations Commodity Trade Data.
6 APPRAISAL DOCUMENT OF TWELFTH FIVE YEAR PLAN
1.3.6 Therefore, India’s challenge is not just rapid growthin manufactures in general but also ensuring healthygrowth in labour-intensive sectors such as clothing,leather manufactures, food processing and electronicassembly. Growth in these latter sectors would helpcreate good jobs for workers with limited skills therebyallowing workers in agriculture and informal sectormanufacturing and services to migrate to the formalsector. Simultaneously, with migration of workers outof agriculture, land area per worker in the sector wouldrise, raising output per worker.
1.3.7 It is in this context that the “Make in India”campaign launched by the Prime Minister assumesspecial significance. From the perspective of good jobs,there is acute need to jumpstart manufacturingproduction. The government’s policy initiatives thatwould help make a success of the Make in Indiacampaign include skill development, greater ease of doingbusiness, a modern bankruptcy law, the Goods andServices Tax (GST), improved infrastructure,development of industrial corridors and building smartcities. Each of these instruments would make criticalcontribution to the growth of manufactures.
1.3.8 Currently, the “Make in India” initiative is focusedon sectors such as automobiles, automobile components,aviation, biotechnology, chemicals, defencemanufacturing, electrical machinery, electronics, foodprocessing, leather, pharmaceuticals and textiles andgarments. The majority of these sectors are those inwhich India already exhibits strength. Sectors in whichIndia lags behind are electronics, food processing,leather, and textiles and garments. These are all labour-intensive sectors and policies that impede their growthdeserve special attention in the reform programme ofthe government.
1.3.9 Labour-market rigidities arising from wide-ranging and complex laws and regulations have beenidentified as perhaps the most important impediment tothe rapid growth of these sectors. Labour being aconcurrent subject, the Central as well as StateGovernments can legislate on it. Both have done so withthe result that there are more than 40 Central and many
more State labour laws. Broadly speaking, stringencyof labour laws rises as the number of workers employedby a firm rises. The Trade Union Act becomes operativeat seven workers. A firm with 10 workers if using poweror with 20 workers if not using power comes under thepurview of the Factories Act, 1948. A firm with 50 ormore finds it very difficult to assign a worker from onetask to the other. A firm with 100 workers or more isnot allowed to lay off workers under any circumstances.
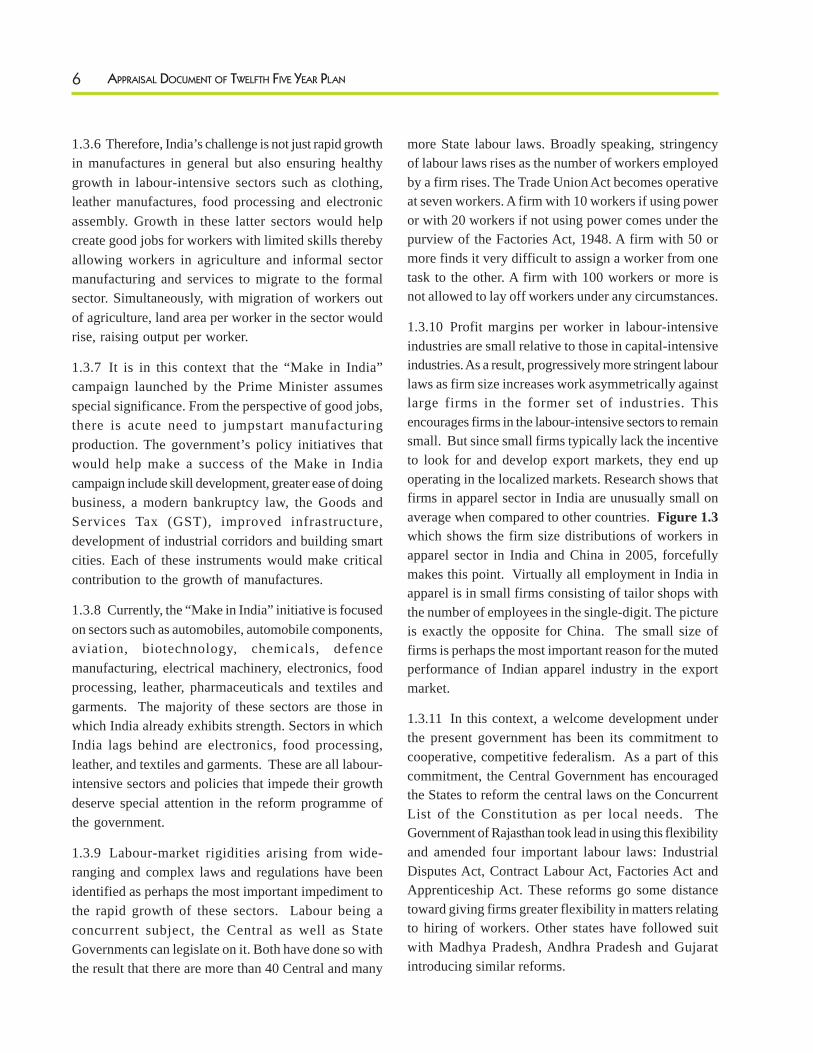
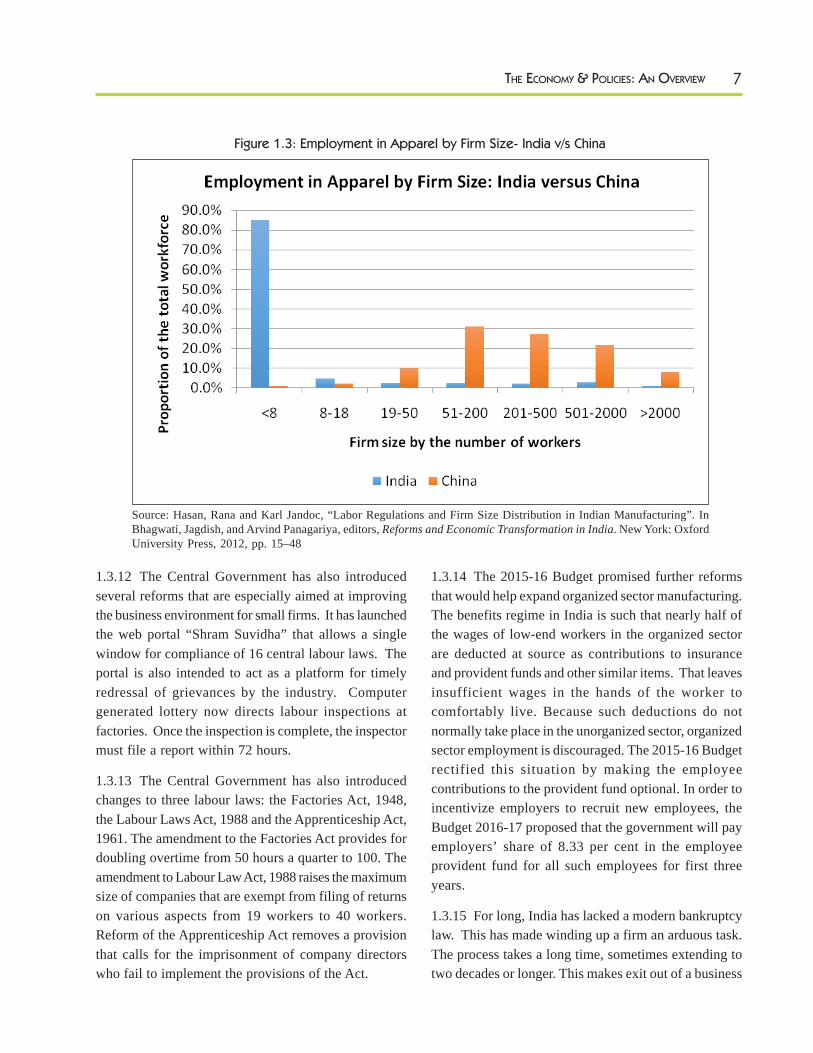
1.3.10 Profit margins per worker in labour-intensiveindustries are small relative to those in capital-intensiveindustries. As a result, progressively more stringent labourlaws as firm size increases work asymmetrically againstlarge firms in the former set of industries. Thisencourages firms in the labour-intensive sectors to remainsmall. But since small firms typically lack the incentiveto look for and develop export markets, they end upoperating in the localized markets. Research shows thatfirms in apparel sector in India are unusually small onaverage when compared to other countries. Figure 1.3which shows the firm size distributions of workers inapparel sector in India and China in 2005, forcefullymakes this point. Virtually all employment in India inapparel is in small firms consisting of tailor shops withthe number of employees in the single-digit. The pictureis exactly the opposite for China. The small size offirms is perhaps the most important reason for the mutedperformance of Indian apparel industry in the exportmarket.
1.3.11 In this context, a welcome development underthe present government has been its commitment tocooperative, competitive federalism. As a part of thiscommitment, the Central Government has encouragedthe States to reform the central laws on the ConcurrentList of the Constitution as per local needs. TheGovernment of Rajasthan took lead in using this flexibilityand amended four important labour laws: IndustrialDisputes Act, Contract Labour Act, Factories Act andApprenticeship Act. These reforms go some distancetoward giving firms greater flexibility in matters relatingto hiring of workers. Other states have followed suitwith Madhya Pradesh, Andhra Pradesh and Gujaratintroducing similar reforms.
7THE ECONOMY & POLICIES: AN OVERVIEW
1.3.12 The Central Government has also introducedseveral reforms that are especially aimed at improvingthe business environment for small firms. It has launchedthe web portal “Shram Suvidha” that allows a singlewindow for compliance of 16 central labour laws. Theportal is also intended to act as a platform for timelyredressal of grievances by the industry. Computergenerated lottery now directs labour inspections atfactories. Once the inspection is complete, the inspectormust file a report within 72 hours.
1.3.13 The Central Government has also introducedchanges to three labour laws: the Factories Act, 1948,the Labour Laws Act, 1988 and the Apprenticeship Act,1961. The amendment to the Factories Act provides fordoubling overtime from 50 hours a quarter to 100. Theamendment to Labour Law Act, 1988 raises the maximumsize of companies that are exempt from filing of returnson various aspects from 19 workers to 40 workers.Reform of the Apprenticeship Act removes a provisionthat calls for the imprisonment of company directorswho fail to implement the provisions of the Act.
1.3.14 The 2015-16 Budget promised further reformsthat would help expand organized sector manufacturing.The benefits regime in India is such that nearly half ofthe wages of low-end workers in the organized sectorare deducted at source as contributions to insuranceand provident funds and other similar items. That leavesinsufficient wages in the hands of the worker tocomfortably live. Because such deductions do notnormally take place in the unorganized sector, organizedsector employment is discouraged. The 2015-16 Budgetrectified this situation by making the employeecontributions to the provident fund optional. In order toincentivize employers to recruit new employees, theBudget 2016-17 proposed that the government will payemployers’ share of 8.33 per cent in the employeeprovident fund for all such employees for first threeyears.
1.3.15 For long, India has lacked a modern bankruptcylaw. This has made winding up a firm an arduous task.The process takes a long time, sometimes extending totwo decades or longer. This makes exit out of a business
Figure 1.3: Employment in Apparel by Firm Size- India v/s China
Source: Hasan, Rana and Karl Jandoc, “Labor Regulations and Firm Size Distribution in Indian Manufacturing”. InBhagwati, Jagdish, and Arvind Panagariya, editors, Reforms and Economic Transformation in India. New York: OxfordUniversity Press, 2012, pp. 15–48
8 APPRAISAL DOCUMENT OF TWELFTH FIVE YEAR PLAN
a very costly affair. In turn, this discourages firms toenter the business in the first place. Risks considerednormal in other parts of the world turn high in Indiabecause in case of failure, exit is very difficult.Economists have argued for long that a modernbankruptcy law can go a long way toward alleviatingthis problem and encouraging investment in the organizedsector. Recognizing this fact, the government hasrecently enacted the Insolvency and Bankruptcy Code,2016.
1.3.16 Tax uncertainty has served as another importantbrake on the growth of manufactures. A series of highlyvisible cases of retrospective taxation have damaged thereputation of the country as the destination for directforeign investment. The case of a major manufacturerin electronics sector best illustrates the problem.Established in 2006, the factory quickly became one ofthe largest producers of the product worldwide. But alarge tax liability assessed in 2013 on transactions goingback several years sealed its fate. 12,000 workersworking in the factory and an even larger numberworking in firms supplying components to it lost theirjobs. Above all, the episode was highly damaging to thereputation of India as an investment destination. Thecommitment of the present government to initiate nonew inquiries into retrospective tax liability is a verywelcome move toward restoring India’s reputation. Butmuch more is needed in terms of spelling out clearly taxlaws so that future investors can assess their tax liabilitieswith reasonable certainty. Simplification of the tax codewill certainly help in this task. But even given the currentcomplexity, it is important to spell out clearly theregulations thereby minimizing discretion on the part ofthe tax officials. China has firms such as Foxconn thatemploys 1.3 million workers and pays wages averaging$3 per hour. India cannot afford to miss out on the goodjobs that such firms promise.
1.3.17 Yet another important area in need of urgentattention from the perspective of Make in India is thesimplification of regulatory cum administrativeprocedures or what has come to be popularly referredto as the ease of doing business. Firms must deal with a
variety of regulations applying to starting a business,obtaining construction permits, getting electricity,registering property, paying taxes, trading across borders,enforcing contracts and insolvency. The rules governingthese activities as well as administrative proceduresimplementing those rules can be cumbersome and, thus,deter many potential investors from entering businessin the first place. For those who do enter, the returnsmay turn low on account of meeting the costs of theseregulations and procedures. Focusing principally onsmall and medium firms, the World Bank annually carriesout surveys and ranks the countries around the worldalong doing business parameters. India does ratherpoorly in these rankings. In 2015, it ranked 142nd out of189 countries in terms of overall doing-businessenvironment which later revised to 134 owing to changein methodology. India did especially poorly inconstruction permits and enforcing contracts categories.In the World Bank’s Ease of Doing Business report 2016,India’s position has improved to 130. There is clearlyconsiderably scope for India to make improvements inthis area. The Department of Industrial Policy andPromotion (DIPP) and the NITI are engaged in acollaborative effort to bring the best practices to theIndian cities and States in many of the doing businessareas. This should bear fruit in the next year or twoin improving the image of India as an investmentdestination as well as bringing the cost of doing businessdown.
1.3.18 Skill development is yet another important areain which India has lagged behind. Successful Indianfirms frequently complain that they are unable to findskilled workers and that when they train them theyquickly lose them to other firms. Recognizing theproblem, the government has launched an all-out efforton skill development, even establishing a separate SkillDevelopment Ministry. The key problem India faceshere is that of scale. Even taking a liberal count, thenumber of individuals being imparted skill is no morethan four million a year currently. With a stock of about470 million workers and additional twelve million joiningeach year, this figure remains well below what Indianeeds. We need a multi-prong strategy to make up for

9THE ECONOMY & POLICIES: AN OVERVIEW
the past complacency. The laws governing apprenticeshipneed to be friendlier to scaling up of apprenticeships,regular schools must consider introducing a vocationalstream for those not planning to go to college, moreschools offering vocational training must be opened, andthere needs to be greater cooperation between firms andeducational institutions to train students and workers.
1.3.19 It is expected that the implementation of GSTwill also help manufactures grow faster. Under thecurrent system, excise duties apply to most goods butservice tax does not apply to all services. By itself, thisfact introduces a bias against manufactures. In addition,the tax on machinery is not rebated so that it gets taxedmultiple times at subsequent stages of production. Inturn, this discourages investment. The GST will removethis cascading of tax on machinery and help stimulateinvestment in general and in manufacturing in particularsince the latter is the heavier user of machinery relativeto services.
1.3.20 Infrastructure in India is under great pressure.Rapid growth during 2003-04 to 2011-12 accompaniedby a major slowdown in infrastructure development hasresulted in major bottlenecks in all modes oftransportation. Bottlenecks have also developed in themovement of traffic due to unnecessary regulation andpoor management of traffic flow at toll booths. Thiscauses delays in the movement of goods and passengersimposing heavy cost on manufacturers. Cloggedtransport arteries also mean that firms must maintain amuch larger inventory of inputs than would be necessaryotherwise. In today’s world of just-in-time delivery,the ability to deliver products on time determines thedifference between winning and losing export contracts.The push by the government to revamp transportinfrastructure in the recent budget is a welcomedevelopment. Likewise, the ambitious plans in therailway budget to expand and improve service arelaudable. But much more effort and investment arerequired to unclog the transport arteries of the nation.
1.3.21 Power sector has also been an importantbottleneck. For labour-intensive manufactures, whooperate on low profit margins, high electricity costs can
be a make or break issue. On the one hand, India needsto expand generation capacity and the supply of coaland gas necessary to convert that capacity into electricityand, on the other, it needs to carry out reforms essentialto restoring the health of distribution companies.Introduction of transparent auctions of coal mines andrelated measures have gone some distance towardsrelieving the supply of coal. As for distributioncompanies, the recent initiative under Ujwal DiscomAssurance Yojana (UDAY) goes a long way towardsclearing up their debts. We will need to be vigilant to seethese reforms through as we go forward.
1.3.22 An extremely critical reform concerns the LandAcquisition Act of 2013. This Act makes any landacquisition by the government a very time-consumingactivity. It is estimated that even if all steps in theacquisition process go smoothly with no bureaucraticdelays at any stage, no protests and no court challenges,land acquisition for private public partnership (PPP)projects under this Act would take a little under fiveyears. It is no surprise that according to all availableaccounts, few new acquisitions were initiated under the2013 Act. In view of the decision by the governmentnot to renew the Ordinance that had temporarily amendedsome of the provisions of the original act, States mustnow take the lead in introducing reforms as per localneeds. Tamil Nadu has already adopted one suchamendment, which introduces a State-specific schedulein the 2013 Act listing State legislations that are exemptfrom the latter.
1.3.23 Two major initiatives aimed at transformationof the economy relate to industrial corridors and smartcities. Thus we have the Delhi-Mumbai IndustrialCorridor (DMIC) and the Dedicated Freight Corridor(DFC) initiatives. Other industrial corridors are still atthe stage of conceptualization. These latter includeBengaluru-Mumbai, Amritsar-Kolkata, Chennai-Bengaluru and Chennai-Vizag corridors. There is nowalso explicit recognition that urbanization is correlatedwith economic development and there is the Smart Citiesinitiative, which splices a new initiative for 100 newsmart cities and 500 habitations with the JNNURM
10 APPRAISAL DOCUMENT OF TWELFTH FIVE YEAR PLAN
programme.5 The initiative has green-field, brown-fieldand green-field components in existing cities, particularlytargeting cities in the less than 4 million range and satellitegreen-field cities as adjuncts to existing cities.
1.3.24 In sum, there are reasons to be optimistic aboutthe prospects of above 7 per cent growth in 2016-17.The large number of reforms initiated by the governmentduring its first two years, briefly described above, laydown a strong foundation for such growth. The caution,however, is essential as well since the reforms in manyareas such as skill development, infrastructure, labourlaws and the Land Acquisition Act of 2013 are far fromcomplete.
1.4 Anti-poverty Programmes for a DirectAssault on Poverty
1.4.1 Sustained rapid and employment-friendly growthis only one leg on which the economy must travel toconquer poverty. Generous anti-poverty programs, madepossible by enhanced revenues that rapid growth makespossible, constitute the other leg. Before turning to thediscussion of these programmes, it is useful to say afew words about the definition of poverty.
1.4.2 Under the most common definition, poverty ismeasured as the proportion of the population living belowcertain threshold level of income referred to as thepoverty line. Poverty line itself represents the minimumincome necessary to purchase a given basket of goodsand services considered essential. Because there is nogeneral agreement on what the “essential” basket ofgoods and services is and the definition in any case mayvary according to the social and economic context,poverty lines and the associated measures of povertyhave generated much controversy around the world,especially in India.
1.4.3 It is generally agreed that poverty is a multi-dimensional phenomenon so that a single indicator suchas the poverty ratio may not be an adequate guide topolicy. It is perhaps in this spirit that the government
has accelerated the move towards directly addressingthe conditions frequently associated with poverty. Inthis spirit, the 2015-16-budget speech of the FinanceMinister defined the fight against poverty in terms of aset of specific indicators. To quote from the budgetspeech, “The vision of what the Prime Minister hascalled ‘Team India’, led by the States and guided by theCentral Government, should include:
(i) A roof for each family in India. The callgiven for ‘Housing for all’ by 2022 wouldrequire Team India to complete 2 crorehouses in urban areas and 4 crore houses inrural areas.
(ii) Each house in the country should have basicfacilities of 24-hour power supply, cleandrinking water, a toilet, and be connected toa road.
(iii) At least one member from each familyshould have access to the means forlivelihood and, employment or economicopportunity, to improve his or her lot.
(iv) Substantial reduction of poverty. All ourschemes should focus on and centre aroundthe poor. Each of us has to commit ourselvesto this task of eliminating absolute poverty.
(v) Electrification, by 2020, of the remaining20,000 villages in the country, including byoff-grid solar power generation. Connectingeach of the 1,78,000 unconnectedhabitations by all-weather roads. This willrequire completing 1,00,000 km of roadscurrently under construction plussanctioning and building another 1,00,000km of road.
(vii) Good health is a necessity for both qualityof life, and a person’s productivity and abilityto support his or her family. Providingmedical services in each village and city isabsolutely essential.
5The Concept Note is available at http://indiansmartcities.in/downloads/CONCEPT_NOTE_-3.12.2014__REVISED_AND_LATEST_.pdf
11THE ECONOMY & POLICIES: AN OVERVIEW
(viii) Educating and skilling our youth to enablethem to get employment is the altar beforewhich we must all bow.
1.4.4 This vision of poverty elimination ismultidimensional and it aims to directly attack theconditions associated with poverty. One advantage ofthinking of the fight against poverty in this manner isthat it sidesteps the issue of the poverty line. Forpurposes of the allocation of central expenditures onspecific schemes across States two possibilities exist.First, if the scheme is universal such as the Sarva ShikshaAbhiyan (SSA), all are covered and the issue of allocationis moot. Second, if the scheme does not cover all in agiven year, allocation of expenditures across States canbe based on a comparison of relative shortfalls alongthe specific dimension of poverty. For example, theallocation of expenditures on housing to a state in anygiven year can be based on the proportion of nationwidehouseholds without housing residing in the state.
1.4.5 Among the important anti-poverty programmescurrently in existence is the scheme based on MahatmaGandhi National Rural Employment Guarantee Act(MGNREGA). It guarantees 100 days of employmentto one adult in each rural household each year. Withinrural areas, the scheme is universal so that it does notrequire the identification of beneficiaries. The 2016-17Budget allocates Rs. 38,500 crore to MGNREGA.
1.4.6 The scheme provides an assured source of incometo the households. There is also evidence that it hascontributed to a rise in rural wages. But the scheme hasa substantial downside as well. It has a relatively poortrack record of asset creation. Moreover, the legislationmandates that employment be for unskilled work. As aresult, workers do not acquire any skills on the job.
1.4.7 Until recently, each Panchayat was required tospend at least 60 per cent of the funds provided underthe scheme on wages. A maximum of 40 per cent of thefunds could be spent on material. This restrictionprecluded many good projects such as building schoolsand hospitals because they require a higher than 40 per
cent of the total expenditures to be allocated to materials.In a welcome move, the government has recently relaxedthis constraint by stipulating that the requirement that aminimum of 60 per cent of the expenditure be incurredon wages may be satisfied at the level of the district.This would allow a specific Panchayat to spend morethan 40 per cent of the expenditure on material providedother Panchayats within the same district make up forthe difference.
1.4.8 To make the scheme further effective, it isdesirable that employment that helps workers acquireskills is permitted. A big advantage of this latter approachis that it will encourage workers to voluntarily exitMGNREGA employment. Once they acquire skills, theywould be more inclined to seek employment that usestheir skills and pays better wages. Finally, to eliminateleakages, it is important that the system of wagepayments through Aadhaar seeded bank accounts israpidly extended to all wage payments under the scheme.
1.4.9 The second major programme specifically aimedat ensuring access to food falls within the purview ofthe Food Security Act, 2013. Under the programme, avast system of procurement of food grains and PublicDistribution System (PDS) to deliver the grain tobeneficiaries is maintained. It promises 75 per cent ofrural population and 50 per cent of urban populationwheat and rice at highly subsidized prices. In monetaryterms, this is the largest single social programme of thegovernment. The 2016-17 Budget allocates Rs. 1,34,834crore to it.
1.4.10 It is widely recognized that the programme issubject to substantial leakages and there is urgent needto look into avenues to eliminating them. The use ofAadhaar platform is one such avenue. It can helpeliminate multiple ration cards held by the samehouseholds and also weed out ghost ration cards. Thisinstrumentality has been deployed with great successrecently but it needs to be extended rapidly to allbeneficiaries. In the longer run, an even more effectiveinstrument would be to give households the option to
12 APPRAISAL DOCUMENT OF TWELFTH FIVE YEAR PLAN
choose between subsidized purchases and equivalentcash. Such an approach would give the beneficiariesthe option to buy their grain from private shops therebyputting competitive pressure on public distribution shops.Some recent pilot projects along these lines haveproduced encouraging results. A key element in thesuccess of this approach, however, is to ensure accessto banking. Beneficiaries receiving cash transfers intheir bank accounts have to be able to withdraw thatcash to effectively use it. Rapidly evolving technologyin this field needs to be better exploited to givebeneficiaries access to basic deposit and withdrawalfacilities.
1.4.11 An important initiative of the present governmentin this context is the Jan Dhan Yojana, which provideseach household a bank account. The account is animportant instrument in itself from the viewpoint offinancial inclusion and is being also used now to bringmodest insurance and pension schemes to the citizens.Additionally, when combined with the Aadhaar, the bankaccount is a powerful tool for cutting leakages undermany entitlement schemes. Already, it is being used toreplace the Liquid Petroleum Gas (LPG) subsidy by directbenefit transfer (DBT). Instead of dealers selling LPGcylinders at subsidized prices, the government has nowlargely shifted to the dealers selling the cylinders at themarket price with the subsidy deposited directly to theAadhaar linked bank account of the beneficiary. Thischange eliminates the possibility of the dealer selling anycylinders not bought by the beneficiary in the blackmarket.
1.4.12 Sarva Shiksha Abhiyan (SSA), in conjunctionwith the Right to Education (RTE) Act of 2009, aims toprovide primary education to all children aged 6 to 14years. According to surveys by the Non-GovernmentOrganization (NGO) Pratham, India is now close touniversal enrolment in school in this age group. Its ASER2014 report places the proportion of children aged 6-14years enrolled in school in rural areas above 96 per centfor each of the past six years. The real problem is thequality of education as measured by studentachievements. The ASER report finds that more than
50 per cent of the fifth graders cannot read standard IIlevel text. Even more disconcertingly, the trend between2010 and 2014 has been towards worsening instead ofimproving performance.
1.4.13 The RTE Act stipulates that no child can be heldback in a grade regardless of his performance all theway up to the eighth grade. A child is entitled to theeighth grade diploma even if he cannot recognize a singleletter or number as long as he spends the eight years inschool. The purpose behind this provision is to minimizethe dropout rate since demoralization resulting fromfailing a class leads children to withdraw from schoolaltogether. But despite this good intention, the provisionhas a detrimental effect on learning outcomes since ittakes away the pressure to learn and to compete. TheRTE Act needs to be revisited.
1.4.14 A critical initiative bearing on health outcomeslaunched recently by the government is Swachh BharatMission. A key component of the mission is open-defecation free India by 2nd October 2019, the 150th birthanniversary of Mahatma Gandhi. But in its broaderconception, it may include access to piped water; well-functioning drainage, sewage and solid wastemanagement in all cities and villages; elimination of pondsin which stagnant water collects and serves as host tobacteria and mosquitoes; and instilling greater sense ofpersonal hygiene and cleanliness in all its aspects amongthe masses. If the mission can be carried to its logicalconclusion, it can be a game changer in terms ofpreventive health care. But it requires significantly largervolume of resources than the current level of revenueswould permit.
1.4.15 There are several other additional social schemesthat aim to promote specific social goals. These includebut are not limited to the Integrated Child DevelopmentServices (ICDS) programme, mid-day meals scheme,Janani Suraksha Yojana, National Health Mission and betibachao, beti padhao campaign. The schemes alsorequire a closer scrutiny so that they can be made moreeffective.
13THE ECONOMY & POLICIES: AN OVERVIEW
1.4.16 Against the backdrop of the developments andcontinuing need for further policy initiatives describedabove, the following Chapters set out the achievementsand shortfalls in various sectors during the first fouryears of the 12th Plan in greater detail. But more importantis the present government’s vision of a development
template, providing an enabling environment for growthand development, addressing market failures, financingthe provision of collective goods and services andtargeting BPL populations efficiently for subsidies. Thatis how minimum government maximum governanceneeds to be interpreted.
14 APPRAISAL DOCUMENT OF TWELFTH FIVE YEAR PLAN
2Macroeconomic Factors
2.1 Twelfth Five Year Plan
2.1.1 The Twelfth Five Year Plan (2012-13 to 2016-17) was launched amidst a slowdown of the economyon account of several domestic and global factors. Themajor issues and challenges included a high CurrentAccount Deficit (CAD) and a fall in the domestic savingsrate, coupled with a high fiscal deficit. This not onlyacted as a constraint on further government spendingbut also crowded out private investment and fueledinflation. During the initial years of the Twelfth Plan,tight monetary policy to tackle higher level of inflationcoupled with a downturn in the business environmenthampered growth. The fiscal consolidation measures bycurtailing government expenditure also dragged growthdown as it was not compensated for by higher levels ofprivate investment. The conditions are improving now,with the Indian economy advancing towards an upswing– although multiple challenges continue to still exist.
2.1.2 In spite of the CAD being brought under control,there are still risks associated with India’s externalenvironment and the dynamics of the global economy.In the wake of the earlier, high levels of the CAD, theimportance of non-debt foreign capital inflows –especially Foreign Direct Investments or FDI – has beenreinforced. Recently, there have been improvements onthe fiscal front with the calibrated reduction in the fiscaldeficit of the Central Government. Headline inflation hasalso shown reduction; but the upside risks still exist,and a continued challenge is to stabilize the inflation rateto reasonable levels. However, higher growth ultimatelydepends on sound policy reforms in promoting domesticand foreign investment, creating employment, improving
food security, raising India’s standards of education andskill development, building new infrastructure, andincreasing the country’s overall competitiveness,particularly in the manufacturing sector.
2.1.3 Earlier, at the start of the Eleventh Five Year Planin 2007-08, the macro balances of the economy weregood. In 2007-08 the economy grew at 9.3 per cent,held the CAD at 1.3 per cent of GDP and restrictedwholesale price inflation (WPI) to a comfortable level,4.7 per cent. The enabling savings and investment rateswere as high as 36.8 per cent and 38.1 per cent of GDPrespectively. The fiscal deficit and revenue deficit werewithin 4 per cent and 0.2 per cent of GDP respectively.However, by 2011-12 – i.e., the last year of the EleventhPlan – there was a gradual deterioration in India’s macroindicators, resulting in lower growth. In the year 2011-12, the growth rate of GDP slipped to 6.7 per cent; thesavings rate and investment rate declined to 31.3 percent and 35.5 per cent respectively. The higher amountof foreign savings was reflected in a large CAD, of 4.2as a percentage of GDP. Also, a higher inflation rate, of8.9 per cent, forced the Reserve Bank of India (RBI) totake a hard stand on interest rates – which did notfacilitate investment, and thus further eroded economicgrowth. Moreover, lower growth in spite of a reasonablyhigh investment rate indicated a worsening of theIncremental Capital Output Ratio (ICOR) – furtherhampering future growth prospects.
2.1.4 The major reasons for these developments canbe divided into two categories, namely international anddomestic. The period between 2007-08 and 2011-12witnessed two major international crises, the first being
15MACROECONOMIC FACTORS
the global financial crisis in 2008-09 and second thesovereign debt crisis in the Eurozone in 2011-12. Onthe domestic front, deterioration in business environment,supply-side constraints resulting in high inflation andconsequent tight monetary policy followed by the RBI,as well as the withdrawal of the post-financial crisisstimulus package, adversely affected macro indicators.The combined effect of these factors hampered thegrowth rate. Alongside, the domestic economy had tobear the brunt of another set of problems peculiar toIndia. Many projects were stalled or delayed because ofdisputes in the acquisition of land, non-availability ofraw material like coal, gas, retrospective amendment oftax laws, the inability of the Government to allocate naturalresources in a transparent manner leading to legal casesand so on. These factors all created negative sentimentsin the minds of investors, leading to an overall climateof pessimism. Despite these setbacks and thedeterioration in growth towards the later part of theEleventh Plan, the annual average growth rate of 8 percent achieved during the Eleventh Plan, against the targetof 9 per cent, was quite impressive.
2.1.5 In view of the above developments, it is fairlyclear that there was a marked difference in the initialconditions at the start of the Twelfth Plan vis-à-vis theEleventh Plan. As a result, the targeted annual averagegrowth rate of the economy was revised downwardsfrom 9 per cent per annum, as envisaged in the Approachto the Twelfth Five Year Plan, to 8 per cent per annumin the finally approved Twelfth Plan document.
2.2 Growth Performance
2.2.1 The Twelfth Plan document stated that theobjective of 8 per cent annual average growth of GDPcan be achieved provided policies that take care ofweaknesses in the system are put in place. To emphasizethe role of policies, alternative scenarios were presentedin the Plan. Scenario one is called “Strong InclusiveGrowth” and presents what is possible if well-designedstrategy is implemented, intervening at key leveragepoints through the numerous policy actions outlined in
the Plan. It envisages taking appropriate steps to dealwith implementation and governance issues to make thewheels of governance move more smoothly at all levels.Scenario two, called “Insufficient action”, describes astate of partial action on policies, and with weakimplementation. The virtuous cycles that reinforcegrowth in Scenario-I will not kick in, and growth caneasily slow down to 6 to 6.5 per cent and inclusivenessalso suffer. This is where the economy will end up ifthere are slippages in implementation and only half-hearted efforts are made. Scenario three, called “Policylogjam”, reflects a situation where for one reason oranother most of the policies needed to achieve Scenario1 are not taken. If this scenario continues for any lengthof time, vicious cycles begin to set in and growth coulddrift down to 5.0 to 5.5 per cent per year, with verypoor outcomes on inclusion.
2.2.2 In a major national income accounting-relatedPress Note, New Series Estimates of National Income,Consumption Expenditure, Saving and CapitalFormation (Base Year 2011-12), released on 30th January2015 by the Ministry of Statistics & ProgrammeImplementation (MOSPI), sector-wise estimates werepresented as the Gross Value Added (GVA) at basic pricesand the use of Gross Domestic Product (GDP) growthrates at Factor Cost (GDPfc) was discontinued. NowGDP at Market Prices (GDPmp) is referred to as GDP.Table 2.1 provides yearly growth rates of GDPfc andGDPmp (with 2004-05 as a base) over the last sevenyears, along with growth rates of GDP and GVA at 2011-12 prices for the last four years.
2.2.3 As per the New Series estimates of nationalincome, the growth rate of Gross Value Added (GVA) atconstant (2011-12) basic prices increased from 5.4 percent in 2012-13 to 6.3 per cent in 2013-14 and furtherto 7.1 per cent in 2014-15. GVA at basic prices isobtained by adding production taxes net of subsidies toGDP at factor cost. According to the Press Note onAdvance Estimates of National Income 2015-16 andQuarterly Estimates of Gross Domestic Product for the
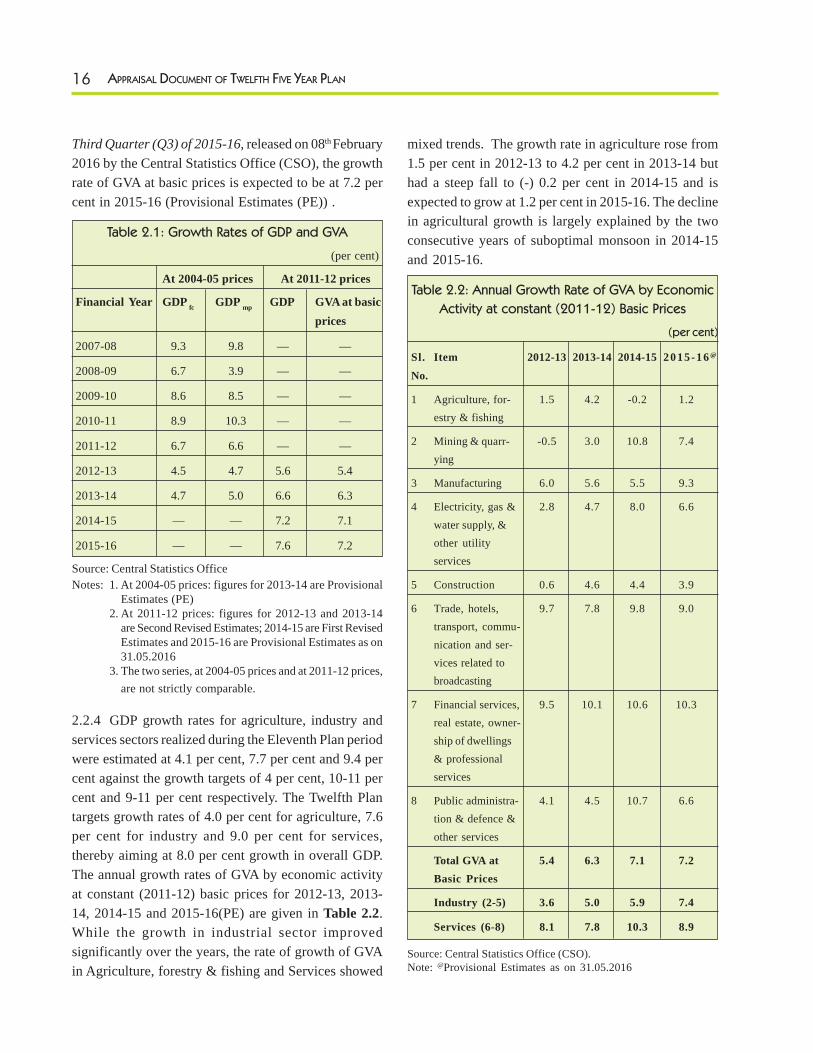
16 APPRAISAL DOCUMENT OF TWELFTH FIVE YEAR PLAN
Third Quarter (Q3) of 2015-16, released on 08th February2016 by the Central Statistics Office (CSO), the growthrate of GVA at basic prices is expected to be at 7.2 percent in 2015-16 (Provisional Estimates (PE)) .
Table 2.1: Growth Rates of GDP and GVA
(per cent)
At 2004-05 prices At 2011-12 prices
Financial Year GDP fc GDP mp GDP GVA at basicprices
2007-08 9.3 9.8 — —
2008-09 6.7 3.9 — —
2009-10 8.6 8.5 — —
2010-11 8.9 10.3 — —
2011-12 6.7 6.6 — —
2012-13 4.5 4.7 5.6 5.4
2013-14 4.7 5.0 6.6 6.3
2014-15 — — 7.2 7.1
2015-16 — — 7.6 7.2
Source: Central Statistics OfficeNotes: 1. At 2004-05 prices: figures for 2013-14 are Provisional
Estimates (PE)2. At 2011-12 prices: figures for 2012-13 and 2013-14
are Second Revised Estimates; 2014-15 are First RevisedEstimates and 2015-16 are Provisional Estimates as on31.05.2016
3. The two series, at 2004-05 prices and at 2011-12 prices,are not strictly comparable.
2.2.4 GDP growth rates for agriculture, industry andservices sectors realized during the Eleventh Plan periodwere estimated at 4.1 per cent, 7.7 per cent and 9.4 percent against the growth targets of 4 per cent, 10-11 percent and 9-11 per cent respectively. The Twelfth Plantargets growth rates of 4.0 per cent for agriculture, 7.6per cent for industry and 9.0 per cent for services,thereby aiming at 8.0 per cent growth in overall GDP.The annual growth rates of GVA by economic activityat constant (2011-12) basic prices for 2012-13, 2013-14, 2014-15 and 2015-16(PE) are given in Table 2.2.While the growth in industrial sector improvedsignificantly over the years, the rate of growth of GVAin Agriculture, forestry & fishing and Services showed
mixed trends. The growth rate in agriculture rose from1.5 per cent in 2012-13 to 4.2 per cent in 2013-14 buthad a steep fall to (-) 0.2 per cent in 2014-15 and isexpected to grow at 1.2 per cent in 2015-16. The declinein agricultural growth is largely explained by the twoconsecutive years of suboptimal monsoon in 2014-15and 2015-16.
Table 2.2: Annual Growth Rate of GVA by Economic
Activity at constant (2011-12) Basic Prices
(per cent)
Sl. Item 2012-13 2013-14 2014-15 2015-16 @
No.
1 Agriculture, for- 1.5 4.2 -0.2 1.2estry & fishing
2 Mining & quarr- -0.5 3.0 10.8 7.4ying
3 Manufacturing 6.0 5.6 5.5 9.3
4 Electricity, gas & 2.8 4.7 8.0 6.6water supply, &other utilityservices
5 Construction 0.6 4.6 4.4 3.9
6 Trade, hotels, 9.7 7.8 9.8 9.0transport, commu-nication and ser-vices related tobroadcasting
7 Financial services, 9.5 10.1 10.6 10.3real estate, owner-ship of dwellings& professionalservices
8 Public administra- 4.1 4.5 10.7 6.6tion & defence &other services
Total GVA at 5.4 6.3 7.1 7.2Basic Prices
Industry (2-5) 3.6 5.0 5.9 7.4
Services (6-8) 8.1 7.8 10.3 8.9
Source: Central Statistics Office (CSO).Note: @Provisional Estimates as on 31.05.2016
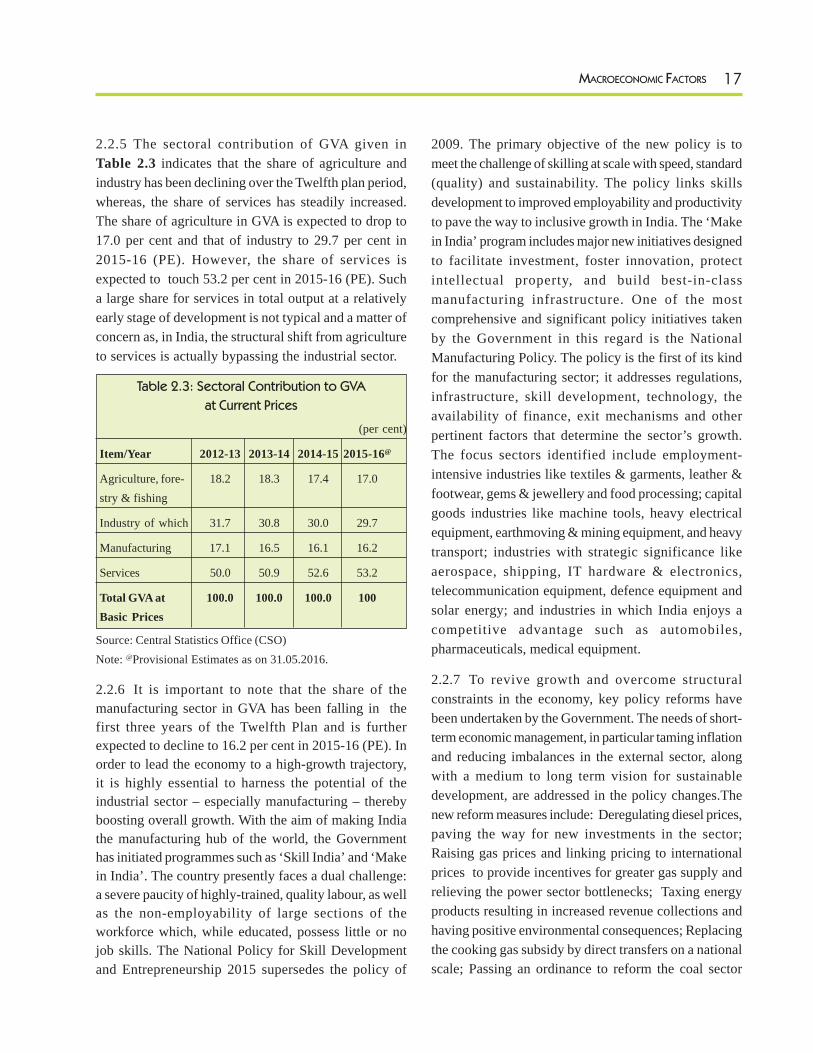
17MACROECONOMIC FACTORS
2.2.5 The sectoral contribution of GVA given inTable 2.3 indicates that the share of agriculture andindustry has been declining over the Twelfth plan period,whereas, the share of services has steadily increased.The share of agriculture in GVA is expected to drop to17.0 per cent and that of industry to 29.7 per cent in2015-16 (PE). However, the share of services isexpected to touch 53.2 per cent in 2015-16 (PE). Sucha large share for services in total output at a relativelyearly stage of development is not typical and a matter ofconcern as, in India, the structural shift from agricultureto services is actually bypassing the industrial sector.
Table 2.3: Sectoral Contribution to GVA
at Current Prices
(per cent)
Item/Year 2012-13 2013-14 2014-15 2015-16@
Agriculture, fore- 18.2 18.3 17.4 17.0stry & fishing
Industry of which 31.7 30.8 30.0 29.7
Manufacturing 17.1 16.5 16.1 16.2
Services 50.0 50.9 52.6 53.2
Total GVA at 100.0 100.0 100.0 100Basic Prices
Source: Central Statistics Office (CSO)Note: @Provisional Estimates as on 31.05.2016.
2.2.6 It is important to note that the share of themanufacturing sector in GVA has been falling in thefirst three years of the Twelfth Plan and is furtherexpected to decline to 16.2 per cent in 2015-16 (PE). Inorder to lead the economy to a high-growth trajectory,it is highly essential to harness the potential of theindustrial sector – especially manufacturing – therebyboosting overall growth. With the aim of making Indiathe manufacturing hub of the world, the Governmenthas initiated programmes such as ‘Skill India’ and ‘Makein India’. The country presently faces a dual challenge:a severe paucity of highly-trained, quality labour, as wellas the non-employability of large sections of theworkforce which, while educated, possess little or nojob skills. The National Policy for Skill Developmentand Entrepreneurship 2015 supersedes the policy of
2009. The primary objective of the new policy is tomeet the challenge of skilling at scale with speed, standard(quality) and sustainability. The policy links skillsdevelopment to improved employability and productivityto pave the way to inclusive growth in India. The ‘Makein India’ program includes major new initiatives designedto facilitate investment, foster innovation, protectintellectual property, and build best-in-classmanufacturing infrastructure. One of the mostcomprehensive and significant policy initiatives takenby the Government in this regard is the NationalManufacturing Policy. The policy is the first of its kindfor the manufacturing sector; it addresses regulations,infrastructure, skill development, technology, theavailability of finance, exit mechanisms and otherpertinent factors that determine the sector’s growth.The focus sectors identified include employment-intensive industries like textiles & garments, leather &footwear, gems & jewellery and food processing; capitalgoods industries like machine tools, heavy electricalequipment, earthmoving & mining equipment, and heavytransport; industries with strategic significance likeaerospace, shipping, IT hardware & electronics,telecommunication equipment, defence equipment andsolar energy; and industries in which India enjoys acompetitive advantage such as automobiles,pharmaceuticals, medical equipment.
2.2.7 To revive growth and overcome structuralconstraints in the economy, key policy reforms havebeen undertaken by the Government. The needs of short-term economic management, in particular taming inflationand reducing imbalances in the external sector, alongwith a medium to long term vision for sustainabledevelopment, are addressed in the policy changes.Thenew reform measures include: Deregulating diesel prices,paving the way for new investments in the sector;Raising gas prices and linking pricing to internationalprices to provide incentives for greater gas supply andrelieving the power sector bottlenecks; Taxing energyproducts resulting in increased revenue collections andhaving positive environmental consequences; Replacingthe cooking gas subsidy by direct transfers on a nationalscale; Passing an ordinance to reform the coal sector
18 APPRAISAL DOCUMENT OF TWELFTH FIVE YEAR PLAN
via auctions; Securing the political agreement on theGoods and Services Tax (GST) that will allow legislativepassage of the constitutional amendment bill; IncreasingFDI caps in defence and insurance; Eliminating thequantitative restrictions on gold; Passing an ordinanceto make land acquisition less onerous, thereby easingthe cost of doing business, while ensuring that farmersget fair compensation; Facilitating Presidential Assentfor labour reforms in Rajasthan and consolidating andmaking transparent a number of labour laws;Commencing a program of disinvestments under which10 percent of the government’s stake in Coal India wasoffered to the public; Passing the Mines and Minerals(Development and Regulation) (MMDR) AmendmentAct, 2015, a significant step in revival of the hithertostagnant mining sector in the country. These reformmeasures are expected to have a significant cumulativeimpact in the economy.
2.2.8 Several initiatives have been taken in the UnionBudget 2016-17 which aim at ensuring macro-economicstability and prudent fiscal management, boostingdomestic demand and continuing with the pace ofeconomic reforms and policy initiatives to change thelives of people for the better. Some of these includeapproval of a new policy for management of Governmentinvestment in Public Sector Enterprises, includingdisinvestment and strategic sale; Steps to re-vitalisePublic-Private Partnerships (PPPs) includingintroduction of Public Utility (Resolution of Disputes)Bill during 2016-17; issuance of Guidelines forrenegotiation of PPP Concession Agreements andintroduction of New credit rating system forinfrastructure projects. As noted, the ‘Make in India’campaign has already been launched, to revivemanufacturing growth and investment and thus createjobs. The major step taken in this regard include changesin customs and excise duty rates on certain inputs toreduce costs and improve competitiveness of domesticindustry in sectors like Information technologyhardware, capital goods, defence production, textiles,mineral fuels & mineral oils, chemicals & petrochemicals,
paper, paperboard & newsprint, Maintenance repair andoverhauling (MRO) of aircrafts and ship repair. Further,there are initiatives for the agriculture sector, whichinclude implementation of ‘Pradhan Mantri Krishi SinchaiYojana’ in mission mode; creating a dedicated LongTerm Irrigation Fund in NABARD; Programme forsustainable management of ground water resources;promoting organic farming through ‘Parmparagat KrishiVikas Yojana’ and ‘Organic Value Chain Development inNorth East Region’ and Unified Agricultural Marketinge-Platform to provide a common e-market platform forwholesale market. The Union Budget 2016-17 has alsoannounced various tax proposals – including relief tosmall tax payers, measures to boost growth andemployment generation, incentivizing domestic valueaddition to help Make in India, additional resourcemobilization for agriculture, rural economy and cleanenvironment– to provide better infrastructure, ruralrevival and social well-being. These measures areexpected to revive the Indian economy and instill animpetus towards a high-growth trajectory.
2.2.9 Growth scenarios at state level: The economy’saggregate growth rate is characterized by regionalvariations across states, with some distinguishable overalltrend. The economic slowdown witnessed in the initialyear of the Twelfth Plan period is reflected in lowergrowth rates for many states when compared to theirEleventh Plan growth rates in the year 2012-13. Howeverthe situation improved in 2013-14 for most states.Table 2.4 provides state-wise growth performanceduring the Eleventh Plan along with Twelfth Planexpectations, as well as their various growth rates inthe first three years of the Twelfth Plan. In 2012-13,Tripura, Bihar, Chhattisgarh and Madhya Pradeshreported the highest growth rates of GSDP, whereasArunachal Pradesh, Tamil Nadu, Odisha and Meghalayahad the lowest. In 2013-14 Meghalaya, Madhya Pradesh,Tripura and Bihar had the highest average growth ratesof GSDP whereas Odisha, Telangana, Rajasthan,Chhattisgarh and Uttar Pradesh had the lowest.
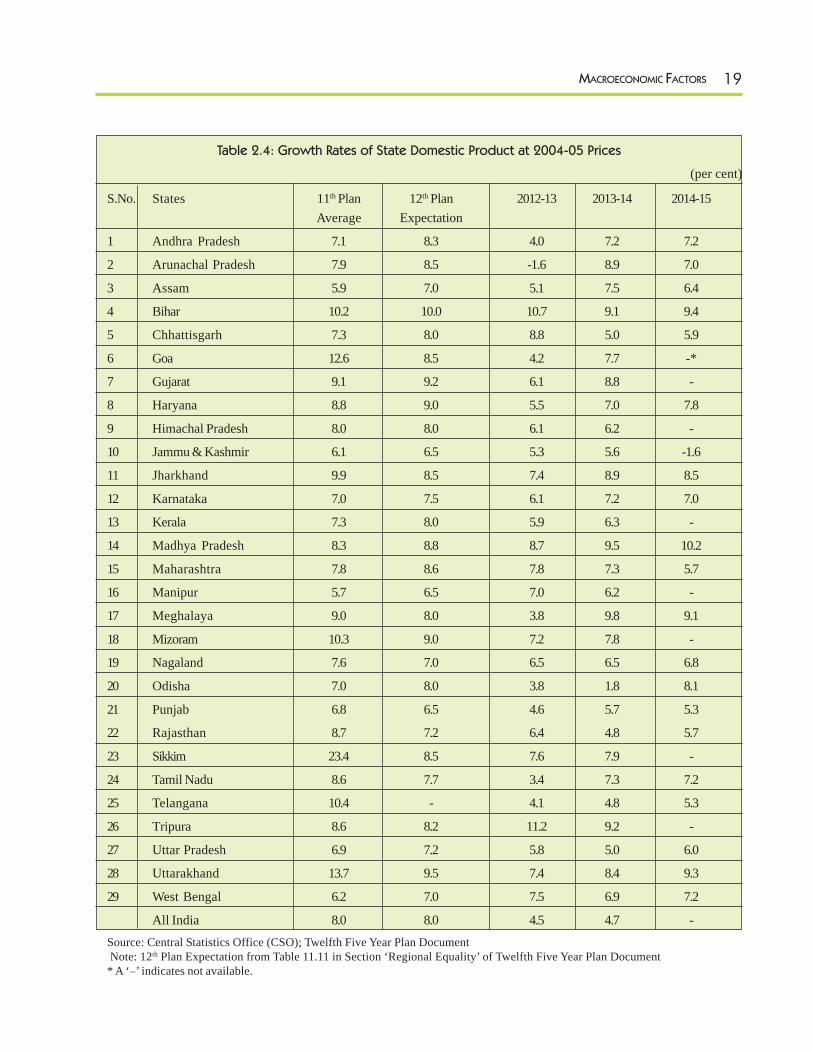
19MACROECONOMIC FACTORS
Table 2.4: Growth Rates of State Domestic Product at 2004-05 Prices
(per cent)
S.No. States 11th Plan 12th Plan 2012-13 2013-14 2014-15Average Expectation
1 Andhra Pradesh 7.1 8.3 4.0 7.2 7.2
2 Arunachal Pradesh 7.9 8.5 -1.6 8.9 7.0
3 Assam 5.9 7.0 5.1 7.5 6.4
4 Bihar 10.2 10.0 10.7 9.1 9.4
5 Chhattisgarh 7.3 8.0 8.8 5.0 5.9
6 Goa 12.6 8.5 4.2 7.7 -*
7 Gujarat 9.1 9.2 6.1 8.8 -
8 Haryana 8.8 9.0 5.5 7.0 7.8
9 Himachal Pradesh 8.0 8.0 6.1 6.2 -
10 Jammu & Kashmir 6.1 6.5 5.3 5.6 -1.6
11 Jharkhand 9.9 8.5 7.4 8.9 8.5
12 Karnataka 7.0 7.5 6.1 7.2 7.0
13 Kerala 7.3 8.0 5.9 6.3 -
14 Madhya Pradesh 8.3 8.8 8.7 9.5 10.2
15 Maharashtra 7.8 8.6 7.8 7.3 5.7
16 Manipur 5.7 6.5 7.0 6.2 -
17 Meghalaya 9.0 8.0 3.8 9.8 9.1
18 Mizoram 10.3 9.0 7.2 7.8 -
19 Nagaland 7.6 7.0 6.5 6.5 6.8
20 Odisha 7.0 8.0 3.8 1.8 8.1
21 Punjab 6.8 6.5 4.6 5.7 5.3
22 Rajasthan 8.7 7.2 6.4 4.8 5.7
23 Sikkim 23.4 8.5 7.6 7.9 -
24 Tamil Nadu 8.6 7.7 3.4 7.3 7.2
25 Telangana 10.4 - 4.1 4.8 5.3
26 Tripura 8.6 8.2 11.2 9.2 -
27 Uttar Pradesh 6.9 7.2 5.8 5.0 6.0
28 Uttarakhand 13.7 9.5 7.4 8.4 9.3
29 West Bengal 6.2 7.0 7.5 6.9 7.2
All India 8.0 8.0 4.5 4.7 -Source: Central Statistics Office (CSO); Twelfth Five Year Plan Document Note: 12th Plan Expectation from Table 11.11 in Section ‘Regional Equality’ of Twelfth Five Year Plan Document* A ‘–’ indicates not available.
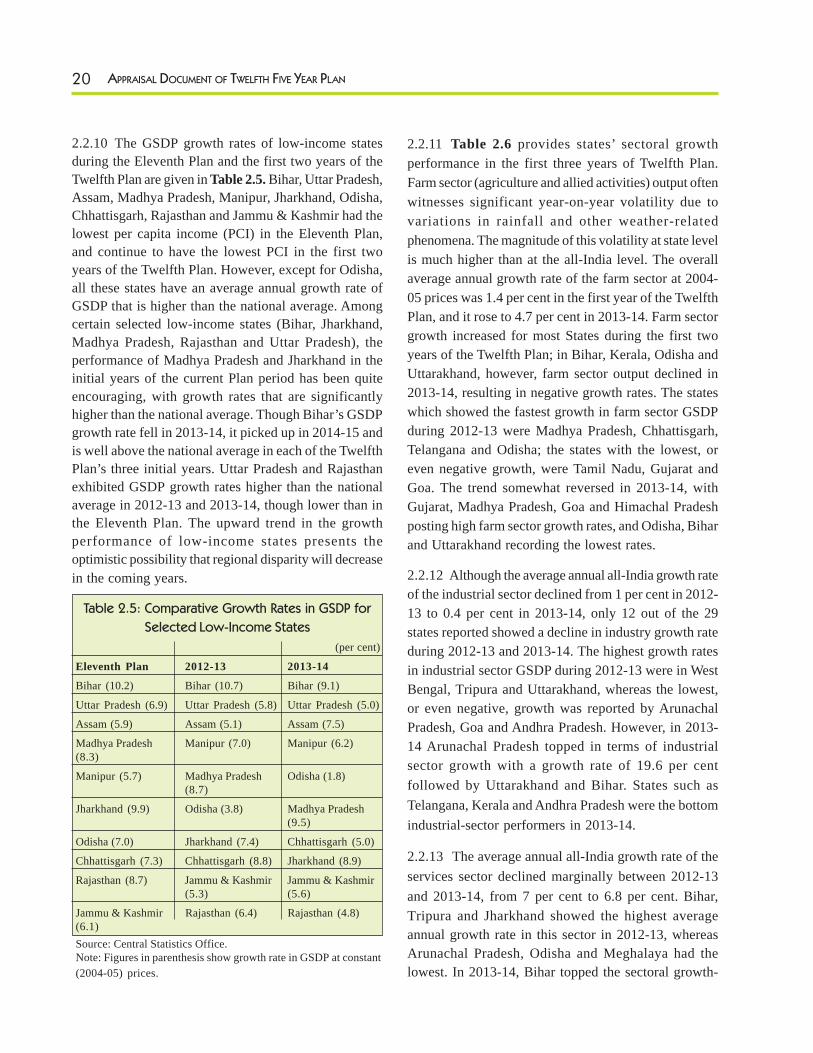
20 APPRAISAL DOCUMENT OF TWELFTH FIVE YEAR PLAN
2.2.10 The GSDP growth rates of low-income statesduring the Eleventh Plan and the first two years of theTwelfth Plan are given in Table 2.5. Bihar, Uttar Pradesh,Assam, Madhya Pradesh, Manipur, Jharkhand, Odisha,Chhattisgarh, Rajasthan and Jammu & Kashmir had thelowest per capita income (PCI) in the Eleventh Plan,and continue to have the lowest PCI in the first twoyears of the Twelfth Plan. However, except for Odisha,all these states have an average annual growth rate ofGSDP that is higher than the national average. Amongcertain selected low-income states (Bihar, Jharkhand,Madhya Pradesh, Rajasthan and Uttar Pradesh), theperformance of Madhya Pradesh and Jharkhand in theinitial years of the current Plan period has been quiteencouraging, with growth rates that are significantlyhigher than the national average. Though Bihar’s GSDPgrowth rate fell in 2013-14, it picked up in 2014-15 andis well above the national average in each of the TwelfthPlan’s three initial years. Uttar Pradesh and Rajasthanexhibited GSDP growth rates higher than the nationalaverage in 2012-13 and 2013-14, though lower than inthe Eleventh Plan. The upward trend in the growthperformance of low-income states presents theoptimistic possibility that regional disparity will decreasein the coming years.
Table 2.5: Comparative Growth Rates in GSDP for
Selected Low-Income States
(per cent)
Eleventh Plan 2012-13 2013-14
Bihar (10.2) Bihar (10.7) Bihar (9.1)
Uttar Pradesh (6.9) Uttar Pradesh (5.8) Uttar Pradesh (5.0)
Assam (5.9) Assam (5.1) Assam (7.5)
Madhya Pradesh Manipur (7.0) Manipur (6.2)(8.3)
Manipur (5.7) Madhya Pradesh Odisha (1.8)(8.7)
Jharkhand (9.9) Odisha (3.8) Madhya Pradesh(9.5)
Odisha (7.0) Jharkhand (7.4) Chhattisgarh (5.0)
Chhattisgarh (7.3) Chhattisgarh (8.8) Jharkhand (8.9)
Rajasthan (8.7) Jammu & Kashmir Jammu & Kashmir(5.3) (5.6)
Jammu & Kashmir Rajasthan (6.4) Rajasthan (4.8)(6.1)Source: Central Statistics Office.Note: Figures in parenthesis show growth rate in GSDP at constant(2004-05) prices.
2.2.11 Table 2.6 provides states’ sectoral growthperformance in the first three years of Twelfth Plan.Farm sector (agriculture and allied activities) output oftenwitnesses significant year-on-year volatility due tovariations in rainfall and other weather-relatedphenomena. The magnitude of this volatility at state levelis much higher than at the all-India level. The overallaverage annual growth rate of the farm sector at 2004-05 prices was 1.4 per cent in the first year of the TwelfthPlan, and it rose to 4.7 per cent in 2013-14. Farm sectorgrowth increased for most States during the first twoyears of the Twelfth Plan; in Bihar, Kerala, Odisha andUttarakhand, however, farm sector output declined in2013-14, resulting in negative growth rates. The stateswhich showed the fastest growth in farm sector GSDPduring 2012-13 were Madhya Pradesh, Chhattisgarh,Telangana and Odisha; the states with the lowest, oreven negative growth, were Tamil Nadu, Gujarat andGoa. The trend somewhat reversed in 2013-14, withGujarat, Madhya Pradesh, Goa and Himachal Pradeshposting high farm sector growth rates, and Odisha, Biharand Uttarakhand recording the lowest rates.
2.2.12 Although the average annual all-India growth rateof the industrial sector declined from 1 per cent in 2012-13 to 0.4 per cent in 2013-14, only 12 out of the 29states reported showed a decline in industry growth rateduring 2012-13 and 2013-14. The highest growth ratesin industrial sector GSDP during 2012-13 were in WestBengal, Tripura and Uttarakhand, whereas the lowest,or even negative, growth was reported by ArunachalPradesh, Goa and Andhra Pradesh. However, in 2013-14 Arunachal Pradesh topped in terms of industrialsector growth with a growth rate of 19.6 per centfollowed by Uttarakhand and Bihar. States such asTelangana, Kerala and Andhra Pradesh were the bottomindustrial-sector performers in 2013-14.
2.2.13 The average annual all-India growth rate of theservices sector declined marginally between 2012-13and 2013-14, from 7 per cent to 6.8 per cent. Bihar,Tripura and Jharkhand showed the highest averageannual growth rate in this sector in 2012-13, whereasArunachal Pradesh, Odisha and Meghalaya had thelowest. In 2013-14, Bihar topped the sectoral growth-
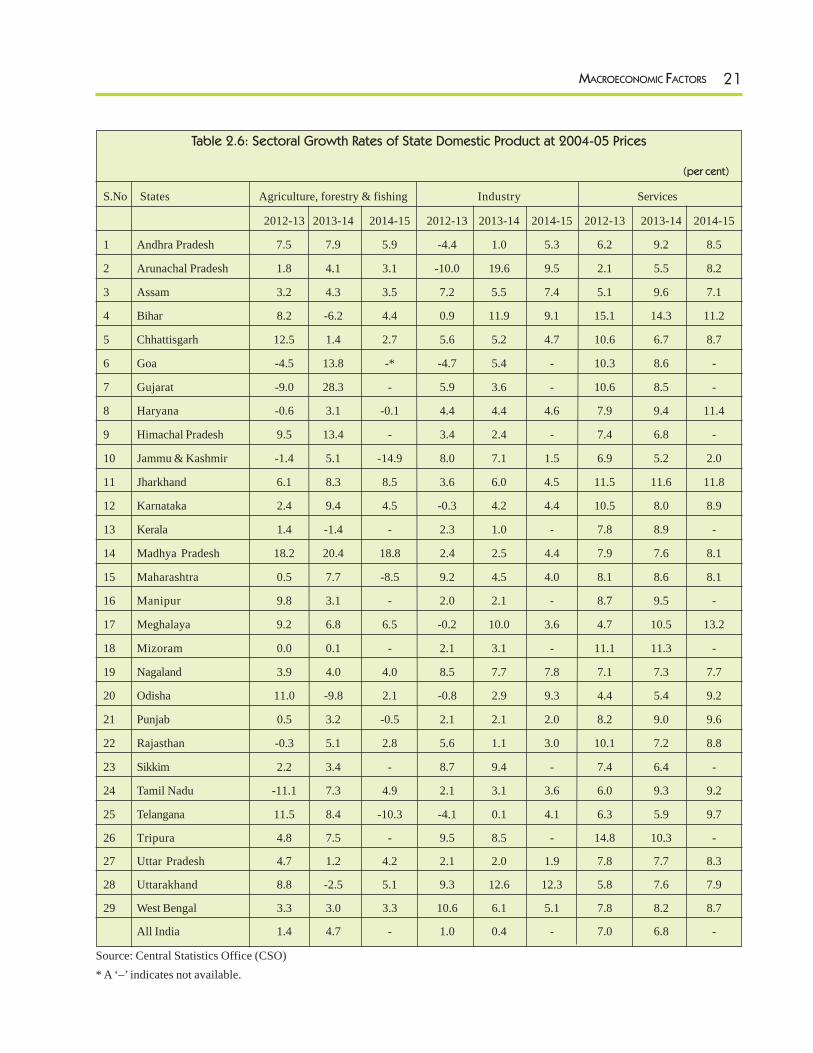
21MACROECONOMIC FACTORS
Table 2.6: Sectoral Growth Rates of State Domestic Product at 2004-05 Prices
(per cent)
S.No States Agriculture, forestry & fishing Industry Services
2012-13 2013-14 2014-15 2012-13 2013-14 2014-15 2012-13 2013-14 2014-15
1 Andhra Pradesh 7.5 7.9 5.9 -4.4 1.0 5.3 6.2 9.2 8.5
2 Arunachal Pradesh 1.8 4.1 3.1 -10.0 19.6 9.5 2.1 5.5 8.2
3 Assam 3.2 4.3 3.5 7.2 5.5 7.4 5.1 9.6 7.1
4 Bihar 8.2 -6.2 4.4 0.9 11.9 9.1 15.1 14.3 11.2
5 Chhattisgarh 12.5 1.4 2.7 5.6 5.2 4.7 10.6 6.7 8.7
6 Goa -4.5 13.8 -* -4.7 5.4 - 10.3 8.6 -
7 Gujarat -9.0 28.3 - 5.9 3.6 - 10.6 8.5 -
8 Haryana -0.6 3.1 -0.1 4.4 4.4 4.6 7.9 9.4 11.4
9 Himachal Pradesh 9.5 13.4 - 3.4 2.4 - 7.4 6.8 -
10 Jammu & Kashmir -1.4 5.1 -14.9 8.0 7.1 1.5 6.9 5.2 2.0
11 Jharkhand 6.1 8.3 8.5 3.6 6.0 4.5 11.5 11.6 11.8
12 Karnataka 2.4 9.4 4.5 -0.3 4.2 4.4 10.5 8.0 8.9
13 Kerala 1.4 -1.4 - 2.3 1.0 - 7.8 8.9 -
14 Madhya Pradesh 18.2 20.4 18.8 2.4 2.5 4.4 7.9 7.6 8.1
15 Maharashtra 0.5 7.7 -8.5 9.2 4.5 4.0 8.1 8.6 8.1
16 Manipur 9.8 3.1 - 2.0 2.1 - 8.7 9.5 -
17 Meghalaya 9.2 6.8 6.5 -0.2 10.0 3.6 4.7 10.5 13.2
18 Mizoram 0.0 0.1 - 2.1 3.1 - 11.1 11.3 -
19 Nagaland 3.9 4.0 4.0 8.5 7.7 7.8 7.1 7.3 7.7
20 Odisha 11.0 -9.8 2.1 -0.8 2.9 9.3 4.4 5.4 9.2
21 Punjab 0.5 3.2 -0.5 2.1 2.1 2.0 8.2 9.0 9.6
22 Rajasthan -0.3 5.1 2.8 5.6 1.1 3.0 10.1 7.2 8.8
23 Sikkim 2.2 3.4 - 8.7 9.4 - 7.4 6.4 -
24 Tamil Nadu -11.1 7.3 4.9 2.1 3.1 3.6 6.0 9.3 9.2
25 Telangana 11.5 8.4 -10.3 -4.1 0.1 4.1 6.3 5.9 9.7
26 Tripura 4.8 7.5 - 9.5 8.5 - 14.8 10.3 -
27 Uttar Pradesh 4.7 1.2 4.2 2.1 2.0 1.9 7.8 7.7 8.3
28 Uttarakhand 8.8 -2.5 5.1 9.3 12.6 12.3 5.8 7.6 7.9
29 West Bengal 3.3 3.0 3.3 10.6 6.1 5.1 7.8 8.2 8.7
All India 1.4 4.7 - 1.0 0.4 - 7.0 6.8 -
Source: Central Statistics Office (CSO)* A ‘–’ indicates not available.
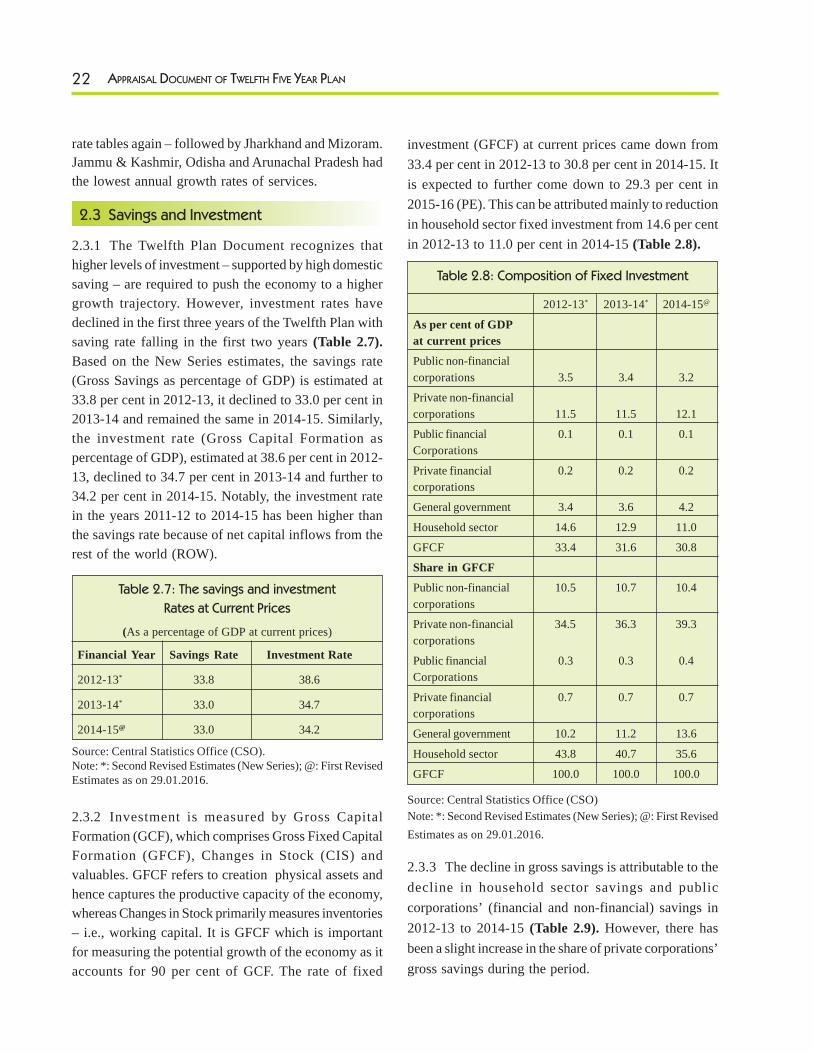
22 APPRAISAL DOCUMENT OF TWELFTH FIVE YEAR PLAN
investment (GFCF) at current prices came down from33.4 per cent in 2012-13 to 30.8 per cent in 2014-15. Itis expected to further come down to 29.3 per cent in2015-16 (PE). This can be attributed mainly to reductionin household sector fixed investment from 14.6 per centin 2012-13 to 11.0 per cent in 2014-15 (Table 2.8).
Table 2.8: Composition of Fixed Investment
2012-13* 2013-14* 2014-15@
As per cent of GDPat current prices
Public non-financialcorporations 3.5 3.4 3.2
Private non-financialcorporations 11.5 11.5 12.1
Public financial 0.1 0.1 0.1Corporations
Private financial 0.2 0.2 0.2corporations
General government 3.4 3.6 4.2
Household sector 14.6 12.9 11.0
GFCF 33.4 31.6 30.8
Share in GFCF
Public non-financial 10.5 10.7 10.4corporations
Private non-financial 34.5 36.3 39.3corporations
Public financial 0.3 0.3 0.4Corporations
Private financial 0.7 0.7 0.7corporations
General government 10.2 11.2 13.6
Household sector 43.8 40.7 35.6
GFCF 100.0 100.0 100.0
Source: Central Statistics Office (CSO)Note: *: Second Revised Estimates (New Series); @: First RevisedEstimates as on 29.01.2016.
2.3.3 The decline in gross savings is attributable to thedecline in household sector savings and publiccorporations’ (financial and non-financial) savings in2012-13 to 2014-15 (Table 2.9). However, there hasbeen a slight increase in the share of private corporations’gross savings during the period.
rate tables again – followed by Jharkhand and Mizoram.Jammu & Kashmir, Odisha and Arunachal Pradesh hadthe lowest annual growth rates of services.
2.3 Savings and Investment
2.3.1 The Twelfth Plan Document recognizes thathigher levels of investment – supported by high domesticsaving – are required to push the economy to a highergrowth trajectory. However, investment rates havedeclined in the first three years of the Twelfth Plan withsaving rate falling in the first two years (Table 2.7).Based on the New Series estimates, the savings rate(Gross Savings as percentage of GDP) is estimated at33.8 per cent in 2012-13, it declined to 33.0 per cent in2013-14 and remained the same in 2014-15. Similarly,the investment rate (Gross Capital Formation aspercentage of GDP), estimated at 38.6 per cent in 2012-13, declined to 34.7 per cent in 2013-14 and further to34.2 per cent in 2014-15. Notably, the investment ratein the years 2011-12 to 2014-15 has been higher thanthe savings rate because of net capital inflows from therest of the world (ROW).
2.3.2 Investment is measured by Gross CapitalFormation (GCF), which comprises Gross Fixed CapitalFormation (GFCF), Changes in Stock (CIS) andvaluables. GFCF refers to creation physical assets andhence captures the productive capacity of the economy,whereas Changes in Stock primarily measures inventories– i.e., working capital. It is GFCF which is importantfor measuring the potential growth of the economy as itaccounts for 90 per cent of GCF. The rate of fixed
Table 2.7: The savings and investment
Rates at Current Prices
(As a percentage of GDP at current prices)
Financial Year Savings Rate Investment Rate
2012-13* 33.8 38.6
2013-14* 33.0 34.7
2014-15@ 33.0 34.2
Source: Central Statistics Office (CSO).Note: *: Second Revised Estimates (New Series); @: First RevisedEstimates as on 29.01.2016.
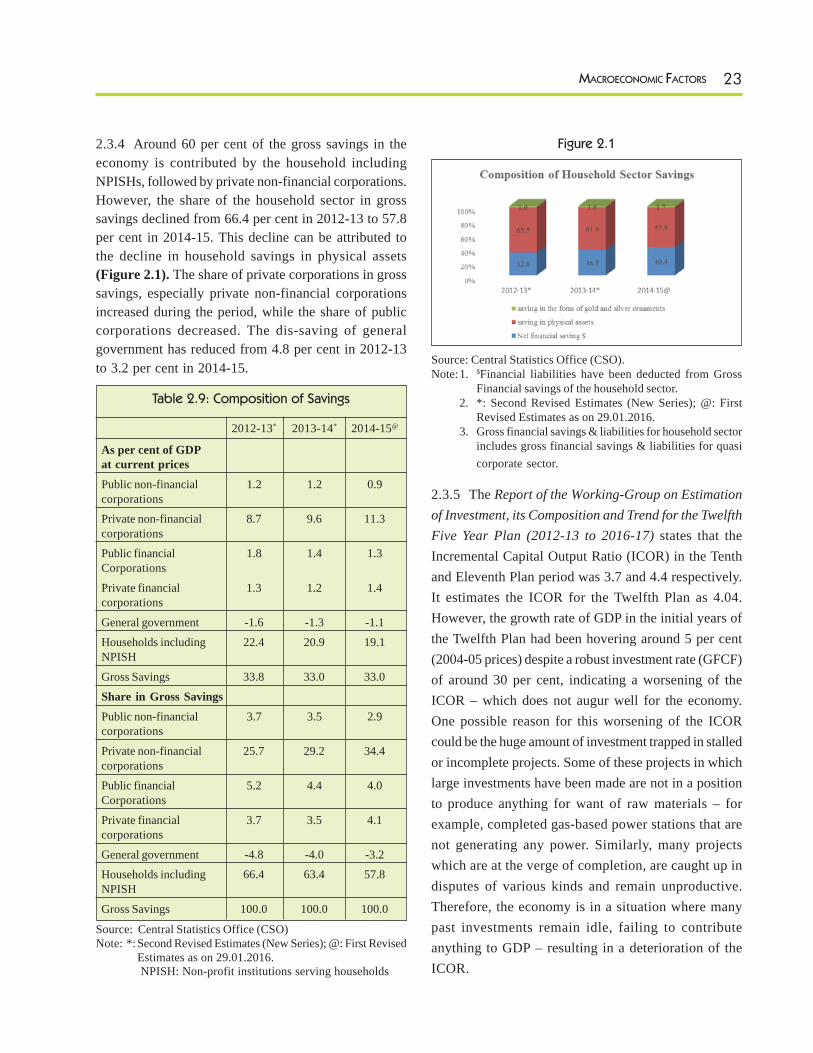
23MACROECONOMIC FACTORS
2.3.4 Around 60 per cent of the gross savings in theeconomy is contributed by the household includingNPISHs, followed by private non-financial corporations.However, the share of the household sector in grosssavings declined from 66.4 per cent in 2012-13 to 57.8per cent in 2014-15. This decline can be attributed tothe decline in household savings in physical assets(Figure 2.1). The share of private corporations in grosssavings, especially private non-financial corporationsincreased during the period, while the share of publiccorporations decreased. The dis-saving of generalgovernment has reduced from 4.8 per cent in 2012-13to 3.2 per cent in 2014-15.
Table 2.9: Composition of Savings
2012-13* 2013-14* 2014-15@
As per cent of GDPat current prices
Public non-financial 1.2 1.2 0.9corporations
Private non-financial 8.7 9.6 11.3corporations
Public financial 1.8 1.4 1.3Corporations
Private financial 1.3 1.2 1.4corporations
General government -1.6 -1.3 -1.1
Households including 22.4 20.9 19.1NPISH
Gross Savings 33.8 33.0 33.0
Share in Gross Savings
Public non-financial 3.7 3.5 2.9corporations
Private non-financial 25.7 29.2 34.4corporations
Public financial 5.2 4.4 4.0Corporations
Private financial 3.7 3.5 4.1corporations
General government -4.8 -4.0 -3.2
Households including 66.4 63.4 57.8NPISH
Gross Savings 100.0 100.0 100.0
Source: Central Statistics Office (CSO)Note: *: Second Revised Estimates (New Series); @: First Revised
Estimates as on 29.01.2016. NPISH: Non-profit institutions serving households
Figure 2.1
Source: Central Statistics Office (CSO).Note:1. $Financial liabilities have been deducted from Gross
Financial savings of the household sector.2. *: Second Revised Estimates (New Series); @: First
Revised Estimates as on 29.01.2016.3. Gross financial savings & liabilities for household sector
includes gross financial savings & liabilities for quasicorporate sector.
2.3.5 The Report of the Working-Group on Estimationof Investment, its Composition and Trend for the TwelfthFive Year Plan (2012-13 to 2016-17) states that theIncremental Capital Output Ratio (ICOR) in the Tenthand Eleventh Plan period was 3.7 and 4.4 respectively.It estimates the ICOR for the Twelfth Plan as 4.04.However, the growth rate of GDP in the initial years ofthe Twelfth Plan had been hovering around 5 per cent(2004-05 prices) despite a robust investment rate (GFCF)of around 30 per cent, indicating a worsening of theICOR – which does not augur well for the economy.One possible reason for this worsening of the ICORcould be the huge amount of investment trapped in stalledor incomplete projects. Some of these projects in whichlarge investments have been made are not in a positionto produce anything for want of raw materials – forexample, completed gas-based power stations that arenot generating any power. Similarly, many projectswhich are at the verge of completion, are caught up indisputes of various kinds and remain unproductive.Therefore, the economy is in a situation where manypast investments remain idle, failing to contributeanything to GDP – resulting in a deterioration of theICOR.
24 APPRAISAL DOCUMENT OF TWELFTH FIVE YEAR PLAN
2.3.6 For India to return to its potential growth path,an improvement in the efficiency of investment iswarranted. This requires unshackling stalled orincomplete projects, and creating a conducive businessenvironment. For this, transparent, unequivocal andstable policies are needed that can reduce the scope forcorruption and uncertainty, and help the corporate sectorin effectively planning its investments over the long termwithout unduly worrying about the risks associatedwith changes in government policies that couldadversely impact those investments. The governmenthas already set up the Prime Minister’s ProjectMonitoring Group (PMG) to track stalled megainvestment schemes, both in the public and the privatesectors, and to remove bottlenecks in theimplementation of these projects.
2.3.7 In order to improve business sentiment and spurdomestic as well as foreign investment in the country,easier regulations and a simpler and stable tax regime isrequired. The government’s recent pronouncement thatthe corporate tax rate would be gradually reduced from30 per cent to 25 per cent over four years, with acorresponding rationalisation of various tax exemptions,is significant in this regard. While encouraging privateinvestment, this step also signals a break from anexemption-based regime. The highlights of the final planof phasing out exemptions as given in Union Budget2016-17 includes (a) The accelerated depreciationprovided under IT Act will be limited to maximum 40per cent from 1.4.2017; (b) The benefit of deductionsfor Research would be limited to 150 per cent from1.4.2017 and 100 per cent from 1.4.2020; (c) The benefitof section 10AA to new SEZ units will be available tothose units which commence activity before 31.3.2020and (d) The weighted deduction under section 35CCDfor skill development will continue up to 1.4.2020. Also,with the launch of “Pradhan Mantri Jan Dhan Yojana” in2014-15, it is expected that financial inclusion willincrease, and household financial savings would be bettermobilized. Further, higher public savings are sought to
be achieved, inter-alia, through efforts towards fiscalconsolidation.
2.4 Fiscal Performance
2.4.1 The government has adopted a revised roadmapfor fiscal consolidation following an amendment to theFiscal Responsibility and Budget Management Act in2012. The strategy for reducing the fiscal deficit hasbeen designed with a judicious mix of, first, a reductionin total Central government expenditure as a percentageof GDP and, second, an improvement in tax revenue asa percentage of GDP. The strategy adopted has startedshowing positive results since 2012 (Table 2.10). Thetotal expenditure of the Central government was reducedfrom 15.8 per cent of GDP in 2009-10 to 14.9 per centin 2011-12 and further to 13.3 per cent in 2014-15. In2015-16 (RE) the total expenditure of the governmenthad only a marginal reduction to 13.2 per cent and to13.1 per cent in 2016-17 (BE).This is on account of thefact that the Government have increased Plan expenditureat the RE stage in 2015-16 in contrast to the usual practiceof reducing it. The gross tax revenue of Centralgovernment remained almost around 10.0 per cent ofGDP from 2010-11 to 2014-15. However, it improvedslightly to 10.8 per cent during 2015-16 and 2016-17indicative of the improved tax buoyancy in the country.As a result, the fiscal deficit of the Centre fell from 5.9per cent of GDP in 2011-12 to 3.9 per cent in 2015-16(RE) and further to 3.5 per cent in 2016-17 (BE). Therevenue deficit of the Centre declined from 4.5 percent of GDP in 2011-12 to 2.3 per cent of GDP in2016-17 (BE). The primary deficit of the Centre alsodeclined in the same period, indicating that the economyis on track to fiscal consolidation. It is also proposedin the Union Budget 2016-17 to constitute a Committeeto review the implementation of the FRBM Act in thecontext of increased uncertainty and volatility in theglobal economy and give its recommendations on theway forward.
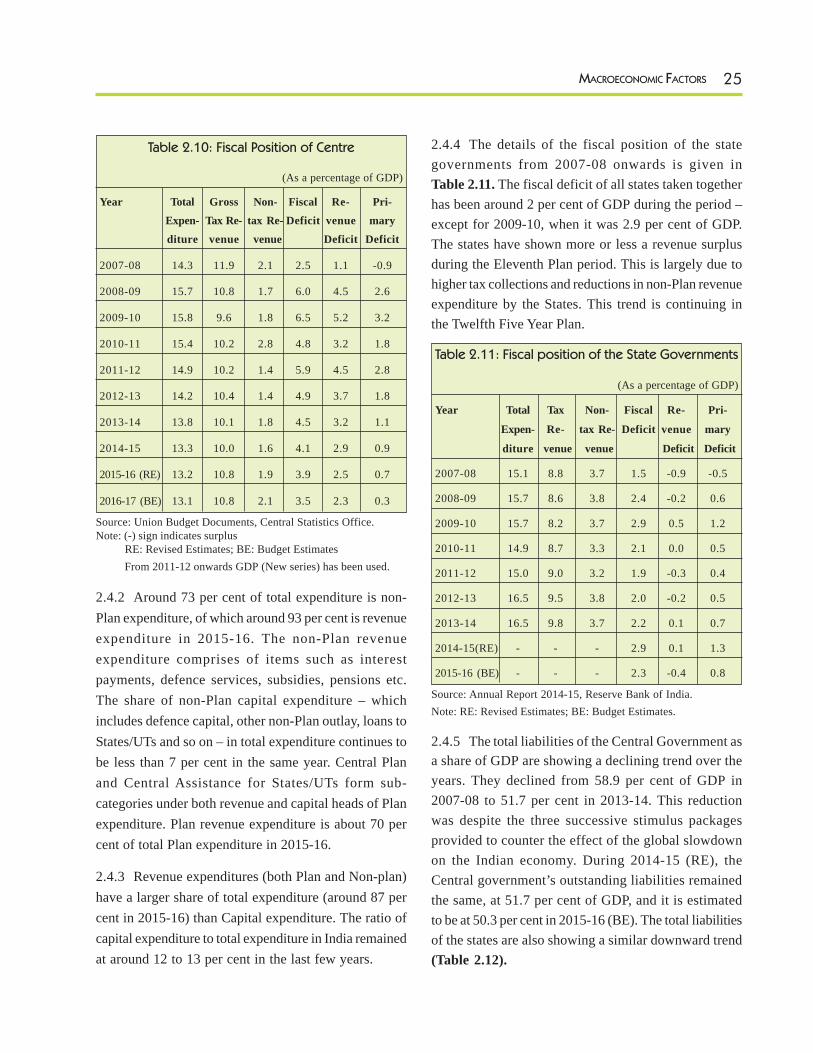
25MACROECONOMIC FACTORS
Table 2.10: Fiscal Position of Centre
(As a percentage of GDP)
Year Total Gross Non- Fiscal Re- Pri-Expen- Tax Re- tax Re- Deficit venue maryditure venue venue Deficit Deficit
2007-08 14.3 11.9 2.1 2.5 1.1 -0.9
2008-09 15.7 10.8 1.7 6.0 4.5 2.6
2009-10 15.8 9.6 1.8 6.5 5.2 3.2
2010-11 15.4 10.2 2.8 4.8 3.2 1.8
2011-12 14.9 10.2 1.4 5.9 4.5 2.8
2012-13 14.2 10.4 1.4 4.9 3.7 1.8
2013-14 13.8 10.1 1.8 4.5 3.2 1.1
2014-15 13.3 10.0 1.6 4.1 2.9 0.9
2015-16 (RE) 13.2 10.8 1.9 3.9 2.5 0.7
2016-17 (BE) 13.1 10.8 2.1 3.5 2.3 0.3
Source: Union Budget Documents, Central Statistics Office.Note: (-) sign indicates surplus RE: Revised Estimates; BE: Budget Estimates From 2011-12 onwards GDP (New series) has been used.
2.4.2 Around 73 per cent of total expenditure is non-Plan expenditure, of which around 93 per cent is revenueexpenditure in 2015-16. The non-Plan revenueexpenditure comprises of items such as interestpayments, defence services, subsidies, pensions etc.The share of non-Plan capital expenditure – whichincludes defence capital, other non-Plan outlay, loans toStates/UTs and so on – in total expenditure continues tobe less than 7 per cent in the same year. Central Planand Central Assistance for States/UTs form sub-categories under both revenue and capital heads of Planexpenditure. Plan revenue expenditure is about 70 percent of total Plan expenditure in 2015-16.
2.4.3 Revenue expenditures (both Plan and Non-plan)have a larger share of total expenditure (around 87 percent in 2015-16) than Capital expenditure. The ratio ofcapital expenditure to total expenditure in India remainedat around 12 to 13 per cent in the last few years.
2.4.4 The details of the fiscal position of the stategovernments from 2007-08 onwards is given inTable 2.11. The fiscal deficit of all states taken togetherhas been around 2 per cent of GDP during the period –except for 2009-10, when it was 2.9 per cent of GDP.The states have shown more or less a revenue surplusduring the Eleventh Plan period. This is largely due tohigher tax collections and reductions in non-Plan revenueexpenditure by the States. This trend is continuing inthe Twelfth Five Year Plan.
Table 2.11: Fiscal position of the State Governments
(As a percentage of GDP)
Year Total Tax Non- Fiscal Re- Pri-
Expen- Re- tax Re- Deficit venue mary
diture venue venue Deficit Deficit
2007-08 15.1 8.8 3.7 1.5 -0.9 -0.5
2008-09 15.7 8.6 3.8 2.4 -0.2 0.6
2009-10 15.7 8.2 3.7 2.9 0.5 1.2
2010-11 14.9 8.7 3.3 2.1 0.0 0.5
2011-12 15.0 9.0 3.2 1.9 -0.3 0.4
2012-13 16.5 9.5 3.8 2.0 -0.2 0.5
2013-14 16.5 9.8 3.7 2.2 0.1 0.7
2014-15(RE) - - - 2.9 0.1 1.3
2015-16 (BE) - - - 2.3 -0.4 0.8
Source: Annual Report 2014-15, Reserve Bank of India.Note: RE: Revised Estimates; BE: Budget Estimates.
2.4.5 The total liabilities of the Central Government asa share of GDP are showing a declining trend over theyears. They declined from 58.9 per cent of GDP in2007-08 to 51.7 per cent in 2013-14. This reductionwas despite the three successive stimulus packagesprovided to counter the effect of the global slowdownon the Indian economy. During 2014-15 (RE), theCentral government’s outstanding liabilities remainedthe same, at 51.7 per cent of GDP, and it is estimatedto be at 50.3 per cent in 2015-16 (BE). The total liabilitiesof the states are also showing a similar downward trend(Table 2.12).
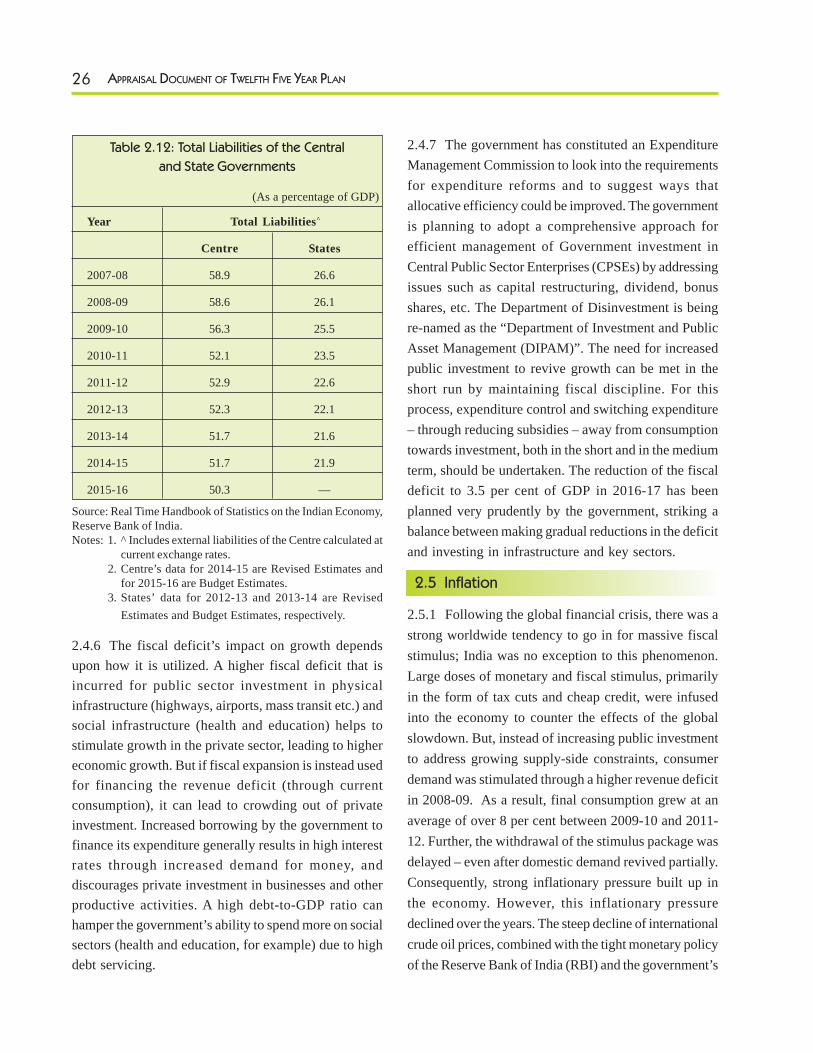
26 APPRAISAL DOCUMENT OF TWELFTH FIVE YEAR PLAN
Table 2.12: Total Liabilities of the Central
and State Governments
(As a percentage of GDP)
Year Total Liabilities^
Centre States
2007-08 58.9 26.6
2008-09 58.6 26.1
2009-10 56.3 25.5
2010-11 52.1 23.5
2011-12 52.9 22.6
2012-13 52.3 22.1
2013-14 51.7 21.6
2014-15 51.7 21.9
2015-16 50.3 —
Source: Real Time Handbook of Statistics on the Indian Economy,Reserve Bank of India.Notes: 1. ^ Includes external liabilities of the Centre calculated at
current exchange rates.2. Centre’s data for 2014-15 are Revised Estimates and
for 2015-16 are Budget Estimates.3. States’ data for 2012-13 and 2013-14 are Revised
Estimates and Budget Estimates, respectively.
2.4.6 The fiscal deficit’s impact on growth dependsupon how it is utilized. A higher fiscal deficit that isincurred for public sector investment in physicalinfrastructure (highways, airports, mass transit etc.) andsocial infrastructure (health and education) helps tostimulate growth in the private sector, leading to highereconomic growth. But if fiscal expansion is instead usedfor financing the revenue deficit (through currentconsumption), it can lead to crowding out of privateinvestment. Increased borrowing by the government tofinance its expenditure generally results in high interestrates through increased demand for money, anddiscourages private investment in businesses and otherproductive activities. A high debt-to-GDP ratio canhamper the government’s ability to spend more on socialsectors (health and education, for example) due to highdebt servicing.
2.4.7 The government has constituted an ExpenditureManagement Commission to look into the requirementsfor expenditure reforms and to suggest ways thatallocative efficiency could be improved. The governmentis planning to adopt a comprehensive approach forefficient management of Government investment inCentral Public Sector Enterprises (CPSEs) by addressingissues such as capital restructuring, dividend, bonusshares, etc. The Department of Disinvestment is beingre-named as the “Department of Investment and PublicAsset Management (DIPAM)”. The need for increasedpublic investment to revive growth can be met in theshort run by maintaining fiscal discipline. For thisprocess, expenditure control and switching expenditure– through reducing subsidies – away from consumptiontowards investment, both in the short and in the mediumterm, should be undertaken. The reduction of the fiscaldeficit to 3.5 per cent of GDP in 2016-17 has beenplanned very prudently by the government, striking abalance between making gradual reductions in the deficitand investing in infrastructure and key sectors.
2.5 Inflation
2.5.1 Following the global financial crisis, there was astrong worldwide tendency to go in for massive fiscalstimulus; India was no exception to this phenomenon.Large doses of monetary and fiscal stimulus, primarilyin the form of tax cuts and cheap credit, were infusedinto the economy to counter the effects of the globalslowdown. But, instead of increasing public investmentto address growing supply-side constraints, consumerdemand was stimulated through a higher revenue deficitin 2008-09. As a result, final consumption grew at anaverage of over 8 per cent between 2009-10 and 2011-12. Further, the withdrawal of the stimulus package wasdelayed – even after domestic demand revived partially.Consequently, strong inflationary pressure built up inthe economy. However, this inflationary pressuredeclined over the years. The steep decline of internationalcrude oil prices, combined with the tight monetary policyof the Reserve Bank of India (RBI) and the government’s
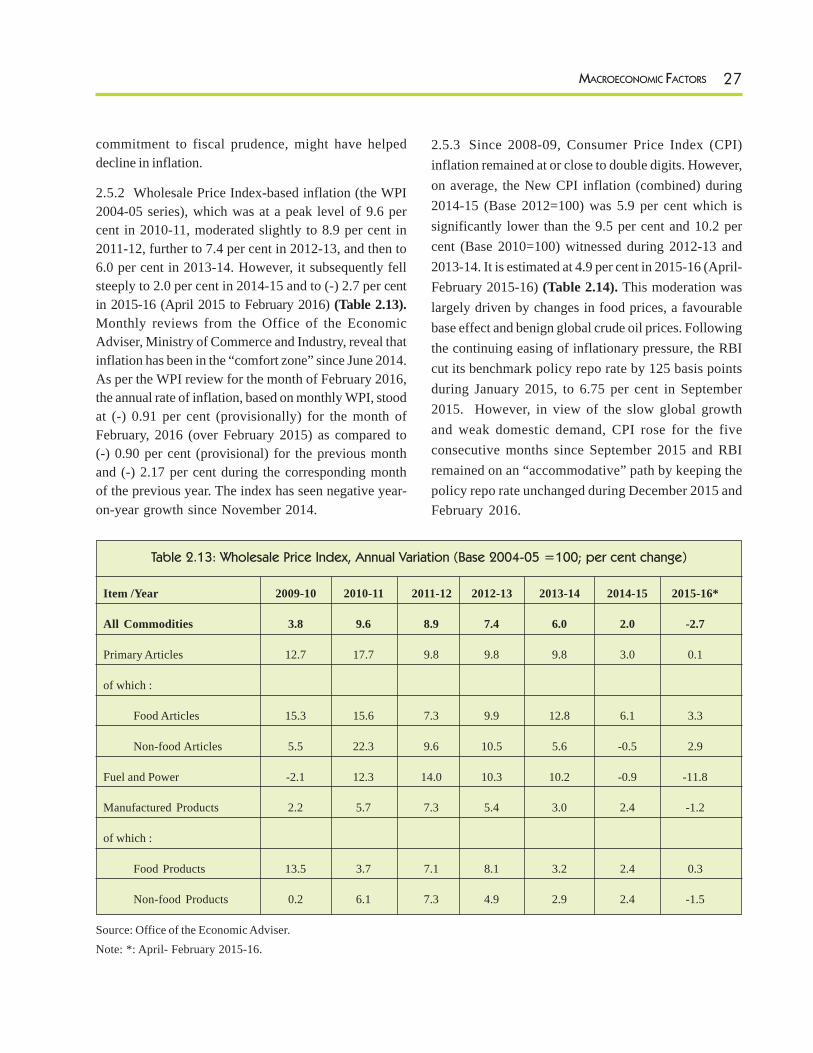
27MACROECONOMIC FACTORS
commitment to fiscal prudence, might have helpeddecline in inflation.
2.5.2 Wholesale Price Index-based inflation (the WPI2004-05 series), which was at a peak level of 9.6 percent in 2010-11, moderated slightly to 8.9 per cent in2011-12, further to 7.4 per cent in 2012-13, and then to6.0 per cent in 2013-14. However, it subsequently fellsteeply to 2.0 per cent in 2014-15 and to (-) 2.7 per centin 2015-16 (April 2015 to February 2016) (Table 2.13).Monthly reviews from the Office of the EconomicAdviser, Ministry of Commerce and Industry, reveal thatinflation has been in the “comfort zone” since June 2014.As per the WPI review for the month of February 2016,the annual rate of inflation, based on monthly WPI, stoodat (-) 0.91 per cent (provisionally) for the month ofFebruary, 2016 (over February 2015) as compared to(-) 0.90 per cent (provisional) for the previous monthand (-) 2.17 per cent during the corresponding monthof the previous year. The index has seen negative year-on-year growth since November 2014.
2.5.3 Since 2008-09, Consumer Price Index (CPI)inflation remained at or close to double digits. However,on average, the New CPI inflation (combined) during2014-15 (Base 2012=100) was 5.9 per cent which issignificantly lower than the 9.5 per cent and 10.2 percent (Base 2010=100) witnessed during 2012-13 and2013-14. It is estimated at 4.9 per cent in 2015-16 (April-February 2015-16) (Table 2.14). This moderation waslargely driven by changes in food prices, a favourablebase effect and benign global crude oil prices. Followingthe continuing easing of inflationary pressure, the RBIcut its benchmark policy repo rate by 125 basis pointsduring January 2015, to 6.75 per cent in September2015. However, in view of the slow global growthand weak domestic demand, CPI rose for the fiveconsecutive months since September 2015 and RBIremained on an “accommodative” path by keeping thepolicy repo rate unchanged during December 2015 andFebruary 2016.
Table 2.13: Wholesale Price Index, Annual Variation (Base 2004-05 =100; per cent change)
Item /Year 2009-10 2010-11 2011-12 2012-13 2013-14 2014-15 2015-16*
All Commodities 3.8 9.6 8.9 7.4 6.0 2.0 -2.7
Primary Articles 12.7 17.7 9.8 9.8 9.8 3.0 0.1
of which :
Food Articles 15.3 15.6 7.3 9.9 12.8 6.1 3.3
Non-food Articles 5.5 22.3 9.6 10.5 5.6 -0.5 2.9
Fuel and Power -2.1 12.3 14.0 10.3 10.2 -0.9 -11.8
Manufactured Products 2.2 5.7 7.3 5.4 3.0 2.4 -1.2
of which :
Food Products 13.5 3.7 7.1 8.1 3.2 2.4 0.3
Non-food Products 0.2 6.1 7.3 4.9 2.9 2.4 -1.5
Source: Office of the Economic Adviser.Note: *: April- February 2015-16.
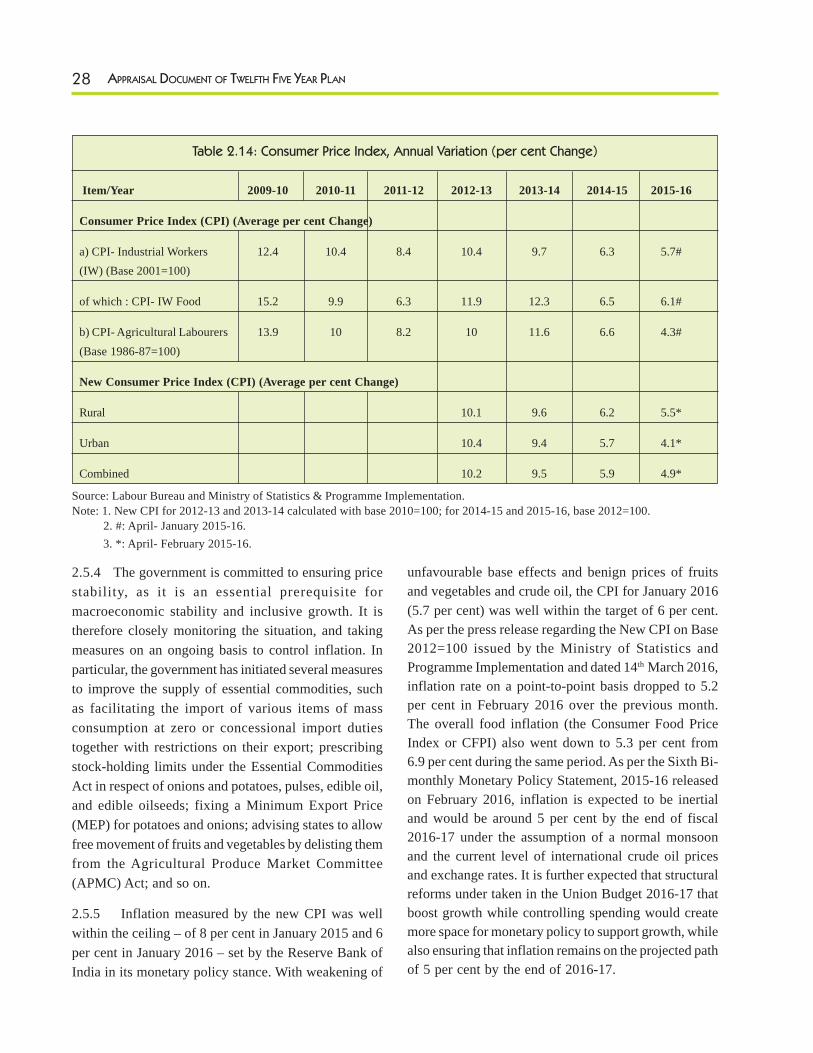
28 APPRAISAL DOCUMENT OF TWELFTH FIVE YEAR PLAN
2.5.4 The government is committed to ensuring pricestability, as it is an essential prerequisite formacroeconomic stability and inclusive growth. It istherefore closely monitoring the situation, and takingmeasures on an ongoing basis to control inflation. Inparticular, the government has initiated several measuresto improve the supply of essential commodities, suchas facilitating the import of various items of massconsumption at zero or concessional import dutiestogether with restrictions on their export; prescribingstock-holding limits under the Essential CommoditiesAct in respect of onions and potatoes, pulses, edible oil,and edible oilseeds; fixing a Minimum Export Price(MEP) for potatoes and onions; advising states to allowfree movement of fruits and vegetables by delisting themfrom the Agricultural Produce Market Committee(APMC) Act; and so on.
2.5.5 Inflation measured by the new CPI was wellwithin the ceiling – of 8 per cent in January 2015 and 6per cent in January 2016 – set by the Reserve Bank ofIndia in its monetary policy stance. With weakening of
unfavourable base effects and benign prices of fruitsand vegetables and crude oil, the CPI for January 2016(5.7 per cent) was well within the target of 6 per cent.As per the press release regarding the New CPI on Base2012=100 issued by the Ministry of Statistics andProgramme Implementation and dated 14th March 2016,inflation rate on a point-to-point basis dropped to 5.2per cent in February 2016 over the previous month.The overall food inflation (the Consumer Food PriceIndex or CFPI) also went down to 5.3 per cent from6.9 per cent during the same period. As per the Sixth Bi-monthly Monetary Policy Statement, 2015-16 releasedon February 2016, inflation is expected to be inertialand would be around 5 per cent by the end of fiscal2016-17 under the assumption of a normal monsoonand the current level of international crude oil pricesand exchange rates. It is further expected that structuralreforms under taken in the Union Budget 2016-17 thatboost growth while controlling spending would createmore space for monetary policy to support growth, whilealso ensuring that inflation remains on the projected pathof 5 per cent by the end of 2016-17.
Table 2.14: Consumer Price Index, Annual Variation (per cent Change)
Item/Year 2009-10 2010-11 2011-12 2012-13 2013-14 2014-15 2015-16
Consumer Price Index (CPI) (Average per cent Change)
a) CPI- Industrial Workers 12.4 10.4 8.4 10.4 9.7 6.3 5.7#(IW) (Base 2001=100)
of which : CPI- IW Food 15.2 9.9 6.3 11.9 12.3 6.5 6.1#
b) CPI- Agricultural Labourers 13.9 10 8.2 10 11.6 6.6 4.3#(Base 1986-87=100)
New Consumer Price Index (CPI) (Average per cent Change)
Rural 10.1 9.6 6.2 5.5*
Urban 10.4 9.4 5.7 4.1*
Combined 10.2 9.5 5.9 4.9*
Source: Labour Bureau and Ministry of Statistics & Programme Implementation.Note: 1. New CPI for 2012-13 and 2013-14 calculated with base 2010=100; for 2014-15 and 2015-16, base 2012=100. 2. #: April- January 2015-16. 3. *: April- February 2015-16.
29MACROECONOMIC FACTORS
2.5.6 Further, it is also important that fiscal policy andmonetary policy should work concurrently to achievegrowth with price stability. Towards the latter half ofthe Eleventh Five Year Plan it was observed that, whilethe RBI was following a tight monetary policy to tackleinflation, the fiscal deficit of the Central Governmentworsened because of increasing subsidies. Because ofthe fiscal profligacy of the Central Government, tightmonetary policy was not able to effectively manageinflation but instead dragged growth down. Of late, thefiscal deficit of the Central Government has decreasedand it seems that both monetary policy and fiscal policyare working in tandem to manage inflation. However,the real challenge lies in stabilizing the inflation rate below5-6 per cent in the medium to long term.
2.6 External Sector Performance
2.6.1 Exports had increased at an average of around20.3 per cent per year in US$ terms during the EleventhPlan. The Twelfth Plan, taking into account theperformance of exports during the Eleventh Plan andthe prospect that the global economy would graduallyrecover, expected exports to be over US$ 570 billion by2016-17. In the first year of the Twelfth Plan (2012-13), the value of exports stood at US $ 300.4 billion, adecline of 1.8 per cent over the previous year. Thesituation improved during 2013-14, with exports valuedat US$ 314.4 billion – an annual growth rate of 4.7 percent. However, in 2014-15 the annual growth rate ofexports declined to 1.3 per cent, with exports valued atUS $ 310.3 billion (RBI, Real Time Handbook of Statisticson the Indian Economy).
2.6.2 India has taken key strategic initiatives under itsForeign Trade Policy to boost exports. Major stepsinclude the diversification of export markets and theexport product basket; strengthening export-relatedinfrastructure; enhancing credit flows fosr exports atlower cost; reducing transaction costs; building a brandimage for India; and extending protection to sensitivedomestic sectors.
2.6.3 For robust export growth, policy initiatives onboth the global and the domestic front need considerableimpetus. On the global side, apart from strengtheningefforts on the Focus Market and Focus Productschemes and on the branding of India, the identificationof sectors for Free Trade Agreements (FTAs) or RegionalTrade Agreements (RTAs) must be on the basis ofcomparative advantage. Similarly, the inverted dutystructure in sectors like electronics, textiles andchemicals must be addressed, as must the artificial dutystructure caused by some FTAs and RTAs. On the otherhand, export-related policies on the domestic side caninclude the cluster-based SEZ approach, withgovernment support in infrastructure and IT. Labour-intensive export segments may be provided withpreferential treatment; this would help in addressingunemployment and aid the manufacturing sector. Topromote the export of hi-tech products and to remainglobally competitive in the long run, investment in R&D,innovation and skill development is necessary. Anotherimportant initiative that needs a further push is thesimplification of procedures and documentation toreduce delays and costs to exporters. In this regard, theimprovement in transport infrastructure, especially portinfrastructure, demands attention.
2.6.4 Imports increased at an average rate of 22.3 percent during the Eleventh Plan period. The value ofimports in the beginning of the Twelfth Plan (2012-13)was recorded at US$ 490.7 billion, showing a growthof 0.3 per cent. However, imports declined by 8.3 percent during 2013-14 to US$ 450.2 billion, largelyreflecting a fall in non-oil imports by 12.6 per cent. Thedecline in the annual growth rate of imports eased to0.5 per cent in 2014-15, with the value of importsshowing at US$ 448.0 billion (RBI, Real Time Handbookof Statistics on the Indian Economy). Top fivecommodities exported from and imported to India aregiven in Table 2.15.
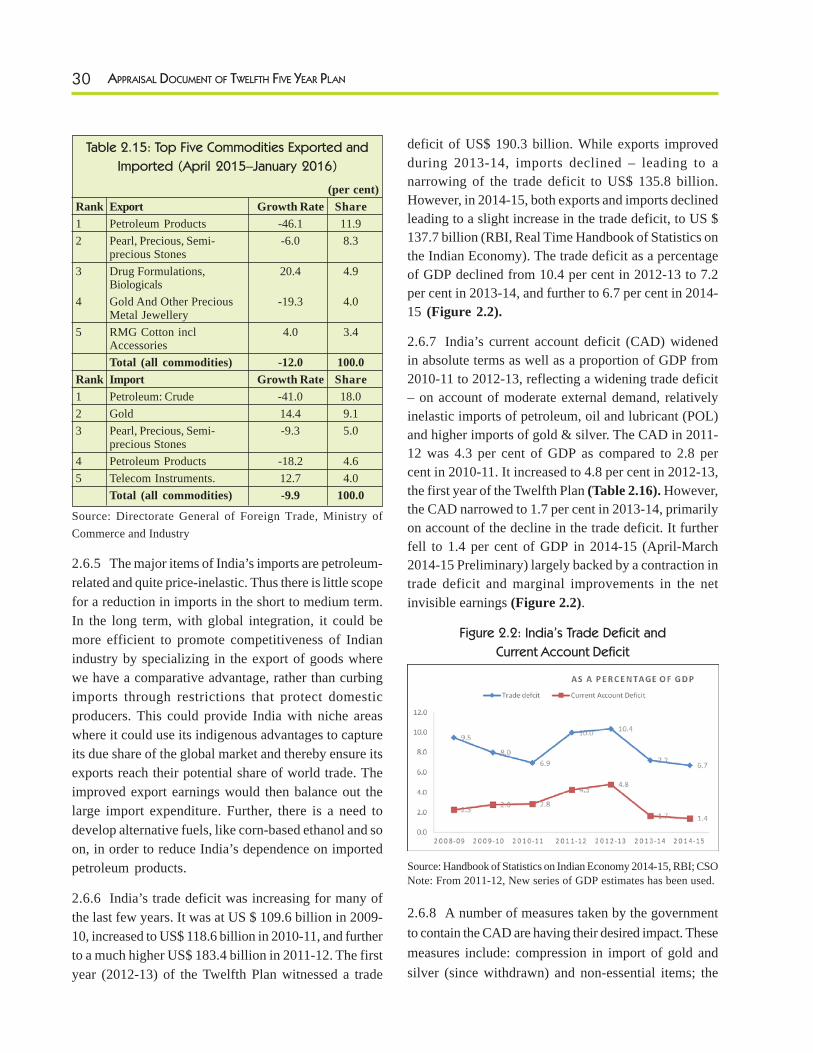
30 APPRAISAL DOCUMENT OF TWELFTH FIVE YEAR PLAN
Table 2.15: Top Five Commodities Exported and
Imported (April 2015–January 2016)
(per cent)Rank Export Growth Rate Share1 Petroleum Products -46.1 11.92 Pearl, Precious, Semi- -6.0 8.3
precious Stones3 Drug Formulations, 20.4 4.9
Biologicals4 Gold And Other Precious -19.3 4.0
Metal Jewellery5 RMG Cotton incl 4.0 3.4
AccessoriesTotal (all commodities) -12.0 100.0
Rank Import Growth Rate Share1 Petroleum: Crude -41.0 18.02 Gold 14.4 9.13 Pearl, Precious, Semi- -9.3 5.0
precious Stones4 Petroleum Products -18.2 4.65 Telecom Instruments. 12.7 4.0
Total (all commodities) -9.9 100.0
Source: Directorate General of Foreign Trade, Ministry ofCommerce and Industry
2.6.5 The major items of India’s imports are petroleum-related and quite price-inelastic. Thus there is little scopefor a reduction in imports in the short to medium term.In the long term, with global integration, it could bemore efficient to promote competitiveness of Indianindustry by specializing in the export of goods wherewe have a comparative advantage, rather than curbingimports through restrictions that protect domesticproducers. This could provide India with niche areaswhere it could use its indigenous advantages to captureits due share of the global market and thereby ensure itsexports reach their potential share of world trade. Theimproved export earnings would then balance out thelarge import expenditure. Further, there is a need todevelop alternative fuels, like corn-based ethanol and soon, in order to reduce India’s dependence on importedpetroleum products.
2.6.6 India’s trade deficit was increasing for many ofthe last few years. It was at US $ 109.6 billion in 2009-10, increased to US$ 118.6 billion in 2010-11, and furtherto a much higher US$ 183.4 billion in 2011-12. The firstyear (2012-13) of the Twelfth Plan witnessed a trade
deficit of US$ 190.3 billion. While exports improvedduring 2013-14, imports declined – leading to anarrowing of the trade deficit to US$ 135.8 billion.However, in 2014-15, both exports and imports declinedleading to a slight increase in the trade deficit, to US $137.7 billion (RBI, Real Time Handbook of Statistics onthe Indian Economy). The trade deficit as a percentageof GDP declined from 10.4 per cent in 2012-13 to 7.2per cent in 2013-14, and further to 6.7 per cent in 2014-15 (Figure 2.2).
2.6.7 India’s current account deficit (CAD) widenedin absolute terms as well as a proportion of GDP from2010-11 to 2012-13, reflecting a widening trade deficit– on account of moderate external demand, relativelyinelastic imports of petroleum, oil and lubricant (POL)and higher imports of gold & silver. The CAD in 2011-12 was 4.3 per cent of GDP as compared to 2.8 percent in 2010-11. It increased to 4.8 per cent in 2012-13,the first year of the Twelfth Plan (Table 2.16). However,the CAD narrowed to 1.7 per cent in 2013-14, primarilyon account of the decline in the trade deficit. It furtherfell to 1.4 per cent of GDP in 2014-15 (April-March2014-15 Preliminary) largely backed by a contraction intrade deficit and marginal improvements in the netinvisible earnings (Figure 2.2).
Figure 2.2: India’s Trade Deficit and
Current Account Deficit
Source: Handbook of Statistics on Indian Economy 2014-15, RBI; CSONote: From 2011-12, New series of GDP estimates has been used.
2.6.8 A number of measures taken by the governmentto contain the CAD are having their desired impact. Thesemeasures include: compression in import of gold andsilver (since withdrawn) and non-essential items; the
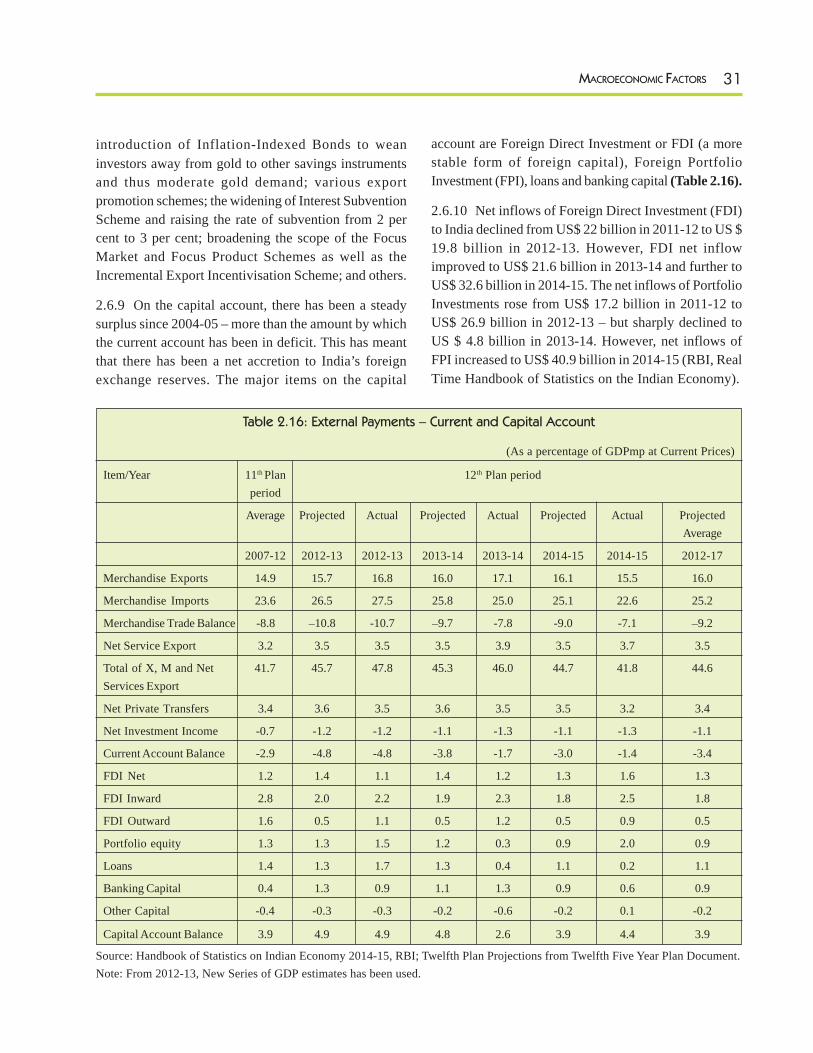
31MACROECONOMIC FACTORS
introduction of Inflation-Indexed Bonds to weaninvestors away from gold to other savings instrumentsand thus moderate gold demand; various exportpromotion schemes; the widening of Interest SubventionScheme and raising the rate of subvention from 2 percent to 3 per cent; broadening the scope of the FocusMarket and Focus Product Schemes as well as theIncremental Export Incentivisation Scheme; and others.
2.6.9 On the capital account, there has been a steadysurplus since 2004-05 – more than the amount by whichthe current account has been in deficit. This has meantthat there has been a net accretion to India’s foreignexchange reserves. The major items on the capital
account are Foreign Direct Investment or FDI (a morestable form of foreign capital), Foreign PortfolioInvestment (FPI), loans and banking capital (Table 2.16).
2.6.10 Net inflows of Foreign Direct Investment (FDI)to India declined from US$ 22 billion in 2011-12 to US $19.8 billion in 2012-13. However, FDI net inflowimproved to US$ 21.6 billion in 2013-14 and further toUS$ 32.6 billion in 2014-15. The net inflows of PortfolioInvestments rose from US$ 17.2 billion in 2011-12 toUS$ 26.9 billion in 2012-13 – but sharply declined toUS $ 4.8 billion in 2013-14. However, net inflows ofFPI increased to US$ 40.9 billion in 2014-15 (RBI, RealTime Handbook of Statistics on the Indian Economy).
Table 2.16: External Payments – Current and Capital Account
(As a percentage of GDPmp at Current Prices)
Item/Year 11th Plan 12th Plan periodperiod
Average Projected Actual Projected Actual Projected Actual ProjectedAverage
2007-12 2012-13 2012-13 2013-14 2013-14 2014-15 2014-15 2012-17
Merchandise Exports 14.9 15.7 16.8 16.0 17.1 16.1 15.5 16.0
Merchandise Imports 23.6 26.5 27.5 25.8 25.0 25.1 22.6 25.2
Merchandise Trade Balance -8.8 –10.8 -10.7 –9.7 -7.8 -9.0 -7.1 –9.2
Net Service Export 3.2 3.5 3.5 3.5 3.9 3.5 3.7 3.5
Total of X, M and Net 41.7 45.7 47.8 45.3 46.0 44.7 41.8 44.6Services Export
Net Private Transfers 3.4 3.6 3.5 3.6 3.5 3.5 3.2 3.4
Net Investment Income -0.7 -1.2 -1.2 -1.1 -1.3 -1.1 -1.3 -1.1
Current Account Balance -2.9 -4.8 -4.8 -3.8 -1.7 -3.0 -1.4 -3.4
FDI Net 1.2 1.4 1.1 1.4 1.2 1.3 1.6 1.3
FDI Inward 2.8 2.0 2.2 1.9 2.3 1.8 2.5 1.8
FDI Outward 1.6 0.5 1.1 0.5 1.2 0.5 0.9 0.5
Portfolio equity 1.3 1.3 1.5 1.2 0.3 0.9 2.0 0.9
Loans 1.4 1.3 1.7 1.3 0.4 1.1 0.2 1.1
Banking Capital 0.4 1.3 0.9 1.1 1.3 0.9 0.6 0.9
Other Capital -0.4 -0.3 -0.3 -0.2 -0.6 -0.2 0.1 -0.2
Capital Account Balance 3.9 4.9 4.9 4.8 2.6 3.9 4.4 3.9
Source: Handbook of Statistics on Indian Economy 2014-15, RBI; Twelfth Plan Projections from Twelfth Five Year Plan Document.Note: From 2012-13, New Series of GDP estimates has been used.
32 APPRAISAL DOCUMENT OF TWELFTH FIVE YEAR PLAN
2.6.11 India has been ranked among the top threeattractive destinations for inbound investments. Since1991, the regulatory environment in terms of foreigninvestment has been consistently eased to make itinvestor-friendly. The policy measures adopted in theUnion Budget 2016-17 in this regard include:Reforms inFDI policy in the areas of Insurance and Pension, AssetReconstruction Companies, Stock Exchanges; 100 percent FDI to be allowed through FIPB route in marketingof food products produced and manufactured in India.
2.6.12 India’s external debt has been increasing overthe years from US$ 317.9 billion in end-March 2011 toUS$ 360.8 billion in end-March 2012, US$ 409.4 billionin end-March 2013, US$ 446.3 billion in end-March 2014and US$ 475.2 billion in end-March 2015. Out of thetotal external debt as of end-March 2015, the long-termdebt at US$ 389.7 billion and short-term debt at US$85.5 billion accounted for 82.0 per cent and 18.0 percent, respectively (RBI, Real Time Handbook ofStatistics on the Indian Economy). The total externaldebt-to-GDP ratio also increased from 18.2 per cent inend-March 2010 to 22.3 per cent in end-March 2013,23.6 per cent in end-March 2014 and further to 23.7per cent in end-March 2015 (Partially Revised). Therise in external debt during the period was due to long-term external debt – particularly commercial borrowingsand NRI deposits.
2.6.13 With the commencement of the Twelfth Plan in2012-13, the value of India’s foreign exchange reserves(including foreign currency assets, gold, reserve trancheand SDRs) stood at US$ 294.4 billion by the end ofMarch 2012. It declined marginally to US $ 292 billionby end of March 2013, but increased to US$ 304.2 billionat end-March 2014. It has further increased to US$ 341.6billion at the end of March 2015(RBI, Real TimeHandbook of Statistics on the Indian Economy) andreached an all-time peak of US$ 355.5 billion as on June19, 2015 and is at US$ 350.4 billion as on February 19,2016 (RBI Bulletin). The lower trade and current accountdeficits and abundant financial flows, mainly portfolioflows into domestic debt and equity markets and foreigndirect investment, resulted in increased foreign exchangereserves.
2.7 Global Economic Environment
2.7.1 The ability of the domestic economy to bounceback to a higher growth trajectory towards the latterhalf of the Twelfth Plan will depend, besides domesticfactors, on the way the global economy grows, especiallythe GDP growth rate in advanced economies. As perWorld Economic Outlook (WEO) Update, January 2016,the growth forecast for the world economy, estimatedat 3.1 per cent in 2015, is projected at 3.4 per cent in2016 and 3.6 percent in 2017. According to the report,risks to the global growth remain downwardly skewedwith the continuing adjustments in the global economyviz. a generalized slowdown in emerging marketeconomies, China’s rebalancing, lower commodityprices, and the gradual exit from extraordinarilyaccommodative monetary conditions in the United States.In advanced economies, a modest and uneven recoveryis expected to continue, with the growth rate slowlyimproving from 1.8 per cent in 2014 to 1.9 per cent in2015 and projected growth rate of 2.1 per cent for 2016and 2017. For emerging markets and developingeconomies, the situation is diverse but in many caseschallenging. It is expected that the slowdown andrebalancing of the Chinese economy, lower commodityprices, and strains in some large emerging marketeconomies will continue to stress growth prospects foremerging market and developing economies in 2016–17.However their growth rate is projected to increase from4.3 per cent in 2016 to 4.7 per cent in 2017. Theprojected pickup in growth in the next two years mainlyreflects forecasts of a gradual improvement of growthrates in countries currently in economic distress, notablyBrazil, Russia, and some countries in the Middle East.Growth in China is expected to remain sluggish to 6.3per cent in 2016 and 6.0 per cent in 2017, indicatingweaker investment growth as the economy continuesto rebalance. India and the rest of emerging Asia aregenerally projected to continue growing at a robust pace,although with some countries suffering importantimplications from China’s economic rebalancing andglobal manufacturing weakness. Notably, the Indianeconomy is projected to grow at a faster pace than theadvanced economies and most of the emerging marketand developing economies, with a growth forecast of7.5 per cent in 2016 and 2017. However, the ability touse diverse global developments to boost its domestic
33MACROECONOMIC FACTORS
growth will depend largely on India’s capacity tosuccessfully tackle domestic problems and improvebusiness sentiment within the country. According to theIMF, India’s economic growth would benefit fromrecent policy reforms, a consequent pickup ininvestment, and lower commodity prices.
2.8 Financing the Twelfth Plan
2.8.1 The Twelfth Plan had estimated the total resourcesavailable for financing the Plan at Rs.80.50 lakh crore(at current prices), from the Centre and States puttogether. This translated to a figure of 11.8 per cent ofexpected GDP over the five-year period. In the first threeyears of the Twelfth Plan, for the Centre and the Statescombined, it is estimated that the total available financialresources for the Twelfth Plan were Rs. 35.61 lakh crore(at current prices), amounting to 10.5 per cent of GDP.It is not feasible to expect that the entirety of the balance,about 56 per cent of the originally estimated total Planresources, would be available in the remaining two yearsof the Twelfth Plan.
2.8.2 The Twelfth Plan had visualized a 0.83 percentagepoint of GDP increase in Plan resources from the levelof 10.97 per cent in the Eleventh Plan realization to 11.80per cent in the Twelfth Plan projection. Of this, theCentre’s resources were expected to increase by 0.39percentage points of GDP while that of the States to goup by 0.44 percentage points.
2.8.3 It is, however, to be noted that the increase intotal Plan resources amounting to 0.83 percentage pointsof GDP (were to be more than financed out of a higherBalance from Current Revenues - BCR), was expectedto reach 1.88 percentage points of GDP in the TwelfthPlan compared to the Eleventh Plan realization (-0.61percentage to GDP). It needs to be noted that the EleventhPlan had a slightly positive BCR amounting to 0.41 percent of GDP. This was visualized to improve to 3.29per cent of GDP in the Twelfth Plan. Of the total of3.29 percentage points of GDP flowing out of BCR,1.88 percentage points was expected from the Centrewhile 1.41 percentage points from the States. In otherwords, the objective was not only to raise the rate ofeconomic growth in an inclusive fashion by increasingthe size of the Plan with respect to GDP, but also to do
so in a fashion that did not depend on the issuance ofmore government debt, and in fact was consistent witha reduction in the extent of deficit financing to fundexpenditure, including Plan expenditure.
2.8.4 However, slippages on the revenue account ofthe Centre began to surface from the very beginningyear of the Twelfth Plan, that is, 2012–13. Thus, asagainst the Twelfth Plan estimate of the Centre’s BCRat 1.88 per cent of GDP, the figures for 2012-13 to2015-16 RE are negative and ranges between (-) 0.04and (-) 0.35 per cent of GDP were undoubtedly muchlower than the target. However, it showed someimprovement at 0.33 percent in 2016-17 (BE).Improvement in the BCR would depend on higher growthmomentum in the Indian economy consistent withstability in the world economy. In case of the States, itis observed a reverse situation. As against an estimatedBCR of 1.4 per cent of GDP in the Twelfth Plan, theactual for 2012–13, 2013-14 and 2014-15 (BE) wereabove the target. Therefore, it is likely that the target forthe Twelfth Plan for States would be realized.
2.8.5 The resources of the Centre flowing from BCR,that is the primary source of non-debt funds available tothe government, has fallen so sharply, it follows that theability to persist with Plan expenditures has beenrestricted from the financing side. This is notwithstandingthe higher borrowings. The borrowings of Centre wereprojected at 3.35 per cent of GDP in the Twelfth Plan.However, Centre’s borrowings [including netMiscellaneous Capital Receipts (MCR)] increased overthe plan period above the projected, to average around3.84 percent of GDP (including 2016-17 BE).
2.8.6 While the pressure from a weaker BCR at theCentre has reduced the pool of resources for financingthe Twelfth Plan, Central Assistance to the States hasrisen by a greater amount than what was originallyprojected. During the Plan period, the amount of CentralPlan Assistance provided to the States and UnionTerritories (UTs) aggregated to 111 per cent of the Planprojections at current prices, as against the GrossBudgetary Support (GBS) available for the Central Plan,being only 52 per cent of the targeted amount. From2014-15, Central Assistance to State Plans also includesCentrally Sponsored Schemes (CSS). The re-structuring
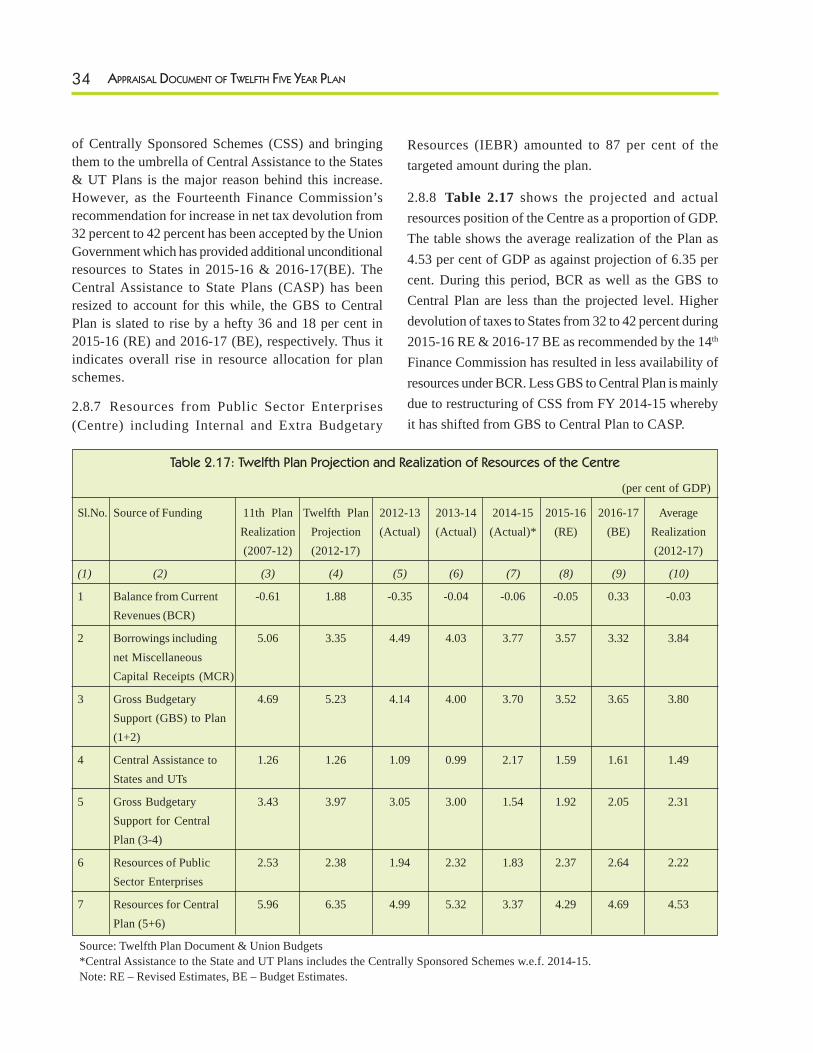
34 APPRAISAL DOCUMENT OF TWELFTH FIVE YEAR PLAN
of Centrally Sponsored Schemes (CSS) and bringingthem to the umbrella of Central Assistance to the States& UT Plans is the major reason behind this increase.However, as the Fourteenth Finance Commission’srecommendation for increase in net tax devolution from32 percent to 42 percent has been accepted by the UnionGovernment which has provided additional unconditionalresources to States in 2015-16 & 2016-17(BE). TheCentral Assistance to State Plans (CASP) has beenresized to account for this while, the GBS to CentralPlan is slated to rise by a hefty 36 and 18 per cent in2015-16 (RE) and 2016-17 (BE), respectively. Thus itindicates overall rise in resource allocation for planschemes.
2.8.7 Resources from Public Sector Enterprises(Centre) including Internal and Extra Budgetary
Resources (IEBR) amounted to 87 per cent of thetargeted amount during the plan.
2.8.8 Table 2.17 shows the projected and actualresources position of the Centre as a proportion of GDP.The table shows the average realization of the Plan as4.53 per cent of GDP as against projection of 6.35 percent. During this period, BCR as well as the GBS toCentral Plan are less than the projected level. Higherdevolution of taxes to States from 32 to 42 percent during2015-16 RE & 2016-17 BE as recommended by the 14th
Finance Commission has resulted in less availability ofresources under BCR. Less GBS to Central Plan is mainlydue to restructuring of CSS from FY 2014-15 wherebyit has shifted from GBS to Central Plan to CASP.
Table 2.17: Twelfth Plan Projection and Realization of Resources of the Centre
(per cent of GDP)
Sl.No. Source of Funding 11th Plan Twelfth Plan 2012-13 2013-14 2014-15 2015-16 2016-17 AverageRealization Projection (Actual) (Actual) (Actual)* (RE) (BE) Realization(2007-12) (2012-17) (2012-17)
(1) (2) (3) (4) (5) (6) (7) (8) (9) (10)
1 Balance from Current -0.61 1.88 -0.35 -0.04 -0.06 -0.05 0.33 -0.03Revenues (BCR)
2 Borrowings including 5.06 3.35 4.49 4.03 3.77 3.57 3.32 3.84net MiscellaneousCapital Receipts (MCR)
3 Gross Budgetary 4.69 5.23 4.14 4.00 3.70 3.52 3.65 3.80Support (GBS) to Plan(1+2)
4 Central Assistance to 1.26 1.26 1.09 0.99 2.17 1.59 1.61 1.49States and UTs
5 Gross Budgetary 3.43 3.97 3.05 3.00 1.54 1.92 2.05 2.31Support for CentralPlan (3-4)
6 Resources of Public 2.53 2.38 1.94 2.32 1.83 2.37 2.64 2.22Sector Enterprises
7 Resources for Central 5.96 6.35 4.99 5.32 3.37 4.29 4.69 4.53Plan (5+6)
Source: Twelfth Plan Document & Union Budgets*Central Assistance to the State and UT Plans includes the Centrally Sponsored Schemes w.e.f. 2014-15.Note: RE – Revised Estimates, BE – Budget Estimates.
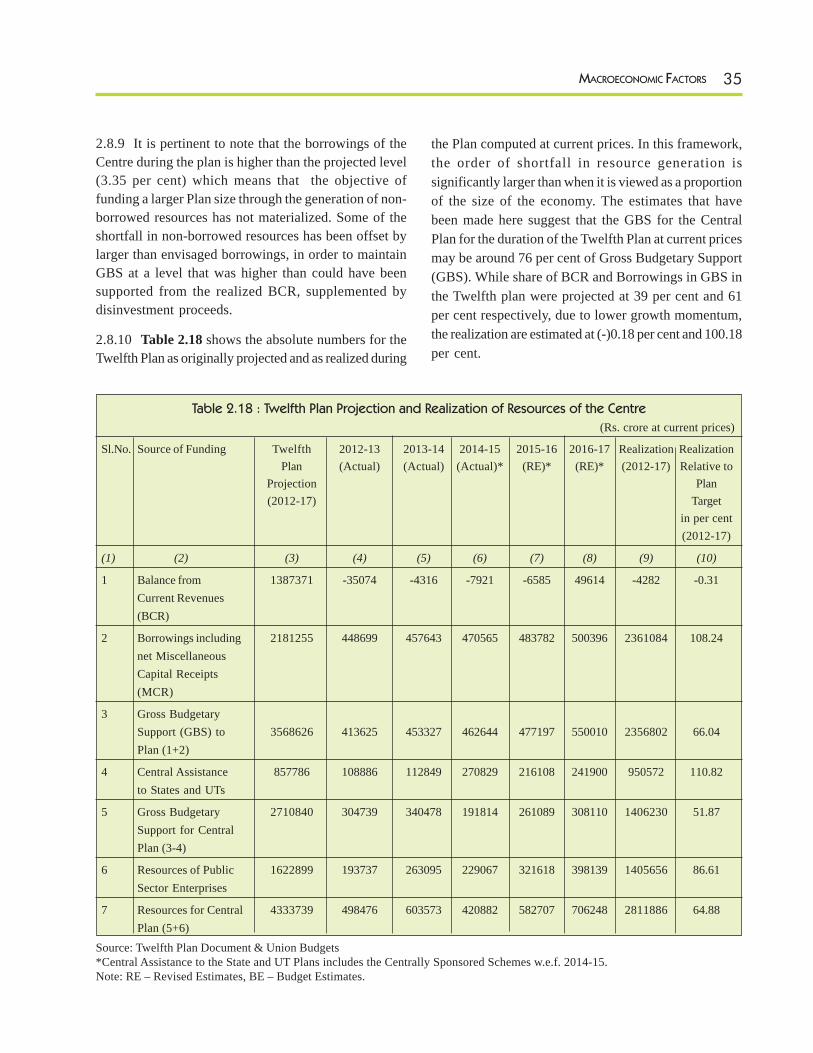
35MACROECONOMIC FACTORS
2.8.9 It is pertinent to note that the borrowings of theCentre during the plan is higher than the projected level(3.35 per cent) which means that the objective offunding a larger Plan size through the generation of non-borrowed resources has not materialized. Some of theshortfall in non-borrowed resources has been offset bylarger than envisaged borrowings, in order to maintainGBS at a level that was higher than could have beensupported from the realized BCR, supplemented bydisinvestment proceeds.
2.8.10 Table 2.18 shows the absolute numbers for theTwelfth Plan as originally projected and as realized during
the Plan computed at current prices. In this framework,the order of shortfall in resource generation issignificantly larger than when it is viewed as a proportionof the size of the economy. The estimates that havebeen made here suggest that the GBS for the CentralPlan for the duration of the Twelfth Plan at current pricesmay be around 76 per cent of Gross Budgetary Support(GBS). While share of BCR and Borrowings in GBS inthe Twelfth plan were projected at 39 per cent and 61per cent respectively, due to lower growth momentum,the realization are estimated at (-)0.18 per cent and 100.18per cent.
Table 2.18 : Twelfth Plan Projection and Realization of Resources of the Centre
(Rs. crore at current prices)
Sl.No. Source of Funding Twelfth 2012-13 2013-14 2014-15 2015-16 2016-17 Realization RealizationPlan (Actual) (Actual) (Actual)* (RE)* (RE)* (2012-17) Relative to
Projection Plan(2012-17) Target
in per cent(2012-17)
(1) (2) (3) (4) (5) (6) (7) (8) (9) (10)
1 Balance from 1387371 -35074 -4316 -7921 -6585 49614 -4282 -0.31Current Revenues(BCR)
2 Borrowings including 2181255 448699 457643 470565 483782 500396 2361084 108.24net MiscellaneousCapital Receipts(MCR)
3 Gross BudgetarySupport (GBS) to 3568626 413625 453327 462644 477197 550010 2356802 66.04Plan (1+2)
4 Central Assistance 857786 108886 112849 270829 216108 241900 950572 110.82to States and UTs
5 Gross Budgetary 2710840 304739 340478 191814 261089 308110 1406230 51.87Support for CentralPlan (3-4)
6 Resources of Public 1622899 193737 263095 229067 321618 398139 1405656 86.61Sector Enterprises
7 Resources for Central 4333739 498476 603573 420882 582707 706248 2811886 64.88Plan (5+6)
Source: Twelfth Plan Document & Union Budgets*Central Assistance to the State and UT Plans includes the Centrally Sponsored Schemes w.e.f. 2014-15.Note: RE – Revised Estimates, BE – Budget Estimates.
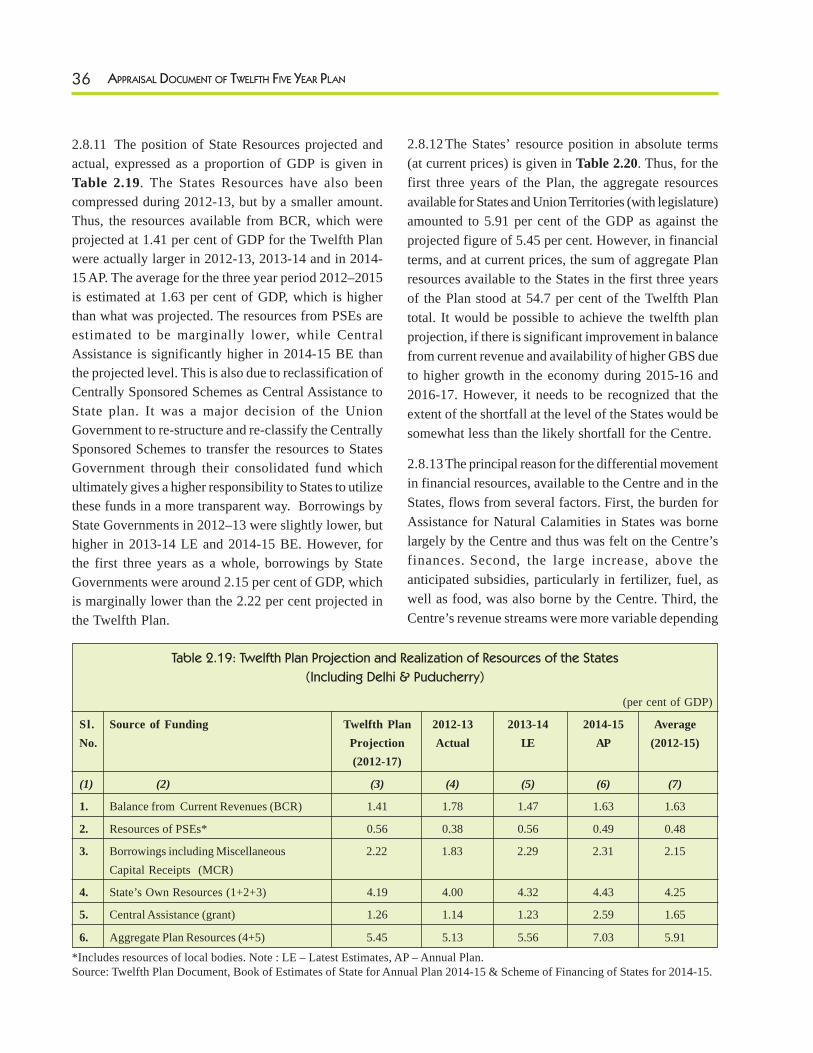
36 APPRAISAL DOCUMENT OF TWELFTH FIVE YEAR PLAN
2.8.11 The position of State Resources projected andactual, expressed as a proportion of GDP is given inTable 2.19. The States Resources have also beencompressed during 2012-13, but by a smaller amount.Thus, the resources available from BCR, which wereprojected at 1.41 per cent of GDP for the Twelfth Planwere actually larger in 2012-13, 2013-14 and in 2014-15 AP. The average for the three year period 2012–2015is estimated at 1.63 per cent of GDP, which is higherthan what was projected. The resources from PSEs areestimated to be marginally lower, while CentralAssistance is significantly higher in 2014-15 BE thanthe projected level. This is also due to reclassification ofCentrally Sponsored Schemes as Central Assistance toState plan. It was a major decision of the UnionGovernment to re-structure and re-classify the CentrallySponsored Schemes to transfer the resources to StatesGovernment through their consolidated fund whichultimately gives a higher responsibility to States to utilizethese funds in a more transparent way. Borrowings byState Governments in 2012–13 were slightly lower, buthigher in 2013-14 LE and 2014-15 BE. However, forthe first three years as a whole, borrowings by StateGovernments were around 2.15 per cent of GDP, whichis marginally lower than the 2.22 per cent projected inthe Twelfth Plan.
2.8.12 The States’ resource position in absolute terms(at current prices) is given in Table 2.20. Thus, for thefirst three years of the Plan, the aggregate resourcesavailable for States and Union Territories (with legislature)amounted to 5.91 per cent of the GDP as against theprojected figure of 5.45 per cent. However, in financialterms, and at current prices, the sum of aggregate Planresources available to the States in the first three yearsof the Plan stood at 54.7 per cent of the Twelfth Plantotal. It would be possible to achieve the twelfth planprojection, if there is significant improvement in balancefrom current revenue and availability of higher GBS dueto higher growth in the economy during 2015-16 and2016-17. However, it needs to be recognized that theextent of the shortfall at the level of the States would besomewhat less than the likely shortfall for the Centre.
2.8.13 The principal reason for the differential movementin financial resources, available to the Centre and in theStates, flows from several factors. First, the burden forAssistance for Natural Calamities in States was bornelargely by the Centre and thus was felt on the Centre’sfinances. Second, the large increase, above theanticipated subsidies, particularly in fertilizer, fuel, aswell as food, was also borne by the Centre. Third, theCentre’s revenue streams were more variable depending
Table 2.19: Twelfth Plan Projection and Realization of Resources of the States
(Including Delhi & Puducherry)
(per cent of GDP)
Sl. Source of Funding Twelfth Plan 2012-13 2013-14 2014-15 AverageNo. Projection Actual LE AP (2012-15)
(2012-17)
(1) (2) (3) (4) (5) (6) (7)
1. Balance from Current Revenues (BCR) 1.41 1.78 1.47 1.63 1.63
2. Resources of PSEs* 0.56 0.38 0.56 0.49 0.48
3. Borrowings including Miscellaneous 2.22 1.83 2.29 2.31 2.15Capital Receipts (MCR)
4. State’s Own Resources (1+2+3) 4.19 4.00 4.32 4.43 4.25
5. Central Assistance (grant) 1.26 1.14 1.23 2.59 1.65
6. Aggregate Plan Resources (4+5) 5.45 5.13 5.56 7.03 5.91
*Includes resources of local bodies. Note : LE – Latest Estimates, AP – Annual Plan.Source: Twelfth Plan Document, Book of Estimates of State for Annual Plan 2014-15 & Scheme of Financing of States for 2014-15.
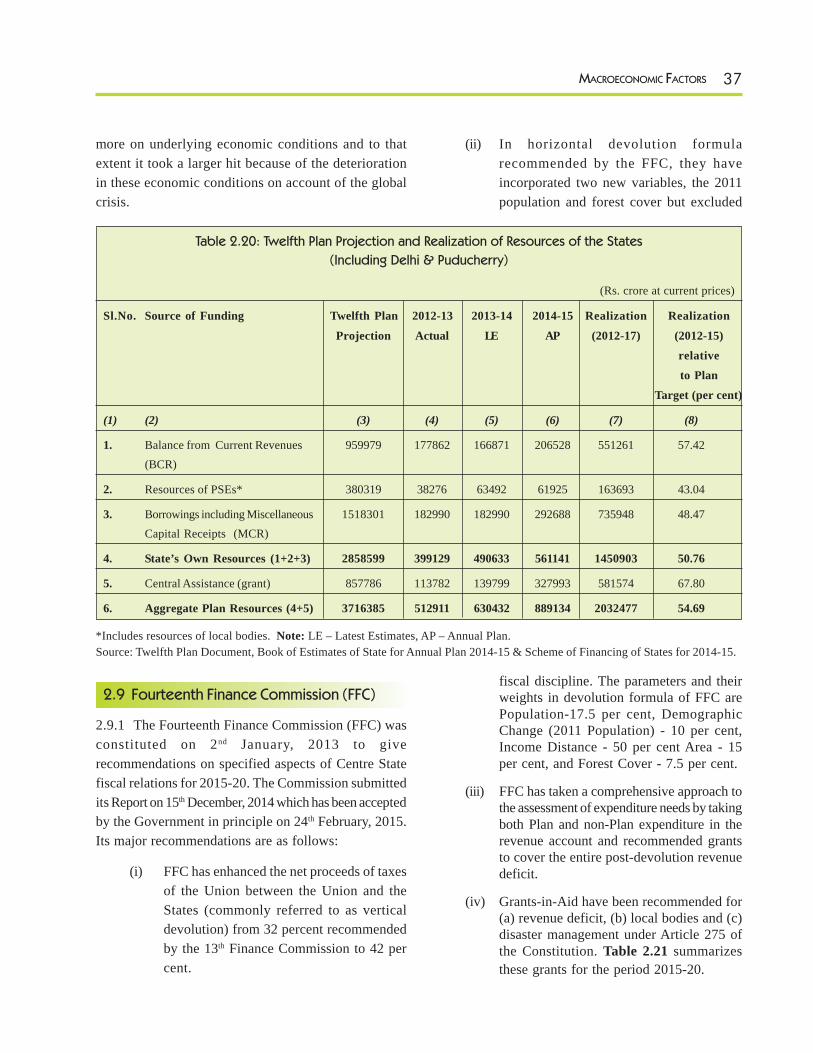
37MACROECONOMIC FACTORS
more on underlying economic conditions and to thatextent it took a larger hit because of the deteriorationin these economic conditions on account of the globalcrisis.
2.9 Fourteenth Finance Commission (FFC)
2.9.1 The Fourteenth Finance Commission (FFC) wasconstituted on 2nd January, 2013 to giverecommendations on specified aspects of Centre Statefiscal relations for 2015-20. The Commission submittedits Report on 15th December, 2014 which has been acceptedby the Government in principle on 24th February, 2015.Its major recommendations are as follows:
(i) FFC has enhanced the net proceeds of taxesof the Union between the Union and theStates (commonly referred to as verticaldevolution) from 32 percent recommendedby the 13th Finance Commission to 42 percent.
(ii) In horizontal devolution formularecommended by the FFC, they haveincorporated two new variables, the 2011population and forest cover but excluded
fiscal discipline. The parameters and theirweights in devolution formula of FFC arePopulation-17.5 per cent, DemographicChange (2011 Population) - 10 per cent,Income Distance - 50 per cent Area - 15per cent, and Forest Cover - 7.5 per cent.
(iii) FFC has taken a comprehensive approach tothe assessment of expenditure needs by takingboth Plan and non-Plan expenditure in therevenue account and recommended grantsto cover the entire post-devolution revenuedeficit.
(iv) Grants-in-Aid have been recommended for(a) revenue deficit, (b) local bodies and (c)disaster management under Article 275 ofthe Constitution. Table 2.21 summarizesthese grants for the period 2015-20.
Table 2.20: Twelfth Plan Projection and Realization of Resources of the States
(Including Delhi & Puducherry)
(Rs. crore at current prices)
Sl.No. Source of Funding Twelfth Plan 2012-13 2013-14 2014-15 Realization Realization
Projection Actual LE AP (2012-17) (2012-15)relativeto Plan
Target (per cent)
(1) (2) (3) (4) (5) (6) (7) (8)
1. Balance from Current Revenues 959979 177862 166871 206528 551261 57.42(BCR)
2. Resources of PSEs* 380319 38276 63492 61925 163693 43.04
3. Borrowings including Miscellaneous 1518301 182990 182990 292688 735948 48.47Capital Receipts (MCR)
4. State’s Own Resources (1+2+3) 2858599 399129 490633 561141 1450903 50.76
5. Central Assistance (grant) 857786 113782 139799 327993 581574 67.80
6. Aggregate Plan Resources (4+5) 3716385 512911 630432 889134 2032477 54.69
*Includes resources of local bodies. Note: LE – Latest Estimates, AP – Annual Plan.Source: Twelfth Plan Document, Book of Estimates of State for Annual Plan 2014-15 & Scheme of Financing of States for 2014-15.
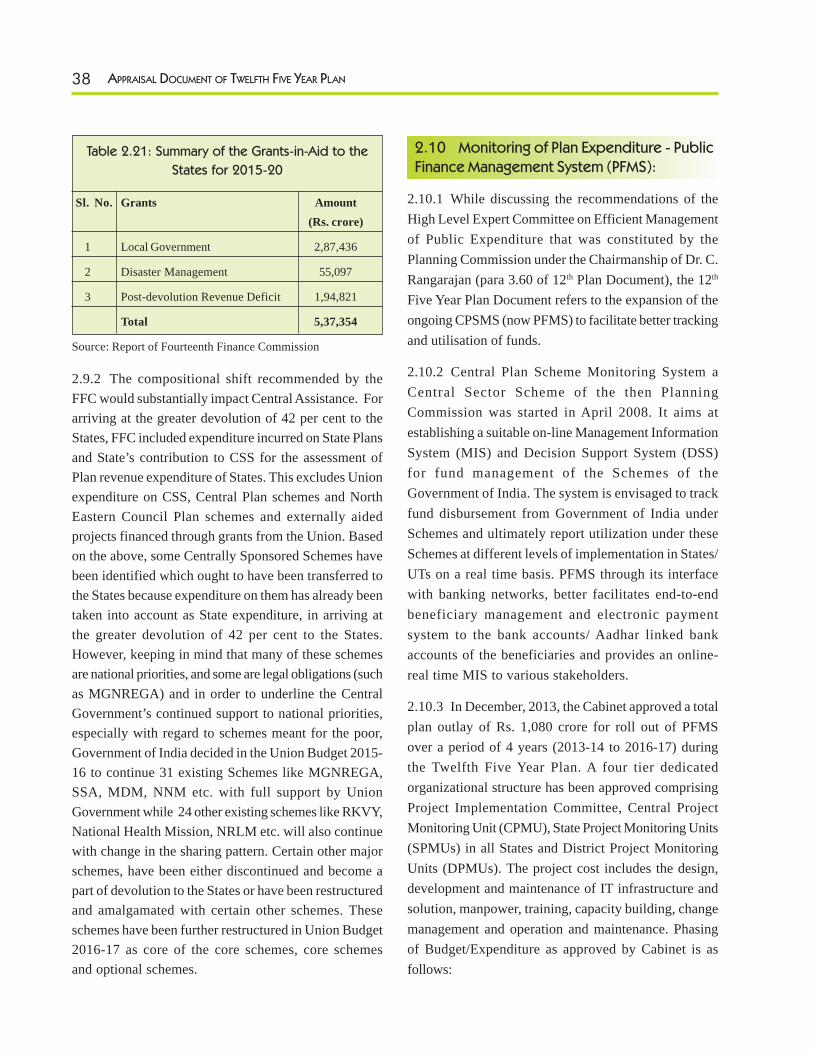
38 APPRAISAL DOCUMENT OF TWELFTH FIVE YEAR PLAN
Table 2.21: Summary of the Grants-in-Aid to the
States for 2015-20
Sl. No. Grants Amount(Rs. crore)
1 Local Government 2,87,436
2 Disaster Management 55,097
3 Post-devolution Revenue Deficit 1,94,821
Total 5,37,354
Source: Report of Fourteenth Finance Commission
2.9.2 The compositional shift recommended by theFFC would substantially impact Central Assistance. Forarriving at the greater devolution of 42 per cent to theStates, FFC included expenditure incurred on State Plansand State’s contribution to CSS for the assessment ofPlan revenue expenditure of States. This excludes Unionexpenditure on CSS, Central Plan schemes and NorthEastern Council Plan schemes and externally aidedprojects financed through grants from the Union. Basedon the above, some Centrally Sponsored Schemes havebeen identified which ought to have been transferred tothe States because expenditure on them has already beentaken into account as State expenditure, in arriving atthe greater devolution of 42 per cent to the States.However, keeping in mind that many of these schemesare national priorities, and some are legal obligations (suchas MGNREGA) and in order to underline the CentralGovernment’s continued support to national priorities,especially with regard to schemes meant for the poor,Government of India decided in the Union Budget 2015-16 to continue 31 existing Schemes like MGNREGA,SSA, MDM, NNM etc. with full support by UnionGovernment while 24 other existing schemes like RKVY,National Health Mission, NRLM etc. will also continuewith change in the sharing pattern. Certain other majorschemes, have been either discontinued and become apart of devolution to the States or have been restructuredand amalgamated with certain other schemes. Theseschemes have been further restructured in Union Budget2016-17 as core of the core schemes, core schemesand optional schemes.
2.10 Monitoring of Plan Expenditure - PublicFinance Management System (PFMS):
2.10.1 While discussing the recommendations of theHigh Level Expert Committee on Efficient Managementof Public Expenditure that was constituted by thePlanning Commission under the Chairmanship of Dr. C.Rangarajan (para 3.60 of 12th Plan Document), the 12th
Five Year Plan Document refers to the expansion of theongoing CPSMS (now PFMS) to facilitate better trackingand utilisation of funds.
2.10.2 Central Plan Scheme Monitoring System aCentral Sector Scheme of the then PlanningCommission was started in April 2008. It aims atestablishing a suitable on-line Management InformationSystem (MIS) and Decision Support System (DSS)for fund management of the Schemes of theGovernment of India. The system is envisaged to trackfund disbursement from Government of India underSchemes and ultimately report utilization under theseSchemes at different levels of implementation in States/UTs on a real time basis. PFMS through its interfacewith banking networks, better facilitates end-to-endbeneficiary management and electronic paymentsystem to the bank accounts/ Aadhar linked bankaccounts of the beneficiaries and provides an online-real time MIS to various stakeholders.
2.10.3 In December, 2013, the Cabinet approved a totalplan outlay of Rs. 1,080 crore for roll out of PFMSover a period of 4 years (2013-14 to 2016-17) duringthe Twelfth Five Year Plan. A four tier dedicatedorganizational structure has been approved comprisingProject Implementation Committee, Central ProjectMonitoring Unit (CPMU), State Project Monitoring Units(SPMUs) in all States and District Project MonitoringUnits (DPMUs). The project cost includes the design,development and maintenance of IT infrastructure andsolution, manpower, training, capacity building, changemanagement and operation and maintenance. Phasingof Budget/Expenditure as approved by Cabinet is asfollows:
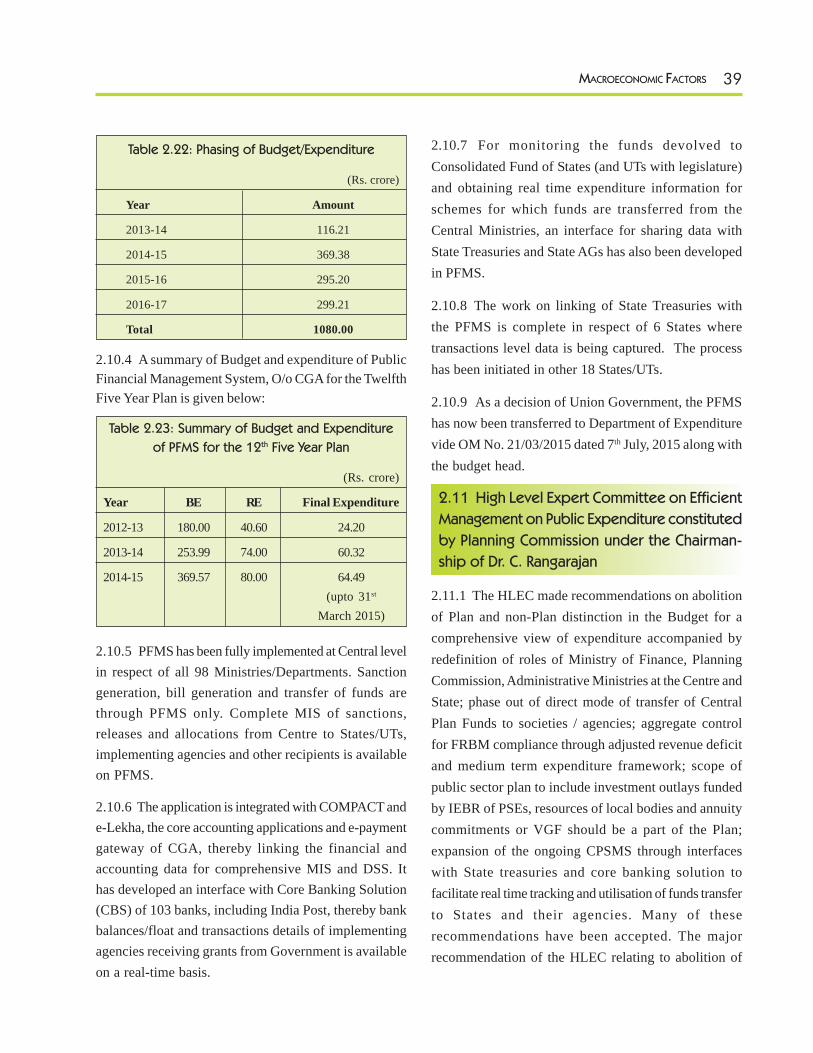
39MACROECONOMIC FACTORS
Table 2.22: Phasing of Budget/Expenditure
(Rs. crore)
Year Amount
2013-14 116.21
2014-15 369.38
2015-16 295.20
2016-17 299.21
Total 1080.00
2.10.4 A summary of Budget and expenditure of PublicFinancial Management System, O/o CGA for the TwelfthFive Year Plan is given below:
Table 2.23: Summary of Budget and Expenditure
of PFMS for the 12th Five Year Plan
(Rs. crore)
Year BE RE Final Expenditure
2012-13 180.00 40.60 24.20
2013-14 253.99 74.00 60.32
2014-15 369.57 80.00 64.49(upto 31st
March 2015)
2.10.5 PFMS has been fully implemented at Central levelin respect of all 98 Ministries/Departments. Sanctiongeneration, bill generation and transfer of funds arethrough PFMS only. Complete MIS of sanctions,releases and allocations from Centre to States/UTs,implementing agencies and other recipients is availableon PFMS.
2.10.6 The application is integrated with COMPACT ande-Lekha, the core accounting applications and e-paymentgateway of CGA, thereby linking the financial andaccounting data for comprehensive MIS and DSS. Ithas developed an interface with Core Banking Solution(CBS) of 103 banks, including India Post, thereby bankbalances/float and transactions details of implementingagencies receiving grants from Government is availableon a real-time basis.
2.10.7 For monitoring the funds devolved toConsolidated Fund of States (and UTs with legislature)and obtaining real time expenditure information forschemes for which funds are transferred from theCentral Ministries, an interface for sharing data withState Treasuries and State AGs has also been developedin PFMS.
2.10.8 The work on linking of State Treasuries withthe PFMS is complete in respect of 6 States wheretransactions level data is being captured. The processhas been initiated in other 18 States/UTs.
2.10.9 As a decision of Union Government, the PFMShas now been transferred to Department of Expenditurevide OM No. 21/03/2015 dated 7th July, 2015 along withthe budget head.
2.11 High Level Expert Committee on Efficient
Management on Public Expenditure constituted
by Planning Commission under the Chairman-
ship of Dr. C. Rangarajan
2.11.1 The HLEC made recommendations on abolitionof Plan and non-Plan distinction in the Budget for acomprehensive view of expenditure accompanied byredefinition of roles of Ministry of Finance, PlanningCommission, Administrative Ministries at the Centre andState; phase out of direct mode of transfer of CentralPlan Funds to societies / agencies; aggregate controlfor FRBM compliance through adjusted revenue deficitand medium term expenditure framework; scope ofpublic sector plan to include investment outlays fundedby IEBR of PSEs, resources of local bodies and annuitycommitments or VGF should be a part of the Plan;expansion of the ongoing CPSMS through interfaceswith State treasuries and core banking solution tofacilitate real time tracking and utilisation of funds transferto States and their agencies. Many of theserecommendations have been accepted. The majorrecommendation of the HLEC relating to abolition of
40 APPRAISAL DOCUMENT OF TWELFTH FIVE YEAR PLAN
plan and non-plan distinction has drawn a lot of attentionfrom the 14th FC, Administrative Reforms Commission,Expenditure Management Commission and due topending Parliament Assurances.
2.11.2 In the meeting of the Internal PlanningCommission (IPC), held on March 6, 2014 there wasnear consensus that present distinction between Planand non-plan expenditure is leading to distortions. Asuggestion also emerged that a more useful distinctionshould have been between developmental and otherexpenditure. In the present system, essentialexpenditures like operation and maintenance andcommitted liabilities are not adequately provided for. Itwas observed that in all such cases where O&Mexpenditures are not financed by ‘user charges’,budgetary provision would be required, otherwise capitalasset created through Plan expenditure are not optimallyutilized. However, once this distinction is abolished, newinstitutional arrangement would be required for makingallocation as so far Plan expenditure was allocated bythe Planning Commission and non-plan expenditure wasprovided by the Ministry of Finance.
2.11.3 Meanwhile, as in the Budget Speech 2016-17BE, Government has decided that the Plan-Non-Planclassification will be done away with from fiscal 2017-18. The Finance Ministry will closely work with theState Finance Departments to align Central and StateBudgets in this matter.
2.12 Union Budget 2016-17
2.12.1 In view of higher devolution by FourteenthFinance Commission and enlarged fiscal space availableto the States, the Block Grants and schemes per sewhich were earlier allocated by erstwhile PlanningCommission to the States/UTs have been discontinuedfrom such direct support w.e.f. FY 2015-16 . Theseschemes are -
1. Backward Regions Grants Fund (StateComponent)
2. Normal Central Assistance
3. Additional Central Assistance for OtherProjects (OTACA)
4. Special Central Assistance
5. Special Central Assistance Hill Areas/Western Ghats
6. Special Plan Assistance
7. ACA for Left Wing Extremist (LWE)
2.12.2 As recommended by the sub-group onrationalization of CSS, the classification of schemesdefined as core of the core, core schemes and optionalschemes has been done in the Union Budget 2016-17.Regarding funding pattern - the existing fundingpattern of schemes defined as ‘core of the core’ ( 6nos.) have been retained, the ‘core schemes’ (20 nos.)will be shared 60:40 between Centre and the States(90:10 for the 8 North Eastern States and 3 HimalayanStates) and the ‘optional schemes’ (2 nos.) will beoptional for the State Government and their fundsharing pattern will be 50:50 between the Centre andthe States (80:20 for the 8 North Eastern States and3 Himalayan States).
2.12.3 Thus schemes under CSS have been restructuredto 28 major schemes in Union Budget 2016-17 against66 in 2014-15.
2.12.4 A Table showing the composition of Plan andNon Plan Expenditure during the plan period is shownin the Table 2.24. The expenditure on GBS for CentralPlan is estimated to increase by 18 per cent in 2016-17BE over 2015-16 RE and CASP to increase by 12 percent, the net effect on Plan expenditure is thereby aprojected increase of 15.3 per cent. However, thereduction of CASP has already been counterbalancedby increasing the tax devolution to States from 32 percent to 42 per cent.
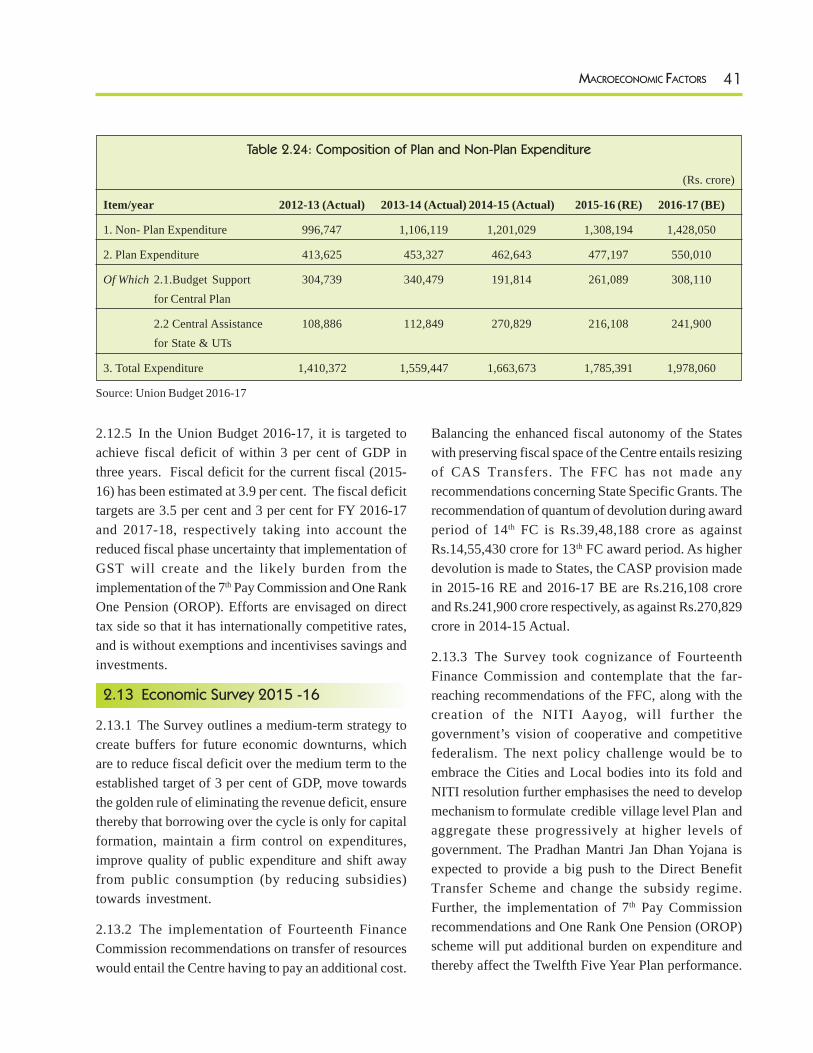
41MACROECONOMIC FACTORS
2.12.5 In the Union Budget 2016-17, it is targeted toachieve fiscal deficit of within 3 per cent of GDP inthree years. Fiscal deficit for the current fiscal (2015-16) has been estimated at 3.9 per cent. The fiscal deficittargets are 3.5 per cent and 3 per cent for FY 2016-17and 2017-18, respectively taking into account thereduced fiscal phase uncertainty that implementation ofGST will create and the likely burden from theimplementation of the 7th Pay Commission and One RankOne Pension (OROP). Efforts are envisaged on directtax side so that it has internationally competitive rates,and is without exemptions and incentivises savings andinvestments.
2.13 Economic Survey 2015 -16
2.13.1 The Survey outlines a medium-term strategy tocreate buffers for future economic downturns, whichare to reduce fiscal deficit over the medium term to theestablished target of 3 per cent of GDP, move towardsthe golden rule of eliminating the revenue deficit, ensurethereby that borrowing over the cycle is only for capitalformation, maintain a firm control on expenditures,improve quality of public expenditure and shift awayfrom public consumption (by reducing subsidies)towards investment.
2.13.2 The implementation of Fourteenth FinanceCommission recommendations on transfer of resourceswould entail the Centre having to pay an additional cost.
Balancing the enhanced fiscal autonomy of the Stateswith preserving fiscal space of the Centre entails resizingof CAS Transfers. The FFC has not made anyrecommendations concerning State Specific Grants. Therecommendation of quantum of devolution during awardperiod of 14th FC is Rs.39,48,188 crore as againstRs.14,55,430 crore for 13th FC award period. As higherdevolution is made to States, the CASP provision madein 2015-16 RE and 2016-17 BE are Rs.216,108 croreand Rs.241,900 crore respectively, as against Rs.270,829crore in 2014-15 Actual.
2.13.3 The Survey took cognizance of FourteenthFinance Commission and contemplate that the far-reaching recommendations of the FFC, along with thecreation of the NITI Aayog, will further thegovernment’s vision of cooperative and competitivefederalism. The next policy challenge would be toembrace the Cities and Local bodies into its fold andNITI resolution further emphasises the need to developmechanism to formulate credible village level Plan andaggregate these progressively at higher levels ofgovernment. The Pradhan Mantri Jan Dhan Yojana isexpected to provide a big push to the Direct BenefitTransfer Scheme and change the subsidy regime.Further, the implementation of 7th Pay Commissionrecommendations and One Rank One Pension (OROP)scheme will put additional burden on expenditure andthereby affect the Twelfth Five Year Plan performance.
Table 2.24: Composition of Plan and Non-Plan Expenditure
(Rs. crore)
Item/year 2012-13 (Actual) 2013-14 (Actual) 2014-15 (Actual) 2015-16 (RE) 2016-17 (BE)
1. Non- Plan Expenditure 996,747 1,106,119 1,201,029 1,308,194 1,428,050
2. Plan Expenditure 413,625 453,327 462,643 477,197 550,010
Of Which 2.1.Budget Support 304,739 340,479 191,814 261,089 308,110for Central Plan
2.2 Central Assistance 108,886 112,849 270,829 216,108 241,900for State & UTs
3. Total Expenditure 1,410,372 1,559,447 1,663,673 1,785,391 1,978,060
Source: Union Budget 2016-17
42 APPRAISAL DOCUMENT OF TWELFTH FIVE YEAR PLAN
2.14 The way forward
2.14.1 While the achievements of the Eleventh Planindicate the strengths of India’s economy, attaining theaverage annual growth target of 8.0 per cent envisagedin the Twelfth Plan does seem challenging – especiallyin the context of the continuing effects of the twin globalcrises. The expected annual average growth rate of GDPto be realized during the first four years of the TwelfthPlan is estimated to be 6.8 per cent; hence, the economywould have to grow in double digits during the remainingone year of the Plan period in order to achieve the targetedgrowth rate of 8 per cent. National and internationalagencies have projected that India is in fact likely togrow in the range of 7.0 to 8.0 per cent in the years2015-16 and 2016-17. Therefore the likely achievementof GDP growth during the Twelfth Five Year Plan periodwould be around 7 per cent. In order to lead the economyto a higher growth trajectory, the focus should essentiallybe on maintaining macro-economic stability, whileimplementing the measures aimed at removing structuralconstraints and reviving stalled and stuck projects sothat production and investment activity gathermomentum.
2.14.2 A high-growth, high-investment strategy requiresfinancing the current account deficit (CAD) mainlythrough Foreign Institutional Investment (FII) andForeign Direct Investment (FDI) flows, so that relianceon external debt is limited. Though the CAD is expectedto be within safe parameters and inflation is moderating,interest rates are still high enough to crowd out privateinvestment. Further, as the economy returns to a highergrowth path, the industrial sector is expected to resumea higher level of imports. Therefore, pressure on theCAD is likely to be felt again – and so exports andremittances will also have to grow to keep the CADwithin reasonable levels. The fiscal deficit must also bebrought down over the medium term to release domesticresources for productive deployment in the economy.Therefore, a balanced growth path, which places equalemphasis on strengthening the various determinants ofgrowth such as physical capital, human capital andproductivity, is sensible and sustainable, and needed for
the economy to achieve its true growth potential. Forthis, intense, dedicated efforts in terms of appropriatepolicy interventions in a time-bound manner will berequired; and these policy interventions must be focusedon the key drivers of growth: boosting investment, skillformation and creating the appropriate externalenvironment.
2.14.3 It is important to mention that businesssentiments play a vital role in determining investments,particularly in the current economic scenario. Thereforeprime importance should be given to boosting sentimentspositively so as to reap the benefits of high foreigninvestment of a long-term and stable nature. India wasranked low in terms of the ‘Ease of Doing Business’(rank 134, 2015) and its component the ‘Ease of Startinga Business’ (rank 164, 2015) in the World Bank’s DoingBusiness Report which provides a measure of businessregulations and their enforcement across 189 economies.The Government of India initiated a number of measuresto improve Ease of Doing Business giving emphasis onsimplification and rationalization of the existing rules andintroduction of information technology for good andeffective governance. The major steps include: limitingthe number of documents required for export and importto three; making online the process of applying forIndustrial License (IL) and Industrial EntrepreneurMemorandum (IEM); removal of requirements ofminimum paid-up capital for companies; increasing theinitial validity period of IL from two years to three yearsetc. Accordingly, India’s Doing Business rank improvedto 130 and Starting Business rank to 155 in 2016 (therankings are benchmarked to June 2015). Theimprovement in rankings is due to significantimprovements in parameters like ease of starting a newbusiness and getting electricity. Still the ease of doingbusiness in India is far from the desired level as statedin the World Bank Report that India continues to havelow rank of 183 when it comes to dealing withconstruction permits and enforcing contracts (Rank178). In comparison to the relatively complex andcumbersome regulatory process in India, the Accountingand Corporate Regulatory Authority (ACRA) in Singapore(which ranks number 1 in Ease of Doing Business) keeps
43MACROECONOMIC FACTORS
regulatory procedures simple. ACRA uses innovativemethods like providing a single “unique entity number”and delivers services through mobile phones. Suchinnovations need to be introduced in India. The prudentuse of technology is essential to make the process ofstarting a business simpler, faster, more transparent andcorruption-free.
2.14.4 Yet another important area for immediate actionis to speed up the implementation of infrastructureprojects. This is critical for removing the supplybottlenecks that constrain growth in most sectors, andalso for boosting investor sentiments. The InvestmentTracking System, monitoring of large PSU investments,and the speeding up of security and other clearancesare all part of the de-bottlenecking effort. Many problemsrequire the Centre to work in closer co-operation withState Governments.
2.14.5 Apart from the fundamental economic factors,social and political factors need to be taken into account,as they strongly affect the economy through theconfidence and sentiments of citizens and investors. Infact, insufficient action along these lines so far, whilethe global environment soured, has affected India’sgrowth more than it should have. Hence, reforms ofgovernment and policymaking institutions requireimmediate action. The need of the hour is to ensurecomplete transparency in the functioning of thegovernment and its policies. Laws, rules and regulationsshould be unequivocal, thereby leaving no scope fordiscretion and should also be written in simple language,with single-window provisioning. Then, these can beeasily understood and complied with by all concerned,thereby avoiding red-tapism and delays in grantingapprovals.
2.14.6 Issues such as corruption, lack of transparency,delays in clearing projects, ill-routed subsidies and soon had rendered governance less effective and washindering growth. Poor institutions, uncertainty ofcontracts, a poor law-and-order situation and highcorruption not only increase investment costs, but alsomake FDI with its high sunk costs unattractive. Hencethere arises an urgent need for institutional reform to
enhance the Indian system’s ability to implementprogrammes and projects more rapidly and effectively;to augment citizens’ confidence in the delivery capabilityof institutions; and to make policymaking processes moretransparent and more inclusive. For this an empoweredcoordination process, with the ability to discipline actorswithin the government and private sector to ensure timelydelivery, is essential.
2.14.7 Inflation management is a crucial area, andgreater focus should be placed on management of pricelevels. If the objective is to have a higher investmentrate supported by high levels of domestic savings, thevery first target should be to manage the inflation rate ata level which provides enough headroom for RBI to cutrates. Further, management of inflation is also importantfor the external sector. A high inflation differential vis-à-vis other countries eventually weakens the currency,thereby adversely affecting the confidence of investors.A paradigm shift towards fiscal consolidation isimperative for taming inflation as well as providing animpetus to growth.
2.14.8 The Goods and Service Tax (GST) ConstitutionalAmendment Bill was introduced in Parliament in 2015.The proposed GST is a single national uniform tax to belevied across India on all goods and services byintegrating various Central and state taxes. The GST,being a destination-based consumption tax centered onvalue-added tax principles, would greatly help inremoving economic distortions caused by the presentcomplex tax structure, and would also aid thedevelopment of a common national market. The GST islikely to improve tax collections and boost India’seconomic development by breaking tax barriers betweenstates. Implementation of the GST will make the taxationsystem transparent and predictable, which will not onlyboost investor confidence but also invite new tradeprospects nationally and internationally as exports willbe zero-rated and imports will face the same taxes asdomestic goods and services adhering to the destinationprinciple. It is also expected that, under the GST system,prices may fall in the long term as dealers might pass onthe benefits of the reduced tax to consumers.
44 APPRAISAL DOCUMENT OF TWELFTH FIVE YEAR PLAN
2.14.9 Competitiveness and business confidence havealso improved distinctly in the country owing to theperception of political stability at the Centre. It is expectedthat the government’s initiatives aimed at investmentrevival, strengthening macro-economic stability andboosting infrastructure will return India to a high-growthtrajectory.
2.14.10 Indications of positive change are beginning tobe visible. The growth rate of gross value added (GVA)at basic prices was estimated at 7.2 per cent, 7.5 percent and 7.1 per cent during the first, second, and thirdquarter of 2015-16 as against 7.4 per cent, 8.1 per centand 6.7 per cent in the corresponding quarters of theprevious year i.e. 2014-15 (according to the press releaseof the Central Statistics Office dated 8th February, 2016).Various steps towards fiscal consolidation have shownpositive results. Inflation has moderated since June 2014and is expected to be contained around 5 per cent througha judicious mix of policy measures. This may give someheadroom to the RBI to cut interest rates, which wouldsignificantly help the growth recovery. Containing theCentre’s fiscal deficit at 3.5 per cent of gross domesticproduct (GDP) for the current financial year, 2016-17,seems difficult but achievable. According to theEconomic Survey 2015-16, the rate of growth of theeconomy can be expected to be in the range of 7.0 to7.75 per cent during the year 2016-17.
2.14.11 Although the domestic factors influencingIndia’s return to a high-growth trajectory seem now tobe under control, international factors are still uncertain.While the global recovery continues at a moderate rate,the outlook is uneven across regions. The global outlookhas been exacerbated by declining commodity pricesespecially reduction in crude oil prices, uncertain financialmarkets and volatile exchange rates, signalling extremerisk-aversion of global investors and adversely affectingcommodities exporting economies. Despite theseuncertainties, India’s growth recovered largely onaccount of domestic absorption, and has exhibited asteady and sound economic growth during 2014-15 and2015-16. Moreover, India’s macroeconomic indicatorslike inflation, fiscal deficit and current account balance
have registered significant improvement over the years.With the government’s commitment towards continuingwith the pace of economic reforms and policy initiatives,strengthened by the fundamental macroeconomicstability, India has already begun its stride to a high-growth trajectory ensuring faster, more inclusive andsustainable growth.
2.15 Summary of Learnings
2.15.1 In order to lead the economy to a higher growthtrajectory, the focus should essentially be on maintainingmacro-economic stability. Low levels of savings andinvestment rates are still a cause of concern. Thus,intense and dedicated efforts in terms of appropriatepolicy interventions in a time-bound manner are requiredto boost savings and investment in the economy.
2.15.2 In order to achieve the true growth potential ofthe economy, a balanced growth path, which places equalemphasis on strengthening the various determinants ofgrowth such as physical capital, human capital,technology, institutions and productivity, is needed. Thepolicy interventions must be focused on the key driversof growth: boosting investment, skill formation andcreating the appropriate environment.
2.15.3 A stable and predictable tax regime is aprecondition for sustained high levels of Investment.Therefore, prime importance should be given to boostinginvestors’ sentiments positively so as to reap the benefitsof high foreign investment of a long-term and stablenature.
2.15.4 Another game changing reform in the field oftaxation is introduction of the Goods and Services Tax(GST). It will help in increased compliance, boost taxrevenues, reduce the tax outflow in the hands of theconsumers and make exports competitive. The taxstructure is expected to be much simpler and easier tounderstand. It is expected that the implementation ofGST will push up GDP by 1-2 per cent.
2.15.5 India has improved its ranking in the ‘Ease ofDoing Business Index’ by 12 ranks in the latest rankingcompiled by the World Bank. However, further
45MACROECONOMIC FACTORS
improvements are required through prudent use oftechnology, setting up milestones and time targets toimprove the ease of doing business in the country andhelp in economic revival. This will make the process ofstarting up a business simpler, faster and moretransparent.
2.15.6 Another important area of focus is unbundlingof stalled projects. The absence of long-term financinginstruments is a major impediment in developinginfrastructure projects in India, leading to stalling ofprojects and lack of enough developers. So, it isimperative to implement measures aimed at removingstructural constraints and reviving stalled and stuckprojects so that production and investment activity gathermomentum.
2.15.7 Apart from the fundamental economic factors,social and political factors need to be taken into account,as they strongly affect the economy through theconfidence and sentiments of citizens and investors. Theneed of the hour is to ensure complete transparency inthe functioning of the government and its policies. Laws,rules and regulations should be unequivocal, therebyleaving no scope for discretion. They should be written
in a simple language with single-window provisioning,thereby avoiding red-tapism and delays in grantingapprovals.
2.15.8 There arises an urgent need for institutionalreform to enhance the Indian system’s ability toimplement programmes and projects more rapidly andeffectively; to augment citizens’ confidence in thedelivery capability of institutions; and to makepolicymaking processes more transparent and moreinclusive.
2.15.9 Inflation management is another crucial area toaccelerate growth. A greater focus should be placed onmanagement of price levels. There should be effectivecoordination of monetary and fiscal policy if overalleconomic performance is to be optimized and maintainedin the long term.
2.15.10 Since, Indian economy is deeply integrated withthe world economy, it is essential to be wary of globaleconomic developments. In order to attain the sustainedhigh growth, we should take lessons and learnings fromglobal economy while simultaneously working on thedomestic factors affecting the growth.
46 APPRAISAL DOCUMENT OF TWELFTH FIVE YEAR PLAN
3Employment and Skill Development
3.1 Introduction
3.1.1 The Twelfth Five Year Plan’s objective of faster,more inclusive and sustainable growth hinges onenhancing the employability of India’s rapidly expandingpopulation in the working age group and ensuring theiraccess to decent employment opportunities. The TwelfthPlan envisages creation of 50 million work opportunitiesin the non-farm sector and skilling and certifying anequivalent number of persons1. The employment strategyoutlined to achieve the target was creation of an efficientand fair labour market by simplifying the regulatoryframework, focusing on labour intensive manufacturingand expanding employment in the organized sector. Skilldevelopment is also crucial for achieving the employmenttarget by ensuring participation of a skilled labour forcein the labour market.
3.1.2 The Twelfth Plan had identified the manufacturingsector as a genuine engine of economic growth whichcould generate 100 million work opportunities by 2022and the service sectors like information technology,finance and banking, tourism, trade and transport as themajor generators of employment2.
3.1.3 On the skill development front, the target is to fillin the existing gaps in terms of quantity, quality, outreach
and mobility. Its success lies in ensuring that apart fromthe labour force receiving adequate skill training, thereshould be linkages between skills imparted and therealities of the job market. This calls for systemic reformsto the national skill qualifications framework, the labourmarket information system and to the various assessmentand certifying bodies.
3.1.4 This chapter covers the progress made in jobcreation and related areas of labour reforms, socialsecurity and skill development during the course of theTwelfth Plan.
3.2 The Labour Market Scenario
3.2.1 The labour force and workforce, as a proportionof population, declined from 43 per cent in 2004-05 to39.5 per cent in 2011-12 and from 42 per cent to 38.6per cent respectively3. The unemployment rate witnesseda marginal decline from 2.3 per cent to 2.2 per centduring this period.
3.2.2 The decline in the labour force participation isaccounted for by the decline in the female labour forceparticipation rate. In absolute terms the number offemales in the labour force declined from 152.6 millionin 2004-05 to 132.4 million in 2011-12, while the numberof males in the labour force increased from 316.4 million
1 Twelfth Five Year Plan 2012-17, Vol. III, Chapter-22, Employment and Skill Development, pp 141.2 Ibid pp 138.3 Key Indicators of Employment and Unemployment in India, NSSO, 2011-12 and 2009-104 The activity status on which a person spent a relatively long time during the 365 days preceding the date of survey is considered his orher usual principal activity status. A person in the usual principal status may also have pursued another economic activity for 30 days ormore, which is referred to as the subsidiary economic activity. For more details refer Twelfth Five Year Plan 2012-17, Vol. III, Chapter 22,Employment and Skill Development, Page 127, Box 22.1.
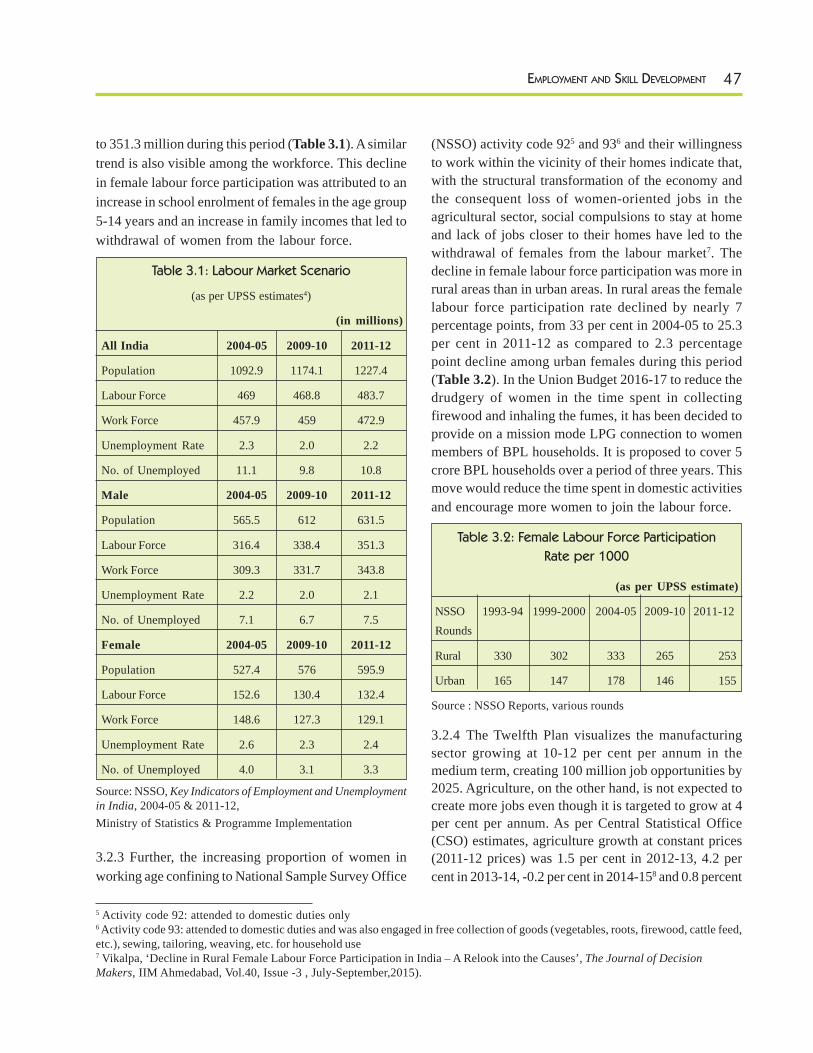
47EMPLOYMENT AND SKILL DEVELOPMENT
to 351.3 million during this period (Table 3.1). A similartrend is also visible among the workforce. This declinein female labour force participation was attributed to anincrease in school enrolment of females in the age group5-14 years and an increase in family incomes that led towithdrawal of women from the labour force.
Table 3.1: Labour Market Scenario
(as per UPSS estimates4)
(in millions)
All India 2004-05 2009-10 2011-12
Population 1092.9 1174.1 1227.4
Labour Force 469 468.8 483.7
Work Force 457.9 459 472.9
Unemployment Rate 2.3 2.0 2.2
No. of Unemployed 11.1 9.8 10.8
Male 2004-05 2009-10 2011-12
Population 565.5 612 631.5
Labour Force 316.4 338.4 351.3
Work Force 309.3 331.7 343.8
Unemployment Rate 2.2 2.0 2.1
No. of Unemployed 7.1 6.7 7.5
Female 2004-05 2009-10 2011-12
Population 527.4 576 595.9
Labour Force 152.6 130.4 132.4
Work Force 148.6 127.3 129.1
Unemployment Rate 2.6 2.3 2.4
No. of Unemployed 4.0 3.1 3.3
Source: NSSO, Key Indicators of Employment and Unemploymentin India, 2004-05 & 2011-12,Ministry of Statistics & Programme Implementation
3.2.3 Further, the increasing proportion of women inworking age confining to National Sample Survey Office
(NSSO) activity code 925 and 936 and their willingnessto work within the vicinity of their homes indicate that,with the structural transformation of the economy andthe consequent loss of women-oriented jobs in theagricultural sector, social compulsions to stay at homeand lack of jobs closer to their homes have led to thewithdrawal of females from the labour market7. Thedecline in female labour force participation was more inrural areas than in urban areas. In rural areas the femalelabour force participation rate declined by nearly 7percentage points, from 33 per cent in 2004-05 to 25.3per cent in 2011-12 as compared to 2.3 percentagepoint decline among urban females during this period(Table 3.2). In the Union Budget 2016-17 to reduce thedrudgery of women in the time spent in collectingfirewood and inhaling the fumes, it has been decided toprovide on a mission mode LPG connection to womenmembers of BPL households. It is proposed to cover 5crore BPL households over a period of three years. Thismove would reduce the time spent in domestic activitiesand encourage more women to join the labour force.
Table 3.2: Female Labour Force Participation
Rate per 1000
(as per UPSS estimate)
NSSO 1993-94 1999-2000 2004-05 2009-10 2011-12Rounds
Rural 330 302 333 265 253
Urban 165 147 178 146 155
Source : NSSO Reports, various rounds
3.2.4 The Twelfth Plan visualizes the manufacturingsector growing at 10-12 per cent per annum in themedium term, creating 100 million job opportunities by2025. Agriculture, on the other hand, is not expected tocreate more jobs even though it is targeted to grow at 4per cent per annum. As per Central Statistical Office(CSO) estimates, agriculture growth at constant prices(2011-12 prices) was 1.5 per cent in 2012-13, 4.2 percent in 2013-14, -0.2 per cent in 2014-158 and 0.8 percent
5 Activity code 92: attended to domestic duties only6 Activity code 93: attended to domestic duties and was also engaged in free collection of goods (vegetables, roots, firewood, cattle feed,etc.), sewing, tailoring, weaving, etc. for household use7 Vikalpa, ‘Decline in Rural Female Labour Force Participation in India – A Relook into the Causes’, The Journal of DecisionMakers, IIM Ahmedabad, Vol.40, Issue -3 , July-September,2015).
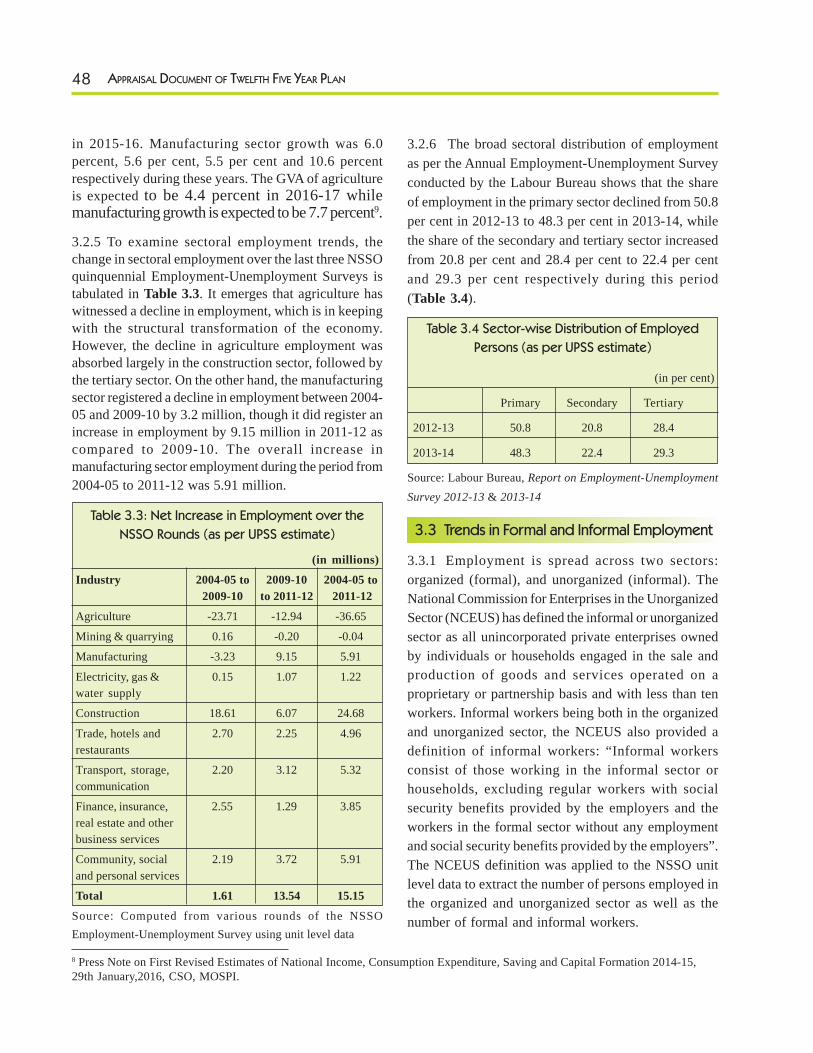
48 APPRAISAL DOCUMENT OF TWELFTH FIVE YEAR PLAN
in 2015-16. Manufacturing sector growth was 6.0percent, 5.6 per cent, 5.5 per cent and 10.6 percentrespectively during these years. The GVA of agricultureis expected to be 4.4 percent in 2016-17 whilemanufacturing growth is expected to be 7.7 percent9.
3.2.5 To examine sectoral employment trends, thechange in sectoral employment over the last three NSSOquinquennial Employment-Unemployment Surveys istabulated in Table 3.3. It emerges that agriculture haswitnessed a decline in employment, which is in keepingwith the structural transformation of the economy.However, the decline in agriculture employment wasabsorbed largely in the construction sector, followed bythe tertiary sector. On the other hand, the manufacturingsector registered a decline in employment between 2004-05 and 2009-10 by 3.2 million, though it did register anincrease in employment by 9.15 million in 2011-12 ascompared to 2009-10. The overall increase inmanufacturing sector employment during the period from2004-05 to 2011-12 was 5.91 million.
Table 3.3: Net Increase in Employment over the
NSSO Rounds (as per UPSS estimate)
(in millions)
Industry 2004-05 to 2009-10 2004-05 to2009-10 to 2011-12 2011-12
Agriculture -23.71 -12.94 -36.65
Mining & quarrying 0.16 -0.20 -0.04
Manufacturing -3.23 9.15 5.91
Electricity, gas & 0.15 1.07 1.22water supply
Construction 18.61 6.07 24.68
Trade, hotels and 2.70 2.25 4.96restaurants
Transport, storage, 2.20 3.12 5.32communication
Finance, insurance, 2.55 1.29 3.85real estate and otherbusiness services
Community, social 2.19 3.72 5.91and personal services
Total 1.61 13.54 15.15
Source: Computed from various rounds of the NSSOEmployment-Unemployment Survey using unit level data
3.2.6 The broad sectoral distribution of employmentas per the Annual Employment-Unemployment Surveyconducted by the Labour Bureau shows that the shareof employment in the primary sector declined from 50.8per cent in 2012-13 to 48.3 per cent in 2013-14, whilethe share of the secondary and tertiary sector increasedfrom 20.8 per cent and 28.4 per cent to 22.4 per centand 29.3 per cent respectively during this period(Table 3.4).
Table 3.4 Sector-wise Distribution of Employed
Persons (as per UPSS estimate)
(in per cent)
Primary Secondary Tertiary
2012-13 50.8 20.8 28.4
2013-14 48.3 22.4 29.3
Source: Labour Bureau, Report on Employment-UnemploymentSurvey 2012-13 & 2013-14
3.3 Trends in Formal and Informal Employment
3.3.1 Employment is spread across two sectors:organized (formal), and unorganized (informal). TheNational Commission for Enterprises in the UnorganizedSector (NCEUS) has defined the informal or unorganizedsector as all unincorporated private enterprises ownedby individuals or households engaged in the sale andproduction of goods and services operated on aproprietary or partnership basis and with less than tenworkers. Informal workers being both in the organizedand unorganized sector, the NCEUS also provided adefinition of informal workers: “Informal workersconsist of those working in the informal sector orhouseholds, excluding regular workers with socialsecurity benefits provided by the employers and theworkers in the formal sector without any employmentand social security benefits provided by the employers”.The NCEUS definition was applied to the NSSO unitlevel data to extract the number of persons employed inthe organized and unorganized sector as well as thenumber of formal and informal workers.
8 Press Note on First Revised Estimates of National Income, Consumption Expenditure, Saving and Capital Formation 2014-15,29th January,2016, CSO, MOSPI.
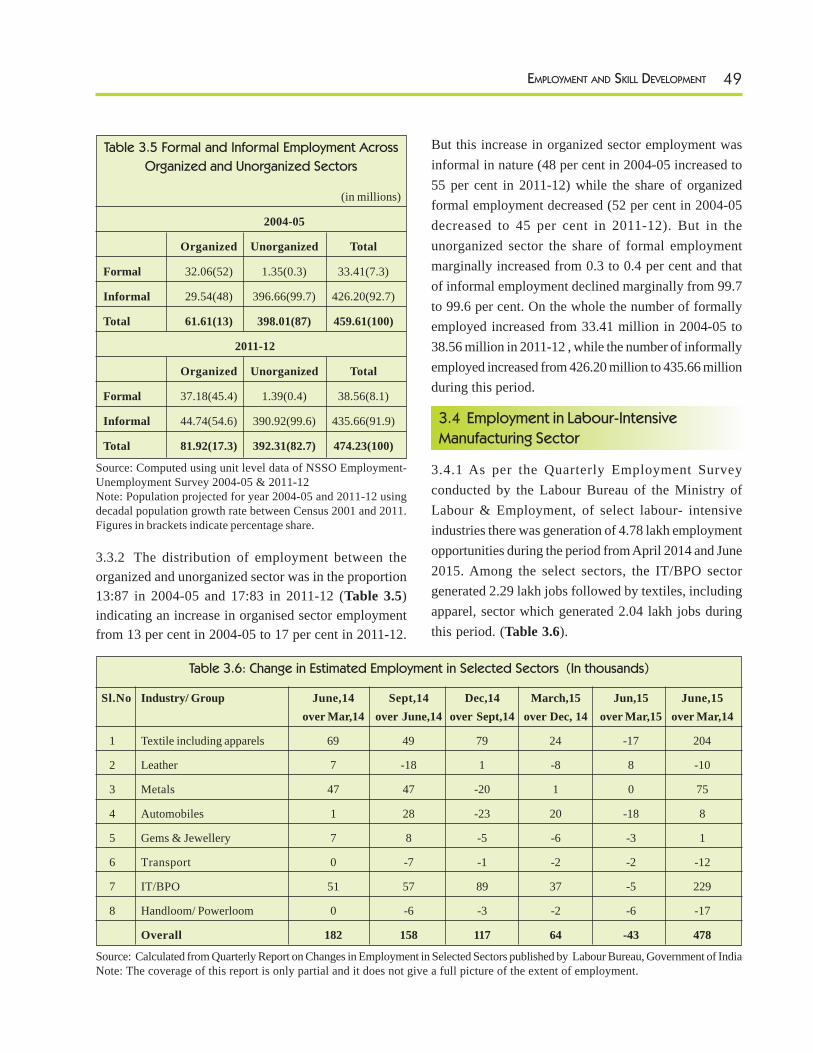
49EMPLOYMENT AND SKILL DEVELOPMENT
Table 3.5 Formal and Informal Employment Across
Organized and Unorganized Sectors
(in millions)
2004-05
Organized Unorganized Total
Formal 32.06(52) 1.35(0.3) 33.41(7.3)
Informal 29.54(48) 396.66(99.7) 426.20(92.7)
Total 61.61(13) 398.01(87) 459.61(100)
2011-12
Organized Unorganized Total
Formal 37.18(45.4) 1.39(0.4) 38.56(8.1)
Informal 44.74(54.6) 390.92(99.6) 435.66(91.9)
Total 81.92(17.3) 392.31(82.7) 474.23(100)
Source: Computed using unit level data of NSSO Employment-Unemployment Survey 2004-05 & 2011-12Note: Population projected for year 2004-05 and 2011-12 usingdecadal population growth rate between Census 2001 and 2011.Figures in brackets indicate percentage share.
3.3.2 The distribution of employment between theorganized and unorganized sector was in the proportion13:87 in 2004-05 and 17:83 in 2011-12 (Table 3.5)indicating an increase in organised sector employmentfrom 13 per cent in 2004-05 to 17 per cent in 2011-12.
But this increase in organized sector employment wasinformal in nature (48 per cent in 2004-05 increased to55 per cent in 2011-12) while the share of organizedformal employment decreased (52 per cent in 2004-05decreased to 45 per cent in 2011-12). But in theunorganized sector the share of formal employmentmarginally increased from 0.3 to 0.4 per cent and thatof informal employment declined marginally from 99.7to 99.6 per cent. On the whole the number of formallyemployed increased from 33.41 million in 2004-05 to38.56 million in 2011-12 , while the number of informallyemployed increased from 426.20 million to 435.66 millionduring this period.
3.4 Employment in Labour-Intensive
Manufacturing Sector
3.4.1 As per the Quarterly Employment Surveyconducted by the Labour Bureau of the Ministry ofLabour & Employment, of select labour- intensiveindustries there was generation of 4.78 lakh employmentopportunities during the period from April 2014 and June2015. Among the select sectors, the IT/BPO sectorgenerated 2.29 lakh jobs followed by textiles, includingapparel, sector which generated 2.04 lakh jobs duringthis period. (Table 3.6).
Table 3.6: Change in Estimated Employment in Selected Sectors (In thousands)
Sl.No Industry/ Group June,14 Sept,14 Dec,14 March,15 Jun,15 June,15over Mar,14 over June,14 over Sept,14 over Dec, 14 over Mar,15 over Mar,14
1 Textile including apparels 69 49 79 24 -17 204
2 Leather 7 -18 1 -8 8 -10
3 Metals 47 47 -20 1 0 75
4 Automobiles 1 28 -23 20 -18 8
5 Gems & Jewellery 7 8 -5 -6 -3 1
6 Transport 0 -7 -1 -2 -2 -12
7 IT/BPO 51 57 89 37 -5 229
8 Handloom/ Powerloom 0 -6 -3 -2 -6 -17
Overall 182 158 117 64 -43 478
Source: Calculated from Quarterly Report on Changes in Employment in Selected Sectors published by Labour Bureau, Government of IndiaNote: The coverage of this report is only partial and it does not give a full picture of the extent of employment.
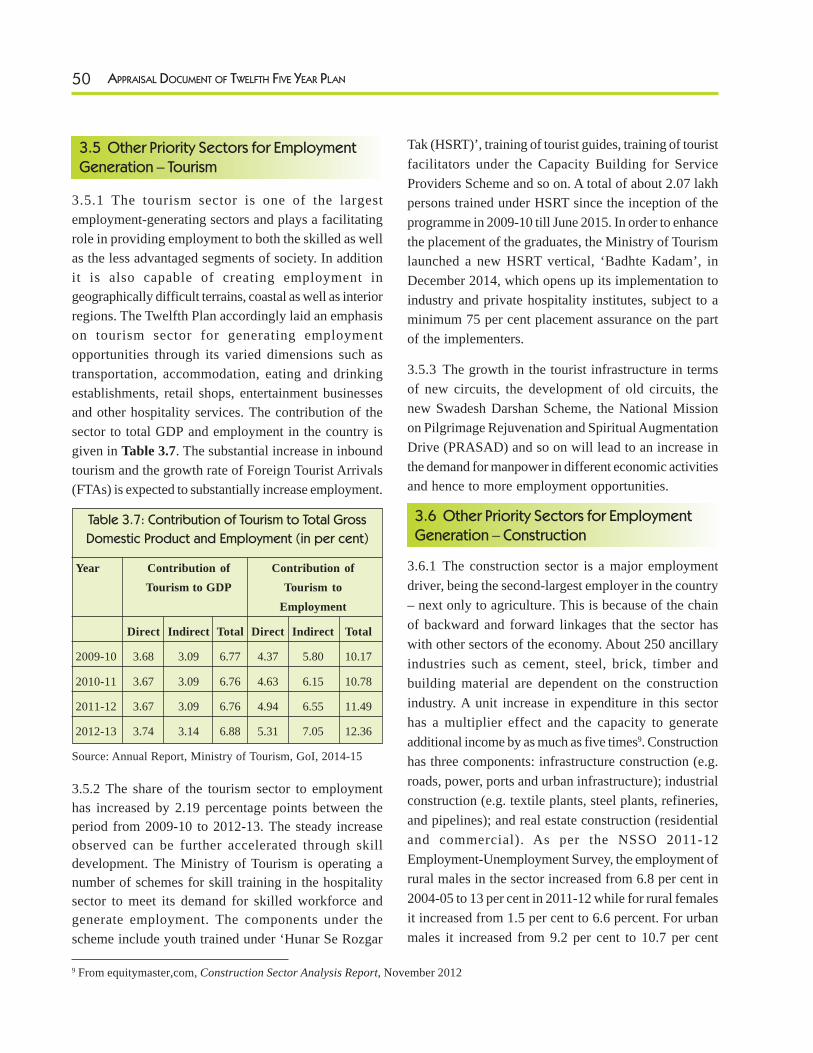
50 APPRAISAL DOCUMENT OF TWELFTH FIVE YEAR PLAN
3.5 Other Priority Sectors for EmploymentGeneration – Tourism
3.5.1 The tourism sector is one of the largestemployment-generating sectors and plays a facilitatingrole in providing employment to both the skilled as wellas the less advantaged segments of society. In additionit is also capable of creating employment ingeographically difficult terrains, coastal as well as interiorregions. The Twelfth Plan accordingly laid an emphasison tourism sector for generating employmentopportunities through its varied dimensions such astransportation, accommodation, eating and drinkingestablishments, retail shops, entertainment businessesand other hospitality services. The contribution of thesector to total GDP and employment in the country isgiven in Table 3.7. The substantial increase in inboundtourism and the growth rate of Foreign Tourist Arrivals(FTAs) is expected to substantially increase employment.
Table 3.7: Contribution of Tourism to Total Gross
Domestic Product and Employment (in per cent)
Year Contribution of Contribution ofTourism to GDP Tourism to
Employment
Direct Indirect Total Direct Indirect Total
2009-10 3.68 3.09 6.77 4.37 5.80 10.17
2010-11 3.67 3.09 6.76 4.63 6.15 10.78
2011-12 3.67 3.09 6.76 4.94 6.55 11.49
2012-13 3.74 3.14 6.88 5.31 7.05 12.36
Source: Annual Report, Ministry of Tourism, GoI, 2014-15
3.5.2 The share of the tourism sector to employmenthas increased by 2.19 percentage points between theperiod from 2009-10 to 2012-13. The steady increaseobserved can be further accelerated through skilldevelopment. The Ministry of Tourism is operating anumber of schemes for skill training in the hospitalitysector to meet its demand for skilled workforce andgenerate employment. The components under thescheme include youth trained under ‘Hunar Se Rozgar
Tak (HSRT)’, training of tourist guides, training of touristfacilitators under the Capacity Building for ServiceProviders Scheme and so on. A total of about 2.07 lakhpersons trained under HSRT since the inception of theprogramme in 2009-10 till June 2015. In order to enhancethe placement of the graduates, the Ministry of Tourismlaunched a new HSRT vertical, ‘Badhte Kadam’, inDecember 2014, which opens up its implementation toindustry and private hospitality institutes, subject to aminimum 75 per cent placement assurance on the partof the implementers.
3.5.3 The growth in the tourist infrastructure in termsof new circuits, the development of old circuits, thenew Swadesh Darshan Scheme, the National Missionon Pilgrimage Rejuvenation and Spiritual AugmentationDrive (PRASAD) and so on will lead to an increase inthe demand for manpower in different economic activitiesand hence to more employment opportunities.
3.6 Other Priority Sectors for EmploymentGeneration – Construction
3.6.1 The construction sector is a major employmentdriver, being the second-largest employer in the country– next only to agriculture. This is because of the chainof backward and forward linkages that the sector haswith other sectors of the economy. About 250 ancillaryindustries such as cement, steel, brick, timber andbuilding material are dependent on the constructionindustry. A unit increase in expenditure in this sectorhas a multiplier effect and the capacity to generateadditional income by as much as five times9. Constructionhas three components: infrastructure construction (e.g.roads, power, ports and urban infrastructure); industrialconstruction (e.g. textile plants, steel plants, refineries,and pipelines); and real estate construction (residentialand commercial). As per the NSSO 2011-12Employment-Unemployment Survey, the employment ofrural males in the sector increased from 6.8 per cent in2004-05 to 13 per cent in 2011-12 while for rural femalesit increased from 1.5 per cent to 6.6 percent. For urbanmales it increased from 9.2 per cent to 10.7 per cent
9 From equitymaster,com, Construction Sector Analysis Report, November 2012
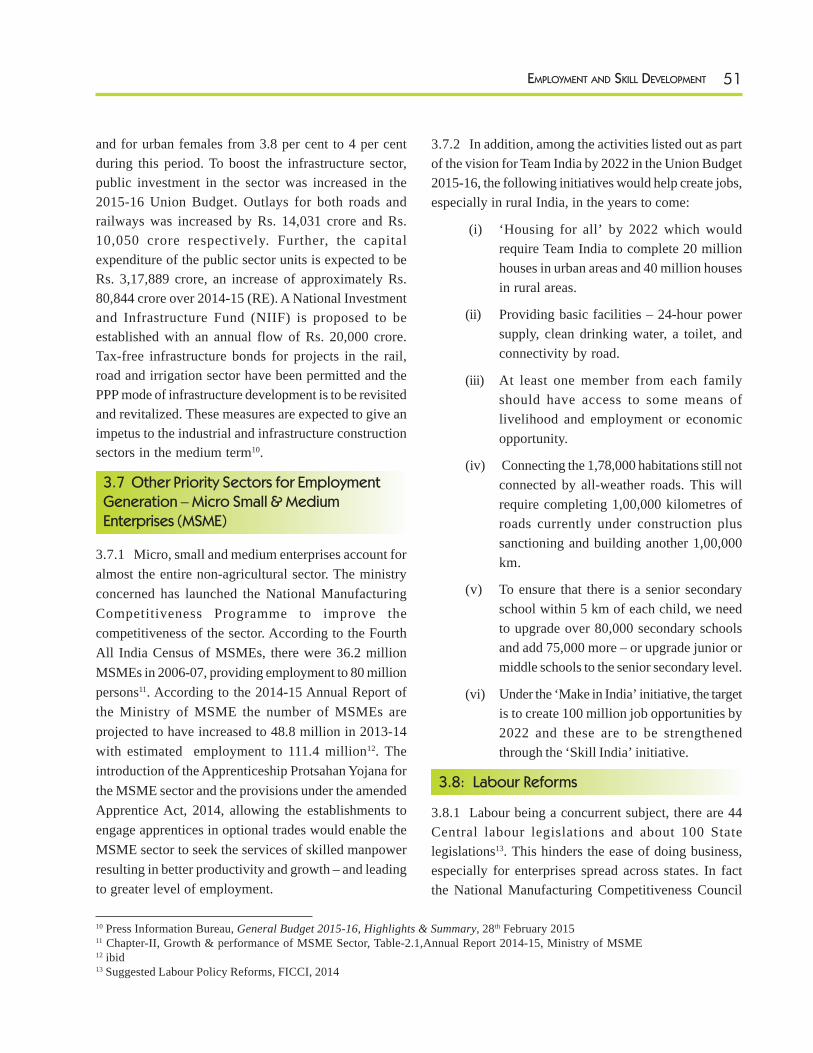
51EMPLOYMENT AND SKILL DEVELOPMENT
and for urban females from 3.8 per cent to 4 per centduring this period. To boost the infrastructure sector,public investment in the sector was increased in the2015-16 Union Budget. Outlays for both roads andrailways was increased by Rs. 14,031 crore and Rs.10,050 crore respectively. Further, the capitalexpenditure of the public sector units is expected to beRs. 3,17,889 crore, an increase of approximately Rs.80,844 crore over 2014-15 (RE). A National Investmentand Infrastructure Fund (NIIF) is proposed to beestablished with an annual flow of Rs. 20,000 crore.Tax-free infrastructure bonds for projects in the rail,road and irrigation sector have been permitted and thePPP mode of infrastructure development is to be revisitedand revitalized. These measures are expected to give animpetus to the industrial and infrastructure constructionsectors in the medium term10.
3.7 Other Priority Sectors for EmploymentGeneration – Micro Small & MediumEnterprises (MSME)
3.7.1 Micro, small and medium enterprises account foralmost the entire non-agricultural sector. The ministryconcerned has launched the National ManufacturingCompetitiveness Programme to improve thecompetitiveness of the sector. According to the FourthAll India Census of MSMEs, there were 36.2 millionMSMEs in 2006-07, providing employment to 80 millionpersons11. According to the 2014-15 Annual Report ofthe Ministry of MSME the number of MSMEs areprojected to have increased to 48.8 million in 2013-14with estimated employment to 111.4 million12. Theintroduction of the Apprenticeship Protsahan Yojana forthe MSME sector and the provisions under the amendedApprentice Act, 2014, allowing the establishments toengage apprentices in optional trades would enable theMSME sector to seek the services of skilled manpowerresulting in better productivity and growth – and leadingto greater level of employment.
3.7.2 In addition, among the activities listed out as partof the vision for Team India by 2022 in the Union Budget2015-16, the following initiatives would help create jobs,especially in rural India, in the years to come:
(i) ‘Housing for all’ by 2022 which wouldrequire Team India to complete 20 millionhouses in urban areas and 40 million housesin rural areas.
(ii) Providing basic facilities – 24-hour powersupply, clean drinking water, a toilet, andconnectivity by road.
(iii) At least one member from each familyshould have access to some means oflivelihood and employment or economicopportunity.
(iv) Connecting the 1,78,000 habitations still notconnected by all-weather roads. This willrequire completing 1,00,000 kilometres ofroads currently under construction plussanctioning and building another 1,00,000km.
(v) To ensure that there is a senior secondaryschool within 5 km of each child, we needto upgrade over 80,000 secondary schoolsand add 75,000 more – or upgrade junior ormiddle schools to the senior secondary level.
(vi) Under the ‘Make in India’ initiative, the targetis to create 100 million job opportunities by2022 and these are to be strengthenedthrough the ‘Skill India’ initiative.
3.8: Labour Reforms
3.8.1 Labour being a concurrent subject, there are 44Central labour legislations and about 100 Statelegislations13. This hinders the ease of doing business,especially for enterprises spread across states. In factthe National Manufacturing Competitiveness Council
10 Press Information Bureau, General Budget 2015-16, Highlights & Summary, 28th February 201511 Chapter-II, Growth & performance of MSME Sector, Table-2.1,Annual Report 2014-15, Ministry of MSME12 ibid13 Suggested Labour Policy Reforms, FICCI, 2014
52 APPRAISAL DOCUMENT OF TWELFTH FIVE YEAR PLAN
referred to there being a need for just three laws: onerelating to rights, one to welfare and one to safety.
3.8.2 The share of organized formal employment, asper the 2011-12 NSSO Employment-Unemployment datais 7.8 per cent14. Therefore, the labour legislations areapplicable only to 37 million, as against a total workforceof around 474 million. According to the Ministry ofLabour & Employment’s Annual Employment Review,2011, only about 0.32 million organized sectorestablishments come under the ambit of the labour laws.
3.8.3 The initiatives of Ministry of Labour andEmployment, such as the launch of the Shram Suvidhaportal; providing unique Labour Identification Number(LIN) to units to facilitate online registration; filing ofself-certified and simplified single online returns by theindustry; transparent labour inspection schemes; andtimely redressal of grievances and amendments to labourlaws, would increase compliance and expand coverageof the organized sector. As an initiative on a pilot basis,the Ministry has selected the Chief Labour Commissioner(Central) organization, the Employees State InsuranceCorporation (ESIC), the Employees Provident FundOrganisation (EPFO) and the Directorate General ofMines Safety (DGMS). These departments’responsibilities cover 16 labour laws. State Governmentswould join this Unified Single Web Portal subsequently.The web portal will contribute proactively to achievethe objective of simplifying business regulations andbringing in transparency and accountability in labourinspections.
3.8.4 The Ministry of Labour & Employment hasintroduced reforms in a number of labour legislationswhich are in various stages of the amendment process.Under the Minimum Wages Act, 1948, an amendment isproposed to make the National Floor Level MinimumWage statutory, and to extend it to all employments.
3.8.5 The Apprentices Act, 1961, was amended byParliament to allow MSMEs also to undertake apprenticetraining. Some of the major amendments include: pan-
India establishments will now be under the purview ofDirectorate General of Training (DGT); apprentices tobe engaged at establishment level instead of trade-wise;extending apprenticeship training to non-engineeringgraduate and diploma holders; employers to undertakedemand-based new courses (optional trades); simplifyingthe procedure for registration of contract ofapprenticeship training, etc. This would encourageestablishments to take in more apprentices and provideshop floor training.
3.8.6 To cover more workers in the ambit of theEmployees’ Pension Scheme, 1995 (EPS), the Ministryof Labour & Employment has enhanced the statutorymonthly wage ceiling under the EPS from the existingRs. 6,500 to Rs. 15,000. It has fixed a minimum pensionof Rs. 1000 per month and 20 per cent additional reliefon the amount of assurance benefit admissible underEmployees’ Deposit Linked Insurance Scheme, 1976.The Ministry is also contemplating bringing in anamendment to the Employees’ Provident Fund &Miscellaneous Provisions Act, 1952, to expand itscoverage to include more workers.
3.8.7 The Factories Act (Amendment) Bill, 2014, hasbeen proposed for allowing the states to raise theapplicability of the Act to units employing 20 workerswhere power is used and to 40 for others, from theexisting 10 and 20, respectively. The Bill removesprohibitions on women working on certain machines inmotion and near cotton openers; allows the StateGovernments to make rules allowing women to worknight-shifts in factories upon fulfilling certain conditions;increases the permissible overtime hours from 50 hoursin one quarter to 100 hours, and from 75 hours to 125hours in certain cases. The amendments should have apositive impact on the participation of female labour forcein factories.
3.8.8 The Labour Laws (Exemption from FurnishingReturns and Maintaining Registers by CertainEstablishments) Act, 2014, is the amended Act thatincreases the number of labour laws under which units
14 Skill Development & Employment Vertical- Computed from NSSO Employment-Unemployment Survey various Rounds using unitlevel data.
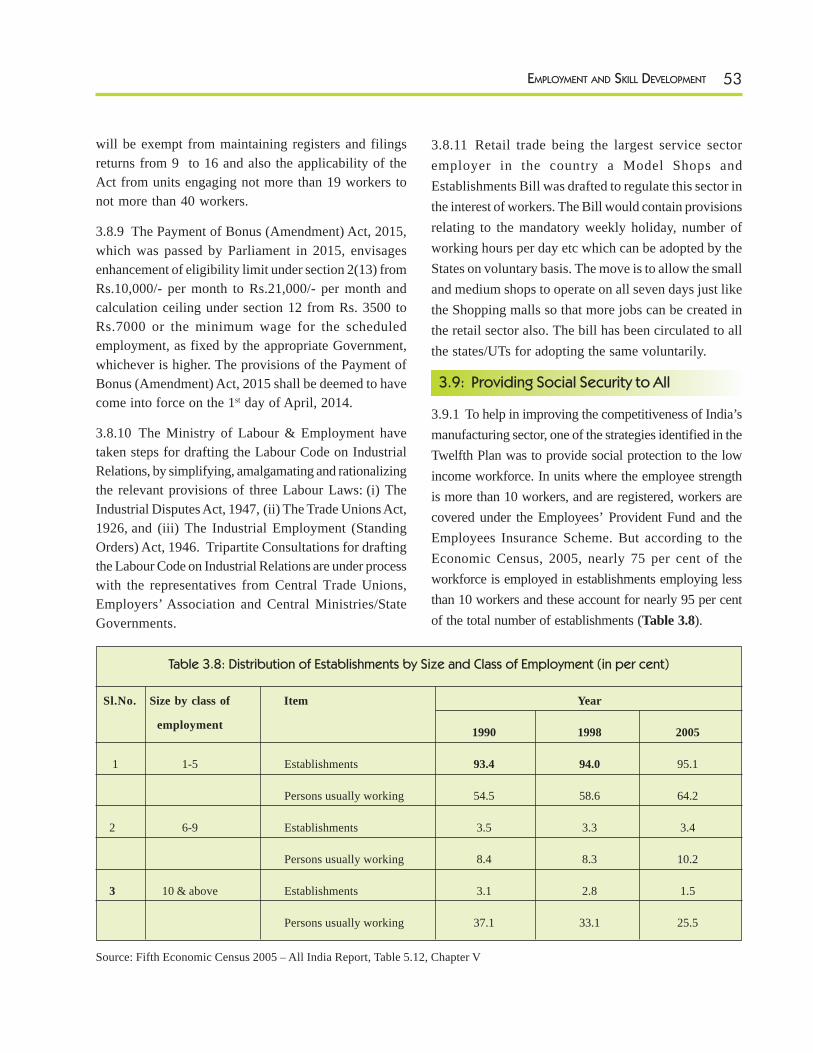
53EMPLOYMENT AND SKILL DEVELOPMENT
will be exempt from maintaining registers and filingsreturns from 9 to 16 and also the applicability of theAct from units engaging not more than 19 workers tonot more than 40 workers.
3.8.9 The Payment of Bonus (Amendment) Act, 2015,which was passed by Parliament in 2015, envisagesenhancement of eligibility limit under section 2(13) fromRs.10,000/- per month to Rs.21,000/- per month andcalculation ceiling under section 12 from Rs. 3500 toRs.7000 or the minimum wage for the scheduledemployment, as fixed by the appropriate Government,whichever is higher. The provisions of the Payment ofBonus (Amendment) Act, 2015 shall be deemed to havecome into force on the 1st day of April, 2014.
3.8.10 The Ministry of Labour & Employment havetaken steps for drafting the Labour Code on IndustrialRelations, by simplifying, amalgamating and rationalizingthe relevant provisions of three Labour Laws: (i) TheIndustrial Disputes Act, 1947, (ii) The Trade Unions Act,1926, and (iii) The Industrial Employment (StandingOrders) Act, 1946. Tripartite Consultations for draftingthe Labour Code on Industrial Relations are under processwith the representatives from Central Trade Unions,Employers’ Association and Central Ministries/StateGovernments.
3.8.11 Retail trade being the largest service sectoremployer in the country a Model Shops andEstablishments Bill was drafted to regulate this sector inthe interest of workers. The Bill would contain provisionsrelating to the mandatory weekly holiday, number ofworking hours per day etc which can be adopted by theStates on voluntary basis. The move is to allow the smalland medium shops to operate on all seven days just likethe Shopping malls so that more jobs can be created inthe retail sector also. The bill has been circulated to allthe states/UTs for adopting the same voluntarily.
3.9: Providing Social Security to All
3.9.1 To help in improving the competitiveness of India’smanufacturing sector, one of the strategies identified in theTwelfth Plan was to provide social protection to the lowincome workforce. In units where the employee strengthis more than 10 workers, and are registered, workers arecovered under the Employees’ Provident Fund and theEmployees Insurance Scheme. But according to theEconomic Census, 2005, nearly 75 per cent of theworkforce is employed in establishments employing lessthan 10 workers and these account for nearly 95 per centof the total number of establishments (Table 3.8).
Table 3.8: Distribution of Establishments by Size and Class of Employment (in per cent)
Sl.No. Size by class of Item Year
employment 1990 1998 2005
1 1-5 Establishments 93.4 94.0 95.1
Persons usually working 54.5 58.6 64.2
2 6-9 Establishments 3.5 3.3 3.4
Persons usually working 8.4 8.3 10.2
3 10 & above Establishments 3.1 2.8 1.5
Persons usually working 37.1 33.1 25.5
Source: Fifth Economic Census 2005 – All India Report, Table 5.12, Chapter V
54 APPRAISAL DOCUMENT OF TWELFTH FIVE YEAR PLAN
3.9.2 To bring these workers under the social safetynet, the erstwhile Planning Commission had prepared aConcept note on the feasibility of a comprehensive socialsecurity scheme for unorganized sector workers, whichformed the basis for the Institute of FinancialManagement and Research (IFMR15) report on‘Comprehensive Social Security for the IndianUnorganised Sector’. As the financial implications ofcovering more than 400 million workforce was veryhigh, it was decided to bring about a convergence ofthe existing social security schemes under a commonplatform. Accordingly a pilot project, to be implementedin 20 districts, converging three social security schemesviz. Rashtriya Swasthya Bima Yojana, Aam Aadmi BimaYojana and the Indira Gandhi National Old Age PensionScheme, implemented by three different Ministries wasbeing conceptualized. The common platform would beenabled by issuing a social security smart card to thebeneficiaries of these schemes. This would involveidentifying and de-duplicating the beneficiary database;and also to enrol the beneficiaries who are left out in allthe three schemes. Since at present there is no centralizeddata base of unorganized workers, the Ministry ofLabour & Employment is working on registration,identification and creation of a nationalized database ofunorganized workers and develop a national platform fordelivery of services for unorganized workers. This nationalplatform will be Aadhaar Seeded and unique identificationnumber to the unorgamnised workers will be provided.
3.9.3 The Rashtriya Swasthya Bima Yojana (RSBY),meant for unorganized sector workers, was transferredfrom the Ministry of Labour & Employment to theMinistry of Health & Family Welfare on “as is where is”basis with effect from 1st April 2015. Henceforth, theMinistry of Health and Family Welfare will be concernedwith the delivery of health care, while enrolment of theunorganized sector workers under the scheme wouldcontinue to rest with the Ministry of Labour &Employment. Since the inception of the RSBY, thecoverage of the scheme has been extended to a largenumber of occupational groups, such as construction
workers, licensed railway porters, street vendors,MGNREGA workers (who have worked for more than15 days during the preceding financial year), beediworkers, domestic workers, sanitation workers, mineworkers, rickshaw-pullers, rag-pickers and Auto/Taxidrivers. At present, the RSBY is being implemented in19 States/UTs. The Committee of Secretaries (COS)has recommended that the scheme be restructured andimplemented through a trust/society at the State level.
3.9.4 To meet the catastrophic health expenditure whichpushes poor households below the poverty line everyyear, the Government has decided to launch a new healthprotection scheme which would provide health coverup to Rs. 1 lakh per family. For senior citizens of age 60years and above belonging to this category, an additionaltop-up package up to Rs.30000 will be provided.
3.9.5 In keeping with an announcement in the 2015-16Union Budget, the Cabinet has approved theoperationalization of three social security schemes – theAtal Pension Yojana (APY), the Pradhan Mantri JeevanJyoti Bima Yojana (PMJJBY) and the Pradhan MantriSuraksha Bima Yojana (PMSBY). The Atal Pension Yojana(APY) is to cover the unorganized sector; subscriberswould receive a fixed minimum monthly pension of Rs.1,000, Rs. 2,000. Rs. 3,000, Rs. 4,000 or Rs. 5,000 atthe age of 60 years, depending upon their contributions– which itself would vary with the age of joining APY.The Central Government would also contribute 50 percent of the total contribution or Rs. 1000 per annum,whichever is lower, to each eligible subscriber accountfor a period of five years (from 2015-16 to 2019-20).Those who joined the APY before 31st December, 2015,who are not members of any statutory social securityscheme, and who are not income tax payers are eligible.The pension would also be available to the spouse onthe death of the subscriber; thereafter the pension corpuswould be returned to the nominee. The minimum age ofjoining APY is 18 years and maximum age is 40 years.The benefit of fixed minimum pension would beguaranteed by the government.
15 Report on Comprehensive Social Security for the Indian Unorganized Sector, Centre for Micro Finance, IFMR, December 2013.
55EMPLOYMENT AND SKILL DEVELOPMENT
3.9.6 The Union Cabinet approved the continuation ofthe minimum pension of Rs. 1,000 per month to thepensioners of the 1995 Employees Pension Scheme(EPS) in perpetuity. The Cabinet also approved thecorresponding grant of continuous annual budgetarysupport for implementing the minimum pension, whichwill be to the tune of Rs. 850 crore per year on a taperingbasis. Providing a minimum pension of Rs. 1,000 permonth is an effort to provide meaningful subsistence topensioners who have served in the organized sector.The present proposal is likely to benefit approximatelytwo million pensioners under the EPS.
3.9.7 Further, in the Union Budget 2015-16, theemployees of the organized sector were given the optionto choose between the Employees’ Provident Fund andthe New Pension Scheme (NPS). Secondly, foremployees below a certain threshold of monthly income,contribution to EPF would be optional, without affectingor reducing the employer’s contribution. With respectto ESI, the employee would have the option of choosingeither ESI or a health insurance product recognized bythe Insurance Regulatory and Development Authority(IRDA). The proposals are being examined inconsultation with stakeholders.
3.9.8 In order to incentivize creation of new jobs in theformal sector, a new scheme, Pradhan Mantri RozgarProtsahan Yojna (PMRPY), has been proposed, wherein8.33 percent of employer contribution under theEmployees’ Pension Scheme shall be made by theGovernment of India for all new employees enrolling inEPFO for the first three years of their employment. Thiswill incentivize the employers to recruit unemployedpersons and also to bring into the books the informalemployees. In order to channelize this intervention towardsthe target group of semi-skilled and unskilled workers,the scheme will be applicable to those with salary up toRs.15000 per month As a part of the textile boosterpackage, for apparel and made up sector, the Ministry ofTextiles has extended the PMRPY Scheme, wherein theGovernment will pay the employers share of 12 per centunder EPFO for all new employments. i.e. 8.33 per centEPS contribution and 3.67 per cent EPF contribution.
3.10: Skill Development
3.10.1 Accelerated economic growth increased thedemand for skilled manpower – and brought to the forethe shortage of such skilled manpower in the country.India is among the countries in which employers arefacing the most difficulty in filling up vacancies. ForIndia, the difficulty of filling up these jobs is 48 percent, above the global standard of 34 per cent in 201216.The lack of applicants, a shortage of applicants withhard skills, and a shortage of suitable employability –including soft skills – are some of the key reasons inwhy it is difficult to find suitable candidates to fill theavailable jobs. The Twelfth Plan aims at improving theoutreach of skill development, both quantitatively andqualitatively, in order to bridge social, regional, spatialand gender divides. The Plan also aims at putting in placea dedicated institutional mechanism: supportmechanisms to augment the financial requirements/provide skill loans for poor students (Credit GuaranteeFund); the development of the National Skill QualificationFramework, incorporating the standards developed bySector Skill Councils; and the creation of a regulatoryframework to oversee its functioning. In addition, thePlan focuses on the training of trainers; promotingPublic-Private Partnerships; linkages between allstakeholders to bridge the demand and supply gap ofskilled manpower; and the training of informal sectorworkers. Developing an ICT-based real-time labourmarket information system; creating an online nationalregister of the persons skilled, and their currentengagement, to not only provide a national database toemployers and all other stakeholders but also to facilitatea transparent monitoring system; converting employmentexchanges into career centers, etc., are also part of thePlan objectives. In order to meet these objectives andgoals, a number of initiatives on skill development havebeen undertaken.
3.10.2 To expand its outreach, the Skill DevelopmentInitiative needs a considerable expansion of its capacity,innovative delivery approaches and Public PrivatePartnerships. Towards this end, the following initiativeshave been undertaken:
16 Knowledge Paper on Skill Development in India: Learner First, September 2012, prepared by Ernst & Young for FICCI17 Skill Development Initiative: Modular Employable Skills Scheme: Feedback from the Field, Astha Ummat, July 2013.
56 APPRAISAL DOCUMENT OF TWELFTH FIVE YEAR PLAN
(i) The Modular Employable Scheme wasstarted in 2008 that aimed at training onemillion persons in demand-driven vocationalskills over the next five years – and onemillion each year after that to support skillstraining, certification and upgradation in theunorganized sector. The scheme catered toschool drop-outs and existing workers.According to an evaluation study done bythe ILO17, the scheme is considered to havehelped provide certification of vocationalskills to people for whom formal educationis impossible due to restrictive programprerequisites. The certification has enabledthem to have better livelihoods, develop softand advanced skills and increase theirproductivity at work. It also increases theirbargaining power in industry. Challenges tothe scheme have been identified in the study.For one, the MES is not designed as anoutcome-based scheme in that it did notensure a link between training andemployment or self-employment for thosenot from industry. Another major challengebeing faced by the scheme is ensuring theemployability of the people trained or testedunder it. At present there is very littleinformation available on the placement ofthe trainees. A proper mechanism to assessdemand should also be developed and utilizedat the state level so as to ascertain theappropriate manpower requirements andmake the scheme more demand-driven – sothe training offered is more closely linkedto employment opportunities. The issue ofincreasing communication betweenemployers in terms of identifying the skillsrequired in the market, and between thevarious training institutes in terms ofprovision of training for identified skills, wasalso raised.
(ii) In 2008, Industrial Training Institutes (ITIs)were brought under Public-PrivatePartnerships (PPP). An evaluation study18
points out that the success of this PPPscheme generally depends on the locationof the ITI, the nearness of industrial unitsand that of the industry partner, and alsothe extent of involvement of the industrypartner and other members in the IMC.Lack of staff – especially of a full-timeprincipal – in the ITI was another drawbackthat was mentioned. The same findings werecorroborated in an evaluation studyconducted by CII19. On a positive note itwas mentioned that the intake capacities haveimproved substantially after the introductionof the PPP. Data on enrolment of studentsin ITIs is not available to assess theprogress.
(iii) The following Centrally Sponsored Schemesimplemented by the Ministry of Labour &Employment have been transferred to theMinistry of Skill Development: SkillDevelopment Initiative-Modular EmployableSkills; Skill Development for 34 Districtsaffected by Left Wing Extremism (LWE);Upgradation of 1396 ITIs; Enhancing SkillDevelopment Infrastructure in NE State &Sikkim; Setting up of Skill DevelopmentCentre at Gulbarga & Bangalore; Upgradationof existing ITIs into Model ITIs.
(iv) The Ministry of Rural Development hasreworked the placement-linked skilldevelopment programme for rural pooryouth into the Deen Dayal UpadhyayaGrameen Kaushalya Yojana (DDU-GKY),which targets those in the age group 15-35years. Training is undertaken in NCVT or
18 Assessment of Evaluation of Scope of Up-Gradation of Select Industrial Training Institutes through PPP in Maharashtra & TamilNadu by Maharashtra Economic Development Council, July 2010.19 Upgrading Industrial Training Institutes under the Public Private Partnership Scheme: An Impact Assessment Study: East &North East Report, May 2014.
57EMPLOYMENT AND SKILL DEVELOPMENT
SSC-recognized courses. Projects areundertaken in PPP mode with assuredplacement for 75 per cent of trainedcandidates. The scheme offers post-placement support to the candidates. TheCabinet has approved removal of existingrestriction which limits the allocation ofDDU-GKY to 25 percent of NRLMallocation to enable the Ministry to expandits focus, inter-alia, to cover training coursesof longer duration for placements in foreignjobs, captive jobs, industry internships,training by accredited institutes andchampion employers, and re-skilling/up-skilling of rural poor youth, including ruralpoor youth who have passed out from ITIs/ Polytechnic Institutes.
(v) The Ministry of Minority Affairs haslaunched a number of new schemes like the‘Seekho Aur Kamao (Learn and Earn)’Scheme, which aims at upgrading the skillsof the minority youth in various modern /traditional vocations depending upon theireducational qualification, present economictrends and the market potential for theirskills. This could help them discover suitableemployment or make them skilled enoughto go for self-employment.
(vi) Upgrading the Skills and Training inTraditional Arts/ Crafts for Development(USTTAD): This new scheme was approvedduring 2014-15 to preserve the rich heritageof the traditional arts and crafts of India’sminorities and build up the capacity availableto poor traditional artisans and craftsmen.In order to promote self-employment forminority communities through developmentof entrepreneurial skills with credit linkages,MANAS (Maulana Azad National Academyfor Skills) has been established by theNational Minorities Development andFinance Corporation on 10th November2014. As an integrated education andlivelihood initiative for the minority
communities, the “Nai Manzil” scheme waslaunched in the August 2015. The schemeaims for educational enhancement and skilltraining, especially for the school dropoutsfrom minority communities and for youthgetting an education from the madrasasystem of education. The scheme is intendedto cover people between the 17- 35 agegroup and will provide avenues forcontinuing higher education and also openup employment opportunities. Skill trainingunder the programme would cover thefollowing areas viz; (i) manufacturing (ii)engineering (iii) services and (iv) soft skills.
(vii) The Swarna Jayanti Shahari Rozgar Yojana(SJSRY) in the Twelfth Plan wasrestructured as the National UrbanLivelihood Mission (NULM). NULM willtarget the urban poor who are occupationallyvulnerable, for Employment through SkillsTraining & Placement (EST&P). TheMission will focus on providing assistancefor developing and upgrading skills of theurban poor so as to enhance their capacityfor self-employment and wage employment.The Support to Urban Street Vendors (USV)component will cover a socio-economicsurvey of street vendors, development ofpro-vending urban planning and vendors’markets, credit enablement of vendors, skilldevelopment and micro-enterprisedevelopment, and convergence undervarious schemes of the government.
(viii) To bring the unorganized sector, especiallyMSME units, into scope of apprenticeshiptraining, the Apprentice Protsahan Yojanawas launched from 16th October, 2014, tosupport 100,000 apprentices in the next twoand a half years by sharing 50 per cent ofthe stipend. Enhanced rates of stipend havebeen notified for trade apprentices, with theminimum rate per month payable indexedto the minimum wage of semi-skilledworkers. The Government will reimburse
58 APPRAISAL DOCUMENT OF TWELFTH FIVE YEAR PLAN
the stipend payable to apprenticesundergoing training in MSMEs for the firsttwo years of training, after which the costwill be borne by the employer.
(ix) The scheme for “Enhancement of SkillDevelopment Infrastructure in the NorthEastern States & Sikkim” has been revisedto include construction of 22 new ITIsinstead of 14 as per the existing scheme.This will enhance the training capacity inthe North East.
(x) The National Skill Certification and RewardScheme was launched in pursuance to theannouncement made in the Union Budget forthe year 2013-14. The scheme was inoperation from August 2013 until September2014. The National Skill DevelopmentCorporation (NSDC) was designated as theimplementing agency for this ‘STAR’scheme. The scheme was a reward-basedskill development programme. Under it, 1.4million enrolments and training were donewith 856,000 certified candidates.
(xi) Based on learnings from the STAR scheme,the Ministry of Skill Development andEntrepreneurship launched the PradhanMantri Kaushal Vikas Yojana (PMKVY) theflagship outcome-based skill training schemeof the Ministry. The programme aims at skillcertification and rewards to mobilize a largenumber of youth for outcome-based skilltraining. Under the scheme, monetaryrewards would be provided to trainees whoare successfully trained, assessed andcertified in skill courses run by affiliatedtraining providers. The scheme targetsreaching out to 2.4 million candidates (1.4million fresh trainees and 1 million in thestream which recognises prior learning) inits first year of implementation. It will targetschool drop-outs, women anddisadvantaged sections of the society as well
as 50,000 persons with disabilities. It willfocus on difficult areas, like districts affectedwith LWE and North East. The implementingagency of this scheme is NSDC. In theUnion Budget 2016-17 it has been decidedto scale up implementation of PMKY to skill1 crore youth over the next three years.
(xii) In March, 2015, the Government launchedthe National Action Plan for Skill Trainingof Persons with Disabilities. This NationalAction Plan is a partnership between theMinistry of Skill Development andEntrepreneurship (MSDE) and theDepartment of Empowerment of Personswith Disability, for skilling 2.5 million peoplewith disabilities over seven years.
(xiii) The Department of School Education andLiteracy has reworked the scheme of“Vocationalisation of Higher SecondaryEducation” into “Vocationalisation ofSecondary and Higher SecondaryEducation”, incorporating lessons from theHaryana pilot project on the NationalVocational Education QualificationFramework (NVEQF) and subsuming therevamped scheme into the RashtriyaMadhyamik Shiksha Abhiyan (RMSA). Therevamped scheme has introduced vocationaleducation from Class IX onwards – i.e., atthe secondary stage.
(xiv) A National Board for Skill DevelopmentCertification is proposed to be set up inpartnership with the industry and academiato set standards and certify skill developmentcourses.
(xv) It was announced in Union Budget 2016-17, that ‘Entrepreneurship Education andTraining’ will be provided in 2200 colleges,300 schools, 500 Government ITIs and 50Vocational Training Centres through MassiveOpen Online Courses. Aspiringentrepreneurs, particularly those from
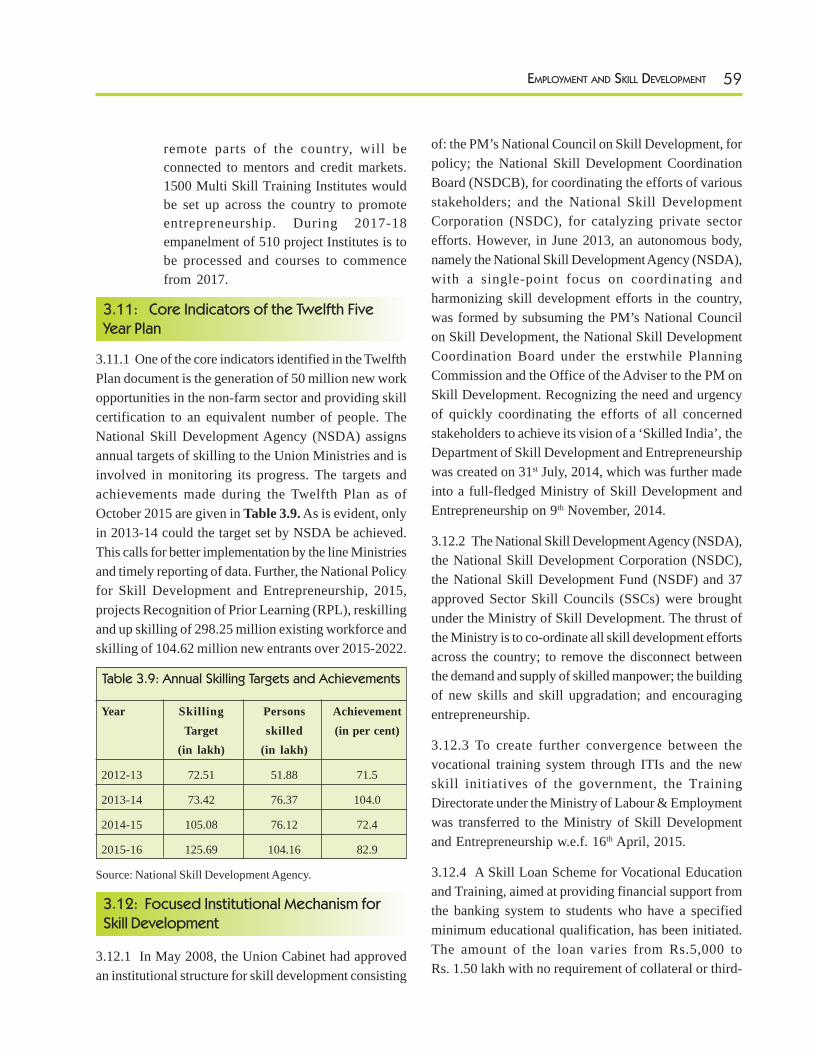
59EMPLOYMENT AND SKILL DEVELOPMENT
remote parts of the country, will beconnected to mentors and credit markets.1500 Multi Skill Training Institutes wouldbe set up across the country to promoteentrepreneurship. During 2017-18empanelment of 510 project Institutes is tobe processed and courses to commencefrom 2017.
3.11: Core Indicators of the Twelfth FiveYear Plan
3.11.1 One of the core indicators identified in the TwelfthPlan document is the generation of 50 million new workopportunities in the non-farm sector and providing skillcertification to an equivalent number of people. TheNational Skill Development Agency (NSDA) assignsannual targets of skilling to the Union Ministries and isinvolved in monitoring its progress. The targets andachievements made during the Twelfth Plan as ofOctober 2015 are given in Table 3.9. As is evident, onlyin 2013-14 could the target set by NSDA be achieved.This calls for better implementation by the line Ministriesand timely reporting of data. Further, the National Policyfor Skill Development and Entrepreneurship, 2015,projects Recognition of Prior Learning (RPL), reskillingand up skilling of 298.25 million existing workforce andskilling of 104.62 million new entrants over 2015-2022.
Table 3.9: Annual Skilling Targets and Achievements
Year Skilling Persons AchievementTarget skilled (in per cent)
(in lakh) (in lakh)
2012-13 72.51 51.88 71.5
2013-14 73.42 76.37 104.0
2014-15 105.08 76.12 72.4
2015-16 125.69 104.16 82.9
Source: National Skill Development Agency.
3.12: Focused Institutional Mechanism forSkill Development
3.12.1 In May 2008, the Union Cabinet had approvedan institutional structure for skill development consisting
of: the PM’s National Council on Skill Development, forpolicy; the National Skill Development CoordinationBoard (NSDCB), for coordinating the efforts of variousstakeholders; and the National Skill DevelopmentCorporation (NSDC), for catalyzing private sectorefforts. However, in June 2013, an autonomous body,namely the National Skill Development Agency (NSDA),with a single-point focus on coordinating andharmonizing skill development efforts in the country,was formed by subsuming the PM’s National Councilon Skill Development, the National Skill DevelopmentCoordination Board under the erstwhile PlanningCommission and the Office of the Adviser to the PM onSkill Development. Recognizing the need and urgencyof quickly coordinating the efforts of all concernedstakeholders to achieve its vision of a ‘Skilled India’, theDepartment of Skill Development and Entrepreneurshipwas created on 31st July, 2014, which was further madeinto a full-fledged Ministry of Skill Development andEntrepreneurship on 9th November, 2014.
3.12.2 The National Skill Development Agency (NSDA),the National Skill Development Corporation (NSDC),the National Skill Development Fund (NSDF) and 37approved Sector Skill Councils (SSCs) were broughtunder the Ministry of Skill Development. The thrust ofthe Ministry is to co-ordinate all skill development effortsacross the country; to remove the disconnect betweenthe demand and supply of skilled manpower; the buildingof new skills and skill upgradation; and encouragingentrepreneurship.
3.12.3 To create further convergence between thevocational training system through ITIs and the newskill initiatives of the government, the TrainingDirectorate under the Ministry of Labour & Employmentwas transferred to the Ministry of Skill Developmentand Entrepreneurship w.e.f. 16th April, 2015.
3.12.4 A Skill Loan Scheme for Vocational Educationand Training, aimed at providing financial support fromthe banking system to students who have a specifiedminimum educational qualification, has been initiated.The amount of the loan varies from Rs.5,000 toRs. 1.50 lakh with no requirement of collateral or third-
60 APPRAISAL DOCUMENT OF TWELFTH FIVE YEAR PLAN
party guarantee. Expenses covered by the loan include:(i) Tuition or course fee; (ii) Examination / library /laboratory fee; (iii) Caution money deposit; (iv) Thepurchase of books, equipment and instruments; and (v)Any other reasonable expenditure found necessary forcompletion of the course. This scheme will help traineesreceive loans allowing them to attend courses coveredby the National Skill Qualification Framework (NSQF)and offered by approved training partners of the NSDC,the State Skill Missions(SSM), the State SkillCorporations (SSC), ITIs, ITCs, polytechnics and soon.
3.12.5 A Credit Guarantee Fund Scheme for SkillDevelopment (CGSSD) has been launched forguaranteeing Skill Development Loans sanctioned bymember banks of the Indian Banks Association (IBA)or other banks and financial institutions, as may bedirected by the government. Further, the government,through the Department of Financial Services in theMinistry of Finance, shall establish a fund forguaranteeing loans sanctioned under the scheme. A totalcorpus of Rs. 1,000 crore with contribution of Rs. 500crore only during 2013-14 has been made by theDepartment of Financial Services to National CreditGuarantee Trustee Company Limited (NCGTC) fromits budget resources.
3.13: Systemic Reforms: Providing MobilityPathways
3.13.1 NSQF is a quality assurance framework whichorganizes qualifications according to a series of levelsof knowledge, skills and aptitude. These levels aredefined in terms of learning outcomes which the learnermust possess regardless of whether they were acquiredthrough formal, non-formal or informal learning. TheNSQF would also help shift the emphasis to outcome-based learning – both in the general and vocational space.The NSQF will also facilitate Recognition of PriorLearning (RPL), which is the process of recognizingprevious learning, often experiential, towards gaining aqualification. Additionally, it would help align Indian and
international qualifications. The Government approvedthe NSQF in December, 2013. So far 1911 Qualificationshave been aligned with NSQF out of which 1463 are fromSector Skill Councils, 141 are from Directorate General ofTraining (DGT) and 300 are from various Central Ministriesand 7 from State Governments.
3.13.2 The NSQF is anchored in the National SkillDevelopment Agency (NSDA) and it would beimplemented through the National Skills QualificationCommittee (NSQC). The major functions of the NSQCwould be: (i) Approve and notify the NationalOccupational Standards (NOSs) and the qualificationpacks prepared by the Sector Skills Councils, includingjob roles that exist across various sectors. (ii) Approvethe accreditation norms developed by the concernedSector Skills Councils for training providers in the sector.
3.13.3 The introduction of the NSQF is a major systemicreform aimed at improving the quality and outcome oftraining. The NSQF provides for a five-yearimplementation schedule. After the third anniversary(end-2016) of the notification of the NSQF, (i)Government funding would not be available for anytraining, educational programme or course which is notNSQF-compliant and (ii) All Government-funded trainingand educational institutions shall define eligibility criteriafor admission to various courses in terms of NSQFlevels. After the fifth anniversary (end-2018) of thenotification of the NSQF, it shall be mandatory for alltraining, educational programmes or courses to beNSQF-compliant. Subsequently, all training andeducational institutions shall define eligibility criteria foradmission to various courses in terms of NSQF levels.
3.14: Improve Quality & Quantity: Trainingof Trainers
3.14.1 The Ministry of Skill Development &Entrepreneurship* operates 21 institutions directlywherein Craftsman Instructor Training Scheme (CITS)courses are run. However, the combined trainingcapacity of these institutes is about 3,600 trainers per
(Note* Many of the reforms were initiated by the Ministry of Labour & Employment from where the Training Vertical and ApprenticeshipTraining Vertical was transferred to Ministry of Skill Development & Entrepreneurship in April 2015).
61EMPLOYMENT AND SKILL DEVELOPMENT
annum. In March 2014, this scheme was revamped as“Up-gradation of Model Industrial Training Institutes toAdvanced Training Institutes” to create a pool of trainedinstructors for training of craftsmen as per the needs ofindustry and for improving the delivery of qualityvocational training. Four ATIs would train a minimumof 800 trainers per year on a two-shift basis. TheseATIs are located at Haldwani (Uttarakhand), Calicut(Kerala), Jodhpur (Rajasthan) and Chaudwar (Odisha).Another scheme “Setting up of additional RegionalVocational Training Institutes (RVTIs) for women” instates with no existing RVTIs is also approved, whereineight new RVTIs would be set up with an annual trainingcapacity of 3,840 women.
3.14.2 The Ministry of Skill Development &Entrepreneurship has initiated several measures duringthe Twelfth Plan to improve the quality and outcome oftraining. These include: introducing a semester systemof training in ITIs; making it mandatory for ITIs to re-affiliate after every five years; and allowing ITIs andindustry to enter into flexi-MoUs to redesign courses tosuit local industry requirements. Several MoUs havealready been signed with Maruti Suzuki, TATA Motors,Flipkart, Raymonds and so on.
3.15: Promoting Public-Private Partnershipsin Skills
3.15.1 The Ministry of Skill Development andEntrepreneurship is in the process of setting up Multi-Skill Institutes (MSIs) through Public-Private Partnership(PPP) mode. The Ministry is actively exploring newmodels for setting up green-field institutions in the skillsspace and envisions the MSIs as pioneering nationalinstitutes for reforming the skill training system in thecountry. Elements for linking the MSIs with the ITIframework are also being explored.
3.15.2 In order to enhance private sector participationin skilling, the National Skill Development Corporationhas been working to enhance the capacity of privatetraining providers through the provision of loan, grantand equity funding. The NSDC has developed a widenetwork for skilling, with 207 NSDC-approved private
training partners and 2,904 operational NSDC partnercentres – including 676 mobile centres – providingcoverage across 28 States and 5 UTs in a total of 471districts across India.
3.16: Bridging the Demand-Supply Gap
3.16.1 The Ministry of Labour & Employment had takenseveral new initiatives during 2014 to increase industryparticipation and thereby improve the quality of training.The Ministry had constituted Mentor Councils (MCs)to revamp courses under the National Council ofVocational Training (NCVT) in 25 sectors. The MentorCouncils have representatives from thought leadersamong various stakeholders: one of the top ten industriesin the sector; innovative entrepreneurs who have provedto be game-changers; academic/professional institutions;champion ITIs for each of the sectors; and experts indelivering education and training through modernmethods, like through use of IT, distance education andso on. The Mentor Councils are mandated to worktowards revamping and suggesting new courses,improving assessment systems and so on for subjectsunder the purview of the NCVT. Eleven priority sectorsincluding construction, IT & ITES, textiles, tourism &hospitality, beauty & wellness, and automobiles havebeen selected to start the process.
3.16.2 The Government has also approved a schemetitled “Upgradation of ITIs into Model ITIs” involvingsetting up of a model ITI in every State to set abenchmark for quality vocational training and to establishdemand centres for industries.
3.16.3 Sector Skill Councils are autonomous industry-led bodies responsible for the creation of industry-ledstandards for skill training – the National OccupationalStandards (NOS) and Qualification Pack (QP). NOSsdescribe best practices by bringing together performancecriteria, knowledge and skills pertaining to a job role. Aset of NOSs related to a specific job role is called aQualification Pack (QP). QPs drive the process of skilltraining. On the basis of the QPs and NOSs, trainingneeds are analysed, which leads to curriculumdevelopment. Once the curriculum is developed, training
62 APPRAISAL DOCUMENT OF TWELFTH FIVE YEAR PLAN
is conducted – followed by the assessment andcertification of the students. As on 31st March, 2015,across 28 Sectors, standards for 1,319 job roles peggedat NSQF levels 1 to 8 have been defined by the SectorSkill Councils. Fourteen SSCs have covered thedevelopment of 80 per cent of entry-level workforceQPs. Till date, the NSDC Board has approved proposalsfor 37 Sector Skill Councils. There are approximately450 corporate representatives in the governing councilsof these SSCs.
3.17: Skilling the Informal Sector
3.17.1 The Skill Development Initiative Scheme is basedon modular employable skills – providing the minimumskill set sufficient for gainful employment to school-leavers, existing workers, ITI graduates and so on. Beingimplemented since 2007-08, the scheme provides forassessment and testing of such skills as are acquiredexperientially. Similarly, there are schemes which arespecifically targeted at the poor and rural populationbelow the poverty line – such as the Deen DayalUpadhyaya Grameen Kaushal Yojana. Meanwhile, theNational Urban Livelihood Mission caters to the urbanpoor.
3.17.2 The NSDA, along with the National Institute ofOpen Schooling (NIOS), organized a National Workshopon “Strategy Planning for Implementing RPL forInformal Sector Workers” in April, 2014. An importantoutcome of the workshop was the selection of six SectorSkill Councils for pilot studies – agriculture, capitalgoods, construction, gems & jewellery, healthcare anddomestic work. RPL processes can identify the skillsthey have and the gaps in their skill sets; and it can givethem formal recognition of the former which they canuse to access further training. The NSDA is engaged incertain pilot studies for RPL in sectors like agriculture,domestic work, gems & jewellery and healthcare, whilea similar study on the construction sector is beingmonitored by the Ministry of Labour & Employment.The findings of these pilot studies will improve the policyand programmes meant for informal sector skilling andthe recognition of prior learning. The Ministry of Labour
& Employment has started the RPL Scheme forconstruction sector workers to receive a 15-day gaptraining at site for an National Council for VocationalTraining (NCVT) certificate. The scheme will be fundedfrom cess funds collected from construction projects.
3.18: Integration, Outcomes and Monitoring
3.18.1 The Labour Market Information System (LMIS)is an integrated database which contains socio-economicdata in modules on (i) supply-side labour force statistics(ii) the demand for skilled and unskilled labour (iii) markettrends like wage structures and distribution, economicgrowth trends across sectors, focus areas for skilledmanpower, occupational shortages etc. The LMIS isintended to be used as a business intelligence tool togenerate key analysis and reports which will determinepolicy interventions by different government stakeholdersand the industry at large. The LMIS is being developedin a modular manner, with the various modules beingcompiled through different sources.
3.18.2 The success of the LMIS depends on theinstitutional structure that is put in place to assimilatereal-time information. At the very least, linkages shouldbe established between the various governmentdepartments responsible for various policies affectingthe labour market on the one hand, and statistical agenciesand departments collecting employment-relatedinformation on the other. A systematic analysis ofinstitutional structures that aim to collect and analyzelabour market information could provide valuable insightson how an efficient and effective information systemneeds to be sustained. The analysis should focus on thedivision of responsibilities and the degree of autonomyof various institutions, the involvement of users, linkageswith the broader economic environment, and so on.
3.18.3 The data on the National Labour MarketInformation System(LMIS) is displayed in the form of10 National Repositories namely Trainers, TrainingCenters, Training Providers, Assessors, AssessmentAgencies, Employers, Trained Candidates, Courses andProspective Candidates each contributing to build aholistic picture of the skill development ecosystem inthe country. As on date, 65 lakh trained candidate data
63EMPLOYMENT AND SKILL DEVELOPMENT
from 4 different Central Ministries are reflected on theLMIS which includes 7 major central skill developmentschemes.
3.18.4 NSDA has developed a roadmap for integratingall remaining data sources including States, CentralMinistries and other Agencies working in the skilldevelopment space. The first step in this direction is toundertake a scoping study of all skill developmentManagement Information system (MIS) systems in thecountry. Following this study, NSDA will develop anaction plan for state integration and roll out which willinclude strengthening of state and institutional MISsystems in a systematic phase wise approach.
3.18.5 The employment linkage on the LMIS has beenfacilitated through integration with the National CareerServices Portal maintained by the Ministry of Labourand Employment. Through this integration, candidatestrained and certified through Government Schemes andprogrammes will reflect as potential job seekers on theNational Career Service (NCS) portal. National SkillDevelopment Agency (NSDA) will also be signing MoUswith all major employment agencies and job portals forsharing of candidate data available on the National LMIS.This will ensure that candidates have multiple avenuesfacilitating employment linkages through the system.
3.18.6 The LMIS will make citizen services accessibleover the Internet, through mobile phones, kiosks, callcentres as well as through personal computers, settingforward a vision for electronic service delivery that doesnot do away with the need for personal contact, butrather supports better management with the infusion oftechnology. The system provides a consolidated andunified view of various stakeholders at any given pointof time and empowers the Government and agencies totake informed decisions by providing intelligent andinsightful reports, as required.
3.19: Employment Exchanges and StateMissions:
3.19.1 The Ministry of Labour & Employment isimplementing the National Career Service Project(NCSP) as a mission-mode project to transformemployment exchanges into “career centres” that provide
a variety of employment-related assistance, whether onskill development or on apprenticeship. The NationalCareer Service (NCS) portal is supported by a call centreand a helpdesk. There is also a network of deliverychannels, including employment exchanges, vocationalrehabilitation centres, coaching-cum-guidance centres,and so on. In addition, 100 Model Career Centres (MCCs)are proposed to be established during the Twelfth Plan.Approvals for 100 MCCs have been accorded till March,2016, and these are being operationalized. It is proposedto inter-link State Employment Exchanges with theNational Career Service platform. where part fundingfor IT upgradation, minor refurbishing of the employmentexchanges will be provided along with funds fororganizing job fairs. Funds have been released to 18States under this component.
3.19.2 The NCS Portal differs from the LMIS. TheNational Career Service portal caters to job-marketentrants looking for jobs, and to industry on the lookoutfor new employees. The LMIS, on the other hand,assimilates data, researches and analyses it, and theinformation is used for making larger policy decisions.Data assimilation from different stakeholders consistingof the government, public and private sources for boththe LMIS and NCS calls for legislative or policy backing.
3.19.3 Most State Governments have set up their StateSkill Development Missions either under the respectiveChief Minister or Chief Secretary. However, only a fewStates have been able to harmonize the skilling effortsacross various line departments. Of special mention isthe Uttar Pradesh Skill Development Mission, which hasconverged schemes and resources with a top-up fundingfacility to cover gaps in Central funding; and theRajasthan Skill & Livelihood Development Corporation,with its “skill icon of the month” award to encourageenrolment and performance of candidates.
3.20: Other Initiatives on Skill Development
3.20.1 Under Section 135 of the new Companies Act,2013, companies with an annual turnover of Rs. 1,000crore and more, or a net worth of Rs. 500 crore andmore, or a net profit of Rs. five crore or more duringany financial year, must spend at least two per cent of
64 APPRAISAL DOCUMENT OF TWELFTH FIVE YEAR PLAN
their average net profits made during the threeimmediately preceding financial years on activities relatedto corporate social responsibility or report the reasonthey did not. The CSR activities as listed in ScheduleVII include employment-enhancing vocational skills.
3.20.2 Ten per cent of Special Central Assistance (SCA)to the Scheduled Caste Sub Plan, 10 per cent SpecialCentral Assistance to the Scheduled Tribes Sub Plan, 5per cent of the Border Area Development Programme,20 per cent of the funds under the Building and OtherConstruction Workers Welfare Cess, and 10 per cent ofthe allocation under the Integrated Action Plan for LWEdistricts have been earmarked for skill development.
3.20.3 A new National Policy for Skill Developmentand Entrepreneurship, 2015 has been made operationalsince July 2015. The policy lays stress on achievingSkill India target by focusing on scale, speed and standardfor sustainable livelihoods.
3.20.4 The Ministry of Skill Development andEntrepreneurship has initiated the process ofestablishment of National Skills Universities. Theseuniversities are to provide nationally-recognizeduniversity degrees and certification for vocational skills;design and conduct assessment procedures; designvocational curriculums (with SSCs) customized toproviding horizontal academic mobility; offer facultytraining courses; and conduct research in the skillslandscape.
3.20.5 The Human Resource and Skill RequirementReports were launched by the National Skill DevelopmentCorporation (NSDC) and Ministry of Skill Developmentand Entrepreneurship in April, 2015. The objective ofthese skill gap reports is to understand the sectoral andgeographical spread of incremental skill requirementsacross 24 high-priority sectors between 2013-17 and2017-22. On the basis of these studies, it is estimatedthat an incremental demand of 109.7 million skilled peoplewould be required by 2022 across these 24 sectors.The top 10 sectors including automobiles, retail,
handloom, leather, and so on account for about 80 percent of the requirement.
3.20.6 To promote entrepreneurship, in January 2016,the Startup India scheme was launched under which adedicated Start-up fund worth Rs. 10,000 crore wouldbe created for funding of Start-ups. The Start-ups wouldbe exempted from paying income tax on their profit forthe first three years. It was also mentioned that a simpleexit policy for Start-ups is being worked out and theGovernment is working towards fast-tracking of start-up patent applications. An eighty per cent exemption inpatent fee for start-up businesses, and a self-certificationbased compliance system for start-ups would beintroduced in respect of nine labour and environmentlaws. The Atal Innovation Mission (AIM) has also beenlaunched to serve as a platform for promotion of world-class Innovation Hubs, Grand Challenges, Startupbusinesses and other self-employment activities,particularly in technology driven areas. The AtalInnovation Mission shall have two core functions: (i)Entrepreneurship promotion through Self-Employmentand Talent Utilization (SETU), wherein innovators wouldbe supported and mentored to become successfulentrepreneurs (ii) Innovation promotion: to provide aplatform where innovative ideas are generated.
3.20.7 To promote entrepreneurship among SC/ST andwomen entrepreneurs the “Stand Up India Scheme” wasalso launched in January 2016. The Scheme is intendedto facilitate at least two such projects per bank branch,on an average one for each category of entrepreneur. Itis expected to benefit at least 2.5 lakh borrowers. TheStand Up India Scheme provides for : (i) Refinancewindow through Small Industries Development Bankof India (SIDBI) with an initial amount of Rs. 10,000crore (ii) Creation of a credit guarantee mechanismthrough the National Credit Guarantee Trustee Company(NCGTC) (iii) Handholding support for borrowers bothat the pre loan stage and during operations. This wouldinclude increasing their familiarity with factoringservices, registration with online platforms and e-market
65EMPLOYMENT AND SKILL DEVELOPMENT
places as well as sessions on best practices and problemsolving. The overall intent of the approval is to leveragethe institutional credit structure to reach out to theseunder-served sectors of the population by facilitatingbank loans repayable up to 7 years and between Rs. 10lakh to Rs. 100 lakh for greenfield enterprises in thenon-farm sector set up by such SC, ST and Womenborrowers. (iv) Margin money of the composite loanwould be up to 25 per cent. Convergence with stateschemes is expected to reduce the actual requirementof margin money for a number of borrowers. (v) Overa period of time, it is proposed that a credit history ofthe borrower be built up through Credit Bureaus.
3.20.8 The Department of Industrial Policy & Promotionhas suggested an action plan for skill development underthe ‘Make in India’ programme to meet its skill needs:
Short-term Initiatives (1 year):
i. Launch a national campaign to make skillsaspirational, and mission-mode projects forskilling and entrepreneurship in focused‘Make in India’ sectors.
ii. Partnership with 100 corporate groups tocreate sustainable skill development models;continuous workplace training(apprenticeship); and at least 25 per cent ofCSR funding earmarked for skilldevelopment.
iii. Initiate action to set up 2,500 multi-skillinginstitutions in PPP mode (new-look, new-feel institutions with strong industrylinkages) and Skills Universities. Based onskill mapping, use existing infrastructure likeschools, colleges, ITIs, post offices,railways and digital broadband to set upskilling centres. Available human resourcesfrom defence and paramilitary forces canhelp ramp up skilling capacity significantly.
iv. Strategically partner with mega programmeslike Swachh Bharat Abhiyan, Digital India,National Solar Mission.
v. Support states in their attempt to build aninstitutional base, through funding andtechnical support.
Medium-term Initiatives (3 years):
vi. Integrating skilling in schools (Class 9+) andhigher education. (Target: 10 per centenrolment in vocational courses; one-thirdof schools to offer vocational courses; halfof the new capacity in higher education tobe in skill-oriented programs.)
vii. The complete alignment of skill standardsacross multiple assessing and certifyingbodies in the country to NSQF, to reach thegoal of ‘One India, One Skilling Standard’;the amendment of recruitment rules forgovernment employment as per NSQFqualifications.
viii. A special cell to meet the skilling needs andstandards of international manufacturingcompanies, and a coordinated action planto harness ‘overseas employment’opportunities.
ix. Creating one IT-enabled platform, whichintegrates all relevant skilling stakeholdersand initiatives. The platform should enablejob exchange, monitoring, delivery,assessment, certification and governance.
x. Create a large pipeline of instructors for skilldevelopment with career progressionpathways through new high-qualityinstitutions, linking to demand generation inkey focus sectors.
3.21: The Way Forward:
3.21.1 The skill development initiative, started in 2009with the objective of skilling 500 million by 2022, hastaken off in a big way with the launch of National SkillDevelopment Mission. State Governments – by and large– have adopted the skill development mandate as a route
66 APPRAISAL DOCUMENT OF TWELFTH FIVE YEAR PLAN
to decrease the level of unemployment prevailingespecially among the youth. However, there is a need tostrengthen the State Skill Development Missions(SSDMs) as the one-point nodal centre for convergenceof skill development schemes and resources. TheSSDMs should be able to prioritize skill developmentschemes taking into account the State’s particular needsand channelize the resources accordingly. In this regardit may be mentioned that NITI Aayog had constituted aSub-Group of Chief Ministers on Skill Development tolook into various facets of skill development.The Sub-Group has submitted its report.The keyrecommendations among others include strengtheningof SSDMs for integrated delivery at one point, incentivizeprivate sector participation, making skill aspirational,adopting strategies for improving access and outreach,improving skills relevance and quality, etc. The Reportof the Sub-Group has been placed in public domain andimplementation on recommendations has commenced.
3.21.2 To scale up, with speed, standard andsustainability the skill development mandate calls forfinancial resources. At present, budgetary resources arethe main source of funding. Alternative sources offunding like imposing of a cess for skill development,the use of funds collected under the education cess, thebuilding & construction workers’ cess, or MPLADS/MLA Funds are other options that need to be explored.
3.21.3 For skill development to be sustainable, theeconomy must grow and jobs must be created. Thenew initiatives announced under the ‘Make in India’programme, like permitting 100 per cent FDI inconstruction sector through the automatic route; theStartup India mission; the Digital India; the AtalInnovation Mission; opening up of FDI in rail sector;increasing the ease of doing business; creation ofindustrial corridors; the Smart Cities Mission; the creationof sanitation facilities under the Swachh Bharat Abhiyan,and so on are expected to create the right ambience foran industrial revival. The revival in turn would helpachieve the Twelfth Plan vision of creating 100 millionmanufacturing sector jobs by 2022.
3.21.4 To facilitate this, the initiatives announced underShramev Jayate for increasing the ease of doing business,the amendments to the Apprentices Act, 1961, the SkillIndia initiative and so on need to be replicated by StateGovernments in order to facilitate the creation of jobs inthe economy and to reap the benefit of the demographicdividend. There is a strong linkage between the ‘Make inIndia’ project and the ‘Skill India’ mission. The statesneed to identify sectors with comparative advantage formanufacturing growth and focus on skill training in thoseareas – including the sectors requiring skilled manpoweras brought out by the skill gap reports of the NSDC andthe Ministry of Skill Development & Entrepreneurship.Central Ministries should coordinate with the states inassessing the physical progress of the various skilldevelopment programmes launched during the TwelfthPlan.
3.21.5 The recent initiatives brought about to enhanceaccess, equality, quality and innovation in the area ofskills and vocational education, and the new institutionalframework defined by the government, shouldstrengthen the Skill India mandate and involve the CentralMinistries and State Governments in taking forward thisagenda. Skilling is the joint responsibility of both theprivate and public sector and each should leverage itsexpertise to come together and create a holistic skillenvironment for the country’s youth.
3.22: Learning from the Appraisal
3.22.1 Efforts should be made to strengthen the StateSkill Development Missions for improving the deliveryframework, for better learning outcomes and also toensure an integration of the skill development schemesrouted through different Central Ministries towards thetarget group.
3.22.2 There is need to broad base the availability offinancial resources beyond the gross budgetary supportthough involvement of private sector, civil society andlocal bodies in designing, implementation and monitoringof skill development schemes.
67EMPLOYMENT AND SKILL DEVELOPMENT
3.22.3 Skill development should form a component ofall schemes of the Ministries so as to address the skilltargets that would be required under the signatureschemes of the government like Make in India, StartupIndia, Standup India, Digital India, Swatch Bharat, Smartcities, rural road connectivity etc. Skill developmentunder Skill India needs to be mainstreamed by makingskilling and placement outcomes a monitorable target ofall developmental schemes implemented by theGovernment of India. In the absence of a skilled labourforce India would not be able to tap jobs that wouldarise in the non-farm sector as technology driven jobsare the requirement of the day.
3.22.4 Decent job creation with coverage of socialsecurity net for employees/workers through legislativeor schematic intervention should be made the underlyingguideline for jobs created through both the public andprivate sector. This would to some extent narrow downthe aspirational gap among the educated unemployedyouth in pursuing public sector jobs which are fewer innumber.
3.22.5 Under the Shram Suvidha Portal, participationby the State governments should be made mandatoryso that the benefits of ease of doing business can begained by employers irrespective of his location.
68 APPRAISAL DOCUMENT OF TWELFTH FIVE YEAR PLAN
4Governance
4.1 Introduction
4.1.1 The Twelfth Five Year Plan recognizes goodgovernance as critical to translating Plan outlays intosignificant outcomes, through efficient resourceutilisation and public service delivery. In this themeChapter, a multi-pronged approach has beenrecommended covering systemic improvements toenhance the effectiveness of public expenditure, toimprove customer satisfaction from the delivery of publicservices, and to tackle the problem of corruption. Eachapproach translates into several action areas which arebriefly summarized as under:
4.1.2 Improving the effectiveness of publicexpenditure: The recommended action areas include:strengthening local institutions; encouraging theparticipation of people in the development process; anenhanced role for voluntary organisations; restructuringCentrally Sponsored Schemes (CSSs) to incorporatebetter implementation mechanisms; strengtheningcapacity for implementation; building in betterconvergence; and improving monitoring and evaluation.The Second Administrative Reforms Commission (ARC)had recommended the “Agency” system ofimplementation, wherein Agencies are seen asaccountable organisations with a defined implementationmandate, mission, budget, performance standards andtargets. The tools recommended for effectiveimplementation are, first, quantifiable measurement ofoutcomes and, second, participative programmedevelopment. The quantification of outcomes and visible
1Para 10.52 of Chapter 10 on ‘Governance’, Twelfth Five Year Plan Document.
results are important for credibility of public expenditure.The Twelfth Plan also identifies1 inadequate consensusamong stake-holders for policy changes and poorcoordination amongst agencies and organisations assome of the reasons for poor implementation. For this,the Plan recommends the development of backbonecapabilities to strengthen multi-stakeholder consultationand for building consensus in policy and implementationprocesses. Building consensus and disseminating bestpractices is seen as key for successful public expenditure.
4.1.3 Improving public service delivery: The thrustareas include a sharper focus on e-governance platformsfor the delivery of various public services like rationcards, licences, passports, etc., and the expansion ofbiometric-based unique identity numbers for residentsof the country in tandem with the National PopulationRegister (NPR). Transparency is to be achieved throughmulti-media and enhanced awareness of governmentprogrammes and schemes. For accountability,continuation of the Result Framework Documents(RFD) has been recommended, which seeks toobjectively grade performance of Ministries/Departments on pre-specified outcomes and objectives.The RFD targets need to be designed to keep in mindthe citizens’ and stakeholders’ perspectives.
4.1.4 Combating Corruption:Transparency in publicexpenditure, procurements through technology basede-tendering, and Civil Service reforms in line with therecommendations of the 2nd ARC are some of the areasthat require immediate attention.
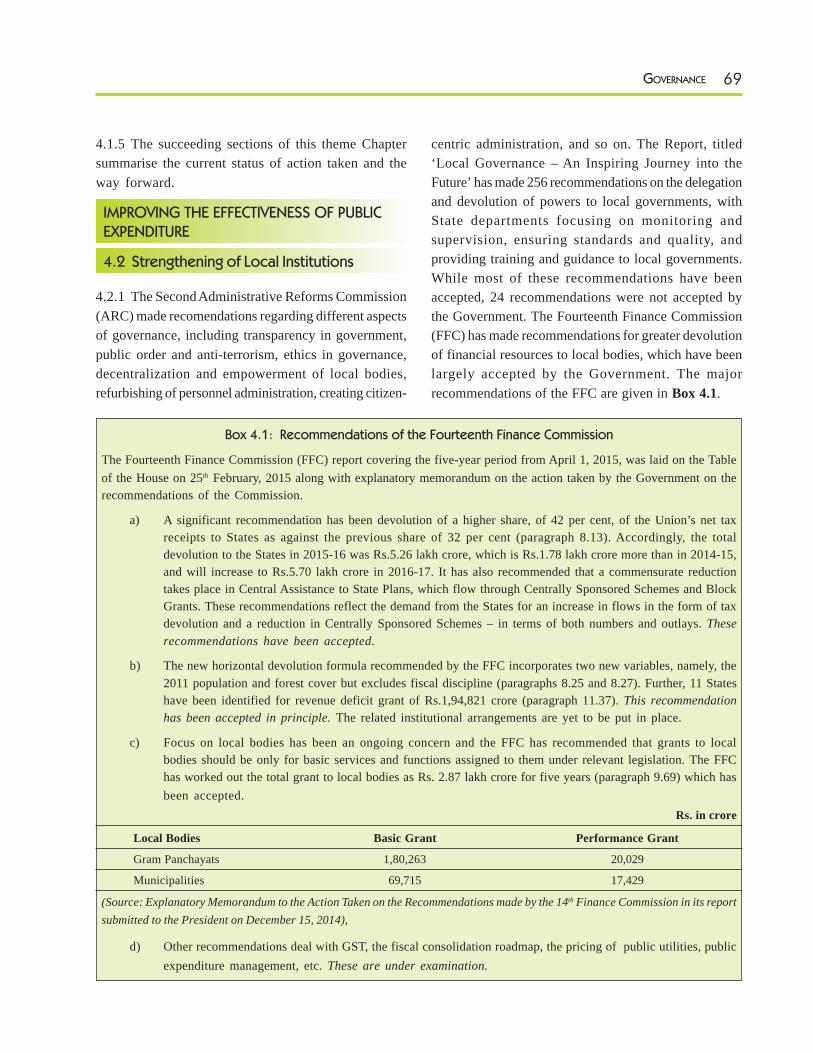
69GOVERNANCE
4.1.5 The succeeding sections of this theme Chaptersummarise the current status of action taken and theway forward.
IMPROVING THE EFFECTIVENESS OF PUBLICEXPENDITURE
4.2 Strengthening of Local Institutions
4.2.1 The Second Administrative Reforms Commission(ARC) made recomendations regarding different aspectsof governance, including transparency in government,public order and anti-terrorism, ethics in governance,decentralization and empowerment of local bodies,refurbishing of personnel administration, creating citizen-
Box 4.1: Recommendations of the Fourteenth Finance Commission
The Fourteenth Finance Commission (FFC) report covering the five-year period from April 1, 2015, was laid on the Tableof the House on 25th February, 2015 along with explanatory memorandum on the action taken by the Government on therecommendations of the Commission.
a) A significant recommendation has been devolution of a higher share, of 42 per cent, of the Union’s net taxreceipts to States as against the previous share of 32 per cent (paragraph 8.13). Accordingly, the totaldevolution to the States in 2015-16 was Rs.5.26 lakh crore, which is Rs.1.78 lakh crore more than in 2014-15,and will increase to Rs.5.70 lakh crore in 2016-17. It has also recommended that a commensurate reductiontakes place in Central Assistance to State Plans, which flow through Centrally Sponsored Schemes and BlockGrants. These recommendations reflect the demand from the States for an increase in flows in the form of taxdevolution and a reduction in Centrally Sponsored Schemes – in terms of both numbers and outlays. Theserecommendations have been accepted.
b) The new horizontal devolution formula recommended by the FFC incorporates two new variables, namely, the2011 population and forest cover but excludes fiscal discipline (paragraphs 8.25 and 8.27). Further, 11 Stateshave been identified for revenue deficit grant of Rs.1,94,821 crore (paragraph 11.37). This recommendationhas been accepted in principle. The related institutional arrangements are yet to be put in place.
c) Focus on local bodies has been an ongoing concern and the FFC has recommended that grants to localbodies should be only for basic services and functions assigned to them under relevant legislation. The FFChas worked out the total grant to local bodies as Rs. 2.87 lakh crore for five years (paragraph 9.69) which hasbeen accepted.
Rs. in crore
Local Bodies Basic Grant Performance Grant
Gram Panchayats 1,80,263 20,029
Municipalities 69,715 17,429
(Source: Explanatory Memorandum to the Action Taken on the Recommendations made by the 14th Finance Commission in its reportsubmitted to the President on December 15, 2014),
d) Other recommendations deal with GST, the fiscal consolidation roadmap, the pricing of public utilities, publicexpenditure management, etc. These are under examination.
centric administration, and so on. The Report, titled‘Local Governance – An Inspiring Journey into theFuture’ has made 256 recommendations on the delegationand devolution of powers to local governments, withState departments focusing on monitoring andsupervision, ensuring standards and quality, andproviding training and guidance to local governments.While most of these recommendations have beenaccepted, 24 recommendations were not accepted bythe Government. The Fourteenth Finance Commission(FFC) has made recommendations for greater devolutionof financial resources to local bodies, which have beenlargely accepted by the Government. The majorrecommendations of the FFC are given in Box 4.1.
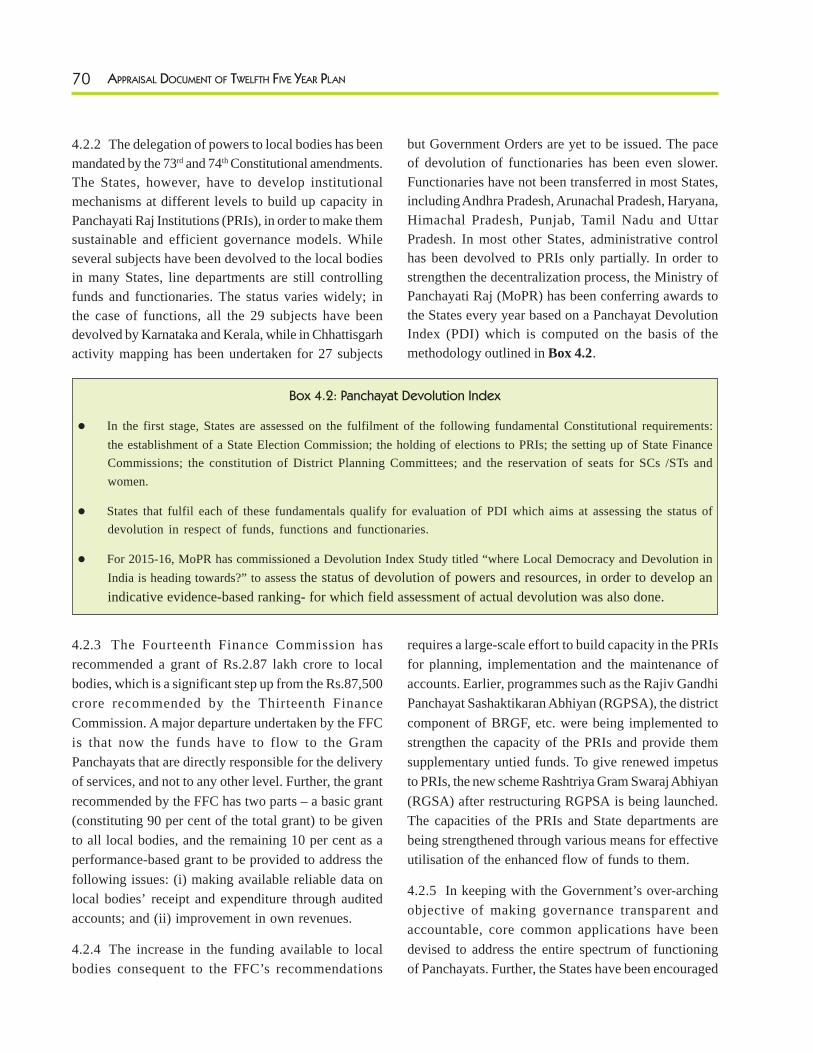
70 APPRAISAL DOCUMENT OF TWELFTH FIVE YEAR PLAN
4.2.2 The delegation of powers to local bodies has beenmandated by the 73rd and 74th Constitutional amendments.The States, however, have to develop institutionalmechanisms at different levels to build up capacity inPanchayati Raj Institutions (PRIs), in order to make themsustainable and efficient governance models. Whileseveral subjects have been devolved to the local bodiesin many States, line departments are still controllingfunds and functionaries. The status varies widely; inthe case of functions, all the 29 subjects have beendevolved by Karnataka and Kerala, while in Chhattisgarhactivity mapping has been undertaken for 27 subjects
Box 4.2: Panchayat Devolution Index
In the first stage, States are assessed on the fulfilment of the following fundamental Constitutional requirements:the establishment of a State Election Commission; the holding of elections to PRIs; the setting up of State FinanceCommissions; the constitution of District Planning Committees; and the reservation of seats for SCs /STs andwomen.
States that fulfil each of these fundamentals qualify for evaluation of PDI which aims at assessing the status ofdevolution in respect of funds, functions and functionaries.
For 2015-16, MoPR has commissioned a Devolution Index Study titled “where Local Democracy and Devolution inIndia is heading towards?” to assess the status of devolution of powers and resources, in order to develop anindicative evidence-based ranking- for which field assessment of actual devolution was also done.
requires a large-scale effort to build capacity in the PRIsfor planning, implementation and the maintenance ofaccounts. Earlier, programmes such as the Rajiv GandhiPanchayat Sashaktikaran Abhiyan (RGPSA), the districtcomponent of BRGF, etc. were being implemented tostrengthen the capacity of the PRIs and provide themsupplementary untied funds. To give renewed impetusto PRIs, the new scheme Rashtriya Gram Swaraj Abhiyan(RGSA) after restructuring RGPSA is being launched.The capacities of the PRIs and State departments arebeing strengthened through various means for effectiveutilisation of the enhanced flow of funds to them.
4.2.5 In keeping with the Government’s over-archingobjective of making governance transparent andaccountable, core common applications have beendevised to address the entire spectrum of functioningof Panchayats. Further, the States have been encouraged
but Government Orders are yet to be issued. The paceof devolution of functionaries has been even slower.Functionaries have not been transferred in most States,including Andhra Pradesh, Arunachal Pradesh, Haryana,Himachal Pradesh, Punjab, Tamil Nadu and UttarPradesh. In most other States, administrative controlhas been devolved to PRIs only partially. In order tostrengthen the decentralization process, the Ministry ofPanchayati Raj (MoPR) has been conferring awards tothe States every year based on a Panchayat DevolutionIndex (PDI) which is computed on the basis of themethodology outlined in Box 4.2.
4.2.3 The Fourteenth Finance Commission hasrecommended a grant of Rs.2.87 lakh crore to localbodies, which is a significant step up from the Rs.87,500crore recommended by the Thirteenth FinanceCommission. A major departure undertaken by the FFCis that now the funds have to flow to the GramPanchayats that are directly responsible for the deliveryof services, and not to any other level. Further, the grantrecommended by the FFC has two parts – a basic grant(constituting 90 per cent of the total grant) to be givento all local bodies, and the remaining 10 per cent as aperformance-based grant to be provided to address thefollowing issues: (i) making available reliable data onlocal bodies’ receipt and expenditure through auditedaccounts; and (ii) improvement in own revenues.
4.2.4 The increase in the funding available to localbodies consequent to the FFC’s recommendations
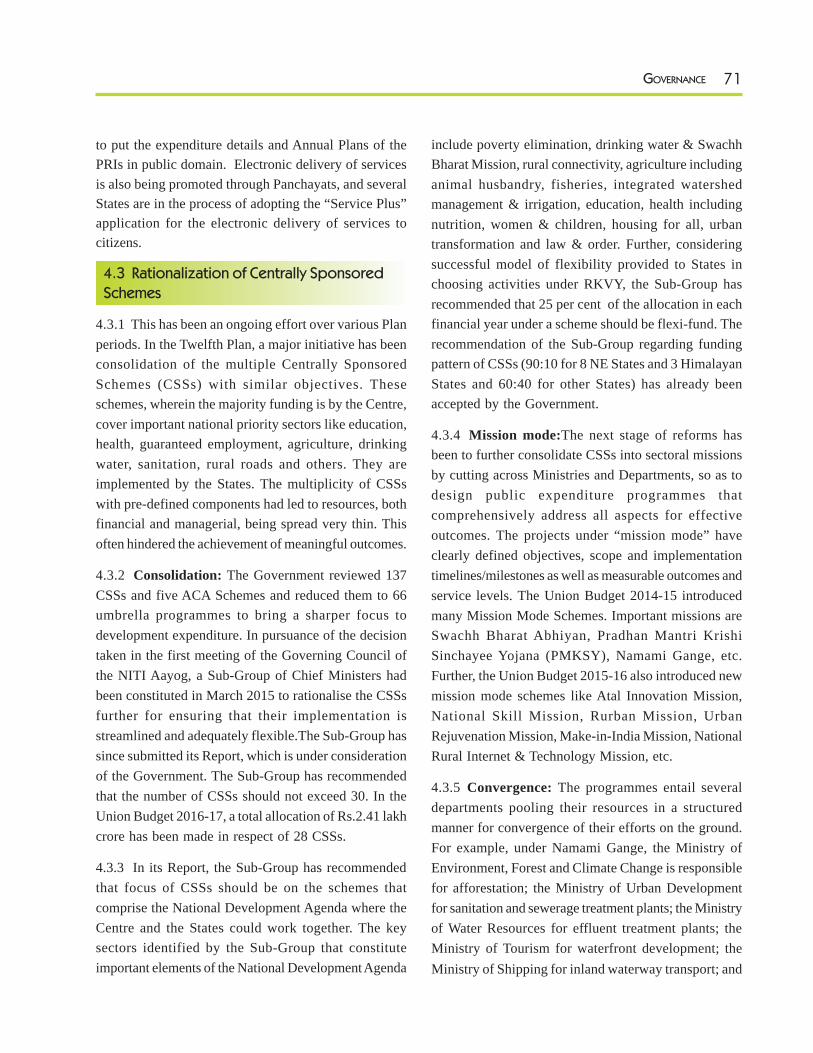
71GOVERNANCE
to put the expenditure details and Annual Plans of thePRIs in public domain. Electronic delivery of servicesis also being promoted through Panchayats, and severalStates are in the process of adopting the “Service Plus”application for the electronic delivery of services tocitizens.
4.3 Rationalization of Centrally SponsoredSchemes
4.3.1 This has been an ongoing effort over various Planperiods. In the Twelfth Plan, a major initiative has beenconsolidation of the multiple Centrally SponsoredSchemes (CSSs) with similar objectives. Theseschemes, wherein the majority funding is by the Centre,cover important national priority sectors like education,health, guaranteed employment, agriculture, drinkingwater, sanitation, rural roads and others. They areimplemented by the States. The multiplicity of CSSswith pre-defined components had led to resources, bothfinancial and managerial, being spread very thin. Thisoften hindered the achievement of meaningful outcomes.
4.3.2 Consolidation: The Government reviewed 137CSSs and five ACA Schemes and reduced them to 66umbrella programmes to bring a sharper focus todevelopment expenditure. In pursuance of the decisiontaken in the first meeting of the Governing Council ofthe NITI Aayog, a Sub-Group of Chief Ministers hadbeen constituted in March 2015 to rationalise the CSSsfurther for ensuring that their implementation isstreamlined and adequately flexible.The Sub-Group hassince submitted its Report, which is under considerationof the Government. The Sub-Group has recommendedthat the number of CSSs should not exceed 30. In theUnion Budget 2016-17, a total allocation of Rs.2.41 lakhcrore has been made in respect of 28 CSSs.
4.3.3 In its Report, the Sub-Group has recommendedthat focus of CSSs should be on the schemes thatcomprise the National Development Agenda where theCentre and the States could work together. The keysectors identified by the Sub-Group that constituteimportant elements of the National Development Agenda
include poverty elimination, drinking water & SwachhBharat Mission, rural connectivity, agriculture includinganimal husbandry, fisheries, integrated watershedmanagement & irrigation, education, health includingnutrition, women & children, housing for all, urbantransformation and law & order. Further, consideringsuccessful model of flexibility provided to States inchoosing activities under RKVY, the Sub-Group hasrecommended that 25 per cent of the allocation in eachfinancial year under a scheme should be flexi-fund. Therecommendation of the Sub-Group regarding fundingpattern of CSSs (90:10 for 8 NE States and 3 HimalayanStates and 60:40 for other States) has already beenaccepted by the Government.
4.3.4 Mission mode:The next stage of reforms hasbeen to further consolidate CSSs into sectoral missionsby cutting across Ministries and Departments, so as todesign public expenditure programmes thatcomprehensively address all aspects for effectiveoutcomes. The projects under “mission mode” haveclearly defined objectives, scope and implementationtimelines/milestones as well as measurable outcomes andservice levels. The Union Budget 2014-15 introducedmany Mission Mode Schemes. Important missions areSwachh Bharat Abhiyan, Pradhan Mantri KrishiSinchayee Yojana (PMKSY), Namami Gange, etc.Further, the Union Budget 2015-16 also introduced newmission mode schemes like Atal Innovation Mission,National Skill Mission, Rurban Mission, UrbanRejuvenation Mission, Make-in-India Mission, NationalRural Internet & Technology Mission, etc.
4.3.5 Convergence: The programmes entail severaldepartments pooling their resources in a structuredmanner for convergence of their efforts on the ground.For example, under Namami Gange, the Ministry ofEnvironment, Forest and Climate Change is responsiblefor afforestation; the Ministry of Urban Developmentfor sanitation and sewerage treatment plants; the Ministryof Water Resources for effluent treatment plants; theMinistry of Tourism for waterfront development; theMinistry of Shipping for inland waterway transport; and
72 APPRAISAL DOCUMENT OF TWELFTH FIVE YEAR PLAN
so on. The implementation of the combined expenditurepackage is also earmarked for priority monitoring, withtimelines. Similar action is underway in other MissionMode Schemes.
4.3.6 People’s participation: Another new aspect ofthis approach is inviting people’s participation inimplementation and funding of components of schemes.In Swachh Bharat Abhiyan, citizens of the country arefully involved in spreading the mission’s message andin its implementation. Funding by corporations andindividuals is being invited to construct sanitationfacilities. Extensive use of the media is also made tospread the mission spirit. On 1st January, 2015, theNational Institution for Transforming India was set up,in order to reinforce focus on policy evaluation andfoster the spirit of cooperative federalism. The NITIAayog will serve as the platform for Centre-Statecooperation and help strengthen State Governmentcapabilities in scheme formulation, implementation andmonitoring.
4.3.7 Gender perspective in the development process:To sensitize Ministries and Departments towardsgender-based perspectives in the development process,the Annual Budget circular mandates they all separatelyreport the quantum of public expenditure earmarkedfor women in their respective budgets. The GenderBudget statement indicates the Budget’s provisions forthe schemes that are substantially meant for the benefitof women in two parts: Part A details schemes in which100 per cent provision is made for women, and Part Breflects schemes where the allocation for womenconstitutes at least 30 per cent of the provision. Allconcerned Ministries and Departments have beenadvised to formulate and implement schemes keepingin view the gender perspective, with multi-sectoralconvergence.
4.3.8 The suggested measures for efficient managementof public expenditure is summarized in Box 4.3.
Box 4.3: Efficient Management of Public Expenditure
The transfer of funds to States, along with theresponsibilities associated with a higher fundingshare in more than 20 Government Programmes, willsee the emergence of significant changes in schemedesign and the implementation mechanisms beingadopted by individual States so as to focus onoutcomes and better address State-specificrequirements.
Some States may need to strengthen their capacityfor designing, implementing and monitoring ofschemes.
The Central Government, through the NITI Aayog,may develop a resource hub on scheme templatesand best practices as a ready reference resource,meant for States seeking successful models.
Monitoring and implementation capabilities ofStates and Ministries will need to be strengthenedand the focus on outcomes tightened.
4.4 Enhanced Role for the Voluntary Sector
4.4.1 The Twelfth Plan envisages strengtheninggovernance at various levels by institutionalizingconsultative planning. Included in this institutionalizationis consultation with the voluntary sector – so thatstakeholders are better represented, and citizens andpeople’s groups can more easily access the process andentitlements that lead to empowerment. The TwelfthPlan also envisages institutionalization of the JointConsultative Group Forum in all forms of planning, asrecommended by the National Policy for the VoluntarySector. In addition, the Plan visualizes State voluntarysector processes in line with the National Policy, andemphasizes the need for funding voluntary organizationsin order to enable them to mobilize people as agents ofsocial transformation. The other major areas emphasizedin the Twelfth Plan are accreditation and certification ofvoluntary organisations and strengthening of thepartnership between the public, private and voluntarysectors.
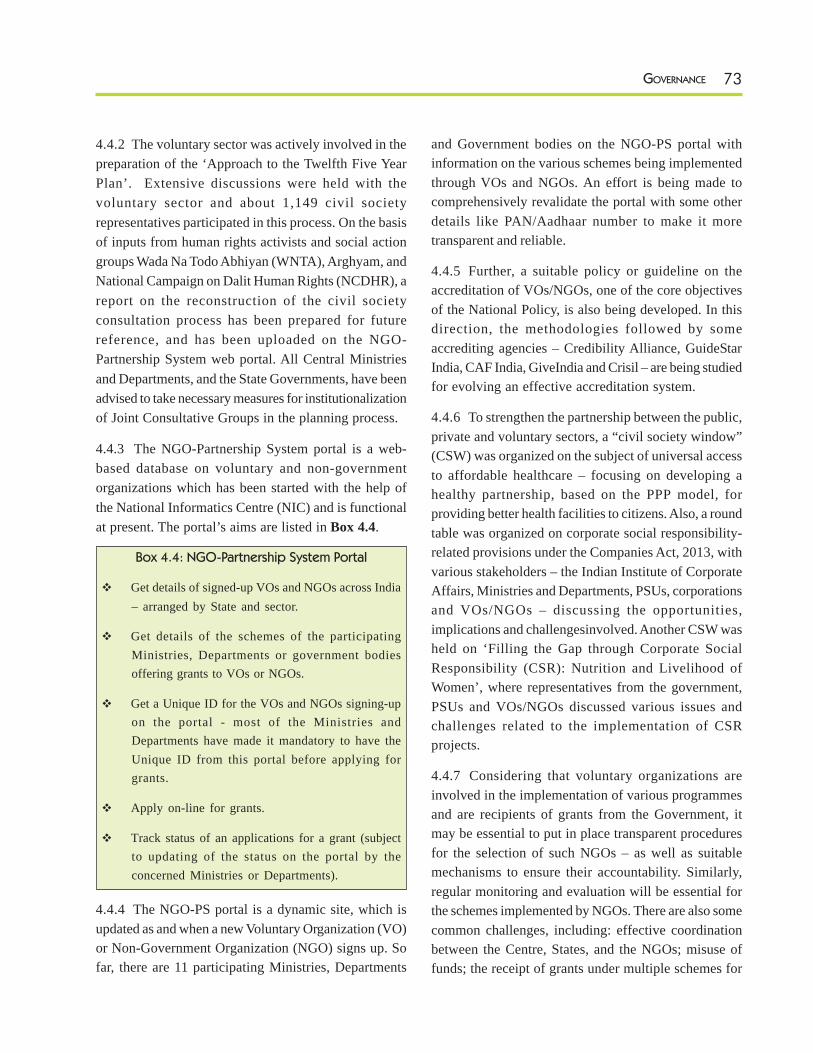
73GOVERNANCE
4.4.2 The voluntary sector was actively involved in thepreparation of the ‘Approach to the Twelfth Five YearPlan’. Extensive discussions were held with thevoluntary sector and about 1,149 civil societyrepresentatives participated in this process. On the basisof inputs from human rights activists and social actiongroups Wada Na Todo Abhiyan (WNTA), Arghyam, andNational Campaign on Dalit Human Rights (NCDHR), areport on the reconstruction of the civil societyconsultation process has been prepared for futurereference, and has been uploaded on the NGO-Partnership System web portal. All Central Ministriesand Departments, and the State Governments, have beenadvised to take necessary measures for institutionalizationof Joint Consultative Groups in the planning process.
4.4.3 The NGO-Partnership System portal is a web-based database on voluntary and non-governmentorganizations which has been started with the help ofthe National Informatics Centre (NIC) and is functionalat present. The portal’s aims are listed in Box 4.4.
Box 4.4: NGO-Partnership System Portal
Get details of signed-up VOs and NGOs across India– arranged by State and sector.
Get details of the schemes of the participatingMinistries, Departments or government bodiesoffering grants to VOs or NGOs.
Get a Unique ID for the VOs and NGOs signing-upon the portal - most of the Ministries andDepartments have made it mandatory to have theUnique ID from this portal before applying forgrants.
Apply on-line for grants.
Track status of an applications for a grant (subjectto updating of the status on the portal by theconcerned Ministries or Departments).
4.4.4 The NGO-PS portal is a dynamic site, which isupdated as and when a new Voluntary Organization (VO)or Non-Government Organization (NGO) signs up. Sofar, there are 11 participating Ministries, Departments
and Government bodies on the NGO-PS portal withinformation on the various schemes being implementedthrough VOs and NGOs. An effort is being made tocomprehensively revalidate the portal with some otherdetails like PAN/Aadhaar number to make it moretransparent and reliable.
4.4.5 Further, a suitable policy or guideline on theaccreditation of VOs/NGOs, one of the core objectivesof the National Policy, is also being developed. In thisdirection, the methodologies followed by someaccrediting agencies – Credibility Alliance, GuideStarIndia, CAF India, GiveIndia and Crisil – are being studiedfor evolving an effective accreditation system.
4.4.6 To strengthen the partnership between the public,private and voluntary sectors, a “civil society window”(CSW) was organized on the subject of universal accessto affordable healthcare – focusing on developing ahealthy partnership, based on the PPP model, forproviding better health facilities to citizens. Also, a roundtable was organized on corporate social responsibility-related provisions under the Companies Act, 2013, withvarious stakeholders – the Indian Institute of CorporateAffairs, Ministries and Departments, PSUs, corporationsand VOs/NGOs – discussing the opportunities,implications and challengesinvolved. Another CSW washeld on ‘Filling the Gap through Corporate SocialResponsibility (CSR): Nutrition and Livelihood ofWomen’, where representatives from the government,PSUs and VOs/NGOs discussed various issues andchallenges related to the implementation of CSRprojects.
4.4.7 Considering that voluntary organizations areinvolved in the implementation of various programmesand are recipients of grants from the Government, itmay be essential to put in place transparent proceduresfor the selection of such NGOs – as well as suitablemechanisms to ensure their accountability. Similarly,regular monitoring and evaluation will be essential forthe schemes implemented by NGOs. There are also somecommon challenges, including: effective coordinationbetween the Centre, States, and the NGOs; misuse offunds; the receipt of grants under multiple schemes for
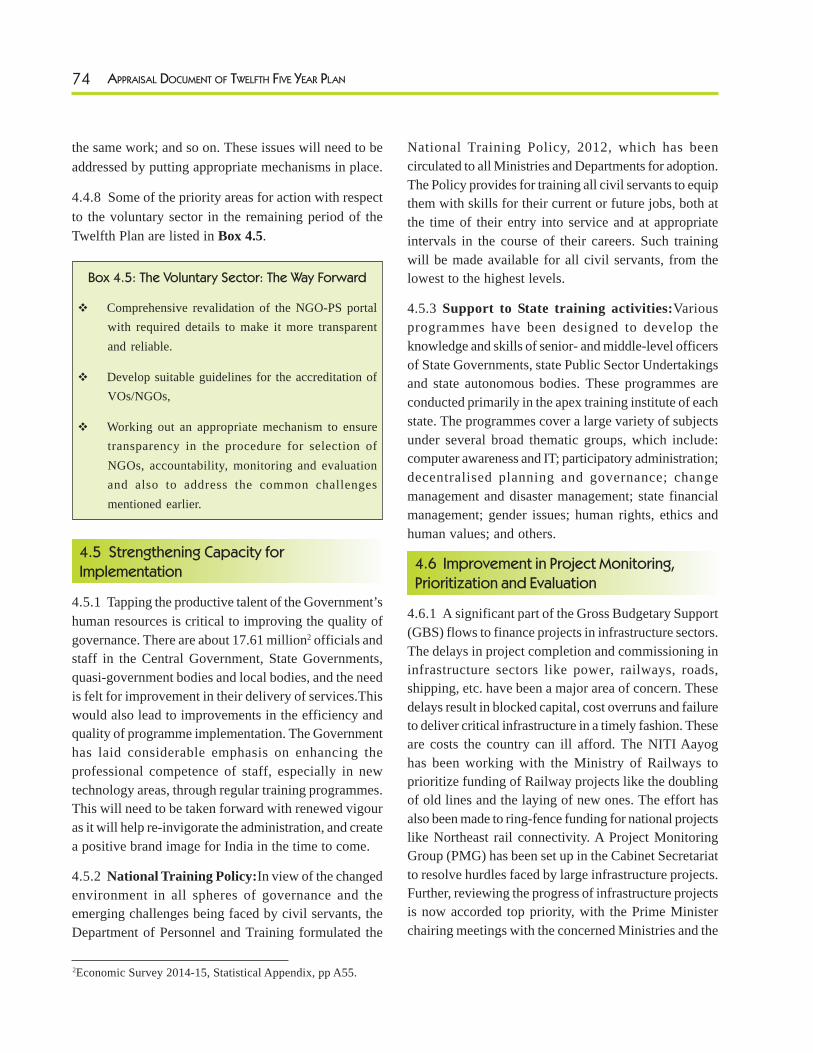
74 APPRAISAL DOCUMENT OF TWELFTH FIVE YEAR PLAN
the same work; and so on. These issues will need to beaddressed by putting appropriate mechanisms in place.
4.4.8 Some of the priority areas for action with respectto the voluntary sector in the remaining period of theTwelfth Plan are listed in Box 4.5.
Box 4.5: The Voluntary Sector: The Way Forward
Comprehensive revalidation of the NGO-PS portalwith required details to make it more transparentand reliable.
Develop suitable guidelines for the accreditation ofVOs/NGOs,
Working out an appropriate mechanism to ensuretransparency in the procedure for selection ofNGOs, accountability, monitoring and evaluationand also to address the common challengesmentioned earlier.
4.5 Strengthening Capacity forImplementation
4.5.1 Tapping the productive talent of the Government’shuman resources is critical to improving the quality ofgovernance. There are about 17.61 million2 officials andstaff in the Central Government, State Governments,quasi-government bodies and local bodies, and the needis felt for improvement in their delivery of services.Thiswould also lead to improvements in the efficiency andquality of programme implementation. The Governmenthas laid considerable emphasis on enhancing theprofessional competence of staff, especially in newtechnology areas, through regular training programmes.This will need to be taken forward with renewed vigouras it will help re-invigorate the administration, and createa positive brand image for India in the time to come.
4.5.2 National Training Policy:In view of the changedenvironment in all spheres of governance and theemerging challenges being faced by civil servants, theDepartment of Personnel and Training formulated the
National Training Policy, 2012, which has beencirculated to all Ministries and Departments for adoption.The Policy provides for training all civil servants to equipthem with skills for their current or future jobs, both atthe time of their entry into service and at appropriateintervals in the course of their careers. Such trainingwill be made available for all civil servants, from thelowest to the highest levels.
4.5.3 Support to State training activities:Variousprogrammes have been designed to develop theknowledge and skills of senior- and middle-level officersof State Governments, state Public Sector Undertakingsand state autonomous bodies. These programmes areconducted primarily in the apex training institute of eachstate. The programmes cover a large variety of subjectsunder several broad thematic groups, which include:computer awareness and IT; participatory administration;decentralised planning and governance; changemanagement and disaster management; state financialmanagement; gender issues; human rights, ethics andhuman values; and others.
4.6 Improvement in Project Monitoring,Prioritization and Evaluation
4.6.1 A significant part of the Gross Budgetary Support(GBS) flows to finance projects in infrastructure sectors.The delays in project completion and commissioning ininfrastructure sectors like power, railways, roads,shipping, etc. have been a major area of concern. Thesedelays result in blocked capital, cost overruns and failureto deliver critical infrastructure in a timely fashion. Theseare costs the country can ill afford. The NITI Aayoghas been working with the Ministry of Railways toprioritize funding of Railway projects like the doublingof old lines and the laying of new ones. The effort hasalso been made to ring-fence funding for national projectslike Northeast rail connectivity. A Project MonitoringGroup (PMG) has been set up in the Cabinet Secretariatto resolve hurdles faced by large infrastructure projects.Further, reviewing the progress of infrastructure projectsis now accorded top priority, with the Prime Ministerchairing meetings with the concerned Ministries and the
2Economic Survey 2014-15, Statistical Appendix, pp A55.
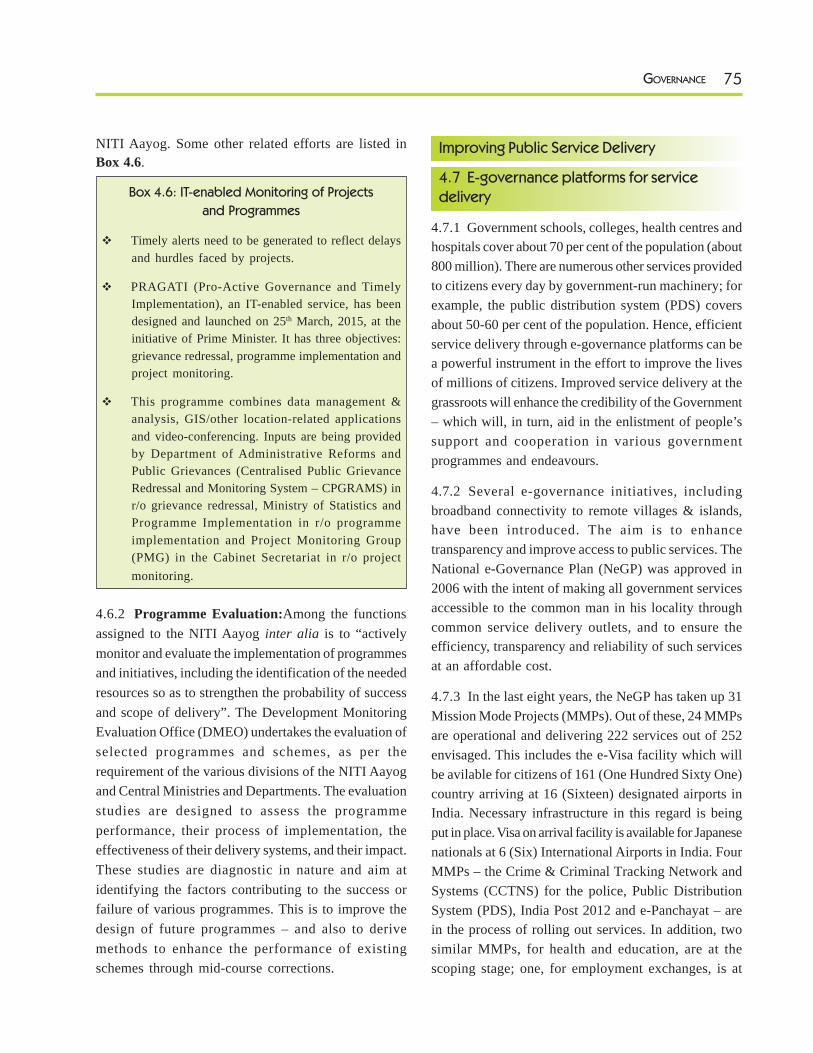
75GOVERNANCE
NITI Aayog. Some other related efforts are listed inBox 4.6.
Box 4.6: IT-enabled Monitoring of Projects
and Programmes
Timely alerts need to be generated to reflect delaysand hurdles faced by projects.
PRAGATI (Pro-Active Governance and TimelyImplementation), an IT-enabled service, has beendesigned and launched on 25th March, 2015, at theinitiative of Prime Minister. It has three objectives:grievance redressal, programme implementation andproject monitoring.
This programme combines data management &analysis, GIS/other location-related applicationsand video-conferencing. Inputs are being providedby Department of Administrative Reforms andPublic Grievances (Centralised Public GrievanceRedressal and Monitoring System – CPGRAMS) inr/o grievance redressal, Ministry of Statistics andProgramme Implementation in r/o programmeimplementation and Project Monitoring Group(PMG) in the Cabinet Secretariat in r/o projectmonitoring.
4.6.2 Programme Evaluation:Among the functionsassigned to the NITI Aayog inter alia is to “activelymonitor and evaluate the implementation of programmesand initiatives, including the identification of the neededresources so as to strengthen the probability of successand scope of delivery”. The Development MonitoringEvaluation Office (DMEO) undertakes the evaluation ofselected programmes and schemes, as per therequirement of the various divisions of the NITI Aayogand Central Ministries and Departments. The evaluationstudies are designed to assess the programmeperformance, their process of implementation, theeffectiveness of their delivery systems, and their impact.These studies are diagnostic in nature and aim atidentifying the factors contributing to the success orfailure of various programmes. This is to improve thedesign of future programmes – and also to derivemethods to enhance the performance of existingschemes through mid-course corrections.
Improving Public Service Delivery
4.7 E-governance platforms for servicedelivery
4.7.1 Government schools, colleges, health centres andhospitals cover about 70 per cent of the population (about800 million). There are numerous other services providedto citizens every day by government-run machinery; forexample, the public distribution system (PDS) coversabout 50-60 per cent of the population. Hence, efficientservice delivery through e-governance platforms can bea powerful instrument in the effort to improve the livesof millions of citizens. Improved service delivery at thegrassroots will enhance the credibility of the Government– which will, in turn, aid in the enlistment of people’ssupport and cooperation in various governmentprogrammes and endeavours.
4.7.2 Several e-governance initiatives, includingbroadband connectivity to remote villages & islands,have been introduced. The aim is to enhancetransparency and improve access to public services. TheNational e-Governance Plan (NeGP) was approved in2006 with the intent of making all government servicesaccessible to the common man in his locality throughcommon service delivery outlets, and to ensure theefficiency, transparency and reliability of such servicesat an affordable cost.
4.7.3 In the last eight years, the NeGP has taken up 31Mission Mode Projects (MMPs). Out of these, 24 MMPsare operational and delivering 222 services out of 252envisaged. This includes the e-Visa facility which willbe avilable for citizens of 161 (One Hundred Sixty One)country arriving at 16 (Sixteen) designated airports inIndia. Necessary infrastructure in this regard is beingput in place. Visa on arrival facility is available for Japanesenationals at 6 (Six) International Airports in India. FourMMPs – the Crime & Criminal Tracking Network andSystems (CCTNS) for the police, Public DistributionSystem (PDS), India Post 2012 and e-Panchayat – arein the process of rolling out services. In addition, twosimilar MMPs, for health and education, are at thescoping stage; one, for employment exchanges, is at
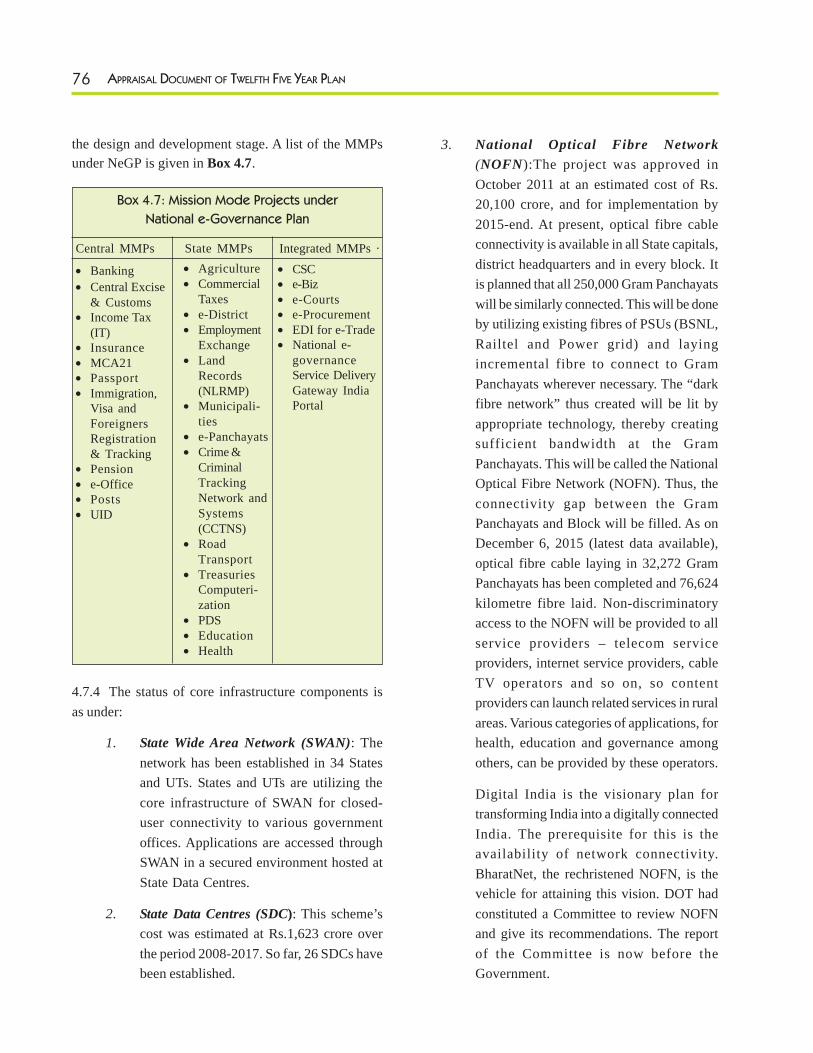
76 APPRAISAL DOCUMENT OF TWELFTH FIVE YEAR PLAN
the design and development stage. A list of the MMPsunder NeGP is given in Box 4.7.
4.7.4 The status of core infrastructure components isas under:
1. State Wide Area Network (SWAN): Thenetwork has been established in 34 Statesand UTs. States and UTs are utilizing thecore infrastructure of SWAN for closed-user connectivity to various governmentoffices. Applications are accessed throughSWAN in a secured environment hosted atState Data Centres.
2. State Data Centres (SDC): This scheme’scost was estimated at Rs.1,623 crore overthe period 2008-2017. So far, 26 SDCs havebeen established.
3. National Optical Fibre Network(NOFN):The project was approved inOctober 2011 at an estimated cost of Rs.20,100 crore, and for implementation by2015-end. At present, optical fibre cableconnectivity is available in all State capitals,district headquarters and in every block. Itis planned that all 250,000 Gram Panchayatswill be similarly connected. This will be doneby utilizing existing fibres of PSUs (BSNL,Railtel and Power grid) and layingincremental fibre to connect to GramPanchayats wherever necessary. The “darkfibre network” thus created will be lit byappropriate technology, thereby creatingsufficient bandwidth at the GramPanchayats. This will be called the NationalOptical Fibre Network (NOFN). Thus, theconnectivity gap between the GramPanchayats and Block will be filled. As onDecember 6, 2015 (latest data available),optical fibre cable laying in 32,272 GramPanchayats has been completed and 76,624kilometre fibre laid. Non-discriminatoryaccess to the NOFN will be provided to allservice providers – telecom serviceproviders, internet service providers, cableTV operators and so on, so contentproviders can launch related services in ruralareas. Various categories of applications, forhealth, education and governance amongothers, can be provided by these operators.
Digital India is the visionary plan fortransforming India into a digitally connectedIndia. The prerequisite for this is theavailability of network connectivity.BharatNet, the rechristened NOFN, is thevehicle for attaining this vision. DOT hadconstituted a Committee to review NOFNand give its recommendations. The reportof the Committee is now before theGovernment.
• Banking• Central Excise
& Customs• Income Tax
(IT)• Insurance• MCA21• Passport• Immigration,
Visa andForeignersRegistration& Tracking
• Pension• e-Office• Posts• UID
Box 4.7: Mission Mode Projects under
National e-Governance Plan
Central MMPs State MMPs Integrated MMPs ·• Agriculture• Commercial
Taxes• e-District• Employment
Exchange• Land
Records(NLRMP)
• Municipali-ties
• e-Panchayats• Crime &
CriminalTrackingNetwork andSystems(CCTNS)
• RoadTransport
• TreasuriesComputeri-zation
• PDS• Education• Health
• CSC• e-Biz• e-Courts• e-Procurement• EDI for e-Trade• National e-
governanceService DeliveryGateway IndiaPortal
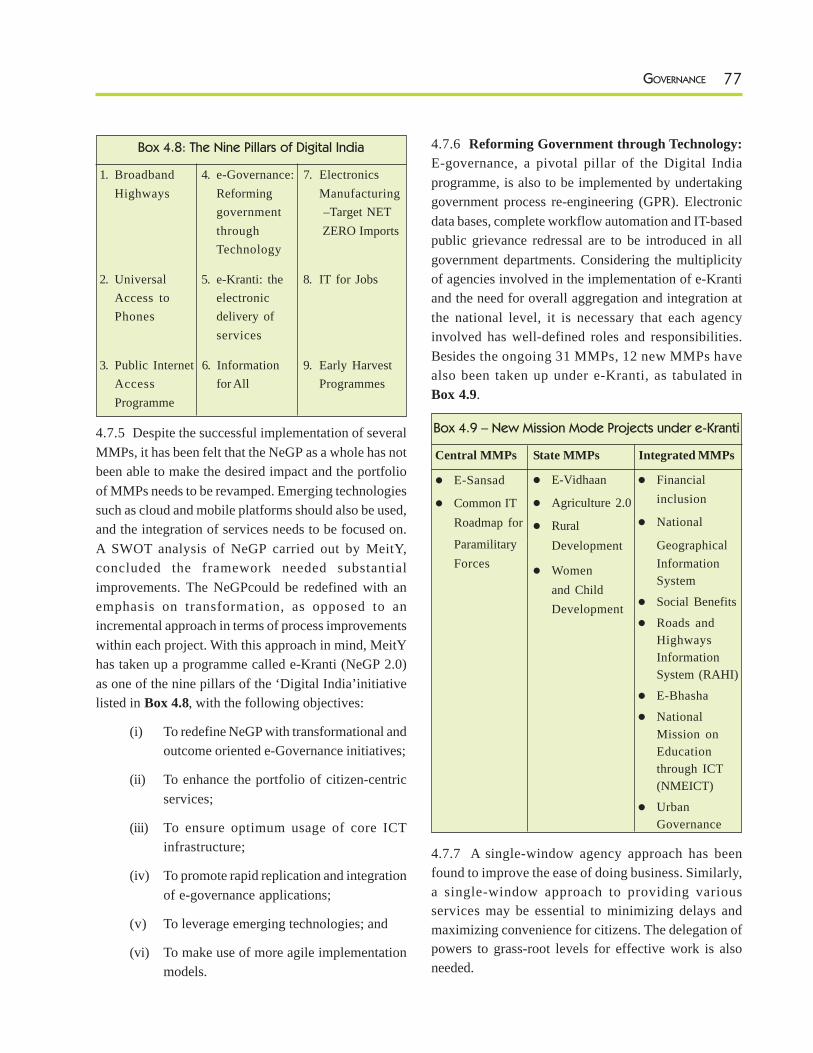
77GOVERNANCE
Box 4.8: The Nine Pillars of Digital India
1. Broadband 4. e-Governance: 7. ElectronicsHighways Reforming Manufacturing
government –Target NETthrough ZERO ImportsTechnology
2. Universal 5. e-Kranti: the 8. IT for JobsAccess to electronicPhones delivery of
services
3. Public Internet 6. Information 9. Early HarvestAccess for All ProgrammesProgramme
4.7.5 Despite the successful implementation of severalMMPs, it has been felt that the NeGP as a whole has notbeen able to make the desired impact and the portfolioof MMPs needs to be revamped. Emerging technologiessuch as cloud and mobile platforms should also be used,and the integration of services needs to be focused on.A SWOT analysis of NeGP carried out by MeitY,concluded the framework needed substantialimprovements. The NeGPcould be redefined with anemphasis on transformation, as opposed to anincremental approach in terms of process improvementswithin each project. With this approach in mind, MeitYhas taken up a programme called e-Kranti (NeGP 2.0)as one of the nine pillars of the ‘Digital India’initiativelisted in Box 4.8, with the following objectives:
(i) To redefine NeGP with transformational andoutcome oriented e-Governance initiatives;
(ii) To enhance the portfolio of citizen-centricservices;
(iii) To ensure optimum usage of core ICTinfrastructure;
(iv) To promote rapid replication and integrationof e-governance applications;
(v) To leverage emerging technologies; and
(vi) To make use of more agile implementationmodels.
4.7.6 Reforming Government through Technology:E-governance, a pivotal pillar of the Digital Indiaprogramme, is also to be implemented by undertakinggovernment process re-engineering (GPR). Electronicdata bases, complete workflow automation and IT-basedpublic grievance redressal are to be introduced in allgovernment departments. Considering the multiplicityof agencies involved in the implementation of e-Krantiand the need for overall aggregation and integration atthe national level, it is necessary that each agencyinvolved has well-defined roles and responsibilities.Besides the ongoing 31 MMPs, 12 new MMPs havealso been taken up under e-Kranti, as tabulated inBox 4.9.
4.7.7 A single-window agency approach has beenfound to improve the ease of doing business. Similarly,a single-window approach to providing variousservices may be essential to minimizing delays andmaximizing convenience for citizens. The delegation ofpowers to grass-root levels for effective work is alsoneeded.
Box 4.9 – New Mission Mode Projects under e-Kranti
Central MMPs State MMPs Integrated MMPs
E-Sansad
Common ITRoadmap for
E-Vidhaan
Agriculture 2.0
Rural
Financialinclusion
National
ParamilitaryForces
GeographicalInformationSystem
Social Benefits
Roads andHighwaysInformationSystem (RAHI)
E-Bhasha
NationalMission onEducationthrough ICT(NMEICT)
UrbanGovernance
Development
Womenand ChildDevelopment
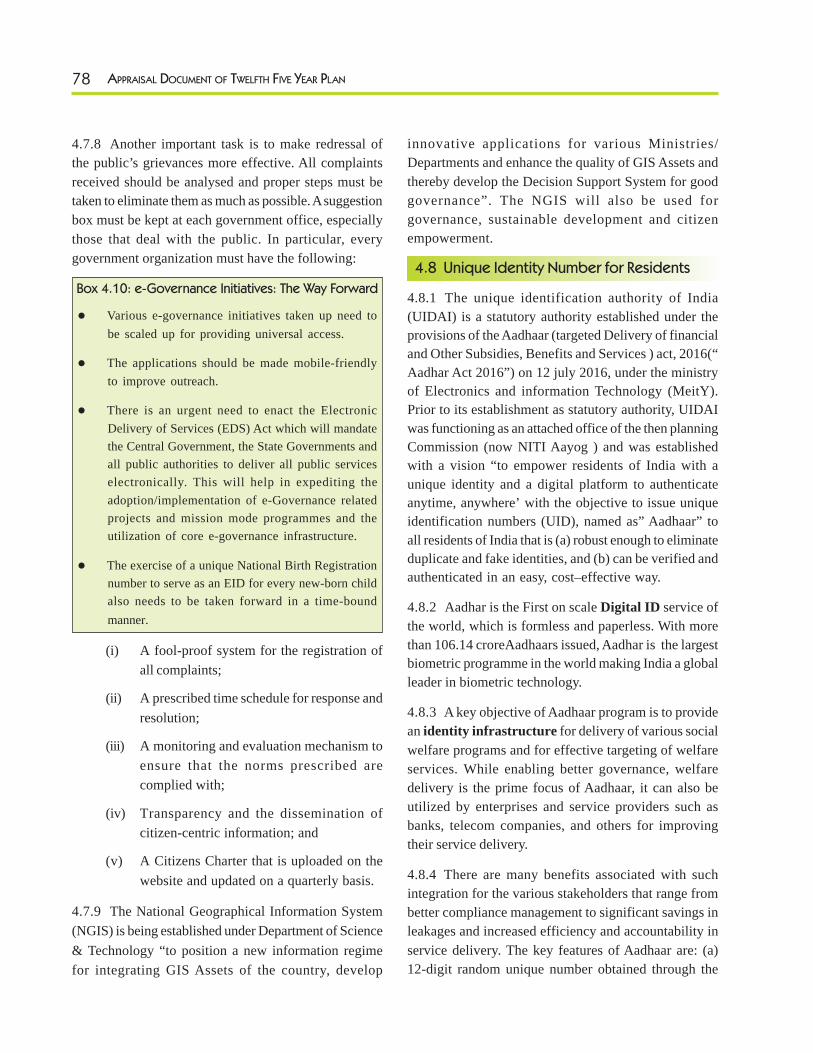
78 APPRAISAL DOCUMENT OF TWELFTH FIVE YEAR PLAN
4.7.8 Another important task is to make redressal ofthe public’s grievances more effective. All complaintsreceived should be analysed and proper steps must betaken to eliminate them as much as possible. A suggestionbox must be kept at each government office, especiallythose that deal with the public. In particular, everygovernment organization must have the following:
Box 4.10: e-Governance Initiatives: The Way Forward
Various e-governance initiatives taken up need tobe scaled up for providing universal access.
The applications should be made mobile-friendlyto improve outreach.
There is an urgent need to enact the ElectronicDelivery of Services (EDS) Act which will mandatethe Central Government, the State Governments andall public authorities to deliver all public serviceselectronically. This will help in expediting theadoption/implementation of e-Governance relatedprojects and mission mode programmes and theutilization of core e-governance infrastructure.
The exercise of a unique National Birth Registrationnumber to serve as an EID for every new-born childalso needs to be taken forward in a time-boundmanner.
(i) A fool-proof system for the registration ofall complaints;
(ii) A prescribed time schedule for response andresolution;
(iii) A monitoring and evaluation mechanism toensure that the norms prescribed arecomplied with;
(iv) Transparency and the dissemination ofcitizen-centric information; and
(v) A Citizens Charter that is uploaded on thewebsite and updated on a quarterly basis.
4.7.9 The National Geographical Information System(NGIS) is being established under Department of Science& Technology “to position a new information regimefor integrating GIS Assets of the country, develop
innovative applications for various Ministries/Departments and enhance the quality of GIS Assets andthereby develop the Decision Support System for goodgovernance”. The NGIS will also be used forgovernance, sustainable development and citizenempowerment.
4.8 Unique Identity Number for Residents
4.8.1 The unique identification authority of India(UIDAI) is a statutory authority established under theprovisions of the Aadhaar (targeted Delivery of financialand Other Subsidies, Benefits and Services ) act, 2016(“Aadhar Act 2016”) on 12 july 2016, under the ministryof Electronics and information Technology (MeitY).Prior to its establishment as statutory authority, UIDAIwas functioning as an attached office of the then planningCommission (now NITI Aayog ) and was establishedwith a vision “to empower residents of India with aunique identity and a digital platform to authenticateanytime, anywhere’ with the objective to issue uniqueidentification numbers (UID), named as” Aadhaar” toall residents of India that is (a) robust enough to eliminateduplicate and fake identities, and (b) can be verified andauthenticated in an easy, cost–effective way.
4.8.2 Aadhar is the First on scale Digital ID service ofthe world, which is formless and paperless. With morethan 106.14 croreAadhaars issued, Aadhar is the largestbiometric programme in the world making India a globalleader in biometric technology.
4.8.3 A key objective of Aadhaar program is to providean identity infrastructure for delivery of various socialwelfare programs and for effective targeting of welfareservices. While enabling better governance, welfaredelivery is the prime focus of Aadhaar, it can also beutilized by enterprises and service providers such asbanks, telecom companies, and others for improvingtheir service delivery.
4.8.4 There are many benefits associated with suchintegration for the various stakeholders that range frombetter compliance management to significant savings inleakages and increased efficiency and accountability inservice delivery. The key features of Aadhaar are: (a)12-digit random unique number obtained through the
79GOVERNANCE
process of de-duplication involving biometrics, (b) Onlya number and not a card, (c) The number does notcontain any intelligence, (d) Scalable technologyarchitecture, (e) Open source technologies, (f) OneResident = One Aadhaar.
Aadhaar Act 2016
4.8.5 The Aadhar (Targeted Delivery of Financial andOther Subsidies, Benefits and Services) Bill, 2016 wasconsidered by the parliament and the same was passedon 16.03.2016. Further, the assent of the president ofIndia was obtained on 25.03.2016 and the act, wasaccordingly published in the Official Gazette on 26.03.16as aadhaar ( targeted delivery of financial and OtherSubsidies, Benefits and Services) Act , 2016 [ Act 18 of2016] and has come into force rfrom 12.09.2016, thedate of notification of the same :
Some of the salient features of Aadhar Act are coveredin the following s3exctions:
a. Section 1: Gives statutory basis to aadhar andthe act would commence based on the dates thatwill announced different provisions of the act.
b. Section 3: gives every resident and entitlementto obtain an aadhaar number
c. Section 7: The Central Governmnet or the StateGovernment, may require that the individual shallundergo Aadhaar authentication for the purposeof establishing identity of such individuals, as acondition for receipt of subsidy, benefit or service,the expenditure for which is incurred from theconsolidated Fund of India . In the case of anindividual to whom no aadhaar has beenassigned,such individual shall make an applicationfor enrollment. Section 7 further provides that,if an Aadhar number has not been assigned to anindividual, the individual shall be offered alternateand viable means of identification for deliveryof subsidy, benefit or service.
d. Section 8: mandates that requesting entity shallseek consent of the individuals before collectingidentity information and while limiting the useof authentication purpose only. Empowers
Authority to perform authentication of theAadhar Number and respond with positive ornegative response.
e. Section 29: Limits the requesting entities to useidentity information only for purpose stated toindividual and restricts sharing/disclosing ofidentity information further without prior consent.It also restricts publishing displaying or postingpublically information of an aadhaar number.
Further, the following regulations are notified under thesaid Aadhaar act 2016;
• Unique identification Authority of India(Transaction of Business at Meeting of theAuthority) Regulations,2016 (No. 1 of2016)
• Aadhaar (Enrolment and update )Regulations 2016 (2 of 2016)
• Aadhaar (Authentication ) Regulations 2016(3 of 2016)
• Aadhaar (data Security ) Regulations 2016(4of 2016)
• Aadhaar (Sharing of Information )Regulations 2016 (5of 2016)
Value Proposition of Aadhaar
4.8.6 Uniqueness: Any individual, irrespective of ageand gender, who is a resident in India and satisfies theverification process laid down by the UIDAI, can enrollfor Aadhaar. An individual is required to enroll only once;the process is free of cost. In case, the resident enrollsmore than once, ONLY ONE Aadhaar shall be generated,as the Uniqueness is achieved through biometric de-duplication.
4.8.7 Aadhaar as Financial Address: As Aadhaar isunique and does not change over the lifecycle of anindividual, the 12-digit Aadhaar is sufficient to transferany payments to an individual. Aadhaar offers thepossibility of sending money by just using the 12-digitnumber for life without bothering about any changes inthe bank account of the individuals. Thus, with thisunique property of being valid for a lifetime, Aadhaar is
80 APPRAISAL DOCUMENT OF TWELFTH FIVE YEAR PLAN
very well perceived as a Financial Address in the bankingsector.
4.8.8 Authentication: One of the other challenges theresident frequently faced was to establish his/her identity.The problem gets further complicated owing to the factof using proxy documents and circulation of counterfeitdocuments in the country, which leads to lack of trustbetween service providers and the resident. However,with Aadhaar’s property of Authentication enables anAadhaar holder to authenticate with a service providerAnytime, Anywhere in the country to prove his/heridentity. To facilitate this, UIDAI has established anecosystem based on best global practices to ensure dataprivacy and reliability of authentication, with UIDAIbeing agnostic to the fact as to why was theauthentication done.
4.8.9 e-KYC: Based on industry inputs, which waslooking for digital KYC solution coming directly fromthe issuer of KYC, UIDAI developed another propertycalled e-KYC. While developing this UIDAI maintainedthe privacy of the individual, by sharing demographicdata of an individual only after receiving explicitauthorization (consent) from the concerned individual.UIDAI has established an ecosystem which ensures thata resident can digitally share the KYC with a registeredservice provider by authorizing UIDAI whenever he/she wanted to share his/her KYC with the serviceprovider to avail a service.
4.8.10 With the explicit consent / authorization by theresident, the Aadhaar e-KYC service provides an instant,electronic, non-repudiable proof of identity and proofof address along with date of birth and gender. Inaddition, it also provides the resident’s mobile numberand email address to the service provider, which helpsin further streamlining the process of service delivery.
Enrolment Ecosystem
4.8.11 Enrolment Implementation Model: Aadhaarenrolment ecosystem is built in partnership with 431Registrars, wherein Registrars are primarily StateGovernments, Public Sector Banks, Registrar Generalof India (RGI), etc. All the Registrars in the ecosystemare signatories to MoUs with UIDAI.
4.8.12 Enrolment Philosophy: One of the keyconsiderations is to keep the Aadhaar system purelyfocused on identity. The Aadhaar system only collectsminimal data to provide unique identity, issue the Aadhaarafter biometric de-duplication, manage lifecycle changesof that identity record. As recommended by theDemographic Data Standards and Verification CommitteeReport (DDSVP) and Biometric Standards Committee,the UIDAI is collecting bare minimum demographicinformation from the residents such as name, age,gender, address, biometric (photograph, ten fingerprintsand two iris) and relationship details in case of minors.
4.8.13 While the above fields are mandatory for everyenrolment, there are other optional fields, such as: (a)In case of children below 5 years age, biometricinformation is not collected and their Aadhaar is linkedto parent’s/guardian’s Aadhaar, (b) e-mail and (c) PhoneNumber.
4.8.14 Enrolment Statistics: The Enrolment Status asof 30th September, 2016 (per cent as per census 2015)is as under:
i. Total Aadhaar generation – 106.14 cr.(83 per cent)
ii. 18+ Aadhaar generation – 79.06 cr. (98.3per cent)
iii. < 18 Aadhaar generation – 27.09 cr. (57.7 percent)
State wise saturation figures have been placed inAnnexure-4.1, 4.2, 4.3 & 4.4 respectively.
4.8.15 Updation: In order to maintain the data of theresidents current and up-to-date, UIDAI has providedan institutional mechanism to enable residents to updatetheir data. The updates include corrections and/orchanges in the demographic details of residents due tochange of address, mobile number or change of nameafter marriage, etc. and biometric attributes that need tobe updated by the children upon attaining the age of 5and 15 years, etc.
4.8.16 UIDAI has institutionalized process of updationthrough post, manual updation through its Permanent
81GOVERNANCE
Enrolment Centres and electronic/online updationthrough its Self Service Update Portal (SSUP). UIDAIrecently launched the API to update mobile numbers inUIDAI database based on bio-metric authentication withany of the authentication ecosystem partners. The servicewill help provide 100 of thousands of service points toupdate mobile number.
4.8.17 Enrolment Strategy: With the Aadhaar saturationexceeding 90 per cent in over 18 states and between 75to 90 per cent in 10 states, it is becoming more difficultto reach out the remaining population. Hence UIDAIhas taken a slew of steps to reach out to the remainingpopulation. Some of the key measures are:
a. Deployment of Permanent EnrolmentCenters (PEC). Currently there are 27,836such PECs and the location can be foundonline.
b. States are being encouraged to acquireenrolment kits. So far 12,140 additional kitshave been procured by the States. All servicedepartments are being advised to provideenrolment facility. Schools, hospitals andanganwadis are being encouraged to set-upenrolment camps.
c. 20,000 Common Service Centers (CSC) willact as Aadhaar Kendras.
d. A pilot is being initiated in >90% saturationStates for “Aadhaar Challenge”. Whereinresidents who are yet to enroll can contactUIDAI for enrolment. UIDAI will reach outto enrol such residents.
4.8.18 In compliance to the UIDAI’s policy, Aadhaar isissued to all residents including the children below 5years of age. However, the biometrics viz. fingerprintsand iris image is not captured for children below 5 yearsof age. In lieu of the same a dedicated client called “ChildEnrollment Client Lite” has been developed to capturethe demographic data and photograph of the childrenbelow 5 years of age. UIDAI intends to leverage theAaganwadi worker network through partnership withMinistry of Women and Child Development.
4.8.19 Recovering Lost EID/UID Number: When aresident loses his/her UID number (and the associatedUID letter) UIDAI has developed a process to recoverthe UID number by an Aadhaar holder. This requires an‘Identity Check’ which involves capturing the resident’sbiometric and demographics and comparing it againstthe entire UID database in order to locate the UID numberof the resident. This service is online in nature and hasbeen institutionalized through its Permanent EnrolmentCenters.
4.8.20 There is also an ‘Aadhaar Search’ facility, wherein if demographic information is input, it helps bring outmatching results. UIDAI has provided over 31,805 such‘Aadhaar Search’ log-ins to state officials.
4.8.21 Aadhaar Generation and Letter Delivery:Once the enrolment takes place, the encrypted enrolmentpackets are uploaded to a designated location at UIDAI.The data packet undergoes various stages of screening,quality control and validation in CIDR to ensureauthenticity and de-duplication of source of data. Afterpassing the additional data quality checks ondemographic, biometric and other validations, the packetis subjected to biometric de-duplication before Aadhaargets generated.
4.8.22 Once the Aadhaar is generated, an Aadhaar letteris printed and dispatched to the resident through IndiaPost. As on date, over 104.93 crore Aadhaar lettershave been dispatched. In addition, the UIDAI providesfacility of an e-Aadhaar portal for downloading theAadhaar letter in PDF format from the website of UIDAI(www.uidai.gov.in). The e-Aadhaar, is treated at parwith the printed Aadhaar letter and is a valid and digitallysigned electronic document. As on date, over 51 croree-Aadhaar letters have been downloaded from websiteof UIDAI. Over 24,150 e-Aadhaar logins provided tostate officials.
Authentication Ecosystem
4.8.23 The purpose of Authentication is to enableresidents to prove their identity and for service providersto confirm that the residents are ‘who they say theyare’ in order to supply services and give access to
82 APPRAISAL DOCUMENT OF TWELFTH FIVE YEAR PLAN
benefits. Aadhaar, being a unique digital ID – provides apowerful platform for authenticating a resident anytimeand anywhere which is in line with the vision of theUIDAI.
4.8.24 The UID architecture is designed on an on-linesystem – data is stored centrally and authentication isdone online. This is a forward-leaning approach thatmakes it possible to avoid the problems associated withmany ID card schemes. Aadhaar Authentication serviceis built to handle upto 10 crore authentications a dayacross two data centers in an active-active fashion andis benchmarked to provide sub-second response time.
4.8.25 Aadhaar authentication is the process whereinAadhaar, along with other attributes (demographic/biometrics/OTP) is submitted to UIDAI’s Central Serverfor verification; the Central server verifies whether thedata submitted matches the data available in the serverand responds with a “Yes/No”. As on date, UIDAIsupports: (a) Biometric (fingerprint + iris) basedauthentication, (b) Demographic-based authentication,and (c) One-time Password authentication.
4.8.26 Authentication Implementation Model:UIDAI provides Authentication and e-KYC servicesthrough agencies called Authentication User Agency(AUA), Authentication Service Agency (ASA) and e-KYCUser Agency (KUA).
4.8.27 Authentication User Agency (AUA): AUA isany government/public/private legal agency registeredin India that seeks to use Aadhaar authentication forproviding access to its services. An AUA is the principalagency that sends authentication requests to enable itsservices/business functions. An AUA connects to theUIDAI Data Centre/ Central Identity Repository (CIDR)through an ASA (either by becoming ASA on its own orcontracting services of an existing ASA) using a securedprotocol. As on 30th September, 2016, 282 entities havebeen on-boarded by UIDAI as AUAs and haveundertaken over 272.93 crore authentication transactionssuccessfully.
4.8.28 Authentication Service Agency (ASA): ASAsare entities that transmit authentication requests to the
CIDR on behalf of one or more AUAs. They play therole of enabling intermediaries through secure connectionestablished with the CIDR. ASAs receive CIDR’sresponse and transmit the same back to the AUAs. Ason 30th September, 2016, 25 ASAs are providing theseservices.
Application of Authentication
4.8.29 E-KYC Services: For an individual, identity andaddress verification is a key requirement for enrolling ina new welfare program, or opening a new bank account,etc. Keeping in view of the various challengesexperienced by either the service provider or an individualrelated to providing PoI and PoA, or KYC, UIDAIlaunched e-KYC services in May, 2013. Thereafter, theadoption and usage of this service has grown in leapsand bounds.
4.8.30 The service provider in all such cases can verifyapplicant identity and address using Aadhaarauthentication and e-KYC online services instead ofasking for paper copies of identity and addressdocuments. This secure, electronic, paperless KYCprocess is expected to substantially reduce the cost ofKYC and provide convenience to customers. In orderfor the service providers and individuals to leverage thisservice of authentication, UIDAI has extended theAuthentication ecosystem to create an online e-KYCservices.
4.8.31 e-Know Your Customer User Agency (KUA):KUAs are extension AUAs that send KYC requests inelectronic manner to enable its services/businessfunctions. KUA connects to the CIDR through a KSA.As on date, 205 KUA entities are live on Aadhaar platform;carrying out a total of about 21.73 crore e-KYCtransactions successfully, as on 30th September, 2016.
Seeding Ecosystem
4.8.32 The UIDAI does not collect or store anyadditional personal information or linking data, suchas PAN number, Driver’s License numbers, details ofcaste, creed, religion, income level or health status,etc. UIDAI has created a seeding ecosystem, wheredifferent partners can leverage various tools offered
83GOVERNANCE
by UIDAI to link Aadhaar in their respective servicedelivery databases.
4.8.33 Aadhaar seeding is a process by which UIDs ofresidents are accurately included in the service deliverydatabase of service providers for enabling Aadhaar basedauthentication during service delivery. The seedingprocess is accomplished in two steps. In the first stepAadhaar is to be captured into the beneficiary databaseand in the second step after verification with referenceto UIDAI database (CIDR) it is linked to the beneficiaryrecord in the database of the service provider.
4.8.34 UIDAI has undertaken multiple activities to ensureAadhaar seeding is facilitated in various schemedatabases. The Aadhaar seeding framework includes:
A Standard Protocol Covering the Approach& Process for Seeding Aadhaars in ServiceDelivery Databases is available on UIDAIwebsite.
https://uidai.gov.in/images/aadhaar_seeding_june_2015_v1.1.pdf
Sensitization workshops: UIDAI hasconducted over forty eight workshopsattended by nearly 716 participants at UIDAIHQ. UIDAI ROs are conducting manyworkshops at regional level with localadministration in States.
Developed content including classroomtraining and computer based training contentfor various stakeholders in Aadhaar seedingoperators. In addition, a system for testingand certification has also been put in placeto certify potential seeding workforce.
4.8.35 Aadhaar seeding in various large databases hasgrown steadily and as on 30th September 2016, a totalof 14.41 crore Aadhaars were seeded in LPG database,8.29 crores in MGNREGS, 16.74 crore in PDS, 1.36crore in NSAP, 12.82 crore in Jan Dhan Accounts, 1.66crore in EPFO accounts and 33.55 crore in bankaccounts.
Data Security and Privacy
4.8.36 Data security and data privacy are bothimportant requirements in any organization andprocesses should be put in place that ensure fullcompliance with the organization’s guidelines at all times.There should be a governance structure to oversee theway data is stored, used and shared across theorganization. Physical as well as Virtual security measuresshould be in place at each touch point for Data security.
4.8.37 Security and privacy of personal data has beenfundamental in design of Aadhaar system withoutsacrificing utility of the national identity system. Whencreating a national identity system of this scale, it isimperative that privacy and security of personal data aredesigned into the strategy of the system from day one.
4.8.38 Aadhaar Act, 2016 has made multiple provisionsfor protection of privacy of individuals’ informationstored with UIDAI. Various sections of the act ensurethat a resident consent is necessary to collectdemographic data for the specified purpose only andcannot be shared with anyone further. Aadhaar Act alsoprovides for punitive measures including fines and/orimprisonment up to 3 years for impersonation, unlawfuldissemination / sharing of information, applicable to bothindividuals and companies. Appropriate measures havebeen taken to ensure security of data at enrolment andauthentication as well. Further, UIDAI has been declaredSTQC ISO 27001:2013 certified.
4.8.39 UIDAI has constructed two captive data centers,one each at Manesar (Haryana) and Bengaluru(Karnataka). UIDAI has been identified to be declaredas “Critical Infrastructure” by National CriticalInformation Infrastructure Protection Centre (NCIIPC)adding another layer of IT security assurance.
New Initiatives
4.8.40 Fertilizers and Kerosene – India still is a largeagrarian economy with maximum population beingmarginalized farmers. Aadhaar has now started workingwith Department of Fertilizers and Ministry of Petroleum
84 APPRAISAL DOCUMENT OF TWELFTH FIVE YEAR PLAN
and Natural Gas to re-engineer processes for phasedadoption of Aadhaar to reduce leakages and ensure thatgovernment benefits and subsidies reach the targetedbeneficiaries.
4.8.41 ITR Filing – The Central Board of Direct Taxes(CBDT) has introduced Aadhaar based electronicverification for filing the Income Tax Returns (ITR) asan option to send ITR-5 directly to the department. Thisinitiative makes the filing of income tax completelyElectronic (Paperless) and simplifies the process of ITRFiling. Previously, after electronic filing, the taxpayerhad to speed post signed copy of ITR-5 to thedepartment within 120 days. With Aadhaar VerificationCode, the verification of the I-T return filing will takeplace electronically in real time.
4.8.42 Unique Entity Number– Based on directions ofHon’ble PM, UIDAI has recommended a protocol onthe process of issuing Unique Identity for Corporations,Limited Companies, Propriety Firms, RegisteredSocieties and Trusts. The protocol has been developedafter inputs from various Ministries viz. CBDT, Ministryof Corporate Affairs, State officials, GSTN, etc.
4.8.43 Working with various Ministries – Aadhaar hasstarted working with multiple ministries/departments viz.Road Transport, land records, education, labour amongstothers to actively incorporate Aadhaar in their processes
with an objective of digitization and de-duplication ofrecords with a phased approach to move towardsAadhaar based service delivery approach.
4.8.44 e-KYC based SIM issuance-Department ofTelecommunication (DoT) has issued circular, datedAugust 16, 2016 allowing Telecom Services providersto start accepting Aadhaar e-KYC for issuance of newmobile SIM cards. With this change, the process ofacquiring new SIM card becomes paperless and nearinstant activation of SIM cards besides being a majorcost savings for the telecom companies. As on 30th
September, 2016, about 75 lakhs new customers havebeen acquired by various telecom service providers bydoing Aadhaar e-KYC.
4.8.45 Aadhaar linkage with Passport - Ministry ofExternal Affairs (MEA) has decided to leverage Aadhaarof the applicants for verification, de-duplication andissuance of passport with an aim to reduce the Turn-Around-Time. The new process has been implementedat all 77 Passport Sewa Kendras (PSKs). Over 61 lakhAadhaar holders have opted to give Aadhaar for applyingfor their Passports. Recently MEA has started givingpassport within a week time in case applicant submitsEPIC, PAN Card, Aadhaar together along with thepassport applications. In this case also, Aadhaar e-KYCis performed by MEA at the time of visit of the applicantto the PSK.
Box 4.11: Aadhaar: The Way Forward
Define timelines for seeding and application development.
Broad-basing & leveraging the Aadhaar platform for various applications across government, businesses andother services for accounting and transparency.
Proactively aid State Governments and institutions in verifying and digitizing beneficiary databases and seedingthem with Aadhaar numbers.
Expand availability of authentication services, e-KYC, etc. and also the network of Authentication Service Agencies(ASA), Authentication User Agencies (AUA), etc.
Ensure residents have the facility to update their demographic details in the event of any changes.
Conduct special enrolment camps to facilitate the enrolment of all children below the age of five, and attain universalenrolment.
Link all bank accounts, insurance schemes, pension accounts, etc. with Aadhaar along with nominees for improvedtargeted services.
85GOVERNANCE
Combating Corruption
4.9 Legal and Regulatory Changes to CombatCorruption
4.9.1 The Fourth Report of the 2nd ARC dealing with‘Ethics in Governance’ provided recommendations forcombating corruption. The status on some of the actionareas are given as under:
i. The proposal to amend the Prevention ofCorruption Act, 1988 to ensure thatsanctioning authorities are not summonedand instead the documents are obtained andproduced before the courts by theappropriate authority is under examination.The proposal regarding amendment toSection 19(1) (a) & (b) of the Act to extendthe protection of previous sanction to publicservants who cease to be in service wasagreed to by a Group of Ministers and theBill stands referred to the DepartmentalStanding Committee on Personnel, PublicGrievances, Pensions, Law & Justice forconsideration.
ii. The Chief Justice of India has addressedletters to Chief Justices of all the High Courtsto ensure that cases in respect of thePrevention of Corruption Act, 1988 are fasttracked and taken up for hearing on apriority basis, both at the High Court anddistrict levels.
iii. The Lokpal and Lokayuktas Act, 2013(1st January, 2014), provides for theestablishment of a Lokpal body for the Unionand Lokayuktas for States to inquire intoallegations of corruption against certainpublic functionaries and for mattersconnected therewith or incidental thereto.The 24 States that have already set upLokayuktas are: Andhra Pradesh, Assam,Bihar, Chhattisgarh, Delhi, Goa, Gujarat,Haryana, Himachal Pradesh, Jammu &Kashmir, Jharkhand, Karnataka, Kerala,Madhya Pradesh, Maharashtra, Meghalaya,Odisha, Punjab, Rajasthan, Sikkim, Tripura,Uttar Pradesh, Uttarakhand and West
Bengal.
iv. In pursuance of the ARC’s recommendationthat operational guidelines of alldevelopmental schemes and citizen-centricprogrammes should provide for a social auditmechanism, a revised EFC/PIB formateffective from 1st April 2014 issued by theMinistry of Finance (Department ofExpenditure) that requires all Ministries andDepartments to formulate proposals forEFC/PIB clearly indicating the arrangementsfor audit – or social audit – of the proposal.The NITI Aayog had also requested allconcerned that “social audit” be included inthe operational guidelines for the monitoringof the following flagship programmes: (i)Sarva Shiksha Abhiyan (SSA), (ii) Mid-dayMeal Scheme (MMS), (iii) Rajiv GandhiDrinking Water Mission, (iv) Total SanitationCampaign, (v) National Rural Health Mission,(vi) Integrated Child Development Scheme,(vii) National Rural Employment GuaranteeScheme, and (viii) Jawaharlal Nehru NationalUrban Renewal Mission.
4.9.2 In order to address deficiencies in the Preventionof Corruption Act, 1988, as regards the definition ofoffences, particularly those on the supply side ofdomestic corruption, and with a view to addressing otherperceived gaps in the Act, an exercise was undertakenby the Department of Personnel and Training. The mainobjectives of this exercise were:
To provide a clear and unambiguousdefinition for the term ‘corruption’.
To incorporate provisions for theconfiscation and forfeiture of propertyillegally acquired by a corrupt public servant.
To afford protection to public servants fromfrivolous and vexatious prosecution byextending the requirement of sanction by thecompetent government to retired officers orministers even after their demitting office,for acts committed while in office.
To lay down clear criteria and procedurefor sanction of prosecution.
86 APPRAISAL DOCUMENT OF TWELFTH FIVE YEAR PLAN
4.9.3 Based on the above exercise, proposals foramendments in the Prevention of Corruption Act, 1988,along with a related amendment in the Delhi Special PoliceEstablishment Act, 1946, were approved by the Cabinetat its meeting held on 1st May, 2013. Accordingly, thePrevention of Corruption (Amendment) Bill, 2013 hasbeen introduced in the Rajya Sabha on 19th August, 2013.The proposed amendments in the Prevention ofCorruption Act, 1988 are, inter alia, aimed at –
a) providing for a clear definition of differentforms of bribery including active bribery(i.e., for punishment of the bribe-giver) inline with international practice;
b) providing for liability of a commercial entityfor failure to prevent bribery of a publicservant by any person associated with suchcommercial entity;
c) incorporating separate provisions forconfiscation and forfeiture of propertyillegally acquired by corrupt public servants;
d) protecting honest public servants from frivolousand vexatious prosecution by extending therequirement of sanction by the competentgovernment to retired public servants for actscommitted while in office; and
e) laying down clear criteria and procedure forsanction of prosecution.
4.9.4 The proposed amendment of Section 6A of theDelhi Special Police Establishment Act is aimed atprotecting public servants at policy-making levels fromfrivolous and vexatious investigations by extending therequirement of approval by the Central Government evenafter they cease to be public servants or after they ceaseto hold sensitive policy-level positions.
4.9.5 The Prevention of Corruption (Amendment) Bill,2013 was referred to the Department RelatedParliamentary Standing Committee on Personnel, PublicGrievances, Law and Justice for examination and report.The Standing Committee has submitted its report on theBill to Parliament on 6th February, 2014, which is underconsideration by the Government.
4.9.6 e-procurement and e-tendering: All CentralGovernment organizations publish their tender enquiries,corrigenda and award of contract details through theCentral Public Procurement Portal of the Government
of India. The system also enables users to migrate tototal electronic procurement mode. The primary objectiveof this portal is to provide a single-point access to theinformation on procurements made across variousCentral Government organizations.
4.10: Civil Service Reforms
4.10.1 Given the large role of the Civil Services indevelopment and regulatory functions, the Twelfth Planlaid considerable emphasis on undertaking Civil Servicereforms to enable them to play these roles moreeffectively. The Plan suggested expeditiousimplementation of the various recommendations in theReport of the Second Administrative ReformsCommission (ARC). Some of the specificrecommendations identified in the Plan for special focusinclude:
(i) The need to keep the services young byrecruiting candidates at the age of around21 years;
(ii) Extensive and periodic training to enable theservices to handle the vast variety ofeconomic and management problems;
(iii) Providing long tenures to officers to enablethem to understand the intricacies of anassignment and make an effectivecontribution;
(iv) An ‘Up or out’ evaluation system so thatonly the better officers stay in service;
(v) Allowing the lateral entry of suitably qualifiedpersonnel from outside government into toppositions; and
(vi) The separation of the policy-making andexecution functions of the Government, andadoption of the ‘agency’ structure for theexecution function.
4.10.2 The Government has accepted most of therecommendations made in the Report of the 2nd ARCwhile decisions on some of the recommendations havebeen deferred. As regards the age for recruitment, it hasbeen decided to keep the upper age limit for entry at 26years for unreserved candidates, 28 for OBC, 29 forSC/ST candidates with an additional two years for thephysically challenged in each category. Regardingextensive and periodic training, the Government has
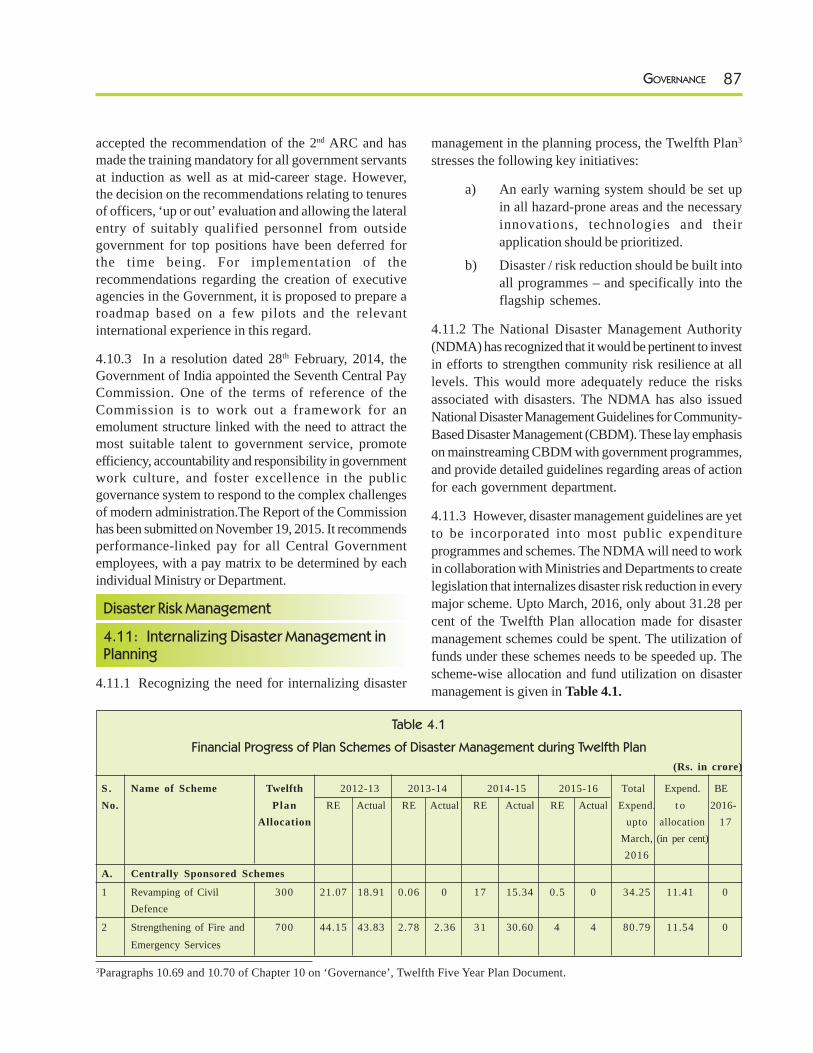
87GOVERNANCE
accepted the recommendation of the 2nd ARC and hasmade the training mandatory for all government servantsat induction as well as at mid-career stage. However,the decision on the recommendations relating to tenuresof officers, ‘up or out’ evaluation and allowing the lateralentry of suitably qualified personnel from outsidegovernment for top positions have been deferred forthe time being. For implementation of therecommendations regarding the creation of executiveagencies in the Government, it is proposed to prepare aroadmap based on a few pilots and the relevantinternational experience in this regard.
4.10.3 In a resolution dated 28th February, 2014, theGovernment of India appointed the Seventh Central PayCommission. One of the terms of reference of theCommission is to work out a framework for anemolument structure linked with the need to attract themost suitable talent to government service, promoteefficiency, accountability and responsibility in governmentwork culture, and foster excellence in the publicgovernance system to respond to the complex challengesof modern administration.The Report of the Commissionhas been submitted on November 19, 2015. It recommendsperformance-linked pay for all Central Governmentemployees, with a pay matrix to be determined by eachindividual Ministry or Department.
Disaster Risk Management
4.11: Internalizing Disaster Management inPlanning
4.11.1 Recognizing the need for internalizing disaster
management in the planning process, the Twelfth Plan3
stresses the following key initiatives:
a) An early warning system should be set upin all hazard-prone areas and the necessaryinnovations, technologies and theirapplication should be prioritized.
b) Disaster / risk reduction should be built intoall programmes – and specifically into theflagship schemes.
4.11.2 The National Disaster Management Authority(NDMA) has recognized that it would be pertinent to investin efforts to strengthen community risk resilience at alllevels. This would more adequately reduce the risksassociated with disasters. The NDMA has also issuedNational Disaster Management Guidelines for Community-Based Disaster Management (CBDM). These lay emphasison mainstreaming CBDM with government programmes,and provide detailed guidelines regarding areas of actionfor each government department.
4.11.3 However, disaster management guidelines are yetto be incorporated into most public expenditureprogrammes and schemes. The NDMA will need to workin collaboration with Ministries and Departments to createlegislation that internalizes disaster risk reduction in everymajor scheme. Upto March, 2016, only about 31.28 percent of the Twelfth Plan allocation made for disastermanagement schemes could be spent. The utilization offunds under these schemes needs to be speeded up. Thescheme-wise allocation and fund utilization on disastermanagement is given in Table 4.1.
3Paragraphs 10.69 and 10.70 of Chapter 10 on ‘Governance’, Twelfth Five Year Plan Document.
Table 4.1
Financial Progress of Plan Schemes of Disaster Management during Twelfth Plan
(Rs. in crore)
S . Name of Scheme Twelfth 2012-13 2013-14 2014-15 2015-16 Total Expend. BENo. Plan RE Actual RE Actual RE Actual RE Actual Expend. t o 2016-
Allocation upto allocation 17March, (in per cent)2016
A. Centrally Sponsored Schemes
1 Revamping of Civil 300 21.07 18.91 0.06 0 17 15.34 0.5 0 34.25 11.41 0Defence
2 Strengthening of Fire and 700 44.15 43.83 2.78 2.36 31 30.60 4 4 80.79 11.54 0
Emergency Services
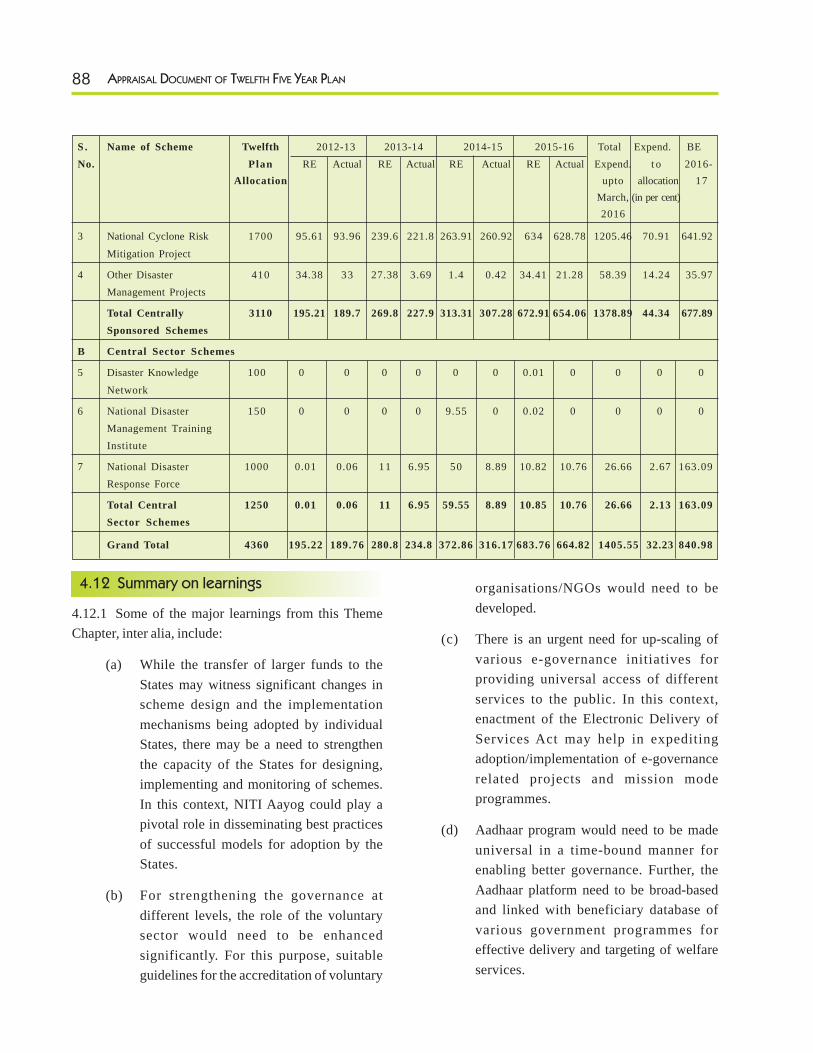
88 APPRAISAL DOCUMENT OF TWELFTH FIVE YEAR PLAN
organisations/NGOs would need to bedeveloped.
(c) There is an urgent need for up-scaling ofvarious e-governance initiatives forproviding universal access of differentservices to the public. In this context,enactment of the Electronic Delivery ofServices Act may help in expeditingadoption/implementation of e-governancerelated projects and mission modeprogrammes.
(d) Aadhaar program would need to be madeuniversal in a time-bound manner forenabling better governance. Further, theAadhaar platform need to be broad-basedand linked with beneficiary database ofvarious government programmes foreffective delivery and targeting of welfareservices.
4.12 Summary on learnings
4.12.1 Some of the major learnings from this ThemeChapter, inter alia, include:
(a) While the transfer of larger funds to theStates may witness significant changes inscheme design and the implementationmechanisms being adopted by individualStates, there may be a need to strengthenthe capacity of the States for designing,implementing and monitoring of schemes.In this context, NITI Aayog could play apivotal role in disseminating best practicesof successful models for adoption by theStates.
(b) For strengthening the governance atdifferent levels, the role of the voluntarysector would need to be enhancedsignificantly. For this purpose, suitableguidelines for the accreditation of voluntary
S . Name of Scheme Twelfth 2012-13 2013-14 2014-15 2015-16 Total Expend. BENo. Plan RE Actual RE Actual RE Actual RE Actual Expend. t o 2016-
Allocation upto allocation 17March, (in per cent)2016
3 National Cyclone Risk 1700 95.61 93.96 239.6 221.8 263.91 260.92 634 628.78 1205.46 70.91 641.92
Mitigation Project
4 Other Disaster 410 34.38 33 27.38 3.69 1.4 0.42 34.41 21.28 58.39 14.24 35.97Management Projects
Total Centrally 3110 195.21 189.7 269.8 227.9 313.31 307.28 672.91 654.06 1378.89 44.34 677.89Sponsored Schemes
B Central Sector Schemes
5 Disaster Knowledge 100 0 0 0 0 0 0 0.01 0 0 0 0
Network
6 National Disaster 150 0 0 0 0 9.55 0 0.02 0 0 0 0Management TrainingInstitute
7 National Disaster 1000 0.01 0.06 11 6.95 50 8.89 10.82 10.76 26.66 2.67 163.09Response Force
Total Central 1250 0.01 0.06 11 6.95 59.55 8.89 10.85 10.76 26.66 2.13 163.09Sector Schemes
Grand Total 4360 195.22 189.76 280.8 234.8 372.86 316.17 683.76 664.82 1405.55 32.23 840.98
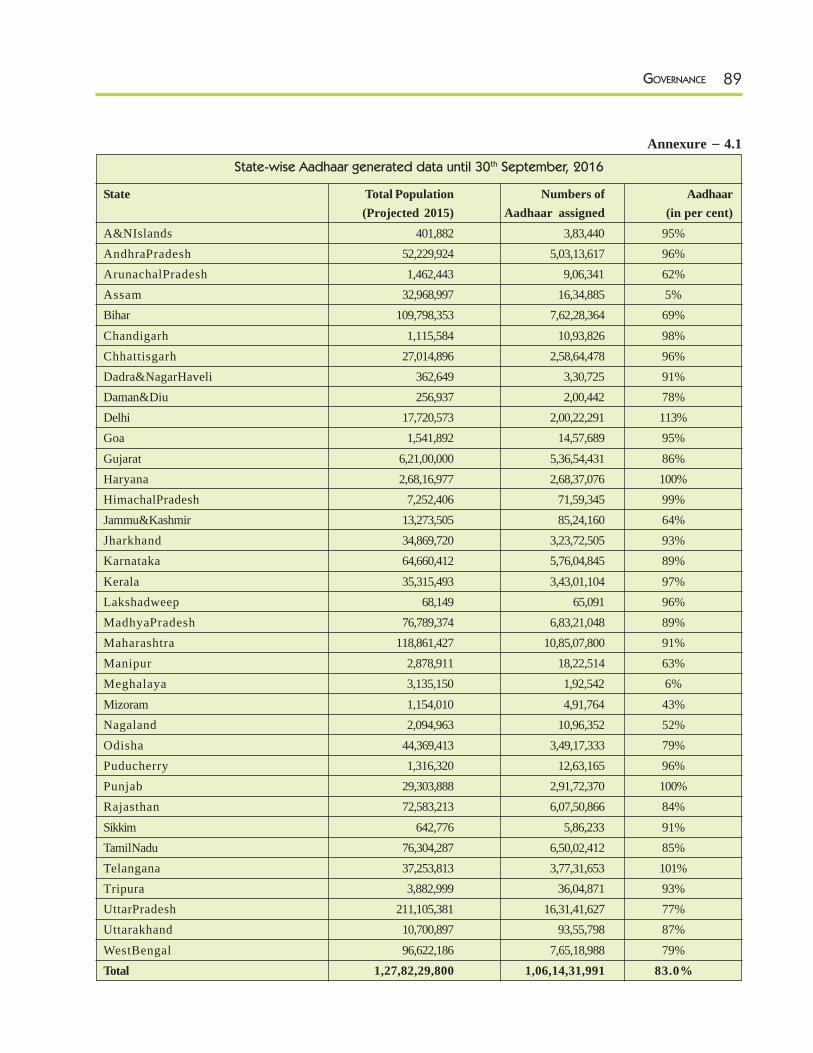
89GOVERNANCE
Annexure – 4.1State-wise Aadhaar generated data until 30th September, 2016
State Total Population Numbers of Aadhaar(Projected 2015) Aadhaar assigned (in per cent)
A&NIslands 401,882 3,83,440 95%AndhraPradesh 52,229,924 5,03,13,617 96%ArunachalPradesh 1,462,443 9,06,341 62%Assam 32,968,997 16,34,885 5%Bihar 109,798,353 7,62,28,364 69%Chandigarh 1,115,584 10,93,826 98%Chhattisgarh 27,014,896 2,58,64,478 96%Dadra&NagarHaveli 362,649 3,30,725 91%Daman&Diu 256,937 2,00,442 78%Delhi 17,720,573 2,00,22,291 113%Goa 1,541,892 14,57,689 95%Gujarat 6,21,00,000 5,36,54,431 86%Haryana 2,68,16,977 2,68,37,076 100%HimachalPradesh 7,252,406 71,59,345 99%Jammu&Kashmir 13,273,505 85,24,160 64%Jharkhand 34,869,720 3,23,72,505 93%Karnataka 64,660,412 5,76,04,845 89%Kerala 35,315,493 3,43,01,104 97%Lakshadweep 68,149 65,091 96%MadhyaPradesh 76,789,374 6,83,21,048 89%Maharashtra 118,861,427 10,85,07,800 91%Manipur 2,878,911 18,22,514 63%Meghalaya 3,135,150 1,92,542 6%Mizoram 1,154,010 4,91,764 43%Nagaland 2,094,963 10,96,352 52%Odisha 44,369,413 3,49,17,333 79%Puducherry 1,316,320 12,63,165 96%Punjab 29,303,888 2,91,72,370 100%Rajasthan 72,583,213 6,07,50,866 84%Sikkim 642,776 5,86,233 91%TamilNadu 76,304,287 6,50,02,412 85%Telangana 37,253,813 3,77,31,653 101%Tripura 3,882,999 36,04,871 93%UttarPradesh 211,105,381 16,31,41,627 77%Uttarakhand 10,700,897 93,55,798 87%WestBengal 96,622,186 7,65,18,988 79%Total 1,27,82,29,800 1,06,14,31,991 83.0%
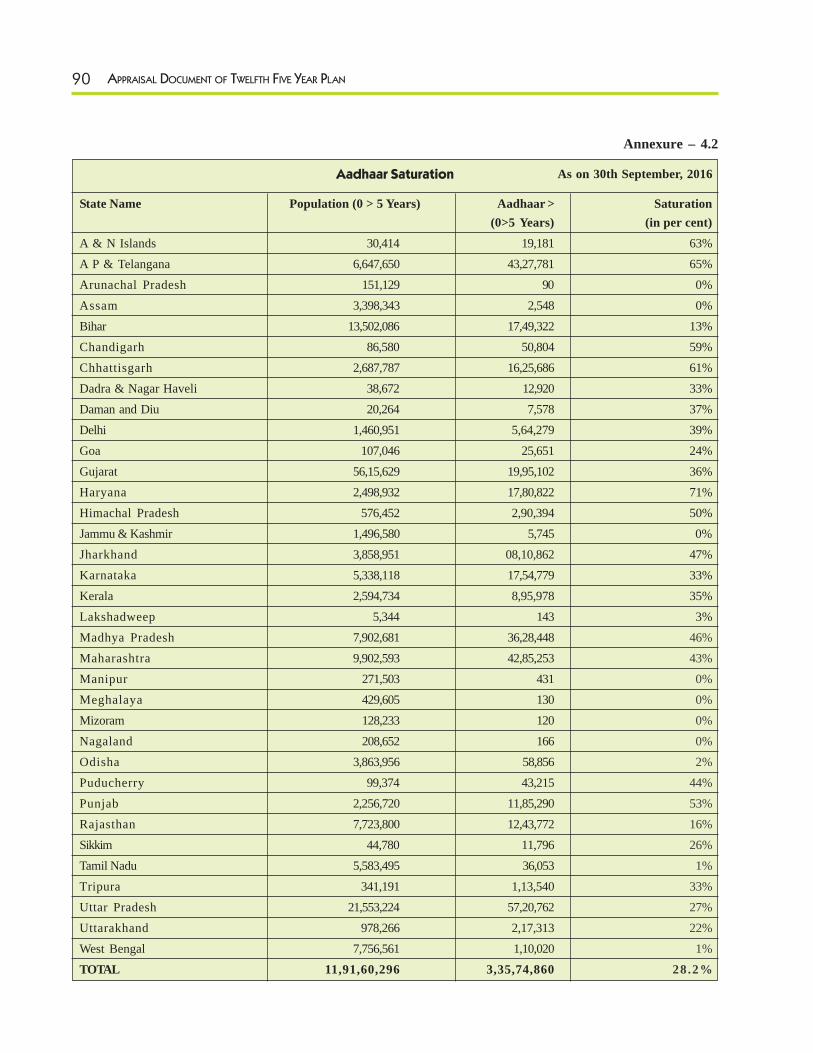
90 APPRAISAL DOCUMENT OF TWELFTH FIVE YEAR PLAN
Annexure – 4.2
Aadhaar Saturation
State Name Population (0 > 5 Years) Aadhaar > Saturation(0>5 Years) (in per cent)
A & N Islands 30,414 19,181 63%A P & Telangana 6,647,650 43,27,781 65%Arunachal Pradesh 151,129 90 0%Assam 3,398,343 2,548 0%Bihar 13,502,086 17,49,322 13%Chandigarh 86,580 50,804 59%Chhattisgarh 2,687,787 16,25,686 61%Dadra & Nagar Haveli 38,672 12,920 33%Daman and Diu 20,264 7,578 37%Delhi 1,460,951 5,64,279 39%Goa 107,046 25,651 24%Gujarat 56,15,629 19,95,102 36%Haryana 2,498,932 17,80,822 71%Himachal Pradesh 576,452 2,90,394 50%Jammu & Kashmir 1,496,580 5,745 0%Jharkhand 3,858,951 08,10,862 47%Karnataka 5,338,118 17,54,779 33%Kerala 2,594,734 8,95,978 35%Lakshadweep 5,344 143 3%Madhya Pradesh 7,902,681 36,28,448 46%Maharashtra 9,902,593 42,85,253 43%Manipur 271,503 431 0%Meghalaya 429,605 130 0%Mizoram 128,233 120 0%Nagaland 208,652 166 0%Odisha 3,863,956 58,856 2%Puducherry 99,374 43,215 44%Punjab 2,256,720 11,85,290 53%Rajasthan 7,723,800 12,43,772 16%Sikkim 44,780 11,796 26%Tamil Nadu 5,583,495 36,053 1%Tripura 341,191 1,13,540 33%Uttar Pradesh 21,553,224 57,20,762 27%Uttarakhand 978,266 2,17,313 22%West Bengal 7,756,561 1,10,020 1%TOTAL 11,91,60,296 3,35,74,860 28.2%
As on 30th September, 2016
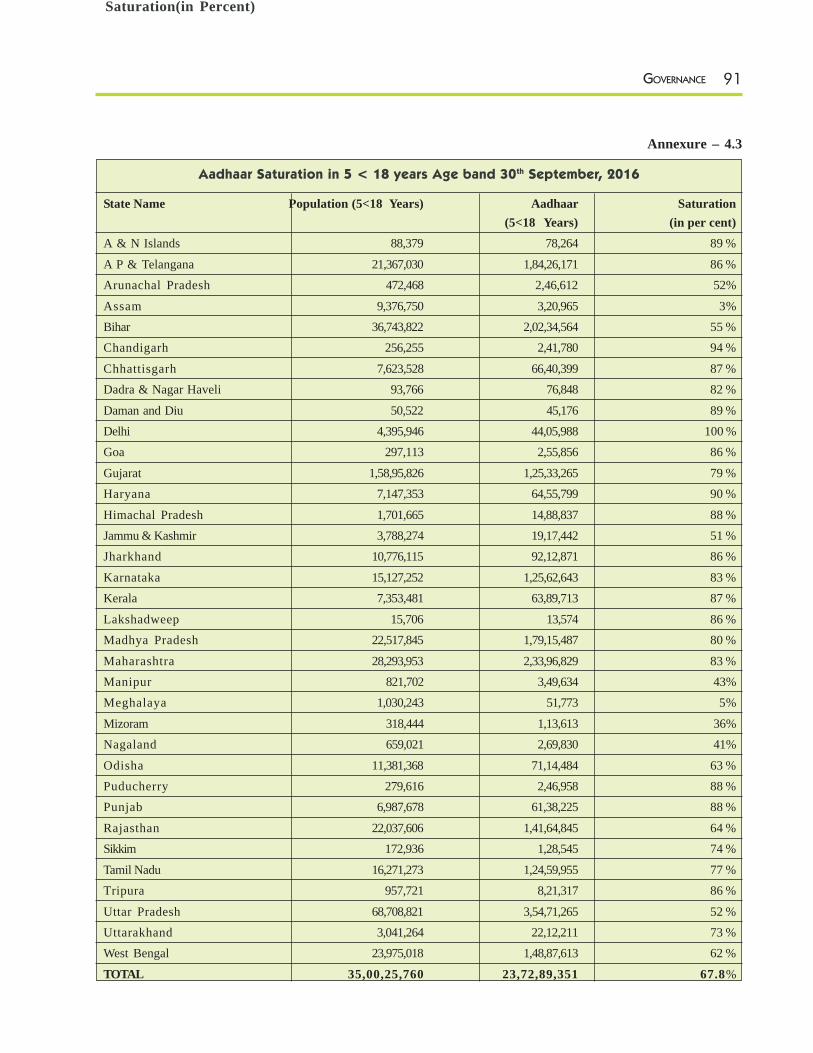
91GOVERNANCE
Annexure – 4.3
Aadhaar Saturation in 5 < 18 years Age band 30th September, 2016
State Name Population (5<18 Years) Aadhaar Saturation(5<18 Years) (in per cent)
A & N Islands 88,379 78,264 89 %
A P & Telangana 21,367,030 1,84,26,171 86 %Arunachal Pradesh 472,468 2,46,612 52%
Assam 9,376,750 3,20,965 3%Bihar 36,743,822 2,02,34,564 55 %Chandigarh 256,255 2,41,780 94 %
Chhattisgarh 7,623,528 66,40,399 87 %Dadra & Nagar Haveli 93,766 76,848 82 %
Daman and Diu 50,522 45,176 89 %Delhi 4,395,946 44,05,988 100 %Goa 297,113 2,55,856 86 %
Gujarat 1,58,95,826 1,25,33,265 79 %Haryana 7,147,353 64,55,799 90 %
Himachal Pradesh 1,701,665 14,88,837 88 %Jammu & Kashmir 3,788,274 19,17,442 51 %Jharkhand 10,776,115 92,12,871 86 %
Karnataka 15,127,252 1,25,62,643 83 %Kerala 7,353,481 63,89,713 87 %
Lakshadweep 15,706 13,574 86 %Madhya Pradesh 22,517,845 1,79,15,487 80 %
Maharashtra 28,293,953 2,33,96,829 83 %Manipur 821,702 3,49,634 43%Meghalaya 1,030,243 51,773 5%
Mizoram 318,444 1,13,613 36%Nagaland 659,021 2,69,830 41%
Odisha 11,381,368 71,14,484 63 %Puducherry 279,616 2,46,958 88 %Punjab 6,987,678 61,38,225 88 %
Rajasthan 22,037,606 1,41,64,845 64 %Sikkim 172,936 1,28,545 74 %
Tamil Nadu 16,271,273 1,24,59,955 77 %Tripura 957,721 8,21,317 86 %
Uttar Pradesh 68,708,821 3,54,71,265 52 %Uttarakhand 3,041,264 22,12,211 73 %West Bengal 23,975,018 1,48,87,613 62 %
TOTAL 35,00,25,760 23,72,89,351 67.8%
Saturation(in Percent)
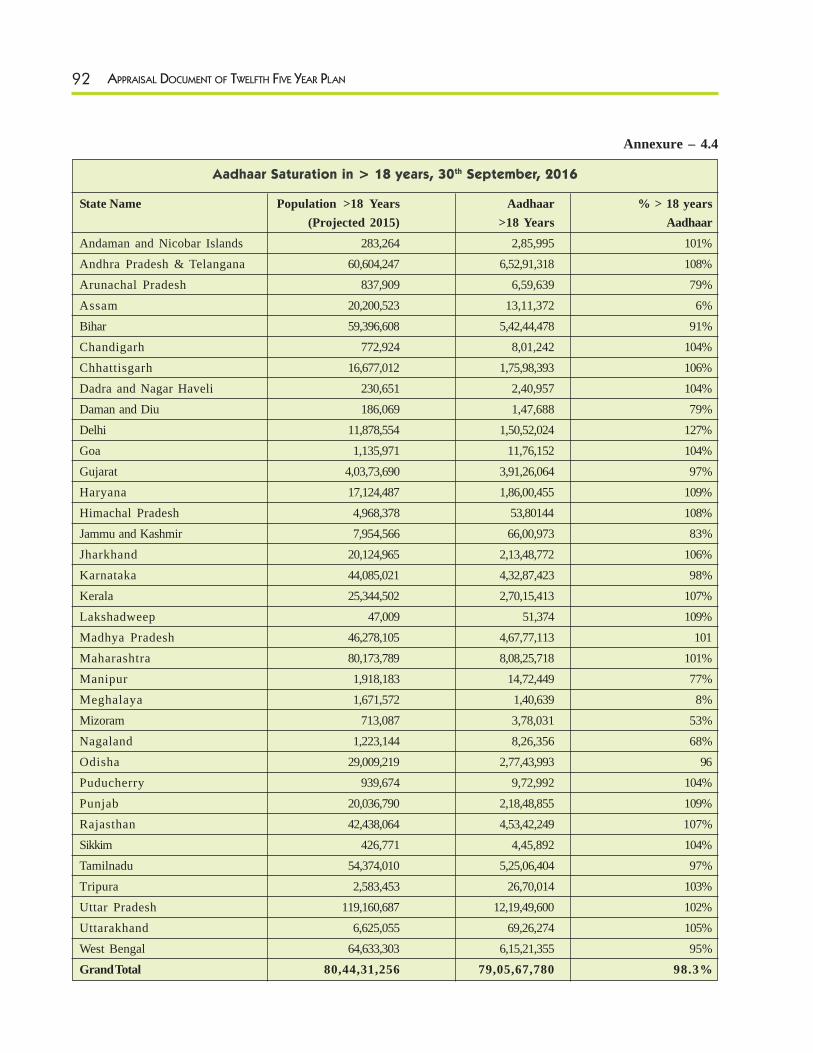
92 APPRAISAL DOCUMENT OF TWELFTH FIVE YEAR PLAN
Annexure – 4.4
Aadhaar Saturation in > 18 years, 30th September, 2016
State Name Population >18 Years Aadhaar % > 18 years(Projected 2015) >18 Years Aadhaar
Andaman and Nicobar Islands 283,264 2,85,995 101%Andhra Pradesh & Telangana 60,604,247 6,52,91,318 108%Arunachal Pradesh 837,909 6,59,639 79%Assam 20,200,523 13,11,372 6%Bihar 59,396,608 5,42,44,478 91%Chandigarh 772,924 8,01,242 104%Chhattisgarh 16,677,012 1,75,98,393 106%Dadra and Nagar Haveli 230,651 2,40,957 104%Daman and Diu 186,069 1,47,688 79%Delhi 11,878,554 1,50,52,024 127%Goa 1,135,971 11,76,152 104%Gujarat 4,03,73,690 3,91,26,064 97%Haryana 17,124,487 1,86,00,455 109%Himachal Pradesh 4,968,378 53,80144 108%Jammu and Kashmir 7,954,566 66,00,973 83%Jharkhand 20,124,965 2,13,48,772 106%Karnataka 44,085,021 4,32,87,423 98%Kerala 25,344,502 2,70,15,413 107%Lakshadweep 47,009 51,374 109%Madhya Pradesh 46,278,105 4,67,77,113 101Maharashtra 80,173,789 8,08,25,718 101%Manipur 1,918,183 14,72,449 77%Meghalaya 1,671,572 1,40,639 8%Mizoram 713,087 3,78,031 53%Nagaland 1,223,144 8,26,356 68%Odisha 29,009,219 2,77,43,993 96Puducherry 939,674 9,72,992 104%Punjab 20,036,790 2,18,48,855 109%Rajasthan 42,438,064 4,53,42,249 107%Sikkim 426,771 4,45,892 104%Tamilnadu 54,374,010 5,25,06,404 97%Tripura 2,583,453 26,70,014 103%Uttar Pradesh 119,160,687 12,19,49,600 102%Uttarakhand 6,625,055 69,26,274 105%West Bengal 64,633,303 6,15,21,355 95%Grand Total 80,44,31,256 79,05,67,780 98.3%
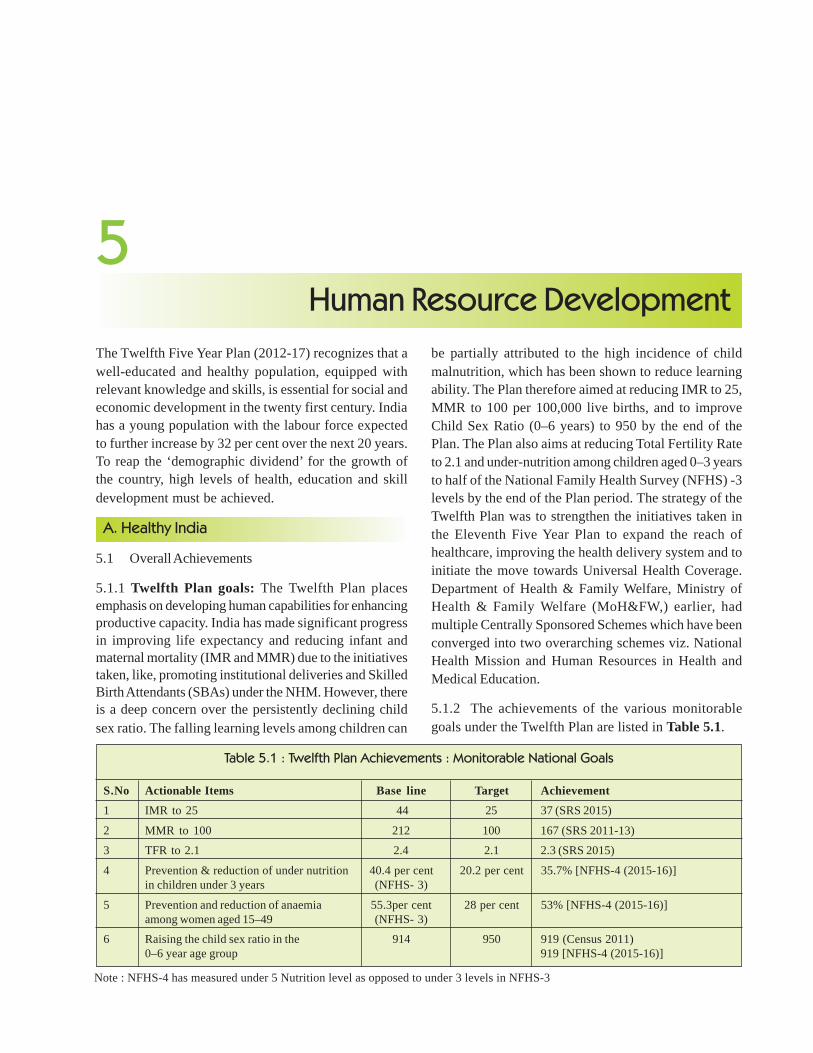
5Human Resource Development
The Twelfth Five Year Plan (2012-17) recognizes that awell-educated and healthy population, equipped withrelevant knowledge and skills, is essential for social andeconomic development in the twenty first century. Indiahas a young population with the labour force expectedto further increase by 32 per cent over the next 20 years.To reap the ‘demographic dividend’ for the growth ofthe country, high levels of health, education and skilldevelopment must be achieved.
A. Healthy India
5.1 Overall Achievements
5.1.1 Twelfth Plan goals: The Twelfth Plan placesemphasis on developing human capabilities for enhancingproductive capacity. India has made significant progressin improving life expectancy and reducing infant andmaternal mortality (IMR and MMR) due to the initiativestaken, like, promoting institutional deliveries and SkilledBirth Attendants (SBAs) under the NHM. However, thereis a deep concern over the persistently declining childsex ratio. The falling learning levels among children can
be partially attributed to the high incidence of childmalnutrition, which has been shown to reduce learningability. The Plan therefore aimed at reducing IMR to 25,MMR to 100 per 100,000 live births, and to improveChild Sex Ratio (0–6 years) to 950 by the end of thePlan. The Plan also aims at reducing Total Fertility Rateto 2.1 and under-nutrition among children aged 0–3 yearsto half of the National Family Health Survey (NFHS) -3levels by the end of the Plan period. The strategy of theTwelfth Plan was to strengthen the initiatives taken inthe Eleventh Five Year Plan to expand the reach ofhealthcare, improving the health delivery system and toinitiate the move towards Universal Health Coverage.Department of Health & Family Welfare, Ministry ofHealth & Family Welfare (MoH&FW,) earlier, hadmultiple Centrally Sponsored Schemes which have beenconverged into two overarching schemes viz. NationalHealth Mission and Human Resources in Health andMedical Education.
5.1.2 The achievements of the various monitorablegoals under the Twelfth Plan are listed in Table 5.1.
Table 5.1 : Twelfth Plan Achievements : Monitorable National Goals
S.No Actionable Items Base line Target Achievement1 IMR to 25 44 25 37 (SRS 2015)
2 MMR to 100 212 100 167 (SRS 2011-13)
3 TFR to 2.1 2.4 2.1 2.3 (SRS 2015)
4 Prevention & reduction of under nutrition 40.4 per cent 20.2 per cent 35.7% [NFHS-4 (2015-16)]in children under 3 years (NFHS- 3)
5 Prevention and reduction of anaemia 55.3per cent 28 per cent 53% [NFHS-4 (2015-16)]among women aged 15–49 (NFHS- 3)
6 Raising the child sex ratio in the 914 950 919 (Census 2011)0–6 year age group 919 [NFHS-4 (2015-16)]
Note : NFHS-4 has measured under 5 Nutrition level as opposed to under 3 levels in NFHS-3
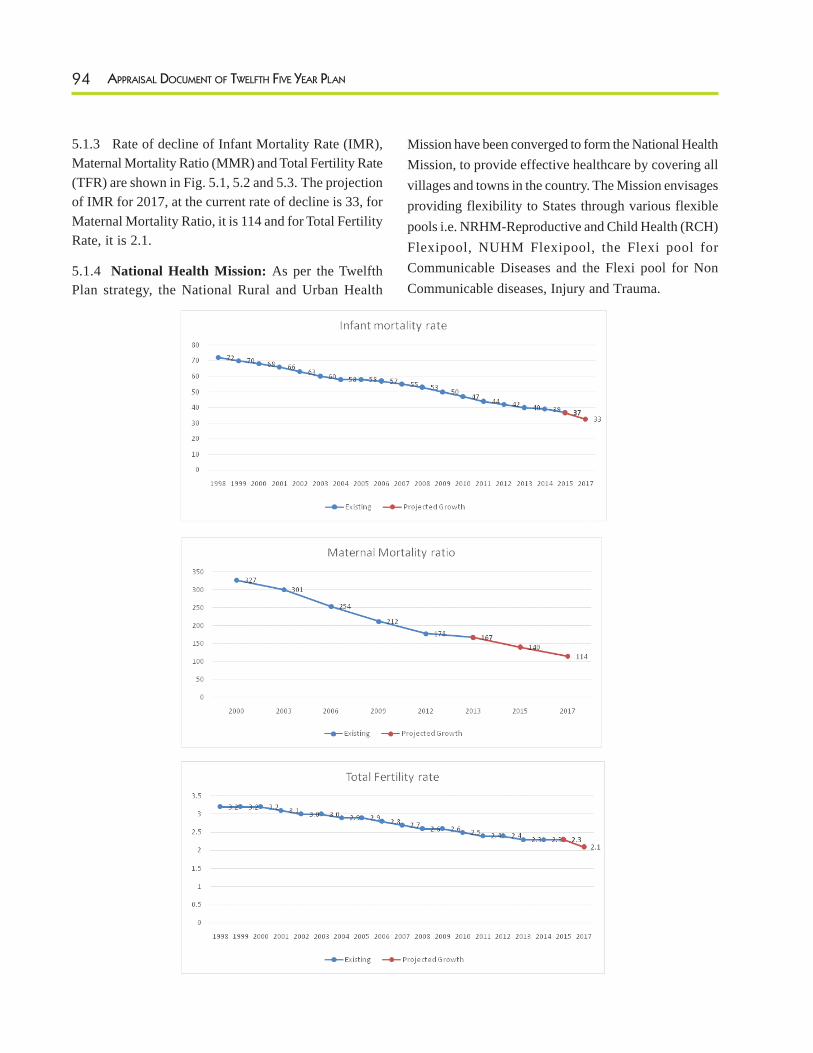
94 APPRAISAL DOCUMENT OF TWELFTH FIVE YEAR PLAN
Mission have been converged to form the National HealthMission, to provide effective healthcare by covering allvillages and towns in the country. The Mission envisagesproviding flexibility to States through various flexiblepools i.e. NRHM-Reproductive and Child Health (RCH)Flexipool, NUHM Flexipool, the Flexi pool forCommunicable Diseases and the Flexi pool for NonCommunicable diseases, Injury and Trauma.
5.1.3 Rate of decline of Infant Mortality Rate (IMR),Maternal Mortality Ratio (MMR) and Total Fertility Rate(TFR) are shown in Fig. 5.1, 5.2 and 5.3. The projectionof IMR for 2017, at the current rate of decline is 33, forMaternal Mortality Ratio, it is 114 and for Total FertilityRate, it is 2.1.
5.1.4 National Health Mission: As per the TwelfthPlan strategy, the National Rural and Urban Health
95HUMAN RESOURCE DEVELOPMENT
5.2 Health Care Service Delivery
5.2.1 Primary health care is provided through a networkof 1,55,069 sub centers (SCs) and 25,354 Primary HealthCentres (PHCs). In spite of such a vast network, theavailability of primary care to the common citizen islimited due to shortages in infrastructure and inadequatehuman resources. There is a shortage of 35,110 SCs(20 per cent) and 6,572 PHCs (22 per cent) as perpopulation norms (Bulletin of Rural Health Statistics-2016). As on 31st March, 2016, the overall shortfall inthe posts of Health Worker (Female) and Auxiliary NurseMidwife (HWF/ANM) was 2.53 per cent of the totalrequirement. Similarly 8.14 per cent of the PHCs werewithout a doctor, 44.59 per cent without a lab technicianand 27.10 per cent without a pharmacist- adverselyaffecting service delivery. Most of the shortfall inqualified manpower is concentrated in a few States,namely, Arunachal Pradesh, Chhattisgarh, Gujarat,Himachal Pradesh, Tamil Nadu, Tripura, Uttarakhandand Uttar Pradesh.
5.2.2 The Secondary level of health care is providedthrough a network of 5,510 Community Health Centres(CHCs) constituting the First Referral Units (FRUs);1,065 Sub-District Hospitals (SDHs) and 773 DistrictHospitals (DHs). There is a shortage of 2,210 (30 percent) CHCs (Bulletin of Rural health Statistics-2015).Overall a high 81.19 per cent of the sanctioned posts ofspecialists-surgeons, obstetricians & gynaecologists,physicians and paediatricians- at CHCs were vacant,severely constraining their service delivery capabilities.
5.2.3 Tertiary care in India is skewed towards urbanareas. Moreover, care by private providers is much moreexpensive than from government providers. As per the60th Round of the National Sample Survey (NSS), theaverage ‘total expenditure for hospitalised treatment perhospitalization case’, during a period of 365 days ingovernment facilities is Rs. 3,238 in rural areas and Rs.3,877 in urban areas. The corresponding figures fortreatment from private facilities are much higher beingRs. 7,408 in rural areas and Rs. 11,553 in urban areas.As per the 71st round of the NSS, this cost has increased
to Rs 6,120 in public health facilities and Rs.25, 850 inprivate facilities. Despite the cost differential, more than70% of illness spells were treated in the private sectorincluding clinics and hospitals and charitable institutions,with the remaining being treated in the public healthfacilities, Government hospitals account for about 70%of institutional deliveries in rural areas and 47% in urbanareas.
5.2.4 Rashtriya Swasthya Bima Yojana (RSBY) waslaunched in 2007 to address the health needs of theunorganised sector and operationalized in April, 2008.Under the Scheme, a smart card based cashlessinsurance, including maternity benefit with ahospitalization coverage of Rs. 30,000/- per annum, isprovided on a family floater basis to below poverty line(BPL) families (for upto five members of a family) and11 other defined categories of unorganized workers.Initially, this scheme was implemented by the Ministryof Labour and Employment, before it was transferredto Ministry of Health & Family Welfare on “as is whereis” basis with effect from 1st April 2015. At present, theRSBY is being implemented in 16 States and UTs. SeniorCitizen Health Insurance Scheme with an enhancedcoverage of Rs. 30, 000 per senior citizen in the eligiblefamily, over and above the RSBY (base cover), hasbeen implemented with effect from 1st April, 2016. It isexpected that a new National Health Protection Schememay be introduced during 2017-18 which will replaceRSBY.
5.2.5 Medical cover to the Central GovernmentEmployees is provided through the Central GovernmentHealth Scheme (CGHS). Since its operation is limitedto 25 cities, a large proportion of employees andpensioners remain excluded from this umbrella scheme.A rough estimate indicates that only 54 per cent (6.7lakh of 12.5 lakh) of serving employees and 44 percent(4.4 lakh of 10.12 lakh) of civil pensioners are CGHSbeneficiaries. Therefore, there is a need to extend thecoverage of CGHS to more dispersed locations, or, analternative system of medical coverage needs to bedevised.
96 APPRAISAL DOCUMENT OF TWELFTH FIVE YEAR PLAN
5.3 Strengthening Infrastructure for ImprovedAccess and Outreach
5.3.1 The Plan also aims at telemedicine and consultationsupport to doctors at primary and secondary facilitiesfrom specialists at tertiary centers. So far, 41 governmentmedical colleges have been connected to the NationalKnowledge Network (NKN) to ensure delivery of e-Education and e-Health initiatives. In addition, 27 RegionalCentres and 4 Peripheral Cancer Centres (PCCs) havealso been networked through a telemedicine network.Telemedicine solutions have been implemented in someStates on a pilot basis under NHM, but mainstreamingof such efforts requires greater perseverance andpersuasion.
5.3.2 A policy change has taken place for new healthfacilities under NHM, from a ‘population norms’ to a‘time to care’ norm in hilly and desert areas. Indian PublicHealth Standards (IPHS) guidelines for health facilities,staffing pattern for Health facilities have thus been revisedadding provisions for additional hands in response to anincrease in case load or in the range of servicesdemanded. In each State, 25 per cent of its districtswhich are in the lowest quintile of the health index havebeen identified as high priority districts. All tribal andleft wing extremism (LWE) affected districts, whichare below the State’s average of composite health index,have also been designated high priority districts. Thesedistricts are to receive higher per capita funding, relaxednorms, enhanced monitoring and focused supportivesupervision and are encouraged to adopt innovativeapproaches to address health challenges.
5.4 Moving Towards Universal Coverage
5.4.1 Free drugs service initiative: Under NHM FreeDrug Service Initiative- substantial funding is being givento States for provision of free essential drugs and settingup of systems for drug procurement, quality assurance,IT based supply chain management systems, trainingand grievance redressal, etc., subject to States/UTsmeeting certain specified conditions. Detailed OperationalGuidelines for NHM-Free Drugs Service Initiative wereissued in July 2015. Drugs and Vaccines Distribution
Management Systems (DVDMS) application developedby CDAC is being implemented in 17 States. All 36States/UTs have notified policy to provide essential drugsfree of cost in public health facilities.
5.4.2 Free Diagnostics Service Initiative: Under theNational Health Mission, Free Diagnostics ServiceInitiative, technical and financial support is provided toStates within their resource envelope for provision offree essential diagnostic services in public health facilities.The operational guidelines on Free Diagnostics ServiceInitiative also contain model RFP documents for a rangeof PPPs such as Tele radiology, hub and spoke modelfor lab diagnostics and CT scan facilities in DistrictHospitals. Further, to ensure functionality of equipment,support is also provided for comprehensive biomedicalequipment maintenance.
5.4.3 Emergency Patient Transport and ReferralSystem: Free referral and patient transport is beingprovided to pregnant women, sick children and patientsrequiring hospitalization. Over 22000 ambulances/ patienttransport vehicles are now-operational across states.These include Emergency Response Service vehiclesand Dial 102 Patient Transport Service vehicles andempanelled vehicles for transporting pregnant womento government hospitals for delivery and back.
5.4.4 Strengthening District Hospital for multispecialty care and as training site: District hospitals(DH) are now under increasing pressure due to increasedutilization and expectations from the population. Thereis thus a need to augment clinical services in all basicspecialty areas as per IPHS and also to develop them asInstitutions where skill based trainings can be conductedfor nursing and paramedical staff. Strengthening of DHwould ensure availability of minimum specialty servicesunder IPHS. The draft guidelines have shared with theStates. This has been identified as a key priority underNHM.
5.4.5 Pradhan Mantri National Dialysis Programme:The ‘Pradhan Mantri National Dialysis Programme’ hasbeen rolled out in 2016 under which support is being
97HUMAN RESOURCE DEVELOPMENT
provided to all States for provision of free dialysisservices for the poor. Guidelines for dialysis services inDistrict Hospitals in PPP mode with model RFP wereissued in April, 2016. Free Dialysis services to poor underthis initiative have become operational across about 300districts.
5.5 Strategies for Maternal and Child Health
5.5.1 It is the Government of India’s current policythat, all deliveries are to be undertaken by a skilled birthattendant (SBA). Under the Reproductive, Maternal,Newborn, Child and Adolescent Health (RMNCH+A)component of NHM more than 70,000 Auxiliary NurseMid wives (ANM), Lady Health Visitors (LHVs) andStaff Nurses (SNs) have also been trained as SkilledBirth Attendants (SBAs). ANMs are incentivised toperform skilled deliveries in villages with a high numberof home deliveries, including the remote and inaccessibleareas with a high proportion of home deliveries. Tostrengthen the service delivery under Maternal and ChildHealth, 495 dedicated maternal and Child Health Wingshave been approved to add 30,000 additional beds. ThePradhan Mantri Surakshit Matritava Abhiyan (PMSMA)has been launched to ensure quality antenatal and postnatal care to pregnant women in the country. Under thecampaign, a minimum package of anti natal care serviceswould be provided to the beneficiaries on the 9th day ofevery month at the Pradhan Mantri Surakshit MatritavaAbhiyan (PMSMA) clinics to ensure that every pregnantwomen receives at least one checkup in the second andthird trimester of pregnancy. The service of 108ambulance needs to be popularized in the States whichare lagging behind in MCH care.
5.5.2 Pre-term birth is an important cause of neonatalmorbidity and mortality. Guidelines to address morbiditiesdue to pre-maturity and to improve survival by use ofinjectable corticosteroids by ANMs to pregnant womanin pre-term labour, have also been developed. Anothersimple and cost effective intervention for improvingsurvival of pre-term and low-birth weight newborns isimplementation of Kangaroo Mother Care (KMC).
5.5.3 Home Based New-born Care (HBNC): Thiscrucial scheme for the reduction of neonatal mortalitylaunched in 2011 has incentivized Accredited Social HealthActivists (ASHAs) for providing home based essentialnew born care. ASHAs also make visits to all newborns
according to a specified schedule for the first 42 daysafter the child’s birth.
National De-worming Day (NDD):
Ministry of Health 8s Family Welfare had adopted a singleday strategy called National Dc-worming Day in 2015to combat STH infections in the children. During NDD,a single dose of Albendazole is administered to the childrenby school teachers and Anganwadi workers.
Ministry of Health and Family Welfare launched MAA-Mothers’ Absolute Affection programme in August 2016for improving breastfeeding practices (InitialBreastfeeding within one hour, Exclusive Breastfeedingup to six months and complementary Breastfeeding upto two years) through mass media and capacitybuilding of health care providers in health facilities aswell as in communities.
Intensified Diarrhoea Control Fortnight (IDCF) - Tocombat diarrheal mortality in children with the ultimateaim of zero child deaths due to childhood diarrhoea,Intensified Diarrhoea Control Fortnight (IDCF) is beingimplemented as a campaign in the month of July, since2014, for control of deaths due to diarrhoea across allStates & UTs.
5.5.4 India Newborn Action Plan (INAP): INAP aimsto end preventable newborn deaths and improve thequality of care through prioritizing such babies that areborn too soon, too small, or sick. These account for themajority of all newborn deaths. It also defines six pillarsfor intervention: pre-conception and antenatal care; careduring labour and child birth; immediate newborn care;care of healthy newborn; care of small and sicknewborn; and care beyond newborn survival. SpecialNewborn Care Units (SNCUs) have been set up in districthospitals and medical colleges to provide round the clockservices for sick newborns. Newborn Stabilization Units(NBSUs) at the level of FRUs and Newborn Care Corners(NBCCs) at delivery points have also been operationalizedall over the country.
5.5.5 Universal Immunization: As per the latestsurvey data available (NFHS-4), the immunizationcoverage has shown remarkable improvement in 23states as compared to NFHS-3, decline in immunizationcoverage is noted only in five states. Data for comparisonis not available for 8 states/UTs.
98 APPRAISAL DOCUMENT OF TWELFTH FIVE YEAR PLAN
The gaps in the programme are a matter of graveconcern, not only because of the high mortality burdenon account of Vaccine preventable diseases (37 per cent),but also because of the fact that infectious diseases affectthe vulnerable poor more than they do the rich.Additionally, the loss of productive hours owing to thesesicknesses has a potentially devastating economic impacton a vast majority of Indians whose survival is criticallydependent on their daily wage.
5.5.6 Mission Indradhanush:
Three phases of Mission Indradhanush have beencompleted and the fourth phase is ongoing in North-eastern states, with plan for expansion to other states inApril 2017. During the three phases and ongoing fourthphase, as on 1st March 2017, more than 2.1 crorechildren were reached of which more than 55 lakhchildren have been fully vaccinated. Further, 55.95 lakhpregnant women have been vaccinated with Tetanustoxoid. A total of 505 districts have been covered duringMission Indradhanush till, March 2017.
Inactivated Polio Vaccine (IPV): In concurrence withthe World Polio End Game strategy, IPV was introducedin November 2015 in six states. The expansion of IPVwas done throughout the country by June 2016. TillJanuary 2017, around 1.36 crore doses of IPV havebeen administered since its introduction.
Rotavirus Vaccine: To reduce the burden of diarrhoeacaused by Rotavirus, the government introducedRotavirus vaccine in March 2016 in four states ofAndhra Pradesh, Haryana, Himachal Pradesh and Odisha.The vaccine is provided as three doses at 6, 10 and 14weeks of age. The rotavirus vaccine has been expandedto four more states namely Assam, Madhya Pradesh,Rajasthan and Tripura on 18th February 2017 and willbe expanded to Tamil Nadu by May 2017.
Rubella vaccine as Measles Rubella (MR) vaccine:MR vaccination campaign targeting children from 9months up to 15 years of age, has been launched on 5thFebruary 2017 in five states namely Karnataka, TamilNadu, Goa, Lakshadeep and Pondicherry. Subsequentto the completion of the campaign, the Rubella vaccine
will be introduced as MR vaccine replacing measlescontaining vaccine 1 & 2 at 9-12 months and 16-24months of age. The vaccine will be introduced inremaining states in a phased manner.
Adult JE vaccine: Japanese Encephalitis vaccination inchildren was introduced in 2006. However, the vaccinewas expanded in adult population of districts with highdisease burden of adult JE in 2015. A total of 31 districtshave been identified for adult JE vaccination in the statesof Assam, Uttar Pradesh & West Bengal. Adult JEvaccination campaign has been completed in 21 districtsduring which 2.6 crore adults were vaccinated with JEvaccine. Of the newly identified 10 districts, thecampaign is ongoing in 6 new districts of West Bengaland 4 districts of Assam will be covered in last quarterof 2016-17.
Scale-up of Pentavalent vaccine:
To provide protection against pneumonia and diarrhoeacaused by Hemophilus influenzae b, Pentavalent vaccinewas introduced in two states in 2011. Till 2014, thevaccine was expanded to 8 states. Further expansion ofpentavalent vaccine was done in 2014 and 2015 withthe vaccine being scaled up nationally by December2015. The pentavalent vaccine has replaced three primarydoses of DPT and Hepatitis B given at 6, 10 and 14week of age. Till November 2016, around 12.5 croredoses of pentavalant vaccine have been provided.
5.5.7 Family Welfare: Data from NFHS 4 showsthat the unmet need for Family Planning has decreased(relative to NFHS 3) in the country. Under the NationalFamily Planning programme, new contraceptivechoices namely Injectable MPA (under Antaraprogramme) and Centchroman (Chhaya) have beenadded to the current basket of choices. The ‘MissionParivar Vikas’ has been launched in 146 high fertilitydistricts of seven high focus states for increasingaccess to contraceptives and family planning services.There is now a greater emphasis on promotion ofspacing methods and post-partum family planning.The ASHAs are actively involved in the home deliveryof contraceptives, providing pregnancy-testing kits aswell as promoting spacing among eligible couples within
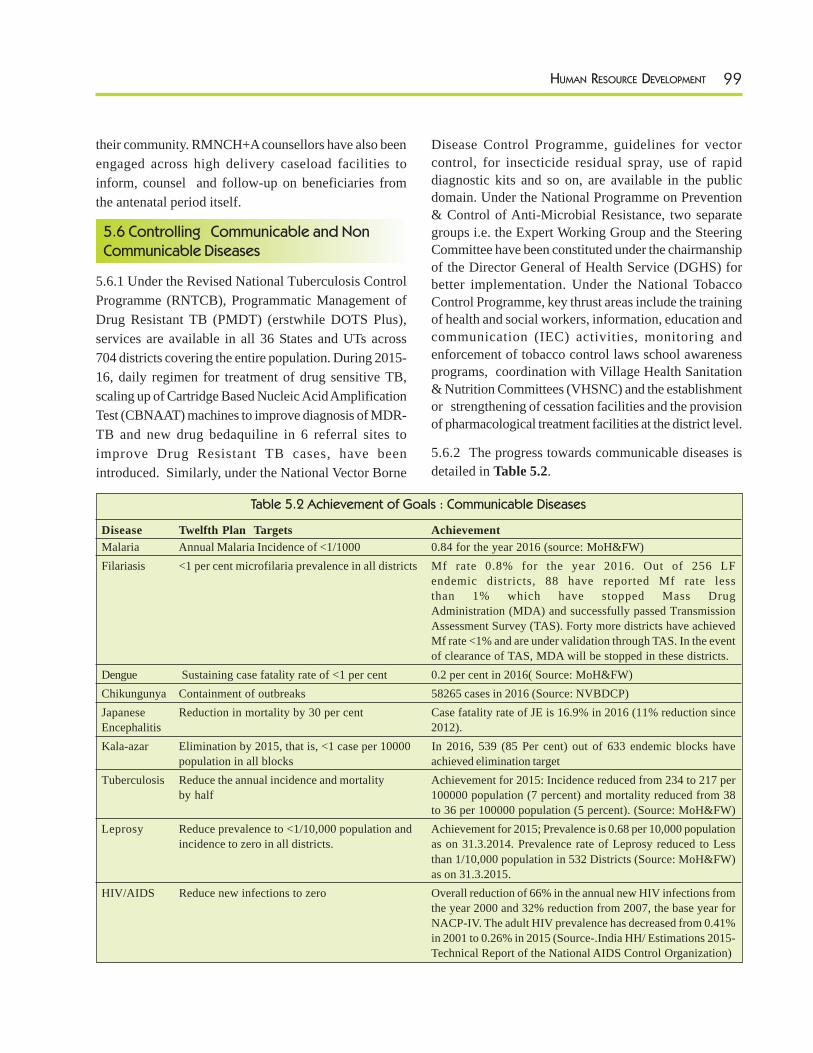
99HUMAN RESOURCE DEVELOPMENT
Disease Control Programme, guidelines for vectorcontrol, for insecticide residual spray, use of rapiddiagnostic kits and so on, are available in the publicdomain. Under the National Programme on Prevention& Control of Anti-Microbial Resistance, two separategroups i.e. the Expert Working Group and the SteeringCommittee have been constituted under the chairmanshipof the Director General of Health Service (DGHS) forbetter implementation. Under the National TobaccoControl Programme, key thrust areas include the trainingof health and social workers, information, education andcommunication (IEC) activities, monitoring andenforcement of tobacco control laws school awarenessprograms, coordination with Village Health Sanitation& Nutrition Committees (VHSNC) and the establishmentor strengthening of cessation facilities and the provisionof pharmacological treatment facilities at the district level.
5.6.2 The progress towards communicable diseases isdetailed in Table 5.2.
their community. RMNCH+A counsellors have also beenengaged across high delivery caseload facilities toinform, counsel and follow-up on beneficiaries fromthe antenatal period itself.
5.6 Controlling Communicable and NonCommunicable Diseases
5.6.1 Under the Revised National Tuberculosis ControlProgramme (RNTCB), Programmatic Management ofDrug Resistant TB (PMDT) (erstwhile DOTS Plus),services are available in all 36 States and UTs across704 districts covering the entire population. During 2015-16, daily regimen for treatment of drug sensitive TB,scaling up of Cartridge Based Nucleic Acid AmplificationTest (CBNAAT) machines to improve diagnosis of MDR-TB and new drug bedaquiline in 6 referral sites toimprove Drug Resistant TB cases, have beenintroduced. Similarly, under the National Vector Borne
Table 5.2 Achievement of Goals : Communicable Diseases
Disease Twelfth Plan Targets AchievementMalaria Annual Malaria Incidence of <1/1000 0.84 for the year 2016 (source: MoH&FW)Filariasis <1 per cent microfilaria prevalence in all districts Mf rate 0.8% for the year 2016. Out of 256 LF
endemic districts, 88 have reported Mf rate lessthan 1% which have stopped Mass DrugAdministration (MDA) and successfully passed TransmissionAssessment Survey (TAS). Forty more districts have achievedMf rate <1% and are under validation through TAS. In the eventof clearance of TAS, MDA will be stopped in these districts.
Dengue Sustaining case fatality rate of <1 per cent 0.2 per cent in 2016( Source: MoH&FW)Chikungunya Containment of outbreaks 58265 cases in 2016 (Source: NVBDCP)Japanese Reduction in mortality by 30 per cent Case fatality rate of JE is 16.9% in 2016 (11% reduction sinceEncephalitis 2012).Kala-azar Elimination by 2015, that is, <1 case per 10000 In 2016, 539 (85 Per cent) out of 633 endemic blocks have
population in all blocks achieved elimination targetTuberculosis Reduce the annual incidence and mortality Achievement for 2015: Incidence reduced from 234 to 217 per
by half 100000 population (7 percent) and mortality reduced from 38to 36 per 100000 population (5 percent). (Source: MoH&FW)
Leprosy Reduce prevalence to <1/10,000 population and Achievement for 2015; Prevalence is 0.68 per 10,000 populationincidence to zero in all districts. as on 31.3.2014. Prevalence rate of Leprosy reduced to Less
than 1/10,000 population in 532 Districts (Source: MoH&FW)as on 31.3.2015.
HIV/AIDS Reduce new infections to zero Overall reduction of 66% in the annual new HIV infections fromthe year 2000 and 32% reduction from 2007, the base year forNACP-IV. The adult HIV prevalence has decreased from 0.41%in 2001 to 0.26% in 2015 (Source-.India HH/ Estimations 2015-Technical Report of the National AIDS Control Organization)
100 APPRAISAL DOCUMENT OF TWELFTH FIVE YEAR PLAN
5.6.3 Despite the overall achievement of the TwelfthPlan’s goals on communicable diseases at the nationallevel, regional variations remain a matter of concern.The MoH&FW needs to share disaggregated data atdistrict level for such communicable diseases, so thatdistricts with endemic prevalence of specific diseasescan be identified. This would help in the formulation ofmicro-plans and strategies- both preventive and curative-that would target the complete elimination of suchdiseases from the affected pockets.
5.6.4 NCDs account for 60 per cent of total deaths inIndia. For non-communicable diseases, primary careincluding for the prevention of hypertension and diabetes,and screening is provided under the National Programmefor Prevention and Control of Cancer Diabetes,Cardiovascular Diseases and Stroke (NPCDCS). Theprogramme also deals with secondary prevention throughroutine follow up with medication to prevent strokes andischemic heart disease. Till March 2016, the programmeis being implemented in 468 districts with 318 districtNCD clinics in DHs and 1,705 in CHCs. Seventy oneCardiac Care units have been set up. 418 districts haveso far been sanctioned in the ROPs communicated to 34States/UTs under the NPHCE, to provide dedicatedhealth care facilities upto districts hospital to the elderlypeople in the country. Under the tertiary level activitiesof the Programme namely *RashtriyaVarishth JanSwasthyaYojana (RVJSY)’, 18 medical institutes haveso far been funded to develop Regional GeriatricCentres (RGCs) in different parts of the country. Also,AIIMS, New Delhi and MMC,^ Chennai have beenfunded to establish National Centres of Ageing (NCAs)each in the premises of these institutions. In addition, aLongitudinal Ageing Study in India (LASI) project hasbeen launched by the Ministry of Health and FamilyWelfare in collaboration with other International partnersat VigyanBhawan, New Delhi on 22nd March, 2016under tertiary level activities of the programme to assessthe health status of the elderly (age45-60 years).The main objectives of the study are to provide
comprehensive evidence based on health and well-beingof the elderly population in India.
5.7 Public Health:
5.7.1 The Twelfth Plan recognizes that a major weaknessof our health system is its insufficient focus on publichealth. Therefore a slew of initiatives have been takenwhich include, but are not limited to, the strengtheningof the eight existing branches of the National Centre forDisease Control (NCDC); the opening of 27 newbranches of the NCDC, the setting up of a CentralSurveillance Unit (CSU) in Delhi, State Surveillance Units(SSUs) in all State/UT headquarters and DistrictSurveillance Units (DSUs) in each district. Under theIntegrated Disease Surveillance Programme (IDSP),Surveillance units have been established at Centre (CSUs),State /UT (SSU) and Districts (DSU) and over 96% ofdistricts re reporting on a weekly basis. 2,679 earlywarning signals (EWS)/outbreaks were detected by IDSPand 117 District labs have been made functional as onDecember 2016.
5.7.2 Data Collection: As per therecommendationsof the Twelfth Plan, it had been proposed that the CentralBureau of Health Intelligence (CBHI) work as a NationalInstitute of Health Intelligence (NIHI). One of itsobjectives will be to collect, analyze and disseminatedata related to the health sector for evidence based policydecisions, planning and research.
5.8 Instruments for Service Delivery
5.8.1 Effective Governance: The NHM frameworkidentifies the role of Village Health Sanitation andNutrition Committee (VHSNC) as the forum for grassroot level action to address the common socialdeterminants of health. They will converge variousinitiatives at the village level. It envisages theinvolvement of ASHA, ANM and AnganwadiWorkers (AWWs) in training programmes(components of training include sanitation, drinkingwater, health & hygiene, the prevention andidentification of malnutrition, safe water storage &
101HUMAN RESOURCE DEVELOPMENT
distribution, the building and use of toilets, and handwashing as well as IEC for behavioural change for theseinterventions. Box 5.1 discusses how Gram ArogyaKendras in Madhya Pradesh already serve as platformfor convergence of the Integrated Child DevelopmentServices (ICDS) and Health.
Box 5.1: Best Practices of Convergence
Gram Arogya Kendra (GAK): Madhya Pradesh
MoH&FW with Ministry of Women and ChildDevelopment (WCD) under the “Health for All” initiativeestablished 49,000 Anganwadi-cum-GAK in each village.The first layer of provision of health services was throughASHA and ANM. They were further supervised by thesector supervisors and sector medical officers (i.e. themedical officer of the area PHC). Together they are calledSwasth Gram Prahari Dal.
1. They serve as a platform for the convergence ofhealth and nutrition services.
2. They decentralize health service delivery andreaching the last mile:
They ensure the timely availability of maternal and childhealth services and the early identification of potentialdisease conditions.
3. They address the second of the ‘three delays’ (delayin reaching the facility):
By co-locating the AWC and GAK, all women and child-related services are available in one place, and thecommunity can easily understand the links betweenhealth and its determinants like nutrition, water andsanitation.
4. They serve as a single unit for all village healthrecords.
5.8.2 Convergence with other SectoralProgrammes:
Rashtriya Bal Swasthya Karyakram (RBSK) which waslaunched in 2013 provides child health screening andearly interventions services by expanding the reach ofmobile health teams at block level. These teams carryout screening of all the children in the age group 0-6years enrolled at Anganwadi. Centres twice a year andchildren 6-18 years enrolled in government/government
aided schools, once a year. RBSK covers 30 commonhealth conditions, including- early detection of birthdefects, diseases, deficiencies and development delays(4 Ds). The programme also works in tandem with theMinistry of Women and Child Development, Ministryof Social Justice and Empowerment and Ministry ofHuman Resource Development.
5.8.3 3Accountabilityfor Outcomes: The model foraccountability includes a three tier structure wherein theMission Steering Group (MSG) oversees the programmeimplementation and governance at the national level: theState Health Mission and the governing body of the StateHealth Society does so at the State level; and the District/City Health society does so at that level. At the facilitylevel, the RogiKalyanSamiti (RKS) will play a similar rolein ensuring accountability to the community. Anothermajor accountability mechanism is the DISHA Committee,which functions under the chairpersonship of the localMember of Parliament and includes participants fromPanchayti Raj Institutions (PRIs) and all related socialsectors in the district. The NHM also encouragescommunity oversight to the programme through themechanism of social audit and periodic concurrent andstatutory audits. Common Review Missions, withparticipation from the Ministry, partners, civil societyorganizations and public health experts are anothermechanism to review the programme performance onan annual basis.
5.9 Regulatory Framework
5.9.1 Health and Medical regulation: The “CentralDrugs Standards Control Organization”(CDSCO) hasbeen functional for quite some time now and has beenregulating medical products such as drugs, and medicaldevices, it also oversees the conduct of clinical trials.The “Food Safety & Standards Authority of India”(FSSAI) has been functional since 2008.
5.9.2 Efforts are being made to strengthen CDSCO toenable it to take decisions for the safe use of medicines.However, much remains to be accomplished: for one,drug regulation needs to be reformed to prevent theCentre and States jurisdictions from overlapping. Inaddition the Drugs and Cosmetics Act, 1940 needs to
102 APPRAISAL DOCUMENT OF TWELFTH FIVE YEAR PLAN
be amended so that it applied to medical devices inaddition to the drugs. A beginning has been made byframing separate rules for medical devices. Rules havebeen framed for the regulation of clinical research andtrials to ensure the safety of clinical trial participants;however this is still a work in progress and furtherrefinement would be necessary
5.9.3 The FSSAI is undertaking a major e-Govcrnance exercise for ensuring greater transparencyand also to create awareness on food safety matters.Its website (www.fssai.gov.in) has been fullyoperationalized and the information is extensive andupdated. The electronic, print and social media is alsobeing used for this purpose.
5.9.4 Regulation of medical practice: The ClinicalEstablishments Act 2010 is now applicable in ten Statesnamely Arunachal Pradesh, Bihar, Himachal Pradesh,Jharkhand, Mizoram, Rajas than, Sikkim, Uttar Pradesh,Uttarakhand, Assam and all SixUnion Territories, exceptDelhi. Draft minimum standards in standard formatshave been prepared for major categories of clinicalestablishments and for 33 categories of specialty / superspecialty-wise departments.Standard TreatmentGuidelines for 21 medical domains have been finalized.Similarly, draft formats for collection of statistics fromclinical establishments have been finalized. The Pre-Conception and Pre-Natal Diagnostic Techniques(PCPNDT) Act, 1994 is also being enforced in all Statesthrough proactive measures.
5.10 Medical Education and HumanResources in Health
5.10.1 According to the records of the Medical Councilof India (MCI), there were 9.29 lakh doctors in the IndianMedical Register as on 31st March 2014. Assuming 80percent availability, it is estimated that, around 7.4 lakhdoctors may actually be available for active service. Thatmeans a doctor to population ratio of 1:1,674 against theWHO norm of 1:1,000. There are also an estimated 7.71lakh Ayurvedic, Unani, Siddha, Naturopathy andHomeopathic practitioners. If they are included thatwould means the availability ratio rises to 1:855. Thiscould happen only through amending State level lawabout registration of doctors and providing an enabling
provision to also allow the enrolment of Indian Systemof Medicine (ISM) professionals in the State medicalregister.
5.10.2 To encourage doctors working in remote anddifficult areas, the MCI with the approval of the CentralGovernment has amended the Post Graduate MedicalEducation Regulations, 2000, thus to provide 50% percent reservation In Post Graduate diploma courses forgovernment medical officers in the Government service,who have served for at least three years in remote ordifficult areas, An incentive of 10 per cent of the marksobtained in the entrance test up to the maximum of 30per cent will be granted to such officers.
5.10.3 Bachelor of Science (Community Health) coursehas been approved to create mid-level healthprofessionals to be primarily deployed at sub-centres,currently manned by an Auxiliary NurseMidwife(ANM). These graduates would be expected to possessthe necessary public health and ambulatory carecompetencies to serve rural population. Assam,Chhattisgarh and Jharkhand have shown willingness toadopt the course and include the same in their Stateprogramme implementation plant (PIPs) for the NHM.
5.10.4 To strengthen India’s medical human resourcesbase in terms of general physicians, specialists andparamedics, a number of Centrally Sponsored ‘Schemeshave been initiated in the Twelfth Plan. These include:
i. The establishment of new medical colleges(upgrading district hospitals): 22 have beenapproved.
ii. Setting up of 14 more AIIMS in differentstates will increase the intake of UG seatsby 100 per institute per batch and BSc.Nursing seats by 60% per institute per batchwhen completed. Subsequently, PG courseswill be started in all these AIIMS, increasingPG seats as per prevalent norms.
iii. Financial assistance to strengthen andupgrade 72 government medical collages toincrease the number of Post Graduate seatsby 4,000 nos.
iv. Setting up 36 State level institutions of alliedhealth sciences in government medical
103HUMAN RESOURCE DEVELOPMENT
colleges with an annual through put of 4,680allied health ,professionals.
v. Setting up 45 pharmacy colleges with anannual output of 5,400 pharmacists.
vi. In the Twelfth Plan, a National Institute ofParamedical Science (NIPS) at Najafgarh,Delhi and five Regional Institutes ofParamedical Sciences (RIPS) atBhubaneswar, Nagpur, Chandigarh,Coimbatore and Bhagalpur have beenapproved. These are aimed at bridging thegap between the need for and the availabilityof paramedical professional. They wouldalso function as centres for improving thequality ofparamedical training.
5.11 Health Information System
5.11.1 NHM envisages a fullyfunctional healthinformation for effective decision-making. /This requiresinformation of service delivery, data both aggregate andgranular, including HMIS, MCTS, Hospital informationSystem data, Revised National TB ControlProgrammeIDSP,Clinical Establishments Act, PCPNDTimplementation. The output of these systems also needsto be linked for display in the GIS application. States/UTs are uploading facilities wise information on thenational HMIS Portal. A fully functional health informationsystem is yet to be put in place.
5.11.2 Recent e health initiatives taken by MoHFWinclude Kilkari that delivers free, weekly, time-appropriate 72 audio messages about pregnancy, childbirth and child care directly to families’ mobile phonesfrom the second trimester of pregnancy until the childis one year old. Kilkari has been launched in Jharkhand,Odisha, Uttar Pradesh, Uttarakhand, MadhyaPradesh,Himachal Pradesh, Delhi, Bihar and Rajasthan.
ANM Online, a tablet based application allows ANMsto enter and update the service records of beneficiarieson real / near real time basis and also acts as a job aid.ANMOL has been successfully implemented in the entireState of Andhra Pradesh and is currently being used by11,865 ANMs in the State.
Mobile Academy, a free audio training course designedto expand and refresh the knowledge base of AccreditedSocial Health Activists (ASHAs) and improve theircommunication skills, has been implemented across fiveStates.
E-RaktKosh initiative, acentralized blood bankmanagement system to provide information on availabilityof nearest blood bank, status of a particular blood groupin blood banks, navigator assistance and automation ofblood bank services apart from donor registries andpromotion of voluntary donation in phased manner hasalso been implemented.
MeraAspataalthat captures patients’ feedback abouttheir experience in the health facilities on the servicesthat they received or sought to receive, to make healthcare delivery in public health facilities more patient centricand accountable.
5.11.3 Best practices adopted for Health InformationSystem by the States are depicted in Box 5.2.
Box 5.2: Best Practices for Information Technology in
Health
i. Madhya Pradesh: The State has started maternaldeath reviews through Skype with the nodal officersof each district.
ii. Lakshadweep: The Union Territory of Lakshadweephas achieved 100 per cent in birth and deathregistration, institutional deliveries, immunizationand through their sustained efforts.
iii. Gujarat: GIS mapping has been effectively utilizedto select the best location for new health facilitiesin poorly serviced area. The Government of Gujarathas also sanctioned High Impact Interventions in77 high priority talukas through a Special PurposeVehicle (SPV).
iv. West Bengal: Web enabled software StoreManagement Information System (SMIS) has beenintroduced in all health units. The procurementthrough the system is being done by the healthunits up to the level of Sub Divisional Hospital (SDH)to generate procurement orders against fundallotment.
v. Haryana : Has taken up on a pilot basis , the onlineBirth Registration Process leading to the generationof the Aadhar identity of the newborn. Scaling up isnow under process.
104 APPRAISAL DOCUMENT OF TWELFTH FIVE YEAR PLAN
5.12 New and Upgraded Medical Institutions
5.12.1 Two major Central Sector Schemes namelyPradhan Mantri Swasthya Suraksha Yojana (PMSSY)and Redevelopment of Hospital/ Institutions whichprovide funding to Institutions namely AIIMS, NewDelhi, PGIMER, Chandigarh, JIPMER Puducherry,Safdarjang Hospital & Medical college, New Delhi etc.:together account for 51.61 per cent of the Twelfth Planallocation for Medical Education of the Central Sectorallocation for Medical Education.
5.12.2 The objective of PMSSY is to correct theimbalances in availability of affordable/reliable tertiarylevel healthcare in the country in general and to augmentfacilities for quality medical education in the under-servedareas by setting up AIIMS or AIIMS like Institutions atthe regional level. The three new AIIMS at AndhraPradesh, Maharashtra and West Bengal will have a 960bed hospital intended to provide healthcare facilities in42 speciality or super speciality disciplines. New AI1MSat Bathinda, Gorakhpur and other upcoming A1IMS willhave a 750 bed hospital with 39 speciality or superspeciality departments.
5.12.3 In all, the six new AIIMS, set up under the firstphase of PMSSY, the medical colleges and nursingcolleges have begun admitting students and the hospitalshave been made functional for MBBS and B.Sc.(Nursing) teaching purposes. In the second phase ofPMSSY, 2 more AIIMS like institutions have beenapproved to be set up at Rae Bareli in UP and in WestBengal. The project in west Bengal shall be establishedin Phase-IV. Under phase-IV of PMSSY, the fourannounced AIIMS in Andhra Pradesh, West Bengal,Maharashtra and Gorakhpur have been approved by theUnion Cabinet. In the fifth phase, seven AIIMS havebeen announced at Jammu, Kashmir, Punjab, Assam,Bihar, Himachal Pradesh and Tamil Nadu. Cabinet hasapproved setting up of AIIMS in Bathinda, Punjab.
73 government medical colleges have been approvedfor upgradation under different phases of PMSSY. Ofthe 13 existing government medical colleges selected
for upgradation under the first phase, 10 have beencompleted. 6 existing government medical colleges havebeen taken up under second phase, out of which 3 havebeen completed. 39 existing government medical collegesare being upgraded under the third phase. 13 existinggovernment medical colleges have been approved forupgradation under fourth phase. Also, 2 governmentmedical colleges have been approved by the Ministry tobe upgraded under PMSSY.
5.12.4 Redevelopment of Hospitals/Institutions:This scheme aims at creating and improving theinfrastructure of nine Central Government hospitals orinstitutions during the Twelfth Plan. The proposals forinfrastructure development under this scheme have beenreceived for the establishment of a National Cancerinstitute at Jhajjar in Haryana and for construction of anew OPD building at Masjid Moth Campus at AIIMS,New Delhi, for the setting up of a satellite centre ofPGIMER Chandigarh at Sangrur, for the redevelopmentof SafdarjangHospital, New Delhi (Phase-I) and forestablishment of JIPMERInternational School of PublicHealth at JIPMER, Puducherry.
5.13 Indian System of Medicine andHomeopathy (AYUSH)
5.13.1 The strength of the AYUSH system lies inpreventive and promotional health care, diseases andhealth conditions relating to women and children, non-communicable diseases, geriatric healthcare stressmanagement, palliative Care, rehabilitation and so on.The Department of AYUSH has been elevated to a full-fledged Ministry with effect from 9th November 2014.Moreover, responding to the India initiative, the UnitedNations has declared 21st June as International Yogaday which was celebrated with fervour across the globeon 21st June, 2015 and second on 21st June, 2016. Thefollowing is the status of key recommendations of theTwelfth Plan with regard to AYUSH.
5.13.2 Integration of AYUSH facilities: TheGovernment of India has adopted a strategy of co-location of AYUSH facilities at Primary Health Centres,Community Health Centres
105HUMAN RESOURCE DEVELOPMENT
and District Hospitals. The engagement of AYUSHDoctor / paramedics and their training is supported bythe Department of Health & Family Welfare, whilesupport for AYUSH infrastructure, equipment / furnitureand medicines is provided by Ministry of AYUSH underthe National AYUSH Mission. So far, AYUSH facilitiesare providedin 50 per cent of CHCs and 37 percent ofPHCs.
5.13.3 National AYUSH Mission:Four erstwhileCentrally Sponsored Schemes of the Ministry of AYUSHnamely development of AYUSH Hospital andDispensaries:
Development of AYUSH Educational Institutions:Development of Quality Control of Ayurveda, Siddha,Unani and Homoeopathy (ASU8&H) Drug and theNational Mission on Medical plants have been mergedinto a single ‘National AYUSH Mission to support theefforts of State/UT Governments to provide AY’USHhealth services/education in the country, particularlyin vulnerable and far-flung areas. The concept of AYUSHGram - as envisaged in Twelfth Plan document- is alsocovered under the National AYUSH Mission. Theresponsibility for developing system - wise standardtreatment guidelines in AYUSH has been given to theNational Institute of Siddha, in Tamil Nadu, the NationalInstitute of Homoeopathy, in Kolkata, the NationalInstitute of Unani Medicine, in Bengaluru, the NationalInstitute of Ayurveda, in Jaipur, Institute of Post GraduateTeaching and Research in Ayurveda in Jamnagar, the
;Morarji Desai National Institute of Yoga, in New Delhiand the National Institute of Naturopathy, in Pune.
5.13.4 Medicinal Plants: A thrust is being providedfor the conservation and cultivation of medicinal plants,the livelihood augmentation of communities by valueaddition to raw material, R&D, and facilitating qualityassurance. A start has been made to support setting upof common facilities for testing, certification,standardization, quality control facilities and othercapacity building measures in ten AYUSH industryclusters in different regions. To ensure internationallyacceptable standards for AYUSH drugs, a PharmacopeiaCommission of Indian medicine and homoeopathy hasbeen established. Steps have also been taken for global
promotion of the AYUSH systems. Ministry of AYUSHhas signed MOU with World Health Organization forcooperation on traditional medicine.
5.13.5 Research and Quality Assurance: An AYUSHresearch portal has been operationalized and augmentedwith about 22979 to promote evidence- based practiceand research in AYUSH and project scientificdevelopments in the AYUSH sector. A voluntary qualitycertification mechanism for granting standard andpremium marks has been put in place under the aegis ofQuality- Council of India (QCI). National Medicinal PlantBoard (NMPB) has finalized a scheme for the voluntarycertification of raw materials from medicinal plants incollaboration with the Quality Council of India (QCI).Organic cultivation and certification of medicinal plants,is being supported by NMPB under its schemes.Deviating from the existing practice of a commonlegislation and regulatory system for allopathic andAYUSH medicines, the Ministry has decided to have aseparate legislation for regulation of AYUSH drugs andset up Central Drug Controller for AYUSH.
5.13.6 Human resource: Theprogress of reforms inAYUSH undergraduate and postgraduate education hasbeen slow. It is proposed to link the major AYUSHeducation institutes with a broadband network underNational Knowledge Network (NKN). This will help toconnect the National Institutes under AYUSH with otherimportant institutes such as AIIMS, IITs etc.
5.14 National AIDS Control Programme (NACP)
5.14.1: India is estimated to have around 86000 annualnew HIV infections in 2015, showing 66% decline innew infections from the year 2000 and 32% declinefrom 2007, the base year for NACP-IV. Adult HIVprevalence has decreased from 0.41% in 2001 to 0.26%in 2015 with 21.17 lakhs people living with HIV/AIDSin the country according to HIV estimations 2015technical report of NACO. The Department of AIDSControl has since been merged with the Department ofHealth & Family Welfare, common policy and oversightmechanisms have been set up in NRHM-NACPCoordination Committee (NNCC) at the National level,and the Joint Programme Management Committee(JPMC) at the State Level.
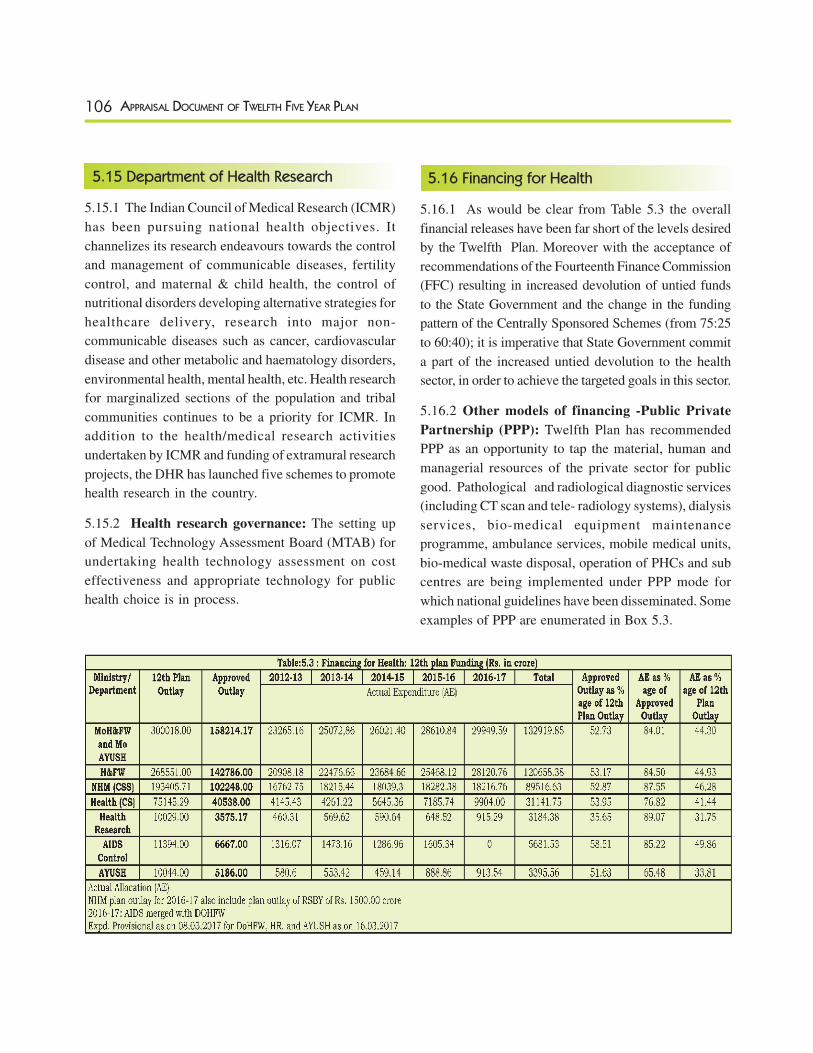
107HUMAN RESOURCE DEVELOPMENT
Box 5.3: Best Practices for Public Private Partnership
1 West Bengal : 68 fair price outlets have been set-up forthe supply of medicines, consumables and implants ingovernment hospitals through PPP, offering 48 per centto 67.25 per cent discount on MRP under PPParrangements. Fair price diagnostic centers and dialysisunits have also been set up.
2. Lakshadweep: Specialty hospital and dialysis units havestarted functioning in the Lakshadweep Islands underPPP mode with all modern amenities.
3. Gujarat: Mukhyamantri Amrutam (MA) Yojana :The scheme provides “cashless,” quality tertiary medicaland surgical care to the members of BPL families with achain of 63 empanelled hospitals (44 private hospitals)providing up to a sum of Rs. 2 lakh per family, per year,on a family floater basis including new born childrenfrom day one. This is not an insurance based scheme as itis 100 per cent funded by the State.
5.17 Summary of main learnings:
5.17.1 Despite significant improvements in healthindicators and achievement of Millennium DevelopmentGoals to a large extent, the targets of the Twelfth Planwere largely missed, especially with respect to maternaland child health. The large supply-side gaps (for whichdata is available) that may be partly associated with theseoutcomes is the lack of adequate health facilities (20 percent and 23 per cent shortfall of sub- centres and PHCsrespectively) and health workers (particularly shortageof specialists (81.19 per cent) to staff the facilities; gapswhich must be filled up on priority.
5.17.2 A number of new/improved schemes wereintroduced during the course of the Plan period (MissionIndradhanush, Rashtriya Bal Swasthya Karyakram,transfer of RSBY to MoH&FW, NHM Free Drugs andDiagnostics Initiative etc) that are aimed at addressingmultiple national health goals. The overall impact of theseschemes will have to be evaluated in due course to guidefurther policy measures in health.
5.17.3 52.73 per cent of the envisaged total 12th PlanOutlay was actually allocated during the period, of that
utilisation (AE) is about 84.01 per cent. The utilisationas per percentage of 12th Plan Outlay is about 44.3 percent..
5.17.4 Initiatives like Kayakalp encourage public healthfacilities in the country to work towards standards ofexcellence to help the facilities stay clean and hygienic.This does not apply only to physical cleanliness, but todevelop and put in place systems and procedures foractivities such as bio-waste disposal etc. Without muchexpenditure, this programme is expected to have a largeimpact on the utilization of public health facilities.
5.18 The Way Forward
5.18.1 Inclusive Growth: In order to achieve the goalof inclusive growth, inter-State and inter-districtdisparities need to be addressed. This is all the moreimportant if Twelfth Plan monitorable goals are to beachieved not only at the National level but also at theState level. The Southern States have far exceeded thebenchmarks for MMR, IMR and TFR, while the EAGStates, despite witnessing a rapid decline on theseparameters, still remain short of their targeted outcomes.These States are not only deficient in health infrastructurebut also in human resources for health. One way toaddress this is by revising the formula for allocation offunds to States under the National Health Mission (NHM).Currently, the allocation is based on socio economic andhealth lag. The formula should have an appropriatebalance of the distance from the mean achivementbackwardness criteria and incremental performance ofthe health systems (As measured through the NITI Indexdeveloped specifically for this purpose).
5.18.2 Flexibility to States: The States may be givenflexibility by allowing programmatic decisions to be takenat the state level by the Chief Secretary of State asChairman of the State Level Sanctioning Committees asin the Rashtriya Krishi Vikas Yojana (RKVY).
5.18.3 States need to be incentivised: Consequenton the recommendations of FFC, total devolution to theStates in 2015-16 was higher by Rs. 1.78 lakh crore i.e.
108 APPRAISAL DOCUMENT OF TWELFTH FIVE YEAR PLAN
from Rs 3.48 lakh crore in 2014-15 to Rs 5.26 crore in2015-16. States need to be incentivised to allocate a largerproportion of these funds on health.
5.18.4 Fully functional Health Information System(HIS): A fully functional HIS should include: universalregistration of births, deaths and cause of death. Maternaland infant death reviews, nutritional surveillance amongwomen & children, out- patient and in-patientinformation through Electronic Medical Records (EMR)to reduce response time in emergencies & help in hospitaladministration, data on human resources within thepublic & private health system, financial managementin the public health system, a national repository ofteaching modules, Tele-medicine and consultationsupport to doctors at primary and secondary facilitiesfrom tertiary centres, nationwide registry of clinicalestablishments, blood banks, drug testing laboratoriesetc. should also be included.
5.18.5 Focus on Public Health: There is an urgentneed for a dedicated Public Health Cadre with supportteam comprising epidemiologists, entomologists, publichealth nurses, inspectors and male Multi-Purposeworkers. All public health facilities should be compliantwith the Indian Public Health Standards (IPHS). IPHSstandards need to be defined for all existing andupcoming tertiary level institutions.
5.18.6 Integration/Co-location of AYUSH facilities:The strength of the AYUSH system lies in preventiveand promotional health care, which needs to be leveragedto reduce the load on already overburdened curative carefacilities.
B. BETTER EDUCATED INDIA
5.19 The Twelfth Plan’s Aims for Education
5.19.1 To take advantage of the youth bulge in order toimprove the productivity and competitiveness of theeconomy, not just the health but also the education levelof the population need to be focused on, in order toenhance employability. Education is also an importanttool for enhancing socio-economic mobility as it providesskills and competence for improved participation. The
Twelfth Plan has a special focus on the expansion ofeducation, improving the quality of education andensuring that all segments of the society get equaleducational opportunities. This special emphasis oneducation has led to an increased allocation of resourcesfor the education sector as a whole. The Twelfth Planaims at improving Mean Years of Schooling (MYS) from5.7 to 7 years by the end of the Plan; reducing drop-outrates; enhancing access to higher education by creatingadditional capacities in the higher education institutionswhich will be aligned to the skill needs of the economy,and eliminating all kinds of divides specially in terms ofgender and social gaps in enrolment by the end of thePlan. It also emphasizes on improving attendance;reducing dropout rates; increasing the overall literacyrate and improving the quality of higher education.Accordingly, the Plan aims at achieving near-universalenrollment in secondary education with a gross enrolmentratio (GER) exceeding 90 per cent; raising GER at seniorsecondary level to 65 per cent; reducing the drop-outrate to less than 25 per cent; ensuring quality secondaryeducation and implementing common curricula andsyllabi of nationally acceptable standards for science,mathematics and English across the country.
5.19.2 The following sections cover the progress madein elementary education, secondary education and highereducation during the course of the Twelfth Five YearPlan.
5.20 School Education and Literacy
5.20.1 The priority areas for education policy have beenaccess, equity, quality and governance. The Twelfth Planfocuses on these but lays more emphasis on improvinglearning outcomes at all levels. As per Census 2011, theliteracy rate of India was 72.99 per cent against whichthe Twelfth Plan target is 80 per cent. The gender gapin literacy was 16.25 per cent in 2011 against which theTwelfth Plan target is below 10 per cent.
5.21 Elementary Education
5.21.1 The elementary education sector has witnesseda near universalization of education (more than 90 percent habitations covered) and strengthening of physicalinfrastructure in terms of school buildings and additional
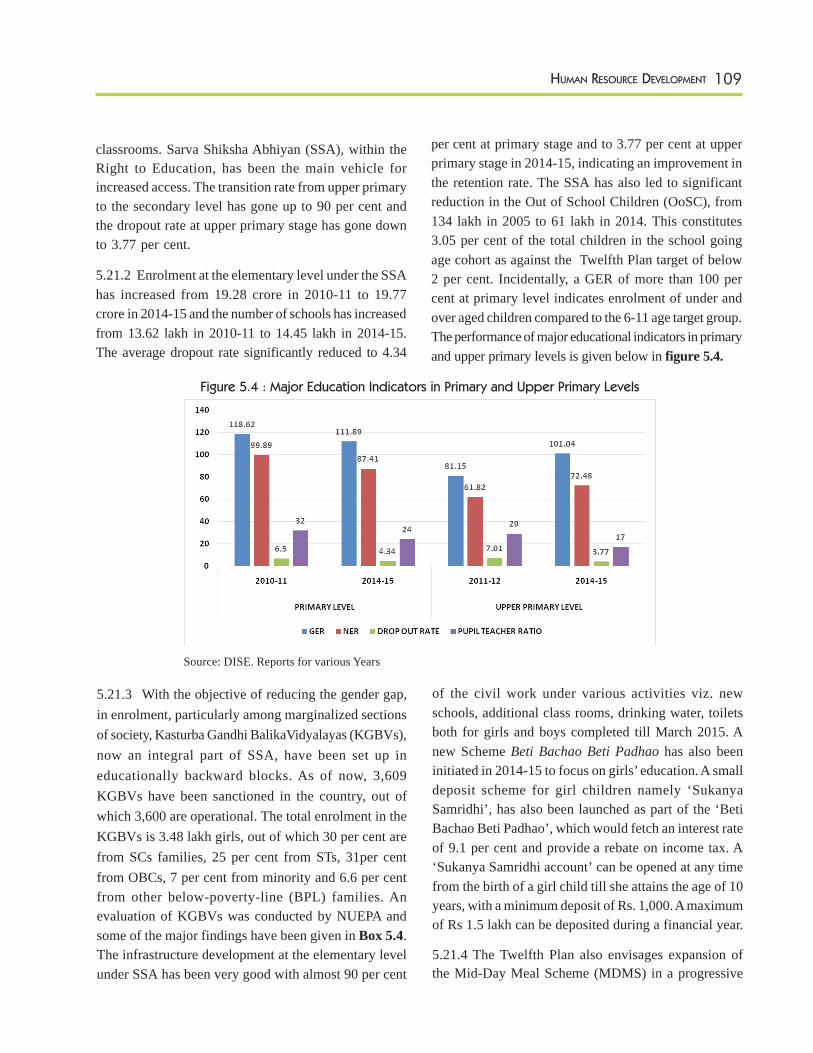
109HUMAN RESOURCE DEVELOPMENT
Source: DISE. Reports for various Years
Figure 5.4 : Major Education Indicators in Primary and Upper Primary Levels
classrooms. Sarva Shiksha Abhiyan (SSA), within theRight to Education, has been the main vehicle forincreased access. The transition rate from upper primaryto the secondary level has gone up to 90 per cent andthe dropout rate at upper primary stage has gone downto 3.77 per cent.
5.21.2 Enrolment at the elementary level under the SSAhas increased from 19.28 crore in 2010-11 to 19.77crore in 2014-15 and the number of schools has increasedfrom 13.62 lakh in 2010-11 to 14.45 lakh in 2014-15.The average dropout rate significantly reduced to 4.34
per cent at primary stage and to 3.77 per cent at upperprimary stage in 2014-15, indicating an improvement inthe retention rate. The SSA has also led to significantreduction in the Out of School Children (OoSC), from134 lakh in 2005 to 61 lakh in 2014. This constitutes3.05 per cent of the total children in the school goingage cohort as against the Twelfth Plan target of below2 per cent. Incidentally, a GER of more than 100 percent at primary level indicates enrolment of under andover aged children compared to the 6-11 age target group.The performance of major educational indicators in primaryand upper primary levels is given below in figure 5.4.
5.21.3 With the objective of reducing the gender gap,in enrolment, particularly among marginalized sectionsof society, Kasturba Gandhi BalikaVidyalayas (KGBVs),now an integral part of SSA, have been set up ineducationally backward blocks. As of now, 3,609KGBVs have been sanctioned in the country, out ofwhich 3,600 are operational. The total enrolment in theKGBVs is 3.48 lakh girls, out of which 30 per cent arefrom SCs families, 25 per cent from STs, 31per centfrom OBCs, 7 per cent from minority and 6.6 per centfrom other below-poverty-line (BPL) families. Anevaluation of KGBVs was conducted by NUEPA andsome of the major findings have been given in Box 5.4.The infrastructure development at the elementary levelunder SSA has been very good with almost 90 per cent
of the civil work under various activities viz. newschools, additional class rooms, drinking water, toiletsboth for girls and boys completed till March 2015. Anew Scheme Beti Bachao Beti Padhao has also beeninitiated in 2014-15 to focus on girls’ education. A smalldeposit scheme for girl children namely ‘SukanyaSamridhi’, has also been launched as part of the ‘BetiBachao Beti Padhao’, which would fetch an interest rateof 9.1 per cent and provide a rebate on income tax. A‘Sukanya Samridhi account’ can be opened at any timefrom the birth of a girl child till she attains the age of 10years, with a minimum deposit of Rs. 1,000. A maximumof Rs 1.5 lakh can be deposited during a financial year.
5.21.4 The Twelfth Plan also envisages expansion ofthe Mid-Day Meal Scheme (MDMS) in a progressive
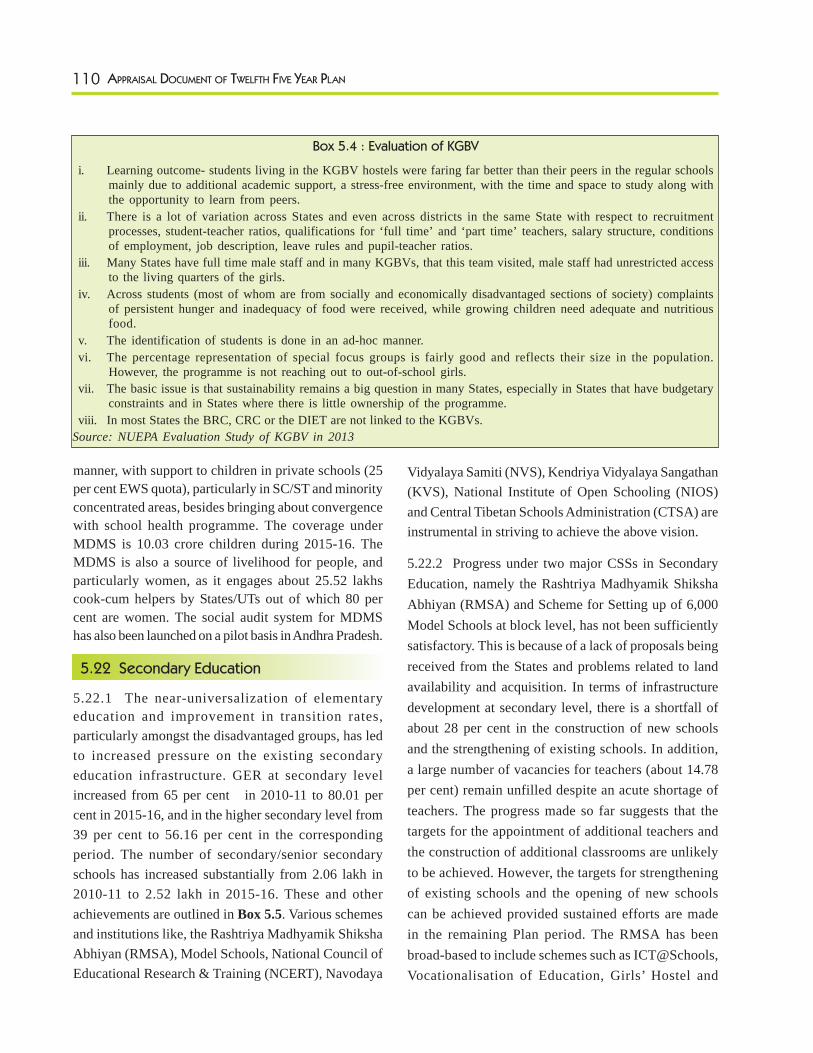
110 APPRAISAL DOCUMENT OF TWELFTH FIVE YEAR PLAN
manner, with support to children in private schools (25per cent EWS quota), particularly in SC/ST and minorityconcentrated areas, besides bringing about convergencewith school health programme. The coverage underMDMS is 10.03 crore children during 2015-16. TheMDMS is also a source of livelihood for people, andparticularly women, as it engages about 25.52 lakhscook-cum helpers by States/UTs out of which 80 percent are women. The social audit system for MDMShas also been launched on a pilot basis in Andhra Pradesh.
5.22 Secondary Education
5.22.1 The near-universalization of elementaryeducation and improvement in transition rates,particularly amongst the disadvantaged groups, has ledto increased pressure on the existing secondaryeducation infrastructure. GER at secondary levelincreased from 65 per cent in 2010-11 to 80.01 percent in 2015-16, and in the higher secondary level from39 per cent to 56.16 per cent in the correspondingperiod. The number of secondary/senior secondaryschools has increased substantially from 2.06 lakh in2010-11 to 2.52 lakh in 2015-16. These and otherachievements are outlined in Box 5.5. Various schemesand institutions like, the Rashtriya Madhyamik ShikshaAbhiyan (RMSA), Model Schools, National Council ofEducational Research & Training (NCERT), Navodaya
Vidyalaya Samiti (NVS), Kendriya Vidyalaya Sangathan(KVS), National Institute of Open Schooling (NIOS)and Central Tibetan Schools Administration (CTSA) areinstrumental in striving to achieve the above vision.
5.22.2 Progress under two major CSSs in SecondaryEducation, namely the Rashtriya Madhyamik ShikshaAbhiyan (RMSA) and Scheme for Setting up of 6,000Model Schools at block level, has not been sufficientlysatisfactory. This is because of a lack of proposals beingreceived from the States and problems related to landavailability and acquisition. In terms of infrastructuredevelopment at secondary level, there is a shortfall ofabout 28 per cent in the construction of new schoolsand the strengthening of existing schools. In addition,a large number of vacancies for teachers (about 14.78per cent) remain unfilled despite an acute shortage ofteachers. The progress made so far suggests that thetargets for the appointment of additional teachers andthe construction of additional classrooms are unlikelyto be achieved. However, the targets for strengtheningof existing schools and the opening of new schoolscan be achieved provided sustained efforts are madein the remaining Plan period. The RMSA has beenbroad-based to include schemes such as ICT@Schools,Vocationalisation of Education, Girls’ Hostel and
Box 5.4 : Evaluation of KGBV
i. Learning outcome- students living in the KGBV hostels were faring far better than their peers in the regular schoolsmainly due to additional academic support, a stress-free environment, with the time and space to study along withthe opportunity to learn from peers.
ii. There is a lot of variation across States and even across districts in the same State with respect to recruitmentprocesses, student-teacher ratios, qualifications for ‘full time’ and ‘part time’ teachers, salary structure, conditionsof employment, job description, leave rules and pupil-teacher ratios.
iii. Many States have full time male staff and in many KGBVs, that this team visited, male staff had unrestricted accessto the living quarters of the girls.
iv. Across students (most of whom are from socially and economically disadvantaged sections of society) complaintsof persistent hunger and inadequacy of food were received, while growing children need adequate and nutritiousfood.
v. The identification of students is done in an ad-hoc manner.vi. The percentage representation of special focus groups is fairly good and reflects their size in the population.
However, the programme is not reaching out to out-of-school girls.vii. The basic issue is that sustainability remains a big question in many States, especially in States that have budgetary
constraints and in States where there is little ownership of the programme.viii. In most States the BRC, CRC or the DIET are not linked to the KGBVs.
Source: NUEPA Evaluation Study of KGBV in 2013
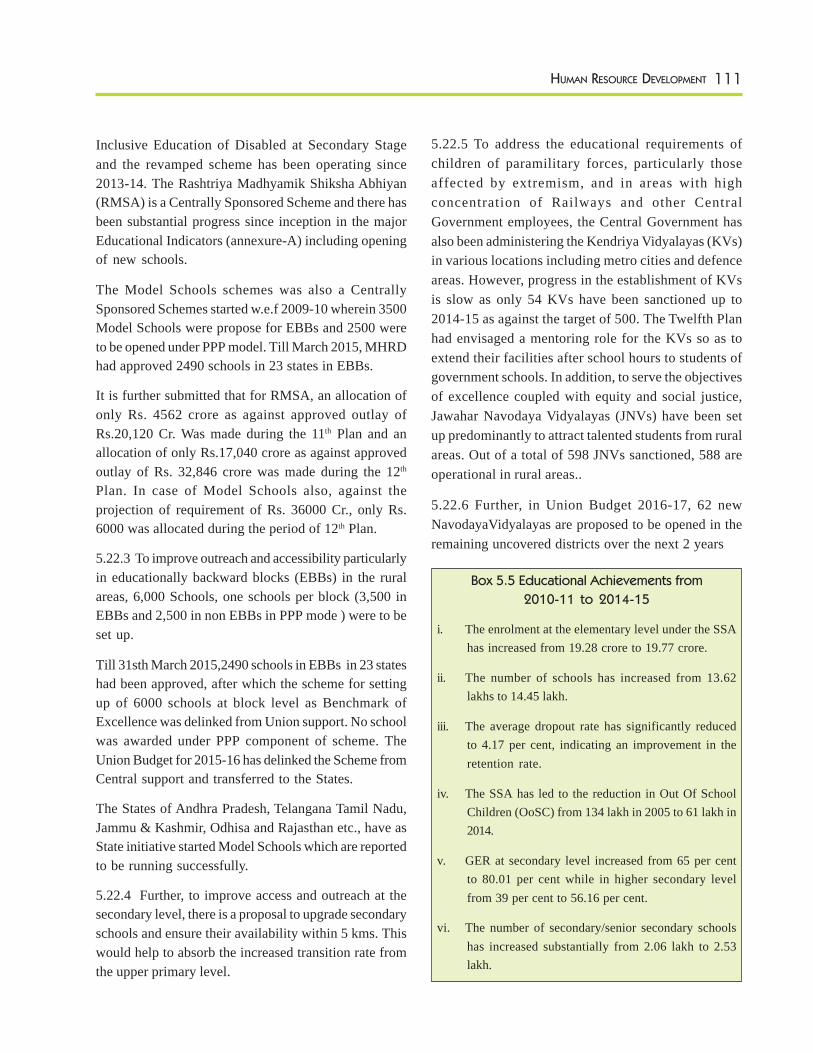
111HUMAN RESOURCE DEVELOPMENT
Inclusive Education of Disabled at Secondary Stageand the revamped scheme has been operating since2013-14. The Rashtriya Madhyamik Shiksha Abhiyan(RMSA) is a Centrally Sponsored Scheme and there hasbeen substantial progress since inception in the majorEducational Indicators (annexure-A) including openingof new schools.
The Model Schools schemes was also a CentrallySponsored Schemes started w.e.f 2009-10 wherein 3500Model Schools were propose for EBBs and 2500 wereto be opened under PPP model. Till March 2015, MHRDhad approved 2490 schools in 23 states in EBBs.
It is further submitted that for RMSA, an allocation ofonly Rs. 4562 crore as against approved outlay ofRs.20,120 Cr. Was made during the 11th Plan and anallocation of only Rs.17,040 crore as against approvedoutlay of Rs. 32,846 crore was made during the 12th
Plan. In case of Model Schools also, against theprojection of requirement of Rs. 36000 Cr., only Rs.6000 was allocated during the period of 12th Plan.
5.22.3 To improve outreach and accessibility particularlyin educationally backward blocks (EBBs) in the ruralareas, 6,000 Schools, one schools per block (3,500 inEBBs and 2,500 in non EBBs in PPP mode ) were to beset up.
Till 31sth March 2015,2490 schools in EBBs in 23 stateshad been approved, after which the scheme for settingup of 6000 schools at block level as Benchmark ofExcellence was delinked from Union support. No schoolwas awarded under PPP component of scheme. TheUnion Budget for 2015-16 has delinked the Scheme fromCentral support and transferred to the States.
The States of Andhra Pradesh, Telangana Tamil Nadu,Jammu & Kashmir, Odhisa and Rajasthan etc., have asState initiative started Model Schools which are reportedto be running successfully.
5.22.4 Further, to improve access and outreach at thesecondary level, there is a proposal to upgrade secondaryschools and ensure their availability within 5 kms. Thiswould help to absorb the increased transition rate fromthe upper primary level.
5.22.5 To address the educational requirements ofchildren of paramilitary forces, particularly thoseaffected by extremism, and in areas with highconcentration of Railways and other CentralGovernment employees, the Central Government hasalso been administering the Kendriya Vidyalayas (KVs)in various locations including metro cities and defenceareas. However, progress in the establishment of KVsis slow as only 54 KVs have been sanctioned up to2014-15 as against the target of 500. The Twelfth Planhad envisaged a mentoring role for the KVs so as toextend their facilities after school hours to students ofgovernment schools. In addition, to serve the objectivesof excellence coupled with equity and social justice,Jawahar Navodaya Vidyalayas (JNVs) have been setup predominantly to attract talented students from ruralareas. Out of a total of 598 JNVs sanctioned, 588 areoperational in rural areas..
5.22.6 Further, in Union Budget 2016-17, 62 newNavodayaVidyalayas are proposed to be opened in theremaining uncovered districts over the next 2 years
Box 5.5 Educational Achievements from
2010-11 to 2014-15
i. The enrolment at the elementary level under the SSAhas increased from 19.28 crore to 19.77 crore.
ii. The number of schools has increased from 13.62lakhs to 14.45 lakh.
iii. The average dropout rate has significantly reducedto 4.17 per cent, indicating an improvement in theretention rate.
iv. The SSA has led to the reduction in Out Of SchoolChildren (OoSC) from 134 lakh in 2005 to 61 lakh in2014.
v. GER at secondary level increased from 65 per centto 80.01 per cent while in higher secondary levelfrom 39 per cent to 56.16 per cent.
vi. The number of secondary/senior secondary schoolshas increased substantially from 2.06 lakh to 2.53lakh.
112 APPRAISAL DOCUMENT OF TWELFTH FIVE YEAR PLAN
5.23 Initiatives to Improve School Quality
5.23.1 Focused programmes for ensuring learning havebeen initiated in most of the States, with specificinterventions designed to target children in Classes I &II to improve learning outcomes. These interventionsinclude activity-based learning methodologies andmodels for early reading and mathematics. Thestrengthening of teaching and learning of maths andscience in upper primary schools are being pursuedthrough focused teacher training along with provisionof teaching-learning materials.
5.23.2 NCERT has developed learning indicators todetermine expected learning outcomes of all classescovering all subjects. It has also developed a frameworkfor Performance Indicators for Elementary SchoolTeachers (PINDICS) and shared it with States. Theseperformance standards define the criteria expected whenteachers perform their major tasks and duties. Theseare further delineated as performance indicators that canbe used to observe progress and to measure actual resultcompared to expected result.
5.23.3 To improve school leadership and competenceof school headmasters and educational administrators,a new National Centre for School Leadership (NCSL),within the National University of Educational Planningand Administration (NUEPA), has been set up. The NCSLhas developed a framework and also a curriculum forschool leadership. The programme has been initiated inthe States/UTs of Andhra Pradesh, Chhattisgarh, Daman& Diu, Dadra & Nagar Haveli, Gujarat, HimachalPradesh, Karnataka, Kerala, Mizoram, Rajasthan, TamilNadu, Uttar Pradesh and West Bengal. The programmewill be expanded to all States.
5.23.4 The National University of Educational Planningand Administration (NUEPA) is also in the process ofdeveloping indicators for school performanceassessment. The initiatives include (a) the developmentof school performance standards to provide commoncore and expectations for all schools (b) guidance onstrategies for helping schools to improve theirperformance, and (c) use of the performance standards
set as the reference or benchmark for both internal andexternal evaluations of the school.
5.23.5 The use of information and communicationtechnology to complement and supplement classroomteaching and learning is pursued as an important strategyto foster quality education at elementary and secondarystages of education. Both under SSA and RMSA,assistance has to be given to States in the provision ofcomputer hardware and related facilities, which wouldalso be used to provide online course content and relatedmaterials to students through massive online opencourse. Key activities include providing computerequipment or labs to schools, development of curriculumbased e-learning materials in local languages, and trainingof teachers in computer use and provide all learningresources on interactive portals named e-Pathshala andNational Repository of Open Education Resource(NROER).
5.23.6 Curricular reforms involving revising of syllabiand textbooks based on the National CurriculumFramewirk,2005 prepared by the NCERT, facilitatinglearning in age-appropriate classes, and improvinglearning through the provision of library and othersupplementary materials are all quality improvementinitiatives. As of March 2016, 25 states had revised theircurriculum in the light of NSF, 2005, 8 states/UTs wrefollowing of NCERT and 3 Uts were following thecurriculum of neighboring States.
5.23.7. Although much has been achieved with regardto gender parity at the national level, there still existsregional and social disparities across the country. Takinginto account the gender bias which is inherent acrossmost sections of society, a ‘Digital Gender Atlas forAdvancing Girl’s Education in India’ was launched onInternational Women’s Day in March 2015. The toolhas been developed in partnership with the United NationsChildren’s Fund (UNICEF) to help identify low-performing geographic pockets for girls, particularlyfrom marginalized groups. It provides comparativeanalysis of individual gender-related indicators over theyears. The Gender Atlas is available on the RMSAwebsite.
113HUMAN RESOURCE DEVELOPMENT
5.24 Issues Needing attention in SchoolEducation and Literacy
5.24.1 Despite progress in terms of improvement inaccess and outreach, the major issues that requireimmediate attention include:
(i) The focus is now on quality improvementand enhancing student leaning.Manyprogrammes have been initiated bycentral and States/UTs Government to fosterquality education and improve studentslearning outcomes. However, improvedschool infrastructure and learningenvironment in all schools have contributedto substantial improvement in the studentsClassrooms ration(SCR) from 41:1 to 27:1in 2015-16 . More Efforts need to be madein this direction.
(ii) There has been a substantial increase in thetotal number of teachers in schoolsimparting elementary education from 5.22million in 2006-2007, to 8.08 million in(2015-16 U-DISE). These efforts havecontributed to a sharp improvement in pupilteacher ratio (PTR) at the primary level ingovernment schools from 36:1 in 2006-07to 25: 1 in 2015-16. However, there is stillan acute shortage of professionally qualified,component, trained and motivated teacherswith about 8.3lakh vacancies across thecountry.
(iii) The recruitment service conditions ofteachers and redeployment of teachers areprimarily in the domain of respective StateGovernments and UT administrations.However, the central Government has beenpursuing the matter of expeditiousrecruitment and redeployment of teacherswith states and UTs at various for a. in manyStates vacancy of teachers occurs due todelay in the process of appointment ofteachers as a result of litigations and
procedural delays in the appointment ofteachers which, in any case is timeconsuming.
(iv) The preponderance (81893-11.50%) as perUDISE 2015-16 of single teacher school atthe primary level across the country alsoadversely affects the quality of teaching.
(v) The percentage of professionally trainedteachers at the elementary stage (classes I-VIII) in all schools has been increased from70.78% (2013 -14) U-DISE, NUEPA) to82.41% (U-DISE 2015-16).
vi) A related issue is professional qualificationand training received by teachers. Accordingto the latest report of the Unified- DistrictInformation System for Education (U-DISE) on School Education in India’, 79%of teachers are professionally qualified. Forthe higher secondary level, the percentageof qualified teachers is around 85.13 %.There is a need to increase the percentageof qualified teachers and also upscaletraining of ‘both qualified and underqualified teachers’.
(vii) To address the gender equality issues, statesGovernments may be encouraged to recruitand appoint adequate female teachers. Atpresent, women constitute only 47.99 % offemale teachers in all schools.
(viii) More than 50% of primary schools lack thehand washing facilities on the schoolspremises. UDISE does not captureinformation on this aspect.
(ix) There is poor convergence of MDMS withschool health programme. Therefore,linkages between medical colleges and HomeScience faculty with State MDMS steeringand monitoring committees and institutionsare needed to evolve state specific guidelinesfor improved quality and safety.
114 APPRAISAL DOCUMENT OF TWELFTH FIVE YEAR PLAN
(x) Only 79.20 % schools have kitchen sheds.This implies that almost 20% schools (2.09lakhs) have thier Mid day Meal preparationseither in an open area or in the classrooms.This is a major cause of concern as itimpacts student safety.
(xi) Financial constraints is the main hurdle inimplementation of the Schemes of RMSAand Model School. Under RMSA and Modelschools, the States identify land first andthen propose for up-gradation of NewSchools.
5.25 Higher Education
5.25.1 The Twelfth Plan envisages building on themomentum generated during the Eleventh Plan andcontinued focus on the Three Es- expansion, equityand excellence. This is sought to be achieved throughoverriding emphasis on quality, diversified highereducation opportunities to meet the needs of employers,and governance reforms to enable institutions to haveautonomy to develop distinctive strengths. The TwelfthPlan targets include enhancing enrolment capacity by10 million and increasing public spending in the Statehigher education system through the Centrally SponsoredSchemes of Rashtriya Uchhatar Shiksha Abhiyan(RUSA), Technical Education Quality ImprovementProgramme (TEQIP), National Mission on use of ICTin higher education, Consolidation and Upgradation ofCentral Institutions and Expansion of Skill BasedProgrammes including Community Colleges. It also aimsat setting up of multi-disciplinary universities, thecreation of 20 centers of excellence, 50 centers fortraining and research in frontier areas of science &technology and humanities, 20 design innovation centres,and 10 inter institutional centers, the establishment ofa council for industry and higher education forcollaboration, a national initiative for the inclusion ofpersons with disabilities, improving academic quality,rejuvenating academic staff colleges, strengtheningaccreditation system, reviewing the doctoral educationsystem, establishing State Councils for higher education
and institutes for academic leadership in higher education,increasing private initiative, and institutional and policyreforms.
5.25.2 By the end of 2014-15, the university and highereducation system had 760 universities, 38,498 collegesand 12,276 diploma level institutions. The All India Surveyon Higher Education (AISHE, 2014-15), estimated thetotal student enrolment in higher education at 34.2 millionwith 18.4 million boys and 15.7 million girls. There hasbeen substantial progress in the thrust areas of expansion,equity, excellence and employability during the period.The Gross Enrolment Ratio (GER) in higher educationincreased from 11.5 per cent in 2005-06 to 24.3 percent in 2014-15. Notably, the target of increasing theGER to 25.2 per cent by the end of Twelfth Plan (2017)and further to 30 per cent by 2020 appears to beachievable. However, the growth of higher educationinstitutions with requisite faculty and infrastructuresupport has not kept pace with the increase inenrolments, and even less so in relation to the apparentand latent demand.
5.25.3 The Rashtriya Uchhatar Shiksha Abhiyan is acentrally sponsored - reform driven scheme to improveaccess, equity and excellence in State Higher EducationSystem. 35 States including UTs have onboarded RUSA.34 State Higher Education Plans(SHEPs) have beenreceived from States and UTs and as many have beenconsidered so far by the Project Approval Board. Thefollowing have been approved under RUSA : Creation of16 Universities through upgradation of autonomouscolleges(8) and clustering of colleges(8) ; 60 new modeldegree colleges, 54 colleges have been upgraded to modeldegree college and 29 new professional colleges havebeen supported; infrastructure grants to 1250 collegesand 117 Universities; Faculty recruitment support for253 posts; and faculty improvement in 8 states; Supportto Vocationalization of Higher Education in 7 states andEquity initiatives in 18 States’; support for National QualityRenaissance Initiative (NQRI) to the National Assessmentand Accreditation Council and support for needsassessment study and capacity building for highereducation administrators ( 620 leaders trained across thecountry) to the Tata Institute of Social Sciences.
115HUMAN RESOURCE DEVELOPMENT
5.25.4 To improve the quality and use of Information &Communication Technology in education, connectivityto 21,569 colleges using 20X512 Kbps VPN overBroadband was provided under the National Mission onEducation through Information & CommunicationTechnology (NMEICT). About 600 Universities/Institutions have been provided with 1 Gbps fibre opticconnectivity, and 400 node local area networks (LAN)have been provided to 50 NMEICT connecteduniversities. In addition, more than 1000 courses inengineering, humanities etc. have also been developedand launched under the National Programme onTechnology Enhanced Learning (NPTEL). Creation ofdigital contents for 77 post graduate subjects by Inflibnetand 87 under graduate subjects by CEC have beencompleted. Over 125 virtual labs, in 9 Engineering andScience disciplines, comprising more than 770experiments are ready for use. More than one lakhteachers have been trained under the Talk to TeacherProject. More than 4,000 spoken tutorials are availablefor online access and 1 lakh Low Cost Access Deviceshave been distributed by IIT Bombay. The SWAYAMMOOCs platform has been developed and has madefunctional with 337 courses prepared by the best teachersin the country. The platform is extended to about 3 crstudents across the country who can choose anytime,anywhere and any one mode of quality education at nocost. The UGC has issued a regulation facilitating transferof credits from institution offering the course into theacademic record of the student. (2) Transponders havebeen leased from ISRO GSAT 15 satellite and (32) DTHchannels for higher education institutions have been madefunctional. These channels transmit high qualityeducational content on a 24x7 basis through DD FreeDish.
5.25.5 To address the issue of shortage of quality faculty,the Pandit Madan Mohan Malaviya National Mission onTeachers and Teaching (PMMMNMTT) was launchedon 25th December, 2014 as a Central Sector Schemewith all India coverage, and an outlay of Rs. 900 crorein the Twelfth Five Year Plan. The Mission is tocomprehensively address all issues related to teaching,teacher preparation, professional development,
curriculum design, designing and developing ofassessment & evaluation methodology, research inpedagogy and developing effective pedagogy. It willaddress the requirement for trainers and teachers in theeducation sector as a whole. A Project Approval Boardhas been constituted and the guidelines of the Schemehave also been approved. 42 projects have been approvedin 08 Project Appraisal Board Meetings.
5.25.6 A strategy for higher education internationalizationwas to be developed during the Twelfth Plan. This wasto include faculty and student exchange programmes,institutional collaborations for teaching education andresearch, exposure to diverse teaching–learning modelsand enhanced use of ICTs. Globally compatible academiccredit systems, curricula internationalisation andprocesses for mutual recognition of qualifications needto be put in place. A professional national agency and an‘India International Education Centre’ at New Delhi wereproposed to be created to undertake internationalisationactivities. It will support selected institutions to establishdedicated internationalisation units. However, progressin this direction has been very slow.
5.25.7. To help students, Higher Education Institutionsand Employers to access degree certificates of candidates,Union Budget 2016-17 has proposed to establish a DigitalDepository for School Leaving Certificates, CollegeDegrees, Academic Awards and Mark Sheets, on thepattern of a Securities Depository. This will help validatetheir authenticity, safe storage and easy retrieval. Thesaid digital depository will be known as NationalAcademic Depository (NAD). It will be on 24x7 onlinemode and will comprise of inter-operable digitaldepositories which shall keep the academic awards indigital format to ensure data integrity.
5.25.8. In Union Budget 2016-17, it has been decidedthat a Higher Education Financing Agency (HEFA) willbe set up with an initial capital base of Rs. 1000 crore.The HEFA will be a not-for-profit organization that willleverage funds from the market and supplement themwith donations and CSR funds. These funds will be usedto finance improvement in infrastructure in topinstitutions and will be serviced through internal accruals.
116 APPRAISAL DOCUMENT OF TWELFTH FIVE YEAR PLAN
5.25.9. An enabling regulatory architecture will beprovided to ten public and ten private institutions toemerge as world-class Teaching and ResearchInstitutions. This will enhance affordable access to highquality education for ordinary Indians.
5.25.10. In order to improve quality of higher education,a National Institutional Ranking Framework that wouldevolve institutions on a set of parameters has beenlaunched in September, 2015. This allows ranking ofhigher educational institutions on objective, verifiableparameters. The first India Rankings was released on4.4.2016 and the next edition is going to be released on3.4.2017.
5.25.11 In order to improve the standards in thetechnical institutions, TEQIP-II project has beenimplemented from 2012-2017. The project helped instrengthening the institution by better governancesystems, improve the teacher-student ratio and increasedthe employability of the technical educational graduatesthrough a host of interventions.
5.25.12 The National Digital Library has beenoperationalised with the help of IIT-Kanpur connectingall the higher educational institutions to a large repositoryof digital learning material. So far more than 25 lakhbooks and journals are made available to more than 1000institutions across the country. This would helpinstitutions from backward regions to access highquality library resources. Under the e-Shodh Sinduproject, more than 18000 electronic journals are centrallyprocured and made available to institutions provided theyaccess to the best digital journals from across the world.
5.25.13 In order to promote research in highereducational institutions, IMPRINT initiative has beenlaunched on 5.11.2015 by Hon’ble President and Hon’blePrime Minister. Under this initiative, the issuesconcerning the standard of living of general public havebeen categorised into (10) Domains and the researchcommunity was asked to submit research projects thatcould result in better scientific solutions. Under this,(259) projects for Rs.595 cr. have been approved bythe Apex Committee in the first call. Under the Uchhatar
Avishkar Yojna, industry-sponsored projects requiringspecific innovations have been promoted by providing75% government contribution. Under this, (92) projectsworth Rs.282.65 crore have been sanctioned in the firstround. In order to promote innovation, a massiveprogramme for starting incubation centres for Startupshave been undertaken. One Research Park at I ITMadras, (15) Technology Business Incubators and (15)Startup Centres have been started in various premiereducational institutions to promote innovative ideas andto convert them to commercial projects. Two Researchparks, one each at IIT Bombay and NT Kharagpur arepresently under construction. In addition, an EFC Memofor establishment of 11 Research Parks and 60 startupcentres across institutions is under circulation amongstvarious Ministries/Departments for comments.
5.26 The Governance Structure in HigherEducation
5.26.1 The University Grants Commission (UGC)promotes & coordinates university education; determines& maintains standards of teaching, examination andresearch in universities; frames regulations on minimumstandards of education; frames regulations on academiccollaboration between Indian and foreign educationalinstitutions; monitors developments in the field ofcollegiate- university education; and disburses grantsto the universities and colleges. It has been serving as avital link between the Union and State Governments andinstitutions of higher learning.
5.26.2 The UGC also advises the Central and StateGovernments on the measures necessary forimprovement of university education. However, thechanging economic scenario has necessitated providingautonomy to institutions. Accordingly, the Twelfth Planaims to provide institutional autonomy by transformingthe role of government to one that is steering and evaluative;strengthening the capacity of the higher education systemto govern itself through widespread and coordinatedregulatory reforms, and to increase transparency in bothpublic and private institutions by requiring them todisclose important standardized information related to
117HUMAN RESOURCE DEVELOPMENT
admissions, fees, faculty, programmes, placements,governance, finance, business tie-ups and ownership.
5.26.3 To strengthen governance, steps were initiatedduring the Plan to create a new legislative frameworkand provide a new governance structure for highereducation in the country. Several new laws were underconsideration, which include (i) The Prohibition of UnfairPractices in Technical Educational Institutions, MedicalEducational Institutions and Universities Bill aimed atchecking unfair practices relating to capitation fees andmisleading advertising through mandatory disclosuresby academic institutions; (ii) The National AccreditationRegulatory Authority for Higher Educational Institutionsfor which the Bill seeks to make accreditation byindependent accreditation agencies mandatory for allhigher educational institutions; (iii) The EducationTribunals Bill to create a Central tribunal and State-leveltribunals for expeditious resolution of disputes relatingto institutions, faculty, students and regulatoryauthorities; (iv) The Foreign Educational Institutions(Regulation of Entry and Operations) Bill to enable qualityforeign education institutions to enter and operate in Indiaand regulate operations of foreign education providers;(v) National Commission for Higher Education andResearch (NCHER) Bill to create an umbrella regulatoryauthority subsuming the UGC, and current regulators,AICTE, NCTE and DEC; and (vi) The National AcademicDepository Bill, 2011, to create a repository of allacademic credentials in the country. However, some ofthese Bills have lapsed and need to be re-introduced inthe Parliament.
Legislative Initiatives
To strengthen governance, steps were initiated to createa new legislative framework and provide a newgovernance structure for higher education in thecountry. Several new laws were introduced in theParliament which also included the following:
(i) The National Accreditation Regulatory Authorityfor Higher Educational Institutions for which the Billseeks to make accreditation by independent accreditationagencies mandatory for all higher educational institutions;
(ii) The Foreign Educational Institutions (Regulationof Entry and Operations) Bill to enable quality foreigneducation institutions to enter and operate in India andregulate operations of foreign education providers;
(iii) The National Academic Depository Bill, 2011, tocreate a repository of all academic credentials in thecountry;
However, consequent to the dissolution of XVth LokSabha, the above bills lapsed.
In the meanwhile, University Grants Commission (UGC)notified a few regulations viz., UGC (MandatoryAssessment and Accreditation of Higher EducationalInstitutions) Regulations, 2012 thereby makingaccreditation mandatory of all eligible higher educationalinstitutions.
It further notified the University Grants Commission(Promotion and Maintenance of Standards of AcademicCollaboration between Indian and Foreign EducationalInstitutions) Regulations, 2016, spelling out the modalitiesfor academic collaboration between the Indian HigherEducational Institution and Foreign Higher EducationalInstitution.
As far as National Academic Depository is concerned,the Union Cabinet in its meeting held on 27th October,2016 accorded its approval for establishing andoperationalising National Academic Depository (NAD).
NAD will be an online store house of academic awards(degrees, diplomas, certificates, mark-sheets etc) lodgedby the academic institutions / boards / eligibilityassessment bodies in a digital format. It will be on 24X7online mode for making available academic awards andshall help in validating their authenticity, their safe storageand easy retrieval.
5.27 Technical Education
5.27.1 Technical Education plays an important role increating skilled manpower, thereby enhancing industrialproductivity and improving the quality of life. It coverscourses and programmes, inter alia, in engineering,technology, management, architecture, town planning,
118 APPRAISAL DOCUMENT OF TWELFTH FIVE YEAR PLAN
pharmacy, applied arts and crafts, hotel managementand catering technology. The Twelfth Plan envisagesthe intake of technical education institutions growing ata faster pace so as to create diverse opportunities forstudents and to meet the skilled human resource needsof the growing economy. The technical/managementeducation system at the Centre comprises the All IndiaCouncil of Technical Education (AICTE) as regulator;22 Indian Institutes of Technology (IITs); 20 IndianInstitutes of Management (IIMs), including 6 announcedin the Union Budget for 2014-15 and One for UnionBudget for 2015-16; the Indian Institute of Science(IISC), 31 National Institutes of Technology (NITs),and Indian Institute of Engineering Science andTechnology (IIEST), Shibpur; 2 Indian Institutes ofInformation Technology, at Allahabad and Gwalior; NorthEastern Regional Institute of Science & Technology orNERIST (Itanagar), Central Institute of Technology(CIT), Kokrajhar, National Institute of IndustrialEngineering (NITIE), Mumbai, Ghani Khan ChowdharyInstitute of Engineering and Technology, Malda ; SantLongowal Institute of Engineering and Technology(Punjab); National Institute of Foundry and ForgeTechnology (Ranchi); three Schools of Planning andArchitecture at Bhopal, New Delhi and Vijaywada;National Institute of Industrial Engineering (Mumbai);7 Indian Institutes of Science Education and Research(IISERs) and 46 technical universities and Institutions.
5.27.2 The newly set up IITs need to be fully developedin terms of infrastructure and faculty to maintain theirbrand name. MHRD is also setting up five new IITs inAndhra Pradesh, Chhattisgarh, Goa, J & K, Kerala, andKarnataka and converting the Indian School of Mines,Dhanbad into a full-fledged IIT.
5.27.3 The Indian Institutes of Science Education andResearch (IISERs) have been functional at Kolkata (WB)and Pune (Maharashtra) since 2006, Mohali (Punjab)since 2007, Bhopal (MP), Thiruvananthapuram (Kerala)since 2008, Tirupati since 2015 and Behrampur since2016. The total student strength at present is 5,315 whilefully functional campuses will have approximately 9,275students and 900 faculty members. These institutionshave been declared as ‘Institutions of National
Importance’ under the National Institutes of Technology,Science Education and Research (NITSER) Act, 2007(as amended in June, 2012). One new IISER, as per theAndhra Pradesh Reorganization Act, 2014 has beenstarted in Tirupati, Andhra Pradesh from 2015-16. Inaddition, the Union Budget for 2015-16 announced settingup of 2 new such institutes, one each in Nagaland andOdisha.
5.27.4 Six new Indian Institutes of Managements(IIMs), at Amritsar (Punjab), Sirmaur (HP),Vishakhapatnam (AP), Bodh Gaya (Bihar), Bhubaneswar(Odisha) and Nagpur (Maharashtra) were announcedduring 2014-15. Their academic session started from2015-16 in temporary campuses. One IIM wasannounced in 2015-16 which has started functioningsince 2016-17. Some of the newly set up IIMs are stillrunning from transit/temporary campuses asconstruction work for building of permanent campusesstarted late due to land acquisition problems. The otherissue pertaining to these institutions is faculty shortage;about 25-30 per cent posts in IIMs have been lyingvacant, which needs immediate attention.
5.27.5 The National Institutes of Technology have alsobeen declared ‘Institutions of National Importance’ underthe National Institutes of Technology Act, 2007, andScience Education and Research (NITSER) Act, 2007(as amended in June, 2012). The total number of NITshas gone up to 31 i.e. one each in all States and majorUTs.
5.27.6 The 2015-16 Union Budget also announced thesetting up of a Post Graduate Institute of HorticultureResearch and Education at Amritsar; and three Nationalinstitutes of Pharmaceutical Education and Research inMaharashtra, Rajasthan and Chhattisgarh.
5.27.7 Polytechnic education is an important constituentof technical education and has played an important rolein providing skilled manpower at various levels. In thelast two decades, many polytechnics have startedoffering courses in emerging disciplines. These includeelectronics, computer science, medical lab technology,hospital engineering, and architectural assistantship;specialized diploma programmes have been offered in
119HUMAN RESOURCE DEVELOPMENT
leather, sugar, and printing technologies among others;programmes tailored to female enrolment such asgarment technology, beauty culture and textile designhave also been initiated. To stimulate the growth ofpolytechnics in the country, particularly in theunderserved and educationally backward regions, 300polytechnics were planned during Eleventh Plan to beset up with Central financial assistance at Rs.12.30 croreper polytechnic. Till May, 2015, 295 polytechnics havebeen sanctioned under the scheme at a total cost of Rs.2,448.63 crore. For the remaining 5 polytechnics, theconcerned State Governments have not provided theirconsent for providing land and meeting recurringexpenditure. Out of the 295 polytechnics, 157 are nowoperational. This component has been merged withRUSA.
5.27.8 A total of 20 Indian Institutes of InformationTechnology (IIITs), in Public Private Partnership (PPP)mode, have been approved in various States. Out ofthese, 15 IIITs had started both undergraduate andpostgraduate academic sessions in 2013-14, 2014-15.and 2016-17. During the first four years of each IIIT,the Central Government provides assistance towardsrecurring expenditure to the extent of Rs.10 crore; theactual year wise requirement varies depending uponthe growth of the institute and its requirement forfunds.
5.28 Quality Issues in Higher Education
5.28.1 One of the main consequences of the massiveexpansion in higher education has been its effect onquality particularly due to huge growth of privateinstitutions. The quality issues in Indian higher educationhave today arisen to the top of the policy agenda.Universities have been expanding faster than the qualityof secondary education graduates, with the result thatthose who enter colleges are increasingly ill-prepared.The problem of comparison is complicated by the rapidobsolescence of many established curricula as theknowledge explosion accelerates. The meaning of qualityin the face of knowledge explosion provides some criticalcriteria for the evaluation of quality, domestically andglobally. However, the Times Higher Education Ranking
(2012-13) Survey placed no Indian institution amongits top 200 institutions. The top ranked Indian institutionswere IIT Kharagpur (234), IIT Bombay (258) and IITRoorkee (267). Though these world rankings are limitedin their scope and coverage of institutions, especiallythose in Asia, it is imperative to examine the basis andcomponents on which institutions are judged and placedin the global rankings. Firstly, single discipline universitiesand universities dedicated to just postgraduate studiesare not considered because of their narrow focus andareas of strength. The major components consideredare teaching (learning environment, student teacher ratio,quality of curriculum), research (volume, income fromresearch, reputation), and citations (research influence).Other factors like international outlook, industry income,employer reputation, etc. are also included. Indian highereducation is not particularly strong in the above-mentioned areas, which is certainly a cause of concern.The university system needs to look at these parametersclosely and endeavour to improve each one of them andespecially focus on the component of research.
5.28.2 Apart from international rankings, otherparameters of judging quality are employability andemployer satisfaction. According to a survey done bythe World Bank and the Federation of Indian Chambersof Commerce and Industry (FICCI), 64 per cent ofemployers are “somewhat”, “not very”, or “not at all”satisfied with the quality of the engineering graduatesthey hire. Increasing unemployment among universitygraduates is another growing problem. According to theindustry reports, only 25 per cent of technical graduatesand 10-15 per cent of other graduates are consideredemployable by the industrial sector. More than 62 percent of the candidates require training to be eligible forany job in the IT sector. To enhance employability, thereis a need for industry and academia interaction andapprenticeship/internship training in the industry.
5.28.3 Another facet mirroring quality is investments inR&D and research outcomes in the institutions of higherlearning. The expenditure on R&D in India is only 0.80per cent of GDP. It needs to be enhanced to 1.5 percent of GDP. The Kakodkar Committee recommendedstrategies to improve technical education in the country
120 APPRAISAL DOCUMENT OF TWELFTH FIVE YEAR PLAN
and enhance the research budget of every institutionto 2 per cent of the total. Innovation and creation ofnew knowledge are the major areas in whichuniversities in the developed countries have an edgeover their Indian counterparts. Investment in R&D indeveloped countries is not limited to public funding;therefore, funding from the private sector (especiallyindustry) is equally important. This has helpeduniversities and industries in such countries to maintaintheir competitive edge.
5.28.4 The Twelfth Plan recognizes that highereducation requires significantly larger investments todeliver on the multiple objectives and to achieve thevarious goals that have been set out for it. This investmenthas to come from both public and private sources andfrom both Central and State exchequers. It is in thiscontext that the erstwhile Planning Commission hadconstituted a Committee on Corporate SectorParticipation in Higher Education, in January 2012 underthe Chairmanship of N R Narayana Murthy, a founder,and past Chairman of Infosys. The Committee’s mandatewas to examine the potential for and providerecommendations on the modalities for corporate sector
participation in higher education. This participation wasto be in support of the development of national educationand innovation hubs and the Institutions of Nationalimportance (INIs) / centers of excellence, as well as ofmodels for industry-institution interaction to act ascatalysts of innovation and sustainable and inclusiveeconomic and regional development.
5.28.5 The report was formally released on 8th May2012 and its recommendations were three-fold: to createenabling conditions to make the higher education systemrobust and useful in order to attract investments;secondly, to improve the quality of higher education byfocusing on research and faculty development, withcorporate sector participation and, thirdly, to engage thecorporate sector to invest in existing institutions, set upnew institutions, and develop new knowledge clusters.It was decided that the Government would set up a groupto examine the recommendations of the Committee andfilter out the ideas which may not be feasible/implementable giving the current state of affairs. Thegroup would also prepare a list of ideas/activities whichcan be implemented immediately. The gist ofrecommendations can be seen in Box 5.6.
Box 5.6: Narayana Murthy Committee’s Recommendations on Corporate Sector
Participation in Higher Education
A. Creating enabling conditions to make the higher education system robust and useful to attract investment:1. Autonomy – in financial, regulatory, academic and administrative aspects2. Resources – ensuring availability of land, infrastructure and connectivity3. Fiscal incentives – to encourage investments and attracting funding4. Enabling environment – (such as visas) for free movement of faculty and students to promote collaboration
with world-class institutions abroad5. Freedom to accredit – with global accreditation agencies to put Indian institutions on par with the best6. Access to funds – through scholarships to enable students to pursue their chosen fields of study
B. Corporate participation in improving quality by enhancing research focus and faculty development:7. Enhancing research focus – through dedicated funding for research, sponsored doctoral programs, and
part-time Masters and PhD programs8. Faculty development – by increasing the talent pool of faculty from corporates (working and retired),
faculty development programs, and sponsorships of visits by expert facultyC. Creation of new infrastructure through corporate investments in higher education:
9. Setting up of new facilities by the corporate sector in existing universities and higher education institutionseither as Centres of Excellence (CoEs) or in the form of technology parks.
10. Setting up of new universities and higher education institutions.11. Developing new knowledge clusters / hubs.
121HUMAN RESOURCE DEVELOPMENT
5.29 Measures for Improving the Quality ofHigher Education
i. The UGC is also implementing schemes toaugment quality and promote research,including scientific research, namely,University with Potential for Excellence(UPE); Centre with Potential for Excellencein Particular Area (CPEPA), Colleges withPotential for Excellence (CPE), SpecialAssistance Programme (SAP), UGC BasicScientific Research (BSR), etc. TheRashtriya Aavishkar Abhiyan (RAA)envisages the motivation and engagement ofchildren in innovative thinking. Researchactivities and programmes in universities andinstitutions in their core areas ofcompetence need to be strengthened.
ii. ‘Quality Assurance of Higher EducationalInstitutions, through assessment andaccreditation, has been made mandatory. Asper the University Grants Commission(UGC) (Mandatory Assessment andAccreditation of higher EducationalInstitutions) Regulations, 2012 it ismandatory for all higher educationalinstitutions to be accredited by anassessment and accreditation agency afterpassing out of two batches or six years,whichever is earlier. The NationalAssessment and Accreditation Council(NAAC) of UGC and the National Board ofAccreditation (NBA) of All India Council ofTechnical Education (AICTE) conductassessment and accreditation of Universities/Colleges/lnstitutions.
The UGC has launched several schemes toimprove standards of education inuniversities and colleges. Under these,financial assistance is provided to eligibleuniversities and colleges for the creation andupgradation of infrastructural facilities,including libraries, laboratories and hostels
and for the strengthening of teaching andresearch. Indian Institute of Technology(IIT), Madras, along with its NationalProgramme on Technology EnhancedLearning (NPTEL) partners, and the NationalAssociation of Software and ServicesCompanies (NASSCOM) have run threeMassive Online Open Courses (MOOCs) of10 weeks each. IIT Madras certifies thesuccessful completion of the course whilecharging a nominal fee. Similarly, IIT Kanpurhas conducted five Online Courses withcertification of 4-5 weeks duration. IITBombay has also run four courses globallyand three more courses are currently goingon. A project on the “Development ofNational Digital Library” has also beensanctioned to IIT, Kharagpur.
iii. The Government notified the National SkillQualification Framework (NSQF) on 27th
December, 2013 to enable a person toacquire a desired competency level, transitto the job market and, at an opportune time,return in order to acquire additional skills tofurther upgrade competence and ensuretheir all-round development. Recognizingthe need to provide students horizontal andvertical mobility from the vocational to thegeneral higher education stream theGovernment launched “Skill AssessmentMatrix for Vocational Advancement of Youth”(SAMVAY). The teachers for vocationaltraining may be drawn from the industriesfor the relevant stream and regular schoolteachers can be trained to impart vocationaleducation with the partnership of industry.
iv. This credit framework along with the CreditFramework for Skill Development (CFSD),issued by the UGC would allow the pursuitof diploma to degree and post-degree
122 APPRAISAL DOCUMENT OF TWELFTH FIVE YEAR PLAN
programmes in vocational education. TheUGC provides grants to universities andcolleges under the two schemes namely“Community Colleges” and “B.Voc degreeprogramme”, which offer employmentoriented skill based vocational courses. Anindustry partner is essentially associatedwith these for curriculum development, thedelivery of courses and to assess learners.A scheme named “Pandit Deen DayalUpadhyay Kaushal Kendra” has also beenapproved by the Commission. The UGC hasdecided to approve 100 KAUSHAL centresunder this Scheme in universities andcolleges across the country duringtheTwelfth Plan. These centres will impartskill based education ranging from thecertificate to the post graduate level.
v. A Student Financial Aid Authority toadminister and monitor the front end of allscholarships as well as educational loanthrough the Pradhan Mantri Vidya LakshmiKaryakram is also being envisaged.
vi. To facilitate partnerships between Indian andforeign educational institutions, a scheme ofGlobal Initiative for Academic Networks(GIAN) was launched in November 2015.It enabled foreign faculty to come and takeone/ two week courses in Higher Educa-tional Institutions in India. So far 801courses have been approved and 629courses conducted. To improve the qualityof deemed to be universities a new set ofRegulations for Deemed to be Universitieswas framed under which focus was on in-creasing transparency and improving qual-ity. Mandatory NAAC accreditation andmandatory review of syllabus every threeyears are the important initiatives includedin the Regulations for improvement in stan-dards.
5.30 Sports
5.30.1 The importance of sports in the life of a youngstudent is invaluable. Sports instils lessons that areessential as young, impressionable students learn valueslike discipline, responsibility, self-confidence, sacrifice,and accountability and above all sportsmanship.
5.30.2 The Twelfth Plan envisages the broad basing ofsports and games and connecting them to schools andcolleges on the one hand and local bodies on the other.This is to be done through the launching of SarvaKrida Abhiyan; National Physical Fitness Programme;support for sports in institutions of higher education;and support for sports infrastructure. A CSS, thePanchayat Yuva Krida Aur Khel Abhiyan (PYKKA) waslaunched in 2008-09 and continues during Twelfth Plan.The scheme was revamped as the Rajiv Gandhi KhelAbhiyan (RGKA), and aims to cover all 6,545 blockpanchayats, providing each an outdoor playfield and apre-fabricated indoor hall. The scheme runs inconvergence with MGNREGA, BRGF, IAP and NLCPR.
5.30.3 PYKKA envisaged covering 2 lakh villagepanchayats and 6,373 block panchayats, developingplaying field in each by 2016-17 (the end of the TwelfthPlan). As against the target of covering 1,28,000 villagepanchayats and 4,078 blocks panchayats by 2013-14,65,735 village panchayats and 1,978 block panchayatswere covered. A sum of Rs. 1,044.42 crore was spenttill 31st March 2014 for developing infrastructure andholding Annual Rural Competitions.
5.30.4 A new scheme, the National Sport Talent SearchScheme (NSTSS), was launched on 20th February, 2015with the objective of identifying sporting talent amongstudents between 8 and 12 years of age (Class IV toClass VI). The scheme was to locate those who possessinborn qualities such as anthropometric, physical andphysiological capabilities without any anatomicalinfirmities. The talents so identified would be nurturedin district level sports schools/central sports schools ornational sports academies so they could excel at the
123HUMAN RESOURCE DEVELOPMENT
national and international sports competitions. An earlierscheme, Identification and Nurturing of Sporting Talentin India (INSTAL), has been subsumed in NSTSS.
5.30.5 Other schemes for facilitating sports andsportspersons are Special Cash Awards (including RajivGandhi Khel Ratna Award); Pension to MeritoriousSportspersons; Assistance to Sports Federations;National Sports Development Fund; and Urban SportsDevelopment Scheme. These schemes are to help increation of a sporting atmosphere in the country.
5.30.6 The Department of Sports is heading towardsbroad basing of sports and games, but some areas needgreater focus for achieving the goals of the TwelfthPlan. These include (i) Sarva Krida Abhiyan; (ii) NationalPhysical Fitness Programme; and (iii) support for sportsin institutions of higher education
5.31 Youth Affairs
5.31.1 The Twelfth Plan envisages the introduction ofNSS/NCC as compulsory co-curricular activity ineducational institutions; targeting female membership inNYKs and grading of youth clubs; convergence foroptimal utilisation of NYKs/National Youth Corps withproper coordination between Centre and States inimplementing various youth development programmes;and a new National Youth Policy with focus on youthempowerment and employability. The National YouthPolicy-2014 has been launched with the youth age-groupdefined as those between 15 and 29 years for a morefocused approach, better development of productiveyouth, and to channelize and effectively utilize youthfulenergy.
5.31.2 Keeping in view the Twelfth Plan aspirations tomodernize youth hostels in tourist areas and increasingthe strength of the NSS volunteers at the rate of 5 lakhsper year during the Plan period, the Youth Hostel Schemeand National Service Scheme have been revamped. Theother schemes run by the Department of Youth Affairsare the National Youth Corps; Promotion of Scoutingand Guiding; International Cooperation etc.
5.31.3 The Finance Minister had announced in the 2014-15 Budget Speech: “Youth of India are pragmatic and
forward-looking and wish to be leaders in all fields. Inorder to promote leadership skills, I propose to set up a‘Young Leaders Programme’ with an initial allocation ofRs.100 crore. A new Scheme entitled “National YoungLeaders Programme (NYLP)” has been introduced todevelop leadership qualities among the youth that wouldenable them to realize their full potential and in theprocess, to contribute to the nation-building process.The NYLP aims to motivate youth to strive for excellencein their respective fields and to bring them to the forefrontof the development process. Some of the componentsof the above scheme are to be implemented throughNehru Yuva Kendra Sangathan and the National ServiceScheme. The Twelfth Plan Outlay for Department ofYouth Affairs to cover these schemes is Rs. 2,048 crore.
5.31.4 Skill Upgradation Programmes for Women areamong the key features of NYKS. Under these thousandsof women have been provided training for various skills.
5.31.5 Some of the programmes being run by theDepartment of Youth Affairs are the promotion of sportsin youth clubs, district youth conventions, promotionof folk culture, youth leadership, national integrationcamps, adolescent health and development, tribal youthexchange, environmental awareness, national youthfestivals, theme based awareness & evaluation, blooddonation camps, the organization of vikas melas andjob fairs, and awareness and education for the preventionof drug abuse and alcoholism in Punjab and Manipur.
5.32 Human Resources: Outlays andExpenditure
5.32.1 The approved outlay and progress of expenditurein MHRD is given in the Annexure 5.1. It can be seenthat the overall expenditure for the first three Plan years(2012-2015) has been only 37.44 per cent of the Planapproved outlay of MHRD. This is an unsatisfactorypace of expenditure. One of the main reasons for slowprogress on expenditure is the non-completion or timeover-run of ongoing civil construction projects,particularly in case of newly set up institutions like IITs,IIMs, IISERs, Central Universities and school buildingsunder some of the newly launched schemes. To achieve
124 APPRAISAL DOCUMENT OF TWELFTH FIVE YEAR PLAN
financial and physical objectives in the remaining period,the pace of expenditure must be stepped up.
5.32.2 For the Ministry of Youth Affairs and Sports,the expenditure during the first three Plan years (2012-15) has been only 41.78 per cent of the approved Planoutlay, mainly on account of slow progress made onnewly proposed schemes. Here, too, the pace ofexpenditure needs to be enhanced substantially if thefinancial and physical objectives of the Plan are to beachieved. The details of outlay and expenditure are givenin Annexure 5.2.
5.33 Education, Sports and Youth Affairs :The Way Forward:
5.33.1 Elementary Education
i) The dropout rates among SCs and STs,which are much higher than the nationalaverage, need to be addressed.
ii) Efforts should be made to bring the out-of-school children, migrant and slum childreninto the mainstream with the help of NGOs,self help groups (SHGs), etc.
iii) Convergence with MGNREGA on theconstruction of infrastructure and toiletconstruction, which may meet some of thedemands in the school infrastructuredeficient States.
iv) To address the problem of teacherabsenteeism and to make them accountablefor it, a mechanism for electronicallymarking teacher attendance needs to beadopted. Further, accountability of teachersimparting education in publicly fundedschools needs to be ensured through astructured mechanism.
v) To enhance their learning outcomes,disadvantaged children need targetedintervention through specific strategies andsupplemental instructions.
5.33.2 Secondary Education
i) A major hurdle identified in theimplementation of RMSA and model schoolscheme is land availability and acquisition.States may be encouraged to enhance thecapacity of existing secondary schools byvertical expansion and strengthening existinginfrastructure. They can also run schoolsin two shifts to efficiently utilize existinginfrastructure. Facilities can also be sharedamong schools.
ii) To enhance access to education andparticipation of children from hilly andsparsely populated areas and districts afflictedwith civil strife, residential hostels for boysand girls in existing schools are needed.
iii) Secondary education needs the adoption ofinternational standards of evaluation withappropriate modification.
iv) Common curricula should be adopted acrossthe country for science and English, to theextent possible.
v) The current RMSA scheme needs to providefor physical education teachers.
vi) Provision of support for out of schoolchildren as per guidelines developed by NIOSneeds to be made.
vii) The total number of educationally backwardblocks in the country is 3,451 or 52 per centof the total blocks which is high. Most ofthese are in Bihar, Jharkhand, MP, Odisha,Rajasthan, Telangana and UP. These Statesare to be motivated to first set up suchschools as would improve access toelementary and second to make availableeducationally qualified and skilled manpower.
viii) Private participation in the education spacemust be incentivized to bring in greater
125HUMAN RESOURCE DEVELOPMENT
investments which could raise GrossEnrolment Ratio (GER) and lower drop-outrates.
5.33.3 Higher Education
i) There is a serious issue of quality in highereducation and it needs to be addressedthrough industry academia interaction.
ii) Investments in R&D and research outcomesin the institutions of higher learning need tobe enhanced. The expenditure on R&D inIndia is only 0.80 per cent of GDP, whichshould be increased.
iii) There is a huge deficit in existing faculty invarious higher education institutions-bothcentrally and state funded. Many institutionsface acute shortages of experienced andsenior faculty, which hampers curriculadevelopment, research initiatives and generalmanagement of institutions. This needs tobe urgently addressed.
iv) Need for making education loans moreaffordable.
v) Research and innovation need special focusand encouragement. The ATAL InnovationMission and SETU would help in thisdirection.
vi) Need for more clarity to make educationloans more affordable.
5.33.4 Youth Affairs
i) To consider introduction of NSS/NCC ascompulsory co-curricular activity ineducational institutions and increasing thestrength of the NSS volunteers.
ii) Targeting increase in female membership inNYKs, skill up gradation programmes forwomen being one of the key features ofNYKS;
iii) Grading of youth clubs and promotion ofsports in youth clubs;
iv) Optimal utilization of NYKs/National YouthCorps with proper coordination betweenCentre and States in implementing youthdevelopment programs;
v) Modernization of youth hostels in touristplaces;
5.33.5 Sports
i) Broad basing sports by connecting these tolocal bodies through a revamped PanchayatYuva Krida Aur Khel Abhiyan, rechristenedas the Rajiv Gandhi Khel Abhiyan;
ii) Identification of sporting talent amongstudents aged 8–12 years (class IV to classVI). They would then be nurtured in district-level sports, or national sports academies,so they could excel at national andinternational sports competitions.
iii) Giving enough space to the National PhysicalFitness Programme and support for sportsin institutions of higher education to helpcreate a sporting atmosphere in the country.
5.34 Empowering Women and ChildProtection
5.34.1 The Appraisal of the Twelfth Plan recognises theprimacy of India’s women and children - who constitutearound 70 per cent of India’s population. It alsorecognizes the fact that more inclusive growth beginswith children and women. In this perspective, theTwelfth Plan assesses the effectiveness of multi sectoralstrategies in breaking an intergenerational cycle ofmultiple deprivations- poverty, social exclusion,undernutrition and gender discrimination faced bychildren and women, all of which impact upon presentand future generations of India’s citizens.
5.34.2 Nutrition constitutes the foundation for humandevelopment, by reducing susceptibility to infections,reducing the related morbidity, disability and mortalityburden, enhancing cumulative lifelong learning capacities
126 APPRAISAL DOCUMENT OF TWELFTH FIVE YEAR PLAN
and adult productivity. Maternal and child undernutritionis the cause attributable to more than one third of themortality of children under five years (LANCET 2008).Ensuring optimal nutrition for young children (underthree years of age) is critical, in order to avert cumulativeand largely irreversible growth and development deficitsover the life cycle, which erode human capital inter-generationally. It is globally acknowledged that nutrition-especially of the young children is one of the mosteffective entry points for human development, povertyreduction and economic development, with higheconomic returns. As also highlighted by the recentEconomic Survey 2015-16 (Chapter 5: Mother and Child)investment in early childhood provides high economicreturns. This is the most rapid and critical period ofphysical and cognitive development; early life conditionssignificantly affect outcomes in adulthood and thesuccess of subsequent interventions in schooling andtraining are significantly influenced by early lifedevelopment. The early years have a cumulative lifelongimpact. With respect to nutrition the Twelfth Plan aimsto reduce undernutrition children below 3 years of ageto half of the 2005-06 (NFHS) levels by 2017. Howeverdata from recent surveys presented below in Box 5.7suggests that the achievement of this target is a challengedespite encouraging progress made by several States.
5.34.3 The Twelfth Plan envisages converging effortsfrom the Ministries of Women & Child Developmentand of Health & Family Welfare to achieve a synergicimpact: the reduction of maternal and child malnutrition,anemia and mortality- especially in the high burden Statesand districts. This has resulted in higher priority beingaccorded to the provision of health services at ICDSAWCs. The Twelfth Plan emphasised the gendercomponent of development planning and making it morechild-centric.
5.34.4 The approach towards women, children andnutrition has evolved over the years with a markedparadigm shift from welfare to development to a rightsbased approach. In the current paradigm, women arerecognized as equal partners in social, economic,development and political processes and as prime moversof social change and as agents of economic change.Inter sectoral convergence at all levels of governance is
also recognized to be a crucial determinant of whethermulti sectoral actions achieve their desired outcomes.
5.35 Malnutrition
5.35.1 The progress made on nutrition has beenencouraging with all the four decisions of the PrimeMinister’s National Council on India’s NutritionChallenges under varying stages of implementation.
i. The strengthening and restructuring, ofICDS is well underway, as outlined above.
ii. The Multi sectoral Programme to addressmaternal and child under nutrition in 200 highburden districts, was also approved in 2013.
iii. Launching a nationwide IEC campaign wasalso accomplished during 2010-12.
iv. Bringing a strong nutrition focus to sectoralprogrammes was achieved through effectivemulti sectoral reviews with 17 Ministries, withnutrition now being anchored in the relevantsectoral strategies of the Twelfth Plan.
v. The institutional arrangements for nutritioncoordination are also evolving, being vestedin the ICDS National Mission Steering Group.
5.35.2 Child Stunting in children under 5 years hasreduced in 13 States covered in Phase 1 as compared toNFHS 3, although absolute levels are still high in someStates. The most significant reductions in child stuntingare seen in Tripura by 31.93 per cent and in West Bengalby 27.13 per cent. Reductions are also seen in Haryana,Maharashtra, Meghalaya, Uttarakhand, MP, Sikkim andGoa. In 10 States/UTs, less than one-third of childrenare stunted. Despite progress made, more than 40 percent of children are stunted in Bihar, Madhya Pradeshand Meghalaya, followed by 36.2 per cent in Karnatakaand 35.4 per cent in Maharashtra.
5.35.3 Child Wasting in children under 5 years isstill high in Phase I States/Union Territories, with levelsabove 25 per cent in Karnataka, Maharashtra and MadhyaPradesh. Significant reductions are seen in Meghalaya(by 15.4 percentage points) and in Madhya Pradesh (by9.2 percentage points) - although absolute levels are stillhigh. Increases in child wasting are reported in 7 States,
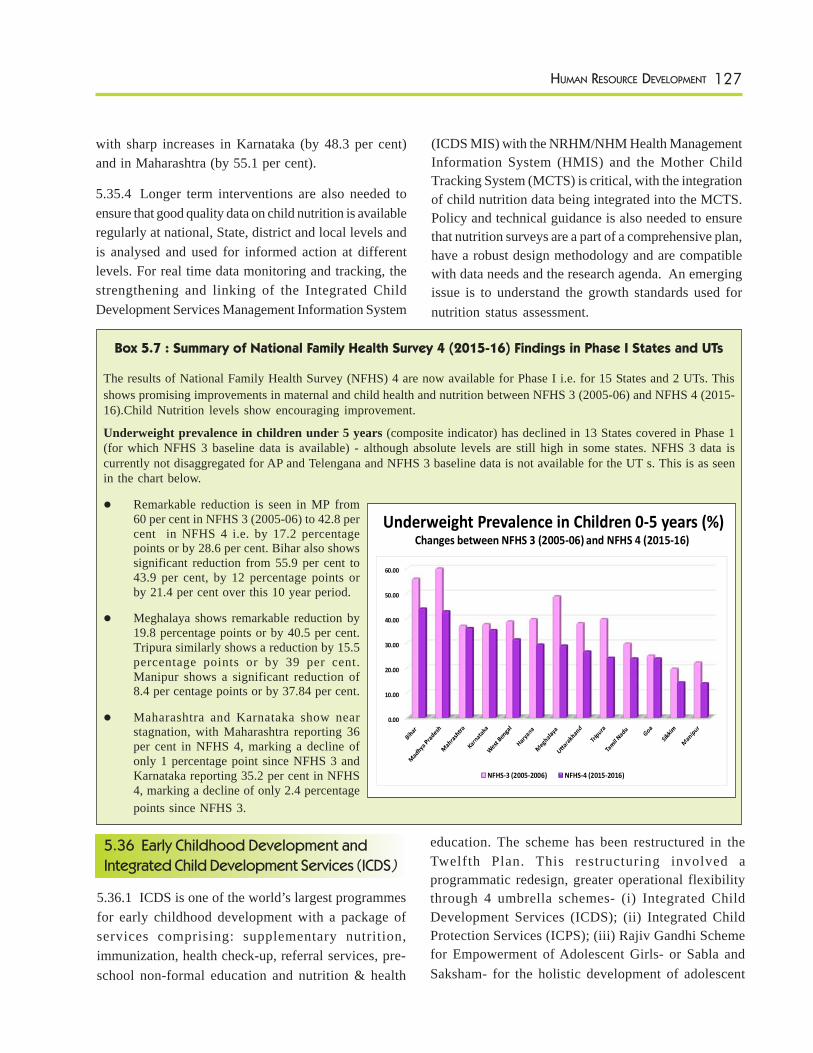
127HUMAN RESOURCE DEVELOPMENT
with sharp increases in Karnataka (by 48.3 per cent)and in Maharashtra (by 55.1 per cent).
5.35.4 Longer term interventions are also needed toensure that good quality data on child nutrition is availableregularly at national, State, district and local levels andis analysed and used for informed action at differentlevels. For real time data monitoring and tracking, thestrengthening and linking of the Integrated ChildDevelopment Services Management Information System
(ICDS MIS) with the NRHM/NHM Health ManagementInformation System (HMIS) and the Mother ChildTracking System (MCTS) is critical, with the integrationof child nutrition data being integrated into the MCTS.Policy and technical guidance is also needed to ensurethat nutrition surveys are a part of a comprehensive plan,have a robust design methodology and are compatiblewith data needs and the research agenda. An emergingissue is to understand the growth standards used fornutrition status assessment.
Box 5.7 : Summary of National Family Health Survey 4 (2015-16) Findings in Phase I States and UTs
The results of National Family Health Survey (NFHS) 4 are now available for Phase I i.e. for 15 States and 2 UTs. Thisshows promising improvements in maternal and child health and nutrition between NFHS 3 (2005-06) and NFHS 4 (2015-16).Child Nutrition levels show encouraging improvement.
Underweight prevalence in children under 5 years (composite indicator) has declined in 13 States covered in Phase 1(for which NFHS 3 baseline data is available) - although absolute levels are still high in some states. NFHS 3 data iscurrently not disaggregated for AP and Telengana and NFHS 3 baseline data is not available for the UT s. This is as seenin the chart below.
Remarkable reduction is seen in MP from60 per cent in NFHS 3 (2005-06) to 42.8 percent in NFHS 4 i.e. by 17.2 percentagepoints or by 28.6 per cent. Bihar also showssignificant reduction from 55.9 per cent to43.9 per cent, by 12 percentage points orby 21.4 per cent over this 10 year period.
Meghalaya shows remarkable reduction by19.8 percentage points or by 40.5 per cent.Tripura similarly shows a reduction by 15.5percentage points or by 39 per cent.Manipur shows a significant reduction of8.4 per centage points or by 37.84 per cent.
Maharashtra and Karnataka show nearstagnation, with Maharashtra reporting 36per cent in NFHS 4, marking a decline ofonly 1 percentage point since NFHS 3 andKarnataka reporting 35.2 per cent in NFHS4, marking a decline of only 2.4 percentagepoints since NFHS 3.
Underweight Prevalence in Children 0‐5 years (%) Changes between NFHS 3 (2005‐06) and NFHS 4 (2015‐16)
0.00
10.00
20.00
30.00
40.00
50.00
60.00
NFHS‐3 (2005‐2006) NFHS‐4 (2015‐2016)
5.36 Early Childhood Development and
Integrated Child Development Services (ICDS)
5.36.1 ICDS is one of the world’s largest programmesfor early childhood development with a package ofservices comprising: supplementary nutrition,immunization, health check-up, referral services, pre-school non-formal education and nutrition & health
education. The scheme has been restructured in theTwelfth Plan. This restructuring involved aprogrammatic redesign, greater operational flexibilitythrough 4 umbrella schemes- (i) Integrated ChildDevelopment Services (ICDS); (ii) Integrated ChildProtection Services (ICPS); (iii) Rajiv Gandhi Schemefor Empowerment of Adolescent Girls- or Sabla andSaksham- for the holistic development of adolescent
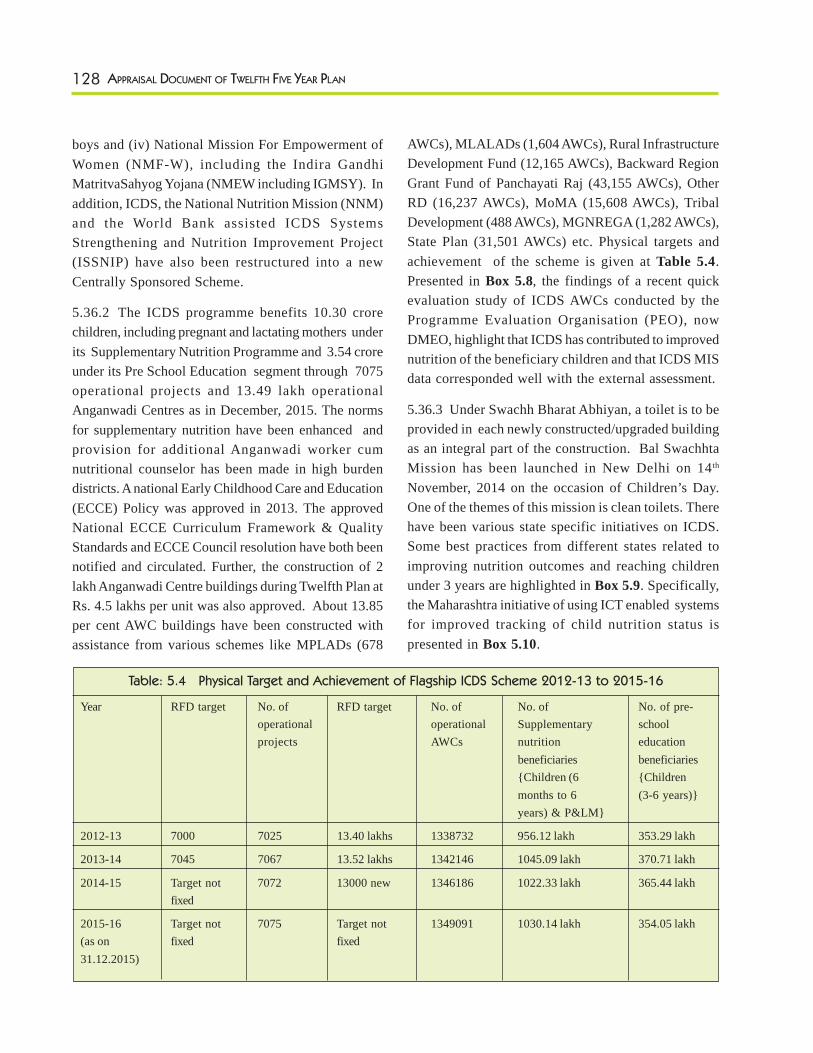
128 APPRAISAL DOCUMENT OF TWELFTH FIVE YEAR PLAN
boys and (iv) National Mission For Empowerment ofWomen (NMF-W), including the Indira GandhiMatritvaSahyog Yojana (NMEW including IGMSY). Inaddition, ICDS, the National Nutrition Mission (NNM)and the World Bank assisted ICDS SystemsStrengthening and Nutrition Improvement Project(ISSNIP) have also been restructured into a newCentrally Sponsored Scheme.
5.36.2 The ICDS programme benefits 10.30 crorechildren, including pregnant and lactating mothers underits Supplementary Nutrition Programme and 3.54 croreunder its Pre School Education segment through 7075operational projects and 13.49 lakh operationalAnganwadi Centres as in December, 2015. The normsfor supplementary nutrition have been enhanced andprovision for additional Anganwadi worker cumnutritional counselor has been made in high burdendistricts. A national Early Childhood Care and Education(ECCE) Policy was approved in 2013. The approvedNational ECCE Curriculum Framework & QualityStandards and ECCE Council resolution have both beennotified and circulated. Further, the construction of 2lakh Anganwadi Centre buildings during Twelfth Plan atRs. 4.5 lakhs per unit was also approved. About 13.85per cent AWC buildings have been constructed withassistance from various schemes like MPLADs (678
AWCs), MLALADs (1,604 AWCs), Rural InfrastructureDevelopment Fund (12,165 AWCs), Backward RegionGrant Fund of Panchayati Raj (43,155 AWCs), OtherRD (16,237 AWCs), MoMA (15,608 AWCs), TribalDevelopment (488 AWCs), MGNREGA (1,282 AWCs),State Plan (31,501 AWCs) etc. Physical targets andachievement of the scheme is given at Table 5.4.Presented in Box 5.8, the findings of a recent quickevaluation study of ICDS AWCs conducted by theProgramme Evaluation Organisation (PEO), nowDMEO, highlight that ICDS has contributed to improvednutrition of the beneficiary children and that ICDS MISdata corresponded well with the external assessment.
5.36.3 Under Swachh Bharat Abhiyan, a toilet is to beprovided in each newly constructed/upgraded buildingas an integral part of the construction. Bal SwachhtaMission has been launched in New Delhi on 14th
November, 2014 on the occasion of Children’s Day.One of the themes of this mission is clean toilets. Therehave been various state specific initiatives on ICDS.Some best practices from different states related toimproving nutrition outcomes and reaching childrenunder 3 years are highlighted in Box 5.9. Specifically,the Maharashtra initiative of using ICT enabled systemsfor improved tracking of child nutrition status ispresented in Box 5.10.
Table: 5.4 Physical Target and Achievement of Flagship ICDS Scheme 2012-13 to 2015-16
Year RFD target No. of RFD target No. of No. of No. of pre-operational operational Supplementary schoolprojects AWCs nutrition education
beneficiaries beneficiaries{Children (6 {Childrenmonths to 6 (3-6 years)}years) & P&LM}
2012-13 7000 7025 13.40 lakhs 1338732 956.12 lakh 353.29 lakh
2013-14 7045 7067 13.52 lakhs 1342146 1045.09 lakh 370.71 lakh
2014-15 Target not 7072 13000 new 1346186 1022.33 lakh 365.44 lakhfixed
2015-16 Target not 7075 Target not 1349091 1030.14 lakh 354.05 lakh(as on fixed fixed31.12.2015)
129HUMAN RESOURCE DEVELOPMENT
5.37 Protecting the Children
5.37.1 Integrated Child Protection Scheme (ICPS) aimsat building a protective environment for children indifficult circumstances, as well as other vulnerablechildren, through Partnership between the government
and civil society. Its financial norms have been revisedw.e.f. 1st April 2014 to include enhanced financial normsfor child maintenance, staff salaries, care and protectionservices and the establishment of statutory bodies andbetter service delivery structures for implementation ofthe scheme. This was another step forward in ensuring
Box 5.8 : Checking Anganwadi Centres
A Quick Evaluation study of ICDS Anganwadi Centres was conducted by the Programme Evaluation Organisation (PEO),now DMEO, to validate the ICDS MIS data in selected States/UTs. The study’s reference period was from Dec-2013 toFebruary -2014.The study was conducted on purposive random sampling basis 510 AWCs in, 19 States/UTs wereselected, AWCs were visited by PEO teams during the month of April, 2014. It was found that total number of childrenenrolled in the registers as 31,397 which 62.70 per cent were rural and balance 37.30 per cent were urban. Out of the totalenrolled children, 15,300 children i.e.48.70 per cent were chosen for weight measurement.One of the important findings of the study was that the children in the normal grade i.e. not undernourished, were 76 percent of the total sample size, which is very encouraging. This indicates that ICDS has contributed to improved nutritionof these children. This also compared well with ICDS MIS data which recorded the percentage of normal grade childrenas varying between 75.4 per cent and 78. 8 per cent. It was found that 75.7 per cent of the AWCs are maintaining recordsproperly.Some challenges also emerged in terms of the work load of AWWs (who were also assigned other tasks), the need forimproved nutrition interventions for younger children, and ensuring the optimal location of AWCs at local levels. Theneed were also identified for improved sanitation, facilities and infrastructure of AWCs, as 41 per cent of the AWCs didnot have adequate space to accommodate children and 51.8 per cent were found to have unhygienic conditions. Theopening of nursery schools in urban and rural areas is also recognised as a challenge, addressing which may catalyseservice quality improvement in ICDS AWCs.
Box 5.9 : ICDS Best Practices
Some of the best practices under ICDS from various States on nutrition strategies , care and counselling to reachchildren under 3 pregnant and lactating mothersi. Nava Jatan (Chhattisgarh) Community level Suposhan volunteers are assigned to track and look after a group of
young undernourished children and ensure their appropriate care and feeding, with health referrals and supportas needed, till the children comes back to normal grade and are no longer undernourished.
ii. Dular (Bihar and Jharkhand) Women community level volunteers and local resource persons each takeresponsibility for 15-20 families with young children counselling and linking them with ICDS and relatedhealth services for improved nutrition.
iii. Positive Deviance (West Bengal, Odisha): Mothers support groups, featuring positive role model mothers whosechildren are growing well counsel mothers of undernourished children. Demonstrated spot feeding sessions (for 12days), followed by home based practice sessions (18 days) and then by follow up and repeat cycles.
iv. Mission Baal Sukham (Gujarat) features 3 levels of managementThe Village Child Nutrition Centre as “Bal Shaktim Kendra” at Anganwadi centres for malnourished childrenwithout any medical needs.The Child Malnutrition Treatment Centre as “BalSewa Kendra” at PHC/CHC/ Sub District level for malnourishedchildren needing some medical care.Nutrition Rehabilitation Centre or “BalSanjeevani Kendra” at District Hospital/ Medical College for malnourishedchildren requiring significant medical care.
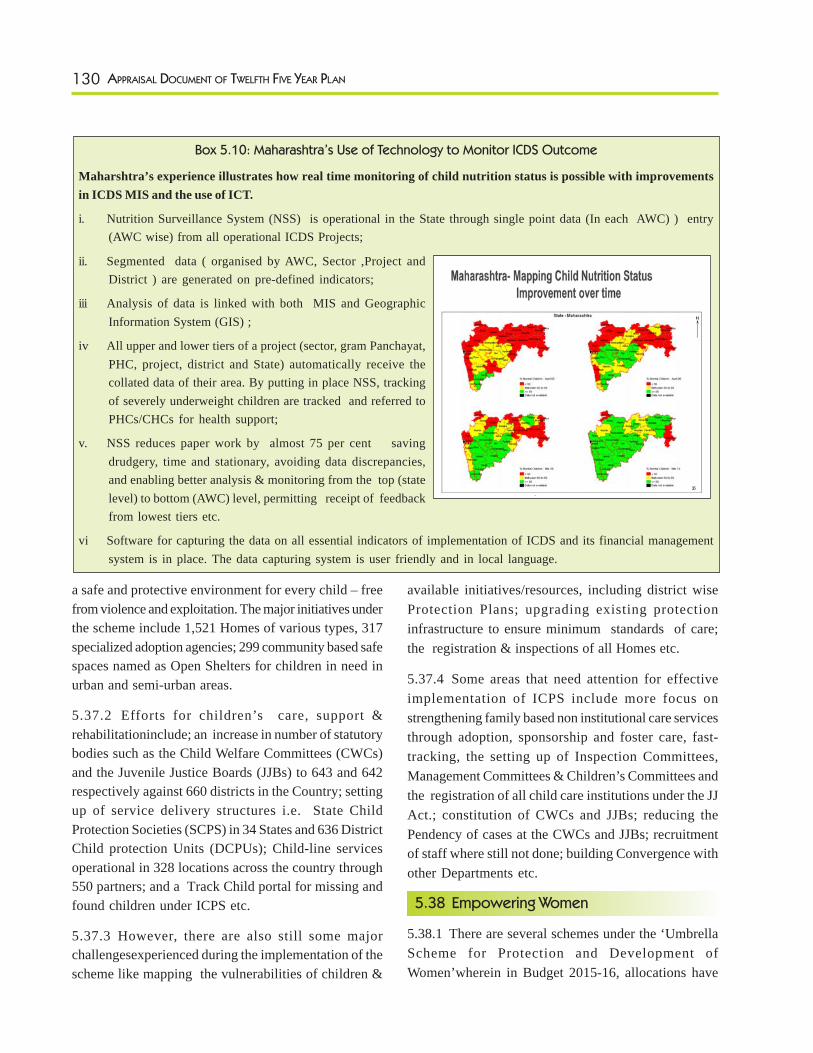
130 APPRAISAL DOCUMENT OF TWELFTH FIVE YEAR PLAN
a safe and protective environment for every child – freefrom violence and exploitation. The major initiatives underthe scheme include 1,521 Homes of various types, 317specialized adoption agencies; 299 community based safespaces named as Open Shelters for children in need inurban and semi-urban areas.
5.37.2 Efforts for children’s care, support &rehabilitationinclude; an increase in number of statutorybodies such as the Child Welfare Committees (CWCs)and the Juvenile Justice Boards (JJBs) to 643 and 642respectively against 660 districts in the Country; settingup of service delivery structures i.e. State ChildProtection Societies (SCPS) in 34 States and 636 DistrictChild protection Units (DCPUs); Child-line servicesoperational in 328 locations across the country through550 partners; and a Track Child portal for missing andfound children under ICPS etc.
5.37.3 However, there are also still some majorchallengesexperienced during the implementation of thescheme like mapping the vulnerabilities of children &
available initiatives/resources, including district wiseProtection Plans; upgrading existing protectioninfrastructure to ensure minimum standards of care;the registration & inspections of all Homes etc.
5.37.4 Some areas that need attention for effectiveimplementation of ICPS include more focus onstrengthening family based non institutional care servicesthrough adoption, sponsorship and foster care, fast-tracking, the setting up of Inspection Committees,Management Committees & Children’s Committees andthe registration of all child care institutions under the JJAct.; constitution of CWCs and JJBs; reducing thePendency of cases at the CWCs and JJBs; recruitmentof staff where still not done; building Convergence withother Departments etc.
5.38 Empowering Women
5.38.1 There are several schemes under the ‘UmbrellaScheme for Protection and Development ofWomen’wherein in Budget 2015-16, allocations have
Box 5.10: Maharashtra’s Use of Technology to Monitor ICDS Outcome
Maharshtra’s experience illustrates how real time monitoring of child nutrition status is possible with improvementsin ICDS MIS and the use of ICT.
i. Nutrition Surveillance System (NSS) is operational in the State through single point data (In each AWC) ) entry(AWC wise) from all operational ICDS Projects;
ii. Segmented data ( organised by AWC, Sector ,Project andDistrict ) are generated on pre-defined indicators;
iii Analysis of data is linked with both MIS and GeographicInformation System (GIS) ;
iv All upper and lower tiers of a project (sector, gram Panchayat,PHC, project, district and State) automatically receive thecollated data of their area. By putting in place NSS, trackingof severely underweight children are tracked and referred toPHCs/CHCs for health support;
v. NSS reduces paper work by almost 75 per cent savingdrudgery, time and stationary, avoiding data discrepancies,and enabling better analysis & monitoring from the top (statelevel) to bottom (AWC) level, permitting receipt of feedbackfrom lowest tiers etc.
vi Software for capturing the data on all essential indicators of implementation of ICDS and its financial managementsystem is in place. The data capturing system is user friendly and in local language.
16
131HUMAN RESOURCE DEVELOPMENT
been made under the Central Plan. The Nirbhaya Fundwith a non-lapsable corpus of Rs.1,000 crore was setup in the Ministry of Finance in 2013-14 and guidelineswere finalized in May 2015. The corpus has expandedwith Rs 1,000 crore each added in each of the subsequent2 Budgets. Guidelines for utilization of the Fund’ havebeen framed with the Ministry of Women & ChildDevelopment (WCD) as the nodal authority. The Ministryof WCD can be approached by various Ministries/Departments for funds with the proposals/schemes, tostrengthen the safety and security of women in thecountry.
5. 38. 2 National Mission for Empowerment ofWomen (NMEW):This mission aims at strengtheningthe inter-sector convergence; coordination amongvarious women’s welfare and socio-economicdevelopment programmes across ministries anddepartments. A National Mission Authority has beenreconstituted overseen by a steering committee at thelevel of the Secretary of the Ministry of WCD. A totalof Rs 25 crore has been allocated for the year 2015-16under the Central Plan.The State Mission Authority(SMA), which is the highest policy making body at thestate level for NMEW, has been constituted in 27 Statesand 5 UTs. The State Resources Centres for Women(SRCWs), which are fully funded by the Centre andresponsible for planning, execution and monitoring ofthe mission’s vision and activities at the State level, havebeen set up in 26 States and 4 UTs.
5.38.3 To provide support like food and shelter,counseling, medical facilities and vocational training towomen SWADHAR scheme is being implemented. TheScheme for universalization of the Women’s Helplinehas been approved on February, 2015 with a total projectcost of Rs.69.49 crore for implementation throughStates /UTs from 1st April, 2015. The scheme envisagesto provide 24 hour emergency and non-emergencyresponse to all women affected by violence both in publicand private sphere, whether in the family, the community,or the workplace etc. The Scheme for One Stop Centrefor Women has also been approved on March, 2015with a total project cost of Rs. 18.58 crore forimplementation through States /UTs from 1st April, 2015.This scheme is to facilitate or provide medical aid, police
assistance, legal counseling / court case management,psycho-social counseling and temporary shelter towomen affected by violence. Each State and UT isplanned to get on ‘One Stop Centre’ in the first phase.
5.38.4 SABLA, the Rajiv Gandhi Scheme forEmpowerment of Adolescent Girls (11-18 years) isimplemented in 205 districts with two components onedealing with nutrition and the other with non nutritionaspects. The pace of implementation for the non-nutritioncomponent was slow till 2012-13, as it involvesconvergence with various line Ministries (for which alot of preparatory work was to be undertaken at Statelevel). In addition limited financial resources wereprovisioned for the various non-nutrition services underthe scheme. SABLA is under evaluation for continuationin the Twelfth Plan. There is a need to work towardsmainstreaming women in new and emerging areas ofthe economy through necessary skill and vocationaltraining, credit facilities and marketing support andtechnology education. This will help women to take upentrepreneurial activities in new and emerging trades.Suitable training modules for short term, market oriented,and demand-driven programmes for women within aflexible delivery framework need to be prepared.
5.38.5 Working Women Hostel (WWH):This schemehas benefited 69051 working women with 921 hostelsset up all over the country till 31-12-2015. The schemehas been strengthened with a more proactive monitoringmechanism. As per the revised guidelines of the STEPScheme-2014, assistance will be available in any sectorfor imparting skills related to employability andentrepreneurship. Against a target of 30000 a total of30953 beneficiaries were covered under STEP Schemeduring 2014-15.
5.38.6 ‘UJJAWALA’- is a Comprehensive Scheme forCombating Trafficking whichhas been revised withenhanced financial norms and strengthening of themonitoring mechanism. As in December 2015 286projects including 162 Protective and RehabilitativeHomes have been sanctioned under the Scheme. On theeve of International Women’s Day, a day that celebratesthe achievements of women and showcases issuesimportant to their well being, Mahila E-HAAT a platform
132 APPRAISAL DOCUMENT OF TWELFTH FIVE YEAR PLAN
for women entrepreneurs to showcase and marlcet theirproducts is being launched. This platform, set up byMinistry of Women and Child Development under theRashtriyaMahilaKosh, will create a complete economiceco system for Women Entrepreneurs. It provides directinteraction between producers and consumers. Thisplatform, set up by Ministry of Women and ChildDevelopment under the RashtriyaMahilaKosh, will createa complete economic eco system for WomenEntrepreneurs. It provides direct interaction betweenproducers and consumers.
5.38.7 A total of 7,35,239 women have been benefittedas on December 2015 from cumulative loans adding upto Rs. 360.24 crore from the RashtriyaMahilaKosh.Torevamp the activities of RMK, a committee of seniorbankers, social workers and experts was constituted,which has since submitted its Report. It has been decidedto provide credit to individual applicants besides SHGs,either directly or through partners of RMK. This creditwould be to provide need based training for capacitybuilding or livelihood creation activities. It was alsodecided to engage 10-15 selected institutions, instead ofdirectly funding intermediary organizations. An onlinemarketing platform for women entreprenuers, MahilaE-Haat, was recently launched on 07th March 2016 toprovide a platform women entrepreneurs to showcaseand market their products. This platform set up underthe Rashtriya Mahila Kosh, is expected to create acomplete economic eco system for WomenEntrepreneurs. It provides direct interaction betweenproducers and consumers.
5.39 Child Sex Ratio
5.39.1 Raising the child sex ratio in the 0–6 year agegroup from 918 to 950 is one of the monitorable targetsof the Twelfth Plan. The decline in the ratio has beensteep and unabated since 1961.The ratio has fallen from927 in 2001 to 918 in 2011 as per Census 2011 (PrimaryCensus Abstract), which is an all-time low since 1961.It declined in 18 States and 3 UTs and sharp falls in therange of 79 to 17 points were seen in the ratio in Jammu& Kashmir, Dadra & Nagar Haveli, Lakshadweep,Andhra Pradesh, Daman and Diu, Manipur, Nagaland,Rajasthan, Maharashtra, Uttarakhand and Jharkhandduring 2001-2011. The steepest fall of 79 points is inJammu & Kashmir -from 941 to 862.
5.39.2 There was a decline in the Child Sex Ratio in429 districts, which is more than two thirds of the totalnumber of districts in the country. In 143 districts thedecline has been of the order of 20 to 49 points. In 25districts the decline has been by more than 50 points.
5.39.3 Between 2001 and 2011 the child sex ratio inRural Areas declined from 933 to 919 and in urbanareas from 906 to 905. While the absolute level of theratio is lower in urban as compared to rural areas - therate of decline in rural areas is steeper and this has majoradverse implications for the future. These trends arevisible in Figure 5.5.
5.39.4 There are also significant gender differentials of8 points (all India) in the mortality rates of childrenunder 5 years - which was 59 for girls as against 51 forboys ( the aggregate was 55) in 2011. Even sharpergender differentials were seen in States such as Jharkhand(18), Chhattisgarh (17), (Rajasthan (15) and UttarPradesh (14) (RGI, 2012).
5.39.5 These trends indicate that the problem of sexselective abortion and elimination is increasing inmagnitude and no longer confined to just some Statesor only to urban areas. This much wider spectrum andspread of the problem has to be addressed. The issueincludes: pre-birth sex selective elimination, infanticidein some areas, and grossneglect of the young girl child.Efforts must include care and protection of the younggirl child in insecure environments, along with longerterm interventions for girls’ education and protection,women’s empowerment and gender equality.
5.39.6 One of the recommendations of the Plan hasbeen that the Girl Child Specific District Plan of Actionto be developed through decentralized planningprocesses. To address the CSR issue of Child Sex ratio,the Scheme ‘Care and Protection of Girl Child- wasformulated as a multi sectoral action plan. Its intent wasto improve Child Sex Ratio in 100 gender critical districtsbased on the National Plan of Action.
5.39.7 A new scheme called Beti Bachao Beti Padhao,aiming to address the issue of Child Sex Ratio through aNational level strategy was launched in January 2015. Ithas focus on a mass communication campaign, along
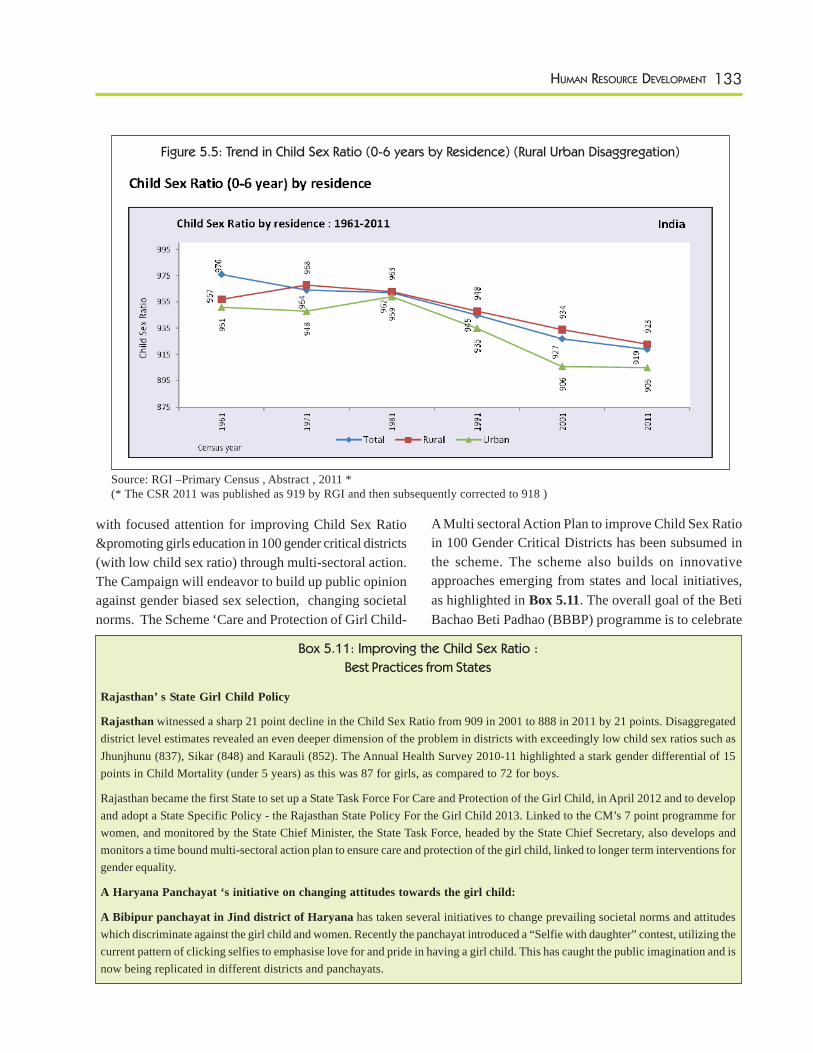
133HUMAN RESOURCE DEVELOPMENT
with focused attention for improving Child Sex Ratio&promoting girls education in 100 gender critical districts(with low child sex ratio) through multi-sectoral action.The Campaign will endeavor to build up public opinionagainst gender biased sex selection, changing societalnorms. The Scheme ‘Care and Protection of Girl Child-
A Multi sectoral Action Plan to improve Child Sex Ratioin 100 Gender Critical Districts has been subsumed inthe scheme. The scheme also builds on innovativeapproaches emerging from states and local initiatives,as highlighted in Box 5.11. The overall goal of the BetiBachao Beti Padhao (BBBP) programme is to celebrate
Figure 5.5: Trend in Child Sex Ratio (0-6 years by Residence) (Rural Urban Disaggregation)
Source: RGI –Primary Census , Abstract , 2011 *(* The CSR 2011 was published as 919 by RGI and then subsequently corrected to 918 )
Box 5.11: Improving the Child Sex Ratio :
Best Practices from States
Rajasthan’ s State Girl Child Policy
Rajasthan witnessed a sharp 21 point decline in the Child Sex Ratio from 909 in 2001 to 888 in 2011 by 21 points. Disaggregateddistrict level estimates revealed an even deeper dimension of the problem in districts with exceedingly low child sex ratios such asJhunjhunu (837), Sikar (848) and Karauli (852). The Annual Health Survey 2010-11 highlighted a stark gender differential of 15points in Child Mortality (under 5 years) as this was 87 for girls, as compared to 72 for boys.
Rajasthan became the first State to set up a State Task Force For Care and Protection of the Girl Child, in April 2012 and to developand adopt a State Specific Policy - the Rajasthan State Policy For the Girl Child 2013. Linked to the CM’s 7 point programme forwomen, and monitored by the State Chief Minister, the State Task Force, headed by the State Chief Secretary, also develops andmonitors a time bound multi-sectoral action plan to ensure care and protection of the girl child, linked to longer term interventions forgender equality.
A Haryana Panchayat ‘s initiative on changing attitudes towards the girl child:
A Bibipur panchayat in Jind district of Haryana has taken several initiatives to change prevailing societal norms and attitudeswhich discriminate against the girl child and women. Recently the panchayat introduced a “Selfie with daughter” contest, utilizing thecurrent pattern of clicking selfies to emphasise love for and pride in having a girl child. This has caught the public imagination and isnow being replicated in different districts and panchayats.
134 APPRAISAL DOCUMENT OF TWELFTH FIVE YEAR PLAN
the Girl Child and enable her education. The total projectcost of the programme for the 2 year and 6 month periodis Rs. 199.99 crore with 100 per cent Central Assistance.
5.40 Enabling Legislations
5.40.1 A number of enabling legislations have beenintroduced in the last two years to address violence anddiscrimination against women and children. These needto be properly implemented and enforced.
5.40.2 Sexual Harassment of Women at Workplace(Prevention, Prohibition and Redressal) Act 2013 makesit mandatory for all offices or unorganized sectorenterprises with 10 or more employees to have aninternal complaints committee to address grievances ina stipulated time or face penalty. The Protection of Childrenfrom Sexual Offences Act, 2012 provides protection toall children under the age of 18 years from the offencesof sexual assault, sexual harassment and pornography.These offences have been clearly defined for the firsttime in law. The Act provides for stringent punishments,which have been graded as per the gravity of the offence.The Criminal Law (Amendment) Act, 2013 has also beenenacted with more stringent provisions.
5.41 Women and Children :The Way Forward
In this emerging perspective and as also highlighted bythe recent Economic Survey 2015-16, young childrenmust be placed first on the development agenda- therationale for imperative action being to ensure faster,more inclusive and sustainable human development andeconomic growth. Envisaged pathways for the wayforward include-
5.41.1 Development and Implementation of a NationalPlan of Action for Children -for survival, development,protection and participation, with monitorable outcomes.This would be reinforced by contextually relevant Stateand District Plans of Action For Children. These Plansof Action would give effect to the updated NationalPolicy For Children and recent/new legislations.
5.41.2 Initiating a new National Nutrition Mission, witha focus on preventing and reducing child undernutrition;reaching pregnant and breast feeding mothers and
children under three years across the life cycle;converging action on key determinants of undernutrition.These include maternal and child care, infant and youngchild feeding- especially early and exclusive breastfeeding for the first six months of life, health, hygieneand sanitation; enhancing community ownership andleadership of panchayats in becoming “kuposhanmukt”.Specific strategies would be developed for poorperforming States and districts and high prevalenceareas, with synergistic linkages of the State/ districtprogramme implementation plans of ICDS, NationalHealth Mission, Swachh Bharat with improvedmonitoring, for accelerating reductions in childundernutrition and related mortality. As suggested in theEconomic Survey 2015-16, creating a “Nudge unit withingovernment”, as other countries have done, may be auseful way of taking this agenda forward.
5.41.3 Institutional mechanisms are needed toensure that Nutrition surveys are part of acomprehensive plan, have a robust design methodologyand are compatible with data needs. This is needed toensure that good quality data on Child Nutrition Statusis available regularly at National, State, District and locallevels, is analysed and used for informed action atdifferent levels.
5.41.4 Real time nutrition data monitoring andtracking by service providers must be strengthened.The strengthening and linking of the Integrated ChildDevelopment Services Management Information System(ICDS MIS) with the NHM Health ManagementInformation System (HMIS) and the Mother ChildTracking System (MCTS) is critical, with the integrationof child nutrition data in MCTS, using the joint ICDSNHM Mother and Child Protection Card as thefoundation.
5.41.5 Strengthening the ICPS scheme to cover allvulnerable children. All components of the schememust be functional in all parts of the country.
5.41.6 Strengthening community action for aprotective environment for children, ensuring childfriendly panchayats and urban local bodies-especially
135HUMAN RESOURCE DEVELOPMENT
for the girl child, in Beti Bachao Beti Padhao gendercritical districts.
5.41.7 Reinforcing BetiBachao, BetiPadhao throughState policies for the girl child and women and specificinterventions such as promotion of equal property rights,affirmative action, promoting 50 per cent reservationfor women in PRIs/ ULBs etc.
5.41.8 Designing a time bound comprehensivestrategy for Women’s Empowerment, Developmentand Protection, as envisaged through an umbrellascheme and convergence with other sectors. This wouldbuild on the recommendations of the High LevelCommittee on the Status of Women. This would alsoinclude a comprehensive strategy to End Violence againstWomen and Girls; ensuring women’s safety and securityand reflecting multisectoral interventions.
5.41.9 Mobilizing enhanced State resources for Womenand Children, utilizing opportunities provided by theenhanced devolution of resources to States. State Plansand budgets should be reviewed using a gender & childlens - guided by agreed Twelfth Plan monitorableoutcomes and in future, adapted and contextualizedSustainable Development Goals. In future, this may alsoculminate in the development and use of Gender andChild Score Cards for States /Districts.
5.41.10 Need for providing adequate resources bothby State and Central governments with effective & resultdriven monitoring mechanisms to implement thestrengthened & Restructured ICDS- especially itsinnovative components.
5.41.11 Poverty Task Forces at national/state levelsshould integrate gender and child poverty concerns andbuild this into indices to measure the inclusiveness ofgrowth or social inclusion.
5.42 Summary of Learnings
5.42.1 Despite significant improvements in healthindicators and achievement of millennium developmentgoals to a large extent, the targets of the 12th Plan werelargely missed, especially with respect to maternal andchild health. The large supply- side gaps for which data
is available and that may be partly associated with theseoutcomes is the lack of adequate health facilities (20 percent and 23 per cent shortfall of sub- centres and PHCsrespectively) and health workers (particularly shortageof specialists (81.19 per cent)) to staff the facilities;gaps which must be filled up on priority.
5.42.2 A number of new/improved schemes wereintroduced during the course of the Plan period (MissionIndradhanush, Rashtriya Bal Swasthya Karyakram,transfer of RSBY to MoH&FW, NHM Free Drugs andDiagnostics Initiative etc) that are aimed at addressingmultiple national health goals. The overall impact of theseschemes will have to be evaluated in due course to guidefurther policy measures in health.
5.42.3 Less than 50 per cent of the total 12th Plan outlaywas allocated during the period. Of that, utilization levelsfor the first four years are 81.34 per cent. Efforts mustbe made to improve utilization capacities of States witheffective governance and stewardship mechanisms.
5.42.4 Kayakalp initiative encourages every public healthfacility in the country to work towards standards ofexcellence to help the facilities stay clean and hygienic.This does not apply only to physical cleanliness, but todevelop and put in place systems and procedures foractivities such as bio-waste disposal or protocolsetc. This initiative has led to improvement in cleanlinessin health facilities. Without much expenditure, thisprogramme is expected to have a large impact on theutilization of public health facilities.
5.43 Education
5.43.1 School Education: Despite significantimprovements in access and equity during the 12th Planperiod, school education in India remains beset withissues of quality. In order to make all boys and girlsready for primary education as well as to reduce dropoutrates in the early primary classes, it is essential toameliorate the quality of education imparted by linkingone year of pre-primary education with primary schoolingwhich is so critical for school preparedness and earlychildhood development. Moreover, in order to ensurethat all girls and boys complete free, equitable and quality
136 APPRAISAL DOCUMENT OF TWELFTH FIVE YEAR PLAN
school education leading to relevant and effective learningoutcomes, there is an urgent need to target learningoutcomes. To this end, the NCERT should developgrade-wise, quantifiable and measurable learningstandards for both primary and secondary education.For this to be effective, there is a need to develop andimplement a system for assessment/ evaluation ofschools and for greater use of ICTs for monitoringlearning outcomes, school evaluation as well as studentattendance. It is equally imperative to substantiallyincrease supply of qualified teachers and set up biometricattendance mechanism to address teacher absenteeism.
5.43.2 Encouraging demonstrative teaching, field visits,learning from surroundings, and sharing of best practicesacross States, like Activity-Based Learning (ABL) andProject-Based Learning (PBL), would go a long way inimproving enrolment and retention. Involvement ofNGOs and Self-Help Groups in programmeimplementation, such as for mainstreaming out of schoolchildren, and home visits by teachers/volunteers to involveparents would ensure inclusive and equitable qualityeducation. In order to eliminate gender disparities ineducation and ensure equal access to all levels ofeducation, including persons with disabilities and childrenfrom socially and disadvantaged sections of society, itis imperative to expand residential schools includingadditional KGBVs in educationally backward blocks andareas with high concentration of SCs/STs/minorities, toset up seasonal hostels (especially for children ofmigrants), to provide transport/ escort facilities fordisadvantaged children, and to ensure greater use of e-content in local languages, especially to target childrenin remote or tribal areas. It is equally important toincrease access to vocational courses (relevant to stateneeds) at secondary/ senior-secondary levels as well asto source vocational instructors on part-time basis fromITIs, polytechnics, and industry.
5.43.3 Higher Education: In order to ensure equalaccess for all men and women to affordable and quality
technical, vocational and higher education, there is aneed to expand existing Massive Open Online Courses(MOOCs) and SWAYAM (Study Webs of Active-Learning for Young Aspiring Minds) as well as to increasepublic spending in State higher education throughexisting CSS of RUSA, TEQIP, and National Missionon Education through Information and CommunicationTechnologies. Equally significant are encouragement ofprivate investment in higher education/ globalization;proper utilisation of infrastructure (evening classes, part-time courses, shift system, online admission); andstrengthening accreditation mechanisms and monitoringof quality at private institutions affiliated to Central/Stateuniversities by benchmarking and bringing them underuniversity umbrella.
5.43.4 Some other measures for improving the qualityof higher education include increasing investments inR&D; monitoring research quality by using indicatorssuch as publication in internationally-reputed journals;engaging with industry for curriculum development toimprove employability of graduating students; addressingfaculty deficit in higher education by using teachingassistance from enrolled research degree students andcontractual part-time recruitment of retired faculty;strengthening faculty exchange programmes, andsubstantially expanding number of scholarships/educational loans / financial aid to deserving studentswith help from national and international organisations.
5.44 Women and Child Development
5.44.1 Moving from Policy to Practice: While thereare strong Constitutional, legislative, policy, plan andprogramme commitments addressing multidimensionalconcerns related to Women, Children and Nutrition,effective implementation remains a challenge. Translatingpolicies into effective programmes and positive carepractices at community and family levels is a keyconcern. For this, changing societal norms related tothe intergenerational cycle of gender discrimination andimproving family care behaviours related to maternal,
137HUMAN RESOURCE DEVELOPMENT
infant and young child nutrition is critical. This isdemonstrated by recent initiatives such asBetiBachaoBetiPadhao and Nutrition initiatives such asAtal Baal Mission in Madhya Pradesh.
5.44.2 Convergence at field level: There are severalsectoral programmes of various line ministries,addressing the different direct and indirect determinantsof undernutrition, and intervening at different stages inthe life cycle. These include the Integrated ChildDevelopment Services, SABLA for adolescent girls,Indira Gandhi MatritvaSahyog Yojana, National HealthMission (including RMNCH +A, Janani Suraksha Yojana),Swachh Bharat Mission, the National Rural DrinkingWater Programme, Mid Day Meals Scheme, TargetedPublic Distribution System, National Food SecurityMission, Mahatma Gandhi National Rural EmploymentGuarantee Scheme and the National Rural LivelihoodMission- among others. Despite existing institutionalmechanisms, these remain fragmented. Implementationexperience of successful State Nutrition Missioninitiatives demonstrates that what is needed isgovernance reform, with state leadership and effectiveconvergence at field levels- at village, panchayat, block,district and state levels, linking with national level.Decentralized district specific planning: Beti BachaoBeti Padhao has demonstrated the effectiveness offocusing on districts with critical gender indicators, withdistrict specific plans led by District Collectors,mobilizing multisectoral action and with active ownershipand motivation of panchayats.
5.44.3 Similarly in Nutrition, State and district leadership,district specific planning, use of nutrition data, mappingand making undernutrition visible, field level convergencebetween ICDS and the health system, use of localcommunity resource volunteers / mothers’ supportgroups and community ownership are essentialprerequisites for success as seen in the Madhya PradeshAtal Baal Mission, the Gujarat Baal Sukham, MaharashtraRajmata Jijau Mission and Bihar Mission Manav Vikas.State experiences with approaches such as Keno Parbo
Na in West Bengal and Ami BhiParibu in Odisha, whilenot implemented in mission mode, also demonstrate theimportance of changing care and feeding behaviors,using local community resources and positive role modelmothers to demonstrate good feeding practices andcounsel other mothers of severely undernourishedchildren for sustained improvement.
5.44.4 Creating a protective environment: Initiativesto address violence against children and women arehighlighting the need to prevent and deter such acts andto create a protective environment for children andwomen, along with addressing such violations after theyoccur. The lesson learnt is that a multipronged approachis needed, which includes prevention, protection, qualityresponse, interventions and care, restorative justice,rehabilitation and re integration. This again calls for achange in mind sets and societal norms.
5.44.5 Ownership of Panchayati Raj Institutions:Several examples of women’s empowerment initiativesunder NMEW such as in Rajasthan, Beti Bachao BetiPadhao in Haryana and child related interventions underICDS in Madhya Pradesh reaffirm the criticality of theownership of panchayati raj institutions and ofcommunity based tracking and monitoring of keyindicators related to the Child Sex Ratio and nutritionstatus of young children for achieving results. Ownershipof panchayati raj institutions and urban local bodies iseven more relevant in the context of the recent enhanceddevolution of resources, following the FourteenthFinance Commission recommendations.
5.44.6 Engendering Development and making itmore child centric: Implementation experience ofgender budgeting, now adopted by 57 Ministries andDepartments (as on March, 2016), highlights the needfor gender budgeting and child budgeting to move frommerely monitoring resource allocations by Ministries andDepartments to ensuring and monitoring gender relatedoutcomes, involving sectors, states, districts and localself-governments, in order to be more effective.
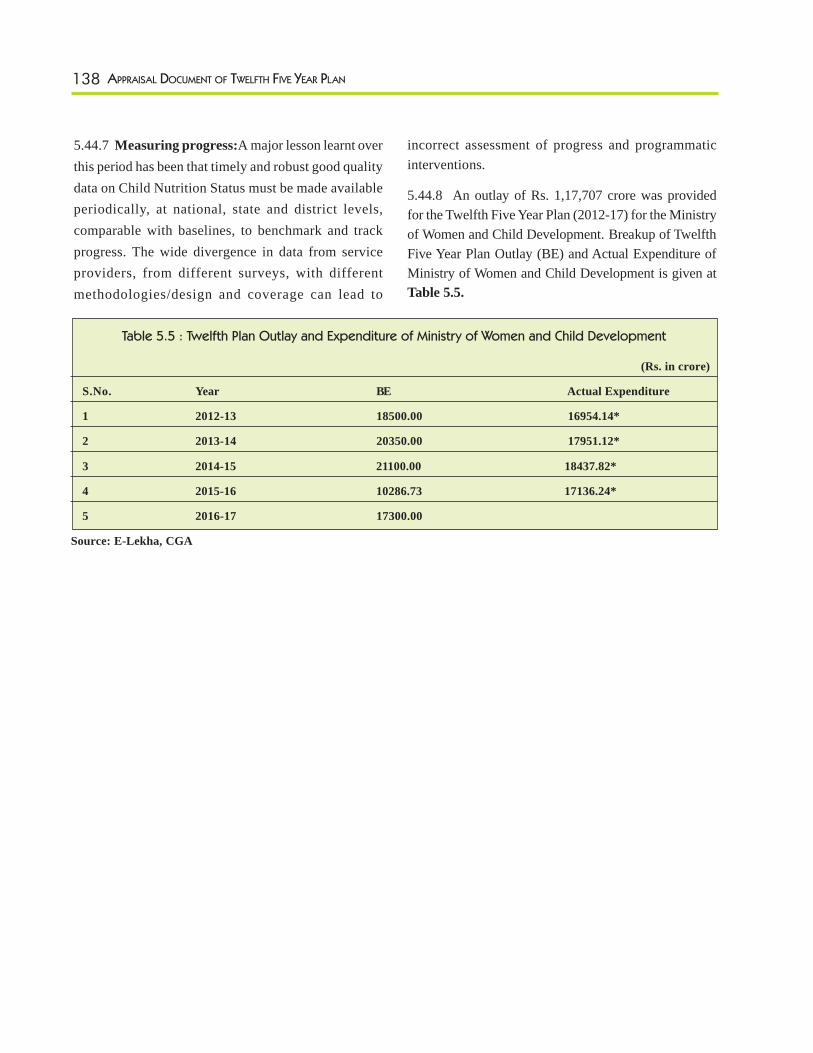
138 APPRAISAL DOCUMENT OF TWELFTH FIVE YEAR PLAN
5.44.7 Measuring progress:A major lesson learnt overthis period has been that timely and robust good qualitydata on Child Nutrition Status must be made availableperiodically, at national, state and district levels,comparable with baselines, to benchmark and trackprogress. The wide divergence in data from serviceproviders, from different surveys, with differentmethodologies/design and coverage can lead to
incorrect assessment of progress and programmaticinterventions.
5.44.8 An outlay of Rs. 1,17,707 crore was providedfor the Twelfth Five Year Plan (2012-17) for the Ministryof Women and Child Development. Breakup of TwelfthFive Year Plan Outlay (BE) and Actual Expenditure ofMinistry of Women and Child Development is given atTable 5.5.
Table 5.5 : Twelfth Plan Outlay and Expenditure of Ministry of Women and Child Development
(Rs. in crore)
S.No. Year BE Actual Expenditure
1 2012-13 18500.00 16954.14*
2 2013-14 20350.00 17951.12*
3 2014-15 21100.00 18437.82*
4 2015-16 10286.73 17136.24*
5 2016-17 17300.00
Source: E-Lekha, CGA
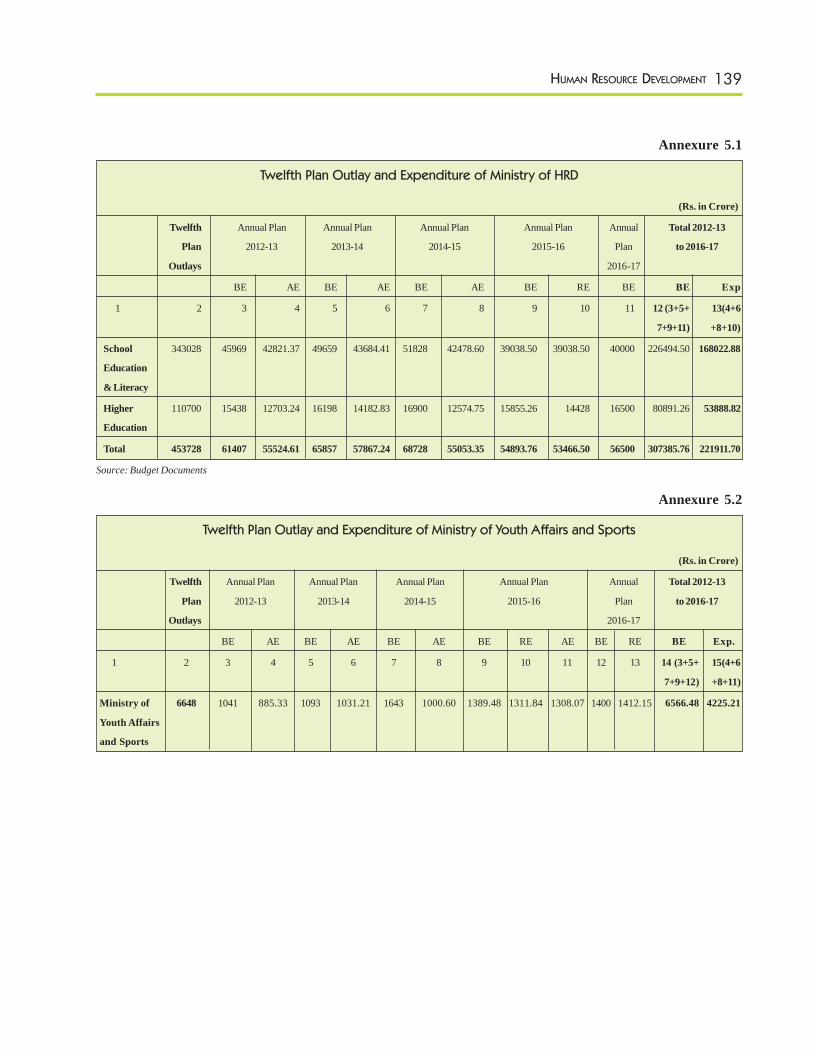
139HUMAN RESOURCE DEVELOPMENT
Annexure 5.1
Twelfth Plan Outlay and Expenditure of Ministry of HRD
(Rs. in Crore)
Twelfth Annual Plan Annual Plan Annual Plan Annual Plan Annual Total 2012-13
Plan 2012-13 2013-14 2014-15 2015-16 Plan to 2016-17
Outlays 2016-17
BE AE BE AE BE AE BE RE BE BE Exp
1 2 3 4 5 6 7 8 9 10 11 12 (3+5+ 13(4+6
7+9+11) +8+10)
School 343028 45969 42821.37 49659 43684.41 51828 42478.60 39038.50 39038.50 40000 226494.50 168022.88
Education
& Literacy
Higher 110700 15438 12703.24 16198 14182.83 16900 12574.75 15855.26 14428 16500 80891.26 53888.82
Education
Total 453728 61407 55524.61 65857 57867.24 68728 55053.35 54893.76 53466.50 56500 307385.76 221911.70
Source: Budget Documents
Annexure 5.2
Twelfth Plan Outlay and Expenditure of Ministry of Youth Affairs and Sports
(Rs. in Crore)
Twelfth Annual Plan Annual Plan Annual Plan Annual Plan Annual Total 2012-13
Plan 2012-13 2013-14 2014-15 2015-16 Plan to 2016-17
Outlays 2016-17
BE AE BE AE BE AE BE RE AE BE RE BE Exp.
1 2 3 4 5 6 7 8 9 10 11 12 13 14 (3+5+ 15(4+6
7+9+12) +8+11)
Ministry of 6648 1041 885.33 1093 1031.21 1643 1000.60 1389.48 1311.84 1308.07 1400 1412.15 6566.48 4225.21
Youth Affairs
and Sports
140 APPRAISAL DOCUMENT OF TWELFTH FIVE YEAR PLAN
6Physical Infrastructure
6.1 Introduction
6.1.1 Infrastructure is pivotal for the growth of India.The Twelfth Plan theme of faster, more inclusive andsustainable growth will be achieved with the help ofadequate infrastructure being made available. During theTwelfth Plan, the emphasis is on completing ongoinginitiatives on a fast-track mode and to further take upmajor projects which would drive the economy.Investments in infrastructure sector have been affectedby various factors including lower GDP growth - withcausality running both ways. The status of investmentand issues in various infrastructure sectors, are given insections 6.2 to 6.20 below. The key issues affectingprivate investment and PPPs across various sectors andway forward are mentioned separately in paragraphs 6.21to 6.25 below.
6.2 Investment in Infrastructure
6.2.1 The Twelfth Plan had projected an investment ofRs. 55,74,663 crore at current prices with a share of 48per cent from the private sector during the Plan period(2012-17). As against the Annual Plan projection of Rs.7,51,012 crore, the actual investment in 2012-13 wasRs. 5,52,431 crore, about 74 per cent. Similarly, againstthe Annual Plan projection of Rs. 8,87,454 crore in 2013-14, the investment was Rs. 6,26,884 crore, implying anachievement of 71 per cent.
6.2.2 The investment anticipated in 2014-15 of Rs.7,13,099 crore is somewhat higher than what wasachieved during 2012-13 and 2013-14. However,investments anticipated in 2015-16 and 2016-17 of
Rs. 8,92,085 crore and Rs. 10,38,324 crore respectivelyare significantly higher due to recent initiatives in manysectors like electricity, roads, railways, ports andtelecommunications which are aimed at creatingadditional capacities and speed up projectimplementation. Further, higher budgetary allocations inthe years 2015-16 and 2016-17 to infrastructure sectorshave the potential to crowd in greater private investment.The total outlay for infrastructure in Budget Estimates2016-17 stands at Rs. 2,21,246 crore.
6.2.3 Based on the lower investment received in thefirst two years of the Plan and the anticipated investmentlevel in remaining three years of the Plan, the TwelfthPlan projections have been revised to Rs. 38,22,822crore which is about 69 per cent of the original Planprojections of Rs. 55,74,663 crore. The revisedprojections of public investment (Centre & States) forthe Twelfth Plan stands at 88 per cent of the target(revised from Rs. 28,90,823 crore to Rs. 25,41,599crore), while the revision in private investment isestimated at 48 per cent of the target (revised fromRs. 26,83,840 crore to Rs. 12,81,223 crore). Thus, theshortfall in realizing the projected private sectorinvestment largely accounts for the downwardprojections of the infrastructure investment in the TwelfthPlan. Sector-wise details for the revised projections forpublic and private investments in various infrastructuresectors are given in Annexure 6.1. One of the principalreasons for shortfall in private investment across sectorsrelates to issues in financing of infrastructure projects.These are discussed in Box 6.5 of this chapter.
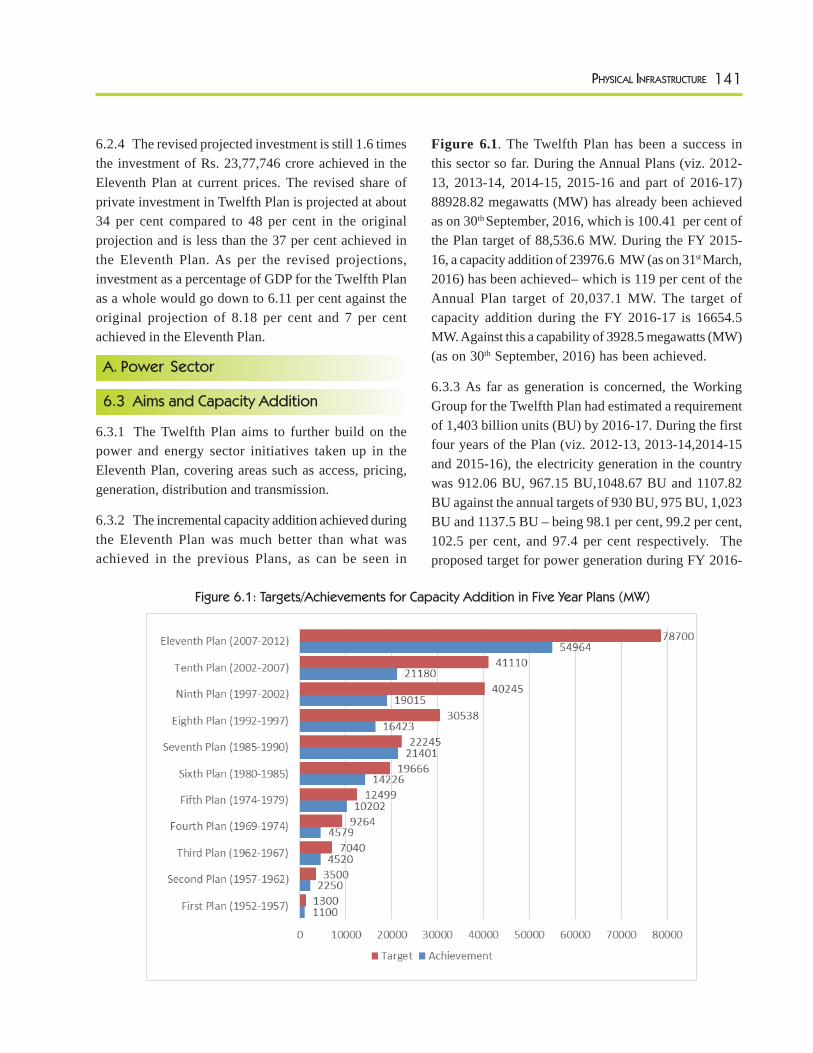
141PHYSICAL INFRASTRUCTURE
6.2.4 The revised projected investment is still 1.6 timesthe investment of Rs. 23,77,746 crore achieved in theEleventh Plan at current prices. The revised share ofprivate investment in Twelfth Plan is projected at about34 per cent compared to 48 per cent in the originalprojection and is less than the 37 per cent achieved inthe Eleventh Plan. As per the revised projections,investment as a percentage of GDP for the Twelfth Planas a whole would go down to 6.11 per cent against theoriginal projection of 8.18 per cent and 7 per centachieved in the Eleventh Plan.
A. Power Sector
6.3 Aims and Capacity Addition
6.3.1 The Twelfth Plan aims to further build on thepower and energy sector initiatives taken up in theEleventh Plan, covering areas such as access, pricing,generation, distribution and transmission.
6.3.2 The incremental capacity addition achieved duringthe Eleventh Plan was much better than what wasachieved in the previous Plans, as can be seen in
Figure 6.1. The Twelfth Plan has been a success inthis sector so far. During the Annual Plans (viz. 2012-13, 2013-14, 2014-15, 2015-16 and part of 2016-17)88928.82 megawatts (MW) has already been achievedas on 30th September, 2016, which is 100.41 per cent ofthe Plan target of 88,536.6 MW. During the FY 2015-16, a capacity addition of 23976.6 MW (as on 31st March,2016) has been achieved– which is 119 per cent of theAnnual Plan target of 20,037.1 MW. The target ofcapacity addition during the FY 2016-17 is 16654.5MW. Against this a capability of 3928.5 megawatts (MW)(as on 30th September, 2016) has been achieved.
6.3.3 As far as generation is concerned, the WorkingGroup for the Twelfth Plan had estimated a requirementof 1,403 billion units (BU) by 2016-17. During the firstfour years of the Plan (viz. 2012-13, 2013-14,2014-15and 2015-16), the electricity generation in the countrywas 912.06 BU, 967.15 BU,1048.67 BU and 1107.82BU against the annual targets of 930 BU, 975 BU, 1,023BU and 1137.5 BU – being 98.1 per cent, 99.2 per cent,102.5 per cent, and 97.4 per cent respectively. Theproposed target for power generation during FY 2016-
Figure 6.1: Targets/Achievements for Capacity Addition in Five Year Plans (MW)
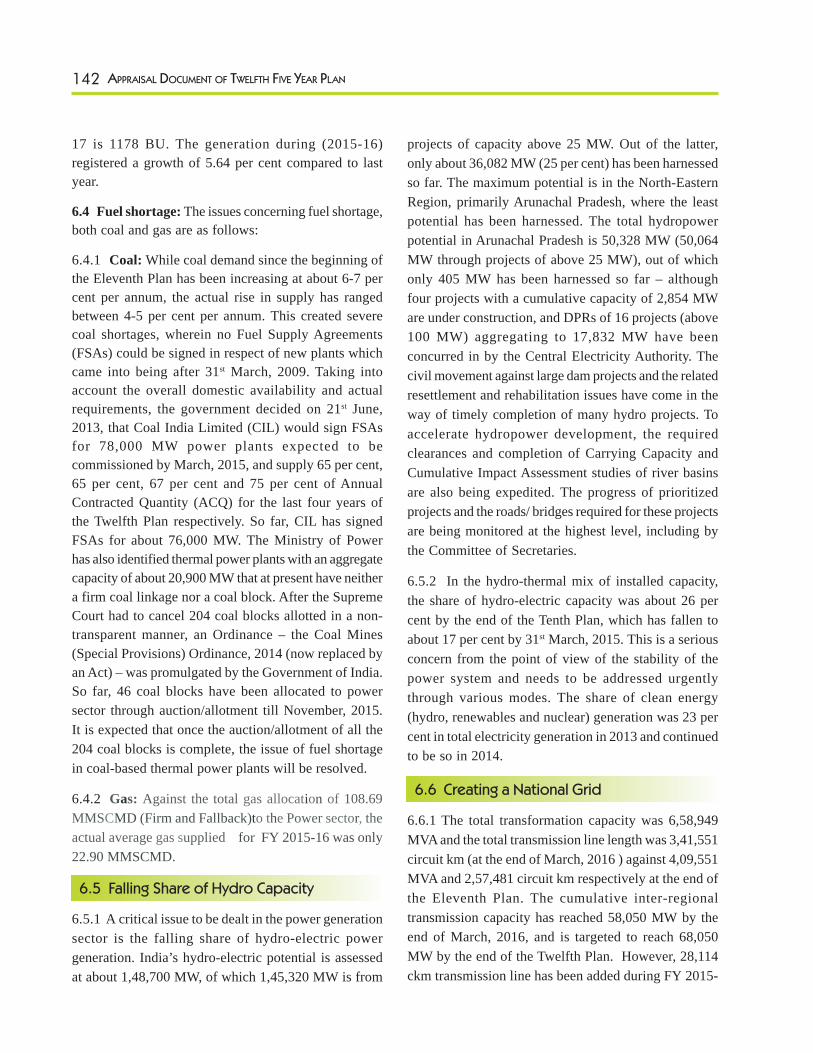
142 APPRAISAL DOCUMENT OF TWELFTH FIVE YEAR PLAN
17 is 1178 BU. The generation during (2015-16)registered a growth of 5.64 per cent compared to lastyear.
6.4 Fuel shortage: The issues concerning fuel shortage,both coal and gas are as follows:
6.4.1 Coal: While coal demand since the beginning ofthe Eleventh Plan has been increasing at about 6-7 percent per annum, the actual rise in supply has rangedbetween 4-5 per cent per annum. This created severecoal shortages, wherein no Fuel Supply Agreements(FSAs) could be signed in respect of new plants whichcame into being after 31st March, 2009. Taking intoaccount the overall domestic availability and actualrequirements, the government decided on 21st June,2013, that Coal India Limited (CIL) would sign FSAsfor 78,000 MW power plants expected to becommissioned by March, 2015, and supply 65 per cent,65 per cent, 67 per cent and 75 per cent of AnnualContracted Quantity (ACQ) for the last four years ofthe Twelfth Plan respectively. So far, CIL has signedFSAs for about 76,000 MW. The Ministry of Powerhas also identified thermal power plants with an aggregatecapacity of about 20,900 MW that at present have neithera firm coal linkage nor a coal block. After the SupremeCourt had to cancel 204 coal blocks allotted in a non-transparent manner, an Ordinance – the Coal Mines(Special Provisions) Ordinance, 2014 (now replaced byan Act) – was promulgated by the Government of India.So far, 46 coal blocks have been allocated to powersector through auction/allotment till November, 2015.It is expected that once the auction/allotment of all the204 coal blocks is complete, the issue of fuel shortagein coal-based thermal power plants will be resolved.
6.4.2 Gas: Against the total gas allocation of 108.69MMSCMD (Firm and Fallback)to the Power sector, theactual average gas supplied for FY 2015-16 was only22.90 MMSCMD.
6.5 Falling Share of Hydro Capacity
6.5.1 A critical issue to be dealt in the power generationsector is the falling share of hydro-electric powergeneration. India’s hydro-electric potential is assessedat about 1,48,700 MW, of which 1,45,320 MW is from
projects of capacity above 25 MW. Out of the latter,only about 36,082 MW (25 per cent) has been harnessedso far. The maximum potential is in the North-EasternRegion, primarily Arunachal Pradesh, where the leastpotential has been harnessed. The total hydropowerpotential in Arunachal Pradesh is 50,328 MW (50,064MW through projects of above 25 MW), out of whichonly 405 MW has been harnessed so far – althoughfour projects with a cumulative capacity of 2,854 MWare under construction, and DPRs of 16 projects (above100 MW) aggregating to 17,832 MW have beenconcurred in by the Central Electricity Authority. Thecivil movement against large dam projects and the relatedresettlement and rehabilitation issues have come in theway of timely completion of many hydro projects. Toaccelerate hydropower development, the requiredclearances and completion of Carrying Capacity andCumulative Impact Assessment studies of river basinsare also being expedited. The progress of prioritizedprojects and the roads/ bridges required for these projectsare being monitored at the highest level, including bythe Committee of Secretaries.
6.5.2 In the hydro-thermal mix of installed capacity,the share of hydro-electric capacity was about 26 percent by the end of the Tenth Plan, which has fallen toabout 17 per cent by 31st March, 2015. This is a seriousconcern from the point of view of the stability of thepower system and needs to be addressed urgentlythrough various modes. The share of clean energy(hydro, renewables and nuclear) generation was 23 percent in total electricity generation in 2013 and continuedto be so in 2014.
6.6 Creating a National Grid
6.6.1 The total transformation capacity was 6,58,949MVA and the total transmission line length was 3,41,551circuit km (at the end of March, 2016 ) against 4,09,551MVA and 2,57,481 circuit km respectively at the end ofthe Eleventh Plan. The cumulative inter-regionaltransmission capacity has reached 58,050 MW by theend of March, 2016, and is targeted to reach 68,050MW by the end of the Twelfth Plan. However, 28,114ckm transmission line has been added during FY 2015-
143PHYSICAL INFRASTRUCTURE
16 against the target of 23,712 ckm, which is 118 percent. The proposed target for transmission line capacityaddition for FY 2016-17 is 23,384 ckm.
6.6.2 Short-term open access at inter-state level isallowed, in order to utilize the spare transmission capacitythat becomes available on account of margins due toinherent design variations in power flow, as well as theinbuilt spare transmission capacity created to cater tofuture load growth or generation addition. As short-termtrades are allowed only on any incidental margins availablein the transmission system, congestion is observed insome transmission corridors, especially in the import ofpower to the Southern Region from the Eastern andWestern Regions. It is also pertinent to mention thatcongestion does not necessarily mean that generation isnot getting dispatched or load is not being met, becausesometimes utilities want to access the cheapest sourcesof power to meet their requirements and this in turnleads to congestion, which is thus more economic innature. During 2014-15 (up to February, 2015), about10 per cent (3.1 BU) of the unconstrained volume tradedthrough Power Exchanges could not be scheduled onaccount of transmission congestion. However, with theaugmentation of the transmission network undertaken,and addition of more transmission lines, there has beensome reduction in congestion.
6.6.3 Distribution: Distribution is the critical link inthe entire power sector value chain, as it is the interfacebetween utilities and consumers. Under the IndianConstitution, power is a concurrent subject, and theresponsibility for distribution and supply of power torural and urban consumers rests with the States. GoIprovides assistance to States through various CentralSector Schemes for improving the distribution sector,mainly through Integrated Power Development Scheme(for urban areas) and the Deendayal Upadhyaya GramJyoti Yojana (for rural areas). These are covered byAnnexure 6.2 and Annexure 6.3, respectively. Undernew initiative of Ministry of Power 24x7 ‘Power forAll’ scheme has been lunched to provide 24x7 reliable& quality power supply. 21 States have signed the Powerof All document. Remaining States will be completed byJune, 2016.
6.7 Financial restructuring of distributioncompanies
6.7.1 The main issue affecting the power sector is thefinancial viability of the distribution companies, ordiscoms. The tariffs awarded by electricity regulatorycommissions have not been sufficient to recover eventhe cost of supply. In fact, the gap between averagerevenue and average cost is widening over time. Thiscan be seen in Figure 6.2.
6.7.2 This has led to a situation where the total annualcommercial losses of the discoms (without subsidy)increased to about Rs. 1,05,000 crore during 2012-13.Section 65 of the Electricity Act, 2003, stipulates thatState Governments may provide subsidy in consumertariffs, as determined by the regulatory commission, butwould need to pay the amount of subsidy in advance tothe concerned power distribution utilities.
6.7.3 GoI has introduced the Ujwal DISCOM AssuranceYojana (UDAY), wherein inter-alia 75 per cent ofDISCOM debt as on 30th September, 2015, were to betaken over by the concerned State Government overtwo years and converted into bonds to be issued by thediscoms to participating lenders duly backed by the StateGovernment guarantee. DISCOM debt not taken overby the states shall be covered by the Banks/Fls into loansas bonds. MOU has been signed by Twenty five (25)States and One (01) UT in all viz. Andhra Pradesh,Arunachal Pradesh, Assam, Bihar, Chhattisgarh, Goa,Gujarat, Haryana, Himachal Pradesh, Jammu & Kashmir,Jharkhnad, Karnataka, Kerala, Manipur, Madhya Pradesh,Maharashtra, Meghalaya, Punjab, Rajasthan, Sikkim,Tamil Nadu, Telangana, Tripura, Uttarakhand, UttarPradesh and Punducherry.
6.7.4 Some improvements in reduction in gaps betweenAverage cost of service (ACS) and Average revenuerealized (ARR) has been in respect of few states due toreduction in invefficiencies, reduction interest cost andcost reflective tariffs. Discoms’ poor financial situationhas led to lower scheduling of power by them. Sincethey are not in a position to pay for power purchase.Consequently, the peak energy deficit came down from9 per cent (in 2012-13) to 4.7 per cent (in 2014-15) andenergy shortage from 8.7 per cent (in 2012-13) to 3.6per cent (in 2014-15).
144 APPRAISAL DOCUMENT OF TWELFTH FIVE YEAR PLAN
6.7.5 Recommendations of the Fourteenth FinanceCommission (FFC): The FFC has made the followingrecommendations for the power sector:
i. 100 per cent metering to be achieved in atime-bound manner for all electricityconsumers.
ii. The Electricity Act, 2003, currently does nothave any provision of penalties for delays inthe payment of subsidy by a StateGovernment. Therefore, the Act may besuitably amended to facilitate levy of suchpenalties. However, the Ministry of Power isof the view that there is no such proposal forimposing any penalty on a State Government.There is provision in Section 65 itself thatthe state Commission may, in advance,compensate persons affected by the grant ofsubsidy in the manner that Commission maydirect as a condition for license, or any otherperson concerned to implement the subsidyprovided for by the State Government.Besides, the spirit of the Act is that the StateGovernment should be distant from theregulators. In the federal structure, the grantof subsidy is a prerogative of the StateGovernment, and the Government of Indiamay not have any role in imposing penaltyon any State authorities.
iii. In order to provide financial autonomy tothe SERCs, Section 103 of the ElectricityAct, 2003, provides for the establishmentof a State Electricity Regulatory CommissionFund by each State Government, to enablethe SERCs to perform their responsibilitiesas envisaged under the Act.
6.7.6 Regarding 100 per cent metering, while 92.4 percent of 11 KV feeders in the country are metered,consumer metering is not complete in many States –for example, in J&K, Bihar, Jharkhand and most of thenorth-eastern States. Further, metering of agriculturalconsumers is also incomplete in most States, whootherwise have been able to meter their non-agriculturalconsumers. Tariffs for the agricultural sector wheremetering is not available, is based on normative criteria.In addition to meters not being installed, there is theproblem of faulty meters, which are not replaced atregular intervals by the distribution companies. Completemetering of all consumers will not only help in raisingrevenues of the discoms but also make a correctassessment of the losses for each category ofconsumers.
6.7.7 Regarding payment of subsidies, it has beenobserved that, against the announced subsidy of Rs.89,678 crore for the years 2010-11 to 2012-13 by thestate governments, the actual subsidy released was Rs.82,205 crore – leaving a significant gap. The State
Figure 6.2: Gap between Average Cost of Supply (ACS) and Average Tariff, 2007-08 to 2012-13
(In paisa/unit)
145PHYSICAL INFRASTRUCTURE
Governments are not paying subsidy upfront despite theclear provisions of Section 65 of the Electricity Act,2003.
6.7.8 Regarding autonomy to the SERCs, it is pertinentto mention that while creation of the State ElectricityRegulatory Commission Fund may give some kind ofautonomy to the State Electricity RegulatoryCommissions, its non-existence has never actuallyimpaired the working of the SERCs. It has been notedin the past that in some States, the Comptroller andAuditor General had argued against creation of the StateElectricity Regulatory Commission Fund.
6.8 Power Sector in the North EasternRegion (NER)
6.8.1 Current status: The North-Eastern States have3,364.11 MW installed capacity, comprising of 1,287.08MW in the State sector, 2,052.50 MW in the Central sectorand 24.53 MW in the private sector. Category-wise, it is1,242 MW in the hydro sector, 1,865.44 MW in the thermalsector and 256.67 MW in the renewable sector. The peakdemand of the region was 2,528 MW, and energyrequirement 14,225 MU during 2014-15. However, NERhad 12.9 per cent peak deficit and 8.7 per cent energydeficit during this period, which is higher than the nationalaverage. The NER States have high T&D losses, whichvary from 24 per cent (in Meghalaya) to 46 per cent (inArunachal Pradesh), as compared to all-India averageT&D losses of 23 per cent.
6.8.2 Development of Hydro-Electric Potential:According to CEA, the identified hydro potential in NERis 63,257 MW. Out of it, merely 1,911 MW (3 per cent)has been developed and 4,280 MW (9 per cent) is underdevelopment. The balance is yet to be harnessed. It maybe noted that, in India, three rivers – namely the Siang,the Subansiri and the Lohit – feed the Brahmaputra. Apartfrom these, three other rivers originating within Indiafeed the Brahmaputra: the Tawang, the Dibang and theKameng. As regards the hydro potential of theBrahmaputra River in India, the majority of it is inArunachal Pradesh. The total hydropower potential inArunachal Pradesh is 50,328 MW, out of which merely405 MW has been harnessed so far.
6.8.3 Presently in NER four Central sector projects(2,770 MW), one State sector project (40 MW) andnine private sector projects (1,470 MW) are underimplementation. NER is endowed with a large hydropotential. After meeting the expected power demand ofNER, surplus power needs to be transmitted to the loadcenters of Northern, Western and Southern Regions overlong distances. The power transfer has also to be carriedout through the narrow “Chicken Neck” corridor about18 km long and 22 km wide, in the north of West Bengalbetween the international borders of Bangladesh andNepal. In this regard, a +800kV, 6,000 MW bi-pole linefrom Bishwanath Chariali in Assam to Agra in UP, isunder construction by POWERGRID for evacuation ofpower from up-coming hydro projects in NER and alsofrom Bhutan. In order to address the issue ofimplementation of intra-state transmission, sub-transmission and distribution system in NER, the Cabinetapproved the Comprehensive Scheme for Strengtheningof Transmission & Distribution Systems in ArunachalPradesh and Sikkim on 15th September, 2014. TheCabinet Committee on Economic Affairs (CCEA) alsoapproved the North Eastern Region Power SystemImprovement scheme for six other North-Eastern States(Assam, Manipur, Meghalaya, Mizoram, Tripura andNagaland) for strengthening of the intra-statetransmission and distribution system. This scheme is tobe funded on 50:50 sharing basis by the Government ofIndia and the World Bank.
6.9 Impact of Budget on the Power Sector
6.9.1 In the Union Budget for 2015-16, it was proposedto set up five Ultra Mega Power Projects (UMPPs) of4,000 MW each in the plug-and play-mode – in otherwords, with all the clearances and linkages in place beforethe projects are awarded. Minister of Power hasidentified two UMPPs to be bid out. These are: BedabahalUMMP (Odisha) and Cheyyur UMPP (Tamil Nadu). Thebid process for Bedabahal UMPP and Cheyyur UMPPwill be initiated after revision of Standard Biddingdocuments and allocation of coal to Infra SPV fordomestic coal based projects. This will unlock investmentof about Rs. 60,000 crore.
146 APPRAISAL DOCUMENT OF TWELFTH FIVE YEAR PLAN
6.9.2 In the Budget of 2016-17, 100 per cent villageelectrification target has been set by 1st May, 2018. Thebudgetary funds for 2016-17 under the villageelectrification programme entitled Deendayal UpadhyayaGram Jyoti Yojana (DDUGJY) have been reduced toRs. 3,000 crore compared to Rs. 4,500 crore in 2015-16, while feeder separation has been included in thescheme, as there are no population norms relatedrestrictions. The quantum of subsidy under newDDUGJY is reduced from 90 per cent to 60 per cent, inthe light of higher FFC allocations to states. The budgetestimate for power sector during 2016-17 is Rs.79,883.57 crore (GBS: Rs 12,200 crore and IEBR: Rs.67,683.57 crore).
6.10 The Coal Sector
6.10.1 Coal contributes over 57 per cent of India’sprimary commercial energy supply and is, therefore,the mainstay of India’s energy sector. Around 78 percent of coal produced in India is consumed for powergeneration (utility and non-utility). Although the shareof renewable energy in India’s total energy mix isexpected to increase sharply in the coming years, thedominance of coal in the mix is not likely to change till2031-32, given the lower-than-expected gas productionfrom existing fields and no new major gas discoveries.India ranks third amongst the coal producing countriesin the world after China and the USA and has sizeablecoal reserves, which are expected to last for over 50years considering the current level of production. Thegrowing demand for coal has made it imperative toaugment domestic production from the public as wellprivate sector and to expedite the reforms process forrealizing efficiency gains through increased competitionin coal sector.
6.10.2 Production: Though domestic coal productionhas increased significantly in the last decade, coaldemand continues to outstrip domestic supply, mainlybecause of a spurt in demand from the power sector.Against a compound annual growth rate of 4.6 per centin coal production during the Eleventh Plan period, thecoal demand/offtake grew at 6.6 per cent. The TwelfthPlan envisages a compound annual growth rate of 8.0
per cent in coal production but the demand/offtake isexpected to grow even higher at around 8.9 per cent.During the first four years of Twelfth Plan, thecompound annual growth in coal production has beenrecorded at 4.27 per cent as against the envisaged targetof 8.0 per cent. This is in spite of the fact that there wasan impressive growth of around 8.5 per cent in coalproduction from CIL during 2015-16 (536.50 MT). Asfar as offtake is concerned, the compound annual growthrate in the first four years of the Plan period has beenalmost recorded at 6.53 per cent (provisional) againstoriginally envisaged target of 8.9 per cent for the Planperiod. The coal production target at the terminal yearof Twelfth Plan is set at 724.7 MTs against 795 MTs setat the time of formulation of Twelfth Five Year Plan
6.10.3 The coal demand/offtake is mainly driven bycoal based thermal power generation. The coal basedgeneration recorded the ever highest growth rate of 12.1per cent during 2014-15 but the same has come downto 7.7 percent during the year 2015-16, mainly onaccount of lower system demand for power. Though,the domestic coal supply from the CIL and SCCL hasimproved considerably in the last two years, coalproduction from captive mines is lagging much behindthe envisaged level of production. This has resulted inhigh coal import to the level of 199.88 MT in theyear 2015-16 against 217.78 Million Tonnes (MTs)during 2014-15. The higher coal imports calls forsustained efforts to raise domestic production
6.10.4 In order to address the coal demand-supply gap,which is mainly met through imports, it has been decidedto quickly enhance the production from Coal IndiaLimited from the current level of 536.5 MTs in 2015-16to 1 billion Tonnes by 2019-20. Similarly, the currentannual production level of SCCL is envisaged to increasefrom 60.38 MTs to 65 MTs by 2019-20. The currentlevel of production from captive blocks is 31.10 MTs,even lower than previous year, and this is envisaged toreach about 300 to 400 MTs. However, details of captiveblock production can be ascertained only on completionof the on-going auction process and transfer of mininglease and other related activities to the new successful
147PHYSICAL INFRASTRUCTURE
bidder. The envisaged enhancement in production issubject to completion of the critical evacuation rail linesand facilitation of land acquisition and related R&R issues.
6.10.5 Demand and Supply: The demand for coal inthe terminal year of the Twelfth Plan (2016-17) wasassessed at 980.5 MTs (both coking and non-coking),out of which the share of the power sector was expectedto be about 738.4 MTs (captive plus non-captive). Atthe same time, coal production was anticipated to be795 MTs, leaving a gap of 185 MTs to be imported.However, both demand and production are registeringlower levels. It is expected that at present trend ofgrowth, import of coal may be nearly same asenvisaged. The above facts indicate that both demandand production have not grown at anticipated rates..
6.10.6 Though the trend in coal production of CIL inthe first two years of the Plan period has beendisappointing, it has shown an impressive growth(CAGR) of around 7.7 per cent during the next twoyears i.e. 2014-15 and 2015-16. For the terminal yearof the Twelfth Plan, CIL has set a coal productiontarget of 598.6 MTs against the coal production targetof 615 MTs set at the time of the formulation of theTwelfth Plan. Coal production from CIL and overall vis-à-vis targets in the last few years is shown in Figure6.3(a) and 6.3(b).
6.10.7 Augmentation of Coal TransportationInfrastructure: As already mentioned in the chapterearlier, coal production has failed to keep pace with thegrowing demand. This is reflected in the rise in importsover 2012-13 (the first year of the Plan). The reasonsfor this are: cancellation of captive mines, delays inenvironmental clearances; land acquisition; R&R issues;and inadequate infrastructure. As far as infrastructureis concerned, one of the main impediments is the delayin construction of three railway lines: the Tori-Shivpur-Katotia line in North Karanpura, Jharkhand; theJharsuguda-Barpalli-Sardega line in Ib valley, Odisha;and the Bhupdeopur-Korichapar-Dharamjaigarh line inChhattisgarh. All the three lines are now expected to becompleted in phases by the year 2018. The Ministry ofCoal has signed two separate MOUs with the Ministry
of Railways and the State Governments of Odisha andJharkhand for taking up these railway projects in therespective states. In addition, there are inadequacies inport capacity and handling as well.
6.10.8 Washeries: To comply with the directives ofMoE&F&CC to supply coal of not more than 34 percent ash to the power plants situated beyond 500 kmsfrom pitheads (w.e.f. 5th June, 2016), Coal India Ltd.has initiated action to set up 15 new washeries including6 coking coal washeries with a capacity of 18.6 MTPAand 9 non-coking coal washeries with a capacity of 94(75.5 initially) Mty are scheduled to be installed insubsidiaries of CIL. All the washeries are envisaged tobe commissioned by 2020.
For 100 per cent compliance of the directives of MoFEand CC for supply of less than 34 per cent ash coal tothe power plants located 500 kms away from the coalsources, located at road centers or at critically pollutedareas, it has been proposed that washeries will be set upeither by CIL on their own, or by consumers on theirown or by a third party on behalf of the consumers.Where ever possible, CIL would facilitate consumers toset up washeries at pitheads by providing raw coal, land,water, power, railways siding facilities , etc, for coalevacuation/handling.
6.10.9 Coal Mines (Special Provisions) Ordinance,2014 and (Special provisions) Act, 2015: To ensurethe uninterrupted supply of coal to end-use plants basedon captive coal, the Government promulgated the CoalMines (Special Provisions) Ordinance, 2014 to facilitateauctioning or allotment of 204 coal blocks following theSupreme Court judgment. It provides for public auctionof the mines by way of competitive bidding, therebyeliminating discretion. The ordinance provides that allthe firms that had their coal blocks cancelled by theSupreme Court, barring those convicted for offencesrelated to the allotment of mines, can bid in the e-auctionafter paying an additional levy. Firms running specifiedend-use plants like steel, cement and power, includingthe ones having coal linkages also qualify for the e–
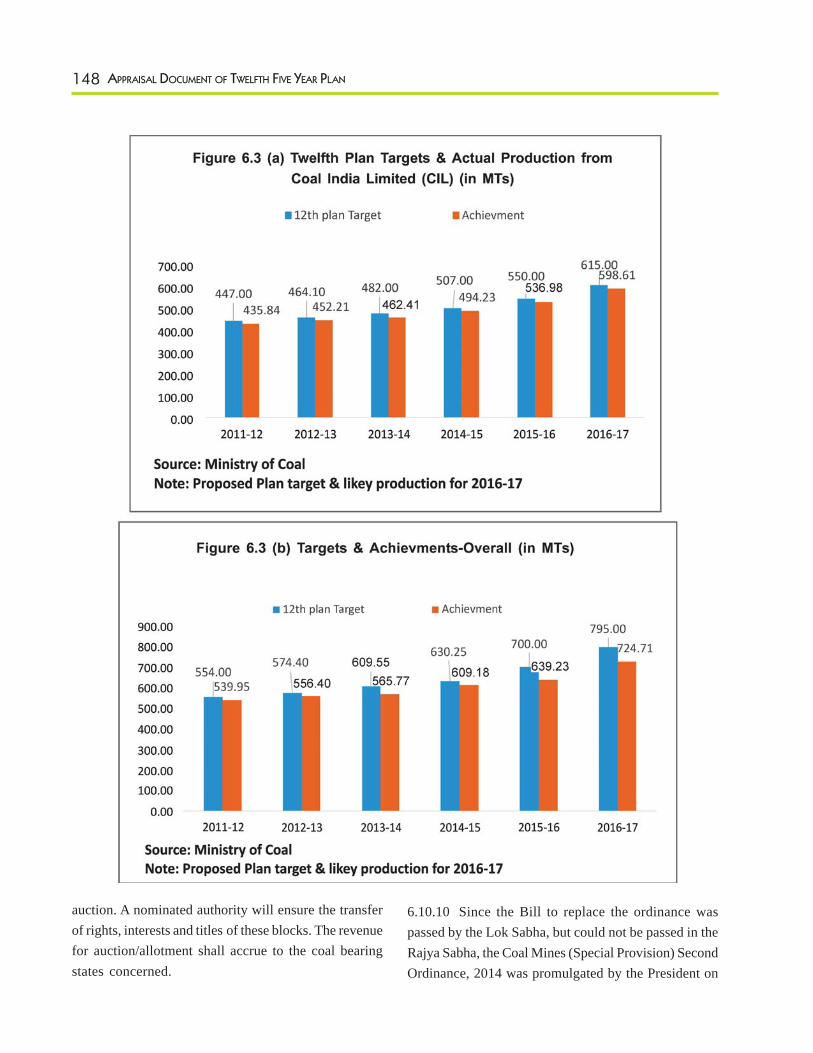
148 APPRAISAL DOCUMENT OF TWELFTH FIVE YEAR PLAN
auction. A nominated authority will ensure the transferof rights, interests and titles of these blocks. The revenuefor auction/allotment shall accrue to the coal bearingstates concerned.
6.10.10 Since the Bill to replace the ordinance waspassed by the Lok Sabha, but could not be passed in theRajya Sabha, the Coal Mines (Special Provision) SecondOrdinance, 2014 was promulgated by the President on
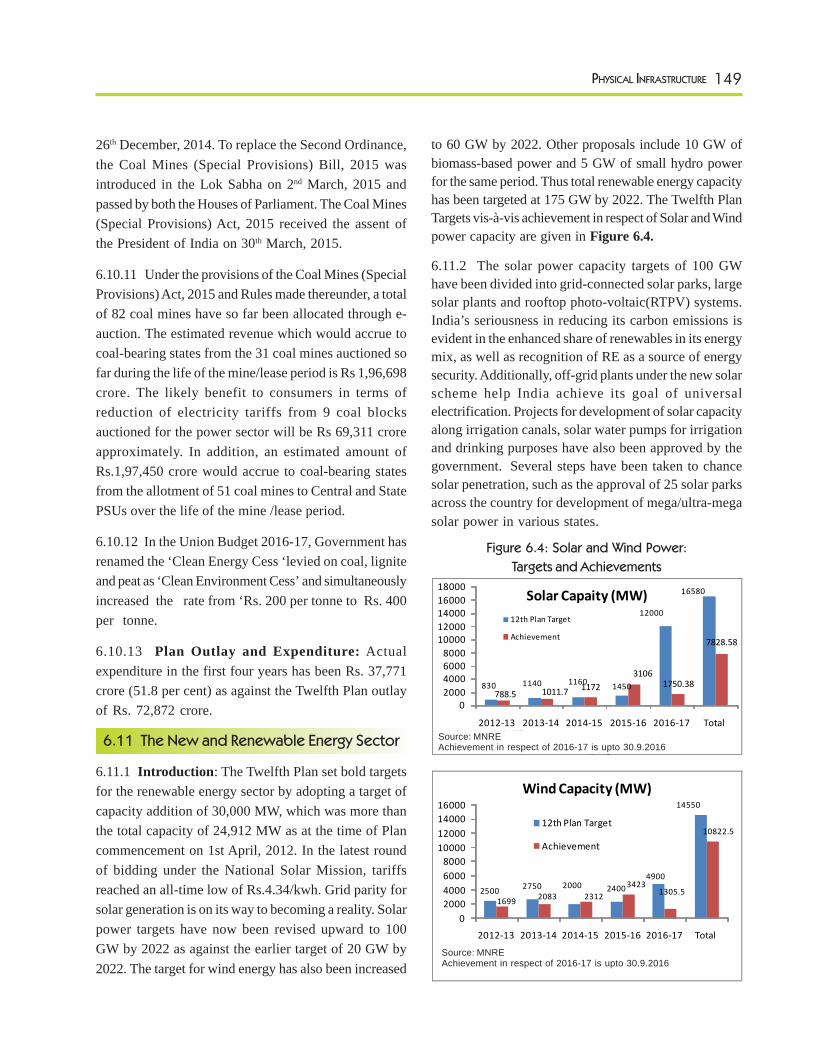
149PHYSICAL INFRASTRUCTURE
26th December, 2014. To replace the Second Ordinance,the Coal Mines (Special Provisions) Bill, 2015 wasintroduced in the Lok Sabha on 2nd March, 2015 andpassed by both the Houses of Parliament. The Coal Mines(Special Provisions) Act, 2015 received the assent ofthe President of India on 30th March, 2015.
6.10.11 Under the provisions of the Coal Mines (SpecialProvisions) Act, 2015 and Rules made thereunder, a totalof 82 coal mines have so far been allocated through e-auction. The estimated revenue which would accrue tocoal-bearing states from the 31 coal mines auctioned sofar during the life of the mine/lease period is Rs 1,96,698crore. The likely benefit to consumers in terms ofreduction of electricity tariffs from 9 coal blocksauctioned for the power sector will be Rs 69,311 croreapproximately. In addition, an estimated amount ofRs.1,97,450 crore would accrue to coal-bearing statesfrom the allotment of 51 coal mines to Central and StatePSUs over the life of the mine /lease period.
6.10.12 In the Union Budget 2016-17, Government hasrenamed the ‘Clean Energy Cess ‘levied on coal, ligniteand peat as ‘Clean Environment Cess’ and simultaneouslyincreased the rate from ‘Rs. 200 per tonne to Rs. 400per tonne.
6.10.13 Plan Outlay and Expenditure: Actualexpenditure in the first four years has been Rs. 37,771crore (51.8 per cent) as against the Twelfth Plan outlayof Rs. 72,872 crore.
6.11 The New and Renewable Energy Sector
6.11.1 Introduction: The Twelfth Plan set bold targetsfor the renewable energy sector by adopting a target ofcapacity addition of 30,000 MW, which was more thanthe total capacity of 24,912 MW as at the time of Plancommencement on 1st April, 2012. In the latest roundof bidding under the National Solar Mission, tariffsreached an all-time low of Rs.4.34/kwh. Grid parity forsolar generation is on its way to becoming a reality. Solarpower targets have now been revised upward to 100GW by 2022 as against the earlier target of 20 GW by2022. The target for wind energy has also been increased
to 60 GW by 2022. Other proposals include 10 GW ofbiomass-based power and 5 GW of small hydro powerfor the same period. Thus total renewable energy capacityhas been targeted at 175 GW by 2022. The Twelfth PlanTargets vis-à-vis achievement in respect of Solar and Windpower capacity are given in Figure 6.4.
6.11.2 The solar power capacity targets of 100 GWhave been divided into grid-connected solar parks, largesolar plants and rooftop photo-voltaic(RTPV) systems.India’s seriousness in reducing its carbon emissions isevident in the enhanced share of renewables in its energymix, as well as recognition of RE as a source of energysecurity. Additionally, off-grid plants under the new solarscheme help India achieve its goal of universalelectrification. Projects for development of solar capacityalong irrigation canals, solar water pumps for irrigationand drinking purposes have also been approved by thegovernment. Several steps have been taken to chancesolar penetration, such as the approval of 25 solar parksacross the country for development of mega/ultra-megasolar power in various states.
Figure 6.4: Solar and Wind Power:
Targets and Achievements
830 1140 1160 1450
12000
16580
788.5 1011.7 11723106
1750.38
7828.58
02000400060008000
1000012000140001600018000
2012‐13 2013‐14 2014‐15 2015‐16 2016‐17 Total
Solar Capaity (MW)12th Plan Target
Achievement
Source: MNRENote: 2016‐17 numbers are projected
2500 2750 2000 24004900
14550
1699 2083 23123423
1305.5
10822.5
02000400060008000
10000120001400016000
2012‐13 2013‐14 2014‐15 2015‐16 2016‐17 Total
Wind Capacity (MW)
12th Plan Target
Achievement
Source: MNRENote: Number for 2016-17 are projected
Source: MNREAchievement in respect of 2016-17 is upto 30.9.2016
Source: MNREAchievement in respect of 2016-17 is upto 30.9.2016
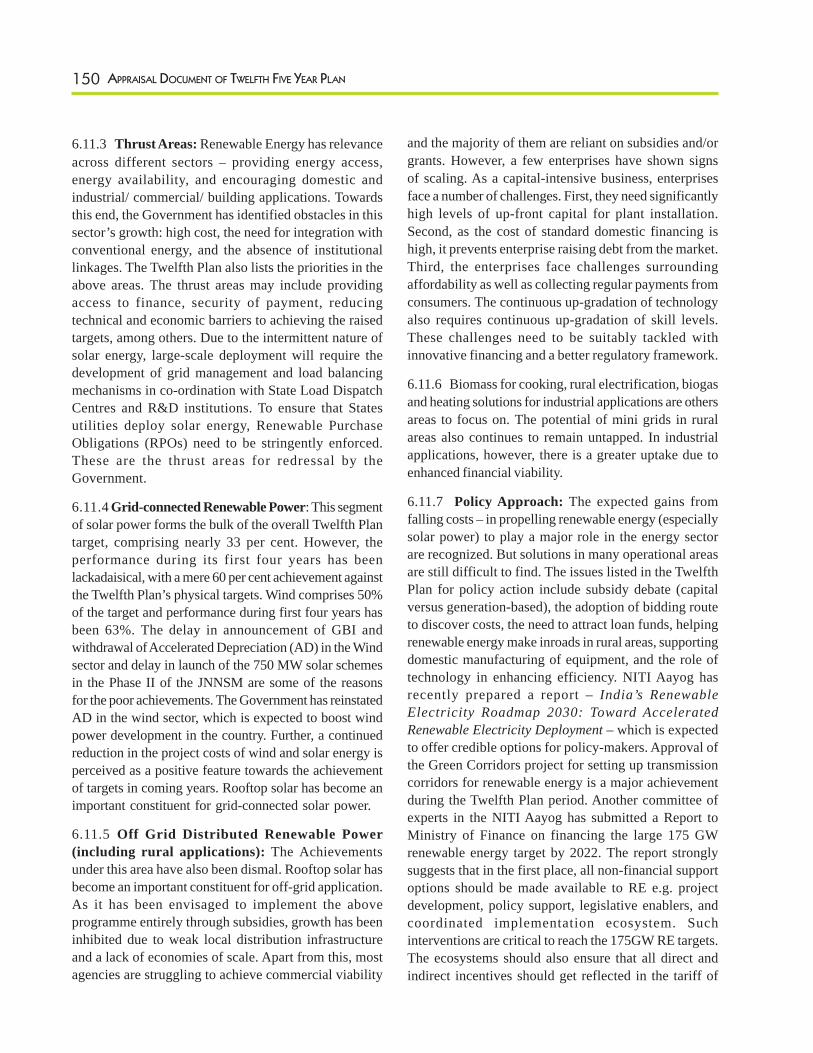
150 APPRAISAL DOCUMENT OF TWELFTH FIVE YEAR PLAN
6.11.3 Thrust Areas: Renewable Energy has relevanceacross different sectors – providing energy access,energy availability, and encouraging domestic andindustrial/ commercial/ building applications. Towardsthis end, the Government has identified obstacles in thissector’s growth: high cost, the need for integration withconventional energy, and the absence of institutionallinkages. The Twelfth Plan also lists the priorities in theabove areas. The thrust areas may include providingaccess to finance, security of payment, reducingtechnical and economic barriers to achieving the raisedtargets, among others. Due to the intermittent nature ofsolar energy, large-scale deployment will require thedevelopment of grid management and load balancingmechanisms in co-ordination with State Load DispatchCentres and R&D institutions. To ensure that Statesutilities deploy solar energy, Renewable PurchaseObligations (RPOs) need to be stringently enforced.These are the thrust areas for redressal by theGovernment.
6.11.4 Grid-connected Renewable Power: This segmentof solar power forms the bulk of the overall Twelfth Plantarget, comprising nearly 33 per cent. However, theperformance during its first four years has beenlackadaisical, with a mere 60 per cent achievement againstthe Twelfth Plan’s physical targets. Wind comprises 50%of the target and performance during first four years hasbeen 63%. The delay in announcement of GBI andwithdrawal of Accelerated Depreciation (AD) in the Windsector and delay in launch of the 750 MW solar schemesin the Phase II of the JNNSM are some of the reasonsfor the poor achievements. The Government has reinstatedAD in the wind sector, which is expected to boost windpower development in the country. Further, a continuedreduction in the project costs of wind and solar energy isperceived as a positive feature towards the achievementof targets in coming years. Rooftop solar has become animportant constituent for grid-connected solar power.
6.11.5 Off Grid Distributed Renewable Power(including rural applications): The Achievementsunder this area have also been dismal. Rooftop solar hasbecome an important constituent for off-grid application.As it has been envisaged to implement the aboveprogramme entirely through subsidies, growth has beeninhibited due to weak local distribution infrastructureand a lack of economies of scale. Apart from this, mostagencies are struggling to achieve commercial viability
and the majority of them are reliant on subsidies and/orgrants. However, a few enterprises have shown signsof scaling. As a capital-intensive business, enterprisesface a number of challenges. First, they need significantlyhigh levels of up-front capital for plant installation.Second, as the cost of standard domestic financing ishigh, it prevents enterprise raising debt from the market.Third, the enterprises face challenges surroundingaffordability as well as collecting regular payments fromconsumers. The continuous up-gradation of technologyalso requires continuous up-gradation of skill levels.These challenges need to be suitably tackled withinnovative financing and a better regulatory framework.
6.11.6 Biomass for cooking, rural electrification, biogasand heating solutions for industrial applications are othersareas to focus on. The potential of mini grids in ruralareas also continues to remain untapped. In industrialapplications, however, there is a greater uptake due toenhanced financial viability.
6.11.7 Policy Approach: The expected gains fromfalling costs – in propelling renewable energy (especiallysolar power) to play a major role in the energy sectorare recognized. But solutions in many operational areasare still difficult to find. The issues listed in the TwelfthPlan for policy action include subsidy debate (capitalversus generation-based), the adoption of bidding routeto discover costs, the need to attract loan funds, helpingrenewable energy make inroads in rural areas, supportingdomestic manufacturing of equipment, and the role oftechnology in enhancing efficiency. NITI Aayog hasrecently prepared a report – India’s RenewableElectricity Roadmap 2030: Toward AcceleratedRenewable Electricity Deployment – which is expectedto offer credible options for policy-makers. Approval ofthe Green Corridors project for setting up transmissioncorridors for renewable energy is a major achievementduring the Twelfth Plan period. Another committee ofexperts in the NITI Aayog has submitted a Report toMinistry of Finance on financing the large 175 GWrenewable energy target by 2022. The report stronglysuggests that in the first place, all non-financial supportoptions should be made available to RE e.g. projectdevelopment, policy support, legislative enablers, andcoordinated implementation ecosystem. Suchinterventions are critical to reach the 175GW RE targets.The ecosystems should also ensure that all direct andindirect incentives should get reflected in the tariff of
151PHYSICAL INFRASTRUCTURE
RE at the procurement end. Further the incentive designand procurement mechanism should be specific to thecharacteristics of resource and technology underconsideration.
6.11.8 The revised Tariff Policy notified in January,2016, inter-alia states that “Long term growth trajectoryof Renewable Purchase Obligations(RPOs) will beprescribed by the Ministry of Power in consultation withMNRE, and with the percentage so made applicable tostart with, the SERCs shall also reserve a minimumpercentage for purchase of solar energy from the dateof notification of this policy, which shall be made suchthat it reaches 8 per cent of total consumption of energy,excluding Hydro Power, by March, 2022 or as notifiedGovernment from time to time.
6.11.9 The Government has set the momentum to reachthe targeted capacity addition of 175 GW by 2022. ARE-INVEST was organised in February, 2015 (Box 6.1).
6.11.10 Solar Initiatives:
i. The setting up of 25 solar parks, each withthe capacity of 500 MW and above, whichwill be able to accommodate over 20,000MW of solar power projects in state. Sofar, 34 solar parks of aggregate capacity ofabout 20,000 MW in 21 states have beenapproved.
ii. The setting up of over 300 MW of Grid-Connected Solar PV Power Projects bydefence establishments and paramilitaryforces, with Viability Gap Funding (VGF)from NCEF.
iii. The setting up of 1,000 MW of Grid-Connected Solar PV Power Projects withViability Gap Fund (VGF) support by CentralPSUs under various Central/state schemes,in three years during 2015-16 to 2017-18.
iv. Pilot-cum-demonstration projects for thedevelopment of Grid-Connected Solar PVPower Plants on canal banks and canal tops:Solar PV Power Projects totaling the fulltarget capacity of 100 MW (50 MW canal-top and 50 MW canal-banks) have beenapproved in 8 states.
v. The setting up of 15,000 MW of Grid-Connected Solar PV Power projects underNational Solar Mission through NTPC/NVVN in three tranches. NTPC is alsoundertaking solar energy projectsaggregating capacity of 3,200 MW.
vi. The setting up of (a) 2,000 MV and 5,000MW of Grid-Connected Solar PV PowerProjects with VGF through SECI underBatch I of Phase-II of JNNSM, (b) Grid-Connected Rooftop and Small Power PlantsProgramme for setting up aggregate capacityof 10,000 MV and (c) Decentralizedgeneration of 10,000 MW of solar power.
6.11.11 Wind Energy Initiatives:
i. The restoration of Accelerated Depreciation(AD) Benefits to wind power projects bythe Government has created a robustmanufacturing base for wind turbines in thecountry.
ii. Excise duty on carbon pultrusions used formanufacture of rotor blades, andintermediates, parts and sub-parts of rotorblades for wind operated electricity generatorshas been reduced from 12.5% to 6.0%.
iii. The classification of renewable projects fromred to green category: wind and solar powerprojects of all capacities, and small hydroprojects of <25 MW capacity have been putin green category, i.e. the project developersto obtain clearance from SPCB to “establishand operate” only once in the beginning.
iv. Setting up a Joint Venture Company (JVC)to undertake first Demonstration OffshoreWind Power Project in the country alongthe Gujarat coast.
6.11.12 Renewable Energy Financing:
i. The Ministry of Finance has accorded in-principle approval for the issuance of taxfree infrastructure bonds of Rs 5,000 crorefor funding renewable energy projects duringFY 2015-16.
ii. The Reserve Bank of India has issued revisedguidelines for all scheduled commercial
152 APPRAISAL DOCUMENT OF TWELFTH FIVE YEAR PLAN
banks making significant inroads forrenewable energy in the priority sectorlending: (a) inclusion of renewable energyin categories of priority sector, (b) bankloans up to a limit of Rs 15 crore toborrowers for purposes like solar-basedpower generators, biomass-based powergenerators, wind mills, micro-hydel plantsand for non-conventional energy-basedpublic utilities viz., street lighting systems,and remote village electrification. Forindividual households, the loan limit will beRs. 10 lakh per borrower.
iii. Authorized Share Capital of IREDA has beenraised by the Government from Rs.1,000to Rs. 6,000 crore, which will help toincrease and strengthen the borrowingcapacity of IREDA.
Box 6.1: RE-INVEST 2015
RE-INVEST 2015, the first meet and exposition in Indiatargeted at global investors in renewable energy, laid astrong foundation for the penetration of renewable energyin India.It featured the signing of Green Energy Commitments byvarious public and private sector companies, whichagreed to invest in the renewable energy sector during2015-2019. A commitment of 292 GW was made by powerproducers in the solar energy, wind energy, small hydroand bio-energy sectors.The manufacturing sector also witnessed a commitmentof 62 GW made by the stakeholders and significantcommitments were made by financial institutions, tofinance renewable projects with a total capacity ofmore than 78 GW.
6.11.13 Physical Targets and Achievements: It isevident that about 63 per cent of the overall physicaltargets of the Twelfth Plan has been achieved duringthe first four years of the Plan. Solar capacity additionof 5847 MW grid-interactive solar has been achievedduring the first 4 years of the Plan, which is 58 per centof the total Twelfth Plan target 10,000 MW. MNRE hasmade plan to add 10,500 MW capacity MW capacityduring the terminal years of Twelfth Plan i.e.2016-17,this would lead to over achievement (163 per cent) ofthe Twelfth Plan solar target. Wind power has achieved
9517.15 MW in first four years and the target for year2016-17 is 4000 MW and expected to be achieved.
6.11.14 Plan Outlay and Expenditure: Actualexpenditure in the first four years has been Rs. 9456crore (which is just over 49 per cent) as against theTwelfth Plan outlay of Rs. 19,113 crore. Consideringtargeted outlay of Rs. 10,192.83 crore (IEBR) of2016-17, the expenditure against the total Twelfth Planoutlay is estimated to be about 102 per cent.
6.12: The Petroleum and Natural Gas Sector
6.12.1 Introduction: The Twelfth Plan acknowledgesthat the elasticity of demand for commercial energy mayremain high as India’s economy grows and traditionalfuels get substituted by cleaner ones. Resultantly, thedemand for petroleum products is projected to increaseat an annual rate of 4.7 per cent. The Plan also madesuggestions in other sectors – infrastructure, capacitybuilding and policy reforms in multiple areas of oil andgas industry. While there has been indifferent achievementon most scores, there is satisfactory progress on thepricing front. The latter has been aided by the recentreduction in crude oil prices, which have had a benignimpact across India’s macro economy, ranging from animproved growth outlook and lower inflation, to healthierfiscal account.
6.12.2 ln October, 2014, the Government took a majorstep to decontrol high-speed diesel (HSD). Similarly, amodest rise in the price of LPG, as well as limiting thenumber of subsidized cylinders per consumer also hada favourable effect on the economy. Disbursing subsidyon domestic liquefied petroleum gas (LPG) cylindersdirectly to Aadhaar-linked accounts of beneficiaries from1st January, 2015 , is yet another major step to curbwasteful consumption of domestic LPG. As on16.03.2017, 16.82 crore LPG consumers are gettingLPG subsidy directly into their bank accounts. So far,more than Rs. 45,288 crore have been transferred intobank accounts of consumers. The use of Aadhaar basedscheme has made black marketing harder, and reducedleakages of LPG After implementation of PAHALScheme, the sale of domestic cylinders which includessubsidized cylinders, registered a growth rate of 5.7%
153PHYSICAL INFRASTRUCTURE
during 2015-16 upto (January 2016) as against 11.31%in FY 2014-15 (upto January 2015) despite increase inconsumer base with the addition of 1.6 crore new LPGconnections during FY 2015-16. Based on prices andsubsidy levels in 2014- 15, it is estimated that the potentialannual fiscal savings due to PAHAL will be Rs 14818crore and Rs 6443 crore during 2014-15 and 2015-16respectively. Under Pradhan MantriUjjwalaYojana(PMUY), 5 croreLPG connections will be provided by2018-19 to BPL families with a support of Rs. 1600 perconnection. Rs. 8000 crore has been allotted towardsthe implementation of PMUY in the budget of 2016-17.PMUY aims at empowering millions of poor women inour country, who are forced to inhale unhealthyemissions from burning coal, wood and other uncleanfuels while cooking. The target of 1.5 crore connectionsfixed for the current financial year 2016-17 has beenachieved within a span of less than 8 months. Around1.9 crore LPG connections have been released acrossthe country under PMUY as on 15th March, 2017.Ongas pricing, the Government in its order dated March21, 2016 has provided freedom for marketing the gas tobe produced from discoveries in deep- water, ultra deepwater and high pressure–high temperature areas. Variousinitiatives taken by Government are provided in Box6.2.
Urja Ganga: In a bid to accelerate development of gaspipeline infrastructure, a capital grant of Rs. 5,176 crore(40%) was granted for the first time for developmentof 2539 km long gas pipeline project i.e. Jagdishpur-Haldia and Bokaro-Dhamra Pipeline (JHBDPL). Hon’blePM laid the foundation stone of the Varanasi CGD Projectas part of ‘Urja Ganga’ on October 24, 2016. Thispipeline would provide connectivity to the eastern partof the country with National Gas Grid and provideimpetus to collective growth and development of thisregion and CGD development of cities falling within thisnetwork.
6.12.3 Thrust Areas: The thrust areas include reducingimport dependency by raising domestic production,enhancing oil and gas security, insulating public financesby appropriate pricing policy, enhancing investmentattractiveness and improving the delivery mechanism
of subsidized products to the target categories. Importdependency continues to rise, posing a major challenge.Therefore, the upstream sector continues to have a highrank in terms of the Government’s priorities for oil andgas sector.Hon’ble Prime Minister has urged allstakeholders to increase the domestic production of Oiland Gas and to reduce import dependence by 10% by2022, when India celebrates its 75th year ofIndependence. He has further enunciated a clear roadmapon future of energy sector which rests on 4 pillars viz.,Energy Access, Energy Efficiency, Energy Sustainabilityand Energy Security.
6.12.4. The achievement in the production, explorationand refinery sub- sectors, as well as growth inconsumption is given in the paras below.
6.12.5 Production: The production of crude oil hasremained in the vicinity of 37 MMT in the first fourPlan years. However, in case of natural gas, there hasbeen an considerable drop. It is apparent that both privateexplorers and National Oil Companies (NOCs) have notbeen able to bring any new field into production. Thegas production from RIL-BP-Niko KG basin field, whichhad led to an exponential increase in India’s oil and gasproduction during the Eleventh Plan, has alsosignificantly dipped. A large number of discoveries arestill pending monetization, raising a question mark onthe efficacy of the New Exploration Licensing Policy(NELP), launched in 1997 against the backdrop of risingoil imports. NOCs, i.e. ONGC and OIL, account forabout 70 per cent of the country’s total oil & gasproduction, whereas the remaining 30 per cent iscontributed by the private sector or joint ventures. TheNOCs possess nominated fields, which are plateauingor declining. Several discoveries made under NELPregime have not been converted into producing fields.The EOR/IOR schemes implemented by the NOCs inthe existing fields are intended towards arresting thenatural decline of old fields. However, it is the new fieldswhich hold the key and it is, therefore, important todevise incentives so as to bring in more discovered fields/marginal fields into production. The production of crudeoil and natural gas, as against the Twelfth Plan targetsare depicted in Figure 6.5.
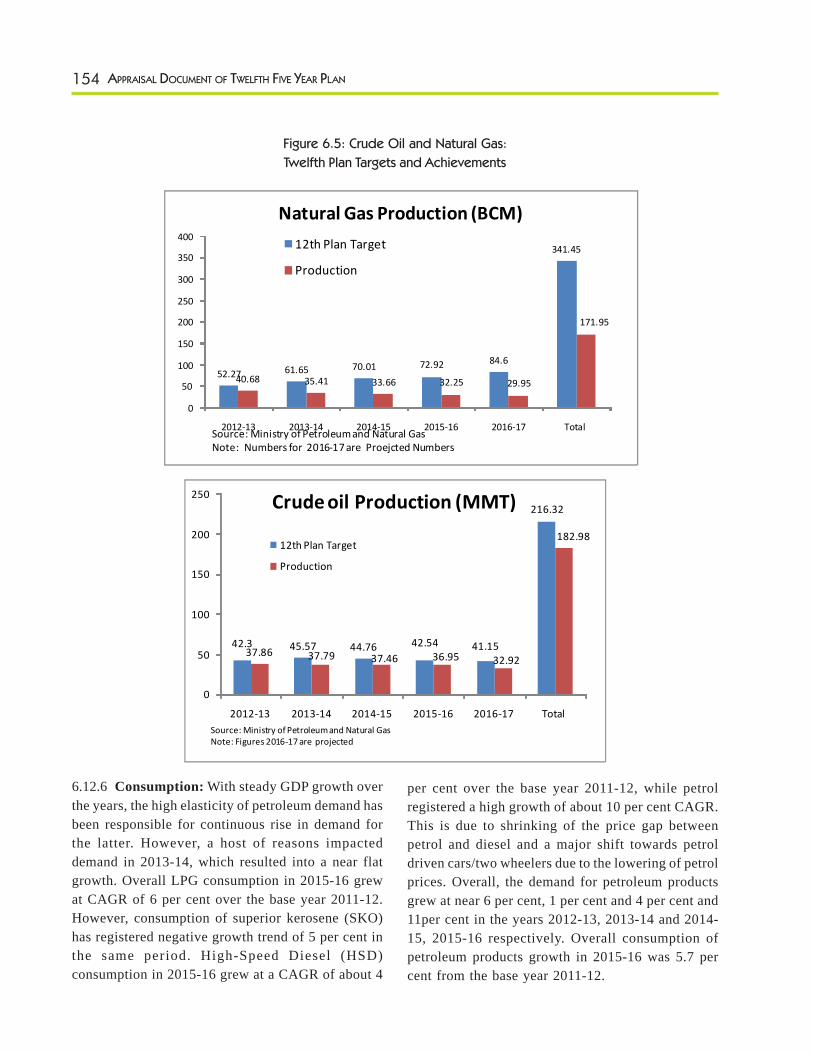
154 APPRAISAL DOCUMENT OF TWELFTH FIVE YEAR PLAN
Figure 6.5: Crude Oil and Natural Gas:
Twelfth Plan Targets and Achievements
Natural Gas Production (BCM)
Crude Oil Production (MMT)
52.27 61.65 70.01 72.92 84.6
341.45
40.68 35.41 33.66 32.25 29.95
171.95
0
50
100
150
200
250
300
350
400
2012‐13 2013‐14 2014‐15 2015‐16 2016‐17 Total
Natural Gas Production (BCM)
12th Plan Target
Production
Source: Ministry of Petroleum and Natural GasNote: Numbers for 2016‐17 are Proejcted Numbers
42.3 45.57 44.76 42.54 41.15
216.32
37.86 37.79 37.46 36.95 32.92
182.98
0
50
100
150
200
250
2012‐13 2013‐14 2014‐15 2015‐16 2016‐17 Total
Crude oil Production (MMT)
12th Plan Target
Production
Source: Ministry of Petroleum and Natural GasNote: Figures 2016‐17 are projected
6.12.6 Consumption: With steady GDP growth overthe years, the high elasticity of petroleum demand hasbeen responsible for continuous rise in demand forthe latter. However, a host of reasons impacteddemand in 2013-14, which resulted into a near flatgrowth. Overall LPG consumption in 2015-16 grewat CAGR of 6 per cent over the base year 2011-12.However, consumption of superior kerosene (SKO)has registered negative growth trend of 5 per cent inthe same period. High-Speed Diesel (HSD)consumption in 2015-16 grew at a CAGR of about 4
per cent over the base year 2011-12, while petrolregistered a high growth of about 10 per cent CAGR.This is due to shrinking of the price gap betweenpetrol and diesel and a major shift towards petroldriven cars/two wheelers due to the lowering of petrolprices. Overall, the demand for petroleum productsgrew at near 6 per cent, 1 per cent and 4 per cent and11per cent in the years 2012-13, 2013-14 and 2014-15, 2015-16 respectively. Overall consumption ofpetroleum products growth in 2015-16 was 5.7 percent from the base year 2011-12.
155PHYSICAL INFRASTRUCTURE
6.12.7 Exploration: India’s 26 sedimentary basins havenot been exploited to the optimum levels and requireintensive exploration efforts for enhancing crude oil andnatural gas production in the country. DespiteGovernment’s policy for allowing 100 percent foreigndirect investment in the upstream sector, the progresshas not been encouraging which was largely attributedto various policy blockades. Although, exploratoryefforts witnessed a steady decline during the 12th Planperiod, much of the focus of the Government was onaddressing various issues, removing bottlenecks andimplementing policy reforms to provide a level playingfield in the upstream sector. Since mid 2014, Governmenthas undertaken a series of transformative reforms andvarious initiatives to incentivise upstream sector andkick-start exploration efforts. These include inter-alia,gas pricing reforms, marketing and pricing freedom forgas produced from deep-water, ultra deep-water andhigh pressure–high temperature areas, auction andinitiating award process of 67 marginal fields underDiscovered Small Field Policy, introducing HydrocarbonLicensing and Exploration Policy, easing out rigidities inthe functioning of PSC regime, permission of extractionof Coal Bed Methane (CBM) to Coal India Limited andits subsidiaries in coal mining areas, Hydrocarbon Visionfor North East, National Data Repository (NDR) andGas hydrates, policy for early monetization ofhydrocarbon discoveries, National Seismic Programmefor 2D seismic survey of entire un-appraised areas andreassessment of hydrocarbon reserves. These focusedsteps would pave the way in accelerating progress inexploratory activities.
6.12.8 Refining: India has 230.066 MMTPA of refiningcapacity with a surplus refining capacity of about 15%,making it the second largest refiner in Asia after China.Private & joint venture companies own about 41% oftotal capacity. The projects face local problems relatingto land acquisition, environment and forest clearances,Right of Use (RoU) for pipe line projects, and delays inengaging with the community and low rate of return onlarge investments. As India is likely to register growthin consumption of petroleum products. Value additionby export oriented refineries is also an important netforeign exchange earner. Asand there is a long leadbetween the concept stage and ultimate commissioningof refineries, expanding refining capacity an area ofimmediate concern. With the growth in consumption ofpetroleum products during 2015-16 around 11.6 per
cent over the previous year, the refining capacity requiresto be revamped..
6.12.9 Pricing: The Government has achievedreasonable success in adjusting the prices of sensitiveproducts, leading to containment of under-recoveries.There has been a sharp reduction by around 83% inunder-recoveries from Rs. 161029 crore in FY 2012-13to Rs 27570 crore in 2015-16. The Rs. 0.50/Litremonthly rise in diesel retail selling price has resulted notonly in dampening growth in its consumption, but alsoreduced under-recovery. As explained above, in October,2014, the Government took the major step ofdecontrolling HSD. Similarly, a modest rise in price andlimiting the number of subsidized LPG cylinders perconsumer has also had a favourable effect. Directingsubsidy on domestic LPG cylinders to beneficiaries’Aadhaar-linked accounts, from 1st January, 2015, hasbeen a major step. LPG witnessed the world’s largestDirect Benefit Transfer Programme, with about 16.82crore beneficiaries receiving a total of Rs45,288croredirectly in their bank accounts as on16.03.2017. The Central Excise duty collection frompetroleum products during 2016-17 (April-December,2016) was 164636 crore, registering an increase of47.42% as compared to Rs. 111677 crore collectedduring the corresponding period in 2015-16. TheGovernment has notified the ‘New Domestic NaturalGas Pricing Guidelines, 2014’ for pricing of DomesticNatural Gas under which the price of Natural Gas isnotified on an interval of six months based on the priceprevailing at Henry Hub, NBP, Alberta Canada and Russia.Accordingly, the price of Natural Gas has been notified@ US $ 2.50/MMBTU on Gross Calorific Value (GCV)basis for the period from 1st October 2016 to 31st March2017. Gas price ceiling is 5.30/MMBTU for discoveriesfor HPHT and from difficult areas for the same period.
6.12.10 Infrastructure, Outlay and Expenditure:The investment regime for petroleum infrastructurecontinued to be unclear due to land issues (gas pipelines),lack of clarity on gas pricing (liquid natural gas, or LNG,terminals) and unresolved regulatory issues (gas pipelinesand city gas distribution networks). Both upstream anddownstream regulatory regime is thus under debate foran overhaul. A total outlay of Rs. 4,41,688 crore was
156 APPRAISAL DOCUMENT OF TWELFTH FIVE YEAR PLAN
approved for this sector over the Plan period, whichincluded GBS of Rs. 5,147 crore. The Actual cumulativeupto February 2017 is 456122.77 crore under I&EBR(102% of the total approved IEBR) and Rs. 4444.54crore under GBS (Plan) (86 per cent of the total approved
GBS (Plan). There is vast scope for this sector tocontribute to the overall growth agenda by majorinvestments in upstream, refining, LNG terminals andpipelines. However, local issues will need to be addressedfor these investments to materialize on the ground.
Box 6.2: Petroleum and Natural Gas Schemes
PAHAL – Direct Benefit transfer for LPG Consumer (DBTL) Scheme : Government, as a measure of good governancehas introduced well targeted system of subsidy delivery to LPG consumers through PAHAL. This initiative of theGovernment was aimed at rationalizing subsidies based on approach to cut subsidy leakages, but not subsidiesthemselves.PAHAL has entered into Guinness book of World Records, being largest Direct Benefit Transfer scheme.So far, more than 16.82 crore (as on 16.03.2017)LPG consumers are getting LPG subsidy and Rs. 45,288 crore have beentransferred directly into their the bank accounts.PAHAL has helped in identifying ghost/multiple/inactive accounts. Blocking of such accounts have resulted in estimatedsavings of more than Rs 21,000 cr during FY 2014-15 & 2015-16.Further, Government has taken steps to rationalise the subsidy outgo by excluding such LPG consumers or his/herspouse having taxable income of above Rs 10 lakh, from availing LPG subsidy.Pradhan Mantri Ujjwala Yojana (PMUY)The Government has launched “Pradhan Mantri Ujjwala Yojana”(PMUY) for providing LPG connections to 5 crorewomen belonging to the Below Poverty Line (BPL) families over a period of 3 years starting from FY 2016-17. Objectiveof the scheme is to provide clean cooking fuel solution to poor households especially in rural areas. Use of LPG as acooking fuel helps in effectively addressing health hazards associated with the use of conventional sources of cookingfuels. As on 14.3.2017, more than 1.90 crore connections have been released under the scheme against the target of 1.5crore fixed for FY 2016-17.Direct Transfer of Cash Subsidy on PDS Kerosene (DTCK):Ministry of Petroleum & Natural Gas has launched DirectBenefit Transfer in PDS Kerosene (DBTK) Scheme. The need to implement DBTK was felt to initiate reforms in allocationanddistribution of PDS SKO distribution system. Under the DBTK, PDS Kerosene is sold to the identified beneficiariesat non-subsidized rates and the applicable subsidy is directly transferred into the bank account of the beneficiaries.Implementation of DBTK will result in better subsidy management through direct transfer of subsidy into bank accountsof beneficiaries. This would result in reducing expenditure on subsidy and also help in curbing diversion of subsidizedkerosene.Under the provisions of the DBTK Scheme, the States/UTs would be given cash incentive of 75% of subsidy savingsduring the first two years, 50% in the third year and 25% in the fourth year. In case the States/UTs voluntarily agree toundertake cuts in kerosene allocation, beyond the savings due to DBT, a similar incentive would be given to thoseStates/UTs.Jharkhand has become the first State in the country to implement DBTK in four districts, with effect from 1.10.2016. StateGovernment of Karnataka, Telangana, Nagaland and Haryana have taken voluntary cut of more than 200,000 KL in theirPDS Kerosene allocation and availed cash incentive.LNG Re-gasification Capacity to be enhanced to meet domestic demand of gas: At present, country is having 4 R-LNGterminals in the country with storage and re-gasification capacity of 26.3 MMTPA. In order to meet the demand ofincreased re-gasification demand, Petronet LNG Ltd (PLL) is expanding the capacity of its Dahej R-LNG terminal by 5MMTPA which is expected to be commissioned by the end of FY 2016-17. Further, an expansion of Dahej by 2.5 MMTPAand development of break-water facility at Dabhol terminal to operationalize 5 MMTPA capacity is expected by 2021-22.On the eastern coast of the country, 3 new R-LNG terminals of 5 MMTPA capacity each (i.e. Dhamra, Kakinada andEnnore) have been planned and the same are expected to be developed by 2022.National Gas Grids: At present, the country’s gas pipeline network is 15,000 km long. It is proposed to build another15,000 km of gas pipeline to complete the national grid. Out of this proposed additional 15,000 km, about 14,500 km hasalready been authorized by MoP&NG/PNGRB and these projects are at various stages of implementation.Developmentof National Gas Grid would connect all major demand and supply centres in India.Urja Ganga:In order to develop gas pipeline network in the eastern part of the country, the Cabinet Committee on Economic Affairs(CCEA) has approved partial capital grant at 40 percent (Rs. 5,176 crore) of the estimated capital cost of Rs.12,940 crore
157PHYSICAL INFRASTRUCTURE
B. Communications Sector
6.13 Telecommunications
6.13.1 Telecommunications is one of the criticalcomponents of socio-economic development. Globally,it’s all pervasive reach has proved to be the driver foraccelerating growth. In India, a series of proactive policymeasures along with active participation by private sectorhave played an important role in the exponential growthof the telecom sector.
6.13.2 The growth of mobile telephony has been oneof India’s most visible success stories and has helpedachieve faster, more inclusive and sustainable growth.The sector has continued to grow rapidly during theTwelfth Plan period. The total subscriber base as on30th September, 2016 was 1074.24 million compared to951.34 million at the beginning of Twelfth Plan. Thusoverall tele-density has increased to 84.09 per cent
during this period. In addition, rural tele-density hasincreased from 39.22 per cent to 51.24 per cent. Thetotal number of broadband subscribers has also grownto 149.75 million, indicating the advent of next phase ofgrowth in telecommunications.
6.13.3 The first two years of Twelfth Plan were amongthe most eventful years for the TelecommunicationsSector. It faced serious transparency challenges arisingfrom issues raised by the allocation of licenses in 2008,which forced the quashing of 122 licenses by theSupreme Court. The Government adopted a multi-pronged approach and initiated a series of policymeasures to maintain the growth momentum and makeit more competitive. As a first step, the NationalTelecom Policy-2012 (NTP-2012) was notified withthe primary objective of maximizing this public goodby making available reliable, affordable and high qualityconverged telecommunication services anytime,anywhere.
to GAIL for development of two gas pipeline projects i.e. Jagdishpur- Haldia and Bokaro-Dhamra Pipeline projects. Thisis the first time in the history that Government has come forward to fund the gas pipeline infrastructure in the country.This project will connect eastern part of the country with National Gas Grid and will ensure the availability of clean andeco-friendly fuel i.e. Natural Gas to the industrial, commercial, domestic and transport sectors in the States of UttarPradesh, Bihar, Jharkhand, Odisha and West Bengal.In order to put thrust on development of CGD network for securing the un-interrupted supply of cooking and transportfuel to public at large, the Government has accorded the highest priority in domestic gas allocation to PNG (Domestic)and CNG (Transport) segments. Government has decided to meet 100% demand of CNG and PNG sector through supplyof domestic gas. At present, 30 CGD companies are developing CGD network in 80 Cities/Districts across 19 State(s)/UTs.As on date, about 34.89 lakh households and 27.5 lakh vehicles are benefitting from these clean and conventional fuels.The aim is to expand the PNG network across the country raising the number of households connected with PNG to 10million by 2019.HELP: The Government has approved the Hydrocarbon Exploration and Licensing Policy (HELP) and the four main factsof this policy are :i. Uniform license for exploration and production of all forms and hydrocarbon.ii. An open acreage policy.iii. Easy to administer revenue sharing model andiv. Marketing and pricing freedom for the crude oil and natural gas produced.Discovered Small Field Policy:The Government put on offer 67 fields for online international competitive bidding withthe objective of monetizing of hydrocarbon resources locked for years under the ‘Discovered Small Field Policy’ whichis packed with all possible reforms similar to HELP. All these fields are located in existing oil and gas producing basins,where oil or gas has already been discovered. Bids were launched on May 25, 2016 and by bid closing date a total of 134e-bids were received for 34 contract areas.The CCEA has since given its approval to award contract in 31 contract areas (23 on onshore and 8 in offshore) ofdiscovered small fields of ONGC and OIL. Award of contract is expected to provide faster development of fields andfacilitate production of oil and gas thereby increasing energy security of the country.
158 APPRAISAL DOCUMENT OF TWELFTH FIVE YEAR PLAN
6.13.4 The NTP-2012 also outlined various measures todevelop a conducive ecosystem. Spectrum was delinkedfrom licencing, paving the way for adoption of auctionsand a mechanism for its allocation. The Government alsoannounced some significant initiatives, like the policy onmergers and acquisitions, inter-service area mobile numberportability, market access for domestically manufacturedproducts and 100 per cent FDI in the sector. The revivalof the two ailing Public Sector Undertakings, MahanagarTelephone Nigam Limited (MTNL) and Bharat SancharNigam Limited (BSNL) was also taken up, keeping inview their strategic importance. These measures areexpected to drive Indian telecom sector in a big way inthe years to come.
6.13.5 The policy interventions taken by theGovernment have started yielding the desired results,
particularly in the telecom sector and electronicsmanufacturing. The auction of Spectrum in three roundsin November, 2012, March, 2013 and February, 2014,generated revenues of Rs. 9,407.64 crore, Rs. 3,639.48crore and Rs. 61,162.22 crore respectively. Thespectrum auctions conducted in February, 2015, havefurther resulted in a commitment of Rs. 1,09,343 crore,to be paid by the winning telecom companies to theGovernment. In the electronics hardware manufacturingsector, project proposals worth over Rs. 18,000 crorehave been received. In addition, the Government hasalso approved establishment of two semiconductorwafer fabrication facilities in the country with a totalinvestment of Rs. 63,000 crore. Box 6.3 gives a glimpseof the measures taken during the Plan in the telecomsector.
Box 6.3: Major Telecom Policy Measures since 2012
i. National Telecom Policy, 2012.ii. National Policy on Electronics, 2012.iii. National Policy on Information Technology, 2012.iv. Policy on Adoption of Open Source Software (OSS) for Government of India.v. “e-mail Policy of Government of India” and “Policy on Acceptable Use of IT Resources of Government of India.vi. Policy on Electronic Development Fund.vii. Framework for Enhancing Cyber Security of Indian Cyberspace.viii. Semiconductor Wafer Fabrication (Fab) Manufacturing Facilities.ix. Reduction in tariff for National Roaming.x. Delicensing of frequency bands 433-434 MHz and 9-50 KHz.xi. Implementation of first phase of the unified licence regime.xii. Revised guidelines for mergers and amalgamations.xiii. Preferential Market Access for domestically manufactured telecom products in government procurement.xiv. Increase in FDI up to 100 per cent for all telecom services.xv. Revision of minimum broadband speed for download from 256 kbps to 512 kbps.xvi. Revival Plan for BSNL and MTNL.xvii. Establishment of Telecommunications Standards Development Society, India (TSDSI) through government-industry
initiative.xviii. Revival Plan of ITI Ltd. through financial restructuring and infusing Rs. 4,156.79 crore.
6.13.6 The Government of India has also initiatedprogrammes for universal access to mobileconnectivity, extending mobile coverage to all theremaining uncovered villages (numbering 55,669)(Figure 6.6) in a phased manner by March, 2019. Outof the 55,669 uncovered villages, 3,000 villages areenvisaged to be provided with mobile coverage during2016-17. The Government’s major focus is to reach
the unreached and remote areas, especially the LeftWing Extremism-affected areas, North-Eastern States,the Himalayan States, the Western Border States andthe Islands on priority basis. Against a target of installing2,199 towers in LWE areas by June, 2016, 2,173 towershave been set up as on September 30, 2016 andtherefore, remaining 26 towers will have to be installedduring 2016-17 to meet the target.
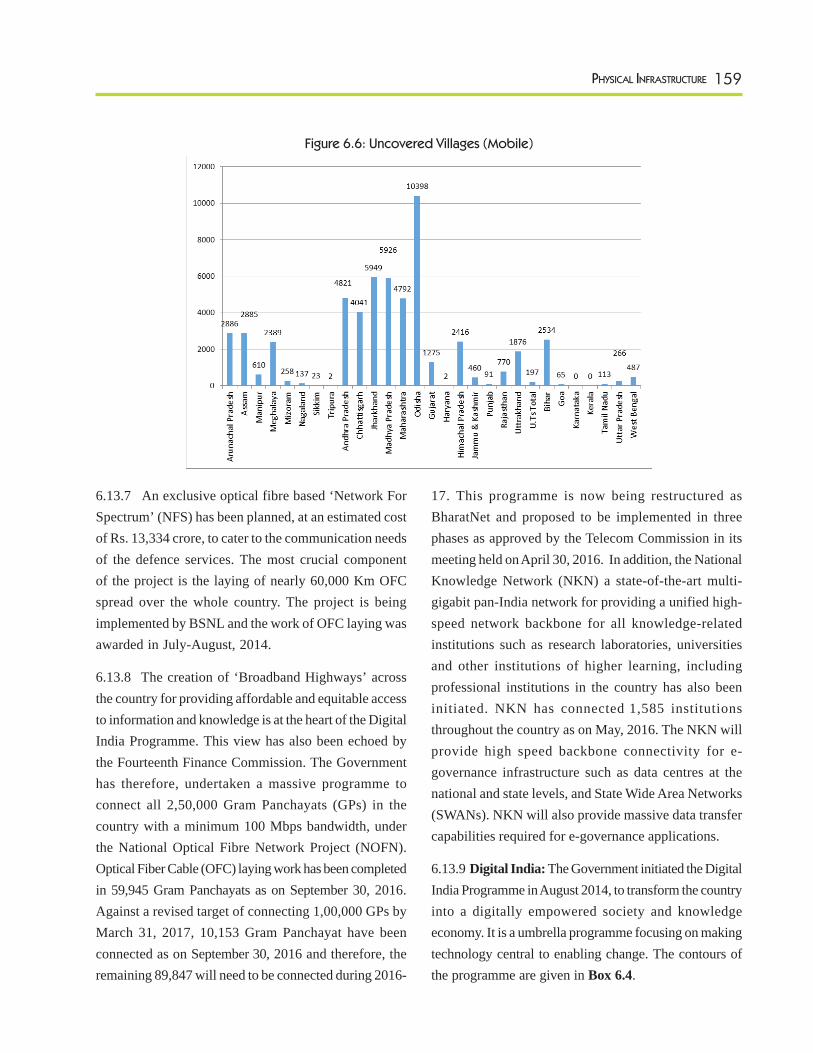
159PHYSICAL INFRASTRUCTURE
6.13.7 An exclusive optical fibre based ‘Network ForSpectrum’ (NFS) has been planned, at an estimated costof Rs. 13,334 crore, to cater to the communication needsof the defence services. The most crucial componentof the project is the laying of nearly 60,000 Km OFCspread over the whole country. The project is beingimplemented by BSNL and the work of OFC laying wasawarded in July-August, 2014.
6.13.8 The creation of ‘Broadband Highways’ acrossthe country for providing affordable and equitable accessto information and knowledge is at the heart of the DigitalIndia Programme. This view has also been echoed bythe Fourteenth Finance Commission. The Governmenthas therefore, undertaken a massive programme toconnect all 2,50,000 Gram Panchayats (GPs) in thecountry with a minimum 100 Mbps bandwidth, underthe National Optical Fibre Network Project (NOFN).Optical Fiber Cable (OFC) laying work has been completedin 59,945 Gram Panchayats as on September 30, 2016.Against a revised target of connecting 1,00,000 GPs byMarch 31, 2017, 10,153 Gram Panchayat have beenconnected as on September 30, 2016 and therefore, theremaining 89,847 will need to be connected during 2016-
17. This programme is now being restructured asBharatNet and proposed to be implemented in threephases as approved by the Telecom Commission in itsmeeting held on April 30, 2016. In addition, the NationalKnowledge Network (NKN) a state-of-the-art multi-gigabit pan-India network for providing a unified high-speed network backbone for all knowledge-relatedinstitutions such as research laboratories, universitiesand other institutions of higher learning, includingprofessional institutions in the country has also beeninitiated. NKN has connected 1,585 institutionsthroughout the country as on May, 2016. The NKN willprovide high speed backbone connectivity for e-governance infrastructure such as data centres at thenational and state levels, and State Wide Area Networks(SWANs). NKN will also provide massive data transfercapabilities required for e-governance applications.
6.13.9 Digital India: The Government initiated the DigitalIndia Programme in August 2014, to transform the countryinto a digitally empowered society and knowledgeeconomy. It is a umbrella programme focusing on makingtechnology central to enabling change. The contours ofthe programme are given in Box 6.4.
Figure 6.6: Uncovered Villages (Mobile)
160 APPRAISAL DOCUMENT OF TWELFTH FIVE YEAR PLAN
6.13.10 The National e-Governance Plan (NeGP), isone of the flagship programmes of Government of India.NeGP was designed and approved for implementationin 2006, with the objective to create a nation-wideframework for e-governance in India. As part of NeGP,out of the 252 electronics services envisaged under 31Mission Mode Projects, 222 services are operational.NeGP has now been subsumed into e-Kranti, which isan integral part of the Digital India programme with thevision of “Transforming e-Governance for TransformingGovernance”. The mission of e-Kranti is to ensure agovernment-wide transformation by delivering all itsservices electronically to citizens through integrated andinteroperable systems and multiple modes while ensuringefficiency, transparency and reliability of such servicesat affordable prices.
6.13.11 e-Kranti now has 44 Mission Mode Projects(MMPs) (including the 31 MMPs under NeGP), whichfocus on specific aspects of electronic governance.There are 13 Central sector MMPs, 17 State sectorMMPs and 14 Integrated MMPs together with the coreICT infrastructure. The MMPs follow the key principlesof e-Kranti: ‘Transformation and not Translation’;‘Integrated Services and not Individual Services’;‘Government Process Reengineering (GPR) to bemandatory in every MMP’; ‘ICT Infrastructure onDemand’; ‘Cloud by Default’; ‘Mobile First’; ‘Fast
Tracking Approvals’; ‘Mandating Standards andProtocols’; ‘Language Localization’; ‘National GIS(Geo-Spatial Information System)’; ‘Security andElectronic Data Preservation’. In addition, e-Kranti alsocovers several new areas: e-Education; Digital Literacyprogramme; e-Healthcare; GIS-based decision-making;Technology for Farmers; Technology for Security;Technology for Financial Inclusion; and Technology forJustice. The implementation of e-Kranti is critical forthe success of e-governance, easy governance and goodgovernance in the country.
6.13.12 It may however be mentioned that the fundingarrangement for the National e-Governance Action Plan(NeGAP), which was hitherto being implemented as aCentrally-Sponsored Scheme, has undergone a changein the light of the recommendations of the FourteenthFinance Commission. It has been left to the States todecide to continue (or not) with this scheme/ programmeout of their increased devolution of resources and thusno direct provision has been made in the 2015-16 budgetof MeitY for NeGAP. Therefore, States need to supportthese schemes, so that the core ICT infrastructurecreated so far would continue to be properly utilized inits entirety. In addition, the implementation of integratedand State sector MMPs as well as the NationalInformation Infrastructure (NII) under e-Kranti wouldkeep flourishing.
Box 6.4: Digital India
Objectives - Centered on 3 Key Pillars
1. Infrastructure as utility to every citizen
2. Governance and services on demand
3. Digital empowerment
Key Action Areas
1. Broadband highways 2. Universal access to phones 3. Electronics manufacturing
4. e-governance - eKranti 5. Public service delivery outlets 6. Jobs in IT sector
7. Digital literacy 8. Information for all 9. Early harvest programmes
161PHYSICAL INFRASTRUCTURE
6.13.13 Challenges and the way forward: The majordevelopmental challenges faced by the sector are toexpand the reach of broadband and connect the hithertounconnected areas, thereby increasing rural tele density.This need to be predominantly driven through theUniversal Service Obligation Fund (USOF), as serviceprovisions in unconnected rural and far flung areas isstill commercially unviable.
6.13.14 The present growth of the telecom sector ismainly driven by voice telephony. The next wave ofgrowth in the telecom sector will be driven by data. TheGovernment has already initiated programmes to boostdata driven services. Facilitating the creation ofinfrastructure for meeting the carriage requirements ofdata demand is a priority area for the Government.
6.13.15 The realization that there are issues in theimplementation of NOFN led the Government toconstitute a committee to review the architecture,implementation strategy, utilization models andinstitutional structure of NOFN and to align NOFN withthe vision of Digital India. The committee has submittedits recommendations, which are being examined by theDepartment of Telecommunications. An early decisionon the recommendations can help in reshaping NOFNto expeditiously deliver the vision of Digital India.
6.13.16 The other major challenge in the telecom sectoris to regain investors’ confidence. This needs to bepromoted by a simplified licensing framework, whichhas the flexibility to adjust and adapt to rapidtechnological changes. In order to align the legalframework to modern requirements, legislation forconverged regulation of the communications sector toserve public interest objectives is proposed. The efficientutilization of spectrum also needs promotion, throughpolicies relating to spectrum trading and spectrumsharing. Box-6.5 lists the tasks in near future for thecommunications sector.
Box 6.5: Communications Sector: Near-Future Tasks
i. Fast- track the implementation of BharatNetprogramme for providing broadband connectivityto Gram Panchayats and support the Digital Indiaprogramme.
ii. Facilitating public wi-fi facilities at public places foraccess to the information highway.
iii. Provision of mobile services in Left Wing Extremism(LWE) affected areas.
iv. Strengthening of mobile telecommunication networkin the North-Eastern States.
v. Strengthening of telecommunication network inA&N Islands and Lakshadweep and connecting theIslands with the mainland.
vi. Fast tracking the completion of the Network forSpectrum project.
vii. Enactment of Right of Way rules to facilitate layingof telecom infrastructure.
viii. Revival and revitalization of BSNL/ MTNL.ix. Rolling out of emergency communication plan for
dealing with disasters.x. Strategy for promoting indigenous R&D, IPR
generation and telecommunication manufacturing.
6.13.17 With the National e-Governance Programme(NeGP) infrastructure in place, and majority of theMission Mode Projects (MMPs) having started providingservices, it is essential to re-examine the programme asa whole. This is essential for improving the delivery ofservices and fast tracking the implementation of suchschemes and sub-components of NeGP that are yet totake off. The ultimate objective is to integrate all theservices accruing from various MMPs and provide themon various platforms like mobile, web as well as throughservice delivery outlets like the Common Service Centres.Integration of various databases is essential forconsolidating the entitlements/benefits to a citizen forefficient and targeted delivery of services. DeitY thereforeneeds to put in place a scheme and stitch together all thedatabases, with residents’Aadhar numbers as a commonlink.
6.13.18 Digital India, National Information Infrastruc-ture (NII) and e-Kranti programmes have been initiatedby DeitY to help consolidate the initiatives undertakentill date and also to fill the gaps while expanding. However,
162 APPRAISAL DOCUMENT OF TWELFTH FIVE YEAR PLAN
there is a need to map the activities completed underNeGP and use the experience/learning in formulating theway forward under Digital India/NII. A crucial elementin the success of these programmes is the availability ofresources both in terms of finances and qualifiedmanpower across the States. IT projects suffer due tothe fast obsolescence of technology; hence, it is essentialto move at least as fast to implement these projects, soas to reap the benefits of the investments made.
6.13.19 Delivery of services to people in real time isthe main objective of NeGP. The States and UTs arecentral to this, and need to play a crucial role by (i)Leveraging the Common ICT platform; (ii) Promotingthe adoption of Aadhaar to facilitate the identification,authentication and delivery of benefits; (iii) The time-bound implementation of State sector MMPs and e-governance initiatives; (iv) Government business processre-engineering using IT; and (v) Ensuring the availabilityof all databases in digital format.
6.13.20 With a mature IT System in place, cloud-basedarchitecture needs to become the default. This wouldhelp in minimizing the huge IT infrastructure costs andimplementation schedule, thereby reducing the overallproject costs as the Indian IT sector moves from capex+ opex-based model to simply an opex-based model.
6.13.21 With a massive rollout of network throughNOFN, NKN and service delivery through MMPs tothe common man, maintenance of the network & assetsso created is a huge challenge and the Government alonewould not be fully equipped to take this forward. Theexpertise and delivery capabilities of private sector needto be used for this purpose. Appropriate PPP modelsneed to be worked out. Possibilities include: CoCo –Company owned and Company operated - servicedelivery models, with appropriate revenue sharing.
6.13.22 In today’s scenario, the security of cyberspacehas attained paramount importance. Complex malicioussoftwares are used by both the State and Non-state actorsas cyber weapons and there have been many untowardincidents. The evolving cyber threat landscape and itspotential impact on the well-being of the nation’s
economy and its security necessitate the need for real-time situational awareness and rapid response to cybersecurity incidents. The establishment of ‘National CyberCoordination Centre’ as a priority will help in buildingsafeguards along with counter-measures to ensuresecurity of the IT systems and the information containedtherein.
6.13.23 Implications of Fourteenth FinanceCommission and Budget 2015-16: The FourteenthFinance Commission has recommended the devolutionof 42 per cent of the divisible pool of taxes to the Statesagainst 32 per cent earlier. It is expected that the Stateswill now have greater flexibility to use this money. Themajor programme/scheme in this sector which needsresources from States out of this higher devolution isthe National e-Governance Action Plan (NeGAP), as theStates will now be vested with its implementation andfast-tracking, depending upon preparedness.
6.13.24 The 2015-16 Union Budget left it to the Statesto take a call on the NeGAP and decide to continue (ornot) with this scheme and its related programmes outof their increased resources resulting from higherdevolution. The major issue which emanates is that theinfrastructure which has been put in place by theGovernment such as the State Wide Area Network, StateData Centres, Common Service Centres as well as thecapacity created so far, continues to be fully utilized.Moreover, as ICT infrastructure suffers from fastobsolescence, all the concerned (States and UTs) needto quickly evolve a common plan to provide services tothe citizens using the infrastructure established. Towardsthis end, the enactment of the Electronics ServicesDelivery Bill needs to be taken up immediately.
6.13.25 Financial performance: During 2012-15, anexpenditure of Rs. 29,116.65 crore was incurred byDepartment of Telecommunications (DoT). An outlayof Rs. 22,680.70 crore (B.E.) has been approved forDoT for 2016-17 against Rs. 20,782.82 crore (R.E.) in2015-16. Thus the total anticipated outlay of the DoTduring the Twelfth Plan would be Rs. 72,580.17 crorewith a GBS of Rs. 19, 619.88 crore against the TwelfthPlan approved GBS of Rs. 20,825 crore.
163PHYSICAL INFRASTRUCTURE
C. Transport
6.14 Overall Status of Transport Sector
6.14.1 The Twelfth Plan had identified the mainchallenges in India’s transport sector as: lack of capacity;low transport efficiency; model imbalance due to anunsustainable level of traffic moving by road; lack oftransport access to large unserved areas of the country;poor safety standards leading to unacceptable levels ofaccidents, especially on roads and the lack of integratedtransport outlook. The strategy for the transport sectorin the Plan addressed these challenges. Looking atcapacity first, the most capacity-constrained sector intransport is the rail sector, where in the last four yearsadditional capacity has been added but not at the scaleof the Plan targets. Notably, the DFC projects are on afirm footing and should add to new capacity by 2019-20 (though not by the originally planned target of March,2017). In the road sector, capacity of single lane NHsand State Highways has to be doubled as a priority forwhich much more needs to be done. The port sectorhas created capacity, especially in the non-major portsector which is likely to be sufficient up to 2020 but thethrust must continue so that as international tradeincreases and the Make in India programme picks up,there is no capacity constraint. In aviation, the numberof airports has increased but penetration of airlines tomany airports including to the north-eastern states ismuch less than required which points to the need forimproving regional connectivity. Growth of passengernumber in the aviation sector has been of very high orderin the last two years.
6.14.2 There has been no substantial achievement indiverting traffic from road to more sustainable forms oftransport i.e. rail and water ways. Growth of rail freighttraffic has not kept pace with Plan targets. In fact, inNTKM terms, this is a decline which may be the firstinstance of negative growth in rail traffic during a planperiod. There has been a decline in originating passengerstoo. Despite the overall decline, the rail passengerdemand on many sectors is not being met due to severecapacity constraints. Transport access to unserved areas
have been improving especially to the north-east, withrailways successfully completing many critical projectsand SARDPNE progressing, although at a slower pacethan required. However, one transportation challengewith which not much engagement has taken place isthat of safety. The Ministry of Road has proposed anew Road Safety Bill while it has faced opposition fromsome states. Consequently, the work on lead transportagency for safety in the form of the National Road SafetyTransport Management Board (NRSTMB) has notprogressed despite being suggested by the SundarCommittee in 2007. The main function of NRSTMBwould be to take steps to improve road safety in thecountry.
6.14.3 On the budgetary issues related to transport,railways remain the most underfinanced transport sectorrelative to its requirements. But greater internal generationfrom the passenger segment is possible by rationalizingfares. This would reduce the need for hiking freightrates.
6.14.4 The case for an integrated transport policy hasbeen made very strongly in the National Transport onDevelopment Policy Committee (NTDPC) report 2014,but not much progress has taken place on this front.The subsequent sections look at the individual transportsectors.
RAILWAYS
6.15 The Twelfth Plan aimed at increasing the pace ofcapacity creation and connectivity to hithertounconnected areas; enhancing rail share in freight trafficby at least 2 per cent; and technological up-gradation.Some major projects which are targeted for completionin the Twelfth Plan are the eastern and western dedicatedfreight corridors and important connectivity projects inthe north eastern states.
6.16 Financial Performance and Investment
6.16.1 The Railways’ financial position continue to beunder strain. In 2016-17 (the 5th year of the Twelfth Plan),it is estimated that the surplus after accounting for allexpenses including dividend would be Rs. 8,480 crore as

164 APPRAISAL DOCUMENT OF TWELFTH FIVE YEAR PLAN
compared to Rs. 10,506 crore in 2015-16. Operating ratiois estimated to be at 92.00 per cent in 2016-17 against theanticipated operating Ratio of 90.5 percent in 2015-16 onaccount of implementation of 7th Pay Commissionrecommendations. The total Plan size envisaged for therail sector under the Twelfth Plan is Rs. 5,19,221 croreto be contributed by GBS of Rs. 1,94,221 crore, internalresources of Rs. 1,05,000 crore, market borrowings ofRs. 1,20,000 crore and private investment including PPPof Rs. 1,00,000 crore. The actual investments in the firstfour years are Rs. 50,383 crore in 2012-13, Rs. 53,989crore in 2013-14, Rs. 58,719 crore in 2014-15, Rs 93,519crores in 2015-16 and the BE for 2016-17 is Rs 1,21,000crores. If the investment planned for the year 2016-17 isachieved, the total investment in the Twelfth Plan periodwould be around Rs 3.78 lakh crore which is 72.7 percent of the projected outlay for the Twelfth Plan. As canbe seen, investment in the fourth year has taken a jumpof 72 per cent over the average of the first three yearsand is expected to move to a further higher trajectory inthe final year. This has been made possible through anew source of funding in the form of BudgetaryResources from Institutional Finance under Internal andExtra Budgetary Resources (IEBR) from institutions suchas the LIC. If we analyse the sources of funding, thenout of the expected Rs. 3.78 lakh crore of investment inthe Twelfth Plan, Rs. 1.69 lakh crore is expected fromGBS which is 87 per cent of the Twelfth Plan target ofRs. 1.94 lakh crore. Similar figures for other sources offunding are: Rs. 0.68 lakh crore from internal sourceswhich is 64 per cent of target; Rs. 0.75 lakh crore frommarket borrowings from IRFC which is 63 per cent ofthe target; around Rs. 0.64 lakh crore from InstitutionalFinancing and PPP which is 64 per cent of the target.
6.17 Operational Performance
6.17.1 The Twelfth Plan targeted a growth of 7.8 percent CAGR in the originating freight loading and 7.7 percent in Net Tonne Kilometres (NTKM). Actual growthhas been 4.4 per cent in originating freight and 2.15 percent in NTKM in the first three years. The targets fororiginating tonnage in 2012-13, 2013-14 and 2014-15were 1,038 MTs, 1,119 MTs and 1,206 MTs respectively.Against this, the achievements have been lower, at 1,008
MTs, 1,052 MTs and 1,095 MTs respectively. For 2015-16, against a very stiff target of 1186.25 MTs whichrepresented a growth of 8.3 per cent over the previousyear, the target had to be revised to 1107 MTs againstwhich the actual achievement was 1102 MTs which isan increase of only 0.6 per cent over 2014-15. The targetfor the terminal year has been kept at 1157 MTs. Thesefigures represent the challenges that confront theRailways in increasing their freight basket since the lackof growth of freight reflects the sluggish growth in thecore sector of the economy comprising commoditiessuch as coal, steel, cement etc. Unless the freight basketis widened to include more of containers and other newcategories such as automobiles, the national goal ofdiverting more freight to rail from road and to take thisproportion to 50 per cent by 2032 as envisioned in theNTDPC Report would be very difficult to achieve. Thisaspect becomes starker if we look at the NTKM figureswhich show that the NTKM in the first four years ofthe plan were 650, 666, 682 and 654 billlion respectivelyand is expected to go up to 694 billion in the final yearof the Twelfth Plan. This shows that there has been littlegrowth in the freight output when measured in terms ofNTKM during the Twelfth Plan period, between the firstyear and the fourth year of the plan period. This isbecause the average distance for which traffic is carriedhas come down from 642 kms in 2012-13 to 592 kms in2015-16. The original target of 1,405 MT for originatingloading and 927 billion for NTKM for the terminal yearof the Twelfth Plan now seems a very high estimategoing by the actual performance during this period.However, the 2015-16 budget has envisaged carrying1.5 billion tonnes by 2019-20 which also is of very highorder. In originating passengers, there has been a growthof 0.35 per cent and in Passenger Kilometres (PKM) agrowth of 2.6 per cent in the first three years ascompared to terminal year of 11th Plan. Originatingpassenger numbers have declined from 8.42 billion in2012-13 to 8.22 billion in 2014-15,and have furthergone down to 8.18 billion in 2015-16. During this period,PKM has grown from 1,098 billion in 2012-13 to 1,147billion in 2014-15 but has fallen to 1,143 billion in 2015-16. In 2016-17, the BE numbers for passengers and
165PHYSICAL INFRASTRUCTURE
PKM are 8.12 billion and 1,137 billion respectively. Thetarget of 11.7 billion passengers and 1,760 billion PKMSin the terminal year of the Plan, incorporating growth of7.5 per cent per annum and annual PKM growth of 10.63per cent remains a very high estimate in the backdropof the actual performance. However, the 2015-16 budgethas targeted 30 million passengers per day i.e. 9.950million per annum by 2019-20 which seems to be a highestimate unless the recent trends are reversed.
6.18 Project Performance
6.18.1 In case of network expansion projects i.e. newlines, gauge conversion, doubling and electrification, theperformance is below annual targets in the threecategories aside from electrification. For electrification,4,042 kms have been achieved in the first three years,which is nearly 5 per cent more than the target. In thefirst three years, a total of 1,331 kms of new lines, 1,889kms of gauge conversion and 2,136 kms of doublingwere achieved which are substantially below the Plantargets for these programmes. The main reason forlower achievements in these segments has been slowgrowth in fund allocation for these categories. Howeverthe scenario changed from 2015-16 when higher targetswere fixed for completion of 500 kms. of New Line,800 kms. of Gauge Conversion, 1200 kms. of Doublingand 1600 kms. of Electrification against which theachievements are 813 kms, 1043 kms, 972 kms and1730 kms. The combined performance of new lines anddoubling which is 1785 km in 2015-16 indicates animprovement of 75 per cent over the achievement in thesetwo categories over 2014-15. The targets for 2016-17 inthese categories are: 400 for new lines; 800 for gaugeconversion, 1600 km for doubling and 2000 km forelectrification which indicates a quantum jump fordoubling. This is in line with the stress on capacityaugmentation in the coming years. The 2015-16 budgethas laid specific emphasis on doubling/3rd/4th Line andreducing the renewal of congestion from the high density-network. The Railways have shifted focus by divertinga bulk of their resources to doubling during the period2015-16 to 2019-20. The targets for this period are:11,100 km of doubling; 1,900 km of new lines, 3,700
km of gauge conversion and 10,000 km ofelectrification. Over the remainder of the 12th Plan, ittherefore follows that there will be a step-up in doublingand electrification as indicated in the increase step upfrom 723 kms of doubling in 2014-15 to 972 km in2015-16. The performance in manufacturing oflocomotives and coaches have been according to theannual targets but in case of coaches, there is evidencethat demand is more than the supply considering theunfulfilled demand in popular long-distance trains andshort distance EMU/DMU type coaches.
6.19 North-East Connectivity
6.19.1 Despite the lower aggregate achievements innetwork expansion programmes during the first threeyears of the Twelfth Plan, in 2013-14, the Railwaysachieved substantial success in meeting the targets forconnectivity in the north eastern region. In 2013, theerstwhile Planning Commission recommended a step-up in finances for NER projects, when a review at PM’slevel revealed higher capacity for projects to absorb morefunds than what was sanctioned. Increase in fundingsince that period has led to higher progress. Presently30 per cent to 35 per cent of total outlay for railwayinfrastructure projects for the country is being earmarkedfor this region, which has yielded rich dividends in termsof completion of many projects within the timelinescommitted by Railway project managers. The pace ofexecution of Railway Projects in the North EasternRegion has further picked up considerably in 2015-16.During this financial year a total track of 816 Km. hasbeen commissioned for passenger traffic and a total trackof 377 kms. has been commissioned for Freight traffic,thereby surpassing the previous best achievement ofcommissioning of 224 kms. for Passenger traffic and447 kms. for Freight traffic during the Financial Year2014-15. Another important achievement during thefinancial year 2015-16, is that three important North-East states namely Tripura, Manipur and Mizoram havebeen brought on the map of BG Network of IndianRailways. All capitals of NER States are targeted to beconnected to BG network by 2020.
166 APPRAISAL DOCUMENT OF TWELFTH FIVE YEAR PLAN
6.20 Progress of Critical Projects
6.20.1 During the Twelfth Plan, the most importantproject undertaken by the Railways is the DedicatedFreight Corridor on the Eastern (EDFC) and Western(WDFC) alignments. The original target for completionof the DFCs was end of the Plan but have now beendelayed and would now be completed in 2019/2020.The latest status as on 31st March, 2016, of MajorMilestones is as given below:-
EDFC:
(i) 82.4 per cent Land acquisition completed;balance would be acquired by June, 2017.
(ii) 66 per cent i.e. 871 kms. of Civil Awardcompleted, balance civil contracts will beawarded by May 2017.
(iii) 31 per cent of Systems contract awarded.
WDFC:
(i) 95.3 per cent Land acquisition completedbalance would be acquired by June, 2017.
(ii) 64 per cent i.e. 1267 kms. of Civil Awardcompleted, balance civil contracts will beawarded by October 2017.
(iii) 63 per cent of Systems contract awarded.
6.20.2 High speed Rail Project between MumbaiAhmedabad has been approved by the Cabinet in itsmeeting held on 09.12.2015 and is under implementation.Details of the project are being negotiated between Japanand India. The first Joint Management Committee (JMC)Meeting at the level of cabinet ministers was held on14th February, 2016 at Mumbai and the second one atTokyo in May, 2016. In addition numerous meetings atthe official level have been held to take forward theexecution of the project.
6.21 Incomplete Projects
6.21.1 The problem of incomplete projects is a veryserious one in the Railways. More than 350 new line,gauge conversion and doubling projects are pending.
These would require more than Rs. 2.8 lakh crore at2014-15 price level for completion. Earlier, the PlanningCommission and now the NITI Aayog have insisted onthe completion of priority projects and projects whichhave moved and cleared the land and other statutoryclearances. The pressure on Railways to invest in socio-economic and connectivity projects is very high butthere has to be proper deployment of adequate resourcesand progress of already sanctioned projects before newones are taken for construction. To tackle the problemof completion of already sanctioned projects, the ministryof Railways have been authorized to formulate JointVenture Companies with various State Governments tomobilize resources for undertaking various railinfrastructure projects in the states.
6.22 Policy Reforms
6.22.1 The Twelfth Plan had set some specific targetsin the area of policy reforms for the Railways. It hasbeen recognized that Indian Railways have very lowpassenger fares, whereas freight rates are comparativelyhigher due to cross-subsidization between these twosegments. In order to rectify this anomaly and to makean institutional arrangement for regular and timelyadjustment in fares in line with increase in cost of inputs,the government has decided to set up an independentRail Development Authority (RDA) to advise the Ministryof Railways on the fixing of passenger and freight fares.Ministry of Railways have circulated a concept Note onRDA and further action is being based on feedback fromstakeholders. In order to attract private investment andPPP, the Ministry of Railways has announced aparticipative policy for capacity augmentation. In August,2014, the Government also permitted 100 per centForeign Direct Investment (FDI) in railways throughthe automatic route. The Ministry in November, 2014,issued sectoral guidelines covering 17 identified areasfor domestic/Foreign Direct Investment (FDI).
6.22.2 The Committee headed by Dr. Bibek Debroy,Member, NITI Aayog for Mobilisation of Resourcesfor Major Railway Projects and Restructuring of Railway
167PHYSICAL INFRASTRUCTURE
Ministry & Railway Board has submitted its final Reportin June, 2015. It contains various recommendations onreforms, which are under consideration.
ROADS
6.23 Plan Targets for Roads
6.23.1 The Twelfth Plan aims to continue with the thrustof upgrading India’s road infrastructure to improvemobility and accessibility while reducing the cost oftransportation. Some of the main targets of the TwelfthPlan pertaining to the road sector, are: National and StateHighways would be upgraded to a minimum of two laneswith paved shoulders by the end of the Plan; all villageswill be connected by all-weather roads by the end of thePlan; completion of NHDP phases I and II (GoldenQuadrilateral and North-South-East-West Corridorsrespectively) as well as NHDP III and NHDP IV (inter-district roads and conversion of single to double lanesrespectively); specific targets for NHDP V (conversionof GQ to 6-lane roads); completing 1,000 kms of accesscontrolled roads; port and rail connectivity and expansionof the National Highway network.
6.24 Financial Performance
6.24.1 An outlay of Rs. 3,95,598 crore (Rs.1,42,769from GBS; Rs. 64,834 crore from IEBR; and Rs.1,87,995 crore from private sector investment has beenrecommend for the development of roads in the centralsector during the Twelfth Plan. The central road sectorhas made an investment of Rs. 2.32 lakh crore up to theend of the 4th year of plan which includes Rs. 1.03 lakhcrore from GBS, Rs. 0.37 lakh crore from IEBR andRs. 0.92 lakh crore from the private sector. In 2016-17,there has been a substantial increase in the allocation atrend which started in 2015-16. The investment targetfor 2016-17 stands at Rs. 1.32 lakh crore with GBS ofRs. 46,833 crore; IEBR of Rs. 59,279 crore and privatesector investment of Rs. 26,850 crore. If the 2016-17forecast of investment takes place, the total investmentin the central road sector would be Rs. 3.64 lakh crorewhich is 92 per cent of the Twelfth Plan investmenttarget for the sector. One of the reasons for this increaseis the enhancement in the accruals to the Central Road
Fund (CRF) from cess on petrol and high-speed dieselfrom Rs. 2 per litre to Rs. 6 per litre.
6.25 Physical Performance
6.25.1 The length awarded has been 1,916 kms, 3,169kms, 7,972 kms, and 10,098 kms in 2012-13, 2013-14,2014-15 and 2015-16 respectively, showing that initiallyit had been low because of lack of interest in Build-Operate-Transfer (BOT) projects due to a variety offactors which will be elaborated later. The lengthawarded has shown improvement in 2013-14, 2014-15and 2015-16 due to more projects being awarded on anEngineering-Procurement-Construction (EPC) basis.The new strategy by MoRTH and NHAI is to awardmore EPC contracts and on their completion, turn theminto operate maintain transfer (OMT) projects. Tillmarket sentiments recover, this could be a viablestrategy. Road construction has been 5,732 kms in 2012-13; 4,260 kms in 2013-14, and 4,410 kms in 2014-15and 6,061 kms in 2015-16. This needs to be steppedup. The two-laning; four-laning and six-laning targetsfor the Plan period are 14,800 kms, 9,826 kms and 5,590kms (a total of 30,216 kms) against which theachievement in the first 4 years has been 11,842 kms,4,218 kms, and 1,465 kms respectively or a total of17,525 kms, about 58 per cent of the target.
6.25.2 Around 17,000 kms National Highways out of atotal length of 76,818 kms were of less than two-lanestandards at the inception of the Twelfth Plan. At thebeginning of the Twelfth Plan, the targeted NH length atthe end of the Plan was around 80,000 kms but this isset to change as is explained subsequently. One of theimportant goals of the Plan is the dual laning of NHstretches which are single-lane. However, MoRTHnotified additional length of roads as NH which increasedthe notified NH length to around 1,01,010 kms by theend of the fourth year of the Plan and is further expectedto go up to nearly 2 lakh kms by end of the plan. As on31.03.2016, the lane-wise distribution of NHs is: singleor intermediate lane 20,700 kms; dual lane 55,603 kms;four or more lanes 24,707 kms. It was proposed todevelop about 30,000 kms of NH length to variousstandards of 2/ 4/ 6 lane during Twelfth Plan, of which
168 APPRAISAL DOCUMENT OF TWELFTH FIVE YEAR PLAN
around 17,525 kms has been developed by the end ofthe fourth year. The policy of incorporating more andmore roads as National Highways as being targetedpresently will lead to a higher proportion of the NH assingle lane. It is expected that this number will increaseto 60,000 kms if the overall NH length is increased sincemost of the new NHs would be in single lane category.
6.26 Non-NHDP National Highways
6.26.1 There are about 21,224 kms of NHs, that arenot approved under various phases of NHDP, SARDP-NE, etc. These highways have various deficiencies suchas inadequate capacity, insufficient pavement thickness,etc. Development of these roads is proposed to be takenup through domestic budgetary resources and multilateralfunding, but so far progress has been slow.
6.27 Special Road Development Programmes
6.27.1 The Special Accelerated Road DevelopmentProgramme in the North East (SARDPNE) is animportant programme for road augmentation in the NorthEast. In Phase A, 4,099 kms of roads have to bedeveloped (3,014 kms NHs and 1,085 kms state roads).Additionally, the Arunachal Package has to beimplemented, which aims to construct 2,319 kms ofroad length including the Trans Arunachal Highway. Outof the aforesaid combined length of 6,418 kms of roadunder these programmes, 4,852 kms (75 per cent) ofthe work has been sanctioned and 1,987 kms constructedas of March, 2016. It is expected that Phase A would becompleted by March, 2017 and Arunachal Package byMarch, 2018 although this requires a much higher rate ofcompletion than what has been achieved. After acomprehensive review of the progress of these projects in2013, it was decided to increase the execution capacity bysetting up more Project Implementation Units (PIUs). TheMinistry has also set up a company, National HighwayInfrastructure Development Corporation Limited(NHIDCL) for construction of projects in the North EastRegion and other Himalayan states which will bringfocused attention. Road stretches from state PWDs,NHAI and MoRTH would be handed over to thiscorporation for faster execution. Special Programme for
Development of Roads in the Left Wing Extremism (LWE)affected areas is another important scheme. TheProgramme covers 33 districts in eight states namelyAndhra Pradesh, Bihar, Chhattisgarh, Jharkhand, MadhyaPradesh, Maharashtra, Odisha and Uttar Pradesh. Thisinvolves a development of about 1,177 kms of NHs and4,276 kms of State Roads in Left Wing Extremism (LWE)affected areas as a Special Project with an estimated costof about Rs. 7,300 crore. As on 31st March, 2016, thedetailed estimates for 5,469 kms length have beensanctioned at an estimated cost of Rs. 8,585 crore, outof which, works on 5,275 kms length costing Rs.7,861crore have been awarded. Development in 3,972 kmslength including 266 kms NHs has been completed up toMarch, 2016 and cumulative expenditure incurred so faris Rs. 5,667 crore. Out of 1,622 kms long LWE affectedVijayawada - Ranchi route, development of 594 kms ofState Roads in Odisha (549 kms Newly declared NH and45 kms SH), not covered in any Central or State Schemehas been approved by the Government at a cost of Rs.1,200 crore during the Eleventh Plan period. So fardevelopment of 302 kms has been completed.
6.27.2 The road ministry has conceptualized a “Bharat-mala Pariyojana” for construction/development of (i) about7000 kms State roads along coastal areas/border areas,(ii) about 7000 kms State roads to facilitate connectivityto backward areas, religious & tourist places, (iii)Setubharatam which aims to renew around 1500 bridgesand more than 200 ROBs or RUBs (iv) Chardhamconnectivity and (v) District connectivity. Besides, it isalso proposed to include improvement/development ofroad connectivity to non-major ports handling “Exim”(Export/Import) Cargo.
6.28 Shortfall in Funds for Maintenance
6.28.1 One of the important concerns of the road sectoris lower priority accorded to maintenance, which leadsto resources on large stretches of NHs being spread toothin. It is consequently difficulty to maintain the NHnetwork in a traffic worthy condition, necessitatingpremature rehabilitation at a much higher level ofinvestment. Funds provided to MoRTH for maintenanceagainst requirements in the first 4 years of the Twelfth
169PHYSICAL INFRASTRUCTURE
Plan show that deficit in financing of maintenanceactivities is almost of the order of 50 per cent.
6.29 Major policy initiatives undertaken byMoRTH during last two years to improveaward of projects
6.29.1 MoRTH was empowered through a Cabinetdecision to decide on mode of delivery of projects –PPP/EPC. It was authorized to appraise projects up toRs. 1000 crores – both for PPP and EPC mode in placeof earlier Rs. 500 crores. In order to enhance inter-ministerial coordination an Infrastructure Group hasbeen created under in the road ministry headed by theminister to resolve multi-stakeholder issues. Processeshave been streamlined like online approval of GeneralArrangement Drawings (GADs) for ROBs/RUBs. Forestand Environmental Clearances have been de-linked. Stage-IForest Clearance is now considered as deemed approvalfor cutting of trees. Segregation of Civil Cost fromCapital Cost for NH projects for appraisal & approvalhas been approved recently by the CCEA to speed upappraisal and approval process leading to faster projectaward.
6.30 Rural Roads
6.30.1 Rural roads are being improved under the flagshipprogramme of PMGSY. An additional component calledPMGSY-II has been launched to consolidate the existingrural road network through up-gradation. The TwelfthPlan allocation for PMGSY is Rs. 1,05,000 crore, outof which in the first four years, Rs. 75,000 crore havebeen allocated.
6.30.2 Funding pattern has been recently changed from100 per cent central funding to 60:40. During the firstfour years of the plan, 31,912 habitations have beenconnected and 1, 22,260 kms roads constructed. On acumulative basis, 1, 16,310 habitations, which is 65 percent of the total eligible habitations (1,78,184 as of 2000),have been connected. The target of completion ofPMGSY has been advanced from 2022 to 2019 forconnecting 61,874 remaining habitations.
PORTS
6.31 Investment in the Twelfth Plan
6.31.1 The outlay for the ports and shipping sector inthe Twelfth Plan includes Rs. 6,960 crore as GBS andRs. 21,990 crore as Internal and Extra BudgetaryResources (IEBR). In addition, the private sector wasexpected to invest nearly Rs. 1,70,000 crore in the portsector. In the first four years of the Plan, the investmentfrom GBS and IEBR was Rs. 14,375.07 crore, which is50 per cent of the total outlay from GBS and IEBR. ThePlan outlay of the Ministry of Shipping is Rs. 4,183.14crore for the year 2016-17 comprising of Rs.1,000 croreas GBS and Rs. 3,183.14 crore as IEBR. Most of theIEBR comes from the internal resources of the portsand is spent on capacity creation, mechanization anddredging projects in the ports. In the first four years ofthe Plan, the private investment in the major ports sectorhas been Rs. 40,703 crore.
6.32 Capacity augmentation
6.32.1 In the first four years of the Twelfth Plan, in themajor port sector, 118 projects for additional portcapacity, capital dredging, mechanization andconnectivity were approved or awarded with a totalinvestment of Rs. 53,345 crore. This is a majorachievement considering that in the entire Eleventh Plan,only 27 projects were awarded. Some of the majorinvestments cleared during the period were the fourthcontainer terminal at Jawaharlal Nehru Port Trust at acost of around Rs. 8,000 crore, and LNG terminalat Ennore at a cost of around Rs. 5,000 crore and manyother smaller projects. Of the total of 118 projectsawarded in the Plan period so far 46 are PPP projects,63 are ‘own’ projects of the ports and the remaining 9projects are captive projects awarded to PSUs andothers. In 2016-17, 33 number of projects are to beawarded leading to a capacity creation of 102 MTPA.
6.32.2 Physical capacity addition in the major port sectorduring the Twelfth Plan period is as follows: 58 MTPAwas added in 2012-13, 56 MTPA in 2013-14, 71 MTPAin 2014-15, 94 MTPA in 2015-16 and a further 100
170 APPRAISAL DOCUMENT OF TWELFTH FIVE YEAR PLAN
MTPA is likely to be added during 2016-17. As a resultthe, total capacity of Major Ports by the end of March,2016 was 965 MTPA and with the additional 100 MTPAtargeted in 2016-17, the capacity of the major ports atthe end of the Twelfth Plan is expected to be 1065MTPA which is lower than the Twelfth Plan target of1,229.24 MTPA by the terminal year but sufficient tocater to the demand of the exim cargo at the presentlevels. Six potential new port locations have beenidentified under Sagarmala Programme namely Vadhavan(Maharashtra), Sagar island (West Bengal), ParadipOuter Harbour (Odisha), Enayam (Tamil Nadu) andBelekeri (Karnataka).
6.33 Traffic Handled
6.33.1 The Twelfth Plan target for traffic carried bymajor ports is 943.06 MTs in the terminal year of thePlan. The traffic handled by major ports in 2012-13,2013-14, 2014-15 and 2015-16 was 545.79 MTs,555.50 MTs, 581.34 MTs and 606.47 MTs respectivelyregistering an average growth of 3.58 per cent perannum. The major deficit is in iron ore due to bans onits export in some major iron ore producing states. Theimport of coal which had been going up initially hascome down in the last year due to improved availabilityof indigenous production.
6.34 Dredging
6.34.1 A minimum draft availability of 14 metres in MajorPorts has been targeted during the Twelfth Plan period.Plans to undertake capital dredging work to enhancethe draft availability at channels and berths have beenformulated by each major port. Presently, channels atParadeep, the outer harbour of Visakhapatnam, Chennai,Kamarajar, Cochin, New Mangalore, Mormugao andJawaharlal Nehru ports have a draft of 14 metres orabove. Project will be taken to increase the draft atMormugao port and Kamarajar (Ennore) port to 18 metresand at Jawaharlal Nehru port to 15 metres.
6.35 Efficiency Parameters
6.35.1 Efficiency parameters in the major port sectorhave shown an improvement in the first four years of
the Twelfth Plan. One of the factors responsible for thisis capacity creation and a focused attention tomechanization through a number of projects particularlyin the average vessel turnaround time which has comedown from 4 days in 2014-15 to 3.42 days in the currentyear 2016-17 (till January, 2017). This is targeted to befurther brought down to 3 days. Average output per berthincreased to 12,458 tonnes in 2014-15 to 14,478 tonnesduring 2016-17 (up to Jan’2017). There were however,significant variations in efficiency parameters acrossindividual ports. For instance, the average turnaroundtime varied from a low of 1.98 days in Cochin during2016-17 (upto Jan, 2017) to a high of 5.07 days inParadip. 70 of the 116 recommendations ofbenchmarking study to international standards alreadyimplemented and remaining will be implemented by 2019.This has resulted in further improvement of efficiencyand productivity of the ports.
6.36 Coastal Shipping and Inland WaterTransport (IWT)
6.36.1 Twelfth Plan has put great emphasis on thedevelopment of coastal shipping and inland watertransport. Steps being taken in this sub-sector are: Newscheme for construction of exclusive coastal berths topromote coastal shipping, wherein ports will be givenfinancial assistance up to 50 per cent of the project cost,faster clearance of coastal cargo through green channelat 8 Major Ports, two more ports expected to createthis facility by June, 2015. Cabotage has been relaxedfor specialised vessels such as Ro Ro, Ro-Pax, LNGProject carriers etc for 5 years. Major Ports haveincreased discount on port charges for Ro Ro vesselsfor 2 years. Bunker duty exemption has been providedfor transportation of coastal containers. In IWT, thegovernment has taken up “Jal Marg Vikas” Project onthe river Ganga between Allahabad and Haldia, coveringa distance of 1,620 km for implementation by the InlandWaterways Authority of India (IWAI), with the technicaladvice and financial support of the World Bank and atan estimated cost of Rs.5,369.18 crore. Completion ofthis project by June, 2020, would enable commercialnavigation by vessels of dead-weight tonnage of least1,500 between Haldia and Allahabad. Consultancy studies
171PHYSICAL INFRASTRUCTURE
for the project are under way. The National WaterwaysAct 2016, has been enforced w.e.f. 12.04.2016. Underthis Act, 106 inland waterways have been declared asNational Waterways in addition to the existing 5 NationalWaterways with a view to create necessaryinfrastructure for navigation.
6.37 Port-led Development (Sagarmala)
6.37.1 A comprehensive programme called Sagarmala hasbeen launched in 2015 by the government for promotingport-led development in India. Main components of theprogramme are port modernization & new portdevelopment, port connectivity enhancement, port-ledindustrialization and coastal community development. Aspart of the programme, the National Perspective Plan hasbeen finalized and more than 400 projects have beenidentified for implementation in coordination with relevantcentral ministries and state governments. Indian Port RailCorporation Limited has been set up to provide efficientlast-mile rail evacuation systems to Ports and SagarmalaDevelopment Company Limited was incorporated forproviding funding support to project SPVs and residualprojects under Sagarmala. For systematic development andcapacity creation Master Plans have been finalized for allthe 12 major ports and 142 port capacity expansion projectsat a total cost of Rs. 91,434 Cr have been identified forimplementation.Port-led development covering all theMaritime States and Union Territories have been proposedand their perspective plans have been prepared. Twentynine potential port-linked industrial clusters across threesectors, namely – Energy, Materials and DiscreteManufacturing, have been identified. In the context ofSagarmala, India could begin by creating one Shenzhen-style Coastal Employment Zone (CEZ) on its western coastand another on the eastern coast near deep ports capableof accommodating very large and heavily loaded ships. Tobe successful, these zones would have to cover a largearea (Shenzhen covers an area of 2050 square kilometres)and would need to have some level of existing infrastructureand economic activity.Coastal community developmentprojects mainly in skilling and fishery sector are also beingfunded under Sagarmala in convergence mode with otherCentral Ministries.
CIVIL AVIATION
6.38 Twelfth Plan Targets
6.38.1 The Twelfth Plan targets to make India amongstthe top five civil aviation countries of the world. Thiscan be achieved by providing safe, secure and affordableair services and by developing world class infrastructure.It was expected that by the terminal year of the Plan, thenumber of domestic passengers would increase at anaverage annual growth rate of 12 per cent to reach 209million, and international passengers to 60 million at anannual average growth of 8 per cent, from 106 millionand 38 million respectively in 2011. Domestic cargowould increase to 1.7 MTPA from 0.9 MTPA andinternational cargo to 2.7 MTPA from 1.5 MTPA by theterminal year of the Plan. In addition to capacity creation,the Plan also envisaged to the improvement of airconnectivity to north-east region, other remote areas andtourist destinations to generate employment; to providebetter infrastructure for training in order to make availablequalified human resources: and to strengthen theregulatory framework for safety and economic aspectsby setting up a Civil Aviation Authority.
6.39 Investments
6.39.1 The Twelfth Plan’s aim is to enhance capacitycreation in airports with a combination of private andpublic sector participation. Development of airports inremote and difficult areas and regions, which requiresspecial consideration from a socio-economic andconnectivity point of view, would be undertaken by theAirports Authority of India (AAI) while private investmentwould flow into airports at other locations. The approvedoutlay for Ministry of Civil Aviation (MoCA) in thetwelfth Plan is Rs. 33,198 crore which consists of Rs.16,983 crore as GBS and Rs. 16,215 crore as IEBR. Inthe first four years of the Plan, the Ministry hasanticipated an investment of Rs. 30370.06 crore whichis 91.5 per cent of the Plan outlay. This includesRs.21,707.95 crore of GBS which is 128 per cent ofthe total Planned GBS outlay, and Rs 8,633.97 crore ofIEBR which is 53 per cent of the total planned IEBR. Forthe terminal year of the plan an amount of Rs. 4417
172 APPRAISAL DOCUMENT OF TWELFTH FIVE YEAR PLAN
crore has been provided of which GBS is Rs. 2000 crore.The most important component of the Twelfth Planthrough GBS is the provision for Turn Around Plan(TAP) and Financial Restructuring Plan (FRP) of AirIndia, for which a provision of Rs. 15,096 crore (89per cent) was made out of the total GBS of Rs.16,983crore for the Ministry. Accordingly, in the first four years,out of the total GBS utilization of Rs. 21,707.95 crore,the largest share of Rs. 21,080 crore (97 %) is accountedfor by Air India. For the fifth year of the plan an amountof Rs. 1713 crore is earmarked for Air India out of thetotal GBS provision of Rs. 2,000 crore for the Ministry.
6.40 Policy Initiatives
6.40.1 The Ministry of Civil Aviation has drafted theNational Civil Aviation Policy 2016 (NCAP – 2016) whichaims to move India from the present 10th to the 3rd
position globally in the aviation sector. The policy aimsto create an eco-system to enable 300 million domesticpassengers by 2022 and 500 million by 2027 along withincrease in cargo volumes to 10 million tonnes by 2027and international ticketing to increase to 200 million by2027 with provisions of safe, secure, affordable andsustainable air travel with access to various parts ofIndia and the world. This is to be achieved through useof technology, effective monitoring, and by enhancingregional connectivity through fiscal support andinfrastructure development. The policy has covered allthe major themes in the Indian aviation sector such asregional connectivity, safety, air transport operations,international operations, development of airports, securityand sustainability of aviation. NCAP 2016 is in the processof approval by the government. To meet the ever growingrequirement of professionally qualified personnel and alsoto create a strong base with a pool of scientific andtechnical manpower in the sector. Ministry is in theprocess of setting up of a National Aviation Universityat the IGRUA Complex, in Fursatganj, U.P.
6.41 Connectivity
6.41.1 The AAI completed development of KadapahAirport, New Civil Air Terminal at Chandigarh, and thenew Integrated terminal building at Tirupati Airport. Themajor initiative taken by AAI during the 4th year of the
Plan include commissioning of the Greenfield KaziNazarul Islam Airport at Andal in West Bengal. In additionproject proposals for setting up of Greenfield airports atvarious sites namely, Dholera in Gujarat, Bhiwadi(Alwar) in Rajasthan, Bhgapuram, Dagadarthi andOvarakallu in Andhra Pradesh, Mopa in Goa, NaviMumbai, Shirdi and Shindudurg in Maharastra, Shimoga,Hassan and Bijapur in Karnataka, Kannur in Kerala,Pakyong in Sikkim, Holongi (Itanagar) in ArunchalPradesh, Datia in Madhya Pradesh, Kushinagar in UttarPradesh, and Karaikal in Puducheri are at various stagesof planning and execution. In order to promote regionaland remote area air connectivity, it has been decided todevelop airports in Tier-II and Tier-III cities. The fivelocations where work is under progress are: Hubli andBelgaum in Karnataka; Kishangarh in Rajasthan;Jharsuguda in Odisha and Tezu in Arunachal Pradesh.AAI has envisaged an investment of Rs 13,177 croreduring a period of 5 years. There are about 160 non-functional airports and air strips with State Governmentswhich can be revived at an indicative cost of Rs 50crore to Rs 100 crore each. The AAI in partnership withthe State Governments would develop some of theseairports under the regional connectivity programme.
6.42 Passenger and Sectoral Growth
6.42.1 Passenger growth has been strong in the firstfour years of the Twelfth Plan. The figures for 2012-13, 2013-14, 2014-15 and 2015-16 are 159.40 million;168.92 million, 190.13 million and 224 million. Overall,growth has been 9.6 per cent per annum with domesticpassengers increasing from 116.37 million in 2012-13to 139.33 million in 2014-15 (11.5per cent per annum)and international from 43.03 million to 50.80 million inthe same period registering a growth of 9 per cent perannum. Low-cost carriers (LCC), modern airports,Foreign Direct Investments (FDI) in domestic airlines,cutting edge information technology (IT) interventionsand a growing emphasis on regional connectivity havehelped growth in the aviation industry. With per-capitause of air transport in India amongst the lowest in theworld, the long-term growth scenario for the sector isvery high.
173PHYSICAL INFRASTRUCTURE
6.43 Air India
6.43.1 The financial performance of Air India Ltd. is amatter of serious policy concern since in the TwelfthPlan, Rs. 15,096 crore has been earmarked for Air Indiaout of the total GBS of Rs. 16,983 crore. The initialimpact on the airline indicates significant improvement,as it has reduced operating losses to Rs. 2,636.19 crorein 2014-15 compared to Rs 3,807.15 crore in 2012-13and has made an operational profit of Rs 105 crore in2015-16. This happened mainly due to an increase inload factor and reduction in crude oil prices. A numberof in-house measures taken by AI have helped in theprocess. But despite its superior performance in the lasttwo years, Air India’s long-term prospects are stillcritical since intensification of competition and fluctuationin oil prices are constant threats to financial sustainability.
6.44 PPP in the Transport Sector
6.44.1 The road sector, a leading sector in India’s private-public partnership (PPP) programme, has beenwitnessing a significant slowdown in the Twelfth Planperiod. Bidders’ response has been poor for projectsbid on PPP mode, and thus most of the projects in 2014-15 and 2015-16 have been awarded on the engineeringprocurement construction (EPC) mode. The main causesfor slowdown are: aggressive bidding in the earlierrounds, possibly because the pre-qualification criteriamade a large number of applicants eligible for pre-qualification; issues relating to land acquisition and grantof environmental and forest clearances; lack of a promptdispute resolution mechanism leading to disputes worthover Rs. 21,000 crore, over 870 arbitration cases; andover-leveraged balance sheets. This has led to a situationwhere it has become very difficult for these developersto arrange project equity for new projects. The problemhas been further compounded due to the recentdownward trend in the traffic revenues, thereby makingseveral of the projects financially unviable on the DesignBuild Finance Operate Transfer (DBFOT) model.However, in the last two years, the Ministry of RoadTransport and Highways (MoRTH) has come out witha number of strategies to alleviate the situation elaboratedin the following para.
6.44.2 The CCEA has allowed private developers totake out their entire equity and exit all operational BOTprojects two years from start of operations irrespectiveof the date of award of the project. This is facilitatinginfusion of liquidity in the sector by enabling existingdevelopers to release their locked-in equity in completedprojects. The CCEA has allowed revival of BOT projectswhich are languishing in the construction stage throughone-time fund infusion by NHAI, subject to adequatedue diligence of such projects on case to case basisthrough an institutional mechanism. This policy wouldhelp physical completion of languishing projects bringingrelief to highway users in the area. Amendments to theModel Concession Agreement (MCA) for BOT projectshave been approved by an empowered Committee ofSecretaries (CoS) headed by the Cabinet Secretary in ameeting held in August, 2015 based on stakeholdersfeedback. This would facilitate streamlined developmentand operation of highway projects. The CCEA recentlyapproved this which would add to the comfort level ofprospective project concessionaires. The policy enablesextension of concession period for all languishing BOT(Toll) projects to the extent of delay not attributable tothe concessionaire provided, the originally envisagedoperation period remains unchanged. Similarly, forlanguishing BOT (Annuity) projects payment of missedannuities corresponding to the actual period of delaynot attributable to the concessionaire shall be restored.
6.44.3 In the port sector, while there is still an appetitefor PPP projects and their award and executioncontinues, there are issues related to tariff-setting. Tariffsfor the Major Ports are regulated by the Tariff Authorityfor Major Ports (TAMP) thus distorting competition withnon-major Ports which are free to set their tariffs basedon competition. The role of TAMP is being redefined inthe new Major Ports Authority Bill, 2016 which has beenintroduced in the Lok Sabha on 16.12.2016.
6.44.4 In the airport sector, after PPP investments inHyderabad, Bengaluru, Mumbai and Delhi airports. Thenext big PPP project in airport sector is Navi Mumbai,which is being developed by the Government ofMaharashtra. This project is under the bidding stage andit is expected to be completed by December, 2019.
174 APPRAISAL DOCUMENT OF TWELFTH FIVE YEAR PLAN
Another relatively large PPP investment in the airportsector is at Mopa in Goa which is at advanced projectpreparation stage and likely to be completed byDecember, 2019.
6.44.5 Alternative models, like the hybrid annuity modelin the road sector which was approved recently, needs tobe used in more projects. Under this model, 40 per centthe Project Cost is to be provided by the government as‘construction support’ to the private developer duringthe construction period and the balance 60 per cent asannuity payments over the concession period along withinterest at market linked rates on outstanding amount tothe concessionaire. There is separate provision for O&Mpayments by the government to the concessionaire.Fifteen projects have already been awarded under themodel.
6.44.6 There is an absolute dearth of concessionaire-led PPP projects in the Railways sector although therehave been a number of joint ventures with stategovernments and customers for development ofinfrastructure. Private investment has come intoMadhepura and Marhowra factories for electric anddiesel locomotives through JVs with leading internationallocomotive manufacturing companies. These projectswould improve technology in the area of locomotivesand through indigenous production are examples of“Make in India”.
6.45 Private Investment in Infrastructure
6.45.1 As brought out in section 6.2 above, there hasbeen a significant downward trend in the infrastructureinvestment during the first three years of the TwelfthPlan. This has been largely due to a sharp decline in theprivate sector investment. The key issues impacting theslowdown in private investment are related to stalling ofprojects, infrastructure financing and contractualframeworks for PPPs. These are discussed in thefollowing sections.
6.46 Stalled Projects
6.46.1 The Economic Survey 2014-15 points that thestalling of projects is severely affecting balance sheetsof the corporate sector and public sector banks, which
in turn is constraining future private investment. Thiscompletes a vicious circle, characterized by aninvestment slowdown leading to less financing back toweak investment. Public-sector stalled projects aremostly in infrastructure whereas private-sector stalledprojects are mostly in manufacturing and infrastructure.The survey further mentions that private projects areheld up mostly due to market conditions and non-regulatory factors, whereas the Government projectsare stalled due to the lack of required clearances.
6.46.2 One sector which has a large number of stalledprojects in both public and private sector is the electricitysector. At the end of the third quarter of 2014-15, 80projects were stalled in the electricity sector, out of which75 are in generation and 5 in distribution; 54 of these 80projects are PPP projects. The major reasons for stallingof electricity projects along with suggested remedialmeasures are discussed below.
6.46.3 The framework for power procurement throughcompetitive bidding notified in 2005 permitted biddersto assume long-term fuel cost and foreign exchange raterisk. Several power producers won the bids throughlow quotes on the escalable portions of the bidparameters. But later, with a rise in international coalprices and a fall in the rupee, these bids have becomeunviable. Revised bid documents for addressing theseissues have been issued in 2013. Adoption of theserevised documents will help in reviving the stalledprojects in the sector.
6.46.4 Commissioned electricity generation projectshave been stranded due to short supply of coal and gas.This has affected the returns to the developers andrepayment of bank debt. There is a need to augmentcoal mining capacity by introducing PPP in coal mining.The Ministry of Coal, with extensive inter-ministerialconsultations, has prepared an MCA for enabling PPP incoal mining. Under this model, the coal mine as well asthe coal will remain in the ownership of the public sector,while the private partner will receive a mining charge onthe coal mined. The sale of such coal will be undertakenby the public entity which grants the PPP concession.The coal companies need to award PPP projects usingthe above framework for augmenting the domestic coalproduction.
175PHYSICAL INFRASTRUCTURE
6.47 Infrastructure Financing
6.47.1 Constraints in the financing of infrastructure arecrucial for the shortfall in private investment acrosssectors. The key issues in infrastructure financing andsome recent initiatives to revive investment flow arebrought out in Box 6.6 below.
Box 6.6: The Financing of Infrastructure
Issues impacting the financing of project
1. Increase in Non-Performing Assets (NPAs) of banks.
2. Shrinkage of equity & debt flows in PPP projectsdue to stranded and stressed projects.
3. Lack of long-term finance.
Recent Initiatives
The following initiatives have recently been taken orannounced, and are expected to augment investment ininfrastructure:
(a) The 2015-16 Union Budget announced the settingup of a National Investment and Infrastructure Fund(NIIF) with an annual flow of Rs. 20,000 crore fromthe government. This will enable the Trust to raisedebt, which in turn, could be invested as equity ininfrastructure finance companies. The infrastructurefinance companies can then leverage this extraequity to raise more debt for funding infrastructureprojects.
(b) The Government has approved easing theguidelines for IIFCL allowing it to be the ‘lead bank’and primary lender, if required. The Scheme forFinancing Viable Infrastructure Projects (SIFTI)which governs IIFCL has been amended in thisregard. The change in norms will provide moreautonomy to IIFCL to increase its potential tofinance PPP projects.
(c) The High Level Committee on FinancingInfrastructure in its Report submitted in August,2014 has given several recommendations with regardto financing of infrastructure. These recommendationsneed to be taken forward by the Department ofFinancial Services in consultation with the ReserveBank of India in a time bound manner.
6.48 Reforming PPP Contracts and Laws
6.48.1 The standardized documents, especially the ModelConcession Agreements (MCAs), have helped in theexpansion of PPPs in the country. More than 200 PPPprojects in the roads and ports sectors have been awardedsince 2006 based on these MCAs. The MCAs haveaddressed the vital issue of assigning both constructionand maintenance responsibilities to one entity. Since inmany projects, especially in the highway sector,maintenance costs depend significantly on constructionquality, a single entity being responsible for bothconstruction and maintenance, helps in reducing thelifecycle costs and restraints the entity to cut cornersduring construction to increase profits. It is, therefore,suggested that maintenance should be made a part of allpublicly funded construction contracts awarded in theinfrastructure sectors.
6.48.2 However, in recent times, concerns have beenraised regarding the rigidity of the MCAs and a need tointroduce flexibility to address unforeseen situations inthe future. The Economic Survey 2014-15 identified thefollowing issues in the existing PPP contracts: (i) existingcontracts focus more on fiscal benefits than on efficientservice provision; (ii) it neglects principles of allocatingrisk to the entity best able to manage it; (iii) there are noex-ante structures for renegotiation; and (iv) contractsare over-dependent on market wisdom. The surveysuggests that to revive private interest and bank lendingin the infrastructure sector, PPP contracts need to berestructured, with the burden shared among differentstakeholders. The government constituted a Committeeunder the chairmanship of Dr. Vijay Kelkar to revisit andrevitalize the PPP model of infrastructure development.The Committee has since submitted its Report, which isunder the consideration of the Government.
6.48.3 As announced in the 2014-15 Union Budget,the Government is also in the process of setting up anew entity, 3P India, with a corpus of Rs. 500 crore toprovide support to mainstreaming PPPs and to enablefocused attention on accelerating the delivery ofefficient PPPs. The task for restructuring of the PPPcontracts could be entrusted to this specialized body.
6.48.4 The following legislative reforms have also beenproposed in Union Budget 2015-16 to accelerate the flowof investment in infrastructure sectors:
176 APPRAISAL DOCUMENT OF TWELFTH FIVE YEAR PLAN
(i) Introduction of Public Contracts(Resolution of Disputes) Bill
(ii) Introduction of Regulatory Reform Law
6.49 Infrastructure: The Way Forward
6.49.1 Robust physical infrastructure is paramount forrealizing the Twelfth Plan objectives of faster, moreinclusive and sustainable growth. With the achievementsduring the first three years of the Plan period and keepingin view the allocation of funds and unfinished tasks, thefollowing way forward for the remaining period of thePlan period is suggested.
i) The difference in average cost of supply andaverage tariff realized by the power discomshas reached about Rs. 1.25/unit (withoutsubsidy). It has been seen that the tariffwhich is awarded by the regulatorycommissions does not cover the full costof supply and it is felt that the regulatorycommissions are not really functioning inan independent manner. Despite the factthat the full cost of supply is not beingawarded by the regulatory commissions,they are not approaching APTEL for relief.This apparently is happening because at timesthe State Governments take into accountpolitical considerations. The discoms needto strictly adhere to APTEL’s directive thatin case no tariff petition is filed by thediscoms, their tariff may be decided by theregulatory commission suo-moto.
ii) Given the average load curve of the country,it is stated that the thermal and hydrocapacities should be maintained in the ratioof 60:40. Over time, the share of hydro hasbeen falling consistently, and today onlyabout 15 per cent of the capacity is fromhydro based generation. Lack of hydrogeneration means that country is not able tomeet our peak load demand in an efficientmanner. There are various reasons whyhydro generation has been coming downand some of the major ones includegeological surprises, law and orderproblems, problems in relief andrehabilitation of oustees, civil societymovement against the construction of large
dams, lack of infrastructure for transportingturbines and generators in the north-easternregion and also lack of availability of longterm finance for the hydro sector.
iii) The Southern region was connected to thenational grid some time ago. However, ithas been seen that there is still considerablecongestion leading to higher spot prices ofelectricity in the southern region of thecountry. At present, the southern region isconnected to the national grid by the Raichur– Sholapur line and there are two more linesunder construction viz. the Narendra –Kolhapur and Wardha – Hyderabad doublecircuit lines. These lines would enable anadditional evacuation of power to the extentof 1,900 MW. Over and above these twolines, there are some arterial lines which areunder construction and which have been heldup due to right-away issues. This needs tobe expedited quickly so that the currentcongestion can be removed.
iv) The Ministry of Coal has drawn an actionplan to scale up Coal India Limited’sproduction from the current level of about494 MT to 1 billion tonnes by 2019-20. Thisneeds to be monitored regularly.
v) The Ministry of Coal also needs to work onthe Output per Man Shift (OMS) fromunderground mines which is extremely lowfor India as compared to other countrieswhich is on account of many factors whichinclude lack of mechanization, the highaverage age of Indian coal workers etc.
vi) Creation of vibrant gas market for increasingshare of gas from current level of 6.57% to15% in future.
vii) Expansion of Natural Gas infrastructure toEastern part of country.
viii) Free pricing regime for Domestic gasproduction.
ix) Expansion of renewable energy capacity to175 GW by 2022.
x) Setting up of 1,000 MW solar plants as ultra-mega solar projects.
177PHYSICAL INFRASTRUCTURE
xi) Resolving the issue of capital grants versusgeneration base in renewable capacitycreation
xii) To address the question of domestic contentversus imported content in the solar sector.
xiii) Scope of auction based bids for derivingproject costs in the solar sector.
xiv) Developing efficient renewable fundingmechanisms keeping in view high interestand hedging costs
xv) Fast tracking of the Electronic Delivery ofservices Bill and its adoption by all statesand UTs for service delivery.
xvi) To make available additional spectrum forbroadband and to facilitate spectrum sharingand trading
xvii) Expeditious implementation of restructuredNOFN- Bharat Net.
xviii) To accelerate speed of execution oftransport projects with focus on completionof on-going works. Higher allocations totransport sector requires increase inmomentum of fund utilization in prioritizedprojects, which will yield benefit to thesector through decongestion and capacityenhancement.
xix) Investment in Railways needs to be increasedfrom 0.4 per cent of GDP in Eleventh Planto 1.0 to 1.2 per cent of GDP on a sustainedbasis over the next couple of decades.Capacity augmentation and networkconnectivity should be based on acomprehensive network development plan,as has been accomplished for NHDP.
xx) An urgent action plan, for the two-laning ofNational and State Highways, with properfunding and time lines for completion isrequired for reasons of enhancing safety andenergy efficiency.
xxi) Rural roads programme would need to becontinued based on the district-level coreroad network plans of the StateGovernments in order to accomplishuniversal connectivity.
xxii) On regulatory front in the port sector, thereis a need to move major ports to the landlordport model and to transform the port truststo statutory landlord port authorities. InRailways, the Regulatory authority for tarifffixation and dispute resolution needs to beset up expeditiously.
xxiii) On the road safety front, the Road SafetyBill should be reviewed to separate aspectsrelated to Motor Vehicles Act so thatportions related to safety including settingup of NRSTMB are speeded up.
xxiv) Ship-building needs to be promoted througha multi-pronged approach and incentivizingindustry.
xxv) In the airport sector, quick moves are neededon building airports in Tier-II and Tier-IIIcities to enable penetration of airports in thehinterland.
xxvi) Policies for promoting regional connectivityand regional airlines have to be finalized asa priority so that the airports in remote andnewly developing areas are sought byairlines. Policies are needed to promote theIndian maintenance, repair and operations(MRO) industry and to review the hightaxation regime for aviation turbine fuel.
xxvii) A plan for the progressive divestment of thegovernment’s stake in Air India over a periodof three to five years needs to be considered.
xxviii) Urgent intervention is required to boost PPPregime in transport sector, especially in roadand rail segments.
xxix) In order to reduce negative externalities dueto transport sector especially, pollution andcarbon emission, there is a need to undertakeimprovement in vehicle and fuel emissionregimes and decision to move to BharatStageIV norms by 2020 has been taken whichneeds very strong coordination betweenmotor vehicles and petroleum industry
xxx) In the port and shipping sector in Sagarmalainitiative for port-led development and JalMarg Vikas for navigation in river Gangahas already been initiated and needs to beimplemented in time bound manner.
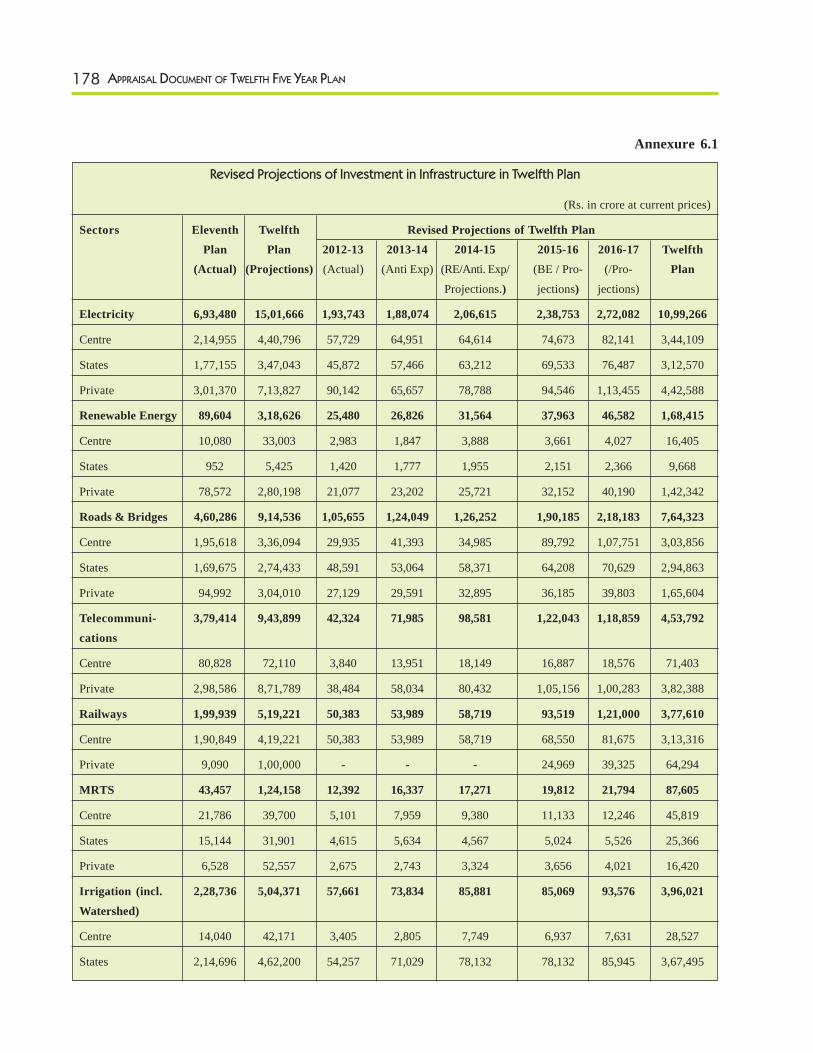
178 APPRAISAL DOCUMENT OF TWELFTH FIVE YEAR PLAN
Annexure 6.1
Revised Projections of Investment in Infrastructure in Twelfth Plan
(Rs. in crore at current prices)
Sectors Eleventh Twelfth Revised Projections of Twelfth PlanPlan Plan 2012-13 2013-14 2014-15 2015-16 2016-17 Twelfth
(Actual) (Projections) (Actual) (Anti Exp) (RE/Anti. Exp/ (BE / Pro- (/Pro- PlanProjections.) jections) jections)
Electricity 6,93,480 15,01,666 1,93,743 1,88,074 2,06,615 2,38,753 2,72,082 10,99,266
Centre 2,14,955 4,40,796 57,729 64,951 64,614 74,673 82,141 3,44,109
States 1,77,155 3,47,043 45,872 57,466 63,212 69,533 76,487 3,12,570
Private 3,01,370 7,13,827 90,142 65,657 78,788 94,546 1,13,455 4,42,588
Renewable Energy 89,604 3,18,626 25,480 26,826 31,564 37,963 46,582 1,68,415
Centre 10,080 33,003 2,983 1,847 3,888 3,661 4,027 16,405
States 952 5,425 1,420 1,777 1,955 2,151 2,366 9,668
Private 78,572 2,80,198 21,077 23,202 25,721 32,152 40,190 1,42,342
Roads & Bridges 4,60,286 9,14,536 1,05,655 1,24,049 1,26,252 1,90,185 2,18,183 7,64,323
Centre 1,95,618 3,36,094 29,935 41,393 34,985 89,792 1,07,751 3,03,856
States 1,69,675 2,74,433 48,591 53,064 58,371 64,208 70,629 2,94,863
Private 94,992 3,04,010 27,129 29,591 32,895 36,185 39,803 1,65,604
Telecommuni- 3,79,414 9,43,899 42,324 71,985 98,581 1,22,043 1,18,859 4,53,792cations
Centre 80,828 72,110 3,840 13,951 18,149 16,887 18,576 71,403
Private 2,98,586 8,71,789 38,484 58,034 80,432 1,05,156 1,00,283 3,82,388
Railways 1,99,939 5,19,221 50,383 53,989 58,719 93,519 1,21,000 3,77,610
Centre 1,90,849 4,19,221 50,383 53,989 58,719 68,550 81,675 3,13,316
Private 9,090 1,00,000 - - - 24,969 39,325 64,294
MRTS 43,457 1,24,158 12,392 16,337 17,271 19,812 21,794 87,605
Centre 21,786 39,700 5,101 7,959 9,380 11,133 12,246 45,819
States 15,144 31,901 4,615 5,634 4,567 5,024 5,526 25,366
Private 6,528 52,557 2,675 2,743 3,324 3,656 4,021 16,420
Irrigation (incl. 2,28,736 5,04,371 57,661 73,834 85,881 85,069 93,576 3,96,021Watershed)
Centre 14,040 42,171 3,405 2,805 7,749 6,937 7,631 28,527
States 2,14,696 4,62,200 54,257 71,029 78,132 78,132 85,945 3,67,495
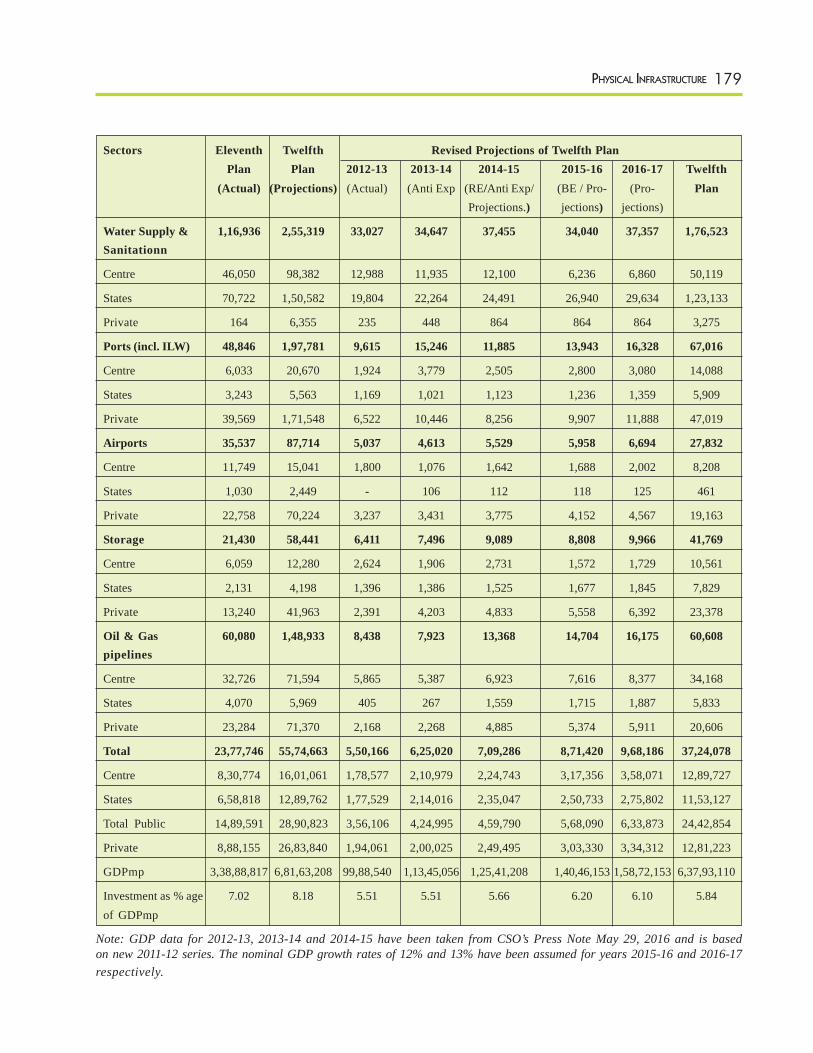
179PHYSICAL INFRASTRUCTURE
Sectors Eleventh Twelfth Revised Projections of Twelfth PlanPlan Plan 2012-13 2013-14 2014-15 2015-16 2016-17 Twelfth
(Actual) (Projections) (Actual) (Anti Exp (RE/Anti Exp/ (BE / Pro- (Pro- PlanProjections.) jections) jections)
Water Supply & 1,16,936 2,55,319 33,027 34,647 37,455 34,040 37,357 1,76,523Sanitationn
Centre 46,050 98,382 12,988 11,935 12,100 6,236 6,860 50,119
States 70,722 1,50,582 19,804 22,264 24,491 26,940 29,634 1,23,133
Private 164 6,355 235 448 864 864 864 3,275
Ports (incl. ILW) 48,846 1,97,781 9,615 15,246 11,885 13,943 16,328 67,016
Centre 6,033 20,670 1,924 3,779 2,505 2,800 3,080 14,088
States 3,243 5,563 1,169 1,021 1,123 1,236 1,359 5,909
Private 39,569 1,71,548 6,522 10,446 8,256 9,907 11,888 47,019
Airports 35,537 87,714 5,037 4,613 5,529 5,958 6,694 27,832
Centre 11,749 15,041 1,800 1,076 1,642 1,688 2,002 8,208
States 1,030 2,449 - 106 112 118 125 461
Private 22,758 70,224 3,237 3,431 3,775 4,152 4,567 19,163
Storage 21,430 58,441 6,411 7,496 9,089 8,808 9,966 41,769
Centre 6,059 12,280 2,624 1,906 2,731 1,572 1,729 10,561
States 2,131 4,198 1,396 1,386 1,525 1,677 1,845 7,829
Private 13,240 41,963 2,391 4,203 4,833 5,558 6,392 23,378
Oil & Gas 60,080 1,48,933 8,438 7,923 13,368 14,704 16,175 60,608pipelines
Centre 32,726 71,594 5,865 5,387 6,923 7,616 8,377 34,168
States 4,070 5,969 405 267 1,559 1,715 1,887 5,833
Private 23,284 71,370 2,168 2,268 4,885 5,374 5,911 20,606
Total 23,77,746 55,74,663 5,50,166 6,25,020 7,09,286 8,71,420 9,68,186 37,24,078
Centre 8,30,774 16,01,061 1,78,577 2,10,979 2,24,743 3,17,356 3,58,071 12,89,727
States 6,58,818 12,89,762 1,77,529 2,14,016 2,35,047 2,50,733 2,75,802 11,53,127
Total Public 14,89,591 28,90,823 3,56,106 4,24,995 4,59,790 5,68,090 6,33,873 24,42,854
Private 8,88,155 26,83,840 1,94,061 2,00,025 2,49,495 3,03,330 3,34,312 12,81,223
GDPmp 3,38,88,817 6,81,63,208 99,88,540 1,13,45,056 1,25,41,208 1,40,46,153 1,58,72,153 6,37,93,110
Investment as % age 7.02 8.18 5.51 5.51 5.66 6.20 6.10 5.84of GDPmp
Note: GDP data for 2012-13, 2013-14 and 2014-15 have been taken from CSO’s Press Note May 29, 2016 and is basedon new 2011-12 series. The nominal GDP growth rates of 12% and 13% have been assumed for years 2015-16 and 2016-17respectively.
180 APPRAISAL DOCUMENT OF TWELFTH FIVE YEAR PLAN
Data Sources and Assumptions
The data sources and assumptions underlying therevised Twelfth Plan investment projections are asfollows:
1. The Central investment figures for 2012-13(Actual), 2013-14 (Actual), 2014-15 (RE) and 2015-16(BE) were compiled from the Union Budgets 2013-14,2014-15, 2015-16. The States investment figures for2012-13 (Actual), and 2013-14 (RE) were taken fromrespective States’ Budget proposals. The Central, Statesand Private investment figures for 2012-13(Actual),2013-14 (Actual) and 2014-15 (RE) in respect of oiland gas pipelines including terminals and oil and gasstorage have been provided by the Ministry of Petroleum& Natural Gas. States and private investment data inrespect of metro rail projects (MRTS) for 2012-15 havebeen provided by Delhi, Jaipur, Chennai, Kochi,Hyderabad, Mumbai metro rail project authorities. Privateinvestment data in respect of roads & bridges for 2012-15 have been provided by NHAI and States of AndhraPradesh, Tamil Nadu, Haryana, Punjab, Rajasthan, UttarPradesh, Madhya Pradesh, Gujarat, Maharashtra,Chhattisgarh, Orissa and Karnataka. The privateinvestment for 2012-13 (Actual), 2013-14 (Actual) and2014-15 (R.E.) in airport sector were collected fromthe Ministry of Civil Aviation. Private investment datafor 2012-14 in electricity has been provided by theCentral Electricity Authority. The private investment data2012-15 in telecommunications has been provided bythe Telecom Regulatory Authority of India. The Ministryof New & Renewable Energy has provided privateinvestment data 2012-15 in the renewable energy sector.The private sector gross capital formation (GCF) instorage was provided by the Central Statistics Officefor 2012-13 and 2013-14 has been taken in storage.Further, private investment data in oil and gas storagefor 2012-13 and 2013-14 provided by Ministry ofPetroleum & Natural Gas has also been included inStorage. Private investment in non-major ports 2012-15 was provided by maritime states. The privateinvestment data 2012-15 in major ports was providedby the Ministry of Shipping.
Projections for Central Sector:
2. For making the revised projections for the Centralsector for 2016-17 a 10 % growth over 2015-16 (BE)has been assumed in electricity, renewable energy,MRTS, irrigation (including watershed), ports (includinginland waterways), water supply & sanitation, ports,airports and storage. Projected investment in roads &bridges for 2016-17 has been arrived at by assuming agrowth rate of 20 % over 2015-16 (BE) to reflect higherCentral investment anticipated in the sector. The Centralinvestment data in roads & bridges include investmentin Pradhan Mantri Gram Sadak Yojana (PMGSY). Foroil & gas pipelines, projections for 2015-16 and 2016-17 have been arrived at by assuming a 10 % annualgrowth over 2014-15 (R.E.) data.
Projections for State Sector
3. For making the revised projections for the Statessector during 2014-17 a 10 per cent growth over 2013-14 (RE) data has been assumed data in electricity,renewable energy, roads & bridges, irrigation (includingwatershed), water supply & sanitation, storage, ports(including inland waterways). For oil & gas pipelines,projections for 2015-16 and 2016-17 have been arrivedat by assuming a 10 per cent annual growth over 2014-15 (R.E.) data.
Projections for Private Sector
4. The projections for private investment (2014-17)in electricity, have been projected by applying 20 percent growth to the investment figure of 2013-14. Theprojections for 2015-17 in renewable energy have beenmade by applying 25 per cent annual growth on theinvestment figure of 2014-15 to reflect higher privateinvestment envisaged in the sector. The investmentprojections for 2015-17 in ports have been made byapplying 20 per cent growth on the investment figure of2014-15 to reflect higher private investment envisagedin the sector. The projections for private investment inthe airport sector for 2014-17 have been made byassuming a 5 per cent growth over 2013-14 data tocover inflation as no major growth is expected. In caseof roads & bridges, based on the past growth trend, a
181PHYSICAL INFRASTRUCTURE
modest 10 per cent growth over 2014-15 data has beenassumed to project investment during 2015-17, as mostof the projects now are being awarded with public funds.In Telecommunications sector, the private investmentdata for 2012-13 and 2013-14 is based on the dataprovided by Telecom Regulatory Authority of India(TRAI) for the Gross Block and Cumulative Works inProgress (CWIP) of licensed telecom private companiesand receipts from spectrum auction. Data for 2014-15,2015-16 and 2016-17 has been projected assuming agrowth rate of 20 per cent keeping in view past trendand increased business and expansion in telecominfrastructure to utilize newly allocated spectrum andthrust on “Digital India” programme. Investment inrailways for 2015-16 were provided by the Ministryof Railways and 20 per cent growth rate has been
assumed for making projection for 2016-17 keeping inview the low base of private investment and renewedthrust on PPPs in Railways. For making revisedprojections during 2015-17 for MRTS, a growth of 10per cent has been assumed over 2014-15 data. Due tonon-availability of private investment in water supply &sanitation, investment of Rs. 864 crore as in the reportof the High Level Committee on FinancingInfrastructure has been assumed during 2014-17. Theprojections for Central, States, and private investmentfor oil & gas pipelines for 2015-17 were arrived at byapplying 10 per cent growth over 2014-15 investmentdata which was provided by the Ministry of Petroleum& Natural Gas. The projections for private investmentin Storage for 2014-17 have been arrived at byassuming an annual growth rate of 15 per cent over2013-14 (actual) data.
182 APPRAISAL DOCUMENT OF TWELFTH FIVE YEAR PLAN
component relating to IT enablement of distributionnetwork for which CCEA has already approvedcost of Rs. 44,011 crore including a budgetarysupport of Rs. 22,727 crore. This outlay will becarried forward to the new scheme of IPDS. TheIPDS scheme has the following components:
a) Strengthening of sub-transmission anddistribution networks in the urban areas;
b) Metering of distribution transformers/feeders/consumers in the urban areas;
c) IT enablement of Distribution sector.
iii) The above components of the IPDS scheme willhave an estimated outlay of Rs. 32,612 croreincluding a budgetary support of Rs. 25,354 croreduring the entire implementation period. AllDiscoms including private sector Discoms andState Power Departments will be eligible forfinancial assistance under the scheme. In case ofprivate sector Discoms where the distribution ofpower supply in the urban areas is with them, theprojects under the scheme will be implementedthrough a State Government Agency and the assetsto be created under the scheme will be owned bythe State Government/State owned companies.These assets will be handed over to the concernedDiscom for their use during the license period onmutually agreed terms & conditions. Theresponsibility of operation and maintenance ofthese assets would be of the Discom concerned.As on 31.03.2015, IPDS schemes worth Rs 3,268crore have already been sanctioned for six States.
Annexure 6.2
Integrated Power Development Scheme
i) The issue of financial viability of Discoms hasbeen touched upon earlier in the chapter and theaggregate and technical (AT&C) losses are closelyrelated to it. AT&C loss levels continue to beunacceptably high and stands at nearly 24 per cent.The pace of reduction continues to be very lowdespite the huge quantum spent on the APDRPscheme between the years 2003 to 2008. Thescheme was restructured thereafter in 2008wherein it was divided into two parts. Part A ofthe scheme is related to assessing the correct losslevels through IT intervention whereas Part Bmakes the actual investments. Projects worth Rs.39,244 crore (Part-A: Rs. 7,028 crore covering1412 towns and 72 SCADA projects; Part-B: Rs.32,216 crore covering 1259 towns) are underimplementation. As on 31st March, 2015, 19 outof 21 Data Centres have been commissioned. 861towns have been declared “Go Live” under Part Aof the programme. Part B of the projects havebeen commissioned in 221 towns. Actual reductionin loss levels would be visible as more and morePart B projects are completed. However, it mustbe understood that reduction in AT&C losses isprimarily a managerial function and investmentscan at best act as a supplement.
ii) The Government of India has launched anIntegrated Power Development Scheme (IPDS).Under IPDS, R-APDRP (as approved by CCEAfor continuation in Twelfth and Thirteenth Plans)has been subsumed alongwith a separate
183PHYSICAL INFRASTRUCTURE
Deendayal Upadhyaya Gram Jyoti Yojana
1. The pace of rural electrification continues to be asource of concern and as on 31st March, 2012,electrification works in 104,496 un-electrified villages,intensive electrification in 248,553 partially electrifiedvillages has been completed and free electricityconnections to 194.25 lakh BPL households have beenreleased under Rajiv Gandhi Grameen Vidyutikaran Yojana(RGGVY) which started in April, 2005. By the end of31st March, 2015, out of the total 5,97,464 villages inIndia (Census, 2011), 5,79,012 villages (97 per cent)have been electrified.
2. During 2013-14, CCEA has approved continuationof RGGVY in the Twelfth and Thirteenth Plans whereinthe task is to complete spill over works of projectsanctioned in Tenth and Eleventh Plans and to cover theremaining villages, habitations (with population 100 &above) and BPL households. The physical targets forTwelfth/ Thirteenth Plans under RGGVY coverelectrification of 8,299 un-electrified villages (Spill overfrom Tenth/ Eleventh Plans projects), electrification of1.65 Lakh habitations and providing free connections to3.54 Lakh BPL households. Against the physical targetsof Twelfth/ Thirteenth Plans, 273 projects having 9012un-electrified villages, 2.32 Lakh partially electrifiedvillages, 1.42 Lakh un-electrified habitations, 4.17 Lakhpartially electrified habitations and 1.32 crore BPLhouseholds have been sanctioned. During the TwelfthPlan (as on 30.04.2015) electrification works in 5,486un-electrified villages, intensive electrification in 75,446partially electrified villages have been completed and freeelectricity connections to 31.64 Lakh BPL householdshave been released.
3. The CCEA approved the Deen Dayal UpadhyayaGram JyotiYojana (DDUGJY) in November, 2014 withcomponents (i) to separate agriculture and non-agriculture feeders facilitating judicious rostering ofsupply to agricultural and non-agricultural consumersin rural areas, (ii) strengthening and augmentation ofsub transmission and distribution infrastructure in rural
areas, including metering of distribution transformers/feeders/consumers and (iii) the rural electrificationworks under RGGVY which had been approved byCCEA in 2013 with estimated cost of Rs. 39,275 crorewith budgetary support of Rs. 35,447 crore has beensubsumed in DDUGJY. The total project cost of worksunder DDUGJY is Rs. 43,033 crore with budgetarysupport of Rs. 33,453 crore. The outlay approved underRGGVY will be carried forward to the DDUGJY inaddition to outlay approved for the scheme. Theobjectives of the DDUGJY are feeder separation (for24x7 power supply for non-agricultural consumers) andproviding access to all rural households. As on30.04.2015, under DDUGJY, projects with approvedcost of Rs. 8,853.12 crore have been sanctioned in theStates of Himachal Pradesh, West Bengal, MadhyaPradesh, Tamil Nadu, Uttar Pradesh and Andhra Pradesh.
4. As on 31.03.2015, 18,452 villages are yet to beelectrified. The Ministry of Power has prepared a roadmap for electrification of balance un-electrified villageswherein the Ministry has planned to electrify 3,500villages in 2015-16, 4,050 villages in 2016-17, 5,100villages in 2017-18 and 5,802 villages in 2018-19. Againstthe Annual target during 2015-16, the achievement is7,108 villages which is 203 per cent. The target forAnnual Plan 2016-17 has been revised to 8,360 villages.
Learnings from the Appraisal of PhysicalInfrastructure Sector:
Power Sector
The thrust of the Government of India is to provide24x7 power supply to a common man. Forimproving access, small decentralized generatingplants (based on renewable energy) feeding localgrids is considered the ideal solution.
But the real challenge is to provide last mileconnectivity to consumers, develop an efficientdistribution system and bring out revenuesustainability by the States by bridging the gapbetween cost of supply and tariff realization.
Annexure 6.3
184 APPRAISAL DOCUMENT OF TWELFTH FIVE YEAR PLAN
Reduction in very high level of AT&C lossesthrough power sector reform and availing benefitsunder new Central Sector Schemes namely IPDSand DDUGJY. Carry out energy audit andaccounting for identification of high loss areas andto take remedial measures. Completion of 100 percent feeder & consumer metering and feedersegregation is key to achieve efficiency in thepower sector. This will improve the financial healthof power utilities and trigger demand of electricityin the country which will results in economicgrowth.
The share of hydro power is reducing and is amatter of concern from stability and economicpoint of view. There is a need to give focus fordevelopment of hydro potential, especially in NorthEastern Region. This will fill up the gap betweendemand and supply of electricity.
Inter-regional transfer of electricity is a constraint.This needs to be augmented to transfer surpluspower available in one region of the country toother power deficient regions.
The New & Renewable Energy Sector
The recent report of Expert Group constituted underNITI Aayog on the direction of Ministry of Finance,strongly suggests that in the first place, all non-financialsupport options should be made available to RenewableEnergy e.g. project development, policy support,legislative enablers, and coordinated implementationecosystem. Such interventions are critical to reach the175GW RE targets. The ecosystems should also ensurethat all direct and indirect incentives should get reflectedin the tariff of RE at the procurement end. Further theincentive design and procurement mechanism shouldbe specific to the characteristics of resource andtechnology under consideration
On the physical progress, solar target would beoverachieved while the wind target would beunderachieved. The entire expenditure against theTwelfth Plan outlay is estimated to be about 102 percent of the target.
Coal Sector
The success of coal sector depends upon makingmore indigenous coal available. It has been observedthat the performance of the sector in the first fouryears of the Plan period indicates that the coal demand/offtake has outstripped production which has a directbearing on coal imports. Coal production fromcaptive sources is a matter of concern as a healthycontribution from these sources will release thepressure on CIL to achieve the desired targets incoming years, and at the same time, will also ease theneed of coal imports
The Petroleum and Natural Gas Sector
However, consumption of superior kerosene (SKO) hasregistered negative growth trend of 5 per cent in thesame period. Under decontrolled price regime, High-Speed Diesel (HSD) consumption in 2015-16 grew at aCAGR of about 4 per cent over the base year 2011-12,while petrol registered a high growth of about 10 percent CAGR. This is due to shrinking of the price gapbetween petrol and diesel and a major shift towards petroldriven cars/two wheelers due to the lowering of petrolprices on account of low crude oil prices in theinternational market. Overall, the demand for petroleumproducts 11 per cent in the years 2015-16 which callsfor enhancing indigenous refining capacity as the surplusexported products would reduce to zero in next 3-5 years.Overall consumption of petroleum products growth in2015-16 was 5.7 per cent from the base year 2011-12.
Against the total outlay of Rs. 4,41,688 crore the likelyexpenditure at the end of the Twelfth Plan will be aboutRs. 3,90,939.80 crore, i.e. about 89 per cent of thetargeted outlay. There is vast scope for this sector tocontribute to the overall growth agenda by majorinvestments in upstream, refining, LNG terminals andpipelines. However, local issues will need to be addressedfor these investments to materialize on the ground.
Communications Sector
The Preferential Market Access policy for electronics& IT hardware manufacturing was initiated with
185PHYSICAL INFRASTRUCTURE
intentions of incentivizing and encouraging domesticmanufacturing. However, it has yielded mixed results.There is a need to revisit the policy and bring inappropriate changes to reflect the ground realities tosupport the governments Make in India programme.
Major infrastructure projects in the area oftelecommunications - National Optical Fiber Networkneeds to be fast tracked for completion. The Digital Indiainitiative cannot yield the desired results without robustnationwide broadband network.
Transport Sector:
There have been a number of learnings from the TwelfthPlan in transport sector. It has been seen that privateinvestment in transport has slowed down especially inthe road sector which had to be compensated by publicinvestment. The Government has accelerated the publicinvestment in infrastructure creation especially in theroad and rail sectors especially during the last twopreceding years of the plan. There has also been anaggressive push in the area of project completion butsome of the fundamental constraints related to projectexecution still prevails especially in the areas of landacquisition. In terms of projects of significance, amention has to be made of the high speed rail betweenMumbai and Ahmedabad which was approved in 2015.Sagarmala with its thrust on port-led industrializationand coastal economic zones is another example of largescale project. However, large projects have equally largeexecution challenges. At this stage, it is not clear howefficiently these can be managed especially in Sagarmalawhich has dimensions beyond the port sector. In projectswhich could have been pushed forward but have not
yet been moved ahead are the other DFCs in the Railwaysapart from the Western and Eastern DFCs. A challengein coming days is the declining trend in rail traffic whichneeds to be reversed on which there is a nationalconsensus. Another important learning is that a logistics-centric view is required to be taken of the transportinfrastructure so that as hard infrastructure is created,the softer aspects of integration and processsimplification also need to take place. Processsimplification which is not resource intensive has hugebenefits if designed well. But this would need allstakeholders to commit to reduction in paperwork andsimplification of processes. Typical examples wheresuch interventions can make dramatic impacts are ports-customs interface where our processes are well belowinternational and even regional best practices. Animportant learning is that capacity creation is not thesole concern especially in the road sector but has nowto be combined with asset management, focus onelimination of congestion and improvement of assetquality. Integration of technology especially in tollmanagement of roads is required to be accelerated. Largeinefficiencies in inter-state borders can be eliminated tobring in quick gains. Road safety is another area wherenot much systematic dent has been made during thisplan period and a greater involvement of technicalexpertise including those from international agencies isneeded. What is still missing in transport planning at thenational scene is the integrated framework especiallybetween the surface based transport modes i.e. rail androad although integration of ports and these sectors ishappening thanks to Sagarmala. The challenge in thecoming months and years is to look at this moreintensively.
186 APPRAISAL DOCUMENT OF TWELFTH FIVE YEAR PLAN
7Environmental Sustainability
7.1 Introduction
7.1.1 The Twelfth Five Year Plan envisaged broad-basedimprovement in standards of living of all sections ofsociety through a faster, more inclusive and sustainablegrowth process. In order to attain the vision of ensuringenvironmental sustainability, various policies andstrategies relating to sectors such as Land, Water,Environment, Forestry & Wildlife and Mineral Resourceshave been envisaged in the Plan document. Progress ineach of these sectors, alongwith the challenges beingfaced, are elaborated in the following sections:
Land Resources
7.2 Land Resources: Challenges and PlanGoals
7.2.1 The sustainable management of diminishing landresources is a major challenge during remaining periodof the Twelfth Plan and beyond. It becomes even moreimportant learning that India supports over 18 per centof the world’s human population and 15 per cent oflivestock population on only 2.4 per cent land area. Thedemand for land for multiple uses is increasing leadingto a decline in per capita availability for agriculture. It isestimated that per capita availability of agricultural landhas declined from 0.48 ha in 1951 to 0.14 ha in 20111.This decline in agricultural land leads to the conversionof forest lands, land under trees and miscellaneous usesfor agriculture – a major concern for environmentalsustainability. The land use pattern for the period 2002-03
to 2011-12 indicated a growth of 1.08 per cent perannum in non-agricultural uses. Other land relatedchallenges are related to policy reforms like land titling,registration, modernization of land records and bringingadditional area under the plough.
7.2.2 Land is a State subject. Therefore, policyinitiatives need to be suitably backed by the States takingcare of demand for food, fodder, fuels and timber andinfrastructure development. Several challenges relatedto resources for survey/resurvey and digitization havebeen experienced by the States while implementing theNational Land Record Modernization Programme(NLRMP). Inadequate availability of the required highspeed bandwidth for connectivity of land record offices;and the lack of availability of a large number of technicallycapable private vendors for the survey are also challengesfaced by the States.
7.2.3 The Twelfth Plan, as a part of environmentalsustainability, envisaged holistic development of naturalresources. Four important programmes – MahatmaGandhi National Rural Enployment Guarantee Scheme(MGNREGS), National Mission for SustainableAgriculture (NMSA), National Initiative on ClimateResilient Agriculture (NICRA) and Integrated WatershedManagement Programme (IWMP) are underimplementation during the Plan. These include a strongecological services component, to contribute toenvironmental sustainability. The MGNREGA, NMSAand NICRA have been discussed in Chapter 8, RuralTransformation. In this chapter IWMP, along with other
1Food and Agricultural Organisation, (2014), FAO Statistical Year Book, 2014, Asia & Pacific Food & Agriculture, pp. 175, RegionalOffice Bangkok.
187ENVIRONMENTAL SUSTAINABILITY
initiatives related to land use policy, land recordmodernization, land titling and registration are discussed.The vital activities of IWMP are related to thedevelopment of degraded natural resources; rain waterharvesting and recharging the groundwater to increasein gross irrigated area from 90 million ha. to 103 millionha, one of the 25 monitorable targets of the Twelfth Plan.
7.3 Integrated Watershed ManagementProgramme (IWMP)
7.3.1 The IWMP aims at restoring the ecological balanceby harnessing; conserving and developing degradednatural resources. This prevents soil erosion, encouragesrain water harvesting and groundwater recharging andenables multi-cropping and diverse agro-based activities.All these aim at achieving sustainable livelihoods for thoseresiding in the watershed area. A total of 8,214 projectscovering an area of 39.07 million ha have been sanctionedtill March, 2015. Against the total cost of the sanctionedprojects of Rs. 50,739.58 crore, about 22 per cent (Rs11,032.2 crore) could be provided to the States withover 97 per cent utilization till December, 2014. This isevident from the facts that out of 8,214 projectssanctioned so far, only 119 (1.5 per cent) are in theconsolidation phase, while 4,613 (56 per cent) havemoved to the work phase and 3,482 (42.5 per cent) arein the preparatory phase. It implies more effort is neededunder IWMP for contribution to soil and waterdevelopment, like augmentation of water resources andincrease in cropping/plantations, etc. One of the reasonsfor less progress and long gestation period has been theinitially slow progress in constituting State levelimplementing agencies. This eventually acquiredmomentum, with all States having constituted the StateLevel Nodal Agencies (SLNAs) for implementation ofIWMP.
7.3.2 IWMP has now been brought under the umbrellascheme of Pradhan Mantri Krishi Sinchayee Yojana(PMKSY) with an allocation of Rs. 1,500 crore for 2015-16. The funding pattern has currently been changed to60:40 against 90:10 (Centre: State) earlier. States needto fund the programme liberally out of their additionalFourteenth Finance Commission allocation etc., to
achieve the target of 25 million ha. area coverage duringthe Plan. Several new initiatives have also beenmainstreamed during the first three years of the Plan tostrengthen implementation and monitoring. Theadditional area targeted to be brought under irrigationthrough IWMP during 2016-17 as per the approvedprojects is 6.17 lakh ha. with an estimated cost ofRs. 7,482.02 crore. However, an amount of Rs. 1,500crore has been allocated for the watershed developmentcomponent of PMKSY including Neeranchal Project(Rs. 100 crore) during the financial year 2016-17.
7.3.3 New Initiatives: The Project FinancialManagement System (PFMS) has been adopted forIWMP to track the position of funds in all registeredaccounts, to enable the monitoring of bank balances andtransactions of accounts in real time and to maintainrecords of all funds released under the programme.Besides, concurrent monitoring and evaluation by thirdparty professional organizations has been initiated tomonitor the implementation of the programme in thefield and to provide regular inputs and reports.
7.3.4 Remote Sensing (RS) and Geographical InformationSystems (GIS) are being used for the selection ofwatersheds, their characterization, prioritization, analysisof natural resources and identification of constraints, etc.National Remote Sensing Centre (NRSC) and othercenters are partnering with the Department of LandResources and States in this activity.
7.3.5 A major concern in watershed projects has beenthe non-availability of their impact in terms of quantifieddeliverables. The Mihir Shah Committee on watershedmanagement, constituted by the erstwhile PlanningCommission also stressed that watershed should beevaluated on key outcome indicators. To achieve this,the evaluation of watershed projects in 50 districtsagainst key outcome indicators has been initiated usingremote sensing and GIS technology. The NRSC isinvolved for the evaluation for five years i.e. till thecompletion of the project. The learnings from thisimpact evaluation will provide a base to extend theremote sensing and GIS based impact evaluation to allIWMP districts.
188 APPRAISAL DOCUMENT OF TWELFTH FIVE YEAR PLAN
7.3.6 Bhuvan geo-portal for IWMP: This web-basedGIS application, or geo-portal, is also in operation foruse in the planning, monitoring and management ofIWMP projects.
(a) Bhuvan - ‘Shristi’ Portal: This portalprovides for use of space images and ITsolutions. It can be used for planning,monitoring and management of watershedprojects. A host of services covering (i)visualization (ii) download of free satellitedata and products of specified period andresolution, (iii) thematic maps of land use,land cover, wasteland etc. are available onthe portal.
(b) Bhuvan: ‘Drishti’ Mobile App: A userfriendly Android mobile app has beendeveloped under the TechnologyDevelopment Extension and Training (TDET)programme to facilitate online monitoring ofthe activities in the field. The applicationallows for uploading photos along with theirGPS locations directly from mobiles to theBhuvan server for viewing and analysis.
7.4 National Land Records ModernizationProgramme (NLRMP)
7.4.1 The National Land Records ModernizationProgramme (NLRMP) was started in 2008-09. NRLMPaims at ushering in the system of conclusive titles, inlieu of the deeds and documents registration system withpresumptive titles that prevails at present. The projecthas been implemented in 457 districts so far.Computerization of Record of Rights (RoRs) has largelybeen completed in 23 States whereas 19 States and UTshave placed RoR data on their web sites. To reduce theinterface with government offices to get these recordsand to facilitate the hassle-free delivery of land records,18 States have stopped manual issuance of RoRs.
7.4.2 The States have also enacted Acts to provide time-bound services relating to a number of departments atone place. The Madhya Pradesh Public Service DeliveryGuarantee Act -2010, and Mee-seva in Andhra Pradesh
are some of the success stories. Integration of Bhoomi-Kaveri is an outstanding example started by Karnatakafor providing integrated service to people at one window.Karnataka has enabled banks’ access to RoRs whichhas reduced the time that bank loans take to besanctioned. Gujarat and Haryana have made progress inresurvey of the land, while Bihar, Odisha, Maharashtraare at various levels of implementation of this activity.Progress made by Gujarat in resurvey and creatingupdated cadasters brings out that overlaying thesecadasters with the maps pertaining to infrastructure andother facilities available in that area could helpconsiderably when it comes to identifying land fordevelopment purposes.
7.5 Right to Fair Compensation and Transpar-ency in Land Acquisition, Rehabilitation &Resettlement (RFCTLAR&R) Act, 2013
7.5.1 The RFCTLAR&R Act, 2013 came into effecton 1st January, 2014. Consequent upon the difficultiesfaced by the States and Central Government agencies inthe implementation of certain provisions of the Act, itwas considered necessary to make changes to it whilesafeguarding the interest of farmers and affected familiesin cases of land acquisition. A conference of StateRevenue Ministers was organized on 27th June, 2014 totake stock of the administrative preparedness.Suggestions received from the State Governments, UnionTerritory administrations, Ministries / Departments andother stakeholders were also considered. Based on thesedeliberations, some amendments were proposed in theAct. Accordingly, the RFCTLAR&R (Amendment)Ordinance, 2014 was promulgated on 31st December,2014. The replacement Bill was introduced in the LokSabha on the 24th February, 2015 but could not be passedby Parliament. To give continuity to the provisions of thesaid Ordinance and to expedite the process of landacquisition, the RFCTLAR&R (Amendment) Ordinance,2015 (No. 4 of 2015) was promulgated on 3rd April, 2015.The ordinance was allowed to lapse on 31st August, 2015.
7.6 Land Reforms
7.6.1 The following key reforms have been initiatedduring the Plan which need to be expedited:
189ENVIRONMENTAL SUSTAINABILITY
7.6.2 Land Titling Bill: Moving from presumptive titlingto conclusive titling, the Bill includes titling in a modularway. To begin with, the titling may be voluntary. It isalso envisaged that the provisional entries will becomeconclusive after three years. The Bill provides forestablishment of Central Land Titling Authority ineach State/UT with the powers of a civil court. The draftregulation under Article 240 of the Constitution on landtilting for implementing in Union Territories has also beenformulated and discussed with UTs. Lakshadweep hasshown its readiness to implement land titling.
7.6.3 National Land Reforms Policy: The draftNational Land Reforms Policy covering, land use plan;the protection of lands belonging to Scheduled Castes,Scheduled Tribes and other marginalized communities;homestead rights; common property resources; landacquisition; modernization of land records; and so on,has been formulated. The policy suggests measures foreffective and speedy resolution of land disputes. A robustGIS based land record system has been envisaged fortransparency and good governance with Gram Sabhasplaying a larger role in land administration.
7.6.4 National Land Use Policy: The draft NationalLand Use Policy envisages identification of non-cultivableland and its strategic development. It focuses on theissues of unregulated shifts of land, reducing per capitaland resource and meeting the demands of rural andagricultural sectors and protecting lands under naturalresources while meeting the demands of urbanization,industrialization, mining, transport and so on.
7.6.5 Registration (Amendment) Bill, 2013: TheRegistration (Amendment) Bill, 2013 was introduced inthe Rajya Sabha on 8th August, 2013. This includes (a)power of attorney to be compulsorily registered;(b) registration of documents, relating to transactionsprohibited by Central/State Acts, to be refused;(c) registration anywhere in the State or UT; (d)
facilitation of electronic registration of documents; and(e) the refund or recovery of registration fees. TheParliamentary Committee has submitted the Bill inParliament after review.
Water Resources
7.7 Water Resources: Scenario and
Challenges
7.7.1 India has only 4 per cent of the world’s waterresources. Even with this limited availability, there arelimits on the utilizable quantities of water, owing to itsuneven distribution in time and space. As much as 75 to85 per cent of the run-off in Indian rivers occurs infour months of the year. The Working Group2 for theTwelfth Plan had estimated that the demand gap betweenwater availability and requirements could be of the orderof 250 Billion Cubic Metres (BCM) for irrigation by 2050(paragraph 1.4 (a), page 11). Even if a fair fraction ofthis additional demand is borne by groundwater, the extraburden on surface irrigation will be of the order of 150BCM to achieve self sufficiency by 2050.
7.7.2 Per capita water availability has been steadilydeclining since 1951, due to the growing population whilewater resources remained constant or depleted. An annualper capita water availability in the range of 1,000 and1,700 cubic metres is termed as a water-stressedcondition, and per capita availability below 1,000 cubicmetres is termed as a water-scarce condition. As per2011 census, the per capita water availability is 1,544cubic metres. There are conflicts among water usersand various water uses at village, district, State andNational levels. There are also competing demands fordrinking, agriculture, industries including power, as alsofor sustaining the ecosystem. Effect of climate changeon water resources may aggravate the scarcity. Growingscarcity of water manifests in the form of acuteproblems at the local level, leading to inequity in access
2 Report of the Working Group on Major and Medium Irrigation and Command Area Development for the Twelfth Plan, PlanningCommission.
190 APPRAISAL DOCUMENT OF TWELFTH FIVE YEAR PLAN
for drinking and irrigation. Over-exploitation ofgroundwater leading to alarming decreases in its levelsleads to an increase in water disputes, which may takethe shape of social unrest.
7.7.3 Other issues like the increasing pollution of freshwater sources; low water-use efficiency, especially inagriculture; recurring floods and droughts; the non-maintenance of water infrastructure leading to itsdeterioration and resulting in inequitable access;variability of water resources due to climate change etc.are equally worrying. Improving water-use efficiencythrough new demand management initiatives like “morecrop, per drop”; increasing water availability (har khetko pani); ensuring participatory groundwatermanagement based on scientific inputs; undertakingwater sector reforms; re-cycling of water; enforcingthe Pollution Control Act; and having a national legislativeframework for water governance are to be pursuedvigorously to meet these various challenges.
7.7.4 Given the huge public investment of Rs. 3,49,626crore (at current prices) over the first eleven Five YearPlans, the irrigation potential created through variousmajor and medium irrigation projects increased from9.72 million ha. at the end of the pre-Plan period (1950)to 47.41 million ha. by the end of the Eleventh Plan(2012). However, the created potential has not been fullyutilized. There was a gap of around 23.30 million ha.between the irrigation potential created and utilized tillthe end of the Eleventh Plan.
7.8 Water Resources: Twelfth Plan Strategy
7.8.1 The Plan visualized a fundamental change in theapproach to water development. It focused on principles,the approach and strategies for water management inIndia. Such strategies included water governance and theparticipation of multiple stakeholders, together with multi-disciplinary development actions for water resourcesmanagement and the maintenance of existing infrastruc-
ture. It called for initiating action on the followingelements3:
i. Narrowing the gap between IrrigationPotential Created and Irrigation PotentialUtilized (IPC and IPU).
ii. Improving water-use efficiency by 20 percent.
iii. Integration of command area development(CAD) works with major and mediumirrigation (MMI) and channelizingMGNREGA funds to improve the canalsystem and CAD work.
iv. Integrating the repair, renovation andrestoration (RRR) of water bodies withIWMP.
v. National Groundwater ManagementProgramme- aquifer mapping.
vi. Broad-basing of human resources (multi-disciplinary HR involvement).
vii. Structural and non-structural measures forflood management.
viii. Redesigning management informationsystem (MIS) for strengthening data baseand monitoring.
ix. A new institutional and legislative frameworkfor the water sector.
7.8.2 The National Water Policy, 2012 was adopted inDecember, 2012 by the National Water ResourcesCouncil, chaired by Prime Minister and with theparticipation of Chief Ministers. The policy proposed anational legal framework for general principles governingthe exercise of legislative and/or executive (or devolved)powers by the Centre, the States and the local governingbodies. A brief on the National Water Policy, 2012 is inBox 7.1.
3 12th Plan, Vol 1, Planning Commission, pp 144.
191ENVIRONMENTAL SUSTAINABILITY
Box 7.1: National Water Policy, 2012
The National Water Policy, 2012 expresses severalconcerns about water resources management in thecountry. These include water resource governance;variation in the availability of water; access to safe waterin terms of quantity and quality; straining relationshipsdue to water disputes; sub-optimal maintenance of waterinfrastructure; and so on. The Policy advocates a numberof suggestions in the following areas:
(i) A national framework law
(ii) Uses of water
(iii) Adaptation to climate change
(iv) Enhancing water available for use
(v) Demand management, water-use efficiencyand water pricing
(vi) Conservation of river corridors, water bodiesand infrastructure
(vii) Project planning and implementation
(viii) Management of flood and drought
(ix) Water supply and sanitation
(x) Institutional arrangements
(xi) Trans-boundary rivers
(xii) Data-base and information system
(xiii) Research and training needs
A Committee constituted by the Ministry of WaterResources, River Development and Ganga Rejuvenationhas already prepared a roadmap for implementation ofthe policy, and it has been shared with all stakeholdersfor wider consultation.
7.9 Water Resources: Schemes/Programmes
7.9.1 To bridge the gap between the IPC and IPU,Command Area Development works (taken up belowthe irrigation outlet of an irrigation project) have nowbeen integrated with the Accelerated Irrigation Benefitsand Flood Management Programme. The Ministry ofWater Resources, River Development and GangaRejuvenation (MoWR, RD&GR) has already initiated theprocess for constitution of the National Bureau of WaterUse Efficiency under the National Water Mission. The
proposed Bureau will have the overall responsibility ofimproving water-use efficiency across various sectors– irrigation, drinking water supply, power generation,industry etc. – in the entire country.
7.9.2 The scheme of Repair, Renovation and Restorationof Water Bodies is revamped and approved for Rs. 6,235crore to cover 10,000 water bodies with a commandarea of 6.235 lakh ha. The Integrated WatershedManagement Programme (IWMP) has been combinedwith this scheme to ensure catchment area treatment ofthe restored water bodies, which would avoid siltationand maintain the capacity created.
7.9.3 The Government of India has launched a GroundWater Regulation and Management Scheme during2013-14 with an estimated cost of Rs. 3,319 crore. Itenvisages groundwater management through aquifermapping in three dimensions along with theircharacterization on 1:50,000 scale covering 8.89 lakhsq. kms. and with further detailing up to 1:10,000 scalefor vulnerable areas. This would be followed by theformulation of aquifer management plans, quantifyingwater availability and water quality, to facilitatesustainable management through a participatorymanagement approach.
7.9.4 The Flood Management Programme of MoWR,RD & GR launched in the Eleventh Plan has beencontinued in the Twelfth Plan with a provision forCentral Assistance of Rs. 10,000 crore to States. Ithas a separate component of Rs. 1,000 crore forcatchment area treatment to address the issue of highrates of run-off and erosion. The Flood ForecastingScheme is also being revamped to increase the numberof flood forecasting stations and inflow forecast stationsto cover dams and reservoirs. A total of 787Hydrological Observation & Flood Forecasting stationsare proposed to be set-up or modernized by providingautomatic data acquisition and real-time datatransmission systems.
7.9.5 The MoWR, RD&GR has already put in placean India Water Resources Information System into
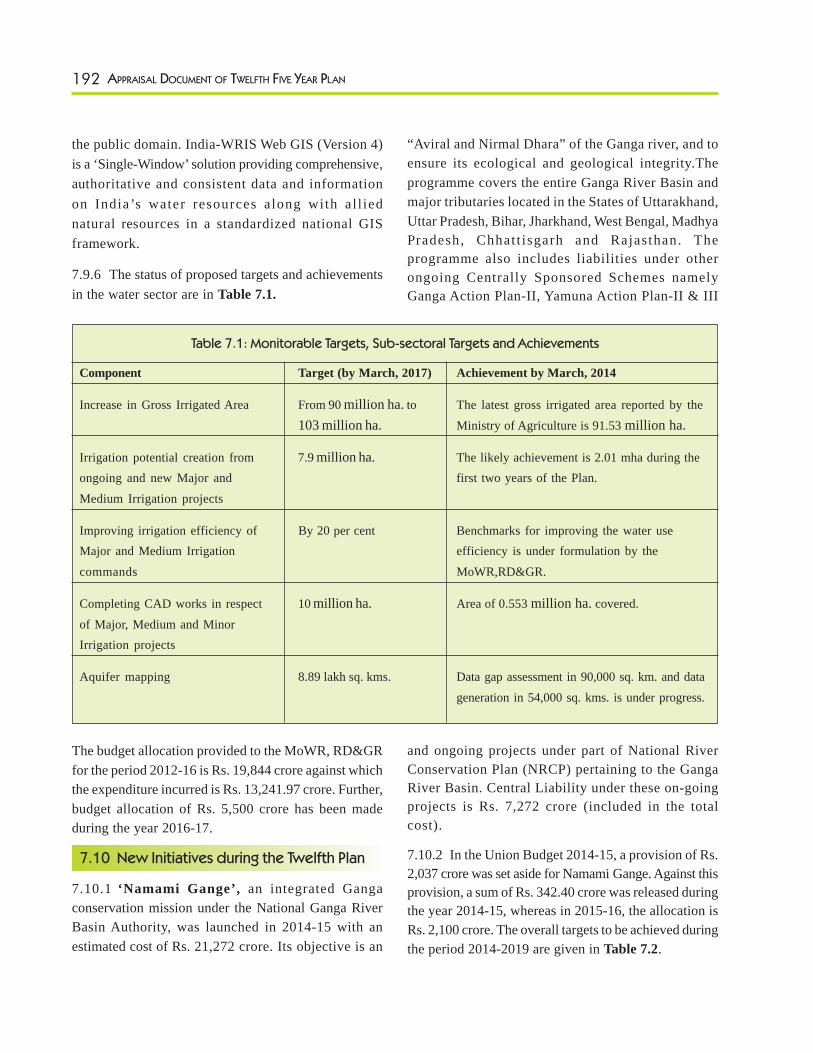
192 APPRAISAL DOCUMENT OF TWELFTH FIVE YEAR PLAN
the public domain. India-WRIS Web GIS (Version 4)is a ‘Single-Window’ solution providing comprehensive,authoritative and consistent data and informationon India’s water resources along with al l iednatural resources in a standardized national GISframework.
7.9.6 The status of proposed targets and achievementsin the water sector are in Table 7.1.
“Aviral and Nirmal Dhara” of the Ganga river, and toensure its ecological and geological integrity.Theprogramme covers the entire Ganga River Basin andmajor tributaries located in the States of Uttarakhand,Uttar Pradesh, Bihar, Jharkhand, West Bengal, MadhyaPradesh, Chhatt isgarh and Rajasthan. Theprogramme also includes liabilities under otherongoing Centrally Sponsored Schemes namelyGanga Action Plan-II, Yamuna Action Plan-II & III
Table 7.1: Monitorable Targets, Sub-sectoral Targets and Achievements
Component Target (by March, 2017) Achievement by March, 2014
Increase in Gross Irrigated Area From 90 million ha. to The latest gross irrigated area reported by the103 million ha. Ministry of Agriculture is 91.53 million ha.
Irrigation potential creation from 7.9 million ha. The likely achievement is 2.01 mha during theongoing and new Major and first two years of the Plan.Medium Irrigation projects
Improving irrigation efficiency of By 20 per cent Benchmarks for improving the water useMajor and Medium Irrigation efficiency is under formulation by thecommands MoWR,RD&GR.
Completing CAD works in respect 10 million ha. Area of 0.553 million ha. covered.of Major, Medium and MinorIrrigation projects
Aquifer mapping 8.89 lakh sq. kms. Data gap assessment in 90,000 sq. km. and datageneration in 54,000 sq. kms. is under progress.
and ongoing projects under part of National RiverConservation Plan (NRCP) pertaining to the GangaRiver Basin. Central Liability under these on-goingprojects is Rs. 7,272 crore (included in the totalcost).
7.10.2 In the Union Budget 2014-15, a provision of Rs.2,037 crore was set aside for Namami Gange. Against thisprovision, a sum of Rs. 342.40 crore was released duringthe year 2014-15, whereas in 2015-16, the allocation isRs. 2,100 crore. The overall targets to be achieved duringthe period 2014-2019 are given in Table 7.2.
The budget allocation provided to the MoWR, RD&GRfor the period 2012-16 is Rs. 19,844 crore against whichthe expenditure incurred is Rs. 13,241.97 crore. Further,budget allocation of Rs. 5,500 crore has been madeduring the year 2016-17.
7.10 New Initiatives during the Twelfth Plan
7.10.1 ‘Namami Gange’, an integrated Gangaconservation mission under the National Ganga RiverBasin Authority, was launched in 2014-15 with anestimated cost of Rs. 21,272 crore. Its objective is an
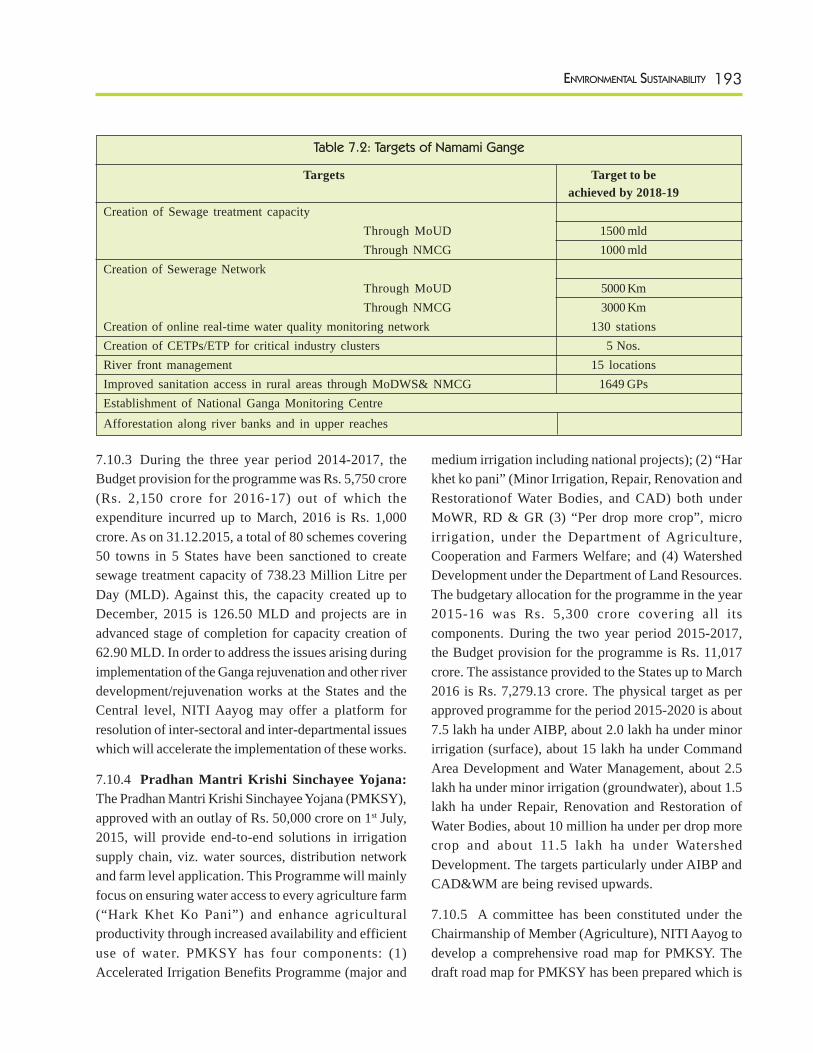
193ENVIRONMENTAL SUSTAINABILITY
7.10.3 During the three year period 2014-2017, theBudget provision for the programme was Rs. 5,750 crore(Rs. 2,150 crore for 2016-17) out of which theexpenditure incurred up to March, 2016 is Rs. 1,000crore. As on 31.12.2015, a total of 80 schemes covering50 towns in 5 States have been sanctioned to createsewage treatment capacity of 738.23 Million Litre perDay (MLD). Against this, the capacity created up toDecember, 2015 is 126.50 MLD and projects are inadvanced stage of completion for capacity creation of62.90 MLD. In order to address the issues arising duringimplementation of the Ganga rejuvenation and other riverdevelopment/rejuvenation works at the States and theCentral level, NITI Aayog may offer a platform forresolution of inter-sectoral and inter-departmental issueswhich will accelerate the implementation of these works.
7.10.4 Pradhan Mantri Krishi Sinchayee Yojana:The Pradhan Mantri Krishi Sinchayee Yojana (PMKSY),approved with an outlay of Rs. 50,000 crore on 1st July,2015, will provide end-to-end solutions in irrigationsupply chain, viz. water sources, distribution networkand farm level application. This Programme will mainlyfocus on ensuring water access to every agriculture farm(“Hark Khet Ko Pani”) and enhance agriculturalproductivity through increased availability and efficientuse of water. PMKSY has four components: (1)Accelerated Irrigation Benefits Programme (major and
medium irrigation including national projects); (2) “Harkhet ko pani” (Minor Irrigation, Repair, Renovation andRestorationof Water Bodies, and CAD) both underMoWR, RD & GR (3) “Per drop more crop”, microirrigation, under the Department of Agriculture,Cooperation and Farmers Welfare; and (4) WatershedDevelopment under the Department of Land Resources.The budgetary allocation for the programme in the year2015-16 was Rs. 5,300 crore covering all itscomponents. During the two year period 2015-2017,the Budget provision for the programme is Rs. 11,017crore. The assistance provided to the States up to March2016 is Rs. 7,279.13 crore. The physical target as perapproved programme for the period 2015-2020 is about7.5 lakh ha under AIBP, about 2.0 lakh ha under minorirrigation (surface), about 15 lakh ha under CommandArea Development and Water Management, about 2.5lakh ha under minor irrigation (groundwater), about 1.5lakh ha under Repair, Renovation and Restoration ofWater Bodies, about 10 million ha under per drop morecrop and about 11.5 lakh ha under WatershedDevelopment. The targets particularly under AIBP andCAD&WM are being revised upwards.
7.10.5 A committee has been constituted under theChairmanship of Member (Agriculture), NITI Aayog todevelop a comprehensive road map for PMKSY. Thedraft road map for PMKSY has been prepared which is
Table 7.2: Targets of Namami Gange
Targets Target to beachieved by 2018-19
Creation of Sewage treatment capacityThrough MoUD 1500 mldThrough NMCG 1000 mld
Creation of Sewerage NetworkThrough MoUD 5000 KmThrough NMCG 3000 Km
Creation of online real-time water quality monitoring network 130 stationsCreation of CETPs/ETP for critical industry clusters 5 Nos.River front management 15 locationsImproved sanitation access in rural areas through MoDWS& NMCG 1649 GPsEstablishment of National Ganga Monitoring CentreAfforestation along river banks and in upper reaches
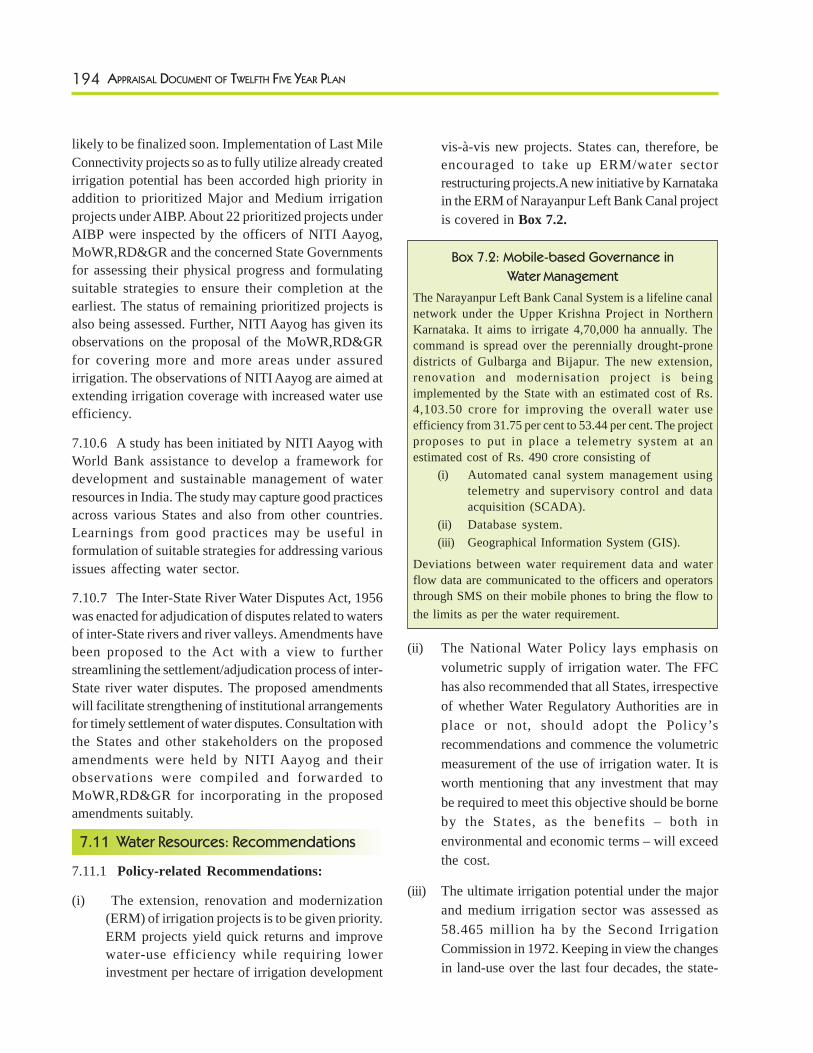
194 APPRAISAL DOCUMENT OF TWELFTH FIVE YEAR PLAN
likely to be finalized soon. Implementation of Last MileConnectivity projects so as to fully utilize already createdirrigation potential has been accorded high priority inaddition to prioritized Major and Medium irrigationprojects under AIBP. About 22 prioritized projects underAIBP were inspected by the officers of NITI Aayog,MoWR,RD&GR and the concerned State Governmentsfor assessing their physical progress and formulatingsuitable strategies to ensure their completion at theearliest. The status of remaining prioritized projects isalso being assessed. Further, NITI Aayog has given itsobservations on the proposal of the MoWR,RD&GRfor covering more and more areas under assuredirrigation. The observations of NITI Aayog are aimed atextending irrigation coverage with increased water useefficiency.
7.10.6 A study has been initiated by NITI Aayog withWorld Bank assistance to develop a framework fordevelopment and sustainable management of waterresources in India. The study may capture good practicesacross various States and also from other countries.Learnings from good practices may be useful informulation of suitable strategies for addressing variousissues affecting water sector.
7.10.7 The Inter-State River Water Disputes Act, 1956was enacted for adjudication of disputes related to watersof inter-State rivers and river valleys. Amendments havebeen proposed to the Act with a view to furtherstreamlining the settlement/adjudication process of inter-State river water disputes. The proposed amendmentswill facilitate strengthening of institutional arrangementsfor timely settlement of water disputes. Consultation withthe States and other stakeholders on the proposedamendments were held by NITI Aayog and theirobservations were compiled and forwarded toMoWR,RD&GR for incorporating in the proposedamendments suitably.
7.11 Water Resources: Recommendations
7.11.1 Policy-related Recommendations:
(i) The extension, renovation and modernization(ERM) of irrigation projects is to be given priority.ERM projects yield quick returns and improvewater-use efficiency while requiring lowerinvestment per hectare of irrigation development
vis-à-vis new projects. States can, therefore, beencouraged to take up ERM/water sectorrestructuring projects.A new initiative by Karnatakain the ERM of Narayanpur Left Bank Canal projectis covered in Box 7.2.
Box 7.2: Mobile-based Governance in
Water Management
The Narayanpur Left Bank Canal System is a lifeline canalnetwork under the Upper Krishna Project in NorthernKarnataka. It aims to irrigate 4,70,000 ha annually. Thecommand is spread over the perennially drought-pronedistricts of Gulbarga and Bijapur. The new extension,renovation and modernisation project is beingimplemented by the State with an estimated cost of Rs.4,103.50 crore for improving the overall water useefficiency from 31.75 per cent to 53.44 per cent. The projectproposes to put in place a telemetry system at anestimated cost of Rs. 490 crore consisting of
(i) Automated canal system management usingtelemetry and supervisory control and dataacquisition (SCADA).
(ii) Database system.(iii) Geographical Information System (GIS).
Deviations between water requirement data and waterflow data are communicated to the officers and operatorsthrough SMS on their mobile phones to bring the flow tothe limits as per the water requirement.
(ii) The National Water Policy lays emphasis onvolumetric supply of irrigation water. The FFChas also recommended that all States, irrespectiveof whether Water Regulatory Authorities are inplace or not, should adopt the Policy’srecommendations and commence the volumetricmeasurement of the use of irrigation water. It isworth mentioning that any investment that maybe required to meet this objective should be borneby the States, as the benefits – both inenvironmental and economic terms – will exceedthe cost.
(iii) The ultimate irrigation potential under the majorand medium irrigation sector was assessed as58.465 million ha by the Second IrrigationCommission in 1972. Keeping in view the changesin land-use over the last four decades, the state-
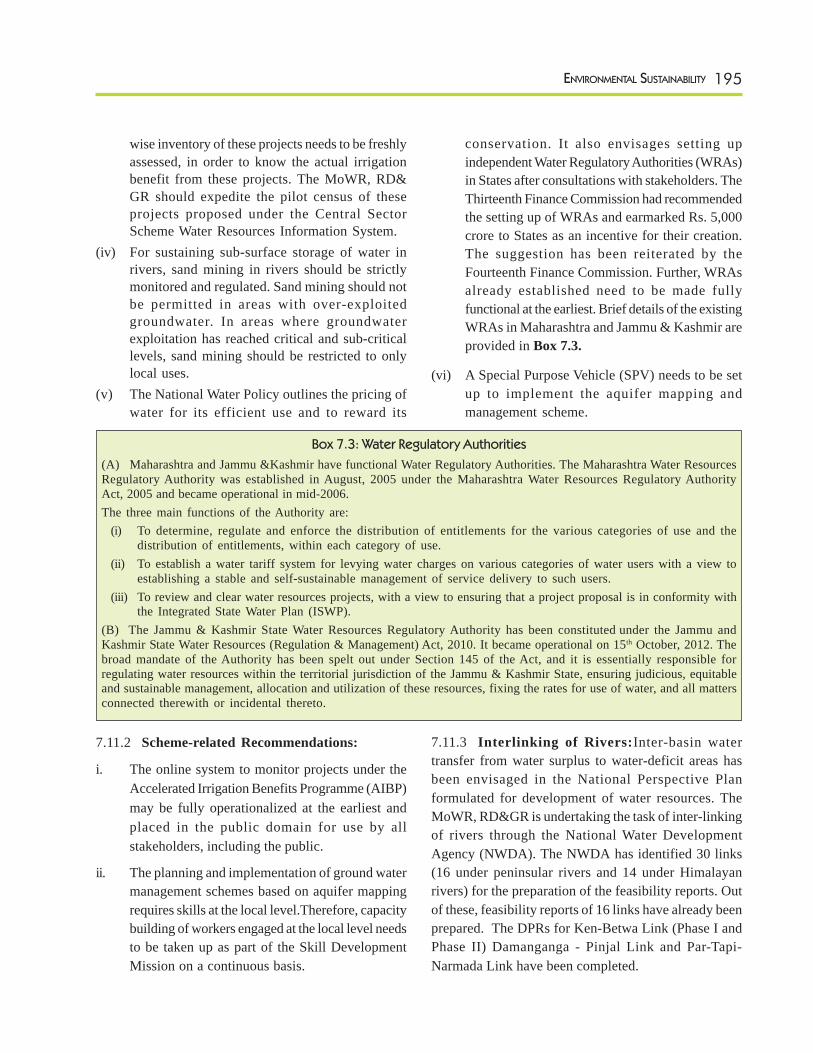
195ENVIRONMENTAL SUSTAINABILITY
wise inventory of these projects needs to be freshlyassessed, in order to know the actual irrigationbenefit from these projects. The MoWR, RD&GR should expedite the pilot census of theseprojects proposed under the Central SectorScheme Water Resources Information System.
(iv) For sustaining sub-surface storage of water inrivers, sand mining in rivers should be strictlymonitored and regulated. Sand mining should notbe permitted in areas with over-exploitedgroundwater. In areas where groundwaterexploitation has reached critical and sub-criticallevels, sand mining should be restricted to onlylocal uses.
(v) The National Water Policy outlines the pricing ofwater for its efficient use and to reward its
conservation. It also envisages setting upindependent Water Regulatory Authorities (WRAs)in States after consultations with stakeholders. TheThirteenth Finance Commission had recommendedthe setting up of WRAs and earmarked Rs. 5,000crore to States as an incentive for their creation.The suggestion has been reiterated by theFourteenth Finance Commission. Further, WRAsalready established need to be made fullyfunctional at the earliest. Brief details of the existingWRAs in Maharashtra and Jammu & Kashmir areprovided in Box 7.3.
(vi) A Special Purpose Vehicle (SPV) needs to be setup to implement the aquifer mapping andmanagement scheme.
Box 7.3: Water Regulatory Authorities
(A) Maharashtra and Jammu &Kashmir have functional Water Regulatory Authorities. The Maharashtra Water ResourcesRegulatory Authority was established in August, 2005 under the Maharashtra Water Resources Regulatory AuthorityAct, 2005 and became operational in mid-2006.The three main functions of the Authority are:
(i) To determine, regulate and enforce the distribution of entitlements for the various categories of use and thedistribution of entitlements, within each category of use.
(ii) To establish a water tariff system for levying water charges on various categories of water users with a view toestablishing a stable and self-sustainable management of service delivery to such users.
(iii) To review and clear water resources projects, with a view to ensuring that a project proposal is in conformity withthe Integrated State Water Plan (ISWP).
(B) The Jammu & Kashmir State Water Resources Regulatory Authority has been constituted under the Jammu andKashmir State Water Resources (Regulation & Management) Act, 2010. It became operational on 15th October, 2012. Thebroad mandate of the Authority has been spelt out under Section 145 of the Act, and it is essentially responsible forregulating water resources within the territorial jurisdiction of the Jammu & Kashmir State, ensuring judicious, equitableand sustainable management, allocation and utilization of these resources, fixing the rates for use of water, and all mattersconnected therewith or incidental thereto.
7.11.2 Scheme-related Recommendations:
i. The online system to monitor projects under theAccelerated Irrigation Benefits Programme (AIBP)may be fully operationalized at the earliest andplaced in the public domain for use by allstakeholders, including the public.
ii. The planning and implementation of ground watermanagement schemes based on aquifer mappingrequires skills at the local level.Therefore, capacitybuilding of workers engaged at the local level needsto be taken up as part of the Skill DevelopmentMission on a continuous basis.
7.11.3 Interlinking of Rivers:Inter-basin watertransfer from water surplus to water-deficit areas hasbeen envisaged in the National Perspective Planformulated for development of water resources. TheMoWR, RD&GR is undertaking the task of inter-linkingof rivers through the National Water DevelopmentAgency (NWDA). The NWDA has identified 30 links(16 under peninsular rivers and 14 under Himalayanrivers) for the preparation of the feasibility reports. Outof these, feasibility reports of 16 links have already beenprepared. The DPRs for Ken-Betwa Link (Phase I andPhase II) Damanganga - Pinjal Link and Par-Tapi-Narmada Link have been completed.
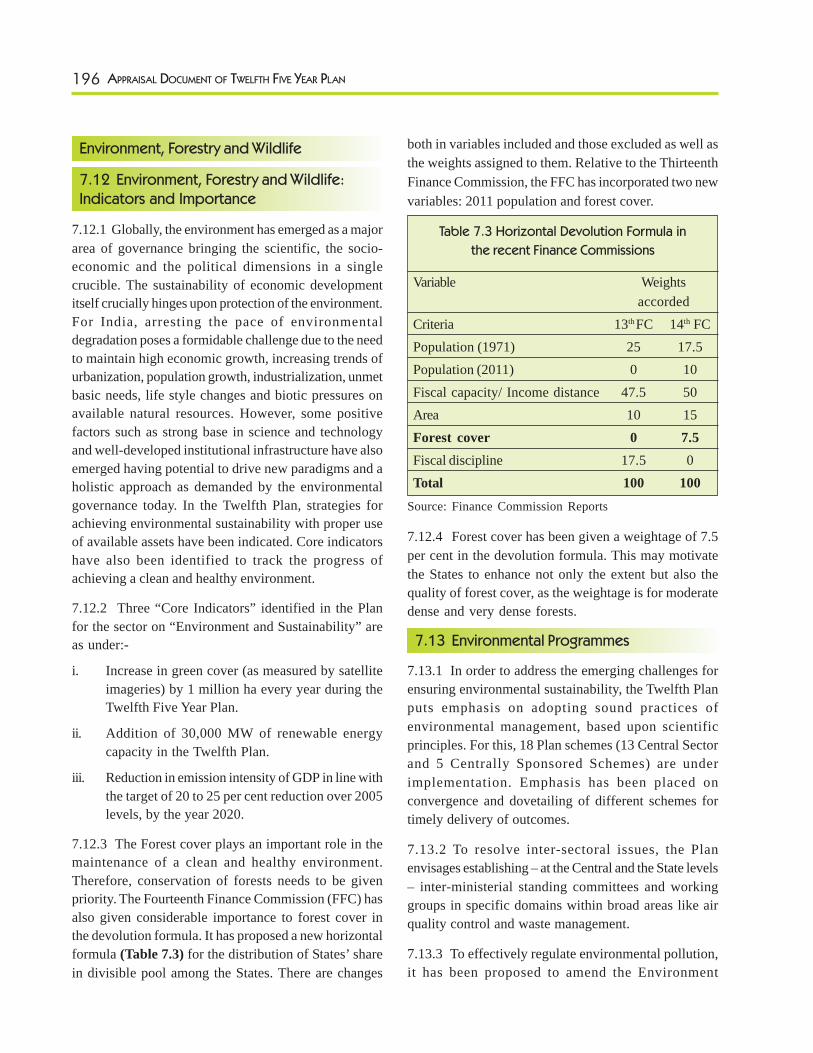
196 APPRAISAL DOCUMENT OF TWELFTH FIVE YEAR PLAN
Environment, Forestry and Wildlife
7.12 Environment, Forestry and Wildlife:Indicators and Importance
7.12.1 Globally, the environment has emerged as a majorarea of governance bringing the scientific, the socio-economic and the political dimensions in a singlecrucible. The sustainability of economic developmentitself crucially hinges upon protection of the environment.For India, arresting the pace of environmentaldegradation poses a formidable challenge due to the needto maintain high economic growth, increasing trends ofurbanization, population growth, industrialization, unmetbasic needs, life style changes and biotic pressures onavailable natural resources. However, some positivefactors such as strong base in science and technologyand well-developed institutional infrastructure have alsoemerged having potential to drive new paradigms and aholistic approach as demanded by the environmentalgovernance today. In the Twelfth Plan, strategies forachieving environmental sustainability with proper useof available assets have been indicated. Core indicatorshave also been identified to track the progress ofachieving a clean and healthy environment.
7.12.2 Three “Core Indicators” identified in the Planfor the sector on “Environment and Sustainability” areas under:-
i. Increase in green cover (as measured by satelliteimageries) by 1 million ha every year during theTwelfth Five Year Plan.
ii. Addition of 30,000 MW of renewable energycapacity in the Twelfth Plan.
iii. Reduction in emission intensity of GDP in line withthe target of 20 to 25 per cent reduction over 2005levels, by the year 2020.
7.12.3 The Forest cover plays an important role in themaintenance of a clean and healthy environment.Therefore, conservation of forests needs to be givenpriority. The Fourteenth Finance Commission (FFC) hasalso given considerable importance to forest cover inthe devolution formula. It has proposed a new horizontalformula (Table 7.3) for the distribution of States’ sharein divisible pool among the States. There are changes
both in variables included and those excluded as well asthe weights assigned to them. Relative to the ThirteenthFinance Commission, the FFC has incorporated two newvariables: 2011 population and forest cover.
Table 7.3 Horizontal Devolution Formula in
the recent Finance Commissions
Variable Weightsaccorded
Criteria 13th FC 14th FCPopulation (1971) 25 17.5Population (2011) 0 10Fiscal capacity/ Income distance 47.5 50Area 10 15Forest cover 0 7.5Fiscal discipline 17.5 0Total 100 100
Source: Finance Commission Reports
7.12.4 Forest cover has been given a weightage of 7.5per cent in the devolution formula. This may motivatethe States to enhance not only the extent but also thequality of forest cover, as the weightage is for moderatedense and very dense forests.
7.13 Environmental Programmes
7.13.1 In order to address the emerging challenges forensuring environmental sustainability, the Twelfth Planputs emphasis on adopting sound practices ofenvironmental management, based upon scientificprinciples. For this, 18 Plan schemes (13 Central Sectorand 5 Centrally Sponsored Schemes) are underimplementation. Emphasis has been placed onconvergence and dovetailing of different schemes fortimely delivery of outcomes.
7.13.2 To resolve inter-sectoral issues, the Planenvisages establishing – at the Central and the State levels– inter-ministerial standing committees and workinggroups in specific domains within broad areas like airquality control and waste management.
7.13.3 To effectively regulate environmental pollution,it has been proposed to amend the Environment
197ENVIRONMENTAL SUSTAINABILITY
(Protection) Act, 1986, and upwardly revise the penaltiestherein. An enabling provision for civil administrativeadjudication to fast-track the levy of penalty has alsobeen proposed. The setting up of a multi-disciplinaryNational Environment Assessment and MonitoringAuthority (NEAMA) to strengthen the process ofgranting environmental clearances and monitoring thereof has also been envisaged.
7.13.4 The Central and the State Governments need toinvest more in strengthening the mechanismsimplementing rules notified under the Environment(Protection) Act, 1986, including the CRZ Notificationand the Marine Fishing Regulation Act.
7.13.5 The Plan also envisages strengthening theBotanical Survey of India (BSI) and the ZoologicalSurvey of India (ZSI) in terms of manpower andinfrastructure. They would thus be able to scale up theirmandated tasks of inventorisation of India’s flora andfauna. Further, the mandate of different institutesengaged in forestry, biodiversity and wildlife research isrequired to be broadened to accommodate emergingneeds for collaborative multidisciplinary research.
7.13.6 A national information grid for biodiversity,ecology and environment data, so as to enable effectivemonitoring and sustainable management of naturalresources, has been proposed in the Plan.This is expectedto be an open, transparent and comprehensive web-basedinformation system covering various landscapes suchas forests, mountains, deserts, and coasts, as well asthe territorial waters of the country’s ExclusiveEconomic Zone.
7.13.7 To develop the Non Timber Forest Produce(NTFP) sector in a holistic way and coordinate variousactivities for sustainable management, an autonomousagency with branches in all States/UTs has beenenvisaged. Enrichment, protection and sustainablemanagement of NTFP resources have the potential to
provide livelihood support to the needy people and alsoto contribute substantially in maintaining ecologicalstability.
7.13.8 Scientific and socio-economic issues related towildlife conservation, including strengthening ofveterinary care for wild animals, are also priority areasin the Plan. Animal Welfare Boards are planned to besetup in all the States, including Societies for Preventionof Cruelty to Animals (SPCAs), under the Prevention ofCruelty (Establishment of Societies for the Preventionof Cruelty to Animals) Rules in all districts of the country.
7.14 Environment
7.14.1 The Forest Survey of India, Dehradun carriesout survey and assessment of the forest resources inIndia and monitors changes in the forest cover. Thefindings are published biennially as the “India State ofForest Report”. As per the India State of Forest Report,20134 (the latest in the series), the total forest and treecover of the country is 7,89,164 sq. kms. which is 24.01per cent of its total geographical area.
7.14.2 As per the latest assessment report of 2013,there is an increase of 5,871 sq. kms. in forest cover ascompared to the 20115 assessment. Although an increasein forest cover has been reported, more efforts areneeded to achieve the goal, as envisaged in the NationalForest Policy of 1988, to have a minimum of one-thirdof the total land area of the country under forest or treecover.
7.14.3 Against the target of an additional 30,000 MWof renewable energy capacity during the Twelfth Plan,10,892 MW has been achieved upto March, 2015. Theemission intensity of GDP is expected to decrease withan increase in forest cover, the addition of renewableenergy capacity, and measures being taken up forsustainable development.
4 Forest Survey of India, (2013): India State of Forest Report, 2013, Dehradun.5 Forest Survey of India, (2011): India State of Forest Report, 2011, Dehradun.
198 APPRAISAL DOCUMENT OF TWELFTH FIVE YEAR PLAN
7.14.4 The draft Compensatory Afforestation Fund Bill,2015 and the proposal to introduce the said bill inParliament were approved by the Union Cabinet on 29th
April, 2015. The proposed legislation seeks to providean appropriate institutional mechanism, both at the Centreand in each State and UT, to ensure the expeditiousutilization of amounts realized in lieu of forest landdiverted for non-forestry purpose. It contains provisionsto ensure the utilization of these amounts in an efficientand transparent manner. The proper and timely utilizationof these amounts will mitigate the impact of diversionof such forest land for non-forestry purposes.
7.14.5 The efficient use of available resources throughthe convergence of various on-going schemes has beenemphasized, to overcome environmental challenges.Convergence guidelines of Green India Mission (GIM)with MGNREGS and Compensatory Afforestation FundManagement and Planning Authority (CAMPA) have beenissued by the Central Government in 2015 to addressclimate change concerns effectively. Further, efforts areon to bring about convergence with othercomplementary missions and programmes.
7.14.6 In order to ensure efficiency, transparency andaccountability in the process of granting environmental,forest and wildlife clearances, a single-window systemof online submission and monitoring (at http://efclearance.nic.in) has been introduced. The status ofproposals at various levels is displayed on this web portal.On 2nd July, 2015, an online system for submission ofapplications for category ‘B’ projects to StateEnvironment Impact Assessment Authorities (SEIAAs)was also launched by the MoEF&CC. This system isexpected to ensure transparency and speed up theclearance process while maintaining its rigor.
7.14.7 A proposal has been moved for the upwardrevision of penalties, and the inclusion of an enablingprovision for civil administrative adjudication to fast-
track the levy of penalties, under the Environment(Protection) Act.
7.14.8 Guidelines have been issued under Forest(Conservation) Act, 1980 for the simplification of theclearance process for projects involving the lineardiversion of forest land– such as the laying of new roads,the widening of existing highways, transmission lines,water supply lines, railway lines, and so on. Thesimplified process for obtaining Forest Clearances (FCs)will expedite the implementation of such projects, leadingto faster and sustainable growth.
7.14.9 Monitoring emissions and effluents frompolluting industries throughout the country through areal-time effluent quality monitoring system is beingimplemented by the MoEF&CC. Guidelines for an onlinecontinuous monitoring system for effluents have beenissued by the Central Pollution Control Board. The onlinemonitoring system will provide continuous measurementof data for long periods of time at the monitoring sitesof interest. Further, the Central Pollution ControlBoard is executing a nation-wide programme of ambientair quality monitoring, known as National Air QualityMonitoring Programme (NAMP). The network forNAMP consists of 580 operating stations covering 244cities and towns across the country6.
7.14.10 Revision of waste management rules related toe-waste, solid waste, plastic waste, hazardous wasteand bio-medical waste has been taken up by MoEF&CC.Notifications of these rules are targeted during the year2016-17. Revised rules will make waste managementmore scientific and effective thereby contributingsignificantly to “Swachh Bharat”.
7.14.11 India successfully hosted the eleventhConference of the Parties (CoP-11) to the Conventionon Biological Diversity (CBD) in October, 2012, atHyderabad. During India’s two-year presidency of CoP-
6Annual Report of the MoEF&CC, 2014-15, pp 112.
199ENVIRONMENTAL SUSTAINABILITY
11, a number of additional activities relating to biodiversityconservation, some of them quite unique, were takenup within as well as outside the government set-up.These include: the setting up of a commemorative pylon,botanic garden and biodiversity museum complex inHyderabad, India’s contribution to South-Southcooperation, and running of the Science ExpressBiodiversity Special train.
7.14.12 As president of CoP-11, India played a proactiveleadership role in ensuring the success of the NagoyaProtocol on “access to genetic resources and fair andequitable sharing of benefits arising from their utilization”by achieving the required number of ratifications. TheProtocol came into force in October, 2014. It is a majorstep towards achieving the first of the global AichiBiodiversity Targets. Recognizing the pivotal role played,India was invited by the global biodiversity communityto preside over the first meeting of the Parties beinghosted by the Republic of Korea.
7.14.13 The discharge of untreated sewage from urbanareas is one of the major sources of pollution of rivers.Creation of additional sewage treatment capacity to bridgethe gap between sewage generation and existingtreatment capacity is needed, and this mammoth taskrequires the involvement of all stakeholders – the CentralGovernment, State Governments, local bodies,implementing agencies, NGOs, and the general public.The proper treatment and disposal of sewage generatedin urban areas is basically the responsibility of theconcerned State Governments and local bodies. However,the Central Government has been supplementing theefforts of State/UT Governments in the creation ofsewerage infrastructure and abatement of pollution inrivers by providing financial assistance throughappropriate schemes of various ministries (MoEF&CC,MoUD and MoWR, RD & GR). Under the CentrallySponsored Scheme ‘National River Conservation Plan’(NRCP), financial assistance is provided to the StateGovernments for pollution abatement in identified
stretches of various rivers. In the Twelfth Plan, there isa provision of Rs.1,500 crore for the NRCP, with thetarget of creating 632 million litres a day (MLD) sewagetreatment capacity. Against this, Rs.388.38 crore couldbe made available during the first three years of the Planperiod and a treatment capacity of 423 MLD wascreated. An amount of Rs. 102 crore has been allocatedduring the year 2016-17 for creation of sewage treatmentplants and other works for abatement of pollution inrivers.
7.14.14 Assistance is also being provided for theconservation and management of identified lakes andwetlands under another scheme, the ‘National Plan forConservation of Aquatic Eco-Systems (NPCA)’. TheNPCA has been initiated after merging two schemes,namely the National Wetland Conservation Programme(NWCP) and the National Lake Conservation Plan(NLCP), so as to provide a common programmaticframework for the scientific management of lakes andwetlands.
7.14.15 The National Mission for a Green India (GIM),one of the eight missions under the National Action Planon Climate Change (NAPCC), has been approved bythe Cabinet Committee on Economic Affairs (CCEA) inFebruary, 2014. Project proposals (Perspective Plans)submitted by six States under GIM have been approvedby the M/oEF&CC. The Ministry is working closelywith State/UT Governments to get the remaining projectproposals for treatment of landscapes identified as perthe mission guidelines. During the year 2016-17, anamount of Rs. 185.01 crore has been allocated for takingup various activities including treatment of identifiedlandscapes (about 6000 ha.) under GIM.
7.14.16 Twenty-eight States and five Union Territorieshave prepared their State Action Plans on Climate Change(SAPCCs). Out of these, SAPCCs of thirty-two Statesand UTs have been endorsed by the National SteeringCommittee on Climate Change at the MoEF&CC. It isnecessary to put SAPCCs in place for all States/UTs, as
200 APPRAISAL DOCUMENT OF TWELFTH FIVE YEAR PLAN
the proper implementation of schemes planned as perapproved SAPCCs will help the States/UTs substantiallyin effectively addressing climate change concerns.
7.14.17 NITI Aayog has been actively involved informulation of strategies for sustainable developmentof islands. It actively particpated in the Inter-Ministerialconsultations for finalising the selecton islands for holisticdevelopment. The NITI Aayog proposes to steer theholistic development of islands on a sustainable basisfor which the process of short-listing of islands isunderway.
7.15 Environment: Recommendations
7.15.1 The M/oEF&CC may take the initiative to set upa high-powered body called the National Environmentand Forestry Council (NEFC), with the Prime Ministeras Chairperson, the Minister of Environment, Forest andClimate Change as Vice Chairperson, aided and advisedby a group of experts. This body may also haverepresentation from the Ministries of External Affairs,Science and Technology, Agriculture, Commerce, Urbanand Rural Development, Tribal Affairs and so on. Sucha high-powered body would provide useful and valuableguidance for environmental sustainability. Similarly, StateEnvironment and Forestry Councils (SEFCs) may alsobe set up in each State to align the working of differentdepartments with that of the Environment and Forestdepartment, so as to ensure environmental sustainabilitywhile implementing various development projects.
7.15.2 Several steps have been taken by the MEF&CCfor streamlining the process of granting EnvironmentClearances (ECs) and Forest Clearances (FCs). Thereport submitted by the High Level Committee constitutedby the MoEF&CC to review various Acts related toenvironment, forest and wildlife provides useful inputsin making the process of granting clearances moretransparent and effective. Therefore, suitable decisionson the recommendations made by the committee,including the umbrella Act on environment, may be taken
in consultation with all stakeholders – the States/UTs,NGOs, technical institutions and the public.
7.15.3 A National Environment Restoration Fund(NERF) may be created by the MoEF&CC fromvoluntary contributions and user fees for access tospecified natural resources. Penalties levied for violationof environment-related Acts may also be deposited inthe NERF. The NERF may be used for cleaning up ofpolluted rivers and sites contaminated with toxic andhazardous waste.
7.15.4 The principles of “Participatory ForestManagement” being practiced in various States and UTsmay be strengthened further by taking up suitablecapacity-building measures. Emphasis may be given onimproving the socio-economic status of village-level JointForest Management Committees (JFMCs) through valueaddition to sustainably-extracted forest produce andmarketing of value-added forest products – in particular,NTFPs (Non-Timber Forest Products). Increase in theshare of value-added NTFPs, particularly bamboo-basedproducts, in the national and international markets maybring substantial economic benefits to many membersof village-level JFMCs.
7.15.5 For international cooperation, efforts may bemade to utilize the SAARC platform to facilitatesustainable development and technology transfer amongmember countries.
7.15.6 Continuous efforts may be made by theMEF&CC and other stakeholders to achieve the 13monitorable targets and 14 goals indicated in the TwelfthFive Year Plan for the sector on Environment, Forestryand Wildlife.
7.16 The Sustainable Development Goals
7.16.1 The 30-member Open Working Group mandatedby the Outcome Document – “The Future We Want” –of the UN Conference on Sustainable Development(Rio+20) held in June, 2012, at Rio in Brazil, came outwith a set of 17 SDGs in July, 2014. The SDGs cover abroad range of sustainable development issues and alsoinclude the means of implementation, as the focus ofone of the goals. Details are in Box 7.4.

201ENVIRONMENTAL SUSTAINABILITY
Box 7.4: Sustainable Development Goals
1. End poverty in all its forms everywhere.
2. End hunger, achieve food security and improvednutrition, and promote sustainable agriculture.
3. Ensure healthy lives and promote well-being for allat all ages.
4. Ensure inclusive and equitable quality educationand promote life-long learning opportunities for all.
5. Achieve gender equality and empower all womenand girls.
6. Ensure availability and sustainable management ofwater and sanitation for all.
7. Ensure access to affordable, reliable, sustainable,and modern energy for all.
8. Promote sustained, inclusive and sustainableeconomic growth, full and productive employment,and decent work for all.
9. Build resilient infrastructure, promote inclusive andsustainable industrialization, and foster innovation.
10. Reduce inequality within and among countries.
11. Make cities and human settlements inclusive, safe,resilient and sustainable.
12. Ensure sustainable consumption and productionpatterns.
13. Take urgent action to combat climate change and itsimpacts.
14. Conserve and sustainably use the oceans, seas, andmarine resources for sustainable development.
15. Protect, restore and promote sustainable use ofterrestrial ecosystems, sustainably manage forests,combat desertification, and halt and reverse landdegradation and halt biodiversity loss.
16. Promote peaceful and inclusive societies forsustainable development, provide access to justicefor all, and build effective, accountable andinclusive institutions at all levels.
17. Strengthen the means of implementation andrevitalize the global partnership for sustainabledevelopment.
7.16.2 These SDGs have been integrated into the UN’sdevelopment agenda for 2016-2030. Now, it is requiredto put in place a mechanism to monitor progress withrespect to each goal, and related targets accepted.Further, the indicators being evolved to achieve thesegoals and targets at the National and State levels need tobe firmed up expeditiously.
Mineral Resources
7.17 Mineral Resources: Introduction
7.17.1 Minerals are broadly grouped into major minerals,comprising atomic minerals; fuel minerals (petroleum,natural gas, coal & lignite); metallic minerals (iron ore,copper ore, manganese ore etc.); non-metallic minerals(limestone, rock phosphate etc.) and minor minerals.The Central Government has powers to frame rules forthe grant of mineral concessions and deciding royaltyrates etc. in respect of major minerals; StateGovernments have powers in respect of minor minerals.India produces 89 minerals which include three atomicminerals, four fuel minerals, 10 metallic minerals, 17non-metallic minerals and 55 minor minerals.
7.17.2 The mining and quarrying sector (includingpetroleum, natural gas, coal, major and minor minerals,but excluding atomic minerals), with a 2.13 per centshare in GDP during 2013-14, contributed significantlyto growth, development and sustainability of themanufacturing and infrastructure sectors. Extraction andmanagement of minerals is integral to the country’soverall development strategy. The value-wisecontribution of the sector to GDP was Rs. 2,22,716crore during 2011-12, which marginally decreased intwo years to Rs. 2,22,652 crore during 2013-14.
7.17.3 The key objectives for the sector under theTwelfth Plan are (a) raw material security for all userindustries (b) enhanced co-production of by-productmetals – Technology Metals, Energy-Critical Metals &Rare Earth Elements (c) ensuring sustainability of theenvironment. To achieve these objectives, the strategyto be adopted includes the strengthening of institutions,encouraging R&D and technology development, creatinginfrastructure, skill development, ensuring full andproductive coverage of survey and exploration activities,
202 APPRAISAL DOCUMENT OF TWELFTH FIVE YEAR PLAN
the development of a database of mineral resources,ensuring the availability of financial resources, ensuringthe environmental sustainability of mining and suitablepolicy changes in line with the overall strategy.
7.18 Mineral Resources:Appraisal Status
7.18.1 Even before the beginning of the Twelfth Plan,the mining sector was concerned with large-scale illegalmining and lack of transparency. To overcome theseproblems, an enabling environment based on soundprinciples of transparency and efficiency was neededto provide a fair level playing field to both domestic andforeign investors. Accordingly, the Mines and Minerals(Development & Regulation) Act, 1957(MMDR) wasamended in January, 2015.The salient features of it nowinclude:
a) Auction of mineral concessions to realizefair value and remove discretion in the grantof mineral concessions. The States willreceive production-linked revenue at acertain percentage of the value of mineral(value of mineral to be taken as notified bythe Indian Bureau of Mines) quoted by thesuccessful bidder during auction.
b) Longer lease periods: Mining leases will nowbe granted for 50 years instead of 30.Therewill be no renewal of mining leases; after theexpiry of the lease period, it will be auctioned.
c) District Mineral Foundations are to beestablished for the benefit of persons and areasaffected by mining. Those mining leasesgranted before the amendment of the Act arerequired to pay to these foundations anamount not exceeding the royalty, whereas themining leases granted thereafter need to payan amount not exceeding 1/3rd of the royalty.
d) Boosting exploration: A National MineralExploration Trust for regional and detailedexploration is to be created, to be funded bya sum equivalent to 2 per cent of the royalty.
e) Sustainable Development Framework: TheCentral Government has been empoweredto issue directions/guidelines for
implementation and evaluation of asustainable development framework forminimizing and mitigating adverseenvironmental impacts particularly in respectof ground water, air, ambient noise and land.
f) Easy transferability of mineral concessionsto encourage private sector participation.
g) Deterrents against illegal mining, includingstringent punishments and a provision forspecial courts.
7.18.2 To enable a smooth transition to the new miningregime, the Mineral Auction Rules, 2015, prescribingprocedures for the auction of mineral areas by the StateGovernments, have been notified on 20th May, 2015.The Mineral (Evidence of Mineral Contents) Rules, 2015,prescribing parameters for considering the evidence ofmineral contents in the area for the auction process,have also been notified on 17th April, 2015.The NationalMineral Exploration Trust Rules, 2015, the Mineral (NonExclusive Reconnaissance Permits) Rules, 2015, andthe Mines and Minerals (Contribution to District MineralFoundation) Rules, 2015 have also been notified. TheMineral (Mining by Government Companies) Rules,2015 and the Mineral (other than Atomic andHydrocarbons Energy Minerals) Concession Rules, 1960have been put in the public domain seeking suggestionsof the stakeholders. The Mineral Conservation andDevelopment Rules (MCDR), 1988 also need to beamended in line with recent changes. The StateGovernments are in the process of framing rules forsetting up District Mineral Foundations. The capacityof State Governments also needs to be strengthened todeal with the transition to the auction regime withoutany disruption in the production of important minerals.
7.18.3 The MMDR Amendment Act, 2015 provides togrant, through auctions, mining leases for areas havingadequate evidence of mineral content; and compositelicences (prospecting licence-cum-mining lease) forareas having inadequate evidence of mineral content.Thecomposite licence holder will initially undertakeprospecting work to locate mineral deposits prior to thegrant of mining lease. All mineral concessions granted
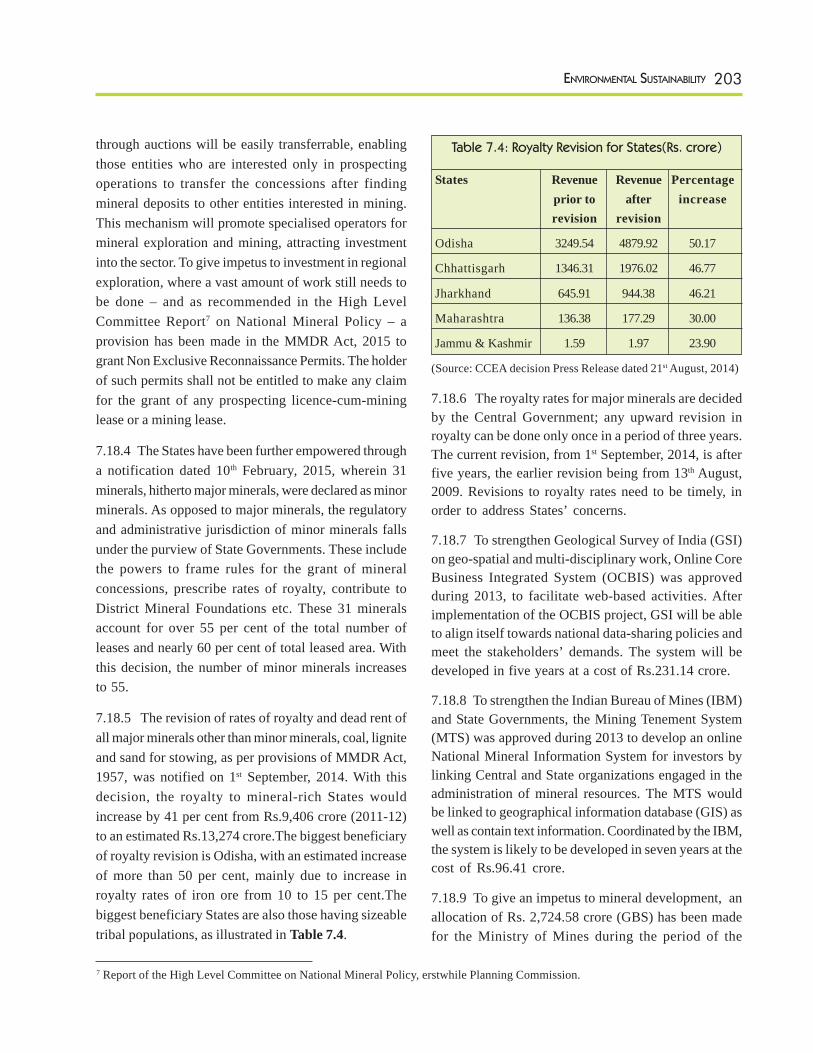
203ENVIRONMENTAL SUSTAINABILITY
through auctions will be easily transferrable, enablingthose entities who are interested only in prospectingoperations to transfer the concessions after findingmineral deposits to other entities interested in mining.This mechanism will promote specialised operators formineral exploration and mining, attracting investmentinto the sector. To give impetus to investment in regionalexploration, where a vast amount of work still needs tobe done – and as recommended in the High LevelCommittee Report7 on National Mineral Policy – aprovision has been made in the MMDR Act, 2015 togrant Non Exclusive Reconnaissance Permits. The holderof such permits shall not be entitled to make any claimfor the grant of any prospecting licence-cum-mininglease or a mining lease.
7.18.4 The States have been further empowered througha notification dated 10th February, 2015, wherein 31minerals, hitherto major minerals, were declared as minorminerals. As opposed to major minerals, the regulatoryand administrative jurisdiction of minor minerals fallsunder the purview of State Governments. These includethe powers to frame rules for the grant of mineralconcessions, prescribe rates of royalty, contribute toDistrict Mineral Foundations etc. These 31 mineralsaccount for over 55 per cent of the total number ofleases and nearly 60 per cent of total leased area. Withthis decision, the number of minor minerals increasesto 55.
7.18.5 The revision of rates of royalty and dead rent ofall major minerals other than minor minerals, coal, ligniteand sand for stowing, as per provisions of MMDR Act,1957, was notified on 1st September, 2014. With thisdecision, the royalty to mineral-rich States wouldincrease by 41 per cent from Rs.9,406 crore (2011-12)to an estimated Rs.13,274 crore.The biggest beneficiaryof royalty revision is Odisha, with an estimated increaseof more than 50 per cent, mainly due to increase inroyalty rates of iron ore from 10 to 15 per cent.Thebiggest beneficiary States are also those having sizeabletribal populations, as illustrated in Table 7.4.
Table 7.4: Royalty Revision for States(Rs. crore)
States Revenue Revenue Percentageprior to after increaserevision revision
Odisha 3249.54 4879.92 50.17
Chhattisgarh 1346.31 1976.02 46.77
Jharkhand 645.91 944.38 46.21
Maharashtra 136.38 177.29 30.00
Jammu & Kashmir 1.59 1.97 23.90
(Source: CCEA decision Press Release dated 21st August, 2014)
7.18.6 The royalty rates for major minerals are decidedby the Central Government; any upward revision inroyalty can be done only once in a period of three years.The current revision, from 1st September, 2014, is afterfive years, the earlier revision being from 13th August,2009. Revisions to royalty rates need to be timely, inorder to address States’ concerns.
7.18.7 To strengthen Geological Survey of India (GSI)on geo-spatial and multi-disciplinary work, Online CoreBusiness Integrated System (OCBIS) was approvedduring 2013, to facilitate web-based activities. Afterimplementation of the OCBIS project, GSI will be ableto align itself towards national data-sharing policies andmeet the stakeholders’ demands. The system will bedeveloped in five years at a cost of Rs.231.14 crore.
7.18.8 To strengthen the Indian Bureau of Mines (IBM)and State Governments, the Mining Tenement System(MTS) was approved during 2013 to develop an onlineNational Mineral Information System for investors bylinking Central and State organizations engaged in theadministration of mineral resources. The MTS wouldbe linked to geographical information database (GIS) aswell as contain text information. Coordinated by the IBM,the system is likely to be developed in seven years at thecost of Rs.96.41 crore.
7.18.9 To give an impetus to mineral development, anallocation of Rs. 2,724.58 crore (GBS) has been madefor the Ministry of Mines during the period of the
7 Report of the High Level Committee on National Mineral Policy, erstwhile Planning Commission.
204 APPRAISAL DOCUMENT OF TWELFTH FIVE YEAR PLAN
Twelfth Five Year Plan against the approved outlay ofRs. 2,332 crore for the Twelfth Plan.
7.19 Mineral Resources: Recommendations
7.19.1 The Fourteenth Finance Commission has viewedthat mining puts a burden on the local environment andinfrastructure, and therefore it is appropriate that someof the income from royalties be shared with the localbody in whose jurisdiction the mining is done. Thiswould help the local body ameliorate the effects of miningon the local population. The Fourteenth FinanceCommission also observed that royalty or cess on royaltyon minor minerals is shared by some States with localbodies, mainly panchayats. In one State, the royalty onsand had been removed and regulation of sand mininghad been entrusted to panchayats. In a few States whereroyalties were shared, State Finance Commissions (SFC)have observed that the full amounts of their share werenot being released to the local bodies. Another SFC notedthat the revenues from royalty on minor minerals hadnot grown in proportion to the increase in theconsumption of materials. The SFC of another Statepointed out that only Class C municipalities were alloweda share of the cess on royalty. The Fourteenth FinanceCommission has also recommended that sharing ofroyalty revenue will enable the local bodies to work forthe betterment of those affected by mining.
7.19.2 Paragraph 8 of the National Mineral Policy 2008,Foreign Trade, mentions that efforts shall be made toexport minerals in value-added form as far as possible.Therefore it is desirable that the export of minerals likeiron ore without value addition may be restricted. Thevalue addition to minerals will significantly contribute to‘Make in India’ and also create additional employmentopportunities.
7.19.3 Minerals being finite and non-renewable, India’sraw material security is crucial. The Reserve to AnnualProduction ratio of important minerals like Chromite,Lead & Zinc is critically low, and for other minerals thesituation is not too comfortable either. Intensive surveyand exploration of new reserves and deep-seated mineralsis required. India’s expenditure on exploration ispresently very low as compared to other mineral-rich
countries. There is a need to expand the resource andreserve base:
i. By stepping up exploration and aidinginternational acquisition of strategic minerals,and
ii. Through an inventory of existing mineralwaste & rejects, and encouraging researchand development for their utilization.
iii. An inclusive database of mineral resourcesdepicting resource stock to average(moving) annual extraction needs to beestablished and placed in the public domain(except for some sensitive minerals). Allsuch pre-competitive data must be availableto facilitate entrepreneurs’ investmentdecisions.
iv. The integration of data provided by GSI,IBM and State Directorates also needs to beensured for availability of comprehensiveup-to-date information.
7.19.4 There exists a large indigenous R&D networkin the mineral sector, with reasonably strong technicalcapabilities. This has to make a concerted effort towardstechnology development in mineral processing – inparticular for improved processes for beneficiation,elemental analysis of ores, and so on. Emphasis mustalso be placed on higher value addition in the sector, andcurbing of non-value-added exports.
7.19.5 Greater attention should be devoted to the survey,exploration and mapping of potential sources of rareearths elements and metals, scaling up R&D inextraction, re-cycling and reuse technologies, and findingalternative materials for use. A consortium approachinvolving academic institutions, government institutionsand R&D establishments is essential in order toovercome stiff competition from internationalcompetitors. It is also necessary to explore possibilitiesfor international collaboration in rare earth mining andthe production of associated finished products likeMagnets. Rare Earths are a strategic resource, andtherefore it is necessary that the complete life-cycle ofrare earths – from mining to end product –be within thecountry. GSI has found initial occurrences of rare earths
205ENVIRONMENTAL SUSTAINABILITY
in various parts of the country. The Department ofAtomic Energy (DAE) explores rare earths predominantlyin potential areas of prescribed substances. In India,Monazite is the principal source for rare earths. Apartfrom Monazite, a prescribed substance, rare earths alsooccurs in Bastnasite and Xenotime minerals. India hasvast resources of Monazite, this mineral contains lightrare earths only; Xenotime, however, contains heavierrare earths also, which have more demand. A large areaof the country has not been explored for rare earths.Therefore, a major programme of exploration for rareearths is needed. Since GSI does not have muchexpertise in rare earth exploration, they may coordinateand work together with DAE.
7.19.6 The Environment Management Plan (EMP) formines needs approval from multiple agencies. This issuehas also been highlighted at para 3.47 of the High LevelCommittee Report on National Mineral Policy; “An EMPhas to be prepared under the MCDR and got approvedby IBM. However, this EMP is not acceptable to theMoEF&CC. The miner has to prepare two EMPsseparately – one for IBM and another for MoEF&CC.This Committee suggests that IBM and MoEF&CCshould prepare guidelines for a composite EMP so thatIBM can approve the same in consultation withMoEF&CC’s field offices.”
Environmental Sustainability: The MajorLearnings and Way Forward
7.20 Land Resources
a. Several policy-related issues, in particularthose related to land leasing andestablishment of community land banks,have so far been non-starters, or have seenslow progress. These must be addressed onpriority in the remaining period of theTwelfth Plan.
b. Land titling, registration, land leasing laws,and the modernization of land records shouldbe pursued vigorously.
c. The development of waste lands andculturable waste land along with efficient
rainwater use may be promoted, to solvethe twin purpose of creating an additionalland bank for farming or plantations andhigher irrigation coverage.
7.21 Water Resources
7.21.1 Appraisal of XII Five Year Plan (Water Sector)has provided useful learnings for better management ofwater resources available in the country. A need to expandirrigation coverage and also to improve on-farm wateruse efficiency is strongly felt. Participation of farmersin use and maintenance of irrigation infrastructure needsto be promoted. Based upon learnings of the XII FiveYear Plan appraisal, the following strategies arerecommended:-
a. Improve water use efficiency by taking upmore Extension, Renovation andModernization projects in the major &medium irrigation sector.
b. Water sector reforms to be deepenedthrough the constitution of Water RegulatoryAuthorities and volumetric measurement ofirrigation water.
c. Persuade States for enacting the NationalWater Framework Law as envisaged in theNational Water Policy, 2012.
d. Reassess the ultimate irrigation potentialunder major and medium irrigation projects.
e. Establish an online monitoring system forprojects under Accelerated IrrigationBenefits Programme.
f. Build consensus for implementation of Inter-Linking of Rivers projects where DPRshave been prepared.
g. Set up a dedicated SPV for implementationof the National Project on AquiferManagement.
h. Skill development of local authorities andresource persons to manage ground-waterbased on aquifer mapping.
206 APPRAISAL DOCUMENT OF TWELFTH FIVE YEAR PLAN
i. Regulate sand mining in blocks with over-exploited and critical groundwater to sustainsub-surface storage.
7.21.2. Better irrigation facilities are expected throughconvergence of various ongoing schemes in the irrigationsector. During the first three years of the Twelfth Plan,programmes for development of water resources werebeing implemented separately by various centralMinistries/ Departments. In order to provide maximumbenefits to the farmers, PMKSY was adopted as anintegrated approach for expanding irrigation coveragewith increased water use efficiency. The approvedprogramme has four components namely (i) AcceleratedIrrigation Benefits Programme, (ii) Har Khet Ko Pani,(iii) Per drop More Crop and (iv) Watershed Developmentbeing implemented with participation of three CentralMinistries/Departments i.e. Department of LandResources, Ministry of Water Resources, RiverDevelopment and Ganga Rejuvenation and Departmentof Agriculture, Cooperation and Farmers Welfare.
7.22 Environment, Forests and Wildlife
The appraisal of Twelfth Five Year Plan (Environment,Forest and Wildlife sector) indicates that implementationof the following strategies may facilitate achievementof the core indicators identified in the Plan for the sectoron ‘Environment and Sustainability:-
a. Expedite the setting up of a NationalEnvironment and Forestry Council forsustainable development.
b. Early decision on the report submitted bythe High Level Committee constituted by theMoEF&CC to review various Acts relatedto forest, wildlife and environment.
c. Create a National Environment RestorationFund (NERF) from voluntary contributionsand user fees for access to specified naturalresources.
d. Strengthen the Participatory ForestManagement practices in States.
e. Utilize SAARC platform to facilitatesustainable development and technologytransfer among member countries.
7.23 Mineral Resources
The appraisal of Twelfth Five Year Plan (Minerals sector)indicates that implementation of the following strategiesmay facilitate sustainable development of mineralresources in the country:-
a. Detailed exploration of mineral resourcesneeds to be accorded high priority.
b. Export minerals in value-added form toaugment employment opportunities underthe Make in India initiative.
c. States to share royalty with local authorities.
d. State Governments to frame rules forDistrict Mineral Foundations.
207AGRICULTURE AND RURAL TRANSFORMATION
8Agriculture and Rural Transformation
but also to raise income of agricultural and rural workers,vanish poverty and reduce inequality. This calls forpromoting technology and investments in agriculture,ensuring fair price of farm produce, promoting valueaddition in agriculture, strengthening supply chains,improving sources of non-farm income and developmentof rural infrastructure and support services in the areasof health, education, roads, skilling, employment, power,tele-communications, housing, drinking water, sanitation,social safety nets and so on.
8.1.3 During the Eleventh Five Year Plan (2007-12), aseries of new programmes and initiatives were put inplace such as the Backward Regions Grant Fund,Integrated Watershed Management Programme, NationalHorticulture Mission, National Food Security Mission,Rashtriya Krishi Vikas Yojana (RKVY), Sarva ShikshaAbhiyan etc. The Panchayati Raj Institutions have beensuccessfully involved in implementing some of theseprogrammes including the Mahatma Gandhi NationalRural Employment Guarantee Act (MGNREGA). Someof these programmes continued during the Twelfth Planand were reoriented to meet growing needs of the fast-changing economy in rural areas. These include providingemployment through the MGNREGA and National RuralLivelihoods Mission (NRLM); housing via the IndiraAwaas Yojana (IAY); sanitation through the TotalSanitation Campaign; provision of drinking water viathe National Rural Drinking Water Programme; socialsecurity through the National Social AssistanceProgramme; watershed development via the IntegratedWatershed Management Programme; road connectivitythrough the Pradhan Mantri Gram Sadak Yojana(PMGSY) and electrification via the Rajiv Gandhi
8.1 Introduction
8.1.1 Agriculture remains the principal source oflivelihood for 48.9 per cent of the workers as per the68th Round of National Sample Survey Organisation(NSSO), 2011-12. Accordingly, any strategy for faster,more inclusive and sustainable growth must necessarilyaddress the issues faced by rural India which comprisesof 833 million people, i.e. 68.8 per cent of totalpopulation of India (Census 2011). Recent data showsthat 109.8 million rural people had come out of povertyduring the period 2004-05 to 2011-12, which broughtdown rural poverty ratio from 41.8 per cent to 25.7 percent (as per Tendulkar methodology). Agricultural sectorgrowth rate had improved appreciably to over 4 per centin the Eleventh Plan and production of foodgrainsincreased by nearly 30 per cent, notwithstanding near13.7 per cent fall in the agricultural workforce during2004-05 to 2011-12. India has transformed from a fooddeficit country to a major exporter of agriculturalcommodities such as rice, wheat, oil meals and cotton.Various schemes and programmes launched during theprevious Plan periods have contributed to this growth,though much more remains to be accomplished so as tobring out a large segment of population out of the povertynet and improve the standards of living of rural populace.
8.1.2 The rural transformation goal broadlyencompasses the strategies aimed at improving theeconomy and overall quality of life of people in the ruralareas. These initiatives essentially address the issues ofenhancing farm profitability, improving means oflivelihood and creating and strengthening support services- both physical and social. The objectives are not onlyto address the issues of food security and climate change,
208 APPRAISAL DOCUMENT OF TWELFTH FIVE YEAR PLAN
Grameen Vidyutikaran Yojana (covered in Chapter onPhysical Infrastructure).
8.1.4 Over the period, there has been a fundamental shiftin the policies designed for the rural areas. The oldparadigm largely focused on agricultural growth, whilethe new approach envisaged during the Twelfth Planhas a multi-sectoral approach including focus ongeneration of non-farm employment, rural tourism, usageof Information and Communication Technology(ICT),self-employment opportunities, micro finance andfinancial inclusion. While the old paradigm for agriculturedevelopment emphasized more on price support andsubsidies, the new approach emphasizes more on creatinginvestments. It also envisages active participation ofGovernments at all levels (national, regional, local), aswell as other stakeholders such as Non-GovernmentalOrganisations (NGOs), Farmer Producer Organisations(FPOs), Self Help Groups (SHGs) and so on. In the oldapproach, focus was mainly on wage employment andincome generation. In the new approach, emphasis islargely on livelihoods, creation of durable assets, skilldevelopment and promotion of self-employment ventures.
8.1.5 This Chapter is divided into two parts. First partcovers the agricultural sector, including food security,while the second part contains measures taken in pursuitof overall rural development. Also indicated are theachievements with regard to budgetary allocations ofthe relevant Ministries as well as the initiatives that needto be taken in the remaining period of the Twelfth Plan.
8.2 Agriculture
8.2.1 Agriculture sector contributed 17.4 per cent tothe overall Gross Value Added at current prices in 2014-15 (as per the new series based on 2011-12 prices)against 18.0 per cent (at current prices) in proportion toGDP during the Eleventh Plan. It is the major source oflivelihood for the rural population and an importantsource of raw material for a large number of industries.Accelerating the growth of agriculture is, therefore,necessary to achieve a higher overall GDP growth rateduring the Twelfth Plan, besides increasing income ofrural masses and ensuring food and nutritional security.
8.2.2 The major challenges in agriculture include lowand uneven productivity, rising stress on natural
resources, uneconomic size of landholdings, disconnectbetween price received by farmers and those paid byconsumers, price volatility, inadequate ruralinfrastructure, including marketing infrastructure, naturalhazards, limited risk coverage as well as low creditsupport and climate change. These would need to beaddressed through appropriate policy reorientation,investment and incentivization of innovations,technologies, inputs and institutional reforms. The keygrowth drivers identified in the Twelfth Plan foragriculture and allied sector included (a) improvingviability of farming and returns on investment thatdepend on scale, market access, prices and risk; (b)development and dissemination of appropriatetechnologies that depend on quality of research and levelof skill development; (c) plan expenditure on agricultureand infrastructure which together with policy must aimto improve productivity, functioning of markets andmore efficient use of natural resources; and (d)governance in terms of institutions that make possiblebetter delivery of services like credit, insurance, animalhealth and of quality inputs like seeds, fertilizers,pesticides and farm machinery. Besides, the emphasisis on correcting regional imbalances by extending greenrevolution to low productivity areas such as the easternregion. This appraisal of the Plan indicates that progressin many areas is on course but certain areas needconcerted action.
8.2.3 Economic Survey 2014-15 had expressed concernthat a deeper shift in the agricultural sector may beunderway calling for greater attention towards this sector,adding that the decade long shift in terms of trade infavour of agriculture may have come to an end,particularly after 2010-11, with agricultural commodityprices showing a slow decline after several years ofimprovement. As a result, rural incomes may comeunder pressure and with fiscal limitations, there may bea need for more targeted support in favour of small,marginal farmers and agricultural labourers. The Planschemes as well as subsidy regime may need to betargeted towards more vulnerable section of population.The Survey also highlights other major concerns in theagriculture sector, which include risk of high level offood inflation, seasonal and short-term price spikes in
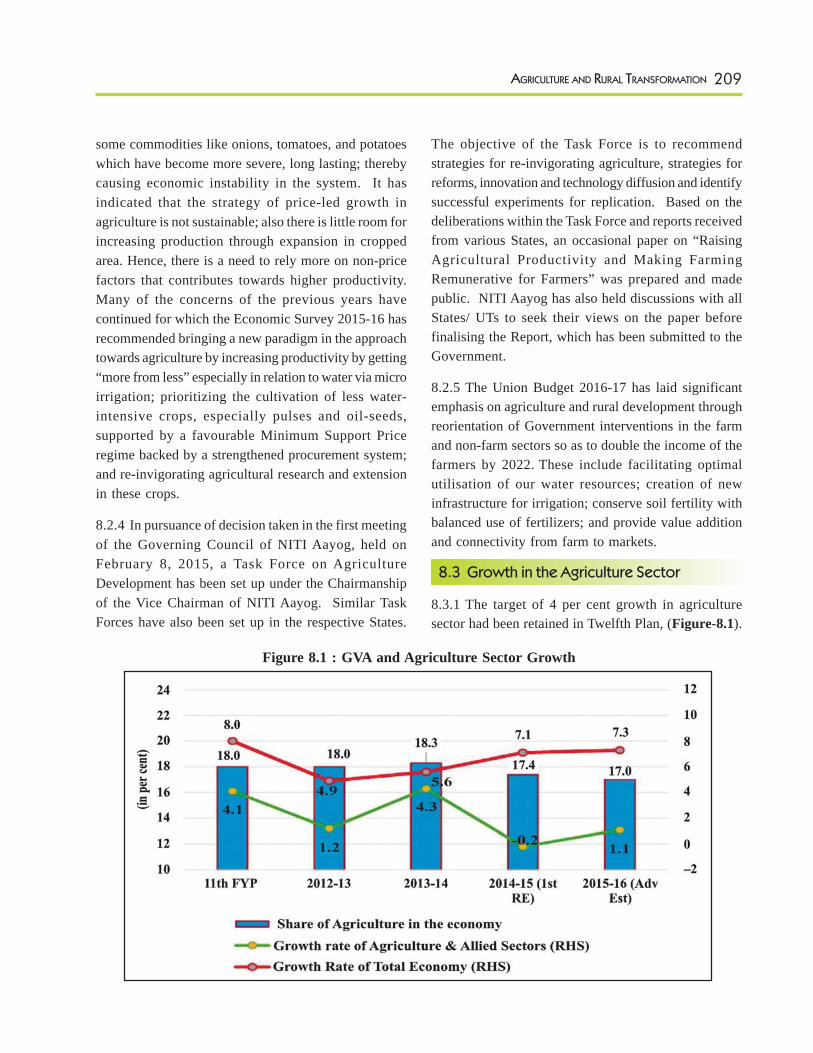
209AGRICULTURE AND RURAL TRANSFORMATION
some commodities like onions, tomatoes, and potatoeswhich have become more severe, long lasting; therebycausing economic instability in the system. It hasindicated that the strategy of price-led growth inagriculture is not sustainable; also there is little room forincreasing production through expansion in croppedarea. Hence, there is a need to rely more on non-pricefactors that contributes towards higher productivity.Many of the concerns of the previous years havecontinued for which the Economic Survey 2015-16 hasrecommended bringing a new paradigm in the approachtowards agriculture by increasing productivity by getting“more from less” especially in relation to water via microirrigation; prioritizing the cultivation of less water-intensive crops, especially pulses and oil-seeds,supported by a favourable Minimum Support Priceregime backed by a strengthened procurement system;and re-invigorating agricultural research and extensionin these crops.
8.2.4 In pursuance of decision taken in the first meetingof the Governing Council of NITI Aayog, held onFebruary 8, 2015, a Task Force on AgricultureDevelopment has been set up under the Chairmanshipof the Vice Chairman of NITI Aayog. Similar TaskForces have also been set up in the respective States.
The objective of the Task Force is to recommendstrategies for re-invigorating agriculture, strategies forreforms, innovation and technology diffusion and identifysuccessful experiments for replication. Based on thedeliberations within the Task Force and reports receivedfrom various States, an occasional paper on “RaisingAgricultural Productivity and Making FarmingRemunerative for Farmers” was prepared and madepublic. NITI Aayog has also held discussions with allStates/ UTs to seek their views on the paper beforefinalising the Report, which has been submitted to theGovernment.
8.2.5 The Union Budget 2016-17 has laid significantemphasis on agriculture and rural development throughreorientation of Government interventions in the farmand non-farm sectors so as to double the income of thefarmers by 2022. These include facilitating optimalutilisation of our water resources; creation of newinfrastructure for irrigation; conserve soil fertility withbalanced use of fertilizers; and provide value additionand connectivity from farm to markets.
8.3 Growth in the Agriculture Sector
8.3.1 The target of 4 per cent growth in agriculturesector had been retained in Twelfth Plan, (Figure-8.1).
Figure 8.1 : GVA and Agriculture Sector Growth
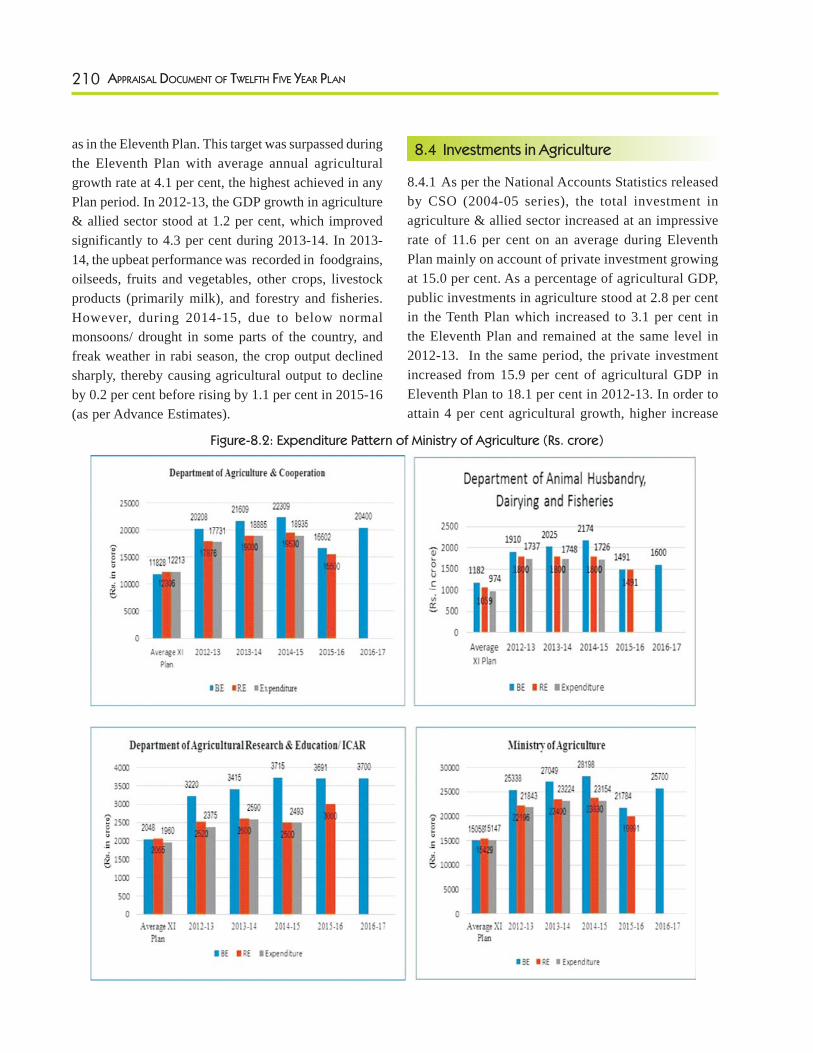
210 APPRAISAL DOCUMENT OF TWELFTH FIVE YEAR PLAN
as in the Eleventh Plan. This target was surpassed duringthe Eleventh Plan with average annual agriculturalgrowth rate at 4.1 per cent, the highest achieved in anyPlan period. In 2012-13, the GDP growth in agriculture& allied sector stood at 1.2 per cent, which improvedsignificantly to 4.3 per cent during 2013-14. In 2013-14, the upbeat performance was recorded in foodgrains,oilseeds, fruits and vegetables, other crops, livestockproducts (primarily milk), and forestry and fisheries.However, during 2014-15, due to below normalmonsoons/ drought in some parts of the country, andfreak weather in rabi season, the crop output declinedsharply, thereby causing agricultural output to declineby 0.2 per cent before rising by 1.1 per cent in 2015-16(as per Advance Estimates).
Figure-8.2: Expenditure Pattern of Ministry of Agriculture (Rs. crore)
8.4 Investments in Agriculture
8.4.1 As per the National Accounts Statistics releasedby CSO (2004-05 series), the total investment inagriculture & allied sector increased at an impressiverate of 11.6 per cent on an average during EleventhPlan mainly on account of private investment growingat 15.0 per cent. As a percentage of agricultural GDP,public investments in agriculture stood at 2.8 per centin the Tenth Plan which increased to 3.1 per cent inthe Eleventh Plan and remained at the same level in2012-13. In the same period, the private investmentincreased from 15.9 per cent of agricultural GDP inEleventh Plan to 18.1 per cent in 2012-13. In order toattain 4 per cent agricultural growth, higher increase
211AGRICULTURE AND RURAL TRANSFORMATION
in investment in agriculture is required both from publicand private sector.
8.5 Expenditure Pattern – Ministry of Agriculture
8.5.1 The Gross Budgetary Support (GBS) for theTwelfth Plan for Ministry of Agriculture includingRashtriya Krishi Vikas Yojana (RKVY) stands atRs.1,74,478 crore. The total allocation (RE) for 2012-13to 2014-15 to the Ministry of Agriculture wasRs.69,426 crore, which is about 40 per cent of thetotal GBS for agriculture. An inter-se comparisonwithin the Departments of the Ministry (Figure 8.2)indicates that lower funds were made available in caseof research compared to the Eleventh Plan allocation.One of the reasons for this was the slow progress offinalization of new and promising projects. However,to impart thrust to new technologies, productivityenhancement, marketing and processinginfrastructure and risk adaptation & mitigation,appropriate allocation would be required for theseareas in the remaining period of the Twelfth Plan.
8.5.2 It is also important to note that pursuant to higherdevolution of resources to States based on therecommendations of the 14th Finance Commission, thefund sharing pattern between Centre and States for manyschemes for agriculture and rural development havechanged. The major schemes of Ministry of RuralDevelopment viz. Mahatma Gandhi National RuralEmployment Guarantee Act (MGNREGA) and PradhanMantri Gram Sadak Yojana (PMGSY) would continueto be fully supported by the Union Government.However, higher State contribution has been put in placefor schemes like Rural Housing, National RuralLivelihood Mission (NRLM) and National SocialAssistance Programme (NSAP). Similarly changedfunding pattern has been effected for Agricultureschemes like Rashtriya Krishi Vikas Yojana, NationalFood Security Mission, Mission for IntegratedDevelopment of Horticulture, National Mission forSustainable Agriculture, National Mission for AgricultureExtension and Technology and National LivestockMission.
8.6 Changing Composition of Agriculture Sector
8.6.1 Responding to the market signals emerging fromrising disposable incomes, urbanization and change indietary preferences of the people, the farmers have beenallocating higher share of their resources to the highvalue crops and livestock. Consequently, between1993-94 and 2012-13 within agriculture sector, the shareof foodgrains in Gross Value of Output declined by 6.0percentage points, while the shares of horticulture,livestock and fisheries increased by 5.2, 4.2 and 0.9percentage points respectively. This manifests thechanging consumption pattern, with perceptible shifttowards fruits, vegetables and livestock products in thefood basket. The rise in prices of these items over thelast few years also shifted terms of trade in their favourexerting positive influence on their growth. This trendis expected to continue for long calling for appropriatepolicy support and strengthening of supply chain,especially in case of perishables, and for setting up post-harvest infrastructure, such as cold storages andwarehouses. Marketing reforms in the agriculture sectorare also pertinent as discussed subsequently in thisChapter.
8.7 Demand and Supply Dynamics
8.7.1 The demand of foodgrains by 2016-17 and 2020-21 had been projected at 257 and 277 million tonnesrespectively by the Twelfth Plan working group on CropHusbandry, Demand and Supply Projections, AgriculturalInputs and Agricultural Statistics. Given the present levelof cereal production, it seems attainable except somedeficiency in pulses. The projection for oilseeds to meetdemand for vegetable oils by the working group was 59million tonnes for 2016-17 and 71 million tonnes for2020-21. A major deficiency is likely to happen in thecase of vegetable/ edible oils where domesticconsumption increased to 21.71 million tonnes in 2014-15 and which was met from imports to the extent ofnearly 59 per cent, costing about Rs.55,800 crore.Therefore, there is an urgent need to provide a focuseddevelopment and policy support to this sector.Thefoodgrain production for the year 2015-16 is expectedto be at 253.16 million tonnes which is about 1.14 million
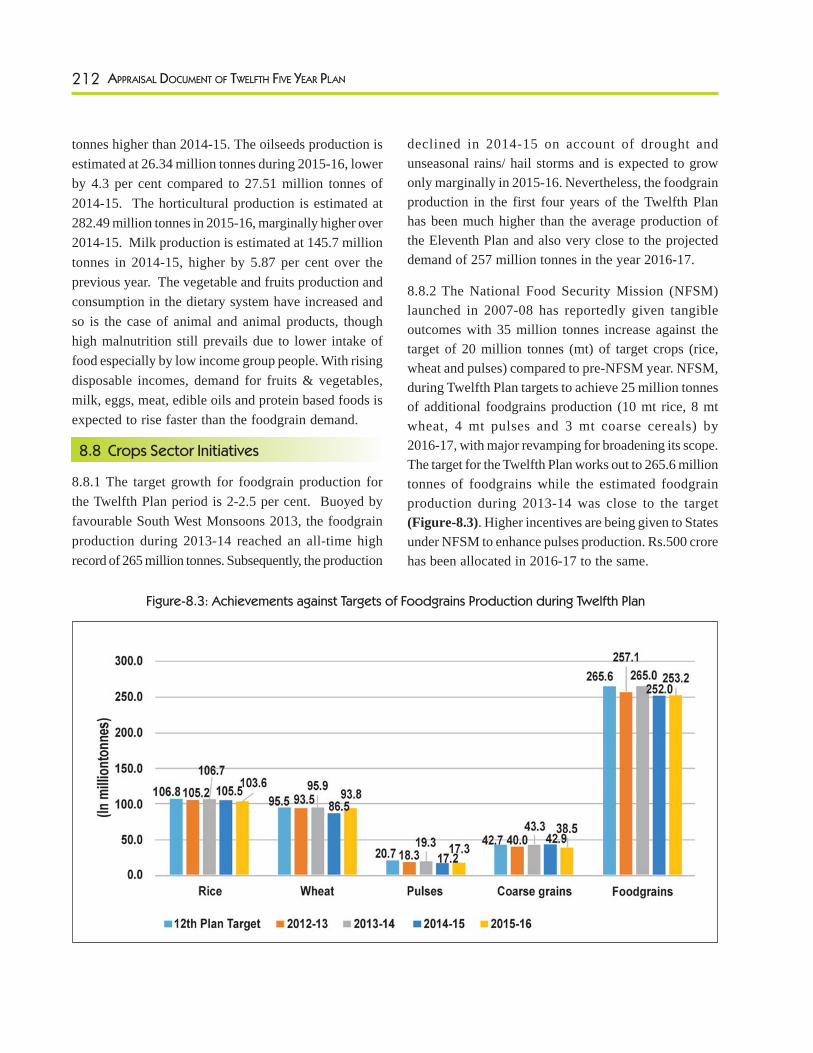
212 APPRAISAL DOCUMENT OF TWELFTH FIVE YEAR PLAN
tonnes higher than 2014-15. The oilseeds production isestimated at 26.34 million tonnes during 2015-16, lowerby 4.3 per cent compared to 27.51 million tonnes of2014-15. The horticultural production is estimated at282.49 million tonnes in 2015-16, marginally higher over2014-15. Milk production is estimated at 145.7 milliontonnes in 2014-15, higher by 5.87 per cent over theprevious year. The vegetable and fruits production andconsumption in the dietary system have increased andso is the case of animal and animal products, thoughhigh malnutrition still prevails due to lower intake offood especially by low income group people. With risingdisposable incomes, demand for fruits & vegetables,milk, eggs, meat, edible oils and protein based foods isexpected to rise faster than the foodgrain demand.
8.8 Crops Sector Initiatives
8.8.1 The target growth for foodgrain production forthe Twelfth Plan period is 2-2.5 per cent. Buoyed byfavourable South West Monsoons 2013, the foodgrainproduction during 2013-14 reached an all-time highrecord of 265 million tonnes. Subsequently, the production
declined in 2014-15 on account of drought andunseasonal rains/ hail storms and is expected to growonly marginally in 2015-16. Nevertheless, the foodgrainproduction in the first four years of the Twelfth Planhas been much higher than the average production ofthe Eleventh Plan and also very close to the projecteddemand of 257 million tonnes in the year 2016-17.
8.8.2 The National Food Security Mission (NFSM)launched in 2007-08 has reportedly given tangibleoutcomes with 35 million tonnes increase against thetarget of 20 million tonnes (mt) of target crops (rice,wheat and pulses) compared to pre-NFSM year. NFSM,during Twelfth Plan targets to achieve 25 million tonnesof additional foodgrains production (10 mt rice, 8 mtwheat, 4 mt pulses and 3 mt coarse cereals) by2016-17, with major revamping for broadening its scope.The target for the Twelfth Plan works out to 265.6 milliontonnes of foodgrains while the estimated foodgrainproduction during 2013-14 was close to the target(Figure-8.3). Higher incentives are being given to Statesunder NFSM to enhance pulses production. Rs.500 crorehas been allocated in 2016-17 to the same.
Figure-8.3: Achievements against Targets of Foodgrains Production during Twelfth Plan
213AGRICULTURE AND RURAL TRANSFORMATION
8.8.3 The National Food Security Mission (NFSM) hasperformed well in the irrigated areas though impact onproductivity in many districts has been lower thanexpectations. During Twelfth Plan, larger focus is onpulses and coarse cereals, which are predominantlygrown under rainfed conditions. To make the impact ofNFSM sustainable, it needs to move away from packagedemonstrations of established technologies and knownpractices to new technologies related to conservationand water positive agriculture, with concurrent backupof research. The value chain integration of smallproducers through FPOs, for sustaining the pulses andoilseeds production is essential. The focus on nutri-grainsshould get sharper under strategic research componentof NFSM, along with climate resilient technologies.Whileefforts to develop high protein maize, and micronutrientrich rice and wheat, etc. are going on with a strongsuccess in high protein maize, the efforts to popularizethese have been limited. The first pilot on nutri-cerealswas initiated in 100 high malnutrition laden districts in2012-13 on bio-fortified food crops. Its procurement wastied up with Small Farmers Agri-business Consortium(SFAC), for supply to Mid-Day Meal Programme. Suchpilots need to be scaled up under National Food SecurityMission, though it entails great deal of support fromNational Agricultural Research System.
8.8.4 The special efforts to enhance productivity of ricebased cropping systems in eastern States (Assam, Bihar,Chhattisgarh, Jharkhand, Odisha, Eastern Uttar Pradeshand West Bengal) should continue under the BringingGreen Revolution to Eastern India (BGREI) programme.A record production of 54.93 million tonnes of rice inimplementing States during 2015-16 was achieved.However, these States should focus more on creatingassets especially water storage and lifting devices, forhigher surface water retention and utilization to sustaingrowth in productivity. Interventions should be forutilization of surface water potential, well integrated withrecently launched Pradhan Mantri Krishi Sinchai Yojana(PMKSY) rather than merely on demonstration of welladopted technologies. The procurement system of riceand alternative crops like oilseeds and pulses should alsobe strengthened in the region to provide remunerativereturns to farmers.
8.8.5 The envisaged growth in oilseeds during theTwelfth Plan is 5 per cent. The restructured NationalMission for Oilseeds and Oil Palm (NMOOP) has beenlaunched to achieve 35.51 million tonnes of oilseeds by2016-17, with flexibilities for introducing innovativemeasures; and by involving private sector. A major issuein oilseeds sector, besides low productivity, is lowrecovery of oil from oilseeds. NMOOP, besides focusingon critical inputs for productivity gains, should alsopromote efficient tools/techniques for oil extraction, asbeing done for tree borne oilseeds(TBOs). The oilpalmand other TBOs should be promoted with higherinvestments. These crops are also very helpful inutilization of waste lands, as well as to fetch higher yieldof edible oil. The oilseed programme needs to be fundedmore to enhance domestic production to meet burgeoningneeds and reduce imports.
8.8.6 Several ongoing schemes on horticulturaldevelopment have been subsumed under Mission forIntegrated Development of Horticulture (MIDH), withgreater flexibility to States for achieving envisagedgrowth of 5 per cent in horticulture during Twelfth Plan.The availability of fruits and vegetables has increasedfrom 158 gram to 190 gram and 309 gram to 349 gram,respectively during 2007 to 2013. The vegetable clustersprogramme started as a sub-scheme of RKVY hasproved effective in linking small farmers to value chainand should be made a major initiative under MIDH. Thespecific areas like accreditation of nurseries and qualityplanting material, higher productivity along with qualityenhancement should get priority, besides creation ofinfrastructure for reducing post-harvest losses.TheNational Horticulture Mission (NHM) will be co-terminuswith the Twelfth Plan, hence institutional strengtheningshould be the core agenda to carry forward thehorticultural development by the States. The Schemesof National Horticulture Board (NHB) and CoconutDevelopment Board (CDB) which are part of MIDH needto be continued beyond Twelfth Plan to achieve theirfull mandate and goals.
8.8.7 Rashtriya Krishi Vikas Yojana (RKVY) hasundoubtedly been a star performer in terms of flexibilityaccorded to States. The scheme has yielded significant
214 APPRAISAL DOCUMENT OF TWELFTH FIVE YEAR PLAN
results in majority of States boosting agricultural growth.Several out of the box initiatives for infrastructuredevelopment, like rural godowns in U.P., public privateprojects for production of pulses in Maharashtra,agricultural marketing in Andhra Pradesh and Karnataka,farm ponds (diggies) in Rajasthan, etc. were taken up,which proved quite rewarding. However, in majority ofthe States, the formulations of the projects could notalign with the problems identified under RKVY. The largerinvestment in finding out permanent solutions for waterscarcity, through water positive infrastructures/interventions were somehow missing, though 15 percentfunds were given to States on the basis of higherunirrigated areas. The identification of projects, werelargely not based on well-studied/analysed informationas demanded in the form of Comprehensive DistrictAgricultural Plan (C-DAP) and State Agricultural Plan(SAP). The sectoral imbalance in allocation,being tiltedtowards crops and less for animal husbandry and fisheries,has been yet another concern raised by majority ofStates. The investment under RKVY should move awayfrom recurring expenses on established technologies,towards innovations and investmenton infrastructure formarketing, storage and processing of food crops, milkand milk products, meat, egg, fish, etc. Accordingly,the institutional set up needs to be strengthened in manyStates.
8.8.8 Crop Diversification has been much talked aboutsince 1990s, especially in original green revolution areas.Responding to the market signals, farmers have shiftedareas away from foodgrains to more remunerativecommercial and horticulture crops. Present increase inthe cultivated land has been on account of croppingintensity, while net sown area has declined slightly. Thedouble cropping increased by about 63.21 million hasince 1950-51, primarily by rice and wheat (33.33million ha), oilseeds (15.75 million ha), pulses (7.13million ha), while coarse cereals reduced by 11.05 millionha. The area under other crops that largely includehorticulture/plantation crops, spices, fodder, etc. increasedby 7.10 million ha. Although a silent diversification,primarily driven by market forces, did take place but nodedicated instrument for designed diversification is inplace. It holds promise, in view of the depleting natural
resources, but requires efficient marketing systems andsupport services (post-harvest management, processingand value chain).
8.8.9 With adequate reserves of rice and wheat, it ispossible to focus on designed diversification from riceand wheat in North Western States to low waterdemanding crops and activities. The integrated farming,including crops, livestock/fish culture and allied business,is the appropriate way to deal with the situation. A specialplan on crop diversification was initiated under RKVYduring 2013-14 in Punjab (20 districts), Haryana (10districts) and Western U.P. (15 districts) to shift areafrom paddy to alternative crops to arrest the depletionof ground water and restoration of soil fertility; thelearnings of which may provide a base for furtherexpansion of the diversification plans. Pooling ofresources and synergy amongst programmes of ruraldevelopment (land and water issues), agriculture(production, marketing and input support), post-harvestindustries (processing, abattoirs), water resources, etc.will be a prerequisite for significant success in thisendeavour. The immediate need is to improve themarketing and storage facilities for alternative crops inthese States. Reforms in marketing, land leasing, tenancylaws and risk management are crucial to change themindset of farmers to make more investments inalternative crops/ enterprises (oilseeds, pulses,horticulture and livestock), especially in rainfed regions.
8.9 Price Support for Agricultural Commodities
8.9.1 The Minimum Support Prices (MSPs) of variousrabi and kharif crops have risen sharply during theEleventh Plan and the first year of the Twelfth Plan.These have helped farmers to get remunerative returnsfor their efforts. Over and above, many StateGovernments announced additional bonus onprocurement of wheat and rice. While increasingproduction, this also led to higher procurement andconsequent increase in central pool stocks of wheat andrice, much above the buffer norms, as also therequirement under the National Food Security Act(NFSA). Sharp increases in MSPs, higher central poolstocks and lower open market availability also led to
215AGRICULTURE AND RURAL TRANSFORMATION
rise in prices of certain food items particularly during2012-13 and 2013-14. While Government tried tomoderate open market prices of food items by enhancingsales under Open Market Sales Scheme (OMSS) during2013-14, such initiatives need to be used more as anexception rather than rule. This also has implications onfiscal deficit as difference between economic cost ofcereals and issue prices under OMSS and PublicDistribution System (PDS) is large and widening. Goingforward, it would be pertinent that there is carefulcalibration of MSPs to balance the interests of farmersand consumers. The emphasis should be such that openmarket prices are higher than the MSPs so that dependenceon Government procurement is limited. Besides, in manyStates, it has been observed that procurement by centralagencies is limited or non-existent while market prices ofmany commodities often fall below MSP. For suchregions, it is imperative that price support system bestrengthened so that farmers need not resort to distresssale.It must be ensured that the farmers get a larger pieof the prices paid by the ultimate consumers.
8.10 Livestock and Fishery
8.10.1 Livestock contributes 29 per cent of Gross ValueAdded in the agriculture sector and provides self-employment to about 15.6 million people. The averagegrowth of livestock output was 4.8 per cent per annumduring the Eleventh Plan. The Twelfth Plan envisaged agrowth of 5-6 per cent in this sector, comprising of 5per cent in milk production, 2-3 per cent in rural poultry,11 per cent in commercial broilers, 7 per cent in layersand 6 per cent in fisheries. To achieve such growthrates, some of the major initiatives like enhancing theartificial insemination from 25 to 50 per cent, 100 percent high genetic merit bull replacement, enhancing theinland fisheries productivity from present level of 1mt/hato 3-4 mt/ha through judicious use of inputs, etc. arerequired. Major issues in livestock sector are access tofeed, fodder and all the more drinking water which isbecoming increasingly scarce in rainfed areas that supportabout 75 per cent of the livestock population. Theongoing programmes of Department of AnimalHusbandry, Dairying and Fisheries have been revampedunder three Centrally Sponsored Schemes-National
Livestock Mission, National Programme for BovineBreeding and Dairy Development (NPBBDD) andLivestock Health and Disease Control and a CentralSector Scheme-National Fisheries Development Board(NFDB), with more flexibility to States through cafeteriaof interventions. These programmes have starteddelivering good results and need to be continued in theremaining period of Twelfth Plan with more balancedstate-wise distribution of assistance, instead of goingentirely by demand driven approach. While enhancingthe allocation to this sector will be a strong case to beconsidered, there is a need to strengthen institutions andmarketing, processing (abattoirs), quality and sanitarystandards for the sector. The conservation of indigenousbreeds, processing and value addition in milk and milkproducts and strengthening of milk cooperatives requireutmost priority. Rashtriya Gokul Mission launched in2014-15 is an important initiative for conservation ofindigenous breeds.
8.10.2 Timely availability and reliability of data is animportant concern. The data released with some delayserves limited purpose for appropriate policy decisions.It is, therefore, pertinent that immediate action forstreamlining the procedures of data collection are takenby the concerned departments, with suitable blendingof remote sensing and satellite information tosynchronize the estimates for crops, fruits andvegetables, etc.
8.10.3 The National Fisheries Development Board(NFDB) has been set up as a special purpose vehiclefor development of fisheries sector in the country.However, the programmes and broader contours ofthe NFDB need to be balanced. There is also a need tofocus on specific areas of fisheries information systemincluding reliable data base, comprehensive fisher-folksafety net, infrastructure in the domestic wholesale andretail fish markets, setting up of modern fish processingplants, re-engineering of the value chain and valueaddition for higher income and investment ininfrastructure through Public Private Partnership (PPP)mode. With marine fisheries facing serious constraints,the main source of future growth in fisheries sectorhas to be inland fisheries.
216 APPRAISAL DOCUMENT OF TWELFTH FIVE YEAR PLAN
8.11 Rainfed Agriculture
8.11.1 The ultimate irrigation potential is 139.91 millionha while the gross cropped area (GCA) was 195.25 mha in 2011-12. This indicates that even with full utilizationof the Irrigation potential about 28 per cent of grosscropped area would remain rainfed, if GCA stagnates at2011-12 level. The National Mission for SustainableAgriculture (NMSA) launched during the Twelfth Plan,aims at mainstreaming rainfed technologies includingagro-forestry through location specific integrated/composite farming systems. It seeks to transform Indianagriculture into a climate resilient production systemthrough suitable adaptation and mitigation measures.NMSA has a strong component of on-farm watermanagement for efficient water application tools andother practices to enhance the on-farm water useefficiency and micro-irrigation which has been extendedto non-horticultural crops also. A target of 3.64 millionha under micro-irrigation has been kept under NMSAfor Twelfth Plan. However, major investment in researchand development that enhances water use efficiency isrequired. A pilot on management and sharing of resourcesof commons through stronger involvement ofcommunities, civil society groups and reputed NGOs isenvisaged in 29 blocks (one in each State) along withleveraging of funds from other schemes like MGNREGS,Integrated Watershed Management Programme (IWMP)etc. A strong mechanism for research backup in NMSAneeds to be built up to assess the impact of climate changeand respond appropriately. Specific focus on improvingthe productivity of problem soils and suitability to farming,preferably under PPP model as successfully implementedin some States, needs to be mainstreamed.
8.11.2 Agroforestry integrates trees and shrubs onfarmlands and rural landscapes to enhance productivity,profitability, diversity and ecosystem sustainability.National Agroforestry Policy, 2014 will help in developingpolicies related to harvesting and marketing of farmforestry produce, which have been important factors inpromotion of farm forestry and restoring ecologicalservices (carbon sequestration) and improving theincome and livelihoods of rural households, especiallythe small farmers.
8.12 Linking Small Farmers to Value Chain
8.12.1 The Twelfth Plan emphasised on encouragingformation of Farmers Producers Organization (FPOs)to create enabling environment to successfully deal witha range of challenges that small and marginal farmersconfront today. Small Farmers’ Agribusiness Consortium(SFAC) was mandated to lead a national pilot project, topromote FPOs as a demonstration of the benefits ofbuilding institutions of producers and their integrationin agri-value chains. Since inception in 2011, the FPOproject has helped to mobilize approximately 8.98 lakhfarmers in about 910 FPOs by September, 2015. Farmershave responded enthusiastically to the message ofaggregation and in implementing the pilot project. Thevital ecosystem put together to support FPOs includesequity grants, credit guarantee fund for facilitating loansto FPCs, inclusion of dairy and poultry as eligibleactivities, nomination of SFAC as procurement agencyto buy pulses and oilseeds under price supportoperations, inclusion of FPOs under Gramin BhandaranYojana and making them eligible for grants under RKVYfor building critical infrastructure.These initiatives needto be scaled up in the remaining period of the TwelfthPlan.
8.13 Technology and Research
8.13.1 The future growth in agriculture will primarilybe knowledge and technology driven. This demandsmore investment in agricultural R&D, innovations andinstitutions to bring about significant change intechnologies for resource conservations and productivityenhancement. During Eleventh Plan, the investment onAgri-R&D was about 0.7 per cent of agri-GDP whichneeds to be enhanced to 1 per cent of agriculture GDPby end of the Twelfth Plan.There has been slowprogress in finalizing the new and existing projects forresearch during the first three years of the TwelfthPlan which needs a serious review. Besides, reformsin Agri-R&D should be the major agenda for theremaining period of Twelfth Plan and beyond. Despitelow participation in agriculture R&D, private sectorhas come out with some impressive technologies likeBt cotton and hybrids in maize and vegetables. Private
217AGRICULTURE AND RURAL TRANSFORMATION
sector need to be facilitated and encouraged to investmore in R&D in the country.
8.13.2 The multiplicity of institutions with overlappingactivities in agriculture research and structuralreorientation of Krishi Vigyan Kendras (KVKs), etc. aresome of the core issues that require immediate attention.KVKs should promote village level knowledge andentrepreneurship models through shared investment toempower the farmers not only as users of technologybut also as producers of knowledge. In order to improvethe efficiency and performance of KVKs, a national levelcompetition has been proposed in Union Budget 2016-17 to be held among 668 KVKs with a total prize moneyof Rs.50 lakh. Similarly, agriculture extension in theStates needs overhauling to appreciate the technologicaldevelopment and its dissemination amongst farmers, witha proper feedback to research system on adoption of thetechnologies. National Mission for Agriculture Extension& Technology (NMAET) needs to catalyse focus ontechnology in agri-extension. A large number of newvarieties are developed each year through public fundingevery year but often not adopted by the farmers due tolack of confidence in the variety, poor dissemination,issues in varietal identification, breeder seed productionand further multiplication and distribution.
8.13.3 Transformation in agricultural education to makeit more inclusive for rural entrepreneurship and havingstrong organic linkages with Higher EducationProgrammes of Ministry of Human Resources is alsorequired. Several ambitious programmes and institutionsof upstream research have been commissioned duringTwelfth Plan, but are yet to take off due to limitedresources available. These programmes along with otherinitiatives such as Agriculture Technology ForecastCentre (ATFC), Agri-Innovate India etc. need to beimplemented on priority. The proliferation of StateAgricultral Universities (SAUs) and disintegration intoVeterinary and Horticultural universities need a thoroughreview by the States, under the guiding principle ofintegrated farming practices adopted by the farmers.The focus also needs to shift from incremental researchto transformational research.
8.13.4 One of the problems of slow progress ofagriculture in eastern region has been low outreach of
the institutions and technologies leading to lowerproductivity in spite of abundant natural resources. Theestablishment of Institutions of excellence on the patternof IARI in Assam and Jharkhand for spearheadingresearch in Agriculture is an important move. The StateAgricultural Universities are also proposed to beestablished in Andhra Pradesh and Rajasthan; andHorticulture Universities in Telangana and Haryana forbetter outreach but their linkages with industry and otherstakeholders to conduct user centric research need tobe prioritised.
8.14 Inputs and Mechanisation
8.14.1 Between 2007-08 and 2013-14, the quality seeddistribution registered an increase ranging from48 per cent in cereals to 360 per cent in potatoes. Thephenomenal growth could be due to incentivization ofseed distribution during the Eleventh Plan period. Thegrowth in total breeder seed production has beenimpressive. However, segregation into breeder seedsof newly released varieties and of the seeds alreadygrown by the farmers, is a case to be studied todistinguish between old and new varieties. A mismatchbetween supply of indented breeder seeds of Centraland State released varieties and the multiplication intocertified seeds raises issues on the multiplication capacityof seed producing agencies at national and states levels,which needs to be rectified in the remaining years ofTwelfth Plan. Further, the seed sector requires reformslike indenting procedure, multiplication, certification andmarketing. The public sector technology generationprocesses, including of the varieties should be reorientedto effectively meet demand by farmers, as has been thecase of private sector. Seed is a critical input forenhancing productivity, hence efforts are essential inensuring its timely availability. A suitable blend of newvariety seeds, in the Seed Replacement Rate (SRR) isthe most desired but has been largely missing. Theparticipatory seed production programme with adequatepricing and marketing facilitation, is also required toinfuse new varieties in the seed chain. In addition,comprehensive and authentic database on seedproduction and distribution in India, by public and privatesectors needs to be built for the benefit of all the
218 APPRAISAL DOCUMENT OF TWELFTH FIVE YEAR PLAN
stakeholders. Massive research is also required inmodifying seed varieties including genetically modifiedones which have been a good success in many countriesbesides our own experiences in BT cotton.
8.14.2 Under the amended New Policy on SeedDevelopment (NPSD), some vital initiatives have beentaken. These include permitting 100 per cent ForeignDirect Investment (FDI) under the automatic route andsimplifying the procedure for inclusion of new varietiesin the Organisation for Economic Cooperation andDevelopment (OECD) Seeds Scheme. The thrust is alsoon creating a seed bank. A Seed Rolling Plan for theperiod up to 2016-17 is also in place for all the Statessince 2013-14 for identification of good varieties forthe seed chain, and agencies responsible for productionof seeds at every level.
8.14.3 The consumption of fertilizers has increased from20.34 million tonnes in 2005-06, to 26.75 million tonnes in2015-16. The average consumption of fertilizers has alsoincreased from 105.5 kg. per ha. in 2005-06 to 130.66 kgper ha in 2015-16. However, India’s consumption ismuch lower than that of Pakistan (205 kg per ha) andChina (396 kg per ha). The fertilizer use has also beenhighly skewed towards nitrogenous fertilizers leadingto serious imbalance among Nitrogen, Phosphorous andPotassium (N, P and K) in some States of the country.With a view to encourage balanced use of fertilizers,Government had introduced Nutrient Based Subsidy(NBS) policy from April 2010, under which a fixed rateof subsidy was announced on nutrients (N, P, K and S),but urea had been kept out of the NBS. Consequently, theprice of urea is much lower than that of other fertilizers,which has resulted in excessive use of urea, therebydistorting the balanced application norms even more.The Twelfth Plan document had strongly emphasizedto move towards a Nutrient Based Subsidy regime forurea. However, the same has not been implemented sofar. It is desirable that the same is implemented in theremaining period of the Twelfth Plan. The Medium TermFiscal Policy Statement, released as part of Union Budget2015-16, has also emphasized pricing reforms of ureasector, from the viewpoint of not only the size of subsidybill, but also balanced use of N, P and K nutrients.
Besides, the issue of gas availability for production ofurea also needs to be sorted out at the earliest.
8.14.4 The Shanta Kumar Committee on restructuringof Food Corporation of India has submitted its Reportto the Government in January, 2015. The Committeehas emphasized that in the long run urea prices mayneed to be de-controlled while subsidy could be givendirectly to farmers using Aadhaar-based authentication/Direct Benefit Transfer mechanism. This is also expectedto help in checking diversion of urea to non-agriculturaluses as well as to neighbouring countries. TheCommittee has recommended a flat subsidy of Rs.7,000per ha to farmers followed by deregulation of the fertilizersector. With a view to improve the quality of servicedelivery to farmers, the Union Budget 2016-17 hasproposed to introduce DBT on pilot basis for fertilizerin a few districts across the country.
8.14.5 Farm mechanization is essential to face thedecline in availability of labour in agriculture, economisethe farming and labour usage in agricultural operations.States with higher farm power availability have, ingeneral, better productivity. However, decreasing trendin operational land holdings, high cost and lower creditworthiness of small holdings reduces benefits of farmmechanization. Use of farm machinery is also dependenton the availability of other infrastructural services in therural areas. Recognizing the need to spread the benefitsof agricultural mechanization among all strata of farmers,promotion of ‘Custom Hiring Centre’ (CHC) foragricultural machinery, is implemented under NationalMission for Agricultural Extension & Technology. Themajor challenge in CHCs will be maintenance ofmachinery, equitable distribution of services to all usersand collection of user charges to facilitate upkeep, up-gradation and further additions. Apart from fieldoperations, the post-harvest engineering should also getlarger focus.
8.15 Irrigation
8.15.1 The indiscriminate and excessive usage of waterresources is leading to alarming reduction in the watertable in the Punjab and Haryana region, which is a matterof concern. Currently 66.10 million ha i.e. 47 per cent
219AGRICULTURE AND RURAL TRANSFORMATION
of net cropped area is irrigated in the country. Anirrigation potential of 85.03 lakh ha is estimated to havebeen created by States from major/medium/minorirrigation projects under the AIBP till March 2013.Multiple programmes are operating for development ofsurface, groundwater resources and also enhancing theapplication use efficiency of the irrigation water butwithout any convergence for resource sharing andbringing synergy. A strong case exists to develop a matrixfor convergence amongst different programmes anddepartments based on comprehensive information of allwater bodies and reservoirs. In this context, UnionBudget 2016-17 has also proposed fast tracking of 89irrigation projects under AIBP which will help to irrigate80.6 lakh hectares. Of these 23 projects are proposedto be completed before 31st March, 2017.
8.15.2 Pradhan Mantri Krishi Sinchai Yojana (PMKSY)has been announced in 2015-16. The PMKSY aims toensure access to protective irrigation to all agriculturalfarms through water harvesting and recycling withincreased water application efficiency to achievemaximum water productivity i.e., per drop more crop.The focus of PMKSY is on end-to-end solution inirrigation supply chain, viz. water sources anddistribution network and farm level applications. ThePMKSY will provide an overarching management andgovernance for convergence amongst the programmesof agriculture, water resources, land resources and otherdepartments dealing with water and energy. An allocationof Rs. 7,299 crore was provided in 2015-16 to supportmicro-irrigation, watershed development and PMKSY-AIBP. The States have been urged to contribute on thisfurther. A total of 28.5 lakh ha is expected to be broughtunder irrigation under this scheme.
8.15.3 The Union Budget 2016-17 has proposed adedicated Long Term Irrigation Fund in NABARD withan initial corpus of about Rs.20,000 crore.Simultaneously, a major programme for sustainablemanagement of ground water resources has beenprepared with an estimated cost of Rs.6,000 crore andproposed for multilateral funding. In addition, at least 5lakh farm ponds and dug wells in rain fed areas and 10lakh compost pits for production of organic manure are
proposed to be taken up by making productive use ofthe allocations under MGNREGA.
8.16 Improvement in Soil Resources
8.16.1 Recently, Government has launched a CentralSector Scheme on soil health card with a proposedallocation of Rs.569 crore. The programme for SoilHealth cards aims at better productivity and more incometo farmers through augmentation of capacity of soilanalysis and preparation of soil fertility status ofindividual farms and consequently rationalising the useof fertilizers.The target is to cover all 14 crore farmholdings by March 2017. Besides, 100 more MobileSoil Testing Laboratories will be established. UnionBudget 2016-17 has also proposed to provide soil andseed testing facilities at 2,000 model retail outlets offertilizer companies during the next three years.
8.17 Organic Farming
8.17.1 Organic farming attempts to reduce or eliminateexternal agricultural inputs, especially synthetic ones andrelies on ecosystem management. The intensive uses ofinorganic fertilizers, pesticides and other inputs formaximizing agri-production were necessitated to meetthe consumption requirement of growing population.However, indiscriminate use of chemical inputs hasbecome serious hazard to human life. Growing concernabout sustainable production with eco-friendly inputsuse, has brought organic farming in sharp focus whichoffers an attractive opportunity to small farms, also inview of the premium price tag, provided the marketingand quality organic input supply are ensured. TheOrganic Farming has been identified a priority area forthe North Eastern Region where large agriculturalproduce are luckily organic by default. To sustainorganic farming, higher investment for secondaryprocessing and capacity building with input support isrequired. Towards this end, the Government haslaunched two important schemes. First, the‘Parmparagat Krishi Vikas Yojana’ which will bring 2lakh acres under organic farming over a three yearperiod. Second, a value chain based organic farmingscheme called “Organic Value Chain Development inNorth East Region” has been launched.
220 APPRAISAL DOCUMENT OF TWELFTH FIVE YEAR PLAN
8.18 Climate Change Challenge
8.18.1 Recent studies at Indian Agricultural ResearchInstitute (IARI) indicated the possibility of loss of 4-5million tonnes in wheat production with every rise of1oC temperature throughout the growing period evenafter considering carbon fertilization (but no adaptationbenefits). Increase in temperature in future is likely toreduce fertilizer use efficiency, aggravate the heat stressin dairy animals adversely affecting their productive andreproductive performance, and limit effective area wherehigh yielding dairy cattle can be economically reared.Increasing sea and river water temperature is likely toadversely affect fish breeding, migration, and harvests.
8.18.2 National Initiatives on Climate ResilientAgriculture (NICRA) was launched in February, 2011to undertake strategic research and demonstration ofproven climate resilient technology. It has made someachievements, like collection of real time data on cropand weather and district level contingency plans andagro-advisory mechanism and pilot testing of block levelagro advisory system, linked to real time weathermonitoring in Belgaum district of Karnataka. Weatherindices for wheat, cotton and groundnut have also beendeveloped for improving the weather insurance products.First ever district-level vulnerability atlas, presentingrelative vulnerability of 572 rural districts of India interms of sensitivity, exposure and adaptive capacity toprioritize investments and plan for research on adaptationinterventions, has also been developed. NICRA andNMSA are two important programmes in Research &Development for implementing the national adaptationplans in agriculture and need to be continued. In addition,the Earth System Science Organization (ESSO) issuesagro-meteorological advisories in 12 languages to 600districts and is subscribed to by over 4.8 million farmers,while Gramin Krishi Mausam Sewa is providing theseadvisory services at block level. The newly launchedKisan TV channel should provide a platform todisseminate these advisories countrywide. However, theresponse to climate change induced calamities, availablein terms of relief measures are largely confined to inputsubsidy and to a limited extent in the form of cropinsurance. These are perceived to be grossly inadequate
and require some long term planning with multi-prongedapproach. Accordingly, transparent relief measures needto be put in place as a social service. The farmers’database needs to be linked with Aadhaar seeded bankaccounts and a minimum specified sum of cash needsto be transferred into these accounts in the event ofnatural calamity.
8.19 Agricultural Wages, Credit and Insurance
8.19.1 Agriculture is labour intensive as about 40 percent of the total variable cost of cultivation is accountedfor by labour and hence availability of labourers to workin agriculture is crucial to sustain farming activities.Agricultural wages are low due to productivity itselfbeing low. In recent years there has been a perceptiblechange in this trend due to economic growth and adoptionof employment generation programmes besides increasein wages under the Minimum Wages Act. However,agricultural wages, in general, are still lower than theindustrial wages. With skill development, this gap willnarrow down, putting further pressure on availabilityand cost of agricultural labour. This strengthens thenecessity for agricultural mechanization in a manner thatis inclusive and suitable for small farmers who compriseabout 85 per cent of total land holdings in the country.
8.19.2 The target of doubling of the flow of agriculturalcredit in three years with base year as 2004-05 wasachieved in two years. Agricultural credit flow furtherincreased consistently to reach Rs.7.3 lakh crore in2013-14. The target for 2014-15 was set at Rs. 800,000crore and for 2015-16, it has been further upscaled toRs. 8,75,000 crore, against which actual credit reachedto over Rs.9 lakh crore. A number of other initiativesfor enhancing flow of credit to agricultural sector havebeen put in place. The Kisan Credit Card Scheme hasbeen made broad-based to include term credit andconsumption needs, besides some risk cover againstaccidental death. The interest subvention scheme forshort-term crop loans upto Rs.3 lakh, has been continuedand a farmer who repays the loan on time, becomeseligible to get crop loan at 4 per cent rate of interest.Post-harvest loans are also being granted againstNegotiable Warehouse Receipts (NWRs) with benefit
221AGRICULTURE AND RURAL TRANSFORMATION
of interest subvention. In the Union Budget 2015-16,Rs.25,000 crore has been allocated towards RuralInfrastructure Development Fund (RIDF); Rs.15,000crore for Long Term Rural Credit Fund; Rs.45,000 crorefor Short Term Co-operative Rural Credit RefinanceFund and Rs.15,000 crore for Short Term RRB RefinanceFund. For micro and small units, particularly in theinformal sector, Micro Units Development RefinanceAgency (MUDRA) Bank has been set up with a corpusof Rs.20,000 crore. The Bank would refinance Micro-Finance Institutions through Pradhan Mantri MudraYojana. These initiatives expected to ease the credit flowfor agricultural and rural sectors need to be effectivelyimplemented during the remaining period of the TwelfthPlan.
8.19.3 As a major initiative of the Government, PradhanMantri Jan Dhan Yojana (PMJDY) was launched inAugust, 2014. The objective of the scheme is to ensureaccess of people to various financial services like basicsavings bank account, need based credit, remittancefacility, insurance and pension to the excluded sectionsi.e. weaker sections and low income groups. PMJDY isa National Mission on Financial Inclusion encompassingan integrated approach to bring about comprehensivefinancial inclusion of all the households. The Plan alsoenvisages channelling of all Government benefits to thebeneficiaries’ accounts and benefitting from the DirectBenefits Transfer (DBT) scheme of the UnionGovernment. The scheme would address technologicalissues like poor connectivity and facilitate on-linetransactions. By 16th March, 2016, about 21.3 crore bankaccounts have been opened under the scheme withoutstanding balance of Rs. 34,842 crore while 17.6 croreRuPay Debit cards have been issued. This scheme isexpected to go a long way in empowering people andimproving efficiency in delivery of benefits. TheEconomic Survey 2014-15 and 2015-16 have highlightedthe importance of “JAM” (Jan Dhan Yojana, Aadhaarand Mobile numbers) trinity to effectively target thepublic resources to the people who need them the most.
8.19.4 The multiplicity of insurance schemes (NationalAgricultural Insurance Scheme, Modified NationalAgricultural Insurance Scheme, Weather Based Crop
Insurance Scheme and Coconut Insurance Scheme) hasbeen revamped into National Crop InsuranceProgramme. While it will add value and address problemsmore effectively, still this instrument available for riskmanagement needs to be made more extensive, efficientand effective to cover the risk of individual farmers,more so of non-loanee farmers in the vulnerable areas.States are reluctant to notify a smaller unit area (such asa village) because of increased requirements of theminimum number of crop cutting experiments that haveto be undertaken, which is both costly and timeconsuming. In order to address the problems faced bythe farmers especially regarding insurance, a newPradhan Mantri Fasal Bima Yojana (PMFBY) has beenlaunched in January, 2016 which needs to beimplemented across all States/ UTs at the earliest.
8.19.5 In order to achieve comprehensive social securityfor all, especially the poor, Government has launchedthree schemes viz. Pradhan Mantri Suraksha BimaYojana, Pradhan Mantri Jeevan Jyoti Beema Yojana andAtal Pension Yojana. The premiums charged under theseschemes are very nominal. The enrolments under theschemes have been very encouraging and can be furtherexpanded to cover a large segment of the population.
8.20 Agricultural Prices and Marketing
8.20.1 Wide gap between the prices received by thefarmers and paid by the consumers in the agriculturalproduce markets is an unfortunate reality. Imperfectmarket conditions, restrictions on the movement ofagricultural commodities due to regulatory issues,infrastructural constraints, transport bottlenecks and localtaxes push up retail prices. Direct marketing by farmersand contract farming are some of the options forreducing large price spread between farm harvest pricesand retail prices. It is necessary that direct marketingand contract farming are promoted to facilitate enhancedshare of producers in consumer’s rupee. Contractfarming also has considerable potential in terms offarmers’ access to modern technology, quality inputsand marketing support through contractual agreementbetween processing and/or marketing firms forproduction support at predetermined prices. Price
222 APPRAISAL DOCUMENT OF TWELFTH FIVE YEAR PLAN
volatility in select commodities has been a matter ofconcern, which needs to be addressed through astructured programme on price stabilization and by givingmore space to producers for storage, technicalbackstopping and direct marketing.
8.20.2 Reforms in agricultural marketing were initiatedto ease restrictive and monopolistic approach of StateGovernments to agricultural markets, reduceintermediaries in supply chain and enhance private sectorinvestment, especially in post-harvest marketinginfrastructure. However, many States are yet to adoptthe model Agricultural Produce Marketing Committee(APMC) Act suggested by the Central Government in2003. Much needed provision for permitting the out-of-mandi transactions and the matter of exemption of marketfee on horticultural perishables, being pursued by theCentre with States, do not find place in the amendedstatutes in several States. The Committee of StateAgriculture Ministers, constituted by the Ministry ofAgriculture for suggesting improvements in AgricultureMarketing, has recommended that reforms andstrengthening of agricultural marketing system beimplemented on priority. Another Committee onEncouraging Investments in Supply Chains set up bythe erstwhile Planning Commission had recommendedexempting perishables from the purview of APMC,provide freedom to farmers and make direct sales toaggregators and processors, introduce electronic auctionplatforms, and replace licensees of APMC markets withopen registration backed by bank guarantees so as toensure wider choice to growers and to preventcartelisation by traders. With a view to create NationalAgriculture Market (NAM), a Central Sector Schemeon Promotion of NAM through Agri-TechInfrastructure Fund (ATIF) has been launched with anoutlay of Rs. 200 crore for 2015-16 to 2017-18. Thescheme would initially incentivize the States by wayof financial support for equipment infrastructure @Rs.30 lakhs per Mandi to enable transactions on e-platform. So far 16 States have given proposals tocover 250 Mandis. The Unified Agricultural MarketingE Platform was dedicated to the nation on the birthdayof Dr. B.R. Ambedkar on April 14, 2016.
8.20.3 The agricultural produce marketing systemssuffer from major distortions and multiplicities of levies,Mandi taxes,VAT, etc. These are neither transparent noruniform across the States and are major impedimentsfor farmers in realizing remunerative price. Karnatakahas developed a model and integrated 155 main marketyards and 354 submarket yards into a single licensingsystem with automated auction and post auction facilities.The National Agricultural Market has also been envisagedby the Government through Agri-Tech InfrastructureFund with an outlay of Rs.200 crore. This includesprovision for the DAC to supply software free-of-costto the States/UTs and for cost of related hardware/infrastructure to be subsidised by the Centre up to Rs. 30lakh per mandi (other than for private mandis). Thescheme will put in place the e-market platform for 585markets in the country. The ATIF is aimed atimplementation of agricultural marketing reforms byinitiating appropriate e-market platforms in States witha view to move towards a National Market. Reform ofthe agricultural marketing through implementation ofe-marketing platform aims to provide greater farmersatisfaction through better prospects for marketing ofthe produce, improved access to market relatedinformation and better price discovery under moreefficient, transparent and competitive marketing platformwith access to increased number of buyers from withinthe State and outside, through transparent auctionprocesses. It would also increase the farmers’ accessto markets through warehouse based sales and thusobviate the need to transport such produce to the mandi.
8.20.4 Price fluctuations, relatively in off season, havebeen a matter of concern, as it takes the prices awayfrom the purchasing capacity of average consumers.Till recently, such fluctuations were more common inperishables or semi perishables like onions, tomatoesand potatoes. Of late, steep fluctuations have beenexperienced even in the case of pulses. A PriceStabilization Fund (PSF) has been established forprocurement and distribution of perishable Agricultureand Horticultural Commodities. The Fund aims toprovide working capital and other expenses forprocurement and distribution of perishable agricultural
223AGRICULTURE AND RURAL TRANSFORMATION
and horticultural commodities and to protect the interestsof farmers as well as consumers.The MarketIntervention Scheme of the Department of Agriculturecan also be broadbased for more effective impact forthe benefit of both farmers and consumers.
8.21 Agricultural Trade
8.21.1 India is one among the 15 leading exporters ofagricultural products in the world with significant exportsof cotton, rice, meat, oil meals and sugar. Exportcompetitiveness has also been developed in specializedagricultural products like basmati rice, guar gum andcastor. In the 9th WTO Ministerial Conference held inBali, Indonesia during 3-7 December, 2013 India hademphatically argued that procurement of foodgrains withthe objective of supporting resource poor farmers shouldnot be construed as Aggregate Measure of Support(AMS), and this stand was supported by a number ofdeveloping countries.
8.21.2 Foreign Direct Investment (FDI) Policy inAgriculture aims at attracting investments in technology,machinery, equipment, seeds/planting material,warehousing and cold storages and other infrastructurelogistics; and complements public and privateinvestments necessary to bring knowledge, technologiesand services to farmers. The investments are made inthe development and production of seed and plantingmaterial, horticulture and nursery services, agriculturemachinery, plant protection services, cattle breeding andlivestock rearing, cold storage and warehousing, whichneed to be encouraged further. In order to encouragefood processing, reduce wastages of fruits andvegetables and create employment opportunities, UnionBudget 2016-17 has allowed 100 percent FDI throughFIPB route in marketing of food products produced andmanufactured in India.
8.21.3 A major issue often raised by farmers isinconsistency in the trade policy for agriculture. Manya times in the past when prices of certain agriculturalcommodity escalate sharply, Government had resorted
to export bans which devoid the farmers of theopportunity to reap the benefits. Instead of switch-onswitch-off policy, it may be more prudent that tariffand other policies, such as Minimum Export Prices, maybe adopted to the extent possible.
8.22 Land Policy and Reforms
8.22.1 The progressive fragmentation of land has madesmall holdings unsustainable which has been furtheraggravated due to degrading quality of land and waterand increased incidences of extreme climatic events.Agricultural land is also getting diverted to meet therequirement of growing economy for housing,infrastructure and industry. Therefore, higher agriculturalproduction has necessarily to come from increased landand water productivity. A prudent land use policy isrequired to make sustainable growth in agriculture withadequate water availability and soil health maintenanceat levels that are conducive to pursue agricultural activitieswith higher level of productivity.
8.22.2 Land degradation is the major threat not only tofood security but also to the environment. According toICAR estimates, about 120.4 m ha1 land in the countryis affected by various kind of land degradation; majorityof which is accounted by water and wind erosion.
8.22.3 Implementation and strengthening of laws relatingto land leasing and tenancy, computerization of landrecords, titling and formulation of policy on diversionof agricultural land for non-agricultural uses, updatingland and soil survey maps, finalization of an enablingframework for involvement of private sector in naturalresource management, and encouraging PPP in land andwatershed development programmes are, thus, urgentlyrequired. The Department of Land Resources, Ministryof Rural Development has prepared the National LandUtilization Policy, 2013 to order and regulate the landuse in an efficient and rationale manner. NITI Aayoghad constituted an Expert Group to prepare a modelLand Leasing Act to enable the states to enact their ownleasing Act based on the model. The Expert Group has
1ICAR/ NAAS publication (2010) Degraded and Wasteland of India: Status and Spatial Distribution. Page 31
224 APPRAISAL DOCUMENT OF TWELFTH FIVE YEAR PLAN
submitted its Report; action on the recommendations ofthe Group is under active consideration.
8.23 National Food Security Act (NFSA), 2013
8.23.1 In continuation of rights based approachfollowed for various other initiatives, the National FoodSecurity Act (NFSA), 2013 has been enacted with theobjective of providing food and nutritional security, inhuman life cycle approach, by ensuring access toadequate quantity of quality food at affordable prices.The NFSA aims at providing coverage to almost two-thirds of the population (upto 75 per cent of the ruralpopulation and 50 per cent of the urban population),that is entitled to receive 5 kg. foodgrains per personper month at highly subsidized prices of Rs.3, Rs.2,Rs.1 per kg for rice, wheat and coarse grains respectivelyunder the Targeted Public Distribution System (TPDS).Under this Act, the poorest of the poor households wouldcontinue to receive 35 kg. foodgrains per household permonth under Antyodaya Anna Yojana scheme. Specialfocus is given on nutritional support to women andchildren. The identification of households eligible forsubsidised grains under NFSA is expected to be carriedout by the States/UTs, which may frame their owncriteria or use Social Economic and Caste Census data.In case of non-supply of foodgrains or meals to entitledpersons, the Act has provisions for payment of foodsecurity allowance. As at the end of April, 2016, 33States/ UTs have implemented the NFSA and there is aneed for other States (Nagaland, Kerala and Tamil Nadu)to suitably implement the same at the earliest.
8.23.2 The NFSA inter alia contains reforms in TPDSin the form of doorstep delivery of foodgrains to theTPDS outlets, application of Information andCommunication Technology (ICT) tools including end-to-end computerization in order to ensure transparentrecording of transactions at all levels and to preventleakages, diversions, etc. The Act also emphasizes onfull transparency of records, preference to publicinstitutions or public bodies such as Panchayats, self-help groups, co-operatives in licensing of fair price shopsand management of fair price shops by women or theircollectives diversification of commodities distributed
under the Public Distribution System. These reformsare considered essential and need to be implementedvigorously by all the States/ UTs.
8.23.3 During the Twelfth Plan, end-to-endcomputerization of TPDS is being undertaken in all States/UTs. In October, 2012, Government approved theimplementation of Component-I of a Plan Scheme whichcomprises activities, namely, digitization of ration cards/beneficiary and other databases, computerization ofsupply-chain management, setting up of transparencyportal and grievance redressal mechanisms forimplementation in all States/UTs during Twelfth Plan.The Department of Food and Public Distribution hasissued guidelines for Fair Price Shop (FPS) Automationwhich also includes technical specifications of Point ofSale (PoS) device and Mobile Terminals. NIC hasdeveloped Android based ‘App’, which also has beenmade available on DeitY’s AppStore. Thirty States/ UTs/NIC have already been sanctioned funds under thescheme and its implementation needs to be expedited.
8.23.4 While implementation of ICT in PDS needs tobe pursued vigorously across all States/ UTs, it isimperative that the digitised database is also seeded withAadhaar number of each beneficiary for which CentralGovernment has already requested the States/ UTs. Thiswill help removing the fakes and duplicates from thesystem, thus channelizing benefits of large amount ofsubsidy given by the Government only to the deservingpeople. This would help containment of food subsidiesin the long run, thus making NFSA more sustainable. Inthis context, Union Budget 2016-17 has announcedproviding automation facilities to 3 lakh Fair Price Shopsby March, 2017. An option of introducing Direct BenefitTransfer (DBT) on pilot basis has also been introducedfor UTs and States (in a few districts).
8.24 High Level Committee on Reorienting theRole and Restructuring of Food Corporationof India
8.24.1 A High Level Committee (HLC), set up by theGovernment under the chairmanship of Shri Shanta Kumarto look into the role and restructuring of Food Corporationof India submitted its report in January, 2015. It has
225AGRICULTURE AND RURAL TRANSFORMATION
recommended that FCI may handover all procurementoperations of wheat, paddy and rice to States such asAndra Pradesh, Chhattisgarh, Haryana, Madhya Pradesh,Punjab and Odisha since they have sufficient experienceand infrastructure for procurement. In these States, FCImay accept only the surplus (after deducting the needsof the States under NFSA) to be moved to deficit States.Simultaneously, FCI may move on to help such Stateswhere farmers suffer from distress sales at prices muchbelow MSP, and which are dominated by small holdings,like Eastern UP, Bihar, West Bengal, Assam etc. This isthe belt from where second green revolution isexpected.The Committee has also recommendedreduction in statutory levies on procurement by the StateGovernments. It has added that the implementation ofNFSA may be deferred in States which have notundertaken computerisation.In a major recommendation,the Committee has suggested reducing NFSA coveragefrom 67 per cent to 40 per cent. The issue prices ofRs.3/2/1 per kg. are also suggested to be restricted toAntyodaya Households while other households may beoffered foodgrains at 50 per cent of MSP. The Committeehas proposed introduction of the concept of direct cashtransfers with large cities to begin with. There is a needto examine these recommendations and take suitablemid-course corrections, else the subsidy burden of NFSAis likely to become unsustainable.
8.25 Rural Development
8.25.1 Rural transformation touches every segment ofthe rural population. The Government has launchedseveral rural development programmes with focus onthe more inclusive growth objective of the Twelfth Plan.The objective of these programmes is upliftment of therural population which was left behind in the journey ofprogress, and over time, got pushed down to the lowerrungs of the economic ladder. The Plan has adoptedlivelihoods approach to reduce poverty as one of its thrustareas. These schemes either deliver benefits directly tothe poor and the excluded groups, or increase their abilityto access employment and income-opportunitiesgenerated by the growth process. These schemes haveassumed greater significance as their objectives are alsoreflected in the new Vision of the Government which
emphasizes cooperative federalism with Centre andStates working together as ‘Team India’.
Livelihood and Social Sector Programmes inthe Twelfth Plan
8.26 Mahatma Gandhi National RuralEmployment Guarantee Act (MGNREGA)
8.26.1 The Mahatma Gandhi National RuralEmployment Guarantee Act (MGNREGA) guaranteesnot less than 100 days of wage employment in afinancial year to every rural household whose adultmembers volunteer to do unskilled manual work. Thescheme was launched in 2006-07 in 200 selecteddistricts, and gradually extended to the whole countryby 2008-09. The Union Budget for 2015-16 hadannounced that the Union Government would continueto fully support MGNREGA, describing it as one ofthe national priorities. The underlying objective of thescheme is to enhance the livelihood security of the poorhouseholds in rural areas. Besides this, MGNREGA’sgoals include rejuvenating natural resource base,creating productive rural assets, stimulating localeconomy by providing safety net to rural poor, ensuringwomen empowerment and strengthening grassrootlevel democratic institutions. More than three-fourthof works taken up under MGNREGA are related towater conservation and other activities for enhancementof agricultural productivity, thereby, multiplying jobopportunities in the agriculture sector and enhancingthe farmers’ income. An allocation of Rs.38,500 crore(BE} has been made for the scheme during the currentfinancial year 2016-17.
8.26.2 The volume of wage employment under thescheme had grown from 143.59 crore person-days in2007-08 to 235.15 crore person-days in 2015-16. Atthe beginning of Twelfth Plan, there were more thaneight crore muster rolls and over 12 crore job cardsplaced online. Notably, a large number of MGNREGAworkers are small and marginal farmers whose landproductivity has declined significantly. As against thenorm of 33 per cent, women’s participation in thescheme was 55.6 per cent in 2016-17 (as on Sept. 2016)while SC & ST participation rate stood at 20.57 and
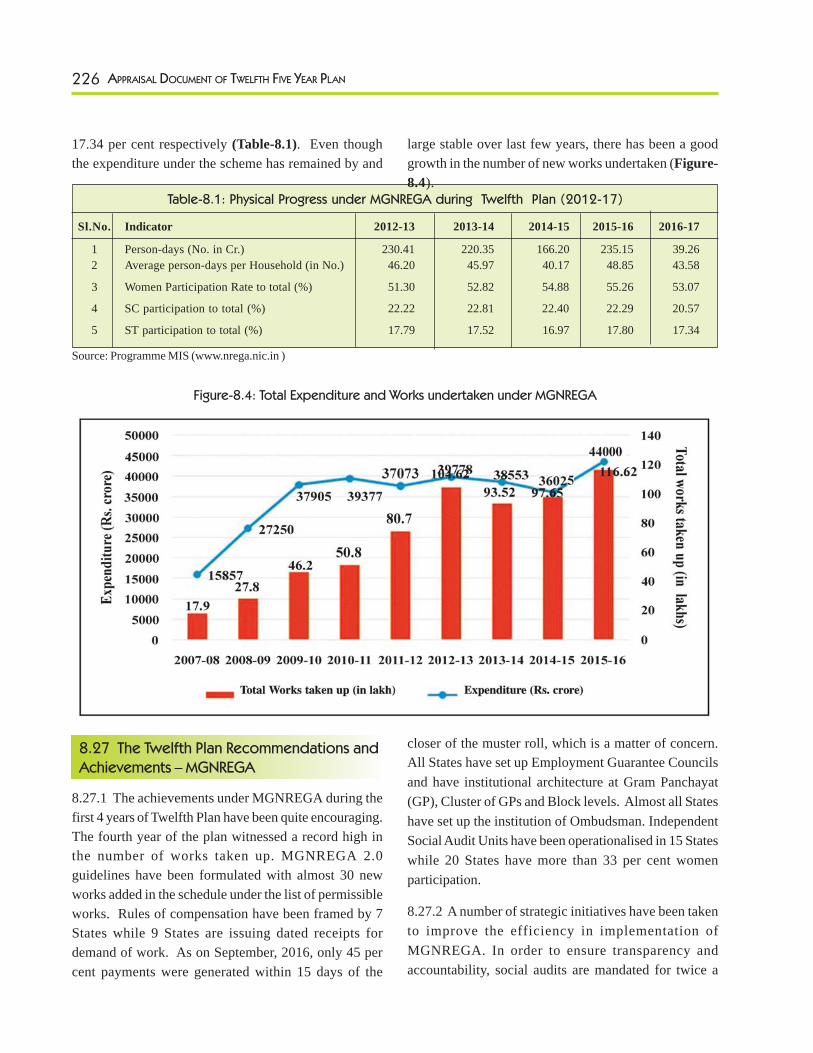
226 APPRAISAL DOCUMENT OF TWELFTH FIVE YEAR PLAN
17.34 per cent respectively (Table-8.1). Even thoughthe expenditure under the scheme has remained by and
large stable over last few years, there has been a goodgrowth in the number of new works undertaken (Figure-8.4).
Table-8.1: Physical Progress under MGNREGA during Twelfth Plan (2012-17)
Sl.No. Indicator 2012-13 2013-14 2014-15 2015-16 2016-17
1 Person-days (No. in Cr.) 230.41 220.35 166.20 235.15 39.262 Average person-days per Household (in No.) 46.20 45.97 40.17 48.85 43.58
3 Women Participation Rate to total (%) 51.30 52.82 54.88 55.26 53.07
4 SC participation to total (%) 22.22 22.81 22.40 22.29 20.57
5 ST participation to total (%) 17.79 17.52 16.97 17.80 17.34
Source: Programme MIS (www.nrega.nic.in )
Figure-8.4: Total Expenditure and Works undertaken under MGNREGA
closer of the muster roll, which is a matter of concern.All States have set up Employment Guarantee Councilsand have institutional architecture at Gram Panchayat(GP), Cluster of GPs and Block levels. Almost all Stateshave set up the institution of Ombudsman. IndependentSocial Audit Units have been operationalised in 15 Stateswhile 20 States have more than 33 per cent womenparticipation.
8.27.2 A number of strategic initiatives have been takento improve the efficiency in implementation ofMGNREGA. In order to ensure transparency andaccountability, social audits are mandated for twice a
8.27 The Twelfth Plan Recommendations andAchievements – MGNREGA
8.27.1 The achievements under MGNREGA during thefirst 4 years of Twelfth Plan have been quite encouraging.The fourth year of the plan witnessed a record high inthe number of works taken up. MGNREGA 2.0guidelines have been formulated with almost 30 newworks added in the schedule under the list of permissibleworks. Rules of compensation have been framed by 7States while 9 States are issuing dated receipts fordemand of work. As on September, 2016, only 45 percent payments were generated within 15 days of the
Total Works taken up (in lakh) Expenditure (Rs. crore)
227AGRICULTURE AND RURAL TRANSFORMATION
year. Provisions for concurrent social audit involvingBharat Nirman Volunteers, village social auditors, Self HelpGroups and youth organisations are available. Emphasisis to cover more vulnerable people under the scheme,with a special Schedule of Rates. The focus of new worksallowed under MGNREGA is also on land and homesteadsowned by SCs/ STs, small & marginal farmers, IAYbeneficiaries and Forest Rights Act beneficiaries. In animportant development, MGNREGA has been notified bythe Ministry of Finance under Direct Benefits Transfer(DBT) scheme for 300 districts in the country.
8.27.3 Nevertheless, there are certain areas of concernunder the Scheme. As against guarantee of at least 100days of wage employment to every household in afinancial year, MGNREGA’s average achievement hasbeen less than 50 days of work in a year, except in2009-10 when it touched about 54 days of work. Theaverage days of work for a household were 45.97, 40.17,44.85 and 43.58 during 2013-14, 2014-15, 2015-16and 2016 -17 (Sept. 2016) respectively. Only 6.02 percent and 10.07 per cent worker households completed100 days of work in 2014-15 and 2015-16 respectively.Expenditure on agriculture and allied works at the all-India level was 52.81 per cent during 2014-15 and 63.11in 2015-16 and there were 16 States still below theprescribed limit of 60 per cent as on March, 2016.
8.27.4 A major reason for divergence between theTwelfth Plan recommendations and achievements is thegap between the projection of labour availability and theactual demand that is put forward. The implementingagencies do not have adequate capacity and institutionalmechanism for the exercise and need capacity building.To address delay in wage payments, fake rolls and ghostworkers, Electronic Fund Management System (e-FMS)and the Electronic Muster Roll (e-MR) have been put inplace to achieve real time transactions and to stopleakages. The other issues of concern are poor qualityand productivity of assets, while transparency,accountability and grievance redressal mechanisms needto be improved. There is a need to extend variousinitiatives (including the use of IT) taken during the firstfour years of the Twelfth Plan in all the States. By March,2016, unemployment allowance rules need to be notifiedin the remaining 16 States while eFMS system needs tobe started in the remaining 9 States.
8.28 National Rural Livelihood Mission (NRLM)
8.28.1 NRLM was launched in June, 2011 afterrestructuring the Swarnajayanti Grameen SwarozgarYojana (SGSY). The scheme focuses on rural poorhouseholds and provides them continuous nurturing andsupport, till they come out of abject poverty. It seeks toreach 8 to 10 crore rural poor households and organiseone woman member from each such household intoaffinity-based women Self-Help Groups (SHGs) andfederations or higher levels by 2024-25. While doingso, the scheme envisages coverage of vulnerable sectionssuch as SC/ST (50 per cent), minorities (15 per cent),disabled (3 per cent), etc. identified through the processof Participatory Identification of Poor (PIP) approvedby the Gram Sabha. The women-centric Missionsupports the poor households in key livelihoods viz.agriculture, non-farm activities, micro-enterprises,skilling and placement, so that they are provided asustainable basket of livelihoods. The Mission has a clear“exit” strategy – after 10 years for intensive blockscovered under the programme – and thereafter it expectsthe women SHGs to take over management of affairsentirely. By 2016-17 (as on Sept..2016), 29 States andfour Union Territory have transited to the Missioncoverage. The uncovered parts of the country areprogressing towards coverage.
8.28.2 The 2015-16 Budget has included the Schemeamong those in respect of which the Centre-Statesfunding pattern is being modified in view of the largerdevolution of tax resources to the States as per therecommendations of the 14th Finance Commission,whereby in this Scheme, the revenue expenditure is tobe borne by the States. In October, 2015 as perrecommendations of the Sub Group of Chief Ministerson Rationalization of the Centrally Sponsored Schemes,the funding pattern between Centre and State has beenrevised to 60:40 w.e.f. April 1, 2015. Subsequent to thechanged funding pattern, the availability of funds shouldnot decrease. The Scheme is now part of the NationalLivelihood Mission (NLM)-(Rural and Urban) and thebudgetary allocation of Central share for the NationalLivelihood Mission (Rural) was Rs.2,505 crore in 2015-16 while Rs.3,000 crore has been allocated for themission during FY 2016-17.
228 APPRAISAL DOCUMENT OF TWELFTH FIVE YEAR PLAN
8.28.3 The Mission has four distinct components –Organising rural poor into SHGs, their training &capacity building and credit linkage; the Mahila KisanSashaktikaran Pariyojana (MKSP); Rural Self-Employment Training Institute (RSETI); and DeenDayal Upadhyaya Grameen Kaushalya Yojana, theplacement linked skill development programme.Directed at strengthening the existing livelihoods of thepoor, the MKSP projects are designed to enhance skillbase of women engaged in agriculture and relatedactivities. Currently, it is being implemented in 119districts spread over 17 States, supporting 30 lakhMahila Kisans. The RSETIs, established in each districtin coordination with public sector banks and StateGovernments, offer short-time residential training (in65 vocations at present) to rural youth from poorhouseholds. During 2014-15, the number of youthtrained by the RSETIs is 3.84 lakh as against the targetof 3.53 lakh and trainees who have become self-dependent is 2.2 lakh. Similarly, during 2015-16, 4.34lakh youths have been trained in RSETIs against thetarget of 3.75 lakh. Since the inception of the schemein 2011, 20.46 lakh youth have been trained and 11.81lakh youths have been settled till September, 2016.
8.28.4 To enhance the employability of rural youth, theGovernment has launched the Deen Dayal UpadhyayGrameen KaushalyaYojana (DDU-GKY). An amount ofRs.600 crore has been proposed for the scheme in theUnion Budget for 2016-17. A dedicated Division underthe Ministry of Rural Development viz. ‘Rural SkillsDivision’, is implementing DDU-GKY placement linkedskill development programme in partnership with public,private, non-government and community organisations.Mandatory placement is assured to 70 per cent of thetrained candidates, who get a minimum salary ofRs.6,000 per month after three-months training. DDU-GKY (erstwhile Aajeevika Skills) is an importantcomponent of the National Skill Development Policy.Theskilling programme for rural youth has now beenrefocused and re-prioritized to build the capacity of ruralpoor youth to address the needs of domestic and globalskill requirements.
8.29 Twelfth Plan Recommendations andAchievements – NRLM
8.29.1 The Twelfth Plan had set the target of covering600 intensive districts, 4,200 intensive blocks, 3.3 crorehouseholds and 26.4 lakh SHGs under the scheme. Asagainst this, by September, 2016, NRLM has beenextended to 524 Intensive Districts, 3082 Intensiveblocks, 304.3 lakh households and 30.58 lakh SHGs.The Plan target for supporting skill development of ruralyouth was fixed at one crore. The achievement tillSeptember, 2016 has been 30.58 lakh only, indicatingthat the target is unlikely to be achieved.
8.29.2 The DDU-GKY Implementation Programmeaims at social inclusion of the poor through mandatorycoverage of 50 per cent SC/ST, 15 per cent minorities,33 per cent women and 3 per cent differently abledpersons. Scheme has special emphasis on areas such asJammu & Kashmir (Himayat–special scheme forplacement linked skilling of youth), 27 most-affectedLeft-wing Extremist (LWE) districts across 9 States(Roshni) and North Eastern States (10 per cent budgetaryallocation).
8.29.3 Some of the constraints affecting implementationof NRLM in some States include transition from theSGSY; issues related to establishment of the Missionarchitecture & human resources, and availability of socialcapital. Seventeen States transited to NRLM in 2012-13, five in 2013-14 and the remaining, except Goa, in2014-15. The States including Andhra Pradesh, Bihar,Madhya Pradesh, Odisha, Rajasthan and Tamil Nadu,had experience in implementing similar schemes, andtogether with Kerala transited to NRLM faster than otherStates. There is a need to cover remaining districts asenvisaged in the Twelfth Plan. Besides, the unevendistribution of SHGs among the States continues to be achallenge to be addressed.
8.30 The Prime Minister ’s Rural DevelopmentFellows Scheme (PMRDF)
8.30.1 The Prime Minister’s Rural Development FellowsScheme, an initiative of the Ministry of RuralDevelopment, in collaboration with State Governments,
229AGRICULTURE AND RURAL TRANSFORMATION
was launched in September, 2011. At present, there are99 PMRD Fellows placed in 76 districts across 18 States(10 Integrated Action Plan (IAP) States, 7 North-EasternStates and Jammu & Kashmir). Out of 99 fellows, 73Fellows are in the IAP districts. Notably, there is anacute scarcity of professional human resources at thedistrict level, particularly in the underdeveloped regionsof the country. The Fellowship has the twin objectiveof engaging young professionals to work with DistrictCollectors in improving the development programmes,as well as to raise a cadre of development facilitators,who will be available as a ready resource for ruraldevelopment activities over a long term. During the two-year duration of the Fellowship, PMRD Fellows workclosely with District Collectors of backward and remotedistricts in improving programme delivery and interfacewith marginalized sections, thereby reducing thedevelopmental and governance deficits.
Basic Amenities
8.31 Rural Housing
8.31.1 As per the Working Group on Rural Housing forthe Twelfth Five Year Plan, the total housing shortage inrural India was estimated at 40 million units at thebeginning of the Twelfth Plan. To help rural familiesbelow the poverty line (BPL) in meeting their housingrequirements, Government is implementing IndiraAwaasYojana (IAY) since 1996. In the first four yearsof the Twelfth Plan, 69.82 lakh houses have beenconstructed with an expenditure of Rs.42,034 crore(Central releases). The IAY has a Central allocation ofRs.10,025 crore for 2015-16 and Rs.15,000 crore (BE)has been allocated for the financial year 2016-17. Fromthe year 2015-16, the Scheme is part of the Housing forAll (Rural and Urban) scheme, to be funded as per thechanged Centre-State funding pattern of 60:40. Due tohigher devolution of Central tax resources to States asper the 14thFinance Commission’s recommendations, theoverall expenditure on the Scheme under the changedfunding pattern should not decrease as the States areexpected to contribute larger funds for the Scheme. Thescheme has been renamed as Pradhan Mantri AwaasYojana (Gramin). Under the PMAY (Gramin) in the next
three years from 2016-17 to 2018-19, there is a targetfor construction of 1 crore houses in rural areas. Further,Rs.81,975 crore would be required to construct thesehouses.
8.31.2 Based on the Twelfth Plan recommendations,the per unit financial assistance under the scheme wasincreased from Rs.45,000 to Rs.70,000 for plains, andfrom Rs.48,500 to Rs.75,000 for hilly, IAP and difficultareas w.e.f. 1st April, 2013. The unit cost has beenfurther increased to Rs. 1,20,000 in plain areas andRs.1,30,000 in hilly states/ IAP districts/ difficult areasw.e.f. April, 2016. The unit cost of homestead plots hasalso been enhanced from Rs.10,000 to Rs.20,000. Thedifficult areas have also been re-defined. In congestedlocalities, where land is costly, provision for multi-storeyed building has also been made. Under the scheme,priority is given to manual scavengers, bonded labourers,women in difficult circumstances, widows of defence,paramilitary and police personnel killed in action, mentallyand physically challenged persons, households withsingle girl child, etc. Construction of toilets with IAYhouses is now mandatory.
8.31.3 The scheme seems to be progressing well butthere are problems of effective monitoring at theimplementation stage. One major challenge is the selectionof beneficiaries and since Socio Economic Caste Census(SECC) is now completed, it would be desirable that theSECC findings are used to identify the beneficiaries. Thereare also issues like catering to housing needs for othersegments of rural population, besides the BPL rural poor.There are gaps in reporting by the States on completionof the houses against the physical targets and the updatedprogress is not reflected in the MIS. The trend of PMAY(Gramin) houses constructed over the past eight yearsbeginning Eleventh Plan shows that the States have tocome forward with larger resources to meet theobjectives of ‘Housing for All by 2022’ in the rural areas.Proposals for manual scavengers also need to beprepared by the States on priority. There is need formore effective convergence of PMAY (Gramin) andother Central/State schemes. Dissemination ofappropriate building technologies, capacity building atvarious levels and grievance redressal are other areas
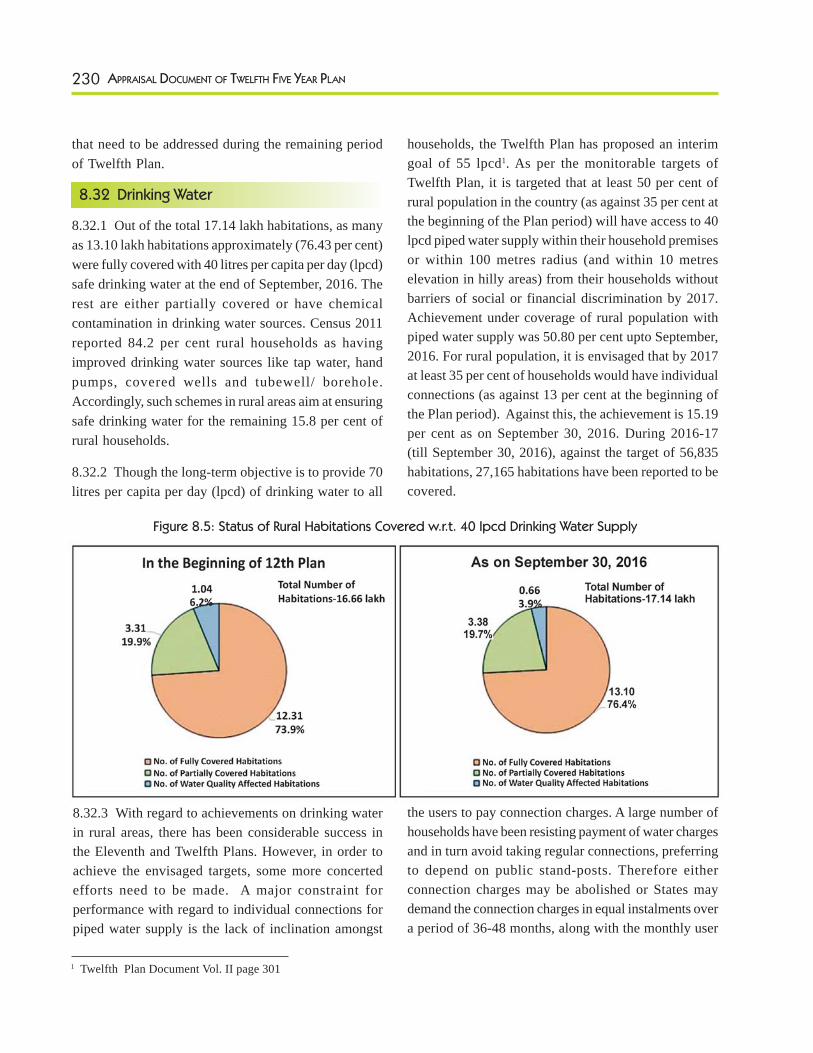
230 APPRAISAL DOCUMENT OF TWELFTH FIVE YEAR PLAN
that need to be addressed during the remaining periodof Twelfth Plan.
8.32 Drinking Water
8.32.1 Out of the total 17.14 lakh habitations, as manyas 13.10 lakh habitations approximately (76.43 per cent)were fully covered with 40 litres per capita per day (lpcd)safe drinking water at the end of September, 2016. Therest are either partially covered or have chemicalcontamination in drinking water sources. Census 2011reported 84.2 per cent rural households as havingimproved drinking water sources like tap water, handpumps, covered wells and tubewell/ borehole.Accordingly, such schemes in rural areas aim at ensuringsafe drinking water for the remaining 15.8 per cent ofrural households.
8.32.2 Though the long-term objective is to provide 70litres per capita per day (lpcd) of drinking water to all
households, the Twelfth Plan has proposed an interimgoal of 55 lpcd1. As per the monitorable targets ofTwelfth Plan, it is targeted that at least 50 per cent ofrural population in the country (as against 35 per cent atthe beginning of the Plan period) will have access to 40lpcd piped water supply within their household premisesor within 100 metres radius (and within 10 metreselevation in hilly areas) from their households withoutbarriers of social or financial discrimination by 2017.Achievement under coverage of rural population withpiped water supply was 50.80 per cent upto September,2016. For rural population, it is envisaged that by 2017at least 35 per cent of households would have individualconnections (as against 13 per cent at the beginning ofthe Plan period). Against this, the achievement is 15.19per cent as on September 30, 2016. During 2016-17(till September 30, 2016), against the target of 56,835habitations, 27,165 habitations have been reported to becovered.
Figure 8.5: Status of Rural Habitations Covered w.r.t. 40 lpcd Drinking Water Supply
8.32.3 With regard to achievements on drinking waterin rural areas, there has been considerable success inthe Eleventh and Twelfth Plans. However, in order toachieve the envisaged targets, some more concertedefforts need to be made. A major constraint forperformance with regard to individual connections forpiped water supply is the lack of inclination amongst
the users to pay connection charges. A large number ofhouseholds have been resisting payment of water chargesand in turn avoid taking regular connections, preferringto depend on public stand-posts. Therefore eitherconnection charges may be abolished or States maydemand the connection charges in equal instalments overa period of 36-48 months, along with the monthly user
1 Twelfth Plan Document Vol. II page 301
231AGRICULTURE AND RURAL TRANSFORMATION
charges. With regard to water quality, the Plan documentenvisaged funding to States having quality affectedhabitations over and above normal National RuralDrinking Water Programme (NRDWP) allocation withhighest priority to arsenic and fluoride affectedhabitations. 5 per cent allocation is being earmarked fordedicated funding in this regard.
8.32.4 The current Central outlay alone under NRDWPfor the Twelfth Five Year Plan for Ministry of DrinkingWater and Sanitation is Rs.68,786 crore. Expenditureof Rs. 38,005.51 crore has been reported by the Statesagainst the central releases of Rs.35,833.43 crore in thefirst four years and eleven months of the Twelfth FiveYear Plan i.e. upto Feb 8, 2017. In the light of higherdevolution of funds to the States on the recommendationsof the 14th Finance Commission, the States are expectedto provide higher allocation for the sector, otherwiseeither target will have to be reduced or the programmemay need to be confined to only drought /desert-proneareas, water quality affected areas etc.
8.33 Sanitation
8.33.1 With an aim to make India ‘clean’ by October,2, 2019, Mahatma Gandhi’s 150th birth anniversary,Swachh Bharat Mission has been launched by the PrimeMinister on October 2, 2014. Its goal includeselimination of open defecation, which is estimated at ahigh 67 per cent households in rural areas and 12.5per cent in urban areas (Census 2011). The SwachhBharat Mission has 2 sub missions - the Swachh BharatMission (Gramin) [SBM(G)] for rural areas throughthe Ministry of Drinking Water and Sanitation (MDWS),and the Swachh Bharat Mission (Urban) for urban areasunder the Ministry of Urban Development. Accordingly,the Nirmal Bharat Abhiyan (NBA) has now beenrestructured into “Swachh Bharat Mission (Gramin)[SBM(G)]”.
8.33.2 Under the programme, focus is on providingaccess to toilet facilities (individual household latrinesand community toilets) to the rural population; carryingout extensive Information, Education and Communication(IEC) and Behaviour Change Campaign, with effectiveuse of mass media, Inter Personal Communication (IPC)
at the household level to change mind-set aboutsanitation and implementing Solid and Liquid WasteManagement (SLWM) activities in rural areas to maintaincleanliness and hygiene in villages. According to Census2011, only 32.7 per cent of total rural households hadlatrine facilities. The target for MDWS is to construct1.5 crore Individual Household Latrines (IHHL) in2016-17. As reported by IMIS website of MDWS, 938lakh households, which is 51.76 per cent of total ruralhouseholds of 1813 lakh in the country are reported tobe covered under IHHL by March, 2016, out of which176 lakh IHHLs have been constructed since the launchof SBM (G). Under the Swachh Bharat Mission (SBM)(Gramin), a household is provided a financial assistanceof Rs.12,000 for a toilet (IHHL).The amount was sharedby the Centre and the concerned State Government in75:25 ratio till 2014-15. However, the Centre: Statefunding pattern has been changed to 60:40 for all theSates except for 8 NE States, 3 Himalayan States whereit is 90:10 since 2015-16. In urban areas, the unit costof a household toilet is Rs.15,000-20,000, and the CentralGovernment incentive for the construction of such toiletunit under the Swachh Bharat Mission (SBM) (Urban)was Rs.4,000 till 2014-15.
8.33.3 Apart from the above, Ministry of RuralDevelopment will also undertake IHHL constructionunder MGNREGA (standalone) as well as IAY. Allschools and Aanganwadi Centres are to be providedtoilets which would be done through Ministry of HRDand Ministry of WCD, respectively. Besides, initiativesare also being taken by PSUs and corporates underCorporate Social Responsibility (CSR). With regard tosanitation, the major goal of the Twelfth Plan is to ensurethat 50 per cent of the Gram Panchayats attain NirmalGram status by the year 2017. At the end of March2016, out of 2.51 lakh Gram Panchayats, about 23045(9.17 per cent) have been declared open defacation free(ODF).
8.33.4 The current Central outlay for rural sanitationfor the Twelfth Five Year Plan under MDWS alone isRs.37,159 crore. Out of this, Rs.14,098.10 crore havebeen utilised against a total budget allocation ofRs.14,175 crore during the first four years of Twelfth
232 APPRAISAL DOCUMENT OF TWELFTH FIVE YEAR PLAN
Plan. The BE for SBM (G) during 2016-17 is Rs.9,000crore. The balance funds required, in addition to thebudgetary allocation for the Twelfth Plan, to achieveSwachh Bharat (Gramin) targets of the Plan have beenproposed to be made available via contributions to theSwachh Bharat Kosh; Swachh Bharat Cess and throughcommitments under CSR. No additional requirementof funds during the Twelfth Plan has been contemplatedfrom budgetary sources by the Ministry of DrinkingWater and Sanitation. Further, since 14th FinanceCommission provides for significantly higher devolutionof funds to Local bodies, it is desirable that more fundsare spent by these bodies to improve the status of basicservices such as water supply, sanitation, sewerage,solid & liquid waste management, etc. in theirrespective areas.
8.34 Provision of Urban Amenities in RuralAreas (PURA)/ Rurban
8.34.1 PURA’s objective was to bridge the rural-urbandivide through provision of livelihood opportunities andurban amenities in rural areas. Started in 2004-05 on apilot basis for three years, the scheme was restructuredin 2010, with the implementing agency function shiftedfrom the DRDA to private sector entities under the PublicPrivate Partnership (PPP) framework. Amenities providedby the Ministry of Rural Development Schemes werewater and sewerage, construction and maintenance ofvillage streets, drainage, solid waste management, skilldevelopment and development of economic activities. Theamenities provided under non-MoRD schemes werevillage street lighting, telecom and electricity. Thereare add-ons, and people-centric revenue earningprojects which include village based tourism, integratedrural hubs, rural market, besides common servicecentres and warehousing for agriculture. PURA hasbeen discontinued during 2014-15 and a newprogramme RURBAN with similar objectives announcedby the Government. However, the ongoing projects underPURA will be pursued till their completion.
8.34.2 The Government of India launched the Dr.Shyama Prasad Mukherji RURBAN Mission on 21tst
February, 2016 (approved by Union Cabinet on 16September 2015) to deliver integrated project-basedinfrastructure in the rural areas. The RURBAN Mission
aims at providing basic amenities in rural areas and checkmigration to cities. The scheme envisages developmentof economic activities, skill development and helpingrural areas get efficient civic infrastructure andassociated services. The preferred mode of deliverywould be through PPPs using various scheme funds.The Mission will be linked to e-governance to achievetargets in a time-bound manner. Best practices ofcooperatives, NGOs and other sectors can also bedovetailed into the scheme. The scheme has an allocationof Rs.300 crore (BE) during 2015-16 and the sameamount has been allocated for the mission inFY 2016-17.
Social Security
8.35 National Social Assistance
Programme(NSAP)
8.35.1 The NSAP has been in operation since 1995 toprovide social security to the vulnerable sections of thesociety like old persons, widows and disabled falling inthe BPL category. Implemented throughout the country,the programme has five components such as IndiraGandhi National Old Age Pension Scheme (IGNOAPS),Indira Gandhi National Widow Pension Scheme(IGNWPS), Indira Gandhi National Disability PensionScheme (IGNDPS), National Family Benefit Scheme(NFBS) and Annapurna Scheme. The NSAP wastransferred to State Plans in 2002-03 and funds werereleased as Additional Central Assistance to the States.On 1stApril, 2014, the NSAP Schemes were convertedback to Centrally Sponsored Schemes and funds beingreleased to the Consolidated Funds of the States. Thereis no change in the funding pattern of the Scheme in the2015-16 Union Budget, and it would continue to be fullysupported by the Union Government. The Ministry ofRural Development (MoRD) issues Guidelines andmonitors expenditure but selection of beneficiaries anddisbursal of payments is done by the State Governments.The number of beneficiaries and total expenditure underNSAP during the first four years of the Twelfth Plan isgiven in Figure 8.6.
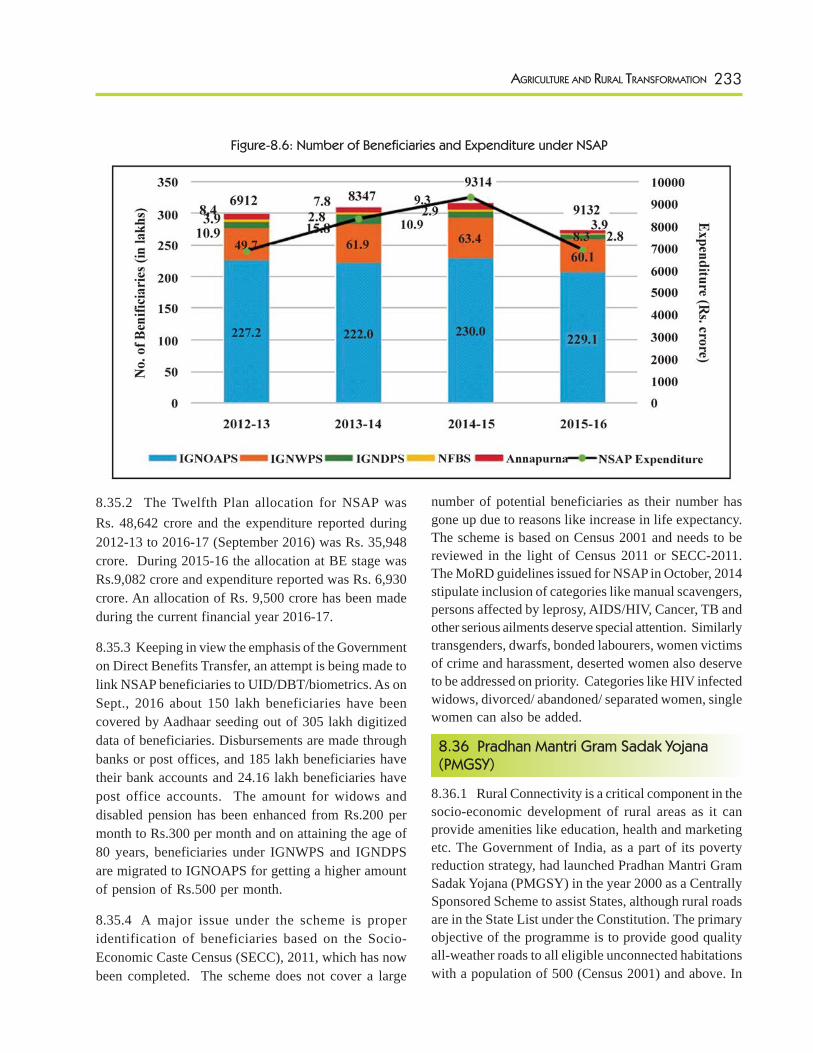
233AGRICULTURE AND RURAL TRANSFORMATION
8.35.2 The Twelfth Plan allocation for NSAP wasRs. 48,642 crore and the expenditure reported during2012-13 to 2016-17 (September 2016) was Rs. 35,948crore. During 2015-16 the allocation at BE stage wasRs.9,082 crore and expenditure reported was Rs. 6,930crore. An allocation of Rs. 9,500 crore has been madeduring the current financial year 2016-17.
8.35.3 Keeping in view the emphasis of the Governmenton Direct Benefits Transfer, an attempt is being made tolink NSAP beneficiaries to UID/DBT/biometrics. As onSept., 2016 about 150 lakh beneficiaries have beencovered by Aadhaar seeding out of 305 lakh digitizeddata of beneficiaries. Disbursements are made throughbanks or post offices, and 185 lakh beneficiaries havetheir bank accounts and 24.16 lakh beneficiaries havepost office accounts. The amount for widows anddisabled pension has been enhanced from Rs.200 permonth to Rs.300 per month and on attaining the age of80 years, beneficiaries under IGNWPS and IGNDPSare migrated to IGNOAPS for getting a higher amountof pension of Rs.500 per month.
8.35.4 A major issue under the scheme is properidentification of beneficiaries based on the Socio-Economic Caste Census (SECC), 2011, which has nowbeen completed. The scheme does not cover a large
number of potential beneficiaries as their number hasgone up due to reasons like increase in life expectancy.The scheme is based on Census 2001 and needs to bereviewed in the light of Census 2011 or SECC-2011.The MoRD guidelines issued for NSAP in October, 2014stipulate inclusion of categories like manual scavengers,persons affected by leprosy, AIDS/HIV, Cancer, TB andother serious ailments deserve special attention. Similarlytransgenders, dwarfs, bonded labourers, women victimsof crime and harassment, deserted women also deserveto be addressed on priority. Categories like HIV infectedwidows, divorced/ abandoned/ separated women, singlewomen can also be added.
8.36 Pradhan Mantri Gram Sadak Yojana(PMGSY)
8.36.1 Rural Connectivity is a critical component in thesocio-economic development of rural areas as it canprovide amenities like education, health and marketingetc. The Government of India, as a part of its povertyreduction strategy, had launched Pradhan Mantri GramSadak Yojana (PMGSY) in the year 2000 as a CentrallySponsored Scheme to assist States, although rural roadsare in the State List under the Constitution. The primaryobjective of the programme is to provide good qualityall-weather roads to all eligible unconnected habitationswith a population of 500 (Census 2001) and above. In
Figure-8.6: Number of Beneficiaries and Expenditure under NSAP
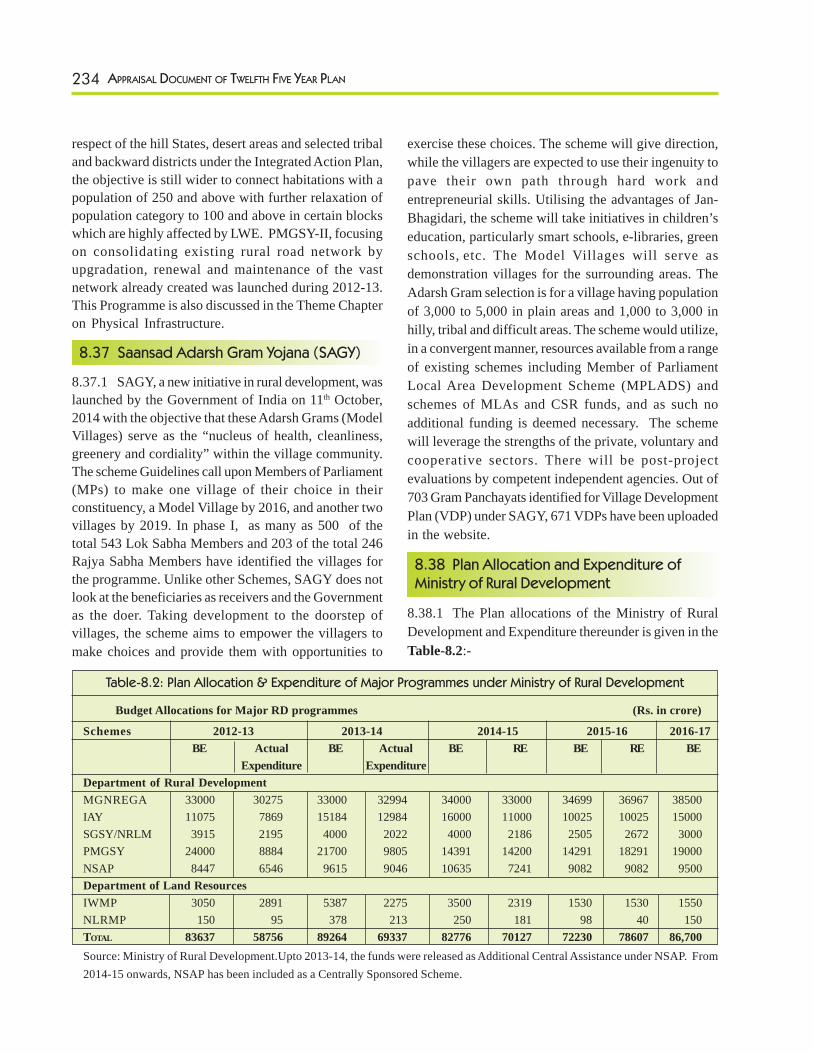
234 APPRAISAL DOCUMENT OF TWELFTH FIVE YEAR PLAN
respect of the hill States, desert areas and selected tribaland backward districts under the Integrated Action Plan,the objective is still wider to connect habitations with apopulation of 250 and above with further relaxation ofpopulation category to 100 and above in certain blockswhich are highly affected by LWE. PMGSY-II, focusingon consolidating existing rural road network byupgradation, renewal and maintenance of the vastnetwork already created was launched during 2012-13.This Programme is also discussed in the Theme Chapteron Physical Infrastructure.
8.37 Saansad Adarsh Gram Yojana (SAGY)
8.37.1 SAGY, a new initiative in rural development, waslaunched by the Government of India on 11th October,2014 with the objective that these Adarsh Grams (ModelVillages) serve as the “nucleus of health, cleanliness,greenery and cordiality” within the village community.The scheme Guidelines call upon Members of Parliament(MPs) to make one village of their choice in theirconstituency, a Model Village by 2016, and another twovillages by 2019. In phase I, as many as 500 of thetotal 543 Lok Sabha Members and 203 of the total 246Rajya Sabha Members have identified the villages forthe programme. Unlike other Schemes, SAGY does notlook at the beneficiaries as receivers and the Governmentas the doer. Taking development to the doorstep ofvillages, the scheme aims to empower the villagers tomake choices and provide them with opportunities to
exercise these choices. The scheme will give direction,while the villagers are expected to use their ingenuity topave their own path through hard work andentrepreneurial skills. Utilising the advantages of Jan-Bhagidari, the scheme will take initiatives in children’seducation, particularly smart schools, e-libraries, greenschools, etc. The Model Villages will serve asdemonstration villages for the surrounding areas. TheAdarsh Gram selection is for a village having populationof 3,000 to 5,000 in plain areas and 1,000 to 3,000 inhilly, tribal and difficult areas. The scheme would utilize,in a convergent manner, resources available from a rangeof existing schemes including Member of ParliamentLocal Area Development Scheme (MPLADS) andschemes of MLAs and CSR funds, and as such noadditional funding is deemed necessary. The schemewill leverage the strengths of the private, voluntary andcooperative sectors. There will be post-projectevaluations by competent independent agencies. Out of703 Gram Panchayats identified for Village DevelopmentPlan (VDP) under SAGY, 671 VDPs have been uploadedin the website.
8.38 Plan Allocation and Expenditure ofMinistry of Rural Development
8.38.1 The Plan allocations of the Ministry of RuralDevelopment and Expenditure thereunder is given in theTable-8.2:-
Table-8.2: Plan Allocation & Expenditure of Major Programmes under Ministry of Rural Development
Budget Allocations for Major RD programmes (Rs. in crore)
Schemes 2012-13 2013-14 2014-15 2015-16 2016-17BE Actual BE Actual BE RE BE RE BE
Expenditure ExpenditureDepartment of Rural DevelopmentMGNREGA 33000 30275 33000 32994 34000 33000 34699 36967 38500IAY 11075 7869 15184 12984 16000 11000 10025 10025 15000SGSY/NRLM 3915 2195 4000 2022 4000 2186 2505 2672 3000PMGSY 24000 8884 21700 9805 14391 14200 14291 18291 19000NSAP 8447 6546 9615 9046 10635 7241 9082 9082 9500Department of Land ResourcesIWMP 3050 2891 5387 2275 3500 2319 1530 1530 1550NLRMP 150 95 378 213 250 181 98 40 150TOTAL 83637 58756 89264 69337 82776 70127 72230 78607 86,700Source: Ministry of Rural Development.Upto 2013-14, the funds were released as Additional Central Assistance under NSAP. From2014-15 onwards, NSAP has been included as a Centrally Sponsored Scheme.
235AGRICULTURE AND RURAL TRANSFORMATION
calamity, a minimum specified sum may be transferredinto the farmers’ Aadhaar seeded bank accounts forquick relief. Fourthly, the group formation of small andmarginal farmers needs to be empowered with policyimpetus towards agricultural marketing, financing, landsharing and land leasing. Collectively, these efforts wouldhelp in doubling the farmers’ income by 2022 asenvisaged in Union Budget 2016-17.
8.39.2 The rising absentee landlordism in many Stateshas put large tracts of land out of productive use, as thelandowners do not lease it due to fear of losing ownershipto tenants. Further, small and marginal farm holders arelooking for opportunities to raise their operationalholdings by leasing in land. The net result is that someland is not used optimally and many smaller holdingsare suffering from scale disadvantages. This requiressubstantive reforms in the land policy particularly at theStates’ level, to achieve the economies of scale inagriculture. In this context, promotion of contractfarming, legislation on land leasing and encouragingconcept of land sharing with some adaptation may leadto the desired vertical integration as a win-win situationfor both farmers and landowners. The model land leasingAct prepared by NITI Aayog needs vigorous advocacyand persuasion so that the States may enact their leasinglaws.
8.39.3 Another important issue is enhancement ofinvestments in agriculture. The yields in India are muchbelow global standards, and need to be raisedsignificantly as the scope for increase in cropped area isfairly limited. The most important reasons for lowaverage productivity is large scale dependence onmonsoons and low level of investments both on-farmand off-farm. The enhanced investment, both public andprivate is required to develop these regions. Besides,Centre and States should together evolve acomprehensive set of policies to channelize greaterprivate investments to address the issues of farm inputs,irrigation, marketing, post-harvest management, riskmanagement, land development and capacity ofinstitutions. Large price differential amongst differentfertilisers, including on account of subsidy policies, havedistorted the balanced application of fertilisers, which is
8.39 Rural Transformation - The Way Forward
8.39.1 Even though the share of agriculture as apercentage of GDP has declined over the years, it isimperative that without the growth of this sector, it wouldbe extremely difficult to achieve the overall growthtargets for the economy. Nearly two-thirds of the Indianpopulation lives in rural areas and strategies for faster,more inclusive and sustainable growth must necessarilyaddress the issues faced by the people living in the ruralareas. Agriculture sector often faced serious stress inthe recent past on account of inadequate or untimelymonsoons or other calamities like floods, hailstorms,etc. It is noteworthy that even though the overall damageto the crop may not be significant at the national level,but for a large number of farmers the distress becomesquite devastating. These natural calamities are beyondthe control of human beings but can be managed toreduce the adverse impact to the minimum extentpossible. Besides risk reduction, it needs to be ensuredthat the farmers get a larger share of the price ultimatelypaid by the consumers. Therefore, the Union and StateGovernments need to work cohesively for improvingthe livelihoods of people living in rural areas. Firstly,agriculture as a profession needs to be made moreremunerative. Periodic hike in MSPs would be requiredto cover increase in input costs but that alone may notsuffice unless it reaches out to every farm household inthe country. It needs to be ensured that the farmers ofall regions, and not just of few States of the country,reap the benefits of MSP. This necessitates expandingthe network of procurement as recommended by theShanta Kumar Committee. Secondly, for crops whichare not covered by Central procurement, alternative pricesupport and market intervention schemes especially forcommodities such as pulses and onions may need to bestrengthened, both in the interests of the farmers andconsumers. Thirdly, the Pradhan Mantri Fasal BimaYojana launched in January, 2016 needs to beimplemented on a scale to provide a risk cover to thefarmers across the regions and commodities. The statesneed to create enabling environment for speedyimplementation of the PMFBY. In the event of natural
236 APPRAISAL DOCUMENT OF TWELFTH FIVE YEAR PLAN
rather skewed towards nitrogen. This can become amajor impediment in further improving productivity andneeds to be addressed through reforms in the fertilisersubsidy regime. Since much of the future growth isexpected in non-cereals sector, it is important thathorticulture, dairy, livestock, fisheries, etc. are providednecessary impetus so as to meet the future requirementsof the country. A National Agricultural Market needs tobe developed on priority. At the same time, it is importantto create opportunities for livelihood of rural people outsidethe agriculture sector and linking them to the value chain.
8.39.4 The climate change remains a major challengein view of its varied direct impact on yields of variouscrops, and also on livestock, dairy and fisheries; whilefurther impacting price behaviour locally and sometimesglobally. The significance of climate change in theagriculture sector was recognised and National Initiativesfor Climate Resilient Agriculture (NICRA) for researchand National Mission for Sustainable Agriculture (NMSA)for development were launched. These are key initiativesfor implementing the adaptation and mitigation measuresin agriculture and aim at transforming agriculture into aclimate resilient production system. However, greaterconvergence of these initiatives is required acrossdifferent schemes -both at Central and State levels.Pradhan Mantri Krishi Sinchai Yojana (PMKSY), as anoverarching instrument for drought proofing, also needsto be meticulously implemented to achieve the target ofper drop more crop.
8.39.5 Public R&D system in agriculture is inevitablein view of the diversity of the sector and its clientele.The experience shows that private sector evolvedtechnologies, many a times, are beyond the normalcapacity of small & marginal farmers. They are limitedto select commodities and locations. As large part of thepeasantry mostly resort to public evolved technologiesand support, the public R&D system needs reforms forgovernance, accountability and efficacy for the publicinvestment made.
8.39.6 The rural development programmes have mademajor strides in helping people come out of the povertynet. However, there are many issues that need to be
addressed in the remaining period of the Twelfth Plan.First and foremost, it is important to curb the leakagesand ensure that benefits directly reach the intendedpeople. This would require strengthening deliverymechanisms, using ICT especially through the DBTmechanism and “JAM” (Jan Dhan- Aadhaar- Mobile)trinity, social audits and involvement of all stakeholders.The Pradhan Mantri Jan Dhan Yojana and recentlylaunched social security schemes viz. Pradhan MantriSuraksha Bima Yojana, Pradhan Mantri Jeevan JyotiYojana and Atal Pension Yojana, together have majorpotential to integrate a large segment of the populationwith the mainstream financial and insurance markets ofthe country. These must be dovetailed for comprehensivedelivery of benefits to people.
8.39.7 Following higher devolution of resources toStates as per the recommendations of the FourteenthFinance Commission, many schemes for agriculture andrural development are expected to witness changes inthe Centre-State sharing pattern. It is, therefore, pertinentthat States increase their share wherever envisaged sothat the schemes do not suffer on the ground. Further,Gram Panchayats (GPs) are also expected to get nearlyRs.2 lakh crore over a five year period (2015-20)coupled with additional resources being made availableto them under schemes like MGNREGA. Being theConstitutional third tier of government and governance,GPs can play a major role in local development byconverging resources over which they have a command.At the same time, the Ministry of Rural Developmentand Ministry of Panchayati Raj should provide technicalassistance for such a process and build the capacity ofStates and Panchayats for carrying out this massiveexercise in participatory planning. Likewise, the DistrictRural Development Agencies (DRDAs) can berestructured into professional organisations capable ofcoordinating and converging the different schemes forpoverty alleviation/ elimination in a time bound manner.Other local bodies have also been granted significantresources as part of 14th Finance Commissiondevolutions, which can be effectively utilised.
8.39.8 Under MGNREGA, the emphasis needs to betowards works that are more productive, asset creating

237AGRICULTURE AND RURAL TRANSFORMATION
and substantially linked to agriculture and allied activities.Other issues that need to be addressed are capacitybuilding of institutions, implementation of electronic fundmanagement systems/ electronic muster rolls in all theStates, putting in place grievance redressal mechanisms,framing rules of compensation in all the States andpayment of wages within the prescribed time limit.Besides, to make the scheme more effective, therestriction of 40 percent limit on materials componentmay be relaxed at the Panchayat level.
8.39.9 The National Rural Livelihood Missionemphasizes both demand and supply side of financialinclusion. On the demand side, it envisages promotionof financial literacy among the poor and to providecatalytic capital to SHGs and federations. On the supplyside, it focuses on coordination with the financial sectorand encourages use of information, communication andtechnology based financial technologies, businesscorrespondents and community facilities like ‘Bank-Mitras’. The NRLM aims to follow saturation approachby ensuring that at least one female member from eachidentified rural household is brought under the SHGnetwork in a time-bound manner. As indicated above,the introduction of DBT, PMJDY, payment of wagesunder MGNREGA through banks/ post office accountsetc. are other instruments to ensure financial inclusionof rural poor that need to be pursued. The issue regardingservice charges payable under financial inclusioninitiatives of the Government also needs to be addressed.
8.39.10 ‘Housing for All’ by 2022 is a thrust area ofthe Government and needs to be implemented withmissionary zeal. This would require integrated approachby putting in place appropriate set of policies thatpromote low cost housing and create greatertransparency in the real estate markets. IAY schememay also have to be re-examined from the point of viewof the fact that there is a large segment of populationthat doesn’t have access to appropriate housing, beingnot classified as the “Below Poverty Line” under theexisting guidelines. The Socio Economic and CasteCensus 2011, the provisional economic data of whichhas been released on 3rdJuly, 2015, can be used to extend
benefits to all deserving population. Dissemination ofappropriate building technologies, capacity building atvarious levels and grievance redressal are other areasthat need to be addressed in the remaining period of theTwelfth Plan.
8.39.11 The Swachh Bharat Mission launched on 2nd
October, 2014 needs to become a mass movement tomake India Clean by 2nd October, 2019 as a befittingtribute to the Father of the Nation on his 150th birthanniversary. The focus, therefore, need not be only onconstructing toilets in the households, or in the schoolsand anganwadi centres or setting up sanitary complexes,but it is equally important to carry out an extensive‘Information, Education and Communication’ campaignso as to impart a behavioural change amongst the peoplefor keeping their surroundings clean. Other stakeholders,including local bodies, and coverage through initiativesunder Corporate Social Responsibility, need to beintegrated with SBM so that the vision becomes a reality.
8.39.12 The National Social Assistance Programmecurrently cover old age, widows and disabled people.The eligibility criteria may need to be re-examined,keeping in view the vulnerability of a large section ofthe people of the country, preferably by using the SocioEconomic and Caste Census data. The quantum ofassistance also needs to be revised from time to timekeeping in view the inflation. This, together with othersocial security and financial inclusion initiativesannounced recently can potentially mitigate risks ofvulnerable people and provide them some stable sourceof livelihood.
8.40 Learnings for the Future
8.40.1 After a remarkable performance of agriculturesector in the Eleventh Plan, the growth during TwelfthPlan has been fairly muted. Partly it has been on accountof drought in three out of four years of the Twelfth Planperiod. This has brought to the forefront a need for astrategy which on the one hand improves farmers’income and on the other hand reduces distress likesituations. Various schemes for food security and povertyalleviation have mitigated part of the problems but yet
238 APPRAISAL DOCUMENT OF TWELFTH FIVE YEAR PLAN
there is a long way to go. While meticulousimplementation of schemes and programmes on groundwould be a key factor, the learnings from the TwelfthPlanprovides many cues for future policy interventions,some of which are critically important. These includethe following:-
(i) First of all, it is most important to de-riskagriculture. Today a large number of farmersfind this means of livelihood unattractive due tolesser incomes and higher risk. To address thisconcern, Pradhan Mantri Fasal Bima Yojana needsto be implemented across all the States at theearliest. In the event of distress, the reliefmeasures for farmers must be quick andtransparent. Irrigated areas must be expandedon a fast track mode.
(ii) Government has stressed for moving beyond ‘foodsecurity’ to ‘income security’ and reorientation ofthe interventions in the farm and non-farm sectorsto double the income of farmers by 2022. Whilethis necessitates higher investment ‘in’ and ‘for’agriculture (agri markets, irrigation, rural roads,etc), it also squarely requires reforms on land leaselaws, fast-tracking APMC reforms andmodification in restrictive rules under EssentialCommodity Act for bringing economy of scale tooperational holdings and better marketing avenues.
(iii) The farmers need to be incentivised to diversifytheir farm activities towards high valuecommodities and enhance the productivity withirrigation and technology upgradation. The valueaddition and connectivity from farm to marketas well as competitive market are essential forbetter price realization and higher farm income.The occupational diversification from farm tonon-farm activities would further augment theincome of farmers.
(iv) Operational holdings need to be consolidated tomake farm holding viable. To achieve, this, trustdeficit between land owners and tenants needs
to be removed through proper legislations. NITIAayog has prepared a Model Agricultural LandLeasingAct. The States should consider enactingland leasing laws based on this model Act.Simultaneously, the land records need to be fullydigitized and integrated with cadastral maps andregistration processes.
(v) Reforms in agriculture R&D must be acceleratedto provide adequate opportunity for privateparticipation in developing market driventechnologies. Agricultural extension system needsto be overhauled with greater emphasis on climateresilience and more efficient two-way feedbackmechanism between farmers and technologydevelopers.
(vi) We must move towards debottleneckingmovement of agricultural commodities across thecountry and facilitate creation of nationalagricultural market. The States need to modifyAPMC Acts to favour electronic trading.
(vii) Technology must be embraced in all the sectionsof rural living be it in the context of providinginformation on agri-commodity prices or forecastabout weather or getting social assistance throughDBT or undertaking banking transactions in non-brick and mortar mode or getting informationabout the better ways of cropping. Seeding withAadhaar needs to be given high importance forall the databases which should be able to interactwith each other with due authorisation frombeneficiaries.
(viii) Subsidies, be it for the purposes of food, fertilizersor other segments, must be targeted in a scientificmanner. Wherever required, the results of SocioEconomic Caste Census or other similartransparent mechanism may be used for betteridentification of beneficiaries. The model ofsubsidies needs to be carefully designed so thatundue benefit is not cornered by people who canotherwise afford without the same. The usage offertilizers also needs to be linked to Soil HealthCards.
239AGRICULTURE AND RURAL TRANSFORMATION
(ix) There are many schemes of rural developmentwhich need to be converged for better outcomes.MGNREGA, with its large outlays can play amajor role in rural transformation, but its activitiesmust be defined in a manner that not only resolvesthe problems faced by people in rural areas butalso provides a long term opportunity forsustainable livelihoods.
(x) It has been proved that people at large are veryreceptive to initiatives such as the Swachh BharatAbhiyan and Pradhan Mantri Jan Dhan Yojanawhich can potentially make long term impact on
people’s lives and these must be furtherstrengthened. Especially in case of PMJDY, itmust not be restricted to only opening bankaccounts. Rather, this is only a beginning and indue course, it should lead to developing habits ofsavings as also getting access to credit from theformal financial system. The cycle of borrowingto undertaking productive activities to earninghigher incomes and repayments must be activatedfor all segments of rural population. Only thenwe would be in a position to ensure a moreequitable and sustainable growth in the times tocome.
240 APPRAISAL DOCUMENT OF TWELFTH FIVE YEAR PLAN
9Urban Transformation
9.1 Introduction
9.1.1 An efficient urbanisation matters to India on manycounts. Firstly, despite a significant reduction in shareof Agriculture and Allied Activities in India’s GDP fromaround 51 per cent in 1951 to around 16 per cent in2014-15, per cent of labour force employed in thesesectors has almost showed an occupational stasis,decreasing from 70 per cent to only 54.6 per cent since1951. For a rapid inclusive growth, a core imperative isfaster creation of remunerative employment opportunitiesin non-farm sector. While there is some evidence ofcreation of non-farm employment in rural sector itself,if experience in other countries undergoing economictransformation is an indicator, much of suchopportunities need to be created in urban sector includingperi urban areas and therefore cities in India have toemerge as an ‘Engine of Economic Growth’.
9.1.2 Secondly, Indian cities are visibly deficient inproviding basic amenities to its citizens even at theircurrent level of population. Assuming that rate of ruralurban migration which has so far remained muted1,would accelerate, cities have to create these amenitiesat a rate faster than what has been accomplished before.Lack of basic amenities affects a city in many ways thathave been well documented. Poor infrastructureadversely affects the ability of cities in attractinginvestment in this globalized world. Coping cost as wellas loss of productivity due to poor infrastructure hasbeen documented to be significant2. It is also important
to realise that the incidence of such coping cost isdisproportionately higher on economically weaker sectionand other vulnerable groups, not only due to deficiencyin provision of such facilities itself but also due to varyingabilities of these Groups to access even freely providedamenities. A special mention needs to be made here interms of availability of affordable public transport andits impact on energy footprint of the cities as well as inimproving the outcomes of the city labour markets.
9.1.3 Thirdly, as the pressure on natural resources isincreasing, sustainability of cities has emerged as a majorconcern. A marked deficiency in processing andscientific disposal of urban waste has resulted in asituation where Indian cities are polluting water bodies,degrading soil and environment at a much larger scalethan they use these resources. Environmentalsustainability of Indian cities is therefore a majorimperative for guiding efficient urbanisation.
9.2 Major Trends in Urbanization
9.2.1 About 377 million Indians, comprising about 31per cent of the country’s population, live in urban areasaccording to Census 2011. While the definition of ‘urban’differs across countries, the current level of urbanisationin India in per cent terms is smaller compared to otherlarge developing countries, e.g. 45 per cent in China, 54per cent in Indonesia, 78 per cent in Mexico, and 87 percent in Brazil. The Twelfth Plan notes in details the trendsin urbanisation1 and projects that the process is set to
1 Paras 18.6-18.10, pp 319-320, Volume II, Twelfth Five Year Plan.2Paras 18.14-18.17 pp 321-322, Volume II, Twelfth Five year Plan.
241URBAN TRANSFORMATION
accelerate2. After finalization of the Plan, census hasreleased some more data and the following is noted:
a) Emergence of Census towns: Census2011 notes that the number of towns in Indiaincreased from 5,161 in 2001 to as many as7,933 (4,041 statutory towns and 3,892census towns) in 2011. It points out thatalmost all of this increase was by growth in‘census’ towns (which increased by 2,530)rather than ‘statutory’ towns (whichincreased by only 242). ‘Statutory’ townsare towns with municipalities orcorporations. “Census town are settlementswhich have qualified the Census definitionof “Urban” viz. (a) all places with amunicipality, corporation, cantonment boardor notified town area committee, etc. (b)all other places which satisfy the followingcriteria:
(i) a minimum population of 5,000
(ii) at least 75% of male working populationengaged in non-agricultural pursuits;and
(iii) a density of population of at least 400persons per square kilometer.
Hence these centers, despite having all thecharacteristics of an urban centre, continueto be statutorily rural and thus governed byrural governance structure.
b) Though urban population as a percentage oftotal population has been steadily rising thereis as yet no evidence of any significantacceleration in its growth rate, though lastdecade witnessed a marginal rise. While it istrue that during 2001-2011, for the first timeIndia added more people in urban areas (90.98million) than in rural areas (90.46 million),the annual exponential growth rate (AEGR),which had peaked during 1971-81, has in factdecelerated in recent decades though pickedup only marginally during 2001-2011. The
AEGR of urban population during the 1950swas 3.5 per cent. The 1970s, saw a veryhigh urban growth of 3.8 per cent. Thegrowth rate, however, came down to 3.1 percent in the 1980s. It went down further to2.73 per cent in the 1990s. The correspondinggrowth rate for 2001-2011 is 2.76 per cent.Comparison of growth rates between last twodecades is at Annexure-9.1 for major urbancenters in India.
c) India has added urban population in allclasses of cities. Population details of citiesof different sizes are at Annexure-9.2. Inurban India, there has been an increase inthe concentration of people, economicperformance and quality jobs in themetropolitan cities as compared to that ofnon-metropolitan cities and small ordertowns. Share of urban population in themetropolitan cities has increased from 37.8to 42.3 per cent as compared to non-metropolitan Class I cities, where the samehas decreased from 30.8 per cent to 27.9per cent (though their numbers have goneup by 57) in the decade 2001-11. “Thenumber of metropolitan cities have alsoincreased from 35 to 52 during 2001-11.The growth rate of metropolitan cities havedeclined during 2001-11.”
d) In the metropolitan cities, the trend ofperipheralization is evident, with thepopulation in the core city areas as apercentage of the total Urban agglomerationshowing a decline of 1.5 percentage pointsin metropolitan cities from 72.7% to 71.2%,as compared to 4.5 percentage points from90.2% in 2001 to 85.7% in non-metropolitanClass-I cities during 2001-11
9.3 Some of the implications of emerging trendin urbanisation are covered below:
a) While the growth in the Agriculture and Alliedactivities during Eleventh Plan was 4.1 per
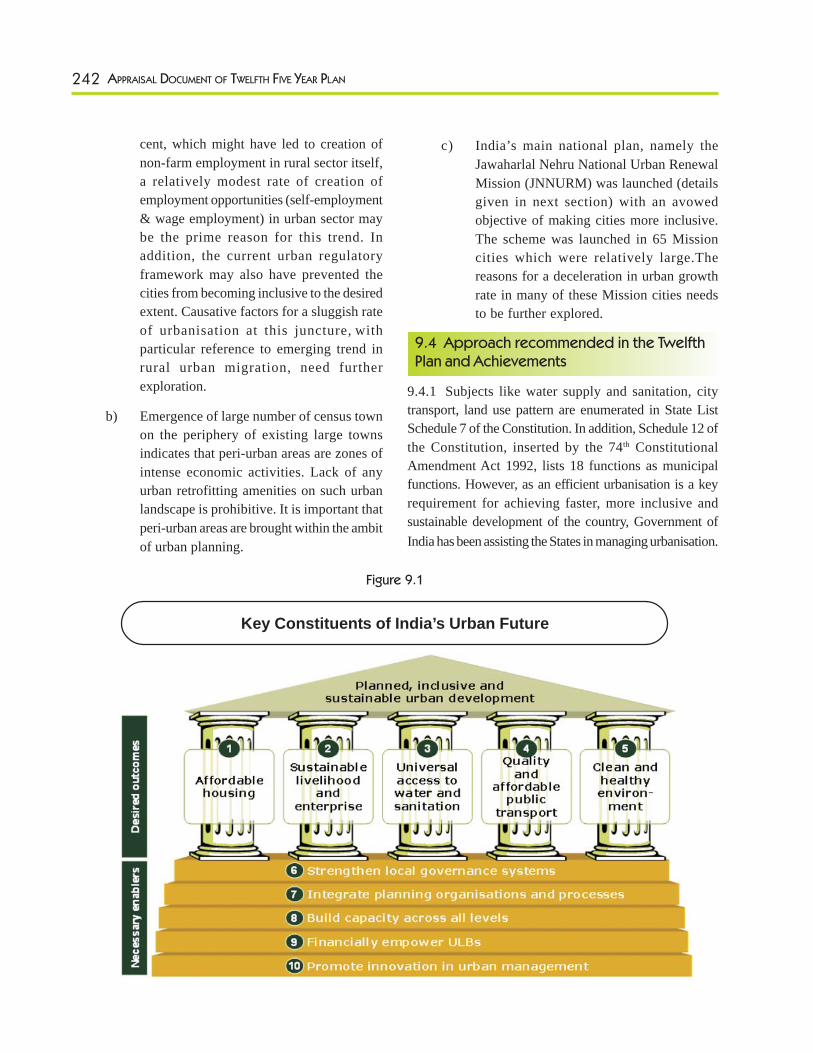
242 APPRAISAL DOCUMENT OF TWELFTH FIVE YEAR PLAN
cent, which might have led to creation ofnon-farm employment in rural sector itself,a relatively modest rate of creation ofemployment opportunities (self-employment& wage employment) in urban sector maybe the prime reason for this trend. Inaddition, the current urban regulatoryframework may also have prevented thecities from becoming inclusive to the desiredextent. Causative factors for a sluggish rateof urbanisation at this juncture, withparticular reference to emerging trend inrural urban migration, need furtherexploration.
b) Emergence of large number of census townon the periphery of existing large townsindicates that peri-urban areas are zones ofintense economic activities. Lack of anyurban retrofitting amenities on such urbanlandscape is prohibitive. It is important thatperi-urban areas are brought within the ambitof urban planning.
c) India’s main national plan, namely theJawaharlal Nehru National Urban RenewalMission (JNNURM) was launched (detailsgiven in next section) with an avowedobjective of making cities more inclusive.The scheme was launched in 65 Missioncities which were relatively large.Thereasons for a deceleration in urban growthrate in many of these Mission cities needsto be further explored.
9.4 Approach recommended in the TwelfthPlan and Achievements
9.4.1 Subjects like water supply and sanitation, citytransport, land use pattern are enumerated in State ListSchedule 7 of the Constitution. In addition, Schedule 12 ofthe Constitution, inserted by the 74th ConstitutionalAmendment Act 1992, lists 18 functions as municipalfunctions. However, as an efficient urbanisation is a keyrequirement for achieving faster, more inclusive andsustainable development of the country, Government ofIndia has been assisting the States in managing urbanisation.
Figure 9.1
Key Constituents of India’s Urban Future
243URBAN TRANSFORMATION
9.4.2 The Twelfth Plan clearly recognized that besidesproviding financial assistance, a prime function ofGovernment of India is to incentivise such structuralreforms which allow the cities to discharge their functionsmore efficiently. It identified key enablers for efficienturbanisation and its desired outcomes in Figure 9.1.
9.4.3 The Plan made a series of recommendationsacross all these key enablers. In addition, the Plan madespecific recommendations for expanding affordable urbantransport network, for addressing housing needs andfor improving the earning potential of urban poor. Majorrecommendations made in the Plan and achievementsare discussed in ensuing paragraphs.
9.5 National Urban Renewal Mission
9.5.1 Since 2005, the approach of Government of Indiafor assisting States to bring about an efficient urbanisationis largely embodied in its flagship programme viz. theJawaharlal Nehru National Urban Renewal Mission(JNNURM). The underlying assumptions made regardingurban sector and strategy employed to address throughthis programme need a review to examine their relevancein the present context as it would help in shaping futurestrategy. It is therefore instructive to look at theprogramme in entirety and not confine to the experiencegained in first three years of the Twelfth Plan.
9.5.2 It was assumed that a major obstacle to efficienturbanisation is inefficient governance structure at citylevel despite requisite decentralization mandated underthe 74th CAA. The Urban Local Bodies, which are tomanage the cities, were financially weak and having poorcapacities. In many cases, they were trapped in a lowlevel equilibrium as due to poor capacity, limitedfunctions were assigned to them. Their finances wereweak and uncertain and hence they were not in a positionto draw a robust urban plan. It was also recognized thaturban governance structure is fragmented and thusinstitutional arrangement to ensure participation ofcitizenry was very weak.
9.5.3 A central problem recognized was the lack of anyrobust spatial plans of cities consistent with aspirationsof the people. As of now, out of 4,041 statutory towns,Master Plans have been drawn in about 2,200 cities.Ministry of Urban Development has been advising theState Governments to expedite the preparation of MasterPlan by using GIS and Remote Sensing Technique. As asymbol of an efficient third tier government, the holisticdevelopment of cities should be in accordance with suchplans developed through participatory process. Ofparticular importance is integration of land use patternwith transport planning in a city.
Table 9.1: Urban Reforms and their Broad Objectives
Focus area Reforms
Empowering Urban Local Bodies and Implementation of decentralization measures as envisaged in 74th CAA includingimprovement in Municipal transfer of 18 functions to ULBs; e-Governance set up at ULBs; Adoption ofadministration accrual based double entry system of accounting in ULBs Administrative and
structural reforms.
Improvement in city level planning Constitution of Metropolitan Planning Committees and District PlanningCommittees.
Improvement in financial position Levy of reasonable user charges; Property tax: 85 per cent coverage and 90 perof ULBs and securing finances for cent collection efficiency; 100 per cent recovery of O&M cost of water supplyprojects and solid waste management; Encouraging Public Private Partnership.
Pro-poor urban reforms Earmarking of budget for urban poor. Earmarking of 20-25 percent of developedland for LIG/EWS category in housing projects and provision of basic servicesfor poor.
Removing distortions in urban land All planning related reforms: reform in rent control Act, rationalisation of stampduty to not more than 5 percent; repeal of Urban Land Ceiling & RegulationAct;computerized registration of land and property and introduction of propertytitle certification system. Simplification of legal and procedural frameworkforconversion of agricultural land for non-agricultural purpose and Revision inbuilding bye laws - streamlinethe approval process.
Sustainability, community participation All planning related reforms; Bye laws for water harvesting, re-use and re-cycledand transparency water; Enactment of Community Participation Law and Public Disclosure law.
244 APPRAISAL DOCUMENT OF TWELFTH FIVE YEAR PLAN
9.5.4 As the passage of 74th CAA in 1992 did not leadto any significant empowerment of ULBs, the obstaclesoutlined above were sought to be addressed throughincentivizing the States in undertaking urban reforms.Hence 23 urban reforms were incentivised underJNNURM; their focus area may be broadly indicated inTable 9.1.
9.5.5 Underlying strategy of urban renewal mission:
a) Emphasis on 65 Mission cities: About 70per cent of JNNURM outlay was meant for65 relatively large or important cities (likeState Capitals or heritage cities with touristpotential), the central idea being that thesecities have larger potential to emerge asengines of growth and secondly, as thesecities would develop, they would have a‘demonstration effect’ on other cities wheredevelopment could be taken up by States.
b) Main elements of design: Reforms fallwithin the purview of State Governments.Hence JNNURM was designed with thefollowing broad arrangement:
i. For accessing Central Assistance, citieswere to prepare City DevelopmentPlans through a participative process.
ii. Central Government was to take upprojects situated in such plans. Thepercentage of Central Assistance wasalso calibrated, with larger citiesreceiving lesser percentage of totalproject cost as Central Assistance.
iii. States entered into an MoU withMinistry of Urban Development(MOUD) agreeing to a 7 year timelinefor completion of the 23 reforms.
iv. The first installment of CentralAssistance was released on sanctionof project. Subsequent installmentswere to be released on the basis ofachievements in completing reformsas per agreed timelines and utilizationof earlier installments.
c) An umbrella scheme for urban sector forrequisite convergence of effort:JNNURM was implemented under 4components. For providing urbaninfrastructure relating to water supply,sewerage, solid-waste management, roadsetc., Urban Infrastructure and Governance(UIG) component for 65 Mission cities, andUrban Infrastructure and DevelopmentScheme for Small and Medium Town(UIDSSMT) for non-Mission cities werecovered. Another component, namely BasicService to the Urban Poor (BSUP) coversMission cities, whereas for non-MissionCities, Integrated Housing and SlumDevelopment Programme (IHSDP) had alsobeen launched. However, over 80 per centof the non-mission cities could not accessthe grants due to inability in raising matchingresources and in preparing viable detailedproject reports. Their limited competencein implementation of the reforms also stoodin the way.
9.6 Changes recommended by Twelfth Planin National Urban Renewal Mission
9.6.1 The Twelfth Plan identified some of the learningsof the implementation of JNNURM and recommendedre-launch of these programmes with broadly followingchanges:
a) Emphasis on medium and small townsas well: Taking cognizance of emergenceof a large number of census towns andaddition of urban population in large as wellas smaller towns, the Plan questioned thebasic assumption that larger funds flowshould take place only to large cities. Insteadthe Plan recommended development of asuitable portfolio of cities, leaving the choiceof selection of such cities with the States.
b) According more flexibility to States inchoosing and sanctioning the project: ThePlan recommended that Central Ministriesmay approve the plan and assist the Statesin operationalization of the plans.
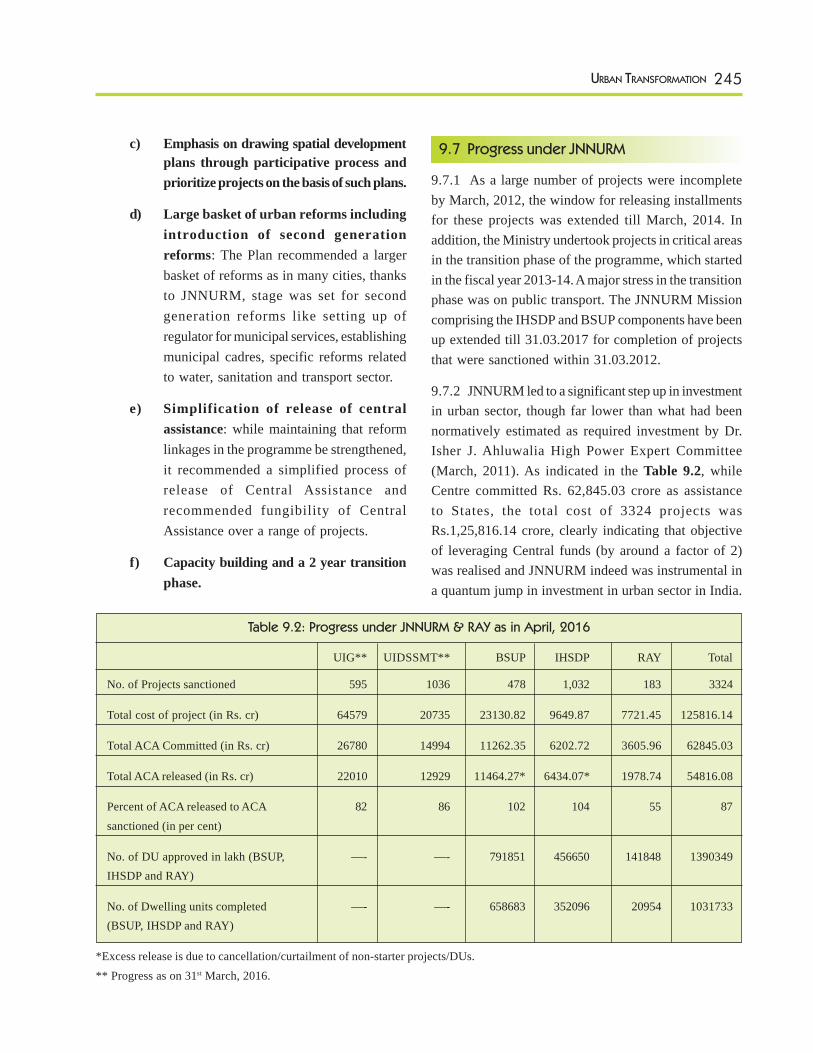
245URBAN TRANSFORMATION
c) Emphasis on drawing spatial developmentplans through participative process andprioritize projects on the basis of such plans.
d) Large basket of urban reforms includingintroduction of second generationreforms: The Plan recommended a largerbasket of reforms as in many cities, thanksto JNNURM, stage was set for secondgeneration reforms like setting up ofregulator for municipal services, establishingmunicipal cadres, specific reforms relatedto water, sanitation and transport sector.
e) Simplification of release of centralassistance: while maintaining that reformlinkages in the programme be strengthened,it recommended a simplified process ofrelease of Central Assistance andrecommended fungibility of CentralAssistance over a range of projects.
f) Capacity building and a 2 year transitionphase.
9.7 Progress under JNNURM
9.7.1 As a large number of projects were incompleteby March, 2012, the window for releasing installmentsfor these projects was extended till March, 2014. Inaddition, the Ministry undertook projects in critical areasin the transition phase of the programme, which startedin the fiscal year 2013-14. A major stress in the transitionphase was on public transport. The JNNURM Missioncomprising the IHSDP and BSUP components have beenup extended till 31.03.2017 for completion of projectsthat were sanctioned within 31.03.2012.
9.7.2 JNNURM led to a significant step up in investmentin urban sector, though far lower than what had beennormatively estimated as required investment by Dr.Isher J. Ahluwalia High Power Expert Committee(March, 2011). As indicated in the Table 9.2, whileCentre committed Rs. 62,845.03 crore as assistanceto States, the total cost of 3324 projects wasRs.1,25,816.14 crore, clearly indicating that objectiveof leveraging Central funds (by around a factor of 2)was realised and JNNURM indeed was instrumental ina quantum jump in investment in urban sector in India.
Table 9.2: Progress under JNNURM & RAY as in April, 2016
UIG** UIDSSMT** BSUP IHSDP RAY Total
No. of Projects sanctioned 595 1036 478 1,032 183 3324
Total cost of project (in Rs. cr) 64579 20735 23130.82 9649.87 7721.45 125816.14
Total ACA Committed (in Rs. cr) 26780 14994 11262.35 6202.72 3605.96 62845.03
Total ACA released (in Rs. cr) 22010 12929 11464.27* 6434.07* 1978.74 54816.08
Percent of ACA released to ACA 82 86 102 104 55 87sanctioned (in per cent)
No. of DU approved in lakh (BSUP, —- —- 791851 456650 141848 1390349IHSDP and RAY)
No. of Dwelling units completed —- —- 658683 352096 20954 1031733(BSUP, IHSDP and RAY)
*Excess release is due to cancellation/curtailment of non-starter projects/DUs.** Progress as on 31st March, 2016.
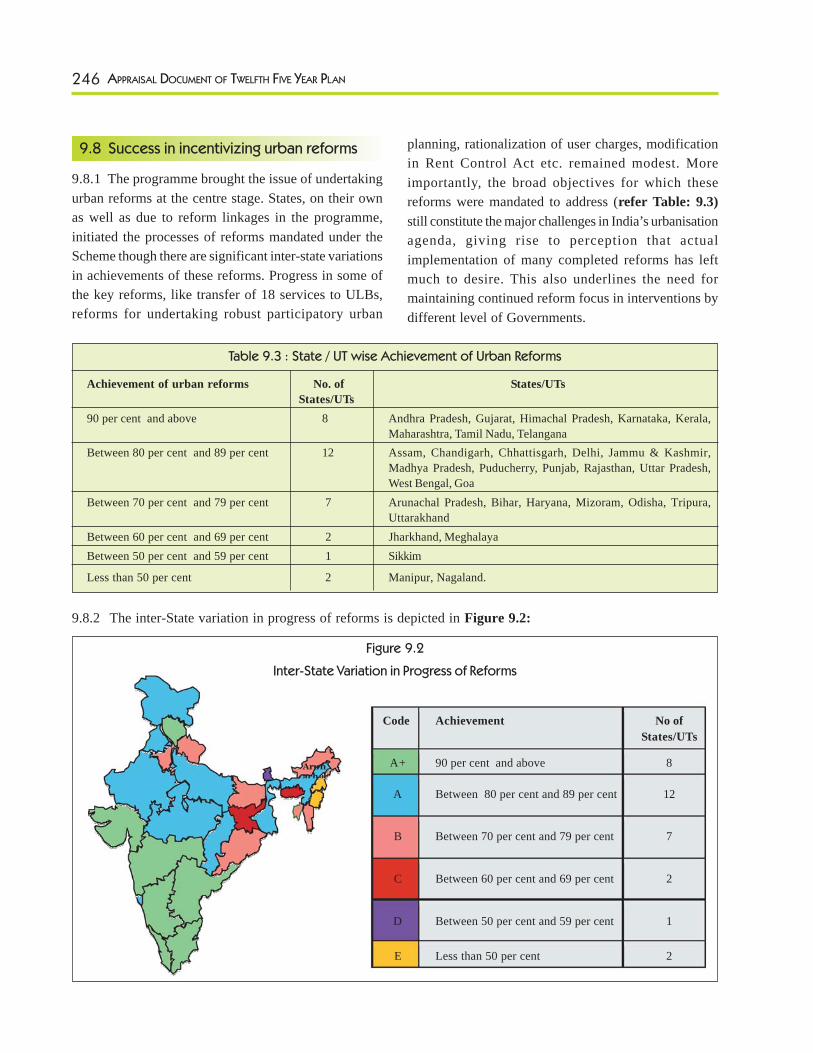
246 APPRAISAL DOCUMENT OF TWELFTH FIVE YEAR PLAN
9.8 Success in incentivizing urban reforms
9.8.1 The programme brought the issue of undertakingurban reforms at the centre stage. States, on their ownas well as due to reform linkages in the programme,initiated the processes of reforms mandated under theScheme though there are significant inter-state variationsin achievements of these reforms. Progress in some ofthe key reforms, like transfer of 18 services to ULBs,reforms for undertaking robust participatory urban
Table 9.3 : State / UT wise Achievement of Urban Reforms
Achievement of urban reforms No. of States/UTsStates/UTs
90 per cent and above 8 Andhra Pradesh, Gujarat, Himachal Pradesh, Karnataka, Kerala,Maharashtra, Tamil Nadu, Telangana
Between 80 per cent and 89 per cent 12 Assam, Chandigarh, Chhattisgarh, Delhi, Jammu & Kashmir,Madhya Pradesh, Puducherry, Punjab, Rajasthan, Uttar Pradesh,West Bengal, Goa
Between 70 per cent and 79 per cent 7 Arunachal Pradesh, Bihar, Haryana, Mizoram, Odisha, Tripura,Uttarakhand
Between 60 per cent and 69 per cent 2 Jharkhand, MeghalayaBetween 50 per cent and 59 per cent 1 Sikkim
Less than 50 per cent 2 Manipur, Nagaland.
planning, rationalization of user charges, modificationin Rent Control Act etc. remained modest. Moreimportantly, the broad objectives for which thesereforms were mandated to address (refer Table: 9.3)still constitute the major challenges in India’s urbanisationagenda, giving rise to perception that actualimplementation of many completed reforms has leftmuch to desire. This also underlines the need formaintaining continued reform focus in interventions bydifferent level of Governments.
Code Achievement No ofStates/UTs
A+ 90 per cent and above 8
A Between 80 per cent and 89 per cent 12
B Between 70 per cent and 79 per cent 7
C Between 60 per cent and 69 per cent 2
D Between 50 per cent and 59 per cent 1
E Less than 50 per cent 2
9.8.2 The inter-State variation in progress of reforms is depicted in Figure 9.2:
Figure 9.2
Inter-State Variation in Progress of Reforms
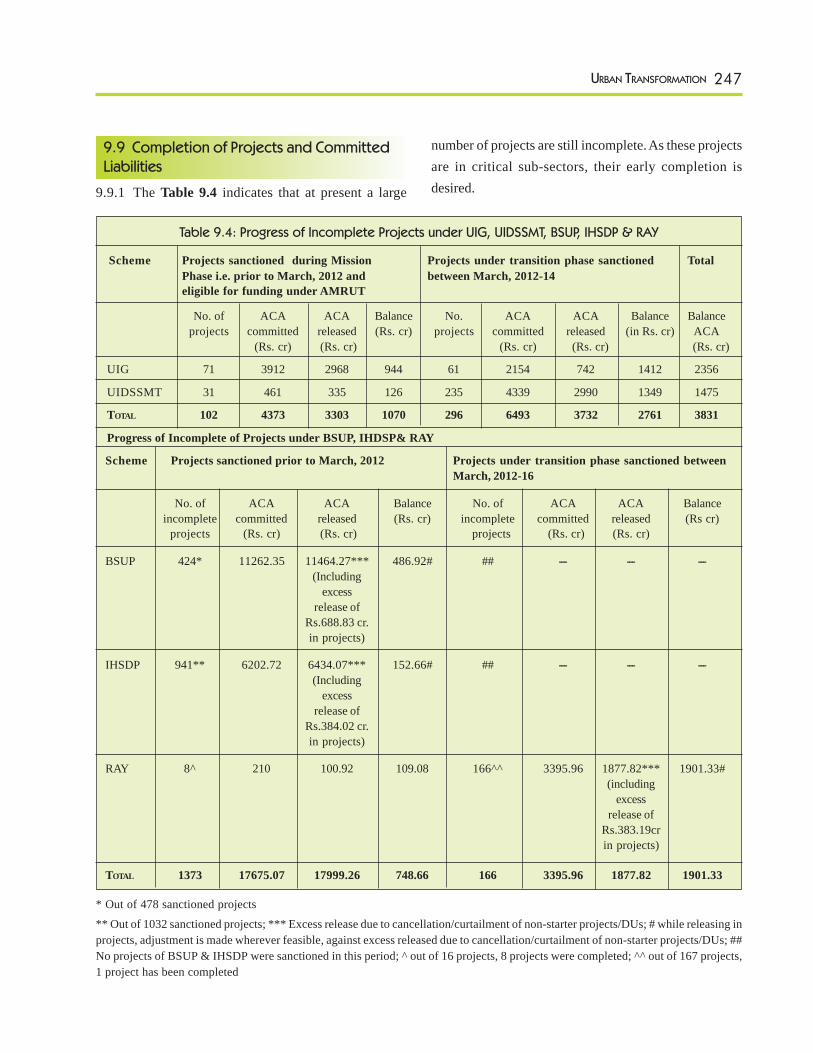
247URBAN TRANSFORMATION
9.9 Completion of Projects and CommittedLiabilities
9.9.1 The Table 9.4 indicates that at present a large
number of projects are still incomplete. As these projectsare in critical sub-sectors, their early completion isdesired.
Table 9.4: Progress of Incomplete Projects under UIG, UIDSSMT, BSUP, IHSDP & RAY
Scheme Projects sanctioned during Mission Projects under transition phase sanctioned TotalPhase i.e. prior to March, 2012 and between March, 2012-14eligible for funding under AMRUT
No. of ACA ACA Balance No. ACA ACA Balance Balanceprojects committed released (Rs. cr) projects committed released (in Rs. cr) ACA
(Rs. cr) (Rs. cr) (Rs. cr) (Rs. cr) (Rs. cr)
UIG 71 3912 2968 944 61 2154 742 1412 2356
UIDSSMT 31 461 335 126 235 4339 2990 1349 1475
TOTAL 102 4373 3303 1070 296 6493 3732 2761 3831
Progress of Incomplete of Projects under BSUP, IHDSP& RAY
Scheme Projects sanctioned prior to March, 2012 Projects under transition phase sanctioned betweenMarch, 2012-16
No. of ACA ACA Balance No. of ACA ACA Balanceincomplete committed released (Rs. cr) incomplete committed released (Rs cr)
projects (Rs. cr) (Rs. cr) projects (Rs. cr) (Rs. cr)
BSUP 424* 11262.35 11464.27*** 486.92# ## --- --- ---(Including
excessrelease of
Rs.688.83 cr.in projects)
IHSDP 941** 6202.72 6434.07*** 152.66# ## --- --- ---(Including
excessrelease of
Rs.384.02 cr.in projects)
RAY 8^ 210 100.92 109.08 166^^ 3395.96 1877.82*** 1901.33#(including
excessrelease of
Rs.383.19crin projects)
TOTAL 1373 17675.07 17999.26 748.66 166 3395.96 1877.82 1901.33
* Out of 478 sanctioned projects
** Out of 1032 sanctioned projects; *** Excess release due to cancellation/curtailment of non-starter projects/DUs; # while releasing inprojects, adjustment is made wherever feasible, against excess released due to cancellation/curtailment of non-starter projects/DUs; ##No projects of BSUP & IHSDP were sanctioned in this period; ^ out of 16 projects, 8 projects were completed; ^^ out of 167 projects,1 project has been completed
248 APPRAISAL DOCUMENT OF TWELFTH FIVE YEAR PLAN
9.10 Relevance of Urban Renewal Strategyand Recommended Guiding Principles
9.10.1 As mentioned earlier, urban sector is largely aState subject. The recommendations of the 14th FinanceCommission (FC) have important bearing on therespective roles of the GOI, States and local governmentsin the sector. (Box 9.1)
Box 9.1Recommendations of 14th Finance Commission,
accepted by Government
i. To increase the devolution to States in Union’snet Tax receipt from 32 per cent to 42 per cent. Thisrecommendation has been accepted by GoI and asagainst devolution of Rs. 3.48 lakh crore to Statesin 2014-15, the devolution in 2015-16 would be Rs.5.26 lakh crore which is an increase of Rs. 1.78 lakhcrore approximately.
ii. For Urban Local Bodies, the FC has recommendedfollowing grants for the period of 2015-20:
a. Basic Grant: Rs. 69,715.03 crore
b. Performance grant: Rs. 17,428.76 crore
c. Total: Rs. 87,143.79 crore
9.10.2 Following recommendations are being made aspart of general approach for efficient urbanisation:
A) Based on recommendations of Isher J. Ahluwalia,High Power Expert Committee (HPEC), theTwelfth Plan had recommended that national urbanrenewal mission should commit 0.25 per cent ofGDP, as this was the projected gap in the municipalfinances as a whole. The Plan had also endorsedrecommendations of HPEC on strengtheningmunicipal finance which included inserting aLocal Bodies Finance List (LBFL) along the linesof the Union and State Lists; Empowerment toULBs to exclusively levy property tax, professiontax, entertainment tax, and advertisement tax andretain the whole of their proceeds; Constitutionallyensuring sharing of a pre-specified percentage ofrevenues from all taxes on goods and services
etc. In view of recommendations made by the14th FC, the above position has altered. Hence,while GoI would continue to assist the Statesin urban sector, its share in projects may suitablyget reduced due to larger fiscal space alreadymade available to States. This also gives anopportunity to implement the Scheme on generalpattern of fostering competition among Statesfor Central funds. Recommendations of HPECregarding devolution of funds from State toULBs continues to remain relevant and standsendorsed.
B) The enablers for efficient urbanisation, identifiedin the Twelfth Plan (refer para 9.4 above) are stillrelevant and strengthening of these enablers shouldcontinue to be the main strategy for urbanisation.Since Spatial Urban Planning through participatoryprocess is the starting point for any efficienturbanisation, it is specifically recommended thatStates may complete drawing of such plans in allcities by the end of the Twelfth Plan. In this regard,Ministry of Urban Development may continue towork with States to ensure that some of the keyrecommendations regarding urban planning viz.integration of land use with transport planning andTransit Oriented Development are mainstreamed.A particular reference is made in this regard to thePlan recommendations of strategic densificationin cities and readjustment methods as aninstrument for boosting availability of scarce landfor efficient urbanisation.
C) The principles identified in the Twelfth Plan forefficient urbanisation continue to remain quiterelevant and should guide the urbanisation process.These principles are:
i) More flexibility to State Governments inmanaging urbanisation
ii) Emphasis on developing a suitable portfolioof cities rather than concentrating only on
249URBAN TRANSFORMATION
large cities and inclusion of peri-urban areasfor urban planning
iii) Drawing spatial development plansthrough participative process
iv) Large basket of urban reforms withmore flexibility to States to completethem, while an alternative is to incentivisea smaller set of doable reforms, mandatinga large set of reforms including secondgeneration reforms has the advantage ofdeveloping a road map for transformationof urban landscape in India.
v) Encouraging private investment underPPP arrangement.
vi) Capacity building in urban sector
vii) Convergence across activities ofdifferent Ministries: it is gettingincreasingly clear that efficient urbanisationinvolves a series of interconnected activitiesoften falling within domain of differentMinistries and different levels ofGovernment. Initiatives like Swachh BharatMission, Housing for All, and creation ofjobs in urban areas require convergence instrategisation as well as implementation. Asrecommended in the Twelfth Plan, ULBsshould become the focal point for all citizenrelated services. In this regard, the 14th FChas recommended that municipal budgetsshould reflect all receipts, including receiptsfrom Government of India, and allexpenditure.
D) There are a large number of projects sanctionedunder the earlier programme of JNNURM whichshould be completed on priority.
9.11 Sector-wise Approaches, Schemes andRecommendations
9.11.1 The preceding paragraph outlines the continuedrelevance of approach recommended in the Twelfth Plankey enablers and guiding principle for efficienturbanisation with some modification. In the succeedingparagraphs, an appraisal of development in the first threeyears of the Plan and emerging course of action areoutlined.
9.12 Housing for All
9.12.1 The Government endeavours to ensure puccahousing for every family by the 75th year ofIndependence (2022). It also aims to provide thesehouses with basic amenities: water, sanitation, electricity,etc. These, perhaps are quite ambitious pronouncements,given the extent of deficiency of housing in India andlimited access to basic services by poor. Onimplementation, they will also be game changers in manyways. Firstly, as one would expect, since housing deficitis most severe at low income level, decent housingwould considerably uplift standard of living of thesehouseholds. Secondly, in urban India, an overwhelmingpercentage of workers are engaged in ‘informal sector.’Many of these workers live in slums or low qualityhouses where they face a very high coping cost due todeficiency in basic amenities. Poor living condition alsoadversely affects their economic productivity. Henceprovisions of housing with these services are alsoproductivity enhancing measures. Thirdly, income andoutput multiplier effect of investment in constructionsector has been estimated to be very high. A progresstowards ensuring housing to all would also result inincreased investment in this sector thereby raising therate of creation of much needed jobs in Indian cities.
Extent of Problem
9.12.2 The total urban housing shortage in 2012 hadbeen estimated at 18.78 million dwelling units (DU) by,Report of the Technical Group on Urban HousingShortage (TG-12) (2012-17)headed by Prof. AmitabhKundu as shown in Figure 9.3.
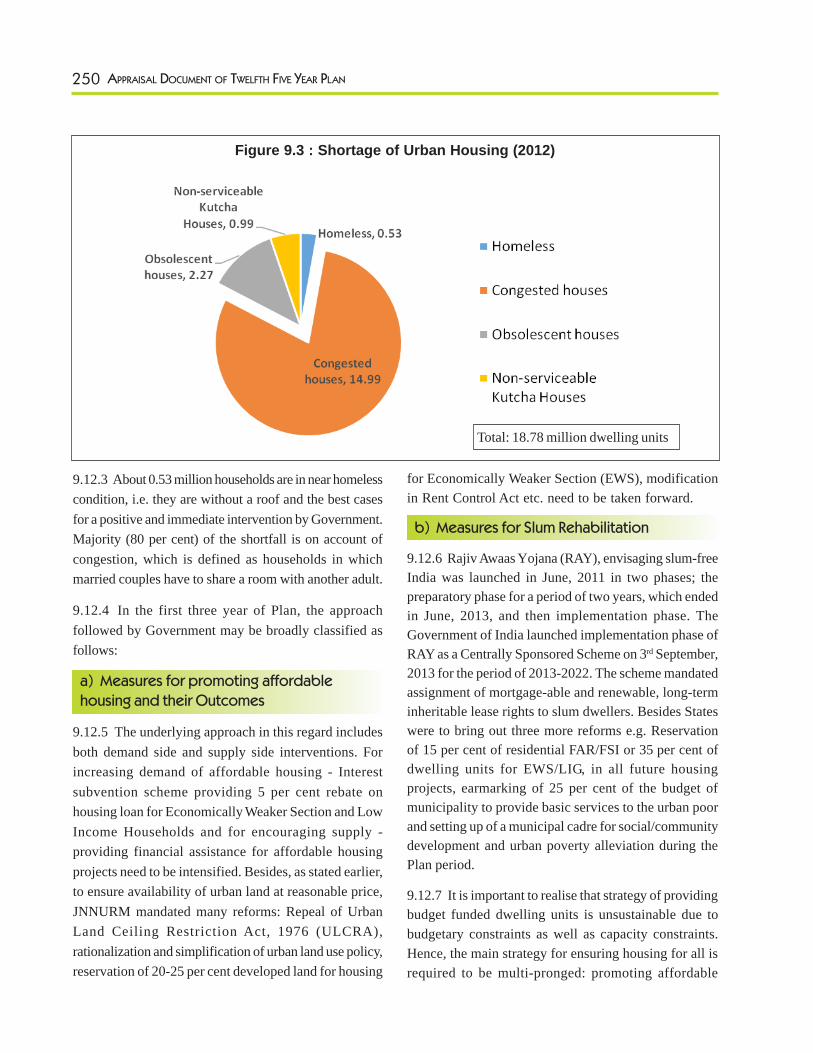
250 APPRAISAL DOCUMENT OF TWELFTH FIVE YEAR PLAN
Total: 18.78 million dwelling units
9.12.3 About 0.53 million households are in near homelesscondition, i.e. they are without a roof and the best casesfor a positive and immediate intervention by Government.Majority (80 per cent) of the shortfall is on account ofcongestion, which is defined as households in whichmarried couples have to share a room with another adult.
9.12.4 In the first three year of Plan, the approachfollowed by Government may be broadly classified asfollows:
a) Measures for promoting affordablehousing and their Outcomes
9.12.5 The underlying approach in this regard includesboth demand side and supply side interventions. Forincreasing demand of affordable housing - Interestsubvention scheme providing 5 per cent rebate onhousing loan for Economically Weaker Section and LowIncome Households and for encouraging supply -providing financial assistance for affordable housingprojects need to be intensified. Besides, as stated earlier,to ensure availability of urban land at reasonable price,JNNURM mandated many reforms: Repeal of UrbanLand Ceiling Restriction Act, 1976 (ULCRA),rationalization and simplification of urban land use policy,reservation of 20-25 per cent developed land for housing
for Economically Weaker Section (EWS), modificationin Rent Control Act etc. need to be taken forward.
b) Measures for Slum Rehabilitation
9.12.6 Rajiv Awaas Yojana (RAY), envisaging slum-freeIndia was launched in June, 2011 in two phases; thepreparatory phase for a period of two years, which endedin June, 2013, and then implementation phase. TheGovernment of India launched implementation phase ofRAY as a Centrally Sponsored Scheme on 3rd September,2013 for the period of 2013-2022. The scheme mandatedassignment of mortgage-able and renewable, long-terminheritable lease rights to slum dwellers. Besides Stateswere to bring out three more reforms e.g. Reservationof 15 per cent of residential FAR/FSI or 35 per cent ofdwelling units for EWS/LIG, in all future housingprojects, earmarking of 25 per cent of the budget ofmunicipality to provide basic services to the urban poorand setting up of a municipal cadre for social/communitydevelopment and urban poverty alleviation during thePlan period.
9.12.7 It is important to realise that strategy of providingbudget funded dwelling units is unsustainable due tobudgetary constraints as well as capacity constraints.Hence, the main strategy for ensuring housing for all isrequired to be multi-pronged: promoting affordable
Figure 9.3 : Shortage of Urban Housing (2012)
251URBAN TRANSFORMATION
housing by making supply and demand sideinterventions, promoting rental housing instead of solereliance on ownership based housing and rehabilitation ofslums through innovative financing strategy. Budgetaryfunding is recommended only in such slum rehabilitationprojects where alternative financing is not possible.
9.12.8 The Government of India, as part of UrbanRejuvenation Mission has launched in June, 2015 aComprehensive Mission viz “Pradhan Mantri Awas Yojana(PMAY)” to assist States/UTs for achieving the goal ofproviding houses to all by 2022. Important elements ofthis strategy may be broadly classified as follows:
a) Rehabilitation of existing slum dwellers,using land as resource through participationof private developers in situ, whereverpossible and in unavoidable cases byrelocation.
b) Promotion of affordable housing throughcredit linked subsidy.
c) Affordable Housing in partnership.
d) Subsidy for beneficiary led individual houseconstruction or enhancement.
9.12.9 Further, in Union Budget 2016-17, Governmenthas announced the following measures to promoteaffordable housing:
a) 100 per cent deduction for profits to anundertaking from a housing project for flatsupto 30 sq. metres in the four metro citiesand 60 sq. metres in other cities approvedduring June, 2016 to March, 2019 andcompleted within 3 years of approval. OnlyMinimum Alternate Tax will be applicable tothese undertakings.
b) Deduction of additional interest ofRs. 50,000 per annum for the ‘first – homebuyers’, for loans upto Rs. 35 lakh, providedhouse value does not exceed Rs. 50 lakhs.
c) Exemption of Dividend Distribution Tax ondistribution made out of income of SPVs to
the REITs and INVITs, to facilitateinvestments in REITs.
d) Exemption of service tax on constructionof affordable houses upto 60 square metresunder any scheme of the Central or StateGovernment including PPP schemes.
e) Extension of excise duty exemption,presently available to Concrete Mixmanufactured at site for use in constructionwork at such site to Ready Mix Concrete.
9.12.10 It may be noted that compared to the earlierapproach of explicitly seeking land for affordable housingthrough reforms, the focus suggested here is tointernalize the reforms, as projects under this head wouldpromote using land based financial instrument as welllocating such projects in areas of intense economicactivities.
9.12.11 Affordable housing is not possible unless landis made available for this purpose. Besides identifyingand reserving land parcels for affordable housing, a majorreform which needs to be the cornerstone of strategy,is to make suitable modifications in the existing urbanplanning norms, with lead role of States. In addition,integration between land and transport planning is neededso that such affordable housing is linked with publictransport. The true potential of construction sector,which has high capacity of generating employment, canbe realised only if the building norms, land conversionprocess and approval processes are streamlined andmade transparent. States can also play an important rolein encouraging cost saving new technologies ofconstruction so that local material is used. Further, ithas been estimated that there are about 10 million vacanthouses in urban India. Besides, within cities, there aremany parcels of land which are inefficiently utilized orare vacant. Discouraging these tendencies would notonly free land for smart cities and affordable housing,but also offer an opportunity to generate much neededresources for financing urban Infrastructure. Theseshould be focus of the Ministry in the remaining Planperiod.
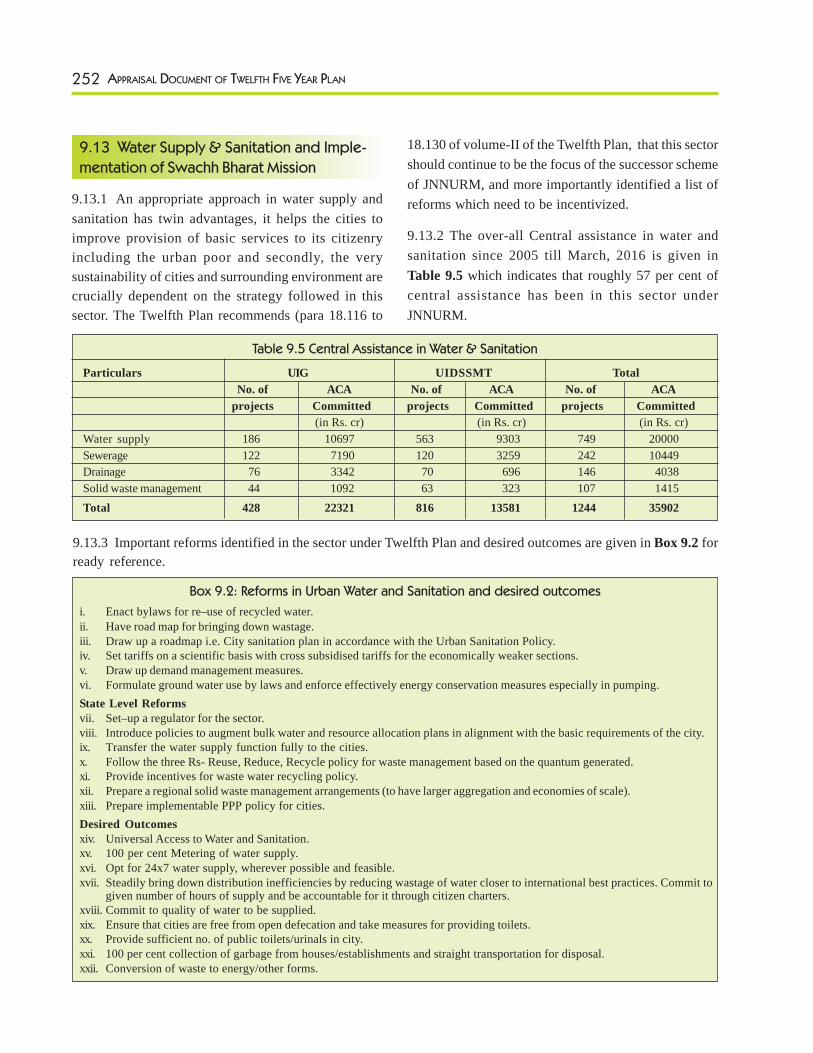
252 APPRAISAL DOCUMENT OF TWELFTH FIVE YEAR PLAN
9.13 Water Supply & Sanitation and Imple-
mentation of Swachh Bharat Mission
9.13.1 An appropriate approach in water supply andsanitation has twin advantages, it helps the cities toimprove provision of basic services to its citizenryincluding the urban poor and secondly, the verysustainability of cities and surrounding environment arecrucially dependent on the strategy followed in thissector. The Twelfth Plan recommends (para 18.116 to
18.130 of volume-II of the Twelfth Plan, that this sectorshould continue to be the focus of the successor schemeof JNNURM, and more importantly identified a list ofreforms which need to be incentivized.
9.13.2 The over-all Central assistance in water andsanitation since 2005 till March, 2016 is given inTable 9.5 which indicates that roughly 57 per cent ofcentral assistance has been in this sector underJNNURM.
Table 9.5 Central Assistance in Water & Sanitation
Particulars UIG UIDSSMT Total No. of ACA No. of ACA No. of ACA
projects Committed projects Committed projects Committed(in Rs. cr) (in Rs. cr) (in Rs. cr)
Water supply 186 10697 563 9303 749 20000Sewerage 122 7190 120 3259 242 10449Drainage 76 3342 70 696 146 4038Solid waste management 44 1092 63 323 107 1415Total 428 22321 816 13581 1244 35902
Box 9.2: Reforms in Urban Water and Sanitation and desired outcomes
i. Enact bylaws for re–use of recycled water.ii. Have road map for bringing down wastage.iii. Draw up a roadmap i.e. City sanitation plan in accordance with the Urban Sanitation Policy.iv. Set tariffs on a scientific basis with cross subsidised tariffs for the economically weaker sections.v. Draw up demand management measures.vi. Formulate ground water use by laws and enforce effectively energy conservation measures especially in pumping.State Level Reformsvii. Set–up a regulator for the sector.viii. Introduce policies to augment bulk water and resource allocation plans in alignment with the basic requirements of the city.ix. Transfer the water supply function fully to the cities.x. Follow the three Rs- Reuse, Reduce, Recycle policy for waste management based on the quantum generated.xi. Provide incentives for waste water recycling policy.xii. Prepare a regional solid waste management arrangements (to have larger aggregation and economies of scale).xiii. Prepare implementable PPP policy for cities. Desired Outcomesxiv. Universal Access to Water and Sanitation.xv. 100 per cent Metering of water supply.xvi. Opt for 24x7 water supply, wherever possible and feasible.xvii. Steadily bring down distribution inefficiencies by reducing wastage of water closer to international best practices. Commit to
given number of hours of supply and be accountable for it through citizen charters.xviii. Commit to quality of water to be supplied.xix. Ensure that cities are free from open defecation and take measures for providing toilets.xx. Provide sufficient no. of public toilets/urinals in city.xxi. 100 per cent collection of garbage from houses/establishments and straight transportation for disposal.xxii. Conversion of waste to energy/other forms.
9.13.3 Important reforms identified in the sector under Twelfth Plan and desired outcomes are given in Box 9.2 forready reference.
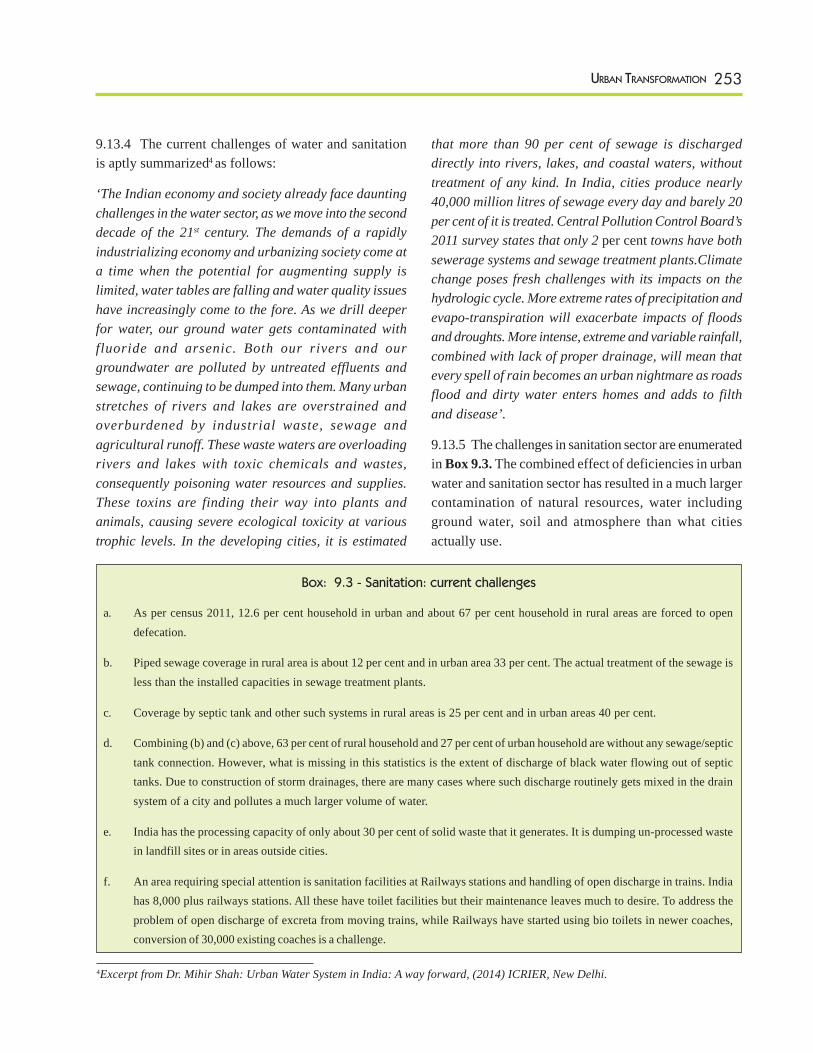
253URBAN TRANSFORMATION
9.13.4 The current challenges of water and sanitationis aptly summarized4 as follows:
‘The Indian economy and society already face dauntingchallenges in the water sector, as we move into the seconddecade of the 21st century. The demands of a rapidlyindustrializing economy and urbanizing society come ata time when the potential for augmenting supply islimited, water tables are falling and water quality issueshave increasingly come to the fore. As we drill deeperfor water, our ground water gets contaminated withfluoride and arsenic. Both our rivers and ourgroundwater are polluted by untreated effluents andsewage, continuing to be dumped into them. Many urbanstretches of rivers and lakes are overstrained andoverburdened by industrial waste, sewage andagricultural runoff. These waste waters are overloadingrivers and lakes with toxic chemicals and wastes,consequently poisoning water resources and supplies.These toxins are finding their way into plants andanimals, causing severe ecological toxicity at varioustrophic levels. In the developing cities, it is estimated
that more than 90 per cent of sewage is dischargeddirectly into rivers, lakes, and coastal waters, withouttreatment of any kind. In India, cities produce nearly40,000 million litres of sewage every day and barely 20per cent of it is treated. Central Pollution Control Board’s2011 survey states that only 2 per cent towns have bothsewerage systems and sewage treatment plants.Climatechange poses fresh challenges with its impacts on thehydrologic cycle. More extreme rates of precipitation andevapo-transpiration will exacerbate impacts of floodsand droughts. More intense, extreme and variable rainfall,combined with lack of proper drainage, will mean thatevery spell of rain becomes an urban nightmare as roadsflood and dirty water enters homes and adds to filthand disease’.
9.13.5 The challenges in sanitation sector are enumeratedin Box 9.3. The combined effect of deficiencies in urbanwater and sanitation sector has resulted in a much largercontamination of natural resources, water includingground water, soil and atmosphere than what citiesactually use.
4Excerpt from Dr. Mihir Shah: Urban Water System in India: A way forward, (2014) ICRIER, New Delhi.
Box: 9.3 - Sanitation: current challenges
a. As per census 2011, 12.6 per cent household in urban and about 67 per cent household in rural areas are forced to opendefecation.
b. Piped sewage coverage in rural area is about 12 per cent and in urban area 33 per cent. The actual treatment of the sewage isless than the installed capacities in sewage treatment plants.
c. Coverage by septic tank and other such systems in rural areas is 25 per cent and in urban areas 40 per cent.
d. Combining (b) and (c) above, 63 per cent of rural household and 27 per cent of urban household are without any sewage/septictank connection. However, what is missing in this statistics is the extent of discharge of black water flowing out of septictanks. Due to construction of storm drainages, there are many cases where such discharge routinely gets mixed in the drainsystem of a city and pollutes a much larger volume of water.
e. India has the processing capacity of only about 30 per cent of solid waste that it generates. It is dumping un-processed wastein landfill sites or in areas outside cities.
f. An area requiring special attention is sanitation facilities at Railways stations and handling of open discharge in trains. Indiahas 8,000 plus railways stations. All these have toilet facilities but their maintenance leaves much to desire. To address theproblem of open discharge of excreta from moving trains, while Railways have started using bio toilets in newer coaches,conversion of 30,000 existing coaches is a challenge.
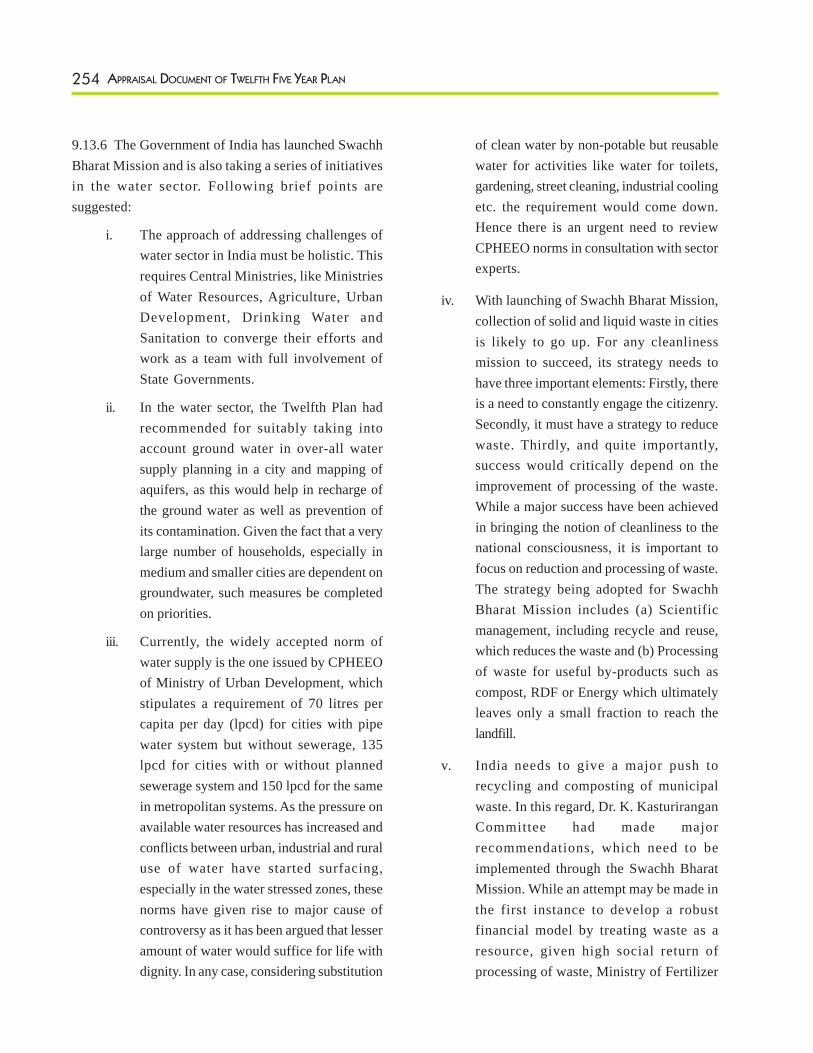
254 APPRAISAL DOCUMENT OF TWELFTH FIVE YEAR PLAN
9.13.6 The Government of India has launched SwachhBharat Mission and is also taking a series of initiativesin the water sector. Following brief points aresuggested:
i. The approach of addressing challenges ofwater sector in India must be holistic. Thisrequires Central Ministries, like Ministriesof Water Resources, Agriculture, UrbanDevelopment, Drinking Water andSanitation to converge their efforts andwork as a team with full involvement ofState Governments.
ii. In the water sector, the Twelfth Plan hadrecommended for suitably taking intoaccount ground water in over-all watersupply planning in a city and mapping ofaquifers, as this would help in recharge ofthe ground water as well as prevention ofits contamination. Given the fact that a verylarge number of households, especially inmedium and smaller cities are dependent ongroundwater, such measures be completedon priorities.
iii. Currently, the widely accepted norm ofwater supply is the one issued by CPHEEOof Ministry of Urban Development, whichstipulates a requirement of 70 litres percapita per day (lpcd) for cities with pipewater system but without sewerage, 135lpcd for cities with or without plannedsewerage system and 150 lpcd for the samein metropolitan systems. As the pressure onavailable water resources has increased andconflicts between urban, industrial and ruraluse of water have started surfacing,especially in the water stressed zones, thesenorms have given rise to major cause ofcontroversy as it has been argued that lesseramount of water would suffice for life withdignity. In any case, considering substitution
of clean water by non-potable but reusablewater for activities like water for toilets,gardening, street cleaning, industrial coolingetc. the requirement would come down.Hence there is an urgent need to reviewCPHEEO norms in consultation with sectorexperts.
iv. With launching of Swachh Bharat Mission,collection of solid and liquid waste in citiesis likely to go up. For any cleanlinessmission to succeed, its strategy needs tohave three important elements: Firstly, thereis a need to constantly engage the citizenry.Secondly, it must have a strategy to reducewaste. Thirdly, and quite importantly,success would critically depend on theimprovement of processing of the waste.While a major success have been achievedin bringing the notion of cleanliness to thenational consciousness, it is important tofocus on reduction and processing of waste.The strategy being adopted for SwachhBharat Mission includes (a) Scientificmanagement, including recycle and reuse,which reduces the waste and (b) Processingof waste for useful by-products such ascompost, RDF or Energy which ultimatelyleaves only a small fraction to reach thelandfill.
v. India needs to give a major push torecycling and composting of municipalwaste. In this regard, Dr. K. KasturiranganCommittee had made majorrecommendations, which need to beimplemented through the Swachh BharatMission. While an attempt may be made inthe first instance to develop a robustfinancial model by treating waste as aresource, given high social return ofprocessing of waste, Ministry of Fertilizer
255URBAN TRANSFORMATION
in consultation with MoUD is examiningthe desirability of subsidising thecompositing of municipal waste. Marketingof compost due to its low N-P-Kcomponent as compared to heavilysubsidised chemical fertilisers has remaineda challenge. The recommenda-tions madeby the aforesaid Committee are beingfollowed.
vi. Likewise, the approach in sewagetreatment has to be reviewed. Firstly, weneed to make decentralized sewagetreatment a preferred choice unless thereare important reasons for preferring thecentralized one. This would imply reviewof the manual issued by CPHEEO.Secondly, such technologies whichconsume less power should be exploredand applied and the popular demand forsubsidised power tariff for CityGovernments in the name of public purposeshould be rejected. Thirdly, Government ofIndia may immediately set up an expertCommittee to recommend per capitairreducible minimum water consumption.
vii. Discharge of septage to water bodies is aserious issue and deserves more attentionthan what it has received. StateGovernments may explore enactinglegislation to the effect that septic tanks needto be cleaned in two years’ time and failurewould invite penal action. Simultaneously, afee based service may be encouraged by theMunicipal bodies to undertake mechanical
cleaning of sewage when demanded by thehouseholds.
viii. Swachh Bharat Mission has laid specialemphasis on stopping open defecation. Whileprovision of community toilets in areashaving little space for construction of toiletsappears to be a preferred strategy, in realitythese have not worked well because lack oftheir ownership adversely affectsmaintenance. A preferred strategy therefore,is to incentivise a group of 2-3 householdsfor construction of shared toilet blocks andgreater reliance on provision of public toiletswith identified agencies and funds formaintenance.
9.14 Urban Mobility
9.14.1 Raising the share of public transport and Non-Motorised Transport (NMT) was one of the keyrecommendations of the National Urban Transport Policyas well as the Twelfth Plan. Besides improving the qualityof life due to reduced commute time and cleanerenvironment, affordable public transport is important forimproving the labour market outcomes in a city. Progressin this regard is broadly as follows:
i. Expansion of Metro Rail Projects
9.14.2 Urban rails are highly capital intensive. Hencethe Twelfth Plan recommended specific set of criteriafor opting for such projects should a city desire, thoughit also recommended that feasibility of other less capitaloptions must be considered. Status of metro projects isgiven in Table 9.6.
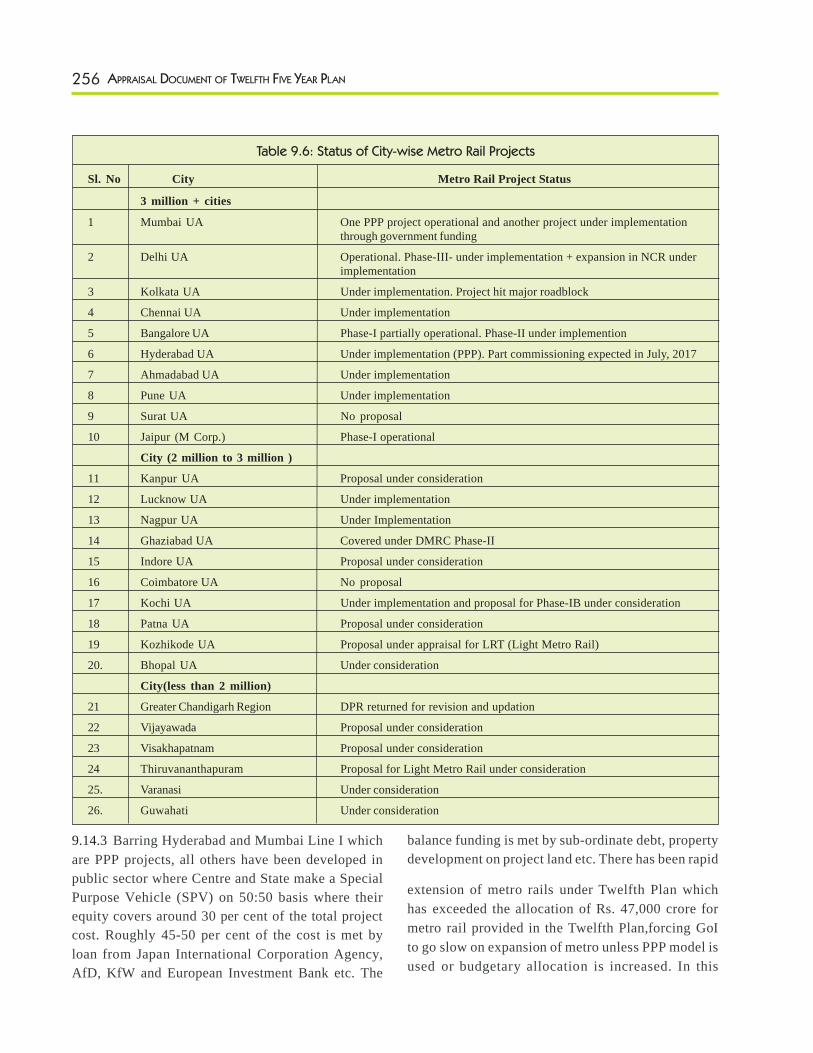
256 APPRAISAL DOCUMENT OF TWELFTH FIVE YEAR PLAN
9.14.3 Barring Hyderabad and Mumbai Line I whichare PPP projects, all others have been developed inpublic sector where Centre and State make a SpecialPurpose Vehicle (SPV) on 50:50 basis where theirequity covers around 30 per cent of the total projectcost. Roughly 45-50 per cent of the cost is met byloan from Japan International Corporation Agency,AfD, KfW and European Investment Bank etc. The
balance funding is met by sub-ordinate debt, propertydevelopment on project land etc. There has been rapid
extension of metro rails under Twelfth Plan whichhas exceeded the allocation of Rs. 47,000 crore formetro rail provided in the Twelfth Plan,forcing GoIto go slow on expansion of metro unless PPP model isused or budgetary allocation is increased. In this
Table 9.6: Status of City-wise Metro Rail Projects
Sl. No City Metro Rail Project Status
3 million + cities
1 Mumbai UA One PPP project operational and another project under implementationthrough government funding
2 Delhi UA Operational. Phase-III- under implementation + expansion in NCR underimplementation
3 Kolkata UA Under implementation. Project hit major roadblock
4 Chennai UA Under implementation
5 Bangalore UA Phase-I partially operational. Phase-II under implemention
6 Hyderabad UA Under implementation (PPP). Part commissioning expected in July, 2017
7 Ahmadabad UA Under implementation
8 Pune UA Under implementation
9 Surat UA No proposal
10 Jaipur (M Corp.) Phase-I operational
City (2 million to 3 million )
11 Kanpur UA Proposal under consideration
12 Lucknow UA Under implementation
13 Nagpur UA Under Implementation
14 Ghaziabad UA Covered under DMRC Phase-II
15 Indore UA Proposal under consideration
16 Coimbatore UA No proposal
17 Kochi UA Under implementation and proposal for Phase-IB under consideration
18 Patna UA Proposal under consideration
19 Kozhikode UA Proposal under appraisal for LRT (Light Metro Rail)
20. Bhopal UA Under consideration
City(less than 2 million)
21 Greater Chandigarh Region DPR returned for revision and updation
22 Vijayawada Proposal under consideration
23 Visakhapatnam Proposal under consideration
24 Thiruvananthapuram Proposal for Light Metro Rail under consideration
25. Varanasi Under consideration
26. Guwahati Under consideration
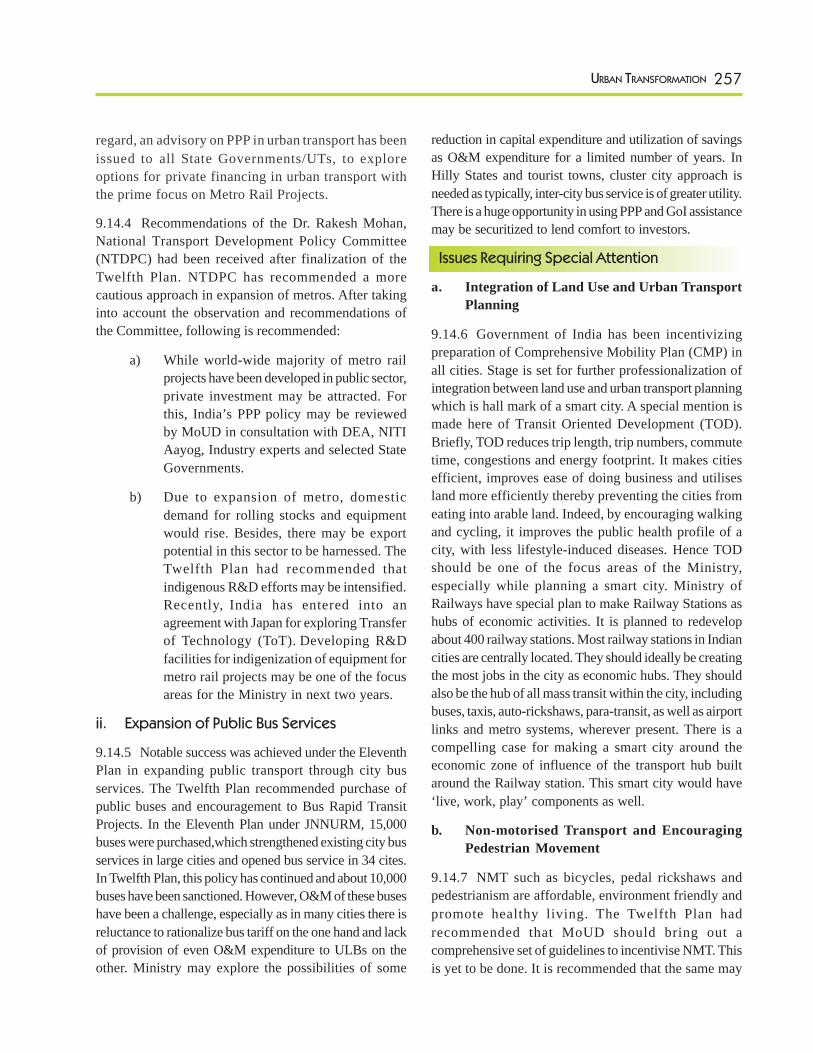
257URBAN TRANSFORMATION
regard, an advisory on PPP in urban transport has beenissued to all State Governments/UTs, to exploreoptions for private financing in urban transport withthe prime focus on Metro Rail Projects.
9.14.4 Recommendations of the Dr. Rakesh Mohan,National Transport Development Policy Committee(NTDPC) had been received after finalization of theTwelfth Plan. NTDPC has recommended a morecautious approach in expansion of metros. After takinginto account the observation and recommendations ofthe Committee, following is recommended:
a) While world-wide majority of metro railprojects have been developed in public sector,private investment may be attracted. Forthis, India’s PPP policy may be reviewedby MoUD in consultation with DEA, NITIAayog, Industry experts and selected StateGovernments.
b) Due to expansion of metro, domesticdemand for rolling stocks and equipmentwould rise. Besides, there may be exportpotential in this sector to be harnessed. TheTwelfth Plan had recommended thatindigenous R&D efforts may be intensified.Recently, India has entered into anagreement with Japan for exploring Transferof Technology (ToT). Developing R&Dfacilities for indigenization of equipment formetro rail projects may be one of the focusareas for the Ministry in next two years.
ii. Expansion of Public Bus Services
9.14.5 Notable success was achieved under the EleventhPlan in expanding public transport through city busservices. The Twelfth Plan recommended purchase ofpublic buses and encouragement to Bus Rapid TransitProjects. In the Eleventh Plan under JNNURM, 15,000buses were purchased,which strengthened existing city busservices in large cities and opened bus service in 34 cites.In Twelfth Plan, this policy has continued and about 10,000buses have been sanctioned. However, O&M of these buseshave been a challenge, especially as in many cities there isreluctance to rationalize bus tariff on the one hand and lackof provision of even O&M expenditure to ULBs on theother. Ministry may explore the possibilities of some
reduction in capital expenditure and utilization of savingsas O&M expenditure for a limited number of years. InHilly States and tourist towns, cluster city approach isneeded as typically, inter-city bus service is of greater utility.There is a huge opportunity in using PPP and GoI assistancemay be securitized to lend comfort to investors.
Issues Requiring Special Attention
a. Integration of Land Use and Urban TransportPlanning
9.14.6 Government of India has been incentivizingpreparation of Comprehensive Mobility Plan (CMP) inall cities. Stage is set for further professionalization ofintegration between land use and urban transport planningwhich is hall mark of a smart city. A special mention ismade here of Transit Oriented Development (TOD).Briefly, TOD reduces trip length, trip numbers, commutetime, congestions and energy footprint. It makes citiesefficient, improves ease of doing business and utilisesland more efficiently thereby preventing the cities fromeating into arable land. Indeed, by encouraging walkingand cycling, it improves the public health profile of acity, with less lifestyle-induced diseases. Hence TODshould be one of the focus areas of the Ministry,especially while planning a smart city. Ministry ofRailways have special plan to make Railway Stations ashubs of economic activities. It is planned to redevelopabout 400 railway stations. Most railway stations in Indiancities are centrally located. They should ideally be creatingthe most jobs in the city as economic hubs. They shouldalso be the hub of all mass transit within the city, includingbuses, taxis, auto-rickshaws, para-transit, as well as airportlinks and metro systems, wherever present. There is acompelling case for making a smart city around theeconomic zone of influence of the transport hub builtaround the Railway station. This smart city would have‘live, work, play’ components as well.
b. Non-motorised Transport and EncouragingPedestrian Movement
9.14.7 NMT such as bicycles, pedal rickshaws andpedestrianism are affordable, environment friendly andpromote healthy living. The Twelfth Plan hadrecommended that MoUD should bring out acomprehensive set of guidelines to incentivise NMT. Thisis yet to be done. It is recommended that the same may

258 APPRAISAL DOCUMENT OF TWELFTH FIVE YEAR PLAN
be given due attention. Similarly, innovations in improvingdesigns of NMT like pedal rickshaw should be suitablyincentivised as this mode of transport is employmentintensive and helps in connecting dots in the last mileconnectivity besides being environmentally a preferredsolution.
9.14.8 Urban Transport is intertwined with UrbanDevelopment which is a State subject. Therefore, urbantransport projects, including pedestrianisation, are proposedand implemented by State Governments. Ministry of UrbanDevelopment had issued National Urban Transport Policyin year 2006, under which the Central Government givespriority to the construction of pedestrian paths & dedicatedcycle tracks in the cities to enhance safety and use ofnon-motorised modes. The Central Government alsosupports formulation and implementation of specific “AreaPlans” in congested urban areas that propose appropriatemix of various modes of transport including exclusivezones for non-motorized transit. Further, Ministry ofUrban Development has issued an Advisory to all StateGovernments regarding inclusion of feeder buses, publicbike sharing and pedestrianisation in the influence zoneas an integral portion of the DPRs for Mass Rapid TransitSystem projects.
iii. Multi Modal integration
9.14.9 At present, even in large cities, India has to go along way in ensuring seamless travel through multi-modalintegration. While this again highlights need for spatialand physical planning and integration of land use andtransport planning, as mentioned in para 9.14.6 above,it is recommended that Ministry of Urban Developmentmay create a Task Force to suggest measures toencourage multi-modal integration in Urban transport.
iv. Follow up of Recommendations of NTDPC
9.14.10 Since NTDPC has made a series ofrecommendations regarding urban transport, it issuggested that to operationalize them, a Task Force maybe constituted in the Ministry of Urban Development.
9.15 Urban Poverty
9.15.1 Creation of jobs in urban sector is central toIndia’s development agenda and is covered under the
Chapter on Employment. However, some specificobservations and recommendations are made which mayhelp in fine tuning the strategy:
a) The Twelfth Plan had fixed an ambitioustarget for reducing consumption poverty viaincome growth, employment expansion,higher level of investment in health, educationwater, slum rehabilitation and directly targetedpoverty reduction programme. While India’surban sector contribution to GDP hasincreased from 41 per cent during 1980-81to 52 per cent during 2004-05 and is currentlyestimated to be about 60 per cent, the rate ofpoverty reduction in urban India has beenslower than that of rural poverty: Urbanpoverty ratio has declined from 31.8 per centin 1993-94 to 25.7 per cent in 2004-5 andfurther to 13.7 per cent in 2011-12. In thisperiod rural poverty ratio declined from 50.1per cent to 25.7 per cent.
b) Gini coefficient of urban income hasworsened5 in three comparable economiesbetween 1994 to 2008. In China, the Ginicoefficient in urban areas rose from 0.292 in1994 to 0.348 in 2005 and 0.352 in 2008. InIndonesia, the corresponding figures are0.353; 0.399 and 0.422. In urban India theGini Coefficient has risen from 0.343 in 1994to 0.376 in 2004 to 0.393 in 2009. Thesefigures fuel the apprehension that unlessspecific policy measures are taken, an increasein income may lead to higher inequality.
c) As indicated in the introductory section, whileactual number of people entering into urbansector is high in absolute number due to largepopulation base of India, the rate ofurbanisation is yet to pick up. Besides, manyurban agglomerations are showing a reducedrate of growth in terms of population. Whilethese issues are matter of further research,prima facie they imply that gains ofagglomeration are either getting withered awaydue to congestion or the cities regulatory
5Mathur O.P. - Urban Poverty in Asia, published by the Asian Development Bank (2014)
259URBAN TRANSFORMATION
framework are exclusionary in their stance,which needs immediate correction.
d) There is evidence that some jobs are beingcreated in the non-farm sector in rural areas
underlining the need for policy attention inrurbanisation in India. The Table 9.7 below,based on analysis shared by Centre forPolicy Research indicates following:
Table 9.7: Non-Farm Job Creation in Villages
State Total Villages Villages with +ve Villages with +veNon-Farm and -ve Farm Non-Farm and -ve Farm
(per cent)
Jammu & Kashmir 6,272 4,550 72.50Himachal Pradesh 17,621 10,115 57.40Punjab 12,076 6,962 57.70Chandigarh 5 4 80.00Uttarakhand 15,521 7,161 46.10Haryana 6,594 3,667 55.60Delhi 99 67 67.70Rajasthan 42,917 23,290 54.30Uttar Pradesh 96,647 55,477 57.40Bihar 38,535 21,985 57.10Sikkim 423 290 68.60Arunachal Pradesh 5128 2559 49.90Nagaland 1381 690 50.00Manipur 2314 1023 44.20Mizoram 687 391 56.90Tripura 848 527 62.10Meghalaya 6381 3206 50.20Assam 24,020 11,161 46.50West Bengal 37,247 17,593 47.20Jharkhand 29,002 17,232 59.40Orissa 47,080 24,190 51.40Chhattisgarh 19,496 9,208 47.20Madhya Pradesh 51,484 22,726 44.10Gujarat 17,793 6,554 36.80Daman & Diu 19 16 84.20Dadra & Nagar Haveli 65 47 72.30Maharashtra 40,685 15,119 37.20Andhra Pradesh 26,125 11,396 43.60Karnataka 27,110 13,871 51.20Goa 319 159 49.80Lakshadweep 5 0 0.00Kerala 1,017 760 74.70Tamil Nadu 14,897 10,140 68.10Puducherry 90 70 77.80A&N Islands 378 154 40.70TOTAL 5,90,281 3,02,360 51.22
Source: Pranav Sidhwani, database; ‘Farm to Non-Farm: Are India’s Villages “Rurbanising”? CPR Urban Working Paper 4,November, 2014’.
260 APPRAISAL DOCUMENT OF TWELFTH FIVE YEAR PLAN
e) Evidence of creation of non-farm sector jobis also available from Census figure whichreports that there is an unprecedenteddecline in the absolute number of cultivatorsfrom 127.3 million in 2001 to 118.7 millionin 2011 (as noted in the Economic surveyof 2013-14).
f) Even though the Table 9.7 indicate positivechanges in proportion of non-farm workersin more than half of villages in India, thefact remains that such trend may not bestrong enough to eliminate poverty in Indiaby creating sufficient jobs.
g) Of particular significance is informal sectorin urban India. A study by ParticipatoryResearch in Asia (PRIA) and IndicusAnalytics in November, 2013 estimatedcontribution of this segment in city economyto be 7.53 per cent and also noted that GDPmultiplier of an informal sector dweller is1.4. This clearly indicates that far frombeing a burden on city economy, theinformal sector has an important role to playand every attempt may be made to improvetheir productivity and reduce their cost ofliving through ensuring access to basic urbanamenities.
h) In the Union Budget 2015-16, Governmenthas announced many measures forimproving impact of skill initiatives andpromote entrepreneurship among the youth,besides strengthening their social security.After ensuring full financial inclusionthrough Jan Dhan Yojana, new initiativesannounced in the budget include setting upof Micro Units Development Refinance
Agency (MUDRA) Bank for refinancingmicro-finance institution; Self Employmentand Talent Utilization mechanism (SETU) forgiving e-support to entrepreneurs and self-employed youth who wish to take upmanufacturing and selling of product basedon new technology; Atal Innovation Missionfor providing a platform of researchers,academicians, entrepreneurs, to foster aculture of innovation, research anddevelopment.
e) For fully realising potential of theseinitiatives, it is expected that newly createdMinistry of Skill Development andEntrepreneurship would bring synergyto the efforts of various Ministries in skillformation.
j) There is a need for convergence betweenNational Rurban Mission, the Urban andRural Livelihood Missions and Skill Mission.A major task is dissemination of informationregarding these initiatives to target groups.Formation of Self Help Group in urbansetting and provision of vouchers for skilldevelopment may be explored to takeadvantage of firstly, a large number ofprivate players and secondly, the aspirationin youth in India. Analyzing the census dataon education status of rural urban malemigrants, analysis by CPR (Table 9.8)indicates that the data is consistent withevidence that while the recent migrants maynot be too well skilled but they pick up skillswith length of stay. Furthermore, NSS dataindicates (Table 9.9) that seasonal migrantsare especially poorly educated.
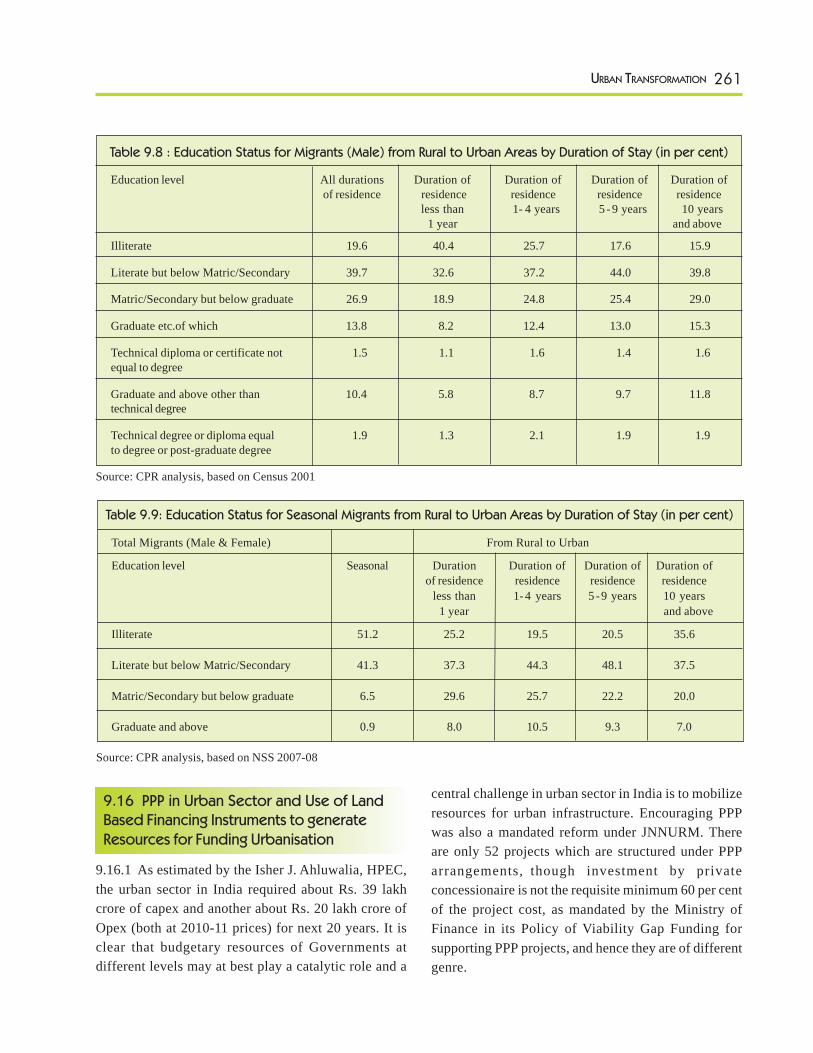
261URBAN TRANSFORMATION
9.16 PPP in Urban Sector and Use of LandBased Financing Instruments to generateResources for Funding Urbanisation
9.16.1 As estimated by the Isher J. Ahluwalia, HPEC,the urban sector in India required about Rs. 39 lakhcrore of capex and another about Rs. 20 lakh crore ofOpex (both at 2010-11 prices) for next 20 years. It isclear that budgetary resources of Governments atdifferent levels may at best play a catalytic role and a
Table 9.8 : Education Status for Migrants (Male) from Rural to Urban Areas by Duration of Stay (in per cent)
Education level All durations Duration of Duration of Duration of Duration ofof residence residence residence residence residence
less than 1- 4 years 5 - 9 years 10 years1 year and above
Illiterate 19.6 40.4 25.7 17.6 15.9
Literate but below Matric/Secondary 39.7 32.6 37.2 44.0 39.8
Matric/Secondary but below graduate 26.9 18.9 24.8 25.4 29.0
Graduate etc.of which 13.8 8.2 12.4 13.0 15.3
Technical diploma or certificate not 1.5 1.1 1.6 1.4 1.6equal to degree
Graduate and above other than 10.4 5.8 8.7 9.7 11.8technical degree
Technical degree or diploma equal 1.9 1.3 2.1 1.9 1.9to degree or post-graduate degree
Source: CPR analysis, based on Census 2001
Table 9.9: Education Status for Seasonal Migrants from Rural to Urban Areas by Duration of Stay (in per cent)
Total Migrants (Male & Female) From Rural to Urban
Education level Seasonal Duration Duration of Duration of Duration ofof residence residence residence residence
less than 1-4 years 5 -9 years 10 years1 year and above
Illiterate 51.2 25.2 19.5 20.5 35.6
Literate but below Matric/Secondary 41.3 37.3 44.3 48.1 37.5
Matric/Secondary but below graduate 6.5 29.6 25.7 22.2 20.0
Graduate and above 0.9 8.0 10.5 9.3 7.0
Source: CPR analysis, based on NSS 2007-08
central challenge in urban sector in India is to mobilizeresources for urban infrastructure. Encouraging PPPwas also a mandated reform under JNNURM. Thereare only 52 projects which are structured under PPParrangements, though investment by privateconcessionaire is not the requisite minimum 60 per centof the project cost, as mandated by the Ministry ofFinance in its Policy of Viability Gap Funding forsupporting PPP projects, and hence they are of differentgenre.
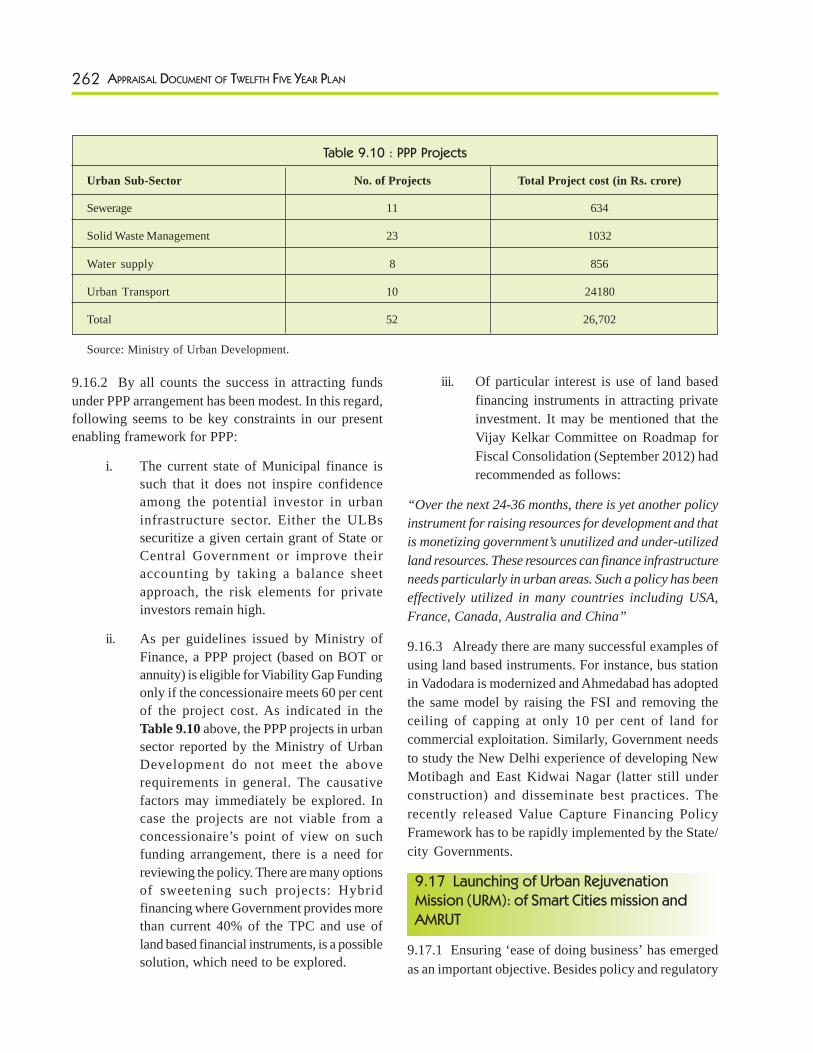
262 APPRAISAL DOCUMENT OF TWELFTH FIVE YEAR PLAN
9.16.2 By all counts the success in attracting fundsunder PPP arrangement has been modest. In this regard,following seems to be key constraints in our presentenabling framework for PPP:
i. The current state of Municipal finance issuch that it does not inspire confidenceamong the potential investor in urbaninfrastructure sector. Either the ULBssecuritize a given certain grant of State orCentral Government or improve theiraccounting by taking a balance sheetapproach, the risk elements for privateinvestors remain high.
ii. As per guidelines issued by Ministry ofFinance, a PPP project (based on BOT orannuity) is eligible for Viability Gap Fundingonly if the concessionaire meets 60 per centof the project cost. As indicated in theTable 9.10 above, the PPP projects in urbansector reported by the Ministry of UrbanDevelopment do not meet the aboverequirements in general. The causativefactors may immediately be explored. Incase the projects are not viable from aconcessionaire’s point of view on suchfunding arrangement, there is a need forreviewing the policy. There are many optionsof sweetening such projects: Hybridfinancing where Government provides morethan current 40% of the TPC and use ofland based financial instruments, is a possiblesolution, which need to be explored.
Table 9.10 : PPP Projects
Urban Sub-Sector No. of Projects Total Project cost (in Rs. crore)
Sewerage 11 634
Solid Waste Management 23 1032
Water supply 8 856
Urban Transport 10 24180
Total 52 26,702
Source: Ministry of Urban Development.
iii. Of particular interest is use of land basedfinancing instruments in attracting privateinvestment. It may be mentioned that theVijay Kelkar Committee on Roadmap forFiscal Consolidation (September 2012) hadrecommended as follows:
“Over the next 24-36 months, there is yet another policyinstrument for raising resources for development and thatis monetizing government’s unutilized and under-utilizedland resources. These resources can finance infrastructureneeds particularly in urban areas. Such a policy has beeneffectively utilized in many countries including USA,France, Canada, Australia and China”
9.16.3 Already there are many successful examples ofusing land based instruments. For instance, bus stationin Vadodara is modernized and Ahmedabad has adoptedthe same model by raising the FSI and removing theceiling of capping at only 10 per cent of land forcommercial exploitation. Similarly, Government needsto study the New Delhi experience of developing NewMotibagh and East Kidwai Nagar (latter still underconstruction) and disseminate best practices. Therecently released Value Capture Financing PolicyFramework has to be rapidly implemented by the State/city Governments.
9.17 Launching of Urban RejuvenationMission (URM): of Smart Cities mission andAMRUT
9.17.1 Ensuring ‘ease of doing business’ has emergedas an important objective. Besides policy and regulatory
263URBAN TRANSFORMATION
stance, ease of doing business is also determined bystate of infrastructure including uninterrupted power,urban connectivity, broadband connectivity and watersupply & sanitation.The Twelfth Plan had endorsed theGujarat Town Planning Scheme for Land Re-adjustmentand has also referred to participative methods beingfollowed in Mumbai (C - ward). Another example maybe citizens’ initiative at Bhendi Bazar clusterredevelopment in Mumbai.
9.17.2 On June 25, 2015, Government of India haslaunched the Smart Cities Mission with the scheme ofHousing for All and Atal Mission for Rejuvenation andUrban Transformation (AMRUT) complementing it. Theunderlying approach is to move towards holisticdevelopment of cities based on integrated planning. TheGovernment expects to invest Rs. 1 lakh crore over 5years under Smart City Mission and AMRUT. Besidesthese, earlier in January 2015, Government launchedthe National Heritage City Development andAugmentation Yojana (HRIDAY) which aims at preserving and revitalizing the soul and uniquecharacteristics of heritage cities in India. 12 heritagecities have been identified and full funding of Rs. 500crore is being provided by the Government for theirdevelopment. The detailed guidelines of all these schemeshave been placed in public domain.
9.17.3 The Smart cities component provides for fourdifferent modes of projects: retrofitting of smartapplications in existing part of city; redevelopment of apart of city by replacing dysfunctional infrastructure;greenfield projects and pan city improvement by applyingsmart solution to city wide infrastructure. Key city-wide infrastructure is upgraded by converging with itscomplementary missions and converging with newschemes of Centre/State. AMRUT has identified watersupply, sewerage and septage management, storm waterdrainage, pedestrian and non-motorized as well as otherpublic transport facilities and creation and up-gradationof green spaces, especially for children. The AMRUThas incorporated some important learnings ofimplementing JNNURM: a great deal of flexibility hasbeen worked into design of these schemes, for instance.In all the components of AMRUT, a major improvement
has been an empowerment of States and ULBs, as theformer have been entrusted with to prepare State AnnualPlan and approve projects. This is likely to address amajor problem under JNNURM and related programmeslike Rajiv Awaas Yojana, etc., which had receivedcriticism of being process heavy.
9.17.4 Urban Development is a State subject, whereasprovision of Central Assistance is to ensure a high levelof investment in city infrastructures. Another objectiveof the Government of India has been to incentivise urbanreforms: a process that was initiated under JNNURMand now the stage is set for incentivizing secondgeneration reforms. Under AMRUT, release of 10 percent Central Assistance is linked to getting threshold scorein achieving reforms. Under Schemes like Housing forAll and Smart Cities Mission, reforms are, in a way,internalized in the scheme design as implementation ofalternative models of Smart cities or in-situ rehabilitationof slum, by using land as a resource, are possible onlywhen some of the important reforms, are carried out.However, to bring a paradigm shift in the way Indiancities are managed, there is a need to review the existingreform basket to include many other reforms and whilemaking all of them mandatory, provide a requisiteflexibility to States and cities to implement these reforms.
9.17.5 Under the Smart Cities Mission for developing100 Smart Cities launched in June, 2015, 60 cities (20cities in Round 1 in January 2016, 3 cities in fast trackround in May 2016 and 27 cities in Round 2 inSeptember, 2016) have been selected. Out of which, 55cities have created Special Purpose Vehicles (SPVs).Remaining five cities namely New Town Kolkata,Mangalore, Kohima, Huballi- Dharwad and Vadodara arein the process of incorporation. During 2015-16, Rs.1469.38 crore was released against allocation of Rs.1496.20 crore during the year. During FY 2016-17, Rs.3205 crore was allocated as BE which has been enhancedto Rs. 4655.99 crore at RE stage. Out of which, Rs.4493.36 Cr. (96.51%) has been released to States/UTs.
9.17.6 Under the AMRUT, in FY 2015-16, State AnnualAction Plans (SAAPs) of all 29 States and 7 UnionTerritories amounting to Rs. 20,774 crore (includingcentral share amounting of Rs. 9894 crore) have been
264 APPRAISAL DOCUMENT OF TWELFTH FIVE YEAR PLAN
approved by the Apex Committee. Further, the firstinstalment of the Central share amounting to Rs. 1948crore has been released to the States in FY 2015-16.Also, in the financial year 2016-17, second SAAPs ofall States and UTs (pertaining to 2016-17) amounting toRs. 25183 crores (including central share of Rs. 13334crores) have been approved and first instalment of Rs.2370 crore released. The States are also submitting theirthird and final SAAPs to cover the balance Mission periodallocation under the Mission and the Plans are beingconsidered and approved.
9.17.7 Under the HRIDAY, in FY 2015-16 HRIDAYCity Plans (HCP) of all the 12 cities Viz.,Varanasi,Amritsar, Warangal, Ajmer, Gaya, Mathura,Kanchipuram, Vellankini, Amaravati, Badami, Dwarakaand Puri have been approved by the HRIDAY NationalEmpowered Committee (HNEC). Further, 17 DetailedProject Reports (DPRs) formulated by the cities havealso been approved by the HNEC. Funds of Rs. 27.92crore have been released in FY 2015-16 to the HRIDAYcities. In FY 2016-17, it is targeted to approve 76 DPRsfrom the HRIDAY cities and complete execution of all
projects. Budget allocation in BE 2016-17 for HRIDAYis Rs.200 crore.
9.18 Learnings from Appraisal
9.18.1 As the URM has been launched recently, noappraisal of underlying strategy is attempted here.However, for implementation of these schemes,following is recommended:
A). As smart cities promote integrated projects, thechallenge of creating DPRs/RFPs for suchintegrated projects will require capacityaugmentation in the form of PMCs andprofessionalto man SPVs.
B) In order to make the complete city smart, the areabased development will have to be replicated tothe entire only.
C) Smart cities have to leverage up to 2.5 times thegrant given by the Centre and State. They willrequire augmentation of own generated resourcesand use of new financial tools such as bonds, ValueCapture Financing etc.
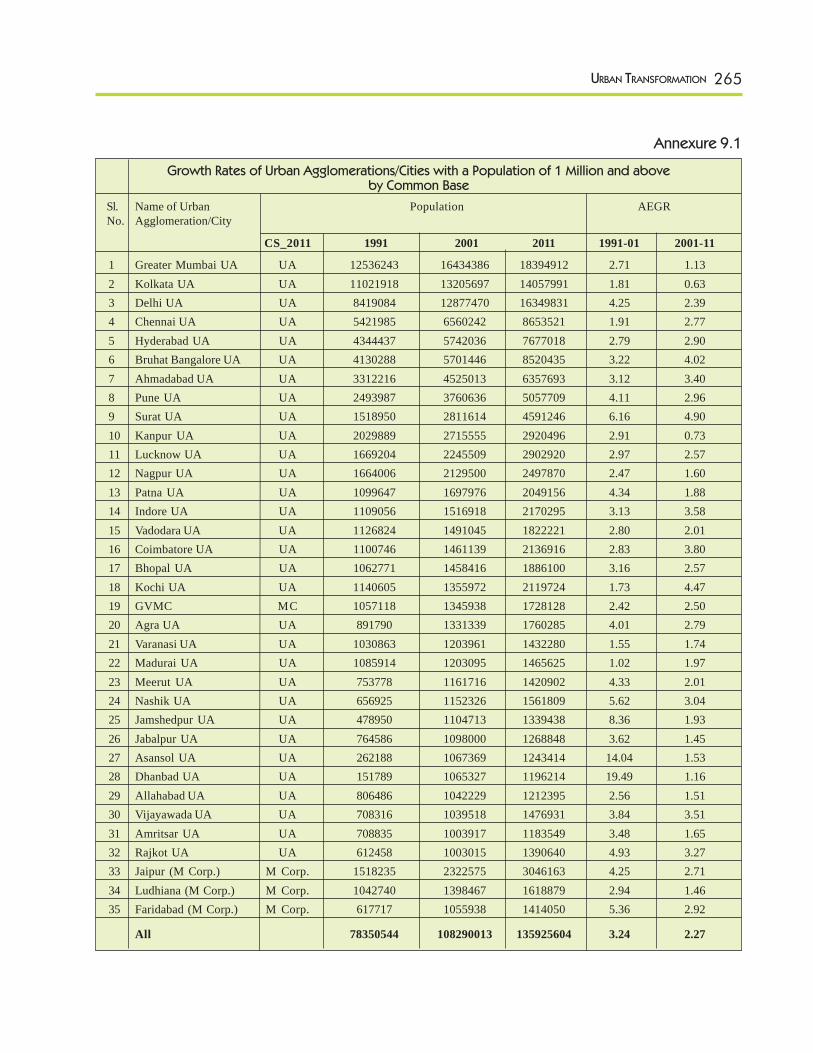
265URBAN TRANSFORMATION
Annexure 9.1
Growth Rates of Urban Agglomerations/Cities with a Population of 1 Million and aboveby Common Base
Sl. Name of Urban Population AEGRNo. Agglomeration/City
CS_2011 1991 2001 2011 1991-01 2001-11
1 Greater Mumbai UA UA 12536243 16434386 18394912 2.71 1.132 Kolkata UA UA 11021918 13205697 14057991 1.81 0.633 Delhi UA UA 8419084 12877470 16349831 4.25 2.394 Chennai UA UA 5421985 6560242 8653521 1.91 2.775 Hyderabad UA UA 4344437 5742036 7677018 2.79 2.906 Bruhat Bangalore UA UA 4130288 5701446 8520435 3.22 4.027 Ahmadabad UA UA 3312216 4525013 6357693 3.12 3.408 Pune UA UA 2493987 3760636 5057709 4.11 2.969 Surat UA UA 1518950 2811614 4591246 6.16 4.9010 Kanpur UA UA 2029889 2715555 2920496 2.91 0.7311 Lucknow UA UA 1669204 2245509 2902920 2.97 2.5712 Nagpur UA UA 1664006 2129500 2497870 2.47 1.6013 Patna UA UA 1099647 1697976 2049156 4.34 1.8814 Indore UA UA 1109056 1516918 2170295 3.13 3.5815 Vadodara UA UA 1126824 1491045 1822221 2.80 2.0116 Coimbatore UA UA 1100746 1461139 2136916 2.83 3.8017 Bhopal UA UA 1062771 1458416 1886100 3.16 2.5718 Kochi UA UA 1140605 1355972 2119724 1.73 4.4719 GVMC MC 1057118 1345938 1728128 2.42 2.5020 Agra UA UA 891790 1331339 1760285 4.01 2.7921 Varanasi UA UA 1030863 1203961 1432280 1.55 1.7422 Madurai UA UA 1085914 1203095 1465625 1.02 1.9723 Meerut UA UA 753778 1161716 1420902 4.33 2.0124 Nashik UA UA 656925 1152326 1561809 5.62 3.0425 Jamshedpur UA UA 478950 1104713 1339438 8.36 1.9326 Jabalpur UA UA 764586 1098000 1268848 3.62 1.4527 Asansol UA UA 262188 1067369 1243414 14.04 1.5328 Dhanbad UA UA 151789 1065327 1196214 19.49 1.1629 Allahabad UA UA 806486 1042229 1212395 2.56 1.5130 Vijayawada UA UA 708316 1039518 1476931 3.84 3.5131 Amritsar UA UA 708835 1003917 1183549 3.48 1.6532 Rajkot UA UA 612458 1003015 1390640 4.93 3.2733 Jaipur (M Corp.) M Corp. 1518235 2322575 3046163 4.25 2.7134 Ludhiana (M Corp.) M Corp. 1042740 1398467 1618879 2.94 1.4635 Faridabad (M Corp.) M Corp. 617717 1055938 1414050 5.36 2.92
All 78350544 108290013 135925604 3.24 2.27
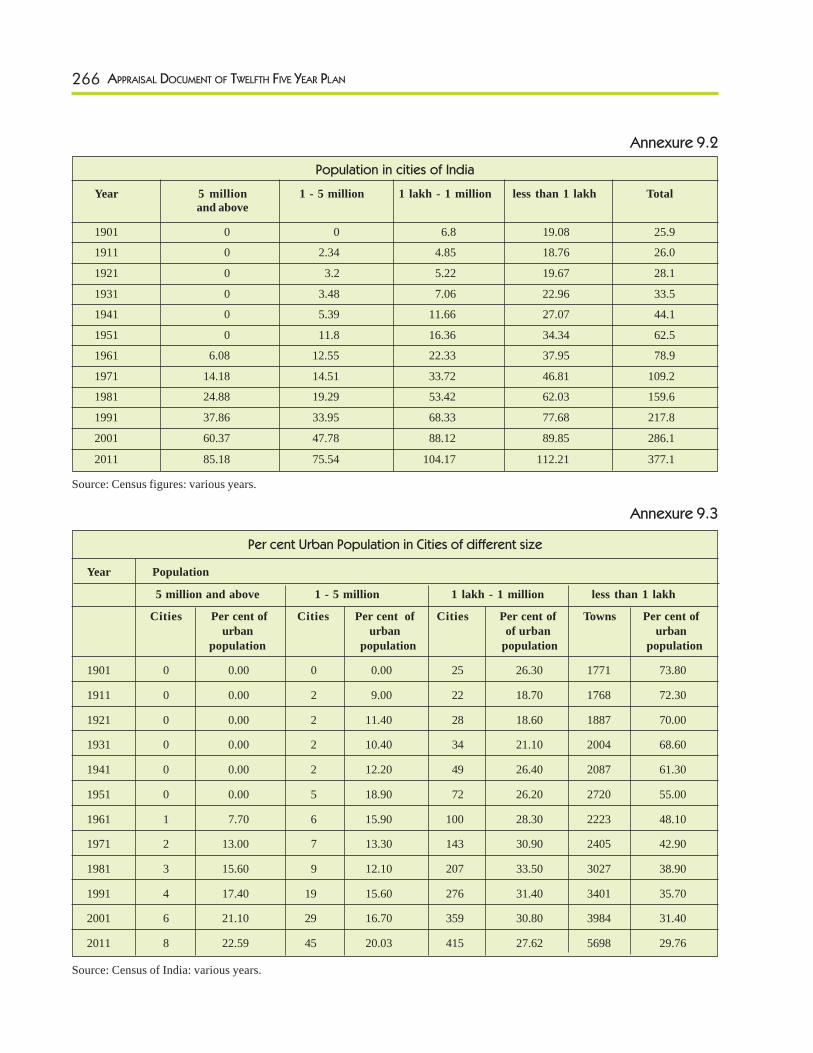
266 APPRAISAL DOCUMENT OF TWELFTH FIVE YEAR PLAN
Annexure 9.2
Population in cities of India
Year 5 million 1 - 5 million 1 lakh - 1 million less than 1 lakh Totaland above
1901 0 0 6.8 19.08 25.9
1911 0 2.34 4.85 18.76 26.0
1921 0 3.2 5.22 19.67 28.1
1931 0 3.48 7.06 22.96 33.5
1941 0 5.39 11.66 27.07 44.1
1951 0 11.8 16.36 34.34 62.5
1961 6.08 12.55 22.33 37.95 78.9
1971 14.18 14.51 33.72 46.81 109.2
1981 24.88 19.29 53.42 62.03 159.6
1991 37.86 33.95 68.33 77.68 217.8
2001 60.37 47.78 88.12 89.85 286.1
2011 85.18 75.54 104.17 112.21 377.1
Source: Census figures: various years.
Annexure 9.3
Per cent Urban Population in Cities of different size
Year Population
5 million and above 1 - 5 million 1 lakh - 1 million less than 1 lakh
Cities Per cent of Cities Per cent of Cities Per cent of Towns Per cent ofurban urban of urban urban
population population population population
1901 0 0.00 0 0.00 25 26.30 1771 73.80
1911 0 0.00 2 9.00 22 18.70 1768 72.30
1921 0 0.00 2 11.40 28 18.60 1887 70.00
1931 0 0.00 2 10.40 34 21.10 2004 68.60
1941 0 0.00 2 12.20 49 26.40 2087 61.30
1951 0 0.00 5 18.90 72 26.20 2720 55.00
1961 1 7.70 6 15.90 100 28.30 2223 48.10
1971 2 13.00 7 13.30 143 30.90 2405 42.90
1981 3 15.60 9 12.10 207 33.50 3027 38.90
1991 4 17.40 19 15.60 276 31.40 3401 35.70
2001 6 21.10 29 16.70 359 30.80 3984 31.40
2011 8 22.59 45 20.03 415 27.62 5698 29.76
Source: Census of India: various years.
Related Documents


