Page 1 AppMetrics for Transactions – SCOM Management Pack Users Guide Introduction SCOM Overview System Center Operations Manager enables data center operations personnel to monitor state, performance, and health information across multiple platforms in an enterprise environment. By importing SCOM management packs from Microsoft or other vendors, SCOM can be configured to monitor a wide variety of configurations and aspects of an IT center’s daily operations and workloads. AppMetrics Management Pack The AppMetrics management pack allows data center staff to monitor the health and availability of their COM+ applications. By configuring the available threshold settings in AppMetrics, various performance thresholds can be monitored though SCOM, alerting staff to problems as soon as they occur. Features The following features are incorporated into the AppMetrics management pack: COM+ application performance monitoring AppMetrics status monitoring Auto discovery of AppMetrics managers, agents, and production monitors Configurable discovery interval, and the ability to enable or disable various monitors and alerts globally or individually Product knowledge which informs the user of the purpose of the monitor or alert, and provides resolution info when applicable Installation Importing the AppMetrics Management Pack The AppMetrics Management pack is imported into SCOM as follows: 1. Navigate to the SCOM Administration console, and select the Management Packs view.

Welcome message from author
This document is posted to help you gain knowledge. Please leave a comment to let me know what you think about it! Share it to your friends and learn new things together.
Transcript
Page 1
AppMetrics for Transactions – SCOM Management Pack Users Guide
Introduction
SCOM Overview
System Center Operations Manager enables data center operations personnel to monitor state,
performance, and health information across multiple platforms in an enterprise environment.
By importing SCOM management packs from Microsoft or other vendors, SCOM can be configured to
monitor a wide variety of configurations and aspects of an IT center’s daily operations and workloads.
AppMetrics Management Pack
The AppMetrics management pack allows data center staff to monitor the health and availability of their
COM+ applications. By configuring the available threshold settings in AppMetrics, various performance
thresholds can be monitored though SCOM, alerting staff to problems as soon as they occur.
Features
The following features are incorporated into the AppMetrics management pack:
COM+ application performance monitoring
AppMetrics status monitoring
Auto discovery of AppMetrics managers, agents, and production monitors
Configurable discovery interval, and the ability to enable or disable various monitors and alerts
globally or individually
Product knowledge which informs the user of the purpose of the monitor or alert, and provides
resolution info when applicable
Installation
Importing the AppMetrics Management Pack
The AppMetrics Management pack is imported into SCOM as follows:
1. Navigate to the SCOM Administration console, and select the Management Packs view.

AppMetrics for Transactions – SCOM Management Pack Users Guide
April 20, 2010
Page 2
Figure 1 - Management Packs View
2. Right click on the Management Packs item, and select Import Management Packs from the
menu.
Figure 2 - Import Management Packs
3. The Import Management Packs dialog will now appear.
AppMetrics for Transactions – SCOM Management Pack Users Guide
April 20, 2010
Page 3
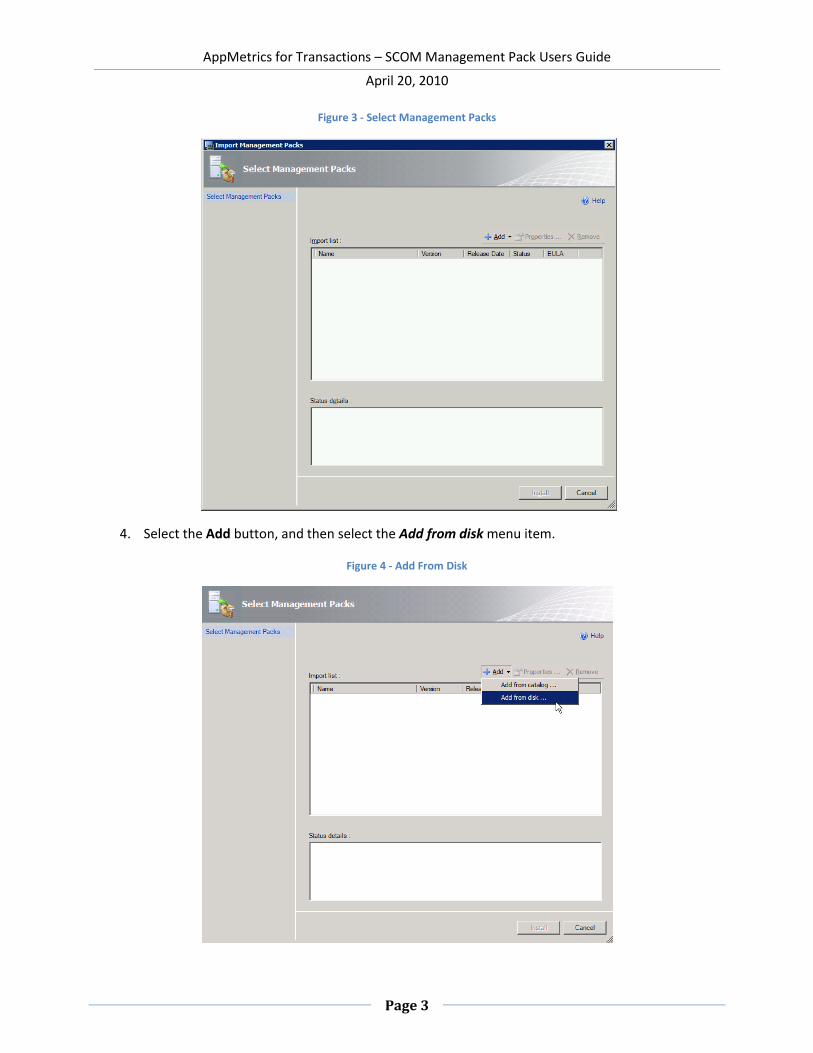
Figure 3 - Select Management Packs
4. Select the Add button, and then select the Add from disk menu item.
Figure 4 - Add From Disk
AppMetrics for Transactions – SCOM Management Pack Users Guide
April 20, 2010
Page 4
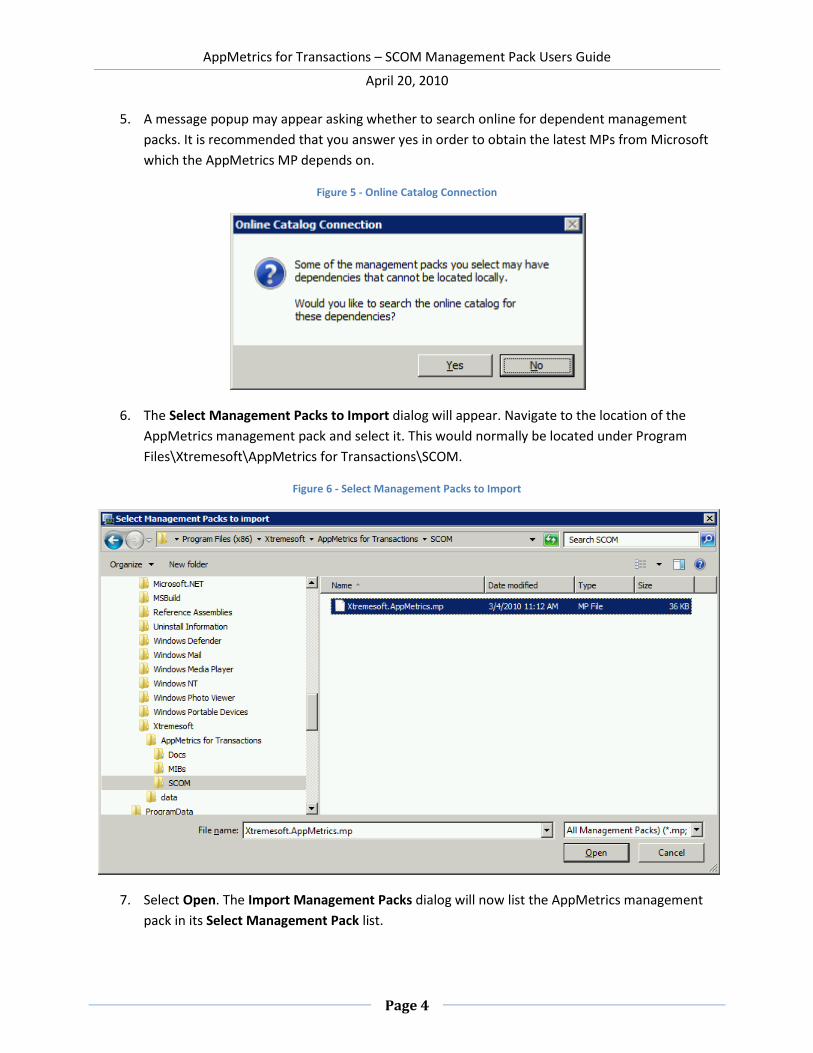
5. A message popup may appear asking whether to search online for dependent management
packs. It is recommended that you answer yes in order to obtain the latest MPs from Microsoft
which the AppMetrics MP depends on.
Figure 5 - Online Catalog Connection
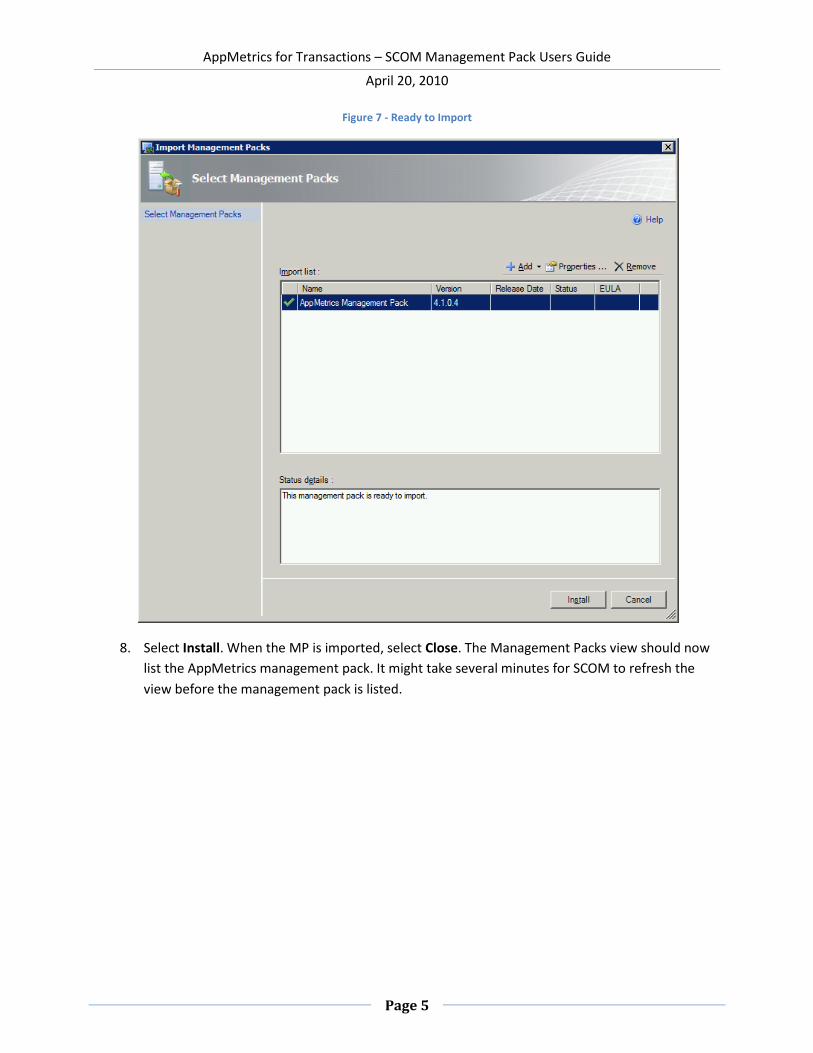
6. The Select Management Packs to Import dialog will appear. Navigate to the location of the
AppMetrics management pack and select it. This would normally be located under Program
Files\Xtremesoft\AppMetrics for Transactions\SCOM.
Figure 6 - Select Management Packs to Import
7. Select Open. The Import Management Packs dialog will now list the AppMetrics management
pack in its Select Management Pack list.
AppMetrics for Transactions – SCOM Management Pack Users Guide
April 20, 2010
Page 5
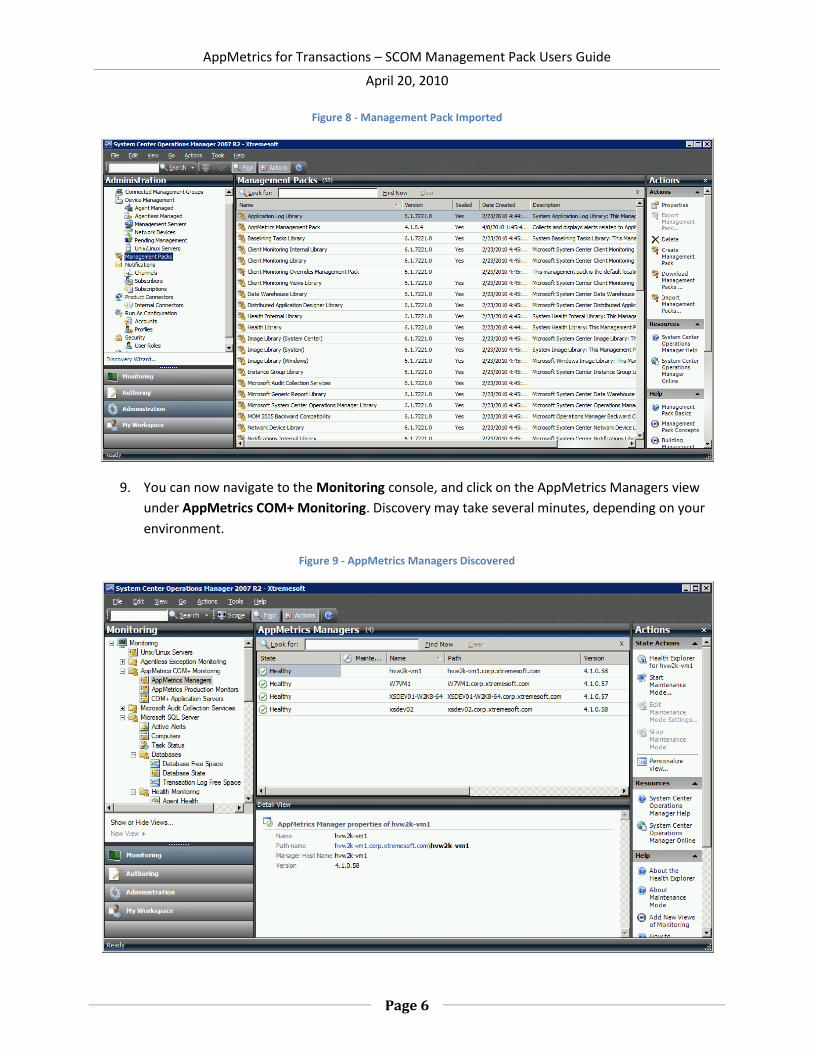
Figure 7 - Ready to Import
8. Select Install. When the MP is imported, select Close. The Management Packs view should now
list the AppMetrics management pack. It might take several minutes for SCOM to refresh the
view before the management pack is listed.
AppMetrics for Transactions – SCOM Management Pack Users Guide
April 20, 2010
Page 6
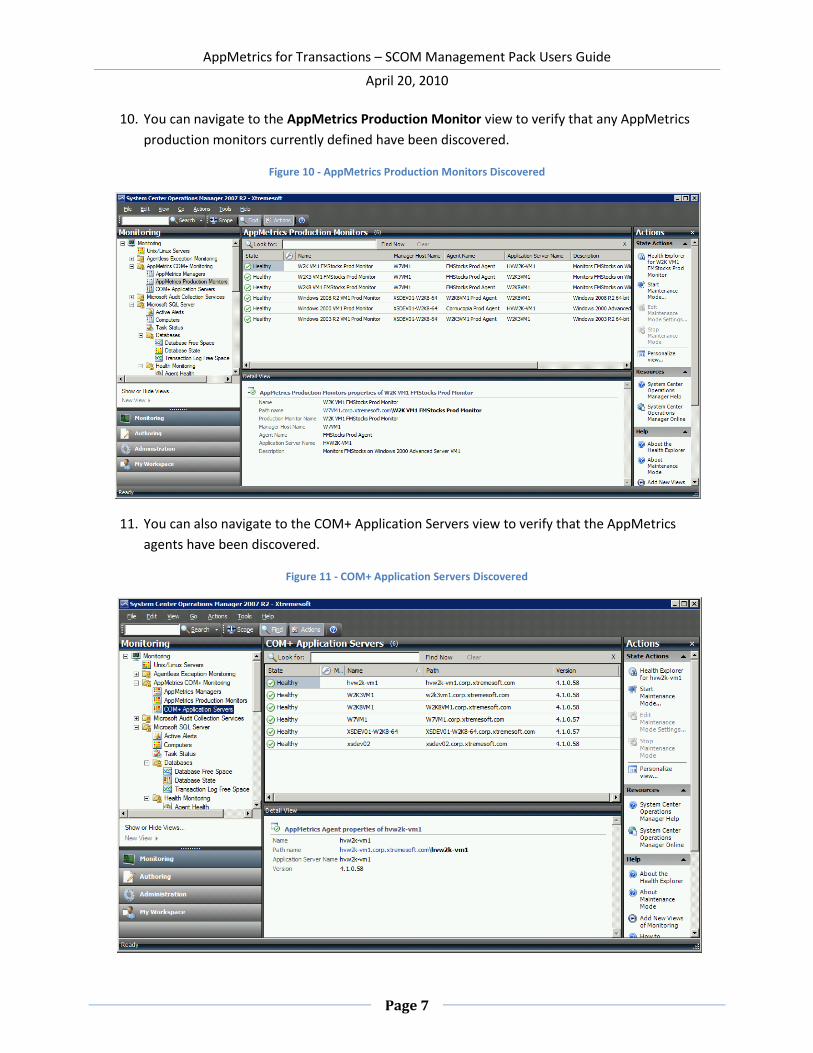
Figure 8 - Management Pack Imported
9. You can now navigate to the Monitoring console, and click on the AppMetrics Managers view
under AppMetrics COM+ Monitoring. Discovery may take several minutes, depending on your
environment.
Figure 9 - AppMetrics Managers Discovered
AppMetrics for Transactions – SCOM Management Pack Users Guide
April 20, 2010
Page 7
10. You can navigate to the AppMetrics Production Monitor view to verify that any AppMetrics
production monitors currently defined have been discovered.
Figure 10 - AppMetrics Production Monitors Discovered
11. You can also navigate to the COM+ Application Servers view to verify that the AppMetrics
agents have been discovered.
Figure 11 - COM+ Application Servers Discovered
AppMetrics for Transactions – SCOM Management Pack Users Guide
April 20, 2010
Page 8
Configuring AppMetrics
In order to enable COM+ monitoring for SCOM, the production monitor’s Notification setting must have
Windows Event log notifications enabled.
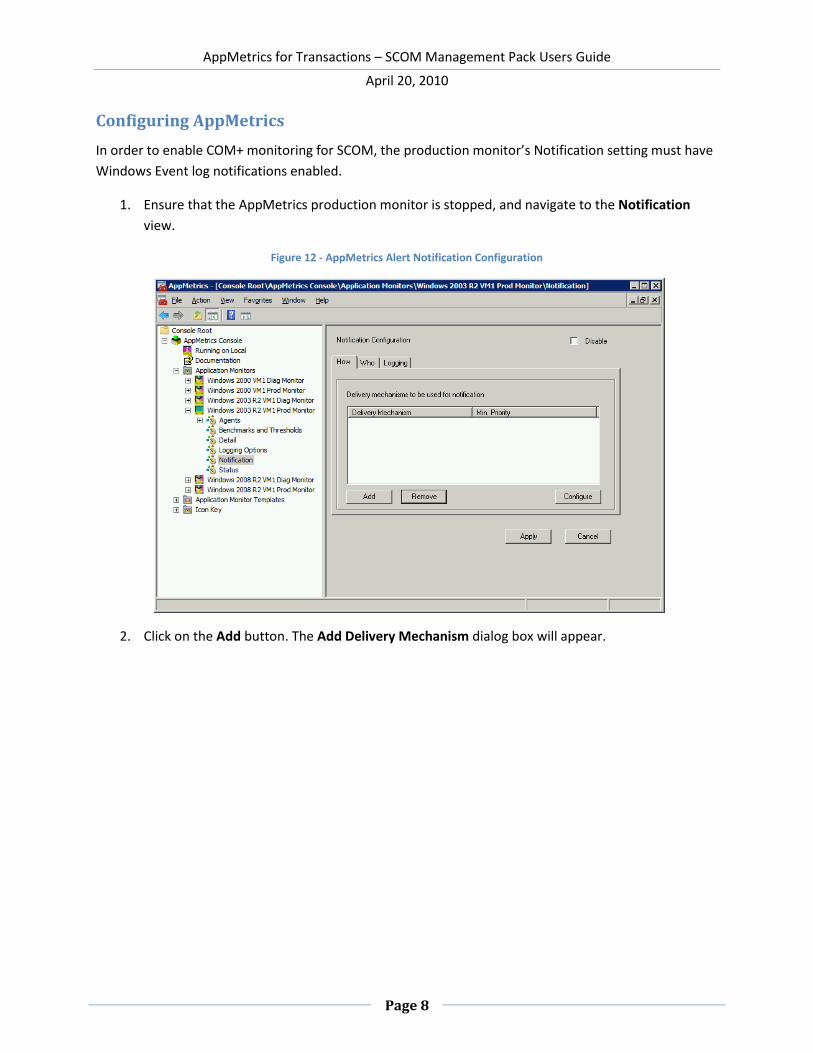
1. Ensure that the AppMetrics production monitor is stopped, and navigate to the Notification
view.
Figure 12 - AppMetrics Alert Notification Configuration
2. Click on the Add button. The Add Delivery Mechanism dialog box will appear.
AppMetrics for Transactions – SCOM Management Pack Users Guide
April 20, 2010
Page 9
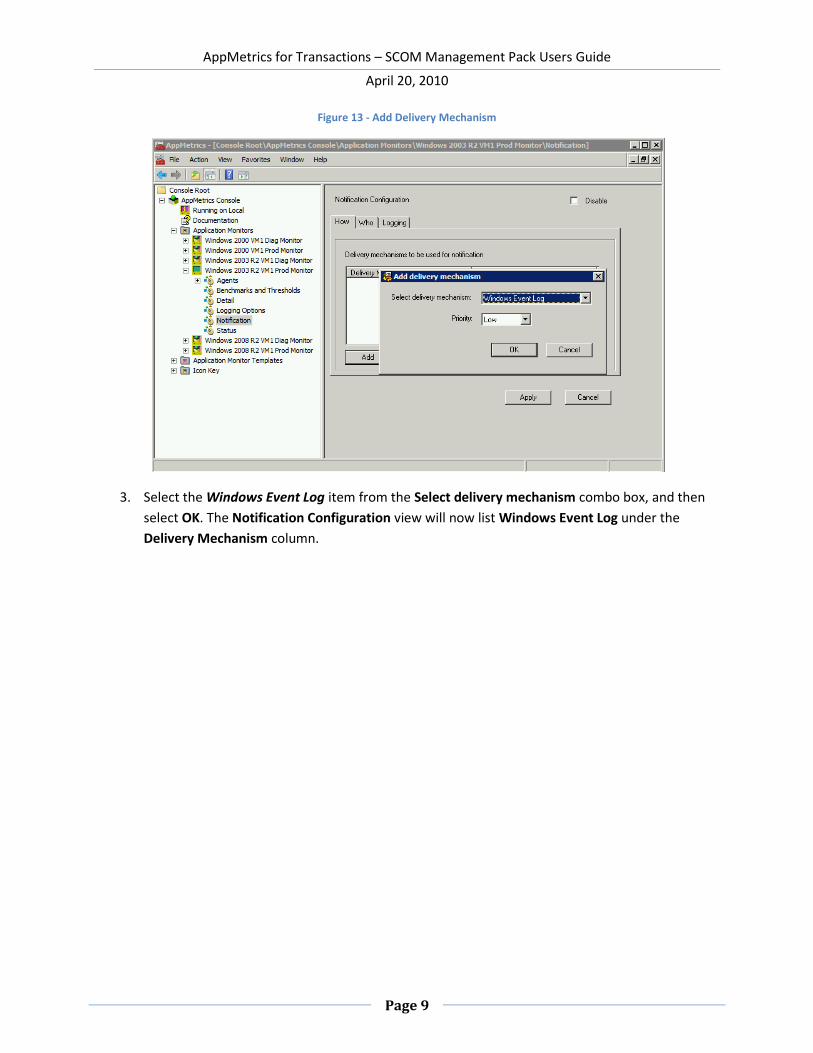
Figure 13 - Add Delivery Mechanism
3. Select the Windows Event Log item from the Select delivery mechanism combo box, and then
select OK. The Notification Configuration view will now list Windows Event Log under the
Delivery Mechanism column.
AppMetrics for Transactions – SCOM Management Pack Users Guide
April 20, 2010
Page 10
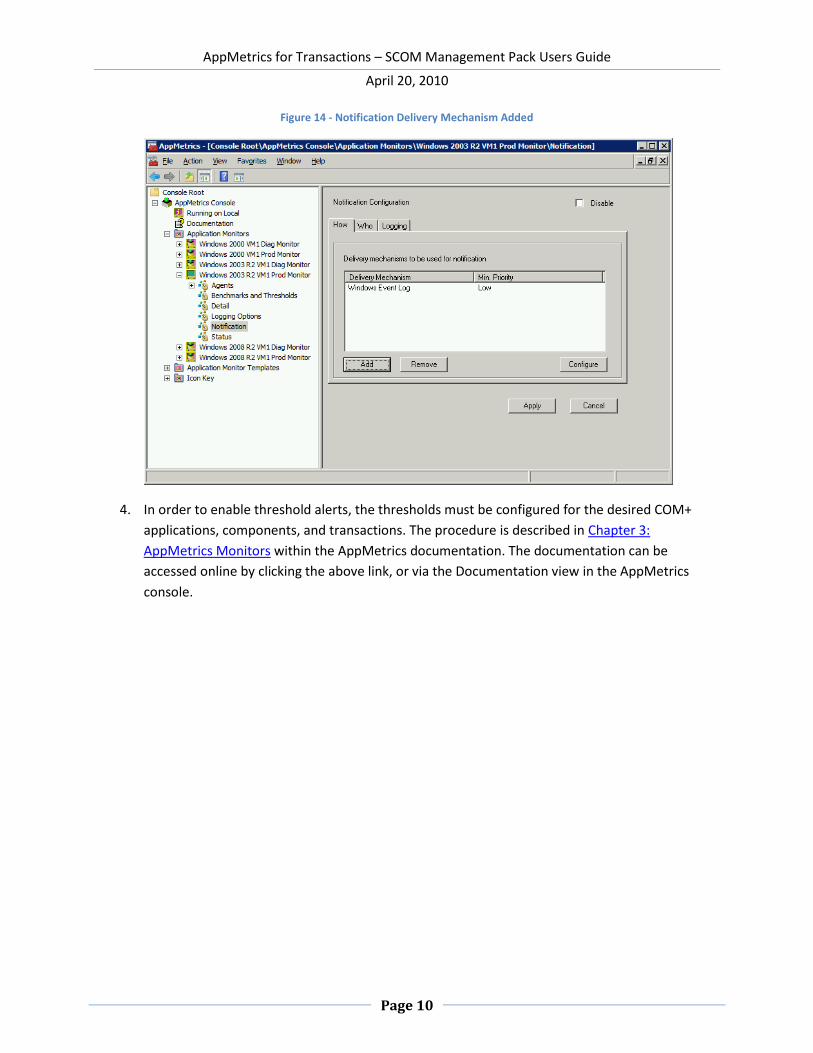
Figure 14 - Notification Delivery Mechanism Added
4. In order to enable threshold alerts, the thresholds must be configured for the desired COM+
applications, components, and transactions. The procedure is described in Chapter 3:
AppMetrics Monitors within the AppMetrics documentation. The documentation can be
accessed online by clicking the above link, or via the Documentation view in the AppMetrics
console.

AppMetrics for Transactions – SCOM Management Pack Users Guide
April 20, 2010
Page 11
Management Pack Options
AppMetrics management pack objects, rules, and monitors can be disabled or enabled using SCOM
overrides in the event of system maintenance or downtime on computers in the operation, and it is
desired to eliminate alerts or state changes due to AppMetrics notifications.
The discovery interval that the AppMetrics management pack uses can also be modified in order to
temporarily shorten the interval from the default of 4 hours to a smaller interval when it is necessary to
discover new AppMetrics objects quickly.
Additionally, the timer reset interval used to automatically resolve the state of COM+ Application Health
Monitors can be overridden to increase or decrease the amount of time it will take for the monitor to
automatically reset to a healthy state.
The properties which can be overridden are as follows;
Enable/Disable
o AppMetrics Manager Discovery
o AppMetrics Production Monitor Discovery
o AppMetrics Agent Discovery
o AppMetrics Manager Connectivity Monitors
o AppMetrics Manager Service Monitor
o AppMetrics Manager Security Events Monitor
o AppMetrics COM+ Application Health Monitor
o AppMetrics Production Monitor State Monitor
o AppMetrics Manager Availability Rollup Monitor
o AppMetrics Manager Security Rollup Monitor
o AppMetrics Agent Health Monitor
o AppMetrics Agent Service Monitor
Time Interval
o AppMetrics Discovery Interval
o AppMetrics COM+ Application Health Monitor Timer Reset Interval
The properties may be overridden for all objects of a particular type, or for individual objects.

AppMetrics for Transactions – SCOM Management Pack Users Guide
April 20, 2010
Page 12
Overriding the Default Discovery Interval
The AppMetrics discovery interval can be overridden to allow for quicker discovery of AppMetrics
manager, agent, and production monitors. The value should be reset once the objects are discovered, as
Microsoft recommends a 4 hour discovery interval for discovery, as shorter intervals may impact
performance.
To override the discovery interval for an AppMetrics object, navigate to the SCOM Authoring console,
Object Discoveries view. Select the object desired, such as AppMetrics Production Monitors.
Figure 15 - Object Discoveries View
Click the Overrides menu, select Override the Object Discovery, and either For all objects of class
Windows Computers (if it is desired to affect the discovery interval of all computers), or For a specific
object of class Windows Computer (if it is desired to change the interval on only one machine, such as
an AppMetrics manager machine where the production monitors are hosted in order to discover new
production monitors or to delete ones from SCOM that have been removed).

AppMetrics for Transactions – SCOM Management Pack Users Guide
April 20, 2010
Page 13
Figure 16 - Discovery Override Select
In this example the For a specific object of class Windows Computer selection was made. The following
dialog box will appear where the specific computer can be selected.
Figure 17 - Select Discovery Object

AppMetrics for Transactions – SCOM Management Pack Users Guide
April 20, 2010
Page 14
Once the selection is made, the Override Properties view will appear, as shown below.
Figure 18 - Discovery Override Properties

AppMetrics for Transactions – SCOM Management Pack Users Guide
April 20, 2010
Page 15
Check the Override checkbox, and enter the desired discovery interval in seconds. Here we are
overriding the default interval of 4 hours (14400 seconds) to 5 minutes (300 seconds).
Figure 19 - Override Default Discovery Interval Value

AppMetrics for Transactions – SCOM Management Pack Users Guide
April 20, 2010
Page 16
Select the Apply button to verify that the Effective Value changes from 14400 to 300. You can then
select OK to dismiss the view.
Figure 20 - Discovery Interval Updated
AppMetrics for Transactions – SCOM Management Pack Users Guide
April 20, 2010
Page 17
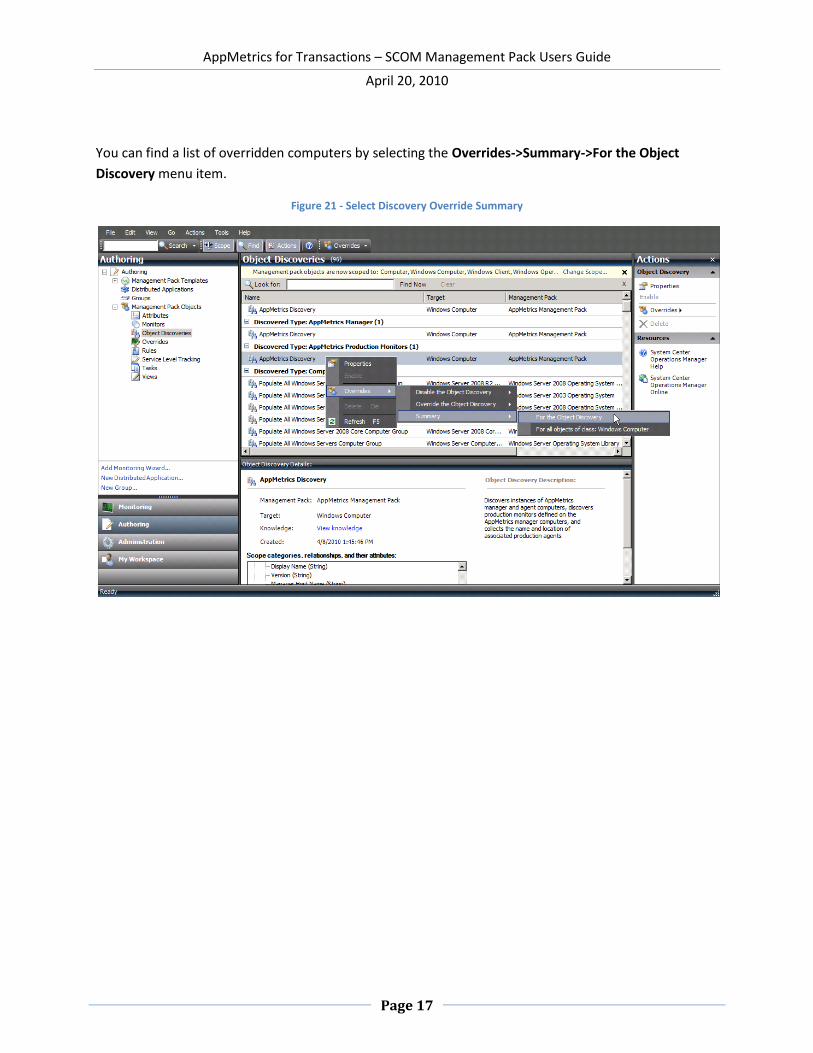
You can find a list of overridden computers by selecting the Overrides->Summary->For the Object
Discovery menu item.
Figure 21 - Select Discovery Override Summary
AppMetrics for Transactions – SCOM Management Pack Users Guide
April 20, 2010
Page 18
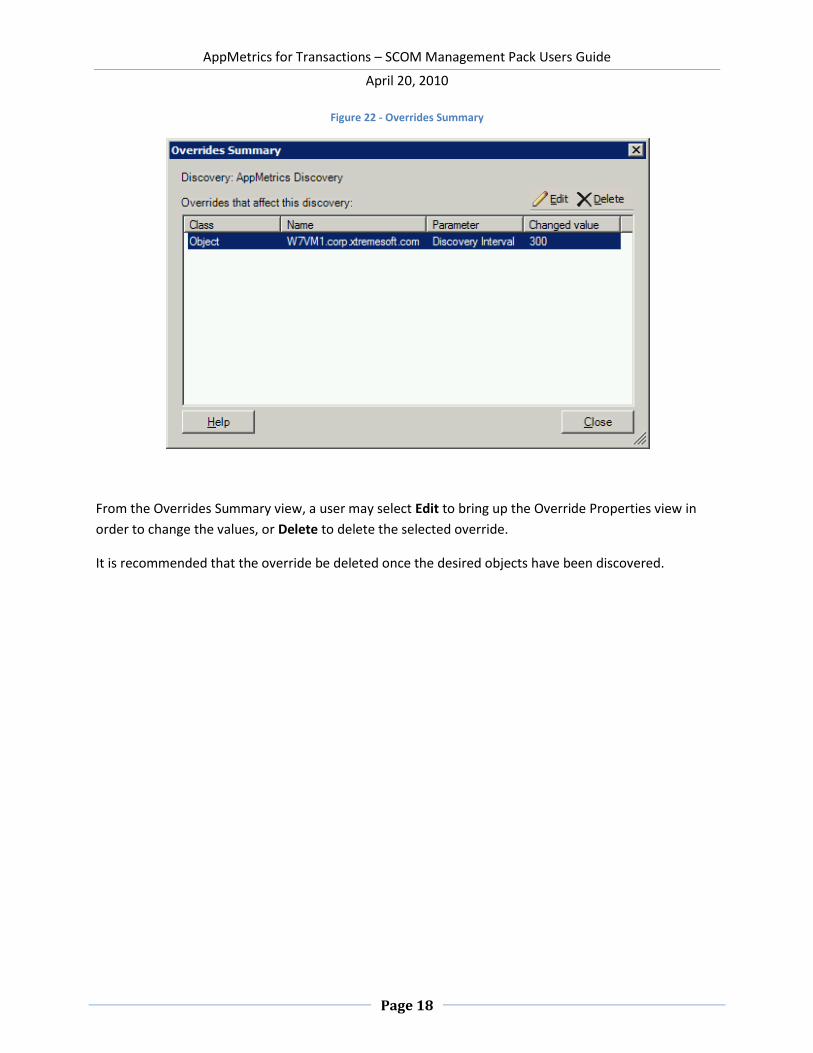
Figure 22 - Overrides Summary
From the Overrides Summary view, a user may select Edit to bring up the Override Properties view in
order to change the values, or Delete to delete the selected override.
It is recommended that the override be deleted once the desired objects have been discovered.

AppMetrics for Transactions – SCOM Management Pack Users Guide
April 20, 2010
Page 19
Disabling and Enabling Monitors
It may be desired to disable monitors for systems undergoing maintenance in order to avoid generating
alerts for those machines. To disable a certain monitor, such as the AppMetrics Manager Service
Monitor, the monitor can be disabled or enabled from either the Authoring console Monitors view, or
from a Monitoring console Health Explorer view for a specific monitor object.
In the example below, a specific AppMetrics Manager object was selected from the AppMetrics
Manager View, and the Health Explorer opened for that object. We will look at how to disable the
AppMetrics Manager Service monitor for the specific AppMetrics Manager computer.
Figure 23 - AppMetrics Manager Health Explorer

AppMetrics for Transactions – SCOM Management Pack Users Guide
April 20, 2010
Page 20
Select the Overrides->Disable the Monitor->For the object {object name} menu item. Here the object
name is W7VM1.
Figure 24 - Disable Monitor from Health Explorer
The monitor will change to a disabled state. The disabled state shows an empty green circle instead of a
green circle with a check mark. It may take several minutes for the SCOM Health Explorer view to
update to a disabled state.

AppMetrics for Transactions – SCOM Management Pack Users Guide
April 20, 2010
Page 21
Figure 25 - AppMetrics Manger Service Monitor Disabled
In order to enable the monitor, select Overrides->Override the Monitor->For the object {object name},
where here the object name is W7VM1.
Figure 26 - Enabling a Disabled Monitor
AppMetrics for Transactions – SCOM Management Pack Users Guide
April 20, 2010
Page 22
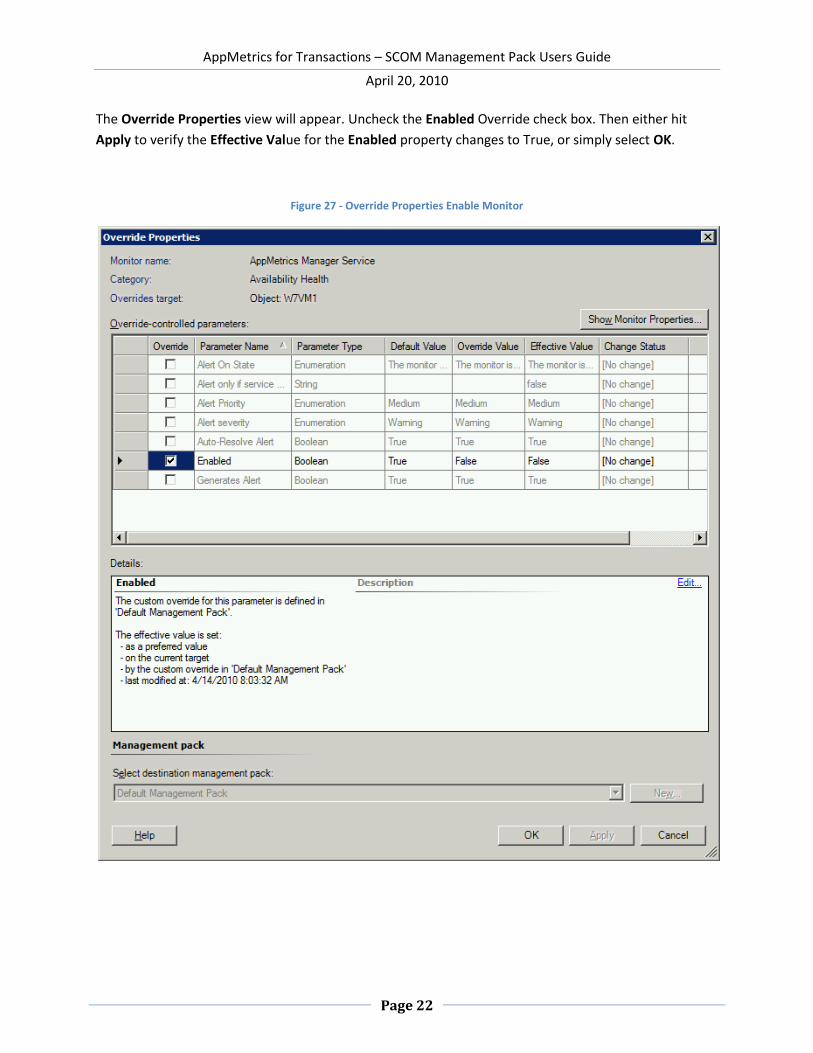
The Override Properties view will appear. Uncheck the Enabled Override check box. Then either hit
Apply to verify the Effective Value for the Enabled property changes to True, or simply select OK.
Figure 27 - Override Properties Enable Monitor
AppMetrics for Transactions – SCOM Management Pack Users Guide
April 20, 2010
Page 23
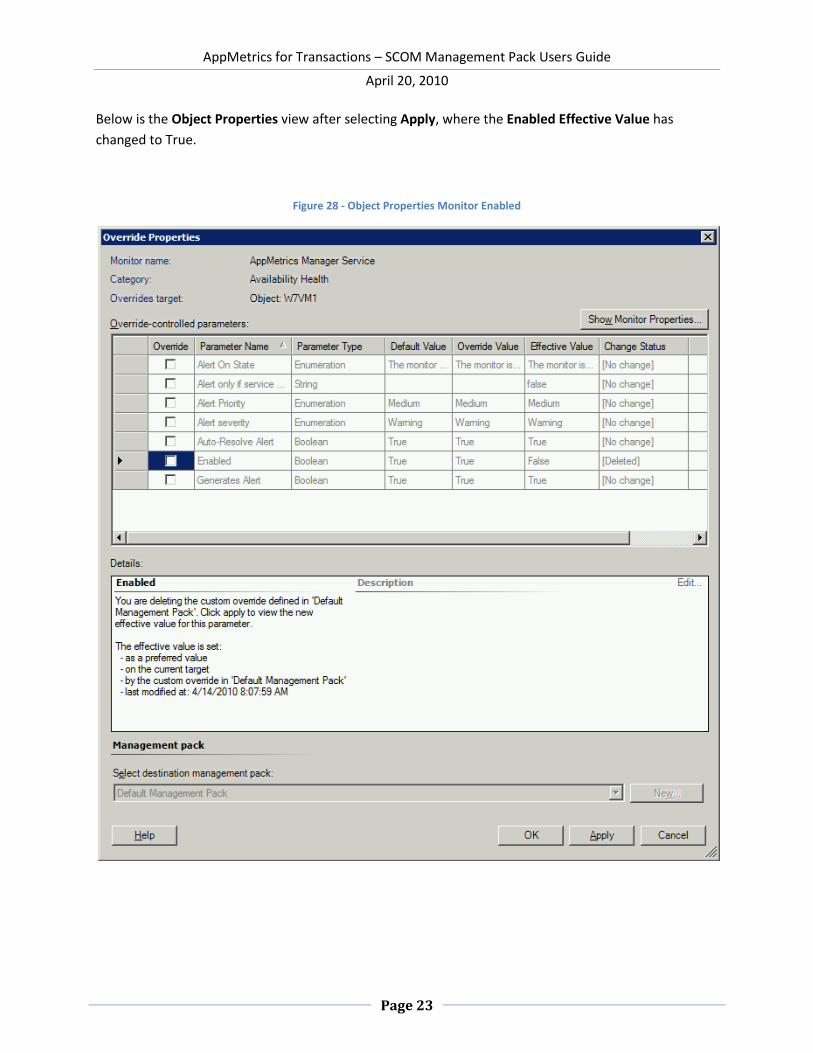
Below is the Object Properties view after selecting Apply, where the Enabled Effective Value has
changed to True.
Figure 28 - Object Properties Monitor Enabled

AppMetrics for Transactions – SCOM Management Pack Users Guide
April 20, 2010
Page 24
In the below example we will show how to disable a monitor for all computers using the SCOM
Authoring console Monitor view.
Here, the AppMetrics Manager Connectivity monitor was selected, and the item right clicked in order to
bring up the Overrides menu. The monitor can be disabled by either selecting Disable the Monitor or
from the Override the Monitor selection. To disable the monitor for all computers, select For all objects
of class AppMetrics Manager. To disable the monitor for a specific computer, select For a specific
object of class AppMetrics Manger.
Figure 29 - Authoring Console Monitors View
To enable the monitor, select the Override the Monitor item and remove the override on the Enable
property.
AppMetrics for Transactions – SCOM Management Pack Users Guide
April 20, 2010
Page 25
Disabling and Enabling Alerts
From time to time it may be desired to disable certain alerts for machines undergoing maintenance, or
for specific COM+ production monitors when it is known that a certain machine has higher than typical
load and is generating excessive threshold exceeded alerts.
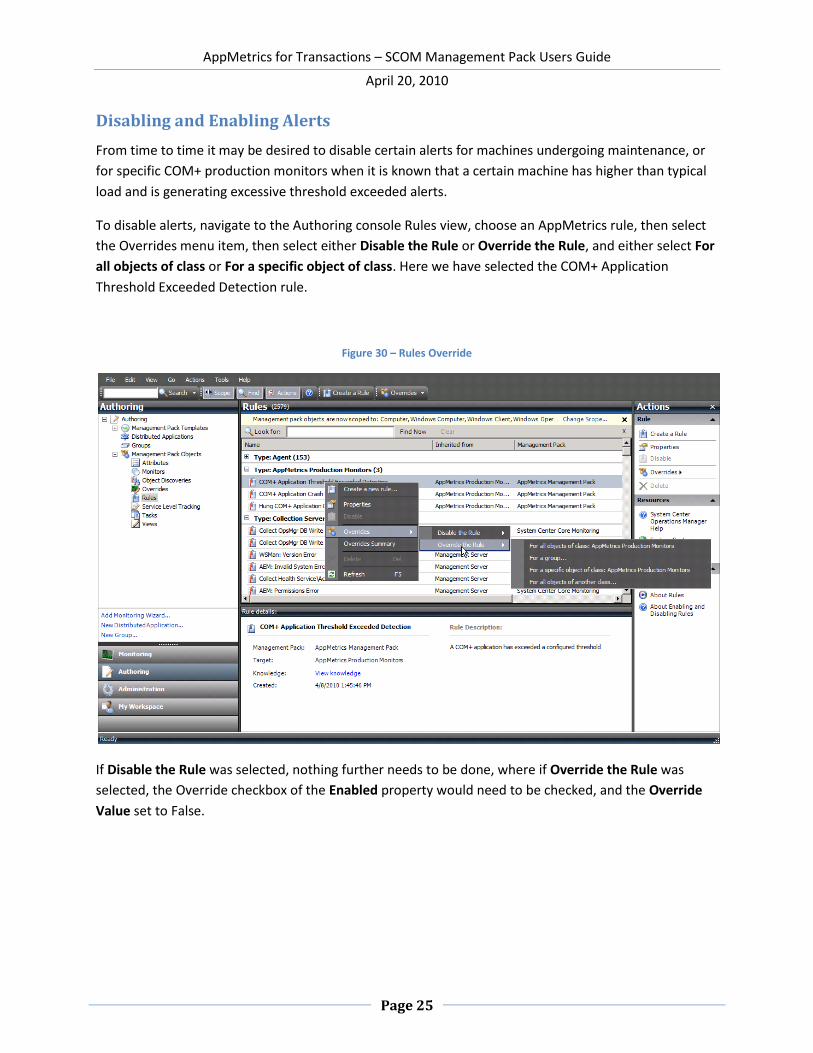
To disable alerts, navigate to the Authoring console Rules view, choose an AppMetrics rule, then select
the Overrides menu item, then select either Disable the Rule or Override the Rule, and either select For
all objects of class or For a specific object of class. Here we have selected the COM+ Application
Threshold Exceeded Detection rule.
Figure 30 – Rules Override
If Disable the Rule was selected, nothing further needs to be done, where if Override the Rule was
selected, the Override checkbox of the Enabled property would need to be checked, and the Override
Value set to False.

AppMetrics for Transactions – SCOM Management Pack Users Guide
April 20, 2010
Page 26
Figure 31 - Rules Override Properties
To enable the rule, Override the rule would need to be selected, and the Override checkbox unchecked
on the Enabled property.
AppMetrics for Transactions – SCOM Management Pack Users Guide
April 20, 2010
Page 27
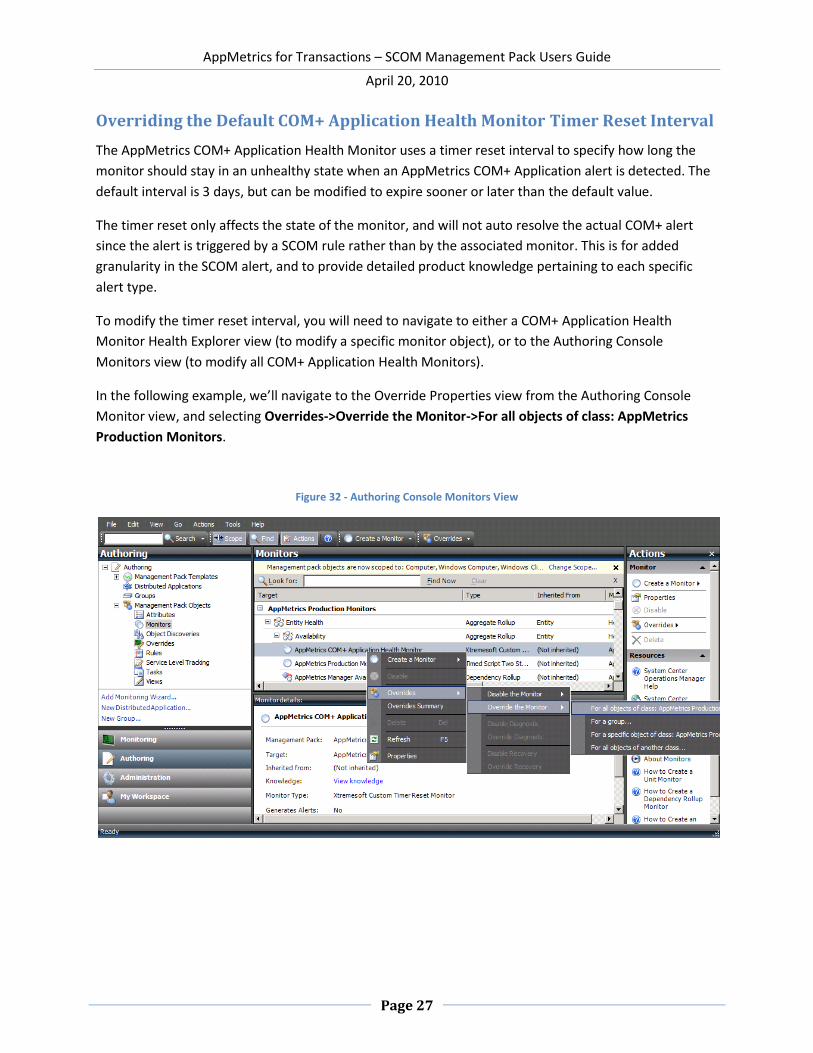
Overriding the Default COM+ Application Health Monitor Timer Reset Interval
The AppMetrics COM+ Application Health Monitor uses a timer reset interval to specify how long the
monitor should stay in an unhealthy state when an AppMetrics COM+ Application alert is detected. The
default interval is 3 days, but can be modified to expire sooner or later than the default value.
The timer reset only affects the state of the monitor, and will not auto resolve the actual COM+ alert
since the alert is triggered by a SCOM rule rather than by the associated monitor. This is for added
granularity in the SCOM alert, and to provide detailed product knowledge pertaining to each specific
alert type.
To modify the timer reset interval, you will need to navigate to either a COM+ Application Health
Monitor Health Explorer view (to modify a specific monitor object), or to the Authoring Console
Monitors view (to modify all COM+ Application Health Monitors).
In the following example, we’ll navigate to the Override Properties view from the Authoring Console
Monitor view, and selecting Overrides->Override the Monitor->For all objects of class: AppMetrics
Production Monitors.
Figure 32 - Authoring Console Monitors View
AppMetrics for Transactions – SCOM Management Pack Users Guide
April 20, 2010
Page 28
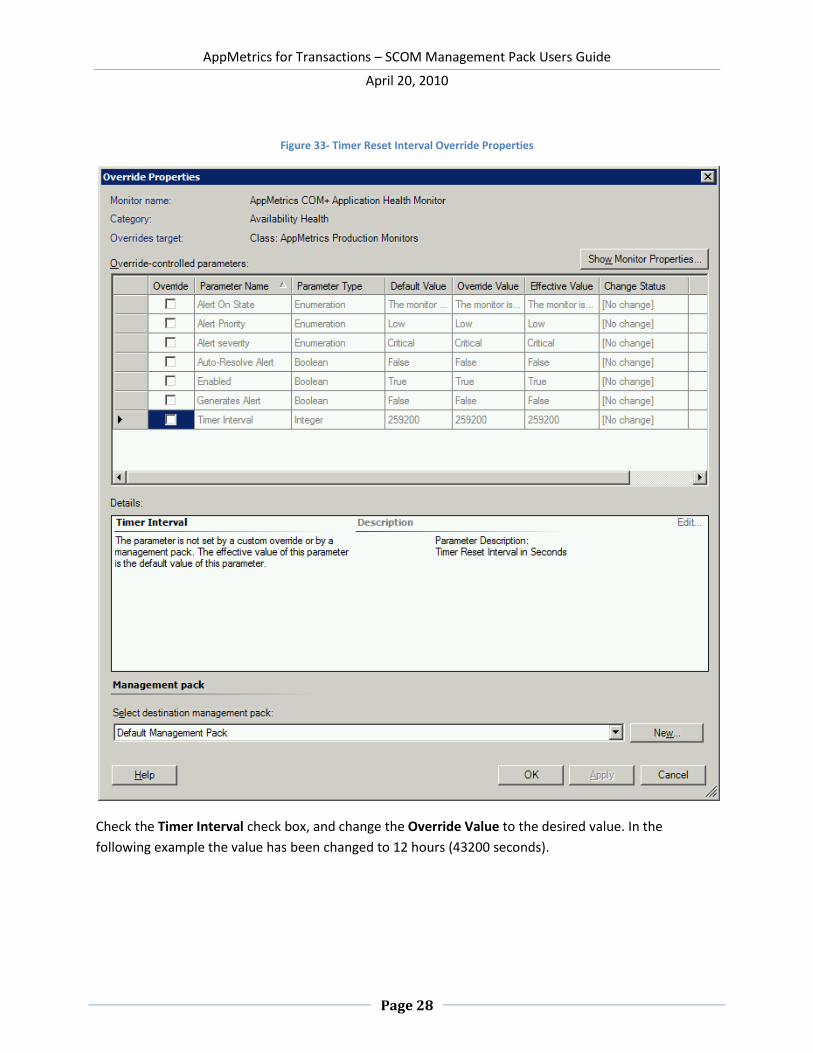
Figure 33- Timer Reset Interval Override Properties
Check the Timer Interval check box, and change the Override Value to the desired value. In the
following example the value has been changed to 12 hours (43200 seconds).

AppMetrics for Transactions – SCOM Management Pack Users Guide
April 20, 2010
Page 29
Figure 34 - Timer Reset Interval New Value Entered
Select Apply to verify your changes. The Effective Value should change to the Override Value. You can
then select OK to dismiss the view.

AppMetrics for Transactions – SCOM Management Pack Users Guide
April 20, 2010
Page 30
Figure 35 - Timer Reset Interval Overridden
AppMetrics for Transactions – SCOM Management Pack Users Guide
April 20, 2010
Page 31
Management Pack Views
The AppMetrics management pack incorporates 3 main views to present health, status, and
performance data.
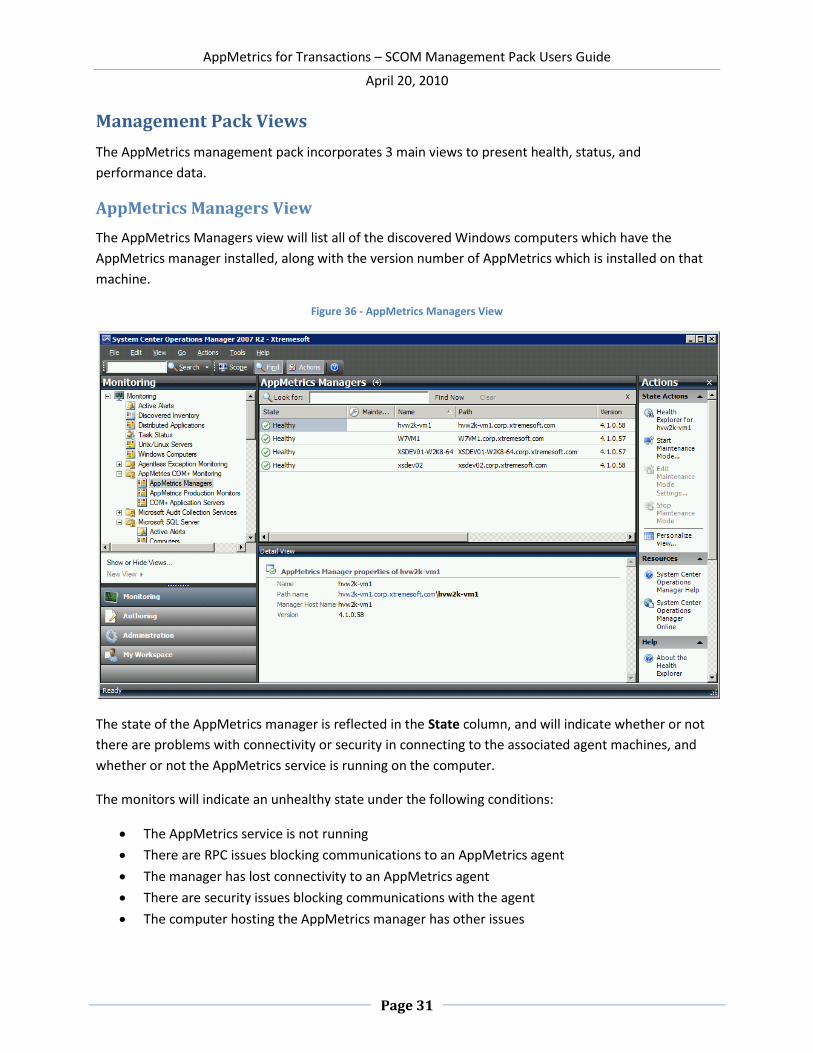
AppMetrics Managers View
The AppMetrics Managers view will list all of the discovered Windows computers which have the
AppMetrics manager installed, along with the version number of AppMetrics which is installed on that
machine.
Figure 36 - AppMetrics Managers View
The state of the AppMetrics manager is reflected in the State column, and will indicate whether or not
there are problems with connectivity or security in connecting to the associated agent machines, and
whether or not the AppMetrics service is running on the computer.
The monitors will indicate an unhealthy state under the following conditions:
The AppMetrics service is not running
There are RPC issues blocking communications to an AppMetrics agent
The manager has lost connectivity to an AppMetrics agent
There are security issues blocking communications with the agent
The computer hosting the AppMetrics manager has other issues
AppMetrics for Transactions – SCOM Management Pack Users Guide
April 20, 2010
Page 32
The Health Explorer for the view can be selected by double clicking on the manager state item, or by
right clicking the row and selecting Health Explorer from the menu.
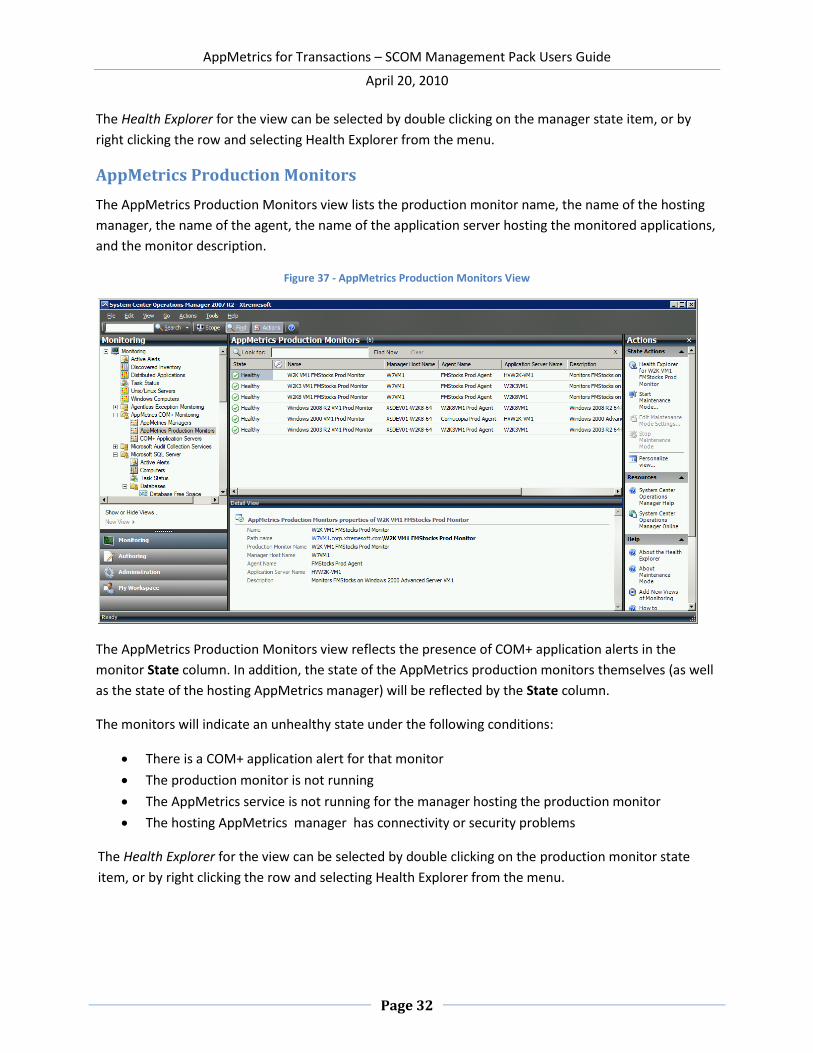
AppMetrics Production Monitors
The AppMetrics Production Monitors view lists the production monitor name, the name of the hosting
manager, the name of the agent, the name of the application server hosting the monitored applications,
and the monitor description.
Figure 37 - AppMetrics Production Monitors View
The AppMetrics Production Monitors view reflects the presence of COM+ application alerts in the
monitor State column. In addition, the state of the AppMetrics production monitors themselves (as well
as the state of the hosting AppMetrics manager) will be reflected by the State column.
The monitors will indicate an unhealthy state under the following conditions:
There is a COM+ application alert for that monitor
The production monitor is not running
The AppMetrics service is not running for the manager hosting the production monitor
The hosting AppMetrics manager has connectivity or security problems
The Health Explorer for the view can be selected by double clicking on the production monitor state
item, or by right clicking the row and selecting Health Explorer from the menu.
AppMetrics for Transactions – SCOM Management Pack Users Guide
April 20, 2010
Page 33
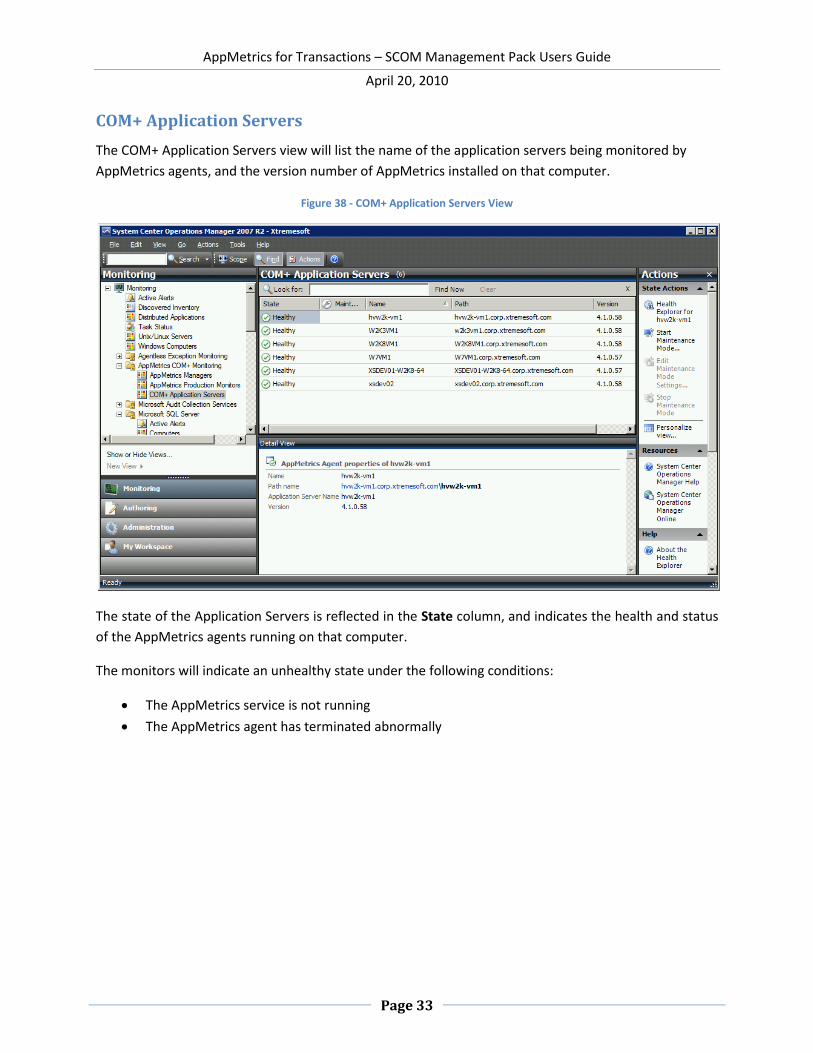
COM+ Application Servers
The COM+ Application Servers view will list the name of the application servers being monitored by
AppMetrics agents, and the version number of AppMetrics installed on that computer.
Figure 38 - COM+ Application Servers View
The state of the Application Servers is reflected in the State column, and indicates the health and status
of the AppMetrics agents running on that computer.
The monitors will indicate an unhealthy state under the following conditions:
The AppMetrics service is not running
The AppMetrics agent has terminated abnormally
AppMetrics for Transactions – SCOM Management Pack Users Guide
April 20, 2010
Page 34
Health Explorer Views
The SCOM Health Explorer provides a hierarchical view of the various health and status monitors which
reflect the state of each object listed in the 3 main AppMetrics views.
By clicking on the individual monitors, details concerning the state of the monitor and associated
knowledge concerning that monitor can be viewed.
AppMetrics Managers
The Health Explorer for items listed in the AppMetrics Managers view can be selected by double clicking
on the manager state item, or by right clicking the row and selecting Health Explorer from the menu.
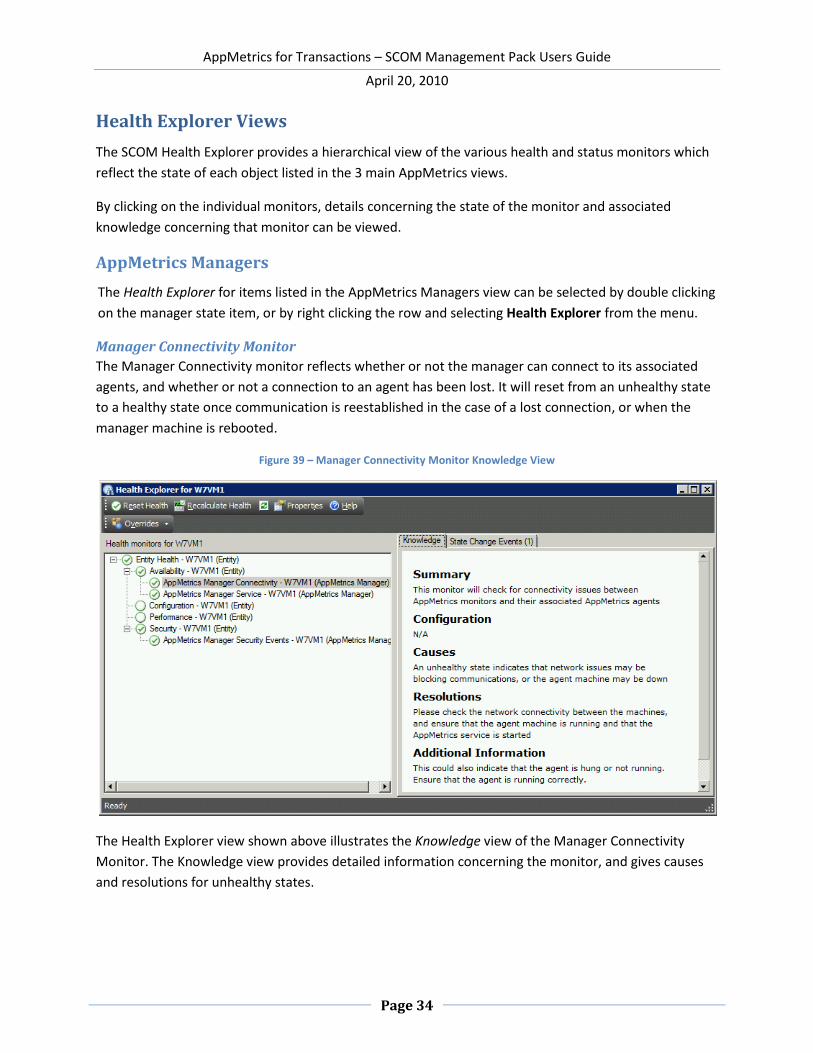
Manager Connectivity Monitor
The Manager Connectivity monitor reflects whether or not the manager can connect to its associated
agents, and whether or not a connection to an agent has been lost. It will reset from an unhealthy state
to a healthy state once communication is reestablished in the case of a lost connection, or when the
manager machine is rebooted.
Figure 39 – Manager Connectivity Monitor Knowledge View
The Health Explorer view shown above illustrates the Knowledge view of the Manager Connectivity
Monitor. The Knowledge view provides detailed information concerning the monitor, and gives causes
and resolutions for unhealthy states.

AppMetrics for Transactions – SCOM Management Pack Users Guide
April 20, 2010
Page 35
The State Change Events view, shown below, indicates dates and times the state of the monitor
changed, and provides Windows Event Log information concerning the event which caused the state
change.
Figure 40 – Manager Connectivity Monitor State Change Events View
AppMetrics for Transactions – SCOM Management Pack Users Guide
April 20, 2010
Page 36
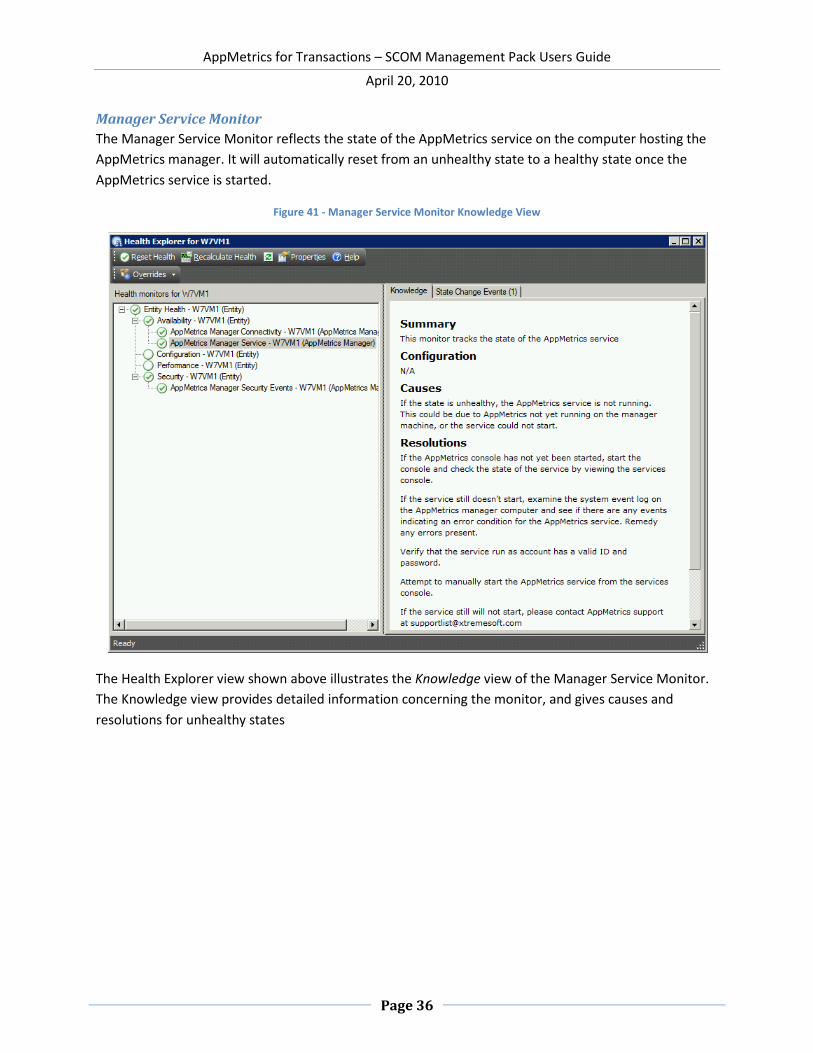
Manager Service Monitor
The Manager Service Monitor reflects the state of the AppMetrics service on the computer hosting the
AppMetrics manager. It will automatically reset from an unhealthy state to a healthy state once the
AppMetrics service is started.
Figure 41 - Manager Service Monitor Knowledge View
The Health Explorer view shown above illustrates the Knowledge view of the Manager Service Monitor.
The Knowledge view provides detailed information concerning the monitor, and gives causes and
resolutions for unhealthy states

AppMetrics for Transactions – SCOM Management Pack Users Guide
April 20, 2010
Page 37
The State Change Events view, indicates dates and times the state of the monitor changed, and provides
Windows Event Log information concerning the event which caused the state change.
Various properties related to the AppMetrics service are also displayed in the Details section.
Figure 42 – Manager Service Monitor State Change Events View
AppMetrics for Transactions – SCOM Management Pack Users Guide
April 20, 2010
Page 38
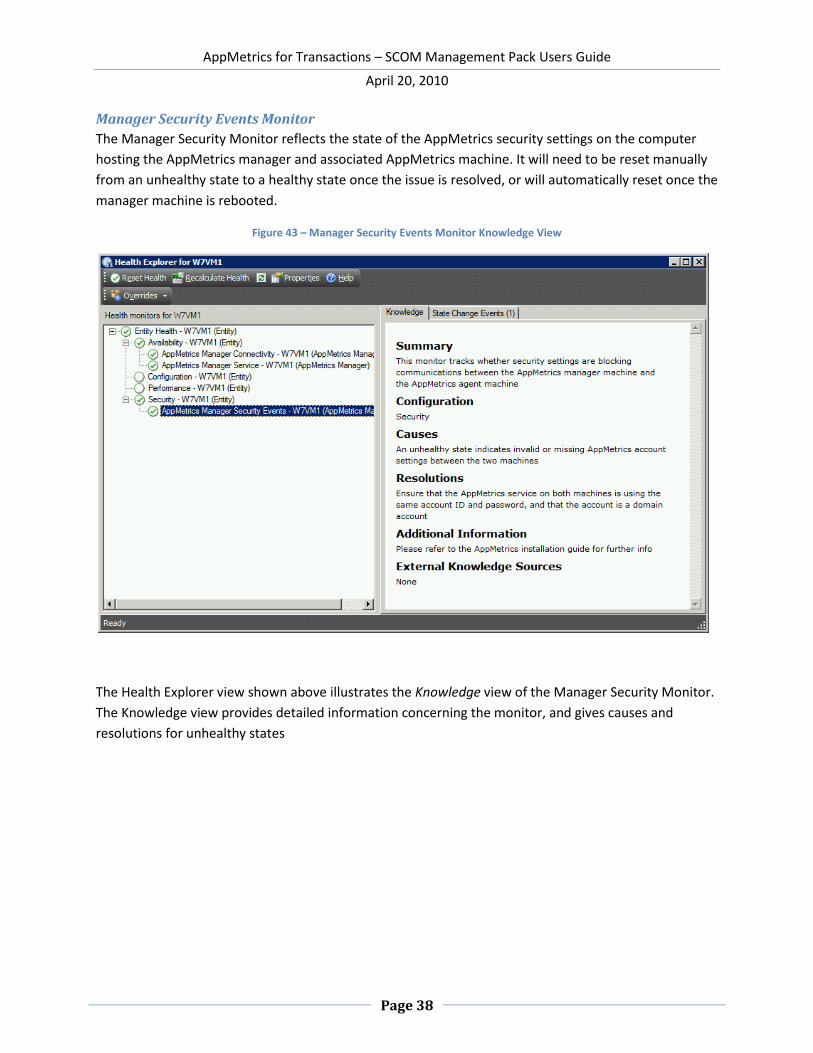
Manager Security Events Monitor
The Manager Security Monitor reflects the state of the AppMetrics security settings on the computer
hosting the AppMetrics manager and associated AppMetrics machine. It will need to be reset manually
from an unhealthy state to a healthy state once the issue is resolved, or will automatically reset once the
manager machine is rebooted.
Figure 43 – Manager Security Events Monitor Knowledge View
The Health Explorer view shown above illustrates the Knowledge view of the Manager Security Monitor.
The Knowledge view provides detailed information concerning the monitor, and gives causes and
resolutions for unhealthy states
AppMetrics for Transactions – SCOM Management Pack Users Guide
April 20, 2010
Page 39
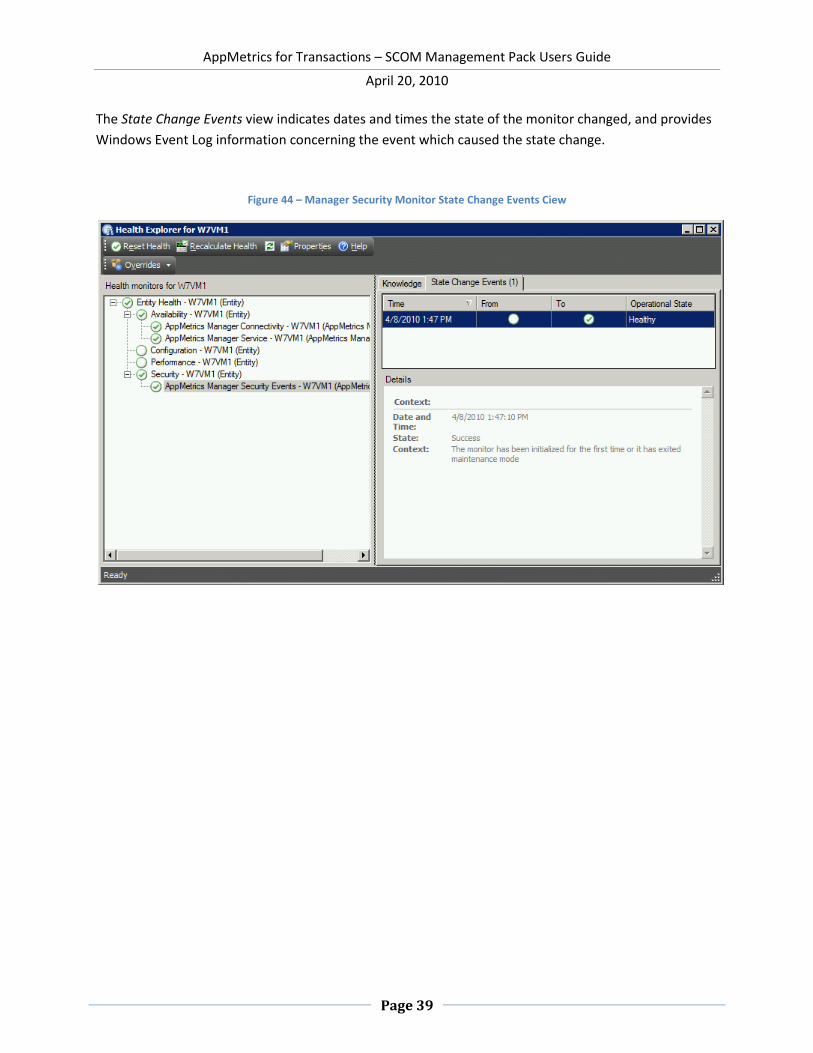
The State Change Events view indicates dates and times the state of the monitor changed, and provides
Windows Event Log information concerning the event which caused the state change.
Figure 44 – Manager Security Monitor State Change Events Ciew
AppMetrics for Transactions – SCOM Management Pack Users Guide
April 20, 2010
Page 40
AppMetrics Production Monitors
The Health Explorer for items listed in the AppMetrics Production Monitors view can be selected by
double clicking on the production monitor state item, or by right clicking the row and selecting Health
Explorer from the menu.
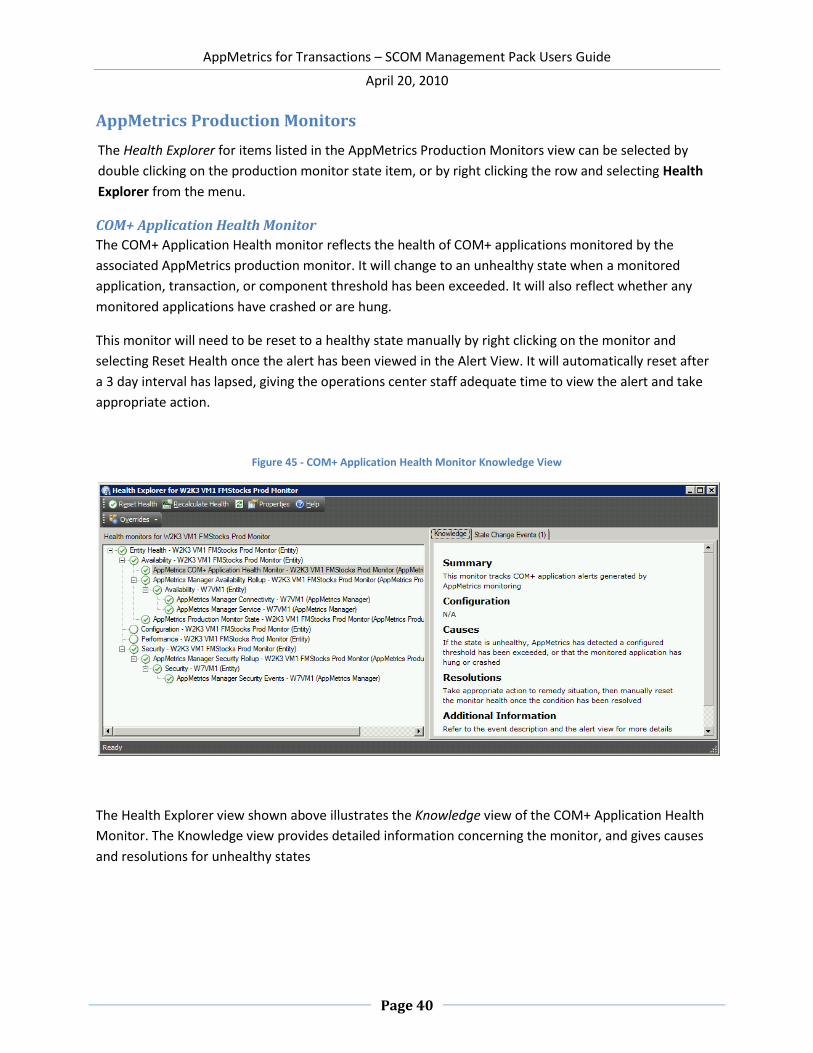
COM+ Application Health Monitor
The COM+ Application Health monitor reflects the health of COM+ applications monitored by the
associated AppMetrics production monitor. It will change to an unhealthy state when a monitored
application, transaction, or component threshold has been exceeded. It will also reflect whether any
monitored applications have crashed or are hung.
This monitor will need to be reset to a healthy state manually by right clicking on the monitor and
selecting Reset Health once the alert has been viewed in the Alert View. It will automatically reset after
a 3 day interval has lapsed, giving the operations center staff adequate time to view the alert and take
appropriate action.
Figure 45 - COM+ Application Health Monitor Knowledge View
The Health Explorer view shown above illustrates the Knowledge view of the COM+ Application Health
Monitor. The Knowledge view provides detailed information concerning the monitor, and gives causes
and resolutions for unhealthy states
AppMetrics for Transactions – SCOM Management Pack Users Guide
April 20, 2010
Page 41
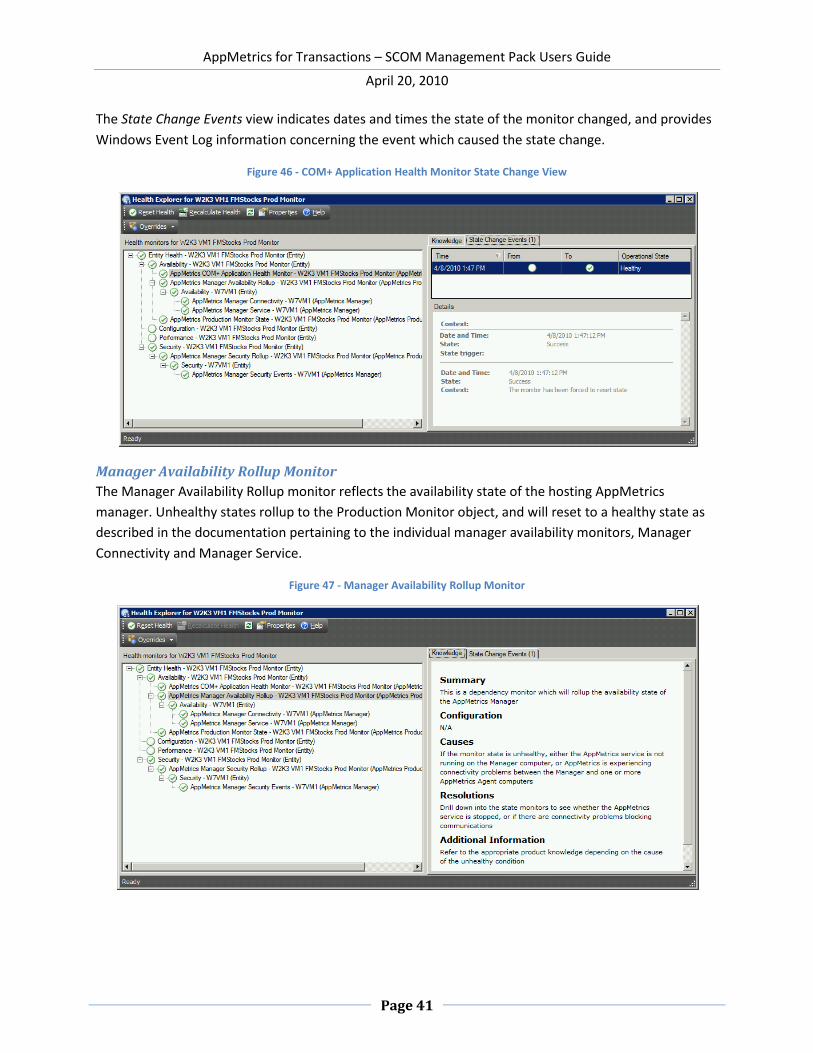
The State Change Events view indicates dates and times the state of the monitor changed, and provides
Windows Event Log information concerning the event which caused the state change.
Figure 46 - COM+ Application Health Monitor State Change View
Manager Availability Rollup Monitor
The Manager Availability Rollup monitor reflects the availability state of the hosting AppMetrics
manager. Unhealthy states rollup to the Production Monitor object, and will reset to a healthy state as
described in the documentation pertaining to the individual manager availability monitors, Manager
Connectivity and Manager Service.
Figure 47 - Manager Availability Rollup Monitor

AppMetrics for Transactions – SCOM Management Pack Users Guide
April 20, 2010
Page 42
Production Monitor State Monitor
The Production Monitor State monitor reflects whether or not the AppMetrics production monitor is
running or stopped. An unhealthy state indicates the production monitor is stopped. Once the
production monitor is started, the state will automatically be reset to healthy.
Figure 48 - Production Monitor State Monitor Knowledge View
Figure 49 - Production Monitor State Monitor State Change View
AppMetrics for Transactions – SCOM Management Pack Users Guide
April 20, 2010
Page 43
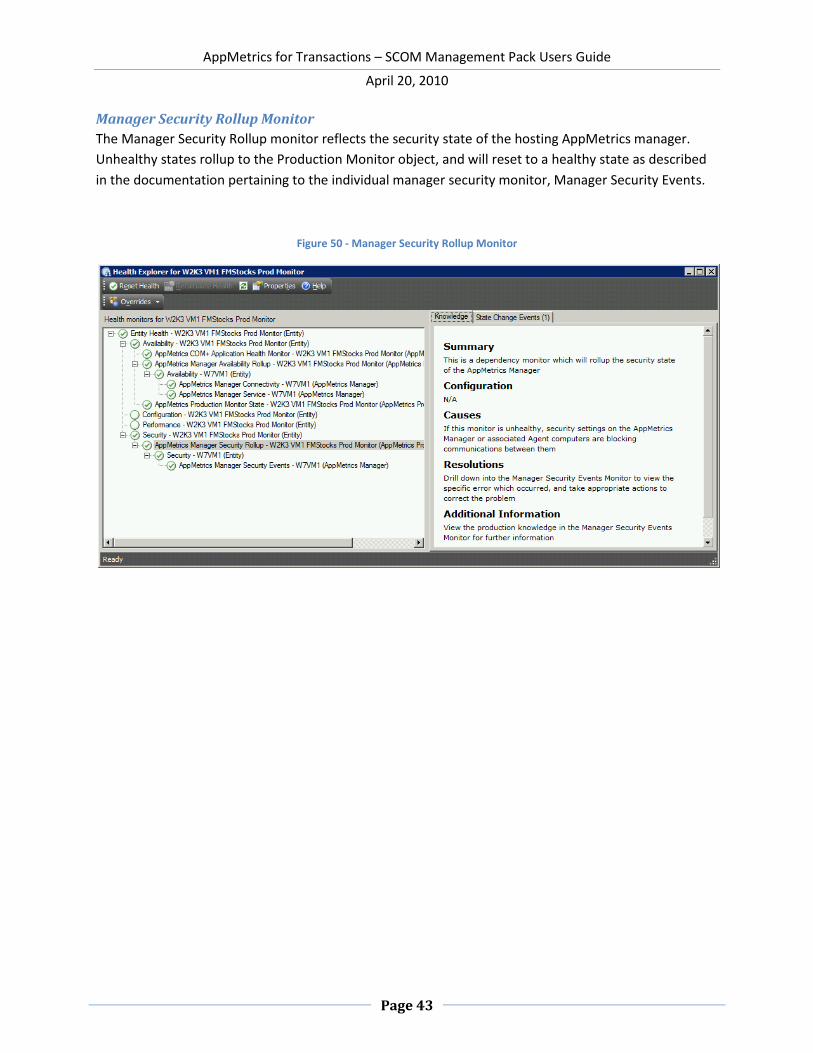
Manager Security Rollup Monitor
The Manager Security Rollup monitor reflects the security state of the hosting AppMetrics manager.
Unhealthy states rollup to the Production Monitor object, and will reset to a healthy state as described
in the documentation pertaining to the individual manager security monitor, Manager Security Events.
Figure 50 - Manager Security Rollup Monitor
AppMetrics for Transactions – SCOM Management Pack Users Guide
April 20, 2010
Page 44
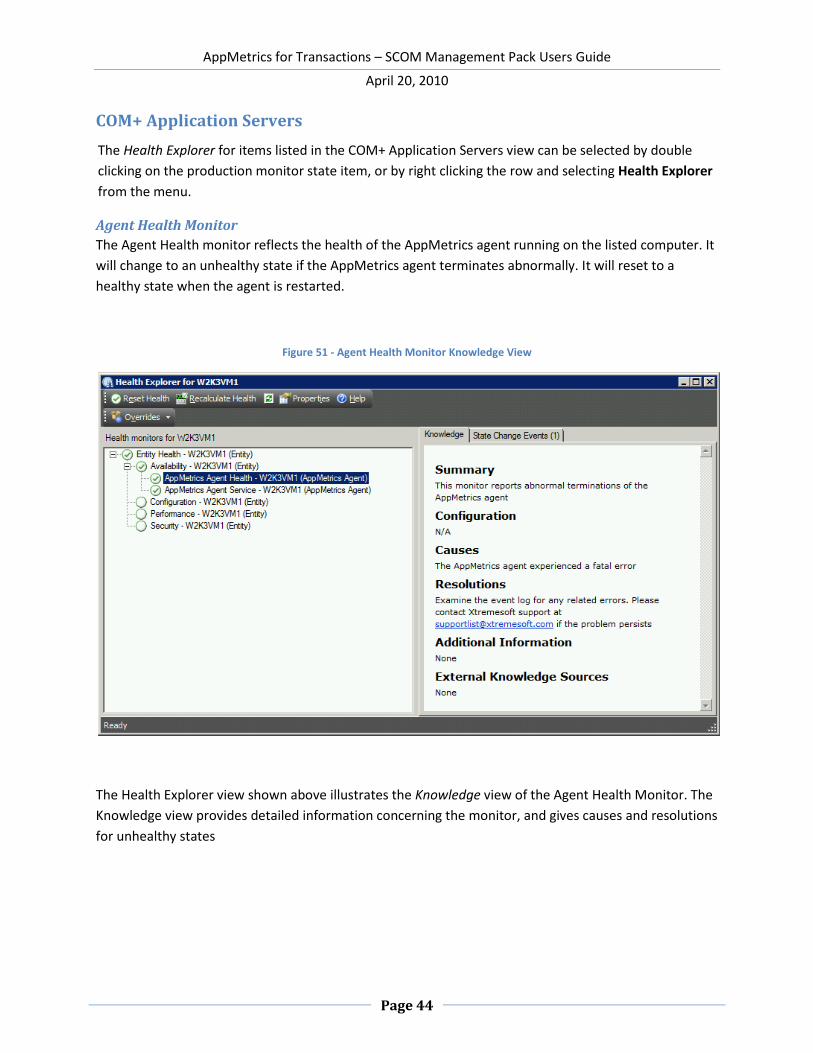
COM+ Application Servers
The Health Explorer for items listed in the COM+ Application Servers view can be selected by double
clicking on the production monitor state item, or by right clicking the row and selecting Health Explorer
from the menu.
Agent Health Monitor
The Agent Health monitor reflects the health of the AppMetrics agent running on the listed computer. It
will change to an unhealthy state if the AppMetrics agent terminates abnormally. It will reset to a
healthy state when the agent is restarted.
Figure 51 - Agent Health Monitor Knowledge View
The Health Explorer view shown above illustrates the Knowledge view of the Agent Health Monitor. The
Knowledge view provides detailed information concerning the monitor, and gives causes and resolutions
for unhealthy states
AppMetrics for Transactions – SCOM Management Pack Users Guide
April 20, 2010
Page 45
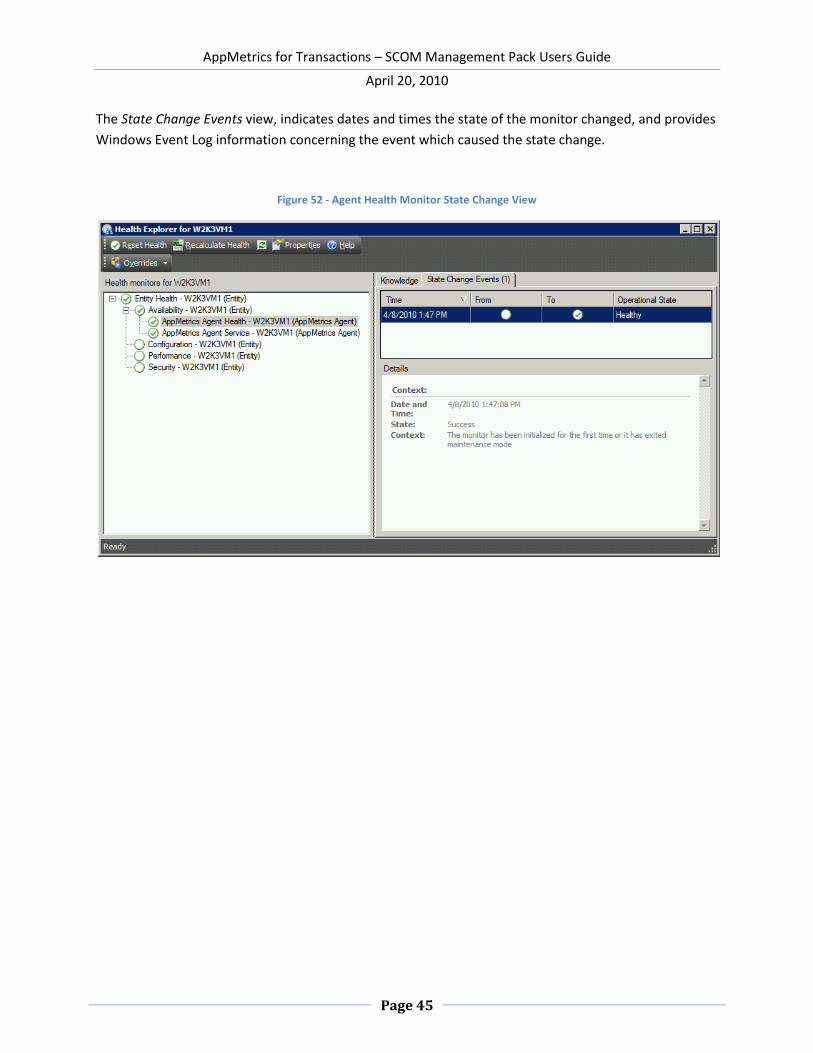
The State Change Events view, indicates dates and times the state of the monitor changed, and provides
Windows Event Log information concerning the event which caused the state change.
Figure 52 - Agent Health Monitor State Change View

AppMetrics for Transactions – SCOM Management Pack Users Guide
April 20, 2010
Page 46
Agent Service Monitor
The Agent Service Monitor reflects the state of the AppMetrics service on the computer hosting the
AppMetrics agent. It will automatically reset from an unhealthy state to a healthy state once the
AppMetrics service is started.
Figure 53 – Agent Service Monitor Knowledge View
The Health Explorer view shown above illustrates the Knowledge view of the Agent Service Monitor. The
Knowledge view provides detailed information concerning the monitor, and gives causes and resolutions
for unhealthy states
AppMetrics for Transactions – SCOM Management Pack Users Guide
April 20, 2010
Page 47
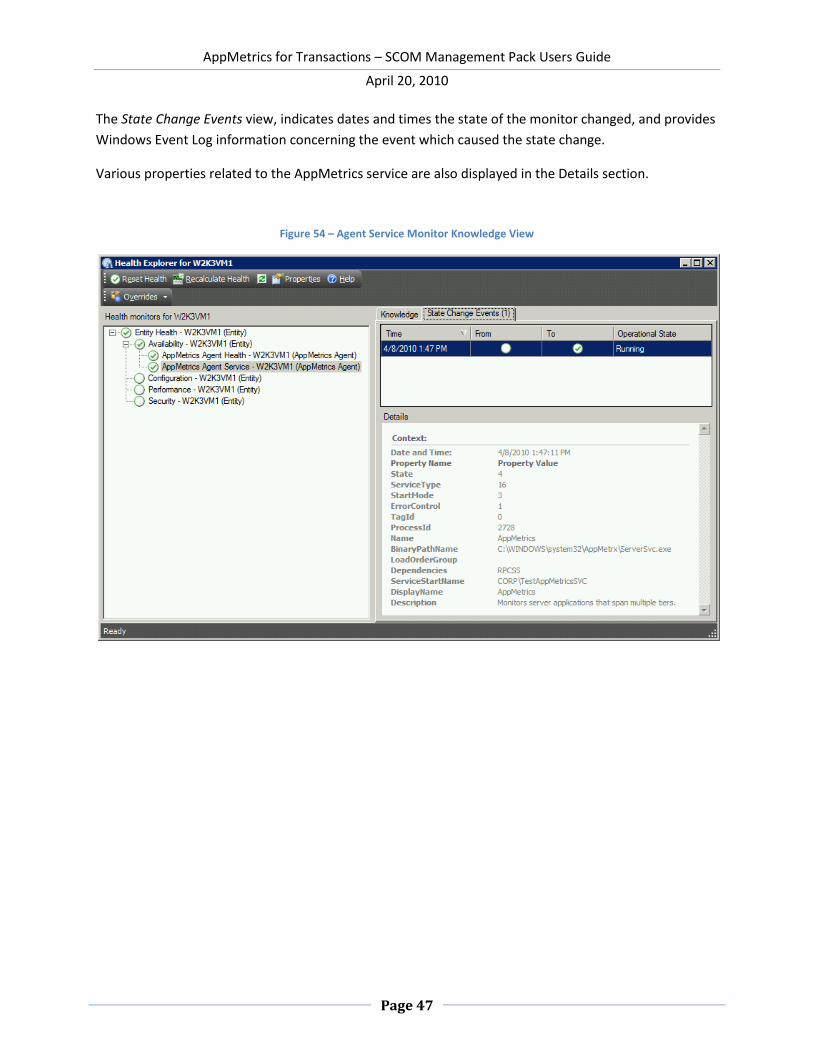
The State Change Events view, indicates dates and times the state of the monitor changed, and provides
Windows Event Log information concerning the event which caused the state change.
Various properties related to the AppMetrics service are also displayed in the Details section.
Figure 54 – Agent Service Monitor Knowledge View
AppMetrics for Transactions – SCOM Management Pack Users Guide
April 20, 2010
Page 48
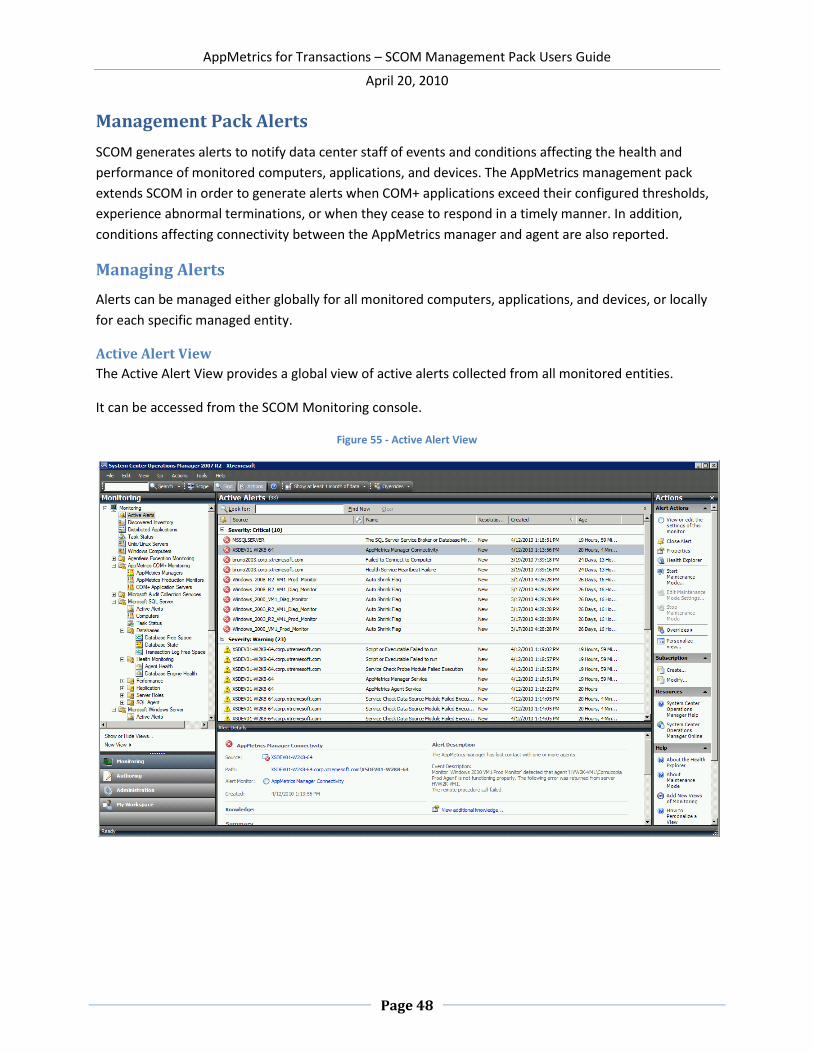
Management Pack Alerts
SCOM generates alerts to notify data center staff of events and conditions affecting the health and
performance of monitored computers, applications, and devices. The AppMetrics management pack
extends SCOM in order to generate alerts when COM+ applications exceed their configured thresholds,
experience abnormal terminations, or when they cease to respond in a timely manner. In addition,
conditions affecting connectivity between the AppMetrics manager and agent are also reported.
Managing Alerts
Alerts can be managed either globally for all monitored computers, applications, and devices, or locally
for each specific managed entity.
Active Alert View
The Active Alert View provides a global view of active alerts collected from all monitored entities.
It can be accessed from the SCOM Monitoring console.
Figure 55 - Active Alert View
AppMetrics for Transactions – SCOM Management Pack Users Guide
April 20, 2010
Page 49
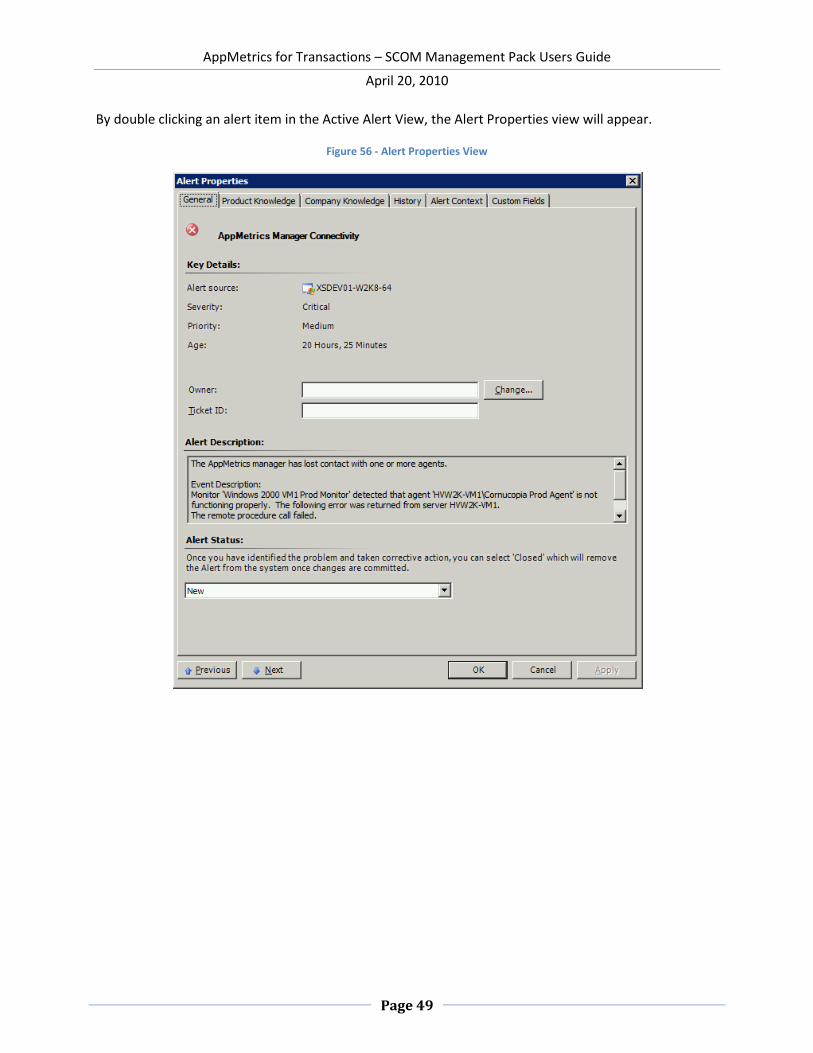
By double clicking an alert item in the Active Alert View, the Alert Properties view will appear.
Figure 56 - Alert Properties View

AppMetrics for Transactions – SCOM Management Pack Users Guide
April 20, 2010
Page 50
Additionally, the alert item may be further examined by right clicking on the item and selecting Open,
where various objects associated to the item may be opened, such as the related Health Explorer for
example.
Figure 57 - Health Explorer for Active Alert
AppMetrics for Transactions – SCOM Management Pack Users Guide
April 20, 2010
Page 51
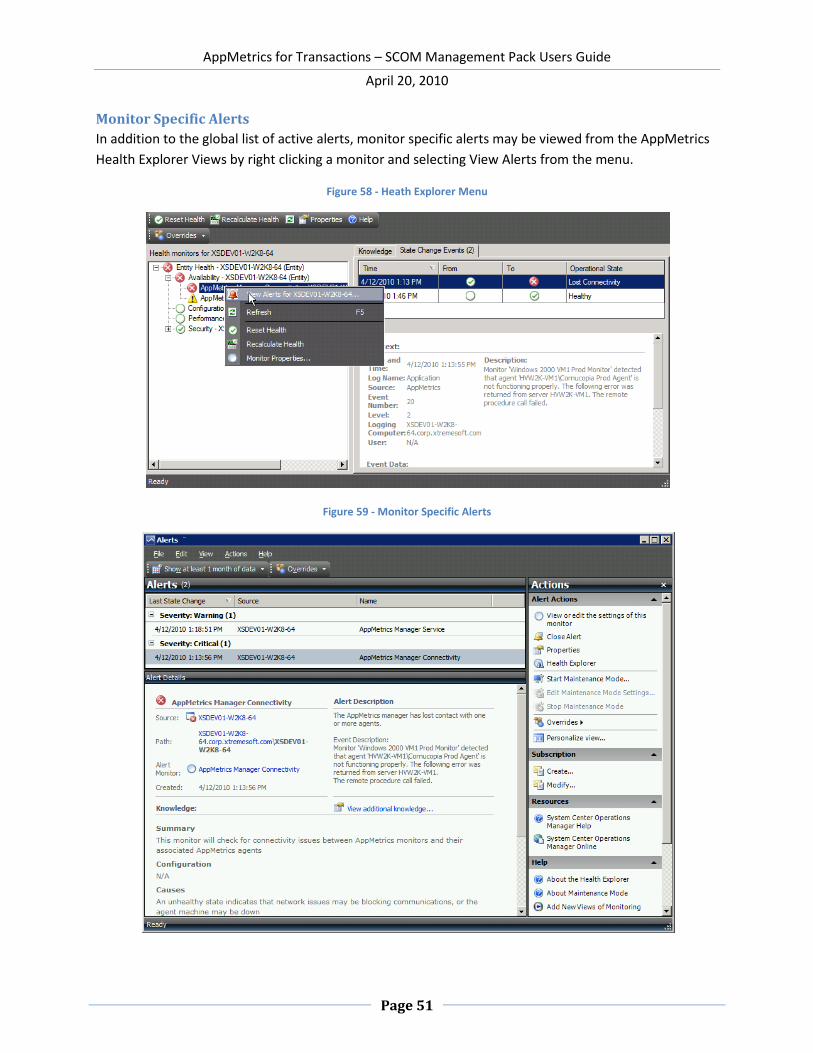
Monitor Specific Alerts
In addition to the global list of active alerts, monitor specific alerts may be viewed from the AppMetrics
Health Explorer Views by right clicking a monitor and selecting View Alerts from the menu.
Figure 58 - Heath Explorer Menu
Figure 59 - Monitor Specific Alerts
AppMetrics for Transactions – SCOM Management Pack Users Guide
April 20, 2010
Page 52
Examples
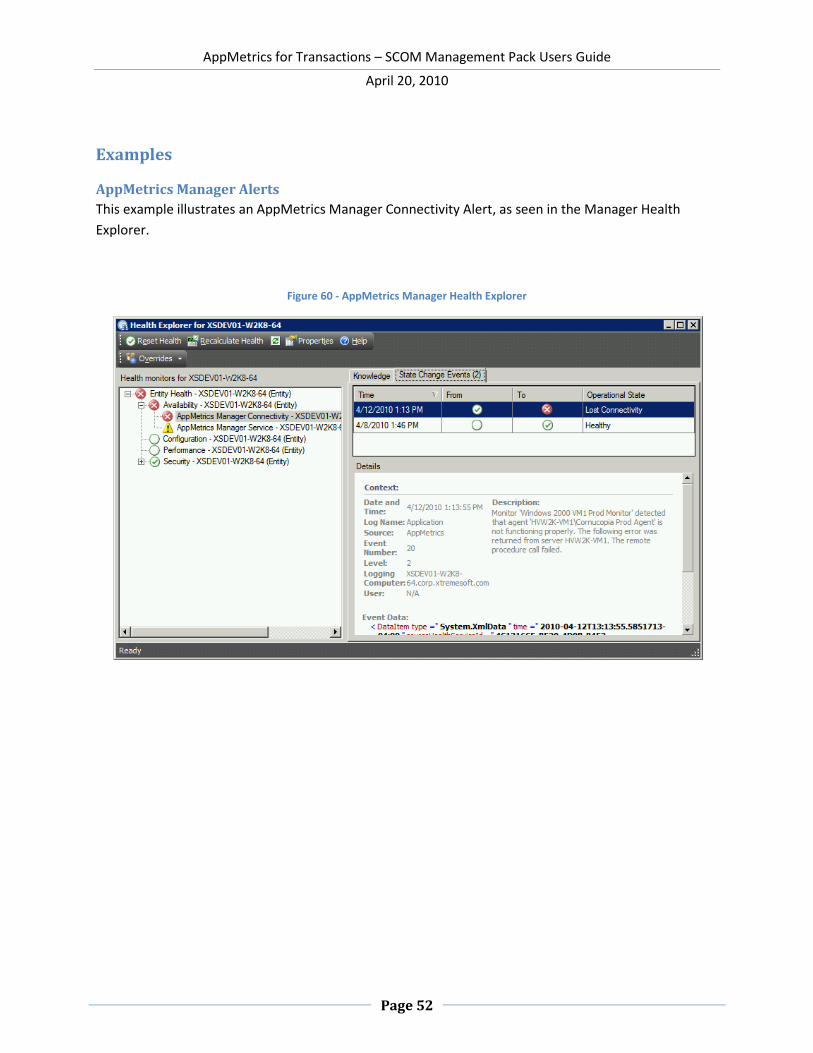
AppMetrics Manager Alerts
This example illustrates an AppMetrics Manager Connectivity Alert, as seen in the Manager Health
Explorer.
Figure 60 - AppMetrics Manager Health Explorer

AppMetrics for Transactions – SCOM Management Pack Users Guide
April 20, 2010
Page 53
Below is the Alert View for the Manager Connectivity Monitor.
Figure 61 - Connectivity Monitor Alert View
AppMetrics for Transactions – SCOM Management Pack Users Guide
April 20, 2010
Page 54
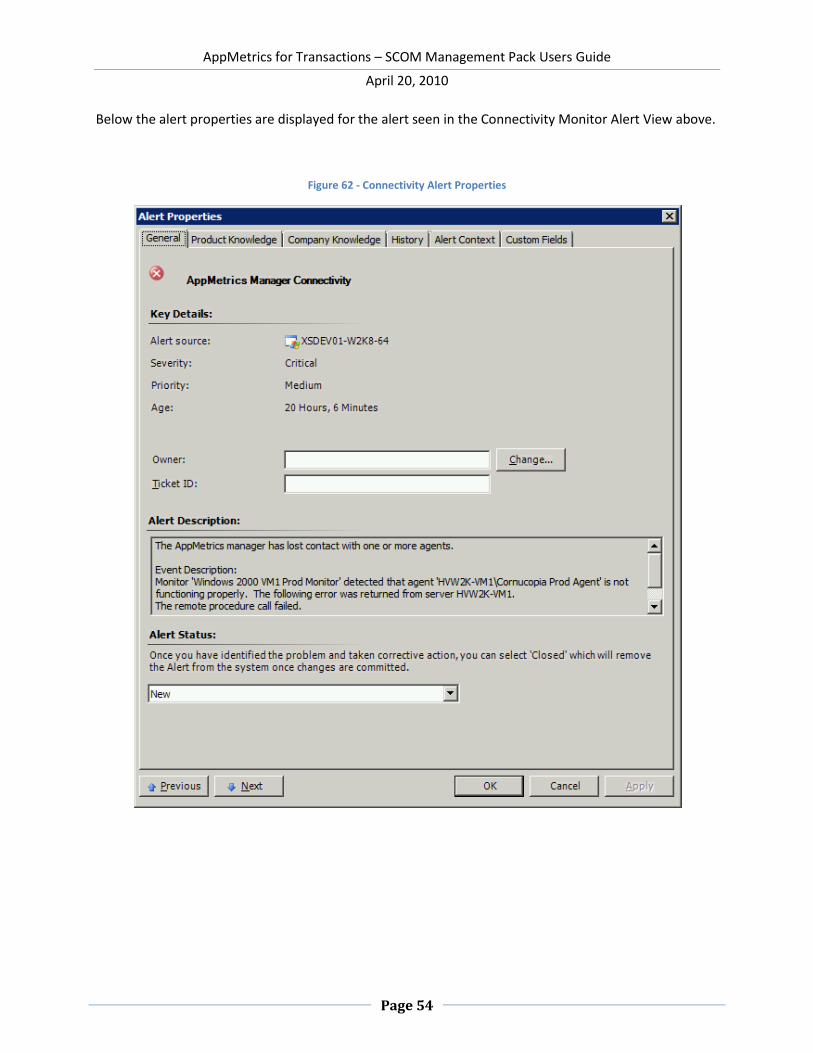
Below the alert properties are displayed for the alert seen in the Connectivity Monitor Alert View above.
Figure 62 - Connectivity Alert Properties

AppMetrics for Transactions – SCOM Management Pack Users Guide
April 20, 2010
Page 55
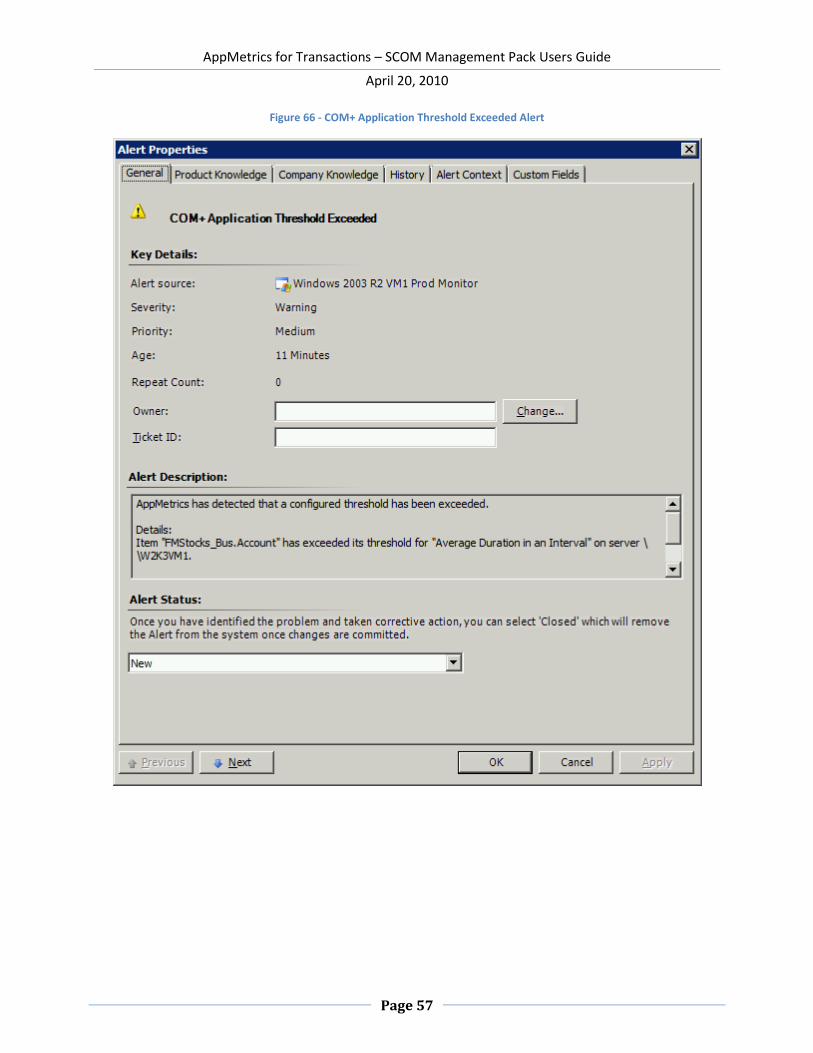
COM+ Application Alerts
Below is an example of COM+ Application alerts caused by a COM+ Threshold Exceeded condition and
Page Faults per Second exceeded condition.
Figure 63 - AppMetrics Production Monitors View with Warning State
Figure 64 - Health Explorer with COM+ Application Monitor Alert

AppMetrics for Transactions – SCOM Management Pack Users Guide
April 20, 2010
Page 56
Figure 65 - COM+ Application Alerts View
AppMetrics for Transactions – SCOM Management Pack Users Guide
April 20, 2010
Page 57
Figure 66 - COM+ Application Threshold Exceeded Alert

AppMetrics for Transactions – SCOM Management Pack Users Guide
April 20, 2010
Page 58
AppMetrics Agent Alerts
Below is an example of an AppMetrics Agent Service alert.
Figure 67 - COM+ Application Servers View Warning State
Figure 68 - COM+ Application Server Health Explorer View with Alert

AppMetrics for Transactions – SCOM Management Pack Users Guide
April 20, 2010
Page 59
Figure 69 - COM+ Application Server Alert View

AppMetrics for Transactions – SCOM Management Pack Users Guide
April 20, 2010
Page 60
Summary
AppMetrics and SCOM working together can efficiently monitor your COM+ and .Net Serviced
Component middle-tier applications, and provide a centralized view of your application’s performance
and status of all of those applications.
For further information or details, please contact Xtremesoft support at [email protected].
Related Documents