J. Appl. Geophys., Vol. 8, No. 1, pp. 63-82, March, 2009. APPLYING THE SEISMIC WAVE VELOCITY SURVEY IN THE ASSESSMENT OF PERMEABILITY COEFFICIENT (K), AT WADI AL-ASLAA AREA, JEDDAH, KINGDOM OF SAUDI ARABIA By Shokry M. M. F. Department of Geophysics, Faculty of Science, Ain Shams University, Cairo, Egypt Email: Mshokry_geoph @ yahoo.com ABSTRACT Seismic wave velocity, geological and geotechnical properties of the shallow ground layers at Wadi Al-Aslaa area were used integratiuely to study the permeability coefficient (K) and to evaluate the foundation layers occurred beneath the dam and lake construction at this area. The area is located at the northeastern part of Jeddah city, Kingdom of Saudi Arabia and undergoes construction phase. The stratigraphy of the site consists mainly of Precambrian Basement rocks in most parts of the area and by Miocene succession of conglomerates and sandstones at the northeastern parts of the area. The permeability coefficient (K) was estimated across the different sections of the study area. The obtained results of the permeability coefficient help in establishing the suitable percautions, which may taken into consideration during the dam and lake construction phases. INTRODUCTION The construction of a dam to retain water causes more interference with natural geplogic conditions than does any other civil engineering operation. Equally striking is the critically important function, that dams perform in storing water for domestic supply, for the generation of power, for flood control, for recreation, and for irrigation. Although the failures of civil engineering works are always of serious consequence, the failure of dams is possibly more serious than others, since they generally occur during periods of abnormal weather, often without warning, and almost always with disastrous results. Defects in foundation beds are an unfortunate factor in many dam failures, and another telling argument is thus presented to support the necessity of neglecting no single feature of foundation beds, that may possibly affect the dam resting upon them (Legget and Karrow, 1982). The record of failures of dams in succeeding years provides a useful if a somewhat melancholy study. Analysis of the causes of failures indicates fairly definitely that, the main reasons have been (1) failure to provide adequate spillway capacity, and (2) defective foundation bed conditions; these two factors have accounted for the majority of all recorded failures. The second

Welcome message from author
This document is posted to help you gain knowledge. Please leave a comment to let me know what you think about it! Share it to your friends and learn new things together.
Transcript
J. Appl. Geophys., Vol. 8, No. 1, pp. 63-82, March, 2009.
APPLYING THE SEISMIC WAVE VELOCITY SURVEY IN THE ASSESSMENT OF PERMEABILITY COEFFICIENT (K),
AT WADI AL-ASLAA AREA, JEDDAH, KINGDOM OF SAUDI ARABIA
By
Shokry M. M. F.
Department of Geophysics, Faculty of Science, Ain Shams University, Cairo, Egypt
Email: Mshokry_geoph @ yahoo.com
ABSTRACT
Seismic wave velocity, geological and geotechnical properties of the shallow
ground layers at Wadi Al-Aslaa area were used integratiuely to study the permeability
coefficient (K) and to evaluate the foundation layers occurred beneath the dam and lake
construction at this area. The area is located at the northeastern part of Jeddah city,
Kingdom of Saudi Arabia and undergoes construction phase. The stratigraphy of the
site consists mainly of Precambrian Basement rocks in most parts of the area and by
Miocene succession of conglomerates and sandstones at the northeastern parts of the
area. The permeability coefficient (K) was estimated across the different sections of the
study area. The obtained results of the permeability coefficient help in establishing the
suitable percautions, which may taken into consideration during the dam and lake
construction phases.
INTRODUCTION
The construction of a dam to retain
water causes more interference with
natural geplogic conditions than does
any other civil engineering operation.
Equally striking is the critically
important function, that dams perform
in storing water for domestic supply,
for the generation of power, for flood
control, for recreation, and for
irrigation. Although the failures of civil
engineering works are always of
serious consequence, the failure of
dams is possibly more serious than
others, since they generally occur
during periods of abnormal weather,
often without warning, and almost
always with disastrous results. Defects
in foundation beds are an unfortunate
factor in many dam failures, and
another telling argument is thus
presented to support the necessity of
neglecting no single feature of
foundation beds, that may possibly
affect the dam resting upon them
(Legget and Karrow, 1982).
The record of failures of dams in
succeeding years provides a useful if a
somewhat melancholy study. Analysis
of the causes of failures indicates fairly
definitely that, the main reasons have
been (1) failure to provide adequate
spillway capacity, and (2) defective
foundation bed conditions; these two
factors have accounted for the majority
of all recorded failures. The second

2
cause of failures noted is dependent
essentially on geologic features,
although the specific reason for failure
may vary from one case to another
(Legget and Karrow, 1982).
A dam is an artificial structure
erected to support a waterproof
membrane designed to retain water
above the level, that it normally
occupies at the site of the dam; suitable
provision is made for passing a certain
calculated flow of water past the dam,
through it, over it, or around it,
depending on the local circumstances.
The membrane may be, and generally
is, an integral part of the dam structure.
The type of dam to be constructed at
any location should be determined
mainly from geological considerations;
and the actual kind of dam to be
constructed. Once its general type has
been decided, will also be dependent to
some extent on the geologic conditions
affecting the supply of structural
materials (Legget and Karrow, 1982).
Since all dams retain water to a
certain predetermined level, the flow of
water in the watercourse being
regulated is seriously affected below
the dam site; the flow is generally
regulated to a more uniform discharge
than that given by the stream itself.
Some of the geological problems
affecting the reservoirs formed by
dams may be encountered also during
construction (Legget and Karrow,
1982).
Dams founded on pervious
foundations present their own special
problems, these problems are mainly
associated with the controlled flow of
water beneath the structure. It may not
be possible to make any dam
foundation absolutely tight, but the
slight leakage occuring with dams on
so called "impermeable" foundation
beds, although associated with uplift
pressure, is generally of no other
consequence. For those dams on
admittedly permeable foundation beds,
the exact nature of the flow of water
through the underlying strata is a vital
part of the design; thus, accurate
knowledge of the water carrying
properties of the unconsolidated
materials encountered becomes a
matter of importance (Legget and
Karrow, 1982).
Since the location of a proposed
dam will generally be restricted by
topographical, economic, and social
considerations, the areas to be
examined as possible sites will be fairly
well defined. Accurate geological
scetions along possible lines for the
dam will be a major requirement.
Geophysical methods can be of great
assistance in this work, when utilized
in connection with strategically placed
boreholes (Legget and Karrow, 1982).
Wadi Al-Aslaa area at Jeddah,
Kingdom of Saudi Arabia was selected
to was construct a dam with its lake to
solve many problems of the area, in
relation to the drainage system (Fig. 1).

3
Figure 1. Study area location using Google Earth Program.
PREVIOUS PRELIMINARY
WORKS
Since the location of a proposed
dam will generally be restricted by
topographical, economic and social
considerations, the area to be examined
as possible site will be fairly well
defined. Accurate geologic sections
and mapping along possible lines for
the dam area were accomplished to
interpret and define the geologic rock
units, and to detect the main faults and
lineaments (EGEC, 2006).
Geophysical methods have great
assistance when utilized in connection
with strategical placed boreholes. A
total of 13 compressional seismic
refraction profiles were conducted at
the study area to investigate a depth of
about 40 to 50 meters with a total
length of geophone spread is 120.0 m.
The profiles layout covered the
proposed dam and lake area (Fig. 2).
Also, the magnetic survey layout was
applied and designed to cover most of
the study area, in which the magnetic
survying is controlled by the
outcropping basement at the study area
(EGEC, 2006).
The seismic refraction profiles at
the study area illustrated (EGEC, 2006)
that, the shallow layers of the site
consist of a surface layer with P-wave
velocity ranging between 240 and 430
m/s and thickness ranging between 1.0
and 8.0 m. This layer corresponds to
Dam Location
Lake
Location
Study area
N 21o 44` 8``
N 21o 46` 30``
E 39o 21` 18`` E 39o 26` 6``
4
wadi sediments (Wadi fill) of silt-sand-
conglomerate. The second layer has a
P-wave velocity ranging between 790
and 1300 m/s and thickness ranging
between 2.0 and 30.0 m. This layer
corresponds to compacted and partially
saturated sands.
The third layer has a P-wave
velocity ranging between 1400 and
3300 m/s and thickness ranging
between 10.0 and 25.0 m. This layer
corresponds to a sandstone layer (low
velocity range between 1400 and 1800
m/s) at the dam area part, and
compacted sandstone and conglomerate
layer (high velocity ranges between
2300 and 3300) at the lake area part.
The bottom layer has a P-wave velocity
ranging between 3850 and 8700 m/s
and thickness of more than 10.0 m.
This layer corresponds to fractured
basements (low velocity range 3850
and 4000 m/s) and fresh basement
rocks (high velocity range 4800 and
8700 m/s) at different locations of the
study area.
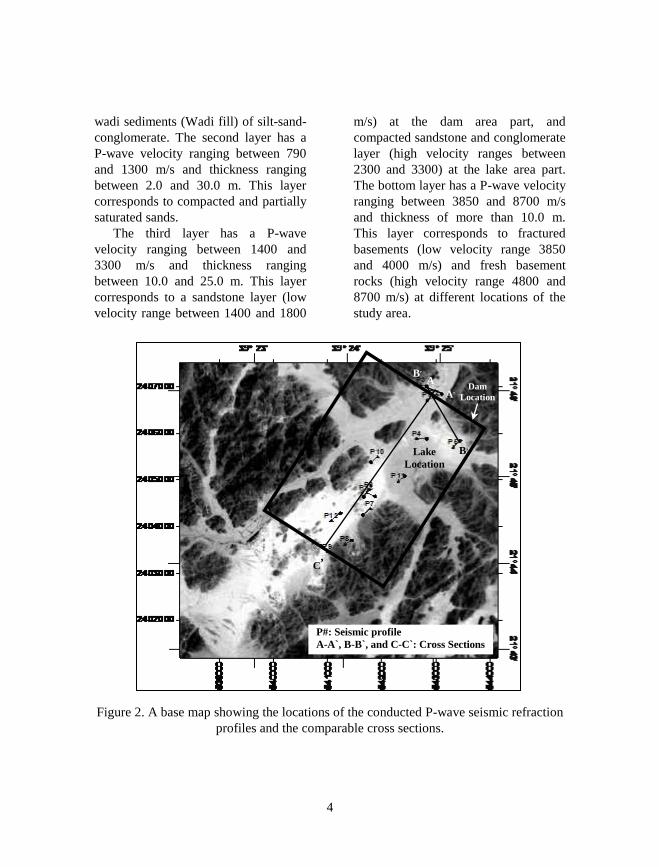
Figure 2. A base map showing the locations of the conducted P-wave seismic refraction
profiles and the comparable cross sections.
B,
C,
C B
A A,
Dam
Location
Lake
Location
P#: Seismic profile
A-A`, B-B`, and C-C`: Cross Sections
B,
J. Appl. Geophys., Vol. 8, No. 1, pp. 63-82, March, 2009.
Thirty two boreholes were drilled at
carefully selected locations at the area
of the dam and lake (the study area)
with depths ranged between 6.00 m and
35.00 m deep. The deep boreholes at
the location of the dam and lake but the
shallow boreholes at the location of the
other utilities. Seven were 35.00 m
deep, twenty one were 18.00 m deep,
one borehole was 10.00 m deep, one
borehole was 9.00 m deep, one
borehole was 7.00 m deep and one
borehole was 6.00 m deep (EGEC,
2006). The soil test borings were
drilled in accordance with the ASTM
D1586-84 (ASTM, 1989). The Unified
Soil Classification System (USCS)
(sited from Liu and Evett, 1992) and
other laboratory tests were carried out
on some of the extracted soil samples
to determine the physical and
mechanical properties of the various
encountered soil layers, according to
the ASTM standards (ASTM, 1989).
The drilled boreholes indicate that,
the near-surface and subsurface
sections consist of the following layers:
A surface layer composed of brown
silty sand. The fines recorded at this
layer are ranged between 9% and 28%.
The SPT results recorded through this
layer are ranged between 12 and 100.
This layer is encountered in all
boreholes starting from the ground
surface and extending down to a depth
varies from 2.5 to 7.0 m below the
ground surface i.e. with a thickness
ranged between 2.5 and 7.0 m.
A layer of highly fractured
sandstone with a mixture of gravel or
clay is occured at some depths and
locations. The measured Rock Quality
Designation (RQD) values for the
extracted samples of the sandstone
cores ranged between 16% and 70%,
indicating a very poor to fair quality
rock nature. This layer is recorded
below the surface layer at depths
ranged between 2.5 and 7.0 m, and
extended to the end of the borehole
depths.
The records made available from
preliminary site studies enable those in
charge of the engineering work to
decide the general type of dam to be
used and to begin their economic and
design studies (Legget and Karrow,
1982).
The geological, geophysical and
geotechnical data are used together to
correlate and integrate each other to
estimate the changing and
heterogeneity of permeability
coefficient (K) through the different
rock units appeared and exposed at the
study area, according to the above
mentioned studies.
GEOLOGICAL MAPPING OF
THE STUDY AREA
The study area is bounded by
latitudes 21º 42
' 29.30
" and 21
º 47
', and
longitudes 39º 20
' and 39
º 28
', at the
northeastern part of Jeddah city,
Kingdom of Saudi Arabia. The mapped
area is covered mainly by Precambrian
Basement rocks in most parts and by
Miocene sedimentary succession of
conglomerates and sandstones in the

6
northeastern part. Detailed field studies
indicate the presence of eight rock units
together with the wadi sediments.
These rock units can be summarized
and arranged form older to younger as
follows (Table 1) and (Fig. 3) (EGEC,
2006):
Table 1. Rock units in the study area, from older to younger.
Rock Unit Location Lithology
The Basic and
Intermediate
Volcanics Unit
Northwestern Part
Highly fractured slightly metamorphosed
basalts, less abundant andesites, with
subordinate andesitic volcaniclastics.
The Gabbro Unit Northwestern and
Southern Parts
Massive medium to coarse-grained gabbros.
Some exposures are slightly metamorphosed
and others are composed of layered gabbros.
The Quartz Diorite
Unit
Eastern and
Central Parts
Massive to weakly foliated medium- to
coarse-grained quartz diorite with
subordinate amounts of diorite.
The Tonalite Unit Southeastern Part Hornblende tonalite.
The Granodiorite Unit Central Part Hornblende granodiorite to biotite
monzogranite.
The Pink Granite Unit Eastern Central
Part
Coarse grained, equigranular and massive
granite of pink color.
The Younger Dykes Basaltic composition
The Conglomerates
and Sandstone Unit
Northern and
Northeastern Parts
Thick layers of slightly lithified, highly
friable and poorly sorted conglomerates,
intercalated with thin layers of slightly to
moderately lithified fine grained sandstones
and shales, attaining an exposed thickness of
about 40 m.
The Wadi Sediments
Unit
Cover the Wadi
floors.
Fine to medium grained unconsolidated
sands.
The Quartz Diorite Unit represents
the main rock unit in the area under
consideration and constitutes about
60% of the surface area of the total
rocks.
The Conglomerates and Sandstone
Unit show great heterogeneity. The
constituent pebbles are greatly variable
in grain size, reaching up to 80 cm in
diameter. The conglomerate pebbles
are mostly angular and consist of
different rock varieties; all of them are
from the Precambrian Basement rocks
(plutonic and volcanic varieties) and
mainly consist of quartz diorite and
granodiorite together with basalts and
andesites. The conglomerate matrix
consists of fine to medium-grained
sands. The sandstone layers are usually
thin and not exceeding 30 cm in
thickness. In general, the rocks are
highly weathered and almost all

7
exposures are covered with the
weathering products, where the fine-
grained materials are weathered out
and the conglomerate boulders are left
behind covering the outcrop surfaces.
Figure 3. Geologic map of the study area (after EGEC, 2006).
STRUCTURAL FEATURES OF
THE STUDY AREA
The Conglomerates and Sandstone
Unit is in structural contact against the
Precambrian Basement rocks along a
master normal fault, that has a NW-SE
trend and downthrown towards the NE.
This unit is affected by a probable fault
along Wadi Shaib Al Burayqah of N-S
trend, as evidenced by the linear
occurrence of the exposures of the
rocks along the wadi.
A large number of faults, mainly
along the NE-SW trend, affect the
Precambrian Basement rocks. Few
faults are trending NW-SE. The most
important of these faults (EGEC, 2006)
(Fig. 1) are:
A major thrust fault running
parallel to Wadi El Maray, along
the NE-SW trend and cutting
through the quartz diorites
throughout along most of its
length. This thrust can be
considered as a master fault in the
region northeast of Jeddah city as a
whole, as it extends southwest of
the study area for a distance of
about 30 km.
A strike slip fault located in the
southern part of the mapped area
cutting through the quartz diorite
and the pink granite. The fault has
Dam Location
Lake
Location

8
a NE-SW direction and a small left
lateral displacement.
A normal fault controls the eastern
side of Wadi El Maray in the
central part of the mapped area,
cutting through the quartz diorite
along the NE-SW direction.
PERMEABILITY OF BEDROCK
One of the essential requirements,
of a rock foundation bed for a dam is
that, the entire geological structure
underlying the site of the dam, in
addition to being strong enough to
carry the designed loads, will be sound
enough to provide a watertight barrier
to the water impounded by the dam.
The first reason for having rock strata
underlying the dam, as watertight as
possible, is obviously to make sure
that, no water escapes. Not only is this
necessary from the point of view of
water conservation, but it is also
essential because any steady flow
through a solid rock formation is
certain to have some erosive action,
which in all the probabilities will
gradually but steady intensify the
defective conditions causing the
original leakage (Legget and Karrow,
1982).
Naturally, the limestone and all soft
rocks are suspect until proved to be
sound, limestone formations, especially
are unusually soluble and so
characterized by underground caverns
or open fissures. Although limestone
causes most of the geological troubles
in foundations, it was a shale and
sandstone combination, that presented
one of the most unusual examples
known to the writers of a permeable
foundation bed for a dam (Legget and
Karrow, 1982).
It will be clear that, the presence of
water in rock foundation beds for
dams, and the possibility of flow
through such bedrock, is a complex
matter, just as complex as is the
variation of geological conditions that
may be encountered. Accordingly, in
addition to study of all relevant
geological information, including the
detailed results of all boring, tests
should be carried out whenever
possible by means of the boreholes
used for obtaining core samples
(Legget and Karrow, 1982).
PERMEABILITY COEFFICIENT
(K) ESTIMATION STRATEGY
FROM SEISMIC VELOCITY
DATA
The basic parameter defining the
flow of ground water, and the
distribution of water pressure, in
geologic media is permeability
coefficient (hydraulic conductivity).
This parameter relates the flow rate of
water through the material to the
pressure gradient applied across it
(Scheidegger, 1960; Morgenstern,
1971).
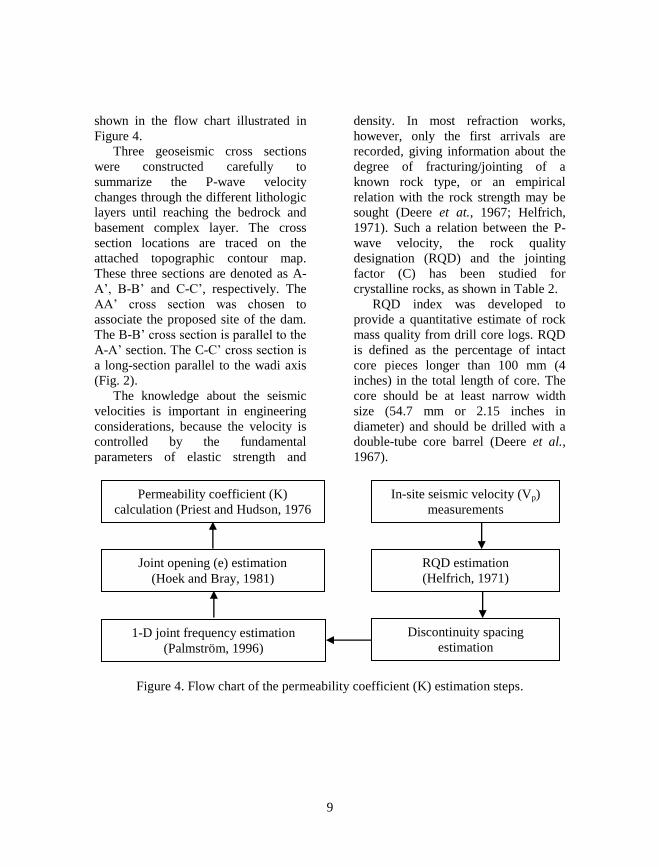
The different steps required to
estimate the permeability coefficient
(K) from seismic velocity (Vp) is
9
shown in the flow chart illustrated in
Figure 4.
Three geoseismic cross sections
were constructed carefully to
summarize the P-wave velocity
changes through the different lithologic
layers until reaching the bedrock and
basement complex layer. The cross
section locations are traced on the
attached topographic contour map.
These three sections are denoted as A-
A’, B-B’ and C-C’, respectively. The
AA’ cross section was chosen to
associate the proposed site of the dam.
The B-B’ cross section is parallel to the
A-A’ section. The C-C’ cross section is
a long-section parallel to the wadi axis
(Fig. 2).
The knowledge about the seismic
velocities is important in engineering
considerations, because the velocity is
controlled by the fundamental
parameters of elastic strength and
density. In most refraction works,
however, only the first arrivals are
recorded, giving information about the
degree of fracturing/jointing of a
known rock type, or an empirical
relation with the rock strength may be
sought (Deere et at., 1967; Helfrich,
1971). Such a relation between the P-
wave velocity, the rock quality
designation (RQD) and the jointing
factor (C) has been studied for
crystalline rocks, as shown in Table 2.
RQD index was developed to
provide a quantitative estimate of rock
mass quality from drill core logs. RQD
is defined as the percentage of intact
core pieces longer than 100 mm (4
inches) in the total length of core. The
core should be at least narrow width
size (54.7 mm or 2.15 inches in
diameter) and should be drilled with a
double-tube core barrel (Deere et al.,
1967).
Figure 4. Flow chart of the permeability coefficient (K) estimation steps.
In-site seismic velocity (Vp)
measurements
RQD estimation
(Helfrich, 1971)
Discontinuity spacing
estimation
(Vardakos, 2004)
1-D joint frequency estimation
(Palmström, 1996)
Joint opening (e) estimation
(Hoek and Bray, 1981)
Permeability coefficient (K)
calculation (Priest and Hudson, 1976

10
Table 2. Empirical relationship between jointing factor (C), seismic velocity (Vp) and
the rock quality designation (RQD) of crystalline rocks (after Helfrich, 1971).
Degree of separation
(after Helfrich, 1971) RQD value (%)
(after Deere et al
1967) C Vp (m/sec)
RQD
classification
Rock without joints 0.65-1.00 >4500 Excellent 90-100
Rock with few joints 0.45-0.65 4000-4500 Good 75-90
Rock with joints 0.30-0.45 3500-4000 Fair 50-75
Rock with numerous joints 0.15-0.30 3000-3500 Poor 25-50
Strongly jointed rock 0.00-0.15 <3000 Very poor 0-25
Figure 5 displays the relation
between discontinuity spacing and
RQD, to estimate the discontinuity
spacing when the data regarding
discontinuity spacing are not available
(Vardakos, 2004).
Figure 5. RQD-discontinuity spacing correlation (after Priest and Hudson, 1976).
A considerable amount of
experience has been gained from more
than 30 years of seismic refraction
surveys in Scandinavia. Sjögren et al.
Average Line
Dashed & open areas are
combined RQD and spacing
rating for different regions
11
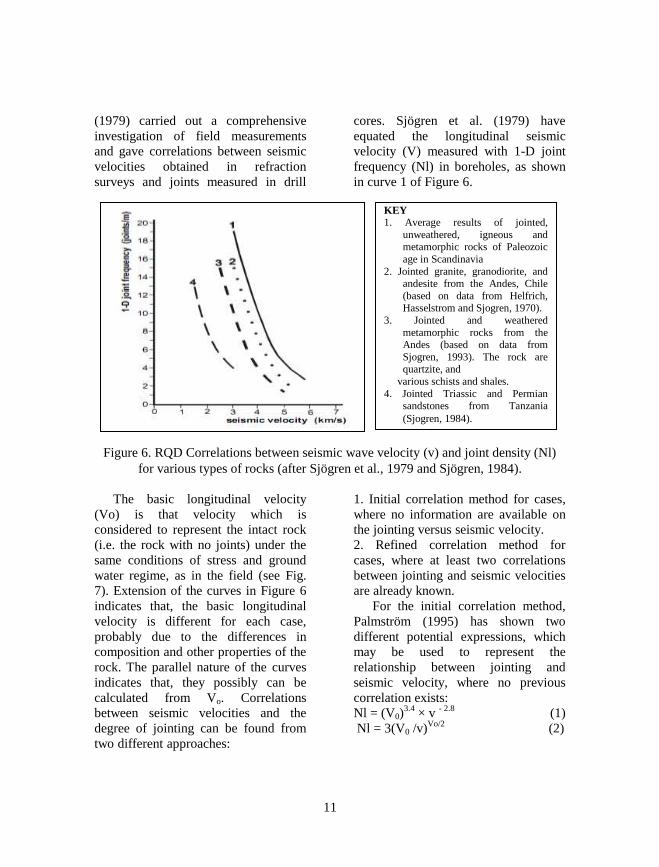
(1979) carried out a comprehensive
investigation of field measurements
and gave correlations between seismic
velocities obtained in refraction
surveys and joints measured in drill
cores. Sjögren et al. (1979) have
equated the longitudinal seismic
velocity (V) measured with 1-D joint
frequency (Nl) in boreholes, as shown
in curve 1 of Figure 6.
Figure 6. RQD Correlations between seismic wave velocity (v) and joint density (Nl)
for various types of rocks (after Sjögren et al., 1979 and Sjögren, 1984).
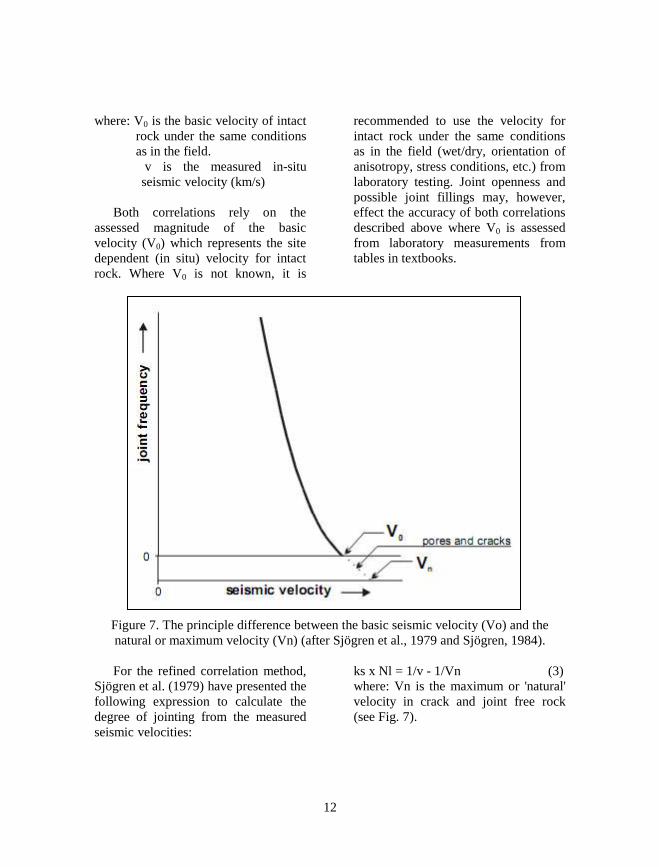
The basic longitudinal velocity
(Vo) is that velocity which is
considered to represent the intact rock
(i.e. the rock with no joints) under the
same conditions of stress and ground
water regime, as in the field (see Fig.
7). Extension of the curves in Figure 6
indicates that, the basic longitudinal
velocity is different for each case,
probably due to the differences in
composition and other properties of the
rock. The parallel nature of the curves
indicates that, they possibly can be
calculated from Vo. Correlations
between seismic velocities and the
degree of jointing can be found from
two different approaches:
1. Initial correlation method for cases,
where no information are available on
the jointing versus seismic velocity.
2. Refined correlation method for
cases, where at least two correlations
between jointing and seismic velocities
are already known.
For the initial correlation method,
Palmström (1995) has shown two
different potential expressions, which
may be used to represent the
relationship between jointing and
seismic velocity, where no previous
correlation exists:
Nl = (V0)3.4
× v - 2.8
(1)
Nl = 3(V0 /v)Vo/2
(2)
KEY 1. Average results of jointed,
unweathered, igneous and metamorphic rocks of Paleozoic
age in Scandinavia
2. Jointed granite, granodiorite, and andesite from the Andes, Chile
(based on data from Helfrich, Hasselstrom and Sjogren, 1970).
3. Jointed and weathered
metamorphic rocks from the Andes (based on data from
Sjogren, 1993). The rock are quartzite, and
various schists and shales.
4. Jointed Triassic and Permian sandstones from Tanzania
(Sjogren, 1984).
12
where: V0 is the basic velocity of intact
rock under the same conditions
as in the field.
v is the measured in-situ
seismic velocity (km/s)
Both correlations rely on the
assessed magnitude of the basic
velocity (V0) which represents the site
dependent (in situ) velocity for intact
rock. Where V0 is not known, it is
recommended to use the velocity for
intact rock under the same conditions
as in the field (wet/dry, orientation of
anisotropy, stress conditions, etc.) from
laboratory testing. Joint openness and
possible joint fillings may, however,
effect the accuracy of both correlations
described above where V0 is assessed
from laboratory measurements from
tables in textbooks.
Figure 7. The principle difference between the basic seismic velocity (Vo) and the
natural or maximum velocity (Vn) (after Sjögren et al., 1979 and Sjögren, 1984).
For the refined correlation method,
Sjögren et al. (1979) have presented the
following expression to calculate the
degree of jointing from the measured
seismic velocities:
ks x Nl = 1/v - 1/Vn (3)
where: Vn is the maximum or 'natural'
velocity in crack and joint free rock
(see Fig. 7).
13
ks is a constant representing
the actual in-situ conditions.
Nl is the 1-D joint frequency
(joints/m) along a drill core or scan
line.
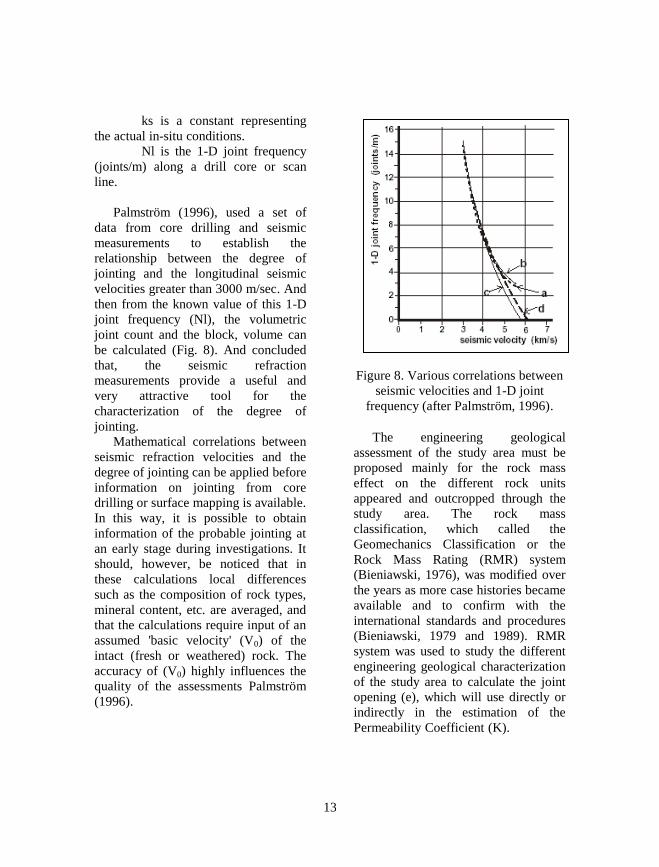
Palmström (1996), used a set of
data from core drilling and seismic
measurements to establish the
relationship between the degree of
jointing and the longitudinal seismic
velocities greater than 3000 m/sec. And
then from the known value of this 1-D
joint frequency (Nl), the volumetric
joint count and the block, volume can
be calculated (Fig. 8). And concluded
that, the seismic refraction
measurements provide a useful and
very attractive tool for the
characterization of the degree of
jointing.
Mathematical correlations between
seismic refraction velocities and the
degree of jointing can be applied before
information on jointing from core
drilling or surface mapping is available.
In this way, it is possible to obtain
information of the probable jointing at
an early stage during investigations. It
should, however, be noticed that in
these calculations local differences
such as the composition of rock types,
mineral content, etc. are averaged, and
that the calculations require input of an
assumed 'basic velocity' (V0) of the
intact (fresh or weathered) rock. The
accuracy of (V0) highly influences the
quality of the assessments Palmström
(1996).
Figure 8. Various correlations between
seismic velocities and 1-D joint
frequency (after Palmström, 1996).
The engineering geological
assessment of the study area must be
proposed mainly for the rock mass
effect on the different rock units
appeared and outcropped through the
study area. The rock mass
classification, which called the
Geomechanics Classification or the
Rock Mass Rating (RMR) system
(Bieniawski, 1976), was modified over
the years as more case histories became
available and to confirm with the
international standards and procedures
(Bieniawski, 1979 and 1989). RMR
system was used to study the different
engineering geological characterization
of the study area to calculate the joint
opening (e), which will use directly or
indirectly in the estimation of the
Permeability Coefficient (K).
14
Twenty stations are located in the
project area, taking in consideration the
proposed dam site and its future lake,
where possible changes in the
engineering properties of the
surrounding rock masses could be
expected. In each of these stations, the
technical investigations and
characterization of the rock masses and
rock materials were carried out (EGEC,
2006).
The engineering geological
investigations and rock mechanics
studies on the study area mainly
include discontinuity surveying,
sampling and laboratory tests. As the
joint system and its engineering
properties control the propagation, flow
and movement of the water in the rock
mass, a special attention should be
given to the study of the characteristics
of the joint systems. These
discontinuities will be primarily
responsible for the permeability of the
available rock masses, that decreases
with increasing depth. A joint analysis
was carried out at each station on the
available rock masses in the site
including orientation, spacing,
persistence, roughness, aperture and
filling, in order to make quantitative
description of the discontinuities to be
used in the geomechanics classification
(RMR) for most rock units distributed
along the Wadi (EGEC, 2006).
These five parameters are the main
factors utilized to classify a rock mass
using the RMR system (Geomechanics
classification), a. Uniaxial compressive
strength of rock material, b. Rock
quality designation, c. Spacing of
discontinuities, d. Conditions of
discontinuities and, e. Ground water
conditions. The classification
parameters, their ratings, guidelines for
classification of discontinuity
conditions and rock mass classes
determined from total ratings can be
summarized in Table 3.
The rock masses in the studied area
vary in their engineering characteristics
from a location to the other one and
from a rock unit to the other one. The
RMR of the rock masses are ranging
between fair rock quality (class III) to
good rock quality (class II) and the
measured field data can be summarized
in Table 4. The recorded joints across
the study area displayed the
occurrences of fractures with average
aperture is 15 mm filled with soft
weathering materials (EGEC, 2006).
In most rock types flow through
intact rock is negligible (defined by
Kprimary), and essentially all flow occurs
along the discontinuities (defined by
Ksecondary). The term secondary
hydraulic conductivity refers to flow in
the rock mass and encompasses flow in
both the intact rock and any
discontinuities that are present. These
conditions result in secondary
hydraulic conductivities having a wide
range of values depending on the
persistence, width and infilling
characteristics of the discontinuities
(Wyllie, D. C. and Christopher, 2004).
According to Darcy`s law, the
permeability coefficient (hydraulic
conductivity coefficient) K is defined
as:

15
)()(2121
hh
Vl
hhA
QlK
(4)
Considering a cylindrical sample of
soil or rock beneath the water table in a
slope. The sample has a cross-sectional
area of (A) and length (l). Water levels
in boreholes at either end of this
sample are at heights (h1) and (h2)
above a reference datum and the
quantity of water flowing through the
sample in a unit of time is Q with the
discharge velocity (V). The substitution
of dimensions for the terms in equation
(4) shows that the parameter (K) has
the same dimensions as the discharge
velocity (V), that is length per unit
time. The units most commonly used in
ground water studies is centimeters per
second (Wyllie, D. C. and Christopher,
2004).
The equivalent permabilities
coefficient (K) of a parallel array of
cracks with different openings are
plotted in Figure (9) which shows that,
the permeability of a rock mass is very
sensitive to the opening of
discontinuities (Hoek and Bray, 1981).
Since these opening changes with
stress, the permeability of a rock mass
will therefore be sensitive to stress.
Table 3. Rock Mass Rating System, (after Bieniawski, 1989).
a. Classification parameters and their ratings
Parameter Range of values
1
Strength of intact
rock
material
Point-load strength index
> 10 MPa
4-10 MPa
2-4 MPa
1-2 MPa
For this low range
uniaxial compressive
test is preferred
Uniaxial comp.
strength
> 250
MPa
100-250
MPa
50-100
MPa
25-50
MPa
5-25
MPa
1-5
MPa
< 1
MPa
Rating 15 12 7 4 2 1 0
2 Drill core Quality RQD (%) 90-100 75-90 50-75 25-50 < 25
Rating 20 17 13 8 3
3 Spacing of discontinuities (mm) > 2000 600-2000 200-600 60-200 > 60
Rating 20 15 10 8 5
4
Condition of dicontinuities (See c)
I II III IV V
Rating 30 25 20 10 0
5
Ground
water
Inflow per 10 m tunnel length (l/m)
None < 10 10-25 25-125 > 125
(Joint water press)/
(Major principle ) O < 0.1 0.1-0.2 0.2-0.5 > 0.5
General conditions Dry Damp Wet Dipping Flowing
Rating 15 10 7 4 0
I: Very rough surface, not continuous, no separation, unweathered wall rock. II: Slightly rough, surfaces separation < 1 mm, slightly weathered walls.
III: Slightly rough, surfaces separation < 1 mm, highly weathered walls. IV: Slickensided surfaces or Gouge < 5 mm thick or separation 1-5 mm continous.
V: Soft gouge > 5 mm thick or separation > 5 mm continous.

16
b. Rock mass classes determined from total ratings
Rating 100 – 81 80 – 61 60 – 41 40 – 21 < 21
Class number I II III IV V
Description V. good rock Good rock Fair rock Poor rock V. poor rock
c. Guidelines for classification of discontinuity conditions
Dictontinuity length
(persistence)
Rating
< 1 m
6
1-3 m
4
3-10 m
2
10-20 m
1
> 20 m
0
Separation (aperture)
Rating
None
6
< 0.1 mm
5
0.1-1.0 mm
4
1-5 mm
1
> 5 mm
0
Roughness
Rating
Very rough
6
Rough
5
Slighty rough
3
Smooth
1
Slickensided
0
Infilling (gouge)
Rating
None
6
HF < 5 mm
4
HF > 5 mm
2
SF < 5 mm
2
SF > 5 mm
0
Weathering
Ratings
Unweatherd 6
SW 5
MW 3
HW 1
Decomposed 0
HF: Hard filling, SF: Soft filling, SW: Slightly weathered, MW: Moderately weathered, HW: Highly weathered
Table 4. Rock Mass Rating analysis of the various rock units in the study area.
Parameters
Basic and
intermediate
unit
Gabbro
unit
Quartz
diorite
unit
Granodiorite
unit
Conglomerate
& sandstone
unit
PLSI (MPa) Value 31-32 6-22 6-23 6 3
Rating 15 12-15 12-15 12 7
RQD (%) Value 33-40 23-66 22-77 36-43 81
Rating 8 3-13 3-17 8 17
SD (mm) Value 10-60 10-60 10-60 10-20 60-150
Rating 8-10 8-10 8-10 8 15
CD Rating 0-10 3-17 10-17 5-10 15
Ground
water
Value Completely dry
Rating 15 15 15 15 15
RMR 46-58 41-70 48-74 48-53 69
Class number III III-II III-II III II
Description Fair Rock
Good-
Fair
rock
Good-
Fair rock Fair Rock Good Rock
PLSI: Point Load Strength Index, SD: Spacing of discontinuity, CD: Condition of discontinuity

17
Figure 9. Influence of joint opening (e) and joint spacing (b) on the permeability
coefficient (K) in the direction of a set of smooth parallel points in a rock mass (after
Hoek and Bray, 1981).
By applying the above mentioned
steps, the Permeability Coefficient (k)
is estimated for the different rock units
appeared through the seismic velocity
sections (Table 5) and plotted on these
sections (Figs 10, 11, and 12).
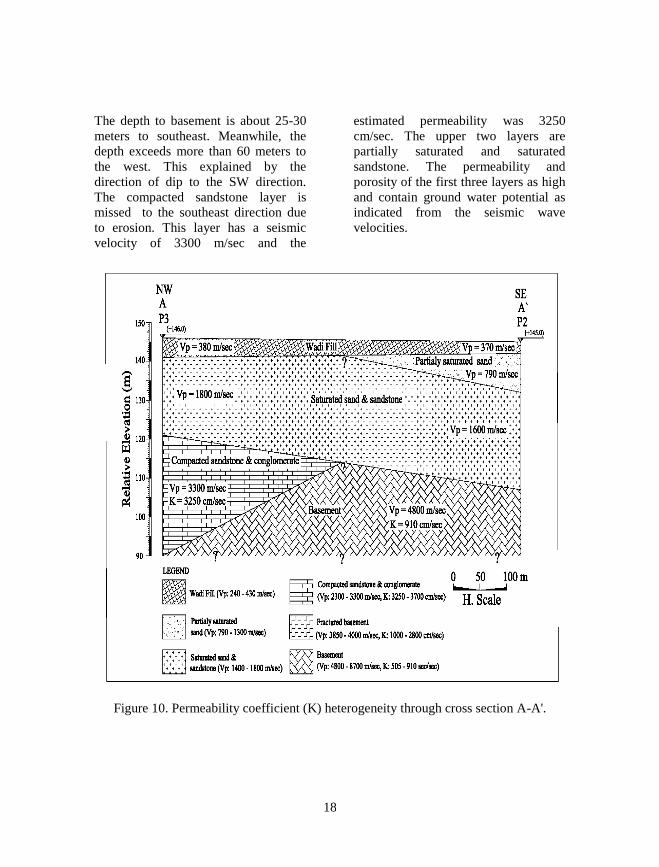
The cross section A-A` shows a
clear difference in the basement depth
from NW and SE. The eastern part of
the dam site characterized by a shallow
depth of a basement rocks with a
seismic velocity of 4800 m/s and
permeability coefficient of 910 cm/sec
which reflects a relatively fracture
intensity and weathering action. The
contact between the basement rocks
and compact sandstone can be
explained by the erosion paleo-surface.
10-6
0.001 0.005 0.01 0.05 0.1
Joint opening e - cms
10-8
10-7
10-5
10-4
10-3
10-2
10-1
1.0
10
Perm
eab
ility co
efficient K
– cm
/sec
A
B
C
A: 100 joints/meter
B: 10 joints/meter
C: 1 joint/meter
18
The depth to basement is about 25-30
meters to southeast. Meanwhile, the
depth exceeds more than 60 meters to
the west. This explained by the
direction of dip to the SW direction.
The compacted sandstone layer is
missed to the southeast direction due
to erosion. This layer has a seismic
velocity of 3300 m/sec and the
estimated permeability was 3250
cm/sec. The upper two layers are
partially saturated and saturated
sandstone. The permeability and
porosity of the first three layers as high
and contain ground water potential as
indicated from the seismic wave
velocities.
Figure 10. Permeability coefficient (K) heterogeneity through cross section A-A'.

19
Figure 11. Permeability coefficient (K) heterogeneity through cross section B-B'.
Figure 12. Permeability coefficient (K) heterogenity through cross section C-C'.
20
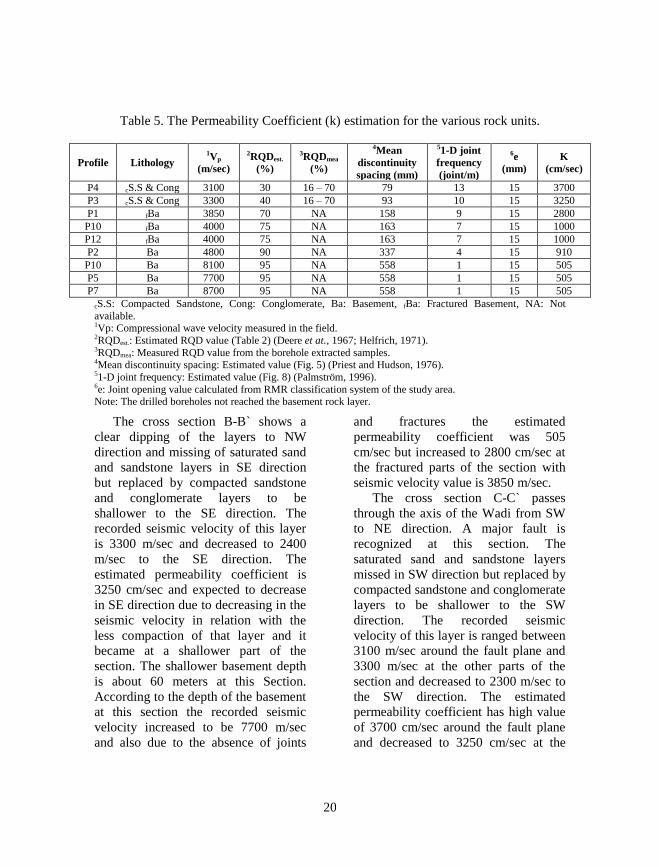
Table 5. The Permeability Coefficient (k) estimation for the various rock units.
Profile Lithology 1Vp
(m/sec)
2RQDest.
(%)
3RQDmea
(%)
4Mean
discontinuity
spacing (mm)
51-D joint
frequency
(joint/m)
6e
(mm)
K
(cm/sec)
P4 cS.S & Cong 3100 30 16 – 70 79 13 15 3700
P3 cS.S & Cong 3300 40 16 – 70 93 10 15 3250
P1 fBa 3850 70 NA 158 9 15 2800
P10 fBa 4000 75 NA 163 7 15 1000
P12 fBa 4000 75 NA 163 7 15 1000
P2 Ba 4800 90 NA 337 4 15 910
P10 Ba 8100 95 NA 558 1 15 505
P5 Ba 7700 95 NA 558 1 15 505
P7 Ba 8700 95 NA 558 1 15 505
cS.S: Compacted Sandstone, Cong: Conglomerate, Ba: Basement, fBa: Fractured Basement, NA: Not
available. 1Vp: Compressional wave velocity measured in the field. 2RQDest.: Estimated RQD value (Table 2) (Deere et at., 1967; Helfrich, 1971). 3RQDmea: Measured RQD value from the borehole extracted samples. 4Mean discontinuity spacing: Estimated value (Fig. 5) (Priest and Hudson, 1976). 51-D joint frequency: Estimated value (Fig. 8) (Palmström, 1996). 6e: Joint opening value calculated from RMR classification system of the study area. Note: The drilled boreholes not reached the basement rock layer.
The cross section B-B` shows a
clear dipping of the layers to NW
direction and missing of saturated sand
and sandstone layers in SE direction
but replaced by compacted sandstone
and conglomerate layers to be
shallower to the SE direction. The
recorded seismic velocity of this layer
is 3300 m/sec and decreased to 2400
m/sec to the SE direction. The
estimated permeability coefficient is
3250 cm/sec and expected to decrease
in SE direction due to decreasing in the
seismic velocity in relation with the
less compaction of that layer and it
became at a shallower part of the
section. The shallower basement depth
is about 60 meters at this Section.
According to the depth of the basement
at this section the recorded seismic
velocity increased to be 7700 m/sec
and also due to the absence of joints
and fractures the estimated
permeability coefficient was 505
cm/sec but increased to 2800 cm/sec at
the fractured parts of the section with
seismic velocity value is 3850 m/sec.
The cross section C-C` passes
through the axis of the Wadi from SW
to NE direction. A major fault is
recognized at this section. The
saturated sand and sandstone layers
missed in SW direction but replaced by
compacted sandstone and conglomerate
layers to be shallower to the SW
direction. The recorded seismic
velocity of this layer is ranged between
3100 m/sec around the fault plane and
3300 m/sec at the other parts of the
section and decreased to 2300 m/sec to
the SW direction. The estimated
permeability coefficient has high value
of 3700 cm/sec around the fault plane
and decreased to 3250 cm/sec at the

21
other parts with high seismic velocity
and far from the fault plane and
expected to decrease in SW direction
due to decreasing in the seismic
velocity in relation with the less
compaction of that layer and it became
at a shallower part of the section like in
the case of section B-B`. The basement
depth attains a depth of about 15
meters to the SW direction and about
70 meters to NE direction. Also, high
seismic velocity recorded for the
basement layer at deep depths reached
about 8700 m/sec with low estimated
permeability coefficient of about 505
cm/sec, but the values of the seismic
velocity decreased at the shallow parts
of the section and around the fault
plane to be ranged between 3850 and
4000 m/sec for the fracture parts of the
basement and the permeability
coefficient increased in this case to be
ranged between 1000 and 2800 cm/sec.
The important factors influencing
ground water within a slope are
distribution of rock types, and details
of the structural geology such as fault
infillings, persistence of joint sets and
the presence of solution cavities. These
features can result in regions of low
and high hydraulic conductivity within
the slope that are termed aquitards and
aquifers, respectively (Wyllie, D. C.
and Christopher, 2004).
Typical ranges of secondary
hydraulic conductivity for the different
geological materials of a variety rock
types, as well as unconsolidated
deposits, covers13 orders of magnitude,
and for any single rock type the range
can be four orders of magnitude. This
shows the difficulty in predicting water
inflow quantities and pressures within
slopes (Wyllie, D. C. and Christopher,
2004).
SUMMARY AND CONCLUSIONS
The previous preliminary
geophysical, geological and
geotechnical works, beside the cross
sections drawn through the study area
reveal that, there are about five rock
units above the basement complex
section, which is the bedrock in the
dam and lake area case study.
These rock units are surface wadi
fill, partially saturated sand layer,
saturated sand and sandstone layer,
compacted sandstone and conglomerate
layer, and the fractured basement and
non-fractured basement complex.
Water seepage is a common
problem in most of the dam sites,
where the impounded water seeks paths
of least resistance through the dam, its
foundation and abutments. The ground
conditions and the geological features
of the dam site greatly influence the
amount of seepage and its relevant
effects. From this point of view, the
aim of our study is to estimate the
calculated permeability coefficient (K)
for the layers suggested for the
construction of the dam and for the
underlying layers, which will reserve
the water at the lake area, that includes
the most compacted and competent
layers above the basement, as well as
the compacted sandstone and

22
conglomerate and the weathered
fractured basement layer.
The basement rock section is
divided into two tears are the fractured
basement and the compacted basement
complex tear (fresh rock) according to
the comparable variation in the
compressional velocity values recorded
through this section that ranged
between 3850 and 4000 m/sec for the
fractured basement, but ranged
between 4800 and 8700 m/sec for the
fresh basement and ranged between
2300 and 3300 m/sec for the
compacted sandstone and conglomerate
unit.
The estimated permeability
coefficient (K) illustrated that, it
increases by the decrease of the
compressional wave velocity. The
estimated permeability coefficient (K)
ranged between 3250 and 3700 cm/sec
for the compacted sandstone and
conglomerate layer, ranged between
1000 and 2800 cm/sec for the fractured
basement layer and ranged from 505
and 910 cm/sec for the basement
complex bedrock.
Based on the obtained results, the
basement complex bedrock lied at a
depth from the ground surface ranged
between 50 and 60 meter, has a low
permeability coefficient. The bedrock
at this level is recommemded to be
suitable for deep constructions if
needed and for reserve water at the lake
area.
There are limitations in the use of
seismic refraction interpretations of
jointing assessments to estimate the
permeability coefficient. These mainly
stem from the fact that there are several
properties and features influencing on
the seismic velocity, and it is
impossible to avoid uncertainties when
variations in the velocity is linked
mainly to one or more of these.
Knowledge of the geological
conditions linked with comprehensive
experience in refraction seismic
measurements is important in reducing
these limitations.
Increase in stress level is known to
cause closing of the joints and hence
the potential to indicate variations in
joint density is reduced where the
measurements are performed in deep
depths. Thus, for this reason the
seismic refraction measurements
generally give better results on or near
the surface where the stress level is low
or moderate and with greater seismic
velocities than 3000 m/sec.
Acknowledgments
The author admires the very helpful
cooperation of EGEC staff for
providing the field data. Also, the
author thanks the two anonymous
reviewers for valuable comments that
helped to clarify and summarize the
content of this article.
REFERENCES
ASTM, 1989, Annual book of
ASTM standards, Philadelphia.
Copyright, American Society for
Testing and Materials, 1916 Race
Street, Philadelphia, PA 19103.
Reprinted with permission.
23
Bieniawski, Z.T., 1976, Rock mass
classification in rock engineering. In:
Exploration for rock engineering, proc.,
of the symp., (ed.Z.T.Bieniawski),
Cape Town: Balkama. 1: pp 79-106.
Bieniawski, Z.T., 1979, The
geomechanics classification in rock
engineering applications. Proc. 4th.
congr., Int. Soc. Rock Mech.,
Montreux 2, 41-48.
Bieniawski, Z.T., 1989,
Engineering rock mass classifications.
New York: Wiley.
Deere, D.U., Hendron, A.J., Patton,
F.D., and Cording, E.J., 1967, Design
of surface and near surface
construction in rock. In Failure and
breakage of rock, proc. 8th U.S. symp.
rock mech., (ed. C. Fairhurst), 237-302.
New York: Soc. Min. Engrs, Am. Inst.
Min. Metal. Petrolm Engrs.
EGEC, 2006, Geological and
geophysical investigations of Wadi Al-
Aslaa dam site, Jeddah, Kingdom of
Saudi Arabia, Report, Submitted to
Sabbagh Engineering Consultants.
Hoek, E., Bray, J., 1981, Rock
Slope Engineering, The Institute of
Mining and Metallury, London.
Helfrich, H.K., 1971, Mapping of
rock mass strength by the seismic
refraction method, IVA Report 38,
Stockholm.
Legget, R.F., and Karrow, P.F.,
1982, Handbook of geology in civil
engineeing, McGraw-Hill book
company, 1346p.
Liu, C., and Evett, J.B., 1992, Soils
and foundations, Prentice-Hall, Inc.,
USA, 465p.
Morgenstern N.R., 1971, The
influence of ground water on stability.
Proc. 1st. Symp. on Stability in Open
Pit Mining, Vancouver, Canada,
AIME. New York, 65.82.
Palmström A., 1995, RMi - a rock
mass characterization system for rock
engineering purposes, Ph.D thesis,
University of Oslo, Norway, 409 pp.
Palmström A., 1996, Application of
seismic refraction survey in assessment
of jointing, Conference on Recent
Advances in Tunnelling Technology,
New Delhi.
Scheidegger A.E., 1960, The
Physics of Flow Through Porous
Media. Macmillan, New York.
Sjögren B., Øvsthus A., and
Sandberg J., 1979, Seismic
classification of rock mass qualities.
Geophysical Prospecting, Vol. 27, No.
2, pp. 409 - 442.
Sjögren B., 1984, Shallow
refraction seismic. Chapman and Hall,
London, 270 pp.
Vardakos, S., 2004, A rock mass
classification tool for personal digital
assistants, the Charles E. Via Jr.
Department of Civil and Environmental
Enginnering, Geotechnical Engineering
Group, Blacksburg, Virginia, 61p.
Wyllie, D. C., Christopher, W.M.,
2004, Rock Slope Engineering, Civil
and mining, 4th
edition, Spon Press,
431p.
Related Documents