ORIGINAL ARTICLE Applying the Clinical Practice Improvement Approach to Stroke Rehabilitation: Methods Used and Baseline Results Julie Gassaway, MS, RN, Susan D. Horn, PhD, Gerben DeJong, PhD, Randall J. Smout, MS, Crystal Clark, MD, MPH, Roberta James, MStat ABSTRACT. Gassaway J, Horn SD, DeJong G, Smout RJ, Clark C, James R. Applying the clinical practice improvement approach to stroke rehabilitation: methods used and baseline results. Arch Phys Med Rehabil 2005;86(12 Suppl 2):S16-33. Objectives: To describe the methods used and baseline data for the Post-Stroke Rehabilitation Outcomes Project (PSROP). Design: Prospective observational cohort study. Setting: Seven inpatient rehabilitation facilities (IRFs) in the United States and New Zealand. Participants: Consecutive convenience sample of 1291 poststroke rehabilitation patients, age older than 18, who were treated between 2001 and 2003 in 7 IRFs (1161 patients in 6 U.S. IRFs). Interventions: Not applicable. Main Outcome Measures: Change in FIM score, change in severity of illness, and discharge destination. Results: For the U.S. sample, the average age was 66 years, 52% were men, 60% were white, and 23% were black. Medi- care was the most frequent payer. Seventy-seven percent of strokes were ischemic, with 43% in the left brain, 44% in the right brain, and 11% bilateral. Mean admission total FIM score was 61, with a mean motor FIM score of 40 and mean cogni- tive FIM score of 21. Lower FIM scores are associated with higher severity-of-illness scores. Mean rehabilitation length of stay was 18.6 days; 78% of patients were discharged home. At discharge, the average increase in total FIM score was 26, in motor FIM score was 22, and in cognitive FIM score was 4. Conclusions: This article outlines methods used in the PSROP, provides an overview of participating IRFs, describes the database, and summarizes key characteristics to enable readers of subsequent articles to better interpret study findings and determine generalizability. Key Words: Outcome assessment (health care); Rehabilita- tion; Severity of illness index; Stroke. © 2005 by the American Congress of Rehabilitation Medicine T HE TERM BLACK BOX has been used to describe specific components (interventions) of the stroke rehabilitation process, because specific details about activities used through- out the course of rehabilitation are lacking in rehabilitation literature. 1-6 Stroke rehabilitation practices are customized to meet individual patient needs, which results in variation from one patient to another and from one rehabilitation center to another. Standardized protocols that exist in other areas of medical practice are not common in stroke rehabilitation, which accounts for about 20% of all inpatient rehabilitation admissions. A rationale for the study and detailed literature review substantiating the need to examine rehabilitation pro- cesses to improve outcomes for specific types of patients is presented elsewhere. 7 This article provides an overview of the methods used in a large multisite study of stroke rehabilitation outcomes known as the Post-Stroke Rehabilitation Outcomes Project (PSROP). It was a component of the Rehabilitation Research and Train- ing Center on Medical Rehabilitation Outcomes commissioned by the National Institute on Disability and Rehabilitation Re- search. The PSROP addressed priority 2: the need for scientific data supporting the effectiveness of rehabilitation treatments for poststroke patients. The article also provides a character- ization of the study group, the scope of care received, and an introduction to rehabilitation outcomes realized. It sets the stage for articles that follow, in which the PSROP’s findings are reported. The PSROP introduces to rehabilitation research a genre of research methodology known as clinical practice improvement (CPI). 8 CPI’s fit into the pantheon of biomedical and clinical research methodology is described elsewhere. 9 A CPI study is an observational cohort study that entails the acquisition of prospective and retrospective data while not disrupting the natural milieu of treatment. CPI examines what actually hap- pens in the care process and contains several distinct features, some of which are meant to compensate for the shortcomings commonly attributed to observational studies, particularly the ability to account for patient covariates. Because of CPI’s methodologic complexity, a significant portion of this article is devoted to how CPI concepts were operationalized in the PSROP. In the context of rehabilitation, the purpose of a CPI study is to discern the relative contributions of specific interventions and therapies to rehabilitation outcomes taking into account patient differences and other contributing factors. On 1 level, CPI studies are straightforward. They resemble other observa- tional studies that take into account demographic-type patient and setting characteristics that may shape outcomes and deter- mine generalizability. CPI then moves to a level beyond tradi- tional observational approaches to create comprehensive, com- plex databases that include detailed patient-specific descriptions, severity-of-illness measures, and characteriza- tions of rehabilitation treatments for large samples of patients. Moreover, CPI studies entail extensive clinical staff participa- tion in all phases of study design, data collection, and analyses. From the Institute for Clinical Outcomes Research, International Severity Infor- mation Systems Inc, Salt Lake City, UT (Gassaway, Horn, Smout, James); National Rehabilitation Hospital and Department of Rehabilitation Medicine, Georgetown University, Washington, DC (DeJong); and Center for Clinical Effectiveness, Elm- hurst Hospital Center, and Mount Sinai School of Medicine, New York, NY (Clark). Supported by the National Institute on Disability and Rehabilitation Research (grant no. H133B990005) and the U.S. Army and Materiel Command (cooperative agreement award no. DAMD17-02-2-0032). The views, opinions, and/or findings contained in this article are those of the author(s) and should not be construed as an official Department of the Army position, policy, or decision unless so designated by other documentation. No commercial party having a direct financial interest in the results of the research supporting this article has or will confer a benefit upon the author(s) or upon any organization with which the author(s) is/are associated. Reprint requests to Susan D. Horn, Institute for Clinical Outcomes Research, 699 E South Temple, Ste 100, Salt Lake City, UT 84102-1282, e-mail: [email protected]. 0003-9993/05/8612S-10100$30.00/0 doi:10.1016/j.apmr.2005.08.114 S16 Arch Phys Med Rehabil Vol 86, Suppl 2, December 2005

Welcome message from author
This document is posted to help you gain knowledge. Please leave a comment to let me know what you think about it! Share it to your friends and learn new things together.
Transcript
O
ASJC
Car
f
U
ptU
s
5csrwthsdm
Ptra
t
M
mRUh
(acoo
so
S
S16
A
RIGINAL ARTICLE
pplying the Clinical Practice Improvement Approach totroke Rehabilitation: Methods Used and Baseline Results
ulie Gassaway, MS, RN, Susan D. Horn, PhD, Gerben DeJong, PhD, Randall J. Smout, MS,
rystal Clark, MD, MPH, Roberta James, MStatTpolmoamwarcp
laIibsdfiisa
r(rapnpscamdP
tapCtamtpdtM
ABSTRACT. Gassaway J, Horn SD, DeJong G, Smout RJ,lark C, James R. Applying the clinical practice improvementpproach to stroke rehabilitation: methods used and baselineesults. Arch Phys Med Rehabil 2005;86(12 Suppl 2):S16-33.
Objectives: To describe the methods used and baseline dataor the Post-Stroke Rehabilitation Outcomes Project (PSROP).
Design: Prospective observational cohort study.Setting: Seven inpatient rehabilitation facilities (IRFs) in the
nited States and New Zealand.Participants: Consecutive convenience sample of 1291
oststroke rehabilitation patients, age older than 18, who werereated between 2001 and 2003 in 7 IRFs (1161 patients in 6.S. IRFs).Interventions: Not applicable.Main Outcome Measures: Change in FIM score, change in
everity of illness, and discharge destination.Results: For the U.S. sample, the average age was 66 years,
2% were men, 60% were white, and 23% were black. Medi-are was the most frequent payer. Seventy-seven percent oftrokes were ischemic, with 43% in the left brain, 44% in theight brain, and 11% bilateral. Mean admission total FIM scoreas 61, with a mean motor FIM score of 40 and mean cogni-
ive FIM score of 21. Lower FIM scores are associated withigher severity-of-illness scores. Mean rehabilitation length oftay was 18.6 days; 78% of patients were discharged home. Atischarge, the average increase in total FIM score was 26, inotor FIM score was 22, and in cognitive FIM score was 4.Conclusions: This article outlines methods used in the
SROP, provides an overview of participating IRFs, describeshe database, and summarizes key characteristics to enableeaders of subsequent articles to better interpret study findingsnd determine generalizability.
Key Words: Outcome assessment (health care); Rehabilita-ion; Severity of illness index; Stroke.
© 2005 by the American Congress of Rehabilitationedicine
From the Institute for Clinical Outcomes Research, International Severity Infor-ation Systems Inc, Salt Lake City, UT (Gassaway, Horn, Smout, James); Nationalehabilitation Hospital and Department of Rehabilitation Medicine, Georgetownniversity, Washington, DC (DeJong); and Center for Clinical Effectiveness, Elm-urst Hospital Center, and Mount Sinai School of Medicine, New York, NY (Clark).Supported by the National Institute on Disability and Rehabilitation Research
grant no. H133B990005) and the U.S. Army and Materiel Command (cooperativegreement award no. DAMD17-02-2-0032). The views, opinions, and/or findingsontained in this article are those of the author(s) and should not be construed as anfficial Department of the Army position, policy, or decision unless so designated byther documentation.No commercial party having a direct financial interest in the results of the research
upporting this article has or will confer a benefit upon the author(s) or upon anyrganization with which the author(s) is/are associated.Reprint requests to Susan D. Horn, Institute for Clinical Outcomes Research, 699 E
outh Temple, Ste 100, Salt Lake City, UT 84102-1282, e-mail: [email protected].
t0003-9993/05/8612S-10100$30.00/0doi:10.1016/j.apmr.2005.08.114
rch Phys Med Rehabil Vol 86, Suppl 2, December 2005
HE TERM BLACK BOX has been used to describe specificcomponents (interventions) of the stroke rehabilitation
rocess, because specific details about activities used through-ut the course of rehabilitation are lacking in rehabilitationiterature.1-6 Stroke rehabilitation practices are customized toeet individual patient needs, which results in variation from
ne patient to another and from one rehabilitation center tonother. Standardized protocols that exist in other areas ofedical practice are not common in stroke rehabilitation,hich accounts for about 20% of all inpatient rehabilitation
dmissions. A rationale for the study and detailed literatureeview substantiating the need to examine rehabilitation pro-esses to improve outcomes for specific types of patients isresented elsewhere.7
This article provides an overview of the methods used in aarge multisite study of stroke rehabilitation outcomes knowns the Post-Stroke Rehabilitation Outcomes Project (PSROP).t was a component of the Rehabilitation Research and Train-ng Center on Medical Rehabilitation Outcomes commissionedy the National Institute on Disability and Rehabilitation Re-earch. The PSROP addressed priority 2: the need for scientificata supporting the effectiveness of rehabilitation treatmentsor poststroke patients. The article also provides a character-zation of the study group, the scope of care received, and anntroduction to rehabilitation outcomes realized. It sets thetage for articles that follow, in which the PSROP’s findingsre reported.
The PSROP introduces to rehabilitation research a genre ofesearch methodology known as clinical practice improvementCPI).8 CPI’s fit into the pantheon of biomedical and clinicalesearch methodology is described elsewhere.9 A CPI study isn observational cohort study that entails the acquisition ofrospective and retrospective data while not disrupting theatural milieu of treatment. CPI examines what actually hap-ens in the care process and contains several distinct features,ome of which are meant to compensate for the shortcomingsommonly attributed to observational studies, particularly thebility to account for patient covariates. Because of CPI’sethodologic complexity, a significant portion of this article is
evoted to how CPI concepts were operationalized in theSROP.In the context of rehabilitation, the purpose of a CPI study is
o discern the relative contributions of specific interventionsnd therapies to rehabilitation outcomes taking into accountatient differences and other contributing factors. On 1 level,PI studies are straightforward. They resemble other observa-
ional studies that take into account demographic-type patientnd setting characteristics that may shape outcomes and deter-ine generalizability. CPI then moves to a level beyond tradi-
ional observational approaches to create comprehensive, com-lex databases that include detailed patient-specificescriptions, severity-of-illness measures, and characteriza-ions of rehabilitation treatments for large samples of patients.
oreover, CPI studies entail extensive clinical staff participa-
ion in all phases of study design, data collection, and analyses.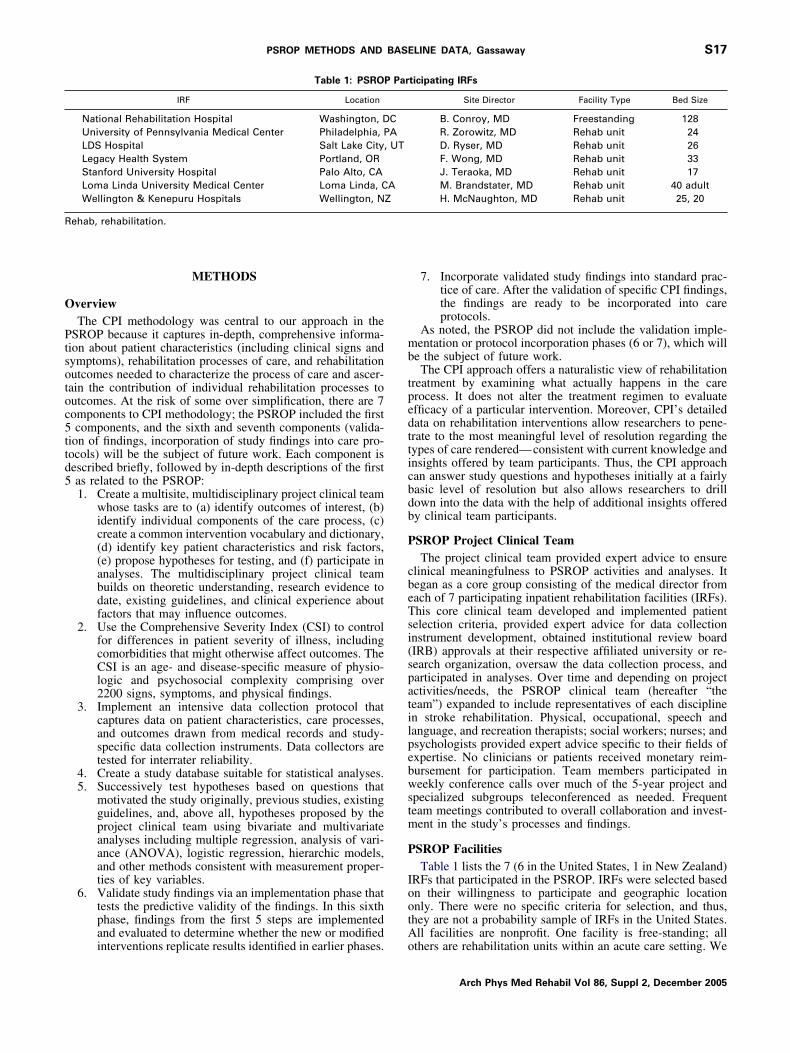
O
Ptsotoc5ttd5
mb
tpedtticbdb
P
cbeTsi(spatilpebwstm
P
IootA
R
S17PSROP METHODS AND BASELINE DATA, Gassaway
METHODS
verviewThe CPI methodology was central to our approach in the
SROP because it captures in-depth, comprehensive informa-ion about patient characteristics (including clinical signs andymptoms), rehabilitation processes of care, and rehabilitationutcomes needed to characterize the process of care and ascer-ain the contribution of individual rehabilitation processes toutcomes. At the risk of some over simplification, there are 7omponents to CPI methodology; the PSROP included the firstcomponents, and the sixth and seventh components (valida-
ion of findings, incorporation of study findings into care pro-ocols) will be the subject of future work. Each component isescribed briefly, followed by in-depth descriptions of the firstas related to the PSROP:1. Create a multisite, multidisciplinary project clinical team
whose tasks are to (a) identify outcomes of interest, (b)identify individual components of the care process, (c)create a common intervention vocabulary and dictionary,(d) identify key patient characteristics and risk factors,(e) propose hypotheses for testing, and (f) participate inanalyses. The multidisciplinary project clinical teambuilds on theoretic understanding, research evidence todate, existing guidelines, and clinical experience aboutfactors that may influence outcomes.
2. Use the Comprehensive Severity Index (CSI) to controlfor differences in patient severity of illness, includingcomorbidities that might otherwise affect outcomes. TheCSI is an age- and disease-specific measure of physio-logic and psychosocial complexity comprising over2200 signs, symptoms, and physical findings.
3. Implement an intensive data collection protocol thatcaptures data on patient characteristics, care processes,and outcomes drawn from medical records and study-specific data collection instruments. Data collectors aretested for interrater reliability.
4. Create a study database suitable for statistical analyses.5. Successively test hypotheses based on questions that
motivated the study originally, previous studies, existingguidelines, and, above all, hypotheses proposed by theproject clinical team using bivariate and multivariateanalyses including multiple regression, analysis of vari-ance (ANOVA), logistic regression, hierarchic models,and other methods consistent with measurement proper-ties of key variables.
6. Validate study findings via an implementation phase thattests the predictive validity of the findings. In this sixthphase, findings from the first 5 steps are implementedand evaluated to determine whether the new or modified
Table 1: PSROP
IRF Location
National Rehabilitation Hospital Washington, DUniversity of Pennsylvania Medical Center Philadelphia, PLDS Hospital Salt Lake City,Legacy Health System Portland, ORStanford University Hospital Palo Alto, CALoma Linda University Medical Center Loma Linda, CWellington & Kenepuru Hospitals Wellington, N
ehab, rehabilitation.
interventions replicate results identified in earlier phases. o
7. Incorporate validated study findings into standard prac-tice of care. After the validation of specific CPI findings,the findings are ready to be incorporated into careprotocols.
As noted, the PSROP did not include the validation imple-entation or protocol incorporation phases (6 or 7), which will
e the subject of future work.The CPI approach offers a naturalistic view of rehabilitation
reatment by examining what actually happens in the carerocess. It does not alter the treatment regimen to evaluatefficacy of a particular intervention. Moreover, CPI’s detailedata on rehabilitation interventions allow researchers to pene-rate to the most meaningful level of resolution regarding theypes of care rendered—consistent with current knowledge andnsights offered by team participants. Thus, the CPI approachan answer study questions and hypotheses initially at a fairlyasic level of resolution but also allows researchers to drillown into the data with the help of additional insights offeredy clinical team participants.
SROP Project Clinical TeamThe project clinical team provided expert advice to ensure
linical meaningfulness to PSROP activities and analyses. Itegan as a core group consisting of the medical director fromach of 7 participating inpatient rehabilitation facilities (IRFs).his core clinical team developed and implemented patientelection criteria, provided expert advice for data collectionnstrument development, obtained institutional review boardIRB) approvals at their respective affiliated university or re-earch organization, oversaw the data collection process, andarticipated in analyses. Over time and depending on projectctivities/needs, the PSROP clinical team (hereafter “theeam”) expanded to include representatives of each disciplinen stroke rehabilitation. Physical, occupational, speech andanguage, and recreation therapists; social workers; nurses; andsychologists provided expert advice specific to their fields ofxpertise. No clinicians or patients received monetary reim-ursement for participation. Team members participated ineekly conference calls over much of the 5-year project and
pecialized subgroups teleconferenced as needed. Frequenteam meetings contributed to overall collaboration and invest-ent in the study’s processes and findings.
SROP FacilitiesTable 1 lists the 7 (6 in the United States, 1 in New Zealand)
RFs that participated in the PSROP. IRFs were selected basedn their willingness to participate and geographic locationnly. There were no specific criteria for selection, and thus,hey are not a probability sample of IRFs in the United States.ll facilities are nonprofit. One facility is free-standing; all
ticipating IRFs
Site Director Facility Type Bed Size
B. Conroy, MD Freestanding 128R. Zorowitz, MD Rehab unit 24D. Ryser, MD Rehab unit 26F. Wong, MD Rehab unit 33J. Teraoka, MD Rehab unit 17M. Brandstater, MD Rehab unit 40 adultH. McNaughton, MD Rehab unit 25, 20
Par
CAUT
AZ
thers are rehabilitation units within an acute care setting. We
Arch Phys Med Rehabil Vol 86, Suppl 2, December 2005
dp2(npdlAma
stFtpyf
Psi
P
sw
tawtdmfZpno
rufteAmaWaamcaip
D
s
SA1*
S18 PSROP METHODS AND BASELINE DATA, Gassaway
A
id not examine facility-specific patient admission criteria forarticipating IRFs. Each site contributed detailed data for about00 consecutive poststroke patients for a total of 1291 patients1161 patients in the United States). The inclusion of 1 inter-ational site (New Zealand) provides somewhat different ap-roaches to rehabilitation care and our data confirm theseifferences. Thus, we elected to report results from New Zea-and as compared with the U.S. sample in a separate article.10
part from this article, the remaining articles in this supple-ent include only the 1161 U.S. patients, and therefore, this
rticle describes information for U.S. patients only.Each IRF enrolled consecutively admitted patients with
troke who met inclusion criteria; 5 sites began enrolling pa-ients with stroke in March 2001; 2 sites began in June 2001.acility size and rate of stroke patient admissions determined
he duration of the enrollment period. Some sites enrolled 200oststroke patients in about 8 months; other sites took up to 2ears. No eligible patients were excluded. Patients with strokerom these 6 U.S. IRFs constitute a convenience sample.
Subsequent articles will use specific subsets of the fullSROP database depending on the topic of each article. Whenubsets are used they are described fully and reasons fornclusion and exclusion of specific patients are provided.
SROP Patient Selection CriteriaEach participating IRF obtained IRB approval for this ob-
ervational study and enrolled consecutively admitted patientsho met the following inclusion criteria:(1) Rehabilitation diagnosis of 430 to 438.99, 997.02, or
852 to 853: one of these diagnosis codes was present inthe list of International Classification of Diseases, 9thRevision (ICD-9),11 codes in the rehabilitation record.
(2) Age greater than 18 years.(3) First rehabilitation admission after current stroke, with
the principal reason for admission being stroke. Thepatient may have had previous strokes and previousrehabilitation admissions for previous stroke(s), but thisis the first admission for the current stroke. Currentstroke must have occurred within 1 year of this reha-
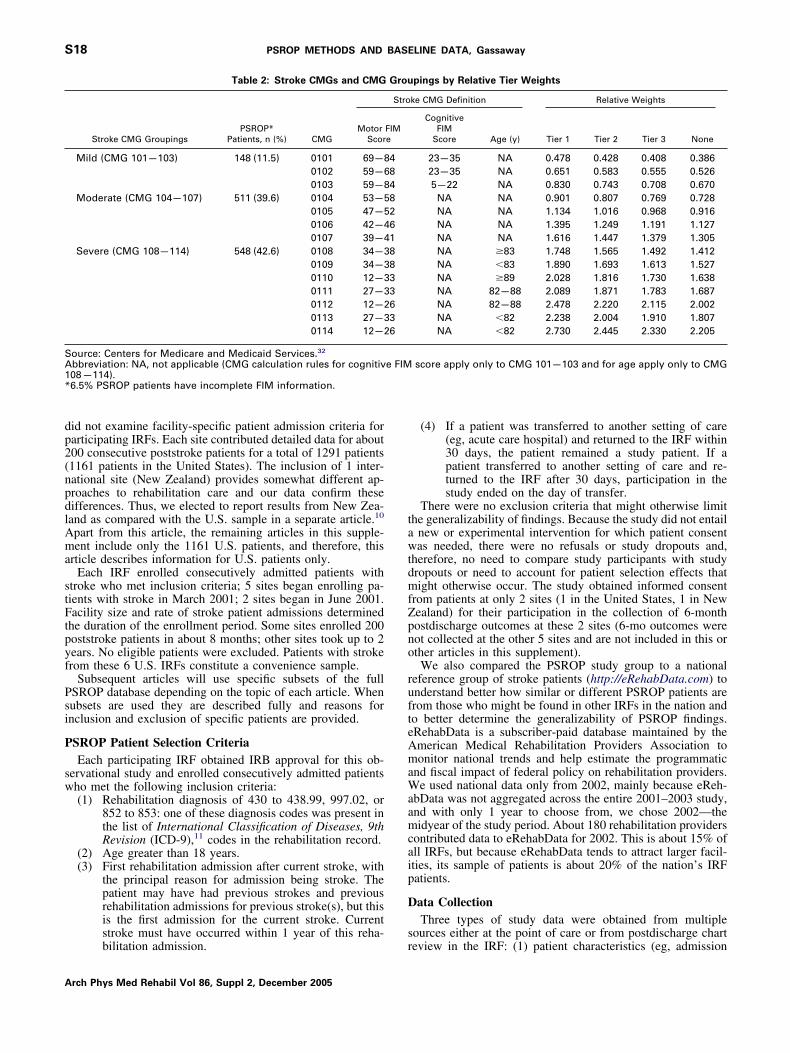
Table 2: Stroke CMGs and CMG
Stroke CMG GroupingsPSROP*
Patients, n (%) CMGMotor
Scor
Mild (CMG 101—103) 148 (11.5) 0101 69—80102 59—60103 59—8
Moderate (CMG 104—107) 511 (39.6) 0104 53—50105 47—50106 42—40107 39—4
Severe (CMG 108—114) 548 (42.6) 0108 34—30109 34—30110 12—30111 27—30112 12—20113 27—30114 12—2
ource: Centers for Medicare and Medicaid Services.32
bbreviation: NA, not applicable (CMG calculation rules for cognitiv08—114).6.5% PSROP patients have incomplete FIM information.
bilitation admission. r
rch Phys Med Rehabil Vol 86, Suppl 2, December 2005
(4) If a patient was transferred to another setting of care(eg, acute care hospital) and returned to the IRF within30 days, the patient remained a study patient. If apatient transferred to another setting of care and re-turned to the IRF after 30 days, participation in thestudy ended on the day of transfer.
There were no exclusion criteria that might otherwise limithe generalizability of findings. Because the study did not entail
new or experimental intervention for which patient consentas needed, there were no refusals or study dropouts and,
herefore, no need to compare study participants with studyropouts or need to account for patient selection effects thatight otherwise occur. The study obtained informed consent
rom patients at only 2 sites (1 in the United States, 1 in Newealand) for their participation in the collection of 6-monthostdischarge outcomes at these 2 sites (6-mo outcomes wereot collected at the other 5 sites and are not included in this orther articles in this supplement).We also compared the PSROP study group to a national
eference group of stroke patients (http://eRehabData.com) tonderstand better how similar or different PSROP patients arerom those who might be found in other IRFs in the nation ando better determine the generalizability of PSROP findings.RehabData is a subscriber-paid database maintained by themerican Medical Rehabilitation Providers Association toonitor national trends and help estimate the programmatic
nd fiscal impact of federal policy on rehabilitation providers.e used national data only from 2002, mainly because eReh-
bData was not aggregated across the entire 2001–2003 study,nd with only 1 year to choose from, we chose 2002—theidyear of the study period. About 180 rehabilitation providers
ontributed data to eRehabData for 2002. This is about 15% ofll IRFs, but because eRehabData tends to attract larger facil-ties, its sample of patients is about 20% of the nation’s IRFatients.
ata CollectionThree types of study data were obtained from multiple
ources either at the point of care or from postdischarge chart
pings by Relative Tier Weights
ke CMG Definition Relative Weights
CognitiveFIM
Score Age (y) Tier 1 Tier 2 Tier 3 None
23—35 NA 0.478 0.428 0.408 0.38623—35 NA 0.651 0.583 0.555 0.5265—22 NA 0.830 0.743 0.708 0.670
NA NA 0.901 0.807 0.769 0.728NA NA 1.134 1.016 0.968 0.916NA NA 1.395 1.249 1.191 1.127NA NA 1.616 1.447 1.379 1.305NA �83 1.748 1.565 1.492 1.412NA �83 1.890 1.693 1.613 1.527NA �89 2.028 1.816 1.730 1.638NA 82—88 2.089 1.871 1.783 1.687NA 82—88 2.478 2.220 2.115 2.002NA �82 2.238 2.004 1.910 1.807NA �82 2.730 2.445 2.330 2.205
score apply only to CMG 101—103 and for age apply only to CMG
Grou
Stro
FIMe
48482618833636
e FIM
eview in the IRF: (1) patient characteristics (eg, admission
S19PSROP METHODS AND BASELINE DATA, Gassaway
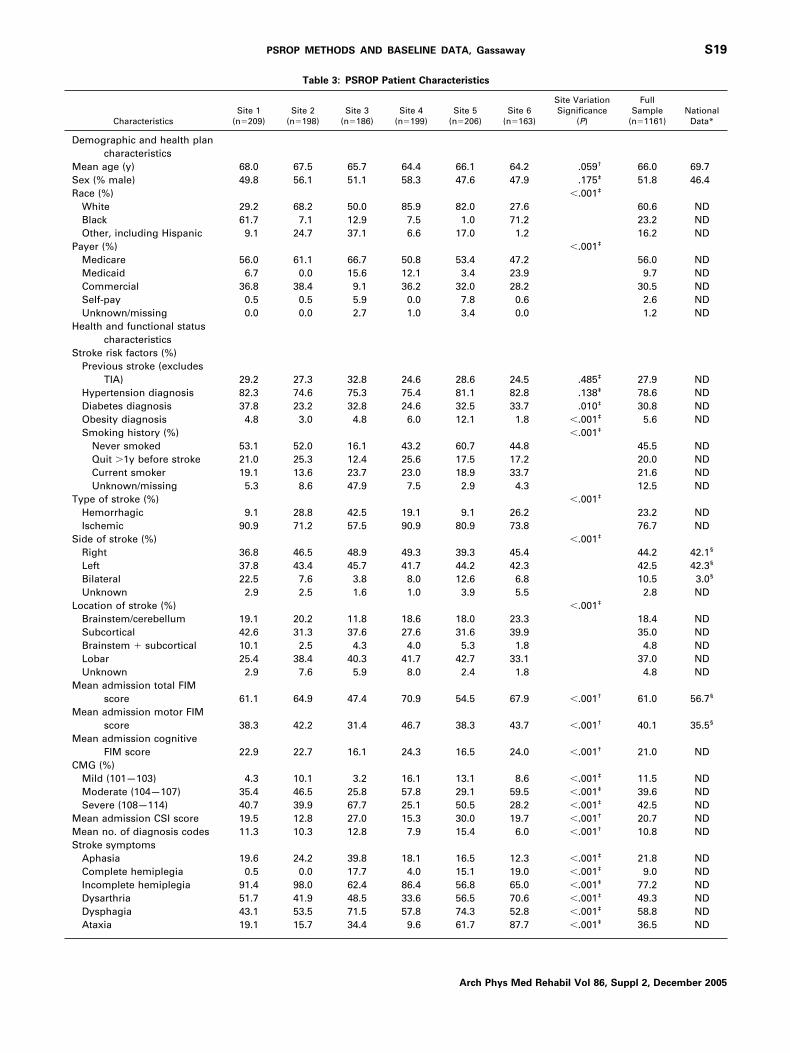
Table 3: PSROP Patient Characteristics
CharacteristicsSite 1
(n�209)Site 2
(n�198)Site 3
(n�186)Site 4
(n�199)Site 5
(n�206)Site 6
(n�163)
Site VariationSignificance
(P)
FullSample
(n�1161)National
Data*
Demographic and health plancharacteristics
Mean age (y) 68.0 67.5 65.7 64.4 66.1 64.2 .059† 66.0 69.7Sex (% male) 49.8 56.1 51.1 58.3 47.6 47.9 .175‡ 51.8 46.4Race (%) �.001‡
White 29.2 68.2 50.0 85.9 82.0 27.6 60.6 NDBlack 61.7 7.1 12.9 7.5 1.0 71.2 23.2 NDOther, including Hispanic 9.1 24.7 37.1 6.6 17.0 1.2 16.2 ND
Payer (%) �.001‡
Medicare 56.0 61.1 66.7 50.8 53.4 47.2 56.0 NDMedicaid 6.7 0.0 15.6 12.1 3.4 23.9 9.7 NDCommercial 36.8 38.4 9.1 36.2 32.0 28.2 30.5 NDSelf-pay 0.5 0.5 5.9 0.0 7.8 0.6 2.6 NDUnknown/missing 0.0 0.0 2.7 1.0 3.4 0.0 1.2 ND
Health and functional statuscharacteristics
Stroke risk factors (%)Previous stroke (excludes
TIA) 29.2 27.3 32.8 24.6 28.6 24.5 .485‡ 27.9 NDHypertension diagnosis 82.3 74.6 75.3 75.4 81.1 82.8 .138‡ 78.6 NDDiabetes diagnosis 37.8 23.2 32.8 24.6 32.5 33.7 .010‡ 30.8 NDObesity diagnosis 4.8 3.0 4.8 6.0 12.1 1.8 �.001‡ 5.6 NDSmoking history (%) �.001‡
Never smoked 53.1 52.0 16.1 43.2 60.7 44.8 45.5 NDQuit �1y before stroke 21.0 25.3 12.4 25.6 17.5 17.2 20.0 NDCurrent smoker 19.1 13.6 23.7 23.0 18.9 33.7 21.6 NDUnknown/missing 5.3 8.6 47.9 7.5 2.9 4.3 12.5 ND
Type of stroke (%) �.001‡
Hemorrhagic 9.1 28.8 42.5 19.1 9.1 26.2 23.2 NDIschemic 90.9 71.2 57.5 90.9 80.9 73.8 76.7 ND
Side of stroke (%) �.001‡
Right 36.8 46.5 48.9 49.3 39.3 45.4 44.2 42.1§
Left 37.8 43.4 45.7 41.7 44.2 42.3 42.5 42.3§
Bilateral 22.5 7.6 3.8 8.0 12.6 6.8 10.5 3.0§
Unknown 2.9 2.5 1.6 1.0 3.9 5.5 2.8 NDLocation of stroke (%) �.001‡
Brainstem/cerebellum 19.1 20.2 11.8 18.6 18.0 23.3 18.4 NDSubcortical 42.6 31.3 37.6 27.6 31.6 39.9 35.0 NDBrainstem � subcortical 10.1 2.5 4.3 4.0 5.3 1.8 4.8 NDLobar 25.4 38.4 40.3 41.7 42.7 33.1 37.0 NDUnknown 2.9 7.6 5.9 8.0 2.4 1.8 4.8 ND
Mean admission total FIMscore 61.1 64.9 47.4 70.9 54.5 67.9 �.001† 61.0 56.7§
Mean admission motor FIMscore 38.3 42.2 31.4 46.7 38.3 43.7 �.001† 40.1 35.5§
Mean admission cognitiveFIM score 22.9 22.7 16.1 24.3 16.5 24.0 �.001† 21.0 ND
CMG (%)Mild (101—103) 4.3 10.1 3.2 16.1 13.1 8.6 �.001‡ 11.5 NDModerate (104—107) 35.4 46.5 25.8 57.8 29.1 59.5 �.001‡ 39.6 NDSevere (108—114) 40.7 39.9 67.7 25.1 50.5 28.2 �.001‡ 42.5 ND
Mean admission CSI score 19.5 12.8 27.0 15.3 30.0 19.7 �.001† 20.7 NDMean no. of diagnosis codes 11.3 10.3 12.8 7.9 15.4 6.0 �.001† 10.8 NDStroke symptoms
Aphasia 19.6 24.2 39.8 18.1 16.5 12.3 �.001‡ 21.8 NDComplete hemiplegia 0.5 0.0 17.7 4.0 15.1 19.0 �.001‡ 9.0 NDIncomplete hemiplegia 91.4 98.0 62.4 86.4 56.8 65.0 �.001‡ 77.2 NDDysarthria 51.7 41.9 48.5 33.6 56.5 70.6 �.001‡ 49.3 NDDysphagia 43.1 53.5 71.5 57.8 74.3 52.8 �.001‡ 58.8 ND
‡
Ataxia 19.1 15.7 34.4 9.6 61.7 87.7 �.001 36.5 NDArch Phys Med Rehabil Vol 86, Suppl 2, December 2005
svai
acempaoHdtpoTrootTwf
btftfrmwCfbaa
eatt
TfFlcmattqtag
sftFstdspc
pwTcpoiefhtadl3ogf
NA*†
‡
§
S20 PSROP METHODS AND BASELINE DATA, Gassaway
A
everity of illness, functional status measures), (2) processariables (eg, treatments, interventions), and (3) outcome vari-bles (eg, discharge functional status, discharge severity ofllness, discharge destination)
Point-of-care data. An important component of CPI is itsttention to the process of care that the patient actually re-eives; it addresses interventions and patient management strat-gies. CPI typically relies on information contained in patientedical records, which trained data collectors abstract after
atient discharge. The team was confident that many identifiedcute care hospital and rehabilitation study variables could bebtained from existing documentation at their respective sites.owever, they strongly believed that existing patient recordsid not document adequately specific activities and interven-ions provided by rehabilitation specialists (eg, physical, occu-ational, and speech therapists); much patient documentation isriented to the needs of payment or reimbursement systems.he team agreed that the ability to capture details of what
ehabilitation specialists do on a daily basis is essential topening the black box of rehabilitation care and strongly rec-mmended that we first determine how to get all members ofhe rehabilitation team to describe accurately what they do.hus, the concept of point-of-care intervention documentationas incorporated into the study design. This initial taxonomy
or stroke rehabilitation is described in detail by DeJong et al.12
Intervention taxonomy (documentation) development—thelack box. Discipline-specific specialty teams with represen-ation from each participating IRF met via teleconferencesrom June 2000 through January 2001 to conceptualize andhen create discipline-specific intervention documentationorms to record activities and interventions used with strokeehabilitation patients. This iterative process took approxi-ately 9 months, because specialty teams learned quickly thathat is practiced in 1 site is often different from other sites.linicians also realized that definitions of common terms differ
rom site to site and practitioner to practitioner. This is thelack box of stroke rehabilitation—What is it that therapistsnd other stroke care clinicians provide to stroke patients? Howre activities or interventions defined and described to others?
The study’s physicians, nurses, psychologists, social work-rs, and physical, occupational, recreational, and speech ther-pists made a first attempt to identify these differences withinheir practices by creating an intervention documentation form
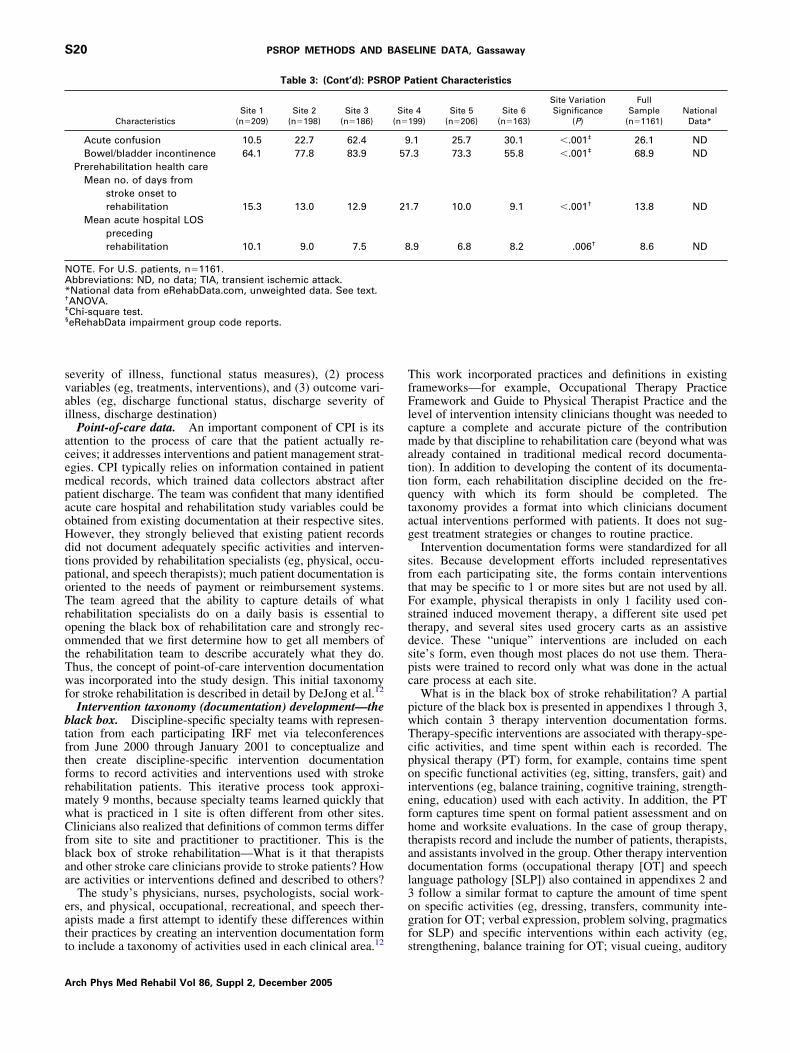
Table 3: (Cont’d): PSR
CharacteristicsSite 1
(n�209)Site 2
(n�198)Site 3
(n�186)
Acute confusion 10.5 22.7 62.4Bowel/bladder incontinence 64.1 77.8 83.9
Prerehabilitation health careMean no. of days from
stroke onset torehabilitation 15.3 13.0 12.9
Mean acute hospital LOSprecedingrehabilitation 10.1 9.0 7.5
OTE. For U.S. patients, n�1161.bbreviations: ND, no data; TIA, transient ischemic attack.National data from eRehabData.com, unweighted data. See text.ANOVA.Chi-square test.eRehabData impairment group code reports.
o include a taxonomy of activities used in each clinical area.12 s
rch Phys Med Rehabil Vol 86, Suppl 2, December 2005
his work incorporated practices and definitions in existingrameworks—for example, Occupational Therapy Practiceramework and Guide to Physical Therapist Practice and the
evel of intervention intensity clinicians thought was needed toapture a complete and accurate picture of the contributionade by that discipline to rehabilitation care (beyond what was
lready contained in traditional medical record documenta-ion). In addition to developing the content of its documenta-ion form, each rehabilitation discipline decided on the fre-uency with which its form should be completed. Theaxonomy provides a format into which clinicians documentctual interventions performed with patients. It does not sug-est treatment strategies or changes to routine practice.Intervention documentation forms were standardized for all
ites. Because development efforts included representativesrom each participating site, the forms contain interventionshat may be specific to 1 or more sites but are not used by all.or example, physical therapists in only 1 facility used con-trained induced movement therapy, a different site used petherapy, and several sites used grocery carts as an assistiveevice. These “unique” interventions are included on eachite’s form, even though most places do not use them. Thera-ists were trained to record only what was done in the actualare process at each site.
What is in the black box of stroke rehabilitation? A partialicture of the black box is presented in appendixes 1 through 3,hich contain 3 therapy intervention documentation forms.herapy-specific interventions are associated with therapy-spe-ific activities, and time spent within each is recorded. Thehysical therapy (PT) form, for example, contains time spentn specific functional activities (eg, sitting, transfers, gait) andnterventions (eg, balance training, cognitive training, strength-ning, education) used with each activity. In addition, the PTorm captures time spent on formal patient assessment and onome and worksite evaluations. In the case of group therapy,herapists record and include the number of patients, therapists,nd assistants involved in the group. Other therapy interventionocumentation forms (occupational therapy [OT] and speechanguage pathology [SLP]) also contained in appendixes 2 and
follow a similar format to capture the amount of time spentn specific activities (eg, dressing, transfers, community inte-ration for OT; verbal expression, problem solving, pragmaticsor SLP) and specific interventions within each activity (eg,
atient Characteristics
e 499)
Site 5(n�206)
Site 6(n�163)
Site VariationSignificance
(P)
FullSample
(n�1161)National
Data*
.1 25.7 30.1 �.001‡ 26.1 ND
.3 73.3 55.8 �.001‡ 68.9 ND
.7 10.0 9.1 �.001† 13.8 ND
.9 6.8 8.2 .006† 8.6 ND
OP P
Sit(n�1
957
21
8
trengthening, balance training for OT; visual cueing, auditory
sfbcmsstifc
dtrcossdcdd
ucdmrteof
iptictf3
teI
N*†
‡
S21PSROP METHODS AND BASELINE DATA, Gassaway
trategies for SLP). One therapy intervention documentationorm was completed for each patient treatment session. Reha-ilitation clinicians may provide overlapping services as in thease of physical therapists and occupational therapists whoay both, for example, provide balance training. In such in-
tances, therapists from each discipline included discipline-pecific applications of the overlapping activities and interven-ions in their taxonomies. The date and time of therapy wasncluded on each intervention documentation form so thatrequency of therapy for specific days of the week could bealculated.
In contrast to the therapy disciplines, other rehabilitationisciplines created intervention documentation forms to meetheir needs of capturing information not contained in traditionalehabilitation documentation. The physician form, for example,aptured time spent in care management discussions, educationf patient/family or medical staff, and supportive activitiesuch as contact with payers and dictation of support letters. Theocial work form contained information about insurance coor-ination, crisis intervention, team collaboration, and familyommunication. Physicians and social workers created multi-ay forms of patient interaction, with 1 column completed per
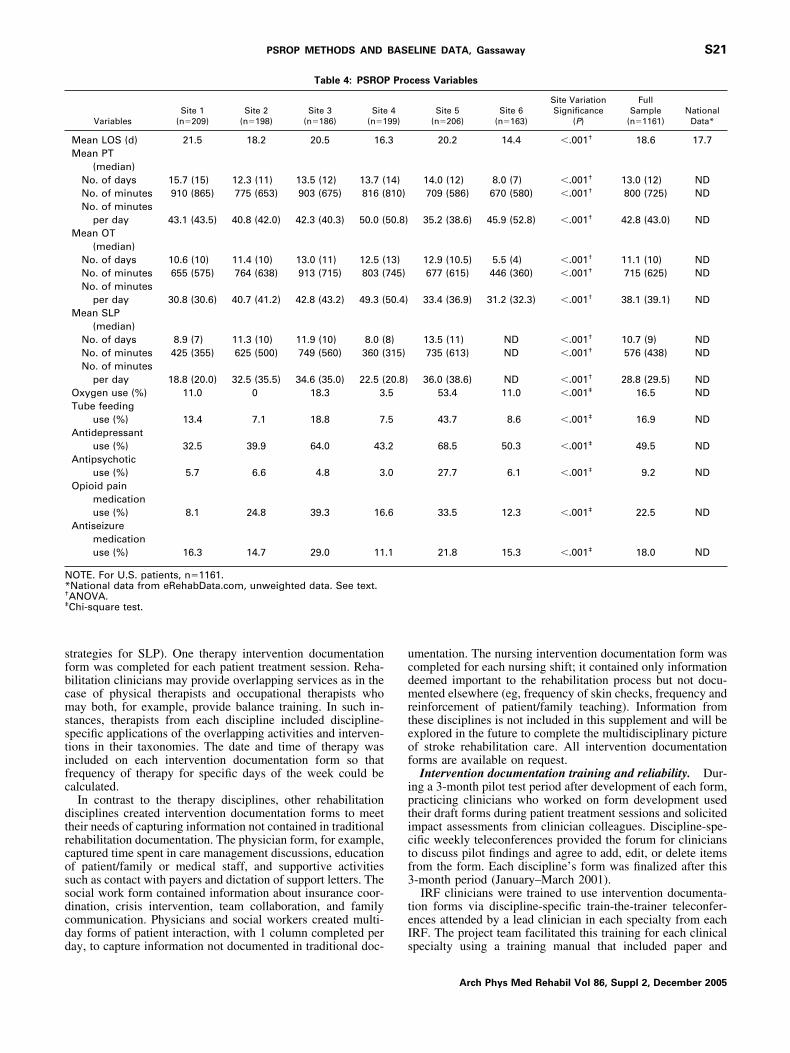
Table 4: PSROP
VariablesSite 1
(n�209)Site 2
(n�198)Site 3
(n�186)Site
(n�1
Mean LOS (d) 21.5 18.2 20.5 16Mean PT
(median)No. of days 15.7 (15) 12.3 (11) 13.5 (12) 13.7 (No. of minutes 910 (865) 775 (653) 903 (675) 816 (No. of minutes
per day 43.1 (43.5) 40.8 (42.0) 42.3 (40.3) 50.0 (Mean OT
(median)No. of days 10.6 (10) 11.4 (10) 13.0 (11) 12.5 (No. of minutes 655 (575) 764 (638) 913 (715) 803 (No. of minutes
per day 30.8 (30.6) 40.7 (41.2) 42.8 (43.2) 49.3 (Mean SLP
(median)No. of days 8.9 (7) 11.3 (10) 11.9 (10) 8.0 (No. of minutes 425 (355) 625 (500) 749 (560) 360 (No. of minutes
per day 18.8 (20.0) 32.5 (35.5) 34.6 (35.0) 22.5 (Oxygen use (%) 11.0 0 18.3 3Tube feeding
use (%) 13.4 7.1 18.8 7Antidepressant
use (%) 32.5 39.9 64.0 43Antipsychotic
use (%) 5.7 6.6 4.8 3Opioid pain
medicationuse (%) 8.1 24.8 39.3 16
Antiseizuremedicationuse (%) 16.3 14.7 29.0 11
OTE. For U.S. patients, n�1161.National data from eRehabData.com, unweighted data. See text.ANOVA.Chi-square test.
ay, to capture information not documented in traditional doc- s
mentation. The nursing intervention documentation form wasompleted for each nursing shift; it contained only informationeemed important to the rehabilitation process but not docu-ented elsewhere (eg, frequency of skin checks, frequency and
einforcement of patient/family teaching). Information fromhese disciplines is not included in this supplement and will bexplored in the future to complete the multidisciplinary picturef stroke rehabilitation care. All intervention documentationorms are available on request.
Intervention documentation training and reliability. Dur-ng a 3-month pilot test period after development of each form,racticing clinicians who worked on form development usedheir draft forms during patient treatment sessions and solicitedmpact assessments from clinician colleagues. Discipline-spe-ific weekly teleconferences provided the forum for clinicianso discuss pilot findings and agree to add, edit, or delete itemsrom the form. Each discipline’s form was finalized after this-month period (January–March 2001).IRF clinicians were trained to use intervention documenta-
ion forms via discipline-specific train-the-trainer teleconfer-nces attended by a lead clinician in each specialty from eachRF. The project team facilitated this training for each clinical
cess Variables
Site 5(n�206)
Site 6(n�163)
Site VariationSignificance
(P)
FullSample
(n�1161)National
Data*
20.2 14.4 �.001† 18.6 17.7
14.0 (12) 8.0 (7) �.001† 13.0 (12) ND709 (586) 670 (580) �.001† 800 (725) ND
35.2 (38.6) 45.9 (52.8) �.001† 42.8 (43.0) ND
12.9 (10.5) 5.5 (4) �.001† 11.1 (10) ND677 (615) 446 (360) �.001† 715 (625) ND
33.4 (36.9) 31.2 (32.3) �.001† 38.1 (39.1) ND
13.5 (11) ND �.001† 10.7 (9) ND735 (613) ND �.001† 576 (438) ND
36.0 (38.6) ND �.001† 28.8 (29.5) ND53.4 11.0 �.001‡ 16.5 ND
43.7 8.6 �.001‡ 16.9 ND
68.5 50.3 �.001‡ 49.5 ND
27.7 6.1 �.001‡ 9.2 ND
33.5 12.3 �.001‡ 22.5 ND
21.8 15.3 �.001‡ 18.0 ND
Pro
499)
.3
14)810)
50.8)
13)745)
50.4)
8)315)
20.8).5
.5
.2
.0
.6
.1
pecialty using a training manual that included paper and
Arch Phys Med Rehabil Vol 86, Suppl 2, December 2005
eitcbte
ccfdi
ttabsce
tapfcp
bcdta(
coopoaPebPesr
wtdevdtes
ssosce
touuolsd
atsTFcds
cgfaaCsttfedss
el4tpppeciqadmtdIsbs
fd(irw
ceac
S22 PSROP METHODS AND BASELINE DATA, Gassaway
A
lectronic copies of the intervention documentation forms,nstructions for completing the forms, and definitions for allerms used on the forms. Written case studies were included; 1ase study was used to demonstrate how to complete each formased on a patient scenario. Additional case studies were usedo evaluate trainees’ understanding of instructions by providingxamples of how to use the form for different patient scenarios.
After the telephone training session, each clinical leaderonducted on-site training sessions for their coworkers. Tele-onferences for each group were held throughout the 2 monthsollowing training to provide clinicians the opportunity toiscuss implementation issues and ask questions of their peersn other participating institutions.
Each site incorporated auditing of intervention documenta-ion form use into routine site practices. Typically, a secondherapist (usually the lead therapist) observed a patient sessionnd completed a separate intervention documentation formased on what was observed. The therapist providing theession completed a form as per protocol and the 2 wereompared. The lead therapist reviewed and discussed differ-nces in completion with the practicing therapist.
Intervention documentation form use. Rehabilitation in-ervention documentation forms were completed for each ther-py session and nursing day for each study patient. Afteratient discharge, completed documentation forms (141,511orms in all) were transmitted to the project office for opticalharacter recognition interpretation and incorporation into theroject database.Intervention documentation validity. Face validity was
uilt into the therapist intervention documentation forms, be-ause they were developed and used by site therapists asescribed above. Clinicians came to agree with the content ofheir respective forms by discussing findings from the pilot testnd then agreeing to add, edit, or delete items from the formcontent validity).
Predictive validity was assessed as described in other arti-les13-16 in this supplement by showing significant effects onutcomes of therapist interventions. For example, the amountf variation explained in discharge FIM score, controlling foratient characteristics (including admission FIM score, severityf illness, demographic factors), was 40% for moderate strokesnd 45% for severe strokes. When total time per day spent onT, OT, and SLP was added, there was no increase in variationxplained for discharge FIM, consistent with previous findingsy Bode et al.17 However, when time per day spent in specificT, OT, and SLP activities was added, the amount of variationxplained increased to 52% for moderate strokes and 68% forevere strokes, adding 12% to 23% explanation of variation,espectively, in discharge FIM score.
Postdischarge chart review. Postdischarge chart reviewas facilitated by the CSI software system that allows for both
he input of severity-of-illness data and the creation of auxiliaryata modules (ADMs), which are sets of study-specific datalements that are collected in addition to patients’ illness se-erity information. The PSROP clinical team identified andefined all patient, process, and outcome variables to include inhe PSROP ADM. Using laptop computers, data collectors atach participating IRF entered chart review data into the CSIoftware system.
The CSI: disease-specific severity-of-illness data (signs andymptoms). The signature component of the CSI softwareystem is the disease-specific severity system. The CSI is anbjective method to define illness severity based on individualigns and symptoms of patients’ diseases. Explicit severityriteria were developed by Susan Horn in conjunction with
xpert clinician panels, originally at the Johns Hopkins Hospi- rrch Phys Med Rehabil Vol 86, Suppl 2, December 2005
al between 1980 and 1992, for each ICD-9-CM diagnosis coder group of similar diagnosis codes. To keep severity criteriap to date with medical practice, the criteria are reviewed andpdated via physician panel discussions with each applicationf the CSI. The CSI defines severity of illness as the physio-ogic and psychosocial complexity presented to medical per-onnel due to the extent and interactions of a patient’sisease(s).8,18-24
Inputs to the CSI include over 2200 disease-specific andge-specific severity criteria including physical findings, his-orical factors, physiologic parameters, and laboratory results atpecified levels of abnormality found in a resident’s chart.reatments provided do not contribute to severity of illness.or example, intubation is not a severity criterion; severityriteria include patient signs and symptoms that led to a clinicalecision to intubate (eg, respiratory acidosis, absent breathounds, cyanosis).
Disease-specific criteria sets are determined by ICD-9-CModes assigned routinely by trained facility diagnosis-relatedroup (DRG) coding personnel. CSI data collection is per-ormed via retrospective chart review after patient discharge,nd thus, all diagnoses assigned by the facility diagnosis coderppear on a front or summary sheet in each patient’s chart. TheSI data collector enters the list of diagnosis codes into the CSI
oftware system, which then displays disease-specific criteriao a trained data collector who abstracts the signs and symp-oms that address the criteria from the patient’s medical recordor specified time periods. It is important to note that thexistence of a diagnosis does not indicate the extent of theisease. The CSI substantiates the diagnosis and allows fortratification based on documented patient signs andymptoms.
The stroke criteria set involves the neurologic, musculoskel-tal, cardiovascular, and respiratory systems; vital signs; andaboratory values. The presence of a stroke ICD-9 code (eg,30 [subarachnoid hemorrhage]) prompts for questions fromhe stroke criteria set, as listed in appendix 4: highest bloodressure, degree of alertness, ataxia, aphasia, dysarthria, dys-nea, perceptual and sensation impairment, dysphagia, hemi-legia, lesion level, time postinjury, acute confusion, and oth-rs. Each criterion is followed by response choices for the dataollector to select; possible responses are presented in decreas-ng order of severity. Responses for the stroke dysphagiauestion, for example, include unable to swallow liquids, un-ble to swallow solids, other dysphagia, and no dysphagia. Theata collector selects the appropriate response based on infor-ation found in the patient’s chart; data collectors are trained
o select the most severe response (by order of presentation). Aisease-specific criteria set exists for each group of similarCD-9-CM codes; the CSI contains over 5500 criteria sets forpecific diagnoses in 5 health care settings (acute care, reha-ilitation, ambulatory, long-term care, hospice) with detailsimilar to the stroke criteria set in appendix 4.
In the PSROP, each CSI criterion was answered separatelyor 3 time periods: admission to rehabilitation (first 24h),ischarge from rehabilitation (discharge day), and maximum.Maximum CSI score covers the full rehabilitation stay, includ-ng admission and discharge periods.) The maximum scoreeflects the most abnormal signs and symptoms, regardless ofhen they occur during the stay.CSI severity scores reflect the interactions of various health
onditions and diseases, as derived from variables in the dis-ase-specific criteria sets. The CSI severity calculation enginessigns a severity weight to each criterion response, which thenontributes to a severity rating for each diagnosis for each
eview period. To compute the overall severity score for a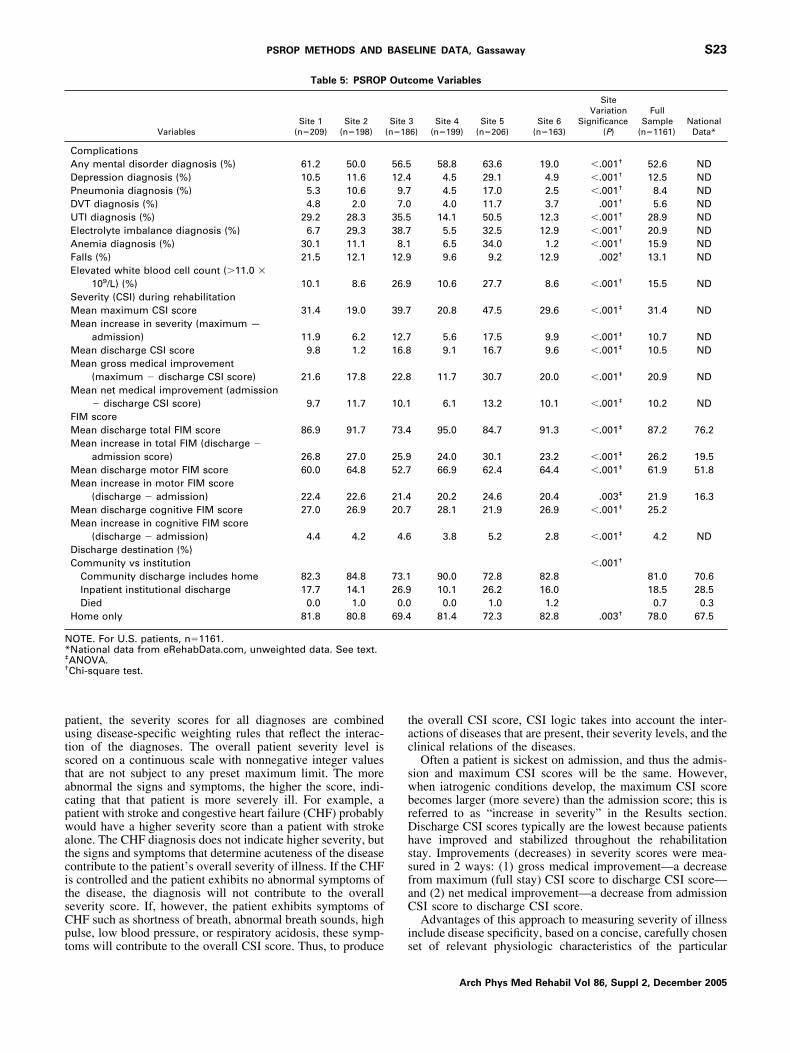
putstacpwatcitsCpt
tac
swbrDhssfaC
i
N*‡
†
S23PSROP METHODS AND BASELINE DATA, Gassaway
atient, the severity scores for all diagnoses are combinedsing disease-specific weighting rules that reflect the interac-ion of the diagnoses. The overall patient severity level iscored on a continuous scale with nonnegative integer valueshat are not subject to any preset maximum limit. The morebnormal the signs and symptoms, the higher the score, indi-ating that that patient is more severely ill. For example, aatient with stroke and congestive heart failure (CHF) probablyould have a higher severity score than a patient with stroke
lone. The CHF diagnosis does not indicate higher severity, buthe signs and symptoms that determine acuteness of the diseaseontribute to the patient’s overall severity of illness. If the CHFs controlled and the patient exhibits no abnormal symptoms ofhe disease, the diagnosis will not contribute to the overalleverity score. If, however, the patient exhibits symptoms ofHF such as shortness of breath, abnormal breath sounds, highulse, low blood pressure, or respiratory acidosis, these symp-
Table 5: PSROP
VariablesSite 1
(n�209)Site 2
(n�198)
ComplicationsAny mental disorder diagnosis (%) 61.2 50.0Depression diagnosis (%) 10.5 11.6Pneumonia diagnosis (%) 5.3 10.6DVT diagnosis (%) 4.8 2.0UTI diagnosis (%) 29.2 28.3Electrolyte imbalance diagnosis (%) 6.7 29.3Anemia diagnosis (%) 30.1 11.1Falls (%) 21.5 12.1Elevated white blood cell count (�11.0 �
109/L) (%) 10.1 8.6Severity (CSI) during rehabilitationMean maximum CSI score 31.4 19.0Mean increase in severity (maximum —
admission) 11.9 6.2Mean discharge CSI score 9.8 1.2Mean gross medical improvement
(maximum � discharge CSI score) 21.6 17.8Mean net medical improvement (admission
� discharge CSI score) 9.7 11.7FIM scoreMean discharge total FIM score 86.9 91.7Mean increase in total FIM (discharge �
admission score) 26.8 27.0Mean discharge motor FIM score 60.0 64.8Mean increase in motor FIM score
(discharge � admission) 22.4 22.6Mean discharge cognitive FIM score 27.0 26.9Mean increase in cognitive FIM score
(discharge � admission) 4.4 4.2Discharge destination (%)Community vs institution
Community discharge includes home 82.3 84.8Inpatient institutional discharge 17.7 14.1Died 0.0 1.0
Home only 81.8 80.8
OTE. For U.S. patients, n�1161.National data from eRehabData.com, unweighted data. See text.ANOVA.Chi-square test.
oms will contribute to the overall CSI score. Thus, to produce s
he overall CSI score, CSI logic takes into account the inter-ctions of diseases that are present, their severity levels, and thelinical relations of the diseases.
Often a patient is sickest on admission, and thus the admis-ion and maximum CSI scores will be the same. However,hen iatrogenic conditions develop, the maximum CSI scoreecomes larger (more severe) than the admission score; this iseferred to as “increase in severity” in the Results section.ischarge CSI scores typically are the lowest because patientsave improved and stabilized throughout the rehabilitationtay. Improvements (decreases) in severity scores were mea-ured in 2 ways: (1) gross medical improvement—a decreaserom maximum (full stay) CSI score to discharge CSI score—nd (2) net medical improvement—a decrease from admissionSI score to discharge CSI score.Advantages of this approach to measuring severity of illness
nclude disease specificity, based on a concise, carefully chosen
ome Variables
36)
Site 4(n�199)
Site 5(n�206)
Site 6(n�163)
SiteVariation
Significance(P)
FullSample
(n�1161)National
Data*
58.8 63.6 19.0 �.001† 52.6 ND4.5 29.1 4.9 �.001† 12.5 ND4.5 17.0 2.5 �.001† 8.4 ND4.0 11.7 3.7 .001† 5.6 ND
14.1 50.5 12.3 �.001† 28.9 ND5.5 32.5 12.9 �.001† 20.9 ND6.5 34.0 1.2 �.001† 15.9 ND9.6 9.2 12.9 .002† 13.1 ND
10.6 27.7 8.6 �.001† 15.5 ND
20.8 47.5 29.6 �.001‡ 31.4 ND
5.6 17.5 9.9 �.001‡ 10.7 ND9.1 16.7 9.6 �.001‡ 10.5 ND
11.7 30.7 20.0 �.001‡ 20.9 ND
6.1 13.2 10.1 �.001‡ 10.2 ND
95.0 84.7 91.3 �.001‡ 87.2 76.2
24.0 30.1 23.2 �.001‡ 26.2 19.566.9 62.4 64.4 �.001‡ 61.9 51.8
20.2 24.6 20.4 .003‡ 21.9 16.328.1 21.9 26.9 �.001‡ 25.2
3.8 5.2 2.8 �.001‡ 4.2 ND
�.001†
90.0 72.8 82.8 81.0 70.610.1 26.2 16.0 18.5 28.50.0 1.0 1.2 0.7 0.3
81.4 72.3 82.8 .003† 78.0 67.5
Outc
Site(n�18
56.512.49.77.0
35.538.78.1
12.9
26.9
39.7
12.716.8
22.8
10.1
73.4
25.952.7
21.420.7
4.6
73.126.90.0
69.4
et of relevant physiologic characteristics of the particular
Arch Phys Med Rehabil Vol 86, Suppl 2, December 2005
df5ettec
ccvtsiccesmWar
psttAtiews(ctecadscofaa
rsckcafn
tcrcf
sti
fb
svownfphtapoatFswwocphvtp
CF
rweccbtitatt
D
ciidf
D
ayFadAt
S24 PSROP METHODS AND BASELINE DATA, Gassaway
A
isease rather than based on a standard set of physiologicactors applied to all diseases; comprehensive scope, with over500 disease-specific severity criteria sets representing all dis-ases for which there is an ICD-9-CM code; independence ofreatments; and ability to measure severity during specifiedime windows in the care process. The CSI has been validatedxtensively in many inpatient, ambulatory, and long-termare settings since 1982.8,18-24
Validity of the CSI for stroke rehabilitation patients. CSIriteria for stroke were examined and updated by the projectlinical team at the beginning of the project to ensure their facealidity for stroke rehabilitation patients. Predictive validity ofhe CSI and its components for stroke rehabilitation patients arehown elsewhere.13-16,25-28 Although levels of disability arencluded in the CSI criteria set for patients with stroke, otheromponents of the CSI remain significant in explaining out-omes after controlling for FIM score and other factors. Forxample, the amount of variation explained in discharge FIMcore by demographic factors alone was 3% for patients withoderate strokes and 4% for patients with severe strokes.hen the CSI score and its components were added, the
mount of variation explained increased to 15% and 24%,espectively, for patients with moderate and severe strokes.
Patient, process, and outcome data. CPI methodologyromotes collection of study-specific patient (in addition toeverity-of-illness), process, and outcome data elements, iden-ified and defined by the study team into an instrument referredo as the ADM within the CSI software system. The PSROPDM contained over 200 variables; most contained date and
ime fields so that they could be associated with other variablesn time sequence, and many have numerous data entries. Forxample, some data related to vital signs, weight, and painere collected for each day of the rehabilitation stay, so these
ingle variables have as many entries as the length of stayLOS). The ADM contained an extensive table of selectionhoices for each variable; however, data collectors were trainedo add to the selection table if a response was not present. Forxample, the durable medical equipment (DME) selection tableontained 173 selection options, but data collectors addednother 18 options, including elastic shoelaces and plate guard,uring data collection. Appendix 5 presents an outline of thetroke ADM; the outline does not include table selectionhoices. Rehabilitation activities and interventions containedn each discipline’s point-of-care intervention documentationorms (see appendixes 1�3) were classified as process vari-bles also but are not included in the ADM outline version inppendix 5.
Patient variables included age, sex, race, payer source, strokeisk factors, type of stroke (hemorrhagic, ischemic), side oftroke (left, right, bilateral), location of stroke (brainstem/erebellum, subcortical, brainstem and subcortical, lobar, un-nown), admission FIM score (total, motor, cognitive, and allomponents), case-mix group (CMG), acute care hospital LOS,nd date and time of stroke symptom onset (which is subtractedrom rehabilitation admission date and time to determine theumber of days from stroke onset to rehabilitation admission).Process variables included rehabilitation LOS, therapy in-
ensity, and specific activities and interventions from point-of-are documentation forms; oxygen use; medications duringehabilitation care; incontinence interventions (eg, indwellingatheters); and nutritional interventions (eg, diet type, tubeeeding).
Outcome variables in the ADM included discharge FIMcores, death, discharge destination (home, community, insti-ution), repeat stroke, deep vein thrombosis (DVT), electrolyte
mbalance, anemia, urinary tract infection (UTI), pneumonia, lrch Phys Med Rehabil Vol 86, Suppl 2, December 2005
alls, mental disorders including depression, and elevated whitelood cell count.The functional performance for each study patient on admis-
ion to and discharge from inpatient rehabilitation was obtainedia retrospective chart review using the study site’s recordingf FIM scores. We assumed all clinicians providing FIM dataithin IRFs as part of standard practice were FIM credentialed;o additional documentation of FIM elements was performedor project purposes. The FIM is a widely used measure oferformance across 13 motor areas and 5 cognitive areas andas been found to have “acceptably high” interrater reliabili-y.29-31 The FIM describes a patient’s ability to perform variousctivities of daily living given various levels of assistance. Aatient who is independent in completing a task is rated a 7,ne who requires only supervision or contact guard is rated a 5,nd one who is dependent is rated a 1 for that specific task. Inhe context of the PSROP project, admission and dischargeIM scores—total, component (motor, cognitive), and sub-cores (specific domains, eg, dressing upper and lower body,alking, bowel and bladder incontinence, problem solving)—ere collected; however, FIM data were incomplete for 6.5%f the sample. FIM ratings also were used to determine “suc-ess” or “failure” in a given activity (ie, increasing the com-onent FIM rating to a predetermined level) and to identify aomogeneous group of study patients for comparison of inter-entions and outcomes (eg, examining differences in interven-ions among all patients who were rated a 3 in auditory com-rehension on admission).We assigned each study patient to a CMG following stroke
MG definition rules based on motor FIM score, cognitiveIM score, and patient age (table 2).Chart review training and reliability. Each IRF medical
ecords abstractor completed a 4-day training session duringhich efficient and accurate collection of chart review data was
xplained and practiced. After the training session, each dataollector underwent a rigorous manual reliability testing pro-ess to ensure complete and accurate data collection that wenteyond internal data editing features of the CSI (eg, featureshat prohibit entry of nonsensible values). Reliability monitor-ng was conducted at 4 points throughout the PSROP to ensurehat data accuracy was maintained. An agreement rate of 95%t the criteria level between each data collector and the projectraining-team reliability person was required for each reliabilityest.
atabase ManagementThe comprehensive PSROP database contains all point of
are and chart review patient data. Patients and facilities aredentified by study identification number only and cannot bedentified directly or through linked identifiers. The entire CSIatabase was exported to SAS statistical software, release 8.2,a
or analysis.
ata AnalysesFor categoric variables, we used contingency tables to ex-
mine differences in frequencies and conducted bivariate anal-ses using chi-square tests to examine differences across sites.or continuous measures we used descriptive statistics, such asverage, median, quartiles, and amount of variation (standardeviation [SD], range), and conducted bivariate analyses usingNOVA to test differences across sites and Pearson correlation
o test associations of continuous variables. A 2-sided P value
ess than .05 was considered statistically significant.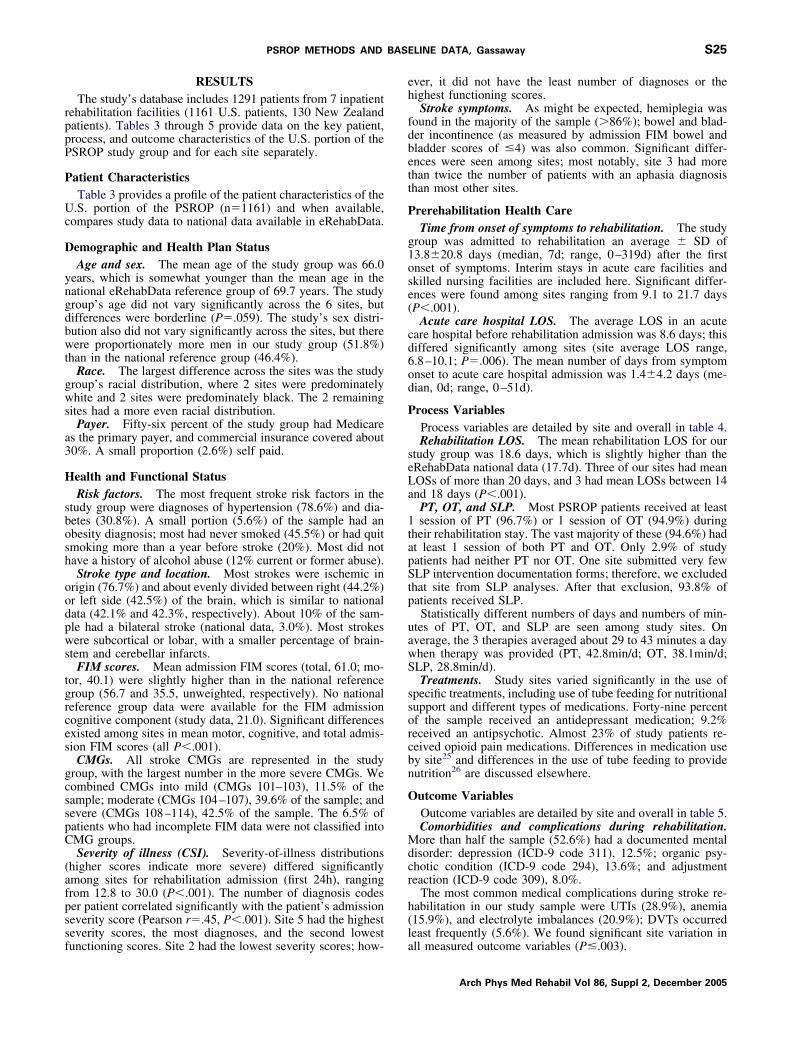
rppP
P
Uc
D
yngdbwt
gws
a3
H
sbosh
oodpws
tgrces
gcsspC
(afpssf
eh
fdbett
P
g1ose(
cd6od
P
seLa
1tapStp
uawS
ssorcbn
O
Mdcr
h(l
S25PSROP METHODS AND BASELINE DATA, Gassaway
RESULTSThe study’s database includes 1291 patients from 7 inpatient
ehabilitation facilities (1161 U.S. patients, 130 New Zealandatients). Tables 3 through 5 provide data on the key patient,rocess, and outcome characteristics of the U.S. portion of theSROP study group and for each site separately.
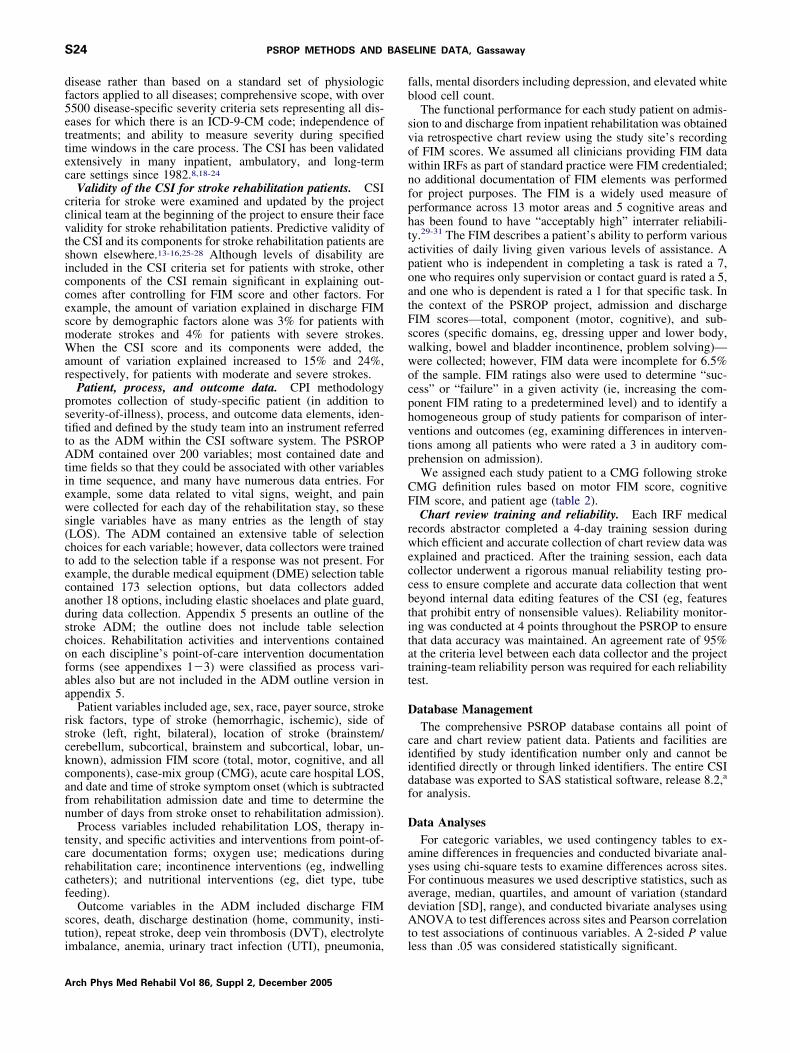
atient CharacteristicsTable 3 provides a profile of the patient characteristics of the
.S. portion of the PSROP (n�1161) and when available,ompares study data to national data available in eRehabData.
emographic and Health Plan StatusAge and sex. The mean age of the study group was 66.0
ears, which is somewhat younger than the mean age in theational eRehabData reference group of 69.7 years. The studyroup’s age did not vary significantly across the 6 sites, butifferences were borderline (P�.059). The study’s sex distri-ution also did not vary significantly across the sites, but thereere proportionately more men in our study group (51.8%)
han in the national reference group (46.4%).Race. The largest difference across the sites was the study
roup’s racial distribution, where 2 sites were predominatelyhite and 2 sites were predominately black. The 2 remaining
ites had a more even racial distribution.Payer. Fifty-six percent of the study group had Medicare
s the primary payer, and commercial insurance covered about0%. A small proportion (2.6%) self paid.
ealth and Functional StatusRisk factors. The most frequent stroke risk factors in the
tudy group were diagnoses of hypertension (78.6%) and dia-etes (30.8%). A small portion (5.6%) of the sample had anbesity diagnosis; most had never smoked (45.5%) or had quitmoking more than a year before stroke (20%). Most did notave a history of alcohol abuse (12% current or former abuse).Stroke type and location. Most strokes were ischemic in
rigin (76.7%) and about evenly divided between right (44.2%)r left side (42.5%) of the brain, which is similar to nationalata (42.1% and 42.3%, respectively). About 10% of the sam-le had a bilateral stroke (national data, 3.0%). Most strokesere subcortical or lobar, with a smaller percentage of brain-
tem and cerebellar infarcts.FIM scores. Mean admission FIM scores (total, 61.0; mo-
or, 40.1) were slightly higher than in the national referenceroup (56.7 and 35.5, unweighted, respectively). No nationaleference group data were available for the FIM admissionognitive component (study data, 21.0). Significant differencesxisted among sites in mean motor, cognitive, and total admis-ion FIM scores (all P�.001).
CMGs. All stroke CMGs are represented in the studyroup, with the largest number in the more severe CMGs. Weombined CMGs into mild (CMGs 101–103), 11.5% of theample; moderate (CMGs 104–107), 39.6% of the sample; andevere (CMGs 108–114), 42.5% of the sample. The 6.5% ofatients who had incomplete FIM data were not classified intoMG groups.Severity of illness (CSI). Severity-of-illness distributions
higher scores indicate more severe) differed significantlymong sites for rehabilitation admission (first 24h), rangingrom 12.8 to 30.0 (P�.001). The number of diagnosis codeser patient correlated significantly with the patient’s admissioneverity score (Pearson r�.45, P�.001). Site 5 had the highesteverity scores, the most diagnoses, and the second lowest
unctioning scores. Site 2 had the lowest severity scores; how- aver, it did not have the least number of diagnoses or theighest functioning scores.Stroke symptoms. As might be expected, hemiplegia was
ound in the majority of the sample (�86%); bowel and blad-er incontinence (as measured by admission FIM bowel andladder scores of �4) was also common. Significant differ-nces were seen among sites; most notably, site 3 had morehan twice the number of patients with an aphasia diagnosishan most other sites.
rerehabilitation Health CareTime from onset of symptoms to rehabilitation. The study
roup was admitted to rehabilitation an average � SD of3.8�20.8 days (median, 7d; range, 0–319d) after the firstnset of symptoms. Interim stays in acute care facilities andkilled nursing facilities are included here. Significant differ-nces were found among sites ranging from 9.1 to 21.7 daysP�.001).
Acute care hospital LOS. The average LOS in an acuteare hospital before rehabilitation admission was 8.6 days; thisiffered significantly among sites (site average LOS range,.8–10.1; P�.006). The mean number of days from symptomnset to acute care hospital admission was 1.4�4.2 days (me-ian, 0d; range, 0–51d).
rocess VariablesProcess variables are detailed by site and overall in table 4.Rehabilitation LOS. The mean rehabilitation LOS for our
tudy group was 18.6 days, which is slightly higher than theRehabData national data (17.7d). Three of our sites had meanOSs of more than 20 days, and 3 had mean LOSs between 14nd 18 days (P�.001).
PT, OT, and SLP. Most PSROP patients received at leastsession of PT (96.7%) or 1 session of OT (94.9%) during
heir rehabilitation stay. The vast majority of these (94.6%) hadt least 1 session of both PT and OT. Only 2.9% of studyatients had neither PT nor OT. One site submitted very fewLP intervention documentation forms; therefore, we excluded
hat site from SLP analyses. After that exclusion, 93.8% ofatients received SLP.Statistically different numbers of days and numbers of min-
tes of PT, OT, and SLP are seen among study sites. Onverage, the 3 therapies averaged about 29 to 43 minutes a dayhen therapy was provided (PT, 42.8min/d; OT, 38.1min/d;LP, 28.8min/d).Treatments. Study sites varied significantly in the use of
pecific treatments, including use of tube feeding for nutritionalupport and different types of medications. Forty-nine percentf the sample received an antidepressant medication; 9.2%eceived an antipsychotic. Almost 23% of study patients re-eived opioid pain medications. Differences in medication usey site25 and differences in the use of tube feeding to provideutrition26 are discussed elsewhere.
utcome VariablesOutcome variables are detailed by site and overall in table 5.Comorbidities and complications during rehabilitation.ore than half the sample (52.6%) had a documented mental
isorder: depression (ICD-9 code 311), 12.5%; organic psy-hotic condition (ICD-9 code 294), 13.6%; and adjustmenteaction (ICD-9 code 309), 8.0%.
The most common medical complications during stroke re-abilitation in our study sample were UTIs (28.9%), anemia15.9%), and electrolyte imbalances (20.9%); DVTs occurredeast frequently (5.6%). We found significant site variation in
ll measured outcome variables (P�.003).Arch Phys Med Rehabil Vol 86, Suppl 2, December 2005
S
(sssa
tispC
F
aFn5s1tSt
3pha
R
btpT(
tariawftdis
apupitt
cmii
st(obtdpdc
stsipfpospcDi
hcslhhmt
L
fhsptcnscihpocd
ualtaemtddtor
S26 PSROP METHODS AND BASELINE DATA, Gassaway
A
everity of Illness (CSI)Increase in severity during rehabilitation. Some patients
11%) had an increase in CSI score during the rehabilitationtay, indicating that their illness severity increased during thetay from what it was at admission. The mean increase ineverity for the full sample was 10.7 (20.7 on admission, 31.4t maximum); significant site variation was found (P�.001).
Discharge severity and change in severity from admissiono discharge. Significant differences were found among sitesn gross medical improvement (decrease from maximum [full-tay] CSI score to discharge CSI score) and net medical im-rovement (decrease from admission CSI score to dischargeSI score; ANOVA, P�.001).
IM ScoresDischarge FIM score and change in FIM scores from
dmission to discharge. The mean discharge total and motorIM scores for the study population were higher than for theational sample (total FIM: 87.2 vs 76.2; motor FIM: 61.9 vs1.8, respectively); larger increases in total and motor FIMcores also were seen in the study sample (total FIM: 26.2 vs9.5; motor FIM: 21.9 vs 16.3, respectively). Data for cogni-ive FIM components are not provided in the national data.tudy sites differed significantly in mean motor, cognitive, and
otal discharge FIM scores (all P�.001).Low FIM scores and high severity scores. As seen in table
, the 2 facilities (sites 3 and 5) that had the lowest functioningatients, as measured by admission FIM scores, also had theighest severity (“sickest”) patients, as measured by the highestdmission CSI scores.
ehabilitation Discharge DestinationMost study patients (81%) were discharged from the reha-
ilitation center to a community setting and the vast majority ofhese were to the resident or family home (78%). This com-ares with national statistics of 70.6% and 67.5%, respectively.he study sample had about double the percentage of deaths
0.7%) when compared with the national sample (0.34%).
DISCUSSIONThe wide-ranging effects of stroke are a challenge for de-
ermining the right match between a stroke survivor’s needsnd the appropriate rehabilitation services. Failure to find theight fit can result in too little or too much care for a patient’sndividual needs. We cannot clinically and fiscally allocateppropriate rehabilitation services for every patient with strokeithout stronger detailed scientific evidence showing the ef-
ectiveness of poststroke rehabilitation interventions. By usinghe CPI approach, the PSROP assembled a comprehensiveatabase providing the opportunity to examine the complexnterplay of patient and process factors and their impact ontroke patient outcomes.
Because of the central role played by the project team in allspects of CPI, this approach can be characterized as a form ofarticipatory action research—a bottom-up approach that val-es the participation of those actually engaged in the care-roviding process and garners their participation in implement-ng study findings. CPI encourages new findings, even thosehat challenge conventional wisdom and long-standing prac-ice.
During this study, there were extraordinary contributions oflinical expertise and time to develop new intervention docu-entation forms by clinical team members at each IRF. The
nclusive nature of the CPI approach retained clinician partic-
pation for more than 5 years with no financial rewards. Phy- irch Phys Med Rehabil Vol 86, Suppl 2, December 2005
icians, therapists, and social workers, among others, realizedhat better understanding of the details of everyday practiceobtained from data, not expert consensus) and the associationf these details with patient outcomes can make great contri-utions to better outcomes for patients with stroke and betterraining and practice techniques for clinicians. The level ofetail about rehabilitation care that became a part of the sup-lemental intervention documentation forms had never beenocumented before and provided tremendous potential to dis-over treatments that are best for specific patient types.
The CSI enabled us to go beyond controlling only for strokeeverity: it allowed us to control for many complex comorbidi-ies common to patients with stroke (particularly those withevere stroke), reflecting more accurately the realities of clin-cal practice. The strength of the CSI’s mechanism for com-ensating or adjusting for differences among patients allowsor a more powerful assessment of the effectiveness of thera-eutic interventions. The CSI’s use of very specific, disease-riented questions produced a highly sensitive measure ofeverity that could not be produced by using diagnosis and/orrocedure codes alone or a limited, fixed set of physiologicriteria no matter what the underlying diagnoses may be.iagnosis codes indicate existence of disease; they do not
ndicate extent of disease.Study sites with higher severity-of-illness scores tended to
ave lower functioning scores (FIM) on admission. The patternontinued at discharge where again, sites with higher dischargeeverity scores tended to have lower functional scores. Simi-arly, study sites with lower severity scores tended to haveigher-functioning patients (see tables 3, 5). Study sites thatad higher severity-of-illness scores also had higher use ofore intensive treatments such as oxygen use and nutritional
ube feedings (see table 4).
imitationsCPI methodology relies on the expertise of participating
acility clinicians to guide the development of high-level studyypotheses and identify critical data elements to study. Asuch, these clinicians are aware of study data elements as theyrovide care and complete point-of-care intervention documen-ation forms or perform routine documentation practices. Thisould be construed as introducing treatment bias; however, theumber of clinicians who participated in the development oftudy instruments was a very small subset of all clinicians whoared for over 1200 stroke rehabilitation patients in 7 facilitiesn 2 countries. Intervention documentation forms and projectypotheses were designed to capture descriptions of actualractice, not to alter practice patterns. In addition, the noveltyf attention to specific study questions would wane over theourse of an extended patient enrollment period (8mo to 2y,epending on site size and stroke volume).As much as supplemental point-of-care intervention doc-
mentation forms provide an unprecedented level of detailbout rehabilitation interventions, they also have intrinsicimitations. Add-on documentation to traditional IRF prac-ices increases the documentation burden of front-line staffnd allotted documentation time may not be sufficient tonsure complete documentation of both. Intervention docu-entation form training was conducted via a train-the-
rainer approach using a lead clinician in each rehabilitationiscipline in each IRF. Thus, the training of most cliniciansepended on the expertise and time availability of the IRFrainers. Monitoring of documentation accuracy became anbligation of each IRF. The project clinical team receivedeports of IRF auditing processes and findings but did not
ntervene directly to determine the level of accuracy of
doftvt
bcbaapfotstroh
tsbIdht
ipsdteanicovlhwlroTifCs
a
Fpdier
paptoa
veatawcpscm
toianlwiits
oiPRUDpPAtMLKr
S27PSROP METHODS AND BASELINE DATA, Gassaway
ocumentation form completion. The project also dependedn each IRF to package all intervention documentationorms and send them to the project office for scanning intohe project database. Despite these limitations, significantariation in outcomes was found because of differences inime spent per day in various therapy activities.14-16
The original intent of the PSROP was to collect data fromoth the acute care hospital and rehabilitation records toover the full poststroke course for each patient. However,udgetary and time constraints, as well as lack of convenientccess to acute care charts, resulted in complete data fromcute care hospital records being collected for only a smallortion of the study population. In the end, data collectionocused primarily on the rehabilitation stay. This led to lackf ability to control for some patient and process variableshat could affect functional outcomes—for example, initialtroke severity (CSI score in acute care), blood pressure,emperature, and glucose levels in the early poststroke pe-iod; acute care complications such as seizures; and detailsf therapies and medications received during acute careospitalization.In the initial planning stages, efforts were made to iden-
ify and use an objective, validated measure of initial strokeeverity (ie, the National Institutes of Health Stroke Scale),ut no standard measure was in use across all participatingRFs. Hence, we did not include such a measure. We alsoid not assess admitting criteria for each IRF, which mayave had an effect on types of patients admitted and, thus,ypes of patients included in the study.
A physiologic severity indexing system, such as the CSI,s limited by data availability. Credentialed DRG codingersonnel at each facility assign ICD-9-CM codes as part oftandard operating IRF procedures; it is these codes thatetermine reimbursement. We did not evaluate the creden-ialing procedures, nor did we audit code assignment. How-ver, the difference in average number of ICD-9-CM codesssigned in facilities (range, 6�15) is curious. A smallerumber of ICD-9-CM codes may result in lower severity ofllness when using a system that is built on ICD-9-CModing. Indeed, the facility with the highest average numberf ICD-9-CM codes (15.4) did have the highest mean se-erity-of-illness score (30). However, the facility with theowest average number of ICD-9-CM codes (6.0) did notave the lowest mean severity scores; there were 2 facilitiesith lower admission and maximum mean severity scores. If
aboratory tests are not ordered, findings are not clearlyeported, or complications are not documented, the severityr incidence rate for the related conditions will be lower.he incidence and type of test ordering and availability of
nformation was not uniform across sites and could accountor a significant portion of the site variability reported inSI scores. However, the CSI and/or its components were
ignificant predictors of various outcomes.13-16,25-28
Lack of a defined time point for measurement of function
fter stroke was another limitation of the study. Ideally, theCB
IM score would be measured at some predetermined end-oint (eg, 90d after stroke onset) for all patients. Use of theischarge FIM scores is less satisfactory, because dischargetself is affected by institutional policies, patient prefer-nces, socioeconomic concerns, insurance coverage, rate ofecovery, and other variables.
The rehabilitation setting database created from thisroject is extremely rich in detail. Of course, this leads to andditional limitation—not all data are reported in this sup-lement. We plan future publications that capture descrip-ions and contributions (intervention documentation) ofther members of rehabilitation care teams, such as nursesnd social workers.
Despite these limitations, having micro-level data pro-ided the ability to focus on the individual patient level toxplore reasons for our findings. The PSROP was the firstpplication of CPI methodology to a rehabilitation popula-ion and process. As with any new application of a process,certain amount of trial and error occurred. This knowledgeill accrue to subsequent CPI studies for other impairment
ategories and settings, allowing significant incremental im-rovements in the efficiency, methodology, and reliability ofuch studies. The knowledge learned also will facilitateompletion of CPI process steps 6 and 7 (validation imple-entation, protocol incorporation) in future work.
CONCLUSIONSThe PSROP created a comprehensive database to assess
he importance of such stroke variables as sex, race, severityf illness, baseline level of functioning, and various therapynterventions on patient-centered outcomes. The PSROPllowed us to describe the duration, intensity, and compo-ents of treatment regimens. In addition, the PSROP al-owed us to discover treatment practices that are associatedith better outcomes for patients with various levels of
mpairment after stroke. These include findings about med-cations, PT, OT, SLP, timing of rehabilitation, and nutri-ional support. Subsequent articles in this supplement de-cribe these findings in detail.13-16,25-28
Acknowledgments: We acknowledge contributions of collab-rators at each clinical site represented in the Post-Stroke Rehabil-tation Outcomes Project: Brendan Conroy, MD (Stroke Recoveryrogram, National Rehabilitation Hospital, Washington, DC);ichard Zorowitz, MD (Department of Rehabilitation Medicine,niversity of Pennsylvania Medical Center, Philadelphia, PA);avid Ryser, MD (Neuro Specialty Rehabilitation Unit, LDS Hos-ital, Salt Lake City, UT); Jeffrey Teraoka, MD (Division ofhysical Medicine and Rehabilitation, Stanford University, Palolto, CA); Frank Wong, MD, and LeeAnn Sims, RN (Rehabilita-
ion Institute of Oregon, Legacy Health Systems, Portland, OR);urray Brandstater, MD (Loma Linda University Medical Center,
oma Linda, CA); and Harry McNaughton, MD (Wellington andenepuru Hospitals, Wellington, NZ). We also acknowledge the
ole of Alan Jette, PhD (Rehabilitation Research and Training
enter on Medical Rehabilitation Outcomes, Boston University,oston, MA).Arch Phys Med Rehabil Vol 86, Suppl 2, December 2005
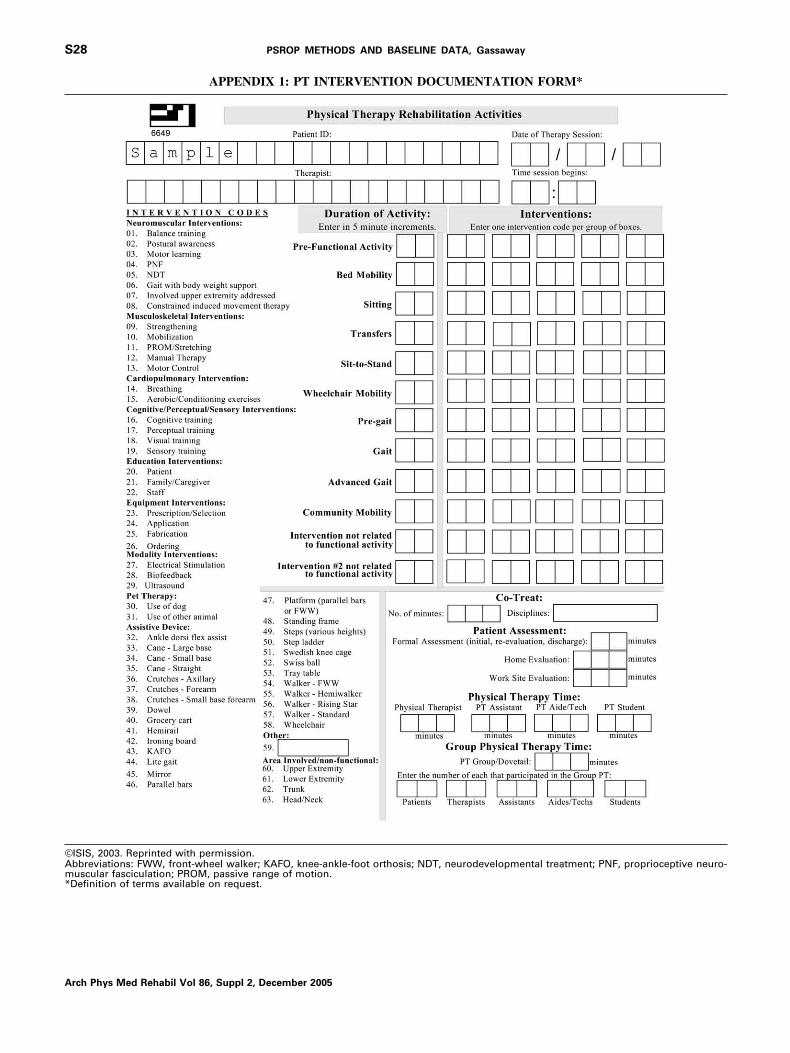
©Am*
S28 PSROP METHODS AND BASELINE DATA, Gassaway
A
APPENDIX 1: PT INTERVENTION DOCUMENTATION FORM*
ISIS, 2003. Reprinted with permission.bbreviations: FWW, front-wheel walker; KAFO, knee-ankle-foot orthosis; NDT, neurodevelopmental treatment; PNF, proprioceptive neuro-uscular fasciculation; PROM, passive range of motion.
Definition of terms available on request.
rch Phys Med Rehabil Vol 86, Suppl 2, December 2005
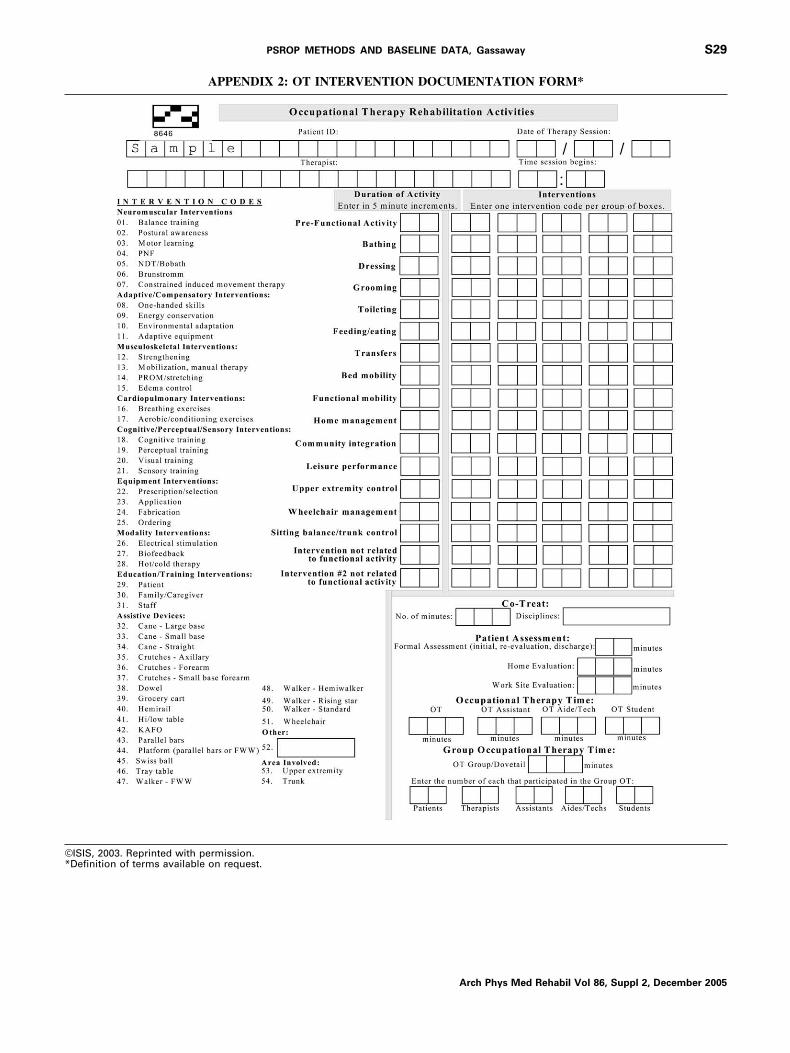
©*
S29PSROP METHODS AND BASELINE DATA, Gassaway
APPENDIX 2: OT INTERVENTION DOCUMENTATION FORM*
ISIS, 2003. Reprinted with permission.Definition of terms available on request.
Arch Phys Med Rehabil Vol 86, Suppl 2, December 2005
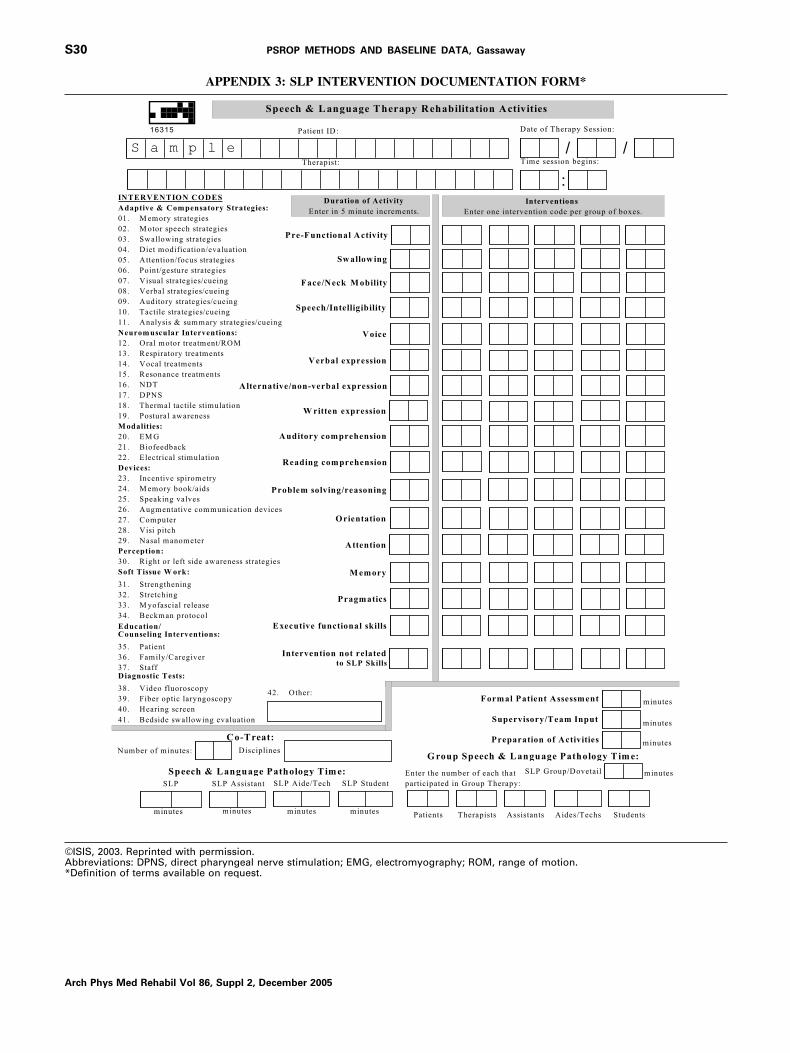
©A*
S30 PSROP METHODS AND BASELINE DATA, Gassaway
A
APPENDIX 3: SLP INTERVENTION DOCUMENTATION FORM*
ISIS, 2003. Reprinted with permission.bbreviations: DPNS, direct pharyngeal nerve stimulation; EMG, electromyography; ROM, range of motion.Definition of terms available on request.
rch Phys Med Rehabil Vol 86, Suppl 2, December 2005
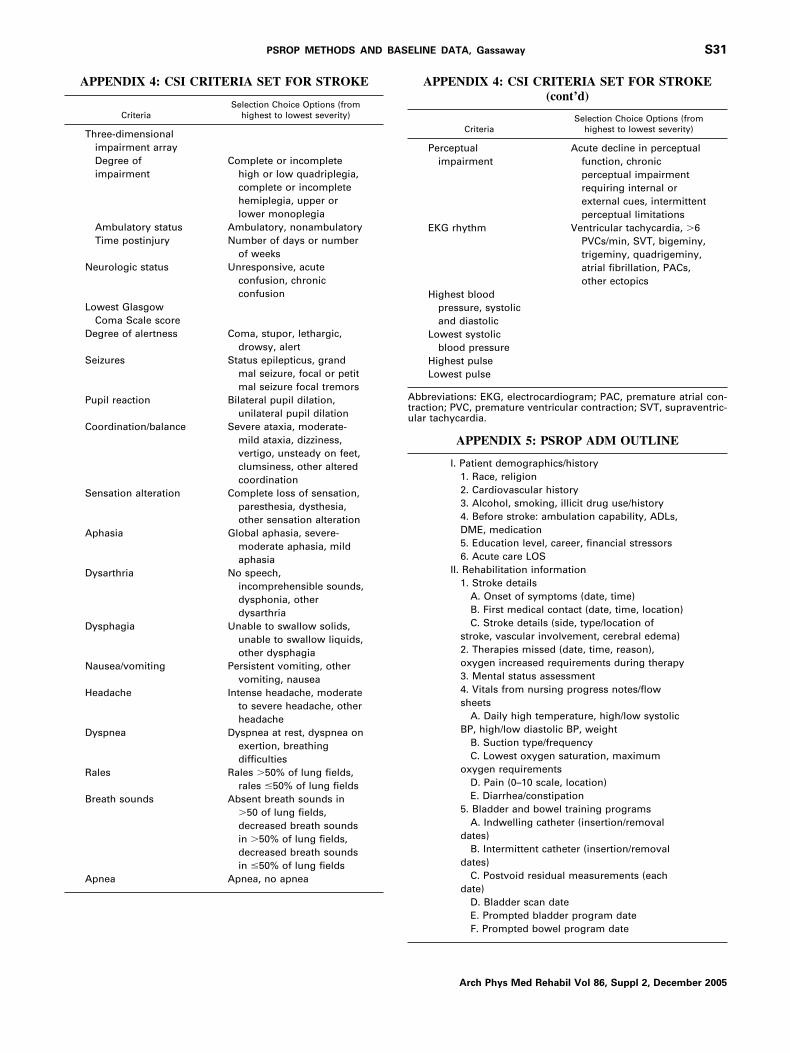
Atu
S31PSROP METHODS AND BASELINE DATA, Gassaway
APPENDIX 4: CSI CRITERIA SET FOR STROKE
CriteriaSelection Choice Options (from
highest to lowest severity)
Three-dimensionalimpairment arrayDegree ofimpairment
Complete or incompletehigh or low quadriplegia,complete or incompletehemiplegia, upper orlower monoplegia
Ambulatory status Ambulatory, nonambulatoryTime postinjury Number of days or number
of weeksNeurologic status Unresponsive, acute
confusion, chronicconfusion
Lowest GlasgowComa Scale score
Degree of alertness Coma, stupor, lethargic,drowsy, alert
Seizures Status epilepticus, grandmal seizure, focal or petitmal seizure focal tremors
Pupil reaction Bilateral pupil dilation,unilateral pupil dilation
Coordination/balance Severe ataxia, moderate-mild ataxia, dizziness,vertigo, unsteady on feet,clumsiness, other alteredcoordination
Sensation alteration Complete loss of sensation,paresthesia, dysthesia,other sensation alteration
Aphasia Global aphasia, severe-moderate aphasia, mildaphasia
Dysarthria No speech,incomprehensible sounds,dysphonia, otherdysarthria
Dysphagia Unable to swallow solids,unable to swallow liquids,other dysphagia
Nausea/vomiting Persistent vomiting, othervomiting, nausea
Headache Intense headache, moderateto severe headache, otherheadache
Dyspnea Dyspnea at rest, dyspnea onexertion, breathingdifficulties
Rales Rales �50% of lung fields,rales �50% of lung fields
Breath sounds Absent breath sounds in�50 of lung fields,decreased breath soundsin �50% of lung fields,decreased breath soundsin �50% of lung fields
Apnea Apnea, no apnea
APPENDIX 4: CSI CRITERIA SET FOR STROKE(cont’d)
CriteriaSelection Choice Options (from
highest to lowest severity)
Perceptualimpairment
Acute decline in perceptualfunction, chronicperceptual impairmentrequiring internal orexternal cues, intermittentperceptual limitations
EKG rhythm Ventricular tachycardia, �6PVCs/min, SVT, bigeminy,trigeminy, quadrigeminy,atrial fibrillation, PACs,other ectopics
Highest bloodpressure, systolicand diastolic
Lowest systolicblood pressure
Highest pulseLowest pulse
bbreviations: EKG, electrocardiogram; PAC, premature atrial con-raction; PVC, premature ventricular contraction; SVT, supraventric-lar tachycardia.
APPENDIX 5: PSROP ADM OUTLINE
I. Patient demographics/history1. Race, religion2. Cardiovascular history3. Alcohol, smoking, illicit drug use/history4. Before stroke: ambulation capability, ADLs,DME, medication5. Education level, career, financial stressors6. Acute care LOS
II. Rehabilitation information1. Stroke details
A. Onset of symptoms (date, time)B. First medical contact (date, time, location)C. Stroke details (side, type/location of
stroke, vascular involvement, cerebral edema)2. Therapies missed (date, time, reason),oxygen increased requirements during therapy3. Mental status assessment4. Vitals from nursing progress notes/flowsheets
A. Daily high temperature, high/low systolicBP, high/low diastolic BP, weight
B. Suction type/frequencyC. Lowest oxygen saturation, maximum
oxygen requirementsD. Pain (0–10 scale, location)E. Diarrhea/constipation
5. Bladder and bowel training programsA. Indwelling catheter (insertion/removal
dates)B. Intermittent catheter (insertion/removal
dates)C. Postvoid residual measurements (each
date)D. Bladder scan dateE. Prompted bladder program dateF. Prompted bowel program date
Arch Phys Med Rehabil Vol 86, Suppl 2, December 2005
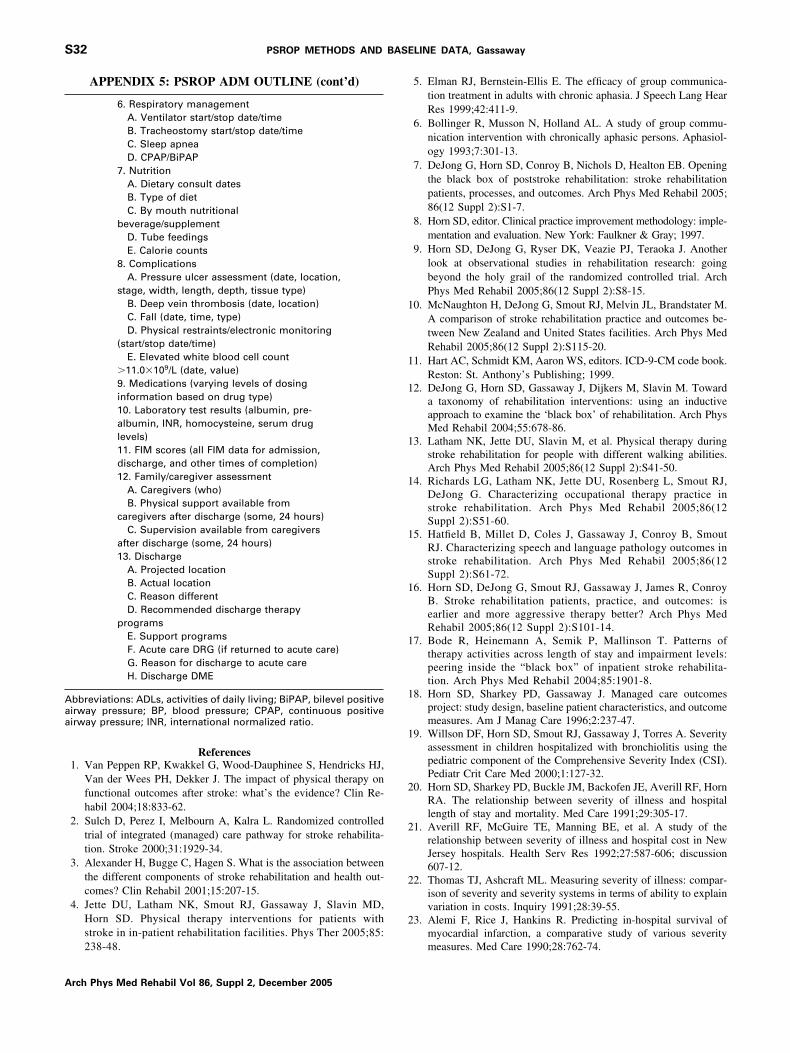
Aaa
1
1
1
1
1
1
1
1
1
1
2
2
2
2
S32 PSROP METHODS AND BASELINE DATA, Gassaway
A
APPENDIX 5: PSROP ADM OUTLINE (cont’d)
6. Respiratory managementA. Ventilator start/stop date/timeB. Tracheostomy start/stop date/timeC. Sleep apneaD. CPAP/BiPAP
7. NutritionA. Dietary consult datesB. Type of dietC. By mouth nutritional
beverage/supplementD. Tube feedingsE. Calorie counts
8. ComplicationsA. Pressure ulcer assessment (date, location,
stage, width, length, depth, tissue type)B. Deep vein thrombosis (date, location)C. Fall (date, time, type)D. Physical restraints/electronic monitoring
(start/stop date/time)E. Elevated white blood cell count
�11.0�109/L (date, value)9. Medications (varying levels of dosinginformation based on drug type)10. Laboratory test results (albumin, pre-albumin, INR, homocysteine, serum druglevels)11. FIM scores (all FIM data for admission,discharge, and other times of completion)12. Family/caregiver assessment
A. Caregivers (who)B. Physical support available from
caregivers after discharge (some, 24 hours)C. Supervision available from caregivers
after discharge (some, 24 hours)13. Discharge
A. Projected locationB. Actual locationC. Reason differentD. Recommended discharge therapy
programsE. Support programsF. Acute care DRG (if returned to acute care)G. Reason for discharge to acute careH. Discharge DME
bbreviations: ADLs, activities of daily living; BiPAP, bilevel positiveirway pressure; BP, blood pressure; CPAP, continuous positiveirway pressure; INR, international normalized ratio.
References1. Van Peppen RP, Kwakkel G, Wood-Dauphinee S, Hendricks HJ,
Van der Wees PH, Dekker J. The impact of physical therapy onfunctional outcomes after stroke: what’s the evidence? Clin Re-habil 2004;18:833-62.
2. Sulch D, Perez I, Melbourn A, Kalra L. Randomized controlledtrial of integrated (managed) care pathway for stroke rehabilita-tion. Stroke 2000;31:1929-34.
3. Alexander H, Bugge C, Hagen S. What is the association betweenthe different components of stroke rehabilitation and health out-comes? Clin Rehabil 2001;15:207-15.
4. Jette DU, Latham NK, Smout RJ, Gassaway J, Slavin MD,Horn SD. Physical therapy interventions for patients withstroke in in-patient rehabilitation facilities. Phys Ther 2005;85:
238-48.rch Phys Med Rehabil Vol 86, Suppl 2, December 2005
5. Elman RJ, Bernstein-Ellis E. The efficacy of group communica-tion treatment in adults with chronic aphasia. J Speech Lang HearRes 1999;42:411-9.
6. Bollinger R, Musson N, Holland AL. A study of group commu-nication intervention with chronically aphasic persons. Aphasiol-ogy 1993;7:301-13.
7. DeJong G, Horn SD, Conroy B, Nichols D, Healton EB. Openingthe black box of poststroke rehabilitation: stroke rehabilitationpatients, processes, and outcomes. Arch Phys Med Rehabil 2005;86(12 Suppl 2):S1-7.
8. Horn SD, editor. Clinical practice improvement methodology: imple-mentation and evaluation. New York: Faulkner & Gray; 1997.
9. Horn SD, DeJong G, Ryser DK, Veazie PJ, Teraoka J. Anotherlook at observational studies in rehabilitation research: goingbeyond the holy grail of the randomized controlled trial. ArchPhys Med Rehabil 2005;86(12 Suppl 2):S8-15.
0. McNaughton H, DeJong G, Smout RJ, Melvin JL, Brandstater M.A comparison of stroke rehabilitation practice and outcomes be-tween New Zealand and United States facilities. Arch Phys MedRehabil 2005;86(12 Suppl 2):S115-20.
1. Hart AC, Schmidt KM, Aaron WS, editors. ICD-9-CM code book.Reston: St. Anthony’s Publishing; 1999.
2. DeJong G, Horn SD, Gassaway J, Dijkers M, Slavin M. Towarda taxonomy of rehabilitation interventions: using an inductiveapproach to examine the ‘black box’ of rehabilitation. Arch PhysMed Rehabil 2004;55:678-86.
3. Latham NK, Jette DU, Slavin M, et al. Physical therapy duringstroke rehabilitation for people with different walking abilities.Arch Phys Med Rehabil 2005;86(12 Suppl 2):S41-50.
4. Richards LG, Latham NK, Jette DU, Rosenberg L, Smout RJ,DeJong G. Characterizing occupational therapy practice instroke rehabilitation. Arch Phys Med Rehabil 2005;86(12Suppl 2):S51-60.
5. Hatfield B, Millet D, Coles J, Gassaway J, Conroy B, SmoutRJ. Characterizing speech and language pathology outcomes instroke rehabilitation. Arch Phys Med Rehabil 2005;86(12Suppl 2):S61-72.
6. Horn SD, DeJong G, Smout RJ, Gassaway J, James R, ConroyB. Stroke rehabilitation patients, practice, and outcomes: isearlier and more aggressive therapy better? Arch Phys MedRehabil 2005;86(12 Suppl 2):S101-14.
7. Bode R, Heinemann A, Semik P, Mallinson T. Patterns oftherapy activities across length of stay and impairment levels:peering inside the “black box” of inpatient stroke rehabilita-tion. Arch Phys Med Rehabil 2004;85:1901-8.
8. Horn SD, Sharkey PD, Gassaway J. Managed care outcomesproject: study design, baseline patient characteristics, and outcomemeasures. Am J Manag Care 1996;2:237-47.
9. Willson DF, Horn SD, Smout RJ, Gassaway J, Torres A. Severityassessment in children hospitalized with bronchiolitis using thepediatric component of the Comprehensive Severity Index (CSI).Pediatr Crit Care Med 2000;1:127-32.
0. Horn SD, Sharkey PD, Buckle JM, Backofen JE, Averill RF, HornRA. The relationship between severity of illness and hospitallength of stay and mortality. Med Care 1991;29:305-17.
1. Averill RF, McGuire TE, Manning BE, et al. A study of therelationship between severity of illness and hospital cost in NewJersey hospitals. Health Serv Res 1992;27:587-606; discussion607-12.
2. Thomas TJ, Ashcraft ML. Measuring severity of illness: compar-ison of severity and severity systems in terms of ability to explainvariation in costs. Inquiry 1991;28:39-55.
3. Alemi F, Rice J, Hankins R. Predicting in-hospital survival ofmyocardial infarction, a comparative study of various severity
measures. Med Care 1990;28:762-74.
2
2
2
2
2
2
3
3
3
S33PSROP METHODS AND BASELINE DATA, Gassaway
4. Horn SD, Torres A Jr, Willson D, Dean JM, Gassaway J, SmoutR. Development of a pediatric age- and disease-specific severitymeasure. J Pediatr 2002;141:496-503.
5. Conroy B, Zorowitz R, Horn SD, Ryser DK, Teraoka J, Smout RJ.An exploration of central nervous system medication use andoutcomes in stroke rehabilitation. Arch Phys Med Rehabil 2005;86(12 Suppl 2):S73-81.
6. James R, Gines D, Menlove A, Horn SD, Gassaway J, Smout RJ.Nutrition support (tube feeding) as a rehabilitation intervention.Arch Phys Med Rehabil 2005;86(12 Suppl 2):S82-92.
7. Maulden SA, Gassaway J, Horn SD, Smout RJ, DeJong G. Timingof initiation of rehabilitation after stroke. Arch Phys Med Rehabil2005;86(12 Suppl 2):S34-40.
8. DeJong G, Horn SD, Smout RJ, Ryser DK. The early impact of
the inpatient rehabilitation facility prospective payment system on astroke rehabilitation case mix, practice patterns, and outcomes.Arch Phys Med Rehabil 2005;86(12 Suppl 2):S93-100.
9. Greenberg E, Treger J, Ring H. Post-stroke follow-up in rehabil-itation outpatient clinic. Isr Med Assoc J 2004;6:603-6.
0. Bohannon RW, Ahlquist M, Lee N, Maljanian R. Functional gainsduring acute hospitalization for stroke. Neurorehabil Neural Re-pair 2003;17:192-5.
1. Hamilton BB, Laughlin JA, Fiedler RC, Granger CV. Interraterreliability of the 7-level functional independence measure (FIM).Scand J Rehabil Med 1994;26:115-9.
2. Centers for Medicare and Medicaid Services. Medicare Program;prospective payment system for inpatient rehabilitation facilities,final rule. 66 Federal Register 41315 (2001).
Supplier. SAS Institute Inc, 100 SAS Campus Dr, Cary, NC 27513.
Arch Phys Med Rehabil Vol 86, Suppl 2, December 2005
Related Documents