APPLYING SIX SIGMA QUALITY MANAGEMENT IN CLOTHES FOLDING TEAM MEMBERS: (ACCORDING TO STUDENT ID) WANG, JUN 2009210552 CUI, WEN 2009210554 ZHAN, GAO 2009210537 QIN, SONG 2009210568 LIN, TANG (Team Leader) 2009310284 ADVANCED QUALITY MANAGEMENT SPRING 2010

Welcome message from author
This document is posted to help you gain knowledge. Please leave a comment to let me know what you think about it! Share it to your friends and learn new things together.
Transcript

APPLYING SIX SIGMA QUALITY
MANAGEMENT IN CLOTHES
FOLDING
TEAM MEMBERS:
(ACCORDING TO STUDENT ID)
WANG, JUN 2009210552
CUI, WEN 2009210554
ZHAN, GAO 2009210537
QIN, SONG 2009210568
LIN, TANG (Team Leader) 2009310284
ADVANCED QUALITY MANAGEMENT
SPRING 2010

i
Contents
ABSTRACT ...................................................................................................... - 1 -
1 INTRODUCTION ...................................................................................... - 1 -
1.1 Motivation ........................................................................................ - 1 -
1.2 Flow chart of project development ................................................... - 2 -
1.3 Implementation stages ...................................................................... - 3 -
2 CASE STUDY ............................................................................................ - 5 -
2.1 Define phase ..................................................................................... - 5 -
2.1.1. Define customers and requirements ....................................... - 5 -
2.1.2. Analyze SIPOC of the project ................................................ - 7 -
2.1.3. Determine CTQ ...................................................................... - 8 -
2.1.4. Determine variables we should measure .............................. - 11 -
2.2 Measurement phase ........................................................................ - 12 -
2.2.1. Mapping the current process ................................................ - 12 -
2.2.2. Cause and effect diagram ..................................................... - 13 -
2.2.3. Data collection plan .............................................................. - 13 -
2.2.4. Measurement System Analysis ............................................ - 14 -
2.2.5. Process capability analysis ................................................... - 15 -
2.3 Analysis phase ................................................................................ - 17 -
2.3.1. Analysis of first experiment ................................................. - 18 -
2.3.2. Analysis of second experiment ............................................. - 18 -

ii
2.3.3. Analysis of third experiment ................................................ - 23 -
2.4 Improvement phase ........................................................................ - 27 -
2.5 Control phase .................................................................................. - 36 -
3 CONCLUSION AND FUTURE WORK ................................................. - 37 -
3.1 Conclusion ...................................................................................... - 37 -
3.2 Future work .................................................................................... - 38 -
4 REFERANCER......................................................................................... - 38 -
- 1 -
ABSTRACT
“Six sigma” is a top down methodology to solve the quality issues in the
manufacture or service system. After the birth of it in Motorola in 1980s, six sigma
has performed an active role in all industries to improve processes. Based on the
knowledge we have learned in the class, we chose to practice our problem solving
ability by a self organized project, which aims to improve the efficiency of T-shirt
folding by using the classical DMAIC analysis method. Finally, after the whole
semester we finished 4 experiments in total and developed a proto-model tool. The
continuous improvement process utilized us all-round ability, i.e. Pareto analysis,
ANOVA, Measurement system analysis, Brain storming etc. Process ability of
different index show significant improvement, for example the Cp of width difference
of the upper and lower side, which is the most common defect shown in the
experiment, increased from 0.44 to 0.92 and finally reach 2.14. Based on the
achievement we have got through the improvement process, we believe that the tool
we developed will help our target customer in their daily work.
1 INTRODUCTION
1.1 Motivation
In real world, we will always be bothered by lots of small things, such as tidying
the room, doing the laundry, folding the clothes. But smart people always develop
advanced tools to help us to get rid of such annoying stuff. We have already got
vacuum cleaner and washing machine to easy the work intensity of household duty,
but how about the folding clothes? Driven by such curiosity, we start our adventure
trying to find a more scientific way to get easier procedure or tools to please our
potential customer.
So after the discussion of what we could do through the “clothes folding” project,
- 2 -
we defined the scope of work:
“ Our project is to develop a more efficient and easy clothes folding method by
trying different methodologies or advanced tools to reduce size variation and time
consumption.”
Though we always complain the folded clothes are not identical which lead us
impossible to make our wardrobe clean and tidy. But compared with the workers who
are responsible for folding T-shirt in manufacturing company and people who sale
T-shirt in the mall, our problem is insignificant. So our customer, which defined as the
T-shirt folding workers in factory and shops, will benefit from our product and
solution. Professional means high standard requirement, so our project‟s output for
these experienced workers should be consistent size within reasonable time
requirement.
According to Linder man et al.‟s definition of Six Sigma:
“Six Sigma is an organized and systematic method for strategic process
improvement and new product and service development that relies on statistical
methods and the scientific method to make dramatic reductions in customer defined
defect rates”.
Here we decide to follow Six Sigma‟s typical DMAIC steps, which consist of
Define Measure Analysis Implement Control, to finish our project.
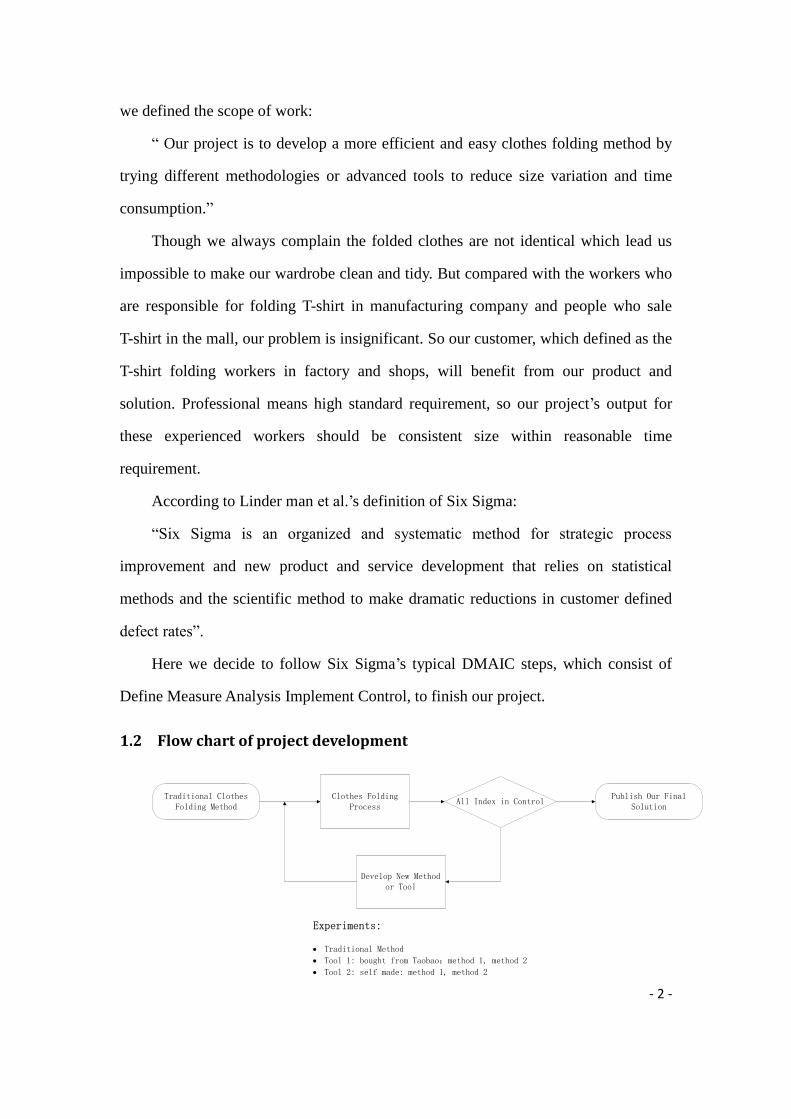
1.2 Flow chart of project development
Traditional Clothes Folding Method
Clothes Folding Process
All Index in Control
Develop New Method or Tool
Publish Our Final Solution
Experiments:
· Traditional Method
· Tool 1: bought from Taobao:method 1, method 2
· Tool 2: self made: method 1, method 2
- 3 -
Figure 1-1 Flow chart of project development
Figure 1-1 shows we start from the tradition method. By continuous trying of
different methods, we finally publish our wooden board tool. Here we conducted 3
main experiments.
Experiment 1: traditional method, used as a contrast of the latter ones;
Experiment 2: tool bought from Taobao, and try 2 methods of using it;
Experiment 3: made tool by hand, prove our improvement.
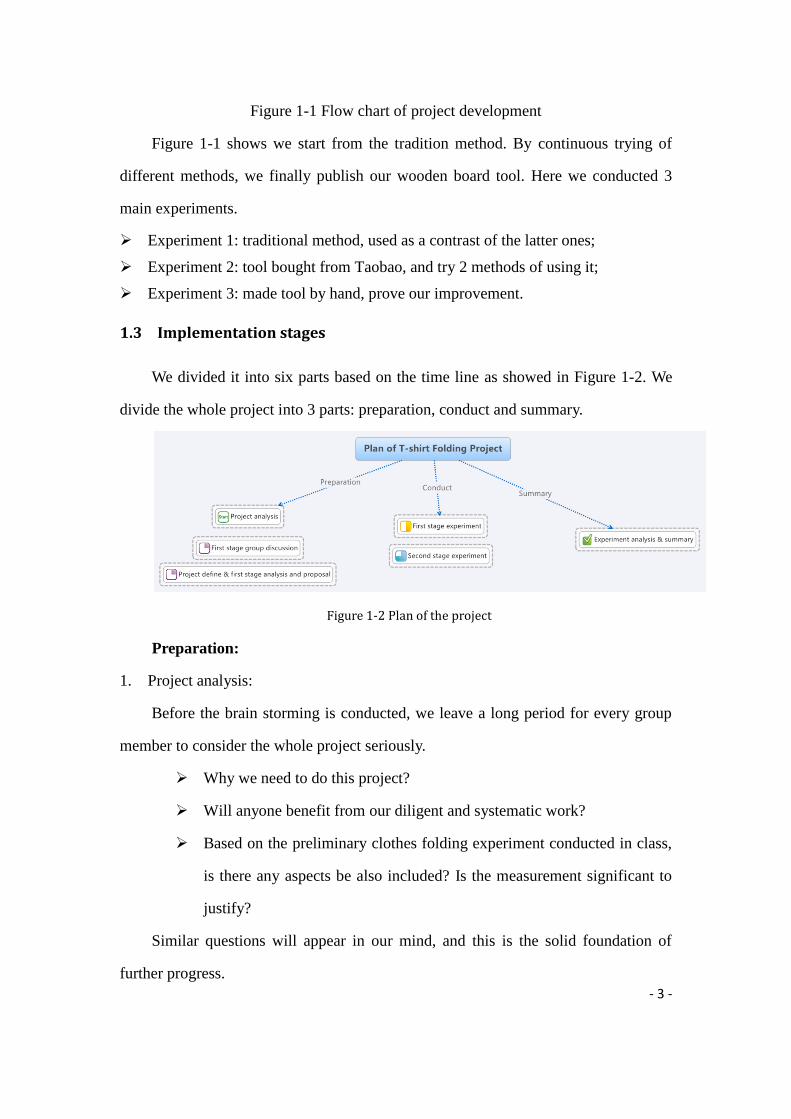
1.3 Implementation stages
We divided it into six parts based on the time line as showed in Figure 1-2. We
divide the whole project into 3 parts: preparation, conduct and summary.
Figure 1-2 Plan of the project
Preparation:
1. Project analysis:
Before the brain storming is conducted, we leave a long period for every group
member to consider the whole project seriously.
Why we need to do this project?
Will anyone benefit from our diligent and systematic work?
Based on the preliminary clothes folding experiment conducted in class,
is there any aspects be also included? Is the measurement significant to
justify?
Similar questions will appear in our mind, and this is the solid foundation of
further progress.

- 4 -
2. First stage group discussion
After the intuitive explore of the potential working aspects of clothes folding
project, the thoughts sharing process will make us understand each other in a
comprehensive way rather than the chapter divided method. A blue picture was
finished after the discussion.
Define: what our goals, problem statements, CTQs, 5M1E etc.
Measurement: indicators, error recourse, measurement methods etc.
Analysis: fish-bone chart, process map, potential improvement aspects etc.
Improvement: process flows, tools etc.
Control: teaching process and later usage etc.
3. Project define & first stage analysis and proposal
Although the previous discussion has built a solid foundation of the later process,
paper work and summary docs are needed to explain the defined aspects clearly.
Causal relationship chart, swimming lane process chart, CTQs choosing and so on
will be summarized and future experiment plans will be developed.
Conduct:
1. First stage experiment
After absorbing the critical experience of the first experiment in class, we come
to a conclusion that the T-shirt which has lines made by folding will leads to
unrealistic and false appearance short working time. So the first stage will chose a
general T-shirt and conducted the experiment again. After that some improved
methods is also be tested for further data collection.
After experiments, the analysis and data mining will leads the group some useful
conclusions and new ideas will also be designed in the next phase experiment.
2. Second stage experiment
- 5 -
The designed experiments which introduce tools were conducted. During this
phase we try different method to make the best use of the bought tool. But finally we
decided to make a new one, according to the founding of the experience gathered. At
this stage, our group member which is the executor of the experiments will be tested
first. And then another group member will be taught in the optimized process and
advance tools to test our project result.
Summary:
Summary the experience of the DMAIC improvement and finished the data
explanation work. Using a top-down methodology to explain our project and finished
the over-all doc files.
2 CASE STUDY
2.1 Define phase
2.1.1. Define customers and requirements
In our project, customers are those workers who are responsible for folding
T-shirt in manufacturing company, and people who sale T-shirt in the mall. After
folding T-shirt, they continue to put the folded T-shirt in a packing bag. Customers
require that they can use less time to finish folding a T-shirt, and also get good quality
of T-shirt folding in a scientific way. The requirements of customers can be described
in tree graph, as below in Figure 2-1.

- 6 -
Figure 2-1 Tree graph of the request of customers
Each requirement is defined in details as below:
1. Time consumption
Customers require that time spent on folding beginning from holding the
T-shirt in hand to putting the folded T-shirt on a table should be as little as
possible.
2. Width difference
Customers require that width difference between the upper side and lower
side of the folded T-shirt should be as little as possible.
3. Characteristic of symmetry
Customers require that the folded T-shirt should be symmetric according to
the centric line of T-shirt.
4. Length variation
Customers require that the length of the folded T-shirt should be constant,
and length variation should be as little as possible.
5. Width extension
Customers require that the width of bottom layer should not be bigger than
the upper layer of the folded T-shirt, namely width extension should be close to
zero.
6. Length extension
- 7 -
Customers require that the length of bottom layer should not be bigger than
the upper layer of the folded T-shirt, namely length extension should be close to
zero.
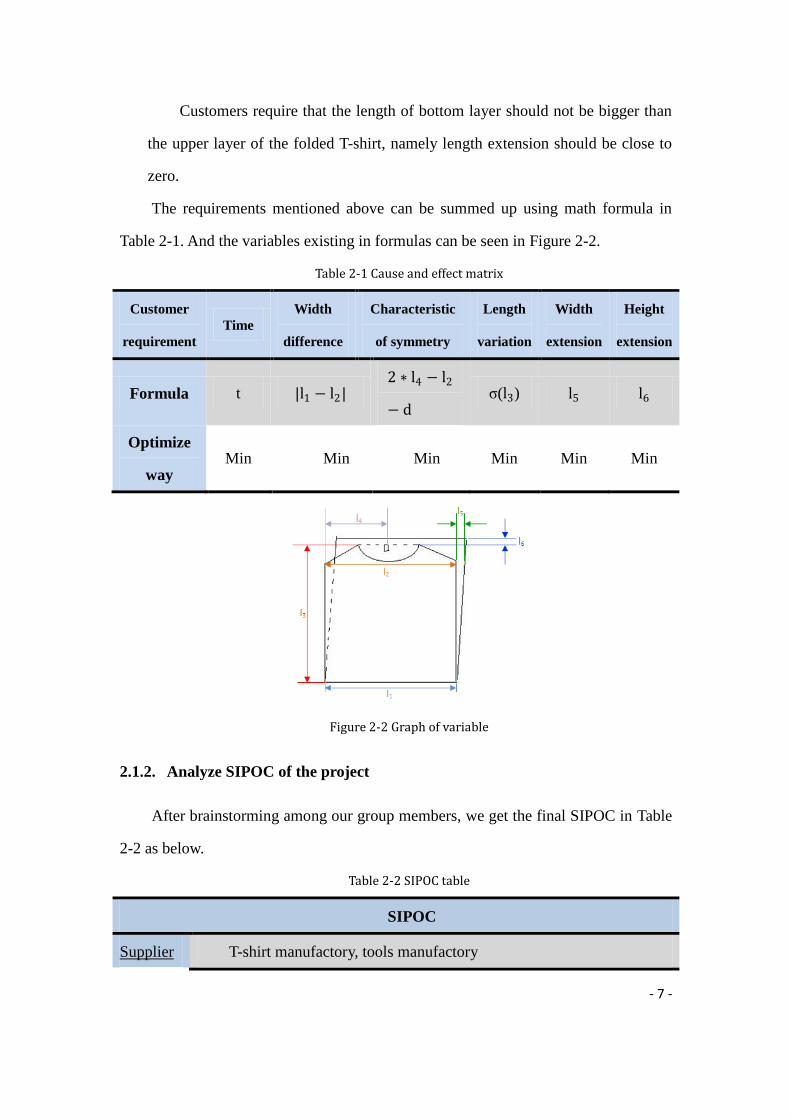
The requirements mentioned above can be summed up using math formula in
Table 2-1. And the variables existing in formulas can be seen in Figure 2-2.
Table 2-1 Cause and effect matrix
Customer
requirement
Time
Width
difference
Characteristic
of symmetry
Length
variation
Width
extension
Height
extension
Formula t |l1 − l2| 2 ∗ l4 − l2
− d σ(l3) l5 l6
Optimize
way Min Min Min Min Min Min
Figure 2-2 Graph of variable
2.1.2. Analyze SIPOC of the project
After brainstorming among our group members, we get the final SIPOC in Table
2-2 as below.
Table 2-2 SIPOC table
SIPOC
Supplier T-shirt manufactory, tools manufactory
- 8 -
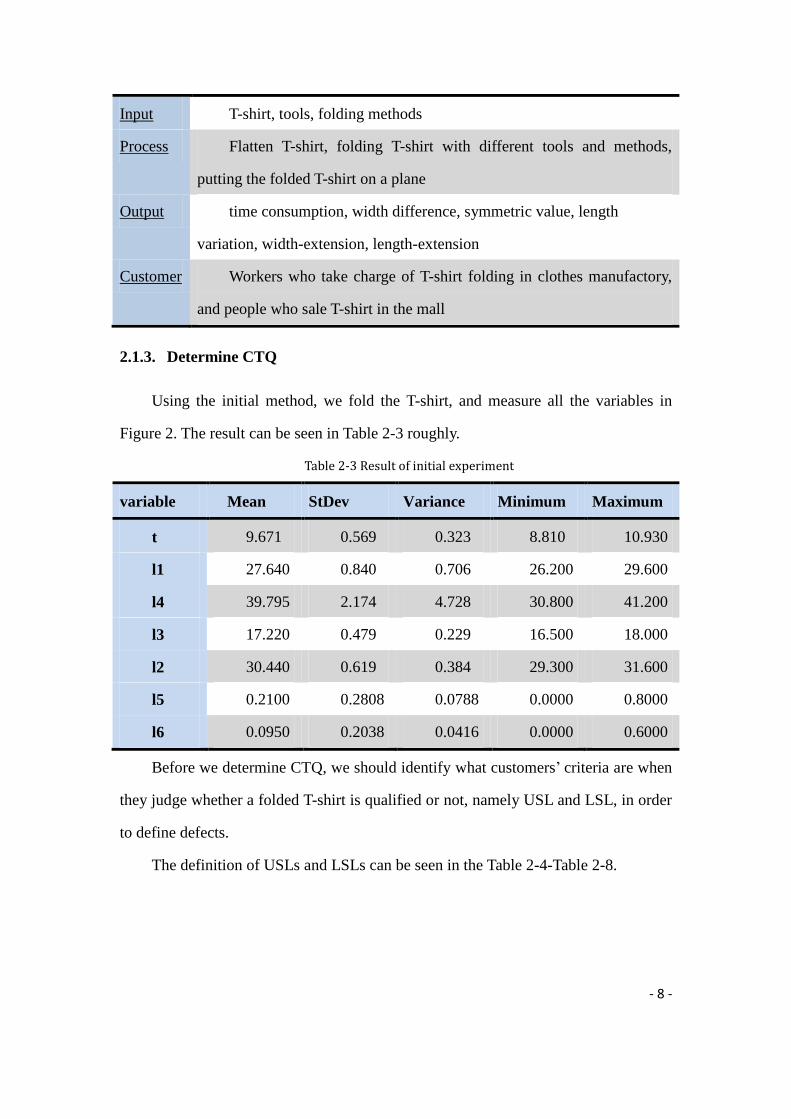
Input T-shirt, tools, folding methods
Process Flatten T-shirt, folding T-shirt with different tools and methods,
putting the folded T-shirt on a plane
Output time consumption, width difference, symmetric value, length
variation, width-extension, length-extension
Customer Workers who take charge of T-shirt folding in clothes manufactory,
and people who sale T-shirt in the mall
2.1.3. Determine CTQ
Using the initial method, we fold the T-shirt, and measure all the variables in
Figure 2. The result can be seen in Table 2-3 roughly.
Table 2-3 Result of initial experiment
variable Mean StDev Variance Minimum Maximum
t 9.671 0.569 0.323 8.810 10.930
l1 27.640 0.840 0.706 26.200 29.600
l4 39.795 2.174 4.728 30.800 41.200
l3 17.220 0.479 0.229 16.500 18.000
l2 30.440 0.619 0.384 29.300 31.600
l5 0.2100 0.2808 0.0788 0.0000 0.8000
l6 0.0950 0.2038 0.0416 0.0000 0.6000
Before we determine CTQ, we should identify what customers‟ criteria are when
they judge whether a folded T-shirt is qualified or not, namely USL and LSL, in order
to define defects.
The definition of USLs and LSLs can be seen in the Table 2-4-Table 2-8.

- 9 -
Table 2-4 Definition of USL and LSL of time consumption
Table 2-5 Definition of USL and LSL of width difference & characteristic of symmetry
Table 2-6 Definition of USL and LSL of length variation
Table 2-7 Definition of USL and LSL of width extension

- 10 -
Table 2-8 Definition of USL and LSL of height extension
Therefore, the USLs and LSLs mentioned above can be summed up in Table 2-9
Table 2-9 USLs and LSLs according to customers’ requirements
request LSL USL
time consumption 0s 10.6381s
width difference -1.452cm 1.452 cm
symmetric value -1.452 cm 1.452 cm
length variation 37.80525 cm 41.78475 cm
width-extension 0 0.2904 cm
length-extension 0 0.39795 cm
Thus, a folded T-shirt can be considered as a defect when its characteristics
regarding time consumption, width difference, symmetric value, length variation,
width-extension, and length-extension go beyond the USLs and LSLs.
Next step, we analyze the experiment result of our initial method, and get the
defect table, as seen in Table 2-10.
Table 2-10 Defect table
Defect type number of defect
time consumption 2
width difference 18
symmetric value 6
length variation 1
width-extension 8
- 11 -
length-extension 3
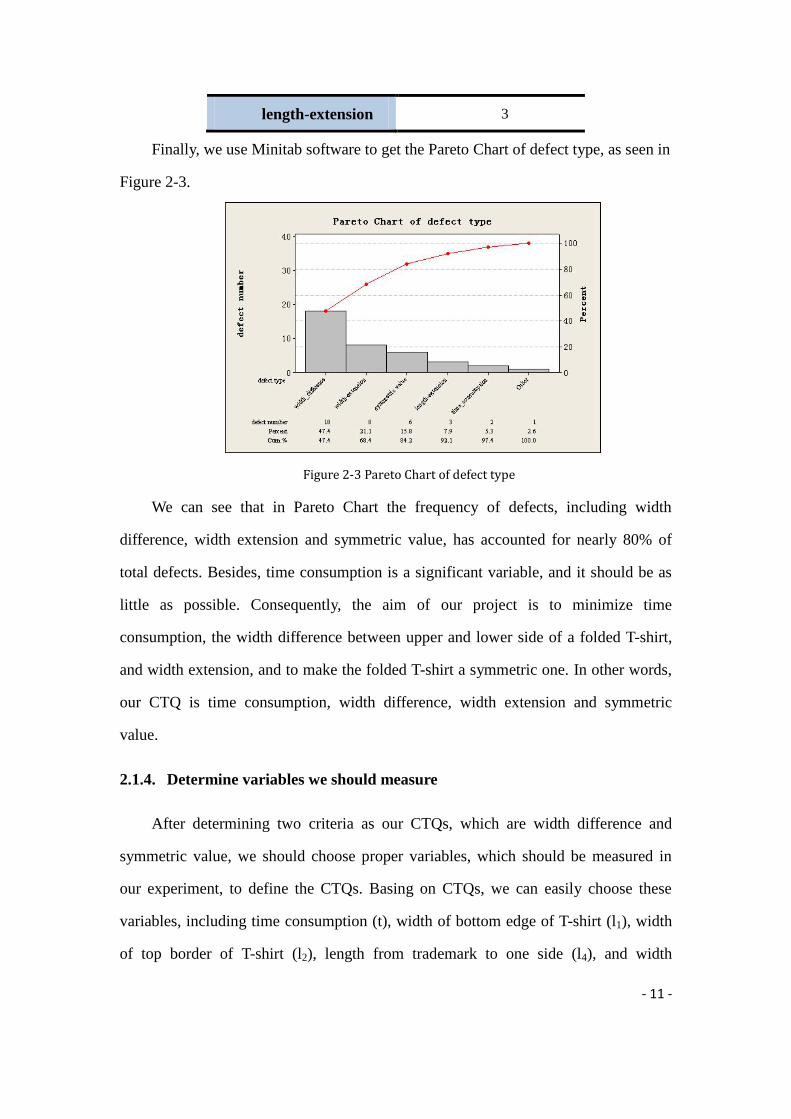
Finally, we use Minitab software to get the Pareto Chart of defect type, as seen in
Figure 2-3.
Figure 2-3 Pareto Chart of defect type
We can see that in Pareto Chart the frequency of defects, including width
difference, width extension and symmetric value, has accounted for nearly 80% of
total defects. Besides, time consumption is a significant variable, and it should be as
little as possible. Consequently, the aim of our project is to minimize time
consumption, the width difference between upper and lower side of a folded T-shirt,
and width extension, and to make the folded T-shirt a symmetric one. In other words,
our CTQ is time consumption, width difference, width extension and symmetric
value.
2.1.4. Determine variables we should measure
After determining two criteria as our CTQs, which are width difference and
symmetric value, we should choose proper variables, which should be measured in
our experiment, to define the CTQs. Basing on CTQs, we can easily choose these
variables, including time consumption (t), width of bottom edge of T-shirt (l1), width
of top border of T-shirt (l2), length from trademark to one side (l4), and width

- 12 -
extension (l5). And the CTQs can be calculated in this way.
Time consumption=t
Width difference= |l2-l1|
Symmetric value=2* l3+d-l2
Width extension=l5
Besides, when we reduce the defects caused by the CTQs, we should not
increase the defects caused by other aspects. Therefore, we should measure l3 and l6 in
order to monitor their situation.
Finally, the goal statement of the project defined by the team members was the
reduction of defects from 1 DPU to 0.067 DPU (defects per unit).
2.2 Measurement phase
Measurement is the second phase of the DMIAC project; it is a critical step to
identify the relationship of the output and the input factors. Based on the CTQ defined
in the define phase, through the measurement phase, we have to clarify measurement
of the output, and collect the data to describe output quantification. Especially,
through the process capability analysis can we identify the fluctuate rule of the output
„Y‟, and catch up the potential chance to improve. Hence, the measurement phase has
the purpose of mapping the current process through flow chart and establishing cause
and effect diagram that describe the project output „Y‟.
2.2.1. Mapping the current process
According to the analysis of the team, we used flow chart to map our process
show as Figure 2-4:

- 13 -
Figure 2-4 T-shirt folding process
2.2.2. Cause and effect diagram
After identifying the process of folding T-shirt, we proceeded to analyze the
potential causes of the defects. Cause and effect analysis was carried out to illustrate
the various causes that affect the quality and velocity. Figure 2-5 shows the potential
causes that could generate a failure in the T-shirt folding operation.
Figure 2-5 Cause and effect diagram
2.2.3. Data collection plan
Though we have already found the potential causes of the defects of folded
T-shirt, but due to the constraint of the time and resources, we just focused on the
aspects of the methods and measurements. Besides, our projects‟ goal is to provide a
way for a manufacturing company and people who sale T-shirt in the mall, hence, we
don‟t consider the manpower, material and other aspects. Since they have to fold all
different kinds of clothes in various places, though these various factors would
- 14 -
influence their performance.
Hence, in our project, we focus on the measurements and methods to fold clothes.
Based on the defects we define, we give the indictors; we have to measure the
indictors and collect data in different situation, including 1 6l l showed as bellow
and time to finish one time folding.
2.2.4. Measurement System Analysis
In the part of measurement system analysis, we want to identify the accuracy and
precision of our measurement system which are always indicated by the bias and
variation. According to the Gauge R&R analysis, the variation in measurement system
is sub-divided into variation due to the repeatability and variation due to the
reproducibility. In the first improvement experiment we have two persons to measure
the folded T-shirt twice each. We analyzed the data and the result showed as bellow.
We have six indicators to measure showed as below figure, the tool we use is a
ruler and its accuracy reaches to „cm‟. The measure process is very simple, we just put
the ruler to the indicators we want to measure and read the data we get. So we have to
evaluate the measurement system to determine whether the system can meet our
requirement.
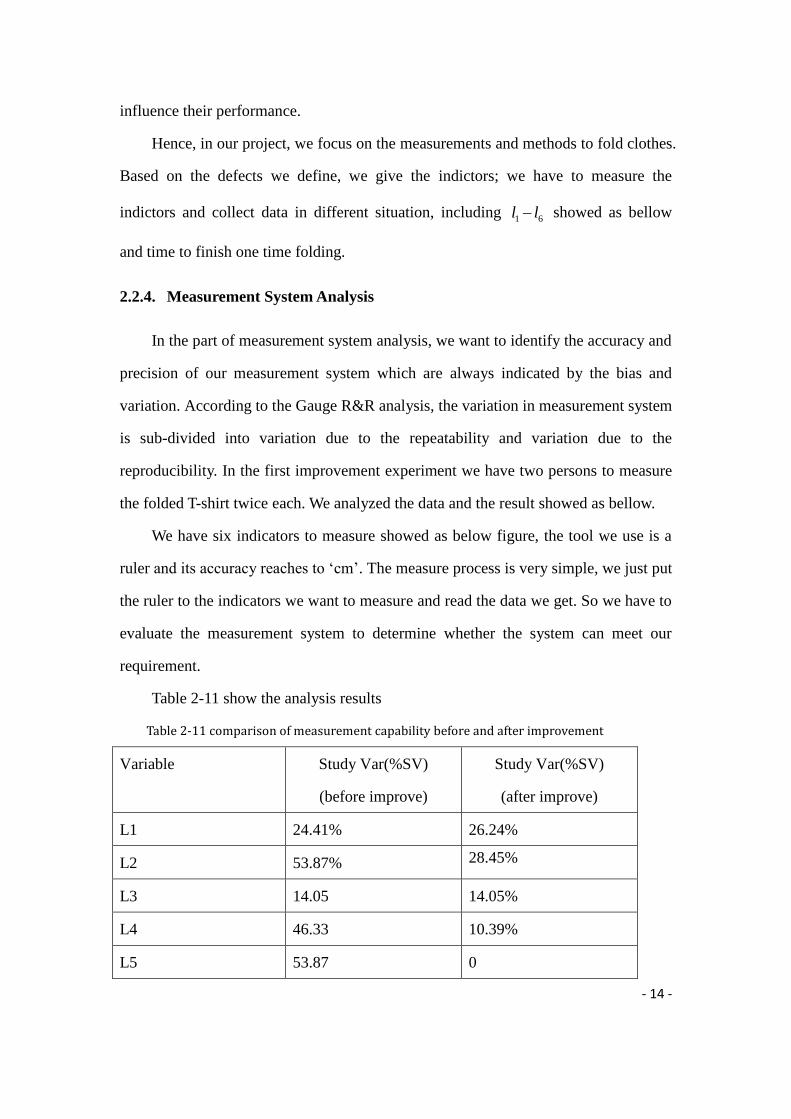
Table 2-11 show the analysis results
Table 2-11 comparison of measurement capability before and after improvement
Variable Study Var(%SV)
(before improve)
Study Var(%SV)
(after improve)
L1 24.41% 26.24%
L2 53.87% 28.45%
L3 14.05 14.05%
L4 46.33 10.39%
L5 53.87 0

- 15 -
From the second column of Table 2-11, we can see the P/TV value of the
measurement system of „L2‟ and „L4‟ are 53.87% and 46.33% separately, which are
for more large than 30%, so the variation is too big to accept, Besides, the number of
groups is 2, which is also less than 5, the discrimination capability still can‟t satisfy
our demand. Hence, we have to improve the measurement system in order to obtain
more reliable data.
The third column of Table 2-11 show the improvement of the measurement
system, we can find that the measurement system is more accurate and precise, which
is more reliable to use for measuring. Therefore, comparing the previous
measurement system, the proposed measuring system shows a relative good
measurement system capability.
2.2.5. Process capability analysis
First experiment:
The precondition of the process capability analysis is the output has to follow
normal distribution, so before analysis, we have to test the normal distribution of the
data.
For the first experiment, L5 don‟t follow the normal distribution. After Box-Cox
transferring, we obtain the process capability for every parameter, showed as Figure
2-6. According to the process capability analysis, we can see that the index of the
process capability is very low; it means that there is large space to improve.
543210-1
LSL Target USL
LSL -1.45
Target 0
USL 1.45
Sample Mean 2.77368
Sample N 19
StDev(Within) 1.09774
StDev(Overall) 1.03217
Process Data
Cp 0.44
CPL 1.28
CPU -0.40
Cpk -0.40
Pp 0.47
PPL 1.36
PPU -0.43
Ppk -0.43
Cpm 0.16
Overall Capability
Potential (Within) Capability
PPM < LSL 0.00
PPM > USL 894736.84
PPM Total 894736.84
Observed Performance
PPM < LSL 59.64
PPM > USL 886056.78
PPM Total 886116.42
Exp. Within Performance
PPM < LSL 21.38
PPM > USL 900153.26
PPM Total 900174.64
Exp. Overall Performance
Within
Overall
Process Capability of L2-L1
3210-1-2
LSL Target USL
LSL -1.45
Target 0
USL 1.45
Sample Mean 0.452632
Sample N 19
StDev(Within) 1.11693
StDev(Overall) 1.26814
Process Data
Cp 0.43
CPL 0.57
CPU 0.30
Cpk 0.30
Pp 0.38
PPL 0.50
PPU 0.26
Ppk 0.26
Cpm 0.36
Overall Capability
Potential (Within) Capability
PPM < LSL 0.00
PPM > USL 315789.47
PPM Total 315789.47
Observed Performance
PPM < LSL 44242.40
PPM > USL 185940.93
PPM Total 230183.33
Exp. Within Performance
PPM < LSL 66764.64
PPM > USL 215793.36
PPM Total 282558.00
Exp. Overall Performance
Within
Overall
Process Capability of 2L2-L4-3.5
Figure 2-6 Process capability of symmetric and width difference
- 16 -
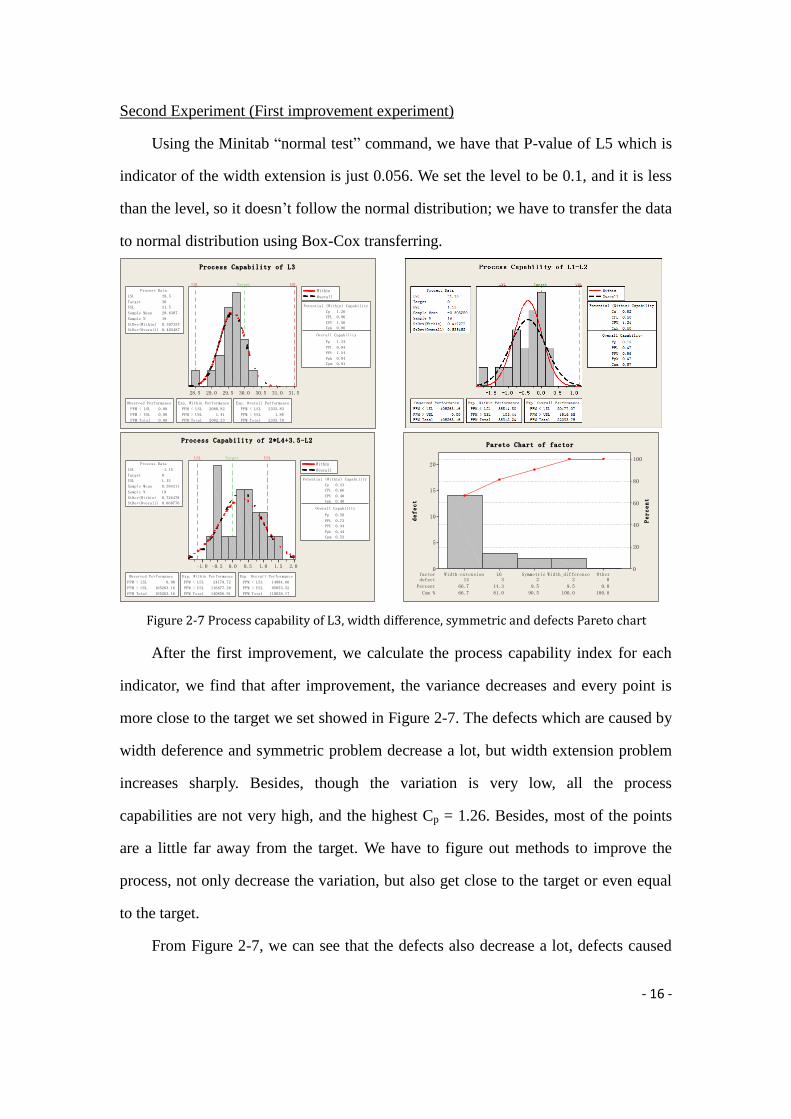
Second Experiment (First improvement experiment)
Using the Minitab “normal test” command, we have that P-value of L5 which is
indicator of the width extension is just 0.056. We set the level to be 0.1, and it is less
than the level, so it doesn‟t follow the normal distribution; we have to transfer the data
to normal distribution using Box-Cox transferring.
31.531.030.530.029.529.028.5
LSL Target USL
LSL 28.5
Target 30
USL 31.5
Sample Mean 29.6387
Sample N 19
StDev(Within) 0.397357
StDev(Overall) 0.402487
Process Data
Cp 1.26
CPL 0.96
CPU 1.56
Cpk 0.96
Pp 1.24
PPL 0.94
PPU 1.54
Ppk 0.94
Cpm 0.91
Overall Capability
Potential (Within) Capability
PPM < LSL 0.00
PPM > USL 0.00
PPM Total 0.00
Observed Performance
PPM < LSL 2080.82
PPM > USL 1.41
PPM Total 2082.23
Exp. Within Performance
PPM < LSL 2333.83
PPM > USL 1.88
PPM Total 2335.70
Exp. Overall Performance
Within
Overall
Process Capability of L3
2.01.51.00.50.0-0.5-1.0
LSL Target USL
LSL -1.15
Target 0
USL 1.15
Sample Mean 0.284211
Sample N 19
StDev(Within) 0.726478
StDev(Overall) 0.660776
Process Data
Cp 0.53
CPL 0.66
CPU 0.40
Cpk 0.40
Pp 0.58
PPL 0.72
PPU 0.44
Ppk 0.44
Cpm 0.53
Overall Capability
Potential (Within) Capability
PPM < LSL 0.00
PPM > USL 105263.16
PPM Total 105263.16
Observed Performance
PPM < LSL 24179.72
PPM > USL 116677.20
PPM Total 140856.91
Exp. Within Performance
PPM < LSL 14984.66
PPM > USL 95053.52
PPM Total 110038.17
Exp. Overall Performance
Within
Overall
Process Capability of 2*L4+3.5-L2
defect 14 3 2 2 0
Percent 66.7 14.3 9.5 9.5 0.0
Cum % 66.7 81.0 90.5 100.0 100.0
factor OtherWidth_differenceSymmetricL6Width-extension
20
15
10
5
0
100
80
60
40
20
0
defect
Percent
Pareto Chart of factor
Figure 2-7 Process capability of L3, width difference, symmetric and defects Pareto chart
After the first improvement, we calculate the process capability index for each
indicator, we find that after improvement, the variance decreases and every point is
more close to the target we set showed in Figure 2-7. The defects which are caused by
width deference and symmetric problem decrease a lot, but width extension problem
increases sharply. Besides, though the variation is very low, all the process
capabilities are not very high, and the highest Cp = 1.26. Besides, most of the points
are a little far away from the target. We have to figure out methods to improve the
process, not only decrease the variation, but also get close to the target or even equal
to the target.
From Figure 2-7, we can see that the defects also decrease a lot, defects caused

- 17 -
by the width difference and symmetric problems decrease sharply, but another factor
caused defects increase. Besides, the process capability index is not high enough and
time consumption increases. Hence, there is still space to improve.
Third Experiment (Second improvement experiment)
After the second improvement experiment, we got the data. Using Minitab to
statistic the data, the process capability shows as Figure 2-8. We can see that the
process capability improve a lot, the highest Cp reaches to almost 3. Hence, the
improvement is acceptable and effect.
1.51.00.50.0-0.5-1.0-1.5
LSL Target USL
LSL -1.55
Target 0
USL 1.55
Sample Mean 0.29875
Sample N 20
StDev(Within) 0.241069
StDev(Overall) 0.237596
Process Data
Cp 2.14
CPL 2.56
CPU 1.73
Cpk 1.73
Pp 2.17
PPL 2.59
PPU 1.76
Ppk 1.76
Cpm 1.33
Overall Capability
Potential (Within) Capability
PPM < LSL 0.00
PPM > USL 0.00
PPM Total 0.00
Observed Performance
PPM < LSL 0.00
PPM > USL 0.10
PPM Total 0.10
Exp. Within Performance
PPM < LSL 0.00
PPM > USL 0.07
PPM Total 0.07
Exp. Overall Performance
Within
Overall
Process Capability of L1-L2
1.51.00.50.0-0.5-1.0-1.5
LSL Target USL
LSL -1.55
Target 0
USL 1.55
Sample Mean 0.114625
Sample N 20
StDev(Within) 0.491509
StDev(Overall) 0.487192
Process Data
Cp 1.05
CPL 1.13
CPU 0.97
Cpk 0.97
Pp 1.06
PPL 1.14
PPU 0.98
Ppk 0.98
Cpm 1.03
Overall Capability
Potential (Within) Capability
PPM < LSL 0.00
PPM > USL 0.00
PPM Total 0.00
Observed Performance
PPM < LSL 353.61
PPM > USL 1748.22
PPM Total 2101.83
Exp. Within Performance
PPM < LSL 316.84
PPM > USL 1608.42
PPM Total 1925.26
Exp. Overall Performance
Within
Overall
Process Capability of 2*L4-L2-3.5
40.840.239.639.038.437.837.2
LSL Target USL
LSL 37.05
Target 39
USL 40.95
Sample Mean 39.0374
Sample N 20
StDev(Within) 0.227371
StDev(Overall) 0.216855
Process Data
Cp 2.86
CPL 2.91
CPU 2.80
Cpk 2.80
Pp 3.00
PPL 3.05
PPU 2.94
Ppk 2.94
Cpm 2.95
Overall Capability
Potential (Within) Capability
PPM < LSL 0.00
PPM > USL 0.00
PPM Total 0.00
Observed Performance
PPM < LSL 0.00
PPM > USL 0.00
PPM Total 0.00
Exp. Within Performance
PPM < LSL 0.00
PPM > USL 0.00
PPM Total 0.00
Exp. Overall Performance
Within
Overall
Process Capability of L3
Figure 2-8 Process capability after second improvement
2.3 Analysis phase
Since our objective is trying to minimize the mean value width difference, width
extension, symmetry and variance value of length, as well as try to spend less time to
fold the T-shirt. Therefore, in analysis part, we will analyze these five results one by
one.
- 18 -
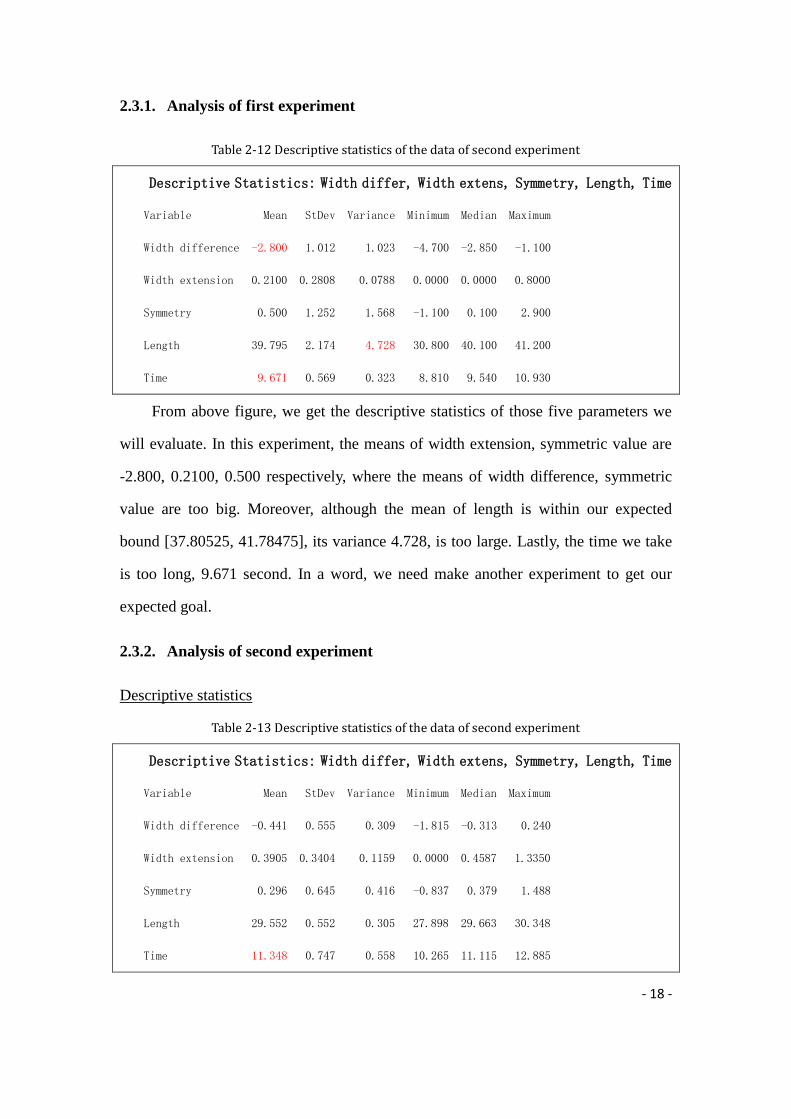
2.3.1. Analysis of first experiment
Table 2-12 Descriptive statistics of the data of second experiment
Descriptive Statistics: Width differ, Width extens, Symmetry, Length, Time
Variable Mean StDev Variance Minimum Median Maximum
Width difference -2.800 1.012 1.023 -4.700 -2.850 -1.100
Width extension 0.2100 0.2808 0.0788 0.0000 0.0000 0.8000
Symmetry 0.500 1.252 1.568 -1.100 0.100 2.900
Length 39.795 2.174 4.728 30.800 40.100 41.200
Time 9.671 0.569 0.323 8.810 9.540 10.930
From above figure, we get the descriptive statistics of those five parameters we
will evaluate. In this experiment, the means of width extension, symmetric value are
-2.800, 0.2100, 0.500 respectively, where the means of width difference, symmetric
value are too big. Moreover, although the mean of length is within our expected
bound [37.80525, 41.78475], its variance 4.728, is too large. Lastly, the time we take
is too long, 9.671 second. In a word, we need make another experiment to get our
expected goal.
2.3.2. Analysis of second experiment
Descriptive statistics
Table 2-13 Descriptive statistics of the data of second experiment
Descriptive Statistics: Width differ, Width extens, Symmetry, Length, Time
Variable Mean StDev Variance Minimum Median Maximum
Width difference -0.441 0.555 0.309 -1.815 -0.313 0.240
Width extension 0.3905 0.3404 0.1159 0.0000 0.4587 1.3350
Symmetry 0.296 0.645 0.416 -0.837 0.379 1.488
Length 29.552 0.552 0.305 27.898 29.663 30.348
Time 11.348 0.747 0.558 10.265 11.115 12.885
- 19 -
From above figure, we can get better results of width difference and length
variance, and the mean of width extension is not too bad, but the results of symmetric
value and time are awful. We will give the detailed hypothesis test in the following
parts.
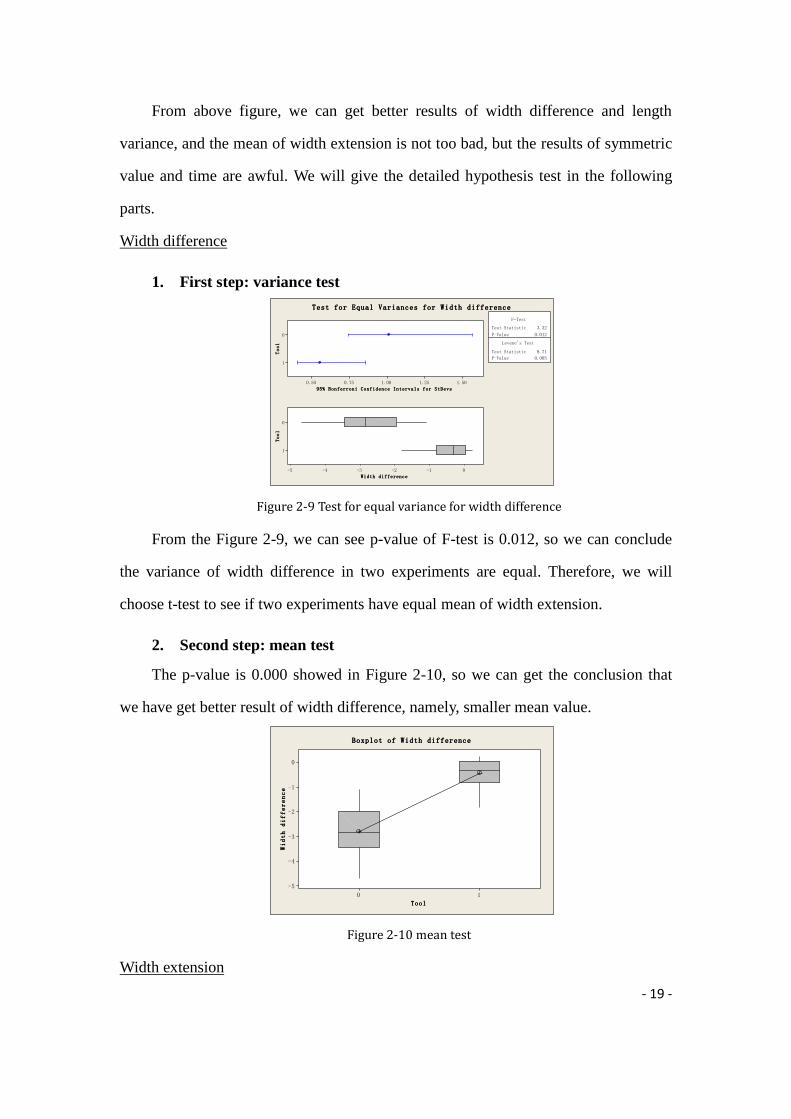
Width difference
1. First step: variance test
1
0
1.501.251.000.750.50
Tool
95% Bonferroni Confidence Intervals for StDevs
1
0
0-1-2-3-4-5
Tool
Width difference
Test Statistic 3.32
P-Value 0.012
Test Statistic 8.71
P-Value 0.005
F-Test
Levene's Test
Test for Equal Variances for Width difference
Figure 2-9 Test for equal variance for width difference
From the Figure 2-9, we can see p-value of F-test is 0.012, so we can conclude
the variance of width difference in two experiments are equal. Therefore, we will
choose t-test to see if two experiments have equal mean of width extension.
2. Second step: mean test
The p-value is 0.000 showed in Figure 2-10, so we can get the conclusion that
we have get better result of width difference, namely, smaller mean value.
10
0
-1
-2
-3
-4
-5
Tool
Width difference
Boxplot of Width difference
Figure 2-10 mean test
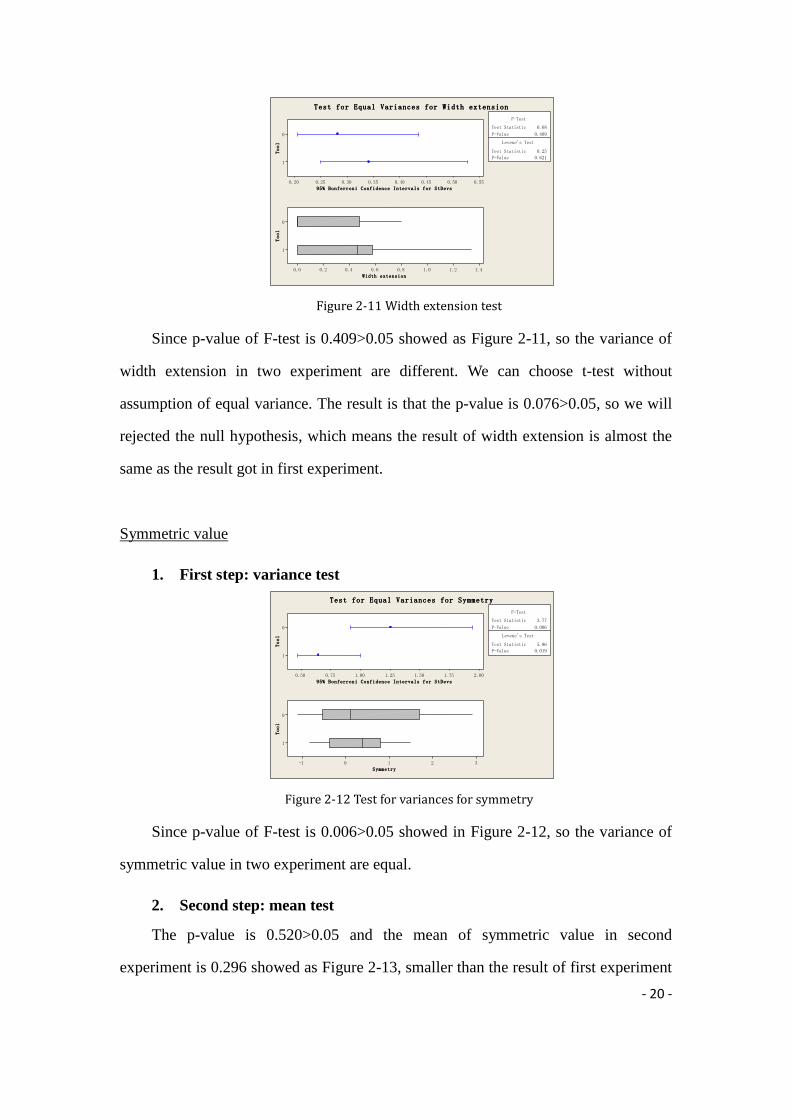
Width extension
- 20 -
1
0
0.550.500.450.400.350.300.250.20
Tool
95% Bonferroni Confidence Intervals for StDevs
1
0
1.41.21.00.80.60.40.20.0Tool
Width extension
Test Statistic 0.68
P-Value 0.409
Test Statistic 0.25
P-Value 0.621
F-Test
Levene's Test
Test for Equal Variances for Width extension
Figure 2-11 Width extension test
Since p-value of F-test is 0.409>0.05 showed as Figure 2-11, so the variance of
width extension in two experiment are different. We can choose t-test without
assumption of equal variance. The result is that the p-value is 0.076>0.05, so we will
rejected the null hypothesis, which means the result of width extension is almost the
same as the result got in first experiment.
Symmetric value
1. First step: variance test
1
0
2.001.751.501.251.000.750.50
Tool
95% Bonferroni Confidence Intervals for StDevs
1
0
3210-1
Tool
Symmetry
Test Statistic 3.77
P-Value 0.006
Test Statistic 5.96
P-Value 0.019
F-Test
Levene's Test
Test for Equal Variances for Symmetry
Figure 2-12 Test for variances for symmetry
Since p-value of F-test is 0.006>0.05 showed in Figure 2-12, so the variance of
symmetric value in two experiment are equal.
2. Second step: mean test
The p-value is 0.520>0.05 and the mean of symmetric value in second
experiment is 0.296 showed as Figure 2-13, smaller than the result of first experiment

- 21 -
(0.50), so we can say symmetric value in second experiment is better than the result in
first experiment.
10
3
2
1
0
-1
Tool
Symmetry
Boxplot of Symmetry
Figure 2-13 Symmetry mean test
Variance of length
Since we do not care about the absolute value of length, what we expected is just
the minimizing the variance of length, so we will go to variance test directly.
1
0
3.53.02.52.01.51.00.50.0
Tool
95% Bonferroni Confidence Intervals for StDevs
1
0
4239363330
Tool
Length
Test Statistic 15.50
P-Value 0.000
Test Statistic 1.13
P-Value 0.295
F-Test
Levene's Test
Test for Equal Variances for Length
Figure 2-14 Variances of length test
Using F-test of two samples in Figure 2-14, where p-value is 0.000<0.05;
moreover, the variance in second experiment is obvious smaller than the result in first
one. Therefore, we can say that second experiment has better result of variance of
length, which is what we expected.
Time
1. First step: variance test
- 22 -
1
0
1.21.00.80.60.4
Tool
95% Bonferroni Confidence Intervals for StDevs
1
0
131211109Tool
Time
Test Statistic 0.58
P-Value 0.244
Test Statistic 1.44
P-Value 0.238
F-Test
Levene's Test
Test for Equal Variances for Time
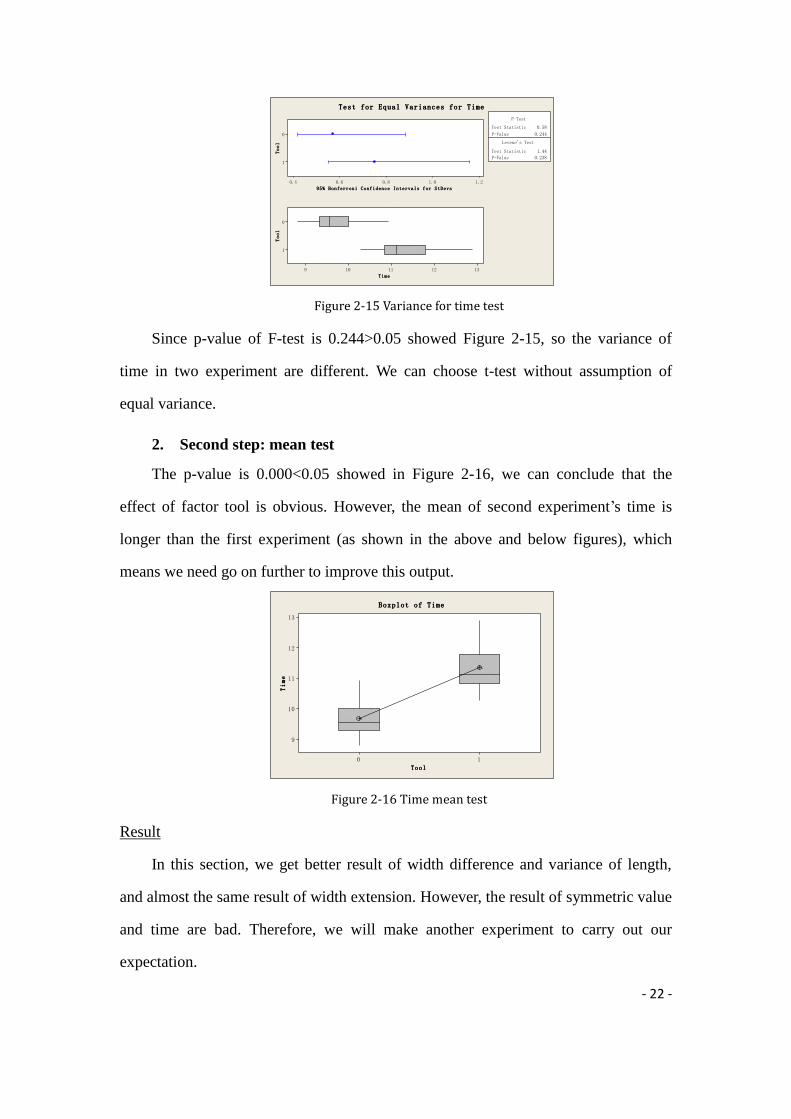
Figure 2-15 Variance for time test
Since p-value of F-test is 0.244>0.05 showed Figure 2-15, so the variance of
time in two experiment are different. We can choose t-test without assumption of
equal variance.
2. Second step: mean test
The p-value is 0.000<0.05 showed in Figure 2-16, we can conclude that the
effect of factor tool is obvious. However, the mean of second experiment‟s time is
longer than the first experiment (as shown in the above and below figures), which
means we need go on further to improve this output.
10
13
12
11
10
9
Tool
Time
Boxplot of Time
Figure 2-16 Time mean test
Result
In this section, we get better result of width difference and variance of length,
and almost the same result of width extension. However, the result of symmetric value
and time are bad. Therefore, we will make another experiment to carry out our
expectation.
- 23 -
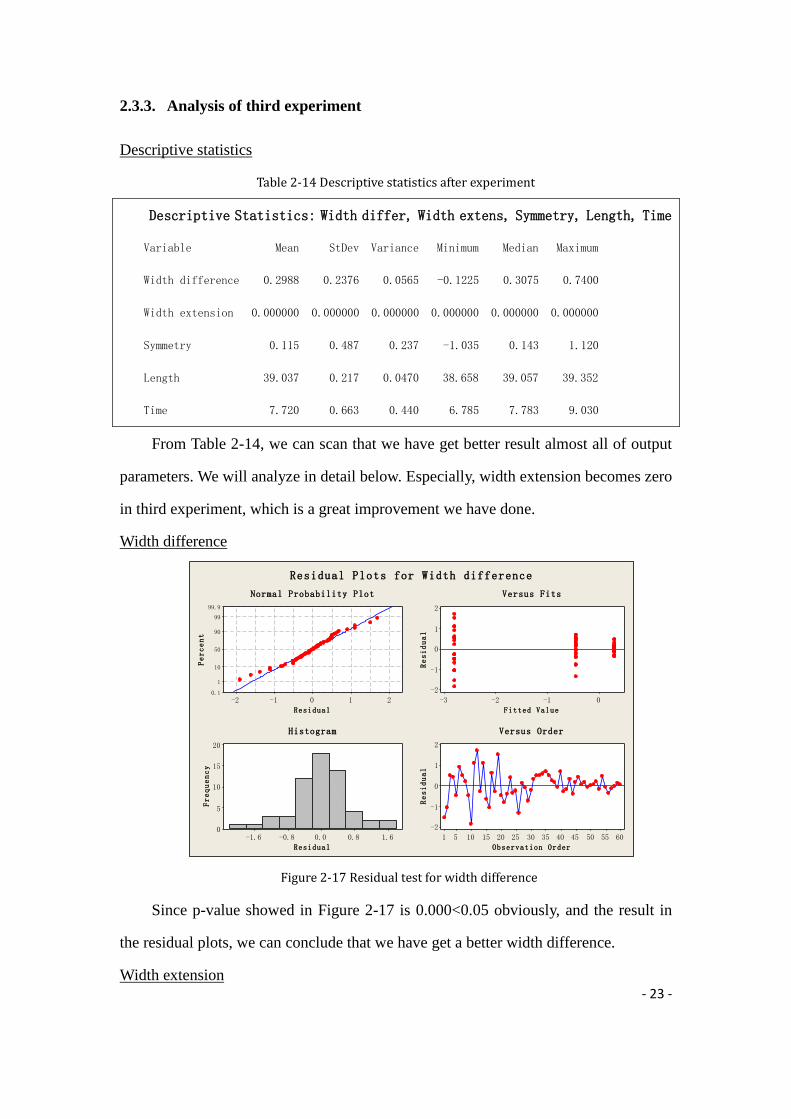
2.3.3. Analysis of third experiment
Descriptive statistics
Table 2-14 Descriptive statistics after experiment
Descriptive Statistics: Width differ, Width extens, Symmetry, Length, Time
Variable Mean StDev Variance Minimum Median Maximum
Width difference 0.2988 0.2376 0.0565 -0.1225 0.3075 0.7400
Width extension 0.000000 0.000000 0.000000 0.000000 0.000000 0.000000
Symmetry 0.115 0.487 0.237 -1.035 0.143 1.120
Length 39.037 0.217 0.0470 38.658 39.057 39.352
Time 7.720 0.663 0.440 6.785 7.783 9.030
From Table 2-14, we can scan that we have get better result almost all of output
parameters. We will analyze in detail below. Especially, width extension becomes zero
in third experiment, which is a great improvement we have done.
Width difference
210-1-2
99.9
99
90
50
10
1
0.1
Residual
Percent
0-1-2-3
2
1
0
-1
-2
Fitted Value
Residual
1.60.80.0-0.8-1.6
20
15
10
5
0
Residual
Frequency
605550454035302520151051
2
1
0
-1
-2
Observation Order
Residual
Normal Probability Plot Versus Fits
Histogram Versus Order
Residual Plots for Width difference
Figure 2-17 Residual test for width difference
Since p-value showed in Figure 2-17 is 0.000<0.05 obviously, and the result in
the residual plots, we can conclude that we have get a better width difference.
Width extension

- 24 -
1.00.50.0-0.5-1.0
99.9
99
90
50
10
1
0.1
Residual
Percent
0.40.30.20.10.0
1.0
0.5
0.0
-0.5
Fitted Value
Residual
0.80.60.40.20.0-0.2-0.4
20
15
10
5
0
Residual
Frequency
605550454035302520151051
1.0
0.5
0.0
-0.5
Observation Order
Residual
Normal Probability Plot Versus Fits
Histogram Versus Order
Residual Plots for Width extension
Figure 2-18 Residual test for width extension
From Figure 2-18, p-value is 0.000<0.05 obviously, we can say the effect of
different tool is different. Since our width extension is zero in third experiment,
certainly we cannot get a better result of this parameter showed as Figure 2-19.
210
1.4
1.2
1.0
0.8
0.6
0.4
0.2
0.0
Tool
Width extension
Boxplot of Width extension
Figure 2-19 Width extension mean test
Symmetric value
- 25 -
210-1-2
99.9
99
90
50
10
1
0.1
Residual
Percent
0.50.40.30.20.1
2
1
0
-1
-2
Fitted Value
Residual
210-1
20
15
10
5
0
Residual
Frequency
605550454035302520151051
2
1
0
-1
-2
Observation Order
Residual
Normal Probability Plot Versus Fits
Histogram Versus Order
Residual Plots for Symmetry
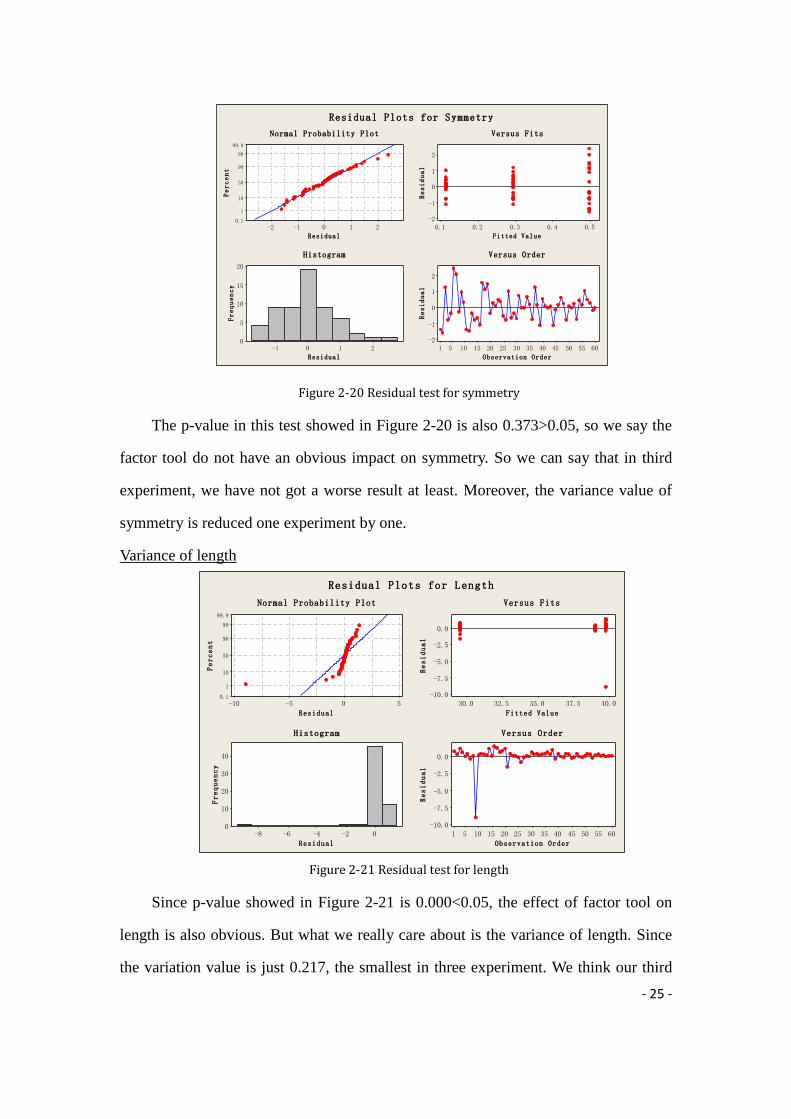
Figure 2-20 Residual test for symmetry
The p-value in this test showed in Figure 2-20 is also 0.373>0.05, so we say the
factor tool do not have an obvious impact on symmetry. So we can say that in third
experiment, we have not got a worse result at least. Moreover, the variance value of
symmetry is reduced one experiment by one.
Variance of length
50-5-10
99.9
99
90
50
10
1
0.1
Residual
Percent
40.037.535.032.530.0
0.0
-2.5
-5.0
-7.5
-10.0
Fitted Value
Residual
0-2-4-6-8
40
30
20
10
0
Residual
Frequency
605550454035302520151051
0.0
-2.5
-5.0
-7.5
-10.0
Observation Order
Residual
Normal Probability Plot Versus Fits
Histogram Versus Order
Residual Plots for Length
Figure 2-21 Residual test for length
Since p-value showed in Figure 2-21 is 0.000<0.05, the effect of factor tool on
length is also obvious. But what we really care about is the variance of length. Since
the variation value is just 0.217, the smallest in three experiment. We think our third

- 26 -
experiment is great and successful.
Time
210-1-2
99.9
99
90
50
10
1
0.1
Residual
Percent
111098
1
0
-1
Fitted Value
Residual
1.51.00.50.0-0.5-1.0
12
9
6
3
0
Residual
Frequency
605550454035302520151051
1
0
-1
Observation Order
Residual
Normal Probability Plot Versus Fits
Histogram Versus Order
Residual Plots for Time
Figure 2-22 Residual test for time
According the results got from Figure 2-22, we can conclude that the effect of
factor tool is obvious. Moreover, the mean of third experiment‟s time is smallest, i.e.,
7.720, as showed in Figure 2-23.
210
13
12
11
10
9
8
7
6
Tool
Time
Boxplot of Time
Figure 2-23 Box-plot of time
Result
Since we have get better result of all parameters we want to improve, we think
our third experiment is successful and our improved tool (denoted by number 2) is
deserved.
- 27 -
2.4 Improvement phase
In this project, after detailed dimensions and begin-end time measurement
standardization, firstly we folded the T-shirt without any tools, measured all the
indexes and conducted data analysis. Through this phase of data analysis, we found
out that although the consuming time as definition is short, the variance of the other
four indexes were still cannot meet our needs.
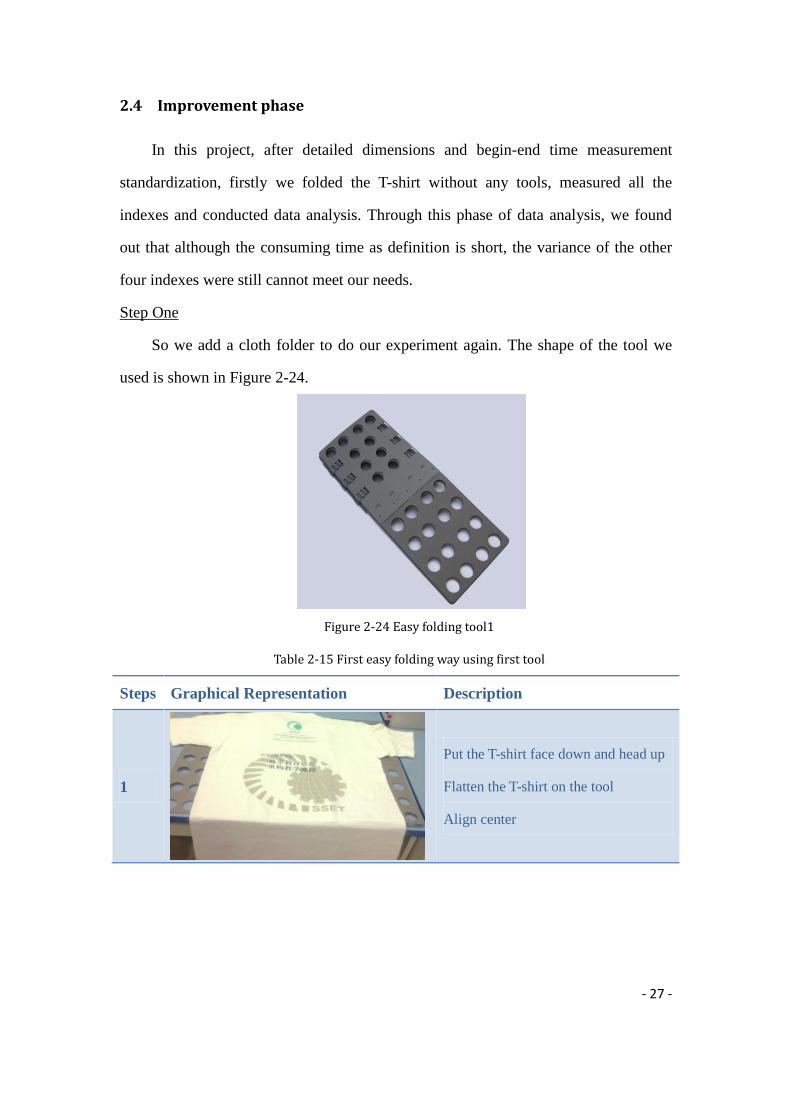
Step One
So we add a cloth folder to do our experiment again. The shape of the tool we
used is shown in Figure 2-24.
Figure 2-24 Easy folding tool1
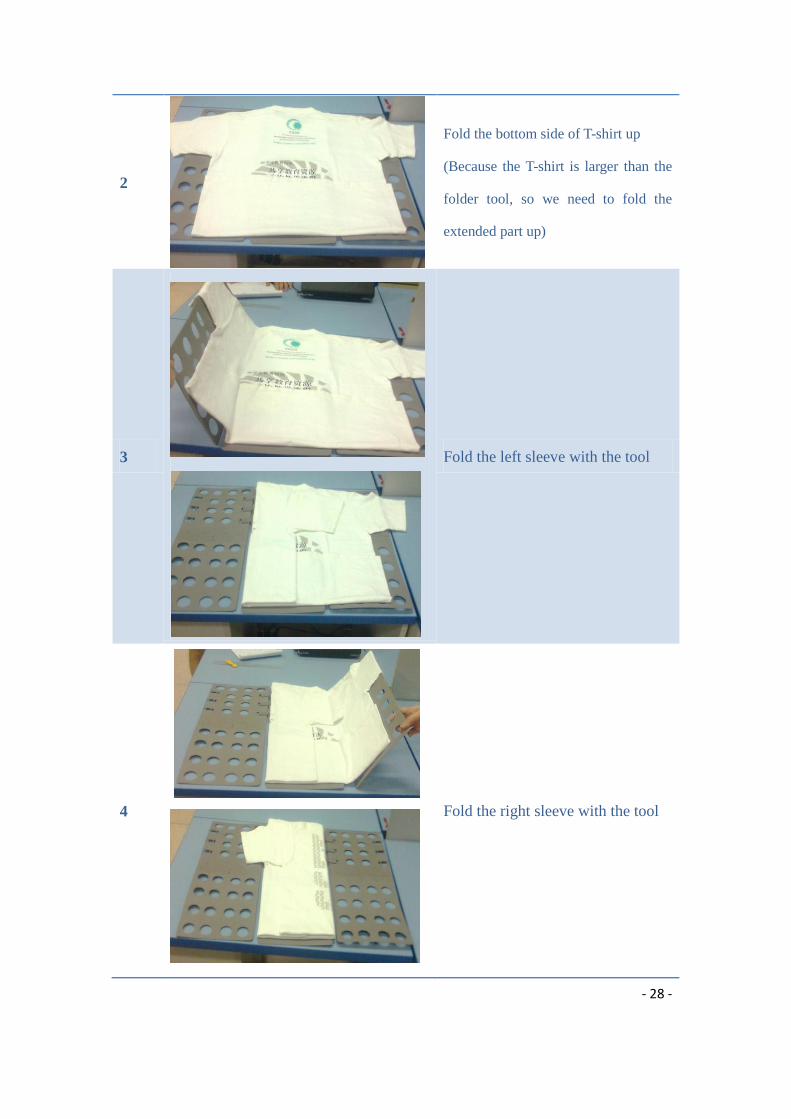
Table 2-15 First easy folding way using first tool
Steps Graphical Representation Description
1
Put the T-shirt face down and head up
Flatten the T-shirt on the tool
Align center
- 28 -
2
Fold the bottom side of T-shirt up
(Because the T-shirt is larger than the
folder tool, so we need to fold the
extended part up)
3
Fold the left sleeve with the tool
4
Fold the right sleeve with the tool
- 29 -
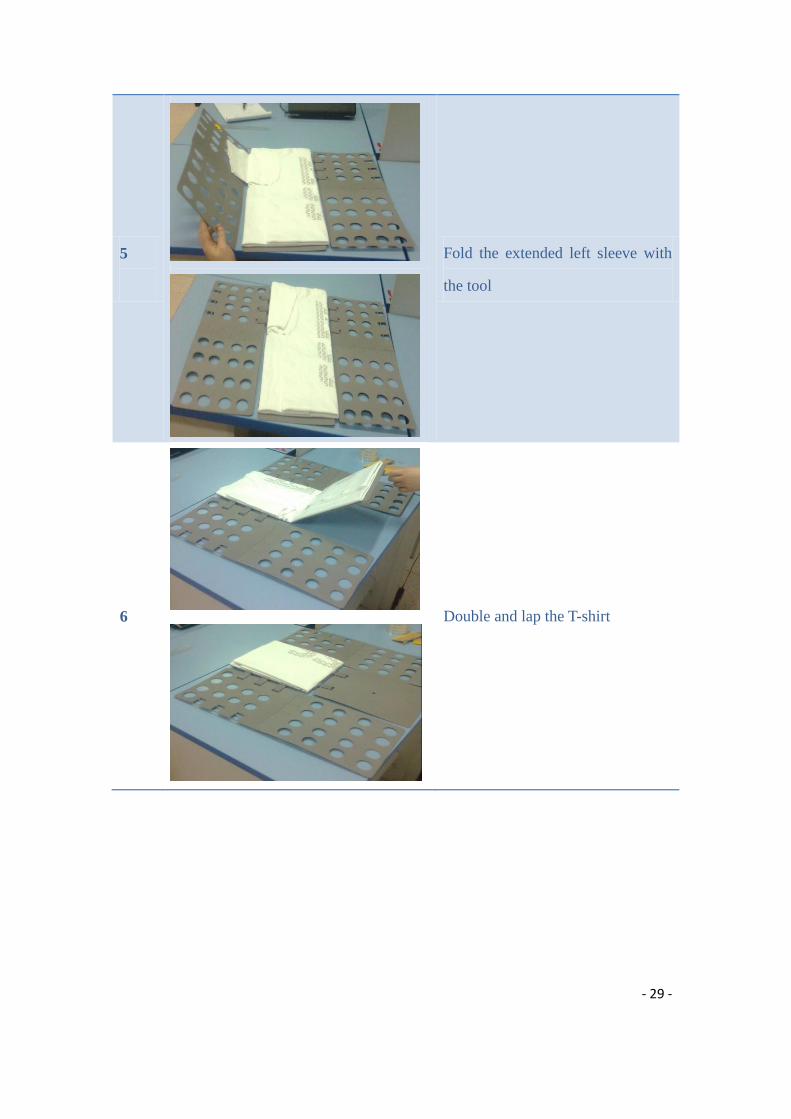
5
Fold the extended left sleeve with
the tool
6
Double and lap the T-shirt

- 30 -
7
Pick the T-shirt
Put it on the desk
Flatten it
After added tool to help us fold T-shirt, we also conducted the data analysis to
check whether the variance is smaller than before and whether the time used is
shorten. With this cloth folder, there were totally 7 steps showed in Table 2-15 to
finish the T-shirt folded and flatten out on desk. With all the data, we could see that
although variance is reduced greatly, the completion time is increased. Furthermore,
the degree of symmetry is not high enough. To analyze the reason, we review the
folding progress and then found with the tool the time from begin to finish folding is
shorten, but the time that is used from picking the T-shirt to flatten it on the desk
would took up very long. So we began to consider how to reduce the unnecessary
time, namely to remove the step 7 or reduce the time used on this phase.
Step Two
Based on this consideration, we began to think about another way to fold the
T-shirt. This way would reach the result that when we finish the fold behavior, the
T-shirt would be face upward position, so we could directly move it on the table. The
new T-shirt folding method is shown in the chart below.

- 31 -
Table 2-16 Second easy folding way using first tool
Steps Graphical Representation Description
1
Put the T-shirt face and head down
Flatten the T-shirt on the tool
Align center
2
`
Fold the bottom side of T-shirt up
(Because the T-shirt is larger than
the folder tool, so we need to fold
the extended part up)
3
Fold the left sleeve with the tool
- 32 -
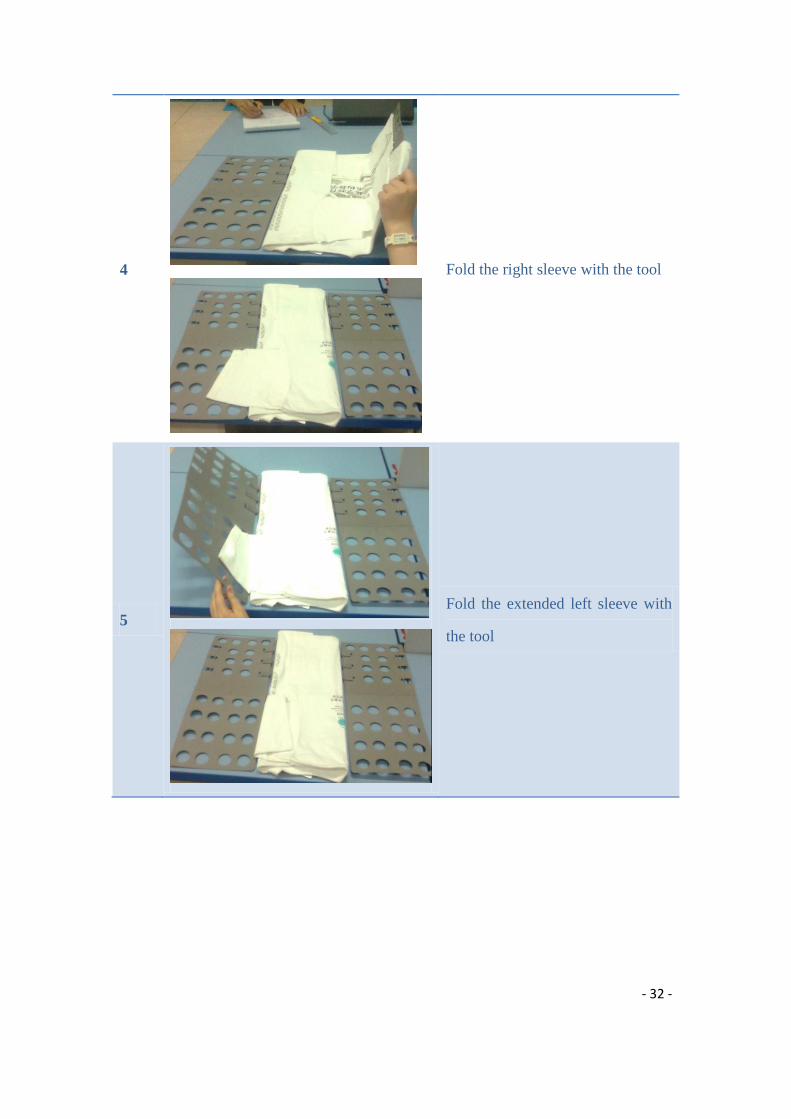
4
Fold the right sleeve with the tool
5
Fold the extended left sleeve with
the tool

- 33 -
6
Double and lap the T-shirt
7
Pick the T-shirt
Put it on the desk
Flatten it
In this step showed in Table 2-16, through several attempts, we found that it‟s
was a quick way to fold the T-shirt, however, because the material of the cloth folding
is not hard enough, so there might be more detective. What‟s more, the folder size

- 34 -
cannot match the big T-shirt, so it still needs to fold the bottom side of T-shirt up,
which would cost some time. Based on these considerations, we decide to do a tool by
ourselves which is more proper and effective.
Step Three
The new folding tool is made of several hardboards, which are strong and
difficult to deform when we folding a cloth. And its size is big enough to meet
different cloth size conditions.
When we tried to make this cloth folding, there were many difficulties. Because
the hardboard itself has a thickness, so how to fix the hardboard‟s position and make it
stable became our first issue. After the first try and experiment, the up width still does
not meet the down size. Through brainstorming, we found that the upper T-shirt‟
width goes with the board, yet the lower part is the sum of board‟s width added by a
gap between the upper moving hardboard and hardboard. So we chamfered the
hardboard to make the gap narrower. Additionally, we also found that when folding
the cloth, if the operator holds in the middle of the upper moving board, the difference
between chamfer‟s width and lap‟s width would be lower.
The folding ways are shown in Table 2-17.
Table 2-17 Easy folding ways using second improvement tool
Steps Graphical Representation Description
1
Put the T-shirt face down and head up
Flatten the T-shirt on the tool
Align center

- 35 -
2
Fold the left sleeve with the tool
3
Fold the right sleeve with the tool
- 36 -
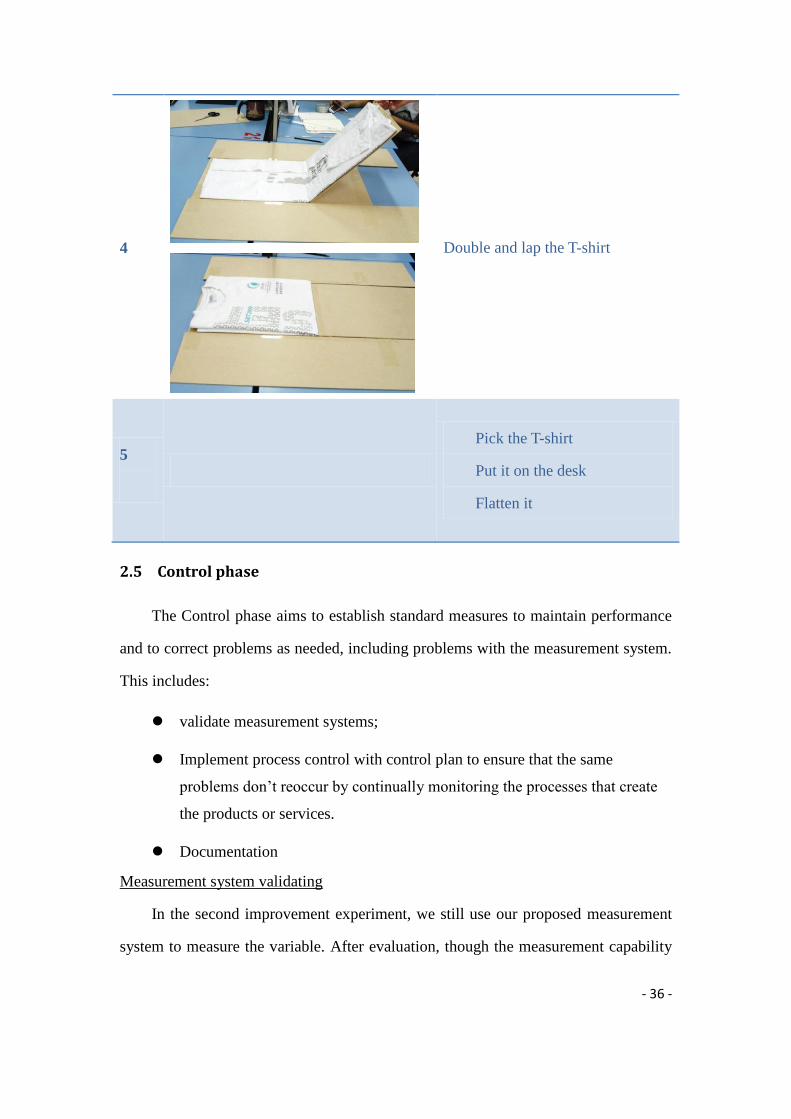
4
Double and lap the T-shirt
5
Pick the T-shirt
Put it on the desk
Flatten it
2.5 Control phase
The Control phase aims to establish standard measures to maintain performance
and to correct problems as needed, including problems with the measurement system.
This includes:
validate measurement systems;
Implement process control with control plan to ensure that the same
problems don‟t reoccur by continually monitoring the processes that create
the products or services.
Documentation
Measurement system validating
In the second improvement experiment, we still use our proposed measurement
system to measure the variable. After evaluation, though the measurement capability
- 37 -
is between 10% and 30%, the capability is acceptable and in control.
Process monitoring and validating
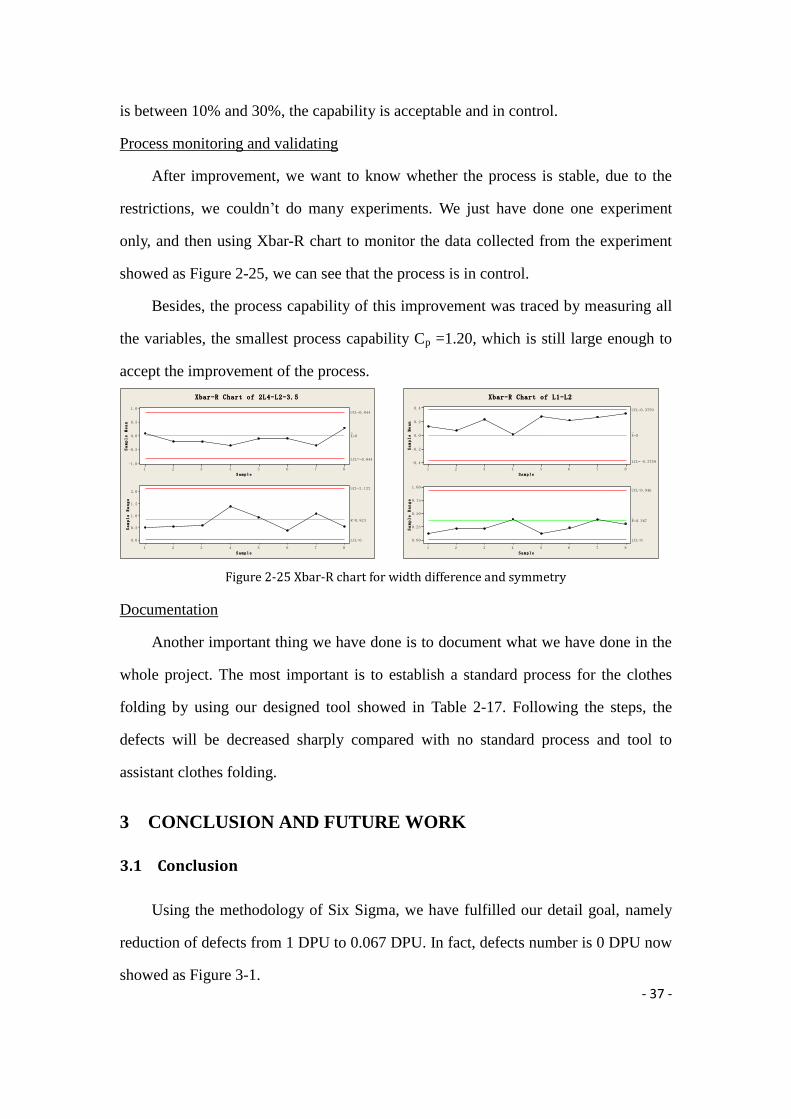
After improvement, we want to know whether the process is stable, due to the
restrictions, we couldn‟t do many experiments. We just have done one experiment
only, and then using Xbar-R chart to monitor the data collected from the experiment
showed as Figure 2-25, we can see that the process is in control.
Besides, the process capability of this improvement was traced by measuring all
the variables, the smallest process capability Cp =1.20, which is still large enough to
accept the improvement of the process.
87654321
1.0
0.5
0.0
-0.5
-1.0
S a m p l e
Sample Mean
__X=0
UCL=0.844
LCL=-0.844
87654321
2.0
1.5
1.0
0.5
0.0
S a m p l e
Sample Range
_R=0.824
UCL=2.122
LCL=0
Xbar-R Chart of 2L4-L2-3.5
87654321
0.4
0.2
0.0
-0.2
-0.4
S a m p l e
Sample Mean
__X=0
UCL=0.3759
LCL=-0.3759
87654321
1.00
0.75
0.50
0.25
0.00
S a m p l e
Sample Range
_R=0.367
UCL=0.946
LCL=0
Xbar-R Chart of L1-L2
Figure 2-25 Xbar-R chart for width difference and symmetry
Documentation
Another important thing we have done is to document what we have done in the
whole project. The most important is to establish a standard process for the clothes
folding by using our designed tool showed in Table 2-17. Following the steps, the
defects will be decreased sharply compared with no standard process and tool to
assistant clothes folding.
3 CONCLUSION AND FUTURE WORK
3.1 Conclusion
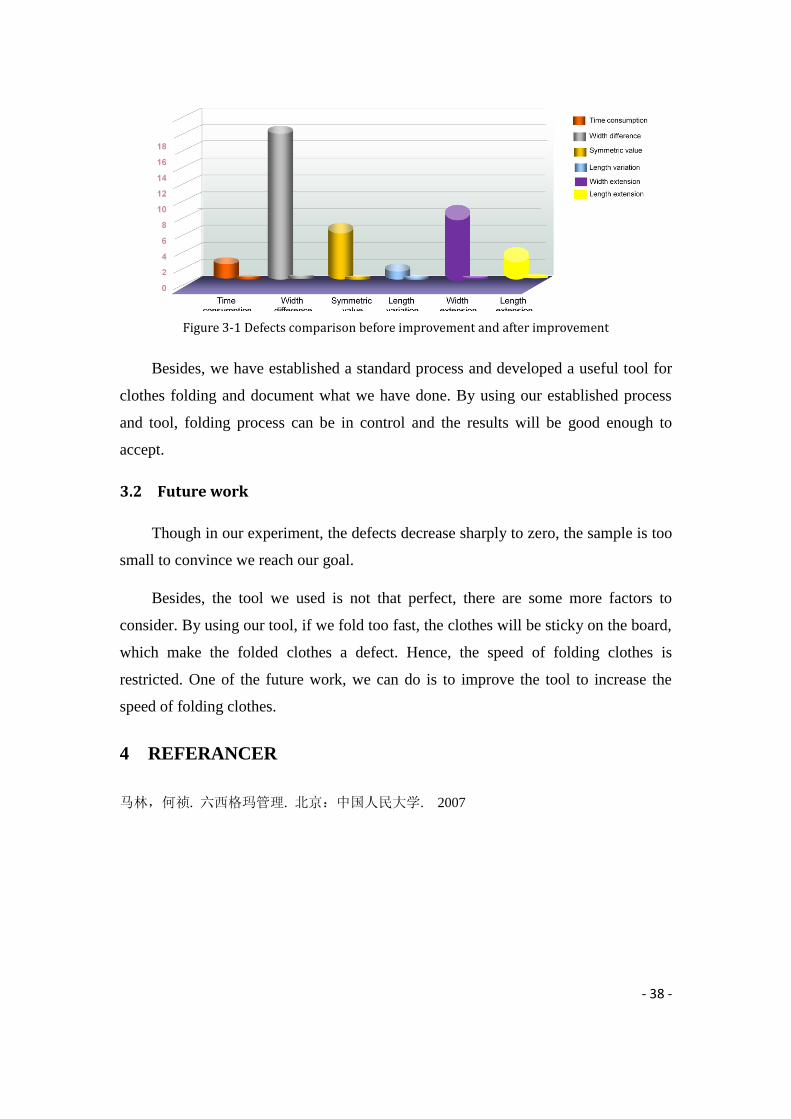
Using the methodology of Six Sigma, we have fulfilled our detail goal, namely
reduction of defects from 1 DPU to 0.067 DPU. In fact, defects number is 0 DPU now
showed as Figure 3-1.
- 38 -
Figure 3-1 Defects comparison before improvement and after improvement
Besides, we have established a standard process and developed a useful tool for
clothes folding and document what we have done. By using our established process
and tool, folding process can be in control and the results will be good enough to
accept.
3.2 Future work
Though in our experiment, the defects decrease sharply to zero, the sample is too
small to convince we reach our goal.
Besides, the tool we used is not that perfect, there are some more factors to
consider. By using our tool, if we fold too fast, the clothes will be sticky on the board,
which make the folded clothes a defect. Hence, the speed of folding clothes is
restricted. One of the future work, we can do is to improve the tool to increase the
speed of folding clothes.
4 REFERANCER
马林,何祯. 六西格玛管理. 北京:中国人民大学. 2007
Related Documents