Applying Pragmatics Principles for Interaction with Visual Analytics Enamul Hoque, Vidya Setlur, Melanie Tory, and Isaac Dykeman (a) initial utterance (b) visualization property reference (c) anaphoric reference (d) deictic reference (e) conjunction (f) lexical cohesion Fig. 1. Example results of various forms of natural language interactions with a dashboard using pragmatic conversation principles. Starting with an initial utterance (a), our system Evizeon supports references to properties in a visualization (b), within the text (c), and through multi-modal interaction (d). Other forms of interaction include support for compound queries (e) and lexical cohesion (f), where a user may use semantically similar words to describe attributes in the visualization, such as ‘deadliest’ for the attribute ‘fatalities.’ Abstract—Interactive visual data analysis is most productive when users can focus on answering the questions they have about their data, rather than focusing on how to operate the interface to the analysis tool. One viable approach to engaging users in interactive conversations with their data is a natural language interface to visualizations. These interfaces have the potential to be both more expressive and more accessible than other interaction paradigms. We explore how principles from language pragmatics can be applied to the flow of visual analytical conversations, using natural language as an input modality. We evaluate the effectiveness of pragmatics support in our system Evizeon, and present design considerations for conversation interfaces to visual analytics tools. Index Terms—natural language, interaction, language pragmatics, visual analytics, ambiguity, feedback 1 I NTRODUCTION A well accepted principle in visual analytics is the need to support interactive exploration and iterative view refinement. A single static • Enamul Hoque is with Stanford University. This work was done when Enamul was an intern at Tableau Research and a student at the University of British Columbia. E-mail: [email protected]. • Vidya Setlur is with Tableau Research. E-mail: [email protected]. • Melanie Tory is with Tableau Research. E-mail: [email protected]. • Isaac Dykeman is with Rice University. This work was done when Isaac was an intern at Tableau Research. E-mail: [email protected]. visualization is rarely sufficient except in the simplest of investiga- tive tasks. The user often needs to interact with their data, iteratively evolving both the questions and the visualization design. Our research explores natural language interaction as a complementary input modal- ity to traditional mouse and touch based interaction for visual analytics. Direct manipulation is an effective interaction technique when one can easily point to the objects of interest (e.g., lassoing a cluster of points). However, mouse and touch interaction can be inefficient when the interface requires many steps to complete a task. Moreover, this form of interaction gets in the way when users cannot translate their data related questions into data attributes or visual variables to ma- nipulate [19]. In contrast, natural language (NL) interaction can offer numerous advantages in terms of ease of use, convenience, and accessi- bility to novice users, facilitating the flow of analysis for novices and

Welcome message from author
This document is posted to help you gain knowledge. Please leave a comment to let me know what you think about it! Share it to your friends and learn new things together.
Transcript
Applying Pragmatics Principles for Interaction with Visual Analytics
Enamul Hoque, Vidya Setlur, Melanie Tory, and Isaac Dykeman
(a) initial utterance (b) visualization property reference (c) anaphoric reference
(d) deictic reference (e) conjunction (f) lexical cohesion
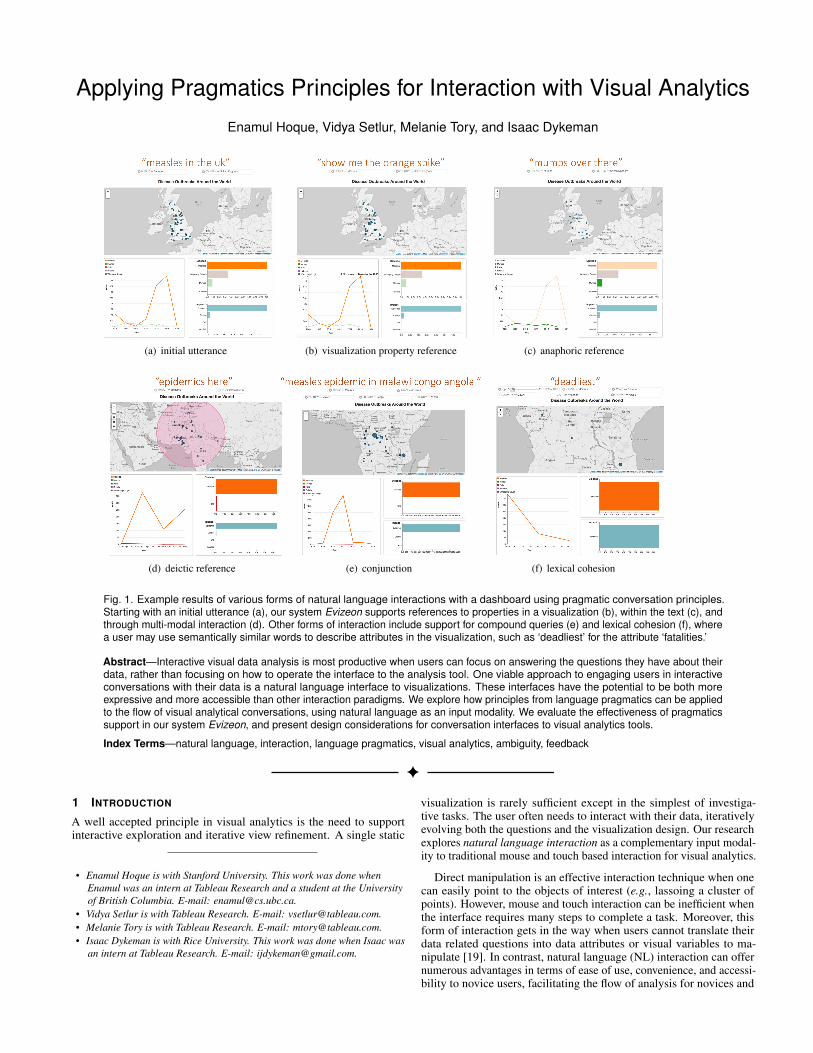
Fig. 1. Example results of various forms of natural language interactions with a dashboard using pragmatic conversation principles.Starting with an initial utterance (a), our system Evizeon supports references to properties in a visualization (b), within the text (c), andthrough multi-modal interaction (d). Other forms of interaction include support for compound queries (e) and lexical cohesion (f), wherea user may use semantically similar words to describe attributes in the visualization, such as ‘deadliest’ for the attribute ‘fatalities.’
Abstract—Interactive visual data analysis is most productive when users can focus on answering the questions they have about theirdata, rather than focusing on how to operate the interface to the analysis tool. One viable approach to engaging users in interactiveconversations with their data is a natural language interface to visualizations. These interfaces have the potential to be both moreexpressive and more accessible than other interaction paradigms. We explore how principles from language pragmatics can be appliedto the flow of visual analytical conversations, using natural language as an input modality. We evaluate the effectiveness of pragmaticssupport in our system Evizeon, and present design considerations for conversation interfaces to visual analytics tools.
Index Terms—natural language, interaction, language pragmatics, visual analytics, ambiguity, feedback
1 INTRODUCTION
A well accepted principle in visual analytics is the need to supportinteractive exploration and iterative view refinement. A single static
• Enamul Hoque is with Stanford University. This work was done whenEnamul was an intern at Tableau Research and a student at the Universityof British Columbia. E-mail: [email protected].
• Vidya Setlur is with Tableau Research. E-mail: [email protected].• Melanie Tory is with Tableau Research. E-mail: [email protected].• Isaac Dykeman is with Rice University. This work was done when Isaac was
an intern at Tableau Research. E-mail: [email protected].
visualization is rarely sufficient except in the simplest of investiga-tive tasks. The user often needs to interact with their data, iterativelyevolving both the questions and the visualization design. Our researchexplores natural language interaction as a complementary input modal-ity to traditional mouse and touch based interaction for visual analytics.
Direct manipulation is an effective interaction technique when onecan easily point to the objects of interest (e.g., lassoing a cluster ofpoints). However, mouse and touch interaction can be inefficient whenthe interface requires many steps to complete a task. Moreover, thisform of interaction gets in the way when users cannot translate theirdata related questions into data attributes or visual variables to ma-nipulate [19]. In contrast, natural language (NL) interaction can offernumerous advantages in terms of ease of use, convenience, and accessi-bility to novice users, facilitating the flow of analysis for novices and
experts alike [19,35]. These make compelling arguments to investigateNL as a complementary interaction modality for visual analytics.
However, NL interaction techniques for visualization are in theirinfancy, and existing tools (e.g., DataTone [17], Articulate [26, 37])largely follow a single query - response paradigm, with some facility tocorrect system misunderstandings. While promising, these systems donot really support a “cycle of visual analysis”; an interface that requiresisolated independent queries cannot be expected to support the fluiditerative exploration and refinement that we expect in visual analytics.Our work introduces new techniques for NL interaction, based on aconversational interaction model.
Figure 1 shows results of natural language interaction using a conver-sational approach, where the user has a back-and-forth exchange withour system. The first query in Figure 1a, “measles in the uk” causes allcharts to highlight or filter to cases of measles in the United Kingdom.Here ‘uk’ is not in the dataset, but is interpreted as an abbreviated placename and automatically matched to the data value ‘United Kingdom’using a geographic corpus. The user then types “show me the orangespike” (Figure 1b); the system understands that this is a referenceto the visual properties of the line chart and adds detail informationto the spike in the line. In Figure 1c, the system interprets “mumpsover there” as containing a reference to the previous location and adifferent value in the disease attribute. It retains the filter on ‘UnitedKingdom’ but updates disease from ‘measles’ to ‘mumps’. “Epidemicshere” (Figure 1d) is a reference to marks selected on the map with amouse, so epidemic diseases in that selected region are highlighted. InFigure 1e, “measles epidemic in malawi congo angola” illustrates aconjunctive query involving multiple search criteria. Finally, the userasks for “deadliest” (Figure 1f). Here the word ‘deadliest’, even thoughnot present anywhere in the dataset, is matched to top 10% of fatalitiesusing a semantic similarity match with external knowledge corpora.Throughout this exchange, the user has been able to build on their priorqueries and adapt the current system state, rather than starting overeach time with a fully qualified input statement.
The interaction sequence in Figure 1 involves a back-and-forth infor-mation exchange akin to human conversations. In human conversation,a turn is identified as a basic unit of dialog, denoted as an utterance [21].Human utterances are very often incomplete or imprecise, relying onthe listener to interpret using their contextual knowledge (speaker, topic,time, location, past utterances, etc.). These tendencies carry over intointeractions with a visualization, where it is known that people useambiguous language and partial specification, and may refer to itemsin their past statements [17, 19, 35].
The importance of supporting idiosyncrasies of human languagebecame blatantly apparent to us in our work on Eviza [35], an early NLinterface to visualizations. Based on our user study, plus an analysis ofover 3000 example input utterances, we identified the need to supportsynonyms, compound queries, dependencies on prior queries, pronouns,references to visual properties like mark size and color, and multimodalinput. Eviza supported only a few of these language characteristics andonly with a very simple model. For example, it supported synonymsonly through stemming or partial string matching. Similarly, peopleappreciated being able to enter follow-on queries, but system behaviorin these situations was often unexpected, pointing to a need to betterunderstand when the system should remember information from pastqueries and when it should start fresh.
An effective NL system needs to interpret input in the context ofthe current system state and the user’s recent interactions. Further-more, it must consider all possible contexts that the user might intendand enable the user to correct misinterpretations. In visual analytics,relevant context primarily consists of semantic properties of the dataset (attributes and values currently in play) and characteristics of thevisualization (visual properties and encodings). Our work exploits anunderstanding of human conversations as a basis for algorithms that caninfer such contextual information. Pragmatics is a term used in linguis-tics to determine reference of utterances through context of use [20].To realize a pragmatic language for interacting with visual analytics,we utilize and extend a model commonly used in linguistic conversa-tional structure [21]. We leverage relationships between entities and
analytical actions that exist between utterances in conversation.Inspired by Pokemon’s etymology for name origins [5], we call
our new system Evizeon, with ‘eon’ meaning evolution. Like Eviza,Evizeon enables natural language interaction with visualizations. How-ever, Evizeon introduces a series of techniques to support conversationalpragmatics, deeply enriching the interaction experience.
1.1 ContributionsRealizing interactive conversations like in Figure 1 requires understand-ing language pragmatics and adapting conversational interfaces to dataanalytics. Unlike general search interfaces, visual analytics tools cantake advantage of their knowledge of data attributes, values, and datarelated expressions to do a better job of inferring a user’s meaning.Towards this end, the contributions of our paper are as follows:
• We introduce a theoretical framework based on pragmatics thatcan improve NL interaction with visual analytics. We proposean extension to the centering approach employed in pragmaticstheory, to support inter-sentential transitional states of continuing,retaining, and shifting the context of the data attributes in play.
• We demonstrate techniques for deducing the grammatical andlexical structure of utterances and their context. Based on ourframework, we support various pragmatic forms of NL interactionwith visual analytics. These include understanding incompleteutterances; referring to entities within the utterances and visual-ization properties; supporting long, compound utterances; identi-fying synonyms and related concepts; and ‘repairing’ responsesto previous utterances.
• We provide appropriate visualization responses either within anexisting visualization or when necessary, by creating new visu-alizations. We support pragmatic ambiguity through targetedtextual feedback and ambiguity widgets.
• We then validate the usefulness of language pragmatics in visualanalytic conversations with two user studies.
2 RELATED WORK
Designing natural language interfaces can be challenging as they needto successfully interpret unconstrained input [38]. Such systems of-ten use deep expert modeling to extract information necessary for anappropriate interpretation. When users stray outside the supporteddomain, the system must still be able to respond to a broad range ofuser inputs. This requires a system to ask for user clarification whenfaced with unexpected input and to learn from these clarifications. ThePersona project was one such interface, but with a limited task domainof selecting music from a database [10]. There has also been a body ofresearch focusing on conversational interfaces, deducing human intentthrough gaze, turn-taking and dialog structure [9, 13, 16].
More recently, NL interfaces for data analysis have emerged as apromising new way of performing analytics. This approach is promis-ing in maintaining conversational flow, as users may be able to expresstheir questions more easily in natural language rather than translatingthem to system commands. Existing commercial systems [3, 4, 8] havefundamental limitations. Most return a minimally interactive visual-ization in response to queries, meaning the answer needs to be exactlycorrect rather than approximate. Many require experts to perform mod-eling before the systems are effective. None are richly integrated witha self-service analysis tool in a manner that allows NL interactionsto become part of a richer visual cycle of analysis. Research systemshave similar limitations. RIA explored geo-referenced data on a mapwith simple queries [40]. Articulate generated visualizations based onsimple queries with limited pragmatics and feedback [26].
Studies show that systems where users are expected to always em-ploy syntactically and semantically complete utterances can often befrustrating [12]. DataTone [17] improved analysis flow by guessingthe user’s intent, producing a chart according to that guess, and thenproviding ambiguity widgets through which the user could adjust set-tings if the system’s guess was incorrect. Eviza [35] was a first steptowards supporting simple pragmatics in analytical interaction. Thesystem used contextual inferencing for supporting pragmatics, wherein
context established by the preceding dialog is used to create a com-plete utterance [33]. A related system, Analyza [15], similarly enabledfollow-up data queries, but without a visualization focus. These systemsrecognized the importance of providing feedback on how the systeminterprets queries and enabling users to correct misunderstandings.
While the use of pragmatics helps with analytical flow, investigationsinto this approach so far have been very preliminary. To be trulyinteractive, these systems need richer support for understanding queriesbased on syntactic and semantic language structure, particularly tied tothe analytical properties of the questions. We also need better criteriafor deciding when to remember information from prior queries, andenhanced flexibility for users to correct poor system choices. In thiswork, we explore how a pragmatics-based approach can enable flexibleinteractions with data that support the flow of visual analysis.
3 PRAGMATICS
Visual analysis is most effective when users can focus on their datarather than the analysis tool’s interface. Pragmatics is particularlyimportant for visual analysis flow, where questions often emerge fromprevious questions and insights. Eviza supported pragmatics using asimple finite state machine (FSM) with the states defined by a weightedprobabilistic distribution over the parse paths [35]. The resolutionof phrasal segments occured using previous parse paths to maximizelikelihood estimation. Studies showed that this approach is rather naıveand we need a more systematic way of understanding when contextfrom previous utterances inform user intent.
In this work, we apply principles of pragmatics by modeling theinteraction behavior as a conversation. Conversations are more thanmere sequences of utterances. For a sequence of utterances to bea conversation, it must exhibit coherence. Coherence is a semanticproperty of conversation, based on the interpretation of each individualutterance relative to the interpretation of other utterances [39].
In order to correctly interpret a set of utterances, we utilize andextend a model commonly used for discourse structure called con-versational centering [21]. In this model, utterances are divided intoconstituent discourse segments, embedding relationships that may holdbetween two segments. A center refers to those entities serving to linkthat utterance to other utterances in the discourse. Consider a discoursesegment DS with utterances U1 . . .Um. Each utterance Un (1≤n<m) inDS is assigned a set of forward-looking centers, C f (Un,DS) referring tothe current focus of the conversation; each utterance other than the seg-ment’s initial utterance, is assigned a set of backward-looking centers,Cb(Un,DS). The set of backward-looking centers of a new utteranceUn+1 is Cb(Un+1,DS), which is equal to the forward-looking centersof Un (i.e., C f (Un,DS)). In the context of visual analytic conversations,forward and backward-looking centers consist of data attributes andvalues, visual properties, and analytical actions (e.g., filter, highlight).
Each discourse segment exhibits both global coherence i.e., theglobal context of the entire conversation, usually referring to a topicor subject of the conversation, and local coherence i.e., coherenceamongst the utterances within that conversation. The global coherenceof the analytical conversation is updated when all the data entitiesand their pronomial referring expressions shift to a new set of entities.Local coherence refers to inferring a sequence of utterances withina local context through transitional states of continuing, retaining,and replacing between C f (Un,DS) and Cb(Un,DS). We extend thisconversational centering theory for visual analytical conversation byintroducing a set of rules for each of these local coherence constructs.
Given an utterance Un, Evizeon responds by executing a series of an-alytical functions derived from the forward-looking centers C f (Un,DS).Here, an analytical function F(X ,op,v) consists of a variable X whichcan be an attribute or a visualization property, an operator op, and avalue v (usually a constant). For example, when the user says “measlesin the uk,” the system creates two functions namely F CAT(diseases,==, measles) and F CAT(country, ==, uk). As the user providesa new utterance Un+1, the system first creates a set of temporary centersCtemp(Un+1,DS) from Un+1 without considering any previous context.We then apply the following set of rules to create a set of forward-looking centers, C f (Un+1,DS) based on some set operations between
Cb(Un+1,DS) and Ctemp(Un+1,DS). These forward-looking centersare then used by Evizeon to respond to the user utterance:
Continue: This is a transition that continues the context fromthe backward-looking center to the forward-looking one. Hence,Cb(Un+1,DS)∈C f (Un+1,DS), along with other entities.
This transition occurs when a variable X is in Ctemp(Un+1) but notin Cb(Un+1,DS). In this case, the system performs the following unionoperation: C f (Un+1,DS)=Cb(Un+1,DS)∪Ctemp(Un+1,DS).
Retain: This transition retains the context from the backward-looking center in the forward-looking one without adding additionalentities to the forward-looking one. Cb(Un+1,DS)=C f (Un+1,DS).
This transition triggers when the variable X is in Cb(Un+1,DS) butnot in Ctemp(Un+1,DS).
Shift: In this transition, the context shifts from the previous one,with C f (Un+1,DS)6=Cb(Un+1,DS).
This transition occurs when the variable X is in both Cb(Un+1,DS)and Ctemp(Un+1,DS) but the corresponding values are different. Inthis case, the system replaces all the backward-centers Cb(Un+1,DS)containing X with Ctemp(Un+1,DS). This transition also occurs when afilter constraint is removed; e.g., removing a widget for measles shiftsthe disease variable from measles to all diseases.
Referring to Figure 1, we illustrate the use of these different types oftransition rules in this analytical conversation snippet between a user,Sara and our system, Evizeon:
SARA: measles in the uk. C f={measles, uk}EVIZEON: [Applies categorical and spatial filters showing measles in the
UK.]SARA: show me the orange spike. CONTINUE
Cb={measles, uk}, C f={measles, uk, orange spike}EVIZEON: [Highlights spike in the line for measles in the line chart.]SARA: mumps over there.
RETAIN Cb={uk}, C f={uk}SHIFT Cb={measles, orange spike}, C f={mumps}
EVIZEON: [Retains spatial filter for UK, updates categorical filter tomumps, removes highlighted spike in the line for measles.]
SARA: measles epidemic in malawi congo angola.SHIFT Cb={mumps}, C f={measles, epidemic}SHIFT Cb={uk}, C f={malawi, congo, angola}
EVIZEON: [Applies categorical filter for measles epidemics, applies newspatial filter on Malawi, Congo, and Angola, replacing UK.]
4 SYSTEM OVERVIEW
Evizeon, similar to Eviza, has an autocompletion module informed bythe grammar containing both predefined rules as well as rules dynami-cally added based on the data attributes in the visualization. Evizeon’spragmatics module is significantly extended from Eviza’s simple FSMto keep track of transition states between utterances. This moduleresponds by executing a series of analytical functions derived fromthe forward-looking centers of the pragmatic model. These analyticalfunctions are executed by communicating with a data manager thatreads in the requested data from the data files.
To enhance the support for pragmatics, Evizeon introduces two mod-ules – the visualization manager and dashboard controller. The formermanages access to visualization properties including marks, colors,axes, and text. It enables query references to existing visualizationsand determines when to generate new visualizations. The latter decideshow each view should respond to a query by analyzing the attributesand their visual encodings. The event manager handles consistencyacross the presentation elements in the visualization when there is achange in state upon execution of the query.
5 FORMS OF PRAGMATIC INTERACTION
Conversation centering posits that utterances display connectednessbetween them. The manner in which these utterances link up with eachother to form a conversation is cohesion. Cohesion comes about as aresult of the combination of both lexical and grammatical structures in
the constituent phrases. Identifying phrase structure is a logical startingpoint to resolve that utterance into one or more analytical functions ap-plied to the visualization. A probabilistic grammar is applied to providea structural description of the input queries, similar to the approachin Eviza [35]. We deduce additional syntactic structure by employinga Part-Of-Speech Tagger [28]. Entities from the parsed output areresolved to corresponding categorical and ordered data attributes [32].By applying our framework on conversation structure, we demonstratevarious forms of pragmatics in analytical conversation [22].
5.1 EllipsisIncomplete utterances are common in conversation. Ellipses are syn-tactically incomplete sentence fragments that exclude one or morelinguistic elements. Often, these utterances cannot be understood inisolation, but rather with previously established context. Eviza supportsellipsis by resolving incomplete utterances based on maximum likeli-hood estimation of the probabilities of the previous parse states [35].This model is rather simplistic and does not incorporate any logic fordetermining when to retain or replace parse states.
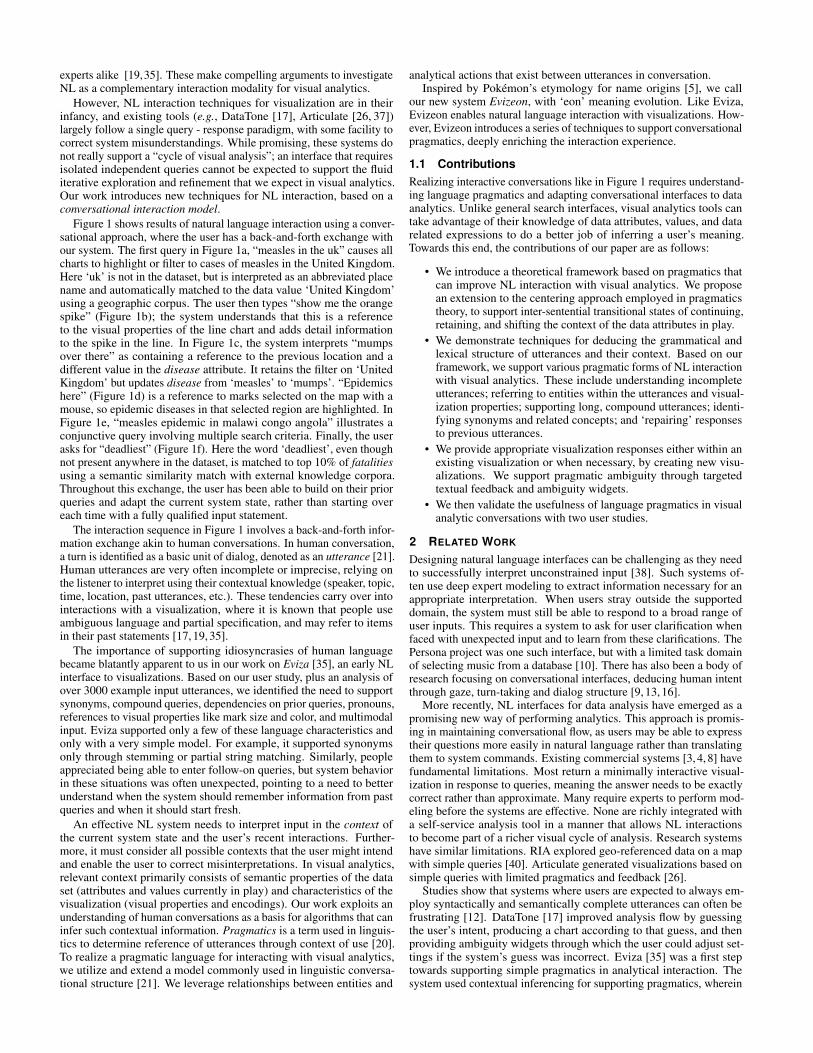
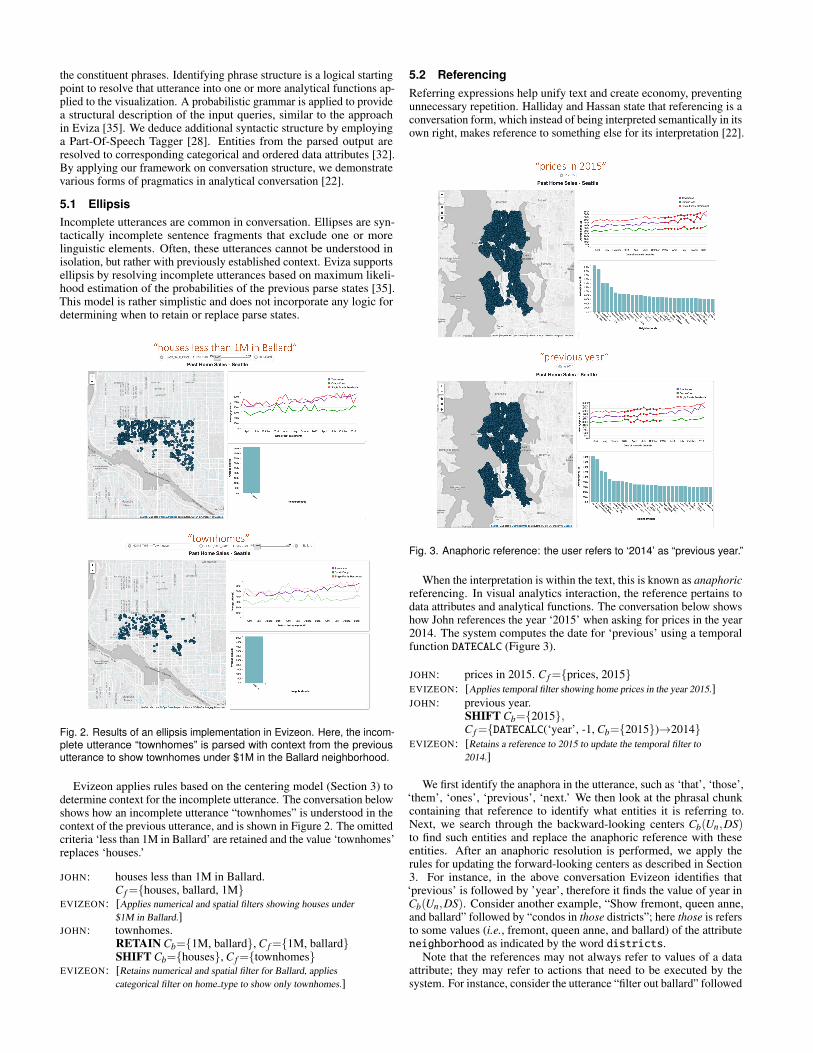
Fig. 2. Results of an ellipsis implementation in Evizeon. Here, the incom-plete utterance “townhomes” is parsed with context from the previousutterance to show townhomes under $1M in the Ballard neighborhood.
Evizeon applies rules based on the centering model (Section 3) todetermine context for the incomplete utterance. The conversation belowshows how an incomplete utterance “townhomes” is understood in thecontext of the previous utterance, and is shown in Figure 2. The omittedcriteria ‘less than 1M in Ballard’ are retained and the value ‘townhomes’replaces ‘houses.’
JOHN: houses less than 1M in Ballard.C f={houses, ballard, 1M}
EVIZEON: [Applies numerical and spatial filters showing houses under$1M in Ballard.]
JOHN: townhomes.RETAIN Cb={1M, ballard}, C f={1M, ballard}SHIFT Cb={houses}, C f={townhomes}
EVIZEON: [Retains numerical and spatial filter for Ballard, appliescategorical filter on home type to show only townhomes.]
5.2 ReferencingReferring expressions help unify text and create economy, preventingunnecessary repetition. Halliday and Hassan state that referencing is aconversation form, which instead of being interpreted semantically in itsown right, makes reference to something else for its interpretation [22].
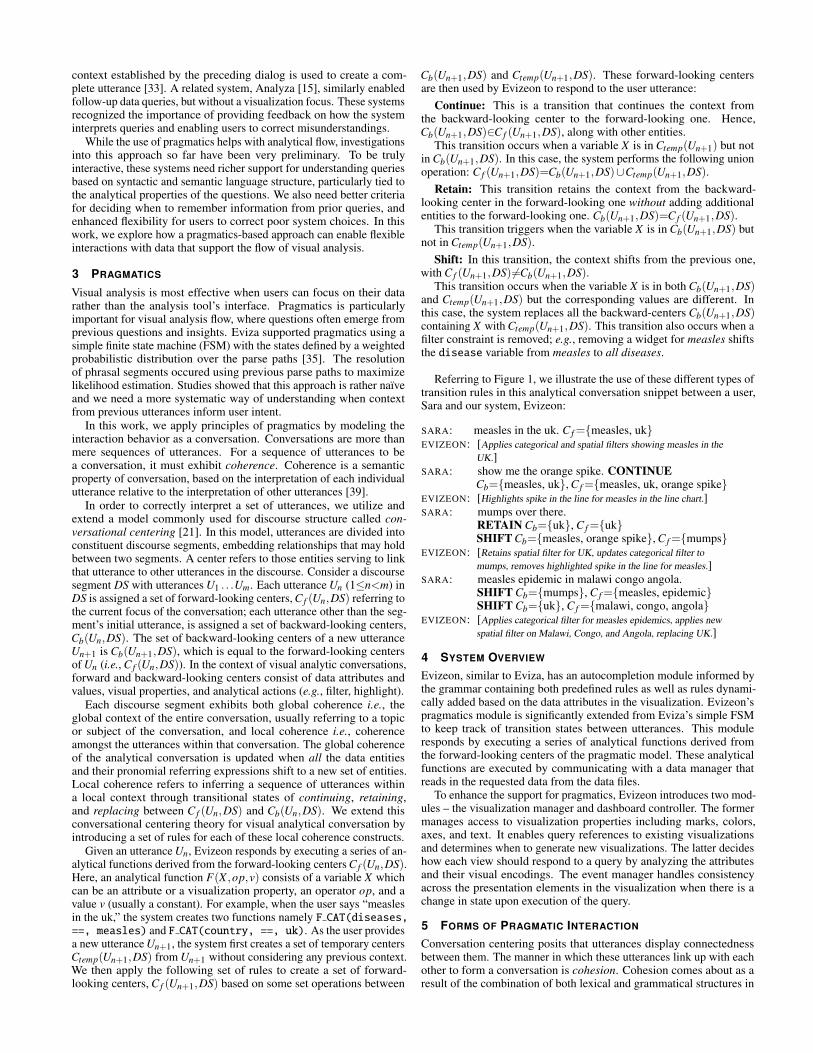
Fig. 3. Anaphoric reference: the user refers to ‘2014’ as “previous year.”
When the interpretation is within the text, this is known as anaphoricreferencing. In visual analytics interaction, the reference pertains todata attributes and analytical functions. The conversation below showshow John references the year ‘2015’ when asking for prices in the year2014. The system computes the date for ‘previous’ using a temporalfunction DATECALC (Figure 3).
JOHN: prices in 2015. C f={prices, 2015}EVIZEON: [Applies temporal filter showing home prices in the year 2015.]JOHN: previous year.
SHIFT Cb={2015},C f={DATECALC(‘year’, -1, Cb={2015})→2014}
EVIZEON: [Retains a reference to 2015 to update the temporal filter to2014.]
We first identify the anaphora in the utterance, such as ‘that’, ‘those’,‘them’, ‘ones’, ‘previous’, ‘next.’ We then look at the phrasal chunkcontaining that reference to identify what entities it is referring to.Next, we search through the backward-looking centers Cb(Un,DS)to find such entities and replace the anaphoric reference with theseentities. After an anaphoric resolution is performed, we apply therules for updating the forward-looking centers as described in Section3. For instance, in the above conversation Evizeon identifies that‘previous’ is followed by ’year’, therefore it finds the value of year inCb(Un,DS). Consider another example, “Show fremont, queen anne,and ballard” followed by “condos in those districts”; here those is refersto some values (i.e., fremont, queen anne, and ballard) of the attributeneighborhood as indicated by the word districts.
Note that the references may not always refer to values of a dataattribute; they may refer to actions that need to be executed by thesystem. For instance, consider the utterance “filter out ballard” followed
by “do that to fremont.” Here, that is not immediately followed by anynoun but immediately preceded by a verb word ‘do’ from which welook at the action mentioned in the previous utterance i.e., ‘filter out.’
Another form of referencing lies outside the text, and in the contextof the visualization. Here, the forward-looking center C f referencescontext within the visualization as opposed to text in the backward-looking center Cb. This form of indirect referencing is of two types: (1)A deictic reference refers to some object in the environment, usuallyby pointing. We support deictic references by enabling multimodalinteraction (mouse + speech/text), as shown in Figure 1d. (2) A visu-alization property reference uses properties in the visualization suchas color, shape, or text in labels, axes and titles. References to textualproperties is supported through computing string edit distances betweenthe input tokens and the labels [2]. For supporting references to markcolors, we use the Berlin & Kay [11] 11 basic color terms and theirassociated values. If one of these color terms is in the utterance, wecompute a Euclidean color distance in CIELAB [36] to match the termto the closest color value in the marks. Mapping these references toactual mark types is further disambiguated by rules in the grammar thatsemantically describe the charts. For example, in Figure 1b, Evizeonsearches for the closest color to ‘orange’ in the line chart identified bythe token ‘spike.’ If a referred mark is present in multiple visualizations,the results are shown in all the corresponding ones.
Eviza only supports deictic referencing as its grammar and FSM donot resolve attributes between forward and backward-looking centers.
5.3 Conjunctions
Fig. 4. Evizeon showing the results of an utterance with implicit conjunc-tions between various attributes for houses in Ballard.
Conjunctions in utterances communicate a range of relations be-tween phrase fragments called conjuncts. In a conversation, peopletend to iteratively build a compound query by adding multiple conjunctsas seen in Figure 1d. They often avoid explicit use of conjunctions andconnectors, such as ‘and’, ‘or’, ‘also’ between the phrases [25]. Forinstance, consider this conversation construct for “houses in Ballardunder 600k last summer” (Figure 4):
SARA: houses in Ballard. C f={houses, ballard}EVIZEON: [Applies categorical and spatial filters showing houses
in Ballard.]SARA: houses in Ballard under 600k last summer.
CONTINUE Cb={houses, ballard},C f={houses, ballard, <600k, last summer}
EVIZEON: [Further refines the current visualization by applying anumerical filter on house price and a temporal filter to showthe past summer.]
5.3.1 LinearizationFinding implicit data coherence among the conjuncts, can be a chal-lenging task. In the example above, all the conjuncts refer to the sameentity ‘houses in Ballard.’ However, there are cases where conjunctsmap to different entities, for instance “houses in Ballard under 600k
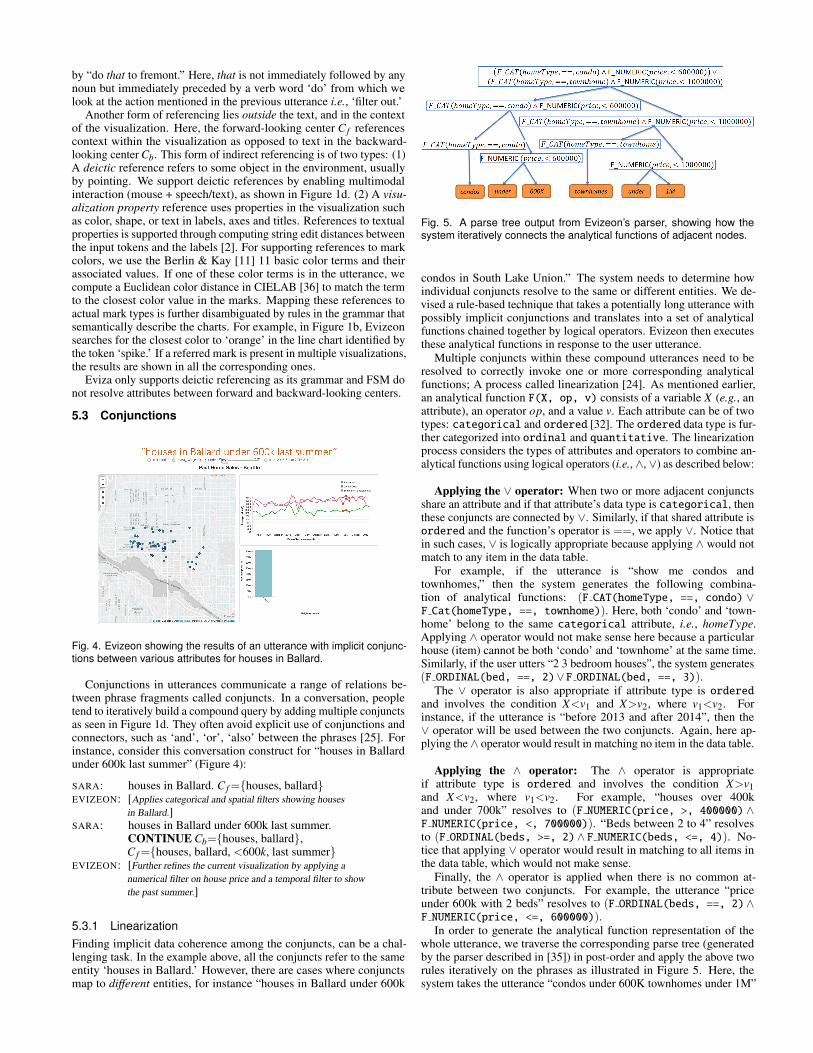
Fig. 5. A parse tree output from Evizeon’s parser, showing how thesystem iteratively connects the analytical functions of adjacent nodes.
condos in South Lake Union.” The system needs to determine howindividual conjuncts resolve to the same or different entities. We de-vised a rule-based technique that takes a potentially long utterance withpossibly implicit conjunctions and translates into a set of analyticalfunctions chained together by logical operators. Evizeon then executesthese analytical functions in response to the user utterance.
Multiple conjuncts within these compound utterances need to beresolved to correctly invoke one or more corresponding analyticalfunctions; A process called linearization [24]. As mentioned earlier,an analytical function F(X, op, v) consists of a variable X (e.g., anattribute), an operator op, and a value v. Each attribute can be of twotypes: categorical and ordered [32]. The ordered data type is fur-ther categorized into ordinal and quantitative. The linearizationprocess considers the types of attributes and operators to combine an-alytical functions using logical operators (i.e., ∧, ∨) as described below:
Applying the ∨ operator: When two or more adjacent conjunctsshare an attribute and if that attribute’s data type is categorical, thenthese conjuncts are connected by ∨. Similarly, if that shared attribute isordered and the function’s operator is ==, we apply ∨. Notice thatin such cases, ∨ is logically appropriate because applying ∧ would notmatch to any item in the data table.
For example, if the utterance is “show me condos andtownhomes,” then the system generates the following combina-tion of analytical functions: (F CAT(homeType, ==, condo) ∨F Cat(homeType, ==, townhome)). Here, both ‘condo’ and ‘town-home’ belong to the same categorical attribute, i.e., homeType.Applying ∧ operator would not make sense here because a particularhouse (item) cannot be both ‘condo’ and ‘townhome’ at the same time.Similarly, if the user utters “2 3 bedroom houses”, the system generates(F ORDINAL(bed, ==, 2)∨F ORDINAL(bed, ==, 3)).
The ∨ operator is also appropriate if attribute type is orderedand involves the condition X<v1 and X>v2, where v1<v2. Forinstance, if the utterance is “before 2013 and after 2014”, then the∨ operator will be used between the two conjuncts. Again, here ap-plying the ∧ operator would result in matching no item in the data table.
Applying the ∧ operator: The ∧ operator is appropriateif attribute type is ordered and involves the condition X>v1and X<v2, where v1<v2. For example, “houses over 400kand under 700k” resolves to (F NUMERIC(price, >, 400000) ∧F NUMERIC(price, <, 700000)). “Beds between 2 to 4” resolvesto (F ORDINAL(beds, >=, 2)∧ F NUMERIC(beds, <=, 4)). No-tice that applying ∨ operator would result in matching to all items inthe data table, which would not make sense.
Finally, the ∧ operator is applied when there is no common at-tribute between two conjuncts. For example, the utterance “priceunder 600k with 2 beds” resolves to (F ORDINAL(beds, ==, 2)∧F NUMERIC(price, <=, 600000)).
In order to generate the analytical function representation of thewhole utterance, we traverse the corresponding parse tree (generatedby the parser described in [35]) in post-order and apply the above tworules iteratively on the phrases as illustrated in Figure 5. Here, thesystem takes the utterance “condos under 600K townhomes under 1M”
as input, and iteratively applies the above rules to generate the chain ofanalytical functions.
5.4 Lexical Cohesion
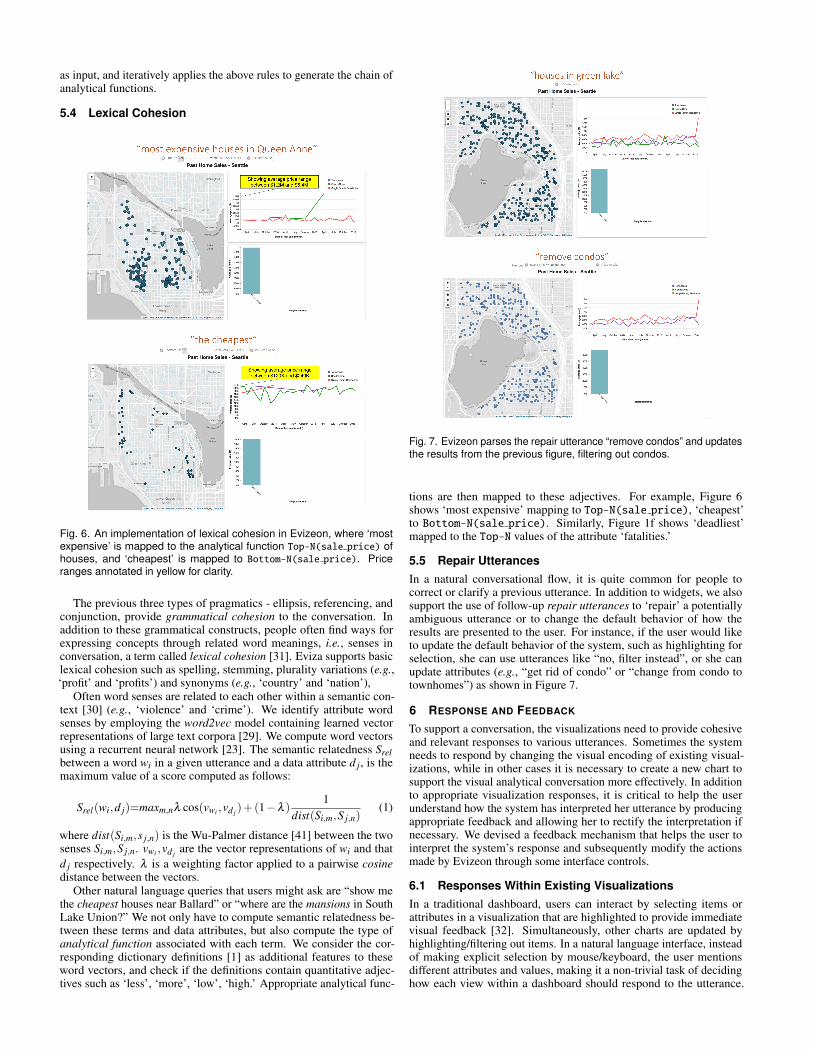
Fig. 6. An implementation of lexical cohesion in Evizeon, where ‘mostexpensive’ is mapped to the analytical function Top-N(sale price) ofhouses, and ‘cheapest’ is mapped to Bottom-N(sale price). Priceranges annotated in yellow for clarity.
The previous three types of pragmatics - ellipsis, referencing, andconjunction, provide grammatical cohesion to the conversation. Inaddition to these grammatical constructs, people often find ways forexpressing concepts through related word meanings, i.e., senses inconversation, a term called lexical cohesion [31]. Eviza supports basiclexical cohesion such as spelling, stemming, plurality variations (e.g.,‘profit’ and ‘profits’) and synonyms (e.g., ‘country’ and ‘nation’),
Often word senses are related to each other within a semantic con-text [30] (e.g., ‘violence’ and ‘crime’). We identify attribute wordsenses by employing the word2vec model containing learned vectorrepresentations of large text corpora [29]. We compute word vectorsusing a recurrent neural network [23]. The semantic relatedness Srelbetween a word wi in a given utterance and a data attribute d j, is themaximum value of a score computed as follows:
Srel(wi,d j)=maxm,nλ cos(vwi ,vd j )+(1−λ )1
dist(Si,m,S j,n)(1)
where dist(Si,m,s j,n) is the Wu-Palmer distance [41] between the twosenses Si,m,S j,n. vwi ,vd j are the vector representations of wi and thatd j respectively. λ is a weighting factor applied to a pairwise cosinedistance between the vectors.
Other natural language queries that users might ask are “show methe cheapest houses near Ballard” or “where are the mansions in SouthLake Union?” We not only have to compute semantic relatedness be-tween these terms and data attributes, but also compute the type ofanalytical function associated with each term. We consider the cor-responding dictionary definitions [1] as additional features to theseword vectors, and check if the definitions contain quantitative adjec-tives such as ‘less’, ‘more’, ‘low’, ‘high.’ Appropriate analytical func-
Fig. 7. Evizeon parses the repair utterance “remove condos” and updatesthe results from the previous figure, filtering out condos.
tions are then mapped to these adjectives. For example, Figure 6shows ‘most expensive’ mapping to Top-N(sale price), ‘cheapest’to Bottom-N(sale price). Similarly, Figure 1f shows ‘deadliest’mapped to the Top-N values of the attribute ‘fatalities.’
5.5 Repair UtterancesIn a natural conversational flow, it is quite common for people tocorrect or clarify a previous utterance. In addition to widgets, we alsosupport the use of follow-up repair utterances to ‘repair’ a potentiallyambiguous utterance or to change the default behavior of how theresults are presented to the user. For instance, if the user would liketo update the default behavior of the system, such as highlighting forselection, she can use utterances like “no, filter instead”, or she canupdate attributes (e.g., “get rid of condo” or “change from condo totownhomes”) as shown in Figure 7.
6 RESPONSE AND FEEDBACK
To support a conversation, the visualizations need to provide cohesiveand relevant responses to various utterances. Sometimes the systemneeds to respond by changing the visual encoding of existing visual-izations, while in other cases it is necessary to create a new chart tosupport the visual analytical conversation more effectively. In additionto appropriate visualization responses, it is critical to help the userunderstand how the system has interpreted her utterance by producingappropriate feedback and allowing her to rectify the interpretation ifnecessary. We devised a feedback mechanism that helps the user tointerpret the system’s response and subsequently modify the actionsmade by Evizeon through some interface controls.
6.1 Responses Within Existing VisualizationsIn a traditional dashboard, users can interact by selecting items orattributes in a visualization that are highlighted to provide immediatevisual feedback [32]. Simultaneously, other charts are updated byhighlighting/filtering out items. In a natural language interface, insteadof making explicit selection by mouse/keyboard, the user mentionsdifferent attributes and values, making it a non-trivial task of decidinghow each view within a dashboard should respond to the utterance.

Fig. 8. Evizeon generates new visualizations as part of a coordinated dashboard in response to various input utterances.
Previous natural language interfaces (e.g., Eviza [35]) have not exploredthis problem as they have only focused on a single visualization.
To decide how the views (V ) in a dashboard should respond to theutterance, our approach is as follows. If the items in the results setretrieved by applying the analytical functions are directly encoded ina chart, then Evizeon highlights these items. In Figure 1a, the mapchart highlights the items that match the criteria “measles in the uk.”However, for a secondary chart that applies further data transformationon the result set (e.g., the line chart and two bar charts), the follow-ing rules are applied: The system first creates a list of all attributes{X1,X2, ...Xm} from the forward looking centers C f (Un+1,DS). It theninvokes the visualization manager to determine if any of these attributesare encoded as dimensions of that visualization V directly (i.e., withoutusing any aggregate functions such as count or average). If that is thecase, it highlights the marks related to the corresponding criteria. Forexample, in Figure 1a , Evizeon highlights the series in the line chartand the bar in the barchart representing ‘measles.’ However, the barchart on impact (lower right) cannot highlight any mark because it doesnot encode any attribute in {X1,X2, ...Xm}. Therefore, it filters out theresults that do not match the criteria “measles in the uk” and updatesthe chart accordingly. Note that users can change the default behaviorby explicitly expressing the choice about whether to filter vs. highlight(e.g., ‘exclude’, ‘remove’, ‘filter only’).
6.2 Creating New VisualizationsDuring visual analysis flow, there may be situations where the existingvisualization cannot meet the evolving information needs of the user.This scenario could arise when a particular data attribute cannot beencoded effectively in the existing visualization (e.g., time values in amap). We hypothesize that in such as cases, creating a new visualizationas a response could be useful to the user. We draw inspiration fromwork that connects the visualization and language specification [27,34].Our current implementation supports the creation of four different typesof visualizations (i.e., bar chart, line chart, map chart, and scatterplot).Figure 8 shows how a dashboard is progressively constructed based onthe input utterances.
The underlying algorithm for creating or changing an existing visu-alization works in following steps: First, the system determines if thecreation of a new visualization or change of an existing one is necessary.Evizeon analyzes the attributes specified in the forward-looking centersC f (Un+1,DS), and searches for any current visualization that encodesthese data properties. If there is no match with the specification ofexisting visualizations, the system generates the corresponding newspecification consisting of attributes and aggregation types. We employa simplified version of the automatic presentation algorithm describedin [27] to decide the type of chart generated based on this specification.Finally, the new chart is positioned using a two-dimensional grid-basedlayout algorithm, automatically coordinated with other views. Thisupdated dashboard responds to subsequent utterances through actionslike highlighting or filtering.
6.3 Ambiguity HandlingThe interactive dialog provides new challenges for natural languageunderstanding systems. One of the most critical challenges is simplydetermining the intent of the utterance. These resolutions are expressedin the form of widgets and feedback to help the user understand the
system’s intent and the provenance of how the utterance was interpreted.By manipulating these widgets and viewing the feedback of what resultsare shown in the visualization, the user can instantiate a follow-up repairutterance to override or clarify the system decisions made.
Widgets are identified from the analytical functions derived froman utterance. An important design consideration here is how can weorganize and present the widgets in an intuitive way so that the user canunderstand how the system interprets her utterance and subsequentlymodify the interpretation using these widgets. For this purpose, wetake the original utterance and order the widgets in the same sequenceas the corresponding query terms. We achieve this by using the librarySparklificator that facilitates the placement of small word-scale visual-ization within text in a compact way [18]. In addition, we provide a setof interactions to users including the ability to manipulate and removea widget to modify the query and resolve ambiguous ones.
Figure 9 shows how Evizeon presents the widgets for the utterance“condo near Ballard under 1.2M.” Here the first term ‘condo’ was re-solved to the widget representing the criteria ‘HOME TYPE equalsCondo/coop’. Then, the second widget conveys the fuzzy distancerepresented by ‘near Ballard.’ Finally, since ‘under 1.2M’ does notexplicitly mention any attribute, the system determines whether thevalue 1200000 is within the range of minimum and maximum val-ues of any numeric attribute in the data. If such an attribute exists(LAST SALE PRICE in this case), the system conveys that to the userand then allows her to change the attribute using the drop-down menu.
6.4 Textual Feedback
In addition to ambiguity handling, Evizeon also provides feedback tomodify the text when it fails to understand the query. For instance, if thesystem cannot successfully parse the given utterance, it attempts to auto-matically correct the misspelled terms by comparing the tokens with theattributes in the current dataset using fuzzy string matching [2]. In casesof partially recognized queries, the system prunes the unrecognizedterms and shows results based on the recognized tokens. Figure 10presents examples of different possible cases and the correspondingfeedback generated by Evizeon.
7 EVALUATION
We conducted two user studies to: (1) verify the usefulness of ourpragmatics and feedback, (2) identify missing behavior, and (3) exploreindividual differences. Study 1 examined transition types – continuing,retaining, and shifting. Study 2 was observational and aimed to seehow people would utilize the pragmatics mechanisms in practice.
We chose an observational study to explore pragmatics challengesin an open-ended way. We considered a comparative experiment; how-ever, our prior study of Eviza [35] had already revealed its limitedpragmatics support: it could not handle conjunctions, its model forellipsis was simplistic, and its lack of feedback was highly confusing.Pilot studies had shown that Eviza could not handle an open-endedmulti-step conversation, which is why we only tested controlled inde-pendent tasks. Comparing Eviza with Evizeon would only highlightthe lack of pragmatics in the former system rather than leading to newinsights. The goal of the Evizeon studies was to evaluate usefulness ofthe new pragmatics features built around conversation centering.
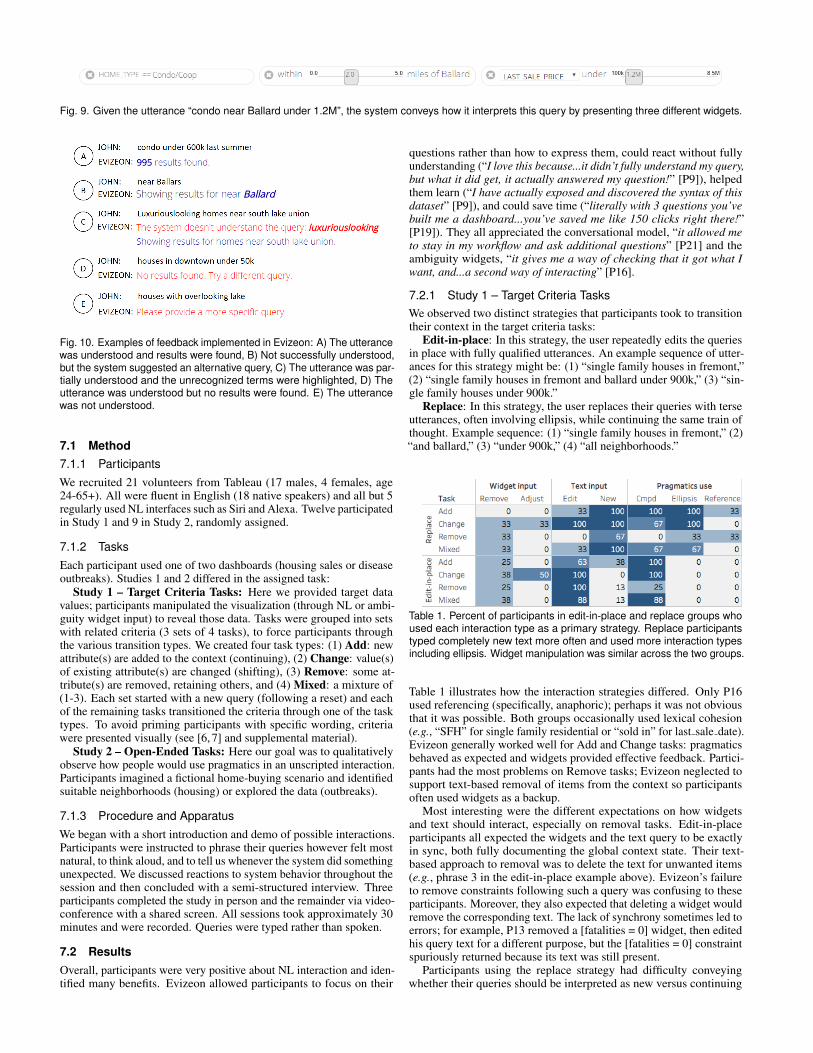
Fig. 9. Given the utterance “condo near Ballard under 1.2M”, the system conveys how it interprets this query by presenting three different widgets.
Fig. 10. Examples of feedback implemented in Evizeon: A) The utterancewas understood and results were found, B) Not successfully understood,but the system suggested an alternative query, C) The utterance was par-tially understood and the unrecognized terms were highlighted, D) Theutterance was understood but no results were found. E) The utterancewas not understood.
7.1 Method7.1.1 ParticipantsWe recruited 21 volunteers from Tableau (17 males, 4 females, age24-65+). All were fluent in English (18 native speakers) and all but 5regularly used NL interfaces such as Siri and Alexa. Twelve participatedin Study 1 and 9 in Study 2, randomly assigned.
7.1.2 TasksEach participant used one of two dashboards (housing sales or diseaseoutbreaks). Studies 1 and 2 differed in the assigned task:
Study 1 – Target Criteria Tasks: Here we provided target datavalues; participants manipulated the visualization (through NL or ambi-guity widget input) to reveal those data. Tasks were grouped into setswith related criteria (3 sets of 4 tasks), to force participants throughthe various transition types. We created four task types: (1) Add: newattribute(s) are added to the context (continuing), (2) Change: value(s)of existing attribute(s) are changed (shifting), (3) Remove: some at-tribute(s) are removed, retaining others, and (4) Mixed: a mixture of(1-3). Each set started with a new query (following a reset) and eachof the remaining tasks transitioned the criteria through one of the tasktypes. To avoid priming participants with specific wording, criteriawere presented visually (see [6, 7] and supplemental material).
Study 2 – Open-Ended Tasks: Here our goal was to qualitativelyobserve how people would use pragmatics in an unscripted interaction.Participants imagined a fictional home-buying scenario and identifiedsuitable neighborhoods (housing) or explored the data (outbreaks).
7.1.3 Procedure and ApparatusWe began with a short introduction and demo of possible interactions.Participants were instructed to phrase their queries however felt mostnatural, to think aloud, and to tell us whenever the system did somethingunexpected. We discussed reactions to system behavior throughout thesession and then concluded with a semi-structured interview. Threeparticipants completed the study in person and the remainder via video-conference with a shared screen. All sessions took approximately 30minutes and were recorded. Queries were typed rather than spoken.
7.2 ResultsOverall, participants were very positive about NL interaction and iden-tified many benefits. Evizeon allowed participants to focus on their
questions rather than how to express them, could react without fullyunderstanding (“I love this because...it didn’t fully understand my query,but what it did get, it actually answered my question!” [P9]), helpedthem learn (“I have actually exposed and discovered the syntax of thisdataset” [P9]), and could save time (“literally with 3 questions you’vebuilt me a dashboard...you’ve saved me like 150 clicks right there!”[P19]). They all appreciated the conversational model, “it allowed meto stay in my workflow and ask additional questions” [P21] and theambiguity widgets, “it gives me a way of checking that it got what Iwant, and...a second way of interacting” [P16].
7.2.1 Study 1 – Target Criteria TasksWe observed two distinct strategies that participants took to transitiontheir context in the target criteria tasks:
Edit-in-place: In this strategy, the user repeatedly edits the queriesin place with fully qualified utterances. An example sequence of utter-ances for this strategy might be: (1) “single family houses in fremont,”(2) “single family houses in fremont and ballard under 900k,” (3) “sin-gle family houses under 900k.”
Replace: In this strategy, the user replaces their queries with terseutterances, often involving ellipsis, while continuing the same train ofthought. Example sequence: (1) “single family houses in fremont,” (2)“and ballard,” (3) “under 900k,” (4) “all neighborhoods.”
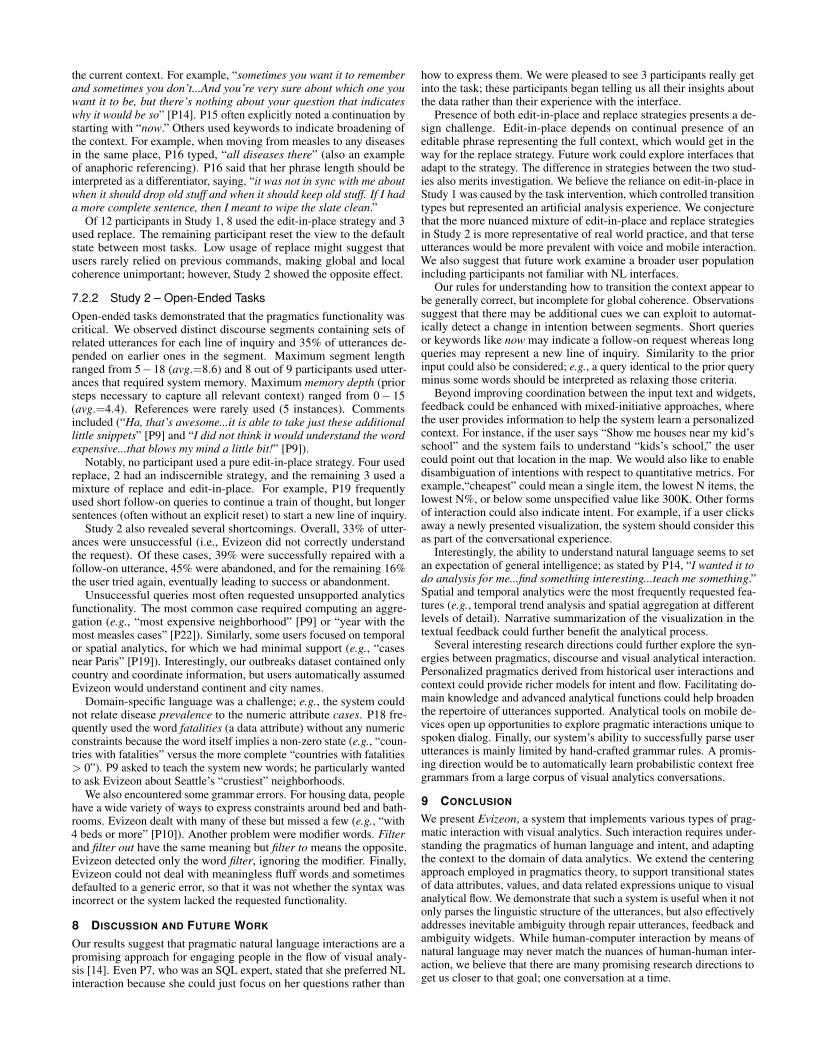
Table 1. Percent of participants in edit-in-place and replace groups whoused each interaction type as a primary strategy. Replace participantstyped completely new text more often and used more interaction typesincluding ellipsis. Widget manipulation was similar across the two groups.
Table 1 illustrates how the interaction strategies differed. Only P16used referencing (specifically, anaphoric); perhaps it was not obviousthat it was possible. Both groups occasionally used lexical cohesion(e.g., “SFH” for single family residential or “sold in” for last sale date).Evizeon generally worked well for Add and Change tasks: pragmaticsbehaved as expected and widgets provided effective feedback. Partici-pants had the most problems on Remove tasks; Evizeon neglected tosupport text-based removal of items from the context so participantsoften used widgets as a backup.
Most interesting were the different expectations on how widgetsand text should interact, especially on removal tasks. Edit-in-placeparticipants all expected the widgets and the text query to be exactlyin sync, both fully documenting the global context state. Their text-based approach to removal was to delete the text for unwanted items(e.g., phrase 3 in the edit-in-place example above). Evizeon’s failureto remove constraints following such a query was confusing to theseparticipants. Moreover, they also expected that deleting a widget wouldremove the corresponding text. The lack of synchrony sometimes led toerrors; for example, P13 removed a [fatalities = 0] widget, then editedhis query text for a different purpose, but the [fatalities = 0] constraintspuriously returned because its text was still present.
Participants using the replace strategy had difficulty conveyingwhether their queries should be interpreted as new versus continuing
the current context. For example, “sometimes you want it to rememberand sometimes you don’t...And you’re very sure about which one youwant it to be, but there’s nothing about your question that indicateswhy it would be so” [P14]. P15 often explicitly noted a continuation bystarting with “now.” Others used keywords to indicate broadening ofthe context. For example, when moving from measles to any diseasesin the same place, P16 typed, “all diseases there” (also an exampleof anaphoric referencing). P16 said that her phrase length should beinterpreted as a differentiator, saying, “it was not in sync with me aboutwhen it should drop old stuff and when it should keep old stuff. If I hada more complete sentence, then I meant to wipe the slate clean.”
Of 12 participants in Study 1, 8 used the edit-in-place strategy and 3used replace. The remaining participant reset the view to the defaultstate between most tasks. Low usage of replace might suggest thatusers rarely relied on previous commands, making global and localcoherence unimportant; however, Study 2 showed the opposite effect.
7.2.2 Study 2 – Open-Ended TasksOpen-ended tasks demonstrated that the pragmatics functionality wascritical. We observed distinct discourse segments containing sets ofrelated utterances for each line of inquiry and 35% of utterances de-pended on earlier ones in the segment. Maximum segment lengthranged from 5−18 (avg.=8.6) and 8 out of 9 participants used utter-ances that required system memory. Maximum memory depth (priorsteps necessary to capture all relevant context) ranged from 0− 15(avg.=4.4). References were rarely used (5 instances). Commentsincluded (“Ha, that’s awesome...it is able to take just these additionallittle snippets” [P9] and “I did not think it would understand the wordexpensive...that blows my mind a little bit!” [P9]).
Notably, no participant used a pure edit-in-place strategy. Four usedreplace, 2 had an indiscernible strategy, and the remaining 3 used amixture of replace and edit-in-place. For example, P19 frequentlyused short follow-on queries to continue a train of thought, but longersentences (often without an explicit reset) to start a new line of inquiry.
Study 2 also revealed several shortcomings. Overall, 33% of utter-ances were unsuccessful (i.e., Evizeon did not correctly understandthe request). Of these cases, 39% were successfully repaired with afollow-on utterance, 45% were abandoned, and for the remaining 16%the user tried again, eventually leading to success or abandonment.
Unsuccessful queries most often requested unsupported analyticsfunctionality. The most common case required computing an aggre-gation (e.g., “most expensive neighborhood” [P9] or “year with themost measles cases” [P22]). Similarly, some users focused on temporalor spatial analytics, for which we had minimal support (e.g., “casesnear Paris” [P19]). Interestingly, our outbreaks dataset contained onlycountry and coordinate information, but users automatically assumedEvizeon would understand continent and city names.
Domain-specific language was a challenge; e.g., the system couldnot relate disease prevalence to the numeric attribute cases. P18 fre-quently used the word fatalities (a data attribute) without any numericconstraints because the word itself implies a non-zero state (e.g., “coun-tries with fatalities” versus the more complete “countries with fatalities> 0”). P9 asked to teach the system new words; he particularly wantedto ask Evizeon about Seattle’s “crustiest” neighborhoods.
We also encountered some grammar errors. For housing data, peoplehave a wide variety of ways to express constraints around bed and bath-rooms. Evizeon dealt with many of these but missed a few (e.g., “with4 beds or more” [P10]). Another problem were modifier words. Filterand filter out have the same meaning but filter to means the opposite.Evizeon detected only the word filter, ignoring the modifier. Finally,Evizeon could not deal with meaningless fluff words and sometimesdefaulted to a generic error, so that it was not whether the syntax wasincorrect or the system lacked the requested functionality.
8 DISCUSSION AND FUTURE WORK
Our results suggest that pragmatic natural language interactions are apromising approach for engaging people in the flow of visual analy-sis [14]. Even P7, who was an SQL expert, stated that she preferred NLinteraction because she could just focus on her questions rather than
how to express them. We were pleased to see 3 participants really getinto the task; these participants began telling us all their insights aboutthe data rather than their experience with the interface.
Presence of both edit-in-place and replace strategies presents a de-sign challenge. Edit-in-place depends on continual presence of aneditable phrase representing the full context, which would get in theway for the replace strategy. Future work could explore interfaces thatadapt to the strategy. The difference in strategies between the two stud-ies also merits investigation. We believe the reliance on edit-in-place inStudy 1 was caused by the task intervention, which controlled transitiontypes but represented an artificial analysis experience. We conjecturethat the more nuanced mixture of edit-in-place and replace strategiesin Study 2 is more representative of real world practice, and that terseutterances would be more prevalent with voice and mobile interaction.We also suggest that future work examine a broader user populationincluding participants not familiar with NL interfaces.
Our rules for understanding how to transition the context appear tobe generally correct, but incomplete for global coherence. Observationssuggest that there may be additional cues we can exploit to automat-ically detect a change in intention between segments. Short queriesor keywords like now may indicate a follow-on request whereas longqueries may represent a new line of inquiry. Similarity to the priorinput could also be considered; e.g., a query identical to the prior queryminus some words should be interpreted as relaxing those criteria.
Beyond improving coordination between the input text and widgets,feedback could be enhanced with mixed-initiative approaches, wherethe user provides information to help the system learn a personalizedcontext. For instance, if the user says “Show me houses near my kid’sschool” and the system fails to understand “kids’s school,” the usercould point out that location in the map. We would also like to enabledisambiguation of intentions with respect to quantitative metrics. Forexample,“cheapest” could mean a single item, the lowest N items, thelowest N%, or below some unspecified value like 300K. Other formsof interaction could also indicate intent. For example, if a user clicksaway a newly presented visualization, the system should consider thisas part of the conversational experience.
Interestingly, the ability to understand natural language seems to setan expectation of general intelligence; as stated by P14, “I wanted it todo analysis for me...find something interesting...teach me something.”Spatial and temporal analytics were the most frequently requested fea-tures (e.g., temporal trend analysis and spatial aggregation at differentlevels of detail). Narrative summarization of the visualization in thetextual feedback could further benefit the analytical process.
Several interesting research directions could further explore the syn-ergies between pragmatics, discourse and visual analytical interaction.Personalized pragmatics derived from historical user interactions andcontext could provide richer models for intent and flow. Facilitating do-main knowledge and advanced analytical functions could help broadenthe repertoire of utterances supported. Analytical tools on mobile de-vices open up opportunities to explore pragmatic interactions unique tospoken dialog. Finally, our system’s ability to successfully parse userutterances is mainly limited by hand-crafted grammar rules. A promis-ing direction would be to automatically learn probabilistic context freegrammars from a large corpus of visual analytics conversations.
9 CONCLUSION
We present Evizeon, a system that implements various types of prag-matic interaction with visual analytics. Such interaction requires under-standing the pragmatics of human language and intent, and adaptingthe context to the domain of data analytics. We extend the centeringapproach employed in pragmatics theory, to support transitional statesof data attributes, values, and data related expressions unique to visualanalytical flow. We demonstrate that such a system is useful when it notonly parses the linguistic structure of the utterances, but also effectivelyaddresses inevitable ambiguity through repair utterances, feedback andambiguity widgets. While human-computer interaction by means ofnatural language may never match the nuances of human-human inter-action, we believe that there are many promising research directions toget us closer to that goal; one conversation at a time.

REFERENCES
[1] Dictionary. http://www.dictionary.com.[2] Fuse Library. http://fusejs.io/.[3] IBM Watson Analytics. http://www.ibm.com/analytics/watson-analytics/.
[4] Microsoft Q & A. https://powerbi.microsoft.com/en-us/documentation/powerbi-service-q-and-a/.
[5] Pokemon Etymology. https://pokemondb.net/etymology.[6] Study trials (housing). https://public.tableau.com/profile/melanie.tory#!/vizhome/Evizeonstudytrials-housingversion/Dashboard1.
[7] Study trials (outbreaks). https://public.tableau.com/profile/melanie.tory#!/vizhome/Evizeonstudytrials-outbreaksversion/Dashboard1.
[8] ThoughtSpot. http://www.thoughtspot.com/.[9] G. Ball. Mixing scripted interaction with task-oriented language process-
ing in a conversational interface. In Proceedings of the 4th InternationalConference on Intelligent User Interfaces, IUI 1999, pp. 101–103. ACM,New York, NY, USA, 1999.
[10] G. Bell, D. Ling, D. Kurlander, J. Muller, Pugh,D, and T. Skelly. LifelikeComputer Characters: The Persona Project at Microsoft Research, pp.191–222. London:AAAI Press, 1997.
[11] B. Berlin and P. Kay. Basic Color Terms: their Universality and Evolution.University of California Press, 1969.
[12] J. G. Carbonell, W. M. Boggs, M. L. Mauldin, and P. G. Anick. The xcal-ibur project, a natural language interface to expert systems and data bases.Proceedings of the Eighth International Joint Conference on ArtificialIntelligence, 1985.
[13] J. Cassell, T. Bickmore, M. Billinghurst, L. Campbell, K. Chang,H. Vilhjalmsson, and H. Yan. Embodiment in conversational interfaces:Rea. In Proceedings of the SIGCHI Conference on Human Factors inComputing Systems, CHI 1999, pp. 520–527. ACM, New York, NY, USA,1999.
[14] M. Csikszentmihalyi. Flow: The Psychology of Optimal Experience.Harper Perennial, New York, NY, March 1991.
[15] K. Dhamdhere, K. S. McCurley, R. Nahmias, M. Sundararajan, and Q. Yan.Analyza: Exploring data with conversation. In Proceedings of the 22ndInternational Conference on Intelligent User Interfaces, IUI 2017, pp.493–504, 2017.
[16] R. Fang, J. Y. Chai, and F. Ferreira. Between linguistic attention and gazefixations inmultimodal conversational interfaces. In Proceedings of the2009 International Conference on Multimodal Interfaces, ICMI-MLMI2009, pp. 143–150. ACM, New York, NY, USA, 2009.
[17] T. Gao, M. Dontcheva, E. Adar, Z. Liu, and K. G. Karahalios. Datatone:Managing ambiguity in natural language interfaces for data visualization.In Proceedings of the 28th Annual ACM Symposium on User InterfaceSoftware Technology, UIST 2015, pp. 489–500. ACM, New York, NY,USA, 2015.
[18] P. Goffin, W. Willett, J.-D. Fekete, and P. Isenberg. Exploring the place-ment and design of word-scale visualizations. IEEE Transactions onVisualization and Computer Graphics, 20(12):2291–2300, 2014.
[19] L. Grammel, M. Tory, and M.-A. Storey. How information visualizationnovices construct visualizations. IEEE Transactions on Visualization andComputer Graphics, 16(6):943–952, 2010.
[20] G. M. Green. Pragmatics and Natural Language Understanding. Rout-ledge, 2012.
[21] B. J. Grosz and C. L. Sidner. Attention, intentions, and the structure ofdiscourse. Computational Linguistics, 12(3):175–204, July 1986.
[22] M. A. Halliday and R. Hasan. Cohesion in English. Longman, London,1976.
[23] F. Hill, K. Cho, A. Korhonen, and Y. Bengio. Learning to understandphrases by embedding the dictionary. Transactions of the Association forComputational Linguistics, 4:17–30, 2016.
[24] L. Horn and G. Ward. Handbook of Pragmatics. Blackwell Handbooks inLinguistics. Wiley, 2004.
[25] A. Knott and T. Sanders. The classification of coherence relations andtheir linguistic markers: An exploration of two languages. Journal ofPragmatics, 30:135–175, 1997.
[26] A. Kumar, J. Aurisano, B. Di Eugenio, A. Johnson, A. Gonzalez, andJ. Leigh. Towards a dialogue system that supports rich visualizations ofdata. In 17th Annual Meeting of the Special Interest Group on Discourseand Dialogue, pp. 304–309, 2016.
[27] J. Mackinlay, P. Hanrahan, and C. Stolte. Show me: Automatic presenta-tion for visual analysis. IEEE Transactions on Visualization and ComputerGraphics, 13(6):1137–1144, Nov. 2007.
[28] C. D. Manning, M. Surdeanu, J. Bauer, J. Finkel, S. J. Bethard, and D. Mc-Closky. The Stanford CoreNLP natural language processing toolkit. InAssociation for Computational Linguistics (ACL) System Demonstrations,pp. 55–60, 2014.
[29] T. Mikolov, I. Sutskever, K. Chen, G. Corrado, and J. Dean. Distributedrepresentations of words and phrases and their compositionality. In Pro-ceedings of the 26th International Conference on Neural InformationProcessing Systems, NIPS 2013, pp. 3111–3119. Curran Associates Inc.,USA, 2013.
[30] G. A. Miller. Wordnet: A lexical database for english. Commun. ACM,38(11):39–41, Nov. 1995.
[31] J. Morris and G. Hirst. Lexical cohesion computed by thesaural relations asan indicator of the structure of text. Computational Linguistics, 17(1):21–48, Mar. 1991.
[32] T. Munzner. Visualization Analysis and Design. CRC Press, 2014.[33] T. Reinhart. Pragmatics and Linguistics: An Analysis of Sentence Topics.
IU Linguistics Club publications. Reproduced by the Indiana UniversityLinguistics Club, 1982.
[34] A. Satyanarayan, K. Wongsuphasawat, and J. Heer. Declarative interactiondesign for data visualization. In Proceedings of the 27th Annual ACMSymposium on User Interface Software and Technology, UIST 2014, pp.669–678. ACM, New York, NY, USA, 2014.
[35] V. Setlur, S. E. Battersby, M. Tory, R. Gossweiler, and A. X. Chang. Eviza:A natural language interface for visual analysis. In Proceedings of the 29thAnnual Symposium on User Interface Software and Technology, UIST2016, pp. 365–377. ACM, New York, NY, USA, 2016.
[36] G. Sharma, W. Wu, and E. N. Dalal. The CIEDE2000 color-differenceformula: implementation notes, supplementary test data, and mathematicalobservations. Color research and application, 30(1):21–30, 2005.
[37] Y. Sun, J. Leigh, A. Johnson, and S. Lee. Articulate: A semi-automatedmodel for translating natural language queries into meaningful visual-izations. In International Symposium on Smart Graphics, pp. 184–195.Springer, 2010.
[38] T. Trower. Creating conversational interfaces for interactive softwareagents. In Extended Abstracts on Human Factors in Computing Systems,CHI EA 1997, pp. 198–199. ACM, New York, NY, USA, 1997.
[39] T. Van Dijk. Text and Context: Explorations in the Semantics and Pragmat-ics of Discourse. Longman Linguistics Library. Addison-Wesley LongmanLimited, 1977.
[40] Z. Wen, M. X. Zhou, and V. Aggarwal. An optimization-based approach todynamic visual context management. In IEEE Symposium on InformationVisualization, pp. 187–194, 2005.
[41] Z. Wu and M. Palmer. Verbs semantics and lexical selection. In Pro-ceedings of the 32nd Annual Meeting on Association for ComputationalLinguistics, ACL 1994, pp. 133–138. Association for Computational Lin-guistics, Stroudsburg, PA, USA, 1994.
Related Documents