I n t e r n a t i o n a l J o u r n a l o f M a n a g e m e n t a n d B u s i n e s s S c i e n c e s International Journal of Management and Business Sciences 2019; Vol. 1, Issue. 1, 14-23 doi: 10.63105/IJMBS.2019.1.1.7 Journal homepage: http://www.sapientpublishing.org/ijmbs Available online at: www.sapientpublishing.org * Corresponding author. Tel.: +0-000-000-0000; Fax: +0-000-000-0000. * Corresponding author Name: Iza Gigauri * Corresponding author. E-mail address: [email protected] * Corresponding author. Country Name: Georgia Copyrights@Sapient Publishing All rights reserved Page 14 of 23 Applying Perceptual Mapping Method for Successful Positioning Strategy Iza Gigauri Associate Professor of St. Andrew the First-Called Georgian University of the Patriarchate of Georgia, School of Business, Computing and Social Sciences, Tbilisi, Georgia. Associate Professor of Caucasus University, Caucasus School of Business, Tbilisi, Georgia. E-mail Address: [email protected] Article Citation: Gigauri, I. (2019). Applying Perceptual Mapping Method for Successful Positioning Strategy. International Journal of Management and Business Sciences, 1(1), 14-24. doi: 10.63105/ijmbs.2019.1.1.7 A B S T R A C T: The paper discusses the theoretical grounds of perceptual mapping and its importance in branding. The paper explains the use of perceptual maps and demonstrates how the collected data can be transferred into visual maps. Simultaneously, it examines various methods of perceptual mapping, and illustrates advantages and disadvantages of different mapping techniques. The paper seeks to make recommendations for business about the benefits in using perceptual mapping in their brand and product positioning strategies. Perceptual mapping method as a powerful tool in marketing research is also useful for service companies. Keywords: Perceptual Map, Positioning, Brand, Marketing Research Introduction The significance and use of perceptual mapping methods by managers to support decisions regarding brand positioning or repositioning is extensively recognized in the marketing literature (Rekettye & Liu, 2001; Dolan, 1990). Its importance is increasing when business is conducted in a country with transition economies. According to the research by Rekettye & Liu (2001), the methodology and techniques of perceptual mapping are complicated and difficult to implement for company managers, who usually require fast and quick analysis. Besides, many research papers present the map without showing how it had been constructed (Rekettye & Liu, 2001). Therefore, the paper aims to show how perceptual maps are developed based on collected data. Furthermore, the paper provides an brought to you by CORE View metadata, citation and similar papers at core.ac.uk provided by ZENODO

Welcome message from author
This document is posted to help you gain knowledge. Please leave a comment to let me know what you think about it! Share it to your friends and learn new things together.
Transcript
I n t e r n a t i o n a l J o u r n a l o f M a n a g e m e n t a n d B u s i n e s s S c i e n c e s
International Journal of Management and Business Sciences 2019; Vol. 1, Issue. 1, 14-23 doi: 10.63105/IJMBS.2019.1.1.7
Journal homepage: http://www.sapientpublishing.org/ijmbs
Available online at: www.sapientpublishing.org
* Corresponding author. Tel.: +0-000-000-0000; Fax: +0-000-000-0000. * Corresponding author Name: Iza Gigauri
* Corresponding author. E-mail address: [email protected] * Corresponding author. Country Name: Georgia Copyrights@Sapient Publishing
All rights reserved Page 14 of 23
Applying Perceptual Mapping Method for Successful Positioning Strategy
Iza Gigauri
Associate Professor of St. Andrew the First-Called Georgian University of the Patriarchate of Georgia, School of
Business, Computing and Social Sciences, Tbilisi, Georgia.
Associate Professor of Caucasus University, Caucasus School of Business, Tbilisi, Georgia.
E-mail Address:
Article Citation: Gigauri, I. (2019). Applying Perceptual Mapping Method for Successful Positioning Strategy. International
Journal of Management and Business Sciences, 1(1), 14-24. doi: 10.63105/ijmbs.2019.1.1.7
A B S T R A C T:
The paper discusses the theoretical grounds of perceptual mapping and its importance in branding. The paper
explains the use of perceptual maps and demonstrates how the collected data can be transferred into visual maps.
Simultaneously, it examines various methods of perceptual mapping, and illustrates advantages and disadvantages
of different mapping techniques. The paper seeks to make recommendations for business about the benefits in
using perceptual mapping in their brand and product positioning strategies. Perceptual mapping method as a
powerful tool in marketing research is also useful for service companies.
Keywords: Perceptual Map, Positioning, Brand, Marketing Research
Introduction
The significance and use of perceptual mapping methods by managers to support decisions regarding brand
positioning or repositioning is extensively recognized in the marketing literature (Rekettye & Liu, 2001; Dolan, 1990).
Its importance is increasing when business is conducted in a country with transition economies.
According to the research by Rekettye & Liu (2001), the methodology and techniques of perceptual mapping are
complicated and difficult to implement for company managers, who usually require fast and quick analysis. Besides,
many research papers present the map without showing how it had been constructed (Rekettye & Liu, 2001). Therefore,
the paper aims to show how perceptual maps are developed based on collected data. Furthermore, the paper provides an
brought to you by COREView metadata, citation and similar papers at core.ac.uk
provided by ZENODO
International Journal of Management and Business Sciences 2019; 1(1): 14-23
S a p i e n t P u b l i s h i n g
Page 17 of 23
overview of methods and techniques of perceptual mapping, as well as its importance in branding, positioning, and
repositioning grounded on perception theories.
Consumers' perceptions and expectations are essential for the success of a company. In today's competitive
environment, creating a brand in the minds of the customers is of paramount importance. Companies attempt to know
how consumers associate their products with the different attributes. Although, companies differ in their advertisement
and promotional campaigns, globalization and liberalization of markets around the world, have resulted in paradigm
shift of the customers' point of views regarding perceived values of a product. Under the circumstances, the customers'
perceptions of brands, preferences, and priorities have become significant for the business.
Although the method is not new, it is not easy to use and to read for people without special knowledge. As a result,
small companies barely use perceptual mapping techniques for positioning their brands. This paper studies the theory
behind perceptual mapping and its impact on business success. Consumer perception of brands needs to be studied and
visualize with graphical perceptual maps in order to plan a successful positioning strategy.
The primary research questions are: What are the main advantages and potential disadvantages of perceptual
mapping? How and when the companies use the perceptual mapping and for what purpose?
The main purpose of this paper is to identify various methods of perceptual mapping, to illustrate the design of a
perceptual map and its techniques, to explain benefits of perceptual mapping in branding in terms of researching
consumer perceptions, to find the relationship in the literature between successful branding strategy and engaging in
perceptual mapping, and to make practical recommendations for companies.
Branding, Positioning, and Perception in Marketing
A product’s position is the place it occupies in the mind of target customers in the competitive business environment,
while positioning is a managerial activity using marketing tools to influence customers' perception and secure a
sustainable place in the mind of the target audience (Schweiger & Schrattenecker, 2009; Helm, 2009; Rekettye & Liu,
2001). Consumers may evaluate the identical product differently depending on how it is branded. Perception is defined
as the process by which an individual select, organizes, and interprets information inputs to create meaningful picture of
the world (Kotler & Keller, 2009). Thus, Perceptual maps provide a visual picture of the positioning activity. If the
company is not satisfied with the achieved location of the product it may try to relocate it (Rekettye & Liu, 2001). The
aim of repositioning is to move consumers' perceptions towards a product to a new, desired location through marketing
communication or promotional instruments.
Since branding is all about perception, it is not a battle of products in the market, but perceptions. For a product to
exist, it must find a place in an individual consumer’s perception of the world of products and services around him/ her,
because a product or service does not exist independent from the consumer. This subjective perception is governed by
the individual consumer’s values, beliefs, needs, experience and environment (Chadha & Kapoor, 2008). Therefore,
customers are creating a brand based on their perception as they usually associate the brand name with specific
attributes, particular benefits, features and characteristics in a given situation.
Furthermore, positioning is also a vital concept for a service industry as it leads to competitive advantage due to the
attributes associated with service quality in the minds of customers (Dash, 2015). Consequently, growth and
development of an enterprise mainly depend on satisfying and attracting customers. Perceptual mapping can visually
displaying customers' perception of quality attributes of service companies, and eventually helps in setting the direction
on the marketing activities by the service companies to ensure better service quality based on the standpoint of
consumers (Dash, 2015).
Since perception is the image or the formalized impressions, which reside in the mind of an individual customer
Gigauri, I. (2019). Applying Perceptual Mapping Method for Successful Positioning Strategy
S a p i e n t P u b l i s h i n g
Page 18 of 23
about different products, companies, or brands, so these perceptions strongly influence on buying behavior. Besides, not
only self-image affects the buying decisions but also brand image. Customers tend to prefer a product or service whose
images appearing consistent with their self-images. However, brand image in the mind of a customer is of utmost
importance. Therefore, marketing communication takes into consideration the perception of incoming stimuli by the
consumers. Perception process includes not only selecting or organizing, but also interpreting information.
Consequently, different people perceive differently the same situation or events, and assign them different meanings.
Yet, those meanings might change over time or by influence. Hence, perceptual mapping attempts to address
perceptions of consumers in order to decide the following marketing efforts to exert influence on their minds.
Concept of Perceptual Mapping
Perceptual maps are used in marketing to visually study relations between two or more attributes. The term
"perceptual map" refers to plots obtained by a series of different techniques, such as principal component analysis,
(multiple) correspondence analysis, and multidimensional scaling, each needing specific requirements for producing the
map and interpreting it (Gower et al., 2010). It should be noted that the relations between the points in the map needs to
be interpreted clearly and explained by a researcher what a point represents. Gower et al. (2010) provide guidelines for
producing perceptual maps that are useful and simple aids for both marketers and readers.
Furthermore, creating brand value to the consumers is also the most important key to an online business in order to
survive the competition and make profits (Chiang et al. 2008). Establishing a strong brand plays a key role for a
competitive business. In this context, brand image and brand personality are main sources of brand perception by the
customers. Moreover, brand personality tends to serve as a symbolic or self-expressive function (Chiang et al. 2008).
Hence, perception mapping for online brands can provide a practical view of the associations and similarities among
online companies or online products for developing branding strategies. The findings of the study by Chiang et al.
(2008) suggest that brand perceptions could be used with identified consumer needs and behaviors to better position
online services. Additionally, perception maps can be applicable to the online brands across different markets. In
addition, the researchers argued that brand perception map also contributes to a better understanding of the online
brands (Chiang et al. 2008).
Perceptual mapping has been historically regarded as one of the most important analytical tools in marketing research
(Chadha & Kapoor, 2008; Green et al., 1998; Steenkamp et al., 1994), and it is essentially suited for the analysis of
brand equity’s sources (Chadha & Kapoor, 2008). Perceptual mapping describes the consumer’s perceptions of objects
on one or a series of spatial maps, so that the relationship between the objects can be easily seen (Chadha & Kapoor,
2008). Attribute-based perceptual mapping uses different approaches such as factor analysis, correspondence analysis
and discriminant analysis. These methods can identify the number of dimensions that the consumers use to distinguish
the objects; determine a preferred location of an object on each of the dimensions; and provide information on the
nature and characteristics of these dimensions (Chadha & Kapoor, 2008).
According to Blake et al. (2003), Perceptual Maps are widely used by market researchers to portray a brand’s image
or consumer’s reactions to product features. Three types of maps are especially popular among professional researchers:
(1) Perceptual maps that identify the images of brands, products, services, etc. Preference maps that estimate differences
among segments or individuals in the appeal or attractiveness of brands, products, services, features; and (3) Hybrid
maps which portray both images and appeal (Blake et al., 2003). Subsequently, a variety of statistical techniques can be
used to generate each type of map. Perceptual maps are usually constructed via multidimensional scaling, multiple
discriminant function, correspondence analysis; while Preference maps are typically developed by a form of
multidimensional “unfolding”; and Hybrid maps are composed by first devising a perceptual map and then introjecting
preferences as “ideal points” or as “vectors” (Blake et al., 2003).
International Journal of Management and Business Sciences 2019; 1(1): 14-23
S a p i e n t P u b l i s h i n g
Page 19 of 23
Perceptual Mapping Method
A perceptual map visually illustrates how target customers view the competing alternatives in a Euclidean space,
which represents the market (Lilien et al., 2002; Dallakyan, 2014). It is constructed by the data reflecting consumer
perceptions of brands in the market place (Dallakyan, 2014).
The major statistical techniques for perceptual mapping have been available for decades, but there are still questions
about those techniques among practicing professionals (Blake et al., 2003).
The perceptual map is the function of multidimensional scaling (MDS) and various factorial techniques, such as
principal component analysis (PCA), correspondence analysis (CA) and discriminant analysis (DA) (Dallakyan, 2014).
In this respect, the perceptual map is a graphical display in which different brands can be portrayed so that distances
between them demonstrate their differences, similarities or dissimilarities, and is measured by the variables. The
variables can be a set of attributes or rank-orderings, evaluated by the consumers on the basis of their perceptions with
the brands (Dallakyan, 2014).
Besides, the perceptual map grounded on the perception of customers towards the dimensions of different attributes
of a product, service, or brand, is developed using discriminant analysis (Dash, 2015).
In addition, the uncovered spatial configuration of brands can be influenced not only by the perceptual differences
between the brands, but also by a respondent-related factor, as respondent- and situation factors can interact with
product attribute perceptions in perceptual mapping applications to influence the respondent's ratings of the brands
(Dillon et al. 1982). Hence, standard practice in perceptual mapping is to collect respondent background characteristics
along with the brand attribute rating data used to derive the perceptual map (Dillon et al. 1982).
According to Gower, et al. (2010), Correspondence analysis (CA) is a popular perceptual mapping method that is
concerned with the analysis of contingency tables. Mathematically, however, the method can be applied to any
nonnegative data matrix. The objective of correspondence analysis is to give a graphical representation of both rows
and columns of the contingency table. For this purpose, high dimensional data is approximated in a low (usually two)
dimensional space (Gower, et al. 2010).
Multidimensional Scaling (MDS) is concerned with drawing a map from a matrix giving the dissimilarities dij
between all pairs of n objects (Gower, et al. 2010). Although MDS exists in two forms: metric MDS and nonmetric
MDS, in practice, there is little difference between maps produced by the two approaches (Gower, et al. 2010).
Initially, the respondents are asked to assign scores of attributes on a Likert scale in the questionnaires. Then,
visualization techniques of multidimensional data - multidimensional scaling (MDS) is used to obtain the perceptual
map. MDS is widely used in the marketing research to solve marketing problems, and in particular, in the area of
perceptual mapping, for which the purpose is to derive a spatial representation of the market (Bijmolt &Wedeu, 1999).
Multidimensional Scaling (MDS), a decompositional multivariate analysis technique has the capability of mapping
out the perceptions held by consumers in terms of brand personality. A perceptual map can be generated from the
obtained responses using MDS (Mishra & Mohanty, 2013). The perceptual mapping of the brands is based on the
similarity / dissimilarity evaluation carried out by the respondents. To these ends, SPSS is widely used to combine the
responses and create a perceptual map through aggregate analysis. It should be also noted that the MDS PROXSCAL
routine creates distances based on a Euclidean scaling model of two dimensions (Mishra & Mohanty, 2013).
MDS is "a procedure that allows a researcher to determine the perceived relative image of a set of objects" (Hair et al.
Gigauri, I. (2019). Applying Perceptual Mapping Method for Successful Positioning Strategy
S a p i e n t P u b l i s h i n g
Page 20 of 23
1998 as cited in Kim, 2002). It arranges a set of objects in a common space based on the similarities or differences of
the object. The major advantage of MDS is that it provides visual representation of the similarities or differences among
the objects (Kim, 2002).
According to Kim (2002), the positions of the companies or brands appearing on the perceptual map can be used by
the companies to clarify the strengths and weaknesses identified by the customers' perceptions. It should be pointed out
that companies that are located in similar positions on the perceptual map might actually not be competitors, and the
positions of brands can be changed over time (Kim, 2002).
Moreover, correspondence analysis is used to construct compositional perceptual maps. Besides, the application of
chi-squared trees analysis can be used to cluster both brands and attributes (Bendixen, 1995). A central aspect of the
interpretation of perceptual maps is the identification of sets of brands that are perceived similarly, or are associated
with a similar set of attributes. Consequently, compositional perceptual mapping remains an important tool in branding
and positioning, as perceived by consumers, and is fundamental to the development of appropriate marketing strategies.
The further segmentation of brands, based on similarity in perceptions, identifies directly competitive sets. This allows
for a more detailed understanding of market structure and consumer behaviour and can enhance the marketing planning
process (Bendixen, 1995).
In summary, perceptual mapping tools are very useful for marketing managers, as they are helpful in making
decisions about product design, customer value, and brand positioning.
Methodologies for Developing the Perceptual Map
Perceptual maps serve as an effective visual guide for the marketing managers as they consist of two dimensions. In
case a product has only two characteristics, the researcher asks the respondents to evaluate these two attributes of the
brands and shows the results on a graph. However, most products have more than two characteristics, and consequently,
they are evaluated by a set of attributes. In such cases, two methods are proposed for developing perceptual maps: the
attribute rating method and the overall similarity method (Dolan, 1990; Rekettye & Liu, 2001). The first method is used
in those cases where relevant product attributes are easy to identify and articulate. Customers are presented the full list
of attributes and are requested to rate each brand on each attribute. On the basis of the information the statistical
analysis - either factor analysis or multiple discriminant analysis - can be used to prepare the two-dimensional
perceptual map (Rekettye & Liu, 2001). The second method is used in the case of products where attributes are hard to
verbalize. Respondents are presented the brands pairwise and are asked to judge them according to their preference.
This method uses the statistical procedure called multidimensional scaling to lead to the production of a two-
dimensional map (Rekettye & Liu, 2001). When attributed rating method is used in the survey, first those attributes
must be identified which influence the buying decision. This can be done by group discussion or other techniques of
qualitative research method. Then, the respondents can be asked in the questionnaire to evaluate the importance of each
attribute. For this intention, a Likert scale should be used to rate them from 1 to 7 or 10. Finally, the perceptual map is
designed based on the results of the survey to visualize the positioning of brands.
The research of Blake et al. (2003) focused on multidimensional scaling (MDS) as it is widely used by market
researchers, and documented the application of two widely used perceptual mapping technique - Classical and Weighted
Multidimensional Scaling. They used the statistical software program SPSS asserting that the ideas can be generalized
to other statistical packages and programs, and have provided a guide for performing perceptual mapping techniques
(Blake et al., 2003).
Classic MDS is also known as Torgerson Scaling or Torgerson-Gower Scaling (Borg & Groenen, 2005). Classic
Multidimensional Scaling (CMDS) mapping can identify how well an advertisement or tagline can fit a company, or
International Journal of Management and Business Sciences 2019; 1(1): 14-23
S a p i e n t P u b l i s h i n g
Page 21 of 23
even be incompatible with a particular brand name. Using this method, respondents rate the similarity of pairs of the
items on a 0-10 point scale, higher numbers meaning more similarity. The closer together on the map are the items, the
more similar they are perceived to be (Blake et al. 2003).
In Weighted Multidimensional Scaling (WMDS), the perceived similarity among stimuli is considered, but
differences in perception among specific segments of individuals are identified. WMDS calculates the differences
among the groups of respondents on a given number of dimensions (Blake et al. 2003).
WMDS shows the importance of a dimension to a particular segment when that segment perceives the stimuli in
question. One map is produced for each segment. The closer together the stimuli are on the map, the more similar is the
weight assigned to an object on a particular dimension. The data can be also separated into male and female segments
(Blake et al. 2003). According to the study of Blake et al. (2003), this kind of perceptual mapping can aid in
determining how appropriate or inappropriate an advertisement can be for a company depending on the target market
segment of interest. Consequently, this mapping technique can identify the most appropriate advertisement for a
particular brand name in general.
Researchers suggest that CMDS can reach two general goals: First, CMDS can estimate the relative importance of
the dimensions that respondents use to judge the degree of similarity or dissimilarity among the stimuli; second, the
degree of similarity among all of the stimuli on those dimensions can be assessed (Blake et al. 2003).
Furthermore, Blake et al. (2003) describe the steps for perceptual mapping using CMDS that is a statistical technique
created to transform data indicating the degree of rated similarity or dissimilarity of objects to scores indicating
distances among the objects. A “map” is constructed to show the distances among the objects. Objects closer together
on the map are perceived as more similar, while objects further apart are perceived as more dissimilar. The same unit of
measurement is used for all of the distances among the objects. One matrix of data is used, displaying the perceptions of
one person or the average person’s answers in the group of respondents in question.
The data analyzed in CMDS can be ordinal, interval, or ratio. Ordinal data arranges objects in a rank order from high
to low on a dimension, whereas interval data pertains to numbering in which one number is a fixed amount more or less
than another number, and ration data has a true zero point in contrast to interval scale, and hence allows a researcher to
calculate ratios or proportions (Blake et al. 2003).
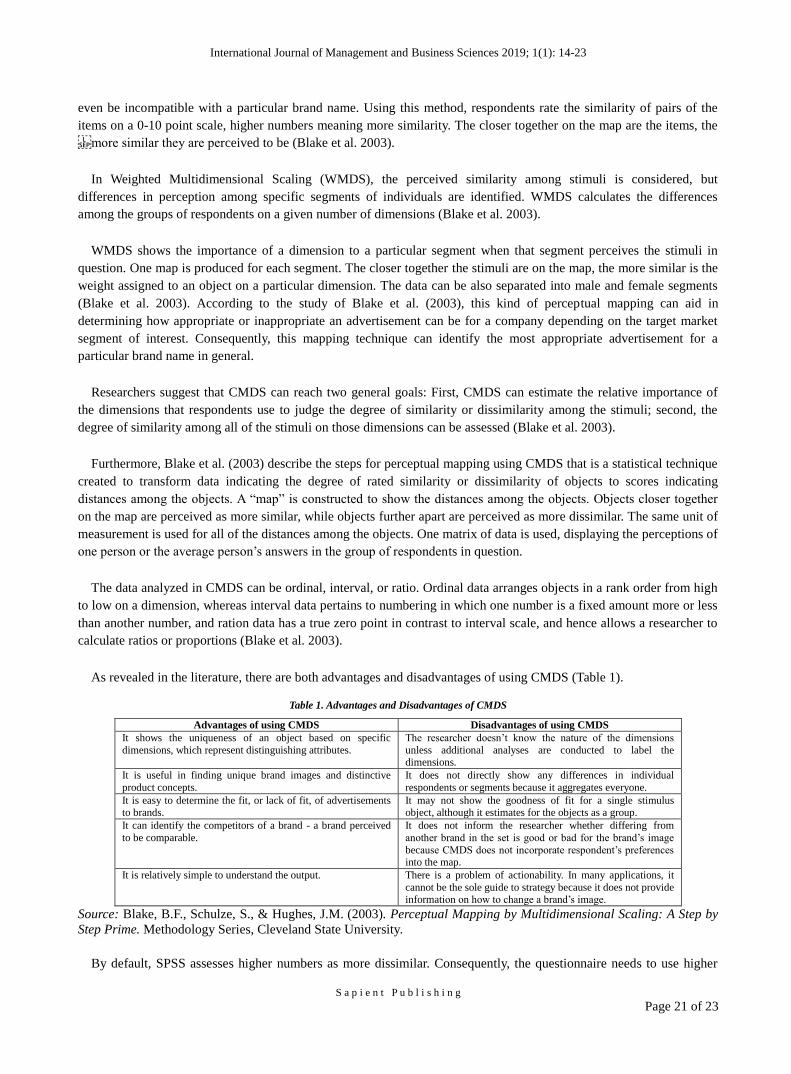
As revealed in the literature, there are both advantages and disadvantages of using CMDS (Table 1).
Table 1. Advantages and Disadvantages of CMDS
Advantages of using CMDS Disadvantages of using CMDS
It shows the uniqueness of an object based on specific
dimensions, which represent distinguishing attributes.
The researcher doesn’t know the nature of the dimensions
unless additional analyses are conducted to label the dimensions.
It is useful in finding unique brand images and distinctive
product concepts.
It does not directly show any differences in individual
respondents or segments because it aggregates everyone.
It is easy to determine the fit, or lack of fit, of advertisements to brands.
It may not show the goodness of fit for a single stimulus object, although it estimates for the objects as a group.
It can identify the competitors of a brand - a brand perceived
to be comparable.
It does not inform the researcher whether differing from
another brand in the set is good or bad for the brand’s image
because CMDS does not incorporate respondent’s preferences into the map.
It is relatively simple to understand the output. There is a problem of actionability. In many applications, it
cannot be the sole guide to strategy because it does not provide information on how to change a brand’s image.
Source: Blake, B.F., Schulze, S., & Hughes, J.M. (2003). Perceptual Mapping by Multidimensional Scaling: A Step by
Step Prime. Methodology Series, Cleveland State University.
By default, SPSS assesses higher numbers as more dissimilar. Consequently, the questionnaire needs to use higher
Gigauri, I. (2019). Applying Perceptual Mapping Method for Successful Positioning Strategy
S a p i e n t P u b l i s h i n g
Page 22 of 23
numbers to indicate dissimilarity and lower numbers to indicate similarity. Otherwise, the values would need to be
recoded (Blake et al., 2003).
According to Blake et al. (2003), WMDS is based upon CMDS, but extends the simpler CMDS to allow for
individual segment differences. WMDS generates a "group space", a mapping that pertains in general to all individuals
or segments. However, it does not show the uniqueness of a specific individual or segment. For this kind of mapping,
demographical and general background data of respondents are needed.
It is also noteworthy that interpretation is the same as CMDS because all interpoint distances between the objects are
on the same scale of distance between each other (Blake et al., 2003). The only difference between CMDS and WMDS
analysis through SPSS is under the Model tab, in which Individual Differences Euclidean Distance should be selected
(Blake et al., 2003). In addition, under the options tab, the researcher specifies group plots, the data matrix, and the
model and options summary. Subsequently, separate maps can be created for different demographic groups, e.g. for
male and female respondents, and calculated the distance between each of the possible pairs of points in one map and
then correlated that with the corresponding distance on the other map, as well as can be calculate the Euclidean distance
separating all points on a map (Blake et al., 2003).
WMDS maps can be interpreted likewise the CMDS maps. But a simple Pearson R correlation can be calculated
between the male and female groups. If a Pearson R correlation is high, it can be concluded that the two spaces (male
and female maps) are comparable. If a Pearson R correlation is low, it can be concluded that there is a huge difference
between the two matrices (Blake et al., 2003).
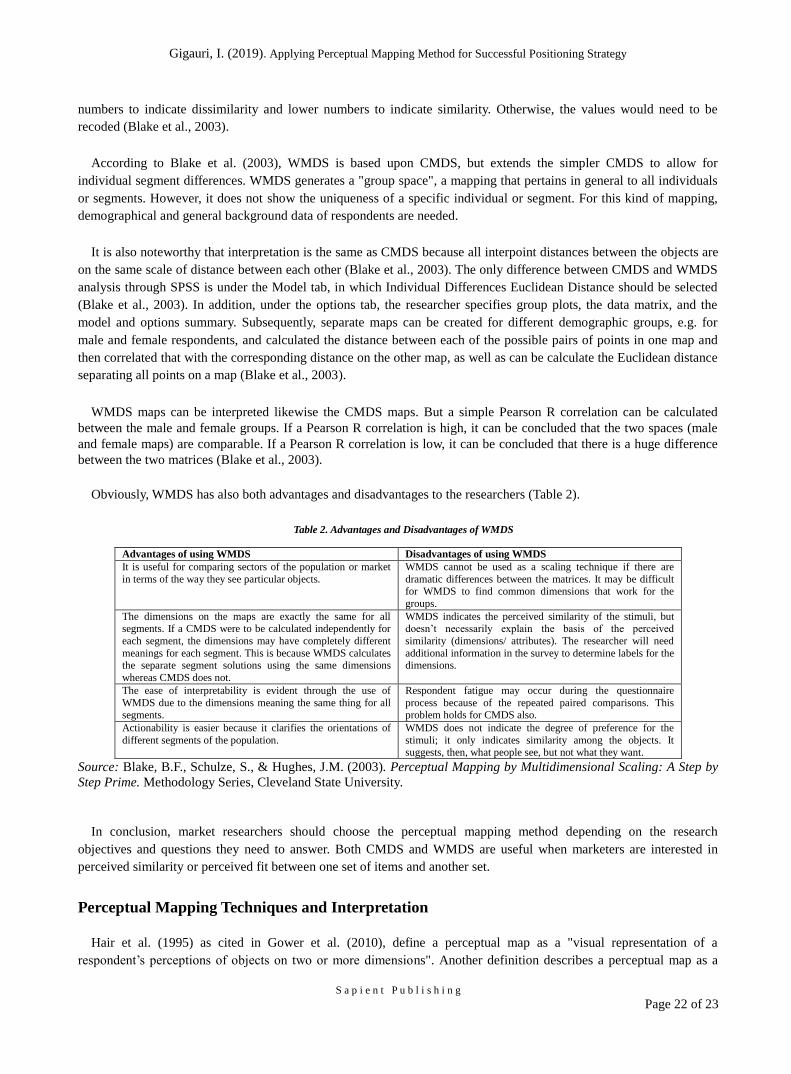
Obviously, WMDS has also both advantages and disadvantages to the researchers (Table 2).
Table 2. Advantages and Disadvantages of WMDS
Advantages of using WMDS Disadvantages of using WMDS
It is useful for comparing sectors of the population or market
in terms of the way they see particular objects.
WMDS cannot be used as a scaling technique if there are
dramatic differences between the matrices. It may be difficult for WMDS to find common dimensions that work for the
groups.
The dimensions on the maps are exactly the same for all segments. If a CMDS were to be calculated independently for
each segment, the dimensions may have completely different
meanings for each segment. This is because WMDS calculates the separate segment solutions using the same dimensions
whereas CMDS does not.
WMDS indicates the perceived similarity of the stimuli, but doesn’t necessarily explain the basis of the perceived
similarity (dimensions/ attributes). The researcher will need
additional information in the survey to determine labels for the dimensions.
The ease of interpretability is evident through the use of
WMDS due to the dimensions meaning the same thing for all segments.
Respondent fatigue may occur during the questionnaire
process because of the repeated paired comparisons. This problem holds for CMDS also.
Actionability is easier because it clarifies the orientations of
different segments of the population.
WMDS does not indicate the degree of preference for the
stimuli; it only indicates similarity among the objects. It suggests, then, what people see, but not what they want.
Source: Blake, B.F., Schulze, S., & Hughes, J.M. (2003). Perceptual Mapping by Multidimensional Scaling: A Step by
Step Prime. Methodology Series, Cleveland State University.
In conclusion, market researchers should choose the perceptual mapping method depending on the research
objectives and questions they need to answer. Both CMDS and WMDS are useful when marketers are interested in
perceived similarity or perceived fit between one set of items and another set.
Perceptual Mapping Techniques and Interpretation
Hair et al. (1995) as cited in Gower et al. (2010), define a perceptual map as a "visual representation of a
respondent’s perceptions of objects on two or more dimensions". Another definition describes a perceptual map as a
International Journal of Management and Business Sciences 2019; 1(1): 14-23
S a p i e n t P u b l i s h i n g
Page 23 of 23
"graphical representation in which competing alternatives are plotted in Euclidean space" (Lilien & Rangaswamy (2003,
as cited in Gower et al., 2010). Thus, perceptual maps illustrate data visualizations, which makes them an effective
marketing tool, as marketing researchers know, how powerful graphical representation of complex high dimensional
data can be. Since consumers' perceptions of products, and relationships between pairs of products are subjects of
interest by the researchers, multidimensional analyses are widely used. Therefore, perceptual mapping as refers to the
type of data (perceptual) coupled with multidimensional methodology (mapping) is useful. Clear perceptual maps are
accompanying by the text about relationships between and within (possibly latent) attributes avoiding difficult statistical
concepts. The perceptual maps can be presented in such a way that the information within them can be quickly and
correctly assimilated (Gower et al., 2010).
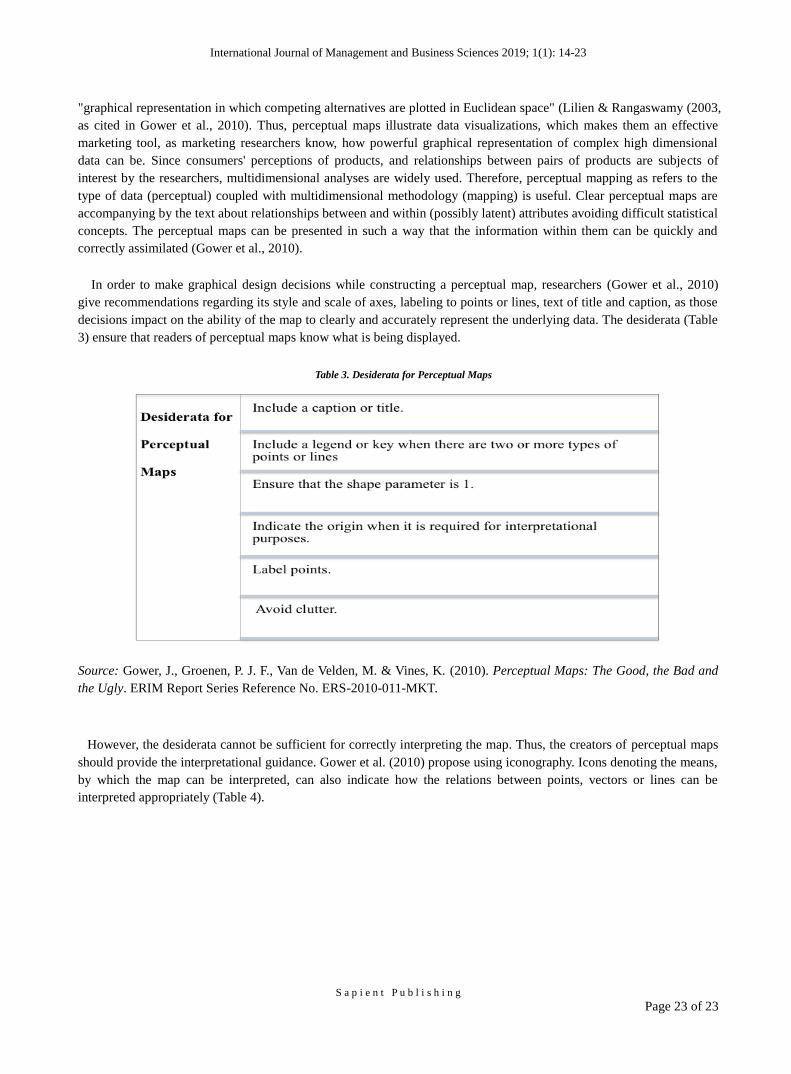
In order to make graphical design decisions while constructing a perceptual map, researchers (Gower et al., 2010)
give recommendations regarding its style and scale of axes, labeling to points or lines, text of title and caption, as those
decisions impact on the ability of the map to clearly and accurately represent the underlying data. The desiderata (Table
3) ensure that readers of perceptual maps know what is being displayed.
Table 3. Desiderata for Perceptual Maps
Source: Gower, J., Groenen, P. J. F., Van de Velden, M. & Vines, K. (2010). Perceptual Maps: The Good, the Bad and
the Ugly. ERIM Report Series Reference No. ERS-2010-011-MKT.
However, the desiderata cannot be sufficient for correctly interpreting the map. Thus, the creators of perceptual maps
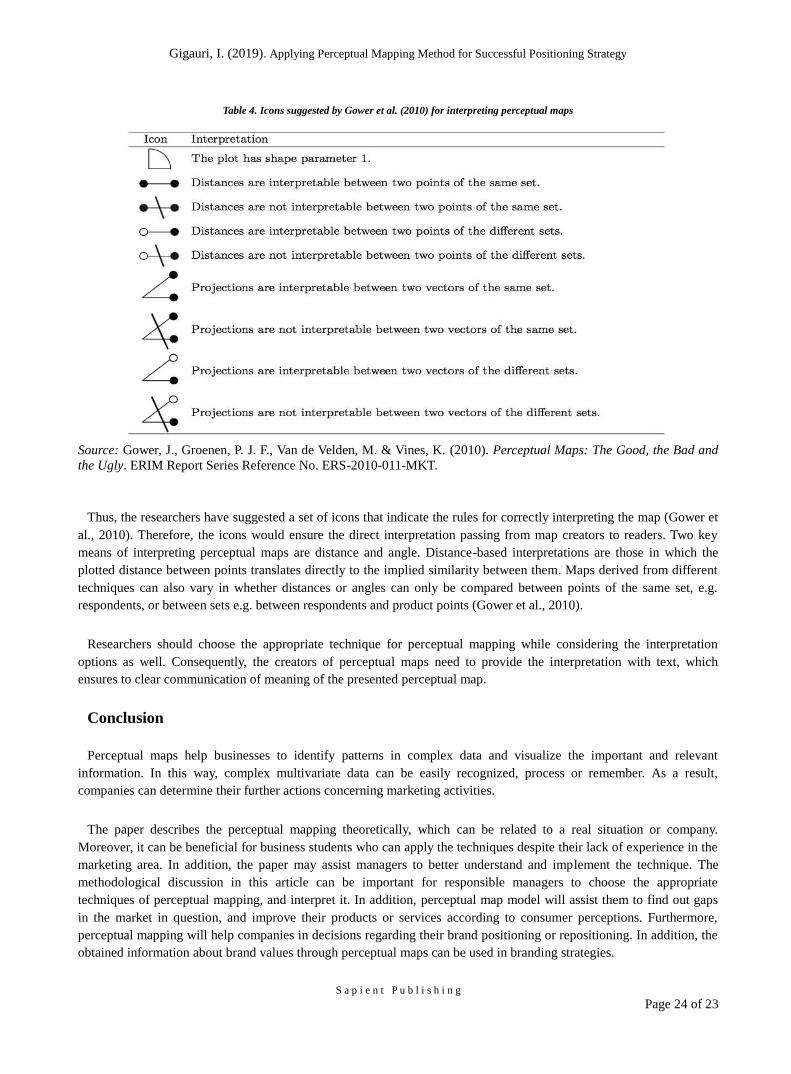
should provide the interpretational guidance. Gower et al. (2010) propose using iconography. Icons denoting the means,
by which the map can be interpreted, can also indicate how the relations between points, vectors or lines can be
interpreted appropriately (Table 4).
Gigauri, I. (2019). Applying Perceptual Mapping Method for Successful Positioning Strategy
S a p i e n t P u b l i s h i n g
Page 24 of 23
Table 4. Icons suggested by Gower et al. (2010) for interpreting perceptual maps
Source: Gower, J., Groenen, P. J. F., Van de Velden, M. & Vines, K. (2010). Perceptual Maps: The Good, the Bad and
the Ugly. ERIM Report Series Reference No. ERS-2010-011-MKT.
Thus, the researchers have suggested a set of icons that indicate the rules for correctly interpreting the map (Gower et
al., 2010). Therefore, the icons would ensure the direct interpretation passing from map creators to readers. Two key
means of interpreting perceptual maps are distance and angle. Distance-based interpretations are those in which the
plotted distance between points translates directly to the implied similarity between them. Maps derived from different
techniques can also vary in whether distances or angles can only be compared between points of the same set, e.g.
respondents, or between sets e.g. between respondents and product points (Gower et al., 2010).
Researchers should choose the appropriate technique for perceptual mapping while considering the interpretation
options as well. Consequently, the creators of perceptual maps need to provide the interpretation with text, which
ensures to clear communication of meaning of the presented perceptual map.
Conclusion
Perceptual maps help businesses to identify patterns in complex data and visualize the important and relevant
information. In this way, complex multivariate data can be easily recognized, process or remember. As a result,
companies can determine their further actions concerning marketing activities.
The paper describes the perceptual mapping theoretically, which can be related to a real situation or company.
Moreover, it can be beneficial for business students who can apply the techniques despite their lack of experience in the
marketing area. In addition, the paper may assist managers to better understand and implement the technique. The
methodological discussion in this article can be important for responsible managers to choose the appropriate
techniques of perceptual mapping, and interpret it. In addition, perceptual map model will assist them to find out gaps
in the market in question, and improve their products or services according to consumer perceptions. Furthermore,
perceptual mapping will help companies in decisions regarding their brand positioning or repositioning. In addition, the
obtained information about brand values through perceptual maps can be used in branding strategies.
International Journal of Management and Business Sciences 2019; 1(1): 14-23
S a p i e n t P u b l i s h i n g
Page 25 of 23
The future growth of an enterprise depends on how effectively it can come up with a new or innovative product
design suitable to consumer perceptions, as well as how effectively it can influence the perception of a consumer or
even change it. Besides, success of the market also depends on how the enterprise can reach the potential customers.
Thus, branding is of great importance, and creating impressions on the minds of the customers through accurate
positioning can be critical in gaining the competitive advantage. Finally, companies should conduct marketing research
using perceptual mapping in order to consider important attributes of their brand, products, and services, and focus on
perception of their consumers to be able to success in the competitive markets.
References
Bendixen, M.T. (1995). Compositional Perceptual Mapping Using Chi-squared Trees Analysis and Correspondence Analysis. Journal of Marketing Management. 11, 571-5.
Bijmolt, T. H. A. & Wedeu, M. (1999). A Comparison Of Multidimensional Scaling Methods For Perceptual Mapping. Journal Of Marketing Research, 36, 277-285.
Blake, B.F., Schulze, S., & Hughes, J. M. (2003). Perceptual Mapping by Multidimensional Scaling: A Step by Step Primer. Methodology Series, Cleveland State University.
Borg, I. & Groenen, P. J. (2005). Modern Multidimensional Scaling: Theory and Applications. Springer, New York.
Chadha, S. K. & Kapoor, D (2008). An Attribute Based Perceptual Mapping Of The Selected Private Life Insurance Companies: An Empirical Study In Ludhiana. VISION - The Journal Of Business Perspective, 12 (3).
Chiang, I.-P., Lin, C.-Y. & Wang, K. M. (2008). Building Online Brand Perceptual Map. Cyberpsychology & Behavior, 11 (5). https://doi.org/10.1089/cpb.2007.0182
Dallakyan, A. (2014). Yogurt Market Analyisis In Armenia Using Hedonic Price Model And Perceptual Mapping Method. American Economic Association (AEA) Annual Meeting.
Dash, A. (2015). Quality-Based Perceptual Mapping of Leading Banks in India: An Empirical Study.The IUP Journal of Management Research, 14 (4).
Dillon, W. R., Frederick, D. & Tangpanichdee, V. (1982). A Note on Accounting for Sources of Variation in Perceptual Maps. Journal of Marketing Research. 19, 302-11.
Dolan, R. J. (1990). Perceptual Mapping: A Manager’s Guide. Harvard Business School Background Note, 590-121.
Gower, J., Groenen, P. J. F., Van de Velden, M. &Vines, K. (2010). Perceptual Maps: The Good, the Bad and the Ugly. ERIM Report Series Reference No. ERS-2010-011-MKT. [Online] Available: https://ssrn.com/abstract=1572196
Green, P. E., Carmone, F. J. & Smith S. M. (1988). Multidimensional Scaling: Concepts And Applications. Allyn & Bacon, Boston.
Helm, R. (2009). Marketing: Strategische Analyse und Marketorientierte Umsetzung. Lucius & Lucius Verlagsgesellschaft mbH, Stuttgart.
Kim, D. J. (2002). A Perceptual Mapping Of Online Travel Agencies and Preference Attributes. Master' Thesis, Graduate College of the Oklahoma State University.
Kotler, P. & Keller, K. L. (2009). Marketing Management. 13th eds. Pearson Prentice Hall. Pearson Education International.
Lilien, G., Rangaswamy, A., Van Bruggen, G. H. & Wierenga, B. (2002). Bridging the Marketing Theory-Practice Gap with Marketing Engineering. Journal of Business Research, 55 (2), 111-121. https://doi.org/10.1016/S0148-2963(00)00146-6
Mishra, M. & Mohanty, S. (2013). Impact of Corporate Social Responsibility Communication on Corporate Brand Personality Assessment. The IUP Journal of Management Research, 12 (4).
Rekettye, G. & and Liu J. (2001). Segmenting the Hungarian Automobile Market Brand Using Perceptual And Value Mapping. Journal of Targeting, Measurement and Analysis for Marketing, 9 (3), 241–253.
Schweiger, G. & Schrattenecker, G. (2009). Werbung: Eine Einführung. 7. Auflage. Lucius & Lucius Verlagsgesellschaft mbH, Stuttgart.
Steenkamp, J.-B. E. M., Van Trijp, H. C. M. & Ten Berge J. M. F. (1994). Perceptual Mapping Based on Idiosyncratic Sets of Attributes. Journal of Marketing Research, 31 (1), 15-27.
Related Documents