Applying Kolb's Experiential Learning Cycle for Laboratory Education Journal: Journal of Engineering Education Manuscript ID: JEE-8153.R1 Manuscript Type: Full Paper Date Submitted by the Author: 17-Dec-2008 Complete List of Authors: Abdulwahed, Mahmoud; Loughborough University, Chemical Engineering Department; Loughborough University, Engineering Center of Excellence in Teaching and Learning Nagy, Zoltan; Loughhborough University, Chemical Engineering Keywords: Laboratory engineering education, remote and virtual laboratories, Kolb�s experiential learning ScholarOne support: (434) 817 2040 ext. 167 Journal of Engineering Education

Welcome message from author
This document is posted to help you gain knowledge. Please leave a comment to let me know what you think about it! Share it to your friends and learn new things together.
Transcript

Applying Kolb's Experiential Learning Cycle for Laboratory Education
Journal: Journal of Engineering Education
Manuscript ID: JEE-8153.R1
Manuscript Type: Full Paper
Date Submitted by the Author:
17-Dec-2008
Complete List of Authors: Abdulwahed, Mahmoud; Loughborough University, Chemical Engineering Department; Loughborough University, Engineering Center of Excellence in Teaching and Learning Nagy, Zoltan; Loughhborough University, Chemical Engineering
Keywords: Laboratory engineering education, remote and virtual laboratories,
Kolb�s experiential learning
ScholarOne support: (434) 817 2040 ext. 167
Journal of Engineering Education
1
†Chemical Engineering Department, Loughborough University, LE11 3TU Loughborough, UK
‡Engineering Center of Excellence in Teaching and Learning, Loughborough University, LE11 3TU Loughborough, UK
Abstract—The paper describes a model for laboratory education based on Kolb’s
experiential learning theory. The method is implemented using modern teaching
technologies and a combination of remote, virtual and hands-on laboratory sessions, and
has been applied to the teaching of the undergraduate process control laboratory at the
Chemical Engineering Department at Loughborough University, United Kingdom. An
argument that poor learning in the laboratory is due to insufficient activation of the
prehension dimension of Kolb’s cycle was suggested and verified, providing a pedagogical
explanation. The quantitative analysis showed significant enhancement of the learning
outcomes of the experimental group compared with the control group. Apart from the
hands-on session, the proposed model involves additional activities, such as pre- and post-
lab tests and virtual laboratory sessions, which are associated with Kolb’s cycle to facilitate
constructivist learning. The paper provides the first laboratory education model that builds
thoroughly on Kolb’s experiential learning theory.
Index Terms— Laboratory engineering education, remote and virtual laboratories, Kolb’s
experiential learning.
* Corresponding author: Email: [email protected]
Applying Kolb’s Experiential Learning Cycle
for Laboratory Education Mahmoud Abdulwahed†‡, Zoltan K Nagy†*
Page 1 of 33
ScholarOne support: (434) 817 2040 ext. 167
Journal of Engineering Education

2
I. INTRODUCTION
THE importance of laboratory experience in engineering education curricula has been emphasized
in a large number of science and engineering education articles (Johnstone and Al-Shuaili, 2001;
Hofstein and Lunetta, 2004; Feisel, 2005; Kirschner, 1988; Ma and Nickerson, 2006). The
essential role of laboratories can be correlated with the fact that engineering is, in general, an
applied science that requires very good hands-on skills and involves elements of design, problem
solving, and analytical thinking. Well designed laboratories during undergraduate engineering
degrees can improve these skills of the future engineers.
Engineering had been taught as a pure hands-on subject up to the 18th century. However,
engineering education has benefited from the advances in science and it began to embed deeper
theoretical concepts by the end of the 19th century, especially in the US schools initially (Feisel,
2005). Since then, the pedagogical emphasis in engineering education has been shifted more
towards classroom and lecture based education, and gradually less attention has been given to the
laboratory education, particularly during the last 30 years (Hofstein and Lunetta, 2004; Hofstein
and Lunetta, 1982; Feisel and Peterson, 2002). Wankat (2004) observed that only 6% of the
articles published in the Journal of Engineering Education from 1993-2002 had ‘Laboratory’ as a
keyword. Laboratory pedagogy has been recently reported to be a fertile arena of research for the
coming years (Hofstein and Lunetta, 2004; Feisel and Rosa, 2005), especially in the context of
the increasing need to make more use of the new developments in information and
communication technology (ICT) for enhancing the laboratory education.
The impact of laboratory education on students’ learning is often not recognized (Roth, 1994).
One reason for rethinking the role of the laboratory in engineering and science education is the
Page 2 of 33
ScholarOne support: (434) 817 2040 ext. 167
Journal of Engineering Education

3
recent shift towards constructivist pedagogy in which the importance of knowledge gained via
experience is emphasized. Furthermore, constructivist pedagogy places larger role on student
autonomy in the learning process. This is particularly important in the view of the recent increase
in the needs of industry for engineering graduates who are autonomous and equipped with good
hands-on skills. Enhancing laboratory education can serve as a motivating factor toward
engineering career.
Despite the important role of laboratories in engineering education, several researchers have
reported that the expected benefits of laboratories on students’ learning are not achieved in most
of the cases (Hofestein and Lunetta, 2004; Roth, 1994). In their literature review, Ma and
Nickerson (2006) found that 100% of the articles concerning hands-on laboratories considered
that labs should be platforms for facilitating conceptual understanding, and 65% considered that
laboratories should also facilitate the design skills. However, constructing knowledge is a
complex process which is often out of the timeframe of the planned laboratory sessions.
Knowledge construction has four main phases according to Kolb’s experiential learning theory,
including stimulation, reflection, abstraction, and experimentation (Kolb 1984). Meaningful
learning is an iterative process requiring reflection (Hofestein and Lunetta, 2004). These
practices are generally missing in the classical hands-on taught laboratories. Gunstone (1991)
considers that laboratories which are taught in the classical way can barely be considered as
platforms of knowledge construction, since students have less time to interact and reflect while
they are busy with the technical and the operational side of the lab. Kirschner (1988) point out
the main shortcomings in some of he hands-on laboratory sessions, including that students are
often required to solve problems that are more difficult than their cognitive abilities, students are
constrained with the short time periods the lab normally offer, and teachers assume that students
Page 3 of 33
ScholarOne support: (434) 817 2040 ext. 167
Journal of Engineering Education
4
will be able to overcome the problems in the assigned time (Kirschner, 1988). They also describe
that classical labs are usually taught as one single demonstration due to economical and logistical
reasons, however, forming and understanding concepts require repetition (Kirschener, 1988).
There is a general consensus that laboratory work generates poor learning outcomes compared to
the time, effort, and costs invested in laboratory education (Kirschner, 1988; Johnstone and Al-
Shuaili, 2001; Hofestein and Lunetta, 2004; Ma and Nickerson, 2006). One possible reason for
the poor learning outcomes is that engineering labs are not or very seldom designed based on
well defined constructivist pedagogical models. One of the suitable pedagogical models for
engineering education is Kolb’s experiential learning framework. Kolb’s experiential learning
cycle is particularly suitable for engineering education which is an experiential field of science
(Bender, 2001; Felder et al., 2000). Moor and Piergiovanni (2003) justified based on Kolb’s
theory, the advantages of blending classroom theory with experiments. Kamis and Topi (2007)
examined three hypotheses of pedagogical design for enhancing the problem solving in the field
of networks subnettings. Two of them were based on Kolb’s model while the third was based on
the advance organizer technique (Ausubel, 1968). Bender (2001) explained a major reform of the
courses taught at the Engineering Design department at the Technical University of Berlin using
Kolb’s theory and describes the importance of incorporating the four dimensions of learning in
the design of lectures. Lagoudas et al. (2000) restructured five core undergraduate engineering
courses using Kolb’s cycle as a pedagogical background for this process. They relied on
computer software and simulations in their implementation of Kolb’s theory (Lagoudas et al.,
2000). Plett et al. (2006) redesigned three engineering courses building upon Kolb theories and
the 4MAT system. The trial course (Introduction to robotics) was very successful and led to a
successful NSF grant proposal for curriculum design (Plett et al., 2006), in which they aim to
Page 4 of 33
ScholarOne support: (434) 817 2040 ext. 167
Journal of Engineering Education

5
redesign a series of systems courses based on the Kolb/4MAT pedagogical model. David and
Wyrick (2002) assessed the learning styles of industrial engineering students over a ten-year
period and used Kolb’s experiential learning cycle as a pedagogical basis for designing learning
experiences for the students. One key finding in their study was that providing balanced learning
experiences to the students, based on the four stages of Kolb’s cycle, had led to deeper learning
and longer retention of information. Stice (1987) also tried to implement teaching strategies in
the class that can accommodate all four stages of Kolbe’s cycle to improve the learning process
for undergraduate students.
A thorough literature review on engineering laboratory design, in particular in the context of
incorporating new technologies such as virtual and/or remote labs, reveals that the majority of
papers are technically focused. This current paper describes a new approach for laboratory
education, which is solely underpinned by Kolb’s experiential learning theory (Kolb, 1984). The
method uses a combination of virtual, remote and hands-on laboratory sessions and pre- and post-
lab tests to maximize the information retention of students by activating the stages of Kolb’s
learning cycle. The approach has been used in the teaching of the second year undergraduate
Process Control Laboratory in the Chemical Engineering Department at Loughborough
University, United Kingdom. A qualitative and quantitative statistical analysis of the
effectiveness of the method is presented. It is shown that the usually poor knowledge retention in
laboratory education can be explained by the inefficient activation of the prehension dimension
of Kolb’s learning cycle. A methodology is proposed based on applying a Virtual Laboratory
environment to provide a preparatory session before the hands-on laboratory to facilitate
reflective preparation for the lab. The results show that significant enhancement of the laboratory
learning process can be achieved by designing and applying a combination of in-class remote,
Page 5 of 33
ScholarOne support: (434) 817 2040 ext. 167
Journal of Engineering Education
6
virtual pre-lab and hands-on laboratory sessions according to Kolb’s experiential learning model.
According to the authors’ knowledge this is the first paper that embraces the Kolb’s
constructivist model as pedagogical basis of designing enhanced laboratory education.
II. KOLB’S EXPERIENTIAL LEARNING THEORY
Kolb has introduced his theory on experiential learning more than 20 years ago (Kolb, 1984),
which has been well accepted as an efficient pedagogical model of learning. Kolb’s experiential
learning theory provides clear mechanisms of teaching and learning design, which are strongly
underlined with the constructivist view on the way people construct their knowledge. Kolb
suggested that effective learners should have four types of abilities: (1) Concrete Experience
Ability (CE), (2) Reflective Observation Ability (RO), (3) Abstract Conceptualization Ability
(AC), and (4) Active Experimentation Ability (AE).
Hence, the optimal learning takes place when learners have adequate balance of these four
stages during their learning experience. According to Kolb, learning requires that individuals first
should detect, depict, or grasp knowledge, and then a phase of construction should take place to
complete the learning process. This construction is a transformation of the grasped knowledge
Abstract Conceptualization
(AC)
Concrete Experience
(CE)
Reflection Observation
(RO)
Active Experimentation
(AE)
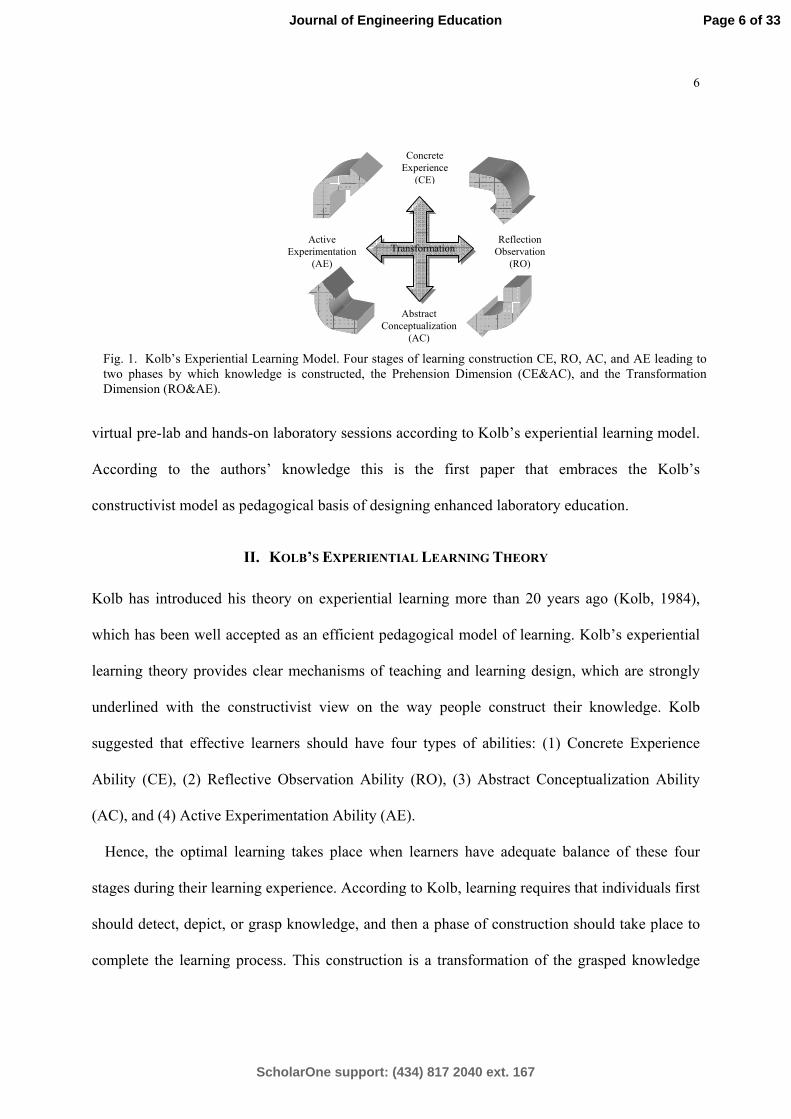
Fig. 1. Kolb’s Experiential Learning Model. Four stages of learning construction CE, RO, AC, and AE leading to two phases by which knowledge is constructed, the Prehension Dimension (CE&AC), and the Transformation Dimension (RO&AE).
Transformation
Page 6 of 33
ScholarOne support: (434) 817 2040 ext. 167
Journal of Engineering Education

7
into a mental model through experiencing this knowledge. Kolb proposed that the optimal
learning would pass through a cycle of the Concrete Experience, Reflective Observation,
Abstract Conceptualization, and Active Experimentation. This is called Kolb’s experiential
learning cycle and is shown schematically in Figure 1. The vertical axis represents the knowledge
grasping dimension, or the prehension dimension, by which knowledge can be grasped through
Apprehension (the concrete experience extreme) or by Comprehension (the abstract
conceptualization extreme), or by mix of both. The horizontal axis represents the knowledge
transformation or knowledge construction dimension. The construction can be done via Intention
(the reflective observation extreme), or via Extension (Active Experimentation).. Previous to this
hypothesis, authors have not distinguished between grasping and transformation, combining them
in one axis. Kolb’s model distinguishes apprehension and comprehension as independent modes
of grasping knowledge and intention and extension as independent modes of transforming
experience. Furthermore he states that the four modes are equally important in contributing to the
learning process, which is in disagreement with Piaget’s opinion that comprehension and
intention are superior processes (Piaget, 1978). In a thoughtful look at the current traditional
teaching methods in higher education, especially in Europe, one can easily realize that in most
cases Piaget’s model of comprehension-intention superiority is followed. These ‘traditional’
teaching methods emphasize on theory taught in classical classroom settings and reflection on
this theory by written exams. In contrast, Kolb’s experiential learning theory has strong
implication for allowing balanced room for each mode, apprehension, comprehension, intention,
and extension in the learning process. Hybrid combination of these elementary modes in the
learning process produces higher level of learning.
During the laboratory session, students are mainly involved in the “Active Experimentation”
Page 7 of 33
ScholarOne support: (434) 817 2040 ext. 167
Journal of Engineering Education

8
stage of Kolb’s cycle, because the emphasis is on doing the experiment. However, learning
something from the experiment, or in other words, the transformation phase for constructing new
knowledge through the experimentation, requires first the information to be grasped or depicted.
In the case of close-ended laboratory sessions, the grasped information are mainly the
experimental procedures and the theory behind the lab (AC of Kolb’s cycle).
Proposition I:
In the light of Kolb’s experiential learning theory, a poor learning outcome of the laboratory
session, that has been frequently reported in the literature, could be related to a weak activation
of the prehension dimension before coming to the lab. Hence the lab session turns into an
algorithmic following of the lab manual instead of actively constructing meaningful knowledge
out of it.
In this paper it is proposed that using the virtual lab in a preparation session can lead to better
activation of the prehension dimension in Kolb’s cycle, which then yields a better activation of
the transformation dimension. To test this assumption, a pedagogical experimental procedure was
designed and applied it in the second year Process Control Laboratory for Chemical Engineering
students at Loughborough University, United Kingdom.
III. VIRTUAL LABORATORIES IN EDUCATION
Computer simulations have become an integrated part of engineering education as early as the
1970s (Smith, 1976; Gosman, et al., 1977; Ingram et al., 1979; Kinzel et al., 1981; Campbell,
1985; Laghari et al.; 1990; Gladwin et al., 1992). Virtual laboratories (simulated versions of the
hands-on labs) present a series of advantages, such as they are more cost-effective to implement
and run, are not constrained by time or space, they are safe, etc. In science and engineering
Page 8 of 33
ScholarOne support: (434) 817 2040 ext. 167
Journal of Engineering Education

9
education virtual labs have emerged as complementary or alternative tools of the hands-on
laboratory education. Raineri (2001) supplemented the hands-on laboratory on molecular biology
with a simulated version available on the web. The main aim of the simulated lab was to provide
the students with the chance of repeating the experiments many times so that they can acquire
higher level skills and techniques in data manipulation and interpretation, which are usually very
difficult to develop in the usual 3 hours classical hands-on laboratory sessions. Using the
simulated lab with the course along five years yielded a 5% increase in the final exam scores, and
a dramatic decrease in the number of students who either failed or passed only with the minimum
threshold (Raineri, 2001). However, Raineri stresses the importance of the hands-on lab, pointing
out that the simulated lab is rather a supplement than a replacement. Very similar conclusions
were reported by Ronen and Eliahu (2000). They used computer simulations software to offer
supplemental version of an electrical circuit design experiment. They found that 70% of the
students in the experimental group benefited from using the simulation by enhancing their
confidence and patience during the hands-on sessions. The students who did not benefit from the
simulation were either those with very high conceptual capabilities for whom the software
formed no additional aid in the task, or those with very low understanding of the topic and who
showed no interest in improving.
Spicer and Stratford (2001) performed a qualitative study on the students perception of replacing
real field trips with simulated ones. The students showed very positive attitude towards using
simulated field trip, but opposed to the replacement of the real field trip with a simulated one.
They valued using the latter as pre- or post-instrument to be utilized before or after the real field
trip.
After two years of combining computer simulations with hands-on laboratory activities in life
Page 9 of 33
ScholarOne support: (434) 817 2040 ext. 167
Journal of Engineering Education

10
sciences, McAteer et al. (1996) concluded that simulations have granted the students better
conceptual understanding, however, there is still a need for the hands-on physical skills,
emphasizing that both modes are important and they are not mutually exclusive.
Lindsay has studied the impact of the access mode to the labs, i.e. hands-on, remote, or
simulated, on the learning outcomes. The results of the statistical analysis suggested that each
mode offers different learning outcomes, and adopting hybrid access modes would enrich the
learning experience of the students..
Heise (2006) did a comparative study on students’ performance in a digital logic lab, which was
offered in both hands-on and simulated versions. Heise observed that students’ motivation and
interest increased dramatically during the hands-on lab compared to when the simulated
experiments were used only.
There is general agreement that simulations cannot and should not always replace the hands-on
labs, however, they can be effective assisting tools. Engum et al. (2003) has performed a
comparative study on using a virtual catheter lab versus a real catheter lab. The study revealed
that both groups of students, who performed the real or the virtual lab, demonstrated the
development of adequate skills, however, the students preferred performing the real lab. Engum
and his colleagues suggested that a combination of the two methodologies may enhance the
students satisfaction and skills acquisition level.
Virtual Labs in Preparation Session
Laboratory preparation can be conducted in many ways. For instance, students can be asked to
prepare by reading the manual and developing an experimental procedure. Alternatively the lab
manual preparation can be combined with using a simulated version of the lab (virtual lab). The
Page 10 of 33
ScholarOne support: (434) 817 2040 ext. 167
Journal of Engineering Education
11
lab manual + virtual lab preparation can result in enhanced preparation due to many reasons.
According to the dual coding theory of information cognition, the human mind percepts and
stores verbal and visual information through two distinct channels (Paivio, 1971). The
implication on educational processes is that incorporating visual objects with verbal information
can lead to better learning (Slavin, 2005). The virtual lab presents a suitable tool of visualizing
the experimental rig in a simplified way and for showing the experimental plots.
The VARK learning styles model suggests that there are four main learning styles: read/write,
aural, visual, and kinesthetic (VARK, 2008). Preparing from the lab manual could be suitable for
those students who have strong read/write learning style, however, combining the virtual lab with
the lab manual in the preparation accommodates the students who have visual and kinesthetic
learning styles, since virtual lab is visualizing the experiment (visual style) and give the students
a chance of doing the experiment virtually (kinesthetic). The learning pyramid model (Weenk,
1999) suggests that information retention rates are different depending on the learning method
(5% lecture, 10% reading, 20% audio/visual, 30% demonstration, 50% discussion group, 75%
practice by doing, 90% teaching others). Virtual lab provides a chance for doing the experiment
and hence resulting in much higher knowledge retention rate than using the lab manual alone.
One key shortcoming of the classical hands-on laboratory teaching is the poor conceptual
learning outcome due to time constraints, lack of repetitions, and the high cognitive load
(Johnstone and Al-Shuaili, 2001; Hofestein and Lunetta, 2004; Ma and Nickerson, 2006, Roth,
1994; Kirschner, 1988). In general, supplementing the hands-on labs with a virtual version has
been found useful, but in most cases, students do not believe that virtual lab can be alternative to
hands-on labs (Engum et al., 2003; Raineri, 2001; Ronen and Eliahu, 2000; Spicer, 2001;
McAteer et al., 1996). Offering to the students a pre-lab session by which they prepare using the
Page 11 of 33
ScholarOne support: (434) 817 2040 ext. 167
Journal of Engineering Education

12
lab manual and the virtual lab, may assist in overcoming some of shortcomings of the hands-on
labs. Additionally, the use of the virtual labs provides an ideal framework for inducing reflections
during the preparation and hence enhancing, according to Kolbe’s model, the conceptualization
and learning already during the preparation for the lab.
IV. CASE STUDY -PROCESS CONTROL LABORATORY
The process control laboratory is part of the second year Instrumentation, Control and
Industrial Practice module at the Chemical Engineering Department at Loughborough University,
UK. The experimental rig for the hands-on process control lab was designed using a surge tank
system. Figure 2 shows a generic schematic diagram of the hands-on experimental rigs. The
laboratory is a compulsory part of the module designed for undergraduate engineering master
(MEng), bachelor (BEng), and bachelor in science (BSc) programmes in Chemical Engineering
at Loughborough University. The lab aims to introduce students to the principles of control
engineering, such as the main components and instruments of a feedback loop, the concepts of
open-loop control, feedback control, proportional-integral-derivative (PID) control, and PID
controller tuning.
The hands-on laboratory consists of two sessions, each of 3 hours duration. The sessions are
scheduled for two consecutive weeks. In the first week the students are introduced into the
elements of typical feedback loops such as sensors, actuators, controller, and process. The main
objectives of the first session are: (i) calibration of the level sensor, (ii) calibration, hysteresis
detection, installed characteristics and relative resistance of the control valve.
During the second week, students are introduced into control engineering concepts, the main
objectives being: (i) to develop an appreciation of automatic control vs. manual control, (ii) to
Page 12 of 33
ScholarOne support: (434) 817 2040 ext. 167
Journal of Engineering Education

13
Fig. 2. Schematic of the Process Control Lab Test Rig. The lab was designed to mimic an industrial plant. It aims to introduce students to the basic elements of instrumentation and control, and to develop qualitative skills of tuning PID controllers.
obtain a qualitative grasp of the differences among, proportional controller (P), proportional-
integral controller (PI), and proportional-integral-differential controller (PID), (iii) to develop
rules for control structure selection based on the observed qualitative information, and (iv) to
perform automatic controller tuning.
A virtual version of the lab has been developed using National Instrument’s software
environment, Labview, and it was made available to students for download. A sample snapshot
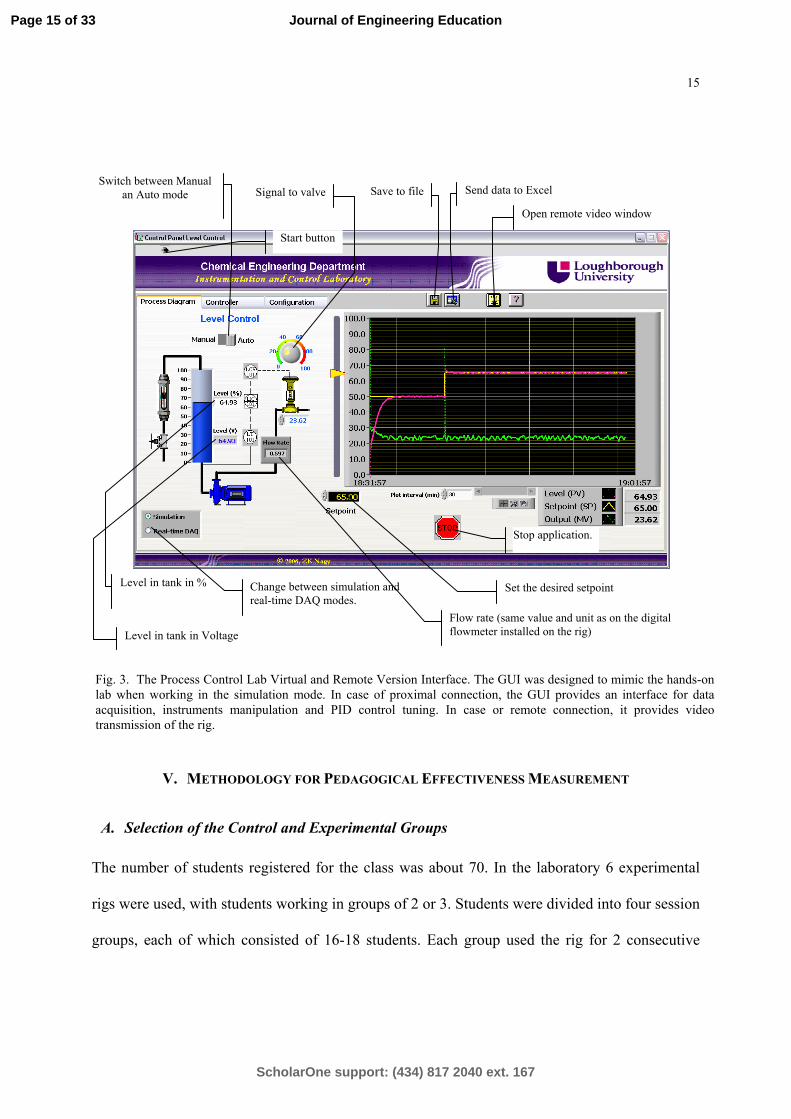
of the operator interface is presented in Figure 3. The Process Control Virtual Laboratory allows
students to perform all experiments in a simulation mode using an interface identical with the real
operator interface in the laboratory.
A remotely operated version of the lab was also developed and used in the classroom to
illustrate the theoretical concepts on real-life experiments. Both virtual and remote operation
modes of the lab were integrated in one software package. The software also provides real-time
video transmission for creating the feeling of ‘telepresence’ when remote lab is in operation.
LC101
Pump
Control valve
V1
Manual valve
V2
Digital Flowmeter
Rotameter
Page 13 of 33
ScholarOne support: (434) 817 2040 ext. 167
Journal of Engineering Education

14
Software and hardware were based on National Instrument LabView (version 8.0) and NI USB-
6000 series USB data acquisition (DAQ) device. The software interface is shown in Figure 3, and
it is available for download at http://www.ilough-lab.com.
The aim of developing virtual and remote modes of the process control lab was to enrich the
laboratory education by offering different access modes that enable maximum utilization of the
process control lab during the module. For instance, the virtual lab offers the students an ideal
mean of practicing the laboratory procedure before coming to the hands-on session, while the
remote lab enables the teacher to broadcast the lab operation live in the classroom for stimulating
the students or for explaining the application of theory in practice. Remote access to hands-on
laboratory also enables interested students to do further inquiry related to the hands-on
experiment from home or anywhere with internet connection. Such remote connections may
eliminate many logistical problems associated with conducting hands-on experiment in the
university lab, such as specific lab opening hours, or safety and supervision problems related to
the students being physically present in the lab.
Page 14 of 33
ScholarOne support: (434) 817 2040 ext. 167
Journal of Engineering Education
15
Fig. 3. The Process Control Lab Virtual and Remote Version Interface. The GUI was designed to mimic the hands-on lab when working in the simulation mode. In case of proximal connection, the GUI provides an interface for data acquisition, instruments manipulation and PID control tuning. In case or remote connection, it provides video transmission of the rig.
V. METHODOLOGY FOR PEDAGOGICAL EFFECTIVENESS MEASUREMENT
A. Selection of the Control and Experimental Groups
The number of students registered for the class was about 70. In the laboratory 6 experimental
rigs were used, with students working in groups of 2 or 3. Students were divided into four session
groups, each of which consisted of 16-18 students. Each group used the rig for 2 consecutive
Set the desired setpoint
Switch between Manual an Auto mode Signal to valve Save to file Send data to Excel
Flow rate (same value and unit as on the digital flowmeter installed on the rig)
Change between simulation and real-time DAQ modes.
Level in tank in %
Level in tank in Voltage
Stop application.
Start button
Open remote video window
Page 15 of 33
ScholarOne support: (434) 817 2040 ext. 167
Journal of Engineering Education

16
weeks to complete the experiments. The lab teaching spread over 8 weeks from the academic
week 2 until the academic week 9 in the autumn semester of the 2007/2008 academic year. In
week one an introductory lecture was organized in a classroom to all students, when the
experiment was described. In this session the laboratory was “brought into the classroom” by
using the remote laboratory mode aiming to stimulate the students’ interest in the lab. A pre-lab
preparation session was also organized for part of the groups, during which students came to the
computer room and worked on the virtual laboratory software following the procedure form the
lab manual, working under minimal supervision. These pre-lab sessions (treatment) were applied
to the Groups 3 (G3) and 4 (G4), whereas Groups 1 (G1) and 2 (G2) had no treatment.
To guarantee equivalence as much as possible among the four groups, students were distributed
evenly based on their percentage average in the previous academic year (the averages of the
groups were, G1=64.02%, G2=63.60%, G3=63.06%, and G4=63.69). In the British educational
system percentage averages are used in the final evaluations and the assignment of grades (A, B
etc) is subjective. The convention used in the Chemical Engineering Department at
Loughborough University is generally to use the grade A for an average above 70%, B for an
average between 60% and 70%, C for average between 50% and 60%, etc. Exams are usually
designed with the aim to have and overall average between 60% and 70%, hence the groups
represent average levels. The groups G1 and G2 represented the control group, whereas G3 and
G4 were the experimental group.
B. Logistical and Ethical Issues in the Experimental Design
Logistical and ethical aspects of the experimental design are important to analyze to understand
the experimental data. To make the pre-lab preparatory sessions compulsory, would require
changes in the course structure requiring approval by the Departmental and University Teaching
Page 16 of 33
ScholarOne support: (434) 817 2040 ext. 167
Journal of Engineering Education
17
Committees, and can violate generic recommendations related to the number of contact hours
within a module. The extra hours required for the preparatory session would be possible officially
only by reducing the number of lectures or problem classes. Not making the virtual laboratory
software available to the control group would have raised ethical issues related to the
discrimination in using teaching aids for parts of the class. Partially this was also the reason why
in the preparatory session a minimal supervision and help was offered. To overcome the
logistical and ethical constraints, the experiments were designed so that no pre-lab preparatory
sessions were scheduled for groups G1 and G2. However, they were asked to prepare for the lab.
The intention in the experiments was that the control group would prepare by reading the manual
and the experimental group by using the virtual lab and the manual. However to eliminate ethical
issues, the lab manual and the virtual lab software were made available for students to download
and use in their preparation. In the questionnaires students from the control group had to answer
the questions whether and how long they prepared from the manual and this data was used in the
evaluation. Non-compulsory pre-lab sessions were scheduled for the G3 and G4 students. These
were time-tabled internally trying to eliminate as much as possible conflicts with the students’
other duties.
About 8-10 students of each G3 and G4 have responded to the request of attending the
preparation session each time, forming the experimental group. The average mark of the
experimental group was 66.65%. Students from Groups 1 and 2 formed the control group with a
group average of 63.81% (only 2.84% less than for the experimental group).
Figure 4 illustrates the methodology used for the pedagogical experiment, with X representing
the equivalent groups (control and experimental before treatment) and Y and Yt the results from
the control and the experimental groups after treatment, respectively.
Page 17 of 33
ScholarOne support: (434) 817 2040 ext. 167
Journal of Engineering Education

18
X
X
Hands-on Lab
Hands-on Lab
Preparation
Pre Post
Experimental Group
Equivalent groups
Fig. 4. Conceptual Model of the pedagogical experimentation methodology. The control group had no treatment, while the experimental group was exposed to preparation session with the virtual laboratory.
Different Outcome?
Control Group
Y
Yt
For the evaluation of the statistically significant difference between the control and the
experimental group (if any) in response to the treatment the null hypothesis was used (Conover,
1998). The null hypothesis in this case states that, “there is no statistically significant difference
in the learning outcome between the control group and the experimental group due to using the
virtual lab in a pre-lab preparation session”.
For accepting or rejecting the null hypothesis, the Mann-Whitney non parametric test
(Conover, 1998) was used. According to this approach the null hypothesis is rejected (meaning
that there is statistically significant difference between the data) if the significance value (σ) of
the test is less than 0.05.
C. Proposition I Verification Stages
The verification was divided into two main parts: (1) verifying that the virtual lab can lead to
enhanced activation of the prehension dimension, and then, (2) verifying that this leads to better
activation of the knowledge transformation dimension.
For the prehension dimension activation verification, a pre-lab test was designed and was
conducted just before starting the hands-on session. The pre-lab tests were given to students in
both weeks I and II. The questions from a sample pre-lab test used in week one are given in the
Page 18 of 33
ScholarOne support: (434) 817 2040 ext. 167
Journal of Engineering Education
19
Appendix. The statistically significant differences between the answers of the students from the
control and the experimental groups would indicate that a pre-lab session with virtual lab plays a
role in grasping information needed for the hands-on laboratory session.
D. Analysis of Knowledge Grasping:
Questions Q1 and Q2 of Week I pre-lab test were strongly related to the hands-on laboratory
session. In these questions, students were asked to develop an experimental procedure that they
will follow for calibrating and deriving the characteristics of the level sensor of the tank and the
control valve that controls the outflow rate of the tank, respectively. Questions Q3-Q7 were
mainly designed to test relevant general knowledge of the students that they may have gathered
through the lectures, from the remote lab demonstrations that were conducted in the classroom,
or by reading the lab manual. The results of the evaluation of the pre-lab test are shown in Table
I. Using the Mann-Whitney test, the exact significance value of Q1 and Q2 were smaller than
0.05 indicating that the null hypothesis can be rejected, hence there is indeed strong statistical
evidence that exposing the students to a preparatory session using the virtual laboratory has lead
them to an overall enhanced grasp of the procedural tasks needed for performing the lab. This
demonstrates that a better activation of the prehension dimension has occurred due to the virtual
lab preparatory session. The lower mean of the control group students is related to the fact that
those students never or poorly prepared for the lab (all students were asked to prepare for the lab,
the software and the lab manual were available to download from the web). Poorer results were
shown when students have only read the manual and have not experienced the procedure with the
virtual lab. The difference between the control and the experimental groups is less significant
(σ = 0.116 > 0.05) for the questions Q3 to Q7 though the average mean is still higher for the
experimental group.
Page 19 of 33
ScholarOne support: (434) 817 2040 ext. 167
Journal of Engineering Education

20
TABLE I
PRE-LAB TEST RESULTS OF WEEK I * Question
Exact Significance, “Sigma” (Mann-Whitney U test)
Means % (Experimental / Control)
Q1 Q2 Sum Q3 to Q7
0.002 0.002 0.166
73.89 / 40.00 55.28 / 21.67 72.33 / 58.23
* Number of samples (Experimental/Control) is 18/30.
The level sensor calibration procedure is relatively easier than the procedure for the control
valve calibration. This may explain the higher mean of Q1 compared to Q2. The pre-lab test of
Week II revealed a similar outcome where the mean of the experimental group was higher than
for the control group. The statistical significance was smaller than the threshold of 0.05
(σ=0.041) allowing to reject the null hypothesis. This shows that students of the experimental
group have better activation of the prehension dimension of Kolb’s cycle as they could grasp
knowledge needed for the hands-on lab operation via the virtual lab that has been used in a pre-
lab session.
E. Analysis of the Knowledge Transformation
To verify that better activation of the prehension dimension would lead to better knowledge
transformation into mental models (Kolb, 1984) after the hands-on lab session, post-lab tests
were conducted directly after the students had finished their experiments.
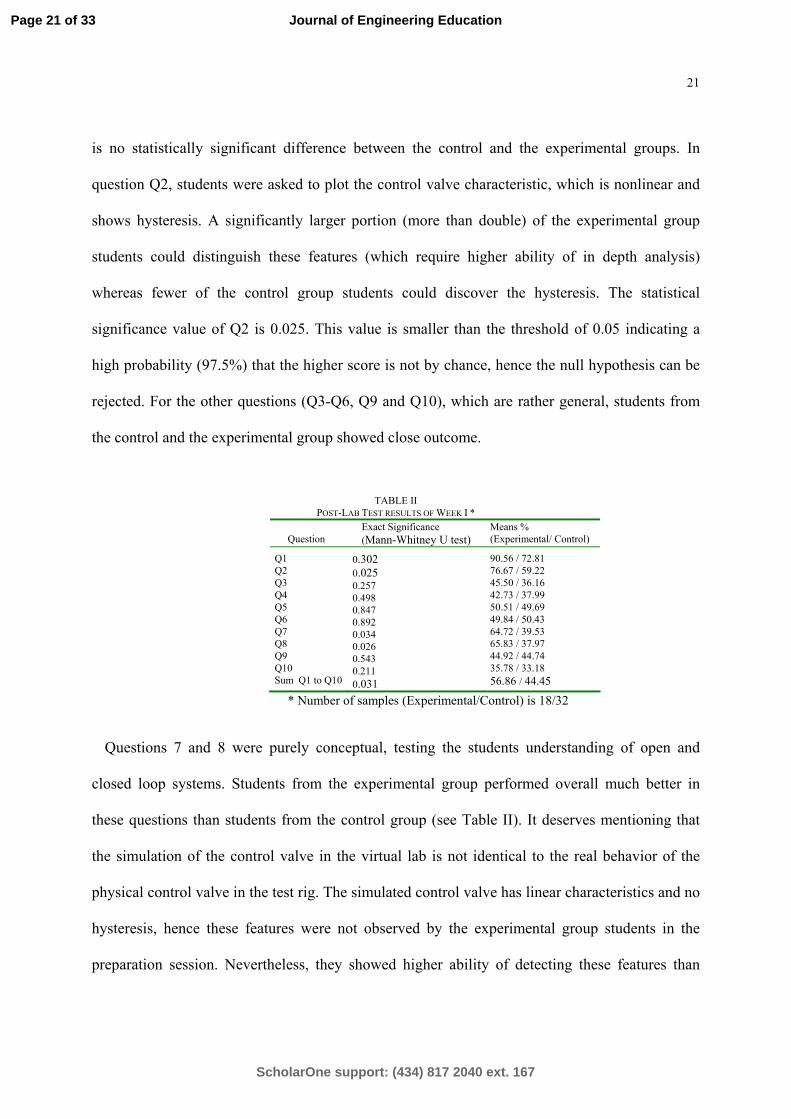
Table II shows the results with the analysis of the post-lab test. In question Q1 of the Week I
post-lab test, students were asked to create a qualitative plot of the level sensor characteristic
curve based on their observations and the data they had collected during the experiment. The
level sensor characteristic is represented by a simple linear curve with no hysteresis. The
students’ answers were rather close for both the experimental and the control groups. The exact
significance value for Q1 is 0.302 which is larger than the threshold of 0.05 indicating that there
Page 20 of 33
ScholarOne support: (434) 817 2040 ext. 167
Journal of Engineering Education
21
is no statistically significant difference between the control and the experimental groups. In
question Q2, students were asked to plot the control valve characteristic, which is nonlinear and
shows hysteresis. A significantly larger portion (more than double) of the experimental group
students could distinguish these features (which require higher ability of in depth analysis)
whereas fewer of the control group students could discover the hysteresis. The statistical
significance value of Q2 is 0.025. This value is smaller than the threshold of 0.05 indicating a
high probability (97.5%) that the higher score is not by chance, hence the null hypothesis can be
rejected. For the other questions (Q3-Q6, Q9 and Q10), which are rather general, students from
the control and the experimental group showed close outcome.
TABLE II POST-LAB TEST RESULTS OF WEEK I *
Question
Exact Significance (Mann-Whitney U test)
Means % (Experimental/ Control)
Q1 Q2 Q3 Q4 Q5 Q6 Q7 Q8 Q9 Q10 Sum Q1 to Q10
0.302 0.025 0.257 0.498 0.847 0.892 0.034 0.026 0.543 0.211 0.031
90.56 / 72.81 76.67 / 59.22 45.50 / 36.16 42.73 / 37.99 50.51 / 49.69 49.84 / 50.43 64.72 / 39.53 65.83 / 37.97 44.92 / 44.74 35.78 / 33.18 56.86 / 44.45
* Number of samples (Experimental/Control) is 18/32
Questions 7 and 8 were purely conceptual, testing the students understanding of open and
closed loop systems. Students from the experimental group performed overall much better in
these questions than students from the control group (see Table II). It deserves mentioning that
the simulation of the control valve in the virtual lab is not identical to the real behavior of the
physical control valve in the test rig. The simulated control valve has linear characteristics and no
hysteresis, hence these features were not observed by the experimental group students in the
preparation session. Nevertheless, they showed higher ability of detecting these features than
Page 21 of 33
ScholarOne support: (434) 817 2040 ext. 167
Journal of Engineering Education

22
students from the control group. The statistical test of the in depth question of Week II post-lab
test has also revealed acceptable significance for rejecting the null hypothesis (exact significance
was 0.013 < 0.05).
These results provide evidence that students who had better activation of the prehension
dimension prior to the lab session have had more in depth learning during the hands-on lab
session. In other words, the transformation of knowledge through the lab experience into mental
models (Kolb, 1984) has been more successful for students who worked on improving their
prehension dimension. This also indicates that constructivist higher order learning in the hands-
on lab session can be improved by more activation of the other stages of the Kolb’s experiential
learning cycle.
A different behavior was also observed during the laboratory sessions in the case of the
experimental group students compared to the control group students. The former showed more
interest in the hands-on lab session and insisted more on answering the pre- and post-lab tests
compared to the control group students. Groups were informed that the pre- and post-lab tests are
voluntary and are not included in the lab or the course final marks.
Kolb’s experiential learning theory offers educators a pedagogical framework of designing
their courses and contextualizing specific activities that lead to enhanced learning outcomes. The
design can be on a large scale, such as a whole degree design, or on a smaller scale, such as the
design of learning objects or a laboratory curriculum. Kolb suggests that optimal learning
happens through transformation of knowledge into mental models. The transformation is done
through reflective observation (RO) and active experimentation (AE). However, a necessary
condition for such transformation (or construction) of knowledge is that this knowledge should
be grasped first. Knowledge depiction occurs via concrete experience (CE) or abstract
Page 22 of 33
ScholarOne support: (434) 817 2040 ext. 167
Journal of Engineering Education

23
conceptualization (AC). A reasonable balance among the four stages leads to optimal learning
outcomes according to Kolb. In classical laboratories, the AE is the main active stage, which may
give an explanation of poor learning outcome during the laboratory learning phase and lead to
propose additional laboratory activities that would enhance the other learning stages in Kolb’s
cycle. In the next section different laboratory activities and their contributions to Kolb’s learning
stages are discussed and a novel model for conducting laboratory education is proposed in the
framework of the pedagogical experiential learning theory.
VI. AN IMPLEMENTAION PROPOSAL OF KOLB’S CYCLE FOR LABORATORY EDUCATION
During the introductory lecture of the Instrumentation and Control module, students were
introduced to the lab using a PowerPoint presentation and the lab was operated remotely in the
classroom with the aim of providing the realism feeling (telepresence) to students and stimulating
them towards conducting the lab. This lecture structure is in correlation with the CE of the
Kolb’s cycle. At the end of the semester in the module questionnaires students were asked
whether this has stimulated their interest in the lab. A significant portion, 80.6%, of the students
answered ‘Yes’.
One of the lectures was devoted to PID control. In this lecture the theoretical background of the
PID control approach was explained and the main features of the control algorithm were
illustrated by using the remote lab in the classroom. Again, a significant portion of students,
78.1%, found this combination useful in understanding the theory more, hence enhanced the AC
part of the Kolb’s cycle.
Well designed pre-lab test questions or preparatory session with the virtual laboratory will help
students contextualizing the laboratory objectives and assist in realizing the CE stage. The use of
the virtual lab and the design of reflective questions facilitate reflection, enhancing the RO stage.
Page 23 of 33
ScholarOne support: (434) 817 2040 ext. 167
Journal of Engineering Education
24
Well designed post-lab test questions give the students a chance to reflect over their experience
in the lab session. These questions must be designed to help to implement a meaningful model of
the knowledge in their memory based on the lab session experience. This helps also enhancing
the RO stage. Putting a pre- and post-lab testing in the context of laboratory education will urge
the students to prepare well which enhances the AC stage.
According to Kolb, constructivist learning occurs in a cyclic spiral way. The optimal learning
happens when all four phases of the learning cycle are activated. As the first cycle ends by
transferring knowledge into mental (or theoretical) model through experience, a further higher
order cycle can be started for constructing higher order knowledge, and so on. Therefore, it is an
important objective of engineering education, in particular, laboratory education, to motivate
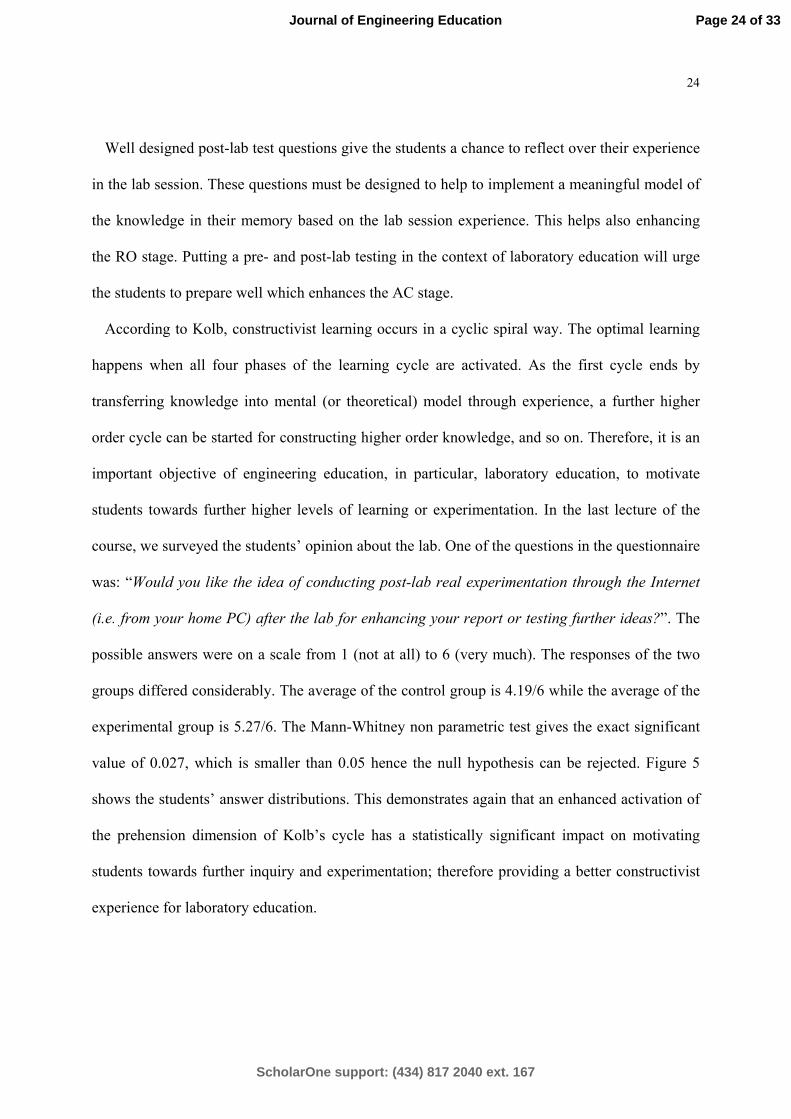
students towards further higher levels of learning or experimentation. In the last lecture of the
course, we surveyed the students’ opinion about the lab. One of the questions in the questionnaire
was: “Would you like the idea of conducting post-lab real experimentation through the Internet
(i.e. from your home PC) after the lab for enhancing your report or testing further ideas?”. The
possible answers were on a scale from 1 (not at all) to 6 (very much). The responses of the two
groups differed considerably. The average of the control group is 4.19/6 while the average of the
experimental group is 5.27/6. The Mann-Whitney non parametric test gives the exact significant
value of 0.027, which is smaller than 0.05 hence the null hypothesis can be rejected. Figure 5
shows the students’ answer distributions. This demonstrates again that an enhanced activation of
the prehension dimension of Kolb’s cycle has a statistically significant impact on motivating
students towards further inquiry and experimentation; therefore providing a better constructivist
experience for laboratory education.
Page 24 of 33
ScholarOne support: (434) 817 2040 ext. 167
Journal of Engineering Education
25
0%
10%
20%
30%
40%
50%
60%
1 2 3 4 5 6
Students Opinion
Control Group Experimental Group
Fig. 5. Experimental group students willingness of conducting further experimentation after the hands-on lab
session (“1” = not at all, “6”= very much).
Remotely operated labs offer the chance to interested students for flexible further investigation
and experimentation, i.e. they offer the possibility of higher order learning. This additional
activity may involve additional theory investigation (AC), active experimentation (AE) and
reflective observation (RO). Remote labs offer the students a chance to repeat the experiment and
have further reflection on their hands-on session (RO).
The virtual lab also offers similar opportunity, however, there is fundamental difference
between the virtual lab and the hands-on or remote lab, which consist in the believe factor. The
question related to the students’ opinion about replacing the hands-on lab with the virtual lab
resulted in 91.2% of the students rejecting this idea.
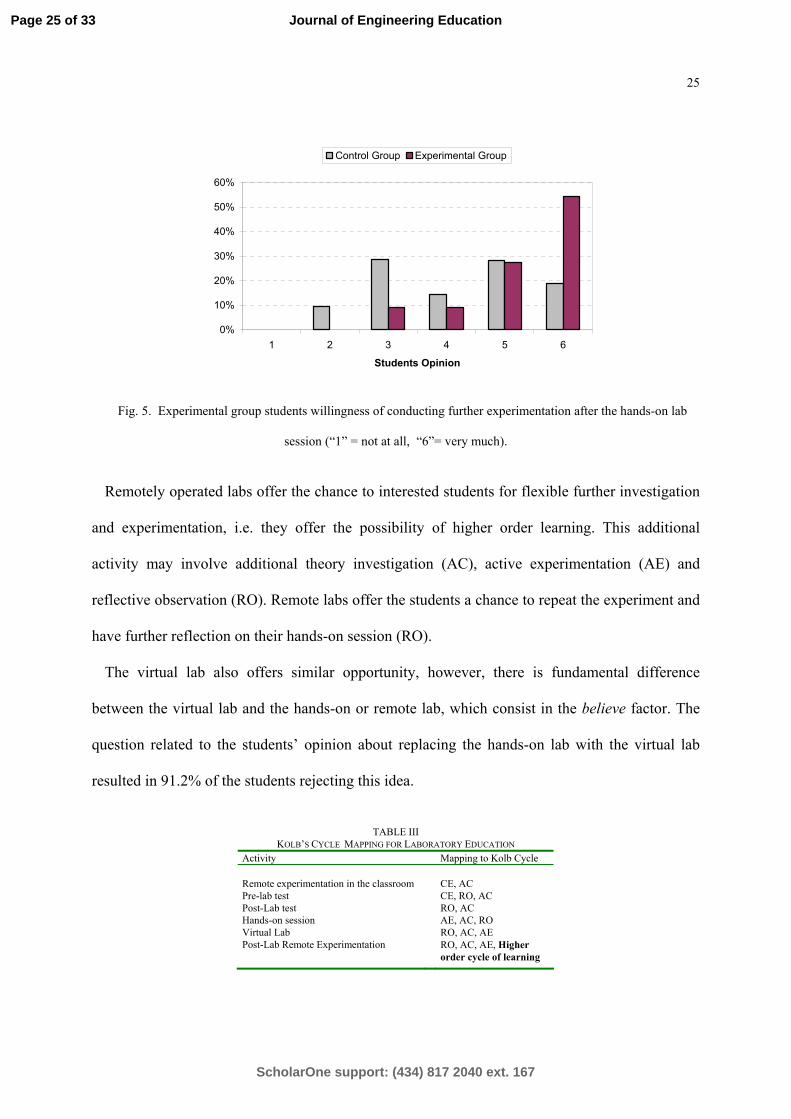
TABLE III KOLB’S CYCLE MAPPING FOR LABORATORY EDUCATION
Activity Mapping to Kolb Cycle
Remote experimentation in the classroom Pre-lab test Post-Lab test Hands-on session Virtual Lab Post-Lab Remote Experimentation
CE, AC CE, RO, AC RO, AC AE, AC, RO RO, AC, AE RO, AC, AE, Higher order cycle of learning
Page 25 of 33
ScholarOne support: (434) 817 2040 ext. 167
Journal of Engineering Education
26
In the laboratory session, students are mainly immersed in the AE stage of Kolb’s cycle. Poor
outcome of laboratory education can be correlated with the fact of poor balance of the other
stages of Kolb’s experiential learning cycle, since little attention is normally paid for laboratory
activities that can lead to constructivist learning during the hands-on session. The results of the
pedagogical experimentation showed in the paper, indicate that modifications can be introduced
to the teaching methodology according to which classical hands-on laboratories are taught. These
modifications, with the aim to enhance constructivist learning, are suggested in the context of
Kolb’s experiential learning cycle and are implemented using recent advances in information and
communication technologies (ICT). The mapping of the different elements of the laboratory
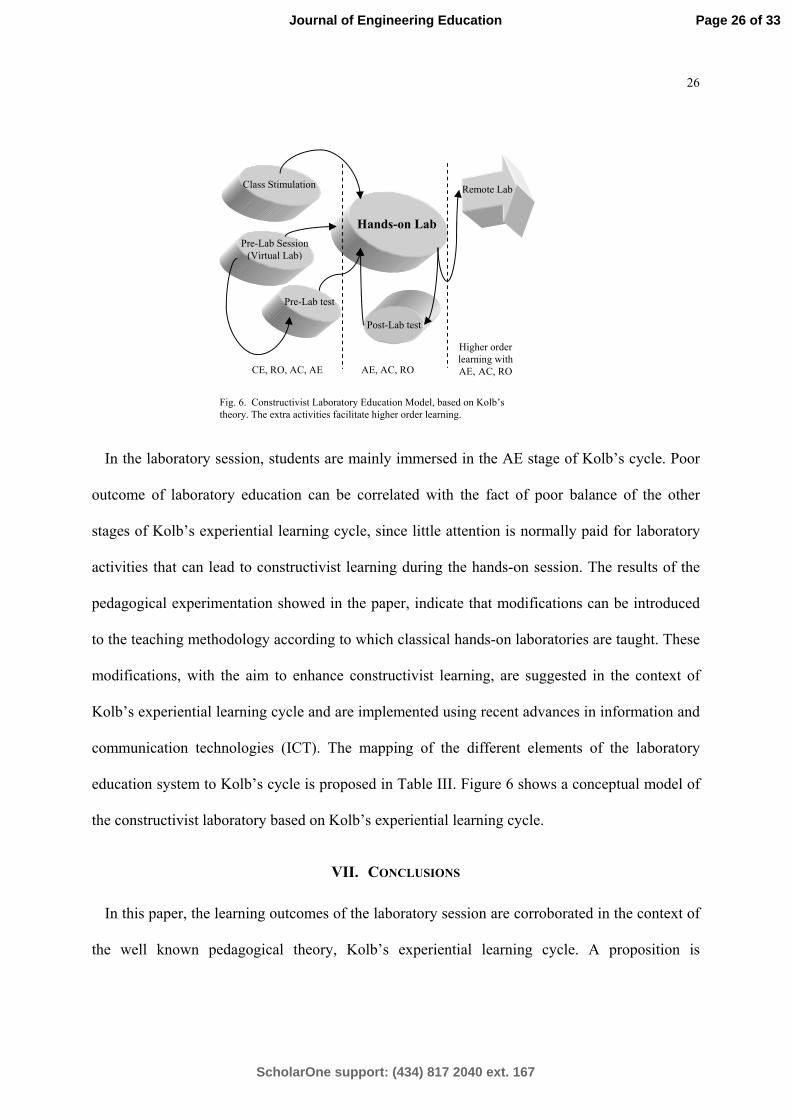
education system to Kolb’s cycle is proposed in Table III. Figure 6 shows a conceptual model of
the constructivist laboratory based on Kolb’s experiential learning cycle.
VII. CONCLUSIONS
In this paper, the learning outcomes of the laboratory session are corroborated in the context of
the well known pedagogical theory, Kolb’s experiential learning cycle. A proposition is
Hands-on Lab
Remote Lab
Post-Lab test
Class Stimulation
Pre-Lab Session (Virtual Lab)
Pre-Lab test
AE, AC, RO CE, RO, AC, AE
Fig. 6. Constructivist Laboratory Education Model, based on Kolb’s theory. The extra activities facilitate higher order learning.
Higher order learning with AE, AC, RO
Page 26 of 33
ScholarOne support: (434) 817 2040 ext. 167
Journal of Engineering Education

27
introduced that considers that the often poor learning outcome of the laboratory session is mainly
due to weak activation of the prehension dimension of the learning cycle, before coming to the
lab. The pedagogical experiments based on combined application of pre- and post-lab tests and
the three dimensional laboratory (application of combination of hands-on, virtual and remote
experiments) have provided statistical evidence of the proposition. The results demonstrate that
designing engineering laboratory education based on well-developed pedagogical theory can lead
to better learning outcomes. Based on the pedagogical experiments, a novel model of laboratory
education was introduced that has its pedagogical background in the experiential learning theory
of Kolb. An algorithm of implementing Kolb’s cycle utilizing virtual and remote modes of the
hands-on lab, as well as, by introducing additional lab activities has been proposed.
.
ACKNOWLEDGMENT
Financial support by the Engineering Center of Excellence in Teaching and Learning
(engCETL), Loughborough University, UK, and by The Higher Education Academy,
Engineering Subject Centre, UK, mini-project are gratefully acknowledged.
Page 27 of 33
ScholarOne support: (434) 817 2040 ext. 167
Journal of Engineering Education

28
REFERENCES
Ausubel DP and Fitzgerald D, 1962. Organizer, General Background, and Antecedent Learning
Variables in Sequential Verbal-Learning. Journal of Educational Psychology, 53(6), 243-249.
Bender B, 2001. Concepts for Purposive and Motivational Teaching and Learning in Engineering
Design Courses. Int. J. Eng. Ed.17(4-5), 336-341.
Campbell DR, 1985. Interactive Graphics Software for an Undergraduate Course in Digital
Signal Processing. Computers & Education,9(2), 79-86.
Conover WJ, 1998. Practical Nonparametric Statistics. 3rd ed. John Wiley.
David A, Wyrick PE, and Hilsen L, 2002. Using Kolb's Cycle to Round Out Learning. Proc. of
the 2002 American Society for Engineering Education Annual Conference
Engum SA, Jeffries P, and Fisher L, 2003. Intravenous Catheter Training System: Computer-
Based Education Versus Traditional Learning Methods. The American Journal of Surgery,
186(1), 67-74.
Feisel LD and Peterson GD, 2002. A Colloquy on Learning Objectives for Engineering
Education Laboratories. In Proceedings of ASEE Annual Conference & Exposition: Vive
L'ingenieur!, Montreal, Canada.
Feisel LD and Rosa AJ, 2005. The Role of The Laboratory in Undergraduate Engineering
Education. J. Eng. Educ., 94(1), 121-130.
Felder R, Woods D, Stice J, and Rugarcia A 2000. The Future of Engineering Education:
II.Teaching Methods that Work. Chemical Engineering Education, 34(1), 26–39.
Gladwin RP, Margerison D, and Walker SM, 1992. Computer-Assisted Learning in Chemistry.
Computers & Education, 1992(1-2), 17-25.
Gosman AD, Launder BE, Lockwood FC, and Reece GJ, 1977. Computer Assisted Teaching of
Page 28 of 33
ScholarOne support: (434) 817 2040 ext. 167
Journal of Engineering Education
29
Fluid Mechanics and Heat Transfer. Computers & Education, 1(3), 131-139.
Gunstone RF, 1991. Reconstructing Theory from Practical Experience. Practical Science, 67-77.
Heise D, 2006. Asserting The Inherent Benefits of Hands-on Laboratory Projects vs. Computer
Simulations. J. Comput. Small Coll. 21(4), 104-110.
Hofstein A and Lunetta VN, 1982. The Role of the Laboratory in Science Teaching: Neglected
Aspects of Research. Review of Educational Research, 52(2), 201-217.
Hofstein A and Lunetta VN, 2004. The Laboratory in Science Education: Foundations for The
Twenty-First Century. Science Education, 88(1), 28-54.
Ingram D, Dickinson CJ, Saunders L, Sherriff M, Bloch R, Sweeney G, and Ahmed K, 1979.
Application of a Pharmacokinetic Simulation Program in Pharmacy Courses. Computers &
Education, 3(4), 335-345.
Johnstone AH and Al-Shuaili A, 2001. Learning in The Laboratory; Some Thoughts from The
Literature. University Chemistry Education, 5, 42-51.
Kamis A and Topi H, 2007. Network Subnetting: an Instance of Technical Problem Solving in
Kolb's Experiential Learning Cycle. Hawaii International Conference on System Sciences.
Kinzel GL, Charles JA, and John JEA, 1981. The Impact of Computer Graphics on Mechanical
Engineering Education at The Ohio State University. Computers & Education, 5(4), 275-287.
Kirschner PA, 1988. The laboratory in Higher Science Education, Problems, Premises, and
Objectives. Higher Education, 17(1), 81-90.
Kolb DA, 1984 .Experiential Learning: Experience as the Source of Learning and Development.
Prentice-Hall.
Laghari JR, Suthar JL, and Cygan S, 1990. PSPICE Applications in High Voltage Engineering
Education. Computers & Education, 14(6), 455-462.
Page 29 of 33
ScholarOne support: (434) 817 2040 ext. 167
Journal of Engineering Education
30
Lagoudas DC, Whitcomb JD, Miller DA, Lagoudas MZ, and Shryock KJ, 2000. Continuum
Mechanics in a Restructured Engineering Undergraduate Curriculum. Int. J. Eng. Ed., 16(4),
301-314.
Lindsay ED and Good MC, 2005. Effects of Laboratory Access Modes upon Learning Outcomes.
IEEE Transactions on Education, 48(4), 619-631.
Ma J and Nickerson JV, 2006. Hands-on, Simulated, and Remote Laboratories: A Comparative
Literature Review. ACM Comput. Surv., 38(3), 1-24.
McAteer E, Neil D, Barr N, Brown M, Draper S, and Henderson F, 1996. Simulation Software in
a Life Sciences Practical Laboratory. Computers & Education, 26(1-3), 101-112.
Moor S and Piergiovanni P, 2003. Experiments in the Classroom, Examples of Inductive
Learning with Classroom-Friendly Laboratory Kits. Proceedings of the 2003 American
Society for Engineering Education Annual Conference & Exposition.
Piaget J, 1978. The Development of Thought: Equilibration of Cognitive Structures. Blackwell.
Plett GL, Ziemer RE, Ciletti MD, Dandapani R, Kalkur T, and Wickert MA, 2006. Experiences
in Updating the ECE Curriculum with Signal Processing First and Kolb/4MAT Pedagogy.
Proceedings of the 2006 American Society for Engineering Education Annual Conference and
Exposition, Chicago, IL, June 18-21, 2006.
Raineri D, 2001. Virtual Laboratories Enhance Traditional Undergraduate Biology Laboratories.
Biochemistry and Molecular Biology Education, 29(4), 160-162.
Ronen M and Eliahu M, 2000. Simulation — a Bridge Between Theory and Reality: the Case of
Electric Circuits. Journal of Computer Assisted Learning, 16(1), 14-26.
Roth WM, 1994. Experimenting in a Constructivist High School Physics Laboratory. J. of Res. in
Sci. Teach., 31(2), 197-223.
Page 30 of 33
ScholarOne support: (434) 817 2040 ext. 167
Journal of Engineering Education
31
Slavin RE, 2005. Educational Psychology. Prentice Hall.
Smith PR 1976. Computers in Engineering Education in the United Kingdom. Computers &
Education, 1(1), 13-21.
Spicer JI, Stratford J, 2001. Student Perceptions of a Virtual Field Trip To Replace a Real Field
Trip. Journal of Computer Assisted Learning, 17(4), 345-54.
Stice JE, 1987. Using KoIb’s Learning Cycle to Improve Student Learning. Engineering
Education, 77(5), 291-296.
VARK, 2008, http://www.vark-learn.com/english/index.asp, retrieved on 10.12.2008.
Wankat PC, 2004. Analysis of the First Ten Years of the Journal of Engineering Education. J. of
Eng. Educ., 93(1), 13-21.
Weenk GWH, 1999. Learning Pyramid. Educational Center, University of Twente, 1999.
AUTHORS INFORMATION
Mahmoud Abdulwahed, has received his Licentiate in Electrical Engineering from Aleppo
University-Syria, he then pursed a postgraduate studies in Systems and Control in Germany,
Sweden, and France. His main interest is in the integration of IT and Cybernetics into social
sciences. He is currently pursuing a PhD degree at the Engineering Center of Excellence in
Teaching and Learning and the Chemical Engineering Department, Loughborough University,
United Kingdom, [email protected].
Zoltan K Nagy, is Senior lecturer since 2005 in the Chemical Engineering Department,
Loughborough University, United Kingdom, [email protected]. Prior to his current position
ZK Nagy has held teaching and research positions at the University of Illinois at Urbana
Champaign, USA, University of Stuttgart, Germany, ETH, Zurich, Switzerland, University of
Heidelberg, Germany, and the “Babes-Bolyai” University of Cluj, Romania. ZK Nagy is the
recipient of the 2007 Royal Academy of Engineering and ExxonMobile Excellence in Teaching
Award.
Page 31 of 33
ScholarOne support: (434) 817 2040 ext. 167
Journal of Engineering Education

32
Appendix Questions from the Pre-lab quizzes for week I, Rigs 1-6:
1- Describe briefly in the space provided below the key steps of the experimental procedure you plan to follow for the sensor calibration:
2- Describe briefly in the space provided below the key steps of the experimental procedure you plan to
follow for the control valve calibration: 3- Define what is a sensor? Do we use any sensor in the process? If yes which are these?
4- Define what is an actuator? Do we use any actuator in the process? If yes which are these? 5- What is the functionality of the control valve in the process? 6- What do we use for measuring the inlet flow rate? 7- What do we use for measuring the outlet flow rate?
Questions from the Post-Lab quiz for week I, Rigs 1-6:
1- Analyze briefly your data obtained for the level sensor calibration. Sketch the level sensor characteristics. 2- Analyze briefly your data obtained for the control valve calibration and sketch the control valve
characteristics.
3- Define what is the zero of a sensor. What was the zero value of the level sensor obtained based on your experiments?
4- Provide a brief definition of the term controller. 5- What is the controller when the process is set to the manual mode?
6- What is the controller when the process is set to the automatic mode,?
7- Is the following an open or closed system? Explain your answer clearly.
Page 32 of 33
ScholarOne support: (434) 817 2040 ext. 167
Journal of Engineering Education
33
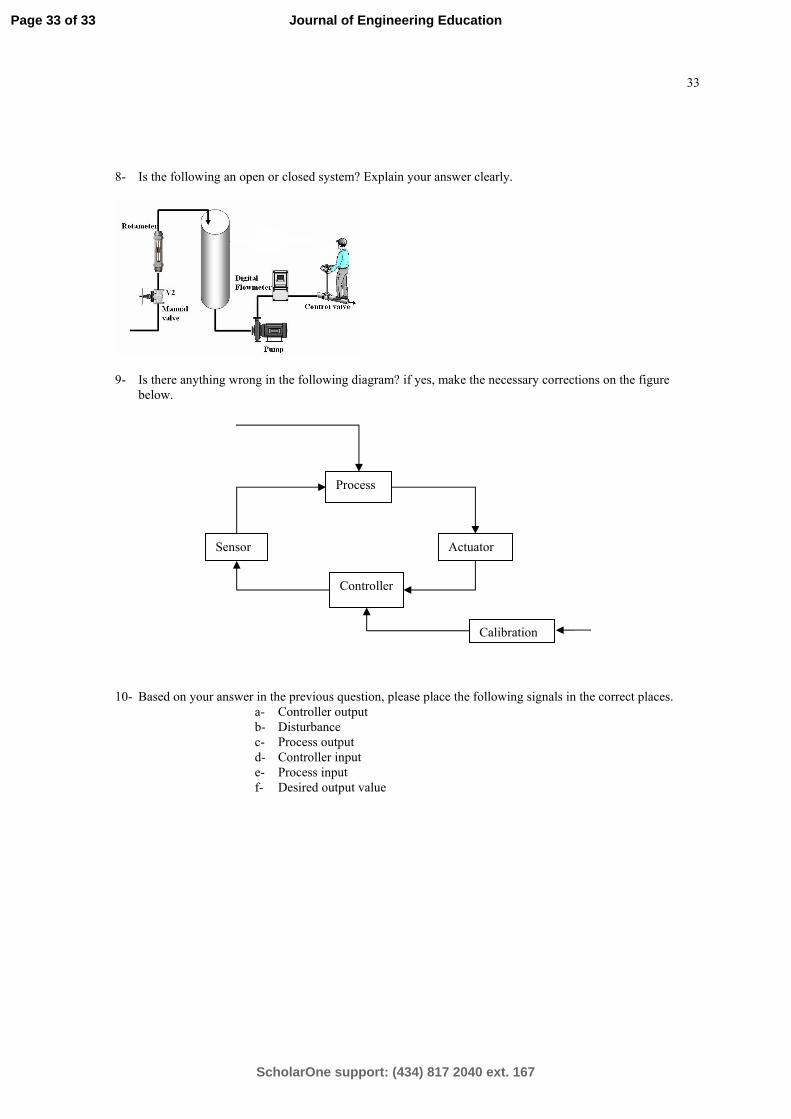
8- Is the following an open or closed system? Explain your answer clearly.
9- Is there anything wrong in the following diagram? if yes, make the necessary corrections on the figure
below.
10- Based on your answer in the previous question, please place the following signals in the correct places. a- Controller output b- Disturbance c- Process output d- Controller input e- Process input f- Desired output value
Process
Actuator
Controller
Sensor
Calibration
Page 33 of 33
ScholarOne support: (434) 817 2040 ext. 167
Journal of Engineering Education
Related Documents


![INSPIRE: An INtelligent System for Personalized ... · where Honey and Mumford, based on Kolb's theory of experiential learning [9], suggested four types of learners: Activists, Pragmatists,](https://static.cupdf.com/doc/110x72/5f07e47f7e708231d41f47b7/inspire-an-intelligent-system-for-personalized-where-honey-and-mumford-based.jpg)