APPLYING HUMAN FACTORS RESEARCH TO ELECTRONIC PRESCRIBING CLINICAL DECISION SUPPORT By Minhui Xie Thesis Submitted to the Faculty of the Graduate School of Vanderbilt University in partial fulfillment of the requirements for the degree of MASTER OF SCIENCE in Biomedical Informatics August, 2009 Nashville, Tennessee Approved: Kevin B Johnson, MD Matthew B. Weinger, MD William M. Gregg, MD

Welcome message from author
This document is posted to help you gain knowledge. Please leave a comment to let me know what you think about it! Share it to your friends and learn new things together.
Transcript
APPLYING HUMAN FACTORS RESEARCH TO ELECTRONIC PRESCRIBING
CLINICAL DECISION SUPPORT
By
Minhui Xie
Thesis
Submitted to the Faculty of the
Graduate School of Vanderbilt University
in partial fulfillment of the requirements
for the degree of
MASTER OF SCIENCE
in
Biomedical Informatics
August, 2009
Nashville, Tennessee
Approved:
Kevin B Johnson, MD
Matthew B. Weinger, MD
William M. Gregg, MD

ii
ACKNOWLEDGMENTS
This work would not have been possible without the guidance of my thesis committee. I
would like to thank my faculty advisor, Dr. Kevin Johnson, for his mentorship, inspiration and
encouragement. I have benefited greatly from his wisdom and experience, and have found nothing
but support from him throughout this journey. Additionally, I am grateful to Drs. Matthew Weinger
and William Gregg for their service on my thesis committee as well as their advice and suggestions;
to Dr. Jim Jirjis, for his compassion and help in recruiting physician participants; and to Dr. Dario
Giuse for his teaching and philosophy from whom I learned to develop a scalable electronic medical
record system. Their experience and insights were invaluable in helping to shape this research.
I would like to thank everyone in the Department of Biomedical Informatics. Their support
has helped me every step of the way. I would like to thank all of the physicians and nurses who
joined my research survey studies from the Vanderbilt University Medical Center and outpatient
clinics. This project would have never succeeded without their help and commitment. I had great
pleasure working with a group of people dedicated to developing Vanderbilt’s renowned Electronic
Health Record and committed to transforming health information technology (IT) at the local and
national level.
I also wish to acknowledge my wife, Yingna, and children, Anthony and Michael. Their love
and immense support have helped to encourage and sustain me during my studies. This work is for
them without whose support and assistance it would not have come true.
iii
TABLE OF CONTENTS
Page
ACKNOWLEDGMENTS.....................................................................................................................................ii
TABLE OF CONTENTS......................................................................................................................................iii
LIST OF TABLES...................................................................................................................................................vi
LIST OF FIGURES ...............................................................................................................................................vii
LIST OF SYMBOLS AND ABBREVIATIONS .......................................................................................... viii
Chapter
I. INTRODUCTION...............................................................................................................................................1
II. BACKGROUND................................................................................................................................................2
Introduction...............................................................................................................................................2
E-Prescribing.............................................................................................................................................2
Clinical Decision Support and E-Prescribing.......................................................................................3
Barriers to e-Prescribing Adoption ........................................................................................................5
Signal-to-Noise issues .....................................................................................................................5
Workflow Integration Issues ..........................................................................................................6
A Case Report: First Databank Commercial Knowledgebase ..........................................................9
The role of Human Factors Research .................................................................................................10
III. INTERFACE DEVELOPMENT AND EXPERT REVIEW ............................................................ 13
Introduction.............................................................................................................................................13
Methods....................................................................................................................................................13
Data Analysis ...........................................................................................................................................16
iv
Results.......................................................................................................................................................16
Alternative approaches to display drug alerts ............................................................................16
Information Mapping....................................................................................................................19
Expert Review and Evaluation ....................................................................................................21
Conclusion ...............................................................................................................................................23
IV. SYSTEM IMPLEMENTATION AND FORMAL USABILITY TESTING.................................. 24
Introduction.............................................................................................................................................24
Prototype Development ........................................................................................................................25
Methods....................................................................................................................................................28
Setting..............................................................................................................................................28
Study Materials ...............................................................................................................................30
Study Design...................................................................................................................................32
Data collection and analysis .........................................................................................................33
Results.......................................................................................................................................................35
Subject enrollment.........................................................................................................................35
Respo ...............................................................................................................................................35
Clinical Appropriateness of Prescribers’ responses .................................................................36
Prescribers’ perception analysis ...................................................................................................38
Discussion................................................................................................................................................40
Conclusion ...............................................................................................................................................44
FUTURE WORK .................................................................................................................................................. 45
REFERENCES ...................................................................................................................................................... 46

v
Appendix
A. STORYBOARD ............................................................................................................................................... 49
B. ENROLLMENT FORM ................................................................................................................................ 56
D. SIMULATED PATIENT CASES................................................................................................................ 59
E. STUDY PACK.................................................................................................................................................. 62
vi
LIST OF TABLES
Page
Table 1: Description of drug alert attributes......................................................................................19
Table 2: Drug alert attributes that have been mapped to each potential interface approach ......20
Table 3: Comparison of prototype interfaces ....................................................................................22
Table 4: Clinical effect............................................................................................................................25
Table 5: Descriptive analysis of enrollment distribution ..................................................................35
Table 6: Clinical appropriateness of prescribers’ responses.............................................................37
Table 7: Correct response rate of prescribers’ responses .................................................................37
Table 8: The result of prescribers’ perception ...................................................................................38
Table 9: Quotes from prescribers’ comments on TreeDashboard-View .......................................40
vii
LIST OF FIGURES
Page
Figure 1: Intrusive pop-up window text to deliver drug alert (21) ....................................................7
Figure 2: Actionable options in subpane to deliver guidelines for best practice (9) ......................8
Figure 3: The interface of prototype e-Rx application .....................................................................10
Figure 4: Drug alert presentation methods - Scrolltext, Tree, TreeDashboard, Thermometer-
View.................................................................................................................................................18
Figure 5: the screen snapshot of e-Rx prototype application ..........................................................21
Figure 6: Drug alert information delivered by TreeDashboard-View.............................................26
Figure 7: Drug alert information delivered by ScrollText-View ......................................................27
Figure 8: Prescription writer interface .................................................................................................28
Figure 9: Simulation lab with CWS workstation and audio-taped distraction instruments .........30
Figure 10: The flowchart of formal usability testing.........................................................................33
Figure 11: The response time of two drug alert interfaces ..............................................................36
viii
LIST OF SYMBOLS AND ABBREVIATIONS
ADE Adverse Drug Event
CPOE computerized physician order entry
EHR Electronic Health Record
e-Rx Electronic Prescribing
DAM Drug Allergy Conflicts
DDCM Disease Contraindications
DDIM Drug-Drug Interactions
DFIM Drug-Food Interaction
DI Duplicate Ingredient
DOSE Dose Range Checking
DT Duplication of Therapy
FDB First Databank
FR Frequency
GERI Geriatric Precautions
LACT Lactation Precautions
MONO Monograph
PEDI Pediatric Precautions
PREG Pregnancy Precautions
RxStar VUMC outpatient e-Rx system
SE Strength of Evidence
SV Severity

ix
SIDE Side Effects
StarPanel VUMC EHR system
TVC The Vanderbilt Clinics
VUMC Vanderbilt University Medival Center
1
CHAPTER I
INTRODUCTION
Clinical decision support (CDS) in electronic prescribing (e-Rx) systems can improve patient
safety and quality of care (1, 2). Despite the availability of drug information knowledgebases and
decision support modules, systems containing this functionality often have it disabled or customized
to minimize irrelevant or insignificant alerts, due to concerns about alert fatigue, i.e., decreasing the
“attention cost” of alerts (3). We postulate that novel user interfaces may decrease the “attention
cost” of alerts, as has been shown in inpatient CPOE (1). This study aimed to explore alternative
approaches to display alerts, and examine whether and how human factors based interface design
can be used to improve signal detection from noisy data (alerts and reminders) in an existing e-
prescribing system
2
CHAPTER II
BACKGROUND
Introduction
The calls for universal electronic prescribing (e-Rx) are louder than ever (1, 2, 4). Actions
should be taken to encourage physicians’ adoption. Current estimates suggest that between 5% and
18% of clinicians use e-Rx (2, 4). However, despite increasing calls for the use of electronic
prescribing by groups such as the Institute of Medicine (5) and the eHealth Initiative (2, 4), e-
prescribing adoption has not reached the levels called for by the federal government (6). It is widely
believed that poor design of clinical decision support in these systems is a large part of the barrier
to adoption (2, 4). Issues such as a large number of alerts leading to ignoring important alerts -
called “alert fatigue”, and user interfaces that disrupt the work process and require inordinate time
to comprehend (i.e., increasing the “attention cost” of the prescribing process) are among the
challenges yet to be overcome. The goal of this project is to explore the potential of novel user
interface designs to improve the presentation and comprehension of clinical decision support during
e-prescribing.
E-Prescribing
In the United States, prescription medications are central to health care. According to the
eHealth Initiative 2004 formal report (2, 4), more than 3 billions prescriptions are written annually,
accounting for 13% of health care expenditures and being used by 65% of the U.S. population. The
erroneous use of prescription medications (such as incorrect dosages, drug-drug interactions or
3
drug-allergy interactions) is common and often results in patient injuries. In general, injuries from
medications are termed adverse drug events (ADEs). A study found that 4.3% of patients
experienced ADEs, 83% of which resulted from outpatient prescriptions. Another study of 62,216
emergency department visits found that 1.7% of visits resulted from outpatient ADEs. A meta-
analysis of 36 studies concluded that 5% of hospital admissions resulted from outpatient ADEs and
only 23% were due to patient errors (3). Center for IT Leadership (CITL) ’s report on ambulatory
setting CPOE systems estimated 8 millions ADEs in U.S. per year; more than 3 millions were
preventable; this is equal to 38 ADEs per provider-year and on average 14 were preventable per
provider-year (7).
Electronic prescribing, often abbreviated as e-prescribing or e-Rx, is "computer-based
support for the creation, transmission, dispensing, and monitoring of pharmacological therapies" (1).
e-Rx is the use of computing devices (clinical workstation, personal computer, or handheld devices)
and drug information knowledgebases to enter, modify, review, output or communicate drug
prescriptions (2). e-Rx is a form of computerized physician order entry (CPOE) and is available in a
variety of graduated levels ranging from basic prescription entry to linked additional electronic drug
references, to advanced integration into an EHR (2, 4, 7). Theoretically, e-Rx with integrated
decision support can reduce medication errors and ADEs, improve health care efficiency and patient
safety (2-4).
Clinical Decision Support and E-Prescribing
In healthcare areas, clinical decision support has been defined somewhat differently by
different authors or groups (8-13). Teich, et, al. defined “clinical decision support” in CPOE/e-Rx
systems as “‘providing clinicians or patients with clinical knowledge and patient-related information,
4
intelligently filtered and presented at appropriate times, to enhance patient care”’ (10). This
functional term includes not only the familiar reactive alerts and reminders (such as alerts for drug
allergy conflicts and drug–drug interactions), but also many other intervention types, including pick
lists, structural order sets, medication reference information for prescribers and patients, and any
other guideline support that can promote safety, education, workflow improvement, and improved
quality of care.
Clinical drug alert/reminder is a form of clinical decision support. Clinical alert/reminder
systems have been the central tools used with e-Rx systems. These systems use computer-generated
messages that notify prescribers when their actions may be potentially unsafe. Typically, e-Rx
systems provide decision support in many areas, including (2, 7, 9, 10):
Drug-allergy interaction
Drug-drug interaction
Drug-disease interaction
Drug-lab interaction
Drug-food interaction
Drug-herbal remedy/vitamin interaction
Duplicate ingredient
Recommended dosing limits including patient-specific limits on total dose, dose rate, etc.
Geriatric precaution
Lactation precaution
Pediatric precaution
Pregnancy precaution
Structural order sets
5
Drug reference information including formulary information, insurance information, cost,
generic alternatives
National/institutional/departmental guidelines that can promote safety, education, workflow
improvement, communication between different stakeholders, and improved quality of care,
etc.
In general, drug alerts/reminders are triggered based on pre-defined rules from CDS
modules embedded in or connected to e-Rx systems. e-Rx writing tools promise to deliver safe and
effective care, in part through their ability to influence clinician decision-making by displaying
patient-specific alerts. They also can help make clinical data readily available and reduce the time a
prescriber needs to spend accessing data – giving a prescriber more time with the patient, and
potentially allowing the prescriber to provide better care.
Barriers to e-Prescribing Adoption
Despite the availability of commercial drug information knowledgebases and CDS modules,
users often disable this functionality. The reasons for this appear to fall within two main themes: the
perceived insignificance of the alerts; and the poor integration of alerts into workflow(2-4, 14, 15)..
Each of these barriers will be discussed below.
Signal-to-Noise issues
Issues of workflow integration are made more significant when the drug alerts are not
considered important. Numerous studies have demonstrated extremely high override rates, far and
above the probably of relevance proposed by Johnson and Grundmeier (16). For example, Payne, et
al., studied characteristics and clinicians’ override of 42,641 prescription orders and about 4500
6
safety checks associated with those prescriptions from a practitioner order entry system in a VA
hospital (17). They discovered an 88% override rate for drug interaction alerts and a 69% override
rate for drug-allergy interaction alerts. Isaac, et al., in a recently published study, looked at 233,537
medication safety alerts associated with 3.5 million electronic prescriptions generated by 2,872
physicians at community-based outpatient practices in Massachusetts, New Jersey and Pennsylvania
(18). They found that, of those 233,537 alerts, 98.6% were for a potential interaction with a drug
being taken by a patient, but physicians overrode 93.4% of the drug interactions and 77% of the
drug allergy alerts.
The high override rate suggests that most prescribers do not find currently implemented,
intrusive alerts valuable, and that major changes are needed to improve the usefulness of electronic
medication alerts. This was proposed by Weingart, in his study of physicians’ override rates for
3,481 drug allergy and drug interaction alerts in primary care (19). Physicians overrode the majority
of alerts for drug allergies (91.2% override rate) and drug interactions (89.4% override rate), and no
significant number of ADEs occurred, suggesting that the threshold for alerting was set too low or
that the signal-to-noise rate of drug alerts was low (or both.) They recommended, for example, that
e-Rx applications should suppress alerts for renewals of medication combinations that patients
currently tolerate.
Workflow Integration Issues
Studies have previously demonstrated that CPOE success depends upon several factors,
including clinicians’ access to CPOE systems that are integrated into a uniform information
workflow (1, 9, 20). Miller and colleagues(9) summarized multiple mechanisms for delivering
decision support within the context of CPOE systems. Three important axes were identified for
7
delivering decision support content: the role for decision support, the time to intervene, and the
method to intervene. According to these studies, decision support may be integrated into the
workflow in 2 presentations styles. Those styles include:
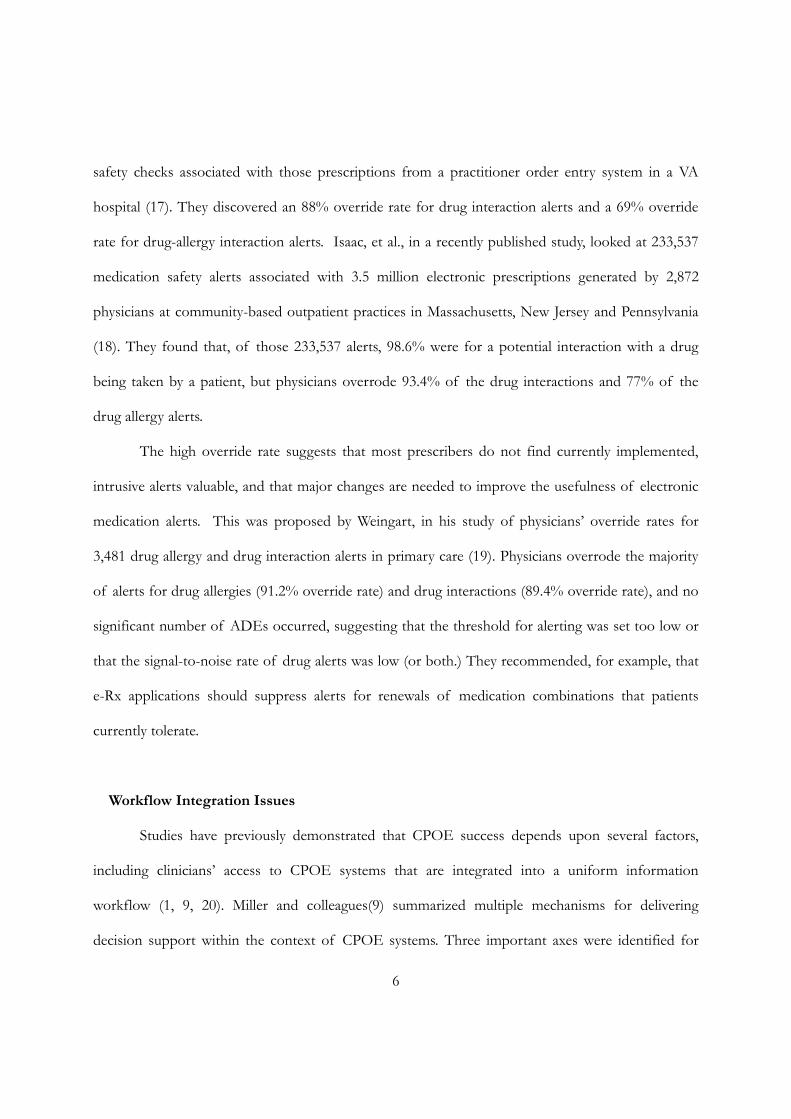
1. Intrusive presentation. An example of intrusive presentation is shown in Figure 1. With
this type of drug alert presentation, the prescriber is required to generate a response
before continuing the ordering process.
Figure 1: Intrusive pop-up window text to deliver drug alert (21)
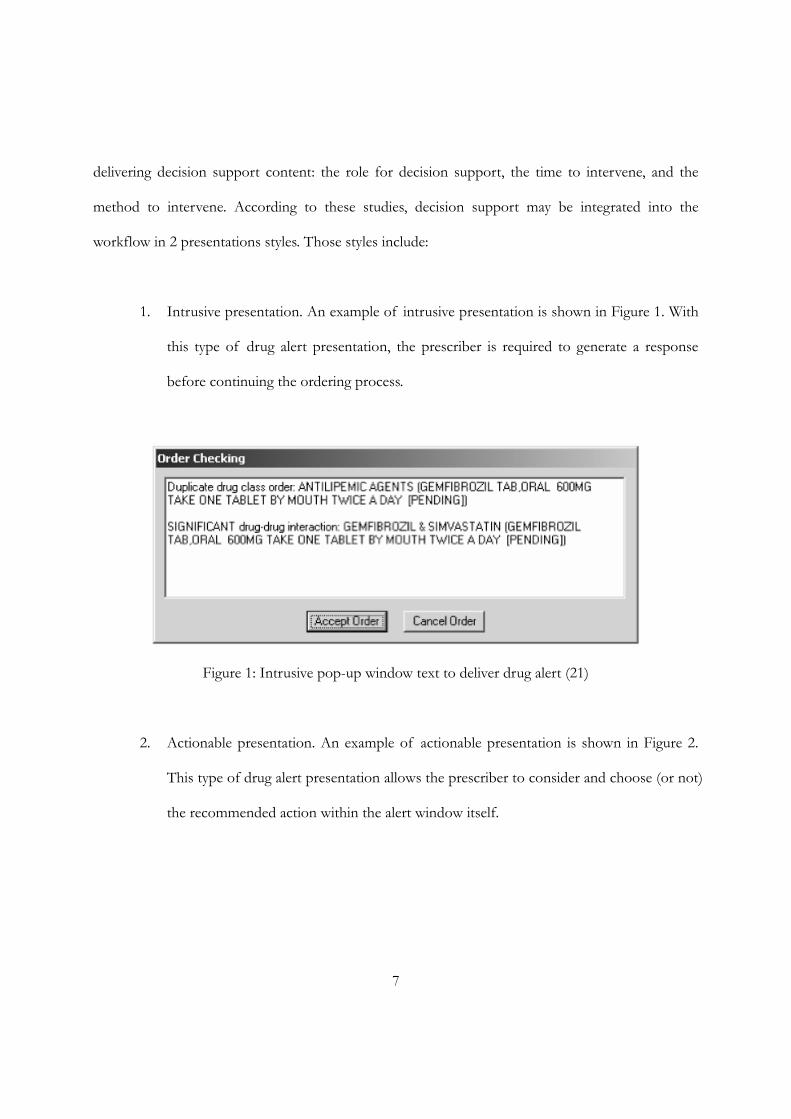
2. Actionable presentation. An example of actionable presentation is shown in Figure 2.
This type of drug alert presentation allows the prescriber to consider and choose (or not)
the recommended action within the alert window itself.
8
Figure 2: Actionable options in subpane to deliver guidelines for best practice (9)
A more complex form of decision support may combine different presentation styles
together and integrate patient-specific information (patient demographics, diagnosis, laboratory
results, active orders, guidelines, protocols, etc.) (9). Depending on the type and severity of the alert,
one or another presentation styles may be most appropriate. A study by Rosenbloom and Miller (20)
evaluated the relationship between physicians’ override rates and different drug alert presentation
methods. The use of an intrusive presentation method, while providing clinically important
information, did so at a significant workflow cost to prescribers. A “pop-up” alert in a separate user
9
interface window was viewed by users as disruptive, and should be reserved for only the most severe
clinical indications.
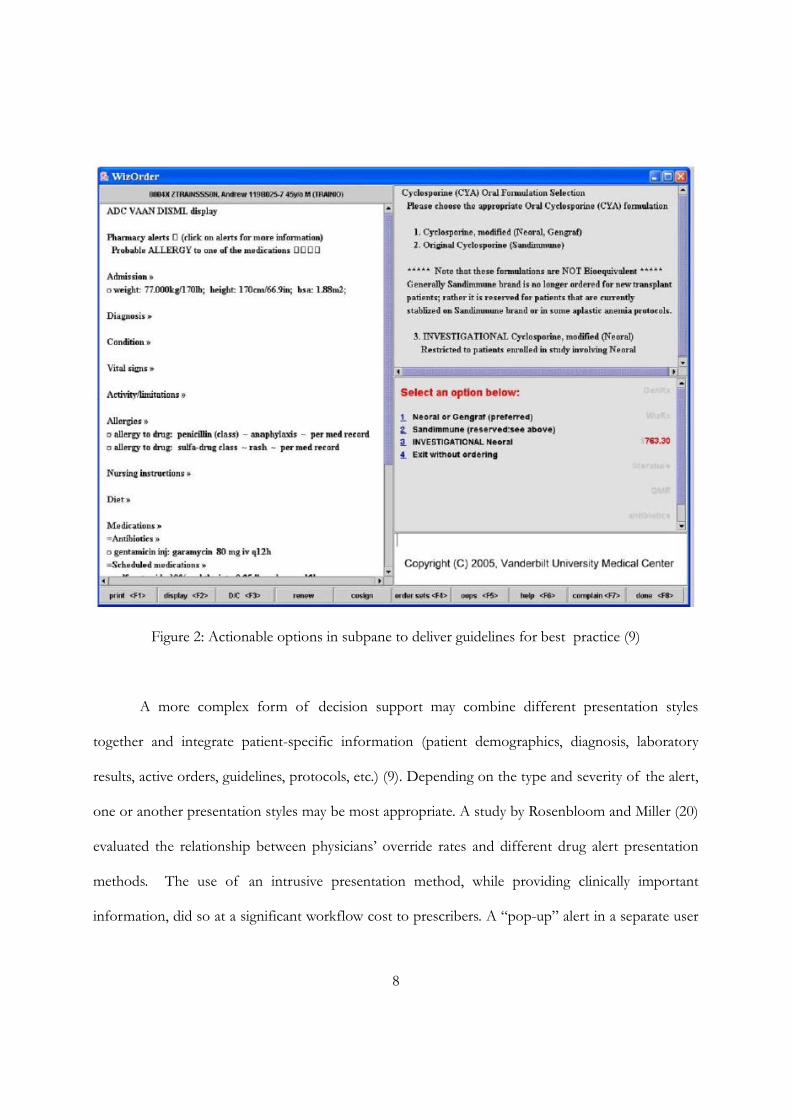
A Case Report: First Databank Commercial Knowledgebase
To understand the volume of clinical drug alerts generated by commercial drug information
knowledgebases, a prototype e-Rx application was developed using a connection to the First
DataBank® (FDB) drug information knowledgebases. This prototype allowed the user to screen
prescribed medications for 13 decision support modules including Drug Allergy Conflicts (DAM),
Disease Contraindications (DDCM), Drug-Drug Interactions (DDIM), Drug-Food Interaction
(DFIM), Duplicate Ingredient (DI), Dose Range Checking (DOSE), Duplication of Therapy (DT),
Geriatric Precautions (GERI), Lactation Precautions (LACT), Pediatric Precautions (PEDI),
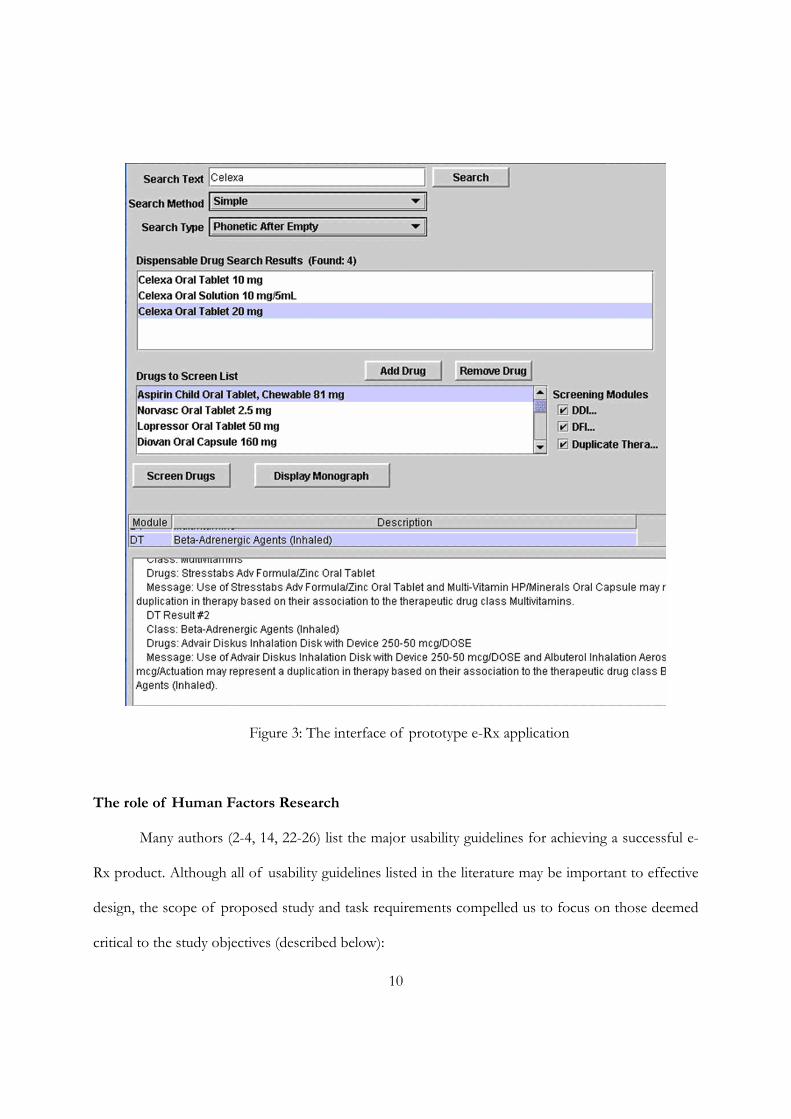
Pregnancy Precautions (PREG) and Side Effects (SIDE). Figure 3 shows the interface of prototype
application. In our feasibility tests, a mock-up patient profile with only 2 diagnosis, 2 allergies, and 10
medications triggered 49 clinical drug alerts with the 5 screening modules in the First DataBank®
drug information knowledgebases (Nov. 2003 version). Similarly, a mock-up patient profile with 6
diagnosis, 2 allergies, and 10 medications triggered more than 150 clinical drug alerts if 9 screening
modules were selected. According to domain expert clinicians, many of these drug alerts were of
low clinical significance. We concluded that the number of alerts triggered by this commercial drug
information knowledgebases was considered unbearable therefore would be treated as “noise” by
prescribers. Moreover, given the large number of alerts, the few clinically significant alerts are more
likely to be overlooked (a problem of low signal-to-noise ratio).
10
Figure 3: The interface of prototype e-Rx application
The role of Human Factors Research
Many authors (2-4, 14, 22-26) list the major usability guidelines for achieving a successful e-
Rx product. Although all of usability guidelines listed in the literature may be important to effective
design, the scope of proposed study and task requirements compelled us to focus on those deemed
critical to the study objectives (described below):
11
1. Efficiency. Physicians are generally under significant fine pressure and want to spend less
time accessing data and more time with their patients. In reality, it is difficult to convince a physician
that clicking through menus and choosing from options is more efficient than simply scribbling
some words on a pad of paper. However, through our literature review and contextual inquiries, we
found that the majority of physicians’ time is not actually spent writing the prescription itself, but
rather on researching information in order to write a prescription and maintaining the prescription
record. Therefore, a design that reduces information retrieval while not impacting prescription
writing time is essential to a successful product.
2. Information density. There is a trade-off between a design that does not crowd too much
information per screen (excessive information density) and the need to display as much information
as needed on one screen. Physicians want a comprehensive system with ready access to key
information. They prefer an effective but simple user interface to minimize cognitive burden and to
reduce the risks of errors. The e-Rx systems can predispose to use errors, such as selecting a sound
alike but wrong medication from a pick list or prescribing for the wrong patient due to a failure to
exit the previous patient’s record (25). For high volumes of information such as comprehensive drug
references, it may be better to split up the information in a logical manner, such as general
information, drug conflicts, and drug dosages and display them in different areas of the screen.
3. Freedom of user control. It may be better to let the users decide what kind of
information they need most. Users could select different decision support modules and decide how
to display various types of clinical alerts on the screen. Moreover, on every page of the prescription
writing process, it may be a good idea to provide the option to cancel the current prescription that a
physician is writing, or provide an alternative suggestion for the replacement. This feature will
provide more flexibility for the e-Rx users (2, 4, 25).
12
4. User-centered Design (27). It is well known that a commercial drug information
knowledgebase can provide comprehensive drug reference but generates low signal-to-noise
information, as described above. Visualization and evaluation techniques are available to facilitate the
design of user interfaces, and have demonstrated an ability to improve users access to and
understanding of large amounts of information (28-30). In addition, careful use of intrusive delivery
methods like “pop-up” window, and less intrusive delivery methods like in-line “incidental display of
relevant information”, should be better aligned with the types of alerts presented to prescribers (1,
9). Of note, there is virtually no literature examining the presentation and prioritization of multiple
drug alerts. Given the massive number of drug alerts that commercial drug information
knowledgebases can produce the low signal-to-noise ratio of these alerts, it is very important to
assess how different alerting interfaces can impact delivery and organization of multiple drug alerts
in an e-Rx application. This assessment is the goal of this study.
In this study, we only focused on user interface design and evaluation for outpatient e-Rx using
a typical desktop PC-based system. The study may also provide information applicable to the use of
PDA-based systems, which have better mobile performance but are less functional than desktop PC
platforms.
13
CHAPTER III
INTERFACE DEVELOPMENT AND EXPERT REVIEW
Introduction
In the previous chapters, I noted the challenge of low signal-to-high noise ratio of
medication alerts and the potential for attention to usability factors to improve e-Rx systems. In
particular, specific aspects of usability such as efficiency, error presentation, information density, and
freedom of user control may be important to explore as we seek to improve the delivery of
medication alerts.
We postulate that novel user interfaces may be required to decrease the attention cost of
alerts in the outpatient setting. In this study, attention cost is defined as prescriber’s effort or
amount of activity to get the e-Rx work done accurately and completely. At least one inpatient
computerized physician ordering entry system had focused on a similar approach with good results
(1).
This study was designed to explore alternative approaches for displaying clinical drug alerts
in an outpatient e-Rx system. The study was broken into three specific aims. This chapter will
explore the process and results of the First Aim: Using a user-centered design, iteratively build,
evaluate and refine a series of user interfaces to display alerts based on available human-computer
interface.
Methods
Four methods were employed to develop these candidate user interfaces. First, existing
14
literature about human-computer interfaces was explored to discover specific user interface
approaches that have been developed for multi-dimensionality alerting. PubMed database, ACM
(Association for Computing Machinery) digital database and SIGCHI (Special Interest Group on
Computer-Human Interaction) database were searched. The combination of the terms used
included: (electronic prescription OR e-prescription OR e-Rx) AND (system OR model); (electronic
prescription OR e-prescription OR e-Rx) AND (user interface OR interface design); (drug alert OR
medication alert OR drug reminder) AND (user interface OR interface design OR presentation);
(alert OR reminder) AND (information visualization). We briefly reviewed the abstracts of relevant
articles and retrieved the full-text articles that might contribute to developing the drug alert interface
in an e-Rx system.
Second, we completed a process called information mapping based on common information
axes available in existing drug information knowledgebases. Information mapping is a scientific
methodology used to divide and label information for easy comprehension, use, and recall (31). In
the context of this study, we mapped the drug alert attributes (category of alert, severity, frequency,
strength of evidence, etc.) to different metaphors (color, text, icon and shape) to ensure that the
drug alert content could be readily captured and comprehended by clinician prescribers.
Third, we used the mapping results to construct a prototype clinical decision support
interface designed to present multiple drug alerts generated from commercial First DataBank® drug
information knowledgebases. This application was developed using Java/Oracle programming, and
allowed us to explore knowledgebase output with predefined complex cases; the prescriber could
explore different alert presentation formats that present the same set of medication alerts. I used
our 4 interface concepts to construct the prototype:
• Interface concept #1: text based alert presentation
15
• Interface concept #3: tree based alert presentation
• Interface concept #4: tree-dashboard based alert presentation
• Interface concept #2: thermometer based alert presentation
Each of these is more fully described later in the results section.
Finally, to access overall clinician perception about the drug alert presentation interfaces, we
conducted an Expert Review. This study consisted of presenting screen snapshots from our
prototype to a group of prescribers, based on patient scenarios tested during the third phase of this
aim. We used a convenience sample of 6 expert reviewers (32), consisting of faculty/fellow
members from the Department of Biomedical Informatics, VUMC. All participants were active
practitioners with at least 2 years experience working with EHR and e-Rx systems. For this final
phase, the researcher met individually with each domain expert and used a think-aloud method while
asking the experts a series of questions (33). For each interface, two types of questions were asked:
1. You are prescribing a medication and are presented with the display above. What does
this display mean? Choose the most precise answer.
The patient has an allergy to a medication
The prescriber is trying to prescribe a medication to which the patient may be
allergic.
The patient is receiving an overdose of Lortab
OR
2. You are prescribing a medication and are presented with the display above.
Describe what is happening in this picture?
What do the different elements on this page mean?
16
Each participant received a 14-page storyboard, including cover page, tutorial and snapshots
of the e-Rx application (4 interface concepts, 2 snapshot pictures each, randomly ordered). A copy
of the storyboard is provided in Appendix A. During the interview, the domain experts were asked
to review and rank order the 4 interfaces in terms of clarity and ease of use. The participants were
also asked to comment on any issues related to multiple drug alert presentation.
Data Analysis
We analyzed the survey questionnaires to assess accuracy of the interpretation (i.e., the fact
that a Lortab-associated drug-food alert, not a drug-allergy alert, was delivered to screen), in addition
to a subjective assessment of the interface to evaluate if the alerts were easy to interpret,
comprehensive, efficient, and discriminating (easy to catch critical information).
Results
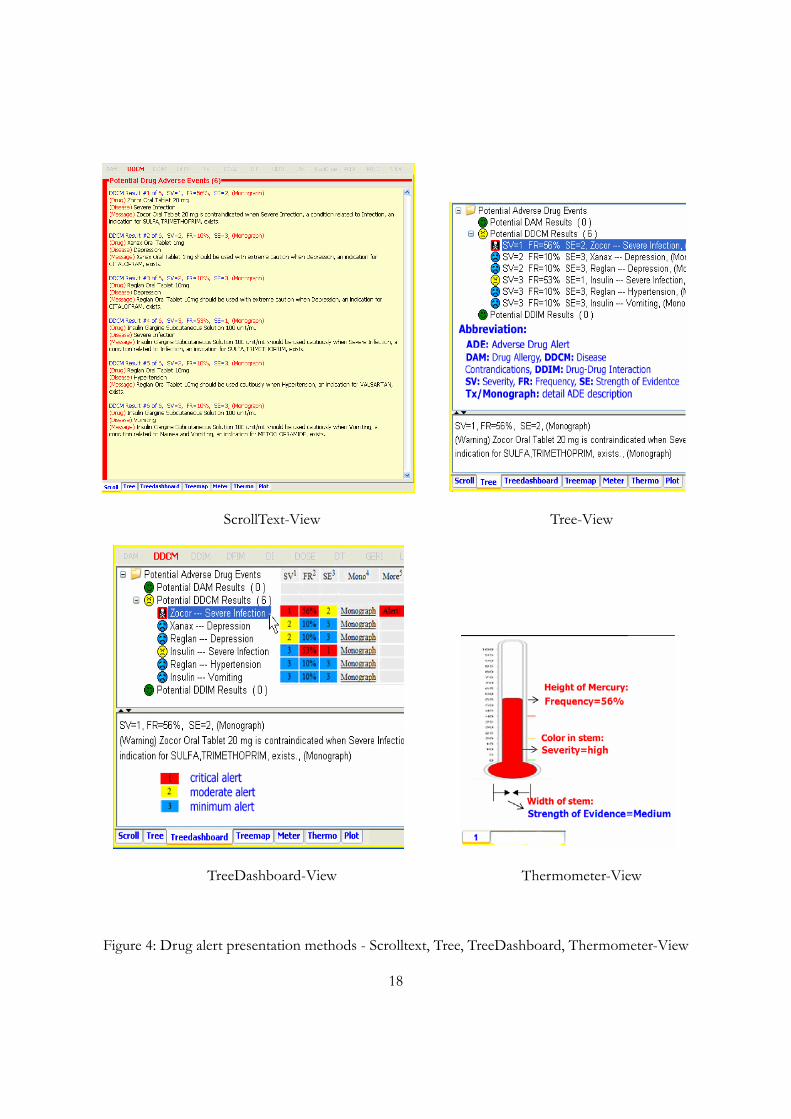
Alternative approaches to display drug alerts
Initial literature and computer-human interface review identified a series of interface
approaches. Four potential interface approaches appeared to show promise - ScrollText, Tree,
TreeDashboard, and Thermometer - for information mapping and further application
implementation (described below in details). Screen views of these approaches are shown in Figure
4.
ScrollText is a user interface that presents drug alert information in plain text format and in
an essentially linear way (34). The presciber can vertically scroll the text back-and-forth to locate
various indicators. "Scrolling", as such, does not change the layout of the text or metaphors, but
more or less facilitates the navigation of various drug alerts.
17
Tree is a user interface that presents drug alert information hierarchically (35). The hierarchy
level of various drug alerts is shown by indentation on the left side of the Tree nodes. The tree is a
collection of one or more nodes. Each node represents a screening module, e.g. drug-drug
interaction screening, drug-disease ccontraindication screening. Each node is the parent of zero or
more children, which are also nodes corresponding to multiple drug alerts retrieved from a certain
screening module. A tree can be expanded (expanded nodes show their children) or collapsed
(children are hidden). The way in which a collapsed or expanded node is displayed depends on
definitive filtering rules.
TreeDashboard is a user interface that, at the cost of some visual and programming
complexity, shows the hierarchy of items, plus a matrix of additional data or item attributes in one
unified structure. In this study, TreeDashboard-View assembles the information from multiple
components into a unified display and presents multiple drug alert information in a way that is easy
to read, and easy to interact during e-Rx. It also allows the prescriber to see a summary of various
indicators. TreeDashboard is based on the concept of TreeTable (35), but it is more interactive in
the way that the end users’ decisions, preferences and needs could be executed while the user is
interacting with various indicators.
Thermometer is a user interface that presents multiple drug alerts in visualization of
various thermometers (36, 37). Clinicians are all familiar with thermometers and may be more
sensitive than anyone else on the changes of a thermometer metaphor. In this implementation, each
drug alert was represented by a thermometer metaphor; the drug alert attributes was presented by
thermometer’s characteristics: mercury’s height, stem’s colour, thermometer’s width, etc.
18
ScrollText-View
Tree-View
TreeDashboard-View
Thermometer-View
Figure 4: Drug alert presentation methods - Scrolltext, Tree, TreeDashboard, Thermometer-View
19
Information Mapping
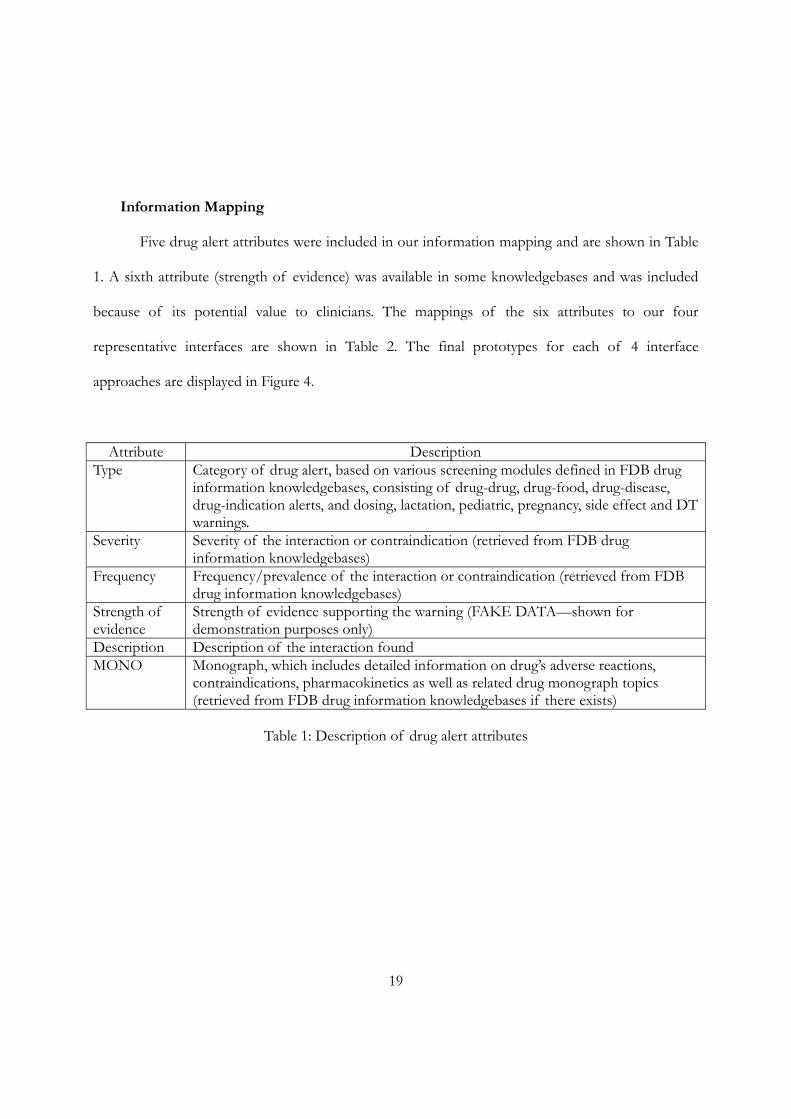
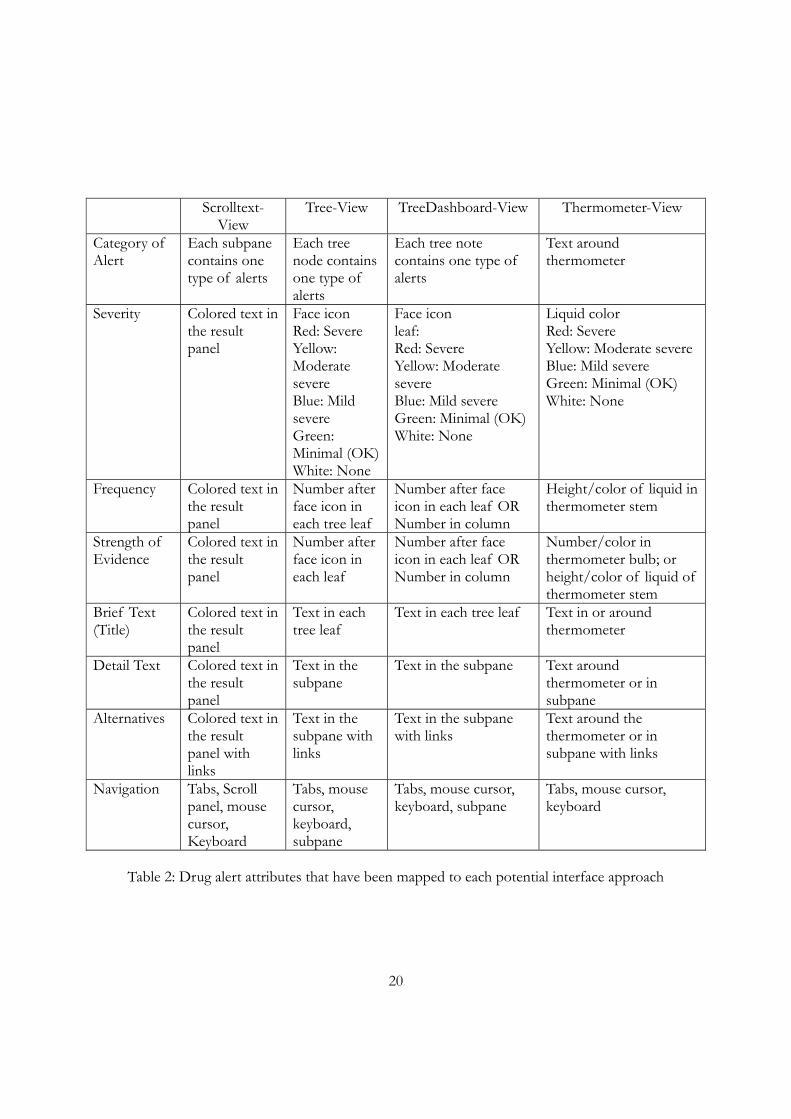
Five drug alert attributes were included in our information mapping and are shown in Table
1. A sixth attribute (strength of evidence) was available in some knowledgebases and was included
because of its potential value to clinicians. The mappings of the six attributes to our four
representative interfaces are shown in Table 2. The final prototypes for each of 4 interface
approaches are displayed in Figure 4.
Attribute Description Type Category of drug alert, based on various screening modules defined in FDB drug
information knowledgebases, consisting of drug-drug, drug-food, drug-disease, drug-indication alerts, and dosing, lactation, pediatric, pregnancy, side effect and DT warnings.
Severity Severity of the interaction or contraindication (retrieved from FDB drug information knowledgebases)
Frequency Frequency/prevalence of the interaction or contraindication (retrieved from FDB drug information knowledgebases)
Strength of evidence
Strength of evidence supporting the warning (FAKE DATA—shown for demonstration purposes only)
Description Description of the interaction found MONO Monograph, which includes detailed information on drug’s adverse reactions,
contraindications, pharmacokinetics as well as related drug monograph topics (retrieved from FDB drug information knowledgebases if there exists)
Table 1: Description of drug alert attributes
20
Scrolltext-View
Tree-View TreeDashboard-View Thermometer-View
Category of Alert
Each subpane contains one type of alerts
Each tree node contains one type of alerts
Each tree note contains one type of alerts
Text around thermometer
Severity Colored text in the result panel
Face icon Red: Severe Yellow: Moderate severe Blue: Mild severe Green: Minimal (OK) White: None
Face icon leaf: Red: Severe Yellow: Moderate severe Blue: Mild severe Green: Minimal (OK) White: None
Liquid color Red: Severe Yellow: Moderate severe Blue: Mild severe Green: Minimal (OK) White: None
Frequency Colored text in the result panel
Number after face icon in each tree leaf
Number after face icon in each leaf OR Number in column
Height/color of liquid in thermometer stem
Strength of Evidence
Colored text in the result panel
Number after face icon in each leaf
Number after face icon in each leaf OR Number in column
Number/color in thermometer bulb; or height/color of liquid of thermometer stem
Brief Text (Title)
Colored text in the result panel
Text in each tree leaf
Text in each tree leaf Text in or around thermometer
Detail Text Colored text in the result panel
Text in the subpane
Text in the subpane Text around thermometer or in subpane
Alternatives Colored text in the result panel with links
Text in the subpane with links
Text in the subpane with links
Text around the thermometer or in subpane with links
Navigation Tabs, Scroll panel, mouse cursor, Keyboard
Tabs, mouse cursor, keyboard, subpane
Tabs, mouse cursor, keyboard, subpane
Tabs, mouse cursor, keyboard
Table 2: Drug alert attributes that have been mapped to each potential interface approach
21
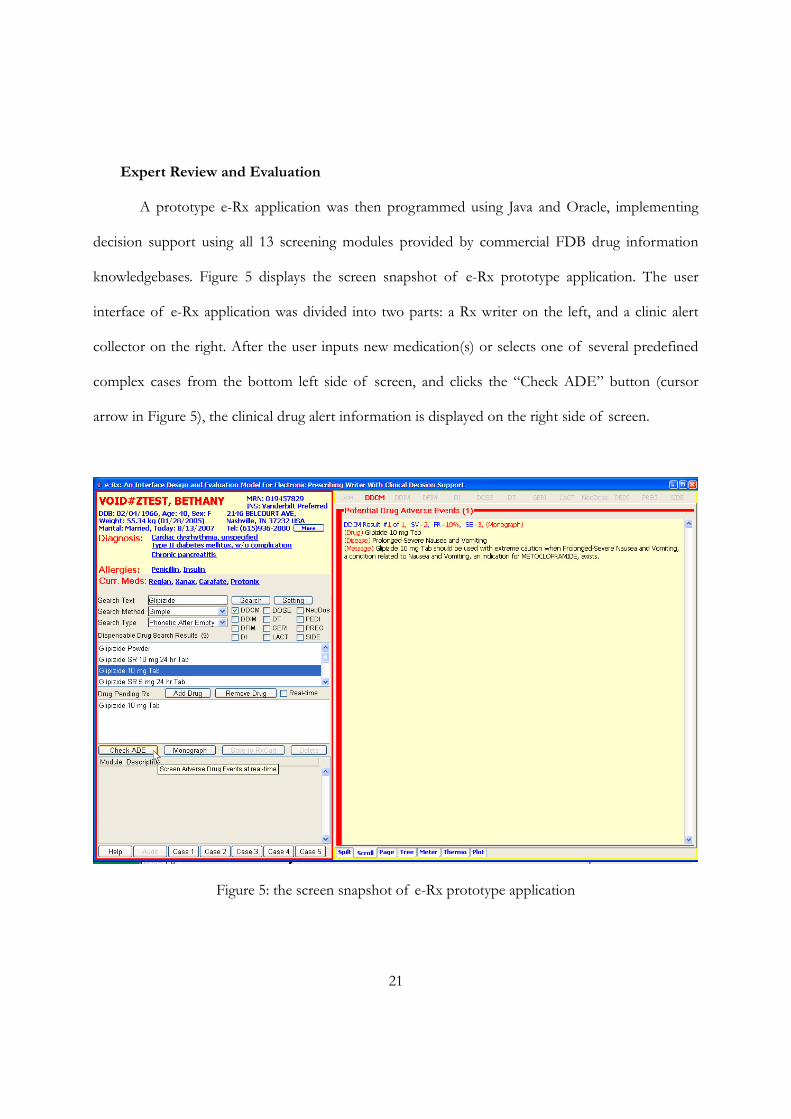
Expert Review and Evaluation
A prototype e-Rx application was then programmed using Java and Oracle, implementing
decision support using all 13 screening modules provided by commercial FDB drug information
knowledgebases. Figure 5 displays the screen snapshot of e-Rx prototype application. The user
interface of e-Rx application was divided into two parts: a Rx writer on the left, and a clinic alert
collector on the right. After the user inputs new medication(s) or selects one of several predefined
complex cases from the bottom left side of screen, and clicks the “Check ADE” button (cursor
arrow in Figure 5), the clinical drug alert information is displayed on the right side of screen.
Figure 5: the screen snapshot of e-Rx prototype application
22
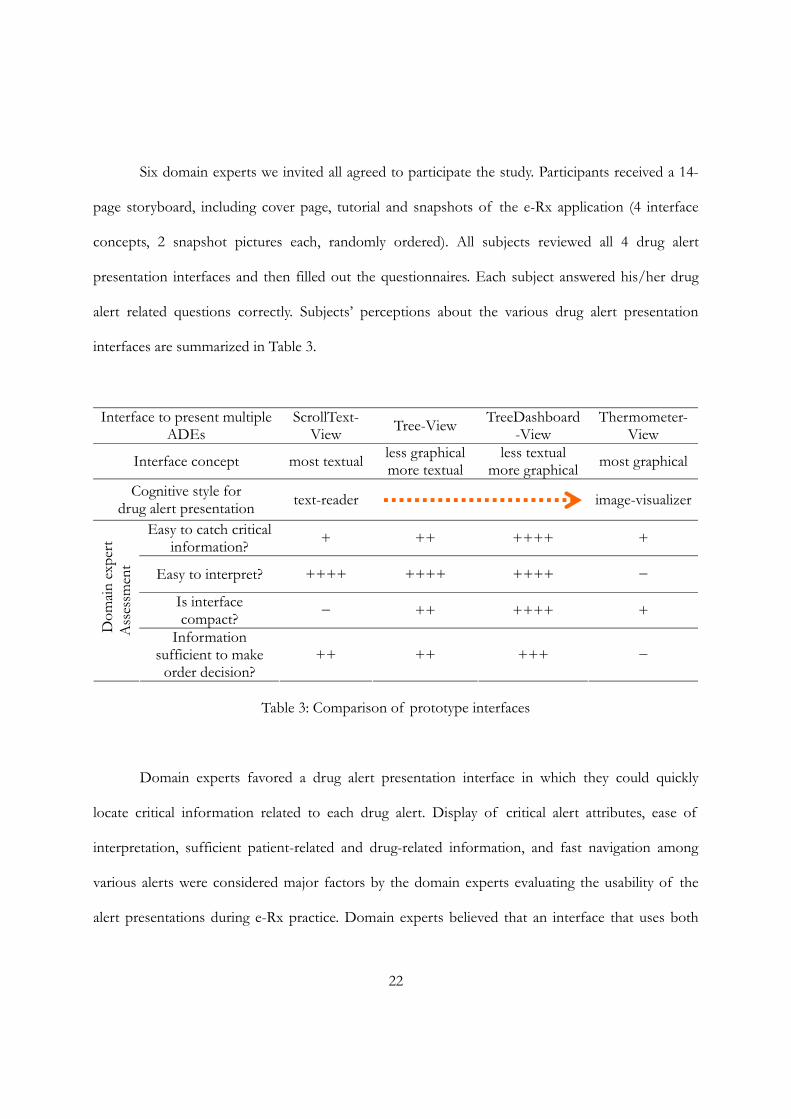
Six domain experts we invited all agreed to participate the study. Participants received a 14-
page storyboard, including cover page, tutorial and snapshots of the e-Rx application (4 interface
concepts, 2 snapshot pictures each, randomly ordered). All subjects reviewed all 4 drug alert
presentation interfaces and then filled out the questionnaires. Each subject answered his/her drug
alert related questions correctly. Subjects’ perceptions about the various drug alert presentation
interfaces are summarized in Table 3.
Interface to present multiple ADEs
ScrollText- View Tree-View TreeDashboard
-View Thermometer-
View
Interface concept most textual less graphical more textual
less textual more graphical most graphical
Cognitive style for drug alert presentation text-reader
image-visualizer
Easy to catch critical information? + ++ ++++ +
Easy to interpret? ++++ ++++ ++++ −
Is interface compact? − ++ ++++ +
Dom
ain e
xper
t A
sses
smen
t
Information sufficient to make
order decision? ++ ++ +++ −
Table 3: Comparison of prototype interfaces
Domain experts favored a drug alert presentation interface in which they could quickly
locate critical information related to each drug alert. Display of critical alert attributes, ease of
interpretation, sufficient patient-related and drug-related information, and fast navigation among
various alerts were considered major factors by the domain experts evaluating the usability of the
alert presentations during e-Rx practice. Domain experts believed that an interface that uses both
23
text and intuitive graphics metaphors better achieved the implementation goals.
Conclusion
We were able to map existing alert attributes to prototype user interfaces. Our review results
suggested that domain experts preferred a presentation method that used both text and graphics to
depict critical information related to each drug alert. The TreeDashboard-View appeared to be the
preferred prototype interface in this study (Table 3).
We used this feedback in subsequent work, as described in the next chapter.
24
CHAPTER IV
SYSTEM IMPLEMENTATION AND FORMAL USABILITY TESTING
Introduction
We postulated that novel user interfaces may be needed to dramatically decrease the
“attention cost” of presenting clinical drug alerts in an e-Rx system. We had been able to map
existing drug alert attributes (Category of alert, Severity, Frequency, Strength of Evidence,
Description, Monograph) to prototype user interfaces as described in Chapter III, Table 2. Our
Expert Review results suggested that domain experts preferred a presentation method that uses
both text and graphics to depict critical information related to each drug alert. The TreeDashboard-
View display appeared to be most favored among the four prototype interfaces studied. We used
this information to address the following two aims, which will be described below:
1. Develop a robust prototype of the preferred user interface from Aim 1 (described in
Chapter III) and integrate it into an existing e-prescribing platform.
2. Compare prescriber performance using a standard text display with performance using
this preferred user interface, with particular focus on clinical appropriateness of
prescriber’s prescribing response, response time, prescriber’s preference on two
interfaces.
Before the application implementation, we also added one more drug alert attribute (showed
in Table 4) into our information mapping based upon the feedback we received from Expert Review
study.
25
Attribute Description Clinical effect Pharmacological mechanism of interaction or contraindication (retrieved
from FDB drug information knowledgebase)
Table 4: Clinical effect
Prototype Development
We implemented our prototype drug alert application into an existing system, Starpanel, that
includes an e-prescribing application called RxStar. StarPanel is an electronic health record
application deployed throughout VUMC. It integrates patient data from multiple sources that
include demographics, lab results, radiology/cardiology/pathology reports, physician notes,
physician letters, discharge summaries, problem lists, medication log, patient indicators/alerts,
inpatient/outpatient/ED census, and external test results. It is fully integrated with RxStar. This
allows access to all of the electronic patient clinical information from one single screen. StarPanel
also support various ways to record the patient’s data, as well as workflow via message basket, work-
lists, new results, draft-and-sign, whiteboards, indicator, and consulting service, etc. StarPanel brings
detailed patient-related information, at the moment that clinicians treat the patient, record the data,
and communicate other clinicians.
RxStar is a web-based outpatient prescription writer designed to create a safe and efficiently
generated prescription. It contains features designed to improve patient safety, including drug-allergy
and drug-dose checking. RxStar is used throughout VUMC, allowing approximately 2000 prescribers
to generate over 60,000 prescriptions each month. Because RxStar has been well-adopted, it
represented the best platform to test the additional functionality of the clinical alert prototype.
The alert prototype interface retrieved patient medication information from RxStar (via
26
StarPanel), as well as drug alert information from First DataBank® drug information
knowledgebases augmented with additional knowledge for certain attributes (e.g. Strength of
Evidence) to simulate an integrated prescribing and decision support process. RxStar integration
allowed the application to turn alerts on or off based on known patient information, such as age,
weight, medical conditions (diagnosis), and current or new medications. The drug alert information
was delivered to clinicians in real-time. In addition, the survey collection process was implemented
directly into the drug alert prototype to calculate time-to-decision and other variables in the
prescribing workflow as close to the decision point as possible.
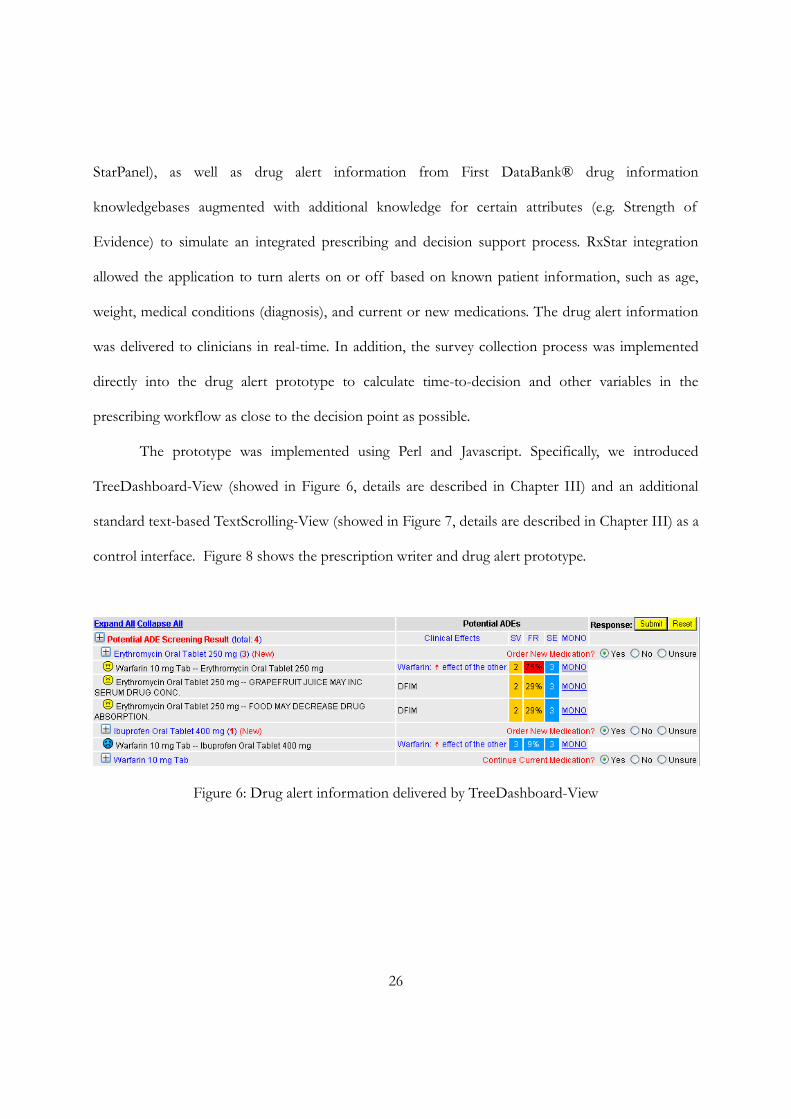
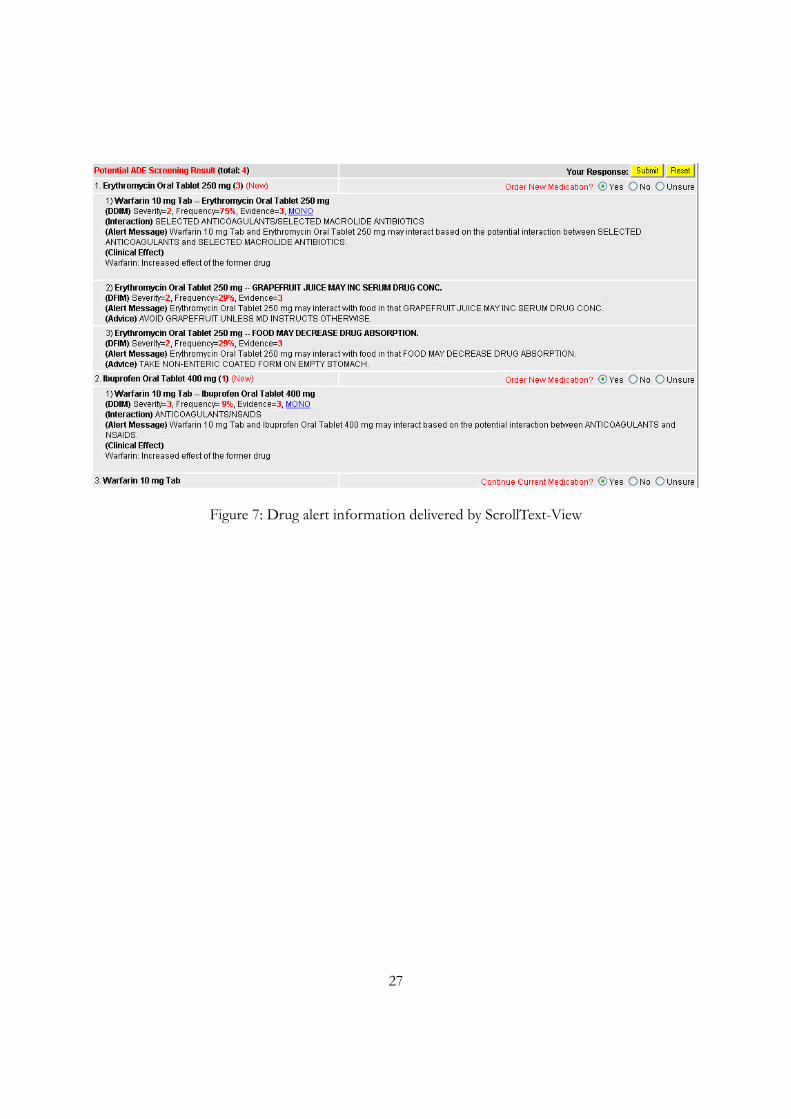
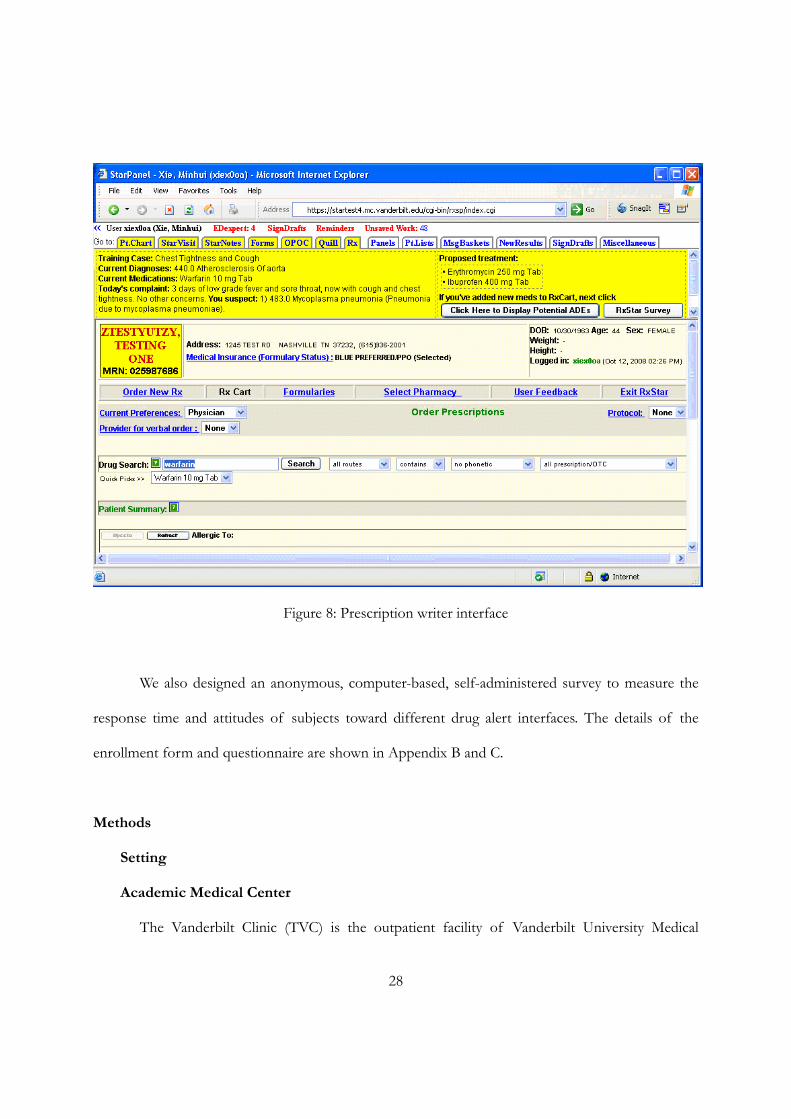
The prototype was implemented using Perl and Javascript. Specifically, we introduced
TreeDashboard-View (showed in Figure 6, details are described in Chapter III) and an additional
standard text-based TextScrolling-View (showed in Figure 7, details are described in Chapter III) as a
control interface. Figure 8 shows the prescription writer and drug alert prototype.
Figure 6: Drug alert information delivered by TreeDashboard-View
27
Figure 7: Drug alert information delivered by ScrollText-View
28
Figure 8: Prescription writer interface
We also designed an anonymous, computer-based, self-administered survey to measure the
response time and attitudes of subjects toward different drug alert interfaces. The details of the
enrollment form and questionnaire are shown in Appendix B and C.
Methods
Setting
Academic Medical Center
The Vanderbilt Clinic (TVC) is the outpatient facility of Vanderbilt University Medical
29
Center (VUMC). As of 2007, TVC had more than 900 Medical Group physicians on staff,
comprising over 95 outpatient specialty practices in several locations and provides a full range of
diagnostic and treatment services. In 2007, TVC had over one million outpatient visits.
Study Population
We recruited physician prescribers who were regular RxStar users from Internal
Medicine/Meds-Peds (combined Internal Medicine and Pediatrics) and who did not participate in
the Expert Review or Pilot Study phase of the project. The study’s description and purpose were
introduced to all target participants by the VUMC Chief Hospital Informatics Officer (also an
Internal Medicine physician) via email. Physicians were provided with details about the project. The
first 12 responders were invited to participate in the study. We used the other respondents as
alternates if we could not schedule a session with any of the original respondent group.
Before the study was administered, pilot study and power analysis were conducted to
estimate the sample size. The study design was approved by the Vanderbilt University Medical
Center Institutional Review Board. After receiving all study information, agreement to participate
was considered informed consent.
Study Environment
The study took place in a quiet cubicle to allow the participant to focus on the task of
deciding whether or not to prescribe a medication, and so that we could simulate the types of
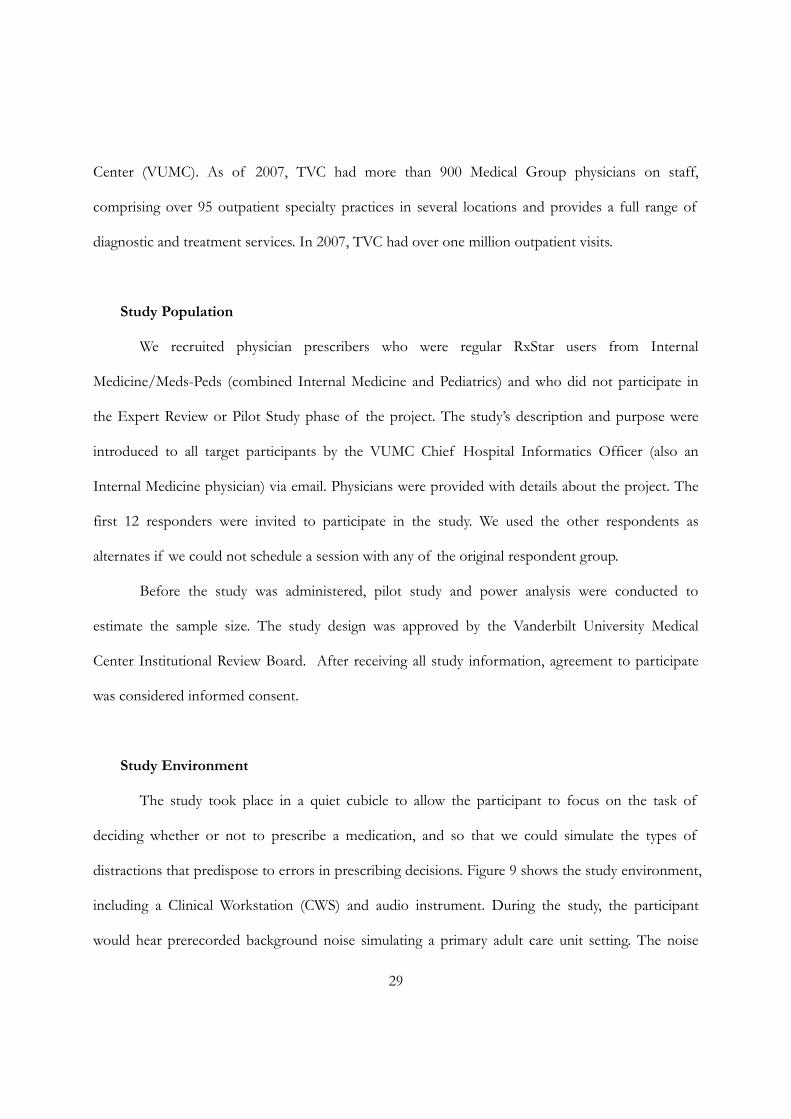
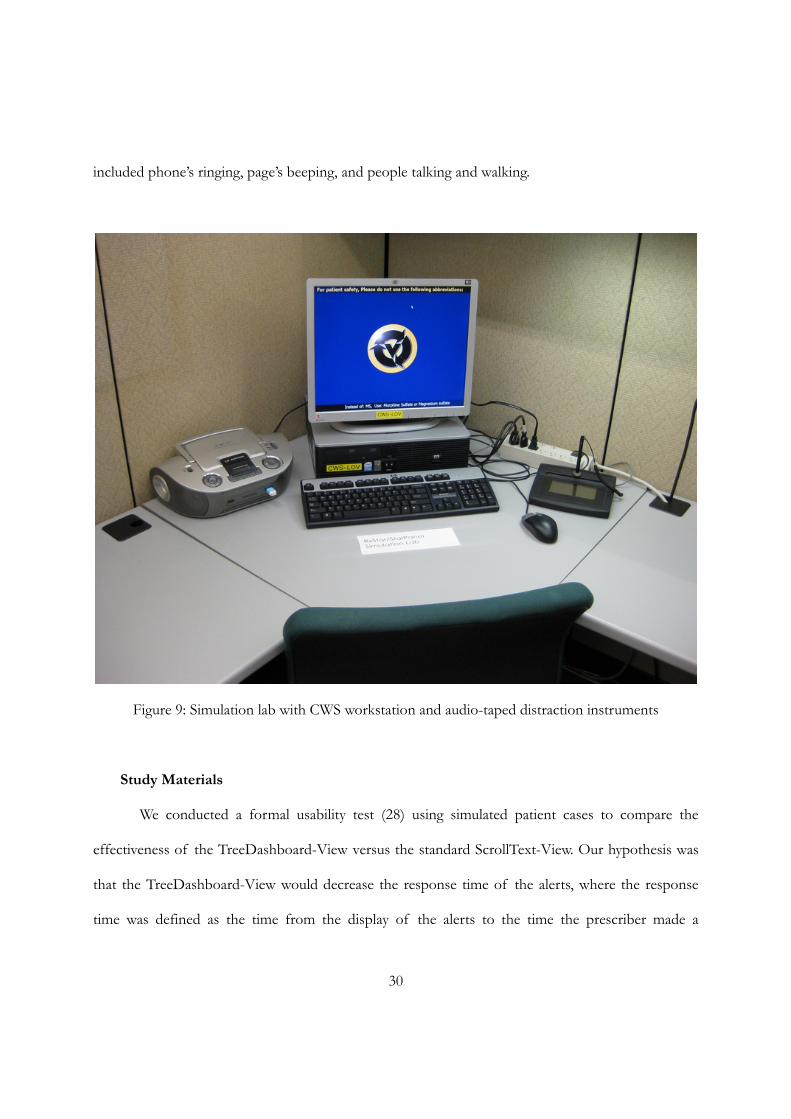
distractions that predispose to errors in prescribing decisions. Figure 9 shows the study environment,
including a Clinical Workstation (CWS) and audio instrument. During the study, the participant
would hear prerecorded background noise simulating a primary adult care unit setting. The noise
30
included phone’s ringing, page’s beeping, and people talking and walking.
Figure 9: Simulation lab with CWS workstation and audio-taped distraction instruments
Study Materials
We conducted a formal usability test (28) using simulated patient cases to compare the
effectiveness of the TreeDashboard-View versus the standard ScrollText-View. Our hypothesis was
that the TreeDashboard-View would decrease the response time of the alerts, where the response
time was defined as the time from the display of the alerts to the time the prescriber made a
31
decision to override or to cancel the prescription, all while distracted by random but typical clinic
noise.
The two simulated patient cases included patient’s demographics, diagnosis, current
medications, new prescribed medication, available laboratory information, etc. The patient-related
information was displayed on the same screen as the prescription writer. The simulated patient cases
represented different but common adult primary care prescribing situations that were similar in
complexity. The details of simulated patient cases used for training and in the study are provided in
Appendix D.
A 10-page study packet included a cover page and a color instruction manual (Appendix E).
The cover page explained the purpose of the survey study. The instruction manual provided detailed
instructions to complete the study. An enrollment form was provided to each participant before the
study and asked about the participants’ current role, department/unit, years of RxStar use, and years
of StarPanel use.
An exit survey was developed to rate both drug alert interfaces with regard to two themes:
quality of care and efficiency. Quality of care questions addressed 4 constructs:
1. Usefulness of drug alerts
2. Ability to detect critical information
3. Ability to accomplish tasks
4. Is information sufficient to make a prescribing decision
Efficiency consisted of two constructs: (1) ability to use without additional training; and (2)
ability to find necessary information when making a prescribing decision.
Participants’ responses to the two drug alert interfaces were captured using a 10-point scale
(1~10) as structured in the Questionnaire for User Interface Satisfaction survey (38), for example,
32
ranging from “1- Hard to detect critical information,” to “10 – Easy to detect critical information”,
or from “1- Inefficient to accomplish tasks,” to “10 – Efficient to accomplish tasks”, etc. where
appropriate. Participants were also provided with four free-text comment box questions to solicit
their thoughts and comments with regard to either drug alert interface.
Finally, we graded each prescriber’s response to the alert prototype based on a benchmark
respfor each alert in each case provided by one senior physician (WCG) and verified by another
domain expert (both are board-certificated internists). Grading used a 5-point (0~4) scale based on
pre-defined rules (see Appendix C).
0 – No significant interaction or risk
1 – Slight or minimal risk for interactions
2 – Moderate risk for interactions (monitoring advisable)
3 – High risk for interactions (monitoring required and consider alternatives)
4 – Contraindication
Study Design
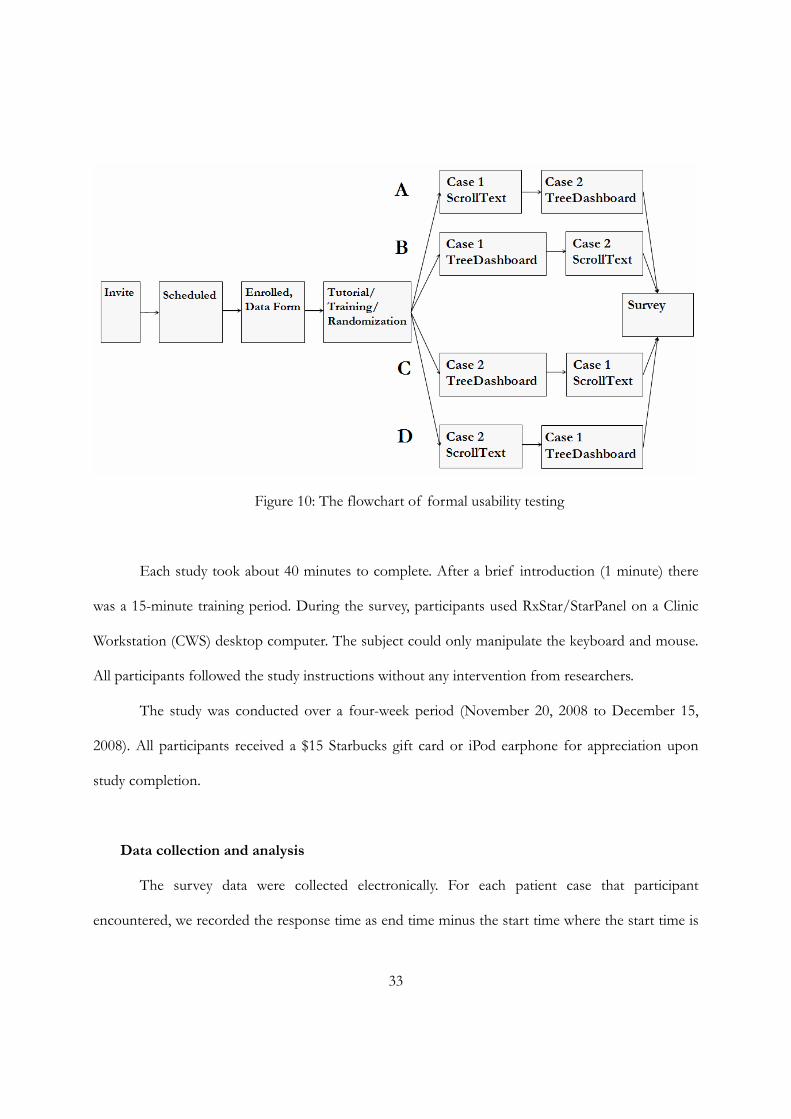
Figure 10 contains a graphical summary of the overall study design. Before beginning the
study, each subject completed the enrollment data form, followed by a tutorial that described the
interfaces and walked the study subject through a Starpanel, RxStar and drug alert prototype session,
using a training case. Once this case was completed, the subject was automatically randomized to
one of 4 possible series of screens, as shown below using a two-by-two counter-balanced
presentation order scheme for case and drug alert interface.
33
Figure 10: The flowchart of formal usability testing
Each study took about 40 minutes to complete. After a brief introduction (1 minute) there
was a 15-minute training period. During the survey, participants used RxStar/StarPanel on a Clinic
Workstation (CWS) desktop computer. The subject could only manipulate the keyboard and mouse.
All participants followed the study instructions without any intervention from researchers.
The study was conducted over a four-week period (November 20, 2008 to December 15,
2008). All participants received a $15 Starbucks gift card or iPod earphone for appreciation upon
study completion.
Data collection and analysis
The survey data were collected electronically. For each patient case that participant
encountered, we recorded the response time as end time minus the start time where the start time is
34
when drug alert information is populated on the screen, and the end time is when the prescriber
makes a final decision about prescribing medication by clicking the “submit decision” button. The
participant was required to make a decision if prescribing or not for each drug including current
medication and new mediation. The available decision options included “Yes”, “No” or “Unsure”.
The analysis used the response time per drug alert interface. We completed a Wilcoxon
Paired Signed-Rank Test for a significant difference in the response time taken to make a
prescription decision between the TreeDashboard-View and controlled ScrollText-View. The same
analysis was applied to participants’ overall perception toward the two drug alert interfaces. All
statistical testing was performed using SPSS software, version 14.0 (SPSS). A difference was
considered present if testing demonstrated a difference in the groups’ means.
Survey sample size was derived from a pilot test of the interface using three board-certified
physicians (two from Internal Medicine, one from Family Medicine practice with training and
experiences in Biomedical Informatics).
In the pilot test, the response time using the ScrollText-View was 156 seconds, with a
standard deviation of 35 seconds; and the mean response time for the TreeDashboard-View was
144 ± 39 seconds. The difference in response time between the two interfaces was 12 ± 5.6 seconds.
Sample size was estimated using “Power and Sample Size Calculator” (version 2.1.20, released on
February 2003) (39). A sample of 12 subjects would provide a power of 90% and an alpha level of
0.05 in the usability testing to determine a difference in the subjects’ response time. Of note, the
pilot used only domain experts, not regular physician prescribers, and presented all cases and drug
alert interfaces in the same sequence (case 1 ScrollText-View; case 2 TreeDashboard-View).
35
Results
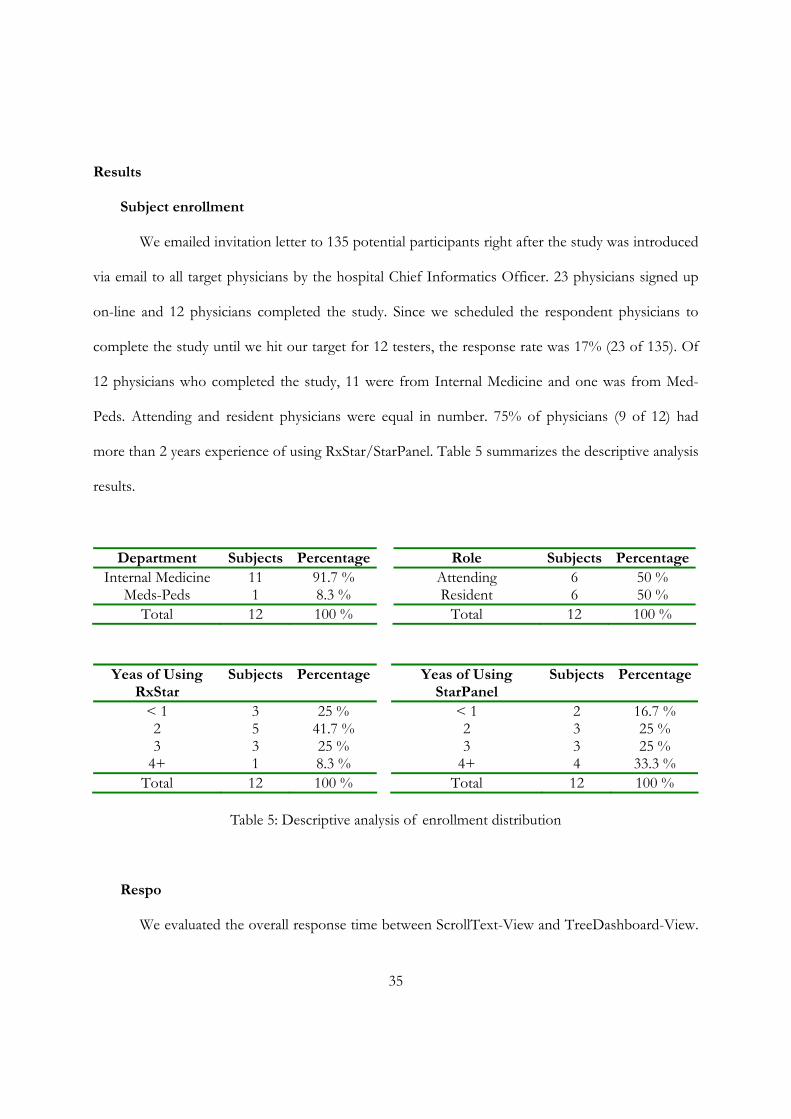
Subject enrollment
We emailed invitation letter to 135 potential participants right after the study was introduced
via email to all target physicians by the hospital Chief Informatics Officer. 23 physicians signed up
on-line and 12 physicians completed the study. Since we scheduled the respondent physicians to
complete the study until we hit our target for 12 testers, the response rate was 17% (23 of 135). Of
12 physicians who completed the study, 11 were from Internal Medicine and one was from Med-
Peds. Attending and resident physicians were equal in number. 75% of physicians (9 of 12) had
more than 2 years experience of using RxStar/StarPanel. Table 5 summarizes the descriptive analysis
results.
Department Subjects PercentageInternal Medicine 11 91.7 %
Meds-Peds 1 8.3 % Total 12 100 %
Role Subjects PercentageAttending 6 50 % Resident 6 50 %
Total 12 100 %
Yeas of Using RxStar
Subjects Percentage
< 1 3 25 % 2 5 41.7 % 3 3 25 %
4+ 1 8.3 % Total 12 100 %
Yeas of Using StarPanel
Subjects Percentage
< 1 2 16.7 % 2 3 25 % 3 3 25 %
4+ 4 33.3 % Total 12 100 %
Table 5: Descriptive analysis of enrollment distribution
Respo
We evaluated the overall response time between ScrollText-View and TreeDashboard-View.
36
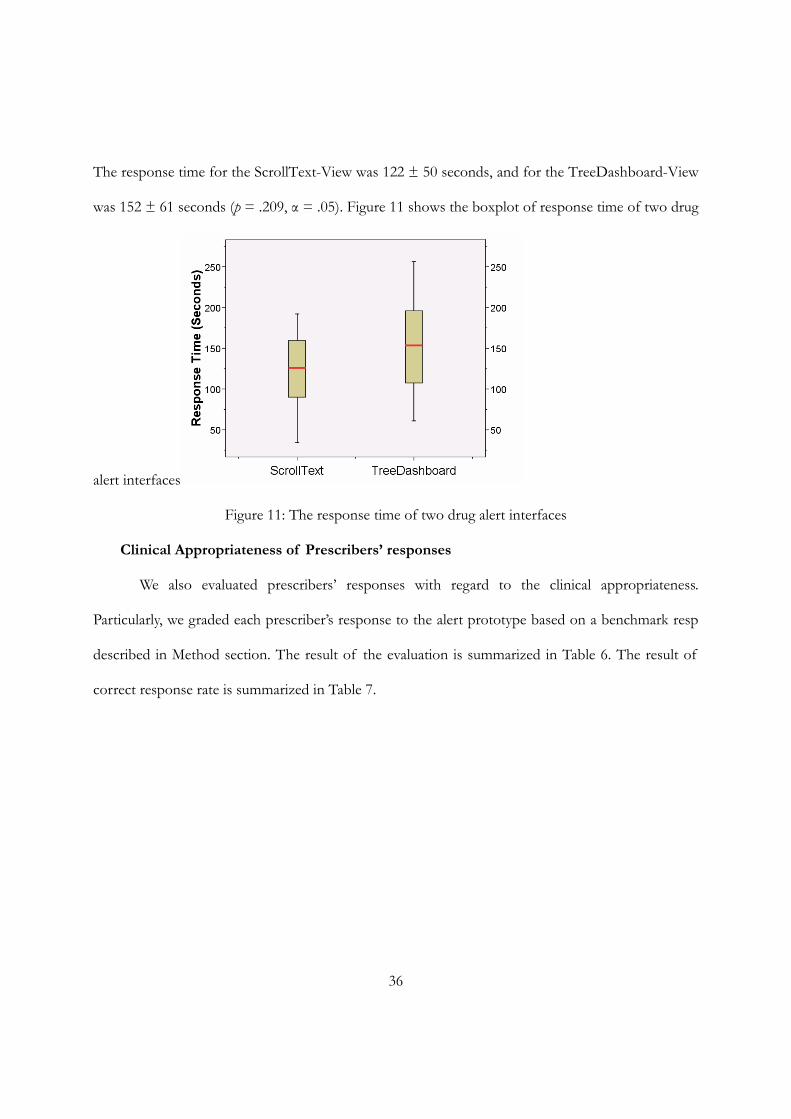
The response time for the ScrollText-View was 122 ± 50 seconds, and for the TreeDashboard-View
was 152 ± 61 seconds (p = .209, α = .05). Figure 11 shows the boxplot of response time of two drug
alert interfaces
Figure 11: The response time of two drug alert interfaces
Clinical Appropriateness of Prescribers’ responses
We also evaluated prescribers’ responses with regard to the clinical appropriateness.
Particularly, we graded each prescriber’s response to the alert prototype based on a benchmark resp
described in Method section. The result of the evaluation is summarized in Table 6. The result of
correct response rate is summarized in Table 7.
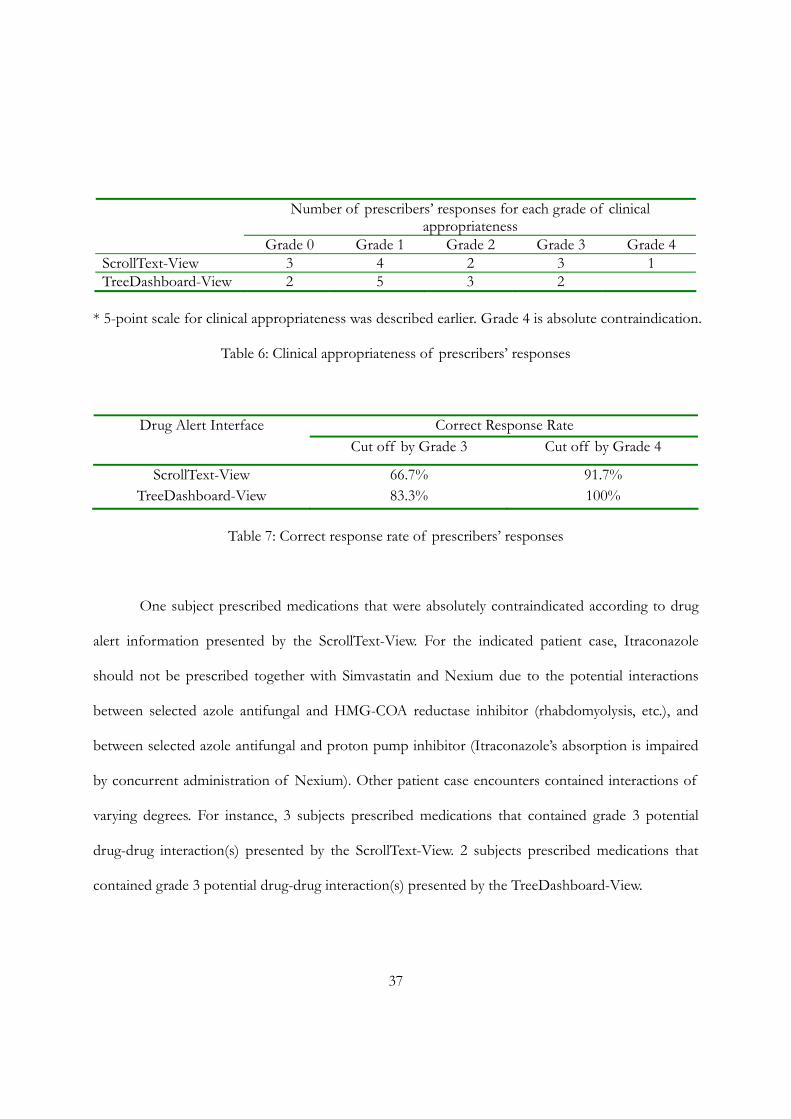
37
Number of prescribers’ responses for each grade of clinical appropriateness
Grade 0 Grade 1 Grade 2 Grade 3 Grade 4 ScrollText-View 3 4 2 3 1 TreeDashboard-View 2 5 3 2
* 5-point scale for clinical appropriateness was described earlier. Grade 4 is absolute contraindication.
Table 6: Clinical appropriateness of prescribers’ responses
Correct Response Rate Drug Alert Interface Cut off by Grade 3 Cut off by Grade 4
ScrollText-View 66.7% 91.7% TreeDashboard-View 83.3% 100%
Table 7: Correct response rate of prescribers’ responses
One subject prescribed medications that were absolutely contraindicated according to drug
alert information presented by the ScrollText-View. For the indicated patient case, Itraconazole
should not be prescribed together with Simvastatin and Nexium due to the potential interactions
between selected azole antifungal and HMG-COA reductase inhibitor (rhabdomyolysis, etc.), and
between selected azole antifungal and proton pump inhibitor (Itraconazole’s absorption is impaired
by concurrent administration of Nexium). Other patient case encounters contained interactions of
varying degrees. For instance, 3 subjects prescribed medications that contained grade 3 potential
drug-drug interaction(s) presented by the ScrollText-View. 2 subjects prescribed medications that
contained grade 3 potential drug-drug interaction(s) presented by the TreeDashboard-View.
38
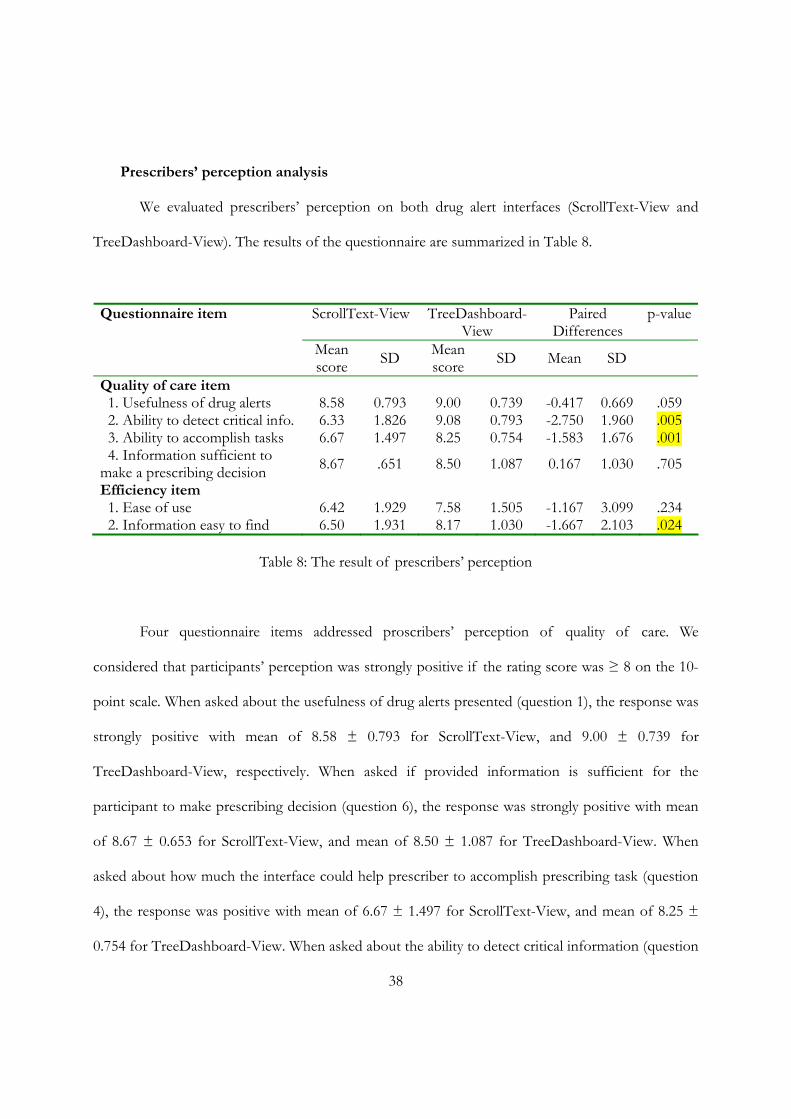
Prescribers’ perception analysis
We evaluated prescribers’ perception on both drug alert interfaces (ScrollText-View and
TreeDashboard-View). The results of the questionnaire are summarized in Table 8.
ScrollText-View TreeDashboard-View
Paired Differences
p-valueQuestionnaire item
Mean score SD Mean
score SD Mean SD
Quality of care item 1. Usefulness of drug alerts 8.58 0.793 9.00 0.739 -0.417 0.669 .059 2. Ability to detect critical info. 6.33 1.826 9.08 0.793 -2.750 1.960 .005 3. Ability to accomplish tasks 6.67 1.497 8.25 0.754 -1.583 1.676 .001 4. Information sufficient to make a prescribing decision 8.67 .651 8.50 1.087 0.167 1.030 .705
Efficiency item 1. Ease of use 6.42 1.929 7.58 1.505 -1.167 3.099 .234 2. Information easy to find 6.50 1.931 8.17 1.030 -1.667 2.103 .024
Table 8: The result of prescribers’ perception
Four questionnaire items addressed proscribers’ perception of quality of care. We
considered that participants’ perception was strongly positive if the rating score was ≥ 8 on the 10-
point scale. When asked about the usefulness of drug alerts presented (question 1), the response was
strongly positive with mean of 8.58 ± 0.793 for ScrollText-View, and 9.00 ± 0.739 for
TreeDashboard-View, respectively. When asked if provided information is sufficient for the
participant to make prescribing decision (question 6), the response was strongly positive with mean
of 8.67 ± 0.653 for ScrollText-View, and mean of 8.50 ± 1.087 for TreeDashboard-View. When
asked about how much the interface could help prescriber to accomplish prescribing task (question
4), the response was positive with mean of 6.67 ± 1.497 for ScrollText-View, and mean of 8.25 ±
0.754 for TreeDashboard-View. When asked about the ability to detect critical information (question
39
2), the response was surprisingly encouraging with a mean of 9.08 ± 0.793 for TreeDashboard-View.
Two questionnaire items addressed proscribers’ perception of efficiency. When asked about
the ease of use (question 3), the response was a mean of 6.42 ± 1.929 for ScrollText-View, and a
mean of 7.58 ± 1.505 for TreeDashboard-View, respectively. When asked if provided information is
easy to find for making prescribing decision (question 5), the mean response was 6.50 ± 1.931 for
ScrollText-View, 8.17 ± 1.030 for TreeDashboard-View.
We performed Wilcoxon Paired Signed-Rank Test to determine if perception difference on
questionnaire items existed between the two drug alert interfaces. The results are summarized in
Table 8.
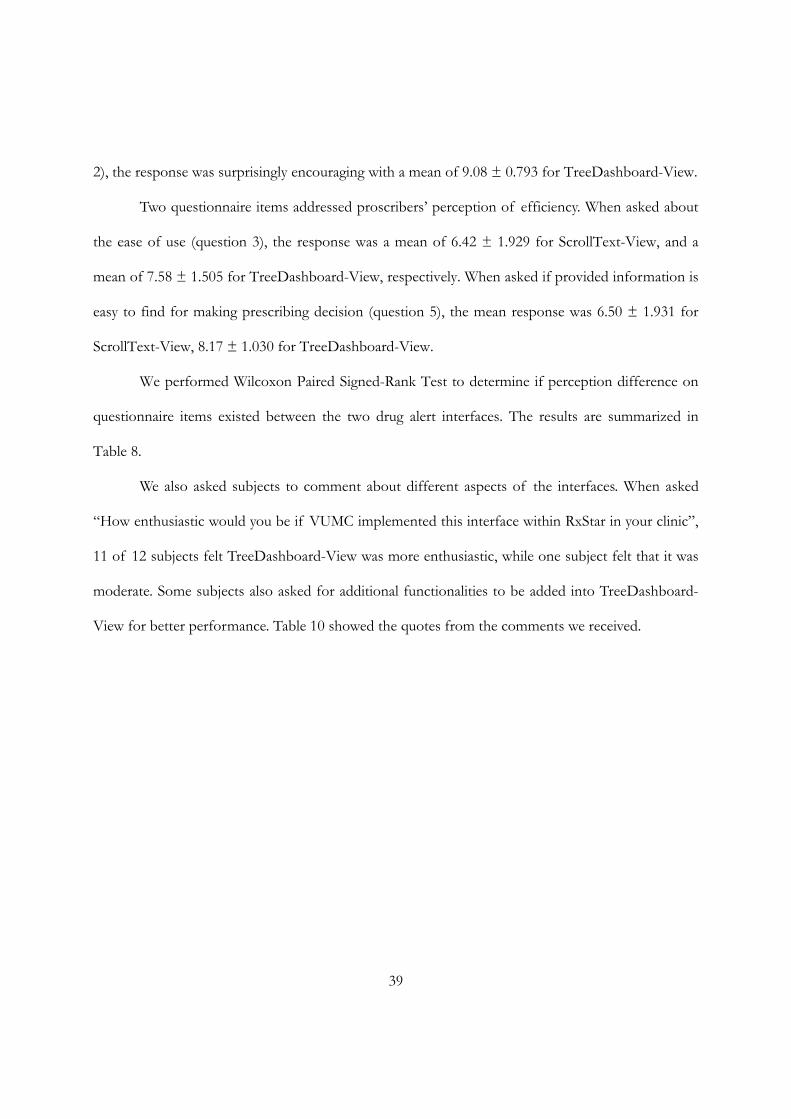
We also asked subjects to comment about different aspects of the interfaces. When asked
“How enthusiastic would you be if VUMC implemented this interface within RxStar in your clinic”,
11 of 12 subjects felt TreeDashboard-View was more enthusiastic, while one subject felt that it was
moderate. Some subjects also asked for additional functionalities to be added into TreeDashboard-
View for better performance. Table 10 showed the quotes from the comments we received.
40
Comment box questions Quotes from comments
How enthusiastic would you be if VUMC implemented this interface (TreeDashboard-View) within RxStar in your clinic
I would like this format I think this one would be easier to incorporate in daily workflow
This is a great interface and would be very helpful
Much more enthusiastic than the other interface
I would like this interface with some minor improvements
Describe what you like about this interface (TreeDashboard-View)
Key information presented at a glance with color-coding and icons that are intuitive. Further information easily available with a click or two.
Color coding and separation of data into table-like format All actionable items are on the right of the screen
I love the color coding, the faces, the boxes of colors ... I am a visual learner and this set up is very useful for me
Clinical effects area (is good) could be expanded
Describe what you don’t like about this interface (TreeDashboard-View)
What exactly do the happy/sad faces reflect?
Maybe I don't remember that there are only 3 levels in your scale and that 2 is in the middle. What if that is 2 out of 6?
Smily/frowny faces are distracting and do not add more information
(I like) ability to review clinical data - switch windows would help
Option does not exist to alter dosages of already existing medication
Table 9: Quotes from prescribers’ comments on TreeDashboard-View
Discussion
We designed and implemented a drug alert presentation application with clinical decision
support using a commercial drug information knowledgebase. The alerting application was
seamlessly integrated into an existing outpatient e-Rx system and used to simulate the prescribing
process. The application contained a computer-based, self-administered survey to measure the
41
response time and attitudes of prescribers toward different drug alert interfaces aimed to deliver
multiple drug alerts.
After an iterative design phase, we examined four different interfaces for presenting multiple
drug alerts. Formal usability testing of the most promising interface (TreeDashboard-View) and
controlled text-centric ScrollText-View demonstrated that physician prescribers agreed or strongly
agreed that multiple drug alerts delivered by either were useful for e-Rx practice (both interfaces
scored > 8.5 on a 10-point scale). Physcian prescribers agreed or strongly agreed that patient-related
and drug alert information presented by both drug alert interfaces were adequate for them to make
prescribing decision (both interfaces were scored ≥ 8.5 on a 10-point scale). Our evaluation of
clinical appropriateness suggested that participants responded to both drug alert presentations
acceptably. Only one subject prescribed medications that were absolutely contraindicated when
presented by the ScrollText-View. Other prescribers’ responses pertained to softer interactions of
varying degrees that may or may not be clinically relevant therefore they are still considered as
“appropriate”.
Formal usability testing also demonstrated that physician prescribers had favorable
impressions for drug alerts presented by the newly-designed TreeDashboard-View on quality of
patient care and efficiency when compared to the controlled ScrollText-View. Out of the six
questions asked for the TreeDashboard-View, five of six were favorable with a score > 8 on a 10
point scale (1~10). “Ease of use” had a mean score of 7.58 ± 1.505, which is still more favorable
than the ScrollText-View. Wilcoxon Paired Signed-Rank Test revealed a statistically significant
difference in participants’ perception in the themes of quality of care and efficiency. Physician
prescribers more likely agreed that the TreeDashboard-View is better than the ScrollText-View to
detect critical alerts, to accomplish prescribing tasks, and to provide information helpful in making
42
ordering decisions (p < 0.005, 0.011, and 0.024, respectively).
The study also showed that physician prescribers’ response time to the same set of drug
alerts varied substantially, reflected by a high standard deviation. Although Wilcoxon Paired Signed-
Rank Test failed to reveal statistically significant difference in the response time between the
ScrollText-View and the TreeDashboard-View (p = .209, α = .05), physician prescribers participating
in the formal usability testing seemed to spend more time with multiple drug alerts presented by the
TreeDashboard-View (152 ± 61 versus 122 ± 50 seconds of ScrollText-View). This is contrary to
our expectations. We initially hypothesized that the novel TreeDashboard-View could help physician
prescribers reduce their response time when evaluating multiple drug alerts. We can speculate an
explanation based on comments collected from survey questionnaire. Traditionally, most drug alerts
are delivered in text format using popup windows. Physician prescribers may be more familiar with
the text-centric ScrollText-View. In contrast, there may be a learning curve to use the more novel
TreeDashboard-View interface. This was indicated by prescribers’ comments on negative aspects of
the interface. Some precribers were confused about the scaling system (coloring schema and
numbering schema) used in the TreeDashboard-View while an extra click was often required to
obtain more detailed drug alert information. In this study, both simulated patient cases contained 6
drug-drug interaction and drug-food interaction alerts. The text-centric ScrollText-View may be still
sufficient to handle this limited number of multiple drug alerts. In addition, some physicians noted
that the TreeDashboard-View encouraged physicians to seek more information, thus slowing down
but potentially providing better quality care during prescribing. An improvement in our scaling
system and more tutorial/training time may help to reduce the prescribers’ response time to
TreeDashboard-View in the future study.
This study has many limitations that merit discussion. First, the ScrollText-View and the
43
TreeDashboard-View were implemented in a simple manner without the extensive user interface
refinements of a commercial interface. Next, physician prescribers may need more time to adopt the
multiple drug alerts delivered by the newly-designed TreeDashboard-View. Third, this study only
investigated a single in-house developed e-Rx system with one commercial drug information
knowledgebase support at one academic medical center. Physician participants were made up of
housestaff in Internal Medicine and Med-Peds who were familiar with the in-house developed
EHR/e-Rx applications in general. It is possible that effects with other systems at other institutes
may differ from those reported here.
Of note, relative small sample size (12 physician prescribers in the formal usability testing) may
limit statistical analysis in this study. We used convenience sampling (attendings and residents) and
simulated patient cases that were limited to internal medicine and primary adult care setting, thus
limiting generalization of the findings to community practitioners or specialists. In the next round
of user interface testing, we may need to expand the design with a larger number of test subjects to
allow for learning, and a greater variety of simulated patient cases selected for each target
subspecialty likely to use this system. After this round of testing is completed, we may also want to
expand the testing to include nurse practitioners as well.
Studies have previously demonstrated that e-Rx success depends upon several factors,
including clinicians’ access to e-Rx systems that is integrated into a single information workflow (1, 9,
20). In this study, we developed and compared prescribers’ performance using different drug alert
presentation methods in an existing e-Rx platform, with particular focus on clinical appropriateness
of prescribing, the response time, and the prescribers’ preferences. The relative small sample size (12
physician prescribers), while limiting for statistical purposes, still provides a basis for questions
regarding the worthiness of the proposed novel drug alert TreeDashboard-View.
44
Conclusion
This study described issues in presenting multiple drug alerts in an outpatient e-Rx
application integrated into EHR system. A robust model for studying multiple drug alert
presentation was developed. Several novel drug alert presentation interfaces were introduced. Both
expert evaluation and usability testing demonstrated that the TreeDashboard-View is viewed more
favorably than the text-only view. Additional studies should be done on a refined version of this
interface to improve its impact on accurate decision making and response time.
45
FUTURE WORK
This study will guide future work on the usability of multiple drug alert presentation
interfaces in an existing outpatient e-Rx system. After the deployment of a preferred drug alert
presentation interface, we hope to iteratively refine the interface design and evaluation of actual
prescribing practices.
We collected feedback throughout the Expert Review and formal usability survey evaluations.
After changes are made to the preferred drug alert presentation interface, the testing cycle could
begin again, e.g., with a new domain expert panel, same or different group of physicians and nurses,
to assess the effects of the changes. This type of usability testing (Expert Review and formal
usability survey) can be conducted repeatedly throughout the software life cycle of e-Rx system. The
prototypes of the drug alert presentation and self-administrated survey interfaces developed in this
study will provide benchmarks against which improvement can be measured in different testing
scenarios.
The outpatient e-Rx system and EHR system used for this study already supports clinical
decision supports including Drug Allergy Conflicts, Dose Range Checking, Drug-Drug interaction,
Drug-Food Interaction, Duplicate Ingredient, Geriatric Precautions, and Lactation Precautions
(provided by commercial FDB drug information knowledgebases). The results of our findings will
be presented to the e-Rx development team. After the design of a preferred drug alert presentation
interface is finalized, our hope is its integration would be seamless and cost-effective.
46
REFERENCES
1. Miller RA, Gardner RM, Johnson KB, Hripcsak G. Clinical decision support and electronic prescribing systems: a time for responsible thought and action. J Am Med Inform Assoc. 2005 Jul-Aug;12(4):403-9.
2. eHI consensus report. Electronic Prescribing: toward maximum value and rapid adoption. Recommendations for optimal design and implementation to improve care, increase efficiency and reduce costs in ambulatory care. Washington DC: eHealth Initiative; 2004; Available from: www.ehealthinitiative.org/initiatives/erx; 2004.
3. Bell DS, Cretin S, Marken RS, Landman AB. A conceptual framework for evaluating outpatient electronic prescribing systems based on their functional capabilities. J Am Med Inform Assoc. 2004 Jan-Feb;11(1):60-70.
4. AHRQ. Electronic Prescribing Initiative eHealth Initiative. Electronic Prescribing: Toward Maximum Value and Rapid Adoption. Recommendations for optimal design and implementation to improve care, increase efficiency and reduce costs in ambulatory care; Agency for Healthcare Research and Quality (AHRQ); Washington DC; April 14, 2004.
5. Institute of Medicine. Preventing Medication Errors: Quality Chasm Series; 2006.
6. Centers for Medicare and Medicaid Services. Medicare Prescription Drug Improvement and Modernization Act (MMA). 2003.
7. CITL. The Value of CPOE in ambulatory settings. Full Report. Available from www.CITL.crg and www.HIMSS.org; 2003.
8. Miller D. ePrescribing: ready for prime time. But is your government? Health Manag Technol. 2009 Jan;30(1):32, 1.
9. Miller RA, Waitman LR, Chen S, Rosenbloom ST. The anatomy of decision support during inpatient care provider order entry (CPOE): Empirical observations from a decade of CPOE experience at Vanderbilt. J Biomed Inform. 2005 Oct 21.
10. Teich JM, Osheroff JA, Pifer EA, Sittig DF, Jenders RA. Clinical decision support in electronic prescribing: recommendations and an action plan: report of the joint clinical decision support workgroup. J Am Med Inform Assoc. 2005 Jul-Aug;12(4):365-76.
11. Chueh H, Barnett GO. "Just-in-time" clinical information. Acad Med. 1997 Jun;72(6):512-7.
12. Braden BJ, Corritore C, McNees P. Computerized decision support systems: implications for practice. Stud Health Technol Inform. 1997;46:300-4.
47
13. Langton KB, Johnston ME, Haynes RB, Mathieu A. A critical appraisal of the literature on the effects of computer-based clinical decision support systems on clinician performance and patient outcomes. Proc Annu Symp Comput Appl Med Care. 1992:626-30.
14. Taylor LK, Tamblyn R. Reasons for physician non-adherence to electronic drug alerts. Stud Health Technol Inform. 2004;107(Pt 2):1101-5.
15. Bergk V, Gasse C, Schnell R, Haefeli WE. Requirements for a successful implementation of drug interaction information systems in general practice: results of a questionnaire survey in Germany. Eur J Clin Pharmacol. 2004 Oct;60(8):595-602.
16. Grundmeier R, Johnson K. Housestaff attitudes toward computer-based clinical decision support. Proc AMIA Symp. 1999:266-70.
17. Payne TH, Nichol WP, Hoey P, Savarino J. Characteristics and override rates of order checks in a practitioner order entry system. Proc AMIA Symp. 2002:602-6.
18. Isaac T, Weissman JS, Davis RB, et al. Overrides of medication alerts in ambulatory care. Arch Intern Med. 2009 Feb 9;169(3):305-11.
19. Weingart SN, Toth M, Sands DZ, Aronson MD, Davis RB, Phillips RS. Physicians' decisions to override computerized drug alerts in primary care. Arch Intern Med. 2003 Nov 24;163(21):2625-31.
20. Rosenbloom ST, Geissbuhler AJ, Dupont WD, et al. Effect of CPOE user interface design on user-initiated access to educational and patient information during clinical care. J Am Med Inform Assoc. 2005 Jul-Aug;12(4):458-73.
21. Spina JR, Glassman PA, Belperio P, Cader R, Asch S. Clinical relevance of automated drug alerts from the perspective of medical providers. Am J Med Qual. 2005 Jan-Feb;20(1):7-14.
22. Sharda P, Das AK, Patel VL. Specifying design criteria for electronic medical record interface using congnitive framework. Proc AMIA Symp. 2003:594-8.
23. Patel VL, Kushniruk AW. Interface design for health care environments: the role of cognitive science. Proc AMIA Symp. 1998:29-37.
24. Koubek RJ, Benysh D, Buck M, Harvey CM, Reynolds M. The development of a theoretical framework and design tool for process usability assessment. Ergonomics. 2003 Jan 15;46(1-3):220-41.
25. Anderson JG, Jay SJ, Anderson M, Hunt TJ. Evaluating the capability of information technology to prevent adverse drug events: a computer simulation approach. J Am Med Inform Assoc. 2002 Sep-Oct;9(5):479-90.
26. Keet R. Essential characteristics of an electronic prescription writer. J Healthc Inf Manag. 1999 Fall;13(3):53-61.
48
27. Donald AN, Stephen WD. User Centered System Design; New Perspectives on Human-Computer Interaction: L. Erlbaum Associates Inc.; 1986.
28. Jacko J, Sears A. The Human-Computer Interaction Handbook: Fundamentals, Evolving Technologies, and Emerging Applications; 2002.
29. Plaisant C, Mushlin R, Snyder A, Li J, Heller D, Shneiderman B. LifeLines: using visualization to enhance navigation and analysis of patient records. Proc AMIA Symp. 1998:76-80.
30. Chazard E, Puech P, Gregoire M, Beuscart R. Using Treemaps to represent medical data. Stud Health Technol Inform. 2006;124:522-7.
31. Horn RE. Mapping Hypertext: The Analysis, Organization, and Display of Knowledge for the Next Generation of On-Line Text and Graphics. Lexington, MA: The Lexington Institute; 1989.
32. Julie A. Jacko AS. The Human-Computer Interaction Handbook: Fundamentals, Evolving Technologies and Emerging Applications (Human Factors and Ergonomics): Lea; 2002.
33. Jaspers MW, Steen T, van den Bos C, Geenen M. The think aloud method: a guide to user interface design. Int J Med Inform. 2004 Nov;73(11-12):781-95.
34. Christian K, Benjamin BB. Benefits of animated scrolling. CHI '05 extended abstracts on Human factors in computing systems. Portland, OR, USA: ACM; 2005.
35. Tidwell J. Showing Complex Data Using TreeTable. Designing Interfaces: Patterns for Effective Interaction Design; 2005.
36. Spang L, Trell E, Fioretos M, Kielstein V, Nasr M. "Healthometer"--an instrument for self-distributed health screening and prevention in the population. J Med Syst. 1998 Oct;22(5):339-55.
37. van Twillert B, Bremer M, Faber AW. Computer-generated virtual reality to control pain and anxiety in pediatric and adult burn patients during wound dressing changes. J Burn Care Res. 2007 Sep-Oct;28(5):694-702.
38. Questionnaire for User Interface Satisfaction. http://www.cs.umd.edu/hcil/quis/.
39. Dupont WD, Plummer WD, Jr. Power and sample size calculations for studies involving linear regression. Control Clin Trials. 1998 Dec;19(6):589-601.
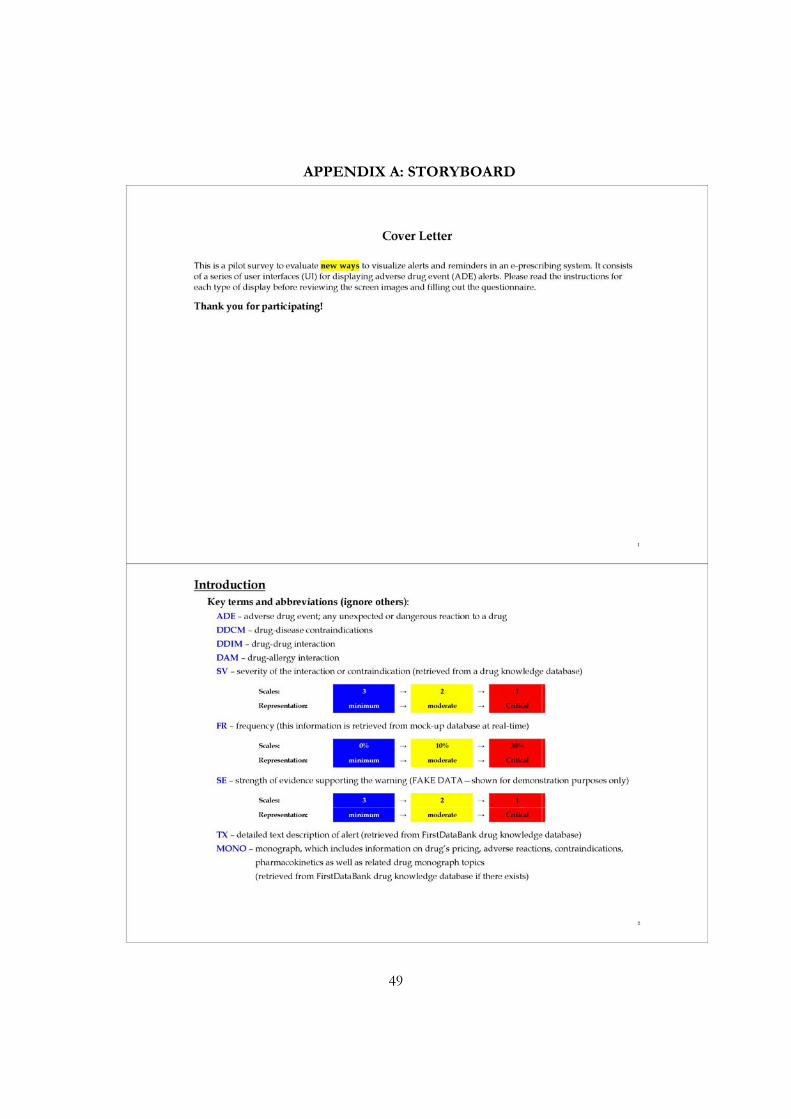
49
APPENDIX A: STORYBOARD
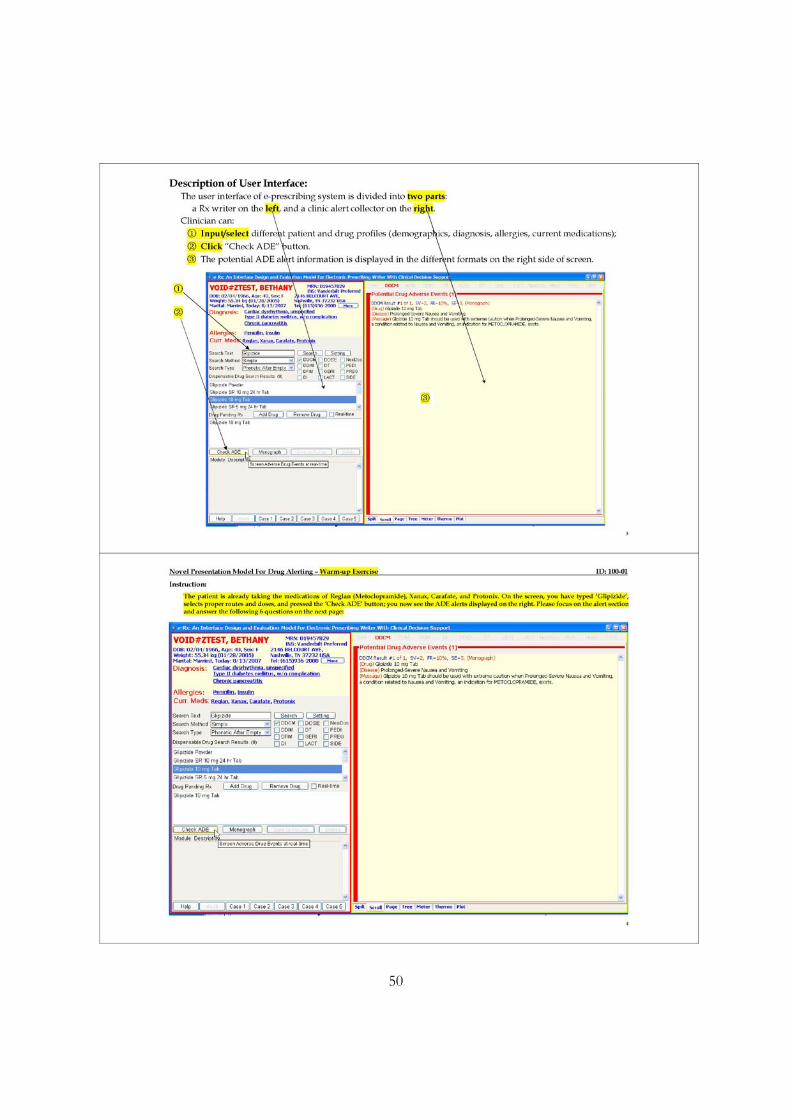
50
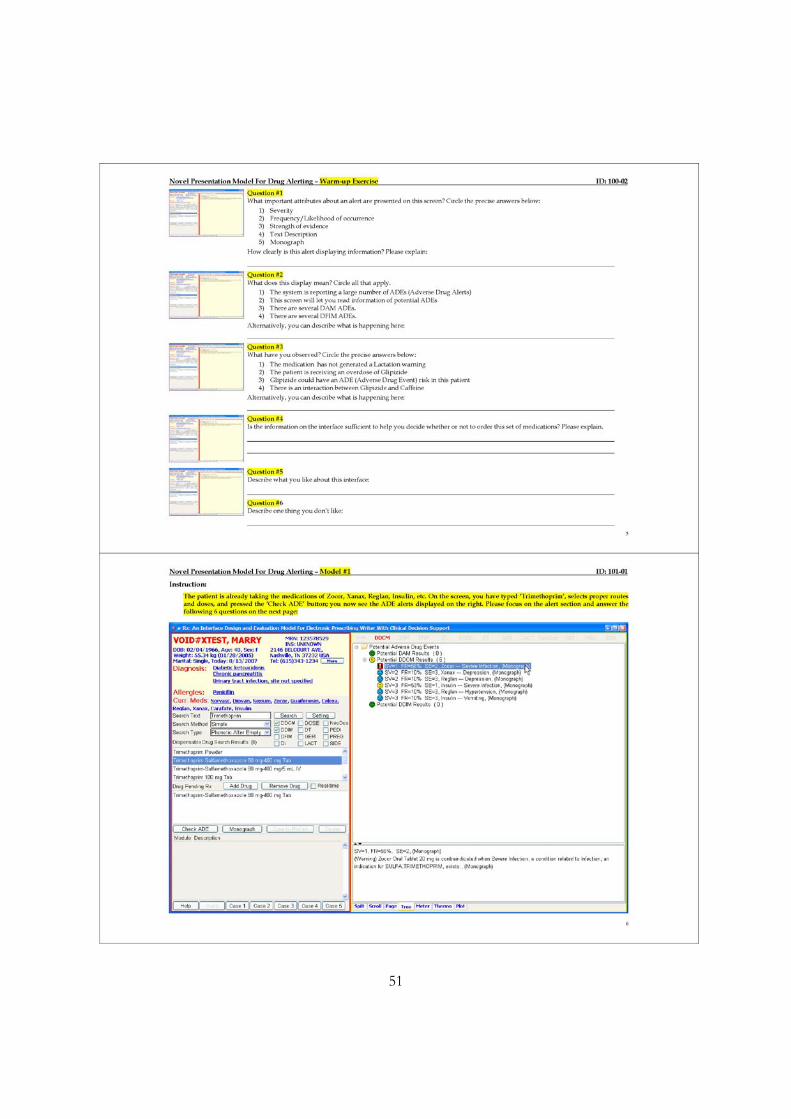
51
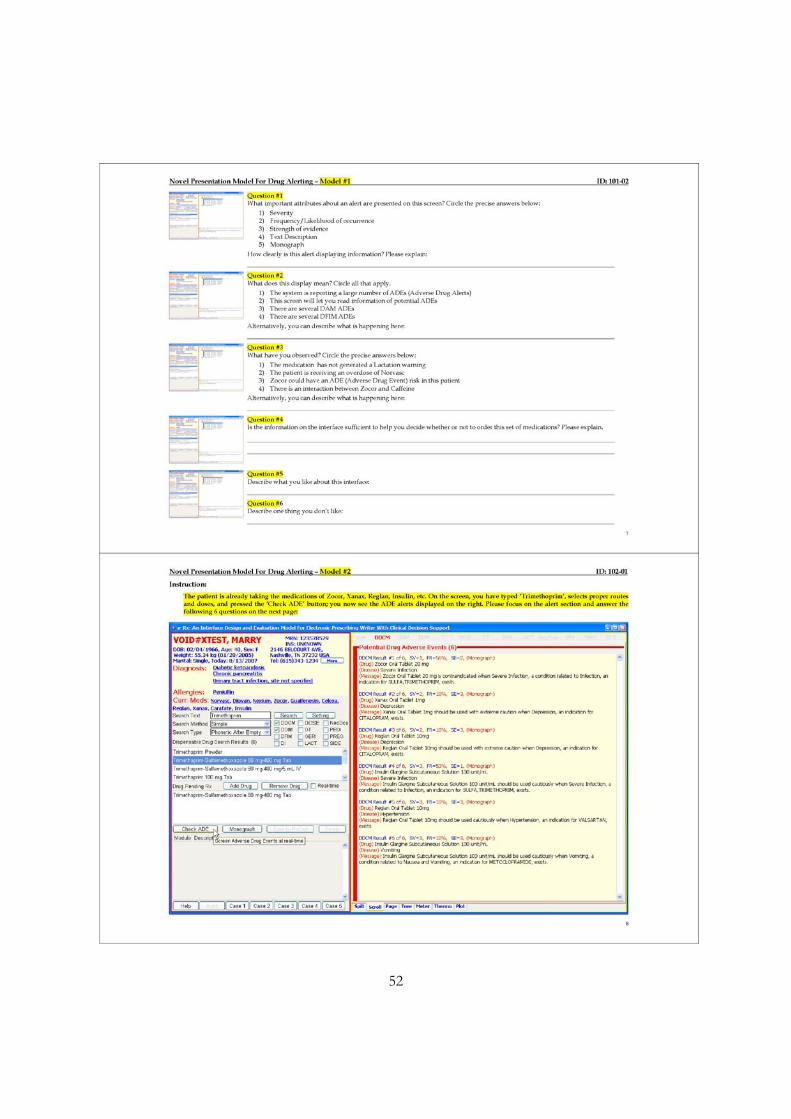
52
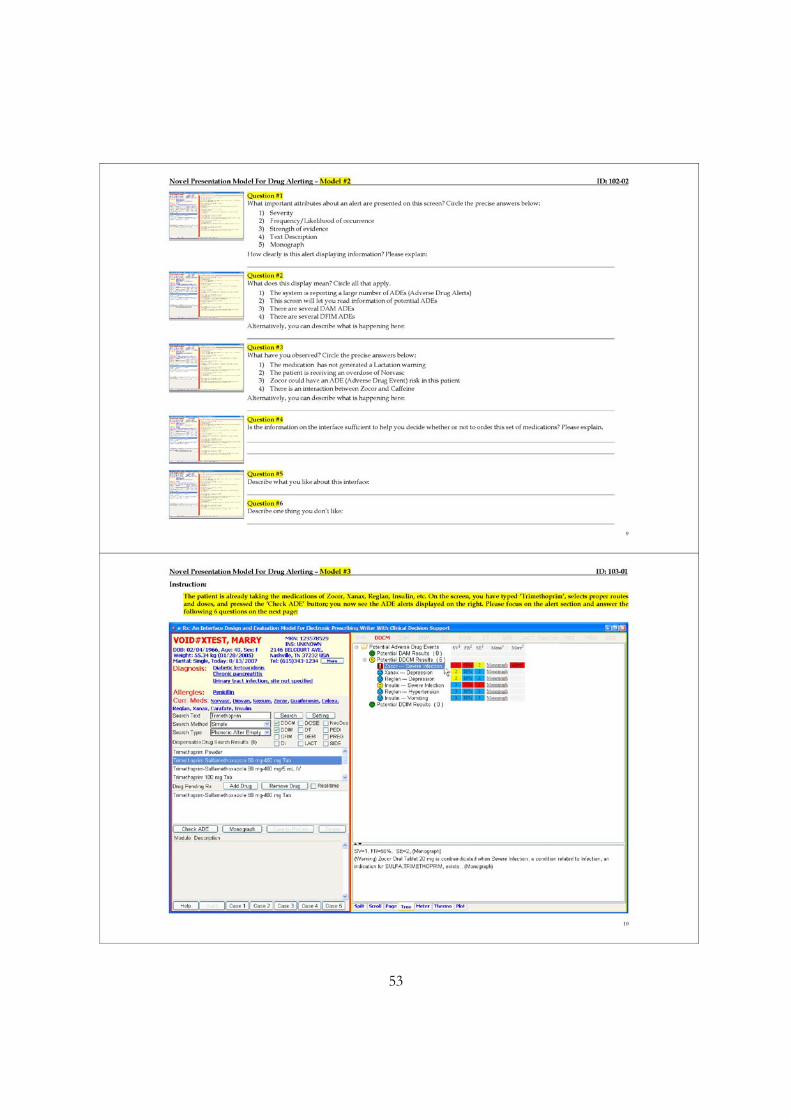
53
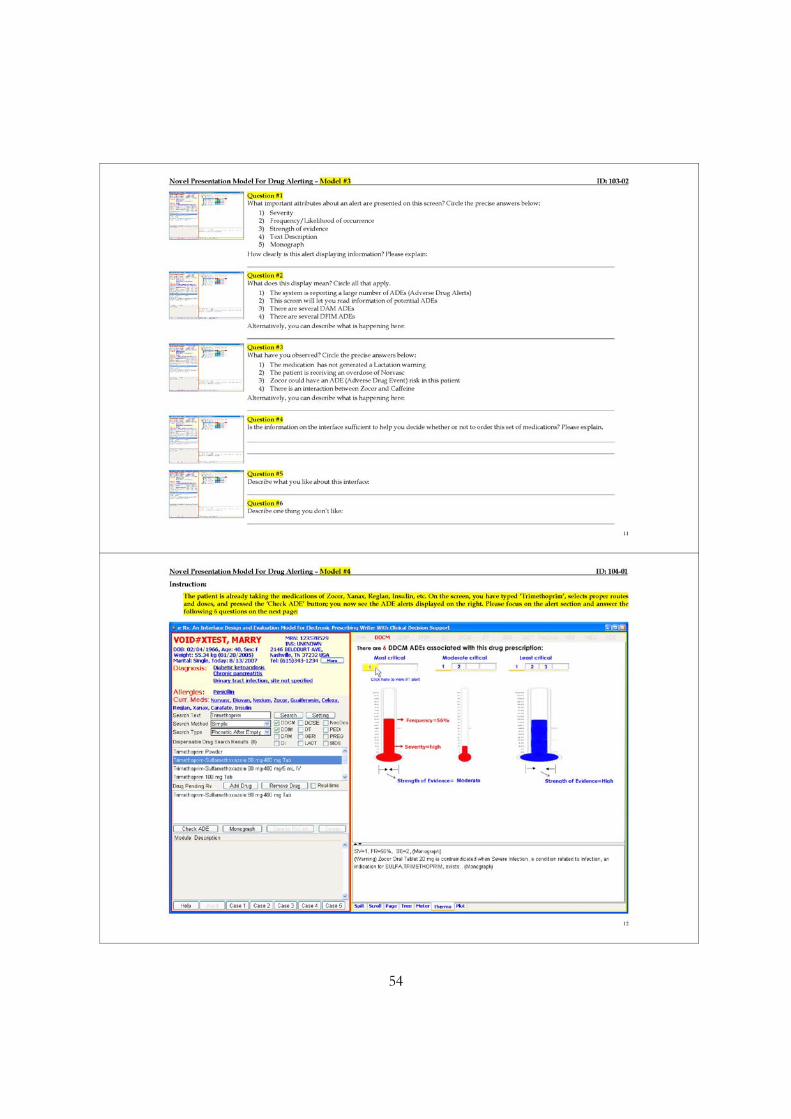
54
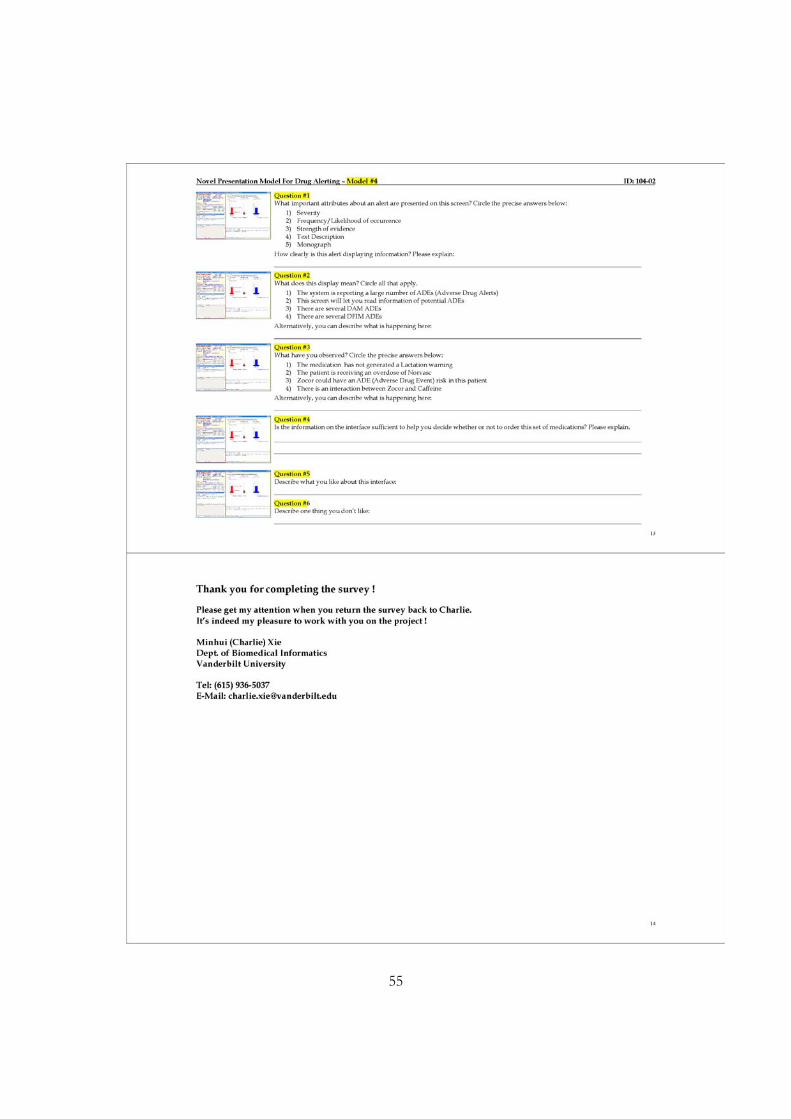
55
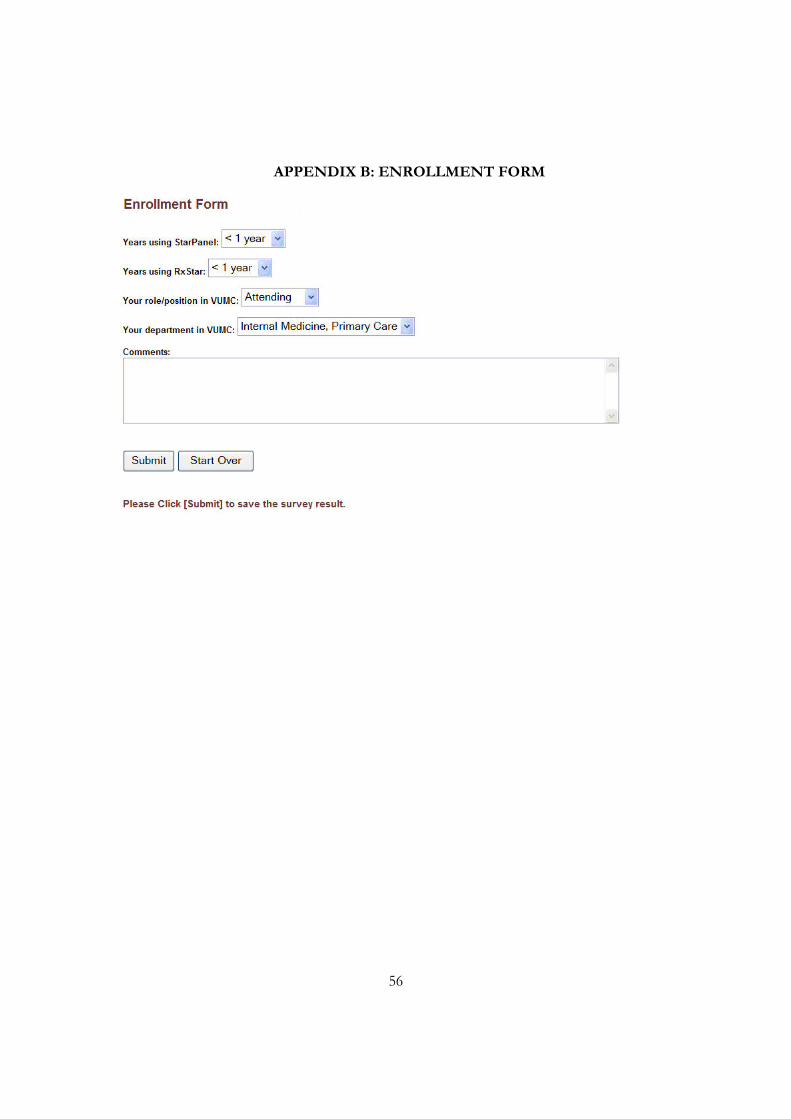
56
APPENDIX B: ENROLLMENT FORM
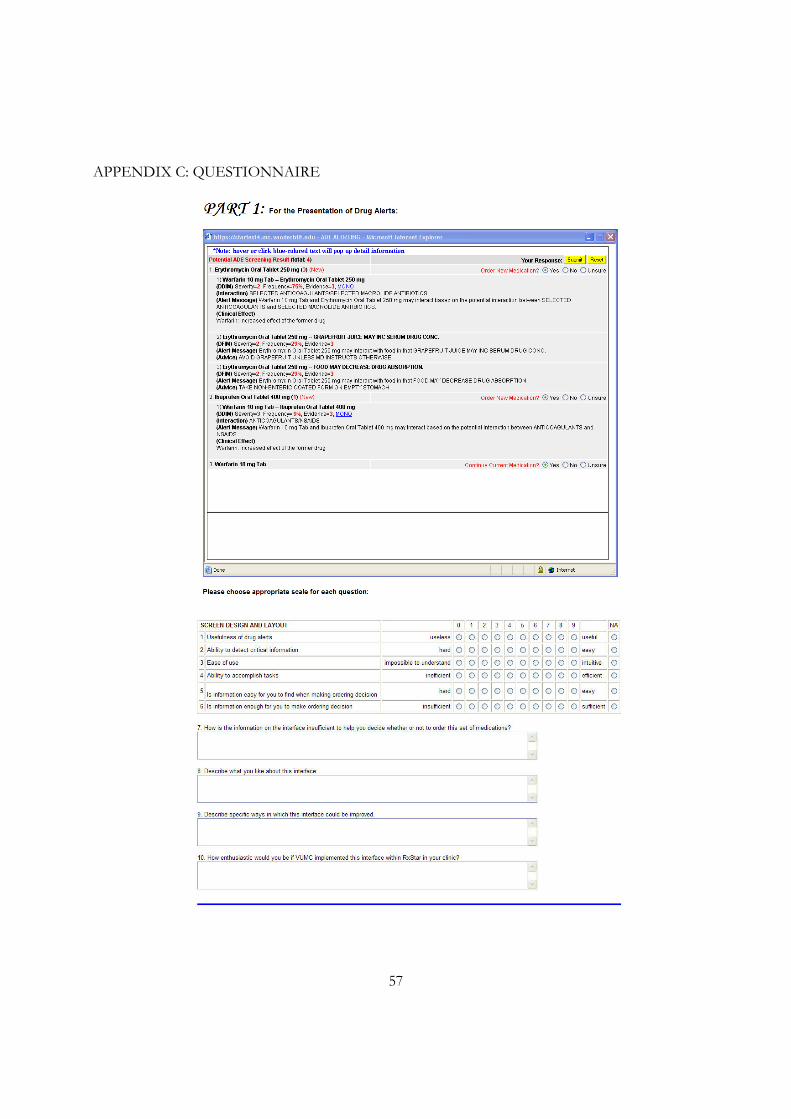
57
APPENDIX C: QUESTIONNAIRE
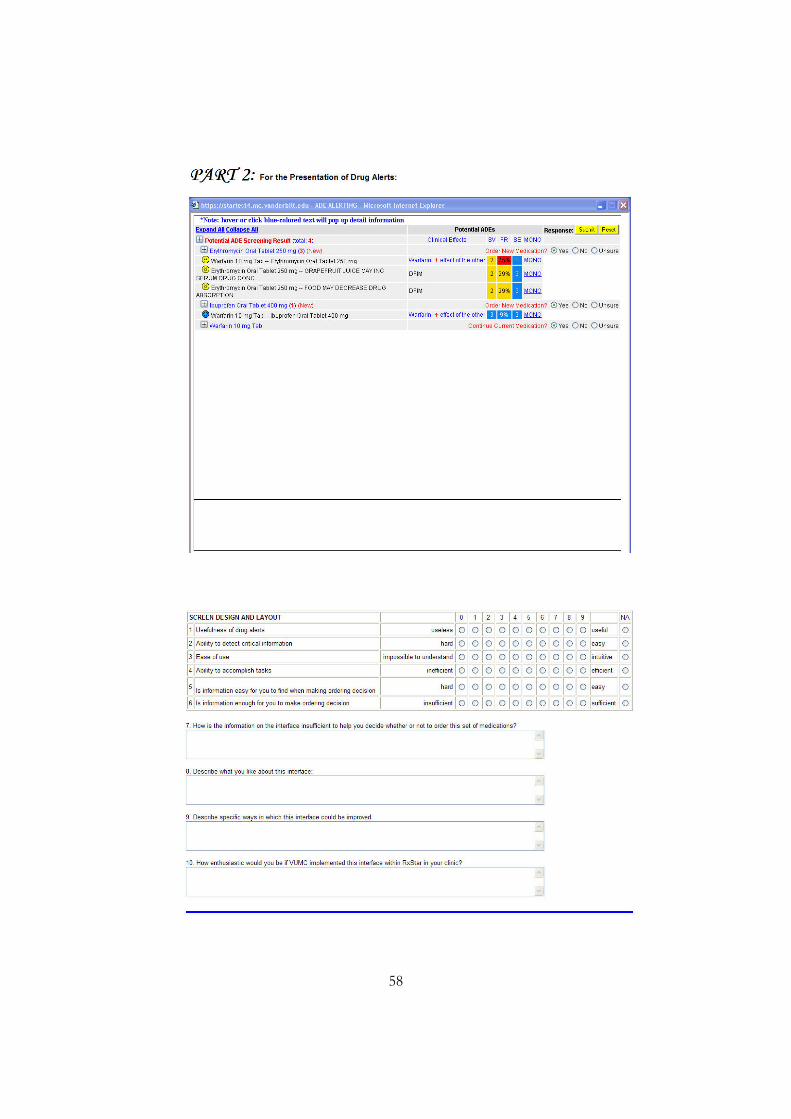
58
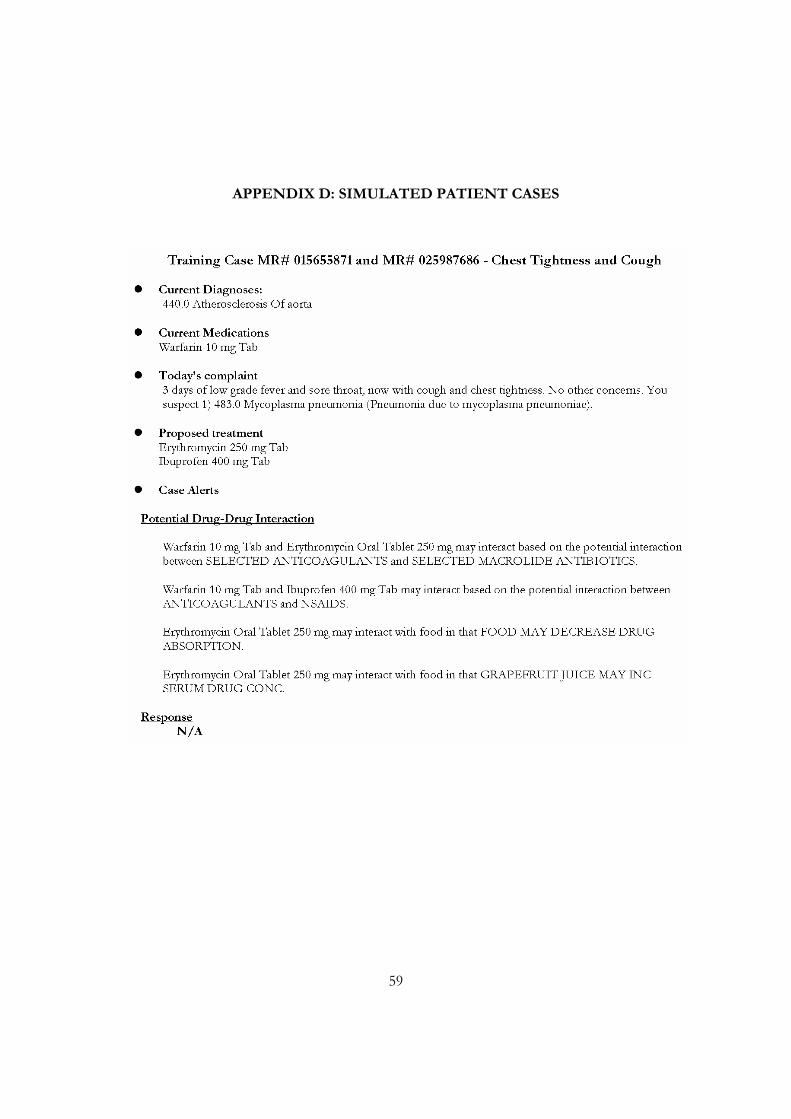
59
APPENDIX D: SIMULATED PATIENT CASES
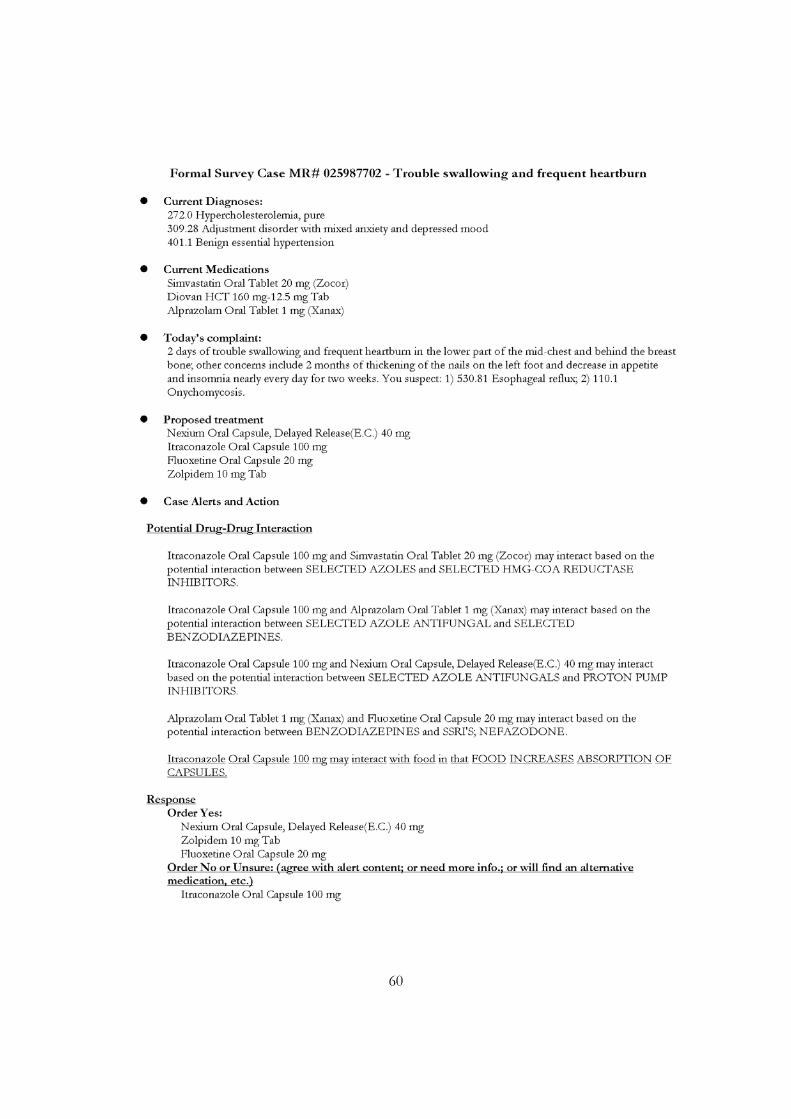
60
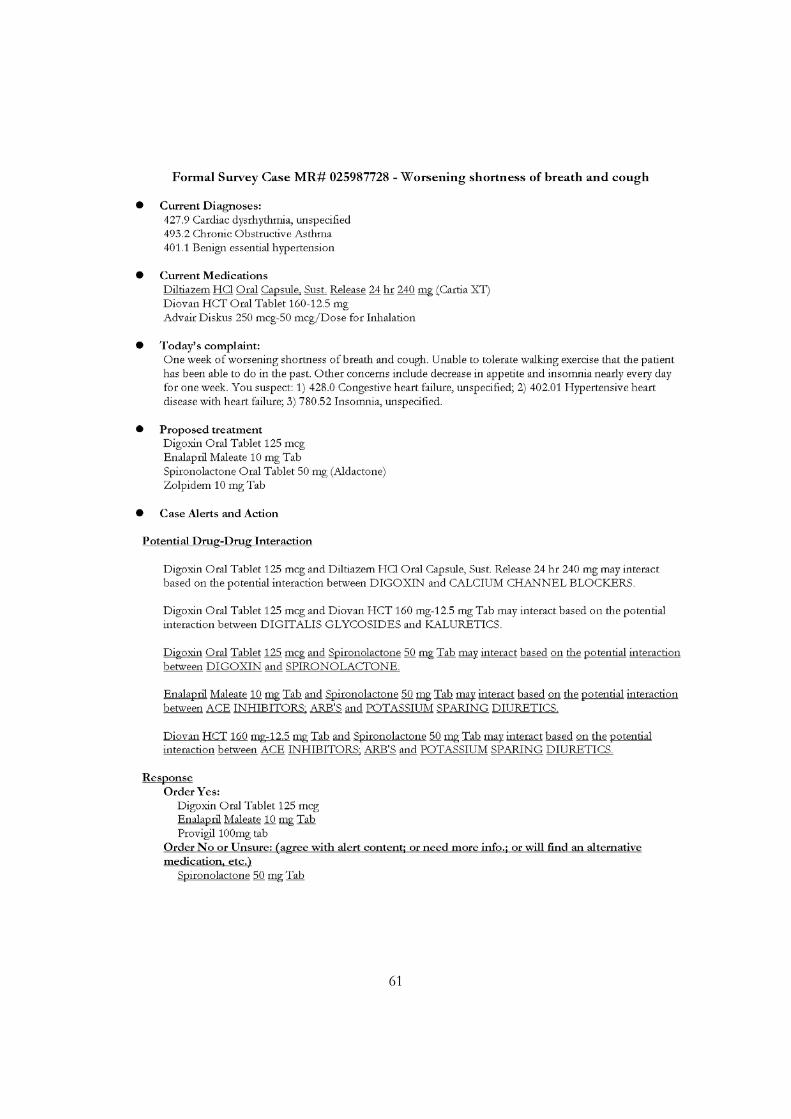
61
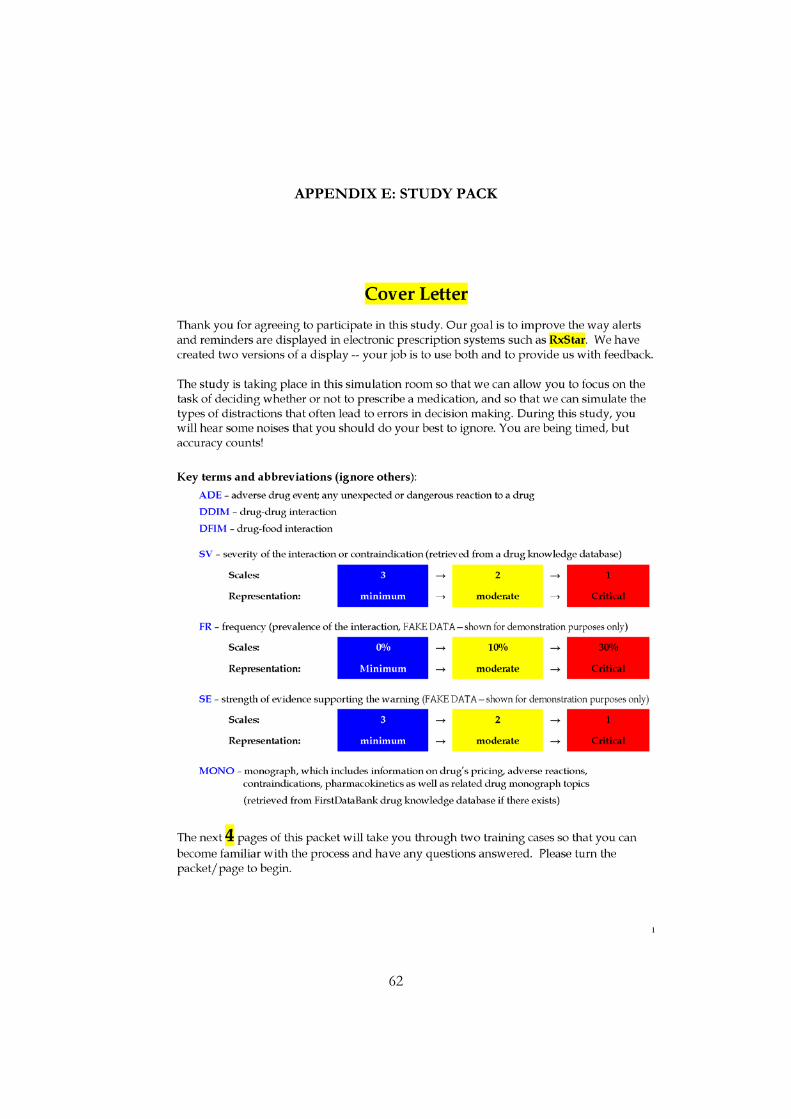
62
APPENDIX E: STUDY PACK
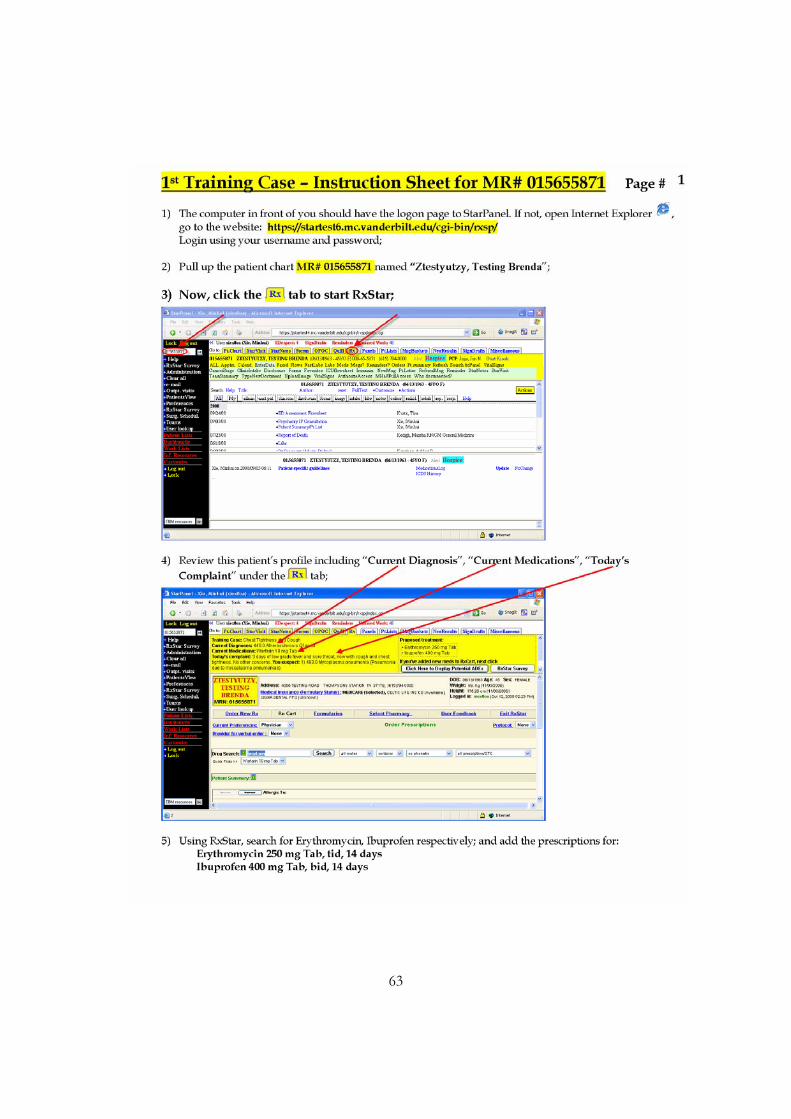
63
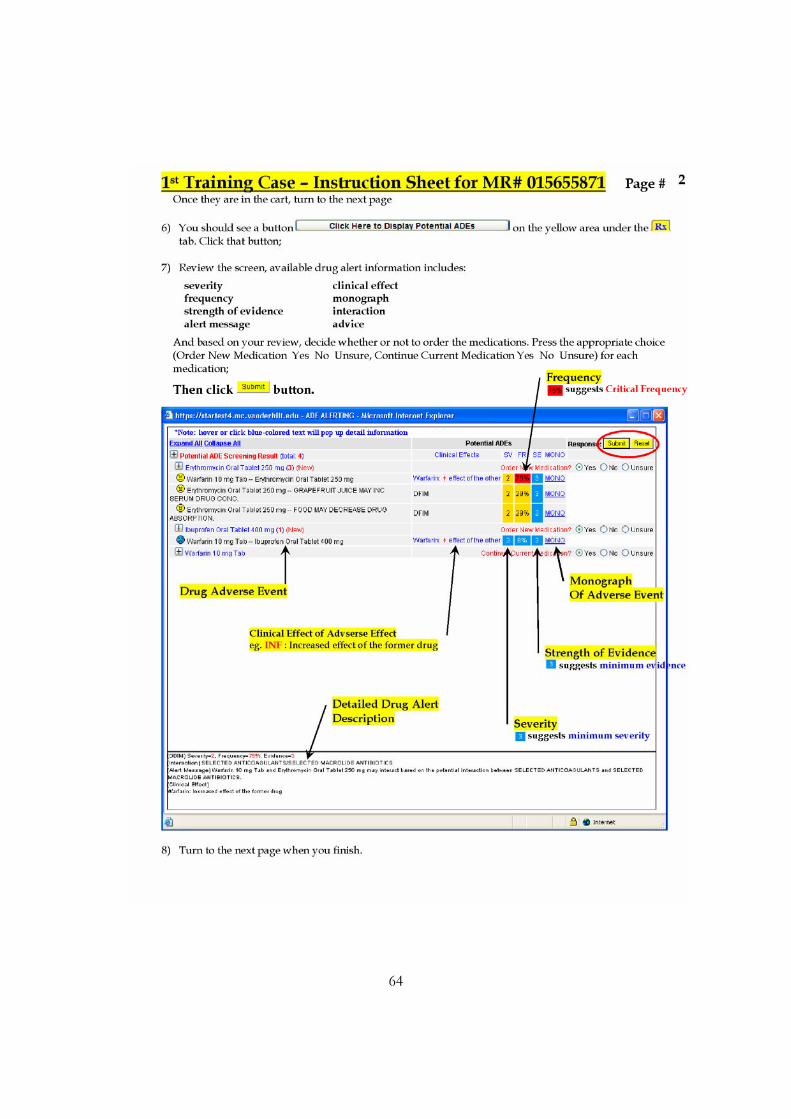
64
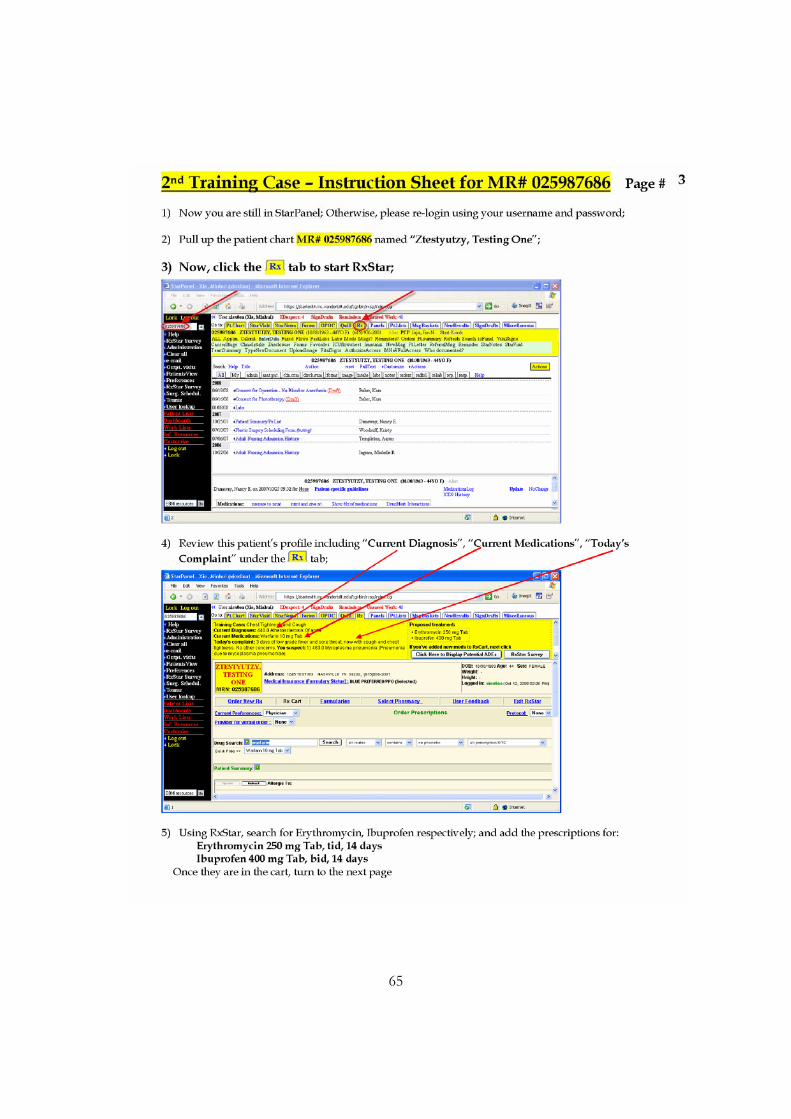
65
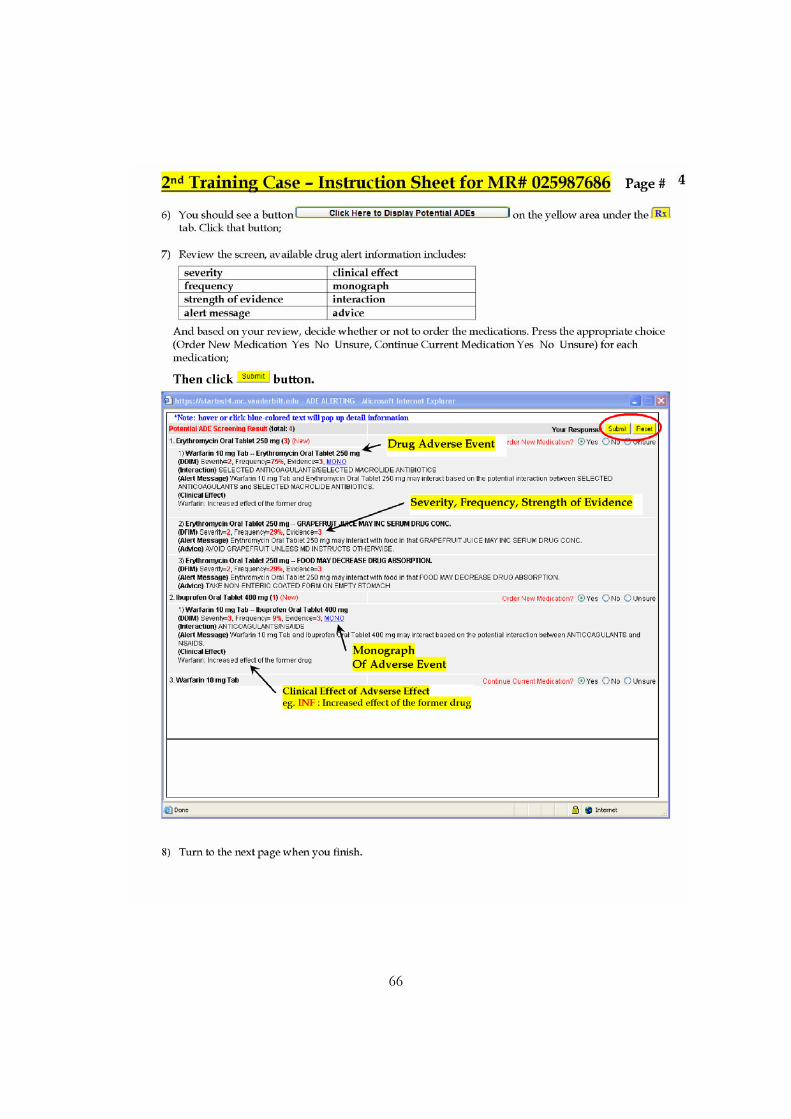
66
67
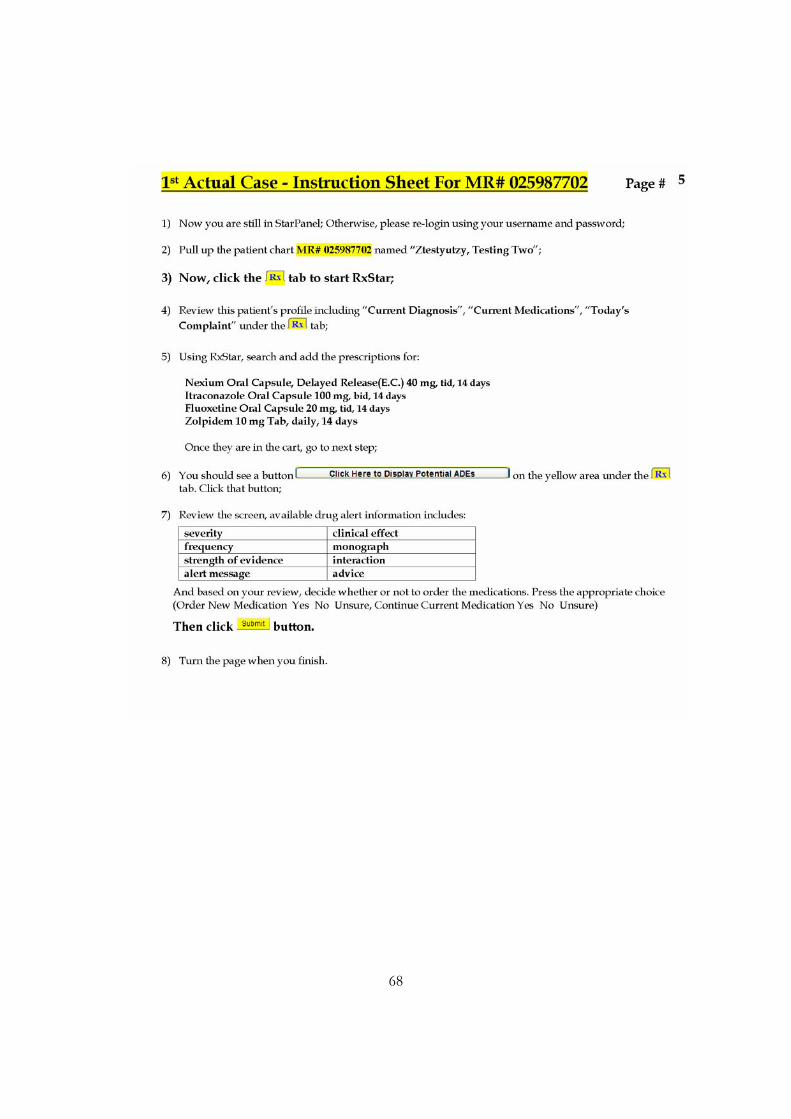
68
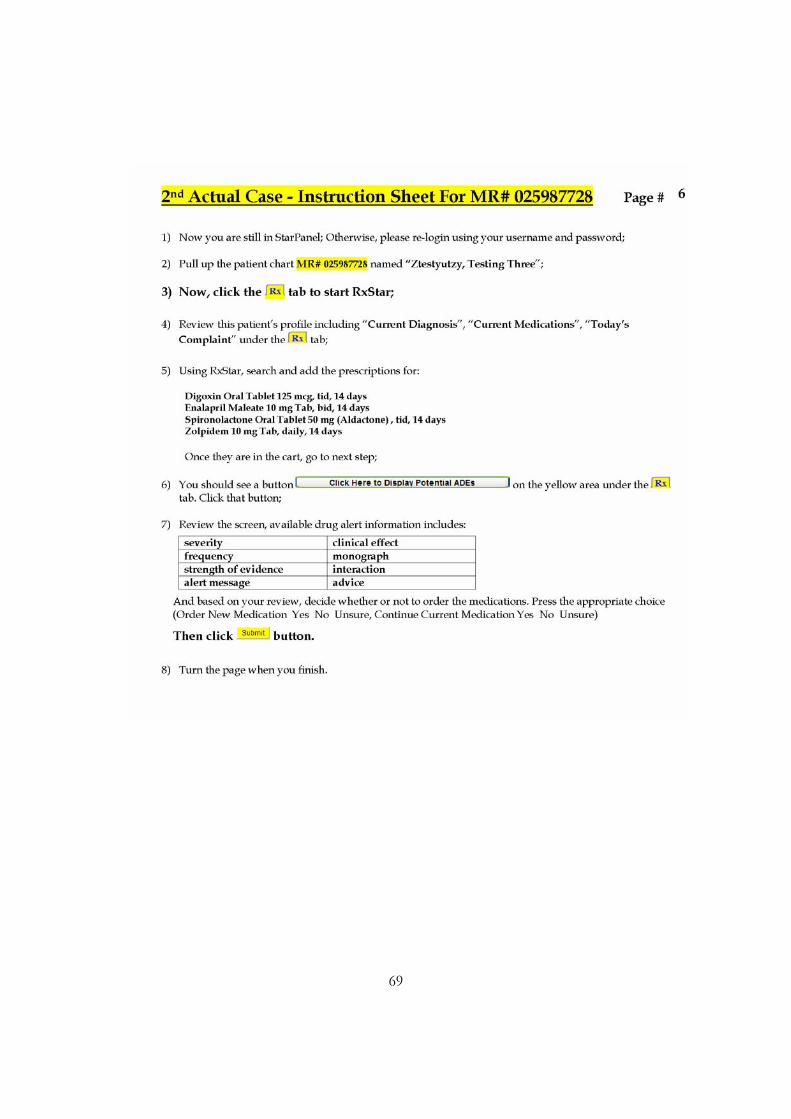
69
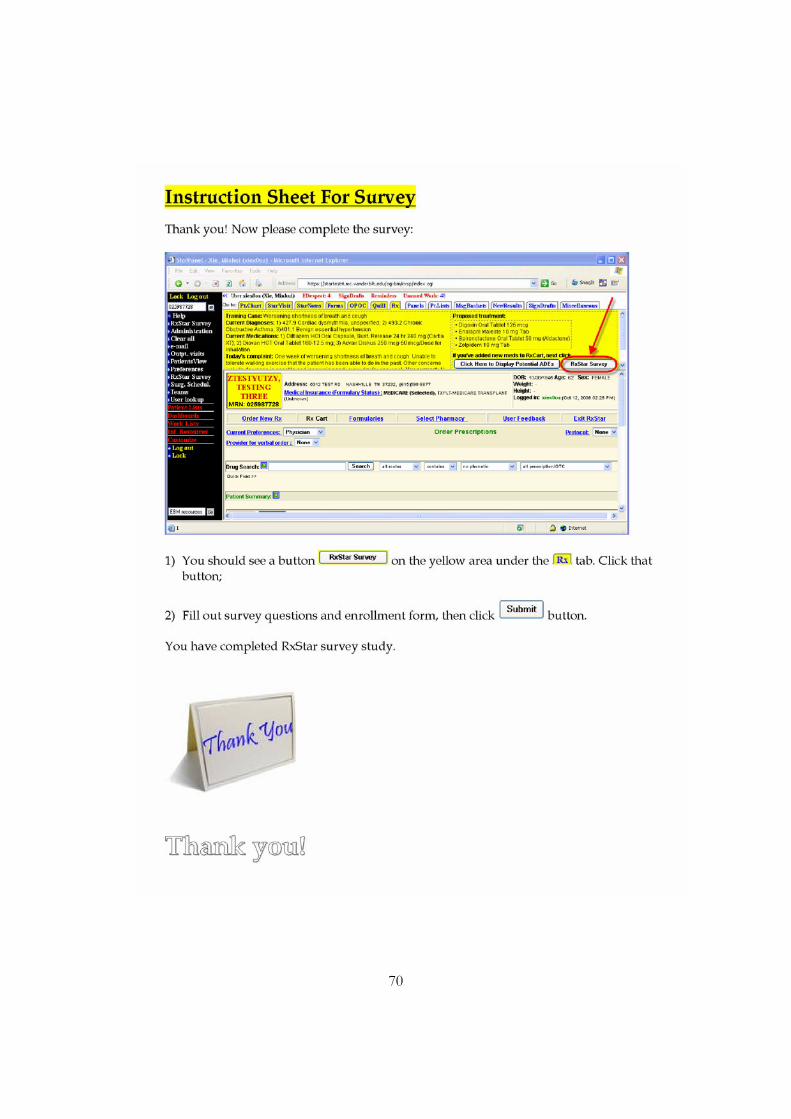
70
Related Documents