Applying ETKF in Stochastic Bioeconomic Model The Barents Sea Cod, Capelin, and Herring eVITA-EnKF meeting, May 2010 Sameh Gharib, [email protected]

Welcome message from author
This document is posted to help you gain knowledge. Please leave a comment to let me know what you think about it! Share it to your friends and learn new things together.
Transcript
Applying ETKF in Stochastic
Bioeconomic Model
The Barents Sea Cod, Capelin, and Herring
eVITA-EnKF meeting, May 2010
Sameh Gharib, [email protected]
eVITA-EnKF meeting, May 2010
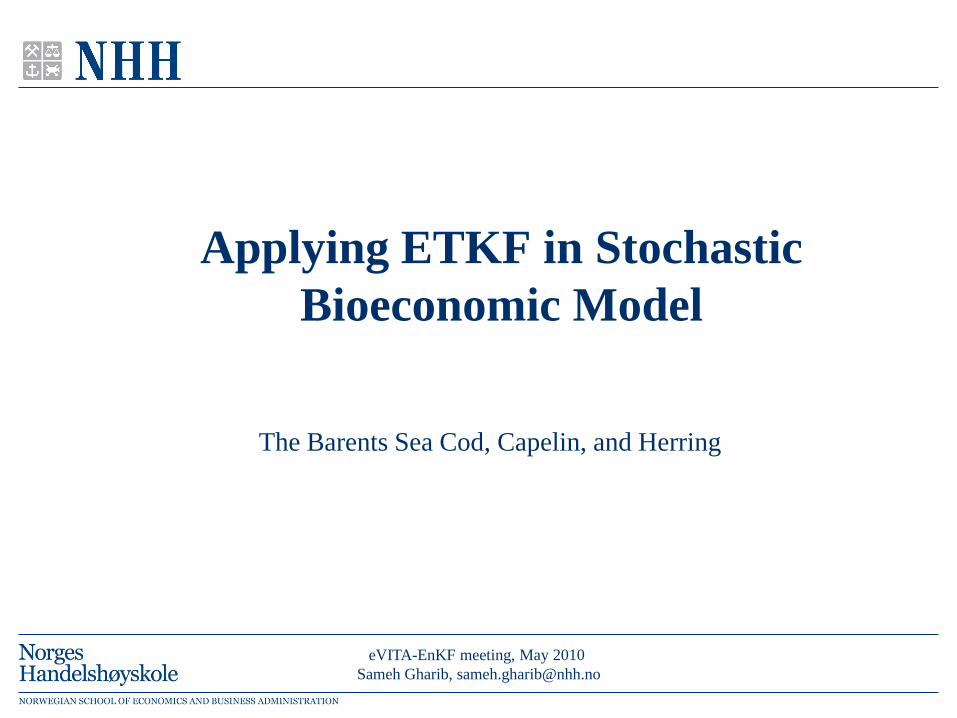
The Study Area
• North East Arctic (Area I and IIa)
• Source of data is ICES Data sets.
ICES: International Council for the Exploration of the Sea.
http://www.ices.dk/
2/1521.05.2010 Sameh Gharib, [email protected]

eVITA-EnKF meeting, May 2010
Fishery Industry
Fish stock and Harvest for Cod, Capelin, and Herring
3/1521.05.2010 Sameh Gharib, [email protected]
1. Find optimal TACs from the management model according to
the present stock sizes.
2. Set optimal TACs into the simulation model.
3. Simulate next year stock sizes in accordance with the TACs.
4. Start again from point 1 with new stock sizes as starting point.

eVITA-EnKF meeting, May 2010
Working Plan
• Two bioeconomic models:
– Single species (1D model : NEAC)
– Multispecies (3D model: Cod, Capelin and Herring)
• Two techniques:
– VAM (used for 1D model).
– ETKF (1D stochastic model, Multispecies Model)
– EnKS.
• Working Papers:
– Paper 1: A comparison between the VAM and EnKF in 1D bioeconomic models.
– Paper 2: Applying ETKF for stochastic biomass models.
– Paper 3: EnKS for 3D multispecies model.
4/1521.05.2010 Sameh Gharib, [email protected]

eVITA-EnKF meeting, May 2010
The population dynamics are described by:
…….. (1)
where x is the biomass and y is the harvest.
The logistic growth function f takes the form:
..…… (2)
where r is the intrinsic growth rate and K is the carrying capacity.
Let p be the unit price of fish and c be a proportionality constant,
then the average net revenue is given by:
……… (3)
the relationship between the rate of change of fish biomass, y, and the function
is given by:
……….(4)
where is an adjustment parameter, and therefore,
we get the system of equations:
……… (5)
where the term is the annual total profit (total revenues - total costs).
yxfdtdx )(/
)/1()( Kxrxxf
yxcpyx )/(),(
/ ( , )dy dt y x y
)/(/
)/1(/
xcpydtdy
yKxxrdtdx
),( yx
)/( xcpy
1-D Bioeconomic Model (Cod) – logistic model
5/1521.05.2010 Sameh Gharib, [email protected]
eVITA-EnKF meeting, May 2010
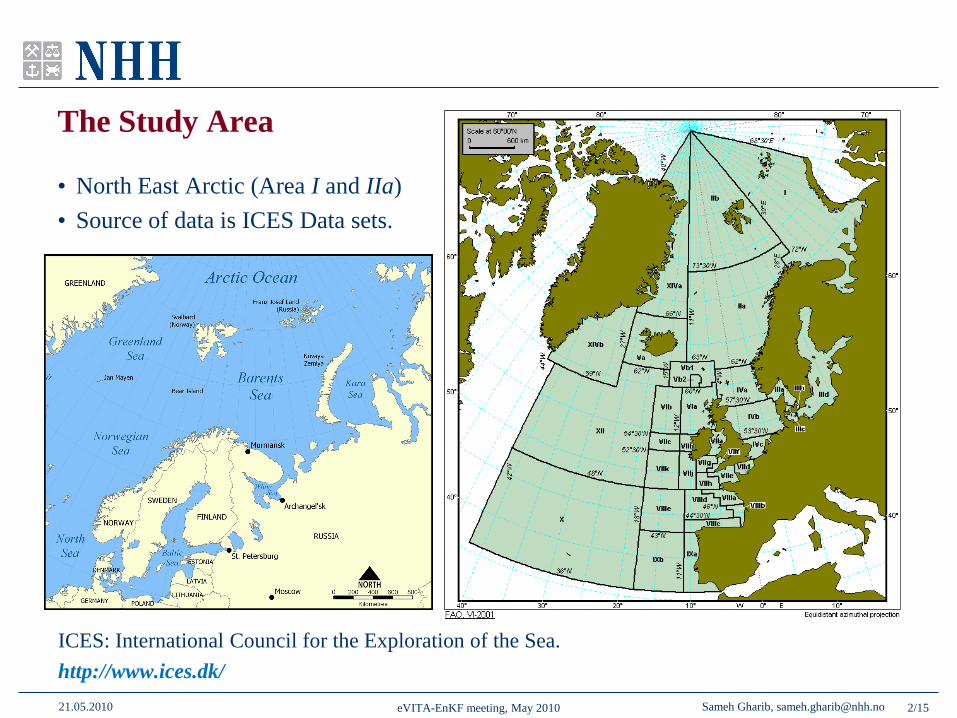
ETKF Results for 1D model – logistic model
Cod Stock (x)
Growth rate (r)
Cod Harvest (h)
Carrying Capacity (K)

eVITA-EnKF meeting, May 2010
1-D Bioeconomic Model (Cod) – Stochastic model
7/1521.05.2010 Sameh Gharib, [email protected]
eVITA-EnKF meeting, May 2010
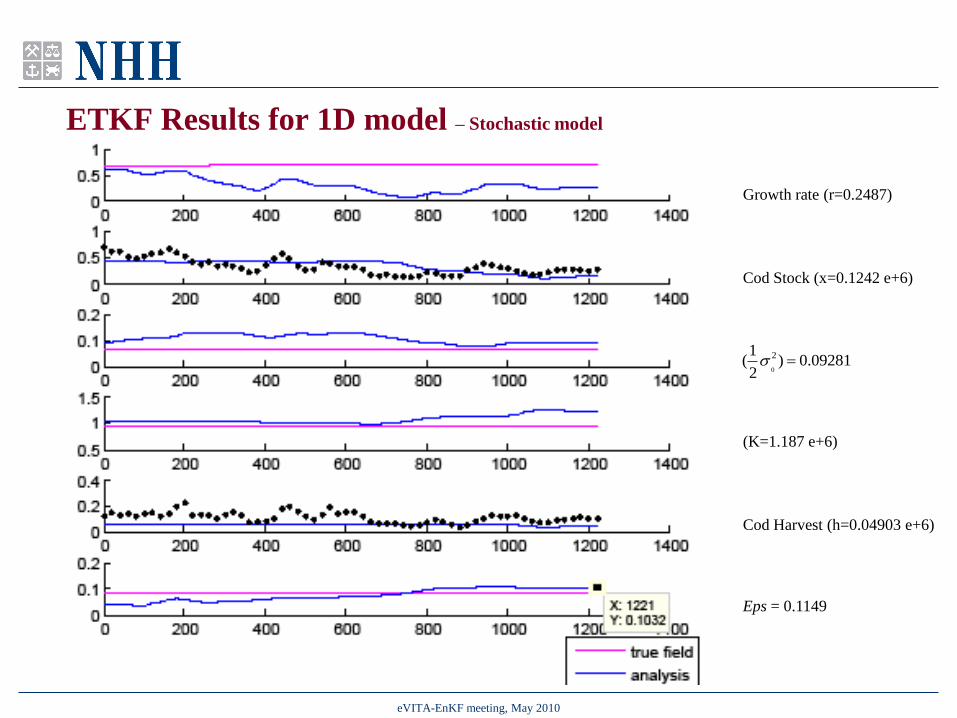
ETKF Results for 1D model – Stochastic model
Cod Stock (x=0.1242 e+6)
Growth rate (r=0.2487)
Cod Harvest (h=0.04903 e+6)
(K=1.187 e+6)
Eps = 0.1149
0
21( ) 0.092812
eVITA-EnKF meeting, May 2010 9/1521.05.2010 Sameh Gharib, [email protected]
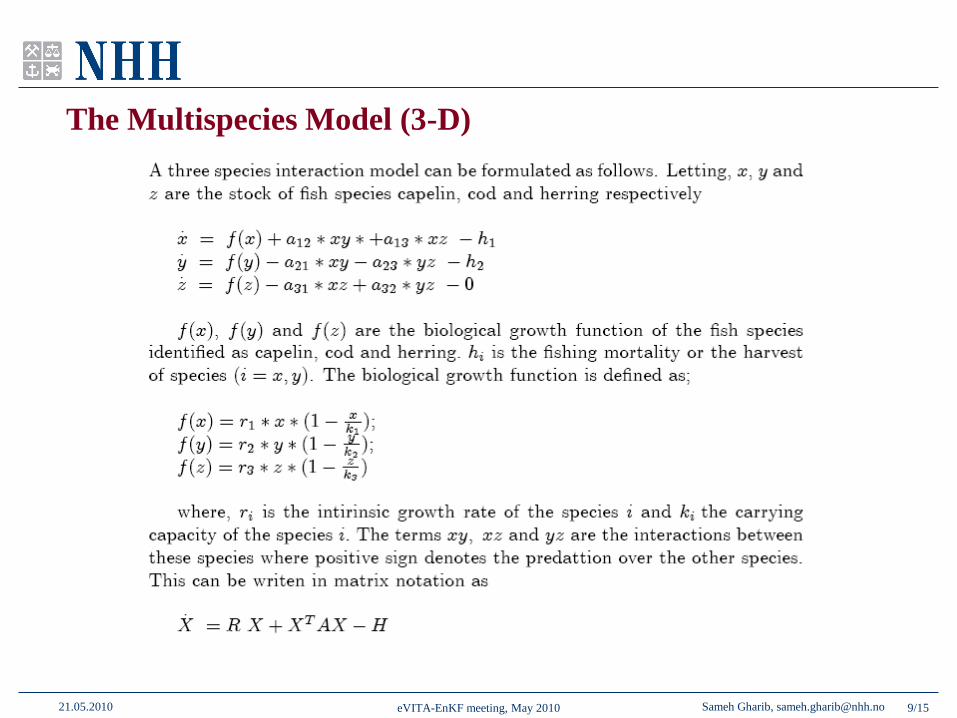
The Multispecies Model (3-D)
eVITA-EnKF meeting, May 2010
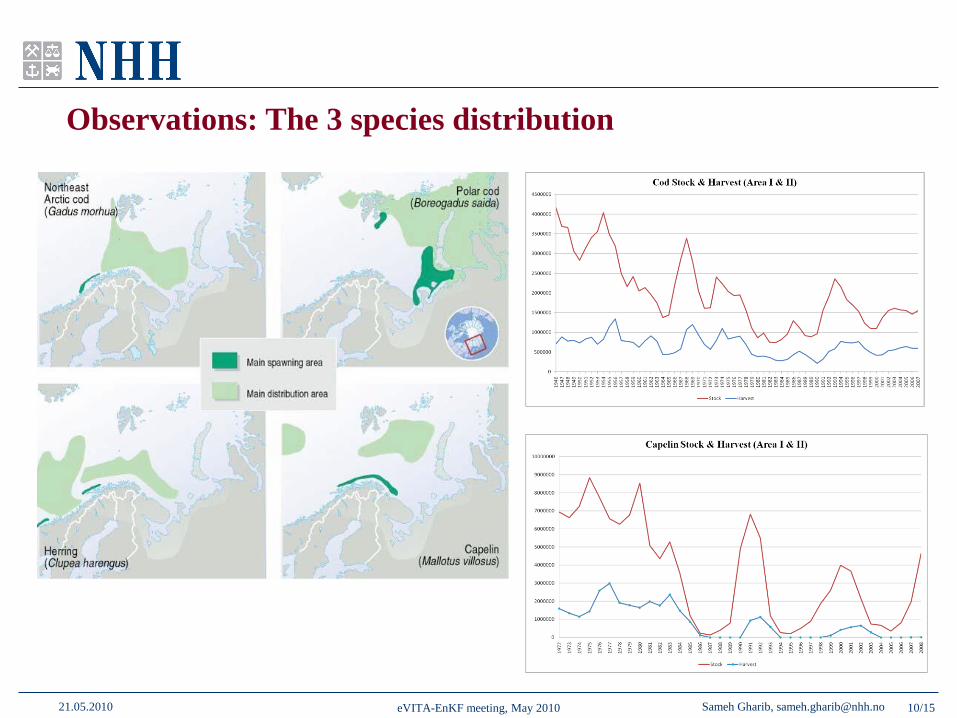
Observations: The 3 species distribution
10/1521.05.2010 Sameh Gharib, [email protected]

eVITA-EnKF meeting, May 2010
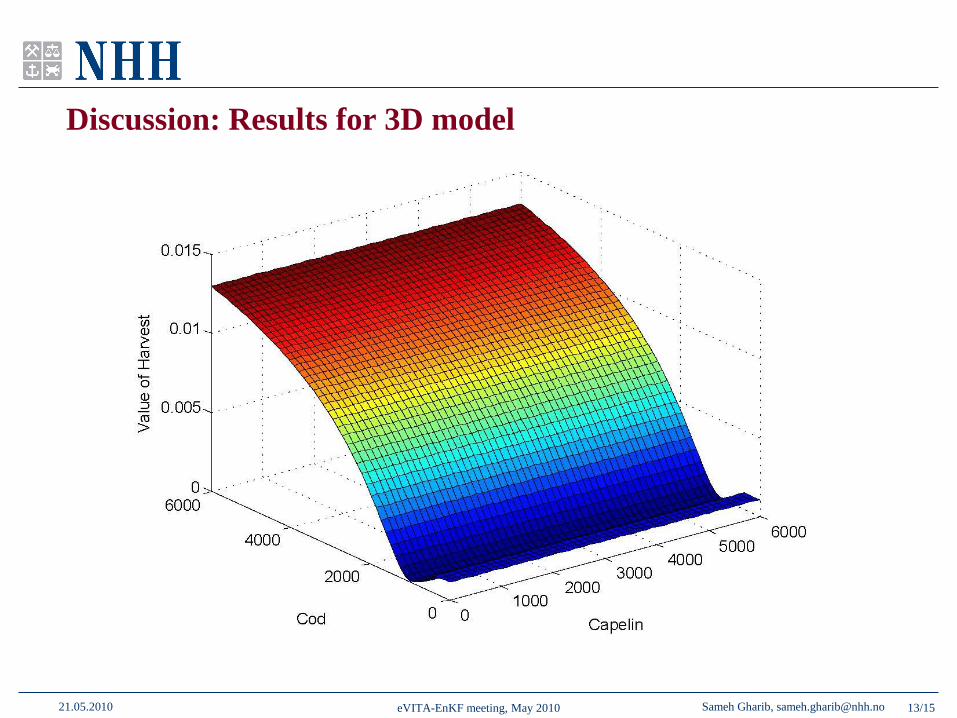
Discussion: Results for 3D model
12/1521.05.2010 Sameh Gharib, [email protected]
eVITA-EnKF meeting, May 2010
Discussion: Results for 3D model
13/1521.05.2010 Sameh Gharib, [email protected]

eVITA-EnKF meeting, May 2010
Oral Communications:
• Data Assimilation Techniques and Inverse Methods, NHH Annual meeting ,
10-12 March 2010, Geilo, Norway.
• Applying Data Assimilation in Bioeconomics Management: A case study of North
East Arctic Cod Stock, Invited talk at ”The First meeting of BMAME Project”
4 March 2010, NHH, Bergen, Norway.
14/1521.05.2010 Sameh Gharib, [email protected]

eVITA-EnKF meeting, May 2010
3-D model
Stock biomasses are given by the vector x = [x1, x2, x3] and harvest by u = [u1, u2, u3], where the
indexes 1, 2 and 3 represent Capelin, Cod and Herring respectively. The growth functions are:
Notice that the growth of herring is somewhat different from that of capelin and cod. Whereas r1
and r2 represent intrinsic growth-rate of respectively capelin and herring, the interpretation of ˜r3 is
more moot, as it also represents positive inflow of biomass when the stock-size is zero. In fact
This reflects the positive inflow of herring from the Norwegian Sea to the Barents Sea, which in this
model only depends on year class 1-3.
16/1521.05.2010 Sameh Gharib, [email protected]
For Capelin, Cod and Herring :
Related Documents