Full Terms & Conditions of access and use can be found at https://www.tandfonline.com/action/journalInformation?journalCode=tiap20 Impact Assessment and Project Appraisal ISSN: 1461-5517 (Print) 1471-5465 (Online) Journal homepage: https://www.tandfonline.com/loi/tiap20 Applying a cost-benefit analysis model to the Three Gorges project in China Dr. Risako Morimoto & Dr. Chris Hope To cite this article: Dr. Risako Morimoto & Dr. Chris Hope (2004) Applying a cost-benefit analysis model to the Three Gorges project in China, Impact Assessment and Project Appraisal, 22:3, 205-220, DOI: 10.3152/147154604781765888 To link to this article: https://doi.org/10.3152/147154604781765888 Published online: 20 Feb 2012. Submit your article to this journal Article views: 4802 View related articles Citing articles: 3 View citing articles

Welcome message from author
This document is posted to help you gain knowledge. Please leave a comment to let me know what you think about it! Share it to your friends and learn new things together.
Transcript

Full Terms & Conditions of access and use can be found athttps://www.tandfonline.com/action/journalInformation?journalCode=tiap20
Impact Assessment and Project Appraisal
ISSN: 1461-5517 (Print) 1471-5465 (Online) Journal homepage: https://www.tandfonline.com/loi/tiap20
Applying a cost-benefit analysis model to theThree Gorges project in China
Dr. Risako Morimoto & Dr. Chris Hope
To cite this article: Dr. Risako Morimoto & Dr. Chris Hope (2004) Applying a cost-benefit analysismodel to the Three Gorges project in China, Impact Assessment and Project Appraisal, 22:3,205-220, DOI: 10.3152/147154604781765888
To link to this article: https://doi.org/10.3152/147154604781765888
Published online: 20 Feb 2012.
Submit your article to this journal
Article views: 4802
View related articles
Citing articles: 3 View citing articles

Impact Assessment and Project Appraisal September 2004 1461-5517/04/030205-16 US$08.00 IAIA 2004 205
Impact Assessment and Project Appraisal, volume 22, number 3, September 2004, pages 205–220, Beech Tree Publishing, 10 Watford Close, Guildford, Surrey GU1 2EP, UK
Probabilistic CBA
Applying a cost–benefit analysis model to the Three Gorges project in China
Risako Morimoto and Chris Hope
The world’s largest hydro project is now under
construction in China. It is controversial as large
environmental and social impacts are anticipated, although it is supposed to control the region’s se-vere floods, to generate 18.2 GW of hydropower,
and to improve river navigation. This study em-ploys a quantitative approach to bring the major
economic, environmental and social impacts of
this massive project together. This comprehensive
probabilistic cost–benefit analysis (CBA) model
takes into account the project uncertainty, and its
empirical application tries to deliver more robust
and justifiable results than those produced by the
more usual deterministic CBAs or multi-criteria
analyses. This allows the distribution of the net
present value to be calculated, and the most sig-nificant impacts to be identified. The mean and the
95th percentile of the cumulative net present value
at a 5% discount rate estimated by the model will be
positive, while the 5th percentile will be negative.
Keywords: CBA; China; dam; energy; sustainable development
Dr Risako Morimoto is a research associate, and Dr Chris Hope a senior lecturer in operational research, Judge Institute of Management, University of Cambridge, Trumpington Street, Cambridge, CB2 1AG, UK; Tel: + 44 1223 339700; Fax: + 44 1223 339701; E-mail: [email protected].
The authors would like to thank Mr Tang Jie (World Bank) and the staff from China Three Gorges Project Corporation (CTGPC) who provided us with some useful data and informa-tion as well as arranging the tour of the dam site and the visit to the research institute of Yangtze sturgeon. Apart from this, all data and information have been obtained from our own inde-pendent study.
HE MOST ENVIRONMENTALLY contro-versial project in China today is the construc-tion of the world’s largest dam, the Three
Gorges project (TGP) on the Yangtze River in western Hubei province. It is currently under con-struction and is expected to be completed in 2009. This large-scale project involves about 20,000 work-ers of whom 40% are women, according to the China Yangtze Three Gorges Project Development Corporation (CTGPC). The dam site is surrounded by scenic landscape with beautiful gorges and many important cultural heritage sites. The area to be submerged is fertile and densely populated.
There are numerous studies on the economic, environmental and social impacts of this gigantic project. The Canadian Yangtze Joint Venture pub-lished its feasibility report in 1988; CTGPC also published a full environmental impact assessment in 1995; Qigang (1998) surveyed affected people using questionnaires and follow-up interviews to examine people’s awareness and their expectation of changes in their life after this massive scale of resettlement (see also Guojie, 1998; Ren, 1998); Qing (1998b) in-terviewed the director of the National History Mu-seum of China to investigate the present situation of archaeological sites around the dam site and the budget for preservation work (see also Childs-Johnson and Sullivan, 1998). Hui (1993) studied wa-ter pollution in the reservoir area, as there are many factories along the river; Leopold (1996) examined the effects of reservoir sedimentation problems; Bing (1998) considered the possibility of the Three Gorges dam being a target for military attack based on past experiences around the world.
There are so many studies that it is difficult to cover them all, but those listed above are the major
T
Probabilistic CBA
206 Impact Assessment and Project Appraisal September 2004
ones. This research assesses the project again using a different approach from the previous studies. It em-ploys a quantitative approach to bring the major economic, environmental and social impacts to-gether. The model has been adapted and developed from that used for Sri Lanka in a previous paper (Morimoto and Hope, 2004).
This comprehensive probabilistic cost–benefit analysis (CBA) model takes into account the project uncertainty, and its empirical application tries to give more robust and justifiable results than the ones that a more usual deterministic CBA or multi-criteria analysis (MCA) produce.
The next section discusses the main issues of the TGP, followed by a detailed explanation on method-ology and the presentation of the results including a full sensitivity analysis. The probabilistic analysis allows the distribution of the net present value (NPV) to be calculated, and the most influential im-pacts to be identified. The final section concludes the study by considering the significance of the results.
Three Gorges project
China’s rapid economic growth has resulted in both dramatic improvements in living standards and seri-ous damage to its environment. About 80% of elec-tricity in China is generated by thermal means (more than 70% is coal; the rest is gas and crude oil), 19% is hydro and 1% nuclear (Zeng and Song, 1998).1 Such a high dominance of coal use in China creates serious environmental problems, such as air, land and water pollution.2 . Burning coal produces green-house gases, and the emission levels of CO2 in China are increasing continuously.
According to Chinese officials, electricity supply would have to increase by 20–30% to eliminate pre-sent power shortages; the economic cost of these power shortages is very high (Wu and Li, 1995). The installed hydro capacity in China is less than 15% of its exploitable potential (Zeng and Song, 1998). The Chinese Government is intending to obtain 40% of its power from clean hydroelectric sources3 (WCD, 2000b).
As a result of an economic slow down and demand reductions from closures of inefficient state-owned industrial units, China’s electric power industry experienced oversupply in 1998–1999 (EIA, 2001). However, this was only a short-term event and growth in electricity consumption is pro-jected at 5.5% per year until 2020 (EIA, 2001).
More electricity is required to boost the economy, including still underdeveloped regions, to meet ex-pected future economic growth, and to meet future increases in household electricity consumption as a result of increased use of electric appliances result-ing from improvements in standard of living. Cur-rently, the electricity transmission capacity is limited. However, once this distribution problem is
solved, a huge increase in electricity consumption in remote areas will be expected.4
History of the dam
Dr Sun Yat-Sen, the forerunner of China’s democratic reform, first proposed to dam the Three Gorges in 1919. The plan of the project has been interrupted over the years by war, the Cultural Revolution, eco-nomic troubles and other events. In 1989, the 70m high Gazhouba Dam (40km downstream of the TGP) opened, after nearly 20 years of construction, in response to the increasing demand for electric power in the region. In August 1996, two major pro-jects to improve transportation in the Three Gorges area, the Xiling Bridge and the airport, were also completed and went into service.
Construction of the TGP is divided into three stages. The river was blocked at the end of Stage I (1993–1997), then the hydro power station started operating at the end of Stage II (1998–2003), and the project will be completed at the end of Stage III (2004–2009). Appendix IV presents photographs of the progress and impacts of the Three Gorges project.
Benefits of the dam
The current dam is intended to provide one tenth of China’s existing energy needs, to raise flood control capacity from the present ten-year frequency to 100-year frequency, and to improve navigation along the river (CTGPC, 1995).5 To generate the same amount of electricity, 50 million tons per year of coal, 25 million tons per year of crude oil or 18 nuclear-power plants would be required (Thurston, 1996).
The Yangtze River has produced some of China’s worst natural flood disasters. For example, in 1954, 30,000 people were killed (Fung, 1999). In Hubei province alone, the 1998 flood resulted in total eco-nomic losses of US$3.6 billion. Agricultural produc-tion in this region accounts for about 22% of gross domestic product (GDP) and the flood inundated about 1.7 million hectares of crops (Saywell, 1998). Thus, avoiding these losses must also be taken into consideration in the creation of a realistic model of the project.
Negative impacts associated with the dam
Opposition around the world continues to argue that the project will be a social and environmental disas-ter, having seen the tragedies of large dams else-where in the world (for instance, Aswan High dam in Egypt) (Barlow, 1999). One of the major concerns is that the dam would affect a massive area of this densely populated region. The world’s third largest river, the Yangtze, carves its route through the
Probabilistic CBA
Impact Assessment and Project Appraisal September 2004 207
mountains of southwestern China, springing from the glacial mountains of northern Tibet. It heads North East to surge through a spectacular 200km stretch of deep, narrow canyons known collectively as the Three Gorges. From there, the river widens and meanders across southern China’s vast fertile plains to the East China Sea at Shanghai.
The Yangtze River valley is China’s agricultural and industrial heartland. It presently supports one third of the country’s population, produces 40% of the nation’s grain, 70% of its rice, and 40% of China’s total industrial output (Morrish, 1997). The project would displace about 1.98 million people, submerge 100,000 hectares of this fertile farmland, 13 cities, 160 towns, 1,352 villages, 1,500 factories
(see Topping, 1996; Goldstein, 1998; Ren, 1998; Childs-Johnson and Sullivan, 1998; Caufield, 1997).
There is also a possibility of dam failures and earthquake (Thurston, 1996).6 Large dams can be a prime military target; as was seen in the case of Ka-jaki dam in southern Afghanistan being bombed by the American air force on the 1 November 2001.
Biodiversity is also a great concern. The river possesses 300 species of fish (of which one third are endemic) and its annual aquatic production output accounts for 50% of the whole nation’s gross output (CTGPC, 1995). However, there is a fear of depriv-ing downstream fisheries as a result of a decline in water quality after constructing the dam (Thirston, 1996; ASCE, 1997). The change in habitat may benefit some species but most likely adversely affect others given that different fish species have often quite specific ecological niches (CTGPC, 1995).
According to Topping (1996), there are over 3000 factories and mines in the reservoir area; they cur-rently produce 10 billion tons of waste annually con-taining 50 different toxins. Topping (1996) argues that, if we assume the waste-water level remains unchanged, the waste content will increase 11 times in some areas because of the dam.
The reservoir area is a great tourist attraction, with its scenic natural landscapes as well as cultural relics and heritage, all carrying a high aesthetic value. The cultural value of the area is also significant. About
12,000 cultural antiquities and 16 archaeological sites will be submerged as a result of the project (Ren, 1998). Construction of the dam will also result in the destruction of an important link in under-standing the birth and early development of China’s ancient civilization. Only a limited number of ar-chaeological remains can be removed or replicated for posterity because of lack of time and funds (CTGPC, 1995).
Finally, there is a risk associated with the genera-tion capability of the dam. The water of the Yangtze River carries the fifth largest sediment discharge in the world, most of which is conveyed during floods.7 The Three Gorges area has been intensively culti-vated so that soil erosion has become a very serious problem because of a loss of a forest cover (CTGPC, 1995). Sedimentation problems are likely to reduce power generation capacity.8
CBA model
There are several project evaluation methods to choose from, each of which has different characteris-tics. CBA is a project-based approach focusing on net benefits. The most fundamental task of analysis is to define alternative options and quantify their impacts on the objectives established for national energy planning (Munasinghe and Meier, 1993). MCA evaluates multiple objectives simultaneously, which can provide decision-makers with additional information to NPV. Least cost analysis focuses on the entire power system and seeks to minimize total system costs.
Hydropower projects generally involve streams of costs and benefits that span many years. Calculating NPV is a relatively easy way to examine the profit-ability of the project, and it provides policy makers with useful information for their decision-making process. However, in reality, often only certain engineering or economic costs and benefits are in-cluded in the analysis.
Hence, this paper focuses on the widely used CBA analysis in a broader context, trying to in-corporate environmental and social issues into the economic analysis. The model is aimed to lie some-where in between the highly practical MCA (see for example, Hope and Palmer, 2001) and the highly theoretical CBA (for example, those described in text books on CBA, such as Zeerbe and Dively (1994), Layard and Glaister (1994), Brent (1996), Boardman et al (2001)), with the aim of giving ro-bust and highly justifiable results.
This paper presents a CBA model slightly modi-fied from the one applied to Sri Lanka in Morimoto and Hope (2004).9 It is expanded from the previous form by adding some extra variables to cover the differences in the projects. The new model is applied to China’s massive Three Gorges dam. The TGP is selected in this paper, as this is currently the dominant option, which is supposed to produce the
The project would displace huge numbers of people and submerge vast areas of fertile farmland; sabotage and earthquake are possible; water quality will probably deteriorate, affecting fisheries; a great tourist attraction and antiquities will be lost; sedimentation is likely to reduce power generation
Probabilistic CBA
208 Impact Assessment and Project Appraisal September 2004
greatest benefit, and indeed it is already under con-struction. The second dominant alternative scheme is to build a thermal power station. This is justifiable, as about 80% of electricity in China is currently generated by thermal (Zeng and Song, 1998).
Other possible alternative schemes are: building a series of dams that generate equivalent amounts of electricity in the less populated upper reach area that has more active water volume whose construction is technically less challenging than the TGP; simply not building a dam; and building nuclear power plants (Fang et al, 1988). The costs and benefits are calculated by determining what might have happened in the absence of the project under construction.
The basic specification of the model is given in Morimoto and Hope (2004). The new equations are described in Appendix I and some of the key equa-tions presented in Morimoto and Hope (2004) are presented in Appendix II.
Some key variables are: PG is non-environmental cost savings on incremental power; EG is a willing-ness-to-pay for incremental power; and CP is the cost of environmental damage saved as a result of building TGP instead of thermal plants. The vari-ables EG and CP are multiplied by the factor P and (1–P) respectively, where P is the proportion of time that alternative power generation is not available. This is because the clean power benefit (the variable CP) is obtained only when the alternative power generation is available, and EG is only obtained when the alternative generation is not available. This process avoids double counting.
The five new variables added to the model are shown in Table 1: NI (navigation improvement); FC
(flood control benefit); FI (negative impact on downstream fishery); DE (mitigation cost of down-stream water pollution) and AS (value of lost archaeological sites10). The evaluation method of CP (clean power) is also slightly modified to use China-specific data, estimated by the Battelle Me-morial Institute, for externality costs for SO2 emis-sions based on a number of domestic studies and the marginal costs of CO2 mitigation. The size of the dam is massive, unlike the previous case study, therefore an expression of the possibility of dam col-lapse as a result of special circumstances (earth-quake, technical failures and being a military target) is also added to the evaluation of the variable AC (accident cost).
Descriptions of the main parameters in the model and their details are presented in Table 2 and 3 re-spectively. The rest of the parameters are found in Appendix III.
Some of the data used in the analysis may not be very accurate or precise. However, this is inevitable, as many variables are not readily quantifiable and some data have a limited availability because of the project complexity.11 Hence, the data are given as ranges representing our best attempts to extract as much up-to-date information as possible from vari-ous sources.
All the parameters in the model are assumed to follow either triangular or Beta distributions, and as-signed a minimum, most likely and maximum value. Then, 10,000 Monte Carlo simulations are run to generate an expected NPV. Repeated runs of the model obtain a probability distribution of possible outcomes, which is a more defensible procedure than just using single values for inputs that are in re-ality not well known.
In comparison with the Sri Lankan dam, this project is much bigger in size, and is far more com-plicated in terms of anticipated negative environ-mental and social issues. Thus, this paper introduces further modifications to allow for premature decommissioning.
Table 2. Main input parameters
Parameter Units Description
P0 Initial proportion of time during which an alternative power generation technology is not available
ϕ Parameter that describes the rate of decrease in P over time
EO Yuan/MWh Initial expected increase in economic output as a result of increased power supply
A Annual rate of decline in power generation as a result of sedimentation
GC GW Generation capacity
AL billion Yuan Archaeological loss
Table 1. New variables added to the model
Variable Description
FC (flood control) The monetary value of flood control benefits. Impact of sedimentation is also considered.
NI (navigation improvement) The benefit from navigation improvements is expressed by reduction in shipping costs. Changes in transportation costs and impacts of sedimentation are also considered.
DE (downstream effects) The cost of dealing with downstream pollution caused by the dam construction.
FI (impacts on downstream fishery)
Expressed by a decline in fish catches.
AS (value of the lost archaeological sites)
Approximated by the proportion of the budget for the preservation of cultural antiquities under the international standards, and the budget to rescue those cultural sites.

Probabilistic CBA
Impact Assessment and Project Appraisal September 2004 209
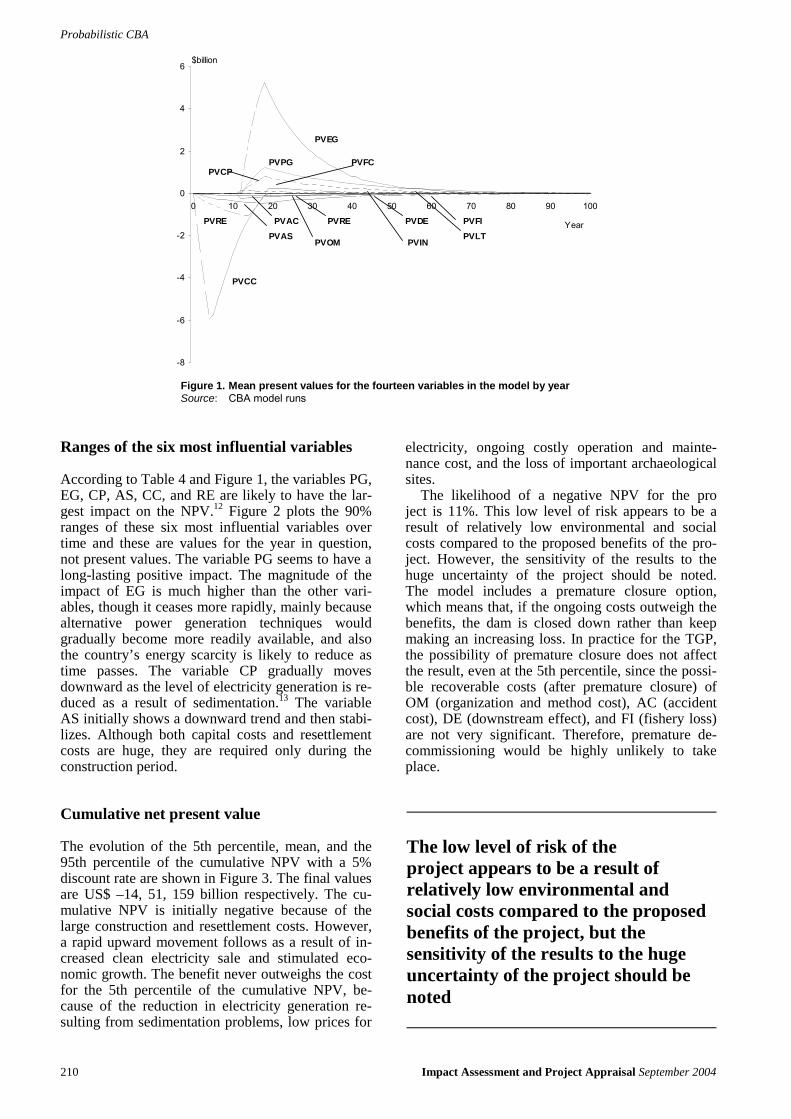
Mean present value results
There are three large positive impacts, EG (economic growth), PG (power generation), and CP (clean power), and three large negative impacts, CC (con-struction cost), AS (value of lost archaeological sites),
and RE (resettlement cost) as shown in Table 4. Fig-ure 1 gives a visual presentation of the mean present values by year; the areas under the lines in the figure are the cumulative NPVs in Table 4. The scale of re-settlement for the TGP is extremely large compared to most dams, since the area is densely populated.
Table 3. Main parameter values and descriptionsa
Parameter Minimum value Most likely value Maximum value
P0 0.17b 0.2c 1d
ϕ 0e 0.018f 0.085g
EOh (Yuan/MWh) 3200 7800 12500
A 0.001i 0.005j 0.03 k
GC (GW) 12.6l 16.4 m 18.2n
AL (billion Yuan) 1.5 o 4.9 p 33 q
Notes: a Other parameters are presented in Appendix III. PERT distribution (a special form of beta distribution) is used for all the parameters except EO, which is described by a triangular distribution b About 40 million rural households out of 232 million have no access to electricity (40/232=0.17) (US Department of Energy, 1996) c The State development and planning Commission estimated that about 20% of China’s area suffered power shortages in 1998 (South China Morning Post, 10 December 1998, “Obstacles block path to reform of industry”; see also Sinton and Fridley (2000) China’s total energy requirement is projected to increase continuously in the next 20 years (US Department of Energy, 1996) According to WCD (2000a), coal cannot be considered as an alternative to hydropower as a source of peaking power because of its inefficiency. Gas turbines could be an alternative, but would offer fewer benefits. Hence, assume that alternative techniques would not be available in a feasible period f Electricity generated by coal- and gas-fired thermal power plants increased by 1.8% in 1998 (China Energy Efficiency Information Bulletin, March 1999) g Electricity generated by coal- and gas-fired thermal power plants increased by 8.5% in 1995 (China Energy Efficiency Information Bulletin, March 1997) h In China, each kWh of power shortage results in a loss of economic output of US$0.38–1.5 (MOF, 1990) i The average annual active storage loss rate as a result of sedimentation is 0.1% (WCD, 2000a, Figure 2.14, page 65) j It is estimated that, after 100 years, 50% of the reservoir will be filled because of sedimentation. Thus, the annual rate will be 50/100 = 0.005 (Ryder and Barber, 1993) k The maximum annual rate of loss of active storage as a result of sedimentation in WCD Cross-Check Survey: a relatively high rate is set in order to challenge project optimism (WCD, 2000a) l The energy output of Victoria Dam in Sri Lanka is about 31% lower than the planned figure (WCD, 2000a) m The WCD Cross-Check Survey shows that over half of the projects in the sample generate power less than the planned figure: the most likely case is 10% below the target (WCD, 2000a) n The current planned installed capacity (CEB, 1994) o The estimated cost of the necessary excavations in the proposed reservoir area is US$180 million (Topping, 1995) p The estimated cost of salvage work for the TGP area is US$590 million (The Associated Press News, 29 January 1995) q The maximum value for TCC above is 660 billion Yuan. The budget for the preservation of historical relics and cultural antiquities should be about 3–5% of the total construction cost according to the international standards (Qing, 1998a, chapter 9). This approximation is used as a proxy because of lack of other appropriate evaluation methods, thus 660 billion Yuan×5%=33 billion Yuan
Table 4. Cumulative mean net present value for the 14n variables at t=100
Benefits US$ billion Costs US$ billion
PVEG Economic growth 82 PVCC Construction 50
PVPG Power generation 31 PVAS Archaeological loss 15
PVCP Clean power 17 PVRE Resettlement 12
PVFC Flood control 5 PVOM O&M 5
PVNI Navigation improvement 3 PVAC Accident 3
PVDE Downstream effect 3
PVFI Fishery loss 0.7
PVLT Tourism loss 0.4
PVIN Land inundation loss 0.2
Source: CBA model runs
Probabilistic CBA
210 Impact Assessment and Project Appraisal September 2004
Ranges of the six most influential variables
According to Table 4 and Figure 1, the variables PG, EG, CP, AS, CC, and RE are likely to have the lar-gest impact on the NPV.12 Figure 2 plots the 90% ranges of these six most influential variables over time and these are values for the year in question, not present values. The variable PG seems to have a long-lasting positive impact. The magnitude of the impact of EG is much higher than the other vari-ables, though it ceases more rapidly, mainly because alternative power generation techniques would gradually become more readily available, and also the country’s energy scarcity is likely to reduce as time passes. The variable CP gradually moves downward as the level of electricity generation is re-duced as a result of sedimentation.13 The variable AS initially shows a downward trend and then stabi-lizes. Although both capital costs and resettlement costs are huge, they are required only during the construction period.
Cumulative net present value
The evolution of the 5th percentile, mean, and the 95th percentile of the cumulative NPV with a 5% discount rate are shown in Figure 3. The final values are US$ –14, 51, 159 billion respectively. The cu-mulative NPV is initially negative because of the large construction and resettlement costs. However, a rapid upward movement follows as a result of in-creased clean electricity sale and stimulated eco-nomic growth. The benefit never outweighs the cost for the 5th percentile of the cumulative NPV, be-cause of the reduction in electricity generation re-sulting from sedimentation problems, low prices for
electricity, ongoing costly operation and mainte-nance cost, and the loss of important archaeological sites.
The likelihood of a negative NPV for the pro ject is 11%. This low level of risk appears to be a result of relatively low environmental and social costs compared to the proposed benefits of the pro-ject. However, the sensitivity of the results to the huge uncertainty of the project should be noted. The model includes a premature closure option, which means that, if the ongoing costs outweigh the benefits, the dam is closed down rather than keep making an increasing loss. In practice for the TGP, the possibility of premature closure does not affect the result, even at the 5th percentile, since the possi-ble recoverable costs (after premature closure) of OM (organization and method cost), AC (accident cost), DE (downstream effect), and FI (fishery loss) are not very significant. Therefore, premature de-commissioning would be highly unlikely to take place.
-8
-6
-4
-2
0
2
4
6
0 10 20 30 40 50 60 70 80 90 100
Year
$billion
PVEG
PVCC
PVRE
PVPGPVCP
PVAS
PVAC
PVFC
PVRE
PVOM
PVDE
PVIN
PVFI
PVLT
Figure 1. Mean present values for the fourteen variables in the model by year Source: CBA model runs
The low level of risk of the project appears to be a result of relatively low environmental and social costs compared to the proposed benefits of the project, but the sensitivity of the results to the huge uncertainty of the project should be noted

Probabilistic CBA
Impact Assessment and Project Appraisal September 2004 211
Sensitivity analysis
Table 5 shows that the following input parameters have the most significant impact on the cumulative NPV: P0 (initial proportion of time during which al-ternative power generation is not available), ϕ (pa-rameter that describes the annual rate of decrease in P (proportion of time during which alternative power generation is not available)), EO (initial expected in-crease in economic output resulting from increased power supply), a (annual rate of decline in power generation because of sedimentation), GC (power generation capacity), and AL (archaeological loss).
The sensitivity of each parameter has the correct sign and is therefore consistent with the model. Although this massive project demands a huge con-struction cost, it seems not to have one of the largest impacts on the NPV. This may be because a fairly
0
1
2
3
4
5
6
7
8
9
0 10 20 30 40 50 60 70 80 90 100
Year
$ billion
95%
Mean
5%
PG (power generation)
0
5
10
15
20
25
30
0 10 20 30 40 50 60 70 80 90 100Year
$ billion
95%
Mean 5%
EG (economic growth)
0 0.5
1 1.5
2 2.5
0 10 20 30 40 50 60 70 80 90 100
Year
$ billion 95%
Mean
5%
CP (clean poverty)
-2.5
-2
-1.5
-1
-0.5
010 20 30 40 50 60 70 80 90 100
Year $ billion
5%
Mean
95%
AS (archaeological loss)
-9
-8
-7
-6
-5
-4
-3
-2
-1
0
10 20 30 40 50 60 70 80 90 100
Year $ billion
5%
Mean
95%
CC (construction cost)
-2 .5
-2
-1 .5
-1
-0 .5
01 0 2 0 3 0 4 0 5 0 6 0 7 0 8 0 9 0 1 0 0
Y e a r $ b ill io n
5 %
M e a n
9 5 %
RE (resettlement cost)
Figure 2. Range of values of the six most influential variables by yearSource: CBA model runs
Table 5. Statistically significant parameters
Parameter Student b coefficient
P0 + 0.58
ϕ – 0.54
EO + 0.39
A – 0.19
GC + 0.15
AL – 0.14
Note: The input parameter values are regressed against the output (NPV). The student b coefficient is a coefficient calculated for each input parameter in the regression equation
Source: CBA model runs

Probabilistic CBA
212 Impact Assessment and Project Appraisal September 2004
small range of data, 470–660 billion Yuan (US$57–80), is used, as it is thought that this parameter is fairly well known.
Several variable discount rates were used to meas-ure the effect of different rates of pure time prefer-ence.14 Figure 4 shows that the choice of pure time preference rate has a strong effect on the value of the cumulative NPV. The fixed discount rate of 5% used for the basic analysis lies in between a pure time preference rate of 1% and 2%. The mean value of the cumulative NPV becomes negative when the pure rate of time preference is approximately above 5%. There-fore, this analysis clearly indicates that the cumulative NPV is sensitive to the choice of discount rates.
Conclusion
This paper has illustrated the use of a CBA model of hydropower projects, slightly modified from the one developed in Morimoto and Hope (2004), using China’s massive Three Gorges Project as a case study. The application of the comprehensive probabilistic
CBA to this controversial project is challenging and novel, as it assesses whether the project, involving such complex environmental and social problems, is worth building, and would contribute to China’s sus-tainable development. Quantification of the project outcome gives a clear picture and helps policy mak-ers in their decision-making process.
Five new variables have been added, namely FC (flood control), NI (navigation improvement), DE (downstream effect), FI (impacts on downstream fishery), and AS (value of lost archaeological sites). The variables with the largest contribution towards the cumulative NPV were PG (power generation), EG (economic growth), CC (construction cost), CP (clean power), RE (resettlement cost), and AS (value of lost archaeological sites).
The sensitivity analysis has shown that the pa-rameters P0 (initial proportion of time during which an alternative power generation is not available) and ϕ (parameter that describes the annual rate of decrease in P (proportion of time during which an alternative power generation is not available)) have particularly significant impacts on NPV.
-50
0
50
100
150
200
250
300
350
0 3 6
%
$billion
95% Mean 5%
Figure 4. The cumulative NPV against the pure rate of time reference Source: CBA model runs
-100
-50
0
50
100
150
200
0 10 20 30 40 50 60 70 80 90 100 Year
$billion
Mean
5%
95%
Figure 3. Range of cumulative NPV with a 5% discount rate by yearSource: CBA model runs

Probabilistic CBA
Impact Assessment and Project Appraisal September 2004 213
The possibility of premature decommissioning has also been introduced in this study, although it did not give a noticeable change to the outcome for the TGP. The improvements of the results could be seen only if sedimentation problems of the TGP were assumed to be even larger than expected, when premature decommissioning would take place.
The mean and the 95th percentile of the cumulative NPV at the 5% discount rate at year 100 were posi-tive, whereas the 5th percentile was negative. It is dif-ficult to compare these findings with those from past studies on the TGP, as most of the previous studies have focused only on each impact of the dam and have employed mainly a qualitative approach. However, the finding in this paper supports the view that the so-cial and environmental implications of the project are not negligible, despite the fact that the benefit of power generation is expected to be large.
Furthermore, the results obtained by the model need to be treated carefully, as they are sensitive to the valuation methods, the choice of discount rates, and the large project uncertainty. Theoretically, posi-tive NPV implies that gainers should compensate
losers, as some people obtain more benefit than oth-ers. However, such distributive effects have not been investigated in this study. Given the large size and geographic scale of the project, investing those ef-fects would be useful in future research.
Finally, we have tried to use the most representa-tive data are readily available, to obtain the best pos-sible results. However, it is admitted that data collection was one of the most difficult parts of this research, since there are so many parameters in-cluded in the model, and the project is not easy to scrutinize. Wider ranges are used for the particularly uncertain figures.
The strength of the model is its simplicity: if the figures used are considered not to be sufficiently ac-curate or representative, they can easily be replaced and the model run again to obtain better results. For example, the paper shows that the variable AL (ar-chaeological loss) has a significant impact on NPV according to the sensitivity analysis. Therefore, fur-ther efforts to search out better estimates for this parameter would be worthwhile, to improve the accuracy of the result.
Appendix I. Additional equations to the previous model (Morimoto and Hope, 2004) FIt = FB*(1–b*t) for t>Tc, GYuan/year
where
FI = benefit from flood control in billion Yuan/year FB = mean annual benefits from flood control in billion Yuan b = annual rate of decline in flood control benefit due to
sedimentation Tc = construction period.
NIt = [SC*(1–c*t)]*e*TRt for t≥TS, GYuan/year, TRt = TR0 for t=0 = (1+g)TRt–1 for t>0, Yuan/ton
where
NI = benefit from navigation improvement in billion Yuan/year (it starts functioning in TS)
SC = annual shipping capacity in Gtons/year E = annual rate of reduction in shipping costs c = annual rate of decline in navigation control benefit as a
result of sedimentation TR+ = shipping costs in Yuan/ton TS = time when hydropower starts operating TR0 = shipping costs at t=0 in Yuan/ton g = annual rate of change in transportation costs.
CPt = (1–Pt)*∑= 2,1i
[CLi*CMi] GYuan/year
CLi = (Ci*QEt)/109 Gtons/year Pt = P0*exp[–ϕt]
where
CP = benefit from replacing coal use CL1 = annual decreased CO2 level because of a decrease in
coal use as a result of the TGP in Gtons/yr P0 = initial proportion of time during which an alternative
power generation technology is unavailable ϕ = parameter that explains the rate of decrease in P over
time
CL2 = annual decreased SO2 level because of a decrease in coal use as a result of the TGP in Gtons/year
C1 = annual decreased CO2 level because of a decrease in coal use as a result of the TGP in tons/GWh/year
C2 = annual decreased SO2 level because of a decrease in coal use as a result of the TGP in tons/GWh/yr
QEt = quantity of electricity generated in GWh/year CM1 = benefits of CO2 reduction in Yuan per ton of CO2 CM2 = benefits of SO2 reduction in Yuan per ton of SO2.
FIt = (FP*t)/Tc for t≤Tc = FP for t>Tc,
where
FP = annual lost profits from fishery in billion Yuan/year.
DEt = 0 for t≤Tc = ADE for t>Tc GYuan/year
where
ADE = annual investment costs to deal with downstream effects in billion Yuan/year (clean-up costs and water pollution mitigation costs).
ASt = AL*t/Tc for t≤Tc = AL for t>Tc GYuan/year
where
AS = value of lost archaeological sites in billion Yuan AL = archaeological loss in billion Yuan.
Because of the scale of the dam and the geographical characteristics of its location, significant economic damage and deaths/injuries would be expected if the dam collapsed as a result of technical failures, being a target of terrorism, or earthquake. Hence,
(continued)

Probabilistic CBA
214 Impact Assessment and Project Appraisal September 2004
Appendix I (continued)
ACt = ∑= 2,1j
ACCjt+DMt GYuan/year,
ACC1t = VD*[DCt+DOMt+DDt] GYuan/year ACC2t = VM*[INCt+IOMt+IDt] GYuan/year
where
ACC1t = estimated annual costs of deaths as a result of accidents in billion Yuan
ACC2t = estimated annual costs of injuries as a result of accidents in billion Yuan
DMt = estimated annual damage costs as a result of special events (costs of economic loss) in billion Yuan
VD = value estimate for deaths in million Yuan/death VM = value estimate for injuries in million Yuan/illness DCt = annual number of deaths during construction INCt = annual number of injuries during construction DOMt = annual number of deaths during O&M IOMt = annual number of injuries during O&M DDt = annual number of deaths as a result of dam technical
failures/terrorism/earthquake IDt = annual number of injuries as a result of dam technical
failures/terrorism/earthquake.
Special events, such as dam technical failures, terrorism, and earthquake, are very rare, so that each estimated accident cost will be multiplied by probability of occurrence of these events.
DDt = (GC*DCR′′ )*(P+P′+P′′ ) for t>Tc = 0 for t≤Tc GYuan/year
where
DCR′′ = annual number of deaths as a result of special circumstances in deaths/GW/year
P = probability of occurrence of technical failures per year P′ = probability of occurrence of terrorism per year P′′ = probability of occurrence of earthquake per year
IDt = (GC*MCR′′ )*(P+P′+P′′ ) for t>Tc = 0 for t≤Tc, GYuan/year
where
MCR′′ = annual number of injuries as a result of special circumstances in injuries/GW/year.
DMt = ECL*(P+P′+P′′ ) for t>Tc, GYuan/year
where
ECL = economic loss in billion Yuan/year.
Decommissioning costs are currently difficult to predict because of uncertainty surrounding the various parameters affecting the costs and the limited practical experiences with decommissioning (WCD, 2000a). Decommissioning costs vary from project to project, though they are usually large.
DCCt = π*TCC if t=TDC = 0 otherwise, GYuan/year
where
DCCt = costs of decommissioning the TGP in billion Yuan/year,π = proportion of decommissioning costs in construction
cost, TDC = time of decommissioning: if policy makers choose
premature closure as the cost outweighs the benefit, TDC = time of premature closure.
If the costs start outweighing the benefits, it would be better to close down the dam prematurely. Policy makers have an option to close down if
TBt–(OMt+DEt+FIt+ACt)+DCCt–DCCt+1<0
where
TB = total benefits, DCCt+1= DCCt/(1+d) = the NPV this year of paying DCC
next year.
Policy makers have a choice each year, either close down or stay open one more year. If they decide to close down, decommissioning costs have to be paid this year, otherwise they pay decommissioning costs next year. The costs of CC, RE, AS, IN and LT are not included in the above equation. This is because CC and RE have already been paid during construction; lost archaeological sites and inundated land may not recover; and the negative impact on tourism may remain, since the aesthetic beauty of the Three Gorges once lost cannot be recovered.
NPVt = ∑=
T
t 0
(1+dt)–t(TBt–TCt) for t≤Tc+Tcl GYuan/year
NPVt = ∑=
T
t 0
(1+dt)–t(TBt–TCt)
if TBt–(OMt+DEt+FIt+ACt)+DCCt–DCCt+1≥0
= –∑=
T
t 0
(1+dt)–t(CCt+REt+ASt+INt+LTt+DCCt)
if TBt–(OMt+DEt+FIt+ACt)+DCCt–DCCt+1<0 for t>Tc+Tcl, GYuan/year
where
TB = total benefits TC = total costs, dt = discount rate (fixed/variable), NPVT = net present value at time T Tc = construction period, Tcl = time to close down the dam (time until which policy
makers allow NPV to be negative after construction).
Appendix II. Equations for the other four most influential variables (CP, AS in Appendix I) PGt = [(QEt*103)*PEt]/109 GYuan/year PEt = PE0 for t=0 = (1+f)*PEt–1 for t>0, Yuan/MW/year QEt = [(t–TS)/(Tc–TS)]*AQE*[1–a(t–TS)] for TS≤t≤Tc = (1–a)*QEt–1 for t>Tc = 0 for t<TS, GWh/year AQE = LF*GC*(365days*24hours) GWh/year TS = δTc year
where
PGt = income from power generation at t in billion Yuan T = year 0…T QEt = quantity of electricity generated in GWh/year
PEt = price of electricity in Yuan/MWh/year PE0 = price of electricity at t=0 in Yuan/MWh/year F = instantaneous proportional annual changes in
electricity prices in China Tc = construction period TS = time hydropower station starts operating AQE = annual quantity of electricity generated in GWh/year A = annual rate of decline in power generation as a result
of sedimentation LF = load factor GC = generating capacity in GW δ = parameter that describes the time the hydropower
station starts operating. (continued)

Probabilistic CBA
Impact Assessment and Project Appraisal September 2004 215
Appendix II (continued)
EGt =Pt*[(QEt*103)*(EO*)]/109 GYuan/year
where
EGt = benefit of economic growth facilitated by increased power supply in billion Yuan
EO = expected increase in economic output as a result of increased power supply in Yuan/MWh.
CCt = MCC*t/TMCC for t≤TMCC = [(1–(t–TMCC))/(Tc–TMCC)]*MCC
forTMCC<t≤Tc GYuan/year MCC = (2*TCC)/Tc GYuan TMCC = αTc year
where
CCt = construction cost of the TGP in billion Yuan MCC = max construction costs in billion Yuan
TCC = total construction costs in billion Yuan TMCC = time when construction costs reach maximum value α = parameter that explains the location of the peak of
the distribution for CC during the construction period.15
REt = MRE*t/TMRE for t≤TMRE = [(1–(t–TMRE))/(Tc–TMRE)]*MRE
forTMRE<t≤Tc GYuan/year MRE = (2*TRE)/Tc GYuan TMRE = βTc year
where
MRE = max resettlement costs in billion Yuan TRE = total resettlement costs in billion Yuan TMRE = time when resettlement costs reach maximum value β = parameter that explains the location of the peak
of the distribution for RE during the construction period
Appendix III. Data Table A-I. Parameter values in the CBA model and descriptions16
Values (min, most likely, max)a
Description of each value
Tc (17, 18, 22) The min is the original plan. 40% of delayed projects show 1-year delay and 5% shows 5-year delay (WCD, 2000a).
PE0 (290,300,330) The most likely is TGP generated electricity prices by CTGPC. The min and max are 5% lower and 10% higher.
ε (0.1, 0.6, 0.9) For min, assuming the loss of the Three Gorges aesthetics has a small effect on tourism, as tourists can visit other attractions in the area. The decrease in number of tourists after the terrorist attack in Sri Lanka in 1998 is used for most likely (CBSL Annual Report 1998). For max, assuming majority of tourists only visit the site to see the Three Gorges.
β (0.6, 0.8, 0.9) The official forecast of the distribution of CC skewed to the right (Li, 1994; Sumi, 1977, page 34, Graph 1).
NT (33000, 70000, 40000)
The most likely is the number of tourists in the base place to visit the Three Gorges area, Wuhan and Chongqing in 1996 (from China Statistic Year Book 1997). The min value is 10% lower than the most likely. The project area is one of the most popular places for both domestic and foreign tourists. Hence, assume twice as much as the most likely for the max.
f20 (0, 0.011, 0.03)
According to China Energy Efficiency Information Bulletin March 1997, China will not increase electricity prices largely in the short term. Thus, assume zero rate of changes for min. The rate of increase in electricity prices from 1986 to 1987 was 0.011 (China Electric Power Industry Year Book 1995). This is used for the most likely. The same source shows a reasonable rate of increase in electricity prices of 0.03 between 1994 and 1995, which is used for max.b
α (0.1, 0.2, 0.5) The official forecast of the distribution of CC skewed to the left (see Li, 1994; Sumi, 1997, page 34, Graph 1.
TCC (470,610,660) The min is the planned figure by CTGPC. 70 hydro projects commissioned in 1915–1986 financed by the World Bank show average cost overruns of 30% (Bacon and Besant-Jones, 1998). WCD shows average cost overruns for large dams excluding extreme cases are 40%.
σ (0.1, 0.5, 0.8) For min, assume the peak of the distribution is at the beginning (completing fundamental work); for the most likely, assume in the middle process (more complicated and large-scale work); for max, assume the peak is towards the end.
C1 (1300, 1400, 1700) The TGP is expected to reduce 50 million tons of coal-use per year, which may reduce 100 million tons of CO2 (Beijing Review, July 1996). The min and max are 10% lower and 20% higher than the most likely.
C2 (25, 28, 34) The TGP is expected to reduce 2 million tons of SO2 (Beijing Review, July 1996). The min and max values are 10% lower and 20% higher than the most likely.
CM1 (120, 130, 160) The most likely is the estimated value by Battelle (1998). The min and max are 10% lower and 20% higher than the most likely.
CM2 (3500, 3800, 4600)
See CM1.
FB (0.76,0.97,35) The min is the estimated value (Luk and Whitney, 1993). The most likely is measured solely by economic criteria in 1986 prices. “If an exceptionally huge flood similar to that of 1870 should occur, the project would reduce losses caused by inundation by 35 billion Yuan, and also prevent a great number of casualties caused by burst dikes” (Rulan et al, 1997).
SC (0.04,0.05,0.06) The most likely is the official value (Beijing Review, March 1992). The min and max are 20% lower and 10% higher.

Probabilistic CBA
216 Impact Assessment and Project Appraisal September 2004
Appendix III (continued)
e (0.3,0.36,0.37) According to Youmei (1997), 0.3 (min) to 0.37 (max). According to Beijing Review, March 1992, 0.36.
TR0 (110,120,140) The most likely is the forecasted transport costs of goods from Central to East on Yangtze in 2005 (Energy Research Institute staff estimates; Battelle, 1998, Table 5.4. Assuming the min and max are 10% lower and 20% higher.
g (0,0.01,0.011) The most likely value is the estimated figure (Energy Research Institute staff estimates in Battlle, 1998, Table 5.4 in note 8). Assuming no change for min, and 10% higher than the most likely for max.
EL (0.12,0.13,0.26) 31000 ha of farmland and 4933 ha of citrus orchards will be submerged, whose values are assumed to be US$380/ha/year, and US$760/ha/year respectively (Furedi, 1999).c The min and max are 10% lower and 10% higher than the most likely respectively.
OMC (170,220,240) O&M cost for large hydro dams=US$20/kW/year (Battelle, 1998, Table 5.11). The same cost overrun rates as for TCC.
FP (0.04,2.4, 2.7) US Fish and Wildlife Service studies show Savage Rapids Dam in Oregon destroyed at least US$5 million/year in fisheries benefits (News letter, May 1998). The most likely is 10% lower than max. “The National Marine Fisheries Service estimated the salmon fishery losses as a result of dams in the Colombia basin to be US$6.5 billion in 1960–80” (McCulley, 1997)
TRE (120,160,180) The min is the planned figure (http: www.china.embassy.org/issues/gorges.htm). The most likely and max are based on the actual number of resettled; 35% and 47% higher than the estimates according to WCD Survey and among the World Bank financed projects respectively (World Bank, 1996).
RS (1500, 1600, 2500) The most likely is per capita international tourist recipients in China in 1996 (China Statistic Year Book 1997). The min and max are 10% lower and 50% higher than the most likely.
ADE (3.2, 3.5, 4.2) The most likely is the estimated figure (Hui, 1998). The min and max are 10% lower and 20% higher than the most likely.
VD (3.3,6.6, 55.6) The same values in Morimoto and Hope (2004).
VM (0.8*10-3, 0.003, 0.3)
See VD.
DCR (0.3, 0.8, 1.9) See VD.
MCR (170,310,340) See VD.
DCR′ (0.32,0.57,0.63) See VD.
MCR′ (7, 12, 13) See VD.
DCR′′ (7*10–3, 12*10–3, 14*10–3)
The max is the estimated value (Inhaber, 1982). The min and the most likely are 50% and 10% less than the max.
MCR′′ (35*103,63*103,70*103)
See VD.
ECL (17, 30, 45) Honduras needs US$ 2 billion to meet expected direct and indirect losses after a 1-in-100-year storm (Freeman, 2000). The total economic losses in Hubei province from the 1998 floods are 30 billion Yuan (Saywell, 1998). The max is 50% higher than the most likely.
b and c (10–4,10–3, 0.03)
Assume the rate is the same as the annual rate of decline in power generation as a result of sedimentation.
π (0.025, 0.08, 0.25) The min and most likely are 1/10 and 1/3 of the max. The removal cost of the 22MW Marmot and Little Sandy Dams is approx US$22 million according to IRN. Based on this figure, the TGP needs 18.2 GW*8.3 Yuan/(mean TCC=610)=0.25.
TDC (50, 75, 100) About 5000 large dams in the world are more than 50 years old (Wade, 1999). Assume 50% and 100% higher for most likely and max
P=10–4
P′= P′′=10–5
Average risk of dam breaking is 10–4(IRN). Dams are considered as prime military targets, but its occurrence is low historically.d Hence, assume the probability of terrorism occurrence and earthquake occurrence as 10 times lower.
Notes: a The variables follow PERT distribution apart from NT, f, DCR, MCR, DCR′, MCR′, DCR′′ , MCR′′ b Assume the min and max values are the same, but the most likely would be 20 % lower every 20-year period c These values are the lost values of the submerged land for coconuts fields and paddy in monetary terms respectively,
according to CEB (1987) study d For example, The British bombed Germany’s Mohne and Eder dams during World War II, the US bombed North Korean
dams during the Korean War and Vietnamese dams and dikes during the Vietnam War (see Bing, 1998 for more detail)
Probabilistic CBA
Impact Assessment and Project Appraisal September 2004 217
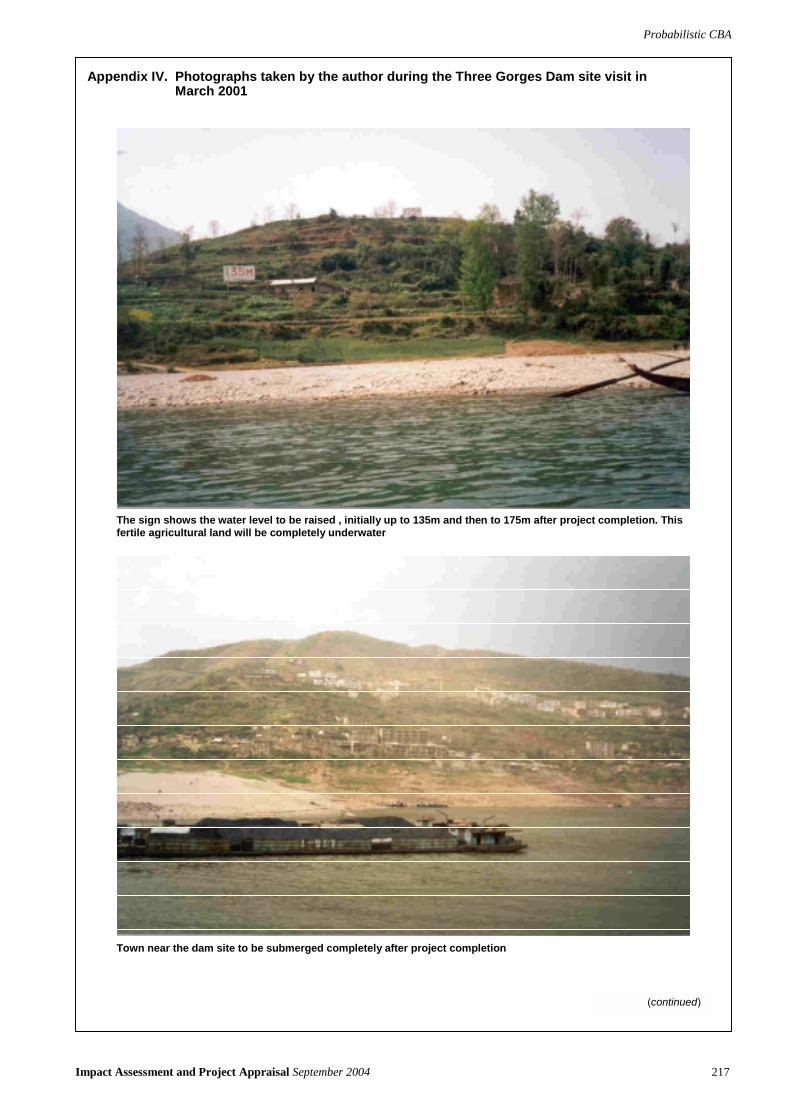
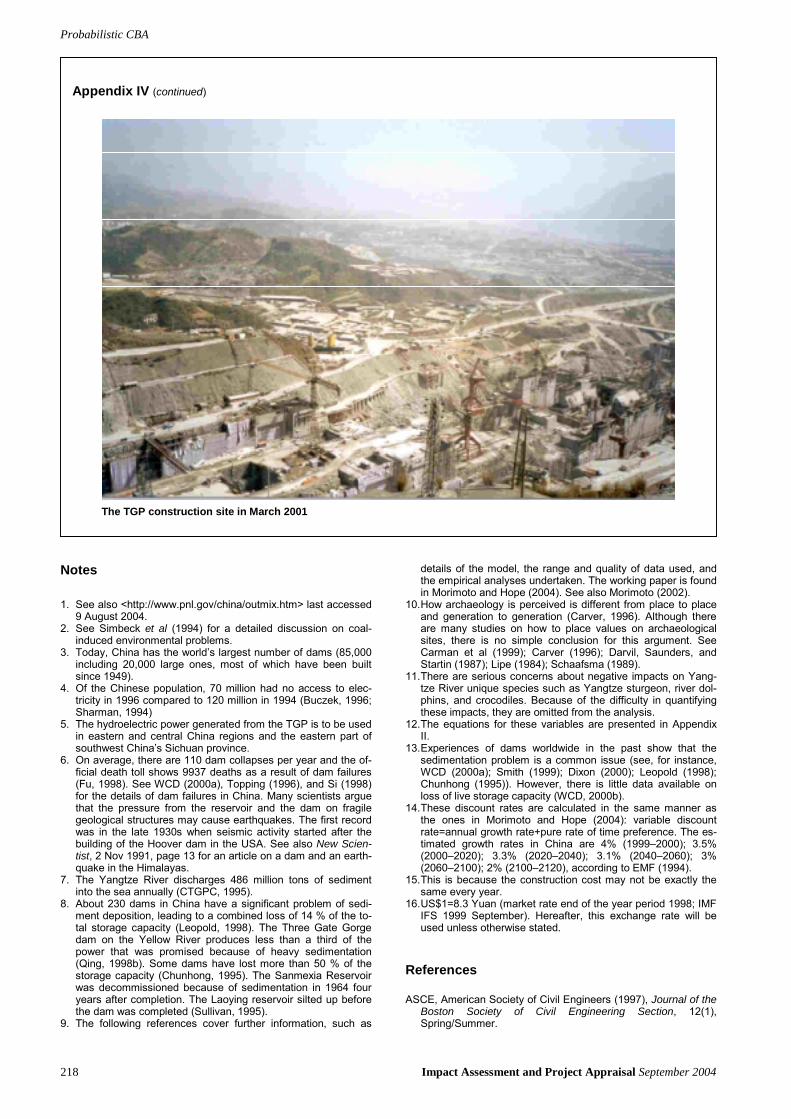
Appendix IV. Photographs taken by the author during the Three Gorges Dam site visit in March 2001
(continued)
The sign shows the water level to be raised , initially up to 135m and then to 175m after project completion. This fertile agricultural land will be completely underwater
Town near the dam site to be submerged completely after project completion
Probabilistic CBA
218 Impact Assessment and Project Appraisal September 2004
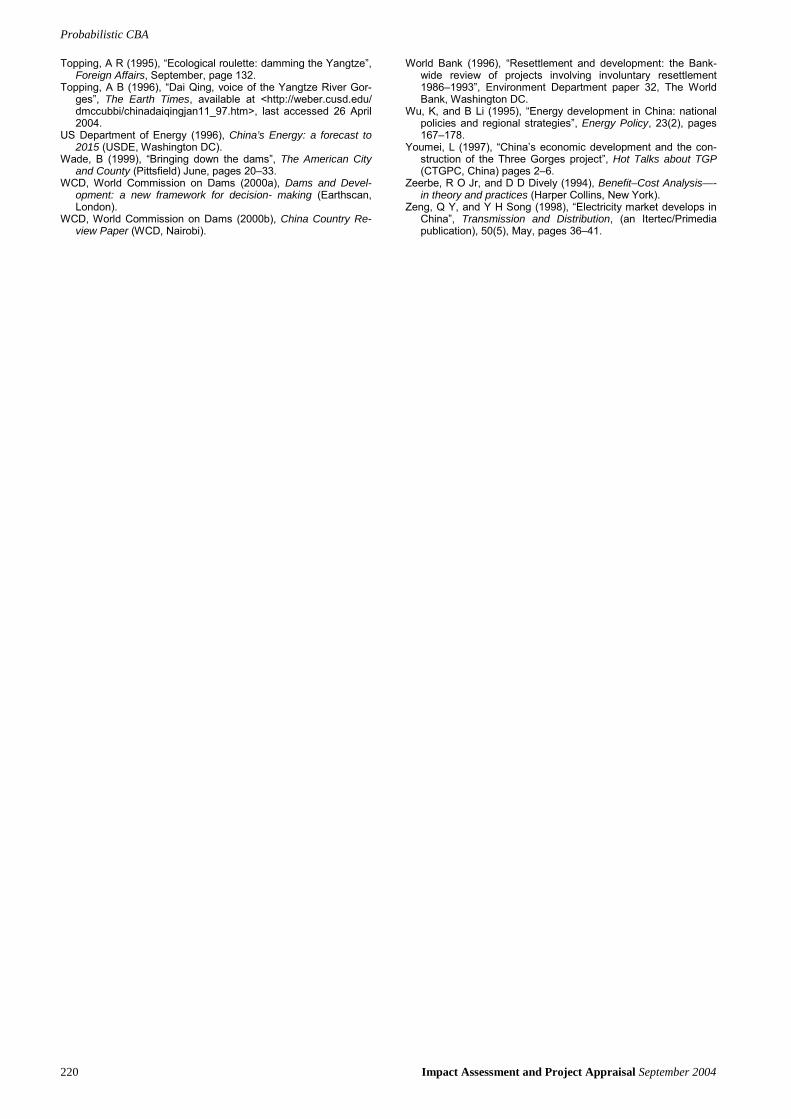
Appendix IV (continued)
Notes
1. See also <http://www.pnl.gov/china/outmix.htm> last accessed 9 August 2004.
2. See Simbeck et al (1994) for a detailed discussion on coal-induced environmental problems.
3. Today, China has the world’s largest number of dams (85,000 including 20,000 large ones, most of which have been built since 1949).
4. Of the Chinese population, 70 million had no access to elec-tricity in 1996 compared to 120 million in 1994 (Buczek, 1996; Sharman, 1994)
5. The hydroelectric power generated from the TGP is to be used in eastern and central China regions and the eastern part of southwest China’s Sichuan province.
6. On average, there are 110 dam collapses per year and the of-ficial death toll shows 9937 deaths as a result of dam failures (Fu, 1998). See WCD (2000a), Topping (1996), and Si (1998) for the details of dam failures in China. Many scientists argue that the pressure from the reservoir and the dam on fragile geological structures may cause earthquakes. The first record was in the late 1930s when seismic activity started after the building of the Hoover dam in the USA. See also New Scien-tist, 2 Nov 1991, page 13 for an article on a dam and an earth-quake in the Himalayas.
7. The Yangtze River discharges 486 million tons of sediment into the sea annually (CTGPC, 1995).
8. About 230 dams in China have a significant problem of sedi-ment deposition, leading to a combined loss of 14 % of the to-tal storage capacity (Leopold, 1998). The Three Gate Gorge dam on the Yellow River produces less than a third of the power that was promised because of heavy sedimentation (Qing, 1998b). Some dams have lost more than 50 % of the storage capacity (Chunhong, 1995). The Sanmexia Reservoir was decommissioned because of sedimentation in 1964 four years after completion. The Laoying reservoir silted up before the dam was completed (Sullivan, 1995).
9. The following references cover further information, such as
details of the model, the range and quality of data used, and the empirical analyses undertaken. The working paper is found in Morimoto and Hope (2004). See also Morimoto (2002).
10. How archaeology is perceived is different from place to place and generation to generation (Carver, 1996). Although there are many studies on how to place values on archaeological sites, there is no simple conclusion for this argument. See Carman et al (1999); Carver (1996); Darvil, Saunders, and Startin (1987); Lipe (1984); Schaafsma (1989).
11. There are serious concerns about negative impacts on Yang-tze River unique species such as Yangtze sturgeon, river dol-phins, and crocodiles. Because of the difficulty in quantifying these impacts, they are omitted from the analysis.
12. The equations for these variables are presented in Appendix II.
13. Experiences of dams worldwide in the past show that the sedimentation problem is a common issue (see, for instance, WCD (2000a); Smith (1999); Dixon (2000); Leopold (1998); Chunhong (1995)). However, there is little data available on loss of live storage capacity (WCD, 2000b).
14. These discount rates are calculated in the same manner as the ones in Morimoto and Hope (2004): variable discount rate=annual growth rate+pure rate of time preference. The es-timated growth rates in China are 4% (1999–2000); 3.5% (2000–2020); 3.3% (2020–2040); 3.1% (2040–2060); 3% (2060–2100); 2% (2100–2120), according to EMF (1994).
15. This is because the construction cost may not be exactly the same every year.
16. US$1=8.3 Yuan (market rate end of the year period 1998; IMF IFS 1999 September). Hereafter, this exchange rate will be used unless otherwise stated.
References
ASCE, American Society of Civil Engineers (1997), Journal of the Boston Society of Civil Engineering Section, 12(1), Spring/Summer.
The TGP construction site in March 2001

Probabilistic CBA
Impact Assessment and Project Appraisal September 2004 219
Bacon, R W, and J E Besant-Jones (1998), “Estimating construc-tion costs and schedules: experiences with power generation projects in developing countries”, Energy Policy, 26(4), pages 317–333.
Barlow, M (1999), “The global water crisis and the co modification of the world’s water supply”, in The Blue Gold: IFG report (In-ternational Forum on Globalization, San Francisco).
Battelle (1998), China’s Electric Power options: an analysis of economic and environmental costs (Battelle Memorial Institute, Washington).
Bentkover, J D, V T Covello and J Mumpower (1986), “Risk of dam failure in benefit–cost analysis”, Water Resources Re-search, 16(3), pages 449–456.
Bing, D (1998), “Military perspectives on the TGP”, in Qing (1998a), chapter 12, pages 171–176.
Boardman, A E, D H Greenberg, A R Vining and D L Weimer (2001), Cost–Benefit Analysis (Prentice Hall, New Jersey, 2nd edition).
Brent, R J (1996), Applied Cost–Benefit Analysis (Edwards Elgar, Cheltenham).
Buczek, M (1996), “Fueling China’s growth”, The China Business Review, Washington, September–October).
Canadian Yangtze Joint Venture (1988), Three Gorges Water Control Project Feasibility Study (CYJV, Canada).
Carman, J, G D Garnegie and P W Wolnizer (1999), “Is archeo-logical valuation an accounting matter?”, Antiquity, 73, pages 143–148.
Carver, M (1996), “On archaeological value”, Antiquity, 70, pages 45–56.
Caufield, C (1997), “Rough sailing at Three Gorges dam”, World Rivers Review, 12(6), December.
CBSL, Central Bank of Sri Lanka (1998), Annual Report 1998 (CBSL, Colombo).
CEB, Ceylon Electricity Board (1987), Master Plan for Electricity Supply in Sri Lanka (CEB, Colombo).
CEB, Ceylon Electricity Board (1994), Environmental Impact As-sessment for the UKHP (CEB, Colombo).
Childs-Johnson, E, and L R Sullivan (1998), “The Three Gorges dam and the fate of China’s southern heritage” in Qing (1998a), Appendix C, pages 200–207.
Chunhong, H (1995), “Controlling reservoir sedimentation in China”, Hydropower and Dams, March, pages 50–52.
Cleere, H F (1984), Archaeological Heritage Management in the Modern World (Taylor and Francis Books Ltd, London).
CTGPC, China Three Gorges Project Corporation (1995), Envi-ronmental Impact Statement for the Yangtze Three Gorges Project (CTPGC, China).
Darvil, T, A Saunders and B Startin (1987), “A question of national importance: approaches to the evaluation of ancient monu-ments for the monuments protection programme in England”, Antiquity, 61, pages 393–408.
Dixon, D A (2000), “A growing problem”, International Water Power and Dam Construction, May, pages 23–25.
EIA, energy Information Administration (2001), China Country Analysis Brief (EIA, Washington).
EMF, Energy Modeling Forum (1994), Final First Round Study Design for EMF 14: Integrated Assessment of Climate Change Energy Modeling Forum (Terman Engineering Center, Stan-ford University, Stanford).
Fang, Tian, Fa-Tang Lin and Cun-Xi Ling (1988), On the Macro Level Decision Making on TGP (Hunan Press of Science and Technology, Changsha, PRC).
Freeman, P K (2000), “Estimating chronic risk from natural disas-ters in developing countries: a case study on Honduras”, paper for the Annual Bank Conference in Paris on Development Economics, Europe Development Thinking at the Millennium, June, pages 26–28.
Fu, S (1998), “A profile of dams in China” in Qing (1998a), chap-ter 2, pages 18–24.
Fung, S (1999), “That dam project!”, Across the Board, May, pages 46–49.
Furedi, F (1999), Power to the People (Kluwer, New York). Gamer, R E (editor) (1999), Understanding Contemporary China
(Rienner Publishers, London). Goldstein, S (1998), “The Three Gorges saga: the high price of
modernization”, Columbia East Asian Review, Spring, avail-able at <(http://www.columbia.edu/cu/ccba/cear/issues/ spring98/text-only/goldstein.htm>, last accessed 22 April 2004.
Guojie, C (1998), “The environmental impacts of resettlement in the Three Gorges Project”, in Qing (1998a), chapter 5, pages 63–69.
Hui, H (1998), “Water pollution in the Three Gorges reservoirs”, in Qing (1998a), chapter 11, pages 160–170.
Hope, C, and R Palmer (2001), “Assessing water quality im-provement schemes: the multi attribute techniques of the UK’s environmental agency”, Integrated Assessment, 2, pages 219–224.
Inhaber, H (1982), Energy Risk Assessment (Gordon and Breach Science Publishers, New York).
Layard, P, and S Glaister (editors) (1994), Cost Benefit Analysis (Cambridge University Press, Cambridge, 2nd edition).
Leopold, L (1998), “Sediment problems at the TGD” in Qing (1998a), Appendix B, pages 194–199.
Li, B, and J P Dorian (1995), “Change in China’s power sector”, Energy Policy, 23(7), pages 619–626.
Li, Y (1994), “On the overall strategy of the Three Gorges Project fund raising”, Construction of China’s Three Gorges (Routledge, London) pages 38–51.
Lipe, W D (1984), “Value and meaning in cultural resources” in H F
Cleere (editor) (1984), Approaches to the Archaeological Heri-tages (Cambridge University Press, Cambridge), pages 1–11.
Luk, S H, and J Whitney (editor) (1993), Megaproject: a case study of China’s Three Gorges Project (M E Sharpe, New York).
McCulley, P (1997), “Taking down bad dams”, World Rivers Re-view, 12(4), August, pages 4–5.
MOF, Ministry of Finance (1990), Energy in China (The Ministry of Energy Press, Beijing).
Morimoto, R (2002), “Environmental, economic and social impacts of dams in developing countries”, PhD thesis, University of Cambridge, available via the University of Cambridge Main Li-brary at <http://www.lib.cam.ac.uk/>, last accessed 22 April 2004.
Morimoto, R, and C Hope (2004), “A CBA model of a hydro project in Sri Lanka”, International Journal of Global Energy Is-sues, special issue on energy and renewable energy with eco-nomic development in developing countries, 21(1/2), pages 47–68.
Morrish, M (1997), “The living geography of China”, Geography, 83(354), January, pages 3–16.
Munasinghe, Mohan, and Peter M Meier (1993), Incorporating Environmental Concerns into Power Sector Planning (World Bank, Washington DC).
Qing (editor) (1998a), The River Dragon Has Come! (IRN, Berke-ley CA).
Qing, D (1998b), “The danger to historical relics and cultural an-tiquities in and around the Three Gorges area”, in Qing (1998a), chapter 9, pages 124–142.
Qigang, D (1998), “What are the Three Gorges resettlers think-ing?”, in Qing (1998a), chapter 6, pages 70–89.
Ren, Q (1998), “Discussing population resettlement with Li Pong” in Qing (1998a, chapter 4, pages 39–62.
Rulan et al (1997), “The Three Gorges project: key to the Devel-opment of the Yangtze River”, Civil Engineering Practice: Journal of the Boston Society of Civil Engineers Sec-tion/ASCE, Spring/Summer, 12(1), pages 39–62.
Ryder, G, and M Barber (editor) (1993), Damming the Three Gorges: 1920–1993 (Probe International, Toronto, 2nd edition).
Saywell, T (1998), “A river run wild”, Far Eastern Economic Re-view, April, pages 38–40.
Schaafsma, C F (1989), “Significant unit proven otherwise: prob-lems versus representative samples”, in Cleere (1984), pages 38–51.
Sharman, R T Jr (1994), “Power in the PRC”, Independent En-ergy, October, pages 24–31.
Si, Y (1998), “The World’s most catastrophic dam failures” in Qing (1998a), chapter 3, pages 25–38.
Simbek, D R, R L Dickenson and L D Carter (1994), “China’s coal use”, Independent Energy, Milaca, Jul/August, pages 12–21.
Sinton, J E, and D G Fridley (2000), “What goes up: recent trends in China’s energy consumption”, Energy Policy, March, pages 671–687.
Smith, V K (1999), “A controversial overview of the foundations of BCA”, in Bentkover et al (1986), pages 449–456.
Sullivan, M E (1995), “The Three Gorges Dam Project: the need for a comprehensive assessment”, The Georgetown Inter-national Environmental law Review, 8(109), pages 109–140.
Sumi, K (1997), Three Gorges Dam and Japan (Chikuji Shokan, Tokyo, in Japanese).
Thurston, K (1996), “Rebuilding China”, The Newsletter of Envi-ronmental Geology: Environmental Focus (Miami University), January, pages 1–3.
Probabilistic CBA
220 Impact Assessment and Project Appraisal September 2004
Topping, A R (1995), “Ecological roulette: damming the Yangtze”, Foreign Affairs, September, page 132.
Topping, A B (1996), “Dai Qing, voice of the Yangtze River Gor-ges”, The Earth Times, available at <http://weber.cusd.edu/ dmccubbi/chinadaiqingjan11_97.htm>, last accessed 26 April 2004.
US Department of Energy (1996), China’s Energy: a forecast to 2015 (USDE, Washington DC).
Wade, B (1999), “Bringing down the dams”, The American City and County (Pittsfield) June, pages 20–33.
WCD, World Commission on Dams (2000a), Dams and Devel-opment: a new framework for decision- making (Earthscan, London).
WCD, World Commission on Dams (2000b), China Country Re-view Paper (WCD, Nairobi).
World Bank (1996), “Resettlement and development: the Bank-wide review of projects involving involuntary resettlement 1986–1993”, Environment Department paper 32, The World Bank, Washington DC.
Wu, K, and B Li (1995), “Energy development in China: national policies and regional strategies”, Energy Policy, 23(2), pages 167–178.
Youmei, L (1997), “China’s economic development and the con-struction of the Three Gorges project”, Hot Talks about TGP (CTGPC, China) pages 2–6.
Zeerbe, R O Jr, and D D Dively (1994), Benefit–Cost Analysis—- in theory and practices (Harper Collins, New York).
Zeng, Q Y, and Y H Song (1998), “Electricity market develops in China”, Transmission and Distribution, (an Itertec/Primedia publication), 50(5), May, pages 36–41.
Related Documents