Applied Econometrics with Extension 2 Time, Date, and Time Series Classes Christian Kleiber, Achim Zeileis © 2008–2017 Applied Econometrics with R – Ext. 2 – Time, Date, and Time Series Classes – 0 / 45

Welcome message from author
This document is posted to help you gain knowledge. Please leave a comment to let me know what you think about it! Share it to your friends and learn new things together.
Transcript

Applied Econometricswith
Extension 2
Time, Date, and Time SeriesClasses
Christian Kleiber, Achim Zeileis © 2008–2017 Applied Econometrics with R – Ext. 2 – Time, Date, and Time Series Classes – 0 / 45
Time, Date, and Time Series Classes
Motivation
Christian Kleiber, Achim Zeileis © 2008–2017 Applied Econometrics with R – Ext. 2 – Time, Date, and Time Series Classes – 1 / 45

Motivation
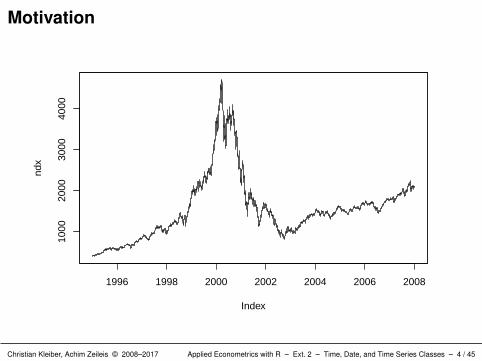
Illustration: Time series computations for NASDAQ-100 series.
Infrastructure: “zoo” series with “Date” time index for daily data.
Technical details: Deferred to later sections.
More information/examples: Zeileis & Grothendieck (2005) and Shah,Zeileis, Grothendieck (2015).
Data source: The data are take from http://finance.yahoo.com/.In fact, this can be queried interactively using get.hist.quote() fromtseries.
Christian Kleiber, Achim Zeileis © 2008–2017 Applied Econometrics with R – Ext. 2 – Time, Date, and Time Series Classes – 2 / 45

Motivation
Data in external text file ndx.txt where each row of the file looks likethis:
03 Jan 1995| 398.0004 Jan 1995| 399.65...
Read into “zoo” time series:
R> ndx <- read.zoo("ndx.dat", format = "%d %b %Y", sep = "|")R> plot(ndx)
Christian Kleiber, Achim Zeileis © 2008–2017 Applied Econometrics with R – Ext. 2 – Time, Date, and Time Series Classes – 3 / 45
Motivation
1996 1998 2000 2002 2004 2006 2008
1000
2000
3000
4000
Index
ndx
Christian Kleiber, Achim Zeileis © 2008–2017 Applied Econometrics with R – Ext. 2 – Time, Date, and Time Series Classes – 4 / 45
Motivation
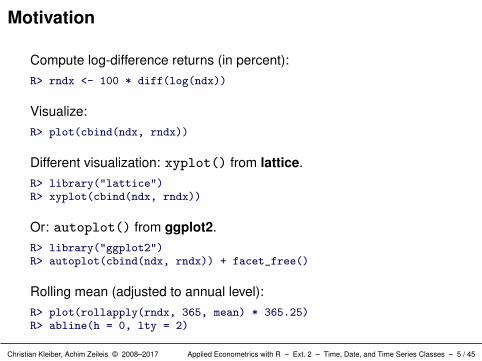
Compute log-difference returns (in percent):R> rndx <- 100 * diff(log(ndx))
Visualize:R> plot(cbind(ndx, rndx))
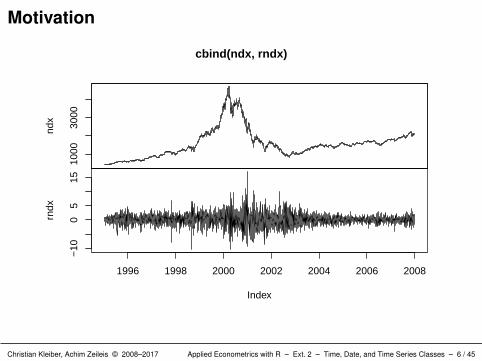
Different visualization: xyplot() from lattice.R> library("lattice")R> xyplot(cbind(ndx, rndx))
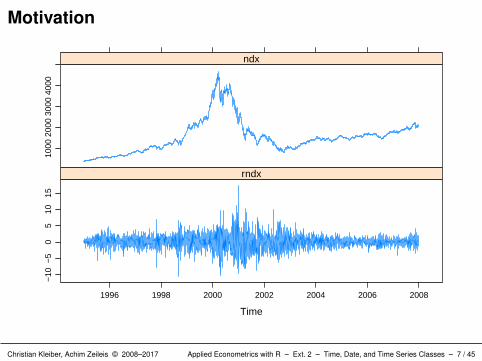
Or: autoplot() from ggplot2.R> library("ggplot2")R> autoplot(cbind(ndx, rndx)) + facet_free()
Rolling mean (adjusted to annual level):R> plot(rollapply(rndx, 365, mean) * 365.25)R> abline(h = 0, lty = 2)
Christian Kleiber, Achim Zeileis © 2008–2017 Applied Econometrics with R – Ext. 2 – Time, Date, and Time Series Classes – 5 / 45
Motivation
1000
3000
ndx
1996 1998 2000 2002 2004 2006 2008
Index
−10
05
15
rndx
cbind(ndx, rndx)
Christian Kleiber, Achim Zeileis © 2008–2017 Applied Econometrics with R – Ext. 2 – Time, Date, and Time Series Classes – 6 / 45
Motivation
Time
1000
2000
3000
4000
ndx−
10−
50
510
15
1996 1998 2000 2002 2004 2006 2008
rndx
Christian Kleiber, Achim Zeileis © 2008–2017 Applied Econometrics with R – Ext. 2 – Time, Date, and Time Series Classes – 7 / 45
Motivationndx
rndx
1995 2000 2005
1000
2000
3000
4000
−10
0
10
Index
Christian Kleiber, Achim Zeileis © 2008–2017 Applied Econometrics with R – Ext. 2 – Time, Date, and Time Series Classes – 8 / 45

Motivation
1996 1998 2000 2002 2004 2006
−10
0−
500
5010
0
Index
rolla
pply
(rnd
x, 3
65, m
ean)
* 3
65.2
5
Christian Kleiber, Achim Zeileis © 2008–2017 Applied Econometrics with R – Ext. 2 – Time, Date, and Time Series Classes – 9 / 45
Motivation
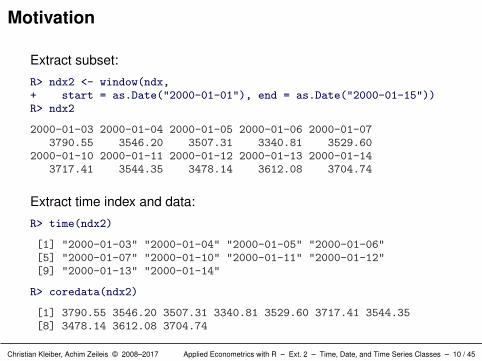
Extract subset:
R> ndx2 <- window(ndx,+ start = as.Date("2000-01-01"), end = as.Date("2000-01-15"))R> ndx2
2000-01-03 2000-01-04 2000-01-05 2000-01-06 2000-01-073790.55 3546.20 3507.31 3340.81 3529.60
2000-01-10 2000-01-11 2000-01-12 2000-01-13 2000-01-143717.41 3544.35 3478.14 3612.08 3704.74
Extract time index and data:
R> time(ndx2)
[1] "2000-01-03" "2000-01-04" "2000-01-05" "2000-01-06"[5] "2000-01-07" "2000-01-10" "2000-01-11" "2000-01-12"[9] "2000-01-13" "2000-01-14"
R> coredata(ndx2)
[1] 3790.55 3546.20 3507.31 3340.81 3529.60 3717.41 3544.35[8] 3478.14 3612.08 3704.74
Christian Kleiber, Achim Zeileis © 2008–2017 Applied Econometrics with R – Ext. 2 – Time, Date, and Time Series Classes – 10 / 45
Motivation
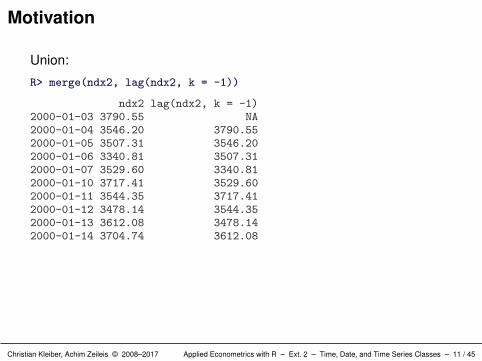
Union:
R> merge(ndx2, lag(ndx2, k = -1))
ndx2 lag(ndx2, k = -1)2000-01-03 3790.55 NA2000-01-04 3546.20 3790.552000-01-05 3507.31 3546.202000-01-06 3340.81 3507.312000-01-07 3529.60 3340.812000-01-10 3717.41 3529.602000-01-11 3544.35 3717.412000-01-12 3478.14 3544.352000-01-13 3612.08 3478.142000-01-14 3704.74 3612.08
Christian Kleiber, Achim Zeileis © 2008–2017 Applied Econometrics with R – Ext. 2 – Time, Date, and Time Series Classes – 11 / 45

Motivation
Intersection:
R> merge(ndx2, lag(ndx2, k = -1), all = FALSE)
ndx2 lag(ndx2, k = -1)2000-01-04 3546.20 3790.552000-01-05 3507.31 3546.202000-01-06 3340.81 3507.312000-01-07 3529.60 3340.812000-01-10 3717.41 3529.602000-01-11 3544.35 3717.412000-01-12 3478.14 3544.352000-01-13 3612.08 3478.142000-01-14 3704.74 3612.08
Christian Kleiber, Achim Zeileis © 2008–2017 Applied Econometrics with R – Ext. 2 – Time, Date, and Time Series Classes – 12 / 45
Motivation
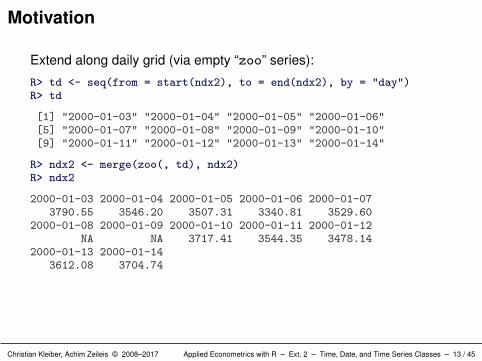
Extend along daily grid (via empty “zoo” series):
R> td <- seq(from = start(ndx2), to = end(ndx2), by = "day")R> td
[1] "2000-01-03" "2000-01-04" "2000-01-05" "2000-01-06"[5] "2000-01-07" "2000-01-08" "2000-01-09" "2000-01-10"[9] "2000-01-11" "2000-01-12" "2000-01-13" "2000-01-14"
R> ndx2 <- merge(zoo(, td), ndx2)R> ndx2
2000-01-03 2000-01-04 2000-01-05 2000-01-06 2000-01-073790.55 3546.20 3507.31 3340.81 3529.60
2000-01-08 2000-01-09 2000-01-10 2000-01-11 2000-01-12NA NA 3717.41 3544.35 3478.14
2000-01-13 2000-01-143612.08 3704.74
Christian Kleiber, Achim Zeileis © 2008–2017 Applied Econometrics with R – Ext. 2 – Time, Date, and Time Series Classes – 13 / 45

Motivation
Various strategies for dealing with NAs: linear interpolation, lastobservation carried forward.
R> merge(ndx2, na.approx(ndx2), na.locf(ndx2))
ndx2 na.approx(ndx2) na.locf(ndx2)2000-01-03 3790.55 3790.55 3790.552000-01-04 3546.20 3546.20 3546.202000-01-05 3507.31 3507.31 3507.312000-01-06 3340.81 3340.81 3340.812000-01-07 3529.60 3529.60 3529.602000-01-08 NA 3592.20 3529.602000-01-09 NA 3654.81 3529.602000-01-10 3717.41 3717.41 3717.412000-01-11 3544.35 3544.35 3544.352000-01-12 3478.14 3478.14 3478.142000-01-13 3612.08 3612.08 3612.082000-01-14 3704.74 3704.74 3704.74
Furthermore: na.omit().
Christian Kleiber, Achim Zeileis © 2008–2017 Applied Econometrics with R – Ext. 2 – Time, Date, and Time Series Classes – 14 / 45

Motivation
Compress to weekly data:R> to_monday <- function(x)+ 7 * ceiling(as.numeric(x - 3)/7) + as.Date(-3)R> ndx_d <- aggregate(ndx, to_monday, tail, 1)R> head(ndx_d, 10)
1995-01-02 1995-01-09 1995-01-16 1995-01-23 1995-01-30401.59 410.48 410.13 407.22 416.14
1995-02-06 1995-02-13 1995-02-20 1995-02-27 1995-03-06430.77 425.66 428.42 436.68 441.76
This exploits that the origin (1970-01-01, as.Date(0)) is a Thursday.
Compress to monthly data:R> ndx_m <- aggregate(ndx, as.yearmon, mean)R> head(ndx_m, 10)
Jan 1995 Feb 1995 Mar 1995 Apr 1995 May 1995 Jun 1995 Jul 1995408.007 425.107 444.035 453.099 484.352 517.553 567.712Aug 1995 Sep 1995 Oct 1995575.515 594.547 579.728
Christian Kleiber, Achim Zeileis © 2008–2017 Applied Econometrics with R – Ext. 2 – Time, Date, and Time Series Classes – 15 / 45
Time, Date, and Time Series Classes
Times and Dates
Christian Kleiber, Achim Zeileis © 2008–2017 Applied Econometrics with R – Ext. 2 – Time, Date, and Time Series Classes – 16 / 45

Times and dates
In finance, business and economics, time-annotated data is ubiquitous.Therefore, a fundamental building block for more complex structures infinance/business/economics are times and dates.
In (macro-)economics, the most important types of times are/wereyears, quarters and months.
In finance, required times are more often at daily or intra-day level.
Christian Kleiber, Achim Zeileis © 2008–2017 Applied Econometrics with R – Ext. 2 – Time, Date, and Time Series Classes – 17 / 45
Times and dates: Data structures
Base R as well as various packages provide
Classes: Implementations of time/date objects that capture allnecessary information of underlying conceptual entities.
Methods: Computations and extraction of relevant information.
Note: In principle, use of documented methods is preferred butsometimes knowledge about the internal structure is very useful.
Christian Kleiber, Achim Zeileis © 2008–2017 Applied Econometrics with R – Ext. 2 – Time, Date, and Time Series Classes – 18 / 45
Times and dates: Data structures
Typical actions and operations: (and R functions/generics)
set up time from numeric or character input, : class constructors
extract underlying numeric scale, : as.numeric() method
produce character label,: format() and as.character() method
use for plotting, : input for plot(), e.g., Axis() method
sequences of times with given spacing, : seq() method
time differences, : group generic functions or difftime()
move forward/backward on time scale, : group generic functions
comparison (less/greater). : group generic functions
Christian Kleiber, Achim Zeileis © 2008–2017 Applied Econometrics with R – Ext. 2 – Time, Date, and Time Series Classes – 19 / 45
Times and dates: Data structures
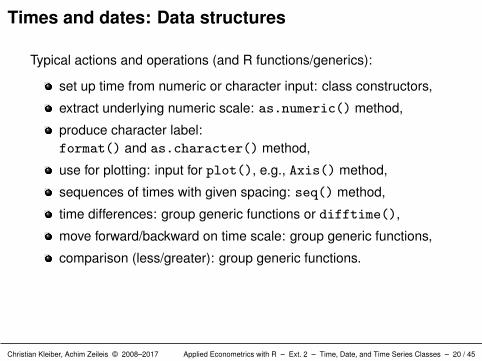
Typical actions and operations (and R functions/generics):
set up time from numeric or character input: class constructors,
extract underlying numeric scale: as.numeric() method,
produce character label:format() and as.character() method,
use for plotting: input for plot(), e.g., Axis() method,
sequences of times with given spacing: seq() method,
time differences: group generic functions or difftime(),
move forward/backward on time scale: group generic functions,
comparison (less/greater): group generic functions.
Christian Kleiber, Achim Zeileis © 2008–2017 Applied Econometrics with R – Ext. 2 – Time, Date, and Time Series Classes – 20 / 45

Time: Years
Example: 1997, 1998, 2002, 2004, . . .
Class: “numeric” or (even better) “integer”
R> ty <- c(1997, 1998, 2002, 2004)R> ty
[1] 1997 1998 2002 2004
R> as.character(ty)
[1] "1997" "1998" "2002" "2004"
R> ty[2] - ty[1]
[1] 1
R> ty + 1
[1] 1998 1999 2003 2005
Christian Kleiber, Achim Zeileis © 2008–2017 Applied Econometrics with R – Ext. 2 – Time, Date, and Time Series Classes – 21 / 45

Time: Quarters
Example: 2000 Q1, 2001 Q3, 2002 Q2, 2002 Q3, . . .
Class: “numeric” (first attempt)
R> tq <- c(2000, 2001.5, 2002.25, 2002.5)R> tq
[1] 2000.00 2001.50 2002.25 2002.50
R> tq[2] - tq[1]
[1] 1.5
R> tq + 1/4
[1] 2000.25 2001.75 2002.50 2002.75
R> as.character(tq)
[1] "2000" "2001.5" "2002.25" "2002.5"
Christian Kleiber, Achim Zeileis © 2008–2017 Applied Econometrics with R – Ext. 2 – Time, Date, and Time Series Classes – 22 / 45
Time: Quarters
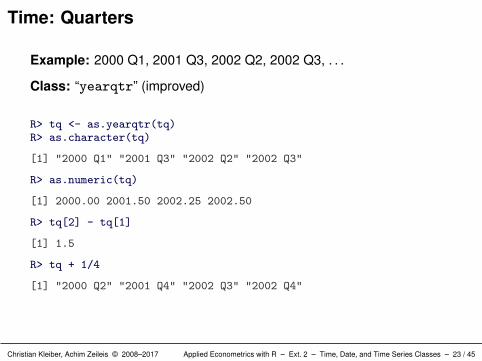
Example: 2000 Q1, 2001 Q3, 2002 Q2, 2002 Q3, . . .
Class: “yearqtr” (improved)
R> tq <- as.yearqtr(tq)R> as.character(tq)
[1] "2000 Q1" "2001 Q3" "2002 Q2" "2002 Q3"
R> as.numeric(tq)
[1] 2000.00 2001.50 2002.25 2002.50
R> tq[2] - tq[1]
[1] 1.5
R> tq + 1/4
[1] "2000 Q2" "2001 Q4" "2002 Q3" "2002 Q4"
Christian Kleiber, Achim Zeileis © 2008–2017 Applied Econometrics with R – Ext. 2 – Time, Date, and Time Series Classes – 23 / 45
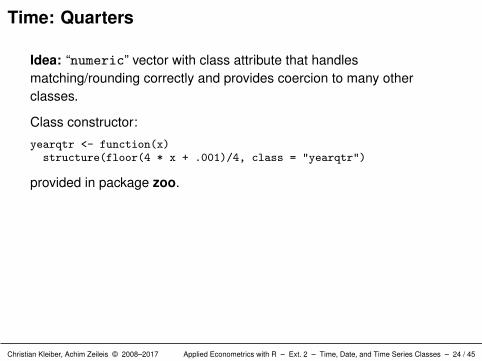
Time: Quarters
Idea: “numeric” vector with class attribute that handlesmatching/rounding correctly and provides coercion to many otherclasses.
Class constructor:
yearqtr <- function(x)structure(floor(4 * x + .001)/4, class = "yearqtr")
provided in package zoo.
Christian Kleiber, Achim Zeileis © 2008–2017 Applied Econometrics with R – Ext. 2 – Time, Date, and Time Series Classes – 24 / 45
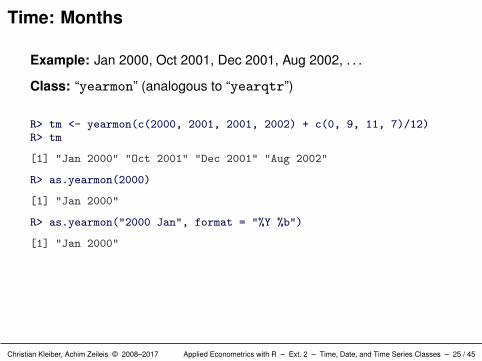
Time: Months
Example: Jan 2000, Oct 2001, Dec 2001, Aug 2002, . . .
Class: “yearmon” (analogous to “yearqtr”)
R> tm <- yearmon(c(2000, 2001, 2001, 2002) + c(0, 9, 11, 7)/12)R> tm
[1] "Jan 2000" "Oct 2001" "Dec 2001" "Aug 2002"
R> as.yearmon(2000)
[1] "Jan 2000"
R> as.yearmon("2000 Jan", format = "%Y %b")
[1] "Jan 2000"
Christian Kleiber, Achim Zeileis © 2008–2017 Applied Econometrics with R – Ext. 2 – Time, Date, and Time Series Classes – 25 / 45
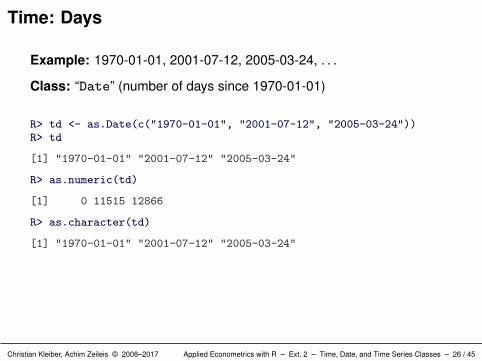
Time: Days
Example: 1970-01-01, 2001-07-12, 2005-03-24, . . .
Class: “Date” (number of days since 1970-01-01)
R> td <- as.Date(c("1970-01-01", "2001-07-12", "2005-03-24"))R> td
[1] "1970-01-01" "2001-07-12" "2005-03-24"
R> as.numeric(td)
[1] 0 11515 12866
R> as.character(td)
[1] "1970-01-01" "2001-07-12" "2005-03-24"
Christian Kleiber, Achim Zeileis © 2008–2017 Applied Econometrics with R – Ext. 2 – Time, Date, and Time Series Classes – 26 / 45

Time: Days
R> format(as.Date(td), "%B %d, %Y")
[1] "January 01, 1970" "July 12, 2001" "March 24, 2005"
R> td[2] - td[1]
Time difference of 11515 days
R> td + 1
[1] "1970-01-02" "2001-07-13" "2005-03-25"
R> as.Date(2)
[1] "1970-01-03"
Christian Kleiber, Achim Zeileis © 2008–2017 Applied Econometrics with R – Ext. 2 – Time, Date, and Time Series Classes – 27 / 45

Time: Intra-day
Example: 1970-01-01 00:00:00, 2001-07-12 12:23:59, . . .
Class: “chron” (days since 1970-01-01, without time zone or daylightsavings time)
R> tc <- chron(c(0, 11515 + 12/24 + 23/1440 + 59/86400))R> tc
[1] (01/01/70 00:00:00) (07/12/01 12:23:59)
R> as.character(tc)
[1] "(01/01/70 00:00:00)" "(07/12/01 12:23:59)"
R> as.numeric(tc)
[1] 0.0 11515.5
R> paste(format(as.Date(dates(tc))), format(times(tc)%%1))
[1] "1970-01-01 00:00:00" "2001-07-12 12:23:59"
R> tc[2] - tc[1]
Time in days:[1] 11515.5
Christian Kleiber, Achim Zeileis © 2008–2017 Applied Econometrics with R – Ext. 2 – Time, Date, and Time Series Classes – 28 / 45
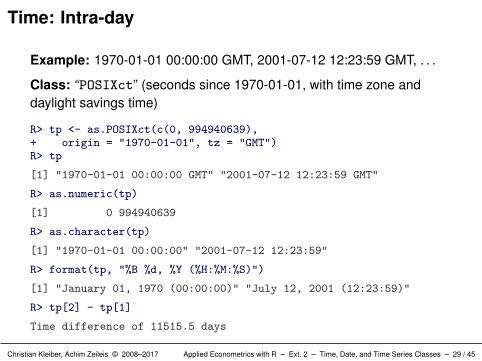
Time: Intra-day
Example: 1970-01-01 00:00:00 GMT, 2001-07-12 12:23:59 GMT, . . .
Class: “POSIXct” (seconds since 1970-01-01, with time zone anddaylight savings time)
R> tp <- as.POSIXct(c(0, 994940639),+ origin = "1970-01-01", tz = "GMT")R> tp
[1] "1970-01-01 00:00:00 GMT" "2001-07-12 12:23:59 GMT"
R> as.numeric(tp)
[1] 0 994940639
R> as.character(tp)
[1] "1970-01-01 00:00:00" "2001-07-12 12:23:59"
R> format(tp, "%B %d, %Y (%H:%M:%S)")
[1] "January 01, 1970 (00:00:00)" "July 12, 2001 (12:23:59)"
R> tp[2] - tp[1]
Time difference of 11515.5 days
Christian Kleiber, Achim Zeileis © 2008–2017 Applied Econometrics with R – Ext. 2 – Time, Date, and Time Series Classes – 29 / 45

Times and dates: Coercion
Coercion: conversions between different time/date formats.
R> as.Date(tq)
[1] "2000-01-01" "2001-07-01" "2002-04-01" "2002-07-01"
R> as.yearqtr(td)
[1] "1970 Q1" "2001 Q3" "2005 Q1"
R> as.yearmon(tp)
[1] "Jan 1970" "Jul 2001"
R> as.Date(tp)
[1] "1970-01-01" "2001-07-12"
R> as.chron(tp)
[1] (01/01/70 00:00:00) (07/12/01 12:23:59)
Christian Kleiber, Achim Zeileis © 2008–2017 Applied Econometrics with R – Ext. 2 – Time, Date, and Time Series Classes – 30 / 45
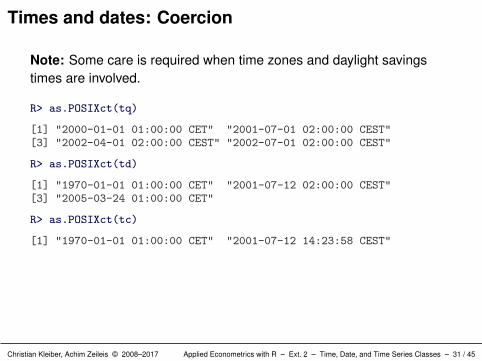
Times and dates: Coercion
Note: Some care is required when time zones and daylight savingstimes are involved.
R> as.POSIXct(tq)
[1] "2000-01-01 01:00:00 CET" "2001-07-01 02:00:00 CEST"[3] "2002-04-01 02:00:00 CEST" "2002-07-01 02:00:00 CEST"
R> as.POSIXct(td)
[1] "1970-01-01 01:00:00 CET" "2001-07-12 02:00:00 CEST"[3] "2005-03-24 01:00:00 CET"
R> as.POSIXct(tc)
[1] "1970-01-01 01:00:00 CET" "2001-07-12 14:23:58 CEST"
Christian Kleiber, Achim Zeileis © 2008–2017 Applied Econometrics with R – Ext. 2 – Time, Date, and Time Series Classes – 31 / 45
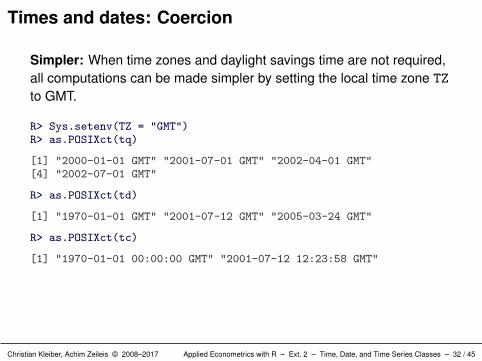
Times and dates: Coercion
Simpler: When time zones and daylight savings time are not required,all computations can be made simpler by setting the local time zone TZ
to GMT.
R> Sys.setenv(TZ = "GMT")R> as.POSIXct(tq)
[1] "2000-01-01 GMT" "2001-07-01 GMT" "2002-04-01 GMT"[4] "2002-07-01 GMT"
R> as.POSIXct(td)
[1] "1970-01-01 GMT" "2001-07-12 GMT" "2005-03-24 GMT"
R> as.POSIXct(tc)
[1] "1970-01-01 00:00:00 GMT" "2001-07-12 12:23:58 GMT"
Christian Kleiber, Achim Zeileis © 2008–2017 Applied Econometrics with R – Ext. 2 – Time, Date, and Time Series Classes – 32 / 45
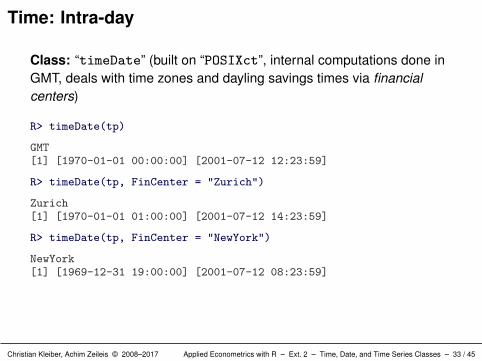
Time: Intra-day
Class: “timeDate” (built on “POSIXct”, internal computations done inGMT, deals with time zones and dayling savings times via financialcenters)
R> timeDate(tp)
GMT[1] [1970-01-01 00:00:00] [2001-07-12 12:23:59]
R> timeDate(tp, FinCenter = "Zurich")
Zurich[1] [1970-01-01 01:00:00] [2001-07-12 14:23:59]
R> timeDate(tp, FinCenter = "NewYork")
NewYork[1] [1969-12-31 19:00:00] [2001-07-12 08:23:59]
Christian Kleiber, Achim Zeileis © 2008–2017 Applied Econometrics with R – Ext. 2 – Time, Date, and Time Series Classes – 33 / 45
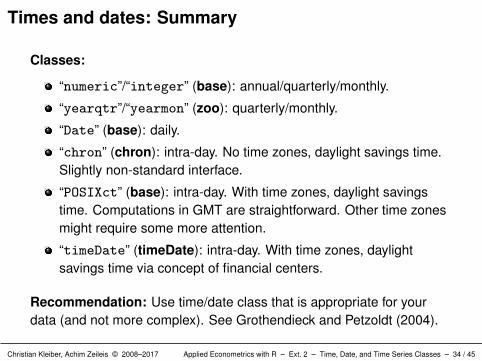
Times and dates: Summary
Classes:
“numeric”/“integer” (base): annual/quarterly/monthly.
“yearqtr”/“yearmon” (zoo): quarterly/monthly.
“Date” (base): daily.
“chron” (chron): intra-day. No time zones, daylight savings time.Slightly non-standard interface.
“POSIXct” (base): intra-day. With time zones, daylight savingstime. Computations in GMT are straightforward. Other time zonesmight require some more attention.
“timeDate” (timeDate): intra-day. With time zones, daylightsavings time via concept of financial centers.
Recommendation: Use time/date class that is appropriate for yourdata (and not more complex). See Grothendieck and Petzoldt (2004).
Christian Kleiber, Achim Zeileis © 2008–2017 Applied Econometrics with R – Ext. 2 – Time, Date, and Time Series Classes – 34 / 45
Time, Date, and Time Series Classes
Time Series
Christian Kleiber, Achim Zeileis © 2008–2017 Applied Econometrics with R – Ext. 2 – Time, Date, and Time Series Classes – 35 / 45
Time series: Structure
Time/date objects are usually not interesting as standalone objects butare used to annotate other data.
The most important application of this are time series where there is foreach time point a vector of (typically numeric) observations.
The observations are most easily arranged in a vector (of length n) oran n × k matrix whose elements are ordered and indexed by n differenttimes/dates.
Christian Kleiber, Achim Zeileis © 2008–2017 Applied Econometrics with R – Ext. 2 – Time, Date, and Time Series Classes – 36 / 45
Time series: Structure
Types of time series:
irregular (unequally spaced),
strictly regular (equally spaced),
or have an underlying regularity, i.e., be created from a regularseries by omitting some observations.
For strictly regular series: the whole time index can be reconstructedfrom start, end and time difference between two observations. Thereciprocal value of the time difference is also called frequency.
For irregular series: all time indexes need to be stored in a vector oflength n.
Christian Kleiber, Achim Zeileis © 2008–2017 Applied Econometrics with R – Ext. 2 – Time, Date, and Time Series Classes – 37 / 45
Time series: Implementations
There are many implementations for time series data in R.
Virtually all of them are focused on numeric data and fix someparticular class for the time index. The most important are:
“ts” (base): regular “numeric” time index (e.g., annual, quarterly,monthly),
“its” (its): irregular time index of class “POSIXct”,
“irts” (tseries): irregular time index of class “POSIXct”,
“timeSeries” (timeSeries): irregular time index of class“timeDate”,
“zoo” (zoo): regular or irregular time index of arbitrary class.
“xts” (xts): built on top of “zoo”, with specialized infrastructure fortime indexes of class “Date”, “POSIXct”, “chron”, “timeDate”,“yearmon”, “yearqtr”, . . .
Christian Kleiber, Achim Zeileis © 2008–2017 Applied Econometrics with R – Ext. 2 – Time, Date, and Time Series Classes – 38 / 45
Time series: Implementations
Advantages of “zoo”:
Can be used with arbitrary time indexes (i.e., you could alsoprovide your own specialized class).
Standard interface: employs R’s standard methods and introducesonly few new generics.
Talks to all other classes: coercion functions are available, e.g.,as.ts(), as.timeSeries(), etc. that work if the time index is ofthe required class. The reverse as.zoo() always works.
Recommendations:
Use “zoo” for storage and basic computations.
If necessary, coerce to other classes for analysis etc.
“xts” is helpful extension of “zoo” for date/time indexes.
Christian Kleiber, Achim Zeileis © 2008–2017 Applied Econometrics with R – Ext. 2 – Time, Date, and Time Series Classes – 39 / 45
Time series: Operations
Typical operations for time series: (and suitable R generics)
visualization, plot(),
extraction of observations or associated times,time() (and coredata()),
lags and differences, lag() and diff(),
subsets in a certain time window, window(),
union and intersection of several time series, merge(),
aggregation along a coarser time grid, aggregate(),
rolling computations such as means or standard deviations.(rollapply()).
Christian Kleiber, Achim Zeileis © 2008–2017 Applied Econometrics with R – Ext. 2 – Time, Date, and Time Series Classes – 40 / 45
Time series: Operations
Typical operations for time series (and suitable R generics):
visualization: plot(),
extraction of observations or associated times:time() (and coredata()),
lags and differences: lag() and diff(),
subsets in a certain time window: window(),
union and intersection of several time series: merge(),
aggregation along a coarser time grid: aggregate(),
rolling computations such as means or standard deviations:(rollapply()).
Christian Kleiber, Achim Zeileis © 2008–2017 Applied Econometrics with R – Ext. 2 – Time, Date, and Time Series Classes – 41 / 45
Time series: Implementations
How do arbitrary time indexes in “zoo” work?
To provide the desired functionality, few actions are required:
ordering, ORDER() (by default calling the non-generic order()),
matching, MATCH() (by default calling the non-generic match()),
combining, c(),
subsetting, [,
querying length n. length().
Christian Kleiber, Achim Zeileis © 2008–2017 Applied Econometrics with R – Ext. 2 – Time, Date, and Time Series Classes – 42 / 45
Time series: Implementations
How do arbitrary time indexes in “zoo” work?
To provide the desired functionality, few actions are required:
ordering: ORDER() (by default calling the non-generic order()),
matching: MATCH() (by default calling the non-generic match()),
combining: c(),
subsetting: [,,
querying length n: length().
Christian Kleiber, Achim Zeileis © 2008–2017 Applied Econometrics with R – Ext. 2 – Time, Date, and Time Series Classes – 43 / 45
Time series: Implementations
If suitable methods are available for the chosen time index (including alltime/date classes above), all tasks (merging, aggregating, etc.) can beperformed without any knowledge about the particular time index class.
For some special operations, further methods are useful/necessary,e.g., axis()/Axis(), as.numeric(), as.character().
If the time index is of a particular class, coercions to and from othertime series classes can be easily provided.
Christian Kleiber, Achim Zeileis © 2008–2017 Applied Econometrics with R – Ext. 2 – Time, Date, and Time Series Classes – 44 / 45
References
Grothendieck G, Petzoldt T (2004). “R Help Desk: Date and TimeClasses in R.” R News, 4(1), 29–32.
Ripley BD, Hornik K (2001). “Date-Time Classes.” R News, 1(2), 8–11.
Shah A, Zeileis A, Grothendieck G (2015). “zoo Quick Reference.”Package vignette. Version 1.7-12.
Zeileis A, Grothendieck G (2005). “zoo: S3 Infrastructure for Regularand Irregular Time Series.” Journal of Statistical Software, 14(6), 1–27.doi:10.18637/jss.v014.i06. Updated version contained asvignette in zoo package.
Christian Kleiber, Achim Zeileis © 2008–2017 Applied Econometrics with R – Ext. 2 – Time, Date, and Time Series Classes – 45 / 45
Related Documents