Bimetallic Pt-Metal catalysts for the decomposition of methanol: Effect of secondary metal on the oxidation state, activity, and selectivity of Pt Jason R. Croy a , S. Mostafa a,b , L. Hickman a , H. Heinrich a,c , B. Roldan Cuenya a,b, * a Department of Physics, University of Central Florida, Orlando, FL 32816, United States b Department of Civil and Environmental Engineering, University of Central Florida, Orlando, FL 32816, United States c Center of Advanced Materials Processing and Characterization, University of Central Florida, Orlando, FL 32816, United States 1. Introduction Pt-Metal (Pt-M) bimetallic catalysts are important in a variety of applications ranging from fuel cells [1] to thermal coatings [2]. In addition, recent years have witnessed a surge in the interest of methanol (MeOH), especially as a potential storage fuel for hydrogen, ultimately used for the production of electricity in on- board applications such as the direct methanol fuel cell (DMFC), portable electronics, or stationary power generation. These applica- tions potentially involve electro-oxidation, steam reforming, and the direct decomposition of MeOH, each encompassing unique reaction conditions [3]. In order to take advantage of Pt-M systems in the design of new catalysts for any of these applications, the structural, chemical, and electronic modifications, brought about by the addition of secondary metals [4–11], need to be fully understood. In particular, the surface compositions of such catalysts are influenced by a number of factors. Besides such familiar properties as surface energy, atomic volume, and heats of sublimation, nanoscale sys- tems require additional considerations. For instance, it has been shown theoretically that Pt atoms may preferentially segregate to sites of low (edges, vertices, etc.) or high (facets) coordination depending on the structure of the particles as well as the metal M [12]. In addition, the presence of oxygen has been shown to heavily influence atomic segregation in nanoparticles (NPs), and the presence of metal M on the NP surface can affect the stability of oxide species on active nanocatalysts [13,14]. In reference to fuel cells, alloying Pt with metals such as Fe, Ru, Ni, Co, as well as others, has been reported to enhance the oxygen reduction reaction (ORR) [5,6], increase activity [15], and enhance resistance to CO poisoning [16]. In connection with the latter, Pt-Ru catalysts are known to be efficient and some detailed theoretical studies already exist concerning this catalyst’s role in CO oxidation [17]. However, as stated earlier, these systems hold importance in a broader sense Applied Catalysis A: General 350 (2008) 207–216 ARTICLE INFO Article history: Received 14 June 2008 Received in revised form 9 August 2008 Accepted 17 August 2008 Available online 23 August 2008 Keywords: Pt nanoparticles Micelles Pt-oxides XPS AFM TEM Mass spectrometry Packed-bed mass flow reactor Methanol decomposition Bimetallic nanoparticles Segregation Catalysis ABSTRACT We present here a study of methanol (MeOH) decomposition over a series of bimetallic Pt-M catalysts, with M = Au, Pd, Ru, Fe. All samples have the same initial size distribution (3 nm nanoparticle height), support (ZrO 2 ), and preparation conditions. Therefore, differences in the electronic and catalytic properties of the samples tested are related directly to the addition of the secondary metals (M). We find that the oxidation state as well as the activity of Pt is heavily influenced by the addition of the secondary metal. PtO is found to be highly stable in these systems and increasing concentrations of metallic Pt are associated with the surface segregation of metal M due to its affinity for the oxygen present during air annealing. ß 2008 Elsevier B.V. All rights reserved. * Corresponding author. E-mail address: [email protected] (B.R. Cuenya). Contents lists available at ScienceDirect Applied Catalysis A: General journal homepage: www.elsevier.com/locate/apcata 0926-860X/$ – see front matter ß 2008 Elsevier B.V. All rights reserved. doi:10.1016/j.apcata.2008.08.013

Welcome message from author
This document is posted to help you gain knowledge. Please leave a comment to let me know what you think about it! Share it to your friends and learn new things together.
Transcript

Applied Catalysis A: General 350 (2008) 207–216
Bimetallic Pt-Metal catalysts for the decomposition of methanol: Effectof secondary metal on the oxidation state, activity, and selectivity of Pt
Jason R. Croy a, S. Mostafa a,b, L. Hickman a, H. Heinrich a,c, B. Roldan Cuenya a,b,*a Department of Physics, University of Central Florida, Orlando, FL 32816, United Statesb Department of Civil and Environmental Engineering, University of Central Florida, Orlando, FL 32816, United Statesc Center of Advanced Materials Processing and Characterization, University of Central Florida, Orlando, FL 32816, United States
A R T I C L E I N F O
Article history:
Received 14 June 2008
Received in revised form 9 August 2008
Accepted 17 August 2008
Available online 23 August 2008
Keywords:
Pt nanoparticles
Micelles
Pt-oxides
XPS
AFM
TEM
Mass spectrometry
Packed-bed mass flow reactor
Methanol decomposition
Bimetallic nanoparticles
Segregation
Catalysis
A B S T R A C T
We present here a study of methanol (MeOH) decomposition over a series of bimetallic Pt-M catalysts,
with M = Au, Pd, Ru, Fe. All samples have the same initial size distribution (�3 nm nanoparticle height),
support (ZrO2), and preparation conditions. Therefore, differences in the electronic and catalytic
properties of the samples tested are related directly to the addition of the secondary metals (M). We find
that the oxidation state as well as the activity of Pt is heavily influenced by the addition of the secondary
metal. PtO is found to be highly stable in these systems and increasing concentrations of metallic Pt are
associated with the surface segregation of metal M due to its affinity for the oxygen present during air
annealing.
� 2008 Elsevier B.V. All rights reserved.
Contents lists available at ScienceDirect
Applied Catalysis A: General
journa l homepage: www.e lsev ier .com/ locate /apcata
1. Introduction
Pt-Metal (Pt-M) bimetallic catalysts are important in a variety ofapplications ranging from fuel cells [1] to thermal coatings [2].In addition, recent years have witnessed a surge in the interestof methanol (MeOH), especially as a potential storage fuel forhydrogen, ultimately used for the production of electricity in on-board applications such as the direct methanol fuel cell (DMFC),portable electronics, or stationary power generation. These applica-tions potentially involve electro-oxidation, steam reforming, and thedirect decomposition of MeOH, each encompassing unique reactionconditions [3].
In order to take advantage of Pt-M systems in the design of newcatalysts for any of these applications, the structural, chemical,and electronic modifications, brought about by the addition of
* Corresponding author.
E-mail address: [email protected] (B.R. Cuenya).
0926-860X/$ – see front matter � 2008 Elsevier B.V. All rights reserved.
doi:10.1016/j.apcata.2008.08.013
secondary metals [4–11], need to be fully understood. In particular,the surface compositions of such catalysts are influenced bya number of factors. Besides such familiar properties as surfaceenergy, atomic volume, and heats of sublimation, nanoscale sys-tems require additional considerations. For instance, it has beenshown theoretically that Pt atoms may preferentially segregate tosites of low (edges, vertices, etc.) or high (facets) coordinationdepending on the structure of the particles as well as the metal M[12]. In addition, the presence of oxygen has been shown to heavilyinfluence atomic segregation in nanoparticles (NPs), and thepresence of metal M on the NP surface can affect the stability ofoxide species on active nanocatalysts [13,14]. In reference to fuelcells, alloying Pt with metals such as Fe, Ru, Ni, Co, as well as others,has been reported to enhance the oxygen reduction reaction(ORR) [5,6], increase activity [15], and enhance resistance to COpoisoning [16]. In connection with the latter, Pt-Ru catalysts areknown to be efficient and some detailed theoretical studies alreadyexist concerning this catalyst’s role in CO oxidation [17]. However,as stated earlier, these systems hold importance in a broader sense

J.R. Croy et al. / Applied Catalysis A: General 350 (2008) 207–216208
than power generation alone [18–32] and a large number of workshave been dedicated to understanding their synthesis, character-ization, and catalytic properties [33–44]
Furthermore, with the ever increasing industrial use ofnanomaterials, their impact on the environment has become anissue of great importance. Specifically, thermally or mechanicallyinduced emissions of particulate Pt from automobile catalyticconverters is a source of toxicological concern [45–48]. Therefore,not only are the activity, selectivity, and stability of the workingcatalysts important, but so also is the state in which they might beemitted into the environment upon reaction (oxidated, chlori-nated, etc.). Although catalysts are prepared in a certain state (i.e.Pt0), the oxidation state of the working catalyst might be different,and how this state evolves and reacts under environmentalconditions is of interest.
In general, it is the surface properties of alloys which arecredited with observed catalytic improvements, and as we willshow in this article, the nature of the secondary metal, as well asthe preparation and pretreatment conditions, have a largeinfluence over the final composition and oxidation state of thesurface and its active components. We present here an investiga-tion of the influence that the addition of M = Au, Pd, Ru, and Fe hason the oxidation state, activity, and selectivity of supportedPt0.8M0.2 nanoparticles. We use as a probe reaction the decom-position of MeOH. Previous studies by our group [49,50] haveshown that the size of Pt nanoparticle catalysts, as well as theparticle support, can influence the type (PtO, PtO2) and stability ofthe metal oxide shell present in ‘‘real-world’’ catalysts underrealistic reaction conditions. Indeed, there has been recent interestin the role of oxidized versus metallic species in the activity ofseveral systems where oxidized metals may contain some catalyticadvantage [51,52]. To remove any ambiguities in the present study,we have used particles of the same average size for all samples anda common support, zirconia. Under these conditions the observedeffects can be directly related to the addition of the secondarymetal.
2. Experimental
Non-polar/polar diblock copolymers [poly(styrene)-block-poly(2vinylpyridine) Polymer Source Inc.] were dissolved in anon-polar solvent (toluene) in order to obtain spherical nano-cages(inverse micelles). These micelles were then loaded with metalsalts (H2PtCl6�6H2O, HAuCl4�3H2O, RuCl3, PdCl2, FeCl3) to produceself-confined and size-selected Metal and Pt-Metal (Pt-M) NPs. Themetal content of all bimetallic samples by weight (wt) was 80% Ptand 20% secondary metal. The particle size was controlled by usinga polymer with a specific head length [PS(27700)-PVP(4300), i.e.constant PVP molecular weight for all samples] and by selecting ametal-salt/polymer-head (PVP) concentration for the solution of0.2 for all samples [53–55]. The solution was then mixed withnanocrystalline ZrO2 (�45 nm, Alfa Aesar) in the form of a powder.All samples were dried in air at �100 8C for 24 h then placed in atubular furnace, open to the air, for calcination at 500 8C for 2.5 h.Each catalyst sample had a total weight of 50 mg and contained 1%by weight metal.
The powder samples were transferred to an ultra high vacuumsystem (UHV, SPECS GmbH) for analysis by X-ray photoelectronspectroscopy (XPS). XPS data were collected using a monochro-matic X-ray source (Al Ka, 1486.6 eV) operating at 350 W and aflood gun was used to correct for sample charging duringmeasurement. All spectra were referenced to the Zr 3d5/2 [ZrO2]peak at 182.6 eV [56].
Catalytic decomposition of methanol in the vapor phase wascarried out in a packed-bed mass flow reactor with a vertical quartz
tube (inner diameter = 4 mm) serving as the reactor vessel. Athermocouple (K-type) in contact with the reactor was used tomonitor temperature and the entire assembly was insulated tominimize heat losses. Immediately prior to the reaction allcatalysts were heated for 1 h at �200 8C (below the initialcalcination temperatures of 500 8C used to remove the polymericnanoparticle shell) in a flow of He at 10 ml/min. Activities weremeasured at atmospheric pressure in the range of 100–220 8C. Thecomposition of the feed was 0.05% MeOH relative to the flow of He,as determined by the partial pressures of He and the mainfragment ion of MeOH (m/q = 31). Further details of the experi-mental set up and measurement conditions can be found in [49].
The polymer-salt solutions were also dip-coated on SiO2/Si(0 0 1) substrates in order to obtain particle size information(height) via atomic force microscopy (AFM) with a NanoscopeMultimode (Digital Instruments) microscope operating in tappingmode. Transmission electron microscopy (TEM) was carried out onthe powder samples with a Tecnai F30 TEM operating at anaccelerating voltage of 300 kV. In addition, energy dispersive X-rayanalysis (EDX) was conducted on each sample.
3. Results and discussion
3.1. Morphological and structural characterization
Fig. 1 displays representative images of the nanoparticlepolymeric solutions dip-coated on SiO2/Si(0 0 1). Here the threeimages show bimetallic samples [Pt-Au (a), Pt-Pd (b), and Pt-Fe (c)]before the removal of the polymeric shell. The images demonstratethe validity of our preparation method for the synthesis ofbimetallic catalysts with narrow size distributions. Analysis of theimages taken after the removal of the polymer (not shown), byheating in ultrahigh vacuum (UHV) for 30 min at 500 8C, gives anaverage particle size (height) of �3 nm.
Fig. 2 shows elemental distribution maps of Pt (a) and Fe (b)obtained by TEM in the same region of the Pt-Fe sample. We cansee a uniform distribution of the metals with Pt and Fe appearingin the same regions within a nanoparticle. Fig. 2(c) shows a facetedparticle from the Pt-Au sample with a measured lattice parameterof 3.96 � 0.02 A. A pure Pt particle in a monometallic Pt sample witha lattice parameter of 3.74 � 0.04 A is displayed in Fig. 2(d). Thelattice parameters for bulk Pt, bulk Au, and a Pt0.8Au0.2 alloy are 3.92,4.07, and 3.94 A, respectively [57,58]. Thus, our value of 3.96 A forthe Pt-Au particle is in agreement with the formation of a Pt-rich, Pt-Au alloy. The TEM images of Fig. 2 reveal our particles to be �10 nmin diameter.
3.2. Electronic and chemical characterization
Figs. 3 and 4 show XPS spectra and Fig. 5 exhibits relatedcompositional information for the monometallic Pt and Pt-Mnanoparticle samples deposited on ZrO2 powder. The fits weredone after linear background subtraction using a product ofGaussian and Lorentzian functions, as defined in the software CASAXPS, with the maximum width (FWHM) of each component heldconstant [Pt0 (1.8 eV), PtO (2.4 eV), PtO2 (2.8 eV)] from spectrum tospectrum. The distinction of PtO and PtO2 species, especially onsmall NPs, is difficult. An initial attempt to fit the Pt-4f region of oursamples with only two doublets (one corresponding to Pt0, theother to PtOx) was made, but such a fit resulted in an unreasonablylarge FWHW (>3). Fig. 3 displays data from the Pt-4f core-levelregion. The vertical solid line in Fig. 3 marks the position of the 4f7/2
peak of metallic Pt at 71.7 eV. The two dashed lines represent theBEs of the 4f7/2 peaks of PtO and PtO2 at 73.0 and 75.3 eV,respectively [59]. These reference values for PtO and PtO2, as well

Fig. 1. AFM images of (a) Pt-Au, (b) Pt-Pd, and (c) Pt-Fe NPs (Pt-M 20% wt M)
supported on SiO2/Si(0 0 1). The images were taken before polymer removal.
J.R. Croy et al. / Applied Catalysis A: General 350 (2008) 207–216 209
as the energy difference between Pt0 and PtO2 (�3.6 eV), areconsistent with several reports of supported Pt and Pt-M systems[60,61], as well as with preliminary data obtained by our group onsimilarly synthesized Pt NPs supported on thin film oxide surfacesafter exposure to atomic oxygen in UHV and subsequent annealing.The Pt0 4f7/2 peak in our monometallic Pt NPs is shifted 0.6 eVhigher than the value of bulk Pt [62]. This positive shift may be
attributed to final state effects in our small clusters and/or aninteraction with the support itself [63]. One possible interaction isthe formation of interfacial Pt-Zr compounds. Alloying of Pt and Zrhas been observed at 500 8C (our annealing temperature) [64] andthe observed shift to higher binding energy of the Pt0 4f7/2 peak isin agreement with Ref. [65] as well as data from our group on thetemperature-dependent reduction of ZrO2-supported Pt NPs [66].What effect these possible interfacial compounds have on thechemical properties of our systems will be investigated in moredetail in the future. The relative content of the different Pt speciesand XPS binding energies obtained from the analysis of the data inFig. 3 are summarized in Table 1. The estimated error in the fit ofthe area of the peaks is �3%. An interesting trend appears in theconcentration of Pt-oxides for these samples as shown in Fig. 5. ThePt-Au is the least metallic in composition being 22% Pt0. As we go fromPt-Au to Pt-Pd we see a substantial increase in the amount of Pt0. Thisincrease continues as we go across Fig. 5 to Pt-Fe with a metallic Ptcontent of 60%.
Fig. 4 shows XPS spectra of the most intense photoelectronpeaks associated with the secondary metals before and after theaddition of Pt. The following core-level regions are shown in Fig. 4:(a) Au-4f, (b) Fe-2p, (c) Pd-3d (and ZrO2-3p), and (d) Ru-3d. InFig. 4(c) we can see that the Pd-3d region overlaps with the ZrO2-3p substrate peaks and we have superimposed the Pd sample’sspectrum on that of the ZrO2 substrate’s (bottom). The Pt-Pdsample is shown on top. Similarly for Ru, shown in Fig. 4(d), the Ru-3d region coincides with C-1s and a deconvolution has been doneto identify the constituent components of the monometallic Ru(bottom) and the Pt-Ru (top) samples.
In order to better understand the segregation phenomenaoccurring in our bimetallic NPs during the post-synthesis annealingtreatment in air at 500 8C, several fundamental properties of themonometallic metals should be kept in mind. For example, the orderof decreasing size for the atomic radii (metallic and Wigner-Seitz) ofour metals is Au > Pt > Pd> Ru > Fe [67,68]. The order of the heatsof sublimation from high to low is Ru > Pt > Fe� Pd > Au [69,70].The surface energies from high to low go as Ru > Pt > Fe > Pd> Au[71] (experimental values). And finally, since our bimetallic NPswere annealed in the presence of oxygen (air), a parameter thatshould be taken into account is the heat of formation of the differentoxides. Starting with the most stable oxide, the trend goes asRu > Fe > Pd> Pt > Au [67].
Although all of the above trends refer to bulk systems, due to therelatively large size of our nanoparticles (�10 nm in diameter) theyare expected to be a reasonable referent for our studies. Theoreticallyit has been shown (for Cu-Ni systems) that clusters containing lessthan 1000 atoms are dominated by geometric effects, while thoseabove this size are driven by thermodynamic effects reported for themacroscopic systems [72]. Using data from Ref. [12], a cubo-octahedral fcc Pt NP of 5 nm in diameter consists of at least 4000atoms. Therefore, thermodynamic arguments of segregation givenabove should be valid. However, from the above parameters, thedifferent affinities for oxygen of the distinct secondary metals arebelieved to play a key role. Alloys are notably affected by adsorbatesfrom the surrounding gaseous environment and the metal havingthe highest affinity for these adsorbates will preferentially segregateto the surface [73,74]. This segregation effect has been observed, forexample, in Pt-Rh catalysts [73]. There, the performance of thecatalysts varied between pure Pt and pure Rh depending on thesurface concentrations of each metal, with Rh preferentiallyoccupying the surface under oxidizing conditions, and Pt underreducing conditions. We might note that many of the studiesmentioned in Ref. [73] are on single crystals under controlledvacuum environments whereas our samples consist of multi-faceted, metal-oxide-supported, metallic nanoclusters. Because all

Fig. 2. (a) Elemental distribution map (using energy-filtered TEM) of the Pt-Fe NPs supported on ZrO2 showing homogeneous distribution of Pt (a) and Fe (b) in individual
clusters. (c) High resolution image of a particle in the Pt-Au sample and (d) a particle in the pure Pt sample.
J.R. Croy et al. / Applied Catalysis A: General 350 (2008) 207–216210
of our samples have been prepared under identical conditions, havesimilar size distributions, are on the same support (ZrO2), and werecalcined in air at the same temperature, the varying concentrationsof the different Pt and PtOx species (Table 1) must be related to thetendency of the secondary metals to segregate to the surface whereoxygen is present during annealing. Therefore, larger amounts ofPtOx in our samples could be related to the presence of a largernumber of superficial Pt atoms, while lower PtOx/Pt0 ratios wouldindicate that the secondary metal has segregated to the nanoparticlesurface, minimizing Pt oxidation.
From the Pt-Au spectrum in Fig. 3, and Table 1, we see that theaddition of Au seems to have had little effect on the oxidation stateof Pt in this system as compared to the similarly prepared pure PtNPs. The atomic radius of Au is larger than that of Pt so we wouldexpect lattice strain to contribute to the segregation of Au to the NPsurface. In addition, the surface energy and heat of sublimation ofAu are each lower than the corresponding values for Pt, againpromoting surface segregation of Au. It has also been showntheoretically that Au will segregate in a Pt0.75Au0.25 system [75],which is close to our Pt0.8Au0.2. However, Au does not have a highaffinity for oxygen, and our annealing in air should not further
Table 1Relative phase content of the different Pt and Pt-oxide species as well as the binding e
Sample Binding energy Pt0 (eV) Pt0 cont
Pt 71.7 28
Pt-Au 71.4 22
Pt-Au/MeOH 71.5 34
Pt-Pd 71.7 35
Pt-Ru 71.8 55
Pt-Fe 71.6 60
Also shown are the corresponding values of the Pt-Au sample after reaction with MeO
favor the segregation of Au to the surface. The metallic state of Auin our pure Au and Pt-Au catalysts is confirmed in the Au-4f XPSspectra of Fig. 4(a). In Fig. 4(a), the Au 4f7/2 peak appears at 84.7 eVin the pure Au (bottom) NP sample, which is 0.7 eV higher than thevalue for bulk Au at 84.0 eV [76], and the same peak appears at84.2 eV in the Pt-Au (top) sample (�0.5 eV shifted with respect tothe pure Au NPs). For the latter sample we also see a negative shiftin the binding energy of Pt0 of 0.4 eV with respect to the pure Ptsample (Table 1). Bastl and Pick [77] have also reported negativebinding energy shifts for both Pt and Au in Pt-Au alloys formed byvapor deposition of Au on polycrystalline Pt foils. Based on our XPSand TEM (average representation of the particle structure) data weconclude that the Pt-Au sample is a homogeneous nanoalloy with aslightly Au-rich surface. It is interesting to note that Zhang et al.[78] have reported that Au can stabilize Pt against dissolution infuel cells by raising the oxidation potential of Pt, whereas in our Pt-Au system we do not find Pt to be reduced compared to the pure Ptsample. The authors point out that Au will interact differentlywhen deposited on a metallic versus oxide substrate and that Audeposited on Pt is unlikely to intermix with Pt. In our system wehave evidence [TEM image shown in Fig. 2(c)] of the formation of
nergy of Pt0 obtained from the Pt-4f XPS spectra shown in Fig. 3
ent (%) PtO content (%) PtO2 content (%)
63 9
66 12
53 13
50 15
32 13
25 15
H (spectrum in Fig. 9).
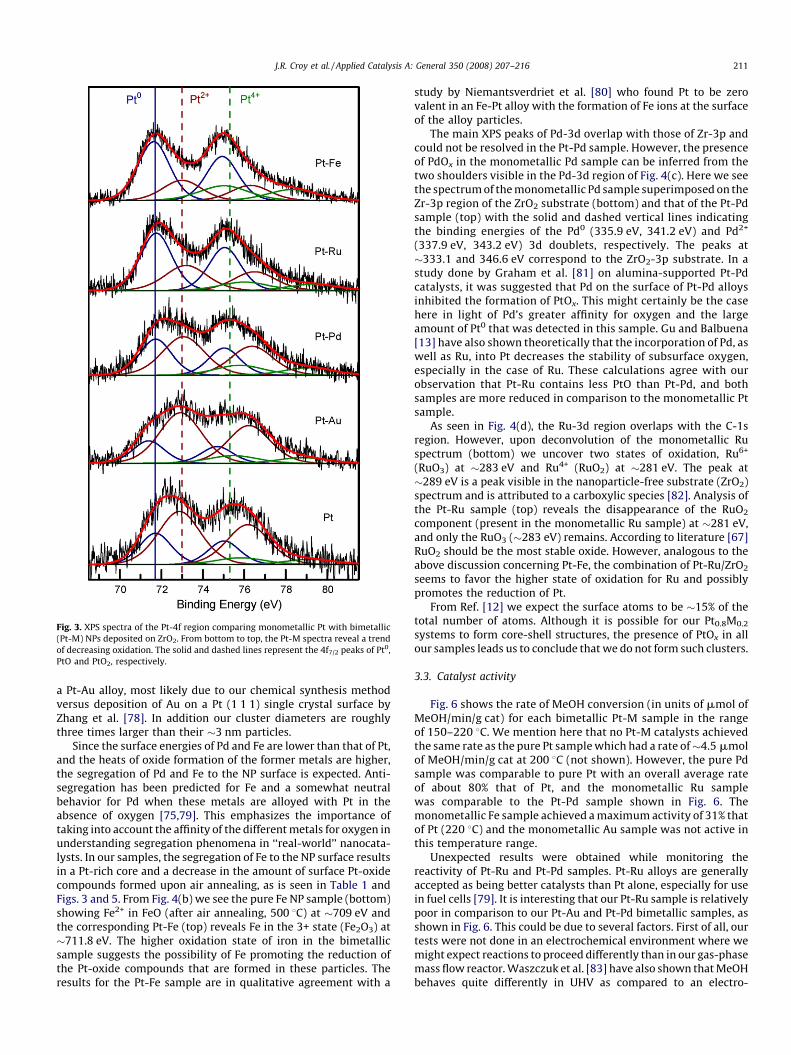
Fig. 3. XPS spectra of the Pt-4f region comparing monometallic Pt with bimetallic
(Pt-M) NPs deposited on ZrO2. From bottom to top, the Pt-M spectra reveal a trend
of decreasing oxidation. The solid and dashed lines represent the 4f7/2 peaks of Pt0,
PtO and PtO2, respectively.
J.R. Croy et al. / Applied Catalysis A: General 350 (2008) 207–216 211
a Pt-Au alloy, most likely due to our chemical synthesis methodversus deposition of Au on a Pt (1 1 1) single crystal surface byZhang et al. [78]. In addition our cluster diameters are roughlythree times larger than their �3 nm particles.
Since the surface energies of Pd and Fe are lower than that of Pt,and the heats of oxide formation of the former metals are higher,the segregation of Pd and Fe to the NP surface is expected. Anti-segregation has been predicted for Fe and a somewhat neutralbehavior for Pd when these metals are alloyed with Pt in theabsence of oxygen [75,79]. This emphasizes the importance oftaking into account the affinity of the different metals for oxygen inunderstanding segregation phenomena in ‘‘real-world’’ nanocata-lysts. In our samples, the segregation of Fe to the NP surface resultsin a Pt-rich core and a decrease in the amount of surface Pt-oxidecompounds formed upon air annealing, as is seen in Table 1 andFigs. 3 and 5. From Fig. 4(b) we see the pure Fe NP sample (bottom)showing Fe2+ in FeO (after air annealing, 500 8C) at �709 eV andthe corresponding Pt-Fe (top) reveals Fe in the 3+ state (Fe2O3) at�711.8 eV. The higher oxidation state of iron in the bimetallicsample suggests the possibility of Fe promoting the reduction ofthe Pt-oxide compounds that are formed in these particles. Theresults for the Pt-Fe sample are in qualitative agreement with a
study by Niemantsverdriet et al. [80] who found Pt to be zerovalent in an Fe-Pt alloy with the formation of Fe ions at the surfaceof the alloy particles.
The main XPS peaks of Pd-3d overlap with those of Zr-3p andcould not be resolved in the Pt-Pd sample. However, the presenceof PdOx in the monometallic Pd sample can be inferred from thetwo shoulders visible in the Pd-3d region of Fig. 4(c). Here we seethe spectrum of the monometallic Pd sample superimposed on theZr-3p region of the ZrO2 substrate (bottom) and that of the Pt-Pdsample (top) with the solid and dashed vertical lines indicatingthe binding energies of the Pd0 (335.9 eV, 341.2 eV) and Pd2+
(337.9 eV, 343.2 eV) 3d doublets, respectively. The peaks at�333.1 and 346.6 eV correspond to the ZrO2-3p substrate. In astudy done by Graham et al. [81] on alumina-supported Pt-Pdcatalysts, it was suggested that Pd on the surface of Pt-Pd alloysinhibited the formation of PtOx. This might certainly be the casehere in light of Pd’s greater affinity for oxygen and the largeamount of Pt0 that was detected in this sample. Gu and Balbuena[13] have also shown theoretically that the incorporation of Pd, aswell as Ru, into Pt decreases the stability of subsurface oxygen,especially in the case of Ru. These calculations agree with ourobservation that Pt-Ru contains less PtO than Pt-Pd, and bothsamples are more reduced in comparison to the monometallic Ptsample.
As seen in Fig. 4(d), the Ru-3d region overlaps with the C-1sregion. However, upon deconvolution of the monometallic Ruspectrum (bottom) we uncover two states of oxidation, Ru6+
(RuO3) at �283 eV and Ru4+ (RuO2) at �281 eV. The peak at�289 eV is a peak visible in the nanoparticle-free substrate (ZrO2)spectrum and is attributed to a carboxylic species [82]. Analysis ofthe Pt-Ru sample (top) reveals the disappearance of the RuO2
component (present in the monometallic Ru sample) at �281 eV,and only the RuO3 (�283 eV) remains. According to literature [67]RuO2 should be the most stable oxide. However, analogous to theabove discussion concerning Pt-Fe, the combination of Pt-Ru/ZrO2
seems to favor the higher state of oxidation for Ru and possiblypromotes the reduction of Pt.
From Ref. [12] we expect the surface atoms to be �15% of thetotal number of atoms. Although it is possible for our Pt0.8M0.2
systems to form core-shell structures, the presence of PtOx in allour samples leads us to conclude that we do not form such clusters.
3.3. Catalyst activity
Fig. 6 shows the rate of MeOH conversion (in units of mmol ofMeOH/min/g cat) for each bimetallic Pt-M sample in the rangeof 150–220 8C. We mention here that no Pt-M catalysts achievedthe same rate as the pure Pt sample which had a rate of�4.5 mmolof MeOH/min/g cat at 200 8C (not shown). However, the pure Pdsample was comparable to pure Pt with an overall average rateof about 80% that of Pt, and the monometallic Ru samplewas comparable to the Pt-Pd sample shown in Fig. 6. Themonometallic Fe sample achieved a maximum activity of 31% thatof Pt (220 8C) and the monometallic Au sample was not active inthis temperature range.
Unexpected results were obtained while monitoring thereactivity of Pt-Ru and Pt-Pd samples. Pt-Ru alloys are generallyaccepted as being better catalysts than Pt alone, especially for usein fuel cells [79]. It is interesting that our Pt-Ru sample is relativelypoor in comparison to our Pt-Au and Pt-Pd bimetallic samples, asshown in Fig. 6. This could be due to several factors. First of all, ourtests were not done in an electrochemical environment where wemight expect reactions to proceed differently than in our gas-phasemass flow reactor. Waszczuk et al. [83] have also shown that MeOHbehaves quite differently in UHV as compared to an electro-

Fig. 4. XPS spectra of (a) Au-4f region of pure Au (bottom) and bimetallic Pt-Au NPs
(top). (b) Fe-2p binding energy region of pure Fe (bottom) and bimetallic Pt-Fe NPs
J.R. Croy et al. / Applied Catalysis A: General 350 (2008) 207–216212
chemical environment. Similarly, the rate of CO oxidation on Ru ismuch greater at higher oxygen coverages than under UHVconditions [84] and the selectivity for MeOH oxidation over aRu catalyst is observed to be significantly different at low and highpressures [85]. Second, the concentration of the secondary metal isimportant and for Pt-Ru catalysts Pt:Ru concentrations of 3:1 and1:1 are common [68]. Our Pt-Ru sample contains only 20% Ru andthis low concentration might not be enough for the Pt to benefitfrom the presence of Ru.
The other point we would like to make note of concerns thePt-Pd sample. Although both the monometallic Pt and Pdsamples show high activity, the bimetallic Pt-Pd sample shows adecrease in activity with respect to both monometallic counter-parts. In a recent paper by Zhang et al. [11] it was demonstratedthat particles consisting of a monolayer of Pt covering a Pd/Cocore showed high activity for O2 reduction. The enhancedactivity was partly attributed to lattice mismatch and a changein the d-band properties of Pt caused by interaction with Pd. Inour case we imagine the reverse situation to be the prevailingone, in which Pd is enriched on the surface compared to Pt. It isfeasible that the interaction of Pd with the underlying Pt is notas favorable as the geometry of Ref. [11], and that thisinteraction decreases the Pd activity towards MeOH decom-position. Further studies on this system should be carried out toanswer this question.
Fig. 7 displays an Arrhenius plot [ln(Reaction Rate) versus 1/T]for the Pt-M samples in the range of 190–220 8C. From this plot,activation energies (Ea) for MeOH decomposition can be obtained.The calculated activation energy for the monometallic Pt sample is28 kJ/mol. The bimetallic Ea values are 59, 73, 96, and 89 kJ/mol forthe Pt-Au, Pt-Pd, Pt-Ru, and Pt-Fe, respectively.
Fig. 8 correlates these data with the phase content (%) of Pt0
(bottom axis) and PtO (top axis) in each Pt-M sample. Theelemental labels denote the M in Pt-M nanocatalysts. For the y-axiswe have calculated the percent difference of the rate for eachsample, with respect to the monometallic Pt, at T = 190, 200, 210,and 220 8C, and plotted the average as:
DRPtð%Þ ¼RPtðTÞ � RPt�MðTÞ
RPtðTÞ� 100
� �
For example, the higher the average percent difference, the lower isthe rate of MeOH conversion for a particular sample compared tothe monometallic Pt. A clear trend emerges relating increasingamounts of metallic Pt with decreasing catalytic activity, andincreasing amounts of PtO with increasing activity. The fits of thePt-4f spectra in Fig. 3 show that only a small amount (�15%) ofPtO2 is present in our samples. Two factors may be discussed inconnection with this trend: (i) the concentration of Pt0 and PtO arerelated to the amount of surface segregation of M, as discussed inthe XPS section; and (ii) PtO may play some role in thedecomposition of MeOH. We will give only brief commentsregarding (ii) as a detailed study on the stability of PtO underreaction conditions, and its catalytic reactivity for MeOH decom-position, is currently being conducted in our group and will bepublished elsewhere [86].
3.4. Catalyst selectivity
Selectivity for each product gas is derived from the massspectrometer data, along with stoichiometric considerations of
(top). (c) Pd-3d region of the monometallic Pd sample superimposed on the Zr-3p
region of the substrate (bottom). The top spectrum shows the Pt-Pd sample. Two
shoulders in the lower spectra reveal the presence of PdOx. (d) Ru-3d core-level
region of the pure Ru (bottom) and bimetallic Pt-Ru (top) NP samples.

Fig. 7. Arrhenius plot of the methanol decomposition rate [ln(R) versus 1/T] over Pt-
M NPs supported on ZrO2.Fig. 5. Relative phase content (%) of Pt0 and PtO in Pt0.8M0.2 NPs supported on ZrO2
obtained from the XPS data in Fig. 3.
J.R. Croy et al. / Applied Catalysis A: General 350 (2008) 207–216 213
the decomposition, water gas shift, and methanation reactions(Eqs. (3)–(5)), and is defined as the percentage of the total productthat each particular partial gas pressure represents,
Selectivity ð%Þ ¼ AnPAn� 100 (2)
where An represents the output of the nth product gas.
CH3OH ¼ CO þ 2H2 (3)
CO þ H2O ¼ CO2þH2 (4)
CO þ 3H2¼ CH4þH2O (5)
In the course of our experiments, only CO2 and CH4 wereobtained as byproducts and only in small amounts at hightemperatures. We can conclude from this that the reactionproceeds mainly through the direct decomposition of MeOHshown in equation (3). It is interesting to note that the Pt referencesample produced CO2 at low temperatures (�2.5% at 150 8C). Theamount of water in the experiment was �0.2% as compared to theflow of the carrier gas He, which helps to facilitate reaction (4). Thisis in accord with the results of Iida and Igarashi [87] who reportedhigh activity for the low temperature water gas shift reaction
Fig. 6. Rate of MeOH decomposition given in mmol of MeOH/min/g cat for all
bimetallic Pt-M samples in the temperature range of 190–220 8C.
(WGS) on Pt/ZrO2 catalysts. The authors were using a feedcontaining an H2O to CO molar ratio of 5. The amount of water inour experiments is low compared to CO (�27%) since we are notdirectly introducing it into the feed, this will limit the occurrence ofthe WGS reaction in our experiments. None of the other samplesshowed this behavior for the WGS reaction at low temperatures.Bera et al. [88] have also reported Pt/CeO2 active for the lowtemperature WGS reaction, with Pt being found mostly in the 2+state (PtO). One interesting exception is the Ru sample whichshows �1% selectivity for CO2 close to 300 8C. The correspondingPt-Ru sample shows a switch to small amounts of CH4 at the sametemperature.
4. Further discussion
4.1. Stability and reactivity of PtO
The monometallic Pt sample (Fig. 3, Table 1) is composedmainly of PtO (Pt2+, 63%) as well as a fairly large (28%) contributionfrom the metallic component (Pt0), with PtO2 (Pt4+) being
Fig. 8. Relative decrease in activity for Pt-M samples with respect to the
monometallic Pt sample. The y-axis gives the average percent difference in the
rate of MeOH decomposition in the range of 190–220 8C as explained in the text. The
bottom and top x-axes relate this decrease to the concentration of Pt0 and PtO,
respectively. The elemental labels denote the M in Pt-M.

Fig. 9. Pt-4f core-level region of the Pt-Au sample before (bottom) and after (top)
reaction with MeOH. Temperature during the reaction ranged from 100 to 300 8Cwith a total time on-stream of �8 h.
J.R. Croy et al. / Applied Catalysis A: General 350 (2008) 207–216214
considerably smaller (9%). The heats of oxide formation of PtO andPtO2 [67] and theoretical calculations [89], indicate that PtO2
should be the more stable oxide. However, possibly due to strongmetal–support interactions, previously confirmed for this system[50], PtO is the most prevalent species under our preparationconditions. Interestingly, the most common terminations of Pt NPsare the (1 1 1) and (1 0 0) planes [90], for which it has beencalculated that a-PtO2 and PtO, respectively, are the most stableoxide phases [89]. However, new data from Seriani and Mitten-dorfer [91] have also shown that PtO2 can be stable on the Pt(1 0 0)surface. Abe et al. [92] have also experimentally observed thesephases to be stable up to 500 8C and the presence of large amountsof PtO might be related to the structure of our NPs. It has beenreported for Pt single crystals that oxides can form at sites of lowcoordination (i.e. steps) where they are more stable than what isnormally expected for bulk oxides [93]. Weaver et al. [94] have alsoobserved enhanced thermal stability of oxides on Pt(1 1 1) due tothe formation of three dimensional oxide particles accompanied bysignificant surface restructuring.
It is still not clear, even for bulk systems, which oxide species isthe most stable, and NPs complicate the situation further becauseof their inherent complexity (i.e. high density of low coordinatedsites, surface facets with different orientations, etc.) For example,Wang et al. [95] have observed experimentally that the surfaceoxide species that forms on Pt particles with diameters <1.3 nm isPtO2, while above 2 nm, as in the case of our particles, PtO isobserved. Oxide stability is observed in our bimetallic Pt-Msystems with PtO being the most stable PtOx species.
In Fig. 9 we show the Pt-4f core-level region of the Pt-Au samplebefore (bottom) and after (top) reaction with MeOH. Thetemperature ranged from 100 to 300 8C during the reaction withMeOH, and the total time on-stream was �8 h. As we can see fromTable 1, this sample is only moderately reduced under our reactionconditions and PtO is highly stable. More extreme H2 reductions(not shown) were also carried out in our reactor with the sameresult that the PtOx compounds could not be fully reduced. Thesesamples were taken from the reactor and transferred in air to theUHV system where we still observed them to be reduced. Thus,complete re-oxidation does not occur during their exposure to air.However, this exposure during transfer is short (<10 min) and theinitial air oxidation occurs at 500 8C. In addition to theseexperiments, preliminary data from in situ X-ray Absorption NearEdge Structure (XANES) measurements (not shown), acquiredbefore and during long exposures (up to 10 h) of the pure Pt and Pt-Au catalysts to CO at various temperatures (up to 200 8C) atBrookhaven National Laboratory, reveal that the initial PtOx
compounds in these samples cannot be fully reduced [96], inagreement with our ex situ measurements of Fig. 9. Severalinteresting works have been published revealing the importance ofoxides in catalytic systems [52,97–101] which lead to the questionof whether or not PtO may play some role in the decomposition ofMeOH. For example, in a recent paper by Li and Hammer [52], DFTcalculations show that three-phase boundaries are particularlyactive sites for chemical reactivity. These boundaries involve thecontact of the gas-phase reactants and products with the metallicand oxidized phases of the catalyst. Another example is theadsorption of MeOH on Cu which is greatly enhanced by theavailability of oxygen [98], either from the feed gas or from thecatalyst due to an incomplete reduction process [99]. Our XPS andreactor data associate increasing activity with increasing concen-trations of PtO and the presence and stability of PtO in our catalystsreveal a novel aspect of these systems. However, one should keepin mind that the enhanced reactivity of the bimetallic NPscontaining PtO may also be simply due to the higher content ofPt atoms (versus atoms from the less active secondary metal, M) at
the NP surface in these samples. A more detailed study of thereactivity of pure Pt NPs with different Pt-oxide concentrations iscurrently being conducted in our group in order to shed light onthis open question.
Finally, as was mentioned in the introduction, we would like tohighlight that the choice of oxide support is crucial in the stabilityof surface and subsurface oxides on supported metal nanoparticles.For example, our group has observed faster and lower temperaturePtOx and Au2O3 reductions on pre-oxidized Pt and Au clustersdeposited on TiO2 as compared to the higher stability observedwhen ZrO2 and SiO2 substrate were considered [50,102].
4.2. Segregation
Reactor data (Fig. 6), in conjunction with XPS (Fig. 3) data, leadus to a model of segregation in our Pt-M samples, dictated largelyby the affinity of metal M for oxygen. In Fig. 10 we present asimplified scheme of this model showing truncated, faceted NPs incontact with the ZrO2 support. The light circles represent Pt atomsand the dark circles represent the atoms of the secondary metal M.The Pt-Au sample, Fig. 10(a), appears to be the most homogeneousalloy of all our samples. This is due to a combination of Au’sfavorable surface segregation (thermodynamic) properties atte-nuated by Pt’s higher affinity for oxygen. The remaining sampleshave a segregation trend that follows the same line of reasoning,where the expected segregation due to lower surface energy,higher atomic volume, heats of sublimation, etc. are overcome bymetal M’s favorable interaction with oxygen during the process ofsample annealing in air. Fig. 10(b) shows the Pt-Pd and Pt-Ru tohave a Pt-rich core and Fig. 10(c) includes most of the Fe in the Pt-Fe at the NP surface. In addition to this scheme, as previouslydiscussed, there may exist regions or patches of different species(Pt0, PtOx, M0, MOx) in contact with each other at the NP surface.These boundaries may enhance interactions with the gas-phase

Fig. 10. Simplified cross sectional schematic of surface segregation phenomena in Pt-M alloys where the oxygen affinity of metal M dominates its distribution within the
segregation profile. Image (a) represents the homogeneous Pt-Au alloy, (b) Pt-Pd and Pt-Ru, and (c) Pt-Fe. Light circles represent Pt atoms and dark circles represent the metal M.
J.R. Croy et al. / Applied Catalysis A: General 350 (2008) 207–216 215
reactants and/or products. Future research on the reactivity ofPt-oxides in reactions that involve oxygen (e.g. CO oxidation)should provide further insight into some of the challenging, openquestions described above.
5. Conclusions
We have tested a series of monometallic (M) and bimetallic (Pt-M) nanocatalysts for the decomposition of MeOH. All catalysts hadthe same initial particle size distribution, support, and preparationconditions. We therefore attribute any differences in the propertiesof these catalysts to the addition of the secondary metals. XPSanalysis reveals the most stable component of these systems tobe PtO, which proves to be highly stable under our reactionconditions. XPS, in conjunction with reaction data, shows a trendrelating the concentration of Pt0 and PtO to the segregation ofmetal M and subsequent catalytic activity as follows. Because allsamples were calcined in air, the metals with the highest affinityfor oxygen tended to surface segregate in the Pt-M NPs. Thisdirectly affected the NP’s catalytic activity by way of metal M’soccupation of surface sites available for reaction with MeOH andpossibly through its influence on the oxidation state of Pt.
We hope this study will stimulate further theoretical investiga-tions on the effect of the chemical environment on segregationphenomena at the nanoscale, as well as on the activity and stabilityof Pt-oxides as a function of metal dopants in bimetallic systems.
Acknowledgments
We would like to thank Prof. Perla Balbuena (Texas A&M) andProf. Werner Keune (Univ. Duisburg-Essen) for helpful discussions.This work has been partially supported by the US Department ofEnergy (DE-FG02-08ER15995). Funding from the Donors of theAmerican Chemical Society Petroleum Research Fund (supplementto grant PRF-42701-G5 for minority undergraduate summerresearch) and the National Science Foundation (NSF-REU, EEC0453436) is greatly appreciated.
References
[1] N.M. Markovic, T.J. Scmidt, V. Stamenkovic, P.N. Ross, Fuel Cells 1 (2001) 105.[2] F. Wu, H. Murakami, Y. Yamabe-Mitarai, H. Harada, H. Katayama, Y. Yamamoto,
Surf. Coat. Technol. 184 (2004) 24.[3] J.R. Rostrup-Nielsen, Phys. Chem. Chem. Phys. 3 (2001) 283.[4] Y. Xu, A.V. Ruban, M. Mavrikakis, J. Am. Chem. Soc. 126 (2004) 4717.[5] U.A. Paulus, A. Wokaun, G.G. Scherer, T.J. Schmidt, V. Stamenkovic, N.M. Mar-
kovic, P.N. Ross, Electrochim. Acta 47 (2002) 3787.[6] S. Mukerjee, S. Srinivasan, M.P. Soriaga, J. Mcbreen, J. Electrochem. Soc. 142
(1995) 1409.[7] V.A. Lubarda, Mech. Mater. 35 (2003) 53.[8] P.L. Hansen, A.M. Molenbroek, A.V. Ruban, J. Phys. Chem. B 101 (1997) 1861.[9] D.R. Rolison, P.L. Hagans, K.E. Swider, J.W. Long, Langmuir 15 (1999) 774.
[10] S. Shukla, S. Seal, Nanostruct. Mater. 11 (1999) 1181.[11] J. Zhang, F.H.B. Lima, M.H. Shao, K. Sasaki, J.X. Wang, J. Hanson, R.R. Adzic, J. Phys.
Chem. B 109 (2005) 22701.[12] G.F. Wang, M.A. Van Hove, P.N. Ross, M.I. Baskes, Prog. Surf. Sci. 79 (2005) 28.
[13] Z.H. Gu, P.B. Balbuena, J. Phys. Chem. C 112 (2008) 5057.[14] G.E. Ramirez-Caballero, P.B. Balbuena, Chem. Phys. Lett. 456 (2008) 64.[15] T. Toda, H. Igarashi, M. Watanabe, J. Electroanal. Chem. 460 (1999) 258.[16] H. Igarashi, T. Fujino, Y.M. Zhu, H. Uchida, M. Watanabe, Phys. Chem. Chem. Phys.
3 (2001) 306.[17] S. Desai, M. Neurock, Electrochim. Acta 48 (2003) 3759.[18] Q. Yi, A. Chen, W. Huang, J. Zhang, X. Liu, G. Xu, Z. Zhou, Electrochem. Comm. 9
(2007) 1513.[19] A. Morlang, U. Neuhausen, K.V. Klementiev, F.W. Schutze, G. Miehe, H. Fuess, E.S.
Lox, Appl. Catal. B-Environ. 60 (2005) 191.[20] W. Rachmady, M.A. Vannice, J. Catal. 209 (2002) 87.[21] M. Bowker, T. Aslam, M. Roebuck, M. Moser, Appl. Catal. A 257 (2004) 57.[22] S.E. Maisuls, K. Seshan, S. Feast, J.A. Lercher, Appl. Catal. B 29 (2001) 69.[23] K.K. Bando, T. Kawai, K. Asakura, T. Matsui, L. Le Bihan, H. Yasuda, Y. Yoshimura,
S.T. Oyarna, Catal. Today 111 (2006) 199.[24] J.R. Kitchin, N.A. Khan, M.A. Barteau, J.G. Chen, B. Yakshinksiy, T.E. Madey, Surf.
Sci. 544 (2003) 295.[25] K. Endo, K. Nakamura, Y. Katayama, T. Miura, Electrochim. Acta 49 (2004) 2503.[26] A. Niquille-Rothlisberger, R. Prins, Catal. Today 123 (2007) 198.[27] D.A. Simonetti, E.L. Kunkes, J.A. Dumesic, J. Catal. 247 (2007) 298.[28] O.S. Alexeev, G.W. Graham, M. Shelef, B.C. Gates, J. Catal. 190 (2000) 157.[29] F. Donsi, K.A. Williams, L.D. Schmidt, Ind. Eng. Chem. Res. 44 (2005) 3453.[30] R.D. Cortright, P.E. Levin, J.A. Dumesic, Ind. Eng. Chem. Res. 37 (1998) 1717.[31] W. Huang, J.R. McCormick, R.F. Lobo, J.G. Chen, J. Catal. 246 (2007) 40.[32] M. Englisch, V.S. Ranade, J.A. Lercher, J. Mol. Catal. A 121 (1997) 69.[33] R.W.J. Scott, A.K. Datye, R.M. Crooks, J. Am. Chem. Soc. 125 (2003) 3708.[34] N. Taylor, H. Kim, J.E. Greene, Surf. Sci. 475 (2001) 171.[35] T.N. Taylor, C.T. Campbell, Surf. Sci. 280 (1993) 277.[36] J.A. Rodriguez, C.M. Truong, D.W. Goodman, Surf. Sci. 271 (1992) L331.[37] R. Zeis, A. Mathur, G. Fritz, J. Lee, J. Erlebacher, J. Power Sources 165 (2007) 65.[38] Y.H. Niu, R.M. Crooks, C.R. Chim. 6 (2003) 1049.[39] Y. Shu, L.E. Murillo, J.P. Bosco, W. Huang, A.I. Frenkel, J.G. Chen, Appl. Catal. A 339
(2008) 169.[40] J.C. Serrano-Ruiz, G.W. Huber, M.A. Sanchez-Castillo, J.A. Dumesic, F. Rodriguez-
Reinoso, A. Sepulveda-Escribano, J. Catal. 241 (2006) 378.[41] O. Ozturk, J.B. Park, S. Ma, J.S. Ratliff, J. Zhou, D.R. Mullins, D.A. Chen, Surf. Sci. 601
(2007) 3099.[42] H.B. Zhao, B.E. Koel, J. Catal. 234 (2005) 24.[43] N.A. Zarkevich, T.L. Tan, D.D. Johnson, Phys. Rev. B 75 (2007) 104203.[44] A.L. Bonivardi, F.H. Ribeiro, G.A. Somorjai, J. Catal. 160 (1996) 269.[45] T. Ruhle, et al. Appl. Catal. B 14 (1997) 69.[46] D. Fliegel, Z. Berner, D. Eckhardt, D. Stuben, Anal. Bioanal. Chem. 379 (2004)
131.[47] M. Peuckert, H.P. Bonzel, Surf. Sci. 145 (1984) 239.[48] M. Schmid, S. Zimmermann, H.F. Krug, B. Sures, Environ. Int. 33 (2007) 385.[49] J.R. Croy, S. Mostafa, J. Liu, Y.H. Sohn, B. Roldan Cuenya, Catal. Lett. 118 (2007) 1.[50] J.R. Croy, S. Mostafa, J. Liu, Y.H. Sohn, H. Heinrich, B. Roldan Cuenya, Catal. Lett.
119 (2007) 209.[51] B.L.M. Hendriksen, J.W.M. Frenken, Phys. Rev. Lett. 89 (2002) 046101.[52] W. Li, B. Hammer, Chem. Phys. Lett. 409 (2005) 1.[53] J.P. Spatz, S. Mossmer, C. Hartmann, M. Moller, T. Herzog, M. Krieger, H.G. Boyen,
P. Ziemann, B. Kabius, Langmuir 16 (2000) 407.[54] B. Roldan Cuenya, S.H. Baeck, T.F. Jaramillo, E.W. McFarland, J. Am. Chem. Soc.
125 (2003) 12929.[55] L.K. Ono, D. Sudfeld, B.R. Cuenya, Surf. Sci. 600 (2006) 5041.[56] B.V. Crist, Handbook of Monochromatic XPS Spectra—Commercially Pure Binary
Oxides, vol. 2, XPS International, Inc., 2005, p. 828.[57] W.B. Pearson (Ed.), A Handbook of Lattice Spacings and Structures of Metals and
Alloys, vol. 1, Perfamon, Oxford, 1964.[58] W.B. Pearson (Ed.), A Handbook of Lattice Spacings and Structures of Metals and
Alloys, vol. 2, Pergamon, Oxford, 1967.[59] NIST X-ray Photoelectron Spectroscopy Database, Version 3.4 (Web Version)
http://srdata.nist.gov/xps/index.htm.[60] A.S. Arico, A.K. Shukla, H. Kim, S. Park, M. Min, V. Antonucci, Appl. Surf. Sci. 172
(2001) 33.[61] A.K. Shukla, M. Neergat, P. Bera, V. Jayaram, M.S. Hegde, J. Electroanal. Chem. 504
(2001) 111.[62] J.L.G. Fierro, J.M. Palacios, F. Tomas, Surf. Interface Anal. 13 (1988) 25.

J.R. Croy et al. / Applied Catalysis A: General 350 (2008) 207–216216
[63] A. Howard, D.N.S. Clark, C.E.J. Mitchell, R.G. Egdell, V.R. Dhanak, Surf. Sci. 518(2002) 210.
[64] R. Symanski, H. Charcosset, Platinum Met. Rev. 30 (1986) 23.[65] P. Oelhafen, J. Phys. F: Met. Phys. 11 (1981) L41.[66] L.K. Ono, J.R. Croy, B. Roldan Cuenya, in preparation.[67] G.V. Samsonov (Ed.), The Oxide Handbook, second ed., Plenum Publishing
Corporation, New York, 1982.[68] E. Antolini, T. Lopes, E.R. Gonzalez, J. Alloys Compd. 461 (2008) 253.[69] J.W. Arblaster, Platinum Met. Rev. 51 (2007) 130.[70] C. Creemers, P. Deurinck, Surf. Interface Anal. 25 (1997) 177.[71] K.F. Wojciechowski, Surf. Sci. 437 (1999) 285.[72] D.S. Mainardi, P.B. Balbuena, Langmuir 17 (2001) 2047.[73] B.E. Nieuwenhuys, Adv. Catal. 44 (2000) 259.[74] L. Guczi, Catal. Today 101 (2005) 53.[75] Y.G. Ma, P.B. Balbuena, Surf. Sci. 602 (2008) 107.[76] E. Irissou, M.C. Denis, M. Chaker, D. Guay, Thin Solid Films 472 (2005) 49.[77] Z. Bastl, T.P. Pick, Surf. Sci. 566 (2004) 832.[78] J. Zhang, K. Sasaki, E. Sutter, R.R. Adzic, Science 315 (2007) 220.[79] U.B. Demirci, J. Power Sources 173 (2007) 11.[80] J.W. Niemantsverdriet, J.A.C. van Kaam, C.F.J. Flipse, A.M. van der Kraan, J. Catal.
96 (1985) 58.[81] G.W. Graham, H.W. Jen, O. Ezekoye, R.J. Kudla, W. Chun, X.Q. Pan, R.W. McCabe,
Catal. Lett. 116 (2007) 1.[82] R. Lopez, R. Romero, F. Martin, J.R. Ramos-Barrado, D. Leinen, Surf. Interface Anal.
38 (2006) 277.[83] P. Waszczuk, G.Q. Lu, A. Wieckowski, C. Lu, C. Rice, R.I. Masel, Electrochim. Acta
47 (2002) 3637.
[84] J. Greeley, J.K. Norskov, M. Mavrikakis, Annu. Rev. Phys. Chem. 53 (2002)319.
[85] R. Blume, M. Havecker, S. Zafeiratos, D. Teschner, A. Knop-Gericke, R. Schlogl, P.Dudin, A. Barinov, M. Kiskinova, Catal. Today 124 (2007) 71.
[86] J.R. Croy, S. Mostafa, B. Roldan Cuenya, in preparation.[87] H. Iida, A. Igarashi, Appl. Catal. A 303 (2006) 192.[88] P. Bera, S. Malwadkar, A. Gayen, C.V.V. Satyanarayana, B.S. Rao, M.S. Hegde, Catal.
Lett. 96 (2004) 213.[89] N. Seriani, W. Pompe, L.C. Ciacchi, J. Phys. Chem. B 110 (2006) 14860.[90] J.M. Petroski, Z.L. Wang, T.C. Green, M.A. El-Sayed, J. Phys. Chem. B 102 (1998)
3316.[91] N. Seriani, F. Mittendorfer, J. Phys. Condens. Mater. 20 (2008) 184023.[92] Y. Abe, M. Kawamura, K. Sasaki, Jpn. J. Appl. Phys. 38 (1999) 2092.[93] J.G. Wang, W.X. Li, M. Borg, J. Gustafson, A. Mikkelsen, T.M. Pedersen, E.
Lundgren, J. Weissenrieder, J. Klikovits, M. Schmid, B. Hammer, J.N. Andersen,Phys. Rev. Lett. 95 (2005) 256102.
[94] J.F. Weaver, J.J. Chen, A.L. Gerard, Surf. Sci. 592 (2005) 83.[95] C.B. Wang, C.T. Yeh, J. Catal. 178 (1998) 450.[96] W. Wen, J. Rodriguez, J. Croy, S. Mostafa, B. Roldan Cuenya, in preparation.[97] Y. Xu, J. Greeley, M. Mavrikakis, J. Am. Chem. Soc. 127 (2005) 12823.[98] A.F. Carley, A.W. Owens, M.K. Rajumon, M.W. Roberts, S.D. Jackson, Catal. Lett. 37
(1996) 79.[99] S.T. Yong, K. Hidajat, S. Kawi, Catal. Today 131 (2008) 188.
[100] I.E. Wachs, R.J. Madix, J. Catal. 53 (1978) 208.[101] X. Wang, W.K. Chen, C.H. Lu, Appl. Surf. Sci. 254 (2008) 4421.[102] L.K. Ono, B. Roldan Cuenya, J. Phys. Chem. C 112 (2008) 4676.
Related Documents