Applications of Statistical Geometry to the Functional Analysis of Protein Mutants Majid Masso Ph.D. Dissertation Defense

Welcome message from author
This document is posted to help you gain knowledge. Please leave a comment to let me know what you think about it! Share it to your friends and learn new things together.
Transcript
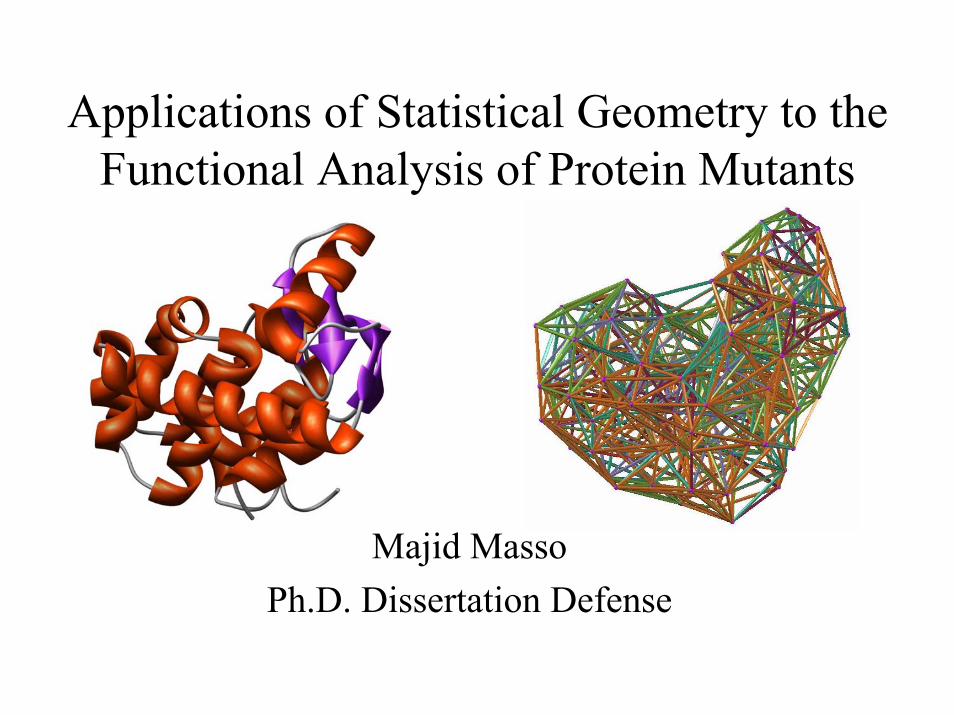
Applications of Statistical Geometry to the Functional Analysis of Protein Mutants
Majid MassoPh.D. Dissertation Defense

Four-Body Statistical Potential• Protein structures are represented as
discrete sets of points in 3D, each corresponding to an amino acid (aa)
• Delaunay tessellation of a protein structure yields an aggregate of space-filling, non-overlapping, irregular tetrahedra (simplices) that each define a quadruplet of nearest-neighbor aa’s
• A four-body statistical potential function is derived via tessellation of a training set of structures, assigning a log-likelihood score to all possible quadruplets of aa’s
HIV-1 protease
E. colilac repressor
i
j
kl

Computational Mutagenesis Methodology• Total Potential or Topological Score of a protein structure, a
global measure of sequence-structure compatibility, is obtained by summing the scores of all the simplices in the tessellation
• Individual Residue Potential or Residue Environment Score of each aa in a protein structure is obtained by locally summing the scoresof only the simplices that use the aa’s point representation as a vertex; the scores of all the aa’s form a Potential Profile vector
• Assumption: minor structural differences and similar tessellations between each mutant and the wild-type (wt) protein
• Approach: the total potential and potential profile of every mutant can be derived from the tessellation of the wt structure
A
SK
D LF
G
R I C

Computational Mutagenesis MethodologyBased on the methodology, each mutant is characterized by a scalar Residual Score and a vector Residual Profile:
• Residual Score – difference between mutant and wt total potentials
Measures the relative change in mutant sequence-structure compatibility from wt
• Residual Profile – difference between mutant and wt potential profiles
Quantifies environmental perturbations from wt at every aapositionEach component in the profile is referred to as an environmental change (EC) score for the corresponding aa position
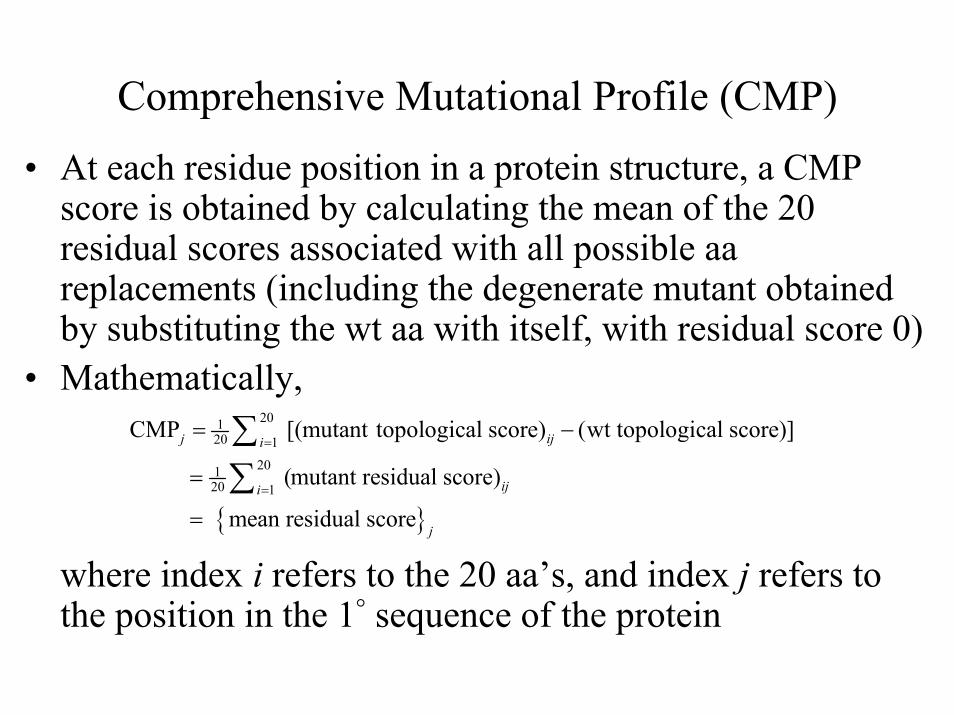
Comprehensive Mutational Profile (CMP)• At each residue position in a protein structure, a CMP
score is obtained by calculating the mean of the 20 residual scores associated with all possible aa replacements (including the degenerate mutant obtained by substituting the wt aa with itself, with residual score 0)
• Mathematically,
where index i refers to the 20 aa’s, and index j refers to the position in the 1° sequence of the protein
{ }
20120 1
20120 1
CMP [(mutant topological score) (wt topological score)]
(mutant residual score)
mean residual score
j iji
iji
j
=
=
= −
=
=
∑∑

CMP Example: HIV-1 Protease• PDB ID: 3phv (monomer, 99 aa’s)• Functional as a homodimer
Interface: P1-T4 and C95-F99Catalytic triad: D25-T26-G27Flap region: M46-V56

CMP Example: HIV-1 Protease

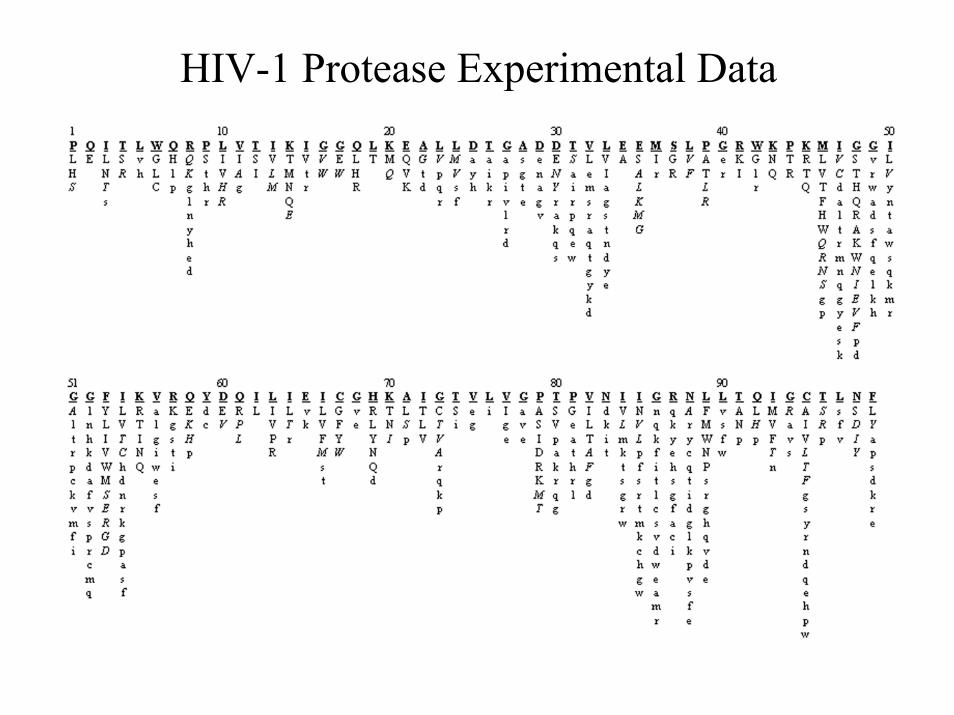
HIV-1 Protease Experimental Data
• Synthesis and analysis of 536 single site missense mutants
336 published mutants: Loeb, D.D., Swanstrom R., Everitt, L., Manchester, M., Stamper, S.E. & Hutchison III, C.A. (1989) Complete mutagenesis of the HIV-1 protease. Nature 340, 397-400.
200 mutants provided by R. Swanstrom (UNC)
• Each mutant placed in one of 3 phenotypic categories, positive, negative, or intermediate, based on activity (ability to process the Pol polyprotein)
• Residual scores of the mutants can be used to elucidate the structure-function relationship in HIV-1 protease
HIV-1 Protease Experimental Data

Structure-Function Correlations Based on Residual Scores: HIV-1 Protease
How significant are the differences in class-pair means?Pos-Neg: p = 1.65 × 10⁻¹¹; Int-Neg: p = 9.90 × 10⁻⁶; and Pos-Int: p = 0.086.

Structure-Function Correlations Based on Residual Scores: Bacteriophage T4 Lysozyme
• Experimental data: 2015 single site mutants generated by introducing the same 13 aa replacements at 163/164 positions -all but M1 (PDB ID: 3lzm)
Rennell, D., Bouvier, S.E., Hardy, L.W. & Poteete, A.R. (1991) Systematic mutation of bacteriophage T4 lysozyme. J. Mol. Biol. 222, 67-88.
• Four mutant activity classes: high, medium, low, negative• Investigators recommend data analysis using only two classes
(active = high + med, inactive = low + neg): p = 0.0003
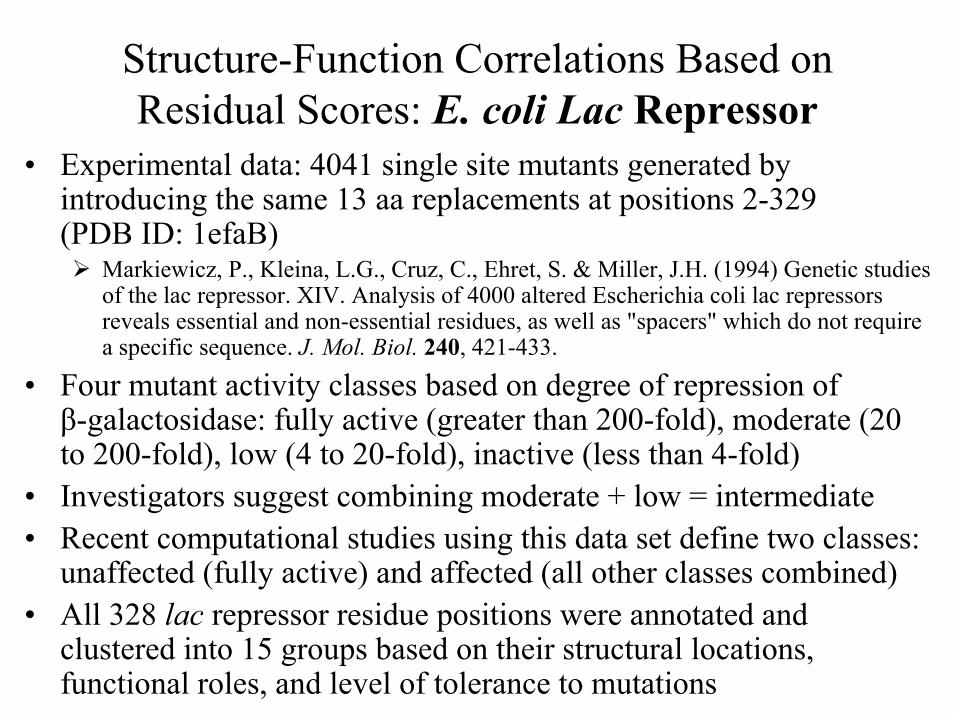
Structure-Function Correlations Based on Residual Scores: E. coli Lac Repressor
• Experimental data: 4041 single site mutants generated by introducing the same 13 aa replacements at positions 2-329 (PDB ID: 1efaB)
Markiewicz, P., Kleina, L.G., Cruz, C., Ehret, S. & Miller, J.H. (1994) Genetic studies of the lac repressor. XIV. Analysis of 4000 altered Escherichia coli lac repressors reveals essential and non-essential residues, as well as "spacers" which do not require a specific sequence. J. Mol. Biol. 240, 421-433.
• Four mutant activity classes based on degree of repression of β-galactosidase: fully active (greater than 200-fold), moderate (20 to 200-fold), low (4 to 20-fold), inactive (less than 4-fold)
• Investigators suggest combining moderate + low = intermediate• Recent computational studies using this data set define two classes:
unaffected (fully active) and affected (all other classes combined)• All 328 lac repressor residue positions were annotated and
clustered into 15 groups based on their structural locations, functional roles, and level of tolerance to mutations

Structure-Function Correlations Based on Residual Scores: E. coli Lac Repressor
How significant are the differences in class-pair means?full-inter: p = 4.64 × 10⁻⁷; full-inactive: p = 1.95 × 10-36; and inter-inactive: p = 6.57 × 10⁻¹⁰.

Lac Repressor: CMP vs. Potential Profile

Distribution of Lac Repressor Residue Positions
Apply chi-square test with 18 df: χ2 = 51.11, so reject null hypothesis that no association exists between structural/functional groups and quadrant locations, with p < 0.0001

Characterizing Structural or Functional Roles of Lac Repressor Residues Based on
Residual Scores and Residue Environment Scores
Mutant Residual Profiles: Motivation• Residual profile vectors encode much more sequence and structure
information about the mutants than residual scores; hence, they may prove to be more useful for classification and inference formutants belonging to different activity classes
• Nonzero components (EC scores) of a mutant residual profile identify the mutated position(s) as well as all of their topological nearest-neighbors based on tessellation (i.e., all positions that participate in simplices with the mutated positions)
• For any single site mutant, the EC score at the residual profilecomponent corresponding to the mutated position is precisely theresidual score of the mutant
• A consequence of the above is that all 19 single site mutants at a particular position have residual profiles w/ identical arrangements of zero and nonzero components (only the EC scores at any given nonzero component differ among the 19 residual profiles)

HIV-1 Protease Dataset: Residual Profiles of the Experimental Mutants
. . .
.
.
.
.
.
.
In each of the 536 rows, the initial three components identify the mutant. This is followed by the 99-dimensional residual profile. The final component is the mutant activity class.
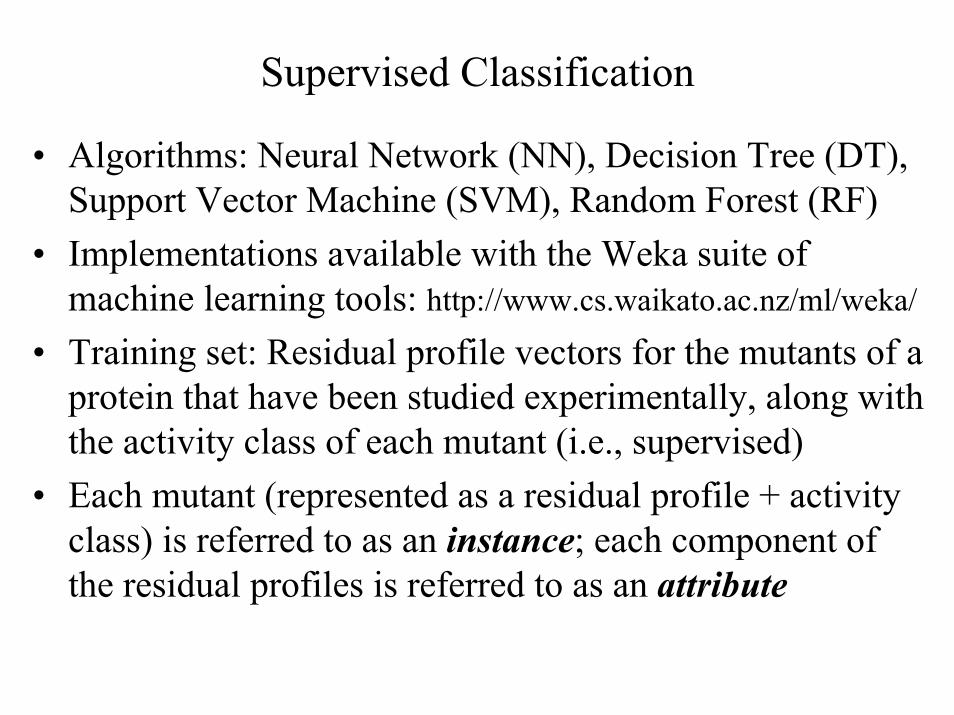
Supervised Classification
• Algorithms: Neural Network (NN), Decision Tree (DT), Support Vector Machine (SVM), Random Forest (RF)
• Implementations available with the Weka suite of machine learning tools: http://www.cs.waikato.ac.nz/ml/weka/
• Training set: Residual profile vectors for the mutants of a protein that have been studied experimentally, along with the activity class of each mutant (i.e., supervised)
• Each mutant (represented as a residual profile + activity class) is referred to as an instance; each component of the residual profiles is referred to as an attribute
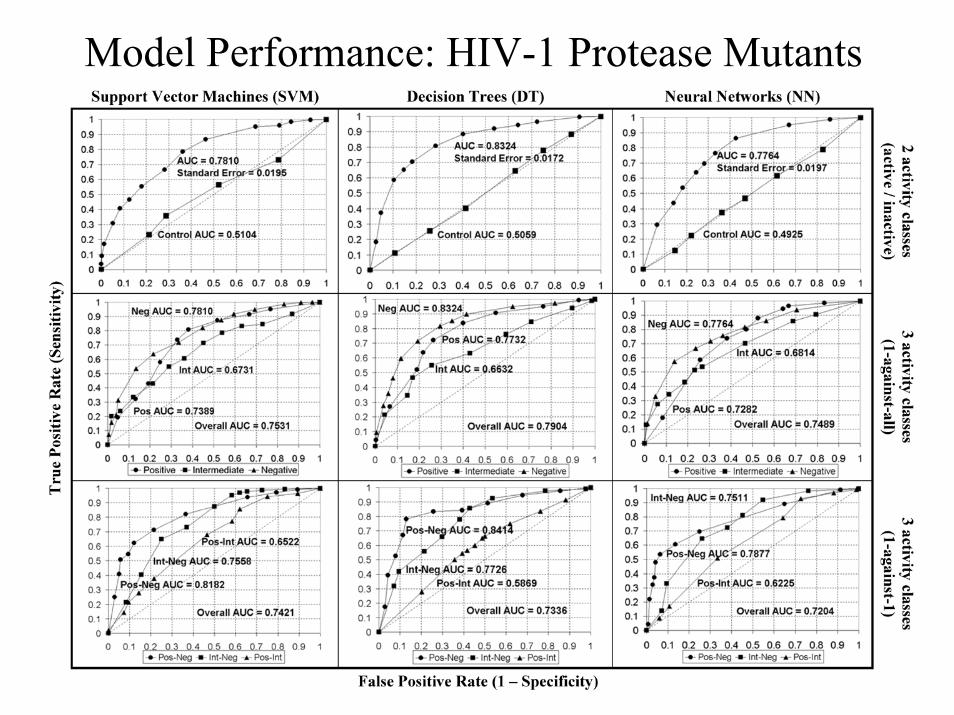
Model Performance: HIV-1 Protease Mutants

AUC Summary for HIV-1 Protease ROC Curves
Pos(1-against-1)
Int(1-against-1)
Neg(1-against-1)
OthersCombined
(1-against-all)
Pos ---0.6522 (SVM)0.5869 (DT)0.6225 (NN)
0.8182 (SVM)0.8414 (DT)0.7877 (NN)
0.7389 (SVM)0.7732 (DT)0.7282 (NN)
Int ---0.7558 (SVM)0.7726 (DT)0.7511 (NN)
0.6731 (SVM)0.6632 (DT)0.6814 (NN)
Neg ---0.7810 (SVM)0.8324 (DT)0.7764 (NN)
• Most disparate signals stem from residual profiles of the positive and negative mutants, followed closely by the intermediate and negative mutants
consistent with biological notion that fully active and inactive mutants display the greatest differences in structural and functional properties, while partially active and inactive mutants display significant, albeit less dramatic differences
• Residual profiles of mutants in the positive and intermediate classes display the least divergent signals
reflects the fact that both classes contain mutants that are more or less functionally active and display at most minimal structural changes from wt

Reliability/Reproducibility of Model Predictions• 60/40 split test option => model learned with 60% of the mutants is used to predict the
activity classes of the remaining 40%; 60 runs => expect approx. 24 predictions/mutant• Apply two-class decision tree learning (default costs)• For each mutant, nc (ni) = total # of correct (incorrect) predictions• Mutant reliability metric: m = (nc – ni) / (nc + ni)• m = 0 => equal # of correct and incorrect predictions; m = 1 => all predictions correct;
m = –1 => all predictions incorrect

Assessment of the Statistical Significance for the Number of Correctly Classified Instances
• Random split: 436 HIV-1 protease mutants used as a training set for decision tree learning; remaining 100 mutants form a test set
• Training: 121 pos, 66 int, 249 neg; Testing: 19 pos, 18 int, 63 neg• Result below based on two classes (similar method for 3 classes):

Assessment of the Statistical Significance for the Number of Correctly Classified Instances
• Training: 187 active, 249 inactive; Testing: 37 active, 63 inactive• Let X = X1+X2+ …+X100, where each Xi is a Bernoulli random
variable representing the outcome of a test set instance prediction.• µ = E(X) = 37·(187/436) + 63·(249/436) = 52 • σ2 = Var(X) = 100·(187/436)·(249/436) = 24.5• So σ = 4.95, and p-value is
where Φ is the cumulative dist. fn. for a standardized normal var.
674 52( 74; 52) ( 4.44) 1 (4.44) 4.42 104.95
XP X P P zµµ
σ−− − > = = > = > ≈ −Φ = ×
Summary of Results Based on Two and Three Classes

Model Performance: T4 Lysozyme Mutants

T4 Lysozyme Mutational Array
Training set mutants (n = 2015) Predicted test set mutants (n = 1101)Active Inactive Active Inactive
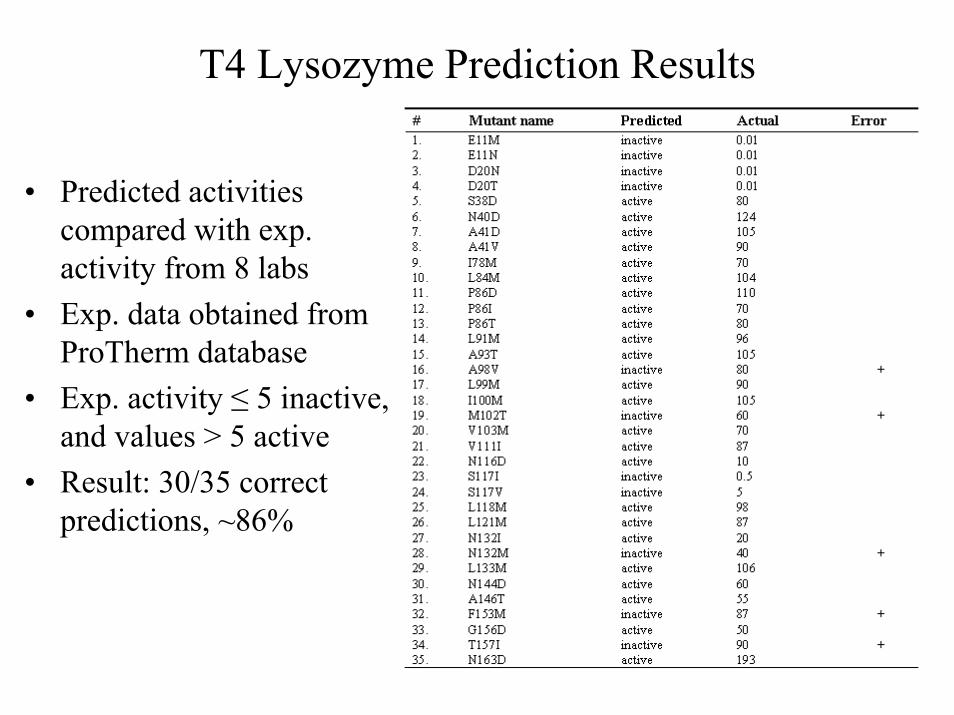
T4 Lysozyme Prediction Results
• Predicted activities compared with exp. activity from 8 labs
• Exp. data obtained fromProTherm database
• Exp. activity ≤ 5 inactive, and values > 5 active
• Result: 30/35 correct predictions, ~86%
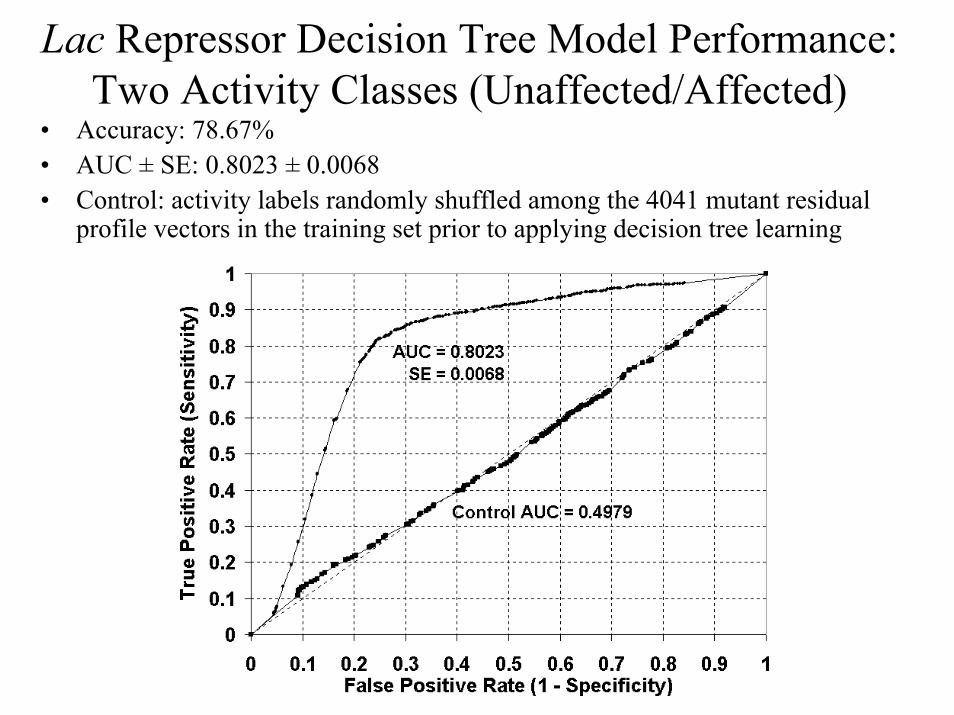
Lac Repressor Decision Tree Model Performance: Two Activity Classes (Unaffected/Affected)
• Accuracy: 78.67%• AUC ± SE: 0.8023 ± 0.0068• Control: activity labels randomly shuffled among the 4041 mutant residual
profile vectors in the training set prior to applying decision tree learning

Learning Curve Example: Lac Repressor• Stratified training sets randomly chosen with replacement in
increments of 100 mutants• At each training set size, mean 10 CV accuracy based on average
of 10 runs using two-class decision tree supervised learning• Error bars represent ±1 std. dev. from the mean
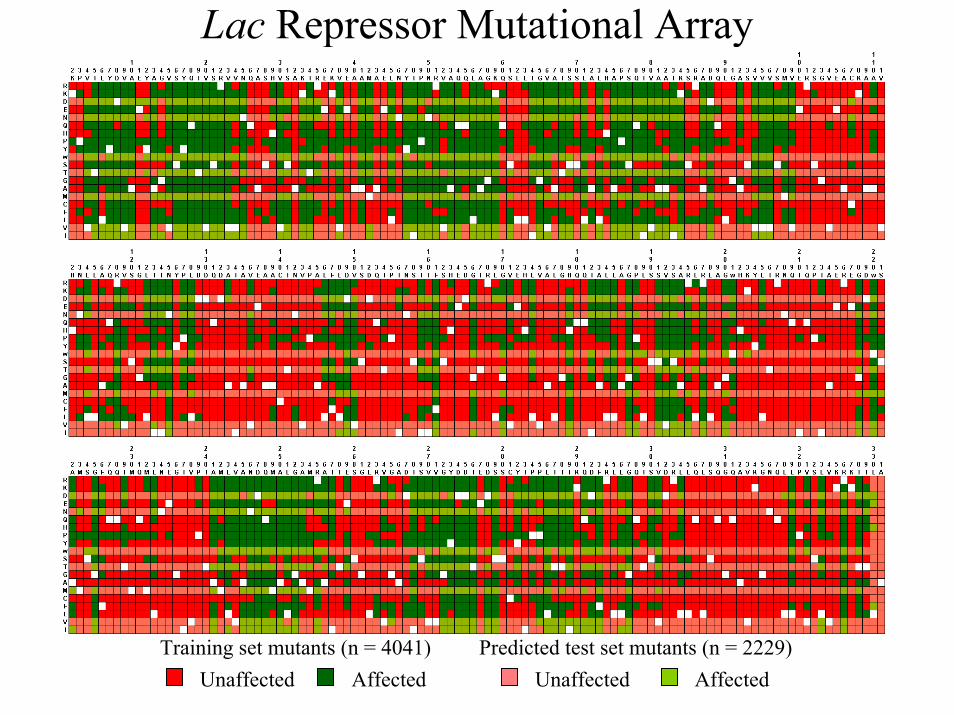
Lac Repressor Mutational Array
Training set mutants (n = 4041) Predicted test set mutants (n = 2229)Unaffected Affected Unaffected Affected
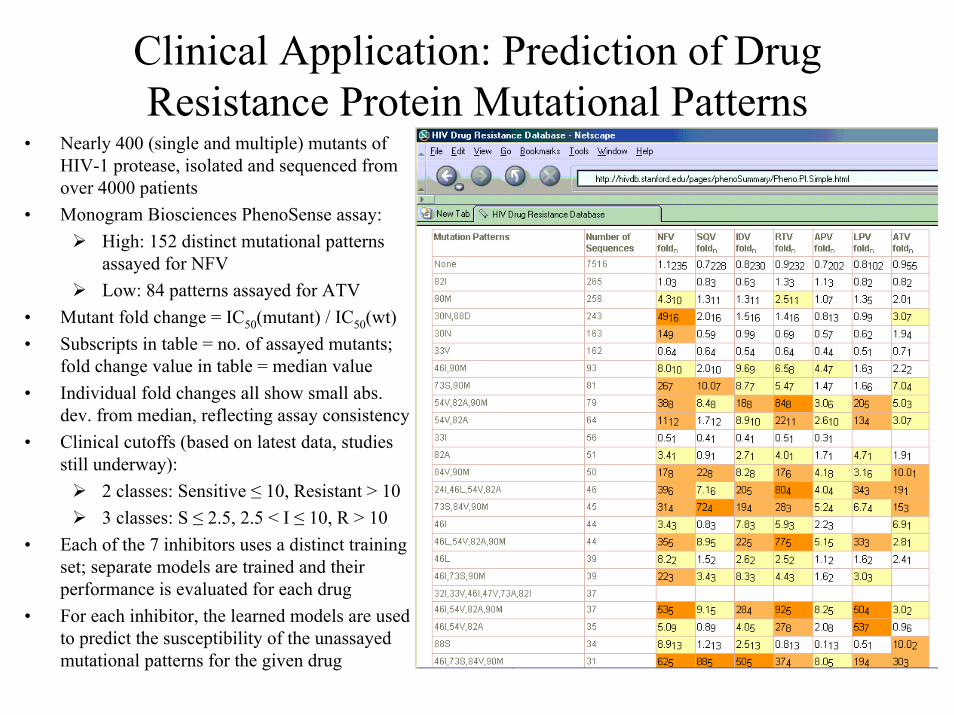
Clinical Application: Prediction of Drug Resistance Protein Mutational Patterns
• Nearly 400 (single and multiple) mutants of HIV-1 protease, isolated and sequenced from over 4000 patients
• Monogram Biosciences PhenoSense assay:High: 152 distinct mutational patterns assayed for NFVLow: 84 patterns assayed for ATV
• Mutant fold change = IC50(mutant) / IC50(wt)• Subscripts in table = no. of assayed mutants;
fold change value in table = median value• Individual fold changes all show small abs.
dev. from median, reflecting assay consistency• Clinical cutoffs (based on latest data, studies
still underway):2 classes: Sensitive ≤ 10, Resistant > 103 classes: S ≤ 2.5, 2.5 < I ≤ 10, R > 10
• Each of the 7 inhibitors uses a distinct training set; separate models are trained and their performance is evaluated for each drug
• For each inhibitor, the learned models are used to predict the susceptibility of the unassayed mutational patterns for the given drug

ROC Curves Based on Two-Class Training Sets

Factors Contributing to Classification CapabilityFactorsF1: values (magnitude and sign) of the
non-zero components in each vectorF2: location of the non-zero components in
each vector F3: number of non-zero components in
each vector
ControlsC1: multiply each non-zero vector component by a random
number generated from the interval [-2, 2] (removes influence of F1, measures contributions of F2 and F3)
C2: randomly shuffle the components of each vector in C1 independently (removes influences of F1 and F2, measures contribution of F3)
Graphed ROC Example: RTV• Apply Random Forest (RF)
supervised classification• Shuffled classes control: S, R class
labels randomly shuffled among mutant vectors prior to RF learningRF Results For All Inhibitors
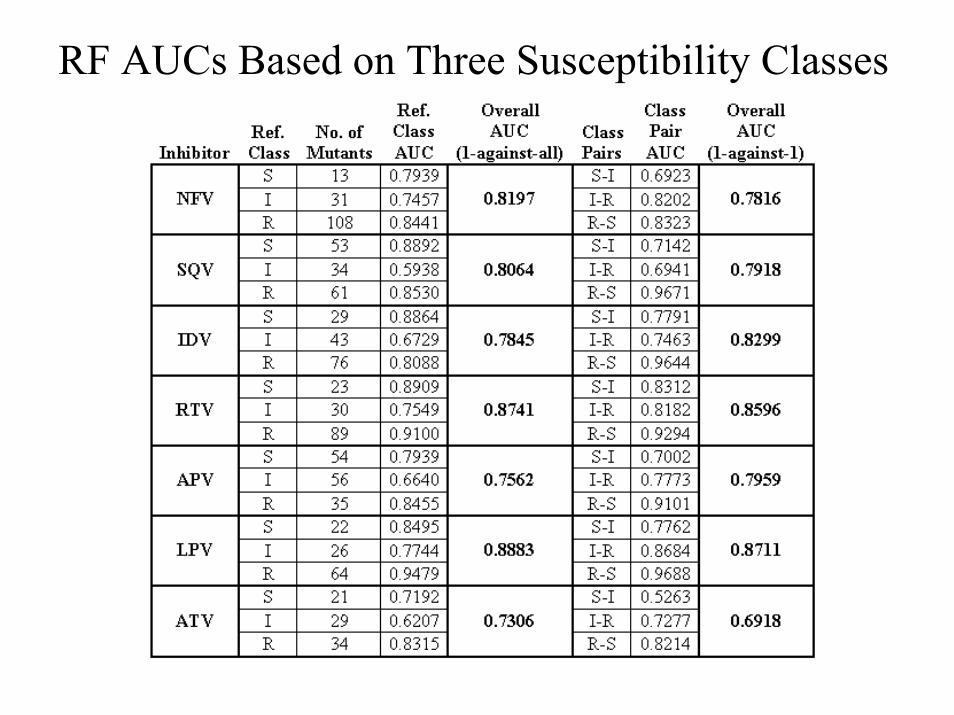
RF AUCs Based on Three Susceptibility Classes

Graphed RF ROC Example: RTV
Publications• Masso, M. & Vaisman, I.I. (2003) Comprehensive mutagenesis of HIV-1
protease: a computational geometry approach. Biochem. Biophys. Res. Comm.305, 322-326.
• Masso, M. (2003) DC-SIGN points the way to a novel mechanism for HIV-1 transmission. Medscape General Medicine 5 (2). Available at: http://www.medscape.com/viewarticle/455538.
• Masso, M. & Jagota, A. Computational Methods in Phylogenetic Analysis. Sunnyvale: Bioinformatics by the Bay Press, 2005. ISBN: 0970029764.
• Masso, M. & Vaisman, I.I. Computational mutagenesis studies of protein structure-function correlations. Proteins (accepted).
• Masso, M. & Vaisman, I.I. Accurate prediction of enzyme mutant activity based on a multibody statistical potential. BMC Bioinform. (to be submitted).
• Masso, M. & Vaisman, I.I. Functional inference of enzyme mutants using a four-body statistical potential. J. Mol. Biol. (to be submitted).
• Masso, M. & Vaisman, I.I. Computational mutagenesis of lac repressor: insights into structure-function correlations and accurate inferential models of mutant activity. J. Proteome Res. (to be submitted).
• Masso, M. & Vaisman, I.I. Inferential models of susceptibility to HIV-1 protease inhibitors: a combined sequence-structure approach to predicting resistance. AIDS (to be submitted).

Selected Conference Presentations• Masso M. and Vaisman I.I. Functional Prediction of Protein Mutants Using a Four-
Body Potential, Intelligent Systems for Molecular Biology (ISMB), Detroit, MI, June 25-29, 2005.
• Masso M. and Vaisman I. Automated Functional Inference of Enzyme Mutants Utilizing a Four-Body Statistical Potential, The Ninth Annual International Conference on Research in Computational Molecular Biology (RECOMB), Cambridge, MA, May 14-18, 2005.
• Masso M. and Vaisman I. Structure-Function Correlation in HIV-1 Protease Using a Four-Body Statistical Potential, International Conference on Structural Genomics (ICSG), Washington Hilton Hotel, Washington, DC, November 17-21, 2004.
• Functional Analysis of HIV-1 Protease Using a Four-Body Statistical Potential, Annual Meeting of the Society for Mathematical Biology (SMB), University of Michigan, Ann Arbor, MI, July 25-28, 2004.
• Masso M. and Vaisman I. Comprehensive Mutagenesis of HIV-1 Protease: A Statistical Geometry Approach, European Conference on Computational Biology (ECCB), Centre de Conférences de la Villette, Paris, France, September 27-30, 2003.
• A Statistical Geometry Approach to the Study of Protein Structure, Annual Summer Meeting of the Mathematical Association of America (MAA), University of Colorado, Boulder, CO, July 29-August 2, 2003.
• Masso M. and Vaisman I. Analyzing Protein Structure-Function Correlations Using Statistical Geometry, Intelligent Systems for Molecular Biology (ISMB), Brisbane Convention & Exhibition Centre, Brisbane, Australia, June 29-July 3, 2003.

Acknowledgements
Summer ’05 InternsDr. Saleet Jafri – OrganizerKahkeshan Hijazi, Nida Parvez
Support StaffGlenda Wilson, Chris Ryan,Susan Beale
SoftwareQhull – tessellation (Barber)Glisten – tessellation visualization (Carr)Chimera – ribbon diagrams (Ferrin)Base Java programs – to generate raw data based on tessellation (Lu)Weka – machine learning (Witten, Frank)
CommitteeDr. Vaisman – Ph.D. Director Dr. GrefenstetteDr. JamisonDr. Royt
Structural Bioinformatics GroupVadim RavichEwy MatheTodd TaylorAndrew CarrTariq AlsheddiGreg Reck

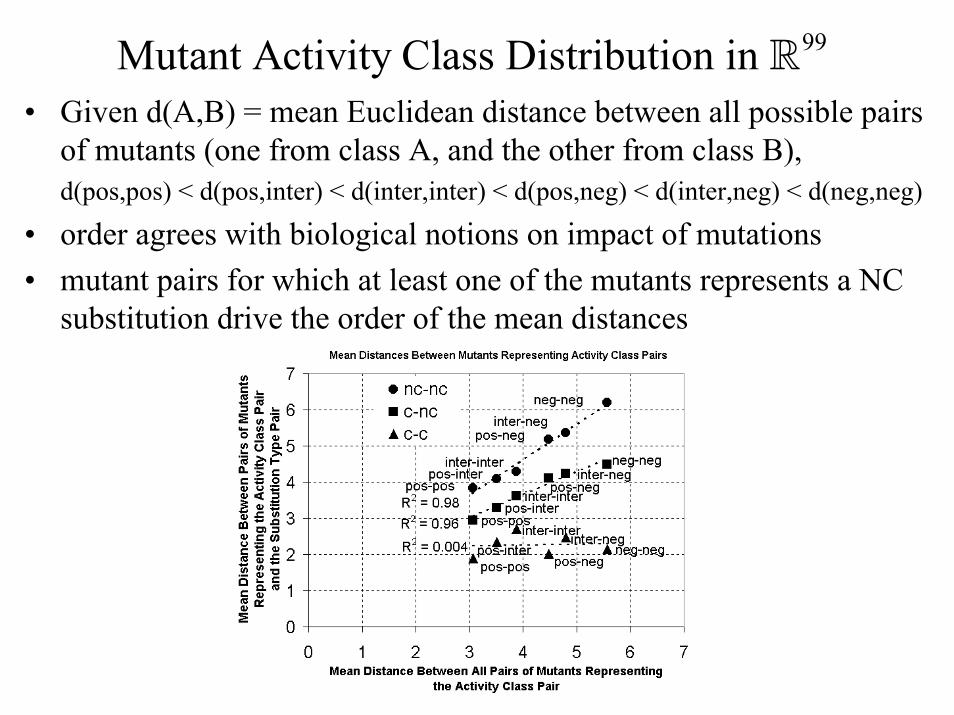
99Mutant Activity Class Distribution in • Given d(A,B) = mean Euclidean distance between all possible pairs
of mutants (one from class A, and the other from class B), d(pos,pos) < d(pos,inter) < d(inter,inter) < d(pos,neg) < d(inter,neg) < d(neg,neg)
• order agrees with biological notions on impact of mutations• mutant pairs for which at least one of the mutants represents a NC
substitution drive the order of the mean distances

Clustering Example: HIV-1 Protease• Ron Shamir’s Expander software:
http://www.cs.tau.ac.il/~rshamir/expander/expander.html• Similar to k-means, but no a priori value of k needed; algorithm
derives optimal number of clusters• Leaves open the question of how well the residual profiles can be
used to classify mutants with differing levels of activity
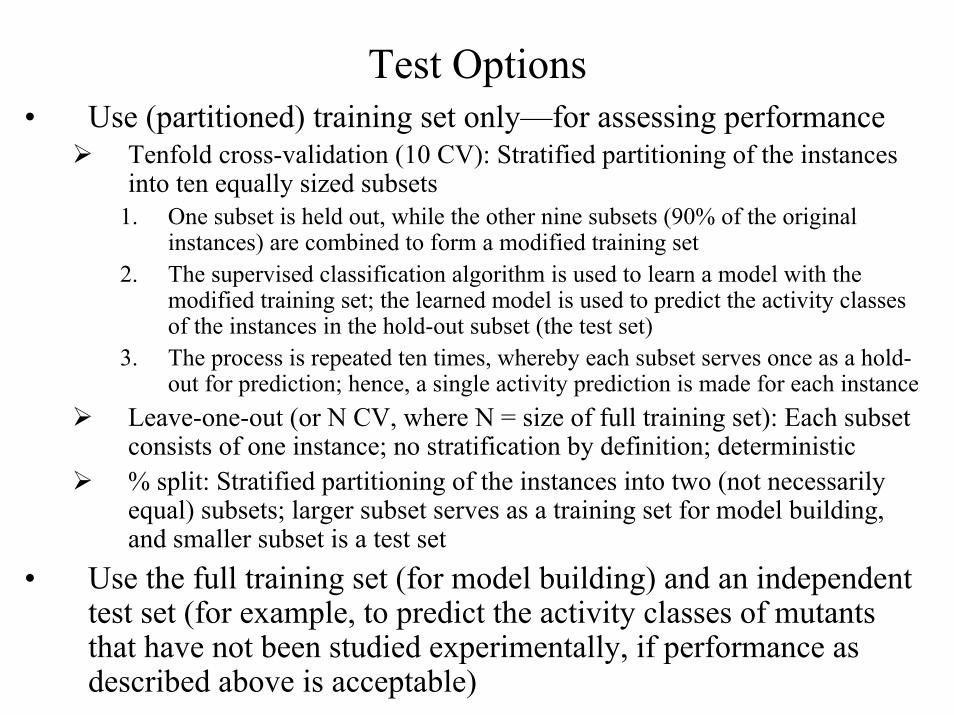
Test Options• Use (partitioned) training set only—for assessing performance
Tenfold cross-validation (10 CV): Stratified partitioning of the instances into ten equally sized subsets
1. One subset is held out, while the other nine subsets (90% of the original instances) are combined to form a modified training set
2. The supervised classification algorithm is used to learn a model with the modified training set; the learned model is used to predict the activity classes of the instances in the hold-out subset (the test set)
3. The process is repeated ten times, whereby each subset serves once as a hold-out for prediction; hence, a single activity prediction is made for each instance
Leave-one-out (or N CV, where N = size of full training set): Each subset consists of one instance; no stratification by definition; deterministic% split: Stratified partitioning of the instances into two (not necessarily equal) subsets; larger subset serves as a training set for model building, and smaller subset is a test set
• Use the full training set (for model building) and an independent test set (for example, to predict the activity classes of mutants that have not been studied experimentally, if performance as described above is acceptable)
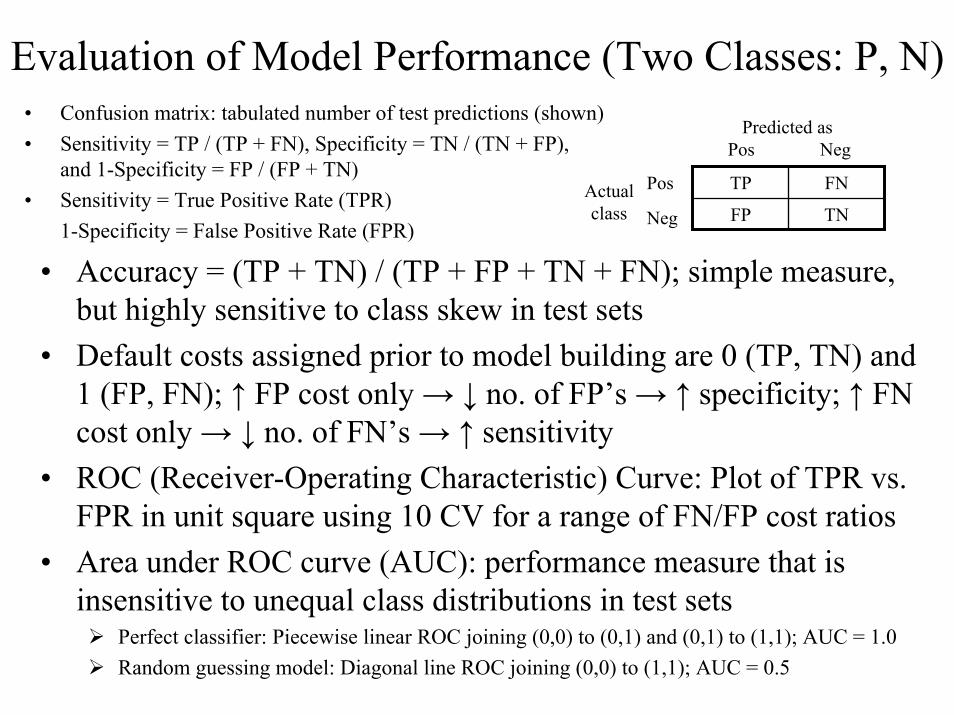
Evaluation of Model Performance (Two Classes: P, N)• Confusion matrix: tabulated number of test predictions (shown)• Sensitivity = TP / (TP + FN), Specificity = TN / (TN + FP),
and 1-Specificity = FP / (FP + TN)• Sensitivity = True Positive Rate (TPR)
1-Specificity = False Positive Rate (FPR)
• Accuracy = (TP + TN) / (TP + FP + TN + FN); simple measure, but highly sensitive to class skew in test sets
• Default costs assigned prior to model building are 0 (TP, TN) and 1 (FP, FN); ↑ FP cost only → ↓ no. of FP’s → ↑ specificity; ↑ FN cost only → ↓ no. of FN’s → ↑ sensitivity
• ROC (Receiver-Operating Characteristic) Curve: Plot of TPR vs. FPR in unit square using 10 CV for a range of FN/FP cost ratios
• Area under ROC curve (AUC): performance measure that is insensitive to unequal class distributions in test sets
Perfect classifier: Piecewise linear ROC joining (0,0) to (0,1) and (0,1) to (1,1); AUC = 1.0Random guessing model: Diagonal line ROC joining (0,0) to (1,1); AUC = 0.5
TNFP
FNTP
Predicted asPos Neg
Pos
NegActualclass

Application to Multiple (n > 2) Classes• One-against-all approach (use all training set instances)
1. Choose one class as a reference (class 1); combine all other classes together by re-labeling as non-reference (class 2)
2. Apply ROC analysis to this two-class system3. Repeat n times so that each class serves as a reference once4. Overall AUC for the multi-class system is a weighted average of the two-
class AUCs (each two-class AUC weight is the proportion of mutants belonging to the respective reference class in the training set); this method is sensitive to class skew in theory, but performs well in practice
• One-against-one approach (truncate the original training set)1. Choose one pair of classes; form a truncated training set consisting of
only instances that belong to either of these two classes2. Apply ROC analysis to this two-class system3. Repeat n(n-1)/2 times, so that every pair of classes is considered4. Overall AUC for the multi-class system is a simple average of the two-
class AUCs; this method remains insensitive to class skew in test sets

Factors Contributing to Classification CapabilityFactorsF1: no. of non-zero components in each vectorF2: value (magnitude and sign) of the non-zero
components in each vectorF3: location of the non-zero components in each
vector F4: no. of non-zero columns in each group of
vectors (submatrix of the training set) representing all mutants generated by amino acid substitutions at the same position
F5: location of the non-zero columns in each group
ControlsC1: multiply each non-zero vector component by a different random
no. generated from the interval [-2, 2] (removes influence of F2, measures contributions of F1 and F3)
C2: randomly shuffle the components of each vector independently (removes influence of F3, measures contributions of F1 and F2)
C3: composite of C1 followed by C2 (removes influences of F2 and F3, measures contribution of F1)
C4: randomly shuffle the columns within each group independently (removes influence of F5, measures contributions of F2 and F4)
C5: composite of C1 followed by C4 (removes influences of F2 and F5, measures contribution of F4)
Ten independent versions of each control training set were prepared, and two-class decision tree learning (default costs) was applied
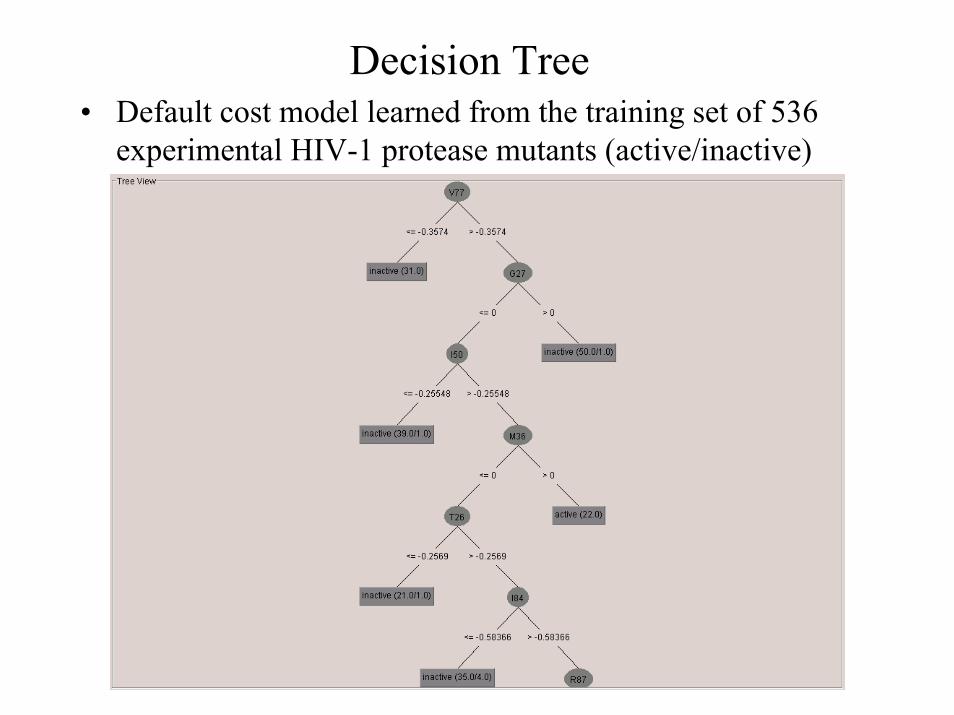
Decision Tree• Default cost model learned from the training set of 536
experimental HIV-1 protease mutants (active/inactive)
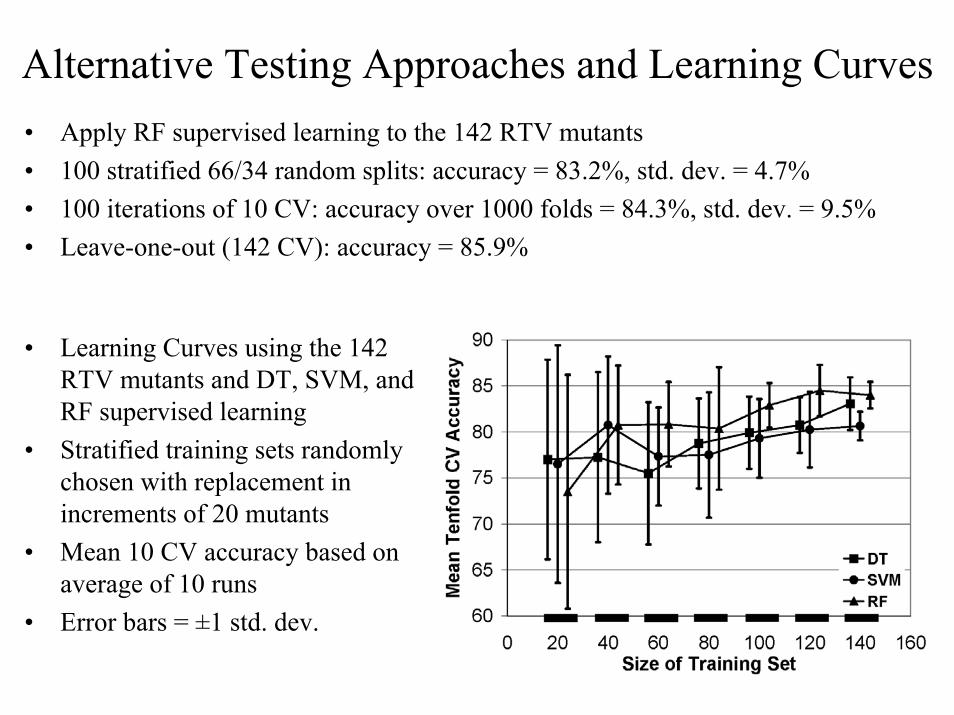
Alternative Testing Approaches and Learning Curves• Apply RF supervised learning to the 142 RTV mutants• 100 stratified 66/34 random splits: accuracy = 83.2%, std. dev. = 4.7%• 100 iterations of 10 CV: accuracy over 1000 folds = 84.3%, std. dev. = 9.5%• Leave-one-out (142 CV): accuracy = 85.9%
• Learning Curves using the 142 RTV mutants and DT, SVM, and RF supervised learning
• Stratified training sets randomly chosen with replacement in increments of 20 mutants
• Mean 10 CV accuracy based on average of 10 runs
• Error bars = ±1 std. dev.
Related Documents