SDG-A-069 1.0/E/04/5/L ME-DUS.COM Shimadzu Deutschland GmbH Albert-Hahn-Str. 6-10 47269 Duisburg · Germany Tel: + 49 - (0)203 - 7687-0 Fax: + 49 - (0)203 - 7687-680 Email: shimadzu @ shimadzu.de www.shimadzu.de

Welcome message from author
This document is posted to help you gain knowledge. Please leave a comment to let me know what you think about it! Share it to your friends and learn new things together.
Transcript

SDG-A-069
1.0/
E/0
4/5/
LM
E-D
US
.CO
MShimadzu Deutschland GmbHAlbert-Hahn-Str. 6 -10
47269 Duisburg · GermanyTel: + 49 - (0)203 - 7687-0
Fax: + 49 - (0)203 - 7687-680Email: [email protected]
www.shimadzu.de

DRUG AND CLINICAL ANALYSIS
GCMS in drug screening and clinical chemistry 9
TLC/MS offline coupling 10
Higher speed through Fast-GCMS 11
ENVIRONMENTAL ANALYSIS
Determination of oil in water according to DIN H53 14
BETX in water and aldehydes determination in printed colours 16
Super fast and sensitive 18
GCMS helps to chemical disarmament 20
It’s quantity that matters 22
ENVIRONMENTAL HYGIENE
“Poison in textiles” 26
Tank up in the rapeseed fields 28
Something in the air 32
FOOD ANALYSIS
Development of a fully automated GC-GC system 36
16 times faster with the GC-2010 38
Fast-GC-ECD analysis of organochlorine pesticides 40
Fruits, not only sweet 43
Customized solutions for complex GCMS problems 46
INSTRUMENTATION
One more success story 50
Innovative design for the highest demands 51
Handy helper for GC and GCMS 52
Cooled PTV injector Optic 3 53
E3-Concept: Efficient, Excellent, Easy 54
POLYMER ANALYSIS
Not just clean – but pure... 58
All inclusive 60
Saving time in Pyrolysis-GCMS 61
Py-GCMS in polymer and additive analysis 62
SOFTWARE
LabSolutions – Solutions for your laboratory 64
One for all – All for one 65
Automation utilising LabSolutions software 66
Excel lends a hand to improve reports 68
Automated workflow with MS Excel 70
Don’t panic 72
Content
Application Book GC/GCMSVolume 1
Publisher:Shimadzu Deutschland GmbHAlbert-Hahn-Str. 6-10 · 47269 DuisburgTelefon: +49 (0) 203 7687-0Telefax: +49 (0) 203 766625Email: [email protected]: www.shimadzu.de
Editorial Team:Uta SteegerTelefon: +49 (0) 203 7687-410 Ralf Weber, Adlene Berg
Design and Production:ME Werbeagentur GWA · Düsseldorf
Circulation:1.000 Copies
© Copyright:Shimadzu Deutschland GmbH, Duisburg, Reprint, in whole or in part, is subject to the permission of the editorial office.
Windows is a Trademark of Microsoft Corporation.

DRUG AND CLINICAL ANALYSIS
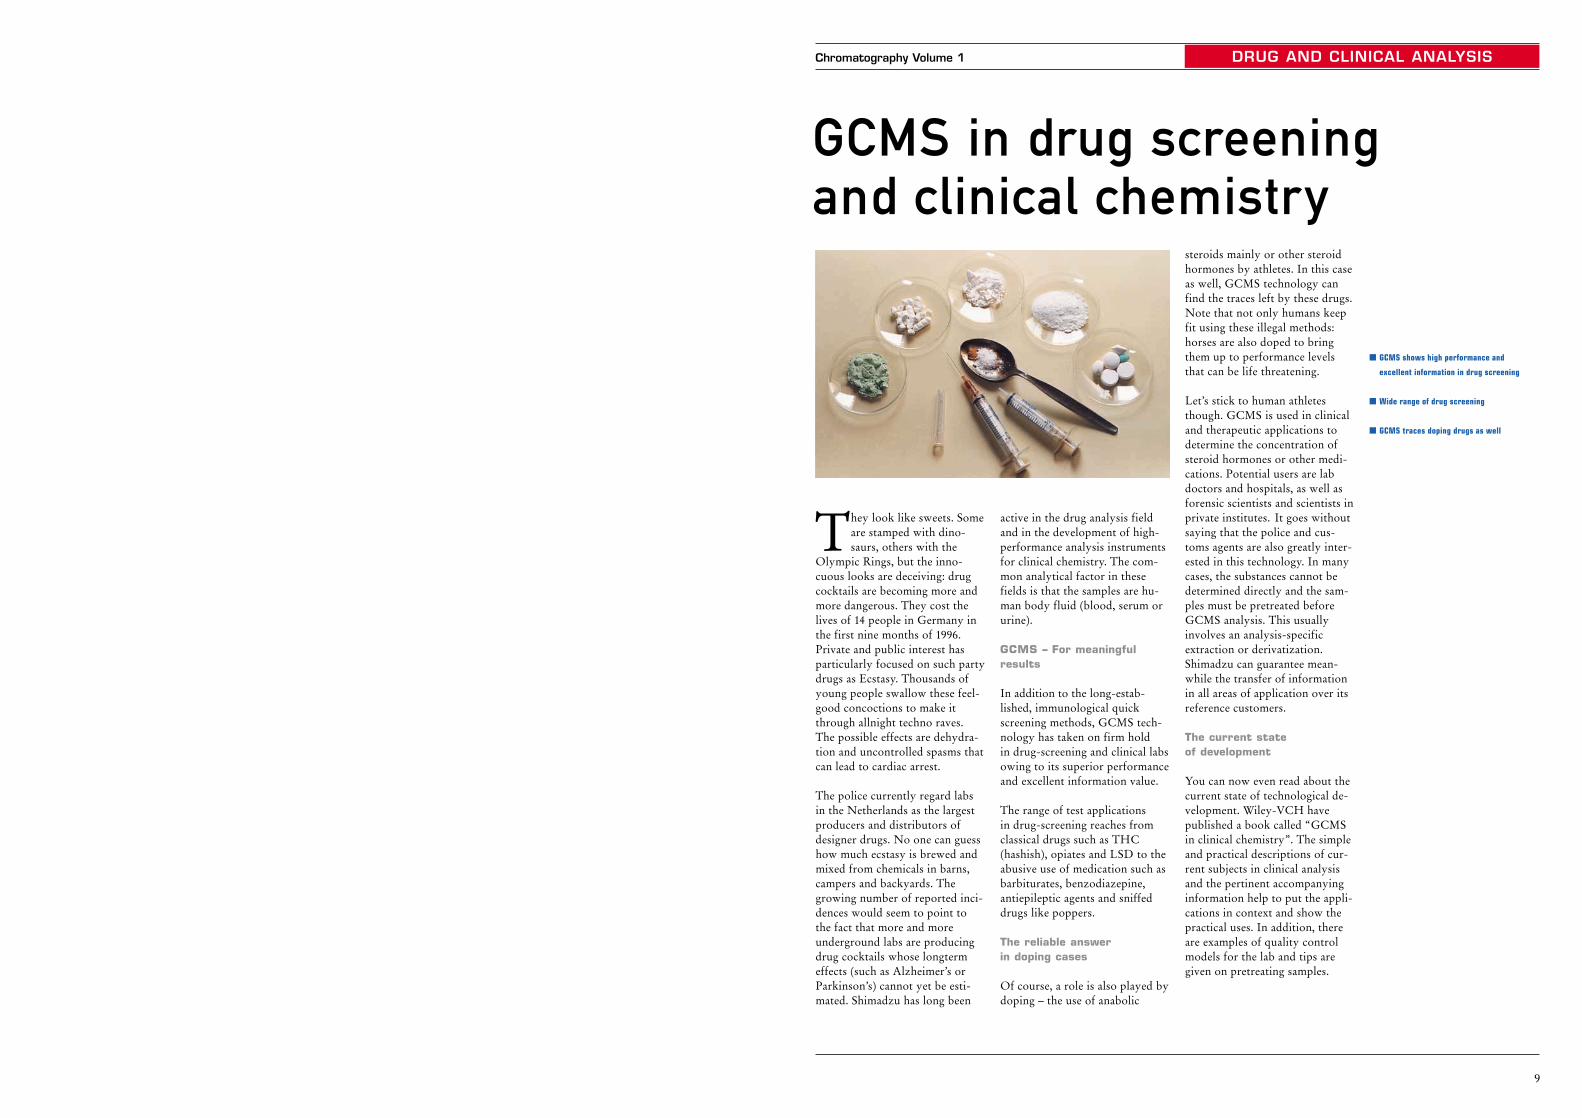
They look like sweets. Someare stamped with dino-saurs, others with the
Olympic Rings, but the inno-cuous looks are deceiving: drugcocktails are becoming more andmore dangerous. They cost thelives of 14 people in Germany inthe first nine months of 1996. Private and public interest hasparticularly focused on such partydrugs as Ecstasy. Thousands ofyoung people swallow these feel-good concoctions to make itthrough allnight techno raves.The possible effects are dehydra-tion and uncontrolled spasms thatcan lead to cardiac arrest.
The police currently regard labsin the Netherlands as the largestproducers and distributors ofdesigner drugs. No one can guesshow much ecstasy is brewed andmixed from chemicals in barns,campers and backyards. Thegrowing number of reported inci-dences would seem to point tothe fact that more and moreunderground labs are producingdrug cocktails whose longtermeffects (such as Alzheimer’s orParkinson’s) cannot yet be esti-mated. Shimadzu has long been
active in the drug analysis fieldand in the development of high-performance analysis instrumentsfor clinical chemistry. The com-mon analytical factor in thesefields is that the samples are hu-man body fluid (blood, serum orurine).
GCMS – For meaningfulresults
In addition to the long-estab-lished, immunological quickscreening methods, GCMS tech-nology has taken on firm hold in drug-screening and clinical labsowing to its superior performanceand excellent information value.
The range of test applications in drug-screening reaches fromclassical drugs such as THC(hashish), opiates and LSD to theabusive use of medication such asbarbiturates, benzodiazepine,antiepileptic agents and sniffeddrugs like poppers.
The reliable answer in doping cases
Of course, a role is also played bydoping – the use of anabolic
steroids mainly or other steroidhormones by athletes. In this caseas well, GCMS technology canfind the traces left by these drugs.Note that not only humans keepfit using these illegal methods:horses are also doped to bringthem up to performance levelsthat can be life threatening.
Let’s stick to human athletesthough. GCMS is used in clinicaland therapeutic applications todetermine the concentration ofsteroid hormones or other medi-cations. Potential users are labdoctors and hospitals, as well asforensic scientists and scientists inprivate institutes. It goes withoutsaying that the police and cus-toms agents are also greatly inter-ested in this technology. In manycases, the substances cannot bedetermined directly and the sam-ples must be pretreated beforeGCMS analysis. This usuallyinvolves an analysis-specificextraction or derivatization.Shimadzu can guarantee mean-while the transfer of informationin all areas of application over itsreference customers.
The current state of development
You can now even read about thecurrent state of technological de-velopment. Wiley-VCH havepublished a book called “GCMSin clinical chemistry”. The simpleand practical descriptions of cur-rent subjects in clinical analysisand the pertinent accompanyinginformation help to put the appli-cations in context and show thepractical uses. In addition, thereare examples of quality controlmodels for the lab and tips aregiven on pretreating samples.
� GCMS shows high performance and
excellent information in drug screening
� Wide range of drug screening
� GCMS traces doping drugs as well
9
Chromatography Volume 1
GCMS in drug screeningand clinical chemistry
� Short high-performance columns increase
sample throughput
� The analysis time is reduced without loss
in resolution
� Impressive improvement in productivity
DRUG AND CLINICAL ANALYSIS
11
Chromatography Volume 1
Higher speed through Fast-GCMS
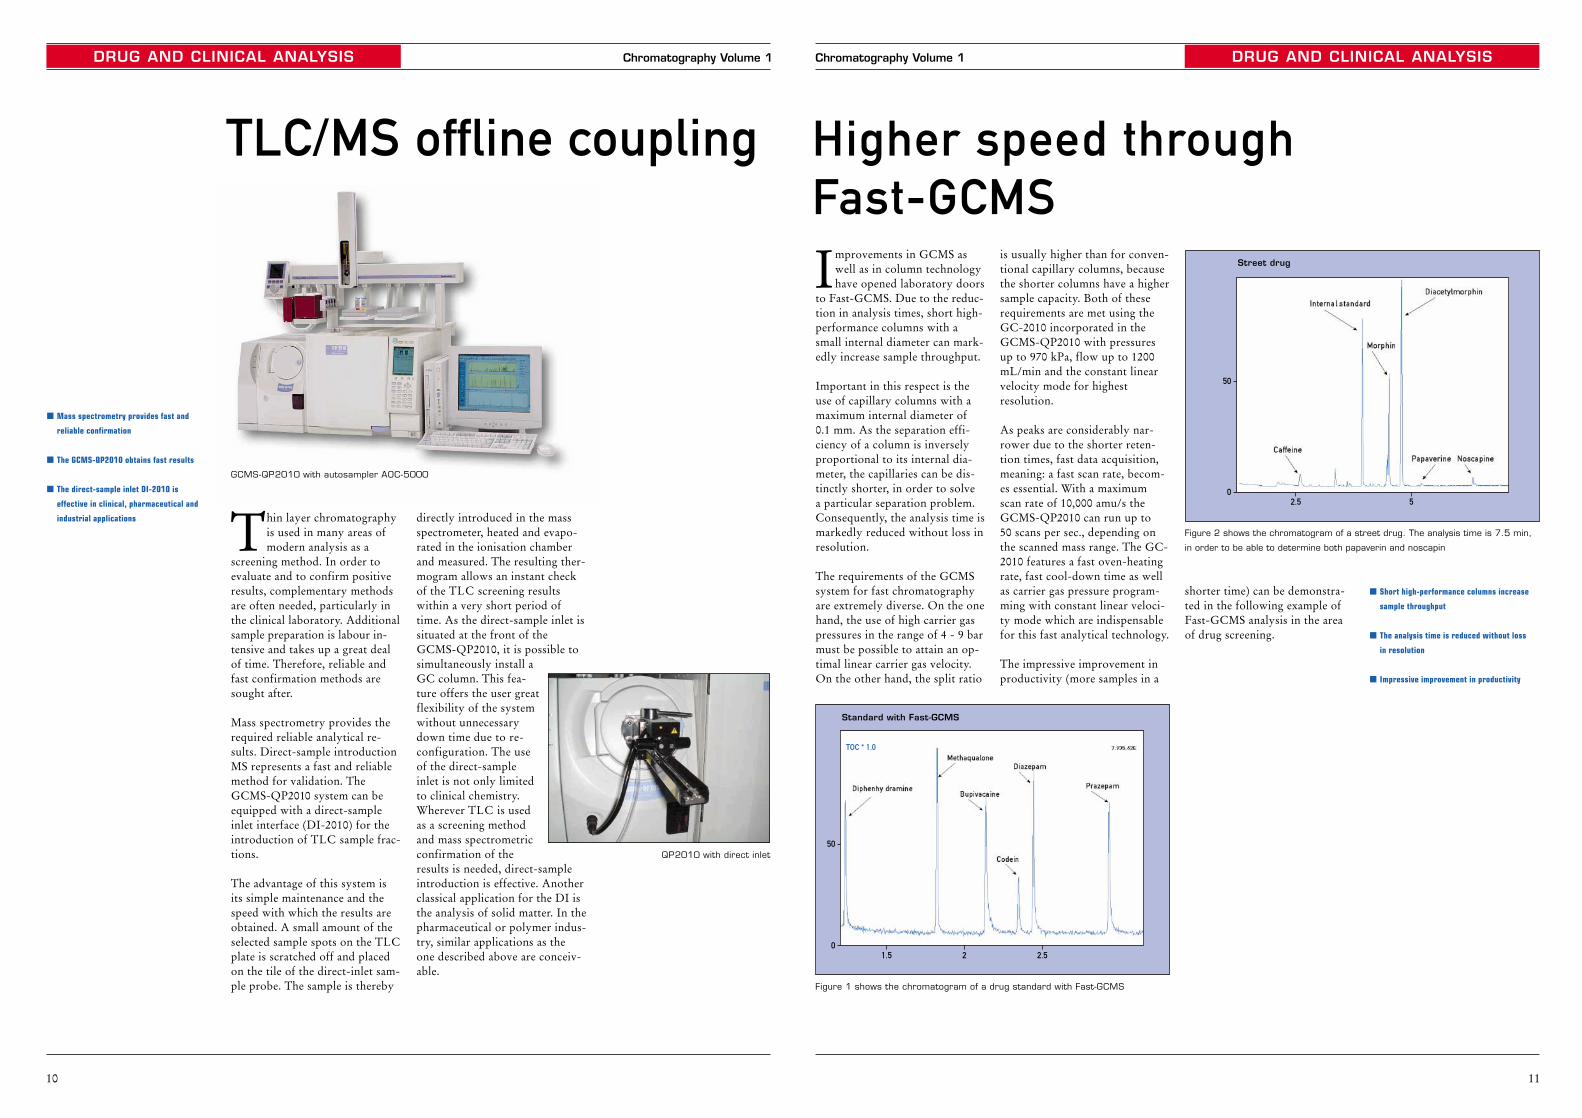
Figure 1 shows the chromatogram of a drug standard with Fast-GCMS
Figure 2 shows the chromatogram of a street drug. The analysis time is 7.5 min,
in order to be able to determine both papaverin and noscapin
1.5 2 2.5
50
0
Standard with Fast-GCMS
2.5 5
50
0
Street drug
TOC * 1.0
Improvements in GCMS aswell as in column technologyhave opened laboratory doors
to Fast-GCMS. Due to the reduc-tion in analysis times, short high-performance columns with asmall internal diameter can mark-edly increase sample throughput.
Important in this respect is theuse of capillary columns with amaximum internal diameter of 0.1 mm. As the separation effi-ciency of a column is inverselyproportional to its internal dia-meter, the capillaries can be dis-tinctly shorter, in order to solve a particular separation problem.Consequently, the analysis time ismarkedly reduced without loss inresolution.
The requirements of the GCMSsystem for fast chromatographyare extremely diverse. On the onehand, the use of high carrier gaspressures in the range of 4 - 9 barmust be possible to attain an op-timal linear carrier gas velocity.On the other hand, the split ratio
is usually higher than for conven-tional capillary columns, becausethe shorter columns have a highersample capacity. Both of theserequirements are met using theGC-2010 incorporated in theGCMS-QP2010 with pressuresup to 970 kPa, flow up to 1200mL/min and the constant linearvelocity mode for highestresolution.
As peaks are considerably nar-rower due to the shorter reten-tion times, fast data acquisition,meaning: a fast scan rate, becom-es essential. With a maximumscan rate of 10,000 amu/s theGCMS-QP2010 can run up to 50 scans per sec., depending onthe scanned mass range. The GC-2010 features a fast oven-heatingrate, fast cool-down time as wellas carrier gas pressure program-ming with constant linear veloci-ty mode which are indispensablefor this fast analytical technology.
The impressive improvement inproductivity (more samples in a
DRUG AND CLINICAL ANALYSIS Chromatography Volume 1
10
QP2010 with direct inlet
� Mass spectrometry provides fast and
reliable confirmation
� The GCMS-QP2010 obtains fast results
� The direct-sample inlet DI-2010 is
effective in clinical, pharmaceutical and
industrial applications
TLC/MS offline coupling
Thin layer chromatographyis used in many areas ofmodern analysis as a
screening method. In order toevaluate and to confirm positiveresults, complementary methodsare often needed, particularly inthe clinical laboratory. Additionalsample preparation is labour in-tensive and takes up a great dealof time. Therefore, reliable andfast confirmation methods aresought after.
Mass spectrometry provides therequired reliable analytical re-sults. Direct-sample introductionMS represents a fast and reliablemethod for validation. TheGCMS-QP2010 system can beequipped with a direct-sampleinlet interface (DI-2010) for theintroduction of TLC sample frac-tions.
The advantage of this system isits simple maintenance and thespeed with which the results areobtained. A small amount of theselected sample spots on the TLCplate is scratched off and placedon the tile of the direct-inlet sam-ple probe. The sample is thereby
directly introduced in the massspectrometer, heated and evapo-rated in the ionisation chamberand measured. The resulting ther-mogram allows an instant checkof the TLC screening resultswithin a very short period oftime. As the direct-sample inlet issituated at the front of the GCMS-QP2010, it is possible tosimultaneously install aGC column. This fea-ture offers the user greatflexibility of the systemwithout unnecessarydown time due to re-configuration. The useof the direct-sampleinlet is not only limitedto clinical chemistry.Wherever TLC is usedas a screening methodand mass spectrometricconfirmation of theresults is needed, direct-sampleintroduction is effective. Anotherclassical application for the DI isthe analysis of solid matter. In thepharmaceutical or polymer indus-try, similar applications as theone described above are conceiv-able.
GCMS-QP2010 with autosampler AOC-5000
shorter time) can be demonstra-ted in the following example ofFast-GCMS analysis in the areaof drug screening.


ENVIRONMENTAL ANALYSIS
15
Chromatography Volume 1
Minutes
0
0
25
75
2.5 5.0 7.5
50
mVolt
s
Figure 3: Chromatogram of the extract (8 mL) of a wastewater sample.
The injection volume was 1 µL
Figure 4: “Fast-GC” of an oil standard. Carrier gas: hydrogen, linear gas velocity:
143 cm/sec, Temperature program 70 °C 1 min, 100 °C/min to 320 °C 4 min
A + B = 1.034 mg/mL
Peak Name
ESTD Concentration
Minutes
mVolt
s
50
25
2.5 5.0
C9
C40
to use relatively short columnswith small internal diameter andlow film thickness.
For oil analysis, however, col-umns with very small internaldiameter as well as low filmthickness are not entirely suit-able, since the samples are inject-ed directly onto the column andthe column capacity needs to betaken into account. As a compro-mise, a 15 m RTX-5 (Restek) col-umn (0.25 mm internal diameter,0.25 µm film thickness) with anuncoated precolumn (retentiongap 2 m, ID = 0.53 mm) wasused. The resulting chromato-gram shows the improvement inanalysis time which can beobtained when using hydrogen as carrier gas, without loss ofseparation efficiency. Using aGC-2010 with high-power ovenallows high heating rates. Thechromatogram in Figure 4 wasobtained at a heating rate of 100 °C/min.
The retention time of C40 wasless than 6 min. This guaranteeshigh sample throughput and veryhigh efficiency.
gration. Based on this calibration,the concentrations of real sam-ples could be determined. Thewaste-water sample was first fil-tered through a folded filter andsubsequently liquid-liquidextraction with cyclohexane wascarried out in a separatory fun-nel. The organic phase was sepa-rated and evaporated down to 8 mL. 1 µL of the extract wasthen injected into the GC sys-tem. Figure 3 shows the resultingchromatogram. A concentrationof 1.034 mg/mL was calculatedfrom the calibration. The hydro-carbon index � could be subse-quently calculated in accordancewith H53: � = 16.46 mg/L.
Fast-GC in oil analysis
In many laboratories productivi-ty, and therefore analysis time,plays an important role. Fast-GChas proved to be a suitablemethod. The separation efficiencyof capillary columns increases lin-early with decreasing internaldiameter. However separationefficiency only increases by thesquare root of the column length.For Fast-GC it is, therefore, best
� Complete package for determination
of oil in water
� Fast-GC is a suitable analysis method
regarding productivity
� High sample throughput and high
efficiency
ENVIRONMENTAL ANALYSIS Chromatography Volume 1
14
Minutes
0
5.0
2.5
5.0
5 10 15
C9
S E
Typ A
Typ B
C40mVolt
s
Concentration in mg/mL0.0
00.5 1.0 1.5
5000
10000
15000 External Standard Curve · Scaling: None
Linear FitR^2 = 0.9992
Are
a x
10
00
Figure 1: Chromatogram of a calibration mixture containing diesel and lubricating
oil (0.8 mg/mL) dissolved in cyclohexane. n-Nonane and n-tetracontane were
added to the solvent for determination of the integration limits (S and E)
Figure 2: Calibration curve in concentration range of 0.05 up to 1.6 mg/mL.
The areas are represented as in Figure 1 and calculated after background
subtraction. The regression coefficient is r2 = 0.9992
water according to DIN H53Determination of oil in
In the determination of oil inwater it has not been possibleto date to substitute trichloro-
trifluoroethane, used in the DINnorm 338 409/procedure H18(FTIR). Therefore the workingcommittee DIN NAW 1.3 hasdecided in November 1999 towithdraw the standard DIN 38409, Part H18.
Alternatives to H18
As an alternative the procedureH53 is part of a European normDIN EN 9377-4. This procedureuses liquid-liquid extraction ofthe water sample and subsequentgas chromatographic separationusing a flame ionisation detector(FID). Cyclohexane, n-hexane,iso-hexane and petroleum etherare suitable extraction solvents.
Essential considerations for theanalysis are:
1. No discrimination of higher-boiling components relative to low-boiling components. A non-discriminating injector,
such as the OCI-2010 on-col-umn injector, should thereforebe used. The ratio of C40 toC20 signals in the chromato-gram should be larger than 0.8.
2. A data acquisition systemshould allow the possibility ofsubtracting blank chromato-grams (injection of pure sol-vent).
3. Integration is carried out fromn-nonane (or n-decane) to n-tetracontane as one structurewith horizontal baseline.
Complete solution for the determination of oil in water
Using the GC-2010 with on-column injector and GCsolutionsoftware in combination with theAOC-20I/S autosampler, Shi-madzu offers a complete packagefor the determination of oil inwater, which complies with allrequirements of the new norm.The C40 to C20 ratio was deter-mined after injection of an alkanemixture and was approximately0.97, markedly higher than the
required value of 0.8. So samplediscrimination was ruled out.The GC system is calibrated with a mixture of two oils: a diesel oil(type A, low boiling point range),which will show well-resolvedpeaks in the chromatogram, and a lubricating oil (type B, higherboiling range), which containsnon-resolved components.
In order to guarantee accuracy, it is important to record blankchromatograms of pure solventfor background subtraction.After subtracting the back-ground, the area between n-nonane (n-decane) and n-tetra-contane is used to calculate thesignal. The calibration rangeshould be adjusted to the expect-ed concentration after extraction.
Figure 2 shows the calibrationcurve in concentration range of0.05 up to 1.6 mg/mL extract.The regression coefficient with avalue of r2 = 0.9992 is excellentand represents a measure for thereliability of the results afterbackground subtraction and inte-
Fast, faster, “Fast-GC”
0.20.0290.0290.0580.0240.0890.16
ENVIRONMENTAL ANALYSIS
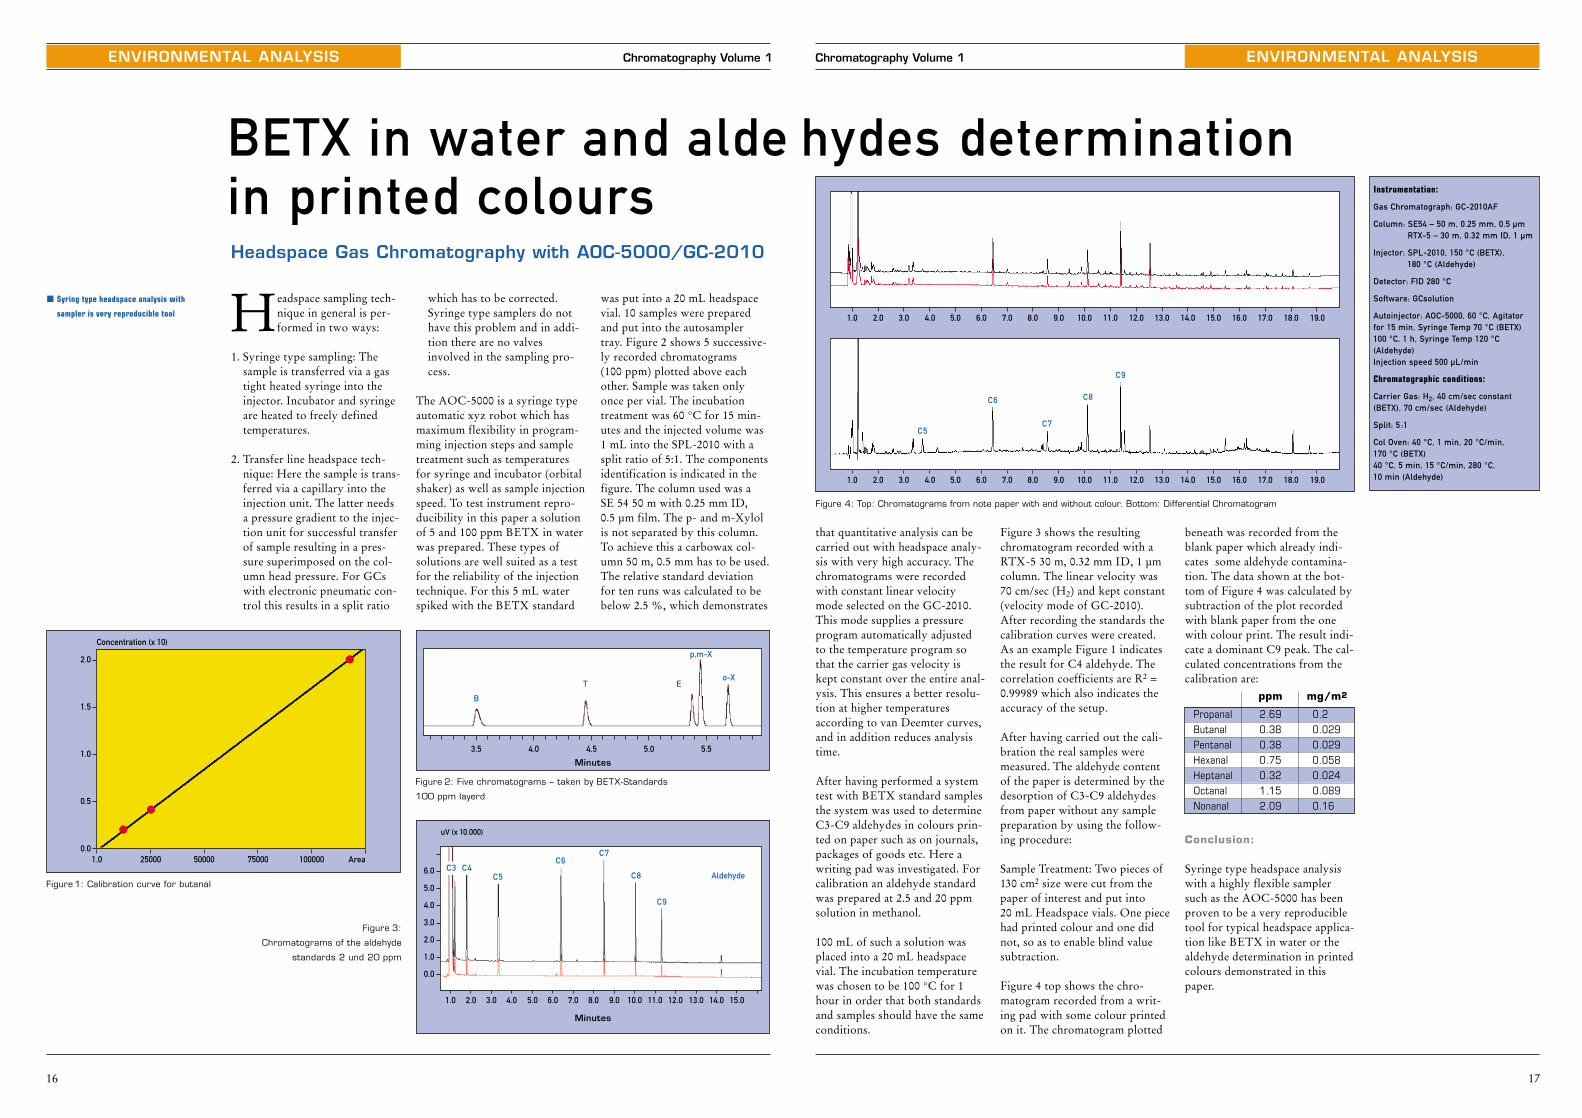
beneath was recorded from theblank paper which already indi-cates some aldehyde contamina-tion. The data shown at the bot-tom of Figure 4 was calculated bysubtraction of the plot recordedwith blank paper from the onewith colour print. The result indi-cate a dominant C9 peak. The cal-culated concentrations from thecalibration are:
Conclusion:
Syringe type headspace analysiswith a highly flexible samplersuch as the AOC-5000 has beenproven to be a very reproducibletool for typical headspace applica-tion like BETX in water or thealdehyde determination in printedcolours demonstrated in thispaper.
17
Chromatography Volume 1
hydes determinationBETX in water and aldein printed colours
that quantitative analysis can becarried out with headspace analy-sis with very high accuracy. Thechromatograms were recordedwith constant linear velocitymode selected on the GC-2010.This mode supplies a pressureprogram automatically adjustedto the temperature program sothat the carrier gas velocity iskept constant over the entire anal-ysis. This ensures a better resolu-tion at higher temperaturesaccording to van Deemter curves,and in addition reduces analysistime.
After having performed a systemtest with BETX standard samplesthe system was used to determineC3-C9 aldehydes in colours prin-ted on paper such as on journals,packages of goods etc. Here awriting pad was investigated. Forcalibration an aldehyde standardwas prepared at 2.5 and 20 ppmsolution in methanol.
100 mL of such a solution wasplaced into a 20 mL headspacevial. The incubation temperaturewas chosen to be 100 °C for 1hour in order that both standardsand samples should have the sameconditions.
Figure 3 shows the resultingchromatogram recorded with aRTX-5 30 m, 0.32 mm ID, 1 µmcolumn. The linear velocity was70 cm/sec (H2) and kept constant(velocity mode of GC-2010).After recording the standards thecalibration curves were created.As an example Figure 1 indicatesthe result for C4 aldehyde. Thecorrelation coefficients are R2 =0.99989 which also indicates theaccuracy of the setup.
After having carried out the cali-bration the real samples weremeasured. The aldehyde contentof the paper is determined by thedesorption of C3-C9 aldehydesfrom paper without any samplepreparation by using the follow-ing procedure:
Sample Treatment: Two pieces of130 cm2 size were cut from thepaper of interest and put into 20 mL Headspace vials. One piecehad printed colour and one didnot, so as to enable blind valuesubtraction.
Figure 4 top shows the chro-matogram recorded from a writ-ing pad with some colour printedon it. The chromatogram plotted
1.0 2.0 3.0 4.0 5.0 6.0 7.0 8.0 9.0 10.0 11.0 12.0 13.0 14.0 15.0 16.0 17.0 18.0 19.0
1.0
C5
C6
C7
C8
C9
2.0 3.0 4.0 5.0 6.0 7.0 8.0 9.0 10.0 11.0 12.0 13.0 14.0 15.0 16.0 17.0 18.0 19.0
Figure 4: Top: Chromatograms from note paper with and without colour. Bottom: Differential Chromatogram
Instrumentation:
Gas Chromatograph: GC-2010AF
Column: SE54 – 50 m, 0.25 mm, 0.5 µmRTX-5 – 30 m, 0.32 mm ID, 1 µm
Injector: SPL-2010, 150 °C (BETX), 180 °C (Aldehyde)
Detector: FID 280 °C
Software: GCsolution
Autoinjector: AOC-5000, 60 °C, Agitatorfor 15 min, Syringe Temp 70 °C (BETX)100 °C, 1 h, Syringe Temp 120 °C (Aldehyde)Injection speed 500 µL/min
Chromatographic conditions:
Carrier Gas: H2, 40 cm/sec constant(BETX), 70 cm/sec (Aldehyde)
Split: 5 :1
Col Oven: 40 °C, 1 min, 20 °C/min, 170 °C (BETX)40 °C, 5 min, 15 °C/min, 280 °C, 10 min (Aldehyde)
PropanalButanalPentanalHexanalHeptanalOctanalNonanal
2.690.380.380.750.321.152.09
ppm mg/m2
ENVIRONMENTAL ANALYSIS Chromatography Volume 1
16
Headspace sampling tech-nique in general is per-formed in two ways:
1. Syringe type sampling: Thesample is transferred via a gastight heated syringe into theinjector. Incubator and syringeare heated to freely definedtemperatures.
2. Transfer line headspace tech-nique: Here the sample is trans-ferred via a capillary into theinjection unit. The latter needsa pressure gradient to the injec-tion unit for successful transferof sample resulting in a pres-sure superimposed on the col-umn head pressure. For GCswith electronic pneumatic con-trol this results in a split ratio
which has to be corrected.Syringe type samplers do nothave this problem and in addi-tion there are no valvesinvolved in the sampling pro-cess.
The AOC-5000 is a syringe typeautomatic xyz robot which hasmaximum flexibility in program-ming injection steps and sampletreatment such as temperaturesfor syringe and incubator (orbitalshaker) as well as sample injectionspeed. To test instrument repro-ducibility in this paper a solutionof 5 and 100 ppm BETX in waterwas prepared. These types ofsolutions are well suited as a testfor the reliability of the injectiontechnique. For this 5 mL waterspiked with the BETX standard
was put into a 20 mL headspacevial. 10 samples were preparedand put into the autosampler tray. Figure 2 shows 5 successive-ly recorded chromatograms (100 ppm) plotted above eachother. Sample was taken onlyonce per vial. The incubationtreatment was 60 °C for 15 min-utes and the injected volume was1 mL into the SPL-2010 with asplit ratio of 5:1. The componentsidentification is indicated in thefigure. The column used was a SE 54 50 m with 0.25 mm ID, 0.5 µm film. The p- and m-Xylolis not separated by this column.To achieve this a carbowax col-umn 50 m, 0.5 mm has to be used.The relative standard deviationfor ten runs was calculated to bebelow 2.5 %, which demonstrates
� Syring type headspace analysis with
sampler is very reproducible tool
Headspace Gas Chromatography with AOC-5000/GC-2010
3.5
B
T E
p,m-X
o-X
4.0 4.5 5.0 5.5
Minutes
1.0 2.0 3.0 4.0 5.0
Minutes
6.0 7.0 8.0 9.0 10.0 11.0 12.0 13.0 14.0 15.0
0.0
1.0
2.0
3.0
4.0
5.0
6.0
uV (x 10.000)
C3 C4C5
C6C7
C8 Aldehyde
C9
1.0 25000 50000 75000 100000 Area0.0
0.5
1.0
1.5
2.0
Concentration (x 10)
Figure 2: Five chromatograms – taken by BETX-Standards
100 ppm layerd
Figure 1: Calibration curve for butanal
Figure 3:
Chromatograms of the aldehyde
standards 2 und 20 ppm
ENVIRONMENTAL ANALYSIS
19
Chromatography Volume 1
0.00
0.25
0.50
1.00
1.25
1.50
1.75
2.00
2.25
2.50
2.75
3.00
0.75
4.0 4.5 5.0 5.5 6.0 6.5 7.0 7.5
Black Tea
ChlorpyrifosEndosulfan Sulfate
Mix 0.5 pg
cal technique which enables thedetection of compounds that, onthe basis of their chemical struc-ture, are able to capture elec-trons. NCI applications are, forexample, the detection of chlori-nated pesticides and phosphoricacid ester pesticides (for examplelindane, chlorpyrifos).
SEI (simulated EI) and NCI canbe carried out on the GCMS-QP2010 without hardware modi-fications with the same ionsource. The user simply indicatesin the GCMSsolution softwarewhich ionisation mode is to beapplied for the analysis. The sys-tem is then optimised automati-cally via a tuning procedure.
Precise Fast-GC
Time plays an important role inpesticide analysis. The analysis results must be available as soon as possible so that, in the case ofpositive results, the necessarymeasures can be taken immedi-ately. Also in this respect, theGCMS-QP2010 lives up to itsoutstanding qualities: with theproven GC-2010 system in theFast-GC mode, results becomeavailable almost immediately. Important features are the high
scan rate of the MS detector of up to 10,000 amu/s and the high data acquisition rate (up to 50 spectra/s). These featuresallow, also for peaks with awidth of significantly less than 1second, acquisition of accuratemass spectra that are suitable formatching against an MS library.
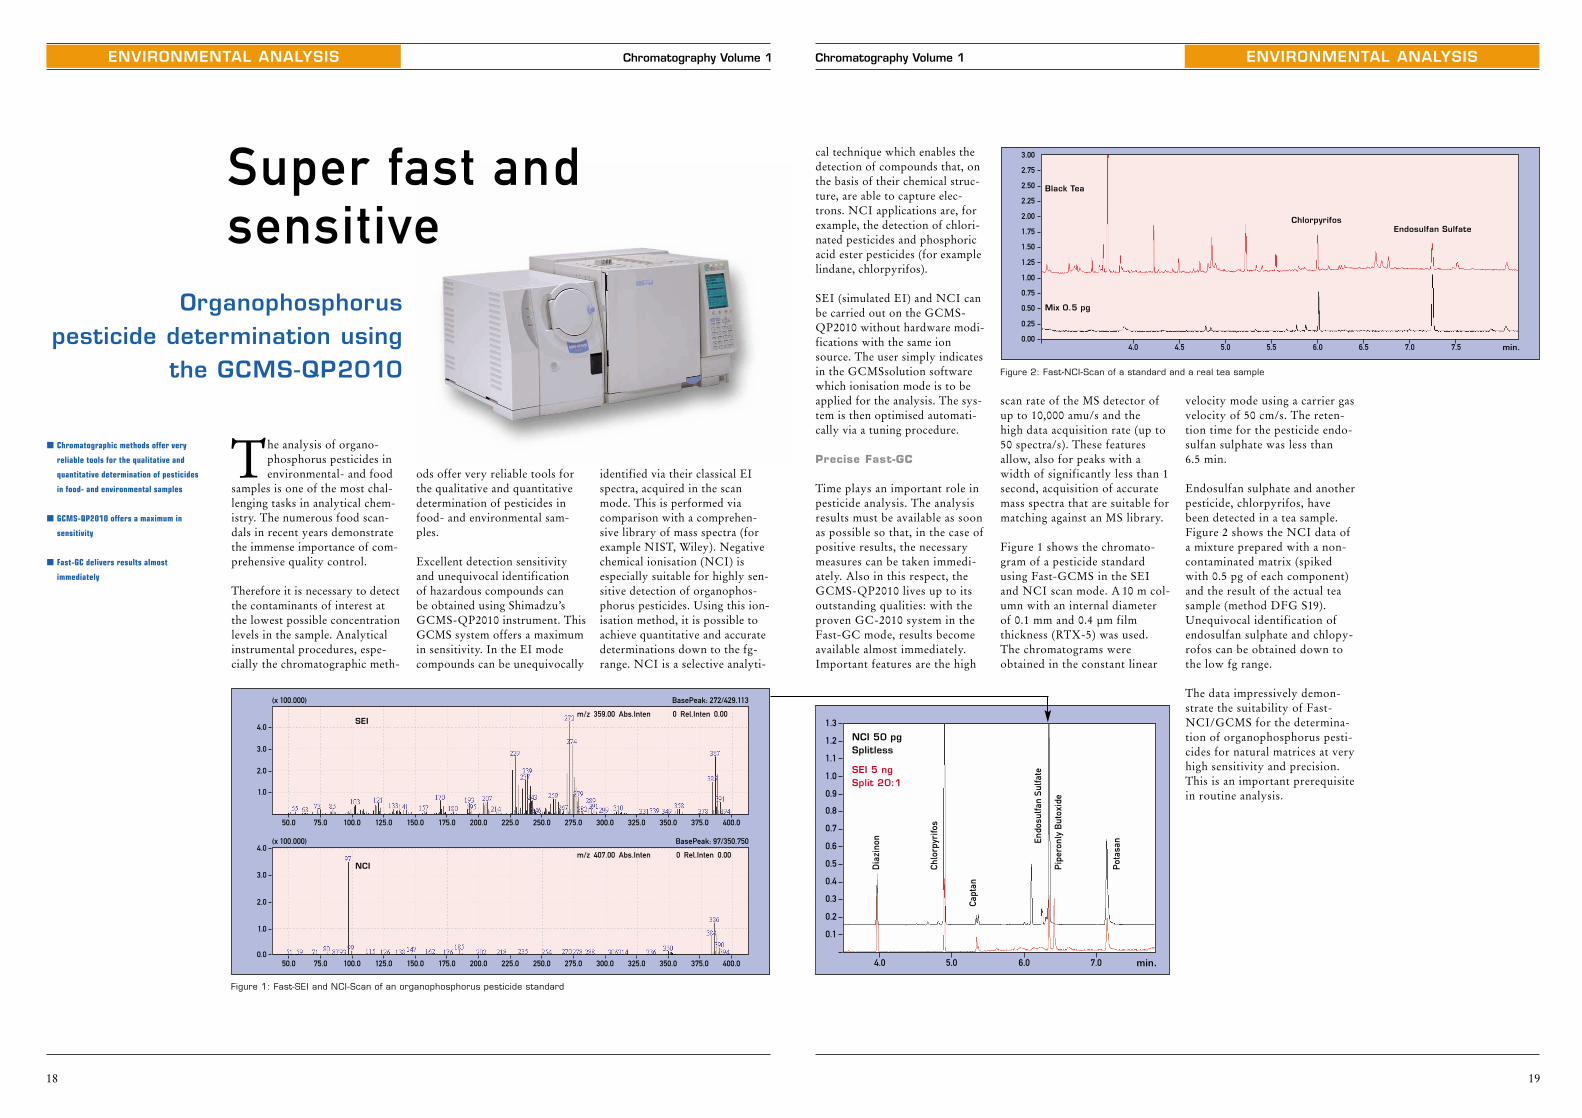
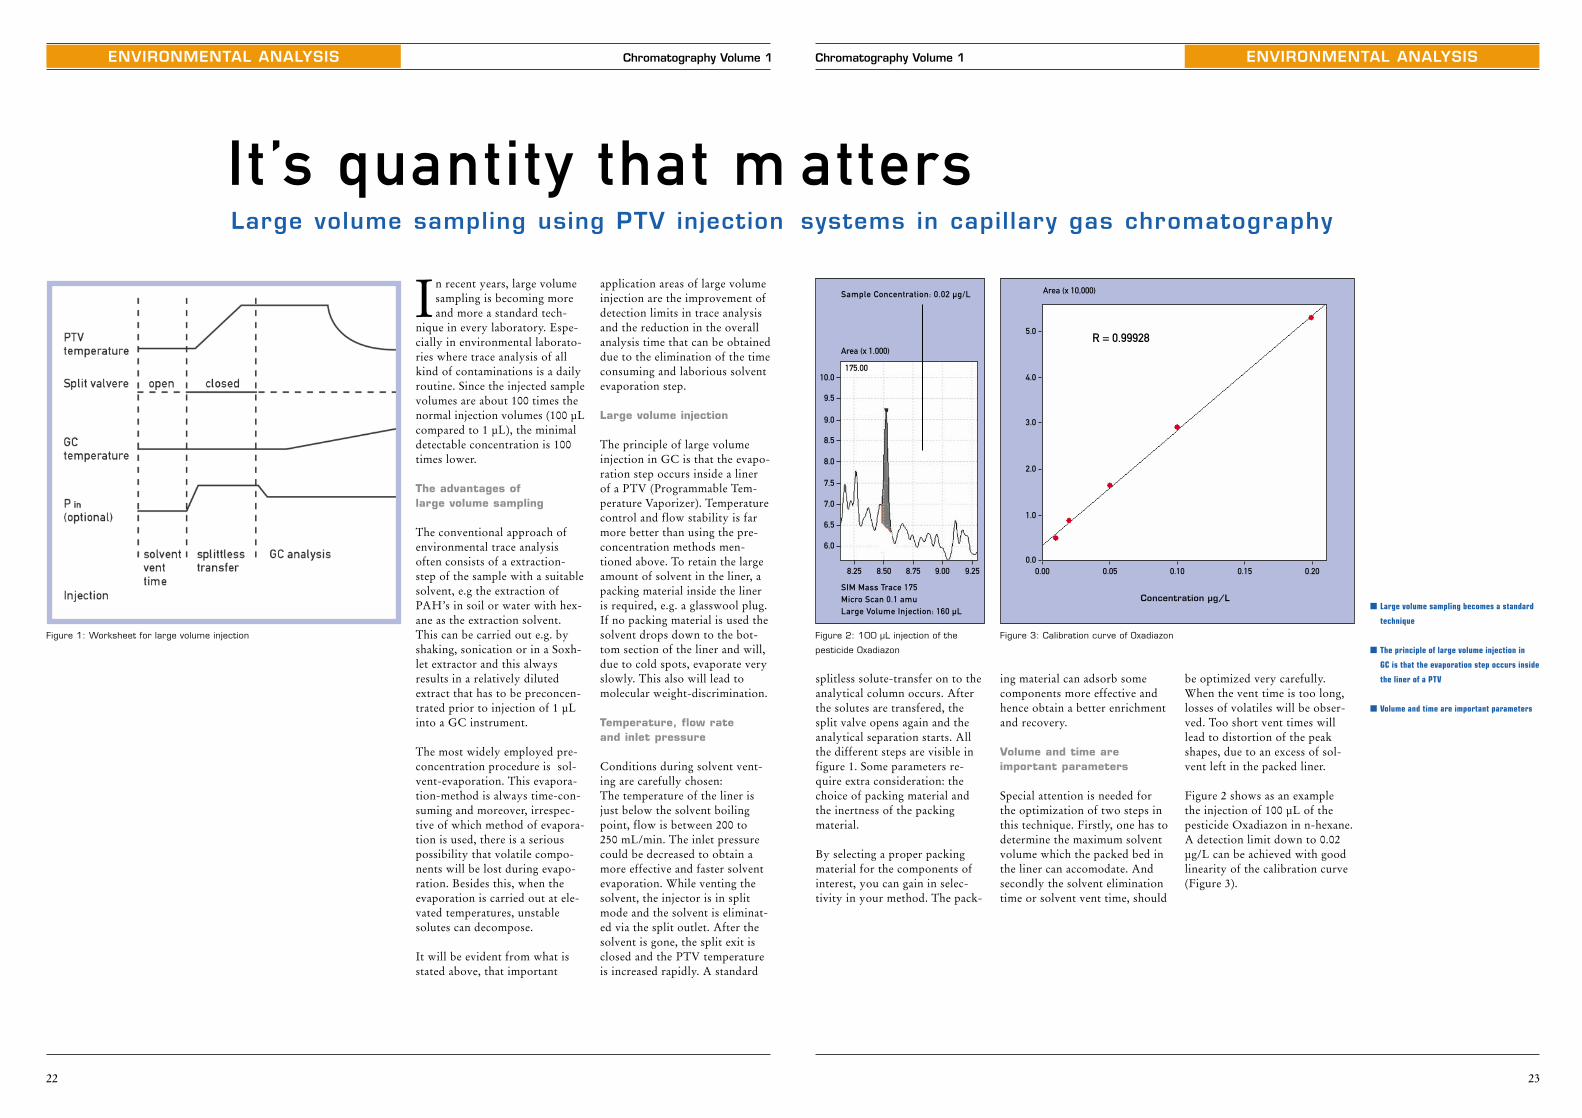
Figure 1 shows the chromato-gram of a pesticide standardusing Fast-GCMS in the SEIand NCI scan mode. A 10 m col-umn with an internal diameterof 0.1 mm and 0.4 µm filmthickness (RTX-5) was used.The chromatograms wereobtained in the constant linear
Figure 2: Fast-NCI-Scan of a standard and a real tea sample
velocity mode using a carrier gasvelocity of 50 cm/s. The reten-tion time for the pesticide endo-sulfan sulphate was less than 6.5 min.
Endosulfan sulphate and anotherpesticide, chlorpyrifos, havebeen detected in a tea sample.Figure 2 shows the NCI data ofa mixture prepared with a non-contaminated matrix (spikedwith 0.5 pg of each component)and the result of the actual teasample (method DFG S19).Unequivocal identification ofendosulfan sulphate and chlopy-rofos can be obtained down tothe low fg range.
The data impressively demon-strate the suitability of Fast-NCI/GCMS for the determina-tion of organophosphorus pesti-cides for natural matrices at veryhigh sensitivity and precision.This is an important prerequisitein routine analysis.
min.
� Chromatographic methods offer very
reliable tools for the qualitative and
quantitative determination of pesticides
in food- and environmental samples
� GCMS-QP2010 offers a maximum in
sensitivity
� Fast-GC delivers results almost
immediately
ENVIRONMENTAL ANALYSIS Chromatography Volume 1
18
The analysis of organo-phosphorus pesticides inenvironmental- and food
samples is one of the most chal-lenging tasks in analytical chem-istry. The numerous food scan-dals in recent years demonstratethe immense importance of com-prehensive quality control.
Therefore it is necessary to detectthe contaminants of interest atthe lowest possible concentrationlevels in the sample. Analyticalinstrumental procedures, espe-cially the chromatographic meth-
ods offer very reliable tools forthe qualitative and quantitativedetermination of pesticides infood- and environmental sam-ples.
Excellent detection sensitivity and unequivocal identification of hazardous compounds can be obtained using Shimadzu’sGCMS-QP2010 instrument. ThisGCMS system offers a maximumin sensitivity. In the EI modecompounds can be unequivocally
identified via their classical EIspectra, acquired in the scanmode. This is performed viacomparison with a comprehen-sive library of mass spectra (forexample NIST, Wiley). Negativechemical ionisation (NCI) isespecially suitable for highly sen-sitive detection of organophos-phorus pesticides. Using this ion-isation method, it is possible toachieve quantitative and accuratedeterminations down to the fg-range. NCI is a selective analyti-
Organophosphorus pesticide determination using
the GCMS-QP2010
0.0
1.0
2.0
3.0
4.0
50.0
(x 100.000) BasePeak: 97/350.750
0 Rel.Inten 0.00m/z 407.00 Abs.Inten
75.0 100.0 125.0 150.0 175.0 200.0 225.0 250.0 275.0 300.0 325.0 350.0 375.0 400.0
NCI
1.0
2.0
3.0
4.0
50.0
(x 100.000) BasePeak: 272/429.113
0 Rel.Inten 0.00m/z 359.00 Abs.Inten
75.0 100.0 125.0 150.0 175.0 200.0 225.0 250.0 275.0 300.0 325.0 350.0 375.0 400.0
SEI
Super fast and sensitive
Figure 1: Fast-SEI and NCI-Scan of an organophosphorus pesticide standard
4.0 5.0 6.0 7.0
0.1
0.2
0.3
0.4
0.5
0.6
0.7
0.8
0.9
1.0
1.1
1.2
1.3
Dia
zino
n
Chlo
rpyr
ifos
Pot
asan
Pip
eron
ly B
utox
ide
Capt
an
Endo
sulfa
n S
ulfa
te
NCI 50 pg Splitless
SEI 5 ng Split 20:1
min.

Finally proposed structure
DiethylamineCH2 = CHSiBuDiethyl formamideEt2NCH2CH2SHN-Methylpyrrolidone**Et2NCH2CH2SMeMePO[OSi(Me)3]2CH2 = CH-S-CH2CH2NEt2
CH3PO(OiBu)OSi(Me)3Caprolactam**Et2NCH2CH2-S-iBuMePO(OiBu)2MePS(OiBu)2Et2NCH2CH2-S-BuMePO(OMe)SCH2CH2NEt2
Et2NCH2CH2-S2-iBuCH2 = CH-S3-CH2CH2NEt2
(Et2NCH2CH2)2SMePO(OiBu)-S-CH2CH2NEt2
Et2NCH2CH2-S3-iBuMePO(SiBu)SCH2CH2NEt2
(Et2NCH2CH2)2S2
(Et2NCH2CH2)2S3
Et2N(CH2CH2S)2CH2CH2NEt2
MePO(OiBu)(SCH2CH2)2NEt2
MePO(OiBu)(SCH2CH2)3NEt2
ENVIRONMENTAL ANALYSIS
21
Chromatography Volume 1
No.
12345
M1S16S27891011M21213141516171819202122
50
58
72114 132
149
165
170192
86 4.427.074
100 1500
25
Figure 2: Mass spectrum of the principal component of RVX-BSM extract (# 18) as an example of its low information
content for evaluating structure.
Table 1: A Final identification of RVX decomposition products in RVX-BSM extracts *“ref.” – The identification is based on
the reference RI data; all other RI values are precalculated; ** Components of reaction mixture used for RVX destruction.
repeatability of flow and temper-ature control the GC-17Aensures stable retention times forthe components day after day,even after column reinstallation.So daily RT control was not nec-essary although RT values for thecomponents were taken from dif-ferent runs. Signals in mass spec-tra were also highly repeatable.The content of the “most suit-able” sample and RIs of the com-ponents identified in the samplesare listed in the table. Seven non-volatile compounds havebeen found as TMS (S1-S3) andmethyl (M1-M4) derivatives. Thetotal list of sample preparationprocedures is presented in [2].
Resultant data from identifica-tion of RVX decomposition pro-
ducts in RVX-BSM extracts issummarised in the table.
Conclusion
Detailed interpretation of GCretention indices as GCMS ana-lytical parameters with the sameimportance as MS data, enablesdetermination of reliable struc-tures for 26 major products ofRussian VX decomposition from44 components found in RVX-BSM extracts, without the needfor complex analytical methods.It is interesting to note that theratio of identified/unidentifiedcompounds is quite close to thatof other contemporary works inthis area. In spite of the applica-tion of chemical ionization massspectra, the structures of 11 from
Content %
11.50.20.92.9
28.80.53.90.2
39.25.9
45.85.90.10.13.20.90.50.50.10.12.0
20.80.30.40.65.8
m/z base peak
5860
101869986
22586
153558697
11386868686868686868686868686
RI
< 700847 ± 1930 ± 1976 ± 2
1034 ± 11076 ± 11142 ± 11144 ± 21214 ± 11266 ± 11292 ± 21298 ± 11331 ± 11337 ± 11424 ± 11510 ± 11576 ± 11584 ± 11689 ± 11740 ± 11782 ± 11818 ± 12010 ± 12021 ± 12128 ± 12648
1 2 3 4 5 6RI-data for identification*
548 ± 8 (vgl.)Approximate RI evaluation895 ± 2 (vgl.)979 ± 2 (vgl.)1002 ± 22 (vgl.)Formed after methylationFormed after silylationReduction to simpler structureFormed after silylation1255 ± 17 (ref.)1297 ± 181283 ± 101336 ± 101335 ± 41446 ± 61518 ± 815701579 ± 281675 ± 81736 ± 81768 ± 81823 ± 262030 ± 282018 ± 32140 ± 82636 ± 8
� Identification of Russion VX decomposition
products by GCMS
� Test methods can be restricted to
GCMS only due to extra processing of
GC retention indices
� 26 components have been identified
23 impurities in VX have beententatively proposed [1], whilstapplication of modern LCMStechnique identifies two thirds of 38 VX decomposition prod-ucts [3].
References
[1] D’Agostino P.A., Provost L.R.,
Visentini J., J. Chromatogr. 402
(1987) 221
[2] Savel’eva E.I, Kusnetsova T.A.,
Radilov A.S and Volynets N.F. Rus.
J. Appl. Chem.74 (2001) 1671.
[3] D’Agostino P. A., Hancock J.R.,
Provost L.R., J. Chromatogr.
A. 837 (1999) 93
ENVIRONMENTAL ANALYSIS Chromatography Volume 1
20
The goal of this work is GCMSidentification of RVX decompo-sition products in RVX-BSM-mixtures. Up to now, only limit-ed information on the possibleformation products has beenavailable. Accessible literaturerelates to VX but not RVX des-truction products.
Several dozens RVX-relatedcompounds were detected inRVX-BSM mixtures (Figure 1).The most significant feature ofRVX decomposition products islow information content of theirEI mass spectra (Figure 2). Thetypical approach in these com-plex cases is not to use singleanalytical methods, but combi-nations including HPLC,LCMS, GC-FTIR, GC-AED,etc. However, there is an alterna-tive way to restrict the test meth-ods only to GCMS, while signif-icantly improving interpretationof GCMS data by extra process-ing of GC retention indices (RI).
Determina-tion and cal-culation ofGC retentionindices
For determinationof GC retention indices(RI) the retention times of n-alkanes C6-C20 and C21-C26 havebeen determined in an artificialmixture and diesel fuel of com-mon grade, respectively. The lin-log RIs have been calculatedusing simplest QBasic program.To predict the structures ofunknown components the RIvalues published in [1] for anoth-
er set of compounds relevant toRVX were recalculated. Refer-ence RI values on standard non-polar polydimethyl siloxane sta-tionary phases for evaluation of∆RI increments have been takenfrom the private collection of one of the authors (I. Zenke-vich).
Instrumentation
Mass Spectrometer: QP-5000Gas Chromatograph: GC-17A
Results
26 components were identified inRVX-BSM by means of concur-rent interpretation of MS andGC data. GCMS allows bothcharacteristics to be obtained inthe same run. Thanks to high
GCMS helps tochemical
disarmament
The V-type chemical war-fare agent VX [O-ethyl S-diisopropylaminoethyl
methylphosphonothioate] and itsisomer, Russian VX [O-isobutylS-(2-diethylamino) methylphos-phonothioate] are highly toxic,persistent and included amongthe stockpiles of the UnitedStates and the former SovietUnion. The complete formula forV-type nerve agents is:
25 500
50
Figure 1: Typical chromatogram (total ion current) of the RVX-BSM
extract by CH2Cl2
Dr. E. Savel’eva, Institute of Hygiene, Occupational Pathology and Human Ecology, St.Petersburg, Russia
Professor Dr. I. Zenkevich, Chemical Research Institute of St. Petersburg State University, St.Petersburg, Russia
For the most “traditional” com-pounds of this series knownsince 1950, i.e. (VX) R = Et, R’ =iso-Pr and for Russian VX(RVX) R = iso-Bu, R’ = Et.
The process proposed and usedin Russia for destruction ofphosphorus-containing warfareagents includes chemical process-ing by mixtures of reagents con-taining potassium isobutylatefollowed by treatment of theformed reaction mixture withbitumen. As a result, so-calledbitumen-salt mixtures (BSM) areprepared. Figure 3: Modern capillary gas
chromatography for routine applica-
tions with GC-17A
ENVIRONMENTAL ANALYSIS
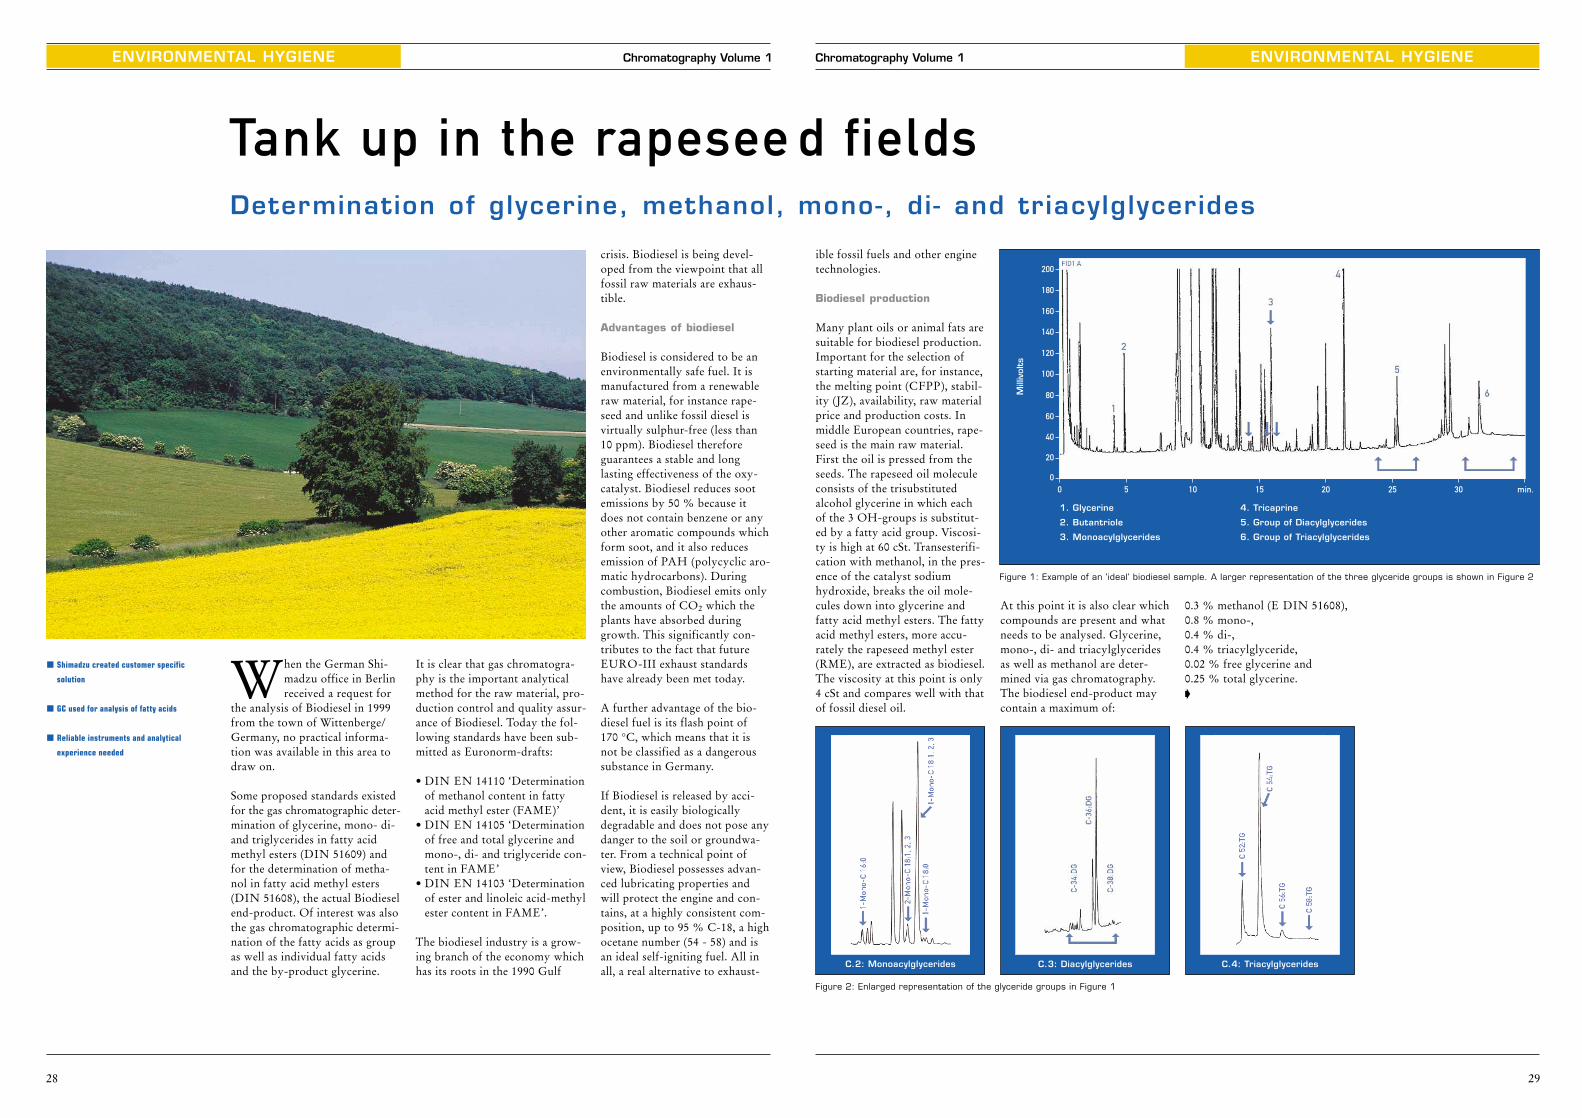
be optimized very carefully.When the vent time is too long,losses of volatiles will be obser-ved. Too short vent times willlead to distortion of the peakshapes, due to an excess of sol-vent left in the packed liner.
Figure 2 shows as an example the injection of 100 µL of thepesticide Oxadiazon in n-hexane. A detection limit down to 0.02µg/L can be achieved with goodlinearity of the calibration curve(Figure 3).
23
Chromatography Volume 1
ing material can adsorb somecomponents more effective andhence obtain a better enrichmentand recovery.
Volume and time are important parameters
Special attention is needed forthe optimization of two steps inthis technique. Firstly, one has todetermine the maximum solventvolume which the packed bed inthe liner can accomodate. Andsecondly the solvent eliminationtime or solvent vent time, should
Figure 3: Calibration curve of OxadiazonFigure 2: 100 µL injection of the
pesticide Oxadiazon
6.0
6.5
7.0
7.5
8.0
8.5
9.0
9.5
10.0
0.0
1.0
2.0
3.0
4.0
5.0
8.25 8.50 8.75 9.00 9.25 0.00 0.05 0.10 0.15 0.20
Concentration µg/L� Large volume sampling becomes a standard
technique
� The principle of large volume injection in
GC is that the evaporation step occurs inside
the liner of a PTV
� Volume and time are important parameters
Area (x 10,000)
Area (x 1.000)
175.00
splitless solute-transfer on to theanalytical column occurs. Afterthe solutes are transfered, thesplit valve opens again and theanalytical separation starts. Allthe different steps are visible infigure 1. Some parameters re-quire extra consideration: thechoice of packing material andthe inertness of the packingmaterial.
By selecting a proper packingmaterial for the components ofinterest, you can gain in selec-tivity in your method. The pack-
R = 0.99928
SIM Mass Trace 175Micro Scan 0.1 amuLarge Volume Injection: 160 µL
Sample Concentration: 0.02 µg/L
ENVIRONMENTAL ANALYSIS
In recent years, large volumesampling is becoming moreand more a standard tech-
nique in every laboratory. Espe-cially in environmental laborato-ries where trace analysis of allkind of contaminations is a dailyroutine. Since the injected samplevolumes are about 100 times thenormal injection volumes (100 µLcompared to 1 µL), the minimaldetectable concentration is 100times lower.
The advantages of large volume sampling
The conventional approach ofenvironmental trace analysisoften consists of a extraction-step of the sample with a suitablesolvent, e.g the extraction ofPAH’s in soil or water with hex-ane as the extraction solvent.This can be carried out e.g. byshaking, sonication or in a Soxh-let extractor and this alwaysresults in a relatively dilutedextract that has to be preconcen-trated prior to injection of 1 µLinto a GC instrument.
The most widely employed pre-concentration procedure is sol-vent-evaporation. This evapora-tion-method is always time-con-suming and moreover, irrespec-tive of which method of evapora-tion is used, there is a seriouspossibility that volatile compo-nents will be lost during evapo-ration. Besides this, when theevaporation is carried out at ele-vated temperatures, unstablesolutes can decompose.
It will be evident from what isstated above, that important
Chromatography Volume 1
22
attersIt’s quantity that msystems in capillary gas chromatographyLarge volume sampling using PTV injection
Figure 1: Worksheet for large volume injection
application areas of large volumeinjection are the improvement ofdetection limits in trace analysisand the reduction in the overallanalysis time that can be obtaineddue to the elimination of the timeconsuming and laborious solventevaporation step.
Large volume injection
The principle of large volumeinjection in GC is that the evapo-ration step occurs inside a linerof a PTV (Programmable Tem-perature Vaporizer). Temperaturecontrol and flow stability is farmore better than using the pre-concentration methods men-tioned above. To retain the largeamount of solvent in the liner, apacking material inside the lineris required, e.g. a glasswool plug.If no packing material is used thesolvent drops down to the bot-tom section of the liner and will,due to cold spots, evaporate veryslowly. This also will lead tomolecular weight-discrimination.
Temperature, flow rate and inlet pressure
Conditions during solvent vent-ing are carefully chosen: The temperature of the liner isjust below the solvent boilingpoint, flow is between 200 to 250 mL/min. The inlet pressurecould be decreased to obtain amore effective and faster solventevaporation. While venting thesolvent, the injector is in splitmode and the solvent is eliminat-ed via the split outlet. After thesolvent is gone, the split exit isclosed and the PTV temperatureis increased rapidly. A standard


ENVIRONMENTAL HYGIENE
27
Chromatography Volume 1
and DBT: 0.25 mg/kg textile.The analytical methods describedbelow are based on the QUL val-ues.
Analysis of organotin compounds in textiles
Extraction: 2 g of the materialto be investigated are boiled inacidified methanol (0.1 %) underreflux conditions for 30 minutes.During sampling, close attentionshould be paid to the homogene-ity of the sample. If the textileconsists of several different fabrics or different colours, analiquot from each fabric or co-loured part should be prepared.
Derivatization: Ethylation ofthe organotin compounds is per-formed using sodium tetraethyl-borate at pH 4.5 in n-hexane andtakes approx. 3 - 4 hours.
Purification: After derivatiza-tion, the sample is purified oversilicagel (EN DIN 38407-13D)using hexane as solvent. The finalvolume of the purified sample is200 µL in n-decane.
GCMS method: The analysis is carried out using a ShimadzuGCMS-QP2010 quadrupole massspectrometer. Separation is car-ried out on a capillary columnDB-5, 30 m, 0.25 mm ID, 0.25 µm. Injector temperature:260 °C, splitless injection, high-pressure injection 100 kPa, 2 min.temperature programme 60 °Cfor 2 min, at 8 °C/min to 160 °C,at 20 °C/min to 300 °C, holdingfor 2 min. Parallel to the temper-ature programme, a pressure pro-gramme is performed (linearvelocity mode). Ion source tem-perature: 250 °C, interface tem-perature 320 °C, SIM mode.
For each degree of alkylation,organotin chlorides (for example,monoheptotin trichloride) areused as internal standards.
Summary
Tin has many naturally occurringisotopes and TBT exhibits strongfragmentation. TBT was there-fore considered not to be suitablefor mass spectrometric detection.TBT can, however, be determi-
0.0 1.5 2.00.5 1.0
0.0
1.0
2.0
1.5
0.5
Are
a R
ati
o
Conc. Ratio
50000
100000
75000
25000
0 50 75 100 125 150 175 200 225 250 275 300
0
4157 82
121
135
151
155
177
183211
207
239
263
267 295
291
235
Inte
nsity
m/z
Figure 2: Calibration of TBT using the internal standard method (concentration
TBT: 0.1; 1.0; 10 ng/µL)
Figure 1: Mass spectrum of TBT after ethylation
ned on a QP2010 at high sensi-tivity in textiles using the above-described analytical method. Thedetection limit for the routineanalysis of TBT is 0.5 ng/µLabsolute – if the instrument is ingood operating condition, adetection limit of 0.1 ng/µL canbe obtained. In textiles, this cor-responds to a concentration of0.05 mg/kg.
This value exactly coincides withthe recommended value of theQUL for TBT. The orientationvalues of the Öko-Tex Standard100 are also within the range ofthe detection limit of this analy-tical method.
� TBT one of the most poisonous compounds
released into the environment
� No legally prescribed threshold values
� TBT can be determined by GCMS analysis
ENVIRONMENTAL HYGIENE Chromatography Volume 1
26
In January 2000, the Germanplusminus TV programmestarted a media frenzy with a
report called 'Poison in textiles'featuring the presence of organ-otin compounds in, among oth-ers, soccer shirts. Although theconcentration of organotin com-pounds found in textiles wasquite low, interest in this class ofcompounds was awakened, par-ticularly for the highly toxiccompound tributyltin (TBT).
The Öko-Test (“eco test”) maga-zine included the organotin com-pounds in its evaluations. A dis-cussion began which went fur-ther than the contamination oftextiles. Concerns regarding theintake through food consump-tion and the pollution of ecosys-tems by organtin compoundswere raised. The internationallyrecognized eco-Umweltinstitut(Eco Environmental Institute) inCologne, Germany, took up thechallenge to react rapidly tothese developments and includedthe determination of organotincompounds in the wide range ofanalyses carried out by the Insti-tute. The range of analytical serv-ices that the Institute providesincludes testing of consumergoods and furnishing materialswith respect to prohibited orhazardous substances.
Use and toxicity of organotin compounds
In general, all organotin com-pounds are considered to be toxic.The most notorious compound istributyltin (TBT), a very persist-ent and highly toxic cell poisonthat is difficult to degrade. TBTis one of the most poisonouscompounds released into theenvironment, and in humans it
causes damage to the hormonal,immune and central nervous sys-tems as well as to the liver andkidneys.
The greater part of the world-wide production of organotincompounds is used as heat andageing stabilizers in plastics, forexample, PVC. These compoundsare also employed as antifoulingpaints for ships, as pesticides, aspreservatives in water-miscibleand antifungal paints and asfungicides in textiles, leather,paper and wood. Synthetic fibresin particular were frequentlytreated with TBT, monobutyl-and dibutyltin. The organotincompounds prevent the develop-ment of an unpleasant smell intextiles during heavy sweating.
Recommended values fororganotin compounds
The investigation of textiles fororganotin compounds is, at pres-ent, an important part of thequality control of these products.Since there are no legally pre-scribed threshold values, recom-mended values are used for pri-vate labels and quality brands.
The Öko-Test magazine, forexample, recommends a TBTvalue of 0.025 mg/kg textile, andfor other organotin compounds avalue of 0.25 mg/kg. The Öko-Tex Standard 100 differentiatedbetween the categories Baby(TBT: 0.5 mg/kg; DBT: 1 mg/kg)and other categories (TBT: 1mg/kg; DBT: not specified). The ‘Association of Environ-ment-compatible Latex Mattress-es’ (QUL, QualitätsverbandUmweltverträgliche Latexma-tratzen) uses the following orien-tation values: TBT: 0.05 mg/kg
“Poison in textiles”compounds using the GCMS-QP2010 Quantitative determination of organotin
Analysis of organotin compounds in the eco-Umweltinstitut in Cologne, Germany
(Dr. Hans-Ulrich Krieg, Managing Director)
ENVIRONMENTAL HYGIENE
29
Chromatography Volume 1
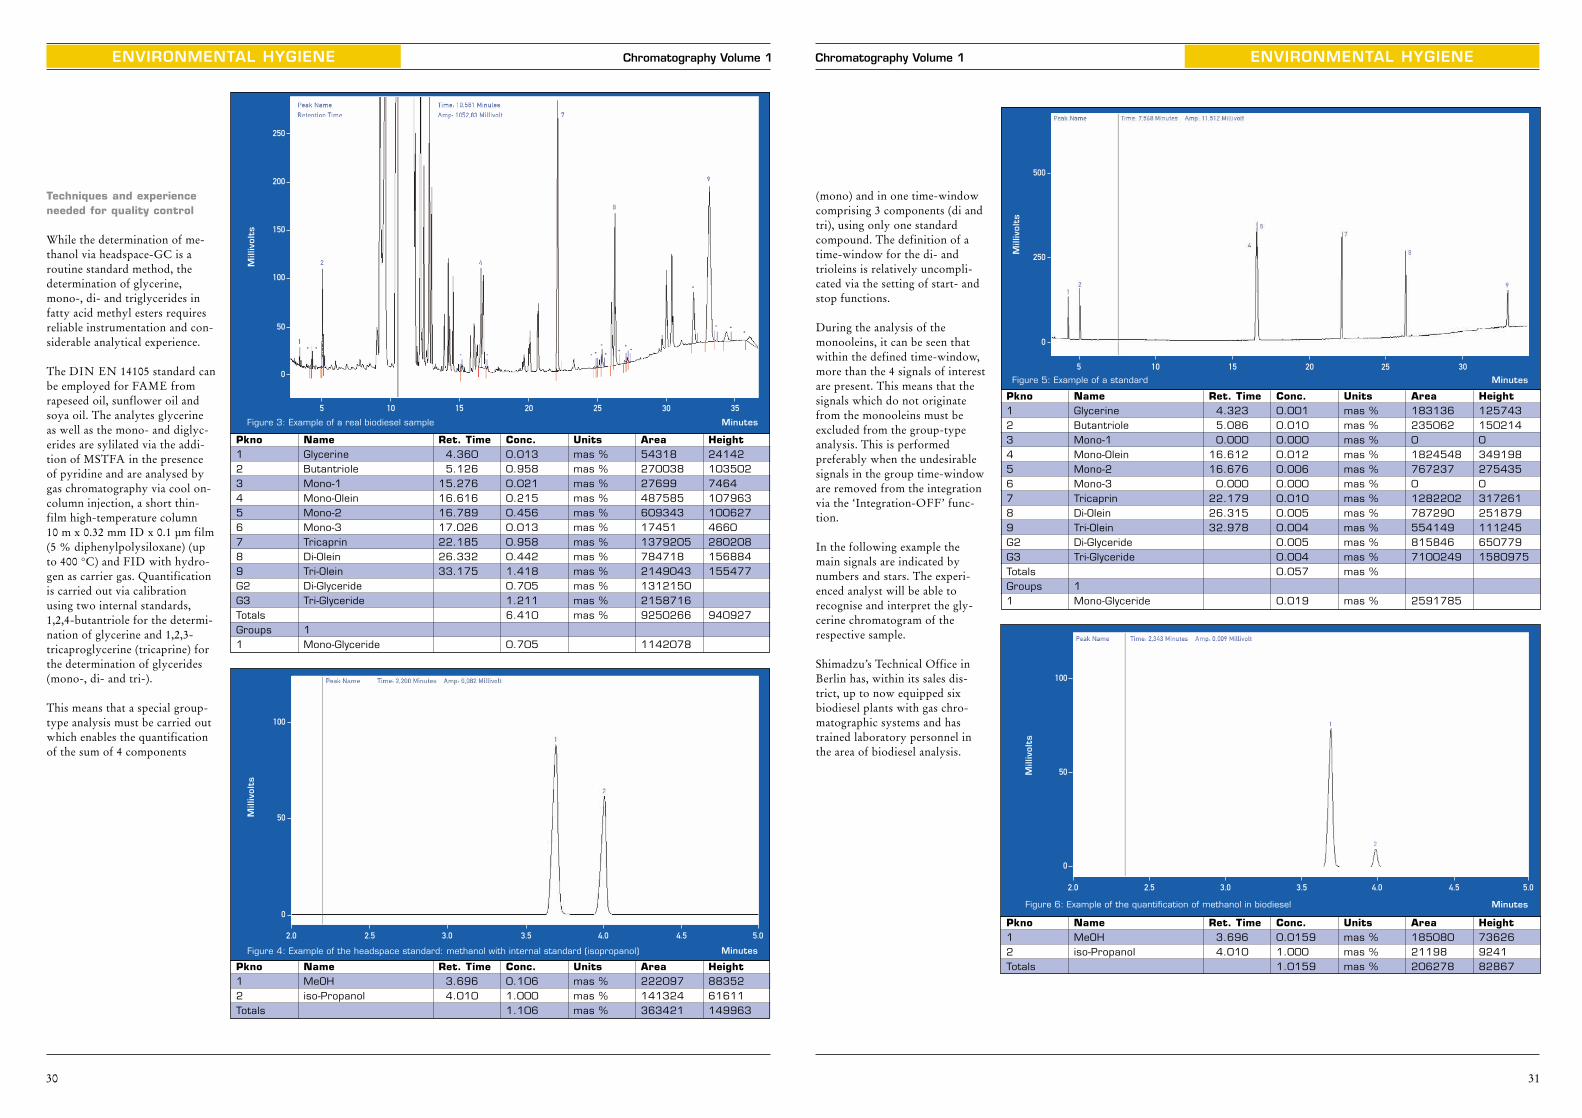
Figure 1: Example of an ‘ideal’ biodiesel sample. A larger representation of the three glyceride groups is shown in Figure 2
Figure 2: Enlarged representation of the glyceride groups in Figure 1
ible fossil fuels and other enginetechnologies.
Biodiesel production
Many plant oils or animal fats aresuitable for biodiesel production.Important for the selection ofstarting material are, for instance,the melting point (CFPP), stabil-ity (JZ), availability, raw materialprice and production costs. Inmiddle European countries, rape-seed is the main raw material.First the oil is pressed from theseeds. The rapeseed oil moleculeconsists of the trisubstitutedalcohol glycerine in which eachof the 3 OH-groups is substitut-ed by a fatty acid group. Viscosi-ty is high at 60 cSt. Transesterifi-cation with methanol, in the pres-ence of the catalyst sodiumhydroxide, breaks the oil mole-cules down into glycerine andfatty acid methyl esters. The fattyacid methyl esters, more accu-rately the rapeseed methyl ester(RME), are extracted as biodiesel.The viscosity at this point is only4 cSt and compares well with thatof fossil diesel oil.
At this point it is also clear whichcompounds are present and whatneeds to be analysed. Glycerine,mono-, di- and triacylglyceridesas well as methanol are deter-mined via gas chromatography.The biodiesel end-product maycontain a maximum of:
0.3 % methanol (E DIN 51608),0.8 % mono-, 0.4 % di-,0.4 % triacylglyceride, 0.02 % free glycerine and 0.25 % total glycerine. �
Mill
ivol
ts
0
20
40
60
80
100
120
140
160
180
200
0 5 10 15 20 25 30 min.
1. Glycerine
2. Butantriole
3. Monoacylglycerides
4. Tricaprine
5. Group of Diacylglycerides
6. Group of Triacylglycerides
C.2: Monoacylglycerides C.3: Diacylglycerides C.4: Triacylglycerides
� Shimadzu created customer specific
solution
� GC used for analysis of fatty acids
� Reliable instruments and analytical
experience needed
ENVIRONMENTAL HYGIENE Chromatography Volume 1
28
When the German Shi-madzu office in Berlinreceived a request for
the analysis of Biodiesel in 1999from the town of Wittenberge/Germany, no practical informa-tion was available in this area todraw on.
Some proposed standards existedfor the gas chromatographic deter-mination of glycerine, mono- di-and triglycerides in fatty acidmethyl esters (DIN 51609) andfor the determination of metha-nol in fatty acid methyl esters(DIN 51608), the actual Biodieselend-product. Of interest was alsothe gas chromatographic determi-nation of the fatty acids as groupas well as individual fatty acidsand the by-product glycerine.
It is clear that gas chromatogra-phy is the important analyticalmethod for the raw material, pro-duction control and quality assur-ance of Biodiesel. Today the fol-lowing standards have been sub-mitted as Euronorm-drafts:
• DIN EN 14110 ‘Determinationof methanol content in fattyacid methyl ester (FAME)’
• DIN EN 14105 ‘Determinationof free and total glycerine andmono-, di- and triglyceride con-tent in FAME’
• DIN EN 14103 ‘Determinationof ester and linoleic acid-methylester content in FAME’.
The biodiesel industry is a grow-ing branch of the economy whichhas its roots in the 1990 Gulf
crisis. Biodiesel is being devel-oped from the viewpoint that allfossil raw materials are exhaus-tible.
Advantages of biodiesel
Biodiesel is considered to be anenvironmentally safe fuel. It ismanufactured from a renewableraw material, for instance rape-seed and unlike fossil diesel isvirtually sulphur-free (less than10 ppm). Biodiesel thereforeguarantees a stable and long lasting effectiveness of the oxy-catalyst. Biodiesel reduces sootemissions by 50 % because itdoes not contain benzene or anyother aromatic compounds whichform soot, and it also reducesemission of PAH (polycyclic aro-matic hydrocarbons). Duringcombustion, Biodiesel emits onlythe amounts of CO2 which theplants have absorbed duringgrowth. This significantly con-tributes to the fact that futureEURO-III exhaust standardshave already been met today.
A further advantage of the bio-diesel fuel is its flash point of 170 °C, which means that it isnot be classified as a dangeroussubstance in Germany.
If Biodiesel is released by acci-dent, it is easily biologicallydegradable and does not pose anydanger to the soil or groundwa-ter. From a technical point ofview, Biodiesel possesses advan-ced lubricating properties andwill protect the engine and con-tains, at a highly consistent com-position, up to 95 % C-18, a highocetane number (54 - 58) and isan ideal self-igniting fuel. All inall, a real alternative to exhaust-
d fieldsTank up in the rapeseemono-, di- and triacylglyceridesDetermination of glycerine, methanol,
Height73626924182867
Height125743150214034919827543503172612518791112456507791580975
Height8835261611149963
Height2414210350274641079631006274660280208156884155477
940927
ENVIRONMENTAL HYGIENE
31
Chromatography Volume 1
Mill
ivol
ts
0
5 10 15 20 25 30
250
500
MinutesFigure 5: Example of a standard
Mill
ivol
ts
0
2.0 2.5 3.0 3.5 4.0 4.5 5.0
50
100
MinutesFigure 6: Example of the quantification of methanol in biodiesel
(mono) and in one time-windowcomprising 3 components (di andtri), using only one standardcompound. The definition of atime-window for the di- and trioleins is relatively uncompli-cated via the setting of start- andstop functions.
During the analysis of themonooleins, it can be seen thatwithin the defined time-window,more than the 4 signals of interestare present. This means that thesignals which do not originatefrom the monooleins must beexcluded from the group-typeanalysis. This is performedpreferably when the undesirablesignals in the group time-windoware removed from the integrationvia the ‘Integration-OFF’ func-tion.
In the following example themain signals are indicated bynumbers and stars. The experi-enced analyst will be able torecognise and interpret the gly-cerine chromatogram of therespective sample.
Shimadzu’s Technical Office inBerlin has, within its sales dis-trict, up to now equipped sixbiodiesel plants with gas chro-matographic systems and hastrained laboratory personnel inthe area of biodiesel analysis.
Pkno123456789G2G3TotalsGroups1
NameGlycerineButantrioleMono-1Mono-OleinMono-2Mono-3TricaprinDi-OleinTri-OleinDi-GlycerideTri-Glyceride
1Mono-Glyceride
Ret. Time4.3235.0860.000
16.61216.676
0.00022.17926.31532.978
Conc.0.0010.0100.0000.0120.0060.0000.0100.0050.0040.0050.0040.057
0.019
Unitsmas %mas %mas %mas %mas %mas %mas %mas %mas %mas %mas %mas %
mas %
Area18313623506201824548767237012822027872905541498158467100249
2591785
Pkno12Totals
NameMeOHiso-Propanol
Ret. Time3.6964.010
Conc.0.01591.0001.0159
Unitsmas %mas %mas %
Area18508021198206278
ENVIRONMENTAL HYGIENE Chromatography Volume 1
30
Mill
ivol
ts
0
2.0 2.5 3.0 3.5 4.0 4.5 5.0
50
100
MinutesFigure 4: Example of the headspace standard: methanol with internal standard (isopropanol)
Techniques and experienceneeded for quality control
While the determination of me-thanol via headspace-GC is aroutine standard method, thedetermination of glycerine,mono-, di- and triglycerides infatty acid methyl esters requiresreliable instrumentation and con-siderable analytical experience.
The DIN EN 14105 standard canbe employed for FAME fromrapeseed oil, sunflower oil andsoya oil. The analytes glycerineas well as the mono- and diglyc-erides are sylilated via the addi-tion of MSTFA in the presenceof pyridine and are analysed bygas chromatography via cool on-column injection, a short thin-film high-temperature column 10 m x 0.32 mm ID x 0.1 µm film(5 % diphenylpolysiloxane) (upto 400 °C) and FID with hydro-gen as carrier gas. Quantificationis carried out via calibrationusing two internal standards,1,2,4-butantriole for the determi-nation of glycerine and 1,2,3-tricaproglycerine (tricaprine) forthe determination of glycerides(mono-, di- and tri-).
This means that a special group-type analysis must be carried outwhich enables the quantificationof the sum of 4 components
Pkno123456789G2G3TotalsGroups1
NameGlycerineButantrioleMono-1Mono-OleinMono-2Mono-3TricaprinDi-OleinTri-OleinDi-GlycerideTri-Glyceride
1Mono-Glyceride
Ret. Time4.3605.126
15.27616.61616.78917.02622.18526.33233.175
Conc.0.0130.9580.0210.2150.4560.0130.9580.4421.4180.7051.2116.410
0.705
Unitsmas %mas %mas %mas %mas %mas %mas %mas %mas %mas %mas %mas %
Area54318270038276994875856093431745113792057847182149043131215021587169250266
1142078
Pkno12Totals
NameMeOHiso-Propanol
Ret. Time3.6964.010
Conc.0.1061.0001.106
Unitsmas %mas %mas %
Area222097141324363421
Mill
ivol
ts
0
5 10 15 20 25 30 35
50
100
150
200
250
MinutesFigure 3: Example of a real biodiesel sample
ENVIRONMENTAL HYGIENE
Figure 3: TICs of a perfume diluted 1000 :1 in acetone and injected with the same
method as figure 2. For reference, the standard is plotted above
(x 100.000.000)
0.25
0.50
0.75
1.00
1.25
1.50
1.75
2.0 3.0 4.0 5.0 6.0 7.0
33
Chromatography Volume 1
Figure 4: Peaks in the retention time segment 1 for comparison of resolution.
Peak numbers are given in elutition sequence
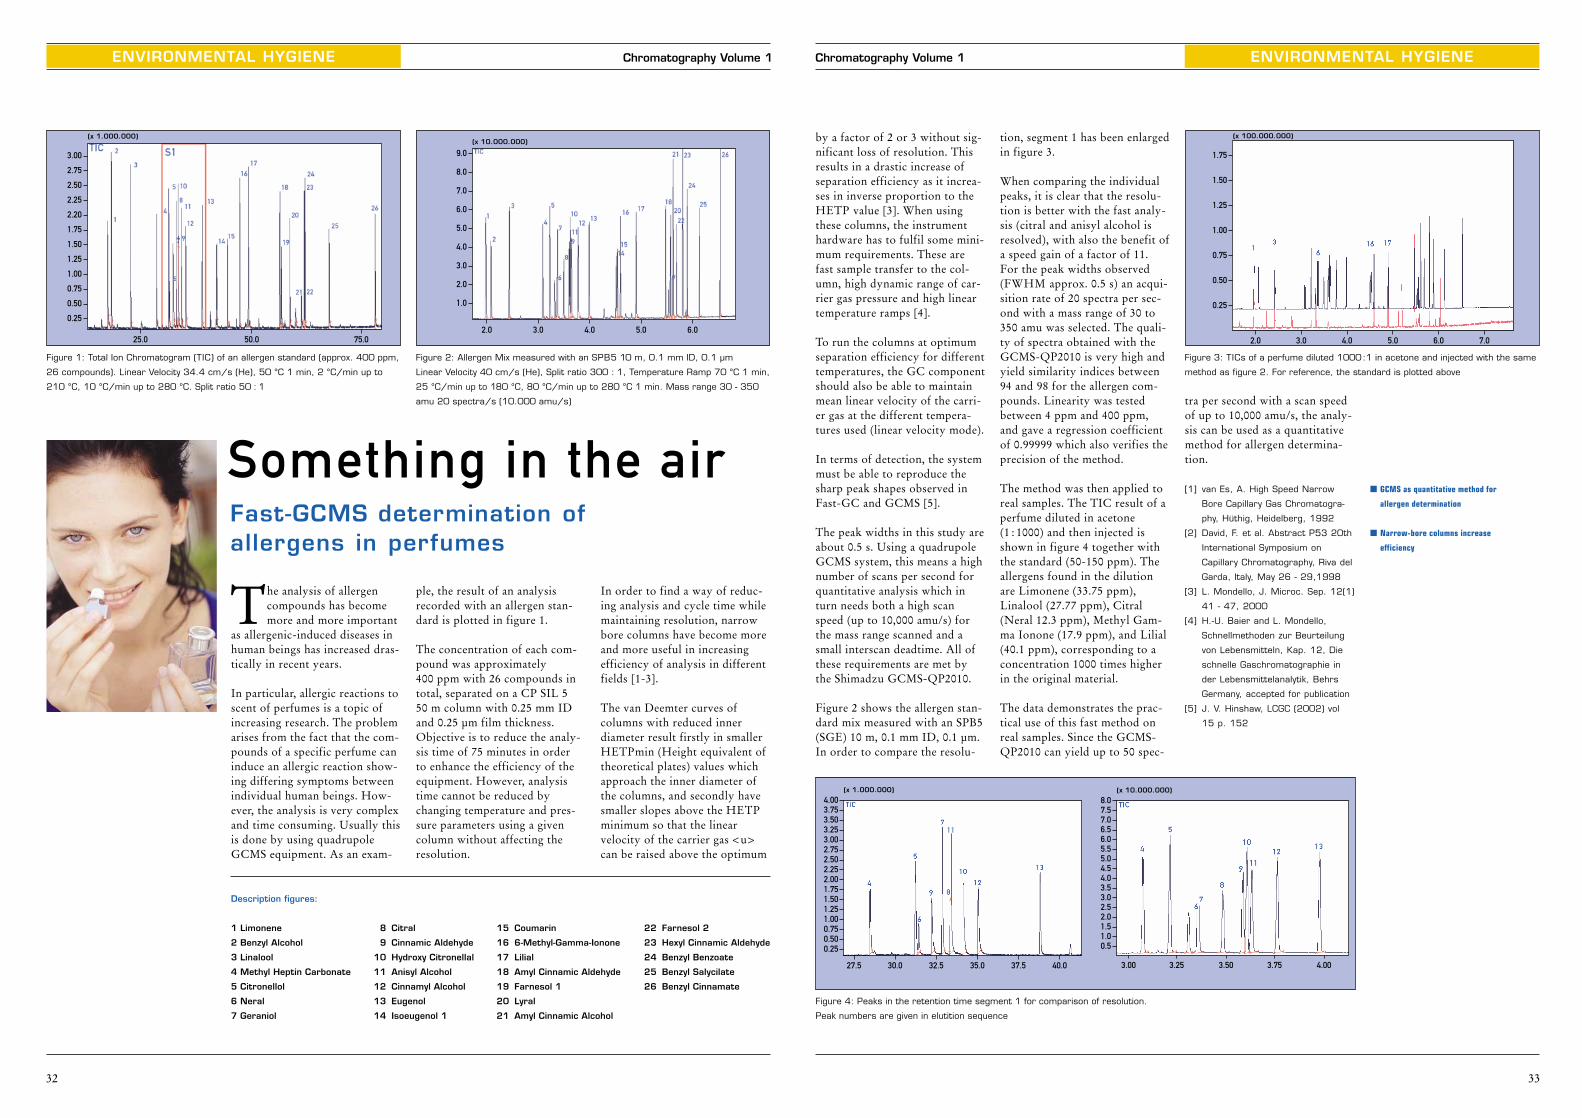
tion, segment 1 has been enlargedin figure 3.
When comparing the individualpeaks, it is clear that the resolu-tion is better with the fast analy-sis (citral and anisyl alcohol isresolved), with also the benefit ofa speed gain of a factor of 11.For the peak widths observed(FWHM approx. 0.5 s) an acqui-sition rate of 20 spectra per sec-ond with a mass range of 30 to350 amu was selected. The quali-ty of spectra obtained with theGCMS-QP2010 is very high andyield similarity indices between94 and 98 for the allergen com-pounds. Linearity was testedbetween 4 ppm and 400 ppm,and gave a regression coefficientof 0.99999 which also verifies theprecision of the method.
The method was then applied toreal samples. The TIC result of aperfume diluted in acetone (1 : 1000) and then injected isshown in figure 4 together withthe standard (50-150 ppm). Theallergens found in the dilutionare Limonene (33.75 ppm),Linalool (27.77 ppm), Citral(Neral 12.3 ppm), Methyl Gam-ma Ionone (17.9 ppm), and Lilial(40.1 ppm), corresponding to aconcentration 1000 times higherin the original material.
The data demonstrates the prac-tical use of this fast method onreal samples. Since the GCMS-QP2010 can yield up to 50 spec-
tra per second with a scan speedof up to 10,000 amu/s, the analy-sis can be used as a quantitativemethod for allergen determina-tion.
[1] van Es, A. High Speed Narrow
Bore Capillary Gas Chromatogra-
phy, Hüthig, Heidelberg, 1992
[2] David, F. et al. Abstract P53 20th
International Symposium on
Capillary Chromatography, Riva del
Garda, Italy, May 26 - 29,1998
[3] L. Mondello, J. Microc. Sep. 12(1)
41 - 47, 2000
[4] H.-U. Baier and L. Mondello,
Schnellmethoden zur Beurteilung
von Lebensmitteln, Kap. 12, Die
schnelle Gaschromatographie in
der Lebensmittelanalytik, Behrs
Germany, accepted for publication
[5] J. V. Hinshaw, LCGC (2002) vol
15 p. 152
(x 1.000.000)
0.250.500.751.001.251.501.752.002.252.502.753.003.253.503.754.00
27.5 30.0 32.5 35.0 37.5 40.0
(x 10.000.000)
0.51.01.52.02.53.03.54.04.55.05.56.06.57.07.58.0
3.00 3.25 3.50 3.75 4.00
by a factor of 2 or 3 without sig-nificant loss of resolution. Thisresults in a drastic increase ofseparation efficiency as it increa-ses in inverse proportion to theHETP value [3]. When usingthese columns, the instrumenthardware has to fulfil some mini-mum requirements. These arefast sample transfer to the col-umn, high dynamic range of car-rier gas pressure and high lineartemperature ramps [4].
To run the columns at optimumseparation efficiency for differenttemperatures, the GC componentshould also be able to maintainmean linear velocity of the carri-er gas at the different tempera-tures used (linear velocity mode).
In terms of detection, the systemmust be able to reproduce thesharp peak shapes observed inFast-GC and GCMS [5].
The peak widths in this study areabout 0.5 s. Using a quadrupoleGCMS system, this means a highnumber of scans per second forquantitative analysis which inturn needs both a high scanspeed (up to 10,000 amu/s) forthe mass range scanned and asmall interscan deadtime. All ofthese requirements are met bythe Shimadzu GCMS-QP2010.
Figure 2 shows the allergen stan-dard mix measured with an SPB5(SGE) 10 m, 0.1 mm ID, 0.1 µm.In order to compare the resolu-
� GCMS as quantitative method for
allergen determination
� Narrow-bore columns increase
efficiency
ENVIRONMENTAL HYGIENE Chromatography Volume 1
32
Fast-GCMS determination of allergens in perfumes
Something in the air
In order to find a way of reduc-ing analysis and cycle time whilemaintaining resolution, narrowbore columns have become moreand more useful in increasingefficiency of analysis in differentfields [1-3].
The van Deemter curves ofcolumns with reduced innerdiameter result firstly in smallerHETPmin (Height equivalent oftheoretical plates) values whichapproach the inner diameter ofthe columns, and secondly havesmaller slopes above the HETPminimum so that the linearvelocity of the carrier gas <u>can be raised above the optimum
The analysis of allergencompounds has becomemore and more important
as allergenic-induced diseases inhuman beings has increased dras-tically in recent years.
In particular, allergic reactions toscent of perfumes is a topic ofincreasing research. The problemarises from the fact that the com-pounds of a specific perfume caninduce an allergic reaction show-ing differing symptoms betweenindividual human beings. How-ever, the analysis is very complexand time consuming. Usually thisis done by using quadrupoleGCMS equipment. As an exam-
ple, the result of an analysisrecorded with an allergen stan-dard is plotted in figure 1.
The concentration of each com-pound was approximately 400 ppm with 26 compounds intotal, separated on a CP SIL 5 50 m column with 0.25 mm IDand 0.25 µm film thickness.Objective is to reduce the analy-sis time of 75 minutes in order to enhance the efficiency of theequipment. However, analysistime cannot be reduced by changing temperature and pres-sure parameters using a givencolumn without affecting the resolution.
Figure 1: Total Ion Chromatogram (TIC) of an allergen standard (approx. 400 ppm,
26 compounds). Linear Velocity 34.4 cm/s (He), 50 °C 1 min, 2 °C/min up to
210 °C, 10 °C/min up to 280 °C. Split ratio 50 : 1
Figure 2: Allergen Mix measured with an SPB5 10 m, 0.1 mm ID, 0.1 µm
Linear Velocity 40 cm/s (He), Split ratio 300 : 1, Temperature Ramp 70 °C 1 min,
25 °C/min up to 180 °C, 80 °C/min up to 280 °C 1 min. Mass range 30 - 350
amu 20 spectra/s (10.000 amu/s)
(x 1.000.000)
0.25
0.50
0.75
1.00
1.25
1.50
1.75
2.20
2.25
2.50
2.75
3.00
25.0 50.0 75.0
(x 10.000.000)
1.0
2.0
3.0
4.0
5.0
6.0
7.0
8.0
9.0
2.0 3.0 4.0 5.0 6.0
Description figures:
1 Limonene
2 Benzyl Alcohol
3 Linalool
4 Methyl Heptin Carbonate
5 Citronellol
6 Neral
7 Geraniol
8 Citral
9 Cinnamic Aldehyde
10 Hydroxy Citronellal
11 Anisyl Alcohol
12 Cinnamyl Alcohol
13 Eugenol
14 Isoeugenol 1
15 Coumarin
16 6-Methyl-Gamma-Ionone
17 Lilial
18 Amyl Cinnamic Aldehyde
19 Farnesol 1
20 Lyral
21 Amyl Cinnamic Alcohol
22 Farnesol 2
23 Hexyl Cinnamic Aldehyde
24 Benzyl Benzoate
25 Benzyl Salycilate
26 Benzyl Cinnamate

FOOD ANALYSIS
37
Chromatography Volume 1
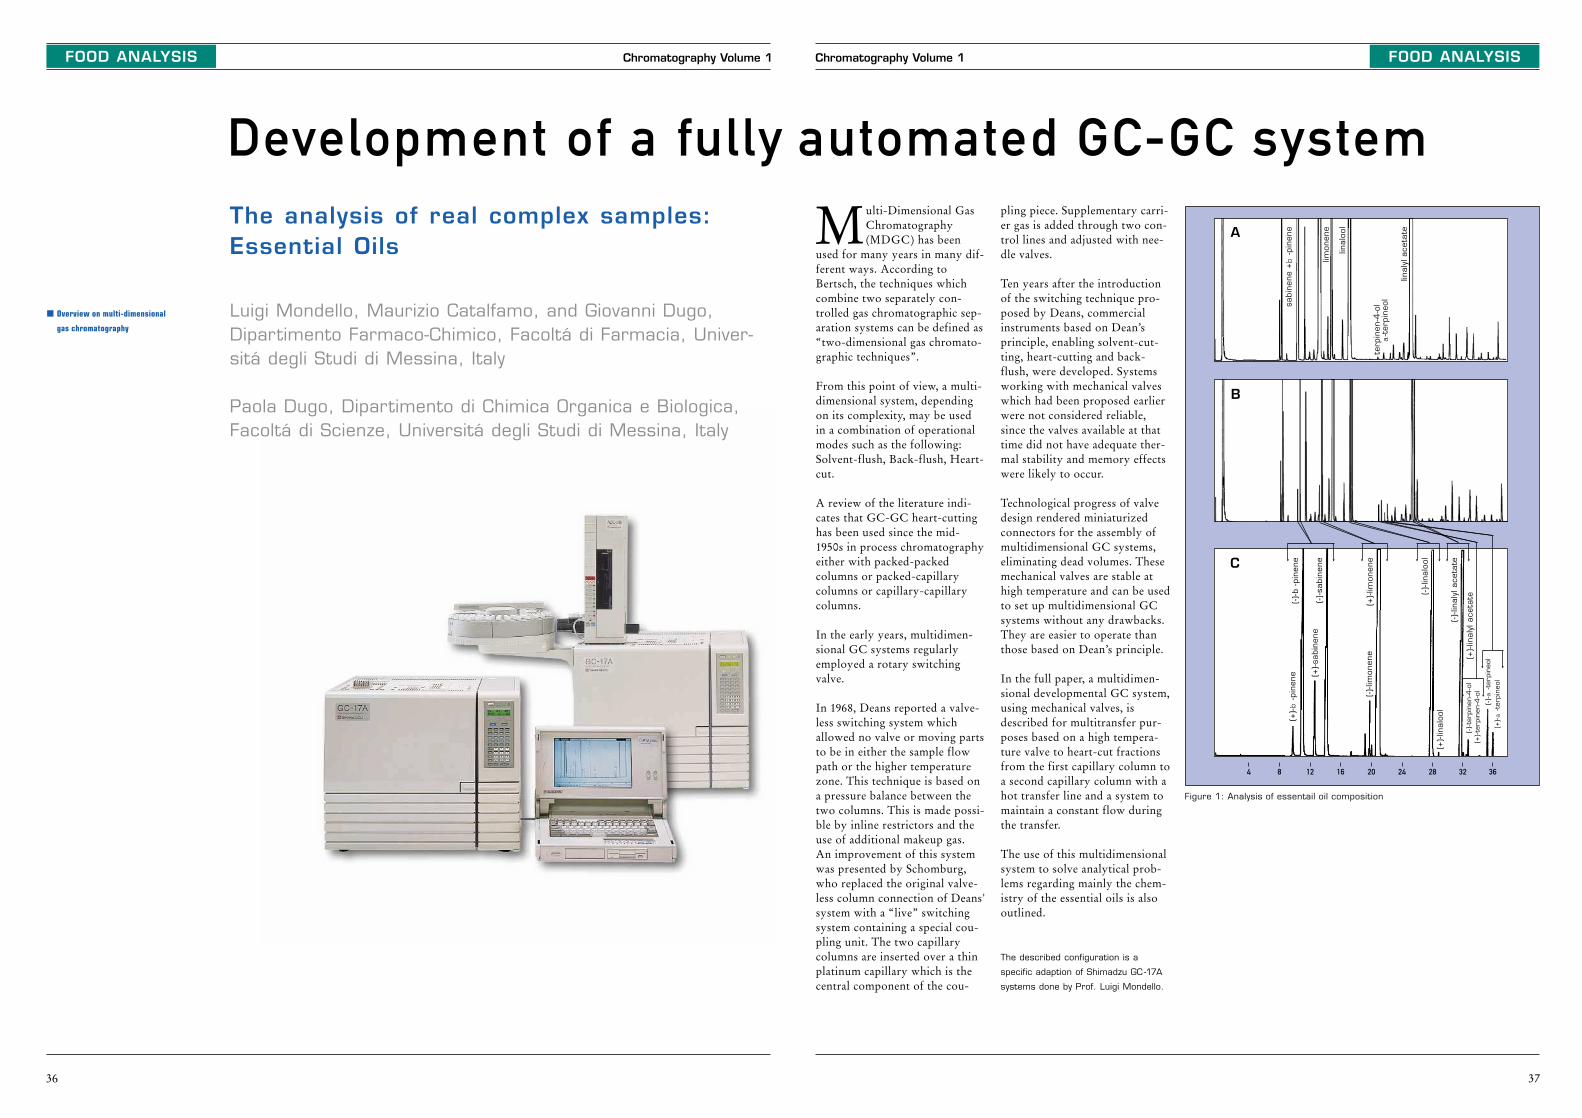
Multi-Dimensional GasChromatography(MDGC) has been
used for many years in many dif-ferent ways. According toBertsch, the techniques whichcombine two separately con-trolled gas chromatographic sep-aration systems can be defined as“two-dimensional gas chromato-graphic techniques”.
From this point of view, a multi-dimensional system, dependingon its complexity, may be used in a combination of operationalmodes such as the following: Solvent-flush, Back-flush, Heart-cut.
A review of the literature indi-cates that GC-GC heart-cuttinghas been used since the mid-1950s in process chromatographyeither with packed-packed columns or packed-capillarycolumns or capillary-capillarycolumns.
In the early years, multidimen-sional GC systems regularlyemployed a rotary switchingvalve.
In 1968, Deans reported a valve-less switching system whichallowed no valve or moving partsto be in either the sample flowpath or the higher temperaturezone. This technique is based ona pressure balance between thetwo columns. This is made possi-ble by inline restrictors and theuse of additional makeup gas. An improvement of this systemwas presented by Schomburg,who replaced the original valve-less column connection of Deans'system with a “live” switchingsystem containing a special cou-pling unit. The two capillarycolumns are inserted over a thinplatinum capillary which is thecentral component of the cou-
pling piece. Supplementary carri-er gas is added through two con-trol lines and adjusted with nee-dle valves.
Ten years after the introductionof the switching technique pro-posed by Deans, commercialinstruments based on Dean’sprinciple, enabling solvent-cut-ting, heart-cutting and back-flush, were developed. Systemsworking with mechanical valveswhich had been proposed earlierwere not considered reliable,since the valves available at thattime did not have adequate ther-mal stability and memory effectswere likely to occur.
Technological progress of valvedesign rendered miniaturizedconnectors for the assembly ofmultidimensional GC systems,eliminating dead volumes. Thesemechanical valves are stable athigh temperature and can be usedto set up multidimensional GCsystems without any drawbacks.They are easier to operate thanthose based on Dean’s principle.
In the full paper, a multidimen-sional developmental GC system,using mechanical valves, isdescribed for multitransfer pur-poses based on a high tempera-ture valve to heart-cut fractionsfrom the first capillary column toa second capillary column with ahot transfer line and a system tomaintain a constant flow duringthe transfer.
The use of this multidimensionalsystem to solve analytical prob-lems regarding mainly the chem-istry of the essential oils is alsooutlined.
The described configuration is a
specific adaption of Shimadzu GC -17A
systems done by Prof. Luigi Mondello.
Figure 1: Analysis of essentail oil composition
4 8 12 16 20 24 28 32 36
sabi
nen
e +b
-pin
ene
limon
ene
linal
ool
linal
yl a
ceta
te
terp
inen
-4-o
la-t
erpi
neo
l
(+)-b
-pin
ene
(-)-b
-pin
ene
(-)-sa
binen
e
(+)-lim
onen
e
(-)-lin
aloo
l
(-)-lin
alyl
ace
tate
(+)-lin
alyl
ace
tate
(-)-te
rpin
en-4
-ol
(+)-te
rpin
en-4
-ol
(-)-a
-ter
pineo
l (+
)-a
-ter
pineo
l
(+)-lin
aloo
l
(-)-lim
onen
e
(+)-sa
binen
e
A
B
C
FOOD ANALYSIS Chromatography Volume 1
36
automated GC-GC systemDevelopment of a fullyThe analysis of real complex samples:Essential Oils
Luigi Mondello, Maurizio Catalfamo, and Giovanni Dugo,Dipartimento Farmaco-Chimico, Facoltá di Farmacia, Univer-sitá degli Studi di Messina, Italy
Paola Dugo, Dipartimento di Chimica Organica e Biologica,Facoltá di Scienze, Universitá degli Studi di Messina, Italy
� Overview on multi-dimensional
gas chromatography
FOOD ANALYSIS
39
Chromatography Volume 1
50.000
0
1) C4:02) C5:03) C6:04) C7:05) C8:06) C9:07) C10:08) C10:19) C11:0
10) C12:011) C12:112) C12:1 isomer13) C13:014) C14:0 iso15) C14:016) C14:117) C15:0 anteiso18) C15:0 iso
19) C15:020) C15:121) C16:0 iso22) C16:023) C16:124) C17:0 anteiso25) C17:0 iso26) C17:027) C17:128) C18:0 iso29) C18:030) C18:1 �931) C18:1 �732) C18:2 �?33) C18:2 �634) C18:2 �?35) C18:3 �336) C18:2 con.
10 20 30
100.000
150.000
200.000
250.000
300.000
350.000
400.000
Inte
nsi
ty
Minutes0.0 33.0
05.000
10.00015.00020.00025.00030.00035.00040.00045.00050.00055.00060.00065.00070.00075.00080.00085.00090.00095.000
100.000105.000110.000115.000120.000125.000
0.0 0.1 0.2 0.3 0.4 0.5 0.6 0.7 0.8 0.9 1.0 1.1 1.2 1.3 1.4 1.5 1.6 1.7 1.8 1.9 2.0
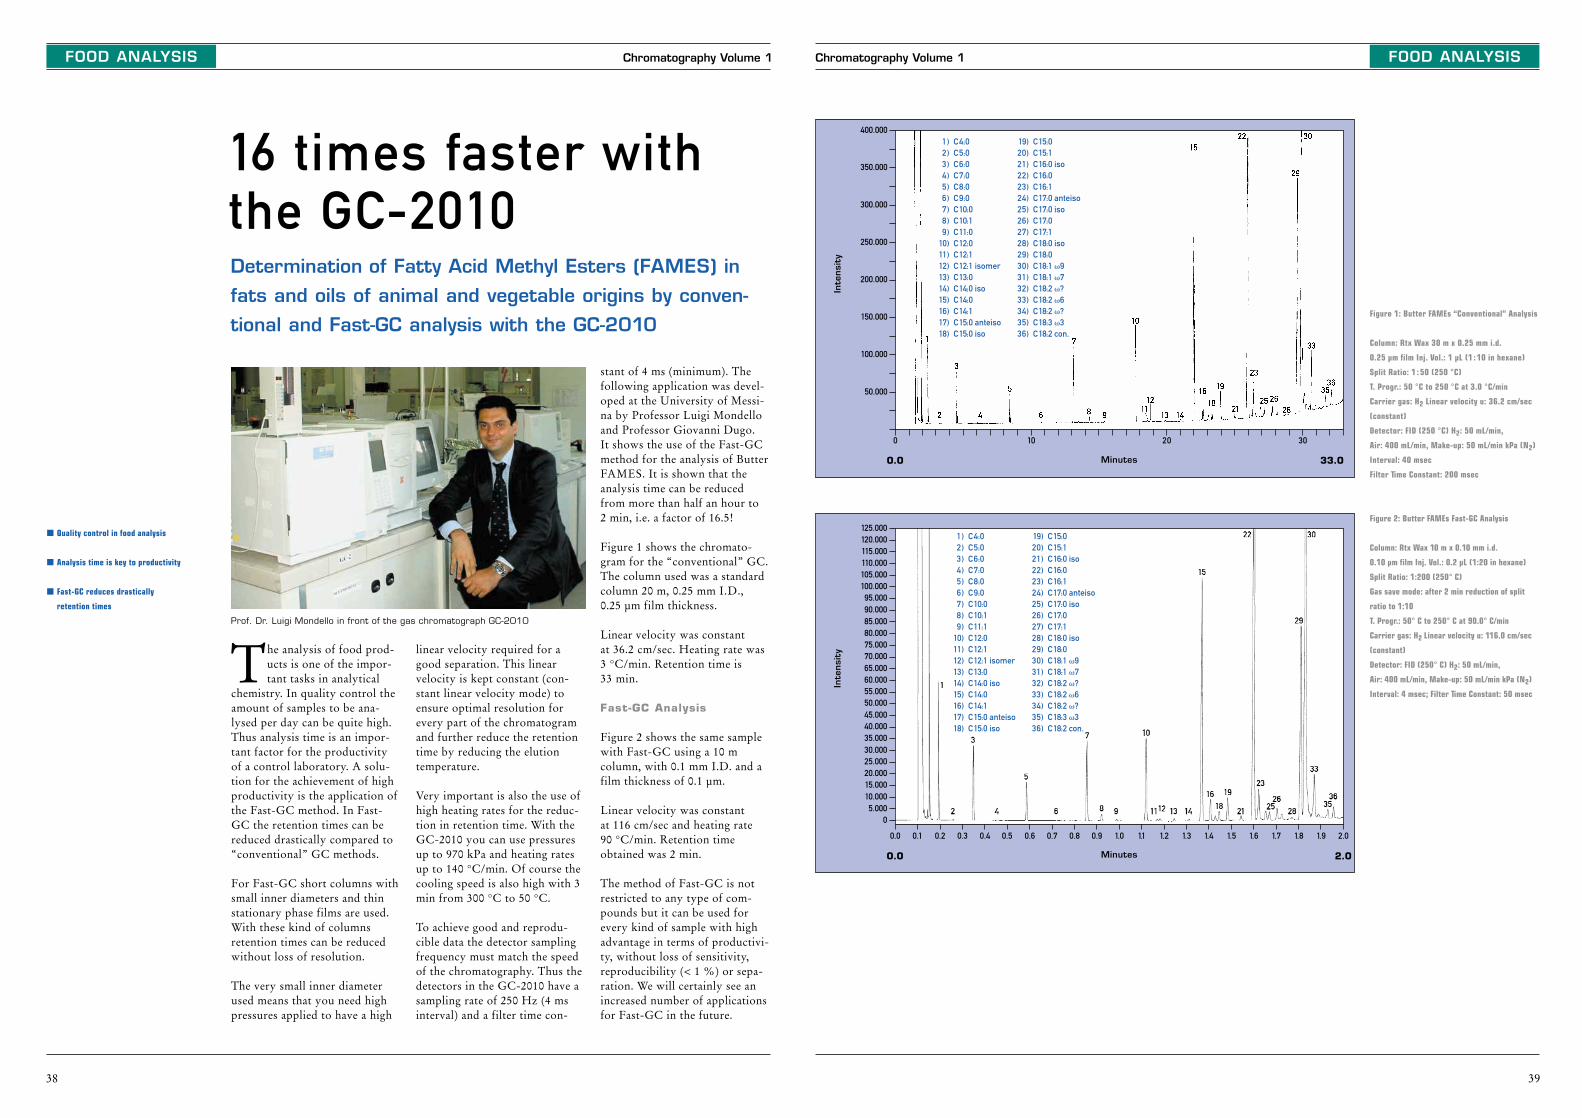
1) C4:02) C5:03) C6:04) C7:05) C8:06) C9:07) C10:08) C10:19) C11:1
10) C12:011) C12:112) C12:1 isomer13) C13:014) C14:0 iso15) C14:016) C14:117) C15:0 anteiso18) C15:0 iso
19) C15:020) C15:121) C16:0 iso22) C16:023) C16:124) C17:0 anteiso25) C17:0 iso26) C17:027) C17:128) C18:0 iso29) C18:030) C18:1 �931) C18:1 �732) C18:2 �?33) C18:2 �634) C18:2 �?35) C18:3 �336) C18:2 con.
Inte
nsi
ty
Minutes0.0 2.0
Figure 1: Butter FAMEs “Conventional” Analysis
Column: Rtx Wax 30 m x 0.25 mm i.d.
0.25 µm film Inj. Vol.: 1 µL (1 : 10 in hexane)
Split Ratio: 1 : 50 (250 °C)
T. Progr.: 50 °C to 250 °C at 3.0 °C/min
Carrier gas: H2 Linear velocity u: 36.2 cm/sec
(constant)
Detector: FID (250 °C) H2: 50 mL/min,
Air: 400 mL/min, Make-up: 50 mL/min kPa (N2)
Interval: 40 msec
Filter Time Constant: 200 msec
Figure 2: Butter FAMEs Fast-GC Analysis
Column: Rtx Wax 10 m x 0.10 mm i.d.
0.10 µm film Inj. Vol.: 0.2 µL (1:20 in hexane)
Split Ratio: 1:200 (250° C)
Gas save mode: after 2 min reduction of split
ratio to 1:10
T. Progr.: 50° C to 250° C at 90.0° C/min
Carrier gas: H2 Linear velocity u: 116.0 cm/sec
(constant)
Detector: FID (250° C) H2: 50 mL/min,
Air: 400 mL/min, Make-up: 50 mL/min kPa (N2)
Interval: 4 msec; Filter Time Constant: 50 msec
FOOD ANALYSIS Chromatography Volume 1
38
The analysis of food prod-ucts is one of the impor-tant tasks in analytical
chemistry. In quality control theamount of samples to be ana-lysed per day can be quite high.Thus analysis time is an impor-tant factor for the productivityof a control laboratory. A solu-tion for the achievement of highproductivity is the application ofthe Fast-GC method. In Fast-GC the retention times can bereduced drastically compared to“conventional” GC methods.
For Fast-GC short columns withsmall inner diameters and thinstationary phase films are used.With these kind of columnsretention times can be reducedwithout loss of resolution.
The very small inner diameterused means that you need highpressures applied to have a high
linear velocity required for agood separation. This linearvelocity is kept constant (con-stant linear velocity mode) toensure optimal resolution forevery part of the chromatogramand further reduce the retentiontime by reducing the elutiontemperature.
Very important is also the use ofhigh heating rates for the reduc-tion in retention time. With theGC-2010 you can use pressuresup to 970 kPa and heating ratesup to 140 °C/min. Of course thecooling speed is also high with 3min from 300 °C to 50 °C.
To achieve good and reprodu-cible data the detector samplingfrequency must match the speedof the chromatography. Thus thedetectors in the GC-2010 have asampling rate of 250 Hz (4 msinterval) and a filter time con-
stant of 4 ms (minimum). Thefollowing application was devel-oped at the University of Messi-na by Professor Luigi Mondelloand Professor Giovanni Dugo. It shows the use of the Fast-GCmethod for the analysis of ButterFAMES. It is shown that theanalysis time can be reducedfrom more than half an hour to 2 min, i.e. a factor of 16.5!
Figure 1 shows the chromato-gram for the “conventional” GC.The column used was a standardcolumn 20 m, 0.25 mm I.D., 0.25 µm film thickness.
Linear velocity was constant at 36.2 cm/sec. Heating rate was3 °C/min. Retention time is 33 min.
Fast-GC Analysis
Figure 2 shows the same samplewith Fast-GC using a 10 m column, with 0.1 mm I.D. and afilm thickness of 0.1 µm.
Linear velocity was constant at 116 cm/sec and heating rate 90 °C/min. Retention timeobtained was 2 min.
The method of Fast-GC is notrestricted to any type of com-pounds but it can be used forevery kind of sample with highadvantage in terms of productivi-ty, without loss of sensitivity,reproducibility (< 1 %) or sepa-ration. We will certainly see anincreased number of applicationsfor Fast-GC in the future.
� Quality control in food analysis
� Analysis time is key to productivity
� Fast-GC reduces drastically
retention times
16 times faster withthe GC-2010Determination of Fatty Acid Methyl Esters (FAMES) in
fats and oils of animal and vegetable origins by conven-
tional and Fast-GC analysis with the GC-2010
Prof. Dr. Luigi Mondello in front of the gas chromatograph GC-2010
41
Chromatography Volume 1 FOOD ANALYSIS
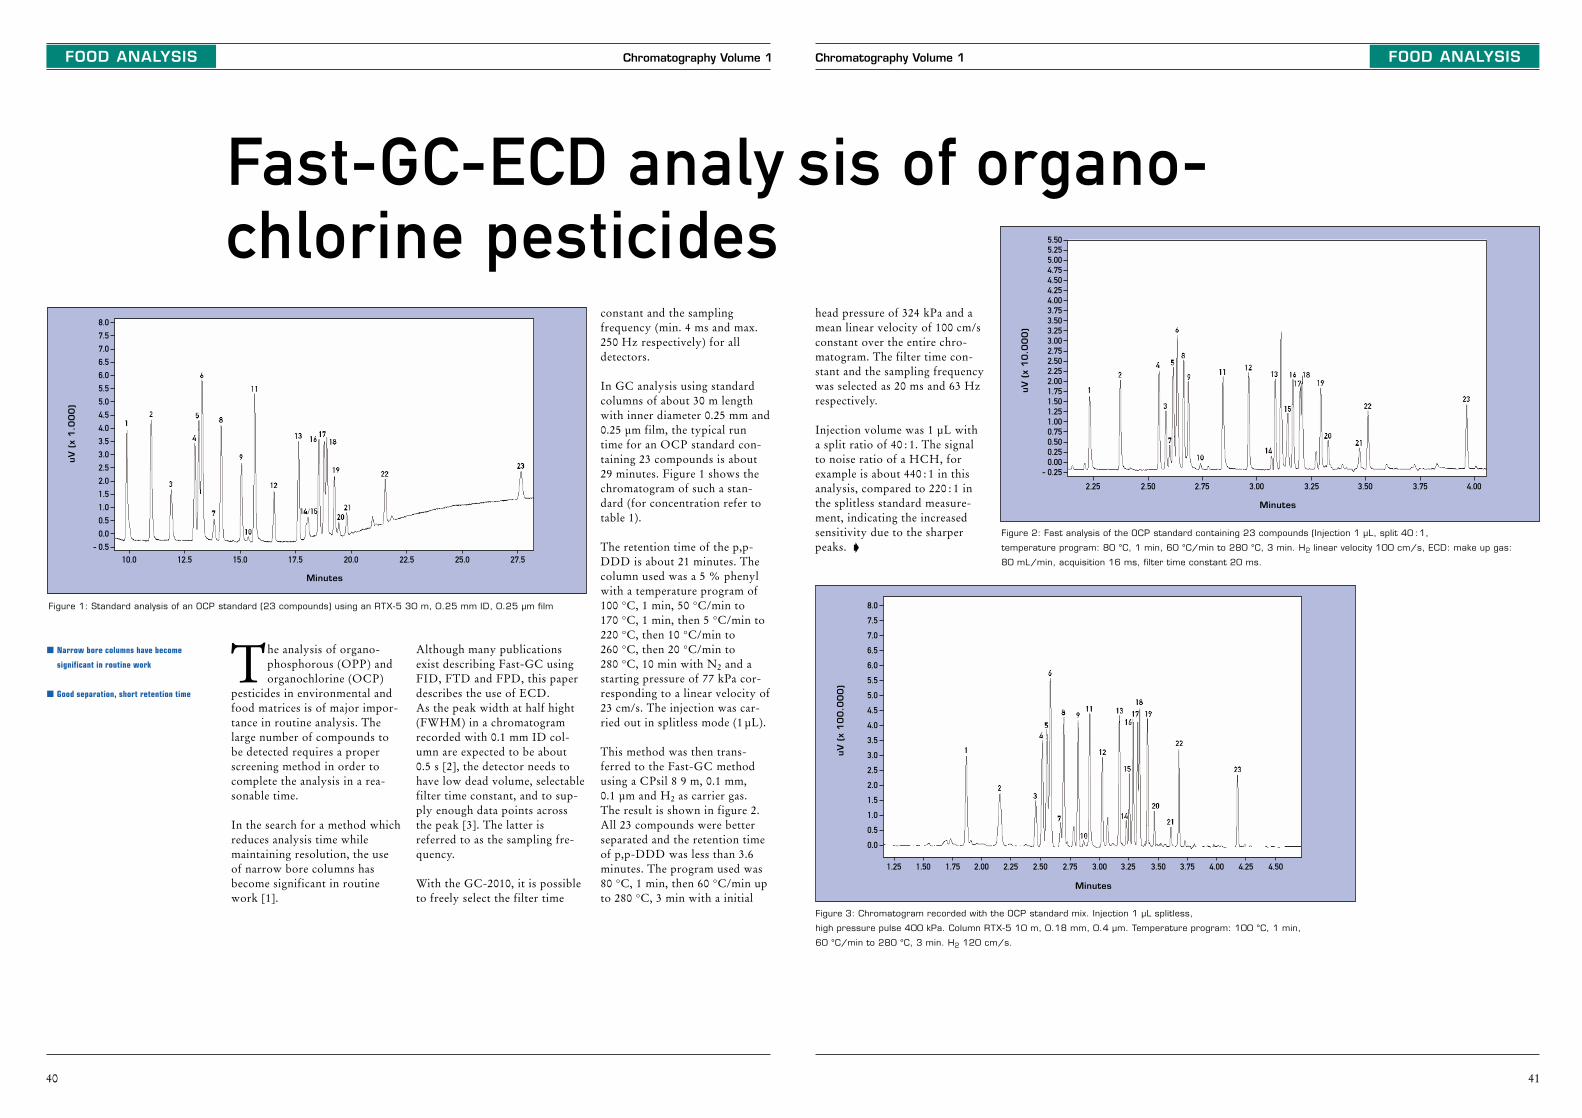
head pressure of 324 kPa and amean linear velocity of 100 cm/sconstant over the entire chro-matogram. The filter time con-stant and the sampling frequencywas selected as 20 ms and 63 Hzrespectively.
Injection volume was 1 µL witha split ratio of 40 : 1. The signalto noise ratio of a HCH, forexample is about 440 : 1 in thisanalysis, compared to 220 : 1 inthe splitless standard measure-ment, indicating the increasedsensitivity due to the sharperpeaks. �
Figure 2: Fast analysis of the OCP standard containing 23 compounds (Injection 1 µL, split 40 :1,
temperature program: 80 °C, 1 min, 60 °C/min to 280 °C, 3 min. H2 linear velocity 100 cm/s, ECD: make up gas:
80 mL/min, acquisition 16 ms, filter time constant 20 ms.
Minutes
2.25 2.50 2.75 3.00 3.25 3.50 3.75 4.00
- 0.250.000.250.500.751.001.251.501.752.002.252.502.753.003.253.503.754.004.254.504.755.005.255.50
uV
(x
10
.00
0)
Minutes
1.25 1.50 1.75 2.00 2.25 2.50 2.75 3.00 3.25 3.50 3.75 4.00 4.25 4.50
0.0
0.5
1.0
1.5
2.0
2.5
3.0
3.5
4.0
4.5
5.0
5.5
6.0
6.5
7.0
7.5
8.0
uV
(x
10
0.0
00
)
Figure 3: Chromatogram recorded with the OCP standard mix. Injection 1 µL splitless,
high pressure pulse 400 kPa. Column RTX-5 10 m, 0.18 mm, 0.4 µm. Temperature program: 100 °C, 1 min,
60 °C/min to 280 °C, 3 min. H2 120 cm/s.
Chromatography Volume 1
40
FOOD ANALYSIS
sis of organo-Fast-GC-ECD analychlorine pesticides
The analysis of organo-phosphorous (OPP) andorganochlorine (OCP)
pesticides in environmental andfood matrices is of major impor-tance in routine analysis. Thelarge number of compounds tobe detected requires a properscreening method in order tocomplete the analysis in a rea-sonable time.
In the search for a method whichreduces analysis time whilemaintaining resolution, the useof narrow bore columns hasbecome significant in routinework [1].
Although many publicationsexist describing Fast-GC usingFID, FTD and FPD, this paperdescribes the use of ECD. As the peak width at half hight(FWHM) in a chromatogramrecorded with 0.1 mm ID col-umn are expected to be about 0.5 s [2], the detector needs tohave low dead volume, selectablefilter time constant, and to sup-ply enough data points acrossthe peak [3]. The latter isreferred to as the sampling fre-quency.
With the GC-2010, it is possibleto freely select the filter time
constant and the sampling frequency (min. 4 ms and max.250 Hz respectively) for alldetectors.
In GC analysis using standardcolumns of about 30 m lengthwith inner diameter 0.25 mm and0.25 µm film, the typical runtime for an OCP standard con-taining 23 compounds is about29 minutes. Figure 1 shows thechromatogram of such a stan-dard (for concentration refer totable 1).
The retention time of the p,p-DDD is about 21 minutes. Thecolumn used was a 5 % phenylwith a temperature program of100 °C, 1 min, 50 °C/min to 170 °C, 1 min, then 5 °C/min to220 °C, then 10 °C/min to 260 °C, then 20 °C/min to 280 °C, 10 min with N2 and astarting pressure of 77 kPa cor-responding to a linear velocity of23 cm/s. The injection was car-ried out in splitless mode (1 µL).
This method was then trans-ferred to the Fast-GC methodusing a CPsil 8 9 m, 0.1 mm, 0.1 µm and H2 as carrier gas.The result is shown in figure 2.All 23 compounds were betterseparated and the retention timeof p,p-DDD was less than 3.6minutes. The program used was80 °C, 1 min, then 60 °C/min upto 280 °C, 3 min with a initial
Minutes
10.0 12.5 15.0 17.5 20.0 22.5 25.0 27.5
- 0.5
0.0
0.5
1.0
1.5
2.0
2.5
3.0
3.5
4.0
4.5
5.0
5.5
6.0
6.5
7.0
7.5
8.0
uV
(x
1.0
00
)
Figure 1: Standard analysis of an OCP standard (23 compounds) using an RTX-5 30 m, 0.25 mm ID, 0.25 µm film
� Narrow bore columns have become
significant in routine work
� Good separation, short retention time
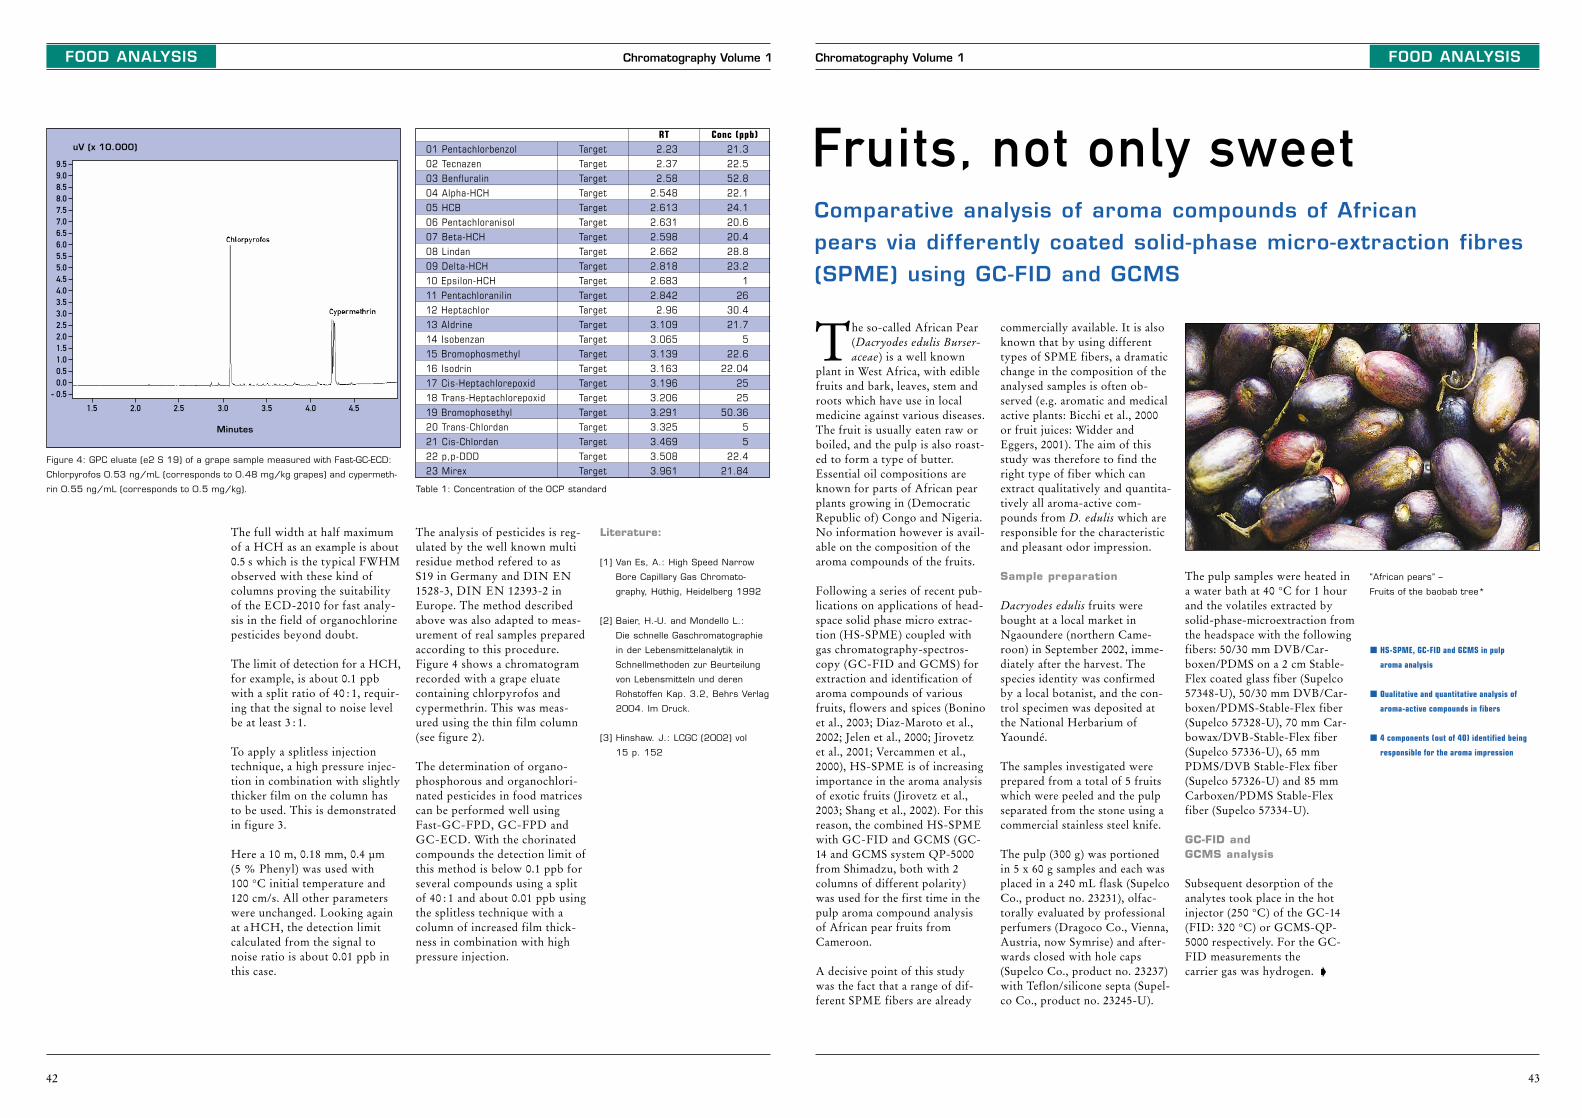
Conc (ppb)21.3
22.5
52.8
22.1
24.1
20.6
20.4
28.8
23.2
1
26
30.4
21.7
5
22.6
22.04
25
25
50.36
5
5
22.4
21.84
43
Chromatography Volume 1 FOOD ANALYSIS
The so-called African Pear(Dacryodes edulis Burser-aceae) is a well known
plant in West Africa, with ediblefruits and bark, leaves, stem androots which have use in localmedicine against various diseases.The fruit is usually eaten raw orboiled, and the pulp is also roast-ed to form a type of butter.Essential oil compositions areknown for parts of African pearplants growing in (DemocraticRepublic of) Congo and Nigeria.No information however is avail-able on the composition of thearoma compounds of the fruits.
Following a series of recent pub-lications on applications of head-space solid phase micro extrac-tion (HS-SPME) coupled withgas chromatography-spectros-copy (GC-FID and GCMS) forextraction and identification ofaroma compounds of variousfruits, flowers and spices (Boninoet al., 2003; Diaz-Maroto et al.,2002; Jelen et al., 2000; Jirovetz et al., 2001; Vercammen et al.,2000), HS-SPME is of increasingimportance in the aroma analysisof exotic fruits (Jirovetz et al.,2003; Shang et al., 2002). For thisreason, the combined HS-SPMEwith GC-FID and GCMS (GC-14 and GCMS system QP-5000from Shimadzu, both with 2columns of different polarity)was used for the first time in thepulp aroma compound analysisof African pear fruits fromCameroon.
A decisive point of this studywas the fact that a range of dif-ferent SPME fibers are already
commercially available. It is alsoknown that by using differenttypes of SPME fibers, a dramaticchange in the composition of theanalysed samples is often ob-served (e.g. aromatic and medicalactive plants: Bicchi et al., 2000or fruit juices: Widder andEggers, 2001). The aim of thisstudy was therefore to find theright type of fiber which canextract qualitatively and quantita-tively all aroma-active com-pounds from D. edulis which areresponsible for the characteristicand pleasant odor impression.
Sample preparation
Dacryodes edulis fruits werebought at a local market inNgaoundere (northern Came-roon) in September 2002, imme-diately after the harvest. Thespecies identity was confirmed by a local botanist, and the con-trol specimen was deposited atthe National Herbarium ofYaoundé.
The samples investigated wereprepared from a total of 5 fruitswhich were peeled and the pulpseparated from the stone using acommercial stainless steel knife.
The pulp (300 g) was portionedin 5 x 60 g samples and each wasplaced in a 240 mL flask (SupelcoCo., product no. 23231), olfac-torally evaluated by professionalperfumers (Dragoco Co., Vienna,Austria, now Symrise) and after-wards closed with hole caps(Supelco Co., product no. 23237)with Teflon/silicone septa (Supel-co Co., product no. 23245-U).
The pulp samples were heated ina water bath at 40 °C for 1 hourand the volatiles extracted bysolid-phase-microextraction fromthe headspace with the followingfibers: 50/30 mm DVB/Car-boxen/PDMS on a 2 cm Stable-Flex coated glass fiber (Supelco57348-U), 50/30 mm DVB/Car-boxen/PDMS-Stable-Flex fiber(Supelco 57328-U), 70 mm Car-bowax/DVB-Stable-Flex fiber(Supelco 57336-U), 65 mmPDMS/DVB Stable-Flex fiber(Supelco 57326-U) and 85 mmCarboxen/PDMS Stable-Flexfiber (Supelco 57334-U).
GC-FID and GCMS analysis
Subsequent desorption of theanalytes took place in the hotinjector (250 °C) of the GC-14(FID: 320 °C) or GCMS-QP-5000 respectively. For the GC-FID measurements the carrier gas was hydrogen. �
Fruits, not only sweetComparative analysis of aroma compounds of African pears via differently coated solid-phase micro-extraction fibres(SPME) using GC-FID and GCMS
“African pears” –
Fruits of the baobab tree*
� HS-SPME, GC-FID and GCMS in pulp
aroma analysis
� Qualitative and quantitative analysis of
aroma-active compounds in fibers
� 4 components (out of 40) identified being
responsible for the aroma impression
Chromatography Volume 1
42
FOOD ANALYSIS
Figure 4: GPC eluate (e2 S 19) of a grape sample measured with Fast-GC-ECD:
Chlorpyrofos 0.53 ng/mL (corresponds to 0.48 mg/kg grapes) and cypermeth-
rin 0.55 ng/mL (corresponds to 0.5 mg/kg). Table 1: Concentration of the OCP standard
Minutes
1.5 2.0 2.5 3.0 3.5 4.0 4.5
- 0.50.00.51.01.52.02.53.03.54.04.55.05.56.06.57.07.58.08.59.09.5
uV (x 10.000) 01 Pentachlorbenzol
02 Tecnazen
03 Benfluralin
04 Alpha-HCH
05 HCB
06 Pentachloranisol
07 Beta-HCH
08 Lindan
09 Delta-HCH
10 Epsilon-HCH
11 Pentachloranilin
12 Heptachlor
13 Aldrine
14 Isobenzan
15 Bromophosmethyl
16 Isodrin
17 Cis-Heptachlorepoxid
18 Trans-Heptachlorepoxid
19 Bromophosethyl
20 Trans-Chlordan
21 Cis-Chlordan
22 p,p-DDD
23 Mirex
Target
Target
Target
Target
Target
Target
Target
Target
Target
Target
Target
Target
Target
Target
Target
Target
Target
Target
Target
Target
Target
Target
Target
RT2.23
2.37
2.58
2.548
2.613
2.631
2.598
2.662
2.818
2.683
2.842
2.96
3.109
3.065
3.139
3.163
3.196
3.206
3.291
3.325
3.469
3.508
3.961
The full width at half maximumof a HCH as an example is about0.5 s which is the typical FWHMobserved with these kind ofcolumns proving the suitabilityof the ECD-2010 for fast analy-sis in the field of organochlorinepesticides beyond doubt.
The limit of detection for a HCH,for example, is about 0.1 ppbwith a split ratio of 40 : 1, requir-ing that the signal to noise levelbe at least 3 : 1.
To apply a splitless injectiontechnique, a high pressure injec-tion in combination with slightlythicker film on the column hasto be used. This is demonstratedin figure 3.
Here a 10 m, 0.18 mm, 0.4 µm (5 % Phenyl) was used with 100 °C initial temperature and120 cm/s. All other parameterswere unchanged. Looking againat aHCH, the detection limitcalculated from the signal tonoise ratio is about 0.01 ppb inthis case.
The analysis of pesticides is reg-ulated by the well known multiresidue method refered to as S19 in Germany and DIN EN1528-3, DIN EN 12393-2 inEurope. The method describedabove was also adapted to meas-urement of real samples preparedaccording to this procedure. Figure 4 shows a chromatogramrecorded with a grape eluatecontaining chlorpyrofos andcypermethrin. This was meas-ured using the thin film column(see figure 2).
The determination of organo-phosphorous and organochlori-nated pesticides in food matricescan be performed well usingFast-GC-FPD, GC-FPD andGC-ECD. With the chorinatedcompounds the detection limit ofthis method is below 0.1 ppb forseveral compounds using a splitof 40 : 1 and about 0.01 ppb usingthe splitless technique with acolumn of increased film thick-ness in combination with highpressure injection.
Literature:
[1] Van Es, A.: High Speed Narrow
Bore Capillary Gas Chromato-
graphy, Hüthig, Heidelberg 1992
[2] Baier, H.-U. and Mondello L.:
Die schnelle Gaschromatographie
in der Lebensmittelanalytik in
Schnellmethoden zur Beurteilung
von Lebensmitteln und deren
Rohstoffen Kap. 3.2, Behrs Verlag
2004. Im Druck.
[3] Hinshaw. J.: LCGC (2002) vol
15 p. 152
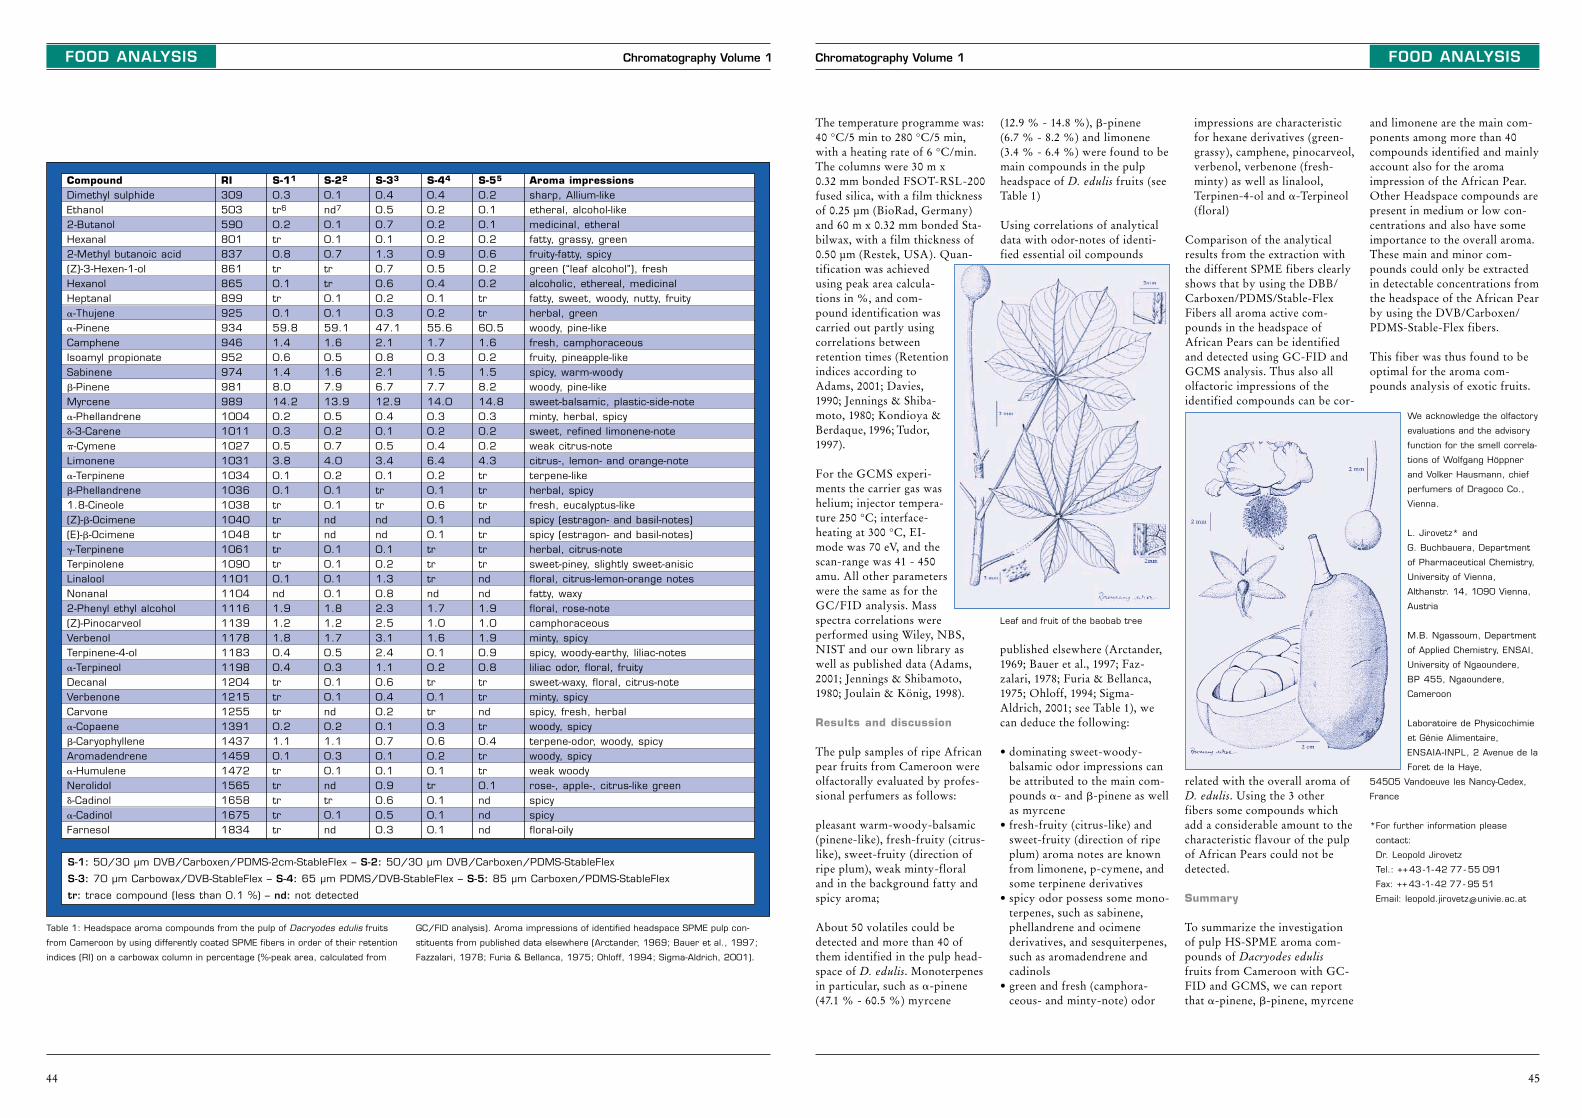
The temperature programme was:40 °C/5 min to 280 °C/5 min,with a heating rate of 6 °C/min.The columns were 30 m x 0.32 mm bonded FSOT-RSL-200fused silica, with a film thicknessof 0.25 µm (BioRad, Germany)and 60 m x 0.32 mm bonded Sta-bilwax, with a film thickness of0.50 µm (Restek, USA). Quan-tification was achievedusing peak area calcula-tions in %, and com-pound identification wascarried out partly usingcorrelations betweenretention times (Retentionindices according toAdams, 2001; Davies,1990; Jennings & Shiba-moto, 1980; Kondioya &Berdaque, 1996; Tudor,1997).
For the GCMS experi-ments the carrier gas washelium; injector tempera-ture 250 °C; interface-heating at 300 °C, EI-mode was 70 eV, and thescan-range was 41 - 450amu. All other parameterswere the same as for theGC/FID analysis. Massspectra correlations wereperformed using Wiley, NBS,NIST and our own library aswell as published data (Adams,2001; Jennings & Shibamoto,1980; Joulain & König, 1998).
Results and discussion
The pulp samples of ripe Africanpear fruits from Cameroon wereolfactorally evaluated by profes-sional perfumers as follows:
pleasant warm-woody-balsamic(pinene-like), fresh-fruity (citrus-like), sweet-fruity (direction ofripe plum), weak minty-floraland in the background fatty andspicy aroma;
About 50 volatiles could bedetected and more than 40 ofthem identified in the pulp head-space of D. edulis. Monoterpenesin particular, such as �-pinene(47.1 % - 60.5 %) myrcene
(12.9 % - 14.8 %), �-pinene (6.7 % - 8.2 %) and limonene(3.4 % - 6.4 %) were found to bemain compounds in the pulpheadspace of D. edulis fruits (seeTable 1)
Using correlations of analyticaldata with odor-notes of identi-fied essential oil compounds
impressions are characteristicfor hexane derivatives (green-grassy), camphene, pinocarveol,verbenol, verbenone (fresh-minty) as well as linalool, Terpinen-4-ol and �-Terpineol(floral)
Comparison of the analyticalresults from the extraction withthe different SPME fibers clearlyshows that by using the DBB/Carboxen/PDMS/Stable-FlexFibers all aroma active com-pounds in the headspace ofAfrican Pears can be identifiedand detected using GC-FID andGCMS analysis. Thus also allolfactoric impressions of theidentified compounds can be cor-
and limonene are the main com-ponents among more than 40compounds identified and mainlyaccount also for the aromaimpression of the African Pear.Other Headspace compounds arepresent in medium or low con-centrations and also have someimportance to the overall aroma.These main and minor com-pounds could only be extractedin detectable concentrations fromthe headspace of the African Pearby using the DVB/Carboxen/PDMS-Stable-Flex fibers.
This fiber was thus found to beoptimal for the aroma com-pounds analysis of exotic fruits.
We acknowledge the olfactory
evaluations and the advisory
function for the smell correla-
tions of Wolfgang Höppner
and Volker Hausmann, chief
perfumers of Dragoco Co.,
Vienna.
L. Jirovetz* and
G. Buchbauera, Department
of Pharmaceutical Chemistry,
University of Vienna,
Althanstr. 14, 1090 Vienna,
Austria
M.B. Ngassoum, Department
of Applied Chemistry, ENSAI,
University of Ngaoundere,
BP 455, Ngaoundere,
Cameroon
Laboratoire de Physicochimie
et Génie Alimentaire,
ENSAIA-INPL, 2 Avenue de la
Foret de la Haye,
54505 Vandoeuve les Nancy-Cedex,
France
*For further information please
contact:
Dr. Leopold Jirovetz
Tel.: ++43 -1-42 77 - 55 091
Fax: ++43 -1-42 77 - 95 51
Email: [email protected]
Leaf and fruit of the baobab tree
published elsewhere (Arctander,1969; Bauer et al., 1997; Faz-zalari, 1978; Furia & Bellanca,1975; Ohloff, 1994; Sigma-Aldrich, 2001; see Table 1), wecan deduce the following:
• dominating sweet-woody-balsamic odor impressions canbe attributed to the main com-pounds �- and �-pinene as wellas myrcene
• fresh-fruity (citrus-like) andsweet-fruity (direction of ripeplum) aroma notes are knownfrom limonene, p-cymene, andsome terpinene derivatives
• spicy odor possess some mono-terpenes, such as sabinene,phellandrene and ocimenederivatives, and sesquiterpenes,such as aromadendrene andcadinols
• green and fresh (camphora-ceous- and minty-note) odor
related with the overall aroma ofD. edulis. Using the 3 otherfibers some compounds whichadd a considerable amount to thecharacteristic flavour of the pulpof African Pears could not bedetected.
Summary
To summarize the investigationof pulp HS-SPME aroma com-pounds of Dacryodes edulisfruits from Cameroon with GC-FID and GCMS, we can reportthat �-pinene, �-pinene, myrcene
FOOD ANALYSIS
45
Chromatography Volume 1Chromatography Volume 1
44
FOOD ANALYSIS
Aroma impressionssharp, Allium-like etheral, alcohol-likemedicinal, etheralfatty, grassy, greenfruity-fatty, spicygreen (“leaf alcohol”), freshalcoholic, ethereal, medicinalfatty, sweet, woody, nutty, fruityherbal, greenwoody, pine-likefresh, camphoraceousfruity, pineapple-like spicy, warm-woody woody, pine-likesweet-balsamic, plastic-side-noteminty, herbal, spicysweet, refined limonene-noteweak citrus-notecitrus-, lemon- and orange-noteterpene-likeherbal, spicyfresh, eucalyptus-likespicy (estragon- and basil-notes)spicy (estragon- and basil-notes)herbal, citrus-notesweet-piney, slightly sweet-anisicfloral, citrus-lemon-orange notesfatty, waxyfloral, rose-notecamphoraceousminty, spicyspicy, woody-earthy, liliac-notesliliac odor, floral, fruitysweet-waxy, floral, citrus-noteminty, spicyspicy, fresh, herbalwoody, spicyterpene-odor, woody, spicywoody, spicyweak woodyrose-, apple-, citrus-like greenspicyspicyfloral-oily
CompoundDimethyl sulphideEthanol2-ButanolHexanal2-Methyl butanoic acid(Z)-3-Hexen-1-olHexanolHeptanal�-Thujene�-PineneCampheneIsoamyl propionateSabinene�-PineneMyrcene�-Phellandrene�-3-Carene�-CymeneLimonene�-Terpinene�-Phellandrene1.8-Cineole(Z)-�-Ocimene(E)-�-Ocimene�-TerpineneTerpinoleneLinaloolNonanal2-Phenyl ethyl alcohol(Z)-PinocarveolVerbenolTerpinene-4-ol�-TerpineolDecanalVerbenoneCarvone�-Copaene�-CaryophylleneAromadendrene�-HumuleneNerolidol�-Cadinol�-CadinolFarnesol
RI309503590801 83786186589992593494695297498198910041011102710311034103610381040104810611090110111041116 113911781183119812041215125513911437145914721565165816751834
S-11
0.3tr6
0.2tr0.8tr0.1tr0.159.81.40.61.48.014.20.20.30.53.80.10.1trtrtrtrtr0.1nd1.91.21.80.40.4trtrtr0.21.10.1trtrtrtrtr
S-22
0.1nd7
0.10.10.7trtr0.10.159.11.60.51.67.913.90.50.20.74.00.20.10.1ndnd0.10.10.10.11.81.21.70.50.30.10.1nd0.21.10.30.1ndtr0.1nd
S-33
0.40.50.70.11.30.70.60.20.347.12.10.82.16.712.90.40.10.53.40.1trtrndnd0.10.21.30.82.32.53.12.41.10.60.40.20.10.70.10.10.90.60.50.3
S-44
0.40.20.20.20.90.50.40.10.255.61.70.31.57.714.0 0.30.20.46.40.20.10.60.10.1trtrtrnd1.71.01.60.10.2tr0.1tr0.30.60.20.1tr0.10.10.1
S-55
0.20.10.10.20.60.20.2trtr60.51.60.21.58.214.80.30.20.24.3trtrtrndtrtrtrndnd1.91.01.90.90.8trtrndtr0.4trtr0.1ndndnd
Table 1: Headspace aroma compounds from the pulp of Dacryodes edulis fruits
from Cameroon by using differently coated SPME fibers in order of their retention
indices (RI) on a carbowax column in percentage (%-peak area, calculated from
GC/FID analysis). Aroma impressions of identified headspace SPME pulp con-
stituents from published data elsewhere (Arctander, 1969; Bauer et al., 1997;
Fazzalari, 1978; Furia & Bellanca, 1975; Ohloff, 1994; Sigma-Aldrich, 2001).
S-1: 50/30 µm DVB/Carboxen/PDMS-2cm-StableFlex – S-2: 50/30 µm DVB/Carboxen/PDMS-StableFlex
S-3: 70 µm Carbowax/DVB-StableFlex – S-4: 65 µm PDMS/DVB-StableFlex – S-5: 85 µm Carboxen/PDMS-StableFlex
tr: trace compound (less than 0.1 %) – nd: not detected
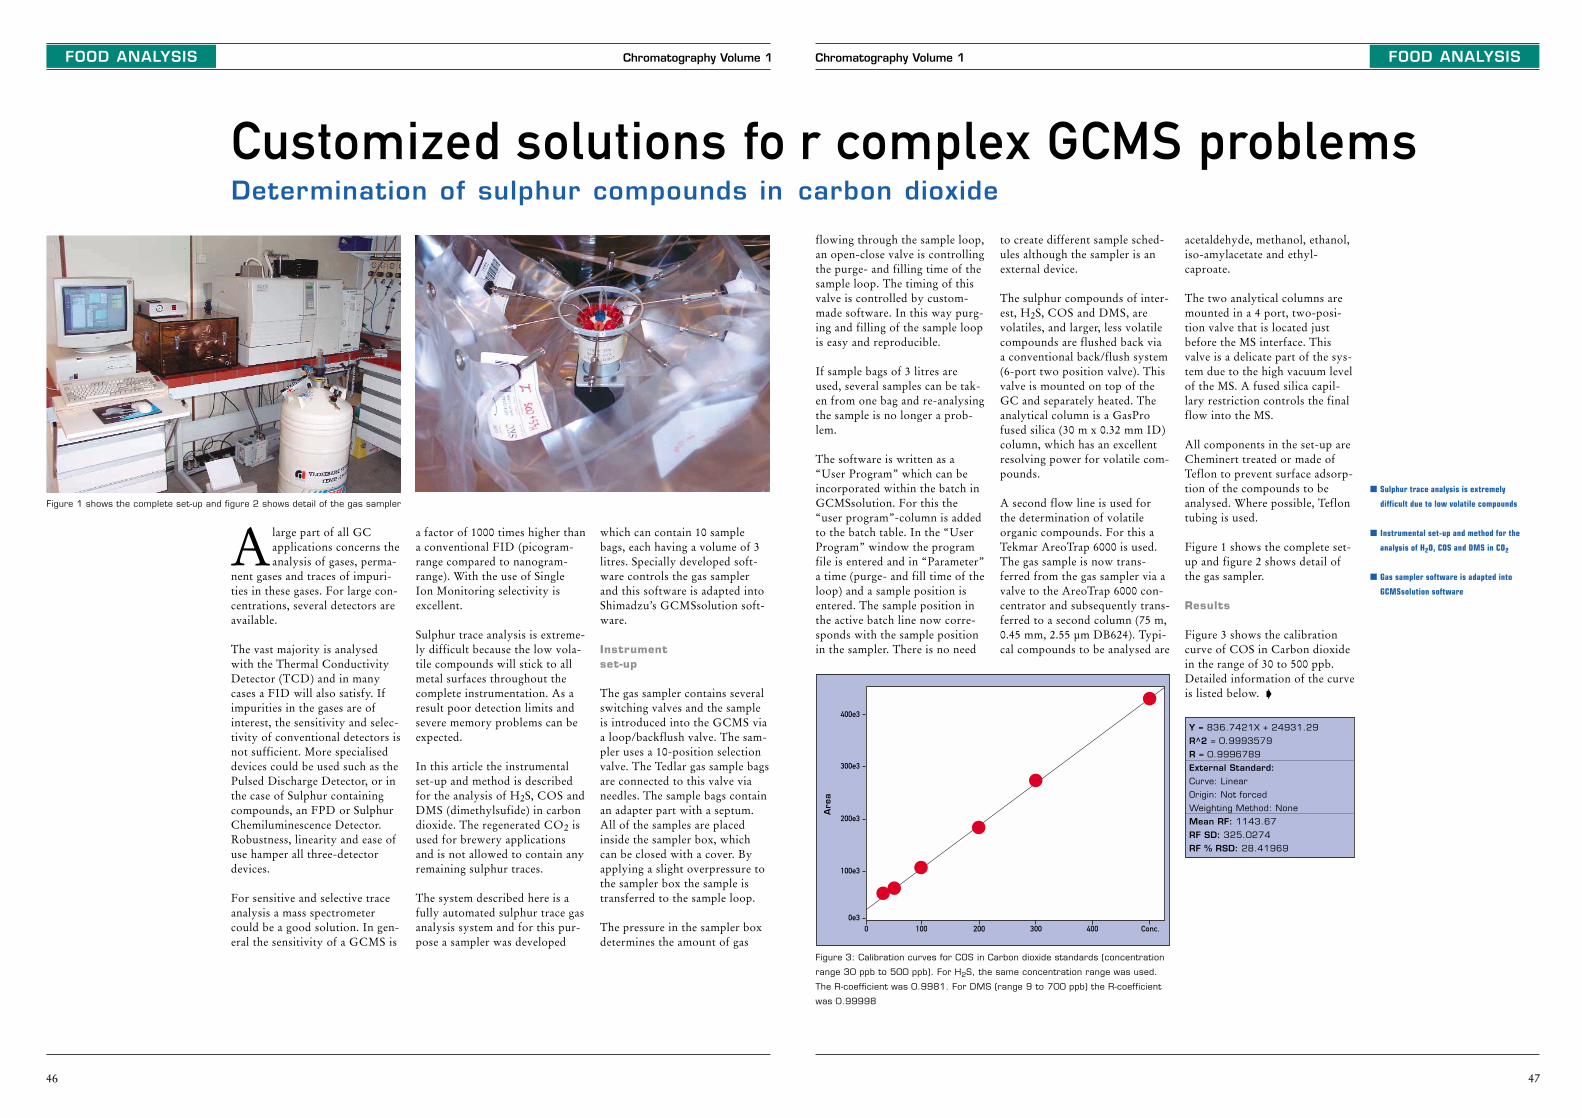
FOOD ANALYSIS
47
Chromatography Volume 1
Figure 3: Calibration curves for COS in Carbon dioxide standards (concentration
range 30 ppb to 500 ppb). For H2S, the same concentration range was used.
The R-coefficient was 0.9981. For DMS (range 9 to 700 ppb) the R-coefficient
was 0.99998
400e3
300e3
200e3
100e3
0e30 100 200 300 400 Conc.
Are
a
Y = 836.7421X + 24931.29
R^2 = 0.9993579
R = 0.9996789
External Standard:
Curve: Linear
Origin: Not forced
Weighting Method: None
Mean RF: 1143.67
RF SD: 325.0274
RF % RSD: 28.41969
flowing through the sample loop,an open-close valve is controllingthe purge- and filling time of thesample loop. The timing of thisvalve is controlled by custom-made software. In this way purg-ing and filling of the sample loopis easy and reproducible.
If sample bags of 3 litres areused, several samples can be tak-en from one bag and re-analysingthe sample is no longer a prob-lem.
The software is written as a“User Program” which can beincorporated within the batch inGCMSsolution. For this the“user program”-column is addedto the batch table. In the “UserProgram” window the programfile is entered and in “Parameter”a time (purge- and fill time of theloop) and a sample position isentered. The sample position inthe active batch line now corre-sponds with the sample positionin the sampler. There is no need
to create different sample sched-ules although the sampler is anexternal device.
The sulphur compounds of inter-est, H2S, COS and DMS, arevolatiles, and larger, less volatilecompounds are flushed back viaa conventional back/flush system(6-port two position valve). Thisvalve is mounted on top of theGC and separately heated. Theanalytical column is a GasProfused silica (30 m x 0.32 mm ID)column, which has an excellentresolving power for volatile com-pounds.
A second flow line is used forthe determination of volatileorganic compounds. For this aTekmar AreoTrap 6000 is used.The gas sample is now trans-ferred from the gas sampler via avalve to the AreoTrap 6000 con-centrator and subsequently trans-ferred to a second column (75 m,0.45 mm, 2.55 µm DB624). Typi-cal compounds to be analysed are
acetaldehyde, methanol, ethanol,iso-amylacetate and ethyl-caproate.
The two analytical columns aremounted in a 4 port, two-posi-tion valve that is located justbefore the MS interface. Thisvalve is a delicate part of the sys-tem due to the high vacuum levelof the MS. A fused silica capil-lary restriction controls the finalflow into the MS.
All components in the set-up areCheminert treated or made ofTeflon to prevent surface adsorp-tion of the compounds to beanalysed. Where possible, Teflontubing is used.
Figure 1 shows the complete set-up and figure 2 shows detail ofthe gas sampler.
Results
Figure 3 shows the calibrationcurve of COS in Carbon dioxidein the range of 30 to 500 ppb.Detailed information of the curveis listed below. �
� Sulphur trace analysis is extremely
difficult due to low volatile compounds
� Instrumental set-up and method for the
analysis of H2O, COS and DMS in CO2
� Gas sampler software is adapted into
GCMSsolution software
FOOD ANALYSIS
which can contain 10 samplebags, each having a volume of 3litres. Specially developed soft-ware controls the gas samplerand this software is adapted intoShimadzu’s GCMSsolution soft-ware.
Instrument set-up
The gas sampler contains severalswitching valves and the sampleis introduced into the GCMS viaa loop/backflush valve. The sam-pler uses a 10-position selectionvalve. The Tedlar gas sample bagsare connected to this valve vianeedles. The sample bags containan adapter part with a septum.All of the samples are placedinside the sampler box, whichcan be closed with a cover. Byapplying a slight overpressure tothe sampler box the sample istransferred to the sample loop.
The pressure in the sampler boxdetermines the amount of gas
Chromatography Volume 1
46
Alarge part of all GCapplications concerns theanalysis of gases, perma-
nent gases and traces of impuri-ties in these gases. For large con-centrations, several detectors areavailable.
The vast majority is analysedwith the Thermal ConductivityDetector (TCD) and in manycases a FID will also satisfy. Ifimpurities in the gases are ofinterest, the sensitivity and selec-tivity of conventional detectors isnot sufficient. More specialiseddevices could be used such as thePulsed Discharge Detector, or inthe case of Sulphur containingcompounds, an FPD or SulphurChemiluminescence Detector.Robustness, linearity and ease ofuse hamper all three-detectordevices.
For sensitive and selective traceanalysis a mass spectrometercould be a good solution. In gen-eral the sensitivity of a GCMS is
a factor of 1000 times higher thana conventional FID (picogram-range compared to nanogram-range). With the use of Single Ion Monitoring selectivity isexcellent.
Sulphur trace analysis is extreme-ly difficult because the low vola-tile compounds will stick to allmetal surfaces throughout thecomplete instrumentation. As aresult poor detection limits andsevere memory problems can beexpected.
In this article the instrumentalset-up and method is describedfor the analysis of H2S, COS andDMS (dimethylsufide) in carbondioxide. The regenerated CO2 isused for brewery applicationsand is not allowed to contain anyremaining sulphur traces.
The system described here is afully automated sulphur trace gasanalysis system and for this pur-pose a sampler was developed
Figure 1 shows the complete set-up and figure 2 shows detail of the gas sampler
carbon dioxide Determination of sulphur compounds in
r complex GCMS problemsCustomized solutions fo
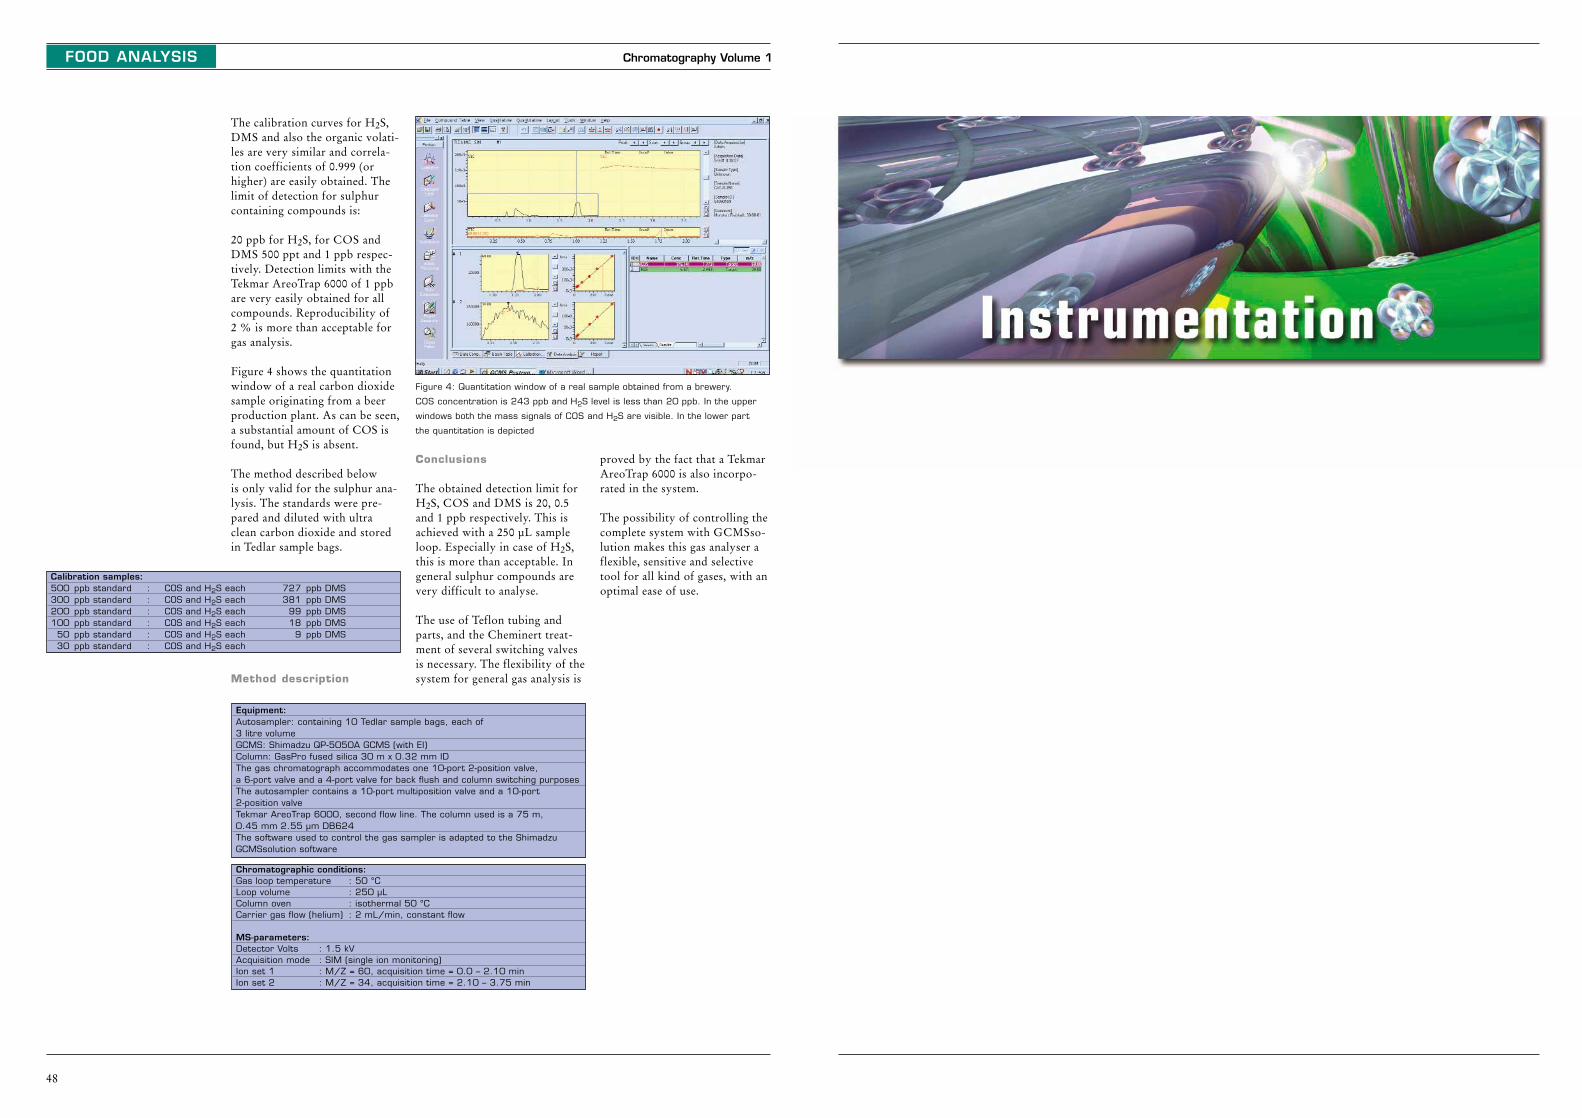
FOOD ANALYSIS
The calibration curves for H2S,DMS and also the organic volati-les are very similar and correla-tion coefficients of 0.999 (orhigher) are easily obtained. Thelimit of detection for sulphurcontaining compounds is:
20 ppb for H2S, for COS andDMS 500 ppt and 1 ppb respec-tively. Detection limits with theTekmar AreoTrap 6000 of 1 ppbare very easily obtained for allcompounds. Reproducibility of 2 % is more than acceptable forgas analysis.
Figure 4 shows the quantitationwindow of a real carbon dioxidesample originating from a beerproduction plant. As can be seen,a substantial amount of COS isfound, but H2S is absent.
The method described below is only valid for the sulphur ana-lysis. The standards were pre-pared and diluted with ultraclean carbon dioxide and storedin Tedlar sample bags.
Method description
Conclusions
The obtained detection limit forH2S, COS and DMS is 20, 0.5and 1 ppb respectively. This isachieved with a 250 µL sampleloop. Especially in case of H2S,this is more than acceptable. Ingeneral sulphur compounds arevery difficult to analyse.
The use of Teflon tubing andparts, and the Cheminert treat-ment of several switching valvesis necessary. The flexibility of thesystem for general gas analysis is
Chromatography Volume 1
48
Calibration samples:500 ppb standard : COS and H2S each 727 ppb DMS300 ppb standard : COS and H2S each 381 ppb DMS200 ppb standard : COS and H2S each 99 ppb DMS100 ppb standard : COS and H2S each 18 ppb DMS
50 ppb standard : COS and H2S each 9 ppb DMS30 ppb standard : COS and H2S each
Figure 4: Quantitation window of a real sample obtained from a brewery.
COS concentration is 243 ppb and H2S level is less than 20 ppb. In the upper
windows both the mass signals of COS and H2S are visible. In the lower part
the quantitation is depicted
Chromatographic conditions:Gas loop temperature : 50 °CLoop volume : 250 µLColumn oven : isothermal 50 °C Carrier gas flow (helium) : 2 mL/min, constant flow
MS-parameters:Detector Volts : 1.5 kVAcquisition mode : SIM (single ion monitoring)Ion set 1 : M/Z = 60, acquisition time = 0.0 – 2.10 minIon set 2 : M/Z = 34, acquisition time = 2.10 – 3.75 min
Equipment:Autosampler: containing 10 Tedlar sample bags, each of 3 litre volumeGCMS: Shimadzu QP-5050A GCMS (with EI)Column: GasPro fused silica 30 m x 0.32 mm ID The gas chromatograph accommodates one 10-port 2-position valve, a 6-port valve and a 4-port valve for back flush and column switching purposesThe autosampler contains a 10-port multiposition valve and a 10-port 2-position valveTekmar AreoTrap 6000, second flow line. The column used is a 75 m, 0.45 mm 2.55 µm DB624The software used to control the gas sampler is adapted to the ShimadzuGCMSsolution software
proved by the fact that a TekmarAreoTrap 6000 is also incorpo-rated in the system.
The possibility of controlling thecomplete system with GCMSso-lution makes this gas analyser aflexible, sensitive and selectivetool for all kind of gases, with anoptimal ease of use.
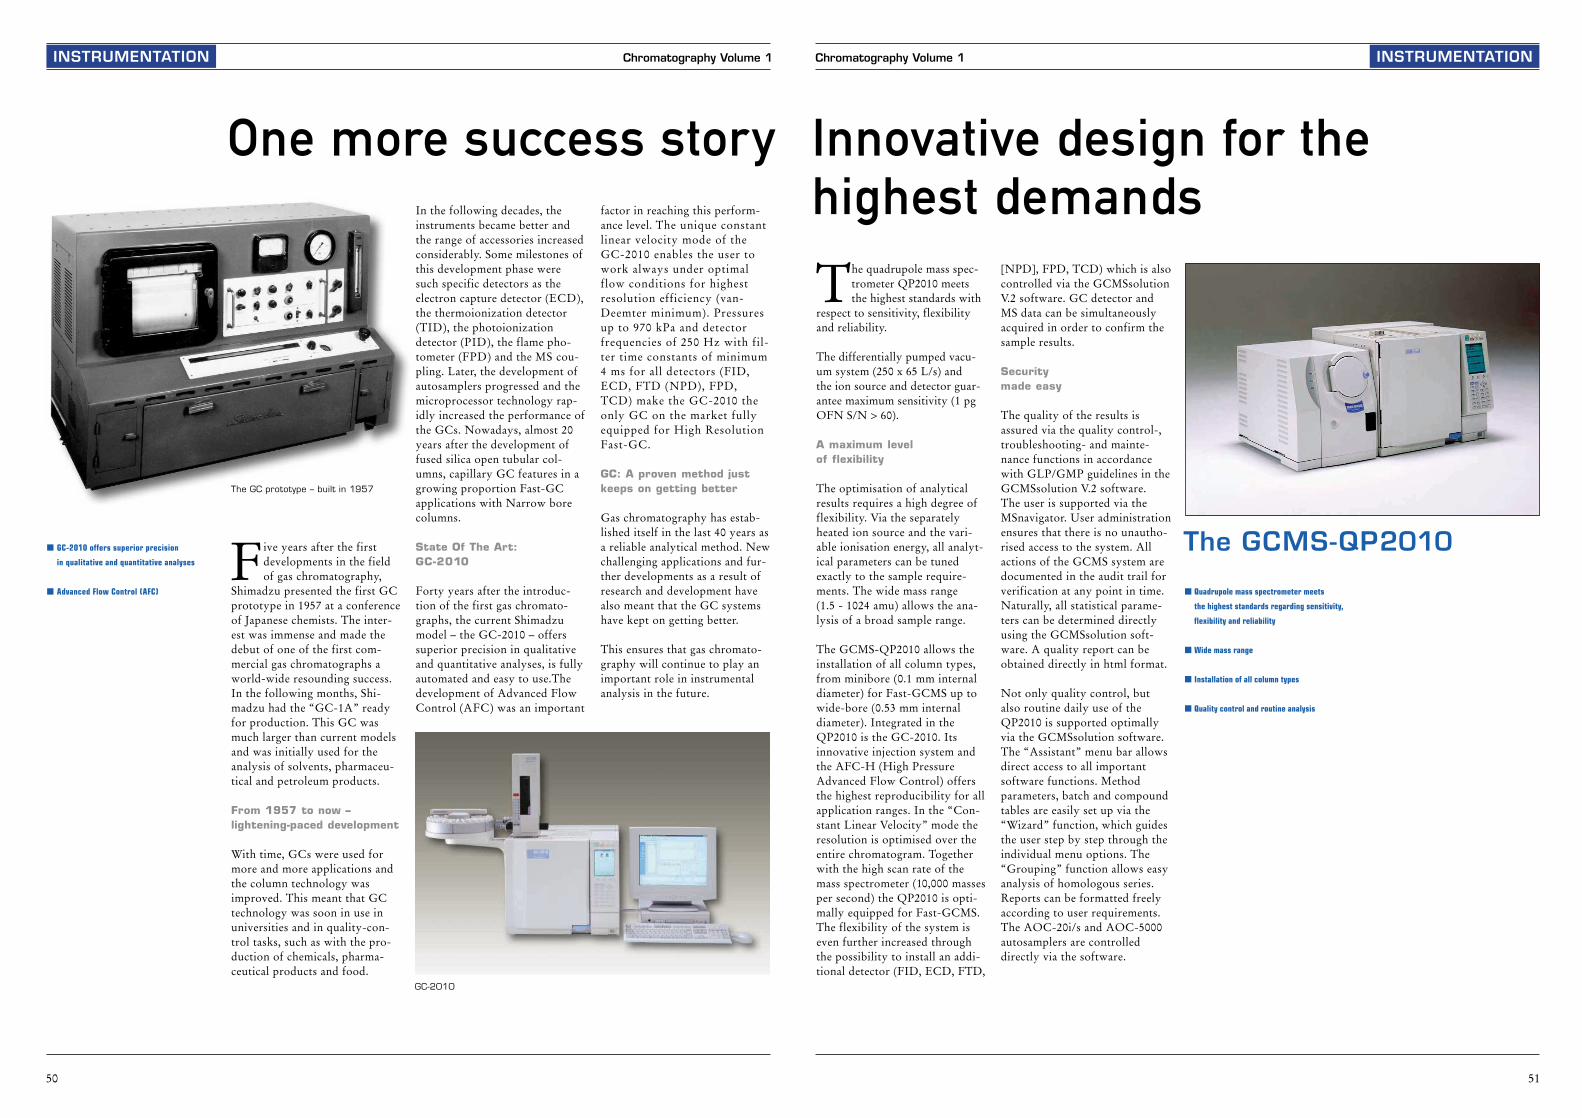
51
Chromatography Volume 1 INSTRUMENTATION
Innovative design for the highest demands
The GCMS-QP2010
The quadrupole mass spec-trometer QP2010 meetsthe highest standards with
respect to sensitivity, flexibilityand reliability.
The differentially pumped vacu-um system (250 x 65 L/s) and the ion source and detector guar-antee maximum sensitivity (1 pgOFN S/N > 60).
A maximum level of flexibility
The optimisation of analytical results requires a high degree offlexibility. Via the separatelyheated ion source and the vari-able ionisation energy, all analyt-ical parameters can be tunedexactly to the sample require-ments. The wide mass range (1.5 - 1024 amu) allows the ana-lysis of a broad sample range.
The GCMS-QP2010 allows theinstallation of all column types,from minibore (0.1 mm internaldiameter) for Fast-GCMS up towide-bore (0.53 mm internaldiameter). Integrated in the QP2010 is the GC-2010. Itsinnovative injection system andthe AFC-H (High PressureAdvanced Flow Control) offersthe highest reproducibility for allapplication ranges. In the “Con-stant Linear Velocity” mode theresolution is optimised over theentire chromatogram. Togetherwith the high scan rate of themass spectrometer (10,000 massesper second) the QP2010 is opti-mally equipped for Fast-GCMS.The flexibility of the system iseven further increased throughthe possibility to install an addi-tional detector (FID, ECD, FTD,
[NPD], FPD, TCD) which is alsocontrolled via the GCMSsolutionV.2 software. GC detector andMS data can be simultaneouslyacquired in order to confirm thesample results.
Security made easy
The quality of the results is assured via the quality control-,troubleshooting- and mainte-nance functions in accordancewith GLP/GMP guidelines in theGCMSsolution V.2 software. The user is supported via theMSnavigator. User administrationensures that there is no unautho-rised access to the system. All actions of the GCMS system aredocumented in the audit trail forverification at any point in time.Naturally, all statistical parame-ters can be determined directlyusing the GCMSsolution soft-ware. A quality report can be obtained directly in html format.
Not only quality control, butalso routine daily use of the QP2010 is supported optimallyvia the GCMSsolution software.The “Assistant” menu bar allows direct access to all importantsoftware functions. Methodparameters, batch and compoundtables are easily set up via the“Wizard” function, which guidesthe user step by step through theindividual menu options. The“Grouping” function allows easyanalysis of homologous series.Reports can be formatted freelyaccording to user requirements.The AOC-20i/s and AOC-5000autosamplers are controlleddirectly via the software.
� Quadrupole mass spectrometer meets
the highest standards regarding sensitivity,
flexibility and reliability
� Wide mass range
� Installation of all column types
� Quality control and routine analysis
INSTRUMENTATION
Five years after the firstdevelopments in the fieldof gas chromatography,
Shimadzu presented the first GCprototype in 1957 at a conferenceof Japanese chemists. The inter-est was immense and made thedebut of one of the first com-mercial gas chromatographs aworld-wide resounding success.In the following months, Shi-madzu had the “GC-1A” readyfor production. This GC wasmuch larger than current modelsand was initially used for theanalysis of solvents, pharmaceu-tical and petroleum products.
From 1957 to now – lightening-paced development
With time, GCs were used formore and more applications andthe column technology wasimproved. This meant that GCtechnology was soon in use inuniversities and in quality-con-trol tasks, such as with the pro-duction of chemicals, pharma-ceutical products and food.
In the following decades, theinstruments became better andthe range of accessories increasedconsiderably. Some milestones ofthis development phase weresuch specific detectors as theelectron capture detector (ECD),the thermoionization detector(TID), the photoionizationdetector (PID), the flame pho-tometer (FPD) and the MS cou-pling. Later, the development ofautosamplers progressed and themicroprocessor technology rap-idly increased the performance ofthe GCs. Nowadays, almost 20years after the development offused silica open tubular col-umns, capillary GC features in agrowing proportion Fast-GCapplications with Narrow borecolumns.
State Of The Art: GC-2010
Forty years after the introduc-tion of the first gas chromato-graphs, the current Shimadzumodel – the GC-2010 – offerssuperior precision in qualitativeand quantitative analyses, is fullyautomated and easy to use.Thedevelopment of Advanced FlowControl (AFC) was an important
factor in reaching this perform-ance level. The unique constantlinear velocity mode of theGC-2010 enables the user towork always under optimalflow conditions for highestresolution efficiency (van-Deemter minimum). Pressuresup to 970 kPa and detectorfrequencies of 250 Hz with fil-ter time constants of minimum4 ms for all detectors (FID,ECD, FTD (NPD), FPD,TCD) make the GC-2010 theonly GC on the market fullyequipped for High ResolutionFast-GC.
GC: A proven method justkeeps on getting better
Gas chromatography has estab-lished itself in the last 40 years asa reliable analytical method. Newchallenging applications and fur-ther developments as a result ofresearch and development havealso meant that the GC systemshave kept on getting better.
This ensures that gas chromato-graphy will continue to play animportant role in instrumentalanalysis in the future.
Chromatography Volume 1
50
One more success story
The GC prototype – built in 1957
GC-2010
� GC-2010 offers superior precision
in qualitative and quantitative analyses
� Advanced Flow Control (AFC)

INSTRUMENTATION
53
Chromatography Volume 1
� Versatile injection tool
� Perfect for applications where sensitivity
is key issue
� Software for easy operation
The Optic 3 injector is aversatile tool for the Shimadzu GC and GCMS
product range. It can be operatedwith split, splitless, on-column/AT-Column, DTD (Thermodes-orption)/DMI (Difficult MatrixIntroduction) and large-volumeinjections.
The designed software makes iteasy to operate. The injectorshows no discrimination and low
thermal degradation of the sam-ple.
By cooling the Optic 3 injector,compounds which would nor-mally degrade in a hot injectionport, e.g. thermally labile pesti-cides as well as highly volatilecompounds, can be analysedwithout any difficulty. The tem-perature range of the Optic 3 isfrom ambient temperature + 10 °C to 600 °C (optionallybetween – 150 °C and 600 °C),making it very flexible.
A large array of liners is availablefor the Optic 3, which are easy tochange, giving the user the choicefor every application.
The application of large-volumeinjection leads to better detectionlimits and can be used in allapplication fields where sensitivi-ty is the key issue, e.g. environ-mental or food analysis.
In addition the Optic 3 can beused for Thermodesorption ana-lysis (DTD). It is also ideal forsamples containing active and/orhigh boiling point compounds.Optionally available µ-vials, tobe inserted inside the liner, allowthe analysis of compoundsdirectly from solid or heavilymatrix loaded samples (DMI).
Cooled PTVinjector Optic 3Enhanced applications for GC and GCMS range
GC injection system Optic 3
INSTRUMENTATION Chromatography Volume 1
52
The GCMS-QP2010 with autosampler
AOC-5000
AOC-5000 is the highlyflexible sampler for GC/GCMS analysis. This
sampler combines liquid sam-pling, headspace- and solid-phasemicro-extraction (SPME) tech-nologies in one system. Chang-ing between the different sam-pling modes is surprisingly easy:a simple exchange of the syringemakes it a snap.
The design of the AOC-5000 isbased on a x-y-z robot arm. Thisarm moves rapidly and accurate-ly to samples, wash ports orincubator. The position of the
objects (injectors, trays, incuba-tor.) as well as the sampling stepscan be freely defined. In this way,parameters such as sucking andinjection velocity or the variableneedle-immersion depths in theinjector and sample vial can bespecified according to the appli-cation.
High productivity withmaximum accuracy
In the headspace mode, equili-bration- and syringe tempera-tures may be defined and flexiblyprogrammed. The syringe ispurged automatically with purepurge gas. The AOC-5000 canaccommodate up to 96 samplevials of 10 or 20 mL. Six posi-tions in the incubator allows par-allel processing of the ongoinganalysis with the equilibration(temperature + rotation in theincubator) of the next sample.
This feature guarantees high pro-ductivity at maximum analyticalaccuracy, due to the fact that thesample is only sucked when theanalysis of the previous sample iscompleted and the GC has re-turned to its “ready” status. Thistype of communication betweenthe GC and the sampler makes itpossible to install cryogenicfocussing of headspace samplesonto the column. Syringe sizesfrom 1 to 5 mL offer maximum
Handy helper for GC and GCMSThe autosampler AOC-5000
� Different sampling methods combined
in one system
� Productivity meets accuracy
� Large volume injection
flexibility for the assorted appli-cations.
Large volume injections
In the liquid mode, additionalsyringe rinses, using 2 differentsolvents, can be defined beforeand after the injection. The dif-ferent syringe sizes also allow awide range in injection volumesup to “large-volume injection”.The AOC-5000 can accommo-date up to 600 sample vials of 1 mL. The individual injectioncycles are correspondingly short,which is particulary importantfor “Fast-GC” applications.
Solid phase microextraction(SPME) has established itself asan alternative sample preparationmode for gas chromatography.This method reduces samplepreparation time and makes theuse of large amounts of solventunnecessary. During SPME thesample is adsorbed onto a sta-tionary phase on the SPME nee-dle and subsequently desorbed inthe GC injector. SPME increasesthe sensitivity through accumu-lation and is used in many appli-cations such as environmental-,forensic-, food- and pharmaceu-tical analysis.
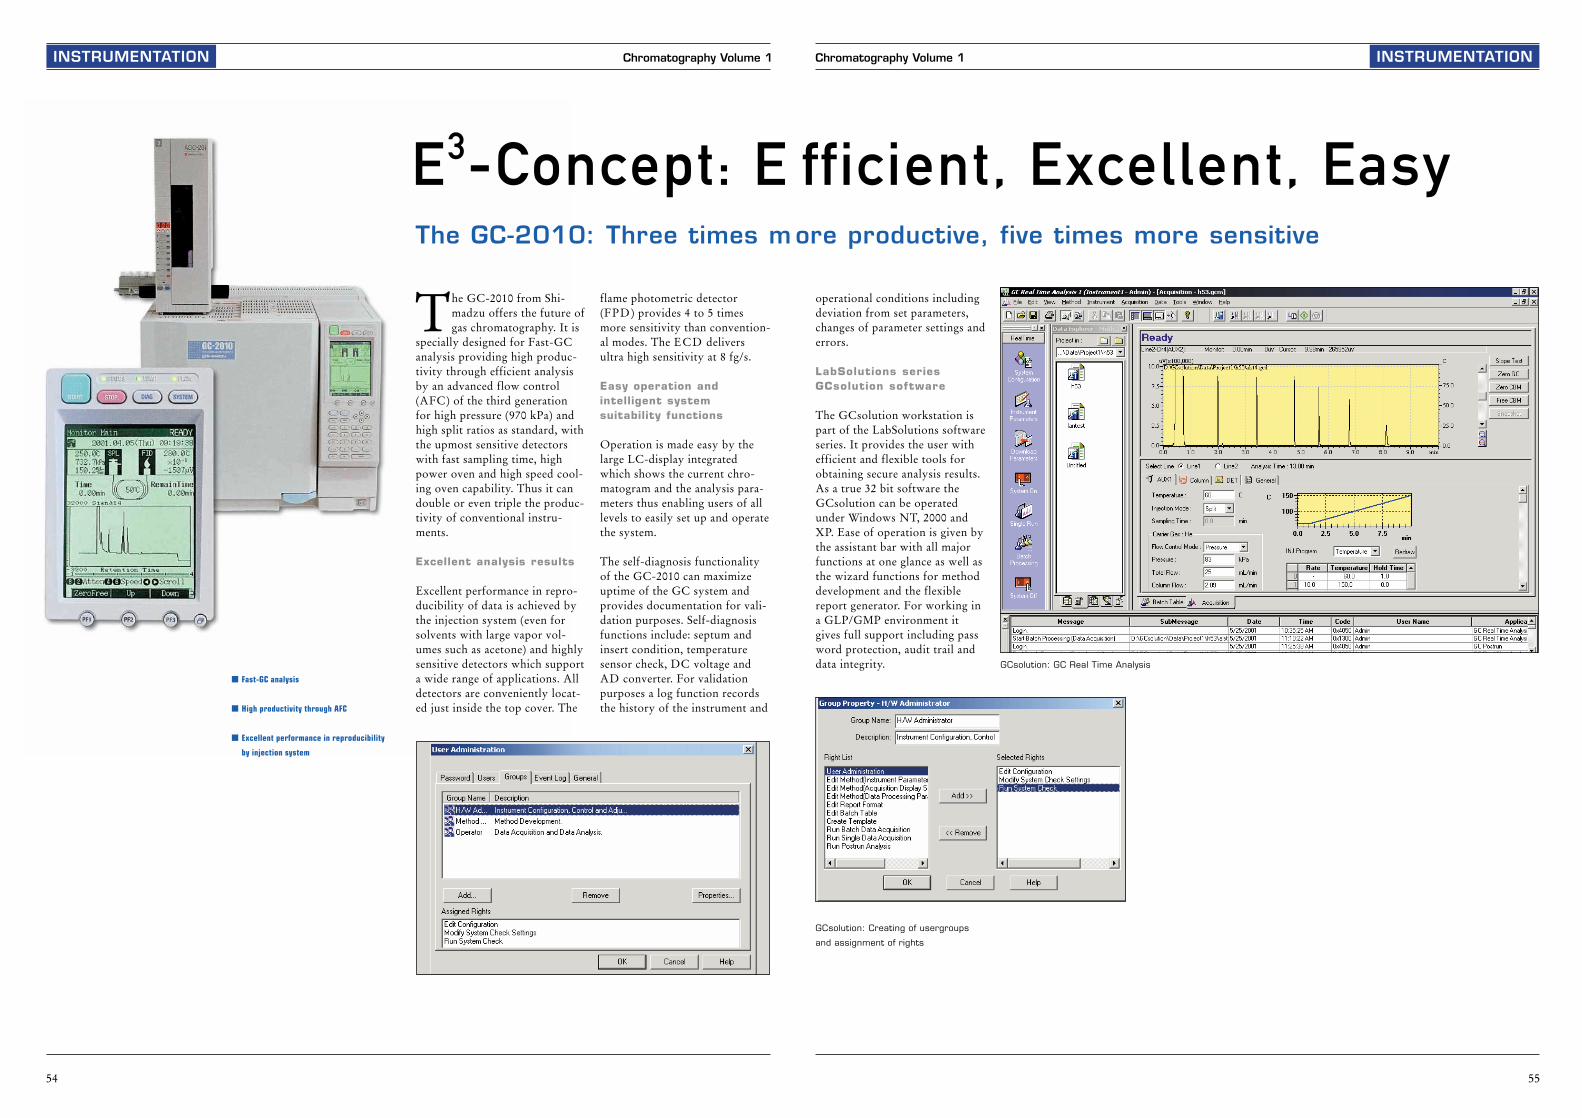
55
Chromatography Volume 1 INSTRUMENTATIONINSTRUMENTATION Chromatography Volume 1
54
fficient, Excellent, EasyE3-Concept: Eore productive, five times more sensitiveThe GC-2010: Three times m
The GC-2010 from Shi-madzu offers the future ofgas chromatography. It is
specially designed for Fast-GCanalysis providing high produc-tivity through efficient analysisby an advanced flow control(AFC) of the third generationfor high pressure (970 kPa) andhigh split ratios as standard, withthe upmost sensitive detectorswith fast sampling time, highpower oven and high speed cool-ing oven capability. Thus it candouble or even triple the produc-tivity of conventional instru-ments.
Excellent analysis results
Excellent performance in repro-ducibility of data is achieved bythe injection system (even forsolvents with large vapor vol-umes such as acetone) and highlysensitive detectors which supporta wide range of applications. Alldetectors are conveniently locat-ed just inside the top cover. The
flame photometric detector(FPD) provides 4 to 5 timesmore sensitivity than convention-al modes. The ECD deliversultra high sensitivity at 8 fg/s.
Easy operation and intelligent system suitability functions
Operation is made easy by thelarge LC-display integratedwhich shows the current chro-matogram and the analysis para-meters thus enabling users of alllevels to easily set up and operatethe system.
The self-diagnosis functionalityof the GC-2010 can maximizeuptime of the GC system andprovides documentation for vali-dation purposes. Self-diagnosisfunctions include: septum andinsert condition, temperaturesensor check, DC voltage andAD converter. For validationpurposes a log function recordsthe history of the instrument and
operational conditions includingdeviation from set parameters,changes of parameter settings anderrors.
LabSolutions seriesGCsolution software
The GCsolution workstation ispart of the LabSolutions softwareseries. It provides the user withefficient and flexible tools forobtaining secure analysis results.As a true 32 bit software theGCsolution can be operatedunder Windows NT, 2000 andXP. Ease of operation is given bythe assistant bar with all majorfunctions at one glance as well asthe wizard functions for methoddevelopment and the flexiblereport generator. For working ina GLP/GMP environment itgives full support including password protection, audit trail anddata integrity. GCsolution: GC Real Time Analysis
GCsolution: Creating of usergroups
and assignment of rights
� Fast-GC analysis
� High productivity through AFC
� Excellent performance in reproducibility
by injection system

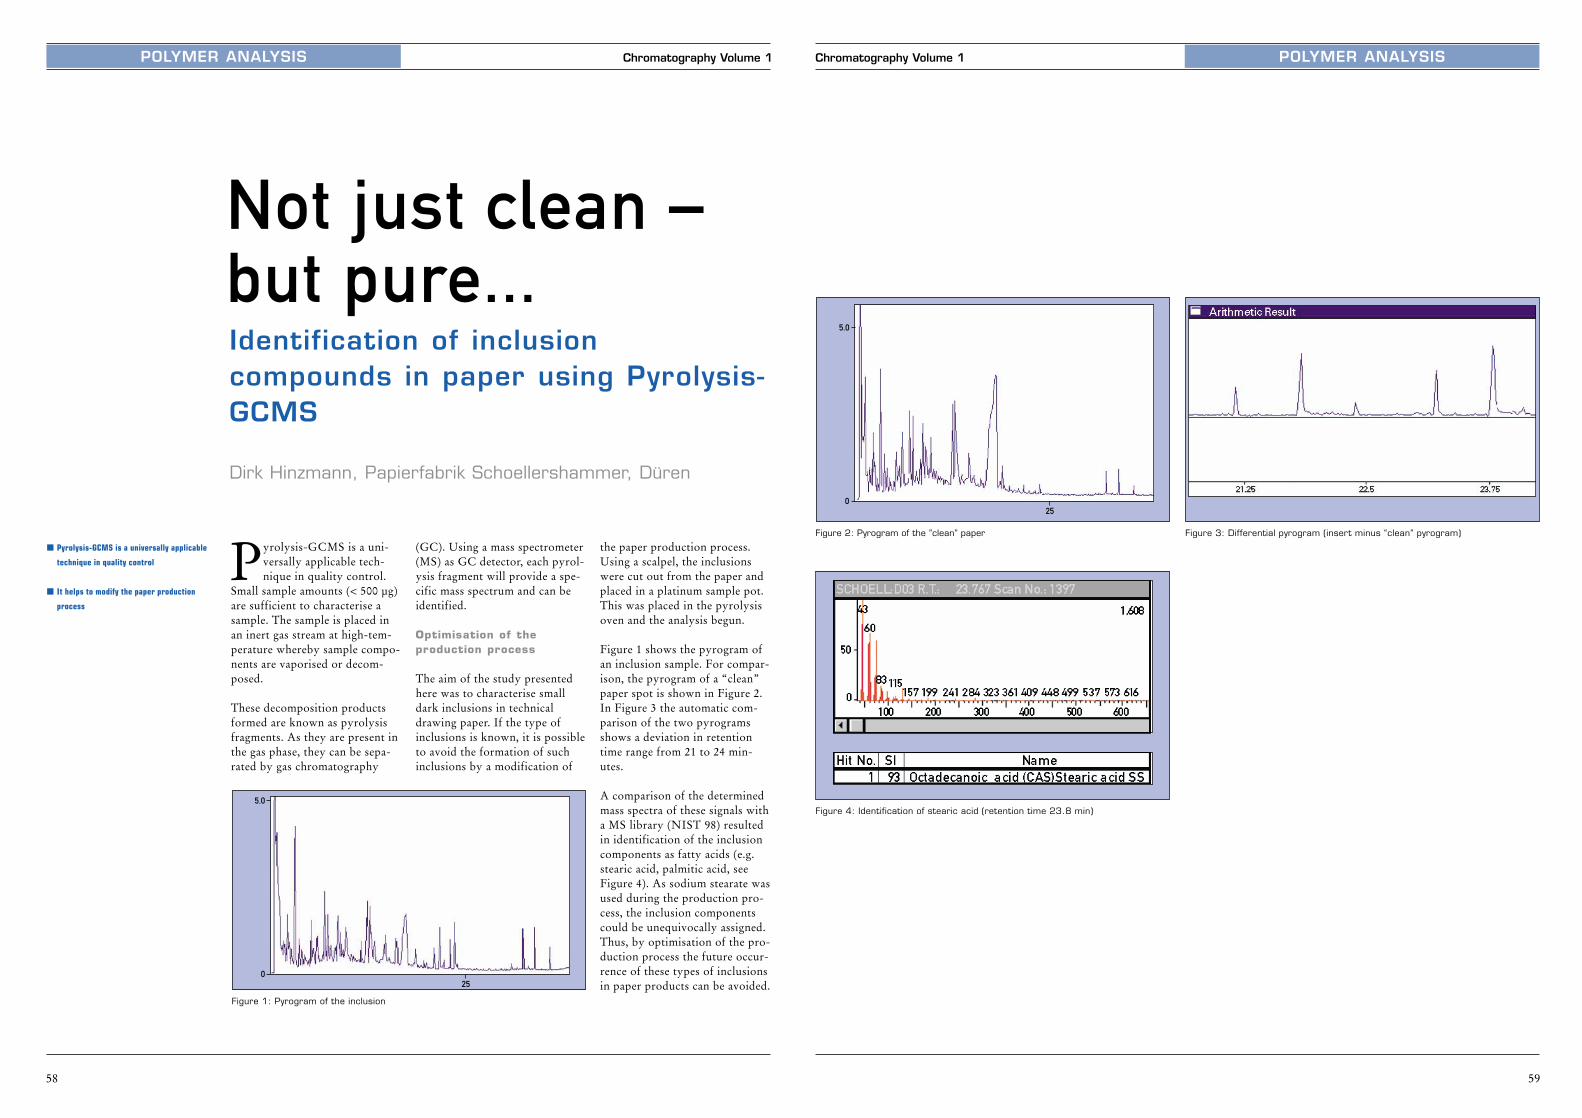
POLYMER ANALYSIS
59
Chromatography Volume 1
25
5.0
0
Figure 2: Pyrogram of the ”clean” paper Figure 3: Differential pyrogram (insert minus “clean” pyrogram)
Figure 4: Identification of stearic acid (retention time 23.8 min)
POLYMER ANALYSIS
Pyrolysis-GCMS is a uni-versally applicable tech-nique in quality control.
Small sample amounts (< 500 µg)are sufficient to characterise asample. The sample is placed inan inert gas stream at high-tem-perature whereby sample compo-nents are vaporised or decom-posed.
These decomposition productsformed are known as pyrolysisfragments. As they are present inthe gas phase, they can be sepa-rated by gas chromatography
(GC). Using a mass spectrometer(MS) as GC detector, each pyrol-ysis fragment will provide a spe-cific mass spectrum and can beidentified.
Optimisation of the production process
The aim of the study presentedhere was to characterise smalldark inclusions in technicaldrawing paper. If the type ofinclusions is known, it is possibleto avoid the formation of suchinclusions by a modification of
Chromatography Volume 1
58
Not just clean – but pure...
25
5.0
0
Identification of inclusion compounds in paper using Pyrolysis-GCMS
Dirk Hinzmann, Papierfabrik Schoellershammer, Düren
Figure 1: Pyrogram of the inclusion
the paper production process.Using a scalpel, the inclusionswere cut out from the paper andplaced in a platinum sample pot.This was placed in the pyrolysisoven and the analysis begun.
Figure 1 shows the pyrogram ofan inclusion sample. For compar-ison, the pyrogram of a “clean”paper spot is shown in Figure 2.In Figure 3 the automatic com-parison of the two pyrogramsshows a deviation in retentiontime range from 21 to 24 min-utes.
A comparison of the determinedmass spectra of these signals witha MS library (NIST 98) resultedin identification of the inclusioncomponents as fatty acids (e.g.stearic acid, palmitic acid, seeFigure 4). As sodium stearate wasused during the production pro-cess, the inclusion componentscould be unequivocally assigned.Thus, by optimisation of the pro-duction process the future occur-rence of these types of inclusionsin paper products can be avoided.
� Pyrolysis-GCMS is a universally applicable
technique in quality control
� It helps to modify the paper production
process
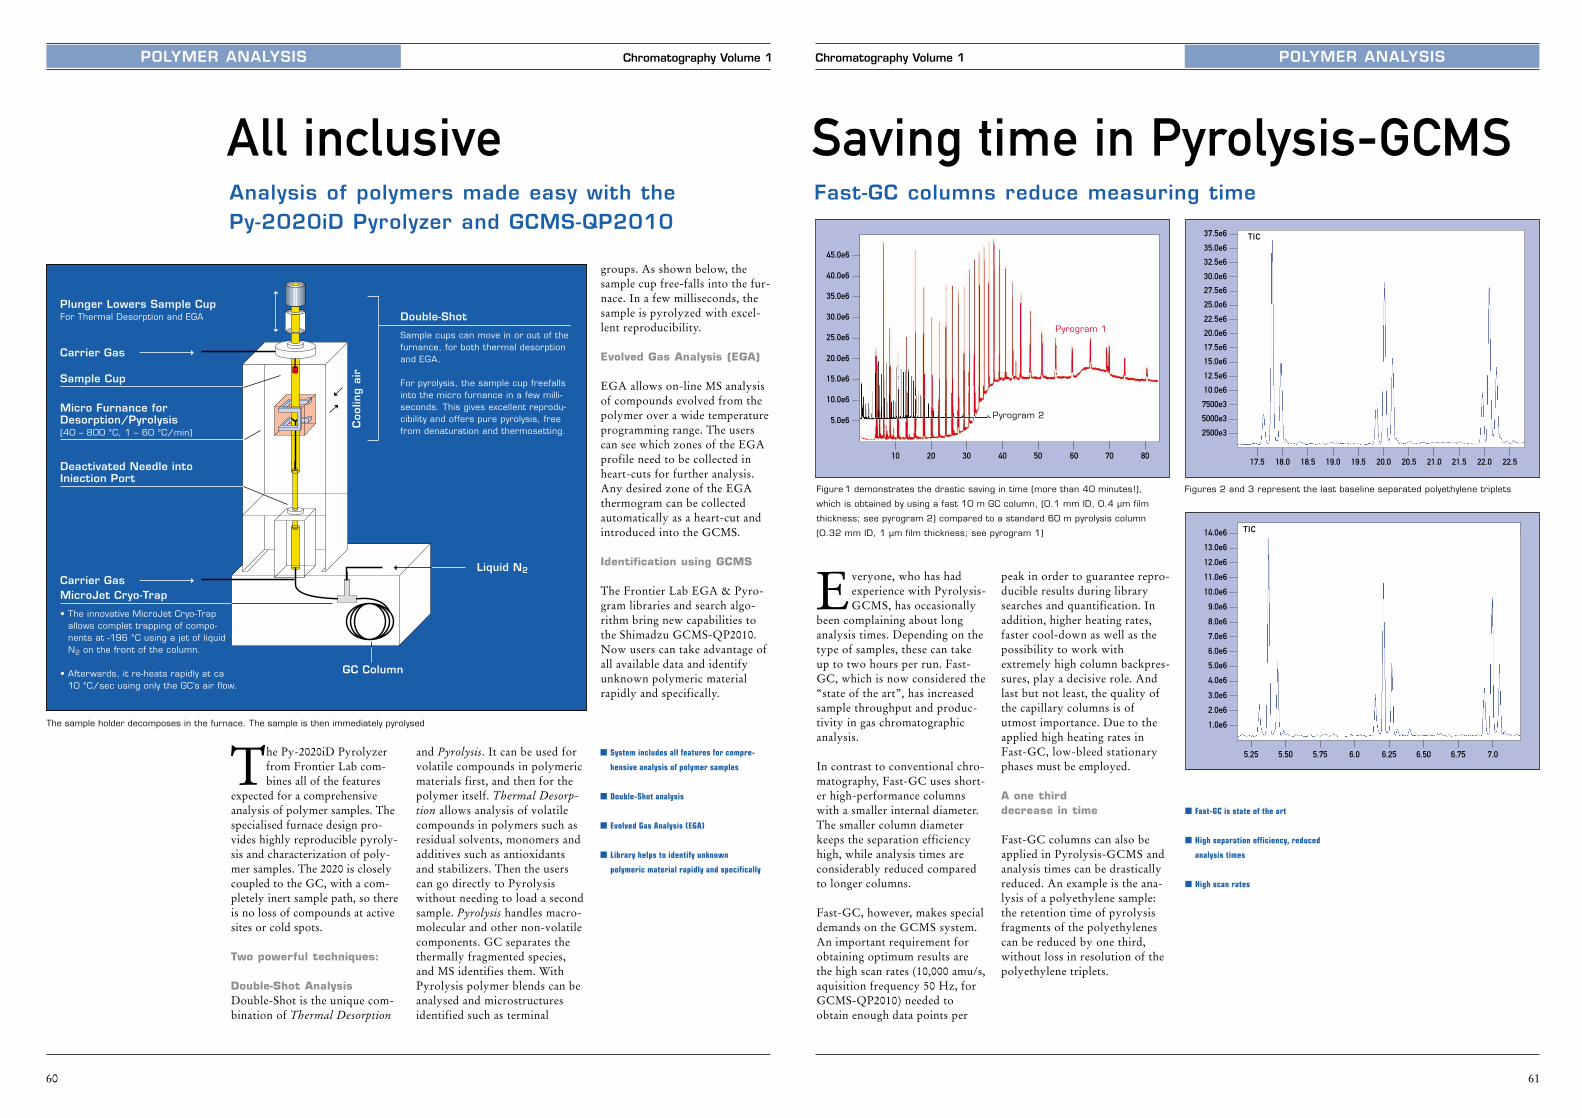
Chromatography Volume 1
60
POLYMER ANALYSIS POLYMER ANALYSIS
61
Chromatography Volume 1
Fast-GC columns reduce measuring time
Saving time in Pyrolysis-GCMS
45.0e6
40.0e6
35.0e6
30.0e6
25.0e6
20.0e6
10.0e6
15.0e6
5.0e6
10 20 30 40 50 60 70 80
37.5e6
35.0e6
32.5e6
30.0e6
27.5e6
25.0e6
22.5e6
20.0e6
17.5e6
15.0e6
12.5e6
10.0e6
7500e3
5000e3
2500e3
17.5 18.0 18.5 19.0 19.5 20.0 20.5 21.0 21.5 22.0 22.5
TIC
14.0e6
13.0e6
12.0e6
11.0e6
10.0e6
9.0e6
8.0e6
7.0e6
6.0e6
5.0e6
4.0e6
3.0e6
2.0e6
1.0e6
5.25 5.50 5.75 6.0 6.25 6.50 6.75 7.0
TIC
Figure 1 demonstrates the drastic saving in time (more than 40 minutes!),
which is obtained by using a fast 10 m GC column, (0.1 mm ID, 0.4 µm film
thickness; see pyrogram 2) compared to a standard 60 m pyrolysis column
(0.32 mm ID, 1 µm film thickness; see pyrogram 1)
Figures 2 and 3 represent the last baseline separated polyethylene triplets
Everyone, who has hadexperience with Pyrolysis-GCMS, has occasionally
been complaining about longanalysis times. Depending on thetype of samples, these can takeup to two hours per run. Fast-GC, which is now considered the“state of the art”, has increasedsample throughput and produc-tivity in gas chromatographicanalysis.
In contrast to conventional chro-matography, Fast-GC uses short-er high-performance columnswith a smaller internal diameter.The smaller column diameterkeeps the separation efficiencyhigh, while analysis times areconsiderably reduced comparedto longer columns.
Fast-GC, however, makes specialdemands on the GCMS system.An important requirement forobtaining optimum results arethe high scan rates (10,000 amu/s,aquisition frequency 50 Hz, forGCMS-QP2010) needed toobtain enough data points per
peak in order to guarantee repro-ducible results during librarysearches and quantification. Inaddition, higher heating rates,faster cool-down as well as thepossibility to work withextremely high column backpres-sures, play a decisive role. Andlast but not least, the quality ofthe capillary columns is ofutmost importance. Due to theapplied high heating rates inFast-GC, low-bleed stationaryphases must be employed.
A one third decrease in time
Fast-GC columns can also beapplied in Pyrolysis-GCMS andanalysis times can be drasticallyreduced. An example is the ana-lysis of a polyethylene sample:the retention time of pyrolysisfragments of the polyethylenescan be reduced by one third,without loss in resolution of thepolyethylene triplets.
Pyrogram 1
Pyrogram 2
� Fast-GC is state of the art
� High separation efficiency, reduced
analysis times
� High scan rates
Double-Shot
Sample cups can move in or out of thefurnance, for both thermal desorptionand EGA.
For pyrolysis, the sample cup freefallsinto the micro furnance in a few milli-seconds. This gives excellent reprodu-cibility and offers pure pyrolysis, freefrom denaturation and thermosetting.
MicroJet Cryo-Trap
• The innovative MicroJet Cryo-Trap allows complet trapping of compo-nents at -196 °C using a jet of liquid N2 on the front of the column.
• Afterwards, it re-heats rapidly at ca 10 °C/sec using only the GC’s air flow.
Plunger Lowers Sample CupFor Thermal Desorption and EGA
Carrier Gas
Sample Cup
Micro Furnance for Desorption/Pyrolysis(40 – 800 °C, 1 – 60 °C/min)
Deactivated Needle into Iniection Port
Carrier GasLiquid N2
Coo
ling a
ir
GC Column
groups. As shown below, thesample cup free-falls into the fur-nace. In a few milliseconds, thesample is pyrolyzed with excel-lent reproducibility.
Evolved Gas Analysis (EGA)
EGA allows on-line MS analysisof compounds evolved from thepolymer over a wide temperatureprogramming range. The userscan see which zones of the EGAprofile need to be collected inheart-cuts for further analysis.Any desired zone of the EGAthermogram can be collectedautomatically as a heart-cut andintroduced into the GCMS.
Identification using GCMS
The Frontier Lab EGA & Pyro-gram libraries and search algo-rithm bring new capabilities tothe Shimadzu GCMS-QP2010.Now users can take advantage ofall available data and identifyunknown polymeric materialrapidly and specifically.
All inclusive
The Py-2020iD Pyrolyzerfrom Frontier Lab com-bines all of the features
expected for a comprehensiveanalysis of polymer samples. Thespecialised furnace design pro-vides highly reproducible pyroly-sis and characterization of poly-mer samples. The 2020 is closelycoupled to the GC, with a com-pletely inert sample path, so thereis no loss of compounds at activesites or cold spots.
Two powerful techniques:
Double-Shot Analysis Double-Shot is the unique com-bination of Thermal Desorption
and Pyrolysis. It can be used forvolatile compounds in polymericmaterials first, and then for thepolymer itself. Thermal Desorp-tion allows analysis of volatilecompounds in polymers such asresidual solvents, monomers andadditives such as antioxidantsand stabilizers. Then the userscan go directly to Pyrolysiswithout needing to load a secondsample. Pyrolysis handles macro-molecular and other non-volatilecomponents. GC separates thethermally fragmented species,and MS identifies them. WithPyrolysis polymer blends can beanalysed and microstructuresidentified such as terminal
Analysis of polymers made easy with thePy-2020iD Pyrolyzer and GCMS-QP2010
The sample holder decomposes in the furnace. The sample is then immediately pyrolysed
� System includes all features for compre-
hensive analysis of polymer samples
� Double-Shot analysis
� Evolved Gas Analysis (EGA)
� Library helps to identify unknown
polymeric material rapidly and specifically
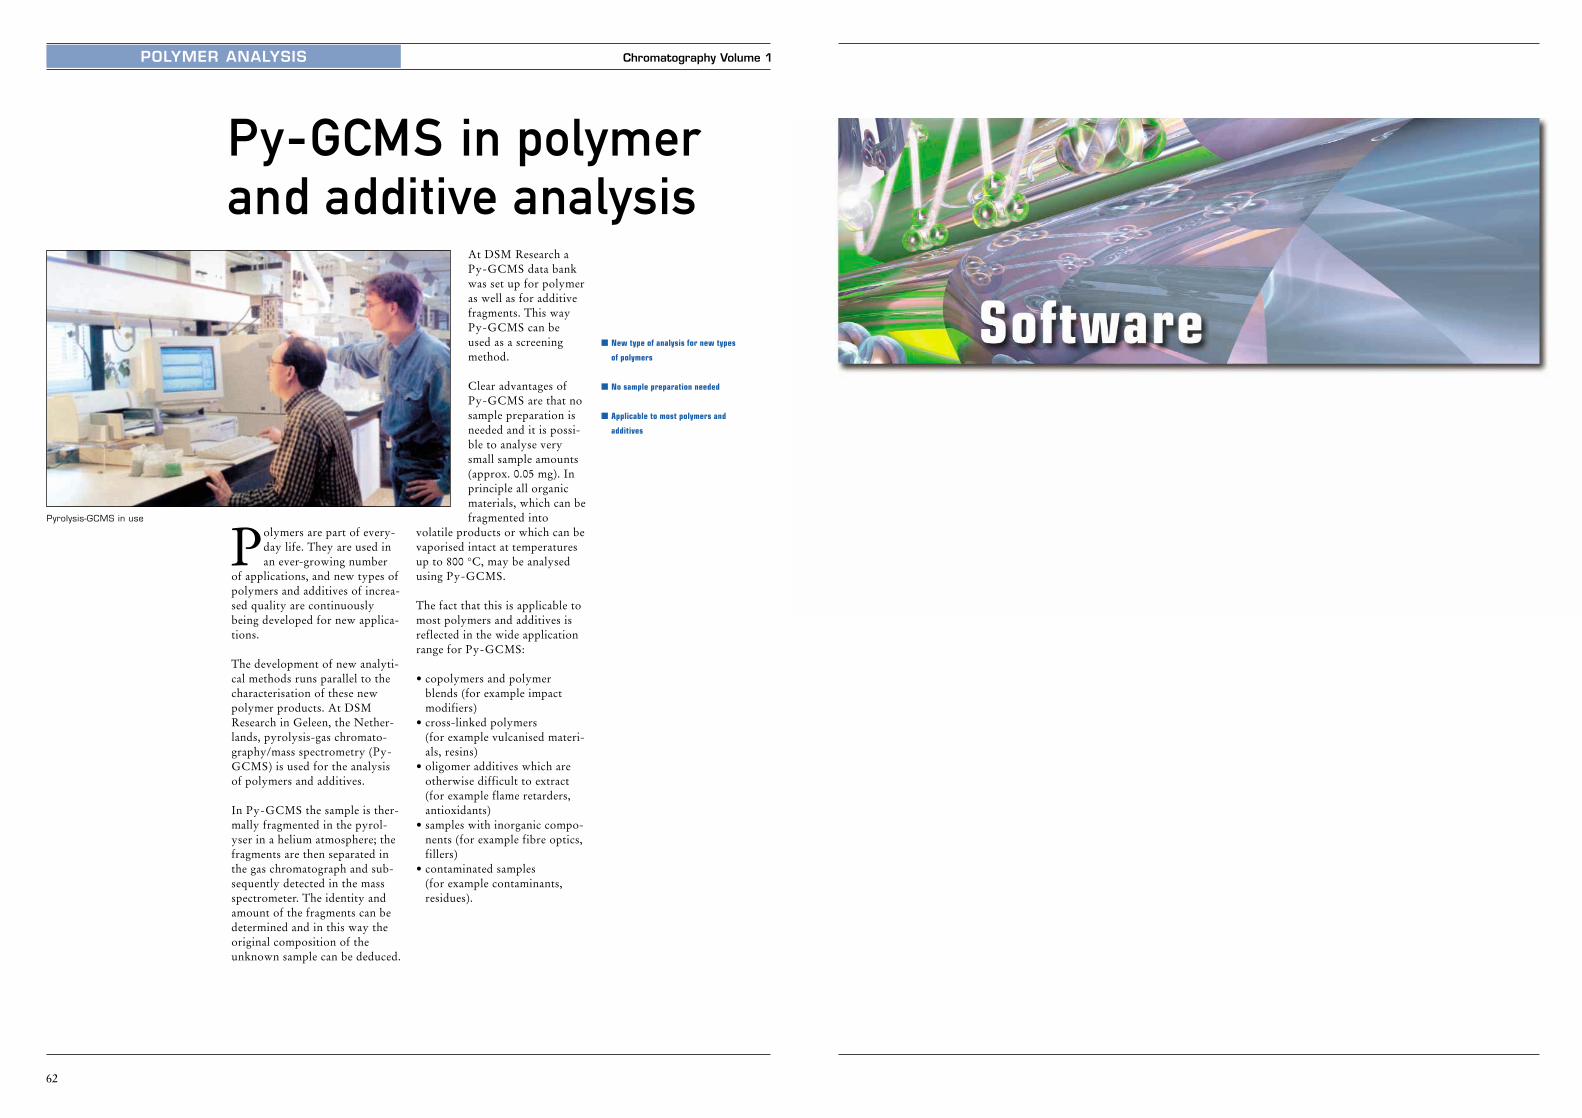
Chromatography Volume 1
62
POLYMER ANALYSIS
Polymers are part of every-day life. They are used inan ever-growing number
of applications, and new types ofpolymers and additives of increa-sed quality are continuouslybeing developed for new applica-tions.
The development of new analyti-cal methods runs parallel to thecharacterisation of these newpolymer products. At DSMResearch in Geleen, the Nether-lands, pyrolysis-gas chromato-graphy/mass spectrometry (Py-GCMS) is used for the analysisof polymers and additives.
In Py-GCMS the sample is ther-mally fragmented in the pyrol-yser in a helium atmosphere; thefragments are then separated inthe gas chromatograph and sub-sequently detected in the massspectrometer. The identity andamount of the fragments can bedetermined and in this way theoriginal composition of theunknown sample can be deduced.
Py-GCMS in polymer and additive analysis
At DSM Research aPy-GCMS data bankwas set up for polymeras well as for additivefragments. This wayPy-GCMS can beused as a screeningmethod.
Clear advantages ofPy-GCMS are that nosample preparation isneeded and it is possi-ble to analyse verysmall sample amounts(approx. 0.05 mg). Inprinciple all organicmaterials, which can befragmented into
volatile products or which can bevaporised intact at temperaturesup to 800 °C, may be analysedusing Py-GCMS.
The fact that this is applicable tomost polymers and additives isreflected in the wide applicationrange for Py-GCMS:
• copolymers and polymerblends (for example impactmodifiers)
• cross-linked polymers (for example vulcanised materi-als, resins)
• oligomer additives which areotherwise difficult to extract(for example flame retarders,antioxidants)
• samples with inorganic compo-nents (for example fibre optics,fillers)
• contaminated samples (for example contaminants,residues).
Pyrolysis-GCMS in use
� New type of analysis for new types
of polymers
� No sample preparation needed
� Applicable to most polymers and
additives
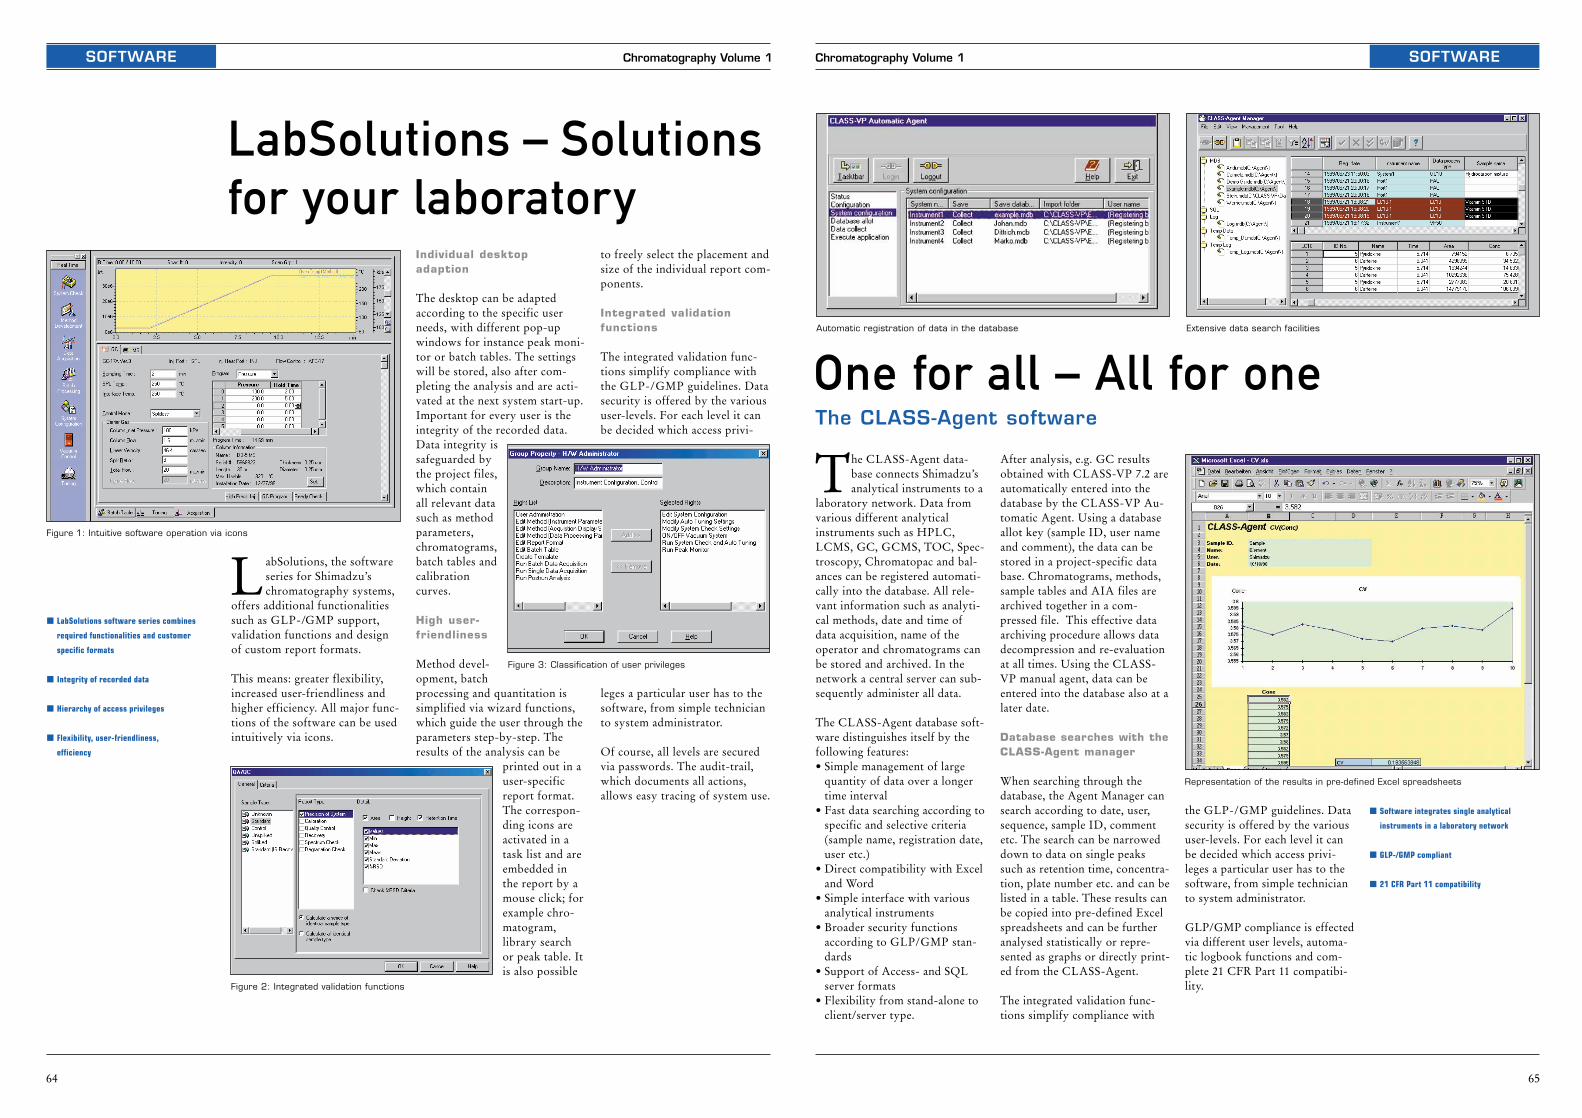
65
Chromatography Volume 1 SOFTWARE
One for all – All for one
The CLASS-Agent data-base connects Shimadzu’sanalytical instruments to a
laboratory network. Data fromvarious different analyticalinstruments such as HPLC,LCMS, GC, GCMS, TOC, Spec-troscopy, Chromatopac and bal-ances can be registered automati-cally into the database. All rele-vant information such as analyti-cal methods, date and time ofdata acquisition, name of theoperator and chromatograms canbe stored and archived. In thenetwork a central server can sub-sequently administer all data.
The CLASS-Agent database soft-ware distinguishes itself by thefollowing features:• Simple management of large
quantity of data over a longertime interval
• Fast data searching according tospecific and selective criteria(sample name, registration date,user etc.)
• Direct compatibility with Exceland Word
• Simple interface with variousanalytical instruments
• Broader security functionsaccording to GLP/GMP stan-dards
• Support of Access- and SQLserver formats
• Flexibility from stand-alone toclient/server type.
After analysis, e.g. GC resultsobtained with CLASS-VP 7.2 areautomatically entered into thedatabase by the CLASS-VP Au-tomatic Agent. Using a databaseallot key (sample ID, user nameand comment), the data can bestored in a project-specific database. Chromatograms, methods,sample tables and AIA files arearchived together in a com-pressed file. This effective dataarchiving procedure allows datadecompression and re-evaluationat all times. Using the CLASS-VP manual agent, data can beentered into the database also at alater date.
Database searches with theCLASS-Agent manager
When searching through thedatabase, the Agent Manager cansearch according to date, user,sequence, sample ID, commentetc. The search can be narroweddown to data on single peakssuch as retention time, concentra-tion, plate number etc. and can belisted in a table. These results canbe copied into pre-defined Excelspreadsheets and can be furtheranalysed statistically or repre-sented as graphs or directly print-ed from the CLASS-Agent.
The integrated validation func-tions simplify compliance with
the GLP-/GMP guidelines. Datasecurity is offered by the varioususer-levels. For each level it canbe decided which access privi-leges a particular user has to thesoftware, from simple technicianto system administrator.
GLP/GMP compliance is effectedvia different user levels, automa-tic logbook functions and com-plete 21 CFR Part 11 compatibi-lity.
The CLASS-Agent software
Automatic registration of data in the database Extensive data search facilities
Representation of the results in pre-defined Excel spreadsheets
� Software integrates single analytical
instruments in a laboratory network
� GLP-/GMP compliant
� 21 CFR Part 11 compatibility
SOFTWARE Chromatography Volume 1
64
LabSolutions – Solutions for your laboratory
Figure 1: Intuitive software operation via icons
LabSolutions, the softwareseries for Shimadzu’schromatography systems,
offers additional functionalitiessuch as GLP-/GMP support,validation functions and designof custom report formats.
This means: greater flexibility,increased user-friendliness andhigher efficiency. All major func-tions of the software can be usedintuitively via icons.
Individual desktop adaption
The desktop can be adaptedaccording to the specific userneeds, with different pop-upwindows for instance peak moni-tor or batch tables. The settingswill be stored, also after com-pleting the analysis and are acti-vated at the next system start-up.Important for every user is theintegrity of the recorded data.Data integrity issafeguarded bythe project files,which containall relevant datasuch as methodparameters,chromatograms,batch tables andcalibrationcurves.
High user-friendliness
Method devel-opment, batchprocessing and quantitation issimplified via wizard functions,which guide the user through theparameters step-by-step. Theresults of the analysis can be
printed out in auser-specificreport format.The correspon-ding icons areactivated in atask list and areembedded inthe report by amouse click; forexample chro-matogram,library searchor peak table. Itis also possible
to freely select the placement andsize of the individual report com-ponents.
Integrated validationfunctions
The integrated validation func-tions simplify compliance withthe GLP-/GMP guidelines. Datasecurity is offered by the varioususer-levels. For each level it canbe decided which access privi-
leges a particular user has to thesoftware, from simple technicianto system administrator.
Of course, all levels are securedvia passwords. The audit-trail,which documents all actions,allows easy tracing of system use.
� LabSolutions software series combines
required functionalities and customer
specific formats
� Integrity of recorded data
� Hierarchy of access privileges
� Flexibility, user-friendliness,
efficiency
Figure 2: Integrated validation functions
Figure 3: Classification of user privileges
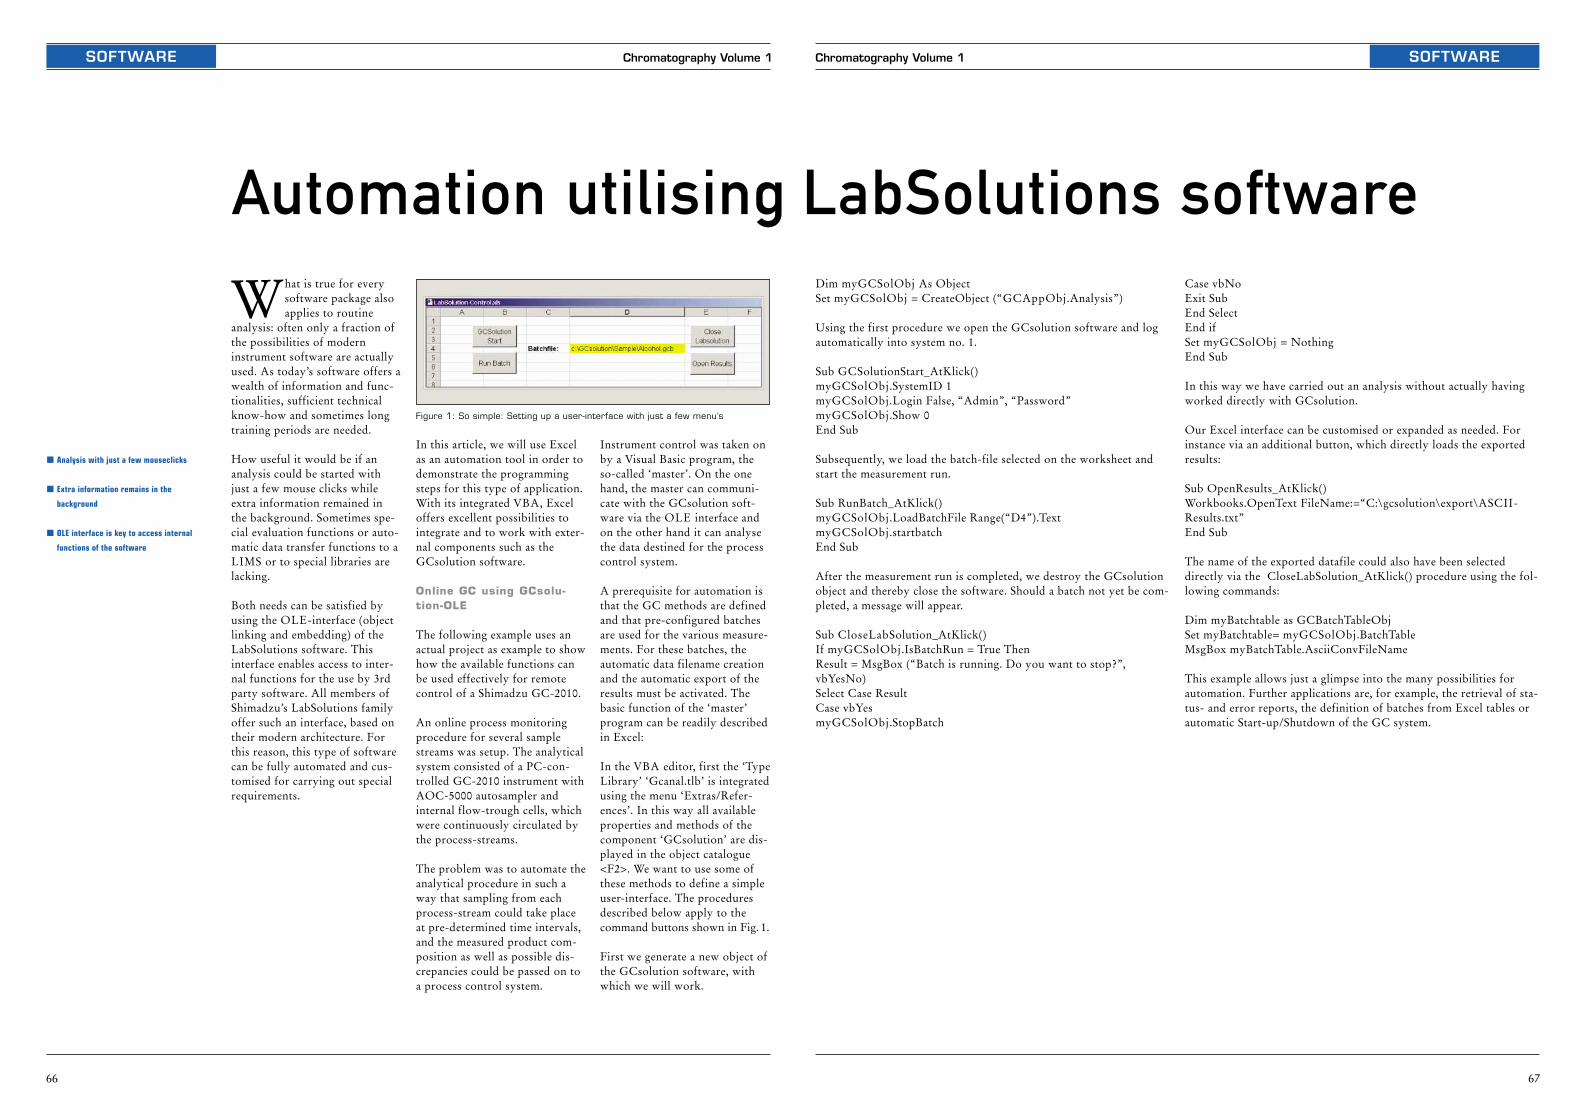
SOFTWARESOFTWARE Chromatography Volume 1
66
What is true for everysoftware package alsoapplies to routine
analysis: often only a fraction ofthe possibilities of moderninstrument software are actuallyused. As today’s software offers awealth of information and func-tionalities, sufficient technicalknow-how and sometimes longtraining periods are needed.
How useful it would be if ananalysis could be started withjust a few mouse clicks whileextra information remained inthe background. Sometimes spe-cial evaluation functions or auto-matic data transfer functions to aLIMS or to special libraries arelacking.
Both needs can be satisfied byusing the OLE-interface (objectlinking and embedding) of theLabSolutions software. Thisinterface enables access to inter-nal functions for the use by 3rdparty software. All members ofShimadzu’s LabSolutions familyoffer such an interface, based ontheir modern architecture. Forthis reason, this type of softwarecan be fully automated and cus-tomised for carrying out specialrequirements.
In this article, we will use Excelas an automation tool in order todemonstrate the programmingsteps for this type of application.With its integrated VBA, Exceloffers excellent possibilities tointegrate and to work with exter-nal components such as theGCsolution software.
Online GC using GCsolu-tion-OLE
The following example uses anactual project as example to showhow the available functions canbe used effectively for remotecontrol of a Shimadzu GC-2010.
An online process monitoringprocedure for several samplestreams was setup. The analyticalsystem consisted of a PC-con-trolled GC-2010 instrument withAOC-5000 autosampler andinternal flow-trough cells, whichwere continuously circulated bythe process-streams.
The problem was to automate theanalytical procedure in such away that sampling from eachprocess-stream could take placeat pre-determined time intervals,and the measured product com-position as well as possible dis-crepancies could be passed on toa process control system.
Figure 1: So simple: Setting up a user-interface with just a few menu’s
LabSolutions softwareAutomation utilising
67
Chromatography Volume 1
Instrument control was taken onby a Visual Basic program, theso-called ‘master’. On the onehand, the master can communi-cate with the GCsolution soft-ware via the OLE interface andon the other hand it can analysethe data destined for the processcontrol system.
A prerequisite for automation isthat the GC methods are definedand that pre-configured batchesare used for the various measure-ments. For these batches, theautomatic data filename creationand the automatic export of theresults must be activated. Thebasic function of the ‘master’program can be readily describedin Excel:
In the VBA editor, first the ‘TypeLibrary’ ‘Gcanal.tlb’ is integratedusing the menu ‘Extras/Refer-ences’. In this way all availableproperties and methods of thecomponent ‘GCsolution’ are dis-played in the object catalogue<F2>. We want to use some ofthese methods to define a simpleuser-interface. The proceduresdescribed below apply to thecommand buttons shown in Fig. 1.
First we generate a new object ofthe GCsolution software, withwhich we will work.
Dim myGCSolObj As Object Set myGCSolObj = CreateObject (“GCAppObj.Analysis”)
Using the first procedure we open the GCsolution software and logautomatically into system no. 1.
Sub GCSolutionStart_AtKlick()myGCSolObj.SystemID 1myGCSolObj.Login False, “Admin”, “Password”myGCSolObj.Show 0End Sub
Subsequently, we load the batch-file selected on the worksheet andstart the measurement run.
Sub RunBatch_AtKlick()myGCSolObj.LoadBatchFile Range(“D4”).TextmyGCSolObj.startbatchEnd Sub
After the measurement run is completed, we destroy the GCsolutionobject and thereby close the software. Should a batch not yet be com-pleted, a message will appear.
Sub CloseLabSolution_AtKlick()If myGCSolObj.IsBatchRun = True ThenResult = MsgBox (“Batch is running. Do you want to stop?”,vbYesNo)Select Case ResultCase vbYesmyGCSolObj.StopBatch
Case vbNoExit SubEnd SelectEnd ifSet myGCSolObj = NothingEnd Sub
In this way we have carried out an analysis without actually havingworked directly with GCsolution.
Our Excel interface can be customised or expanded as needed. Forinstance via an additional button, which directly loads the exportedresults:
Sub OpenResults_AtKlick()Workbooks.OpenText FileName:=“C:\gcsolution\export\ASCII-Results.txt”End Sub
The name of the exported datafile could also have been selecteddirectly via the CloseLabSolution_AtKlick() procedure using the fol-lowing commands:
Dim myBatchtable as GCBatchTableObjSet myBatchtable= myGCSolObj.BatchTableMsgBox myBatchTable.AsciiConvFileName
This example allows just a glimpse into the many possibilities forautomation. Further applications are, for example, the retrieval of sta-tus- and error reports, the definition of batches from Excel tables orautomatic Start-up/Shutdown of the GC system.
� Analysis with just a few mouseclicks
� Extra information remains in the
background
� OLE interface is key to access internal
functions of the software
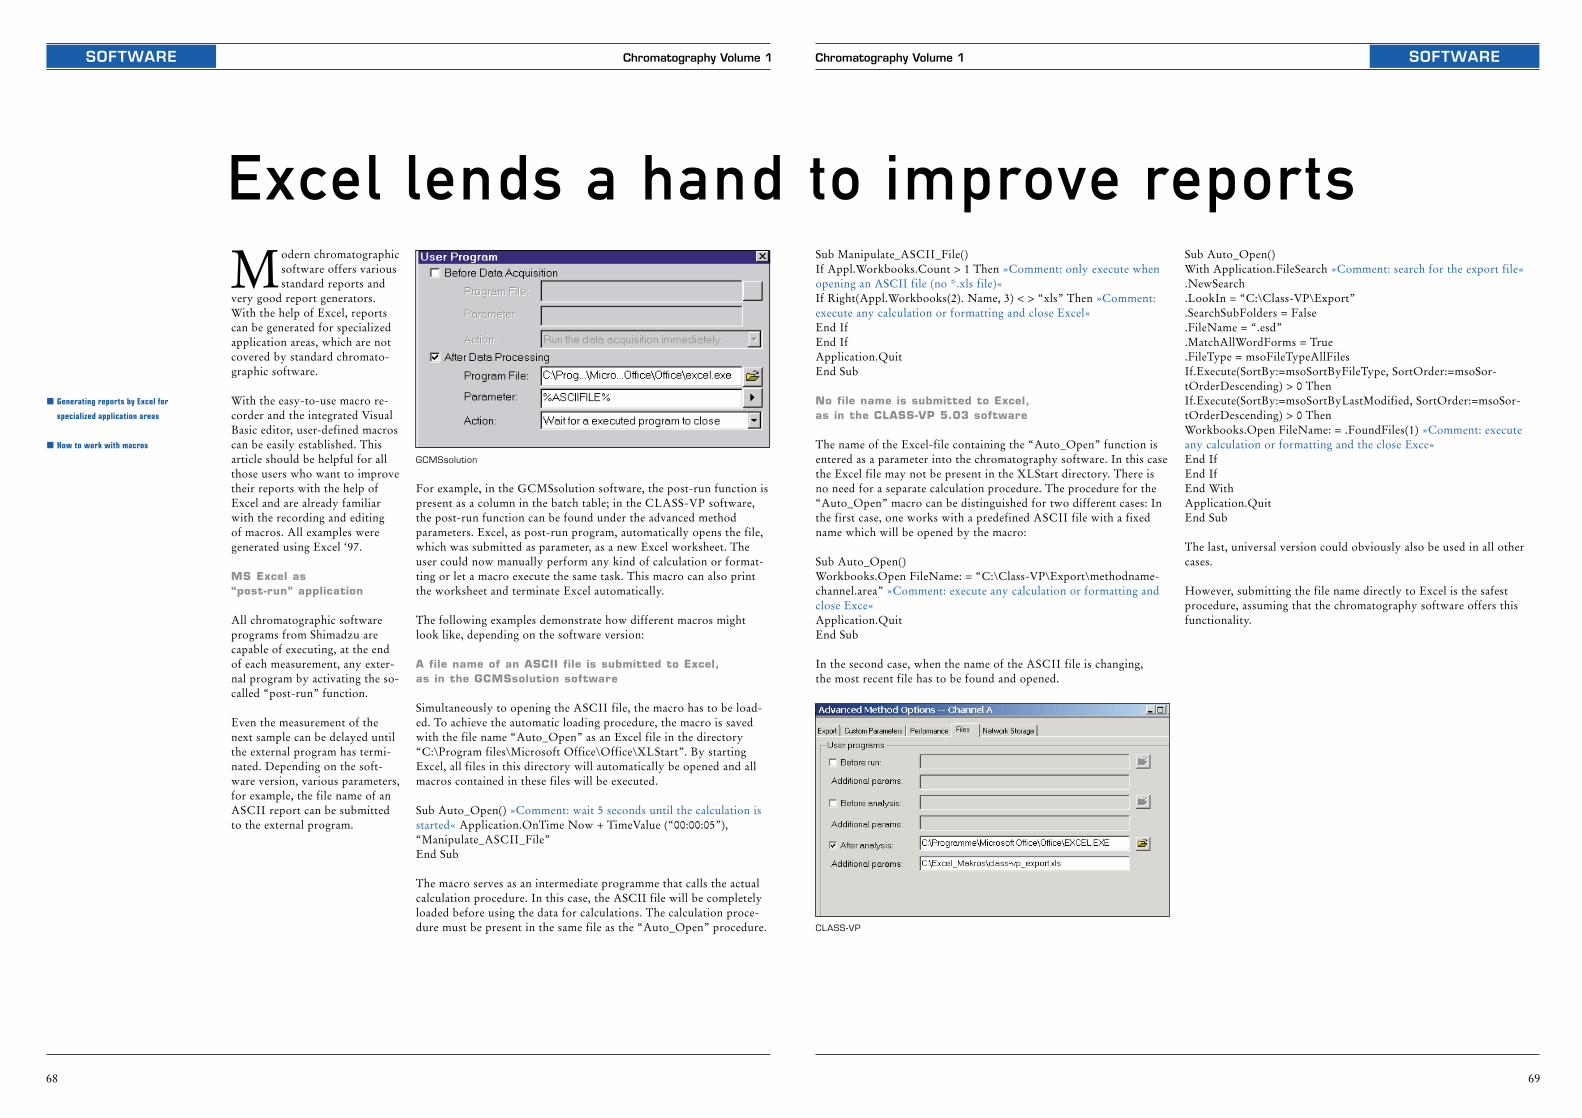
SOFTWARESOFTWARE
69
Chromatography Volume 1Chromatography Volume 1
68
Modern chromatographicsoftware offers variousstandard reports and
very good report generators.With the help of Excel, reportscan be generated for specializedapplication areas, which are notcovered by standard chromato-graphic software.
With the easy-to-use macro re-corder and the integrated VisualBasic editor, user-defined macroscan be easily established. Thisarticle should be helpful for allthose users who want to improvetheir reports with the help ofExcel and are already familiarwith the recording and editing of macros. All examples weregenerated using Excel ‘97.
MS Excel as “post-run” application
All chromatographic softwareprograms from Shimadzu arecapable of executing, at the endof each measurement, any exter-nal program by activating the so-called “post-run” function.
Even the measurement of thenext sample can be delayed untilthe external program has termi-nated. Depending on the soft-ware version, various parameters,for example, the file name of anASCII report can be submittedto the external program.
For example, in the GCMSsolution software, the post-run function ispresent as a column in the batch table; in the CLASS-VP software,the post-run function can be found under the advanced methodparameters. Excel, as post-run program, automatically opens the file,which was submitted as parameter, as a new Excel worksheet. Theuser could now manually perform any kind of calculation or format-ting or let a macro execute the same task. This macro can also printthe worksheet and terminate Excel automatically.
The following examples demonstrate how different macros mightlook like, depending on the software version:
A file name of an ASCII file is submitted to Excel, as in the GCMSsolution software
Simultaneously to opening the ASCII file, the macro has to be load-ed. To achieve the automatic loading procedure, the macro is savedwith the file name “Auto_Open” as an Excel file in the directory“C:\Program files\Microsoft Office\Office\XLStart”. By startingExcel, all files in this directory will automatically be opened and allmacros contained in these files will be executed.
Sub Auto_Open() »Comment: wait 5 seconds until the calculation isstarted« Application.OnTime Now + TimeValue (“00:00:05”),“Manipulate_ASCII_File”End Sub
The macro serves as an intermediate programme that calls the actualcalculation procedure. In this case, the ASCII file will be completelyloaded before using the data for calculations. The calculation proce-dure must be present in the same file as the “Auto_Open” procedure.
GCMSsolution
to improve reportsExcel lends a handSub Manipulate_ASCII_File()If Appl.Workbooks.Count > 1 Then »Comment: only execute whenopening an ASCII file (no *.xls file)«If Right(Appl.Workbooks(2). Name, 3) < > “xls” Then »Comment:execute any calculation or formatting and close Excel«End IfEnd IfApplication.QuitEnd Sub
No file name is submitted to Excel, as in the CLASS-VP 5.03 software
The name of the Excel-file containing the “Auto_Open” function isentered as a parameter into the chromatography software. In this casethe Excel file may not be present in the XLStart directory. There isno need for a separate calculation procedure. The procedure for the“Auto_Open” macro can be distinguished for two different cases: Inthe first case, one works with a predefined ASCII file with a fixedname which will be opened by the macro:
Sub Auto_Open()Workbooks.Open FileName: = “C:\Class-VP\Export\methodname-channel.area” »Comment: execute any calculation or formatting andclose Exce«Application.QuitEnd Sub
In the second case, when the name of the ASCII file is changing, the most recent file has to be found and opened.
Sub Auto_Open()With Application.FileSearch »Comment: search for the export file«.NewSearch.LookIn = “C:\Class-VP\Export”.SearchSubFolders = False.FileName = “.esd”.MatchAllWordForms = True.FileType = msoFileTypeAllFilesIf.Execute(SortBy:=msoSortByFileType, SortOrder:=msoSor-tOrderDescending) > 0 ThenIf.Execute(SortBy:=msoSortByLastModified, SortOrder:=msoSor-tOrderDescending) > 0 ThenWorkbooks.Open FileName: = .FoundFiles(1) »Comment: executeany calculation or formatting and the close Exce«End IfEnd IfEnd WithApplication.QuitEnd Sub
The last, universal version could obviously also be used in all othercases.
However, submitting the file name directly to Excel is the safest procedure, assuming that the chromatography software offers thisfunctionality.
� Generating reports by Excel for
specialized application areas
� How to work with macros
CLASS-VP
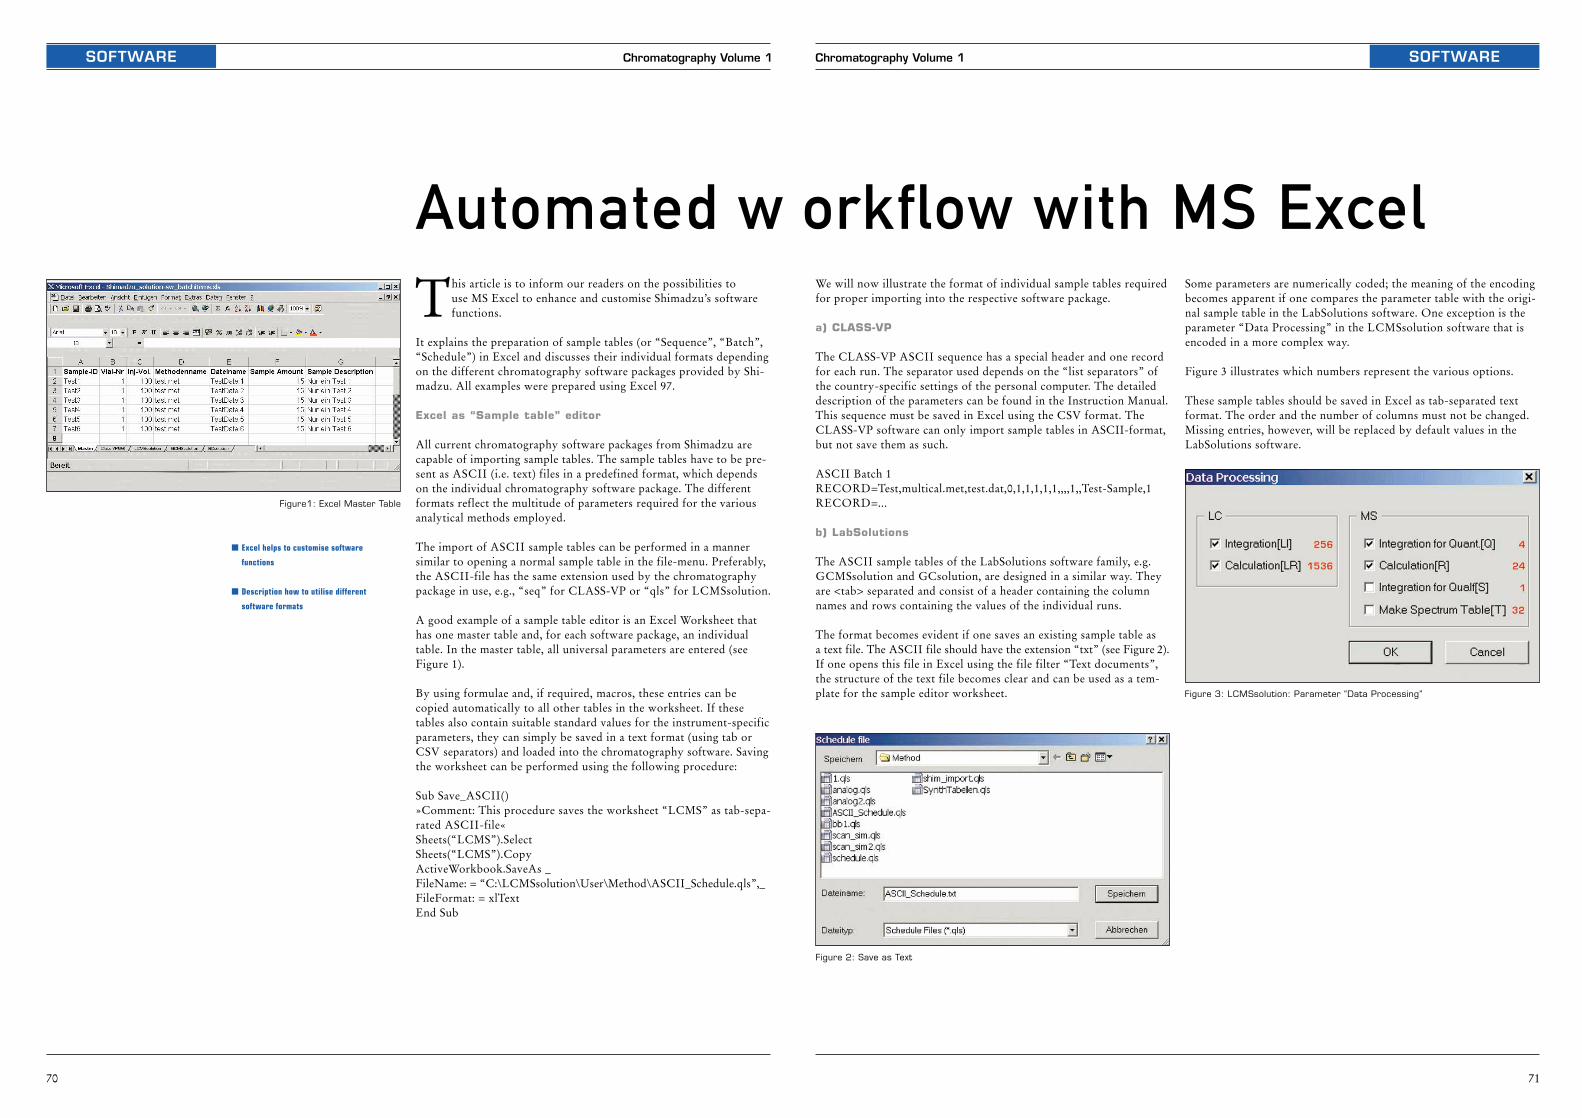
71
Chromatography Volume 1 SOFTWAREChromatography Volume 1
70
SOFTWARE
This article is to inform our readers on the possibilities to use MS Excel to enhance and customise Shimadzu’s softwarefunctions.
It explains the preparation of sample tables (or “Sequence”, “Batch”,“Schedule”) in Excel and discusses their individual formats dependingon the different chromatography software packages provided by Shi-madzu. All examples were prepared using Excel 97.
Excel as “Sample table” editor
All current chromatography software packages from Shimadzu arecapable of importing sample tables. The sample tables have to be pre-sent as ASCII (i.e. text) files in a predefined format, which dependson the individual chromatography software package. The differentformats reflect the multitude of parameters required for the variousanalytical methods employed.
The import of ASCII sample tables can be performed in a mannersimilar to opening a normal sample table in the file-menu. Preferably,the ASCII-file has the same extension used by the chromatographypackage in use, e.g., “seq” for CLASS-VP or “qls” for LCMSsolution.
A good example of a sample table editor is an Excel Worksheet thathas one master table and, for each software package, an individualtable. In the master table, all universal parameters are entered (seeFigure 1).
By using formulae and, if required, macros, these entries can becopied automatically to all other tables in the worksheet. If thesetables also contain suitable standard values for the instrument-specificparameters, they can simply be saved in a text format (using tab orCSV separators) and loaded into the chromatography software. Savingthe worksheet can be performed using the following procedure:
Sub Save_ASCII()»Comment: This procedure saves the worksheet “LCMS” as tab-sepa-rated ASCII-file«Sheets(“LCMS”).SelectSheets(“LCMS”).CopyActiveWorkbook.SaveAs _FileName: = “C:\LCMSsolution\User\Method\ASCII_Schedule.qls”,_FileFormat: = xlTextEnd Sub
We will now illustrate the format of individual sample tables requiredfor proper importing into the respective software package.
a) CLASS-VP
The CLASS-VP ASCII sequence has a special header and one recordfor each run. The separator used depends on the “list separators” ofthe country-specific settings of the personal computer. The detaileddescription of the parameters can be found in the Instruction Manual.This sequence must be saved in Excel using the CSV format. TheCLASS-VP software can only import sample tables in ASCII-format,but not save them as such.
ASCII Batch 1RECORD=Test,multical.met,test.dat,0,1,1,1,1,1,,,,1,,Test-Sample,1RECORD=...
b) LabSolutions
The ASCII sample tables of the LabSolutions software family, e.g.GCMSsolution and GCsolution, are designed in a similar way. Theyare <tab> separated and consist of a header containing the columnnames and rows containing the values of the individual runs.
The format becomes evident if one saves an existing sample table as a text file. The ASCII file should have the extension “txt” (see Figure 2).If one opens this file in Excel using the file filter “Text documents”,the structure of the text file becomes clear and can be used as a tem-plate for the sample editor worksheet.
orkflow with MS ExcelAutomated wSome parameters are numerically coded; the meaning of the encodingbecomes apparent if one compares the parameter table with the origi-nal sample table in the LabSolutions software. One exception is theparameter “Data Processing” in the LCMSsolution software that isencoded in a more complex way.
Figure 3 illustrates which numbers represent the various options.
These sample tables should be saved in Excel as tab-separated textformat. The order and the number of columns must not be changed.Missing entries, however, will be replaced by default values in theLabSolutions software.
� Excel helps to customise software
functions
� Description how to utilise different
software formats
Figure1: Excel Master Table
Figure 2: Save as Text
Figure 3: LCMSsolution: Parameter “Data Processing”
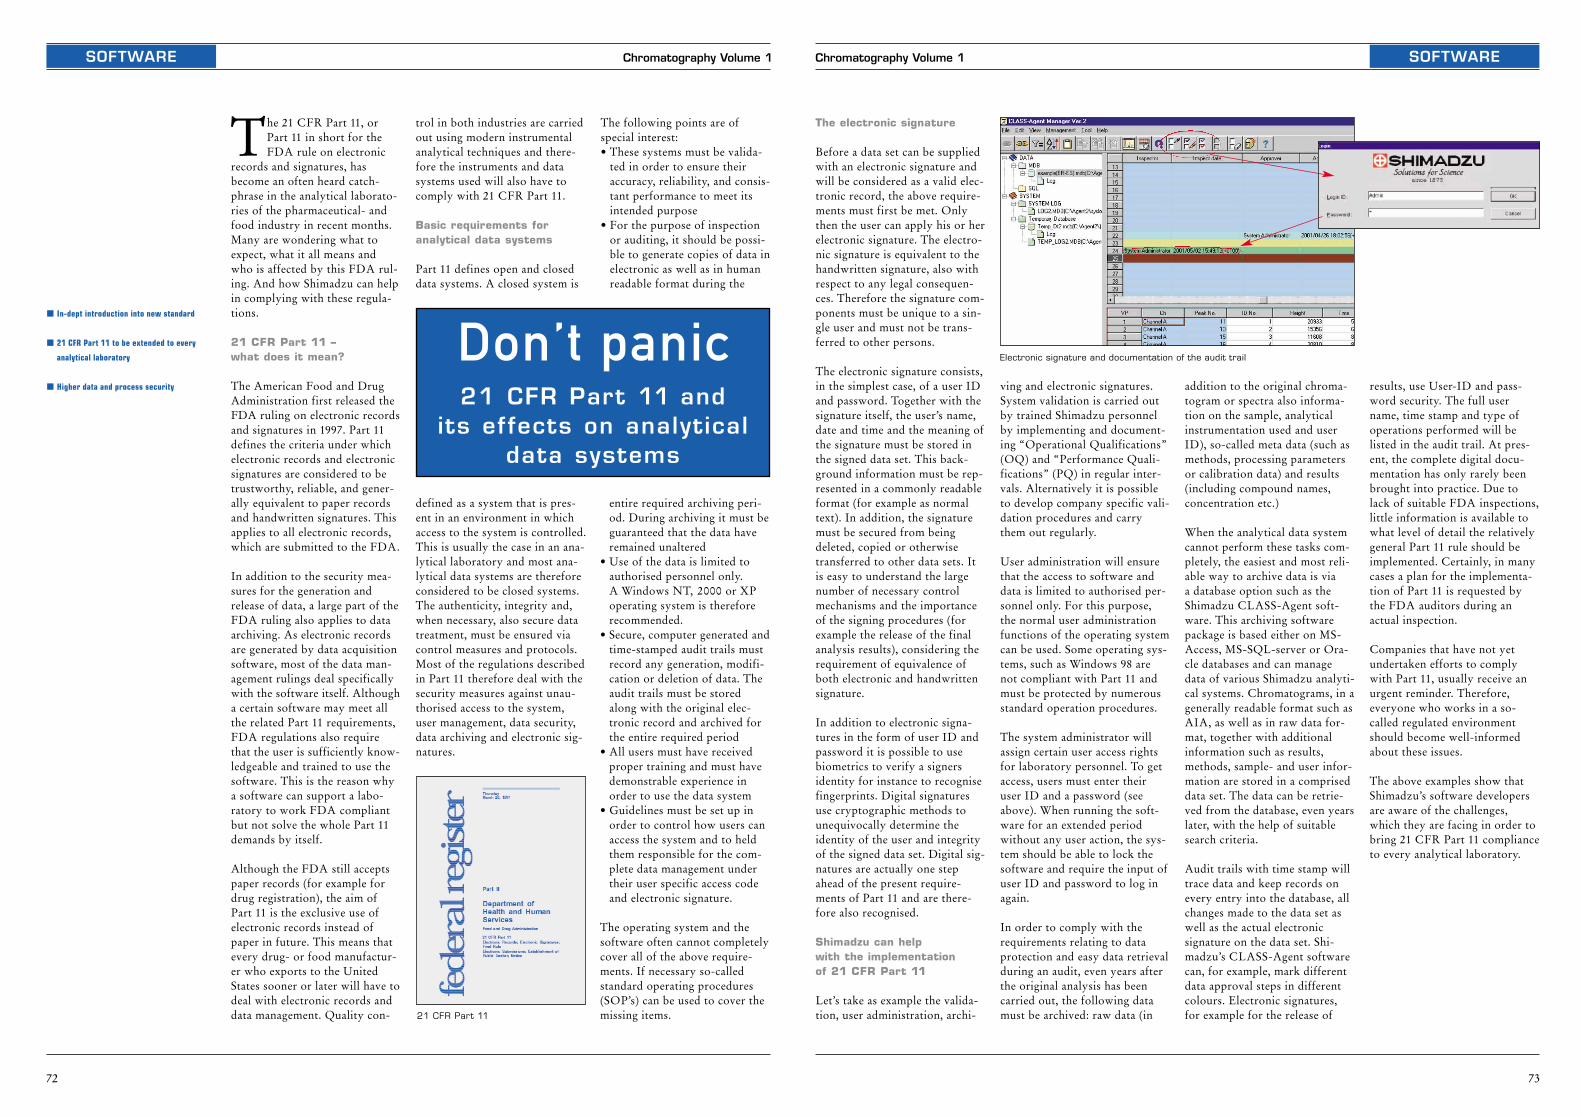
73
Chromatography Volume 1 SOFTWAREChromatography Volume 1
72
SOFTWARE
The 21 CFR Part 11, orPart 11 in short for theFDA rule on electronic
records and signatures, hasbecome an often heard catch-phrase in the analytical laborato-ries of the pharmaceutical- andfood industry in recent months.Many are wondering what toexpect, what it all means andwho is affected by this FDA rul-ing. And how Shimadzu can helpin complying with these regula-tions.
21 CFR Part 11 – what does it mean?
The American Food and DrugAdministration first released theFDA ruling on electronic recordsand signatures in 1997. Part 11defines the criteria under whichelectronic records and electronicsignatures are considered to betrustworthy, reliable, and gener-ally equivalent to paper recordsand handwritten signatures. Thisapplies to all electronic records,which are submitted to the FDA.
In addition to the security mea-sures for the generation andrelease of data, a large part of theFDA ruling also applies to dataarchiving. As electronic recordsare generated by data acquisitionsoftware, most of the data man-agement rulings deal specificallywith the software itself. Althougha certain software may meet allthe related Part 11 requirements,FDA regulations also requirethat the user is sufficiently know-ledgeable and trained to use thesoftware. This is the reason whya software can support a labo-ratory to work FDA compliantbut not solve the whole Part 11demands by itself.
Although the FDA still acceptspaper records (for example fordrug registration), the aim of Part 11 is the exclusive use ofelectronic records instead ofpaper in future. This means thatevery drug- or food manufactur-er who exports to the UnitedStates sooner or later will have todeal with electronic records anddata management. Quality con-
trol in both industries are carriedout using modern instrumentalanalytical techniques and there-fore the instruments and datasystems used will also have tocomply with 21 CFR Part 11.
Basic requirements for analytical data systems
Part 11 defines open and closeddata systems. A closed system is
The following points are of special interest:• These systems must be valida-
ted in order to ensure theiraccuracy, reliability, and consis-tant performance to meet itsintended purpose
• For the purpose of inspectionor auditing, it should be possi-ble to generate copies of data inelectronic as well as in humanreadable format during the
The electronic signature
Before a data set can be suppliedwith an electronic signature andwill be considered as a valid elec-tronic record, the above require-ments must first be met. Onlythen the user can apply his or herelectronic signature. The electro-nic signature is equivalent to thehandwritten signature, also withrespect to any legal consequen-ces. Therefore the signature com-ponents must be unique to a sin-gle user and must not be trans-ferred to other persons.
The electronic signature consists,in the simplest case, of a user IDand password. Together with thesignature itself, the user’s name,date and time and the meaning ofthe signature must be stored inthe signed data set. This back-ground information must be rep-resented in a commonly readableformat (for example as normaltext). In addition, the signaturemust be secured from beingdeleted, copied or otherwisetransferred to other data sets. Itis easy to understand the largenumber of necessary controlmechanisms and the importanceof the signing procedures (forexample the release of the finalanalysis results), considering therequirement of equivalence ofboth electronic and handwrittensignature.
In addition to electronic signa-tures in the form of user ID andpassword it is possible to usebiometrics to verify a signersidentity for instance to recognisefingerprints. Digital signaturesuse cryptographic methods tounequivocally determine theidentity of the user and integrityof the signed data set. Digital sig-natures are actually one stepahead of the present require-ments of Part 11 and are there-fore also recognised.
Shimadzu can help with the implementation of 21 CFR Part 11
Let’s take as example the valida-tion, user administration, archi-
Don’t panic21 CFR Part 11 and
its effects on analytical data systems
ving and electronic signatures.System validation is carried outby trained Shimadzu personnelby implementing and document-ing “Operational Qualifications”(OQ) and “Performance Quali-fications” (PQ) in regular inter-vals. Alternatively it is possibleto develop company specific vali-dation procedures and carrythem out regularly.
User administration will ensurethat the access to software anddata is limited to authorised per-sonnel only. For this purpose,the normal user administrationfunctions of the operating systemcan be used. Some operating sys-tems, such as Windows 98 arenot compliant with Part 11 andmust be protected by numerousstandard operation procedures.
The system administrator willassign certain user access rightsfor laboratory personnel. To getaccess, users must enter theiruser ID and a password (seeabove). When running the soft-ware for an extended periodwithout any user action, the sys-tem should be able to lock thesoftware and require the input ofuser ID and password to log inagain.
In order to comply with therequirements relating to dataprotection and easy data retrievalduring an audit, even years afterthe original analysis has beencarried out, the following datamust be archived: raw data (in
� In-dept introduction into new standard
� 21 CFR Part 11 to be extended to every
analytical laboratory
� Higher data and process security
21 CFR Part 11
addition to the original chroma-togram or spectra also informa-tion on the sample, analyticalinstrumentation used and userID), so-called meta data (such asmethods, processing parametersor calibration data) and results(including compound names,concentration etc.)
When the analytical data systemcannot perform these tasks com-pletely, the easiest and most reli-able way to archive data is via a database option such as theShimadzu CLASS-Agent soft-ware. This archiving softwarepackage is based either on MS-Access, MS-SQL-server or Ora-cle databases and can managedata of various Shimadzu analyti-cal systems. Chromatograms, in agenerally readable format such asAIA, as well as in raw data for-mat, together with additionalinformation such as results,methods, sample- and user infor-mation are stored in a compriseddata set. The data can be retrie-ved from the database, even yearslater, with the help of suitablesearch criteria.
Audit trails with time stamp willtrace data and keep records onevery entry into the database, allchanges made to the data set aswell as the actual electronic signature on the data set. Shi-madzu’s CLASS-Agent softwarecan, for example, mark differentdata approval steps in differentcolours. Electronic signatures,for example for the release of
results, use User-ID and pass-word security. The full username, time stamp and type ofoperations performed will belisted in the audit trail. At pres-ent, the complete digital docu-mentation has only rarely beenbrought into practice. Due tolack of suitable FDA inspections,little information is available towhat level of detail the relativelygeneral Part 11 rule should beimplemented. Certainly, in manycases a plan for the implementa-tion of Part 11 is requested bythe FDA auditors during anactual inspection.
Companies that have not yetundertaken efforts to complywith Part 11, usually receive anurgent reminder. Therefore,everyone who works in a so-called regulated environmentshould become well-informedabout these issues.
The above examples show thatShimadzu’s software developersare aware of the challenges,which they are facing in order tobring 21 CFR Part 11 complianceto every analytical laboratory.
Electronic signature and documentation of the audit trail
defined as a system that is pres-ent in an environment in whichaccess to the system is controlled.This is usually the case in an ana-lytical laboratory and most ana-lytical data systems are thereforeconsidered to be closed systems.The authenticity, integrity and,when necessary, also secure datatreatment, must be ensured viacontrol measures and protocols.Most of the regulations describedin Part 11 therefore deal with thesecurity measures against unau-thorised access to the system,user management, data security,data archiving and electronic sig-natures.
entire required archiving peri-od. During archiving it must beguaranteed that the data haveremained unaltered
• Use of the data is limited toauthorised personnel only. A Windows NT, 2000 or XPoperating system is thereforerecommended.
• Secure, computer generated andtime-stamped audit trails mustrecord any generation, modifi-cation or deletion of data. Theaudit trails must be storedalong with the original elec-tronic record and archived forthe entire required period
• All users must have receivedproper training and must havedemonstrable experience inorder to use the data system
• Guidelines must be set up inorder to control how users canaccess the system and to heldthem responsible for the com-plete data management undertheir user specific access codeand electronic signature.
The operating system and the software often cannot completelycover all of the above require-ments. If necessary so-calledstandard operating procedures(SOP’s) can be used to cover themissing items.

Entry Page
21 CFR Part 11 65, 72
40 years Shimadzu GC 50
Additive analysis 62
Aldehyde analysis in printed colours 16
Allergens in parfumes 32
Animal and vegetable oils 38
AOC-5000 autosampler 52
Aroma compounds 43
Barbiturates 9
Benzodiazepine 9
BETX in water 16
Biodiesel analysis 28
Breweries 46
Chemical warfare agents 20
CLASS Agent software 65, 72
CLASS VP software 70
Clinical analysis 10
Cooled PTV 53
Constant linear velocity mode 50
Customized user interface 66
Database management 65
Dean switch 36
DI-MS (Direct Inlet) 10
DIN H53 method (GC) 14
Doping 9
Drug analysis 11
Drug screening 9
Drugs of abuse 9
Electronic record 72
Electronic signature 72
Essential oils 36
FAME analysis 28, 38
Fast-GC 38, 50, 54
Fast-GCMS 11, 18, 32, 51, 61
Food 40
GC 28, 53
GC-2010 50, 54
GC-ED 40
Entry Page
GC-FID 43
GC-GC system 36
GCMS 9, 16, 20, 26, 43, 46, 53
GCMS-QP2010 51
GCMSsolution software 64
GCsolution software 64, 66
GLP/GLP support 64
GLP/GMP 65
Headspace 16, 52
LabSolutions software 68, 70, 72
Large-Volume injection 22
LSD 9
MS Excel 68, 70
Multi-dimensional GC 36
NCI (Negative Chemical Ionization) 18
Oil in water analysis 14
OLE functions 66
On-column injection 14
Optic 3 53
Organochlorine pesticides 40
Organo tin compounds in textiles 26
Organophosphorous pesticides 18
Paper analysis 58
Pharmaceutical analysis 10
Polymer analysis 10, 60, 61, 62
Post-run programs 68
Productivity 11
PTV injection 22
Py-2020iD 60
Pyrolysis-GCMS 58, 60, 61, 62
Sample table 70
SPME (Solid Phase Micro Extraction) 43, 52
Sulfur compounds in CO2 46
THC 9
TLC/MS 10
User program 46
Validation 64
Index
Related Documents


