Application Scalability and Communication Signatures on Leading Supercomputing Platforms Leonid Oliker, Shoaib Kamil, Andrew Canning, Jonathan Carter, Costin Iancu, John Shalf, Hongzhang Shan, David Skinner, Erich Strohmaier, Tom Goodale CRD/NERSC, Lawrence Berkeley National Laboratory, Berkeley, CA 94720 Abstract After a decade where supercomputing capability was dominated by the rapid pace of improvements to CPU clock frequency, the performance of next generation of supercomputing designs are increasingly differen- tiated by varying interconnect designs and level of integration. Understanding their performance trade- offs is critical for computational scientists, architec- tural designers, and system procurements. Our paper examines the performance of the very latest gener- ation of superscalar-based supercomputing platforms for a broad range of full-scale scientific applications. (we are the first to compare this set of architec- tures). Our results show that smaller sized problems are rapidly dominated by latency at larger concurren- cies on all systems except for the IBM BG/L. This may have important ramifications for future systems where it is expected that smaller memory sizes per peak flop on the system will force users to large con- currencies for even the smaller problem sizes. 1 Introduction After a decade where supercomputing capability was dominated by the rapid pace of improvements to CPU clock frequency, the performance of next gen- eration of supercomputing designs are increasingly differentiated by varying interconnect designs and level of integration. Understanding their performance tradeoffs is critical for computational scientists, ar- chitectural designers, and system procurements. We conduct experiments using a broad range of scien- tific applications with a wide array of computational algorithms, underlying structures, and communica- tion patterns. First we evaluate architecture behav- ior by comparing aggregate performance and scala- bility. Next we develop a methodology for capturing an application’s communication signature for a given architecture and problem specification. We also introduce a more qualitative representa- tion of the application communication requirements called BALAD (BAndwidth and Latency Driven) graphs. The BALAD graphs allows us to intuitively compare the architectural balance of competing plat- forms and identify potential sources of communica- tion bottlenecks. The BALAD graphs trace a vector that indicates where reductions bytes/flop ratio are no longer sus- tainable and also where adding interconnection band- width without considering the latency of the intercon- nect is also a losing proposition at higher concurren- cies. Our results show that smaller sized problems are rapidly dominated by latency at larger concurren- cies on all systems except for the IBM BG/L. This may have important ramifications for future systems where it is expected that smaller memory sizes per peak flop on the system will force users to large con- currencies for even the smaller problem sizes. 2 Scientific Application Overview Five applications from diverse areas in scien- tific computing were chosen to compare the perfor- mance on our suite of leading supercomputing plat- forms. We examine: Cactus, a framework for high- performance computing — for our tests we use an as- trophysics application, BSSN-MoL that evolves Ein- stein’s equations from the Theory of General Relativ- ity using a modification of the Arnowitt-Deser-Misner formulation; ELB3D, a lattice-Boltzmann code to study turbulent fluid flow; BeamBeam3D, a paral- lel particle-field decomposition based particle-in-cell code for high energy ring colliders; PARATEC, a first principles materials science code that solves the Kohn-Sham equations of density functional theory to obtain electronic wave functions; HyperCLaw an adaptive mesh refinement (AMR) framework for solv- ing the Hyperbolic conservation laws of gas dynamics via a higher-order Godunov method. Table 1 presents an overview of the application characteristics. These codes represent candidate ultra-scale ap- plications that have the potential to fully utilize leadership-class computing systems, and represent a broad range of algorithms and computational struc- tures. Communication characteristics include: sim- ple ghost boundary exchange for the stencil-based Cactus computation; interpolation between the grid and lattice structures of ELB3D; global gather and broadcast operations to compute the charge and field properties in BeamBeam3D; all-to-all data transpo- sitions used to implement PARATECs 3D FFTs, and complex data movements required to create and dy- namically adapt grid hierarchies in HyperCLaw. Ex- 1

Welcome message from author
This document is posted to help you gain knowledge. Please leave a comment to let me know what you think about it! Share it to your friends and learn new things together.
Transcript
Application Scalability and Communication Signatureson Leading Supercomputing Platforms
Leonid Oliker, Shoaib Kamil, Andrew Canning, Jonathan Carter,Costin Iancu, John Shalf, Hongzhang Shan, David Skinner, Erich Strohmaier, Tom GoodaleCRD/NERSC, Lawrence Berkeley National Laboratory, Berkeley, CA 94720
Abstract
After a decade where supercomputing capability wasdominated by the rapid pace of improvements to CPUclock frequency, the performance of next generationof supercomputing designs are increasingly differen-tiated by varying interconnect designs and level ofintegration. Understanding their performance trade-offs is critical for computational scientists, architec-tural designers, and system procurements. Our paperexamines the performance of the very latest gener-ation of superscalar-based supercomputing platformsfor a broad range of full-scale scientific applications.(we are the first to compare this set of architec-tures). Our results show that smaller sized problemsare rapidly dominated by latency at larger concurren-cies on all systems except for the IBM BG/L. Thismay have important ramifications for future systemswhere it is expected that smaller memory sizes perpeak flop on the system will force users to large con-currencies for even the smaller problem sizes.
1 Introduction
After a decade where supercomputing capabilitywas dominated by the rapid pace of improvements toCPU clock frequency, the performance of next gen-eration of supercomputing designs are increasinglydifferentiated by varying interconnect designs andlevel of integration. Understanding their performancetradeoffs is critical for computational scientists, ar-chitectural designers, and system procurements. Weconduct experiments using a broad range of scien-tific applications with a wide array of computationalalgorithms, underlying structures, and communica-tion patterns. First we evaluate architecture behav-ior by comparing aggregate performance and scala-bility. Next we develop a methodology for capturingan application’s communication signature for a givenarchitecture and problem specification.
We also introduce a more qualitative representa-tion of the application communication requirementscalled BALAD (BAndwidth and Latency Driven)graphs. The BALAD graphs allows us to intuitivelycompare the architectural balance of competing plat-forms and identify potential sources of communica-tion bottlenecks.
The BALAD graphs trace a vector that indicateswhere reductions bytes/flop ratio are no longer sus-tainable and also where adding interconnection band-width without considering the latency of the intercon-nect is also a losing proposition at higher concurren-cies.
Our results show that smaller sized problems arerapidly dominated by latency at larger concurren-cies on all systems except for the IBM BG/L. Thismay have important ramifications for future systemswhere it is expected that smaller memory sizes perpeak flop on the system will force users to large con-currencies for even the smaller problem sizes.
2 Scientific ApplicationOverview
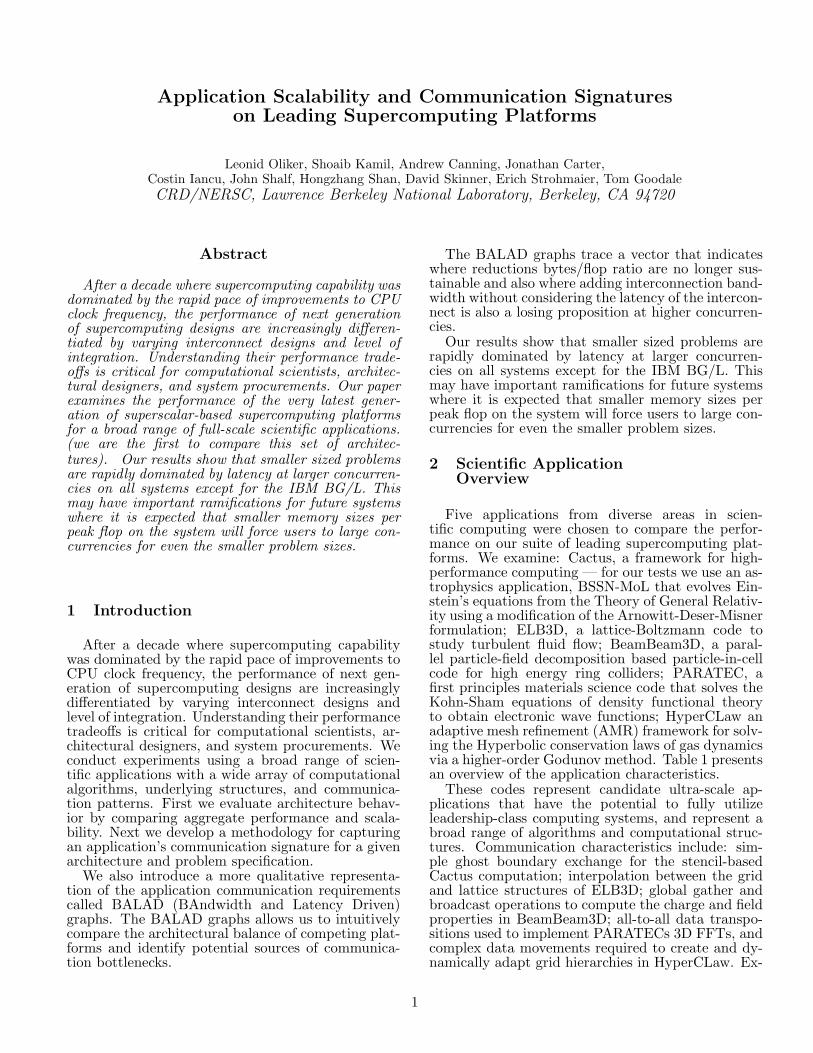
Five applications from diverse areas in scien-tific computing were chosen to compare the perfor-mance on our suite of leading supercomputing plat-forms. We examine: Cactus, a framework for high-performance computing — for our tests we use an as-trophysics application, BSSN-MoL that evolves Ein-stein’s equations from the Theory of General Relativ-ity using a modification of the Arnowitt-Deser-Misnerformulation; ELB3D, a lattice-Boltzmann code tostudy turbulent fluid flow; BeamBeam3D, a paral-lel particle-field decomposition based particle-in-cellcode for high energy ring colliders; PARATEC, afirst principles materials science code that solves theKohn-Sham equations of density functional theoryto obtain electronic wave functions; HyperCLaw anadaptive mesh refinement (AMR) framework for solv-ing the Hyperbolic conservation laws of gas dynamicsvia a higher-order Godunov method. Table 1 presentsan overview of the application characteristics.
These codes represent candidate ultra-scale ap-plications that have the potential to fully utilizeleadership-class computing systems, and represent abroad range of algorithms and computational struc-tures. Communication characteristics include: sim-ple ghost boundary exchange for the stencil-basedCactus computation; interpolation between the gridand lattice structures of ELB3D; global gather andbroadcast operations to compute the charge and fieldproperties in BeamBeam3D; all-to-all data transpo-sitions used to implement PARATECs 3D FFTs, andcomplex data movements required to create and dy-namically adapt grid hierarchies in HyperCLaw. Ex-
1
Name Lines Discipline Methods StructureCACTUS 84,000 Astrophysics Einstein Theory of GR, ADM-BSSN Grid
ELBD 3,000 Fluid Dynamics Lattice Boltzmann, Navier-Stokes Grid/LatticeBeamBeam3D 28,000 High Energy Physics Particle in Cell, Vlasov-Poisson Particle/Grid
PARATEC 50,000 Material Science Density Functional Theory, FFT Fourier/GridHyperCLaw 69,000 Gas Dynamics Hyperbolic, High-order Godunov Grid AMR
Table 1. Overview of scientific applications examined in our study.
amining these varied computational methodologiesacross a set of modern supercomputing platforms, al-lows us to study the performance tradeoffs of differ-ent architectural balances and topological intercon-nect approaches.
3 Target Architectures
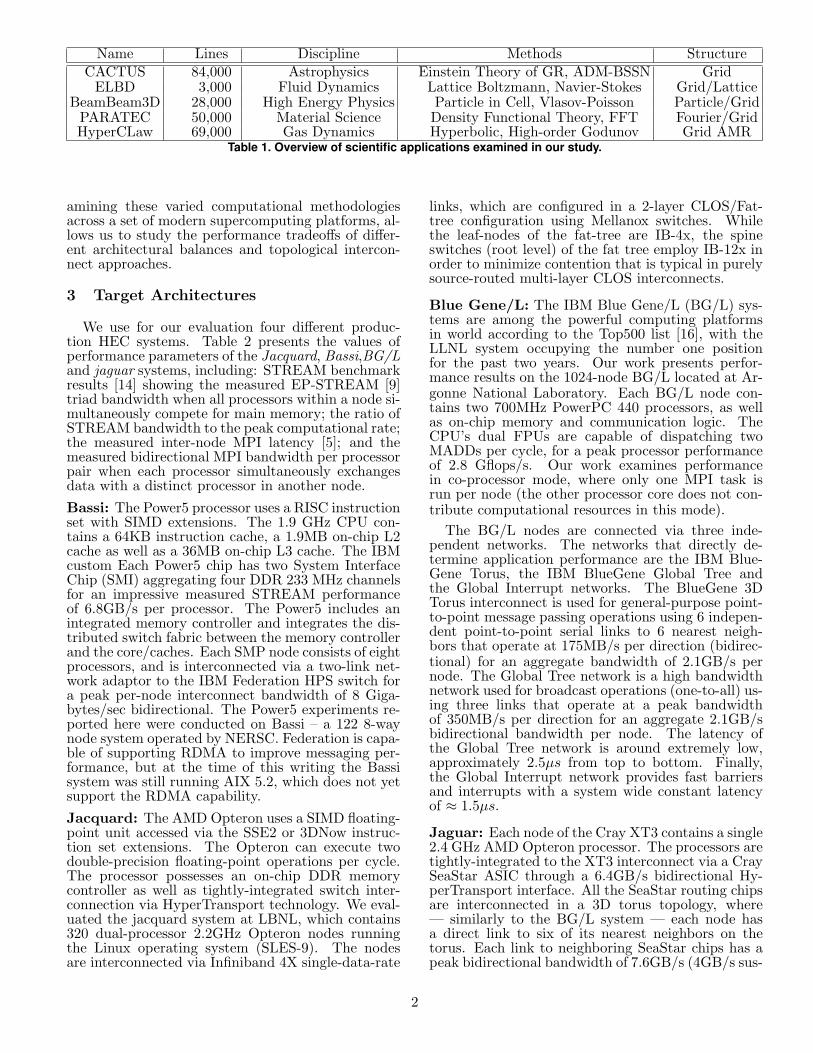
We use for our evaluation four different produc-tion HEC systems. Table 2 presents the values ofperformance parameters of the Jacquard, Bassi,BG/Land jaguar systems, including: STREAM benchmarkresults [14] showing the measured EP-STREAM [9]triad bandwidth when all processors within a node si-multaneously compete for main memory; the ratio ofSTREAM bandwidth to the peak computational rate;the measured inter-node MPI latency [5]; and themeasured bidirectional MPI bandwidth per processorpair when each processor simultaneously exchangesdata with a distinct processor in another node.Bassi: The Power5 processor uses a RISC instructionset with SIMD extensions. The 1.9 GHz CPU con-tains a 64KB instruction cache, a 1.9MB on-chip L2cache as well as a 36MB on-chip L3 cache. The IBMcustom Each Power5 chip has two System InterfaceChip (SMI) aggregating four DDR 233 MHz channelsfor an impressive measured STREAM performanceof 6.8GB/s per processor. The Power5 includes anintegrated memory controller and integrates the dis-tributed switch fabric between the memory controllerand the core/caches. Each SMP node consists of eightprocessors, and is interconnected via a two-link net-work adaptor to the IBM Federation HPS switch fora peak per-node interconnect bandwidth of 8 Giga-bytes/sec bidirectional. The Power5 experiments re-ported here were conducted on Bassi – a 122 8-waynode system operated by NERSC. Federation is capa-ble of supporting RDMA to improve messaging per-formance, but at the time of this writing the Bassisystem was still running AIX 5.2, which does not yetsupport the RDMA capability.Jacquard: The AMD Opteron uses a SIMD floating-point unit accessed via the SSE2 or 3DNow instruc-tion set extensions. The Opteron can execute twodouble-precision floating-point operations per cycle.The processor possesses an on-chip DDR memorycontroller as well as tightly-integrated switch inter-connection via HyperTransport technology. We eval-uated the jacquard system at LBNL, which contains320 dual-processor 2.2GHz Opteron nodes runningthe Linux operating system (SLES-9). The nodesare interconnected via Infiniband 4X single-data-rate
links, which are configured in a 2-layer CLOS/Fat-tree configuration using Mellanox switches. Whilethe leaf-nodes of the fat-tree are IB-4x, the spineswitches (root level) of the fat tree employ IB-12x inorder to minimize contention that is typical in purelysource-routed multi-layer CLOS interconnects.
Blue Gene/L: The IBM Blue Gene/L (BG/L) sys-tems are among the powerful computing platformsin world according to the Top500 list [16], with theLLNL system occupying the number one positionfor the past two years. Our work presents perfor-mance results on the 1024-node BG/L located at Ar-gonne National Laboratory. Each BG/L node con-tains two 700MHz PowerPC 440 processors, as wellas on-chip memory and communication logic. TheCPU’s dual FPUs are capable of dispatching twoMADDs per cycle, for a peak processor performanceof 2.8 Gflops/s. Our work examines performancein co-processor mode, where only one MPI task isrun per node (the other processor core does not con-tribute computational resources in this mode).
The BG/L nodes are connected via three inde-pendent networks. The networks that directly de-termine application performance are the IBM Blue-Gene Torus, the IBM BlueGene Global Tree andthe Global Interrupt networks. The BlueGene 3DTorus interconnect is used for general-purpose point-to-point message passing operations using 6 indepen-dent point-to-point serial links to 6 nearest neigh-bors that operate at 175MB/s per direction (bidirec-tional) for an aggregate bandwidth of 2.1GB/s pernode. The Global Tree network is a high bandwidthnetwork used for broadcast operations (one-to-all) us-ing three links that operate at a peak bandwidthof 350MB/s per direction for an aggregate 2.1GB/sbidirectional bandwidth per node. The latency ofthe Global Tree network is around extremely low,approximately 2.5µs from top to bottom. Finally,the Global Interrupt network provides fast barriersand interrupts with a system wide constant latencyof ≈ 1.5µs.
Jaguar: Each node of the Cray XT3 contains a single2.4 GHz AMD Opteron processor. The processors aretightly-integrated to the XT3 interconnect via a CraySeaStar ASIC through a 6.4GB/s bidirectional Hy-perTransport interface. All the SeaStar routing chipsare interconnected in a 3D torus topology, where— similarly to the BG/L system — each node hasa direct link to six of its nearest neighbors on thetorus. Each link to neighboring SeaStar chips has apeak bidirectional bandwidth of 7.6GB/s (4GB/s sus-
2
P/ Clock Peak Stream BW Ratio MPI Lat MPI BW NetworkName PlatformNode (GHz) (GF/s/P) (GB/s/P) (Byte/Flop) (µsec) (GB/s/P) Topology
Jacquard Opteron 2 2.2 4.4 2.3 0.51 5.2 0.73 Fat-treeBassi Power5 8 1.9 7.6 6.8 0.85 4.7 0.69 Fat-treeBG/L Blue Gene/L 2 0.7 2.8 0.9 0.31 2.21 0.16 3D TorusJaguar XT3 1 2.4 4.8 4.8 1.01 5.52 1.2 3D Torus
Table 2. Architectural highlights of studied HEC platforms.
tained). Our experiments are conducted on the 5294node XT3 system operated by the National Leader-ship Computing Facility (NLCF) at Oak Ridge Na-tional Laboratory running the Catamount microker-nel on the compute nodes. Note that the Opteronprocessor technology in Jaguar and Jacquard arenearly identical, giving us a opportunity to closelyexamine the performance tradeoffs between the dif-fering 3D-torus and fat-tree interconnect approaches.
4 Performance Evaluation and Scalability
In this section we present performance results andanalysis of our diverse set of scientific applicationsusing four leading supercomputing platforms. Foreach code we perform strong scaling experiments us-ing both a small and large data size. This allows usto study how effectively our studied architectures re-spond to growing stress on the interconnect layer withincreasing concurrencies. (All missing performancedata will be presented in the final paper versions.)
Performance results measured on these systems,presented in Gflop/s per processor (denoted asGFs/P) and percentage of peak (%Pk), are used tocompare the time to solution of our evaluated plat-forms. The Gflop/s value is computed by dividing avalid baseline flop-count by the measured wall-clocktime of each platform — thus the ratio between thecomputational rates is the same as the ratio of run-times across the evaluated systems. We also presentthe percent of parallel efficiency (%PE) for each prob-lem size, via a linear scaling based on the smallestavailable concurrency. As a result, the %PE may notbe directly comparable across varying problem sizesfor a given application, as the smallest concurrencybaseline could differ depending on the details of theproblem configuration.
While unconventional, this approach is more valu-able than attempting to compare on the basis offixed concurrencies because the entire design pointof systems like BG/L is based on the assumptionthat more of its slower-performing processors shouldbe employed to solve the same sized problem thanwould otherwise be used on systems with higher-performance (and higher power-consumption) proces-sors. Therefore, comparisons between BG/L and theother systems based on a fixed concurrency are there-fore unfair in that context.
4.1 BSSN-MoL: A Cactus-based General RelativelyApplication
One of the most challenging problems in astro-physics is the numerical solution of Einstein’s equa-tions following from the Theory of General Relativity(GR): a set of coupled nonlinear hyperbolic and el-liptic equations containing thousands of terms whenfully expanded. The BSSN-MoL application, whichmakes use of the Cactus Computational ToolKit [4,7],is designed to evolve Einstein’s equations stably in3D on supercomputers to simulate astrophysical phe-nomena with high gravitational fluxes – such asthe collision of two black holes and the gravita-tional waves radiating from that event. While Cac-tus is a modular framework supporting a wide va-riety of applications, this study focuses exclusivelyon the GR solver, which implements the Arnowitt--Deser-Misner (ADM) Baumgarte-Shapiro-Shibata--Nakamura (BSSN) [2] with Method of Lines inte-gration to enable stable evolution of black holes.
For parallel computation, the grid is block domaindecomposed so that each processor has a section ofthe global grid. The standard MPI driver (PUGH)for Cactus solves the PDE on a local grid sectionand then updates the values at the ghost zones byexchanging data on the faces of its topological neigh-bors in the domain decomposition.
4.1.1 Experimental results
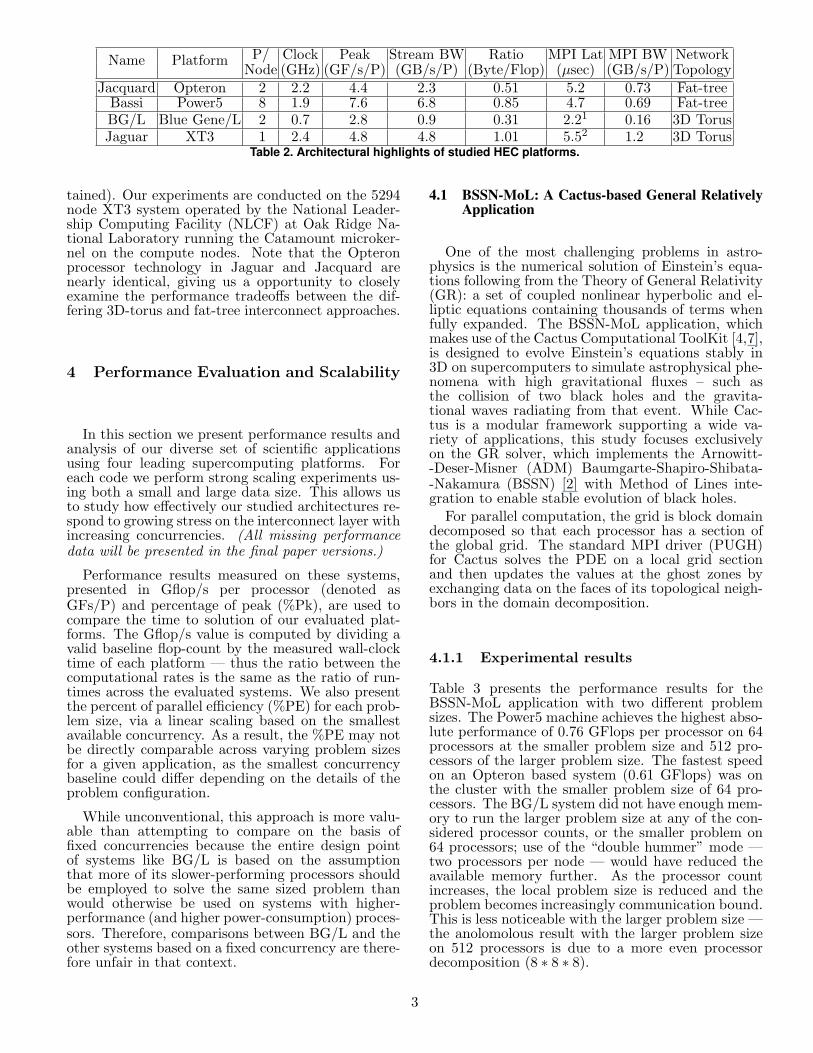
Table 3 presents the performance results for theBSSN-MoL application with two different problemsizes. The Power5 machine achieves the highest abso-lute performance of 0.76 GFlops per processor on 64processors at the smaller problem size and 512 pro-cessors of the larger problem size. The fastest speedon an Opteron based system (0.61 GFlops) was onthe cluster with the smaller problem size of 64 pro-cessors. The BG/L system did not have enough mem-ory to run the larger problem size at any of the con-sidered processor counts, or the smaller problem on64 processors; use of the “double hummer” mode —two processors per node — would have reduced theavailable memory further. As the processor countincreases, the local problem size is reduced and theproblem becomes increasingly communication bound.This is less noticeable with the larger problem size —the anolomolous result with the larger problem sizeon 512 processors is due to a more even processordecomposition (8 ∗ 8 ∗ 8).
3
Bassi Jacquard Jaguar BG/LSize PGFs/P %Pk %PE GFs/P %Pk %PE GFs/P %Pk %PE GFs/P %Pk %PE
64 0.76 10% 100% 0.61 13.9% 100% 0.42 8.8% 100% — — —2563 128 0.75 9.9% 99% 0.59 13.4% 97% 0.43 9.0% 102% 0.39 13.9% 100%
256 0.70 9.2% 92% — — — 0.44 9.2% 104% 0.20 7.1% 51%512 — — — — — — 0.36 7.5% 86% 0.19 6.8% 49%
1024 — — — — — — — — — 0.18 6.4% 46%7683 256 0.63 8.3% 100% 0.45 10.2% 100% — — — — — —
512 0.76 10% 121% — — — 0.45 9.4% 100% — — —
Table 3. BSSN-MoL results using 2563 and 7683 grid sizes in Gflops/processor (GFs/P), percentage of peak (%Pk), andparallel efficiency (%PE).
4.2 ELBM3D
Lattice-Boltzmann methods (LBM) have proveda good alternative to conventional numerical ap-proaches for simulating fluid flows and modelingphysics in fluids [15]. The basic idea is to developa simplified kinetic model that incorporates the es-sential physics, and reproduces correct macroscopicaveraged properties. These algorithms have beenused extensively over the past ten years for simulatingNavier-Stokes flows. As can be expected from explicitalgorithms, LBM are prone to numerical nonlinear in-stabilities as one pushes to higher Reynolds numbers.These numerical instabilities arise because there areno constraints imposed to enforce the distributionfunctions to remain non-negative. Entropic LBM al-gorithms, which do preserve the non-negativity of thedistribution functions—even in the limit of arbitrarysmall transport coefficients—have recently been de-veloped for Navier-Stokes turbulence [3], and are in-corporated into a recently developed code [17].
While LBM methods lend themselves to easy im-plementation of difficult boundary geometries, e.g.,by the use of bounce-back to simulate no slip wallconditions, here we report on 3D simulations underperiodic boundary conditions, with the spatial gridand phase space velocity lattice overlaying each other.Each lattice point is associated with a set of meso-scopic variables, whose values are stored in vectorsproportional to the number of streaming directions.The lattice is partitioned onto a 3-dimensional Carte-sian processor grid, and MPI is used for communica-tion. As in most simulations of this nature, ghostcells are used to hold copies of the planes of datafrom neighboring processors.
4.2.1 Experimental results
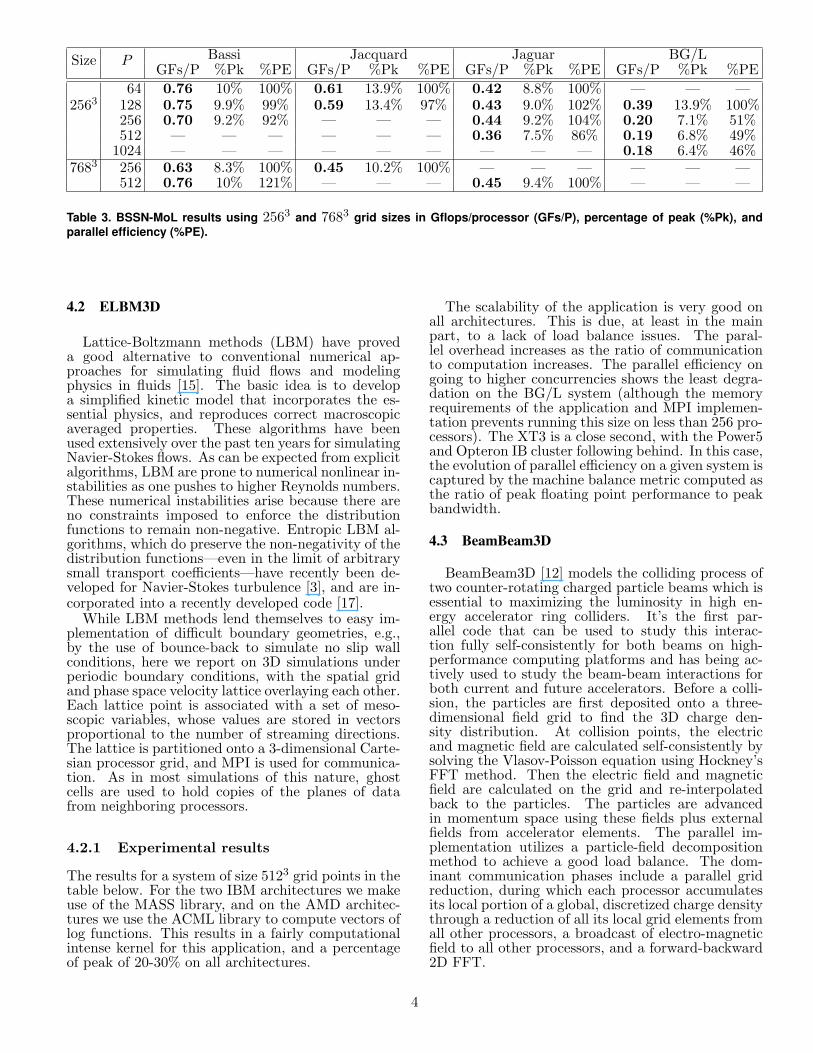
The results for a system of size 5123 grid points in thetable below. For the two IBM architectures we makeuse of the MASS library, and on the AMD architec-tures we use the ACML library to compute vectors oflog functions. This results in a fairly computationalintense kernel for this application, and a percentageof peak of 20-30% on all architectures.
The scalability of the application is very good onall architectures. This is due, at least in the mainpart, to a lack of load balance issues. The paral-lel overhead increases as the ratio of communicationto computation increases. The parallel efficiency ongoing to higher concurrencies shows the least degra-dation on the BG/L system (although the memoryrequirements of the application and MPI implemen-tation prevents running this size on less than 256 pro-cessors). The XT3 is a close second, with the Power5and Opteron IB cluster following behind. In this case,the evolution of parallel efficiency on a given system iscaptured by the machine balance metric computed asthe ratio of peak floating point performance to peakbandwidth.
4.3 BeamBeam3D
BeamBeam3D [12] models the colliding process oftwo counter-rotating charged particle beams which isessential to maximizing the luminosity in high en-ergy accelerator ring colliders. It’s the first par-allel code that can be used to study this interac-tion fully self-consistently for both beams on high-performance computing platforms and has being ac-tively used to study the beam-beam interactions forboth current and future accelerators. Before a colli-sion, the particles are first deposited onto a three-dimensional field grid to find the 3D charge den-sity distribution. At collision points, the electricand magnetic field are calculated self-consistently bysolving the Vlasov-Poisson equation using Hockney’sFFT method. Then the electric field and magneticfield are calculated on the grid and re-interpolatedback to the particles. The particles are advancedin momentum space using these fields plus externalfields from accelerator elements. The parallel im-plementation utilizes a particle-field decompositionmethod to achieve a good load balance. The dom-inant communication phases include a parallel gridreduction, during which each processor accumulatesits local portion of a global, discretized charge densitythrough a reduction of all its local grid elements fromall other processors, a broadcast of electro-magneticfield to all other processors, and a forward-backward2D FFT.
4
Bassi Jacquard Jaguar BG/LSize PGFs/P %Pk %PE GFs/P %Pk %PE GFs/P %Pk %PE GFs/P %Pk %PE
64 2.31 30% 100% 1.15 26% 100% 1.11 23% 100% — — —128 2.07 27% 90% 1.12 25% 97% 1.08 23% 97% — — —
5123 256 2.02 27% 88% 1.08 25% 95% 1.07 22% 96% 0.45 32% 100%512 2.11 28% 91% 1.06 22% 95% 0.45 32% 99%
1024 — — — — — — 0.44 32% 97%
Table 4. ELBM3D results using 5123 grid systems in Gflops/processor (GFs/P), percentage of peak (%Pk), and parallelefficiency (%PE).
Bassi Jacquard Jaguar BG/LGrid PGFs/P %Pk %PE GFs/P %Pk %PE GFs/P %Pk %PE GFs/P %Pk %PE
64 0.69 9.0% 100% 0.25 5.65% 100% 0.16 3.4% 100% 0.10 3.6% 100%128x128 0.59 7.3% 81% 0.23 5.20% 92% 0.11 2.4% 71% 0.10 3.5% 96%128x256 0.45 5.9% 65% 0.16 3.61% 69% 0.09 1.9% 56% 0.10 3.4% 93%32512 0.36 4.7% 52% 0.09 1.9% 56% 0.09 3.0% 83%64 0.57 7.5% 100% 0.28 6.28% 100% 0.30 6.2% 100% 0.08 3.0% 100%256x
128 0.52 6.9% 92% 0.24 5.47% 87% 0.25 5.3% 85% 0.08 2.8% 93%256x256 0.46 6.1% 81% 0.19 4.28% 68% 0.23 4.8% 78% 0.07 2.7% 88%32512 0.39 5.1% 68% 0.22 4.5% 73% 0.08 3.0% 99%
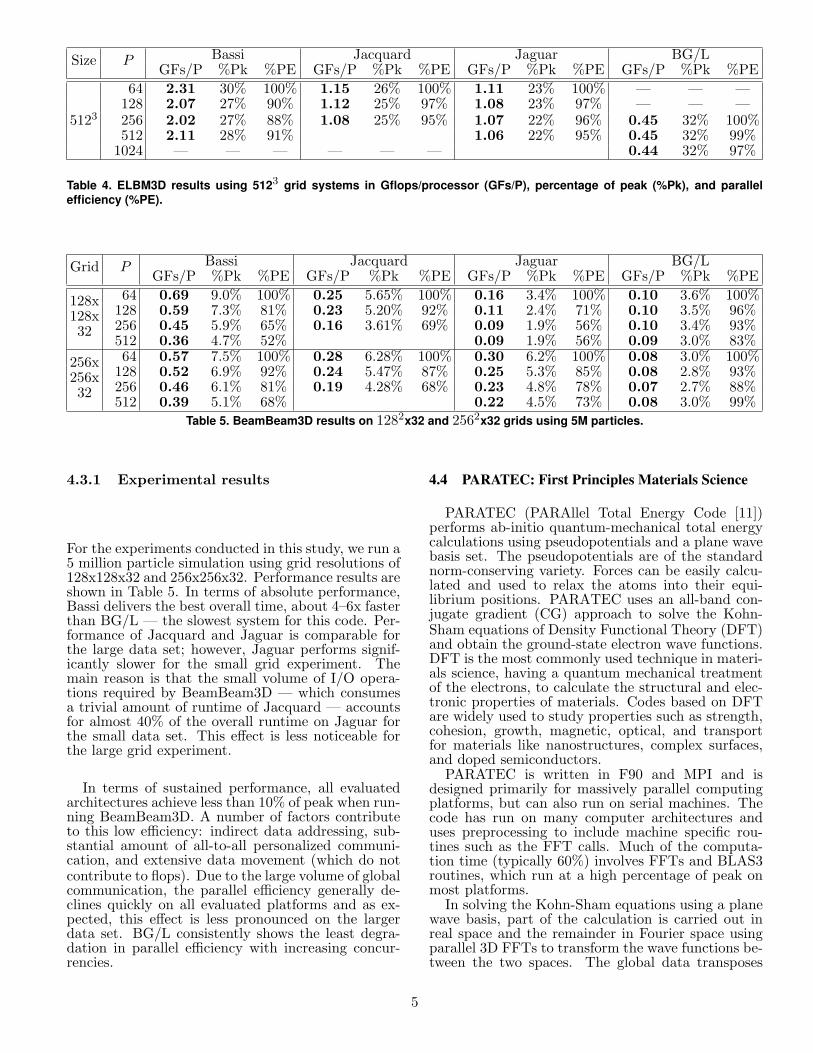
Table 5. BeamBeam3D results on 1282x32 and 2562x32 grids using 5M particles.
4.3.1 Experimental results
For the experiments conducted in this study, we run a5 million particle simulation using grid resolutions of128x128x32 and 256x256x32. Performance results areshown in Table 5. In terms of absolute performance,Bassi delivers the best overall time, about 4–6x fasterthan BG/L — the slowest system for this code. Per-formance of Jacquard and Jaguar is comparable forthe large data set; however, Jaguar performs signif-icantly slower for the small grid experiment. Themain reason is that the small volume of I/O opera-tions required by BeamBeam3D — which consumesa trivial amount of runtime of Jacquard — accountsfor almost 40% of the overall runtime on Jaguar forthe small data set. This effect is less noticeable forthe large grid experiment.
In terms of sustained performance, all evaluatedarchitectures achieve less than 10% of peak when run-ning BeamBeam3D. A number of factors contributeto this low efficiency: indirect data addressing, sub-stantial amount of all-to-all personalized communi-cation, and extensive data movement (which do notcontribute to flops). Due to the large volume of globalcommunication, the parallel efficiency generally de-clines quickly on all evaluated platforms and as ex-pected, this effect is less pronounced on the largerdata set. BG/L consistently shows the least degra-dation in parallel efficiency with increasing concur-rencies.
4.4 PARATEC: First Principles Materials Science
PARATEC (PARAllel Total Energy Code [11])performs ab-initio quantum-mechanical total energycalculations using pseudopotentials and a plane wavebasis set. The pseudopotentials are of the standardnorm-conserving variety. Forces can be easily calcu-lated and used to relax the atoms into their equi-librium positions. PARATEC uses an all-band con-jugate gradient (CG) approach to solve the Kohn-Sham equations of Density Functional Theory (DFT)and obtain the ground-state electron wave functions.DFT is the most commonly used technique in materi-als science, having a quantum mechanical treatmentof the electrons, to calculate the structural and elec-tronic properties of materials. Codes based on DFTare widely used to study properties such as strength,cohesion, growth, magnetic, optical, and transportfor materials like nanostructures, complex surfaces,and doped semiconductors.
PARATEC is written in F90 and MPI and isdesigned primarily for massively parallel computingplatforms, but can also run on serial machines. Thecode has run on many computer architectures anduses preprocessing to include machine specific rou-tines such as the FFT calls. Much of the computa-tion time (typically 60%) involves FFTs and BLAS3routines, which run at a high percentage of peak onmost platforms.
In solving the Kohn-Sham equations using a planewave basis, part of the calculation is carried out inreal space and the remainder in Fourier space usingparallel 3D FFTs to transform the wave functions be-tween the two spaces. The global data transposes
5
within these FFT operations account for the bulkof PARATEC’s communication overhead, and canquickly become the bottleneck at high concurrencies.We use our own handwritten 3D FFTs rather thanlibrary routines as the data layout in Fourier spaceis a sphere of points, rather than a standard squaregrid. The sphere is load balanced by distributing thedifferent length columns from the sphere to differentprocessors such that each processor holds a similarnumber of points in Fourier space. Effective load bal-ancing is important, as much of the compute intensivepart of the calculation is carried out in Fourier space.
4.4.1 Experimental results
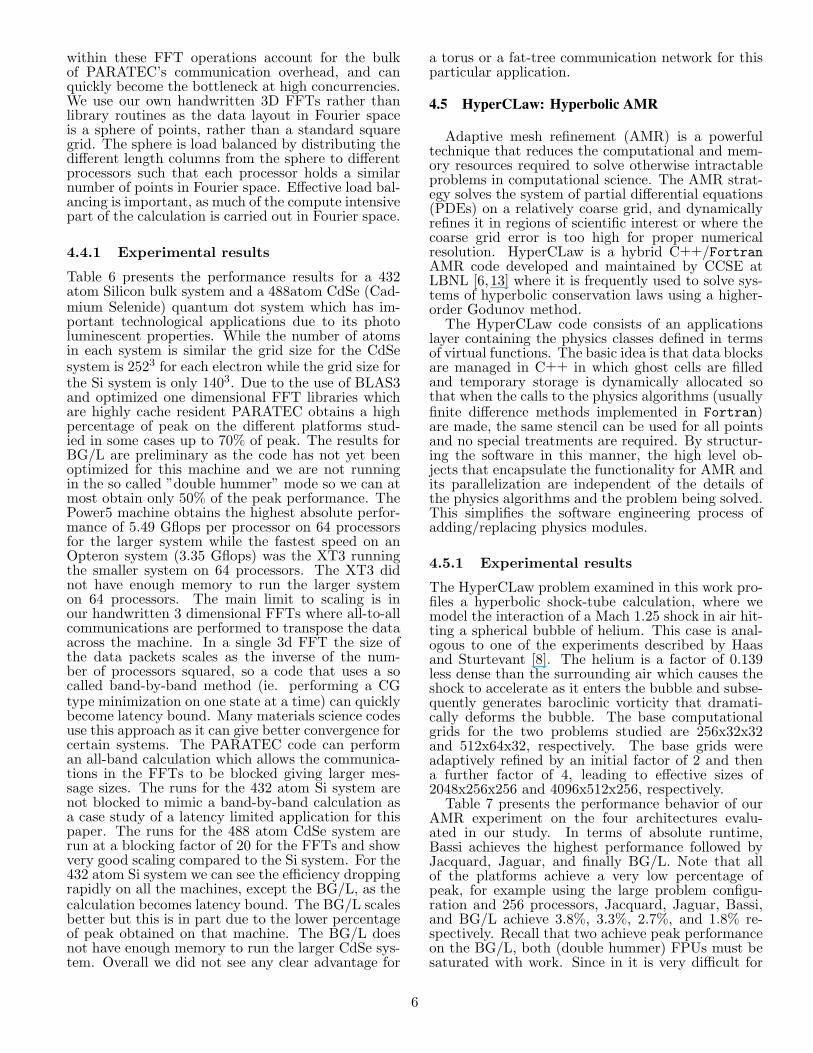
Table 6 presents the performance results for a 432atom Silicon bulk system and a 488atom CdSe (Cad-mium Selenide) quantum dot system which has im-portant technological applications due to its photoluminescent properties. While the number of atomsin each system is similar the grid size for the CdSesystem is 2523 for each electron while the grid size forthe Si system is only 1403. Due to the use of BLAS3and optimized one dimensional FFT libraries whichare highly cache resident PARATEC obtains a highpercentage of peak on the different platforms stud-ied in some cases up to 70% of peak. The results forBG/L are preliminary as the code has not yet beenoptimized for this machine and we are not runningin the so called ”double hummer” mode so we can atmost obtain only 50% of the peak performance. ThePower5 machine obtains the highest absolute perfor-mance of 5.49 Gflops per processor on 64 processorsfor the larger system while the fastest speed on anOpteron system (3.35 Gflops) was the XT3 runningthe smaller system on 64 processors. The XT3 didnot have enough memory to run the larger systemon 64 processors. The main limit to scaling is inour handwritten 3 dimensional FFTs where all-to-allcommunications are performed to transpose the dataacross the machine. In a single 3d FFT the size ofthe data packets scales as the inverse of the num-ber of processors squared, so a code that uses a socalled band-by-band method (ie. performing a CGtype minimization on one state at a time) can quicklybecome latency bound. Many materials science codesuse this approach as it can give better convergence forcertain systems. The PARATEC code can performan all-band calculation which allows the communica-tions in the FFTs to be blocked giving larger mes-sage sizes. The runs for the 432 atom Si system arenot blocked to mimic a band-by-band calculation asa case study of a latency limited application for thispaper. The runs for the 488 atom CdSe system arerun at a blocking factor of 20 for the FFTs and showvery good scaling compared to the Si system. For the432 atom Si system we can see the efficiency droppingrapidly on all the machines, except the BG/L, as thecalculation becomes latency bound. The BG/L scalesbetter but this is in part due to the lower percentageof peak obtained on that machine. The BG/L doesnot have enough memory to run the larger CdSe sys-tem. Overall we did not see any clear advantage for
a torus or a fat-tree communication network for thisparticular application.
4.5 HyperCLaw: Hyperbolic AMR
Adaptive mesh refinement (AMR) is a powerfultechnique that reduces the computational and mem-ory resources required to solve otherwise intractableproblems in computational science. The AMR strat-egy solves the system of partial differential equations(PDEs) on a relatively coarse grid, and dynamicallyrefines it in regions of scientific interest or where thecoarse grid error is too high for proper numericalresolution. HyperCLaw is a hybrid C++/FortranAMR code developed and maintained by CCSE atLBNL [6,13] where it is frequently used to solve sys-tems of hyperbolic conservation laws using a higher-order Godunov method.
The HyperCLaw code consists of an applicationslayer containing the physics classes defined in termsof virtual functions. The basic idea is that data blocksare managed in C++ in which ghost cells are filledand temporary storage is dynamically allocated sothat when the calls to the physics algorithms (usuallyfinite difference methods implemented in Fortran)are made, the same stencil can be used for all pointsand no special treatments are required. By structur-ing the software in this manner, the high level ob-jects that encapsulate the functionality for AMR andits parallelization are independent of the details ofthe physics algorithms and the problem being solved.This simplifies the software engineering process ofadding/replacing physics modules.
4.5.1 Experimental results
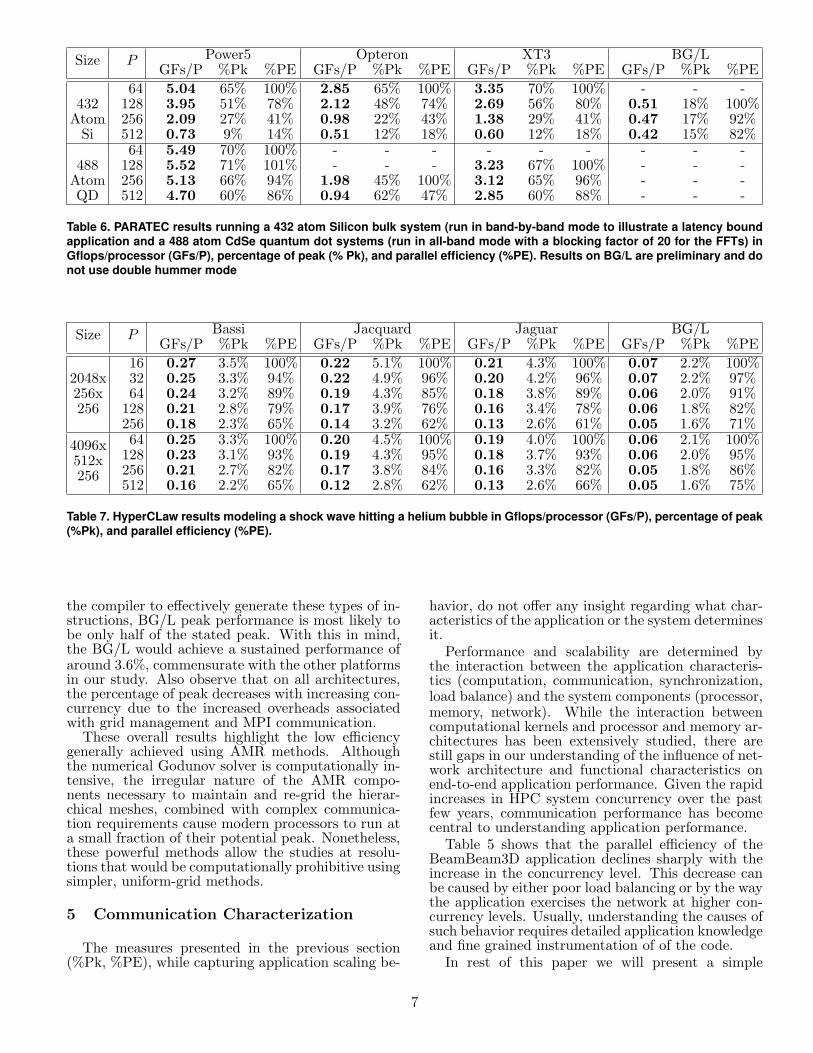
The HyperCLaw problem examined in this work pro-files a hyperbolic shock-tube calculation, where wemodel the interaction of a Mach 1.25 shock in air hit-ting a spherical bubble of helium. This case is anal-ogous to one of the experiments described by Haasand Sturtevant [8]. The helium is a factor of 0.139less dense than the surrounding air which causes theshock to accelerate as it enters the bubble and subse-quently generates baroclinic vorticity that dramati-cally deforms the bubble. The base computationalgrids for the two problems studied are 256x32x32and 512x64x32, respectively. The base grids wereadaptively refined by an initial factor of 2 and thena further factor of 4, leading to effective sizes of2048x256x256 and 4096x512x256, respectively.
Table 7 presents the performance behavior of ourAMR experiment on the four architectures evalu-ated in our study. In terms of absolute runtime,Bassi achieves the highest performance followed byJacquard, Jaguar, and finally BG/L. Note that allof the platforms achieve a very low percentage ofpeak, for example using the large problem configu-ration and 256 processors, Jacquard, Jaguar, Bassi,and BG/L achieve 3.8%, 3.3%, 2.7%, and 1.8% re-spectively. Recall that two achieve peak performanceon the BG/L, both (double hummer) FPUs must besaturated with work. Since in it is very difficult for
6
Power5 Opteron XT3 BG/LSize PGFs/P %Pk %PE GFs/P %Pk %PE GFs/P %Pk %PE GFs/P %Pk %PE
64 5.04 65% 100% 2.85 65% 100% 3.35 70% 100% - - -432 128 3.95 51% 78% 2.12 48% 74% 2.69 56% 80% 0.51 18% 100%
Atom 256 2.09 27% 41% 0.98 22% 43% 1.38 29% 41% 0.47 17% 92%Si 512 0.73 9% 14% 0.51 12% 18% 0.60 12% 18% 0.42 15% 82%
64 5.49 70% 100% - - - - - - - - -488 128 5.52 71% 101% - - - 3.23 67% 100% - - -
Atom 256 5.13 66% 94% 1.98 45% 100% 3.12 65% 96% - - -QD 512 4.70 60% 86% 0.94 62% 47% 2.85 60% 88% - - -
Table 6. PARATEC results running a 432 atom Silicon bulk system (run in band-by-band mode to illustrate a latency boundapplication and a 488 atom CdSe quantum dot systems (run in all-band mode with a blocking factor of 20 for the FFTs) inGflops/processor (GFs/P), percentage of peak (% Pk), and parallel efficiency (%PE). Results on BG/L are preliminary and donot use double hummer mode
Bassi Jacquard Jaguar BG/LSize PGFs/P %Pk %PE GFs/P %Pk %PE GFs/P %Pk %PE GFs/P %Pk %PE
16 0.27 3.5% 100% 0.22 5.1% 100% 0.21 4.3% 100% 0.07 2.2% 100%2048x 32 0.25 3.3% 94% 0.22 4.9% 96% 0.20 4.2% 96% 0.07 2.2% 97%256x 64 0.24 3.2% 89% 0.19 4.3% 85% 0.18 3.8% 89% 0.06 2.0% 91%256 128 0.21 2.8% 79% 0.17 3.9% 76% 0.16 3.4% 78% 0.06 1.8% 82%
256 0.18 2.3% 65% 0.14 3.2% 62% 0.13 2.6% 61% 0.05 1.6% 71%64 0.25 3.3% 100% 0.20 4.5% 100% 0.19 4.0% 100% 0.06 2.1% 100%4096x
128 0.23 3.1% 93% 0.19 4.3% 95% 0.18 3.7% 93% 0.06 2.0% 95%512x256 0.21 2.7% 82% 0.17 3.8% 84% 0.16 3.3% 82% 0.05 1.8% 86%256512 0.16 2.2% 65% 0.12 2.8% 62% 0.13 2.6% 66% 0.05 1.6% 75%
Table 7. HyperCLaw results modeling a shock wave hitting a helium bubble in Gflops/processor (GFs/P), percentage of peak(%Pk), and parallel efficiency (%PE).
the compiler to effectively generate these types of in-structions, BG/L peak performance is most likely tobe only half of the stated peak. With this in mind,the BG/L would achieve a sustained performance ofaround 3.6%, commensurate with the other platformsin our study. Also observe that on all architectures,the percentage of peak decreases with increasing con-currency due to the increased overheads associatedwith grid management and MPI communication.
These overall results highlight the low efficiencygenerally achieved using AMR methods. Althoughthe numerical Godunov solver is computationally in-tensive, the irregular nature of the AMR compo-nents necessary to maintain and re-grid the hierar-chical meshes, combined with complex communica-tion requirements cause modern processors to run ata small fraction of their potential peak. Nonetheless,these powerful methods allow the studies at resolu-tions that would be computationally prohibitive usingsimpler, uniform-grid methods.
5 Communication Characterization
The measures presented in the previous section(%Pk, %PE), while capturing application scaling be-
havior, do not offer any insight regarding what char-acteristics of the application or the system determinesit.
Performance and scalability are determined bythe interaction between the application characteris-tics (computation, communication, synchronization,load balance) and the system components (processor,memory, network). While the interaction betweencomputational kernels and processor and memory ar-chitectures has been extensively studied, there arestill gaps in our understanding of the influence of net-work architecture and functional characteristics onend-to-end application performance. Given the rapidincreases in HPC system concurrency over the pastfew years, communication performance has becomecentral to understanding application performance.
Table 5 shows that the parallel efficiency of theBeamBeam3D application declines sharply with theincrease in the concurrency level. This decrease canbe caused by either poor load balancing or by the waythe application exercises the network at higher con-currency levels. Usually, understanding the causes ofsuch behavior requires detailed application knowledgeand fine grained instrumentation of of the code.
In rest of this paper we will present a simple
7
methodology that combines aggregate metrics ofcommunication with aggregate metrics of computa-tion and a simple network performance model. Usingthis methodology, we can correlate the applicationbehavior with its scaling behavior and understand thecauses for degradation. Also, the choice of perfor-mance metrics allows us to characterize the impactof various network architectural features on scalingbehavior.
We utilize two tools to capture information aboutthe machines and applications in our study. For cap-turing characteristics of the various machine inter-connects, we use a modified version of the PMaCEFF BW benchmark [1], and to record the runtimecharacteristics of our applications, we use the Inte-grated Performance Monitoring tool [10].
5.1 Network Characteristics
One commonly used simple model for network per-formance is a linear timing model with the parame-ters latency and bandwidth. The latency captures thefixed cost of injecting a message and crossing the net-work while the bandwidth captures the cost of mov-ing the data across the network. Latency is the timetaken for a 0 byte transfer. The time to send a mes-sage of a particular size is Timesize = L + size/BW .
We use a modified version of the PingPong con-tained in EFF BW from the PMaC benchmarkingsuite. To characterize the latency and bandwidth ofthe machine, we run a parallel PingPong test on largesystem domain, where we randomly assign processorsinto pairs. This allows us to record the times fromPingPongs across various layers of the network, andwe use the median time to send a 0 byte message asthe observed one-way latency. Because for most ofthese machines (with the exception of BlueGene/L)a job may be fragmented across various segments ofthe total system, we use the median time as the la-tency, even though a best-case packed job would re-sult in faster point-to-point times, and a job com-pletely fragmented across the machine would resultin poorer latencies. Although using a best-case orworst-case latency would also provide us with inter-esting information, we chose to use the median timebecause it reflects a reasonable usual case where ap-plication nodes are somewhat spread across the ma-chine, but not completely.
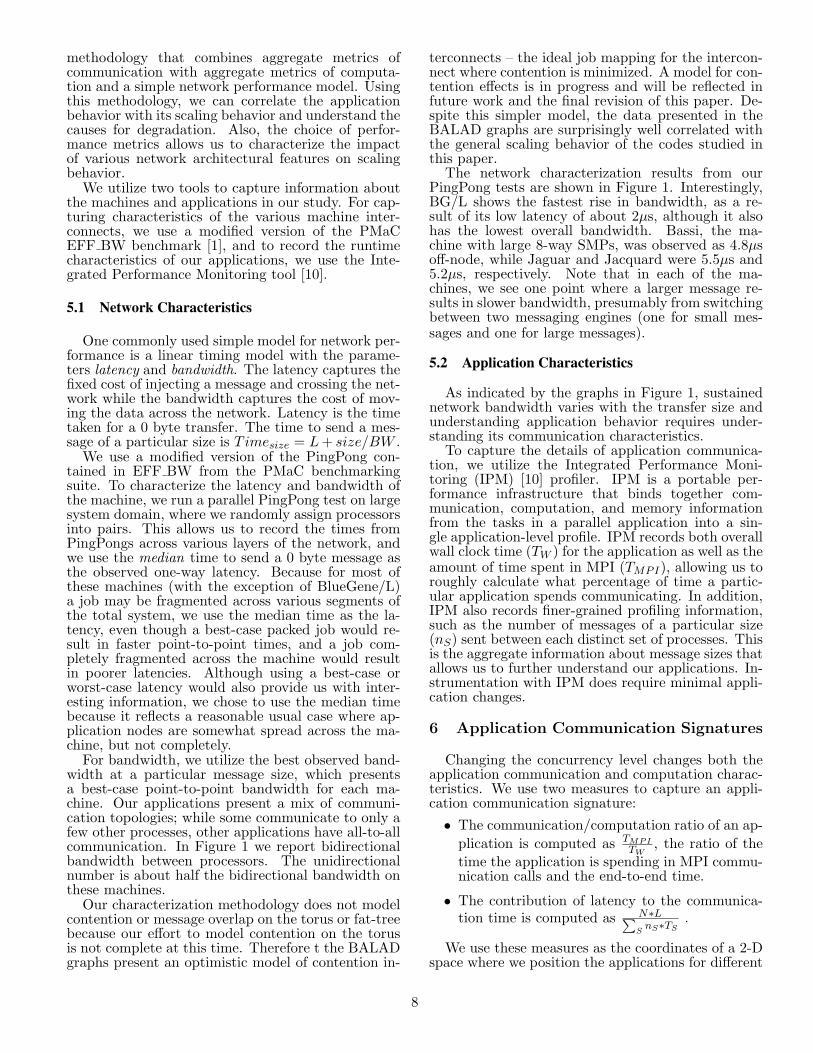
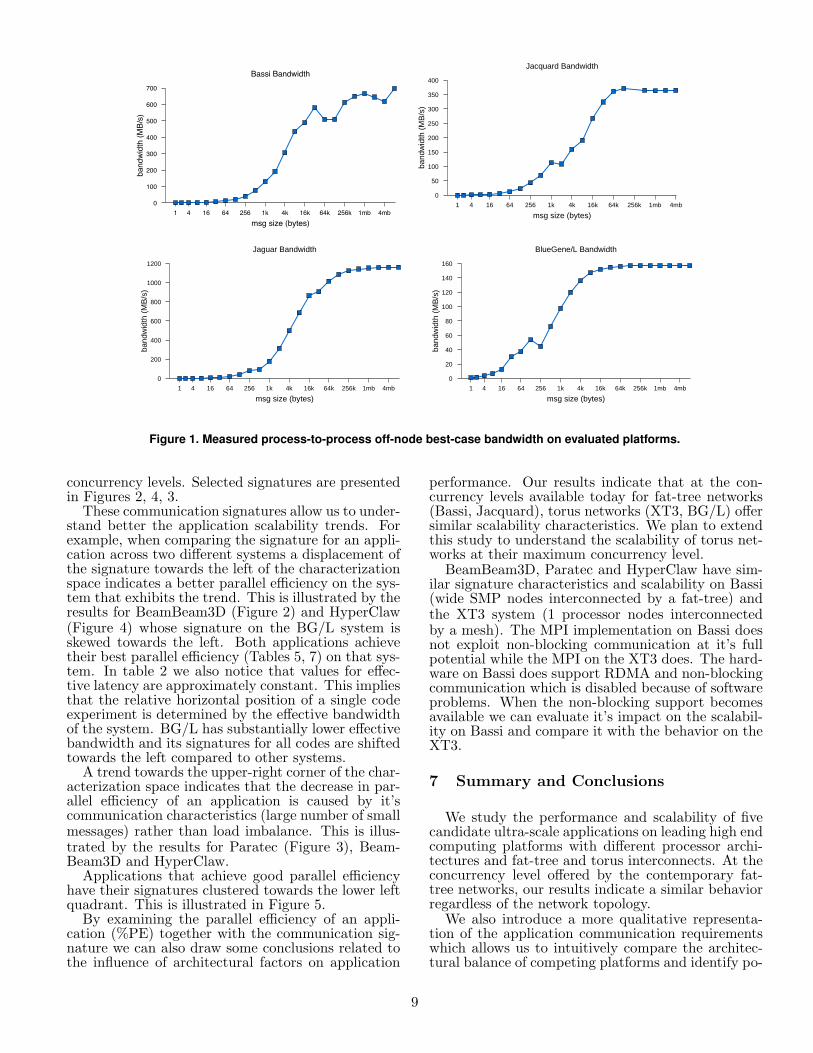
For bandwidth, we utilize the best observed band-width at a particular message size, which presentsa best-case point-to-point bandwidth for each ma-chine. Our applications present a mix of communi-cation topologies; while some communicate to only afew other processes, other applications have all-to-allcommunication. In Figure 1 we report bidirectionalbandwidth between processors. The unidirectionalnumber is about half the bidirectional bandwidth onthese machines.
Our characterization methodology does not modelcontention or message overlap on the torus or fat-treebecause our effort to model contention on the torusis not complete at this time. Therefore t the BALADgraphs present an optimistic model of contention in-
terconnects – the ideal job mapping for the intercon-nect where contention is minimized. A model for con-tention effects is in progress and will be reflected infuture work and the final revision of this paper. De-spite this simpler model, the data presented in theBALAD graphs are surprisingly well correlated withthe general scaling behavior of the codes studied inthis paper.
The network characterization results from ourPingPong tests are shown in Figure 1. Interestingly,BG/L shows the fastest rise in bandwidth, as a re-sult of its low latency of about 2µs, although it alsohas the lowest overall bandwidth. Bassi, the ma-chine with large 8-way SMPs, was observed as 4.8µsoff-node, while Jaguar and Jacquard were 5.5µs and5.2µs, respectively. Note that in each of the ma-chines, we see one point where a larger message re-sults in slower bandwidth, presumably from switchingbetween two messaging engines (one for small mes-sages and one for large messages).
5.2 Application Characteristics
As indicated by the graphs in Figure 1, sustainednetwork bandwidth varies with the transfer size andunderstanding application behavior requires under-standing its communication characteristics.
To capture the details of application communica-tion, we utilize the Integrated Performance Moni-toring (IPM) [10] profiler. IPM is a portable per-formance infrastructure that binds together com-munication, computation, and memory informationfrom the tasks in a parallel application into a sin-gle application-level profile. IPM records both overallwall clock time (TW ) for the application as well as theamount of time spent in MPI (TMPI), allowing us toroughly calculate what percentage of time a partic-ular application spends communicating. In addition,IPM also records finer-grained profiling information,such as the number of messages of a particular size(nS) sent between each distinct set of processes. Thisis the aggregate information about message sizes thatallows us to further understand our applications. In-strumentation with IPM does require minimal appli-cation changes.
6 Application Communication Signatures
Changing the concurrency level changes both theapplication communication and computation charac-teristics. We use two measures to capture an appli-cation communication signature:• The communication/computation ratio of an ap-
plication is computed as TMPITW
, the ratio of thetime the application is spending in MPI commu-nication calls and the end-to-end time.
• The contribution of latency to the communica-tion time is computed as N∗L∑
SnS∗TS
.
We use these measures as the coordinates of a 2-Dspace where we position the applications for different
8
msg size (bytes)1 4 16 64 256 1k 4k 16k 64k 256k 1mb 4mb
band
wid
th (M
B/s)
0
100
200
300
400
500
600
700
Bassi Bandwidth
msg size (bytes)1 4 16 64 256 1k 4k 16k 64k 256k 1mb 4mb
band
wid
th (
MB
/s)
0
50
100
150
200
250
300
350
400
Jacquard Bandwidth
msg size (bytes)1 4 16 64 256 1k 4k 16k 64k 256k 1mb 4mb
band
wid
th (
MB
/s)
0
200
400
600
800
1000
1200
Jaguar Bandwidth
msg size (bytes)1 4 16 64 256 1k 4k 16k 64k 256k 1mb 4mb
band
wid
th (
MB
/s)
0
20
40
60
80
100
120
140
160
BlueGene/L Bandwidth
Figure 1. Measured process-to-process off-node best-case bandwidth on evaluated platforms.
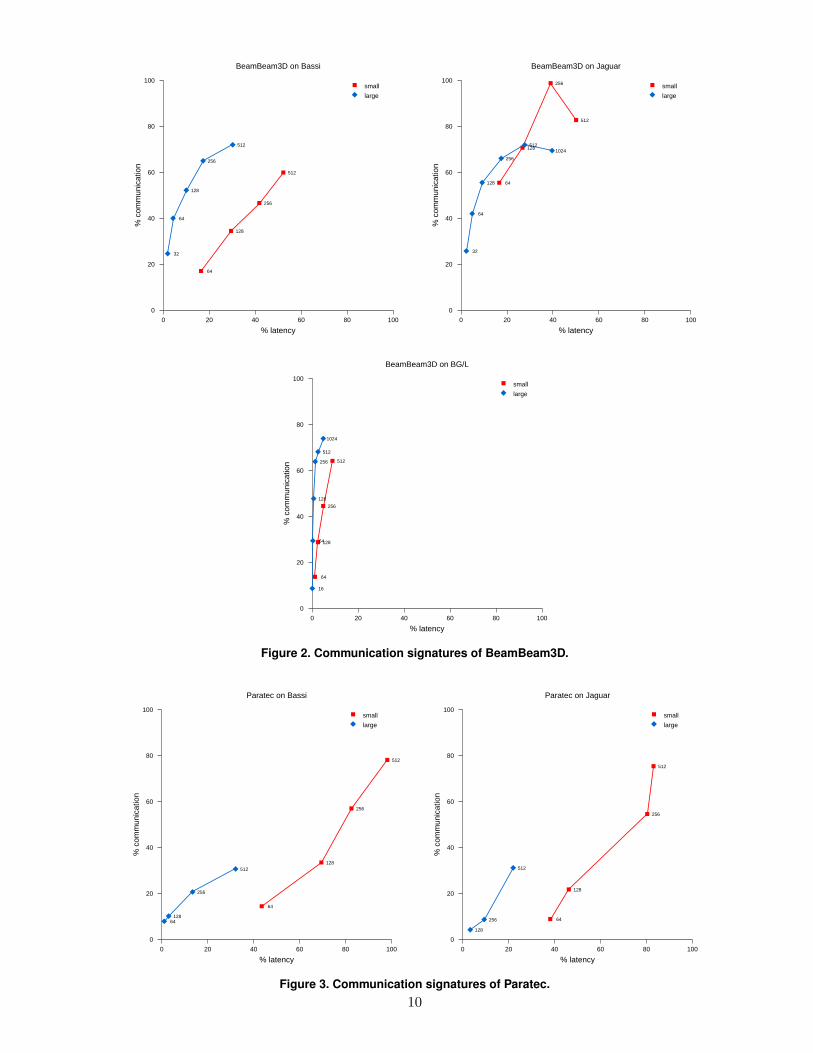
concurrency levels. Selected signatures are presentedin Figures 2, 4, 3.
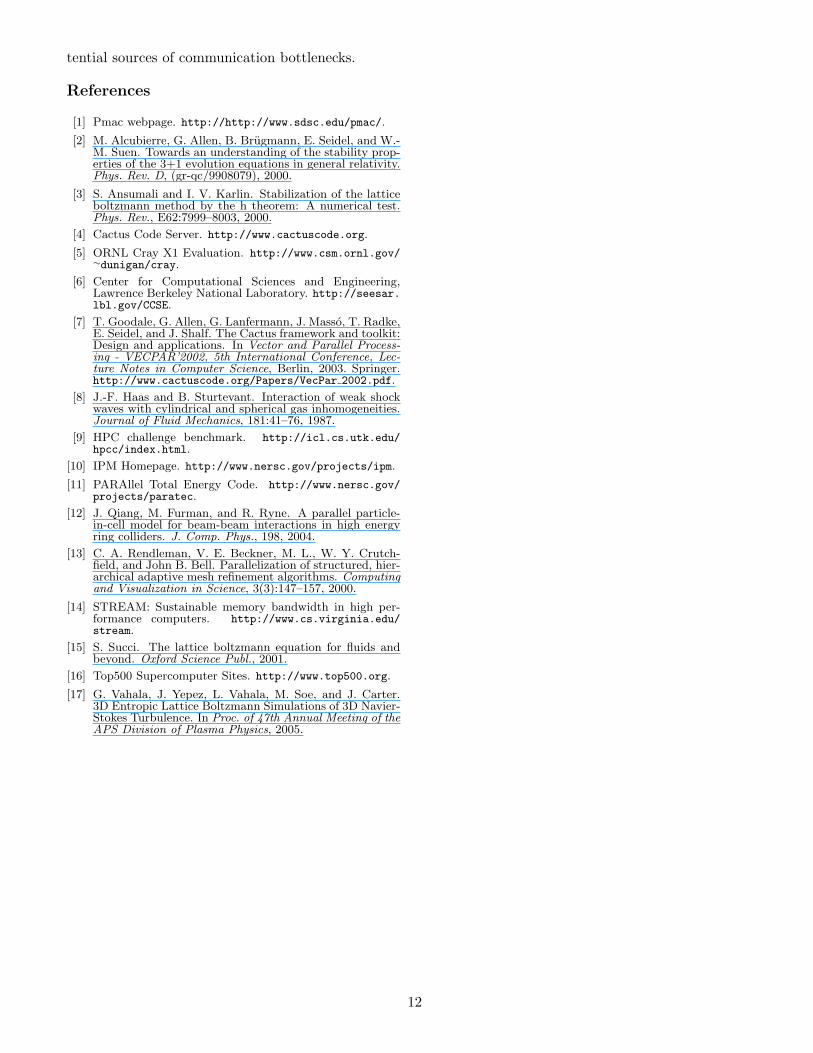
These communication signatures allow us to under-stand better the application scalability trends. Forexample, when comparing the signature for an appli-cation across two different systems a displacement ofthe signature towards the left of the characterizationspace indicates a better parallel efficiency on the sys-tem that exhibits the trend. This is illustrated by theresults for BeamBeam3D (Figure 2) and HyperClaw(Figure 4) whose signature on the BG/L system isskewed towards the left. Both applications achievetheir best parallel efficiency (Tables 5, 7) on that sys-tem. In table 2 we also notice that values for effec-tive latency are approximately constant. This impliesthat the relative horizontal position of a single codeexperiment is determined by the effective bandwidthof the system. BG/L has substantially lower effectivebandwidth and its signatures for all codes are shiftedtowards the left compared to other systems.
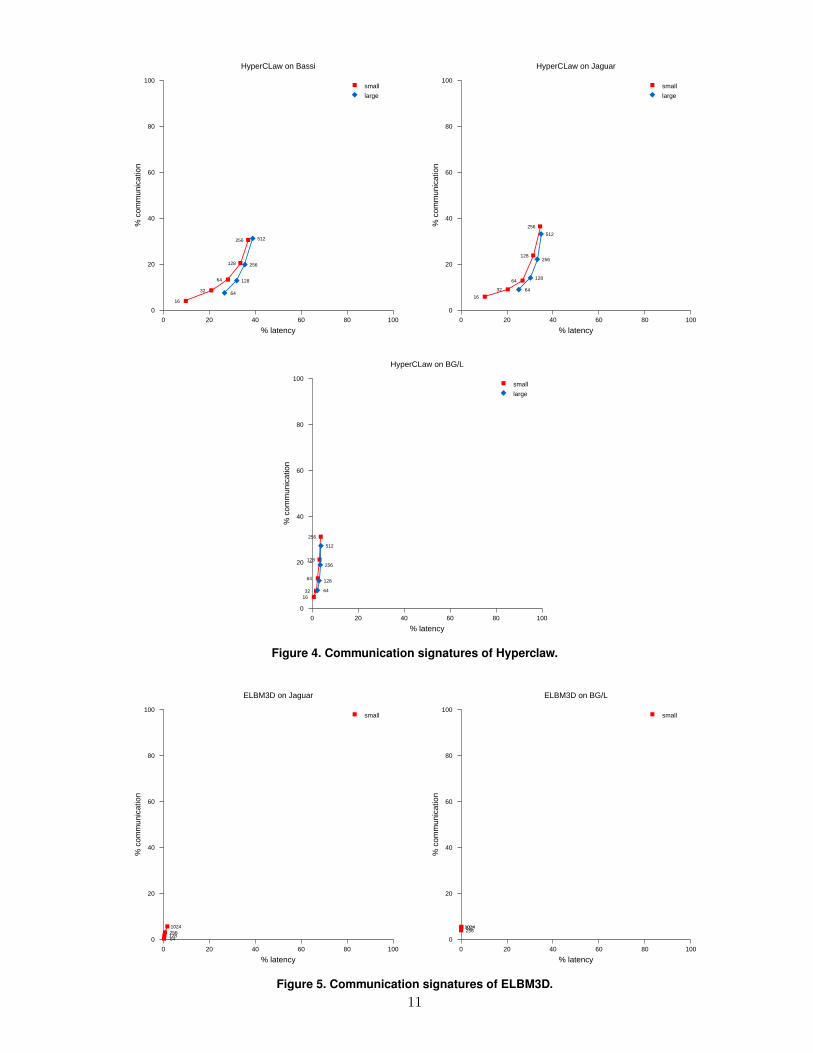
A trend towards the upper-right corner of the char-acterization space indicates that the decrease in par-allel efficiency of an application is caused by it’scommunication characteristics (large number of smallmessages) rather than load imbalance. This is illus-trated by the results for Paratec (Figure 3), Beam-Beam3D and HyperClaw.
Applications that achieve good parallel efficiencyhave their signatures clustered towards the lower leftquadrant. This is illustrated in Figure 5.
By examining the parallel efficiency of an appli-cation (%PE) together with the communication sig-nature we can also draw some conclusions related tothe influence of architectural factors on application
performance. Our results indicate that at the con-currency levels available today for fat-tree networks(Bassi, Jacquard), torus networks (XT3, BG/L) offersimilar scalability characteristics. We plan to extendthis study to understand the scalability of torus net-works at their maximum concurrency level.
BeamBeam3D, Paratec and HyperClaw have sim-ilar signature characteristics and scalability on Bassi(wide SMP nodes interconnected by a fat-tree) andthe XT3 system (1 processor nodes interconnectedby a mesh). The MPI implementation on Bassi doesnot exploit non-blocking communication at it’s fullpotential while the MPI on the XT3 does. The hard-ware on Bassi does support RDMA and non-blockingcommunication which is disabled because of softwareproblems. When the non-blocking support becomesavailable we can evaluate it’s impact on the scalabil-ity on Bassi and compare it with the behavior on theXT3.
7 Summary and Conclusions
We study the performance and scalability of fivecandidate ultra-scale applications on leading high endcomputing platforms with different processor archi-tectures and fat-tree and torus interconnects. At theconcurrency level offered by the contemporary fat-tree networks, our results indicate a similar behaviorregardless of the network topology.
We also introduce a more qualitative representa-tion of the application communication requirementswhich allows us to intuitively compare the architec-tural balance of competing platforms and identify po-
9
% latency0 20 40 60 80 100
% c
omm
unic
atio
n
0
20
40
60
80
100
64
128
256
512
32
64
128
256
512
small
large
BeamBeam3D on Bassi
% latency0 20 40 60 80 100
% c
omm
unic
atio
n
0
20
40
60
80
100
64
128
256
512
32
64
128
256
5121024
small
large
BeamBeam3D on Jaguar
% latency0 20 40 60 80 100
% c
omm
unic
atio
n
0
20
40
60
80
100
64
128
256
512
16
64
128
256
512
1024
small
large
BeamBeam3D on BG/L
Figure 2. Communication signatures of BeamBeam3D.
% latency0 20 40 60 80 100
% c
omm
unic
atio
n
0
20
40
60
80
100
64
128
256
512
64128
256
512
small
large
Paratec on Bassi
% latency0 20 40 60 80 100
% c
omm
unic
atio
n
0
20
40
60
80
100
64
128
256
512
128
256
512
small
large
Paratec on Jaguar
Figure 3. Communication signatures of Paratec.10
% latency0 20 40 60 80 100
% c
omm
unic
atio
n
0
20
40
60
80
100
16
32
64
128
256
64
128
256
512
small
large
HyperCLaw on Bassi
% latency0 20 40 60 80 100
% c
omm
unic
atio
n
0
20
40
60
80
100
16
32
64
128
256
64
128
256
512
small
large
HyperCLaw on Jaguar
% latency0 20 40 60 80 100
% c
omm
unic
atio
n
0
20
40
60
80
100
1632
64
128
256
64
128
256
512
small
large
HyperCLaw on BG/L
Figure 4. Communication signatures of Hyperclaw.
% latency0 20 40 60 80 100
% c
omm
unic
atio
n
0
20
40
60
80
100
641282561024
small
ELBM3D on Jaguar
% latency0 20 40 60 80 100
% c
omm
unic
atio
n
0
20
40
60
80
100
2565121024
small
ELBM3D on BG/L
Figure 5. Communication signatures of ELBM3D.11
tential sources of communication bottlenecks.
References
[1] Pmac webpage. http://http://www.sdsc.edu/pmac/.
[2] M. Alcubierre, G. Allen, B. Brugmann, E. Seidel, and W.-M. Suen. Towards an understanding of the stability prop-erties of the 3+1 evolution equations in general relativity.Phys. Rev. D, (gr-qc/9908079), 2000.
[3] S. Ansumali and I. V. Karlin. Stabilization of the latticeboltzmann method by the h theorem: A numerical test.Phys. Rev., E62:7999–8003, 2000.
[4] Cactus Code Server. http://www.cactuscode.org.
[5] ORNL Cray X1 Evaluation. http://www.csm.ornl.gov/∼dunigan/cray.
[6] Center for Computational Sciences and Engineering,Lawrence Berkeley National Laboratory. http://seesar.lbl.gov/CCSE.
[7] T. Goodale, G. Allen, G. Lanfermann, J. Masso, T. Radke,E. Seidel, and J. Shalf. The Cactus framework and toolkit:Design and applications. In Vector and Parallel Process-ing - VECPAR’2002, 5th International Conference, Lec-ture Notes in Computer Science, Berlin, 2003. Springer.http://www.cactuscode.org/Papers/VecPar 2002.pdf.
[8] J.-F. Haas and B. Sturtevant. Interaction of weak shockwaves with cylindrical and spherical gas inhomogeneities.Journal of Fluid Mechanics, 181:41–76, 1987.
[9] HPC challenge benchmark. http://icl.cs.utk.edu/hpcc/index.html.
[10] IPM Homepage. http://www.nersc.gov/projects/ipm.
[11] PARAllel Total Energy Code. http://www.nersc.gov/projects/paratec.
[12] J. Qiang, M. Furman, and R. Ryne. A parallel particle-in-cell model for beam-beam interactions in high energyring colliders. J. Comp. Phys., 198, 2004.
[13] C. A. Rendleman, V. E. Beckner, M. L., W. Y. Crutch-field, and John B. Bell. Parallelization of structured, hier-archical adaptive mesh refinement algorithms. Computingand Visualization in Science, 3(3):147–157, 2000.
[14] STREAM: Sustainable memory bandwidth in high per-formance computers. http://www.cs.virginia.edu/stream.
[15] S. Succi. The lattice boltzmann equation for fluids andbeyond. Oxford Science Publ., 2001.
[16] Top500 Supercomputer Sites. http://www.top500.org.
[17] G. Vahala, J. Yepez, L. Vahala, M. Soe, and J. Carter.3D Entropic Lattice Boltzmann Simulations of 3D Navier-Stokes Turbulence. In Proc. of 47th Annual Meeting of theAPS Division of Plasma Physics, 2005.
12
Related Documents