© 2014 VMware Inc. All rights reserved. Application Performance Management in the Cloud using Learning, Optimization, and Control Xiaoyun Zhu May 9, 2014

Welcome message from author
This document is posted to help you gain knowledge. Please leave a comment to let me know what you think about it! Share it to your friends and learn new things together.
Transcript
© 2014 VMware Inc. All rights reserved.
Application Performance Management in the Cloud using Learning, Optimization, and Control
Xiaoyun Zhu May 9, 2014

47%
34%
Source: “The hidden costs of managing applications in the cloud,” Compuware/Research In Action White Paper, Dec. 2012,
based on survey results from 468 CIOs in Americas, Europe, and Asia.
Rising adoption of cloud-based services
2
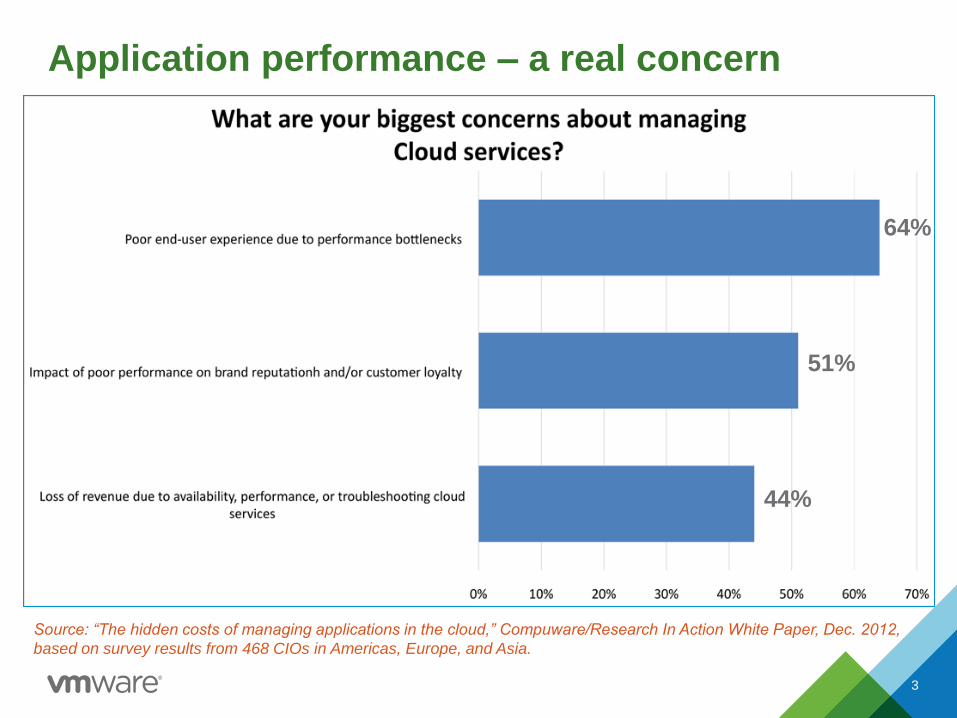
64%
51%
44%
Source: “The hidden costs of managing applications in the cloud,” Compuware/Research In Action White Paper, Dec. 2012,
based on survey results from 468 CIOs in Americas, Europe, and Asia.
Application performance – a real concern
3
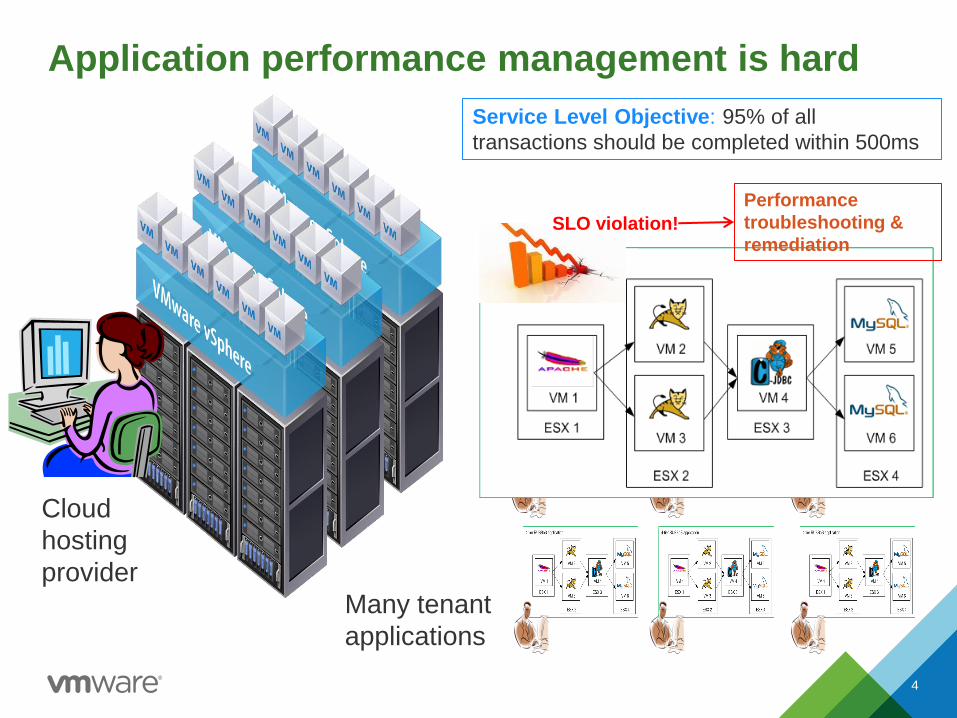
Application performance management is hard
4
Cloud
hosting
provider
Service Level Objective: 95% of all
transactions should be completed within 500ms
Many tenant
applications
SLO violation!
Performance
troubleshooting &
remediation

• On average, 46.2 hours spend in “war-room” scenarios each month
5
Source: Improving the usability of APM data: Essential capabilities and benefits. TRAC Research, June 2012, based on
survey data from 400 IT organizations worldwide
Challenges in managing application performance

APM-related problems we’re working on
• Real-time performance monitoring
Infrastructure-level vs. application-level monitoring
• Automated performance modeling
Knowledge-driven vs. data-driven
Linear vs. nonlinear models
Offline vs. online modeling
• Computer-assisted performance troubleshooting
Correlation & model based problem localization
• Service level remediation via auto-scaling
Horizontal vs. vertical scaling
6

Infrastructure-level performance monitoring
Physical host metrics
• System-level stats collected by the hypervisor e.g., esxtop – CPU, memory, disk, network, interrupt
• CPU stats
%USED, %RUN, %RDY, %SYS, %OVRLP, %CSTP, %WAIT, %IDLE, %SWPWT
• ~100s-1000s metrics per host!
VM metrics
• Resource usage stats collected by the guest OS
e.g., dstat, iostat
• ~10s metrics per VM
• Widely available on most platforms
• Available at a time scale of seconds to minutes
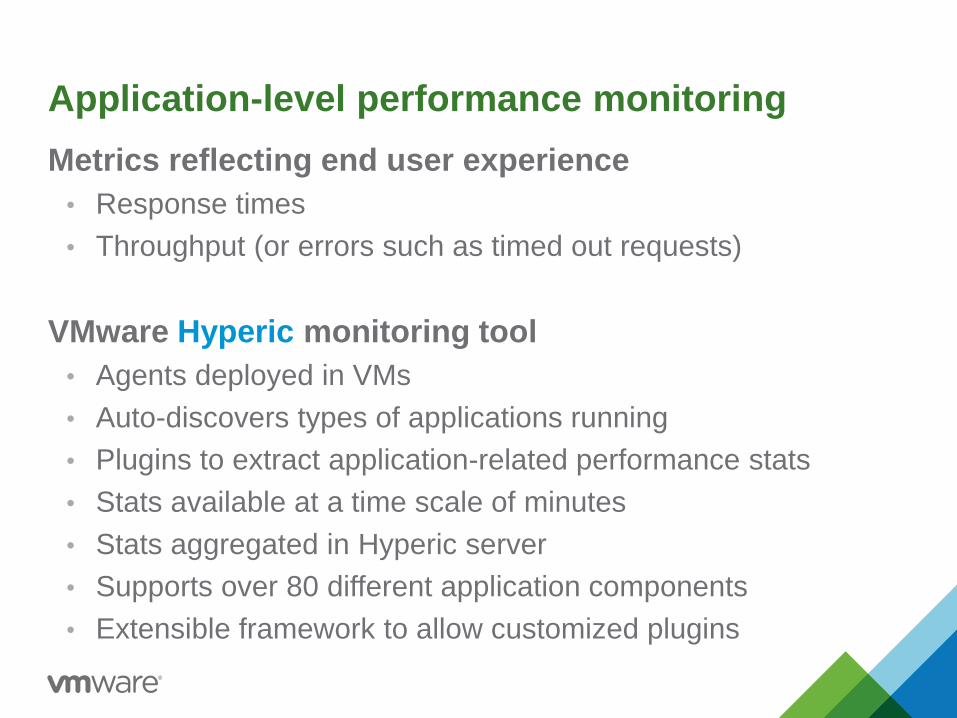
Application-level performance monitoring
Metrics reflecting end user experience
• Response times
• Throughput (or errors such as timed out requests)
VMware Hyperic monitoring tool
• Agents deployed in VMs
• Auto-discovers types of applications running
• Plugins to extract application-related performance stats
• Stats available at a time scale of minutes
• Stats aggregated in Hyperic server
• Supports over 80 different application components
• Extensible framework to allow customized plugins

Source: “APM-generated big data boom.” Netuitive & APMDigest, July 2012, based on survey of US & UK IT professionals.
APM-generated big data
• “APM tools were part of the huge explosion in metric collection, generating thousands of KPIs per application.”
• “83% of respondents agreed that metric data collection has grown >300% in the last 4 years alone.”
• “88% of companies are only able to analyze less than half of the metric data they collect… 45% analyze less than a quarter of the data.”
• “77% of respondents cannot effectively correlate business, customer experience, and IT metrics.”
9

10
“false
negatives”
Source: Improving the usability of APM data: Essential capabilities and benefits. TRAC Research, June 2012, based on
survey data from 400 IT organizations worldwide
Challenges in usability of performance data

The Semantic Gap challenge Correlating performance data from different sources
11

Better IT analytics for APM automation Three-pronged approach
12
Optimization
Control
Learning
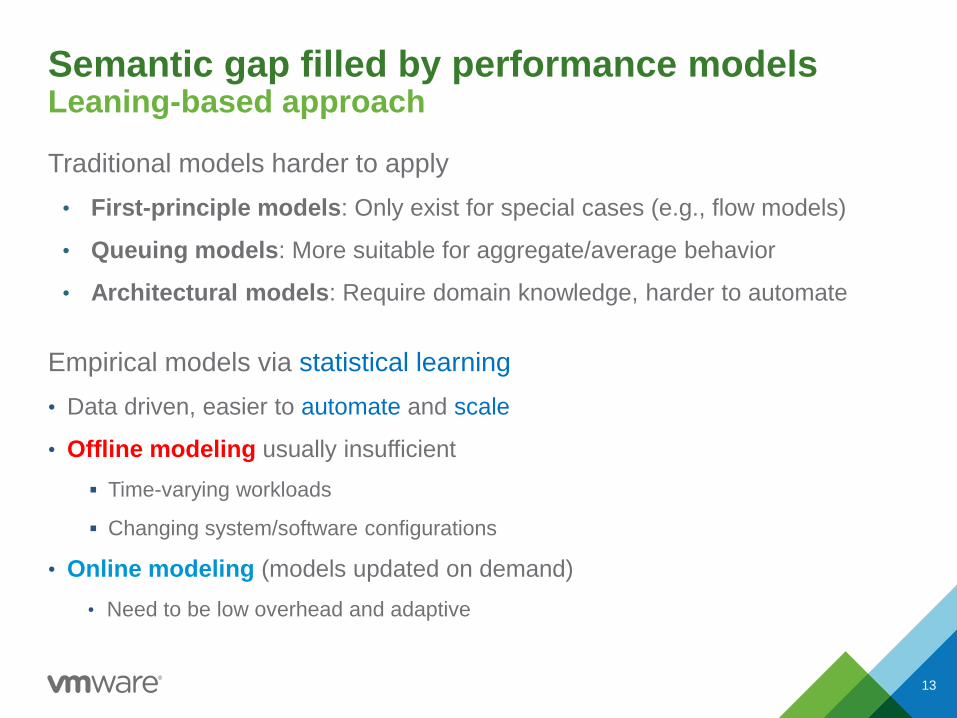
Semantic gap filled by performance models Leaning-based approach
Traditional models harder to apply
• First-principle models: Only exist for special cases (e.g., flow models)
• Queuing models: More suitable for aggregate/average behavior
• Architectural models: Require domain knowledge, harder to automate
Empirical models via statistical learning
• Data driven, easier to automate and scale
• Offline modeling usually insufficient
Time-varying workloads
Changing system/software configurations
• Online modeling (models updated on demand)
• Need to be low overhead and adaptive
13

Three key questions
• Q1: Which variables go into the model?
• Which system resources or parameters affect application performance the most?
• Correlation-based analysis to provide hints
• Q2: What kind of model should we use?
• Nonlinear models - better accuracy in general
• Linear regression models - cheaper to compute and easier to interpret
• Q3: How do we know our model is (still) accurate?
• Online change-point detection
14

Correlation and model based metric selection
15
Sensor Module
Application
performance metrics
(THP, MRT, RT95p)
Host metrics
(1000’s)
Guest VM metrics
(10’s)
Online Change-Point Detection Module
Re-train model? Yes/No
Online hypothesis testing
new samples
Model and top metrics
Metric Filtering & Model Building Module
Phase 1:
Correlation-based
filtering
Phase 2:
Model-based
filtering
raw metrics
Yes
suspicious
metrics
remediation
* P. Xiong et al. “vPerfGuard: An automated model-driven framework for application performance diagnosis in consolidated cloud
environments.” ICPE 2013.

16
Model retraining
Note: All models during the contention
period show CPU on ESX1 as the top
metric affecting application latency!
CPU contention
noisy neighbors
Intervals MRT Model
27 – 45 MRT = 1.13 H_ESX1_CPU_Util +
1.97 H_ESX4_Mem_Active – 89.7
46 – 74 MRT = 752.8
H_ESX1_CPULoad_1MinAvg – 562.9
75 – 89 MRT = 12.5
H_ESX1_Web_vCPU_Ready – 25.0
90 – 102 MRT = -7.70 H_ESX1_vCPU_Idle
+ 410.3
Case study: CPU contention with co-located VMs

Performance remediation via auto-scaling

Challenges to ensure application performance
• Enterprise applications are distributed or multi-tiered
• App-level performance depends on access to many resources
– HW: CPU, memory, cache, network, storage
– SW: threads, connection pool, locks
• Time-varying application behavior
• Dynamic and bursty workload demands
• Performance interference among co-hosted applications
18 18

Auto-Scaling to maintain application SLO
19
Front
Tier DB Tier
End
User
Application Latency

Auto-Scaling to Maintain Application SLO
20
Front
Tier DB Tier
End
User
Application Latency
Front
Tier DB Tier
End
User
Application Latency
Horizontal scaling

Auto-Scaling to Maintain Application SLO
21
Front
Tier DB Tier
End
User
Application Latency
Front
Tier DB Tier
End
User
Application Latency
Vertical scaling Horizontal scaling

Horizontal scaling of applications
Academic research
• Muse: Managing energy and server resources in hosting centers (SOSP’01)
• A hybrid reinforcement learning approach to autonomic resource allocation
(ICAC’05)
• A lot of recent work scaling clusters of VMs
Commercial systems
• Amazon Web Services: http://aws.amazon.com/autoscaling/
• RightScale: http://www.rightscale.com
• Rule-based: User-set thresholds/alerts on resource utilization or load metrics
• Learning-based: Ongoing work at VMware
22

Vertical scaling of resource containers Method 1: Dynamic resource control settings
• Available on various virtualization platforms
• For shared CPU, memory, disk I/O*, network I/O*:
– Reservation (R)* – minimum guaranteed amount of resources
– Limit (L) – upper bound on resource consumption (non-work-conserving)
– Shares (S) – relative priority during resource contention
• VM’s CPU/memory demand (D): estimated by hypervisor, critical to actual allocation
23
R
L
VM configured size (C) Actual-allocation =
f(R, L, S, D, Cap)
Available capacity
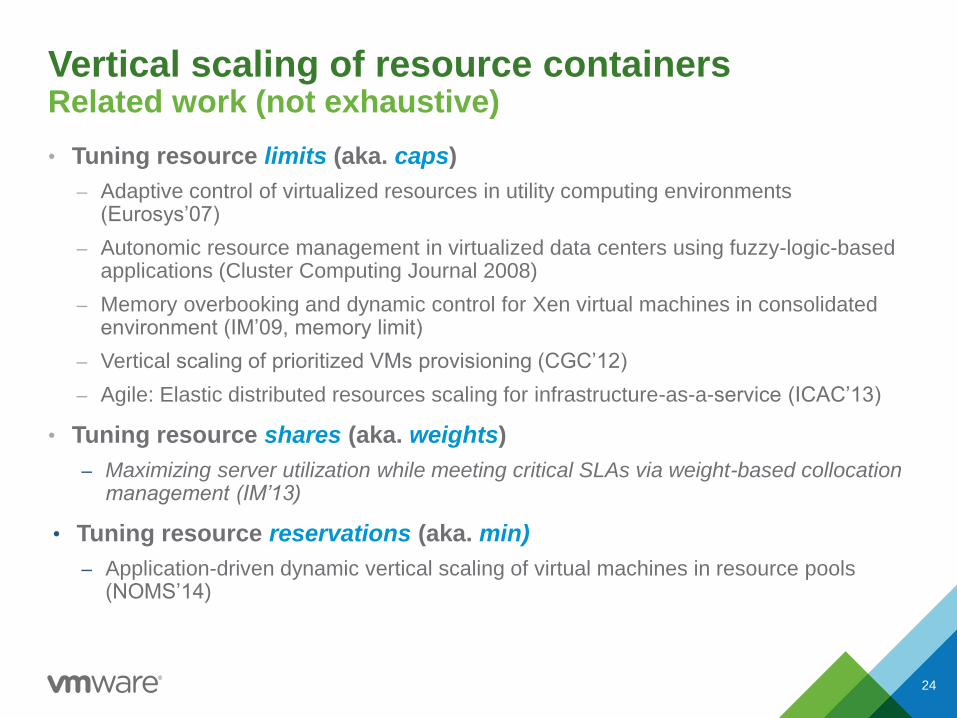
Vertical scaling of resource containers Related work (not exhaustive)
• Tuning resource limits (aka. caps)
– Adaptive control of virtualized resources in utility computing environments (Eurosys’07)
– Autonomic resource management in virtualized data centers using fuzzy-logic-based applications (Cluster Computing Journal 2008)
– Memory overbooking and dynamic control for Xen virtual machines in consolidated environment (IM’09, memory limit)
– Vertical scaling of prioritized VMs provisioning (CGC’12)
– Agile: Elastic distributed resources scaling for infrastructure-as-a-service (ICAC’13)
• Tuning resource shares (aka. weights)
– Maximizing server utilization while meeting critical SLAs via weight-based collocation management (IM’13)
• Tuning resource reservations (aka. min)
– Application-driven dynamic vertical scaling of virtual machines in resource pools (NOMS’14)
24
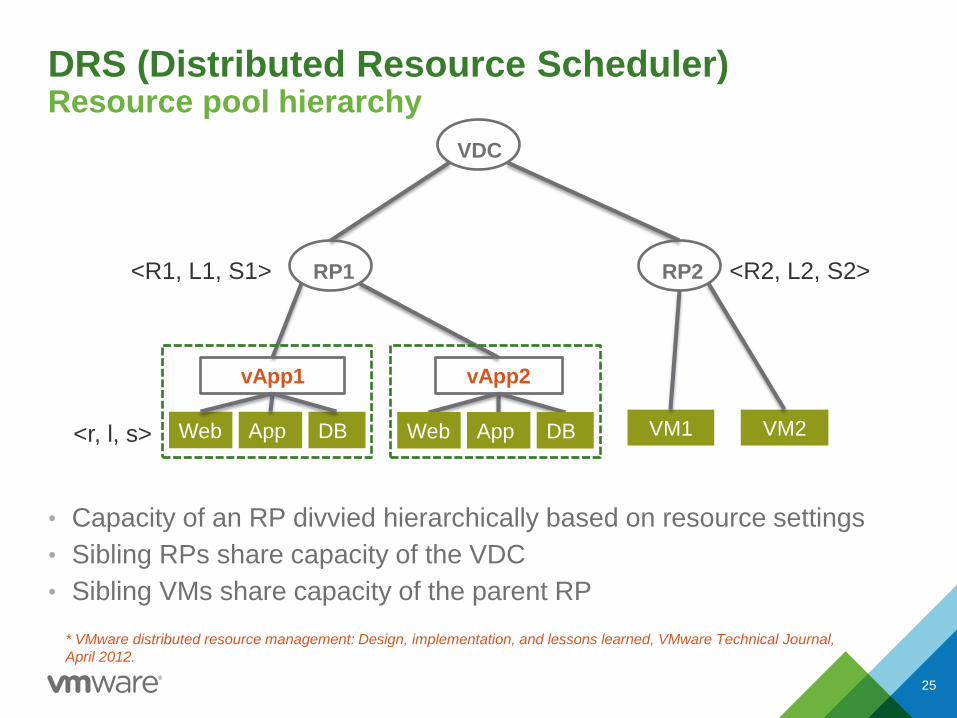
DRS (Distributed Resource Scheduler) Resource pool hierarchy
• Capacity of an RP divvied hierarchically based on resource settings
• Sibling RPs share capacity of the VDC
• Sibling VMs share capacity of the parent RP
25
VDC
RP1
VM1 VM2 Web App DB
vApp1
RP2
vApp2
Web App DB
<R1, L1, S1> <R2, L2, S2>
<r, l, s>
* VMware distributed resource management: Design, implementation, and lessons learned, VMware Technical Journal,
April 2012.
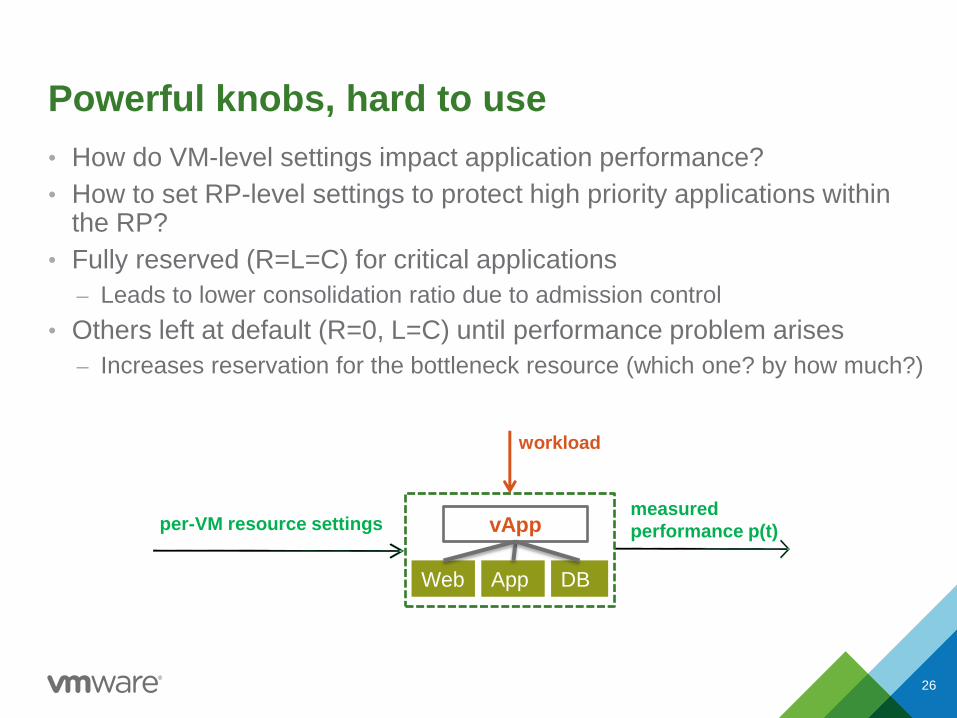
Powerful knobs, hard to use
• How do VM-level settings impact application performance?
• How to set RP-level settings to protect high priority applications within the RP?
• Fully reserved (R=L=C) for critical applications
– Leads to lower consolidation ratio due to admission control
• Others left at default (R=0, L=C) until performance problem arises
– Increases reservation for the bottleneck resource (which one? by how much?)
26
measured
performance p(t) per-VM resource settings
Web App DB
vApp
workload

Performance model learned for each vApp
Maps VM-level resource allocations to app-level performance
• Captures multiple tiers and multiple resource types
• Choose a linear regression model (easy to compute)
• Workload indirectly captured in model parameters
• Model parameters updated online in each interval (tracks nonlinearity)
27
per-VM memory usage ukm(t)
measured
performance p(t)
per-VM CPU usage ukc(t)
Web App DB
vApp Model
p(t) = f(u(t), l)
workload l

Rule-based vs. model-based feedback control
28
Rule-based Model-based
often involves no analytical
model
requires an analytical model
driven by intuition and domain
knowledge
driven by quantitative
relationships
hard to control multiple knobs at
the same time
captures interactions between
multiple metrics
no concern of dynamics considers dynamics and
transient responses
threshold and heuristics based standard control methods as
building blocks
no systematic consideration of
stability
systematically handles tradeoff
between stability & performance
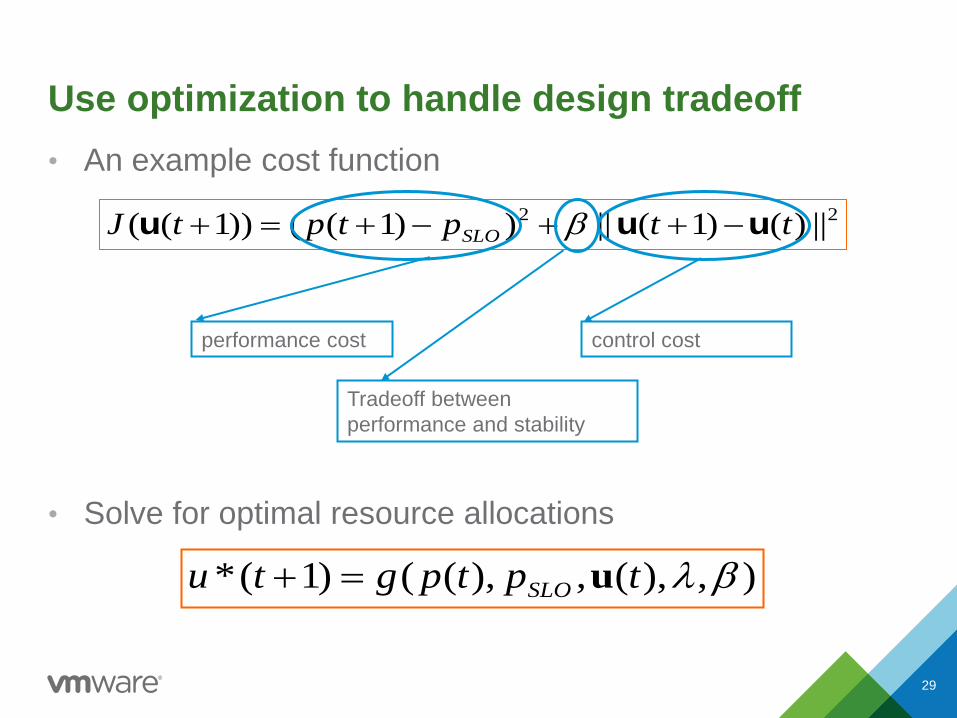
Use optimization to handle design tradeoff
• An example cost function
• Solve for optimal resource allocations
29
22 ||)()1(||))1(())1(( ttptptJ SLO uuu
Tradeoff between
performance and stability
performance cost control cost
),),(,),(()1(* ltptpgtu SLO u
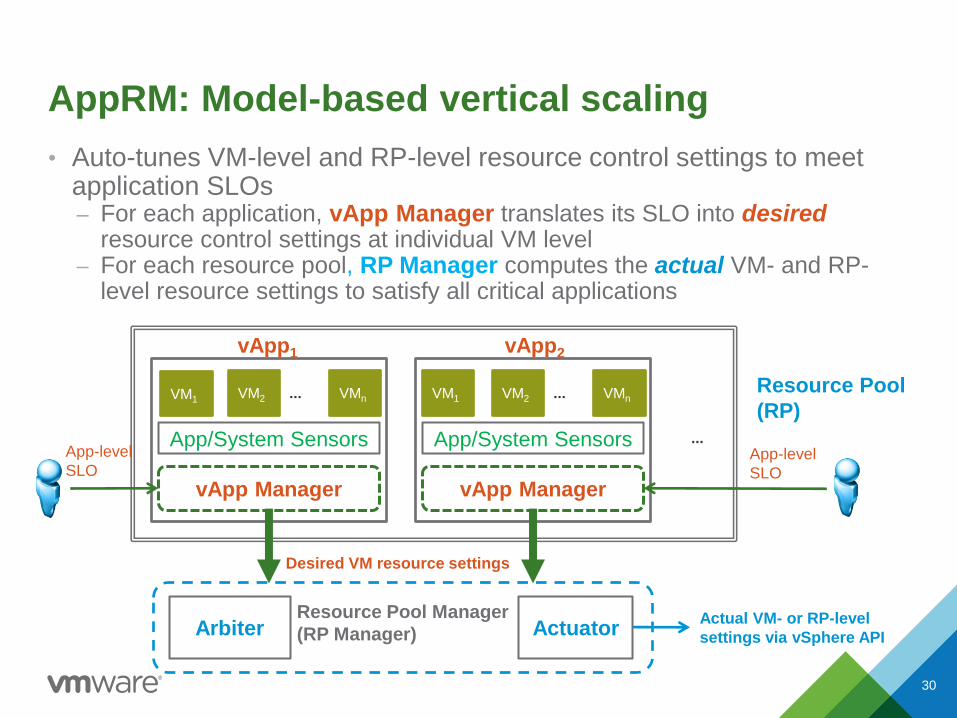
AppRM: Model-based vertical scaling
• Auto-tunes VM-level and RP-level resource control settings to meet application SLOs – For each application, vApp Manager translates its SLO into desired
resource control settings at individual VM level – For each resource pool, RP Manager computes the actual VM- and RP-
level resource settings to satisfy all critical applications
30
Arbiter Actuator
Desired VM resource settings
VM1 VM2 VMn ...
App/System Sensors
vApp Manager
VM2 VMn ...
App/System Sensors
vApp Manager
VM1
vApp1 vApp2
Actual VM- or RP-level
settings via vSphere API
...
Resource Pool
(RP)
App-level
SLO
App-level
SLO
Resource Pool Manager
(RP Manager)
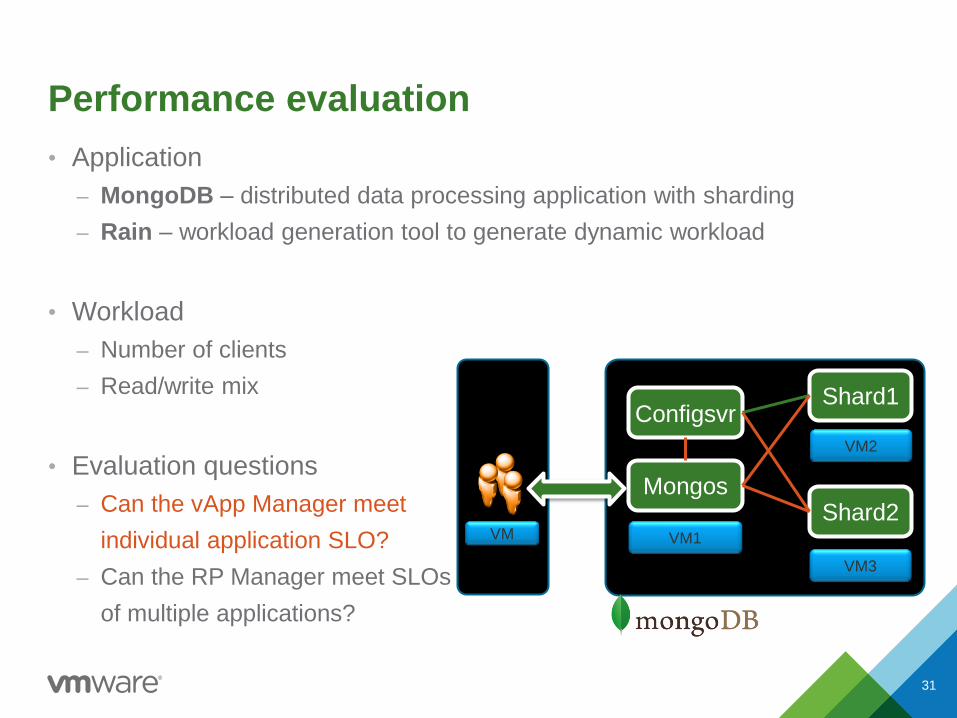
Performance evaluation
• Application
– MongoDB – distributed data processing application with sharding
– Rain – workload generation tool to generate dynamic workload
• Workload
– Number of clients
– Read/write mix
• Evaluation questions
– Can the vApp Manager meet
individual application SLO?
– Can the RP Manager meet SLOs
of multiple applications?
31
VM
Shard1
Shard2
Configsvr
Mongos
VM1
VM2
VM3
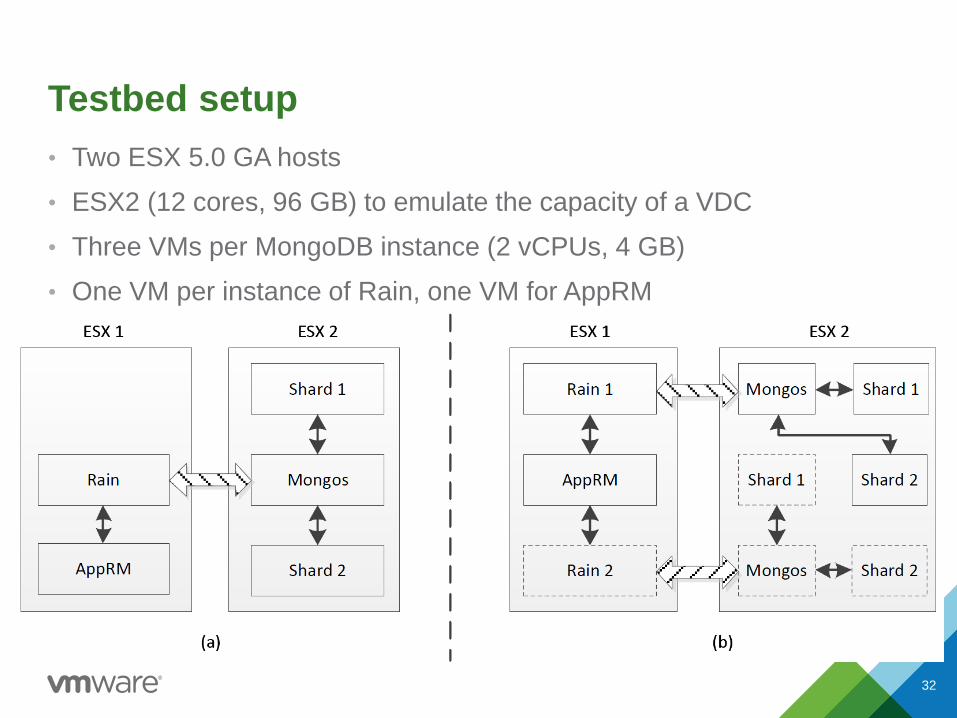
Testbed setup
• Two ESX 5.0 GA hosts
• ESX2 (12 cores, 96 GB) to emulate the capacity of a VDC
• Three VMs per MongoDB instance (2 vCPUs, 4 GB)
• One VM per instance of Rain, one VM for AppRM
32
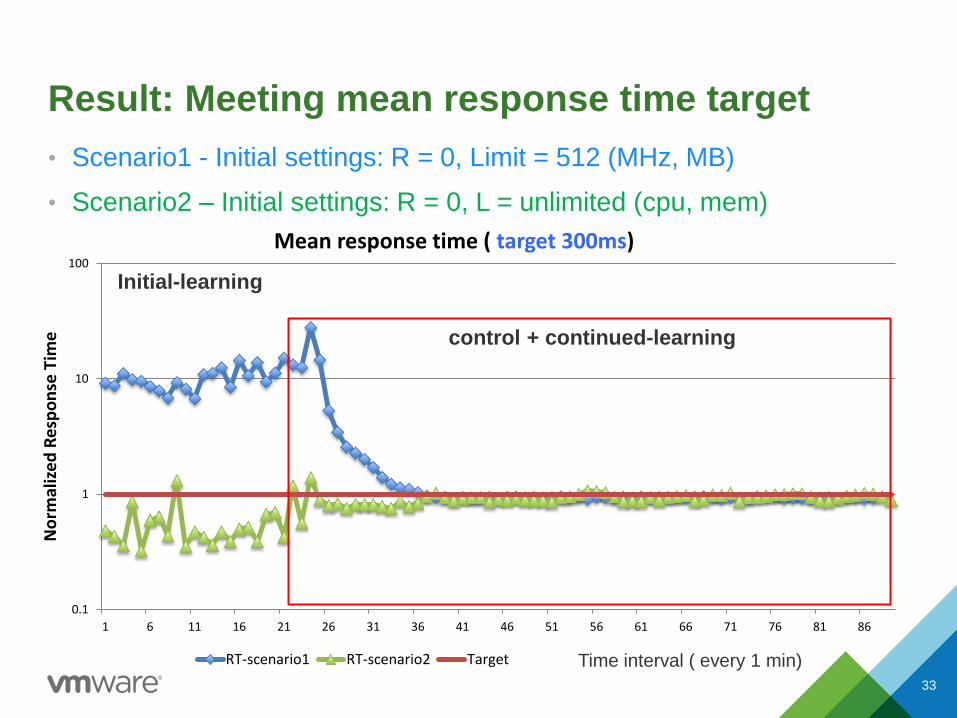
0.1
1
10
100
1 6 11 16 21 26 31 36 41 46 51 56 61 66 71 76 81 86
No
rmal
ize
d R
esp
on
se T
ime
Mean response time ( target 300ms)
RT-scenario1 RT-scenario2 Target
control + continued-learning
Time interval ( every 1 min)
Result: Meeting mean response time target
• Scenario1 - Initial settings: R = 0, Limit = 512 (MHz, MB)
• Scenario2 – Initial settings: R = 0, L = unlimited (cpu, mem)
33
Initial-learning

Resource utilization (under-provisioned case)
• Target response time = 300 ms
• Initial setting R = 0, L = 512 MHz/MB (under-provisioned)
34
0
0.01
0.02
0.03
0.04
0.05
0.06
0.07
0.08
0.09
1 11 21 31 41 51 61 71 81
CP
U u
tiliz
atio
n
CPU utilization
Mongos-CPU Shard1-CPU Shard2-CPU
0
0.02
0.04
0.06
0.08
0.1
0.12
0.14
0.16
0.18
0.2
1 11 21 31 41 51 61 71 81
Mem
ory
uti
lizat
ion
Memory utilization
Mongos-MEM Shard1-MEM Shard2-MEM
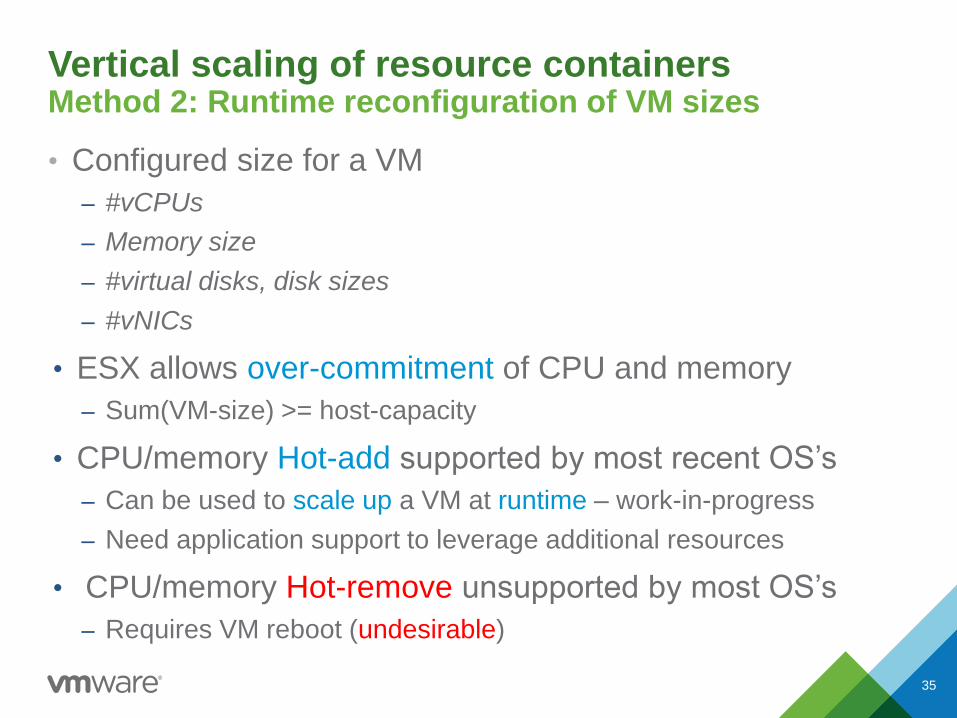
Vertical scaling of resource containers Method 2: Runtime reconfiguration of VM sizes
• Configured size for a VM
– #vCPUs
– Memory size
– #virtual disks, disk sizes
– #vNICs
• ESX allows over-commitment of CPU and memory
– Sum(VM-size) >= host-capacity
• CPU/memory Hot-add supported by most recent OS’s
– Can be used to scale up a VM at runtime – work-in-progress
– Need application support to leverage additional resources
• CPU/memory Hot-remove unsupported by most OS’s
– Requires VM reboot (undesirable)
35
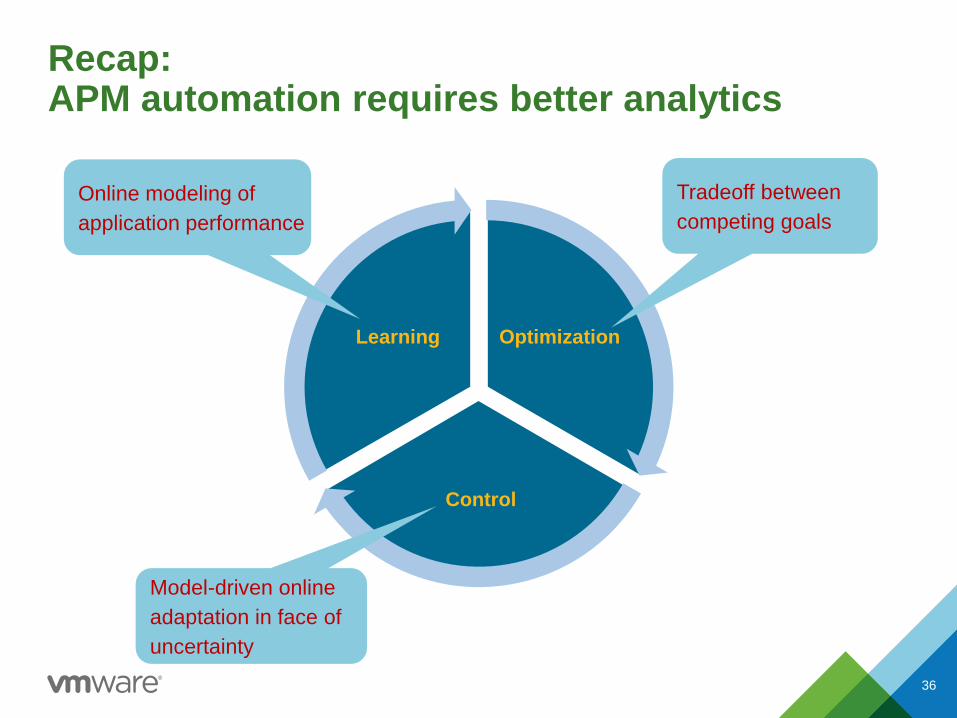
Recap: APM automation requires better analytics
36
Optimization
Control
Learning
Online modeling of
application performance
Tradeoff between
competing goals
Model-driven online
adaptation in face of
uncertainty


References
• X. Zhu, et al. “What does control theory bring to systems research?” ACM SIGOPS Operating Systems Review, 43(1), January 2009.
• P. Padala et al. “Automated control of multiple virtualized resources.” Eurosys 2009.
• A. Gulati et al. “Cloud scale resource management: Challenges and techniques.”
HotCloud 2011.
• A. Gulati et al. “VMware distributed resource management: Design, implementation, and
lessons learned.” VMware Technical Journal, Vol. 1(1), April 2012.
• P. Xiong et al. “vPerfGuard: An automated model-driven framework for application
performance diagnosis in consolidated cloud environments.” ICPE 2013.
• A. Gulati , “Towards proactive resource management in virtualized datacenters,”
RESoLVE 2013.
• L. Lu, et al., “Application-Driven dynamic vertical scaling of virtual machines in resource
pools.” to appear at NOMS 2014.
38
Related Documents