1 APPLICATION OF ULTRA-VIOLET RADIATION TO CONTROL BACTERIAL GROWTH IN THE RO FEED WATER FROM NANOFILTRATION MEMBRANES 1 Hassan A. Munshi, Mohamed O. Saeed, Troy N. Green, Ali A. Al-Hamza, Mohammad Farooque and Abdul Rahim A. Ismail Saline Water Conversion Corporation P.O.Box 8328, Al-Jubail -31951, Saudi Arabia Tel: + 966-3-343 0012, Fax: + 966-3-343 1615 Email: [email protected] SUMMARY The study was carried out to evaluate the effectiveness of UV treatment on bacterial growth in a NF-SWRO Pilot Plant at Al-Jubail. The study was divided into five phases: (i) regular operation stage (without UV), (ii) operation under UV-radiation at raw seawater (RSW) inlet, (iii) plant operation under UV- radiation at RSW inlet and up-stream of NF membrane, at the same time (iv) plant operation under UV-radiation ahead of the NF membrane and (v) the operation phase with the least biofilm potential and higher percentage of biofouling control (Phase #IV) was selected and investigated further. Water samples were collected from five locations: RSW, after UV unit (AUV), after media filter (AMF), after cartridge filter (ACF), nanofiltration permeate (NFP) and nanofiltration brine (NFB). Bacterial count, bacterial aftergrowth, biofilm, TOC, PO 4 , pH and conductivity were estimated for all these samples. The study showed up to 99.15% reduction in bacterial counts after UV treatment as compared to raw seawater at different study phases suggesting an effective performance of UV sterilization. However, an increase in bacterial count was noticed at AMF and ACF location. Presumably, due to recovery of bacteria these filters and in storage tank ACF. Laboratory studies also showed that, incubation of UV treated samples for 48-h resulted in bacterial recovery or aftergrowth. AUV and NFP also registered reduced TOC, nitrite and phosphate levels in the feed water indicating the presence of nutrient scavengers before the NF membrane. A decline in phosphate, nitrite and TOC levels was also found in 48-h incubated samples indicating nutrient up-take by bacteria. The study suggests that while UV treatment may considerably 1 Issued as Technical Report No. TR: APP 3805/99001 in September 2001

Welcome message from author
This document is posted to help you gain knowledge. Please leave a comment to let me know what you think about it! Share it to your friends and learn new things together.
Transcript
1
APPLICATION OF ULTRA-VIOLET RADIATION TO CONTROL BACTERIAL GROWTH IN THE RO FEED WATER FROM NANOFILTRATION MEMBRANES1
Hassan A. Munshi, Mohamed O. Saeed, Troy N. Green, Ali A. Al-Hamza, Mohammad Farooque and Abdul Rahim A. Ismail
Saline Water Conversion Corporation
P.O.Box 8328, Al-Jubail -31951, Saudi Arabia Tel: + 966-3-343 0012, Fax: + 966-3-343 1615
Email: [email protected] SUMMARY The study was carried out to evaluate the effectiveness of UV treatment on
bacterial growth in a NF-SWRO Pilot Plant at Al-Jubail. The study was divided
into five phases: (i) regular operation stage (without UV), (ii) operation under
UV-radiation at raw seawater (RSW) inlet, (iii) plant operation under UV-
radiation at RSW inlet and up-stream of NF membrane, at the same time (iv)
plant operation under UV-radiation ahead of the NF membrane and (v) the
operation phase with the least biofilm potential and higher percentage of
biofouling control (Phase #IV) was selected and investigated further. Water
samples were collected from five locations: RSW, after UV unit (AUV), after
media filter (AMF), after cartridge filter (ACF), nanofiltration permeate (NFP)
and nanofiltration brine (NFB). Bacterial count, bacterial aftergrowth, biofilm,
TOC, PO4, pH and conductivity were estimated for all these samples. The
study showed up to 99.15% reduction in bacterial counts after UV treatment
as compared to raw seawater at different study phases suggesting an
effective performance of UV sterilization. However, an increase in bacterial
count was noticed at AMF and ACF location. Presumably, due to recovery of
bacteria these filters and in storage tank ACF. Laboratory studies also
showed that, incubation of UV treated samples for 48-h resulted in bacterial
recovery or aftergrowth. AUV and NFP also registered reduced TOC, nitrite
and phosphate levels in the feed water indicating the presence of nutrient
scavengers before the NF membrane. A decline in phosphate, nitrite and TOC
levels was also found in 48-h incubated samples indicating nutrient up-take by
bacteria. The study suggests that while UV treatment may considerably
1 Issued as Technical Report No. TR: APP 3805/99001 in September 2001
2
reduce bacterial counts in a NF-SWRO system at a pilot plant, bacterial
recovery was evident in a manner noticed in the process of
chlorination/dechlorination. Applying UV treatment after filtration and storage
system and after the NF membrane may result in a higher percentage of
bacterial reduction and less biofilm formation because UV-radiation is most
effective in pure water.
1. INTRODUCTION Since the early days sunlight has been used in the preservation of foodstuff. Scientific
development helped in discovering the lethal effect of sunlight on microbes due to
exposure to UV radiation. Further development led to the manufacture of artificial
UV-radiation units. Recently, the use of UV-radiation as a effective disinfecting agent
has been well developed and applied on a large scale in treatment of wastewater and
drinking water [1].
The germicidal effects of UV-radiation at wavelengths ranging from 227 to 329nm
were known as early as 1900 [2]. The action of UV spectrum exhibits a maximum at a
wavelength of 270nm for most microorganism’s [3]. UV-radiation at wavelengths
lower than 200nm is classified as non-ionizing radiation. It is well established that
killing of microbial cells by UV-radiation is primarily due to its action on
deoxyribonucleic acid (DNA). Bacteria, phages, viruses and organic micropollutants
are also killed or reduced by photochemical wet combustion down to or below
detection limits of organic carbon [4]. Therefore UV sterilization has become a
practical solution for safe disinfection of drinking water. Also, usage of medium
pressure lamps with small reactors has helped to substantially reduce the capital costs
of UV treatment [5].
Seawater Reverse Osmosis (SWRO) desalination plants face biofouling problems
from bacteria originating from feed seawater. The problem is most evident when
using surface seawater as a feed for SWRO plants. Biofouling leads to decreased
SWRO membrane performance and thus affects plants’ operation. Once bacteria
reach to the RO membrane, they colonize the membrane surface building a biofilm
3
and causing membrane fouling. This affects membrane permeability and decreases
salt rejection.
Most disinfection strategies to control bacterial growth in SWRO plants use
chemicals. Control of bacterial growth by chemical disinfectants depends on many
factors, such as chemical concentration, its mode of action, contact time, density of
organisms and total suspended solids (TSS) of feed water. These factors make it often
extremely difficult to attain absolute disinfection. In addition, chemical disinfectants
like chlorine and its derivatives may be hazardous to health. Chlorine, which is a
widely accepted biocide, is known to oxidize and degrade the humic substances in
seawater, thus, resulting in smaller molecules, which are assimilable organic carbon
(AOC) [6]. The AOC in turn is a good nutrient source for bacteria [7] and under such
situations could also lead to rapid biofilm formation in SWRO plants [8]. Chlorination
may also enhance the formation of trihalomethanes which are said to be carcinogenic.
Filtration is an effective method to control biofouling of RO membranes and different
types of filtration media are used. Presswood [9] recorded the history of membrane
filtration techniques. Earlier, this technique had been used to control bacterial
contamination of drinking water. Bechhold was credited with the use of ultrafiltration
in 1907. He used a membrane filter of less than 10 nm pore size coupled with air
pressure. Hassan et al., [10] introduced NF membranes to pretreat SWRO feed. NF
membranes have the capability of rejecting particles/molecules of up to one nm size.
Bacterial cells are normally between 0.5-5µm, and are therefore retained on the NF
membrane surface. These bacteria should be disinfected or otherwise they could form
biofilm on membrane surface. Bacterial disinfection is essential for the treatment of
feed for NF-softening plants [11] and in water treatment by NF-RO systems [12].
A study on UV light disinfection [13] in an SWRO pilot plant showed a 90-99.9%
reduction in bacteria present in raw seawater after UV treatment. Since NF product
water used as feed for RO membranes is much cleaner than that of a conventional RO
pretreatment feed, a UV-radiation disinfection will be more efficient in controlling
bacterial growth in NF treated RO feed water. As presence of bacteria in consider
numbers at the NFP has been reported earlier (Personal communication and also Ref.
4
23). Subsequently, biofouling potential of RO membranes will decrease. Moreover,
UV treatment has other advantages. It has immediate germicidal effect. Being a
closed system, it is safe and it requires only a small space for equipment [14].
However, incorrect application of UV-radiation in feed water treatment can be
unsuccessful [15]. Determining the right dosage and locations of UV unit for a system
is essential. The present study is aimed to evaluate the effectiveness of UV-radiation
as a disinfection of NF-SWRO feed.
2. OBJECTIVES
The present study was carried out with the following objectives:
1. To test the efficacy of UV-radiation in removing/controlling bacterial growth
and attachment in nanofiltration feed and product water.
2. To measure the effect of UV-radiation on nutrient composition of water.
3. To carry out cost analysis comparing UV-disinfection cost to that of the
conventional chlorination/dechlorination.
3. EXPERIMENTAL
3.1 NF-SWRO System Description at the R&D Center Pilot Plant The present study was carried out on two different UV units. The first two stages of
experiment were carried out on Unit #1, which is capable of operating at a feed flow
rate of 7 m3/h equipped with a Fluid Type Medium Pressure UV Sterilization System
(300 watt at 257.7 nm) for disinfetion of feed seawater [16]. The last three stages of
the experiment were carried out using Unit #2, with a feed flow rate of 5 m3/h.
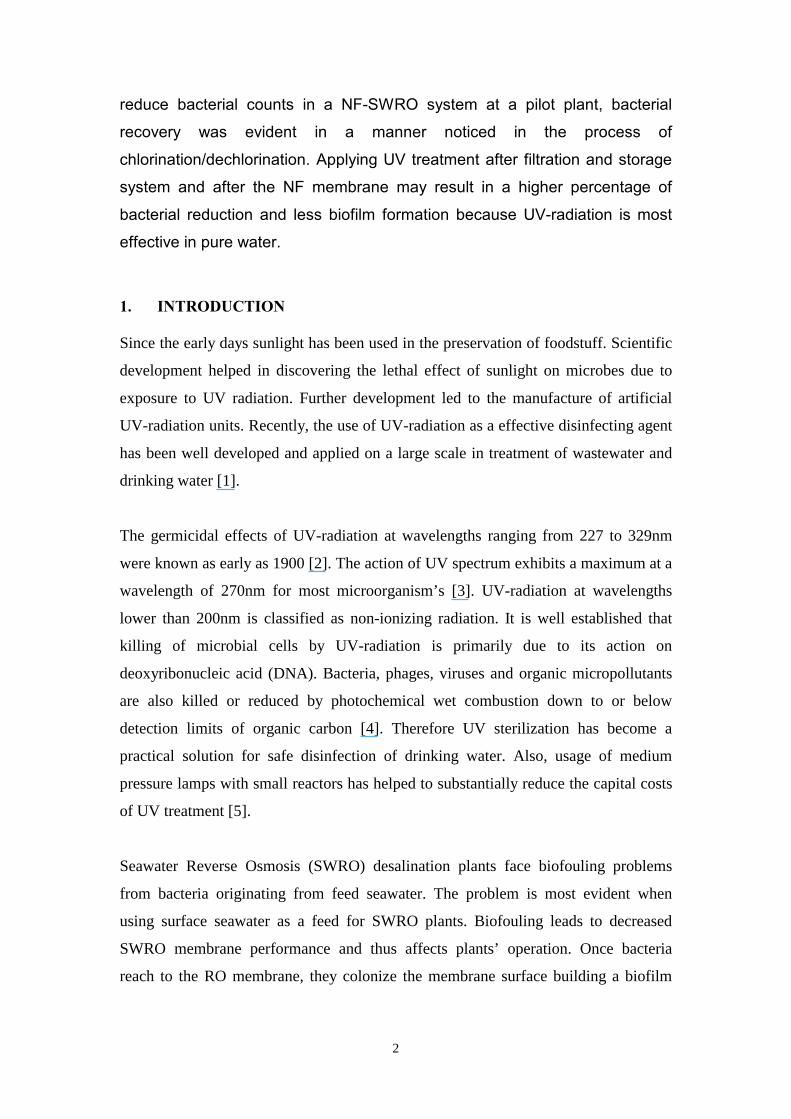
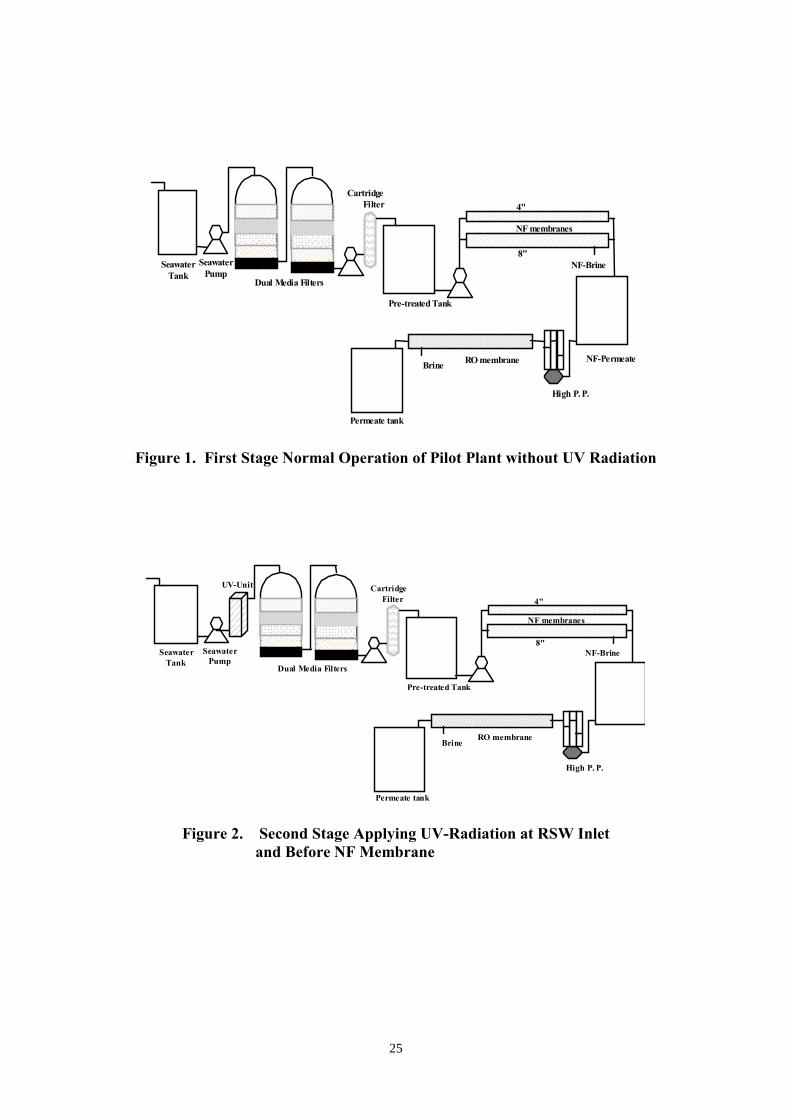
The pretreatment section to which Unit #1 is associated (Figure 1) consists of a dual
media filter followed by a fine sand media filter which is operated at a feed flow rate
of 7 m3/h. Raw seawater was obtained from an open sea intake. A coagulant. (0.4– 0.6
mg/l FeCl3 as F3+) is used to help reduce SDI to below 4. The pretreated seawater was
then stored in a 15 - m3 capacity holding tank and was fed to 6 elements of 8″ × 40″
nanofiltration membranes (Osmonics DK8040F) arranged in series after adjusting the
5
pH to about 6, by dosing sulfuric acid ahead of a 5 µm cartridge filter. The
membranes were operated at a feed pressure of about 20 – 25 bar and at feed flow rate
of 7 m3/h. The permeate from the NF membranes was used as feed for the RO
membranes of cellulose triacetate hollow fine fiber type.
Unit #2 is associated with a pretreatment section similar to unit #1 but with a holding
tank capacity of about 2 m3. Unit #2 consist of two Fluid Type Medium Pressure UV
Sterilization units, (300 watt at 257.7 nm) one before the media filter and one before
NF membranes. NF membranes used in this unit are of size 4″ × 40″. Six membranes
in a series configuration were used. Four out of the 6 membranes were Osmonics
DK4040 NF membranes and the rest were Trisep TS80 N membrane. The feed flow
was about 3 m3/h and at a feed pressure of 25 bar and a pH of 6.
3.2 Different Phases of the Experiment. The study was carried out during October 1999 to April 2001. Bacterial growth and
regrowth in the feed water were studied at different locations of the NF-SWRO Pilot
Plant of the Research and Development Center at Al-Jubail (RDC). The study was
carried out in five stages of plant operation:
1. Normal condition of plant operation without using UV-radiation (Figure 1):
Samples were collected to evaluate bacterial growth and micronutrient levels
from feed seawater (RSW), after media filter (AMF), after cartridge filter (ACF),
nanofiltration permeate (NFP) and nanofiltration brine (NFB).
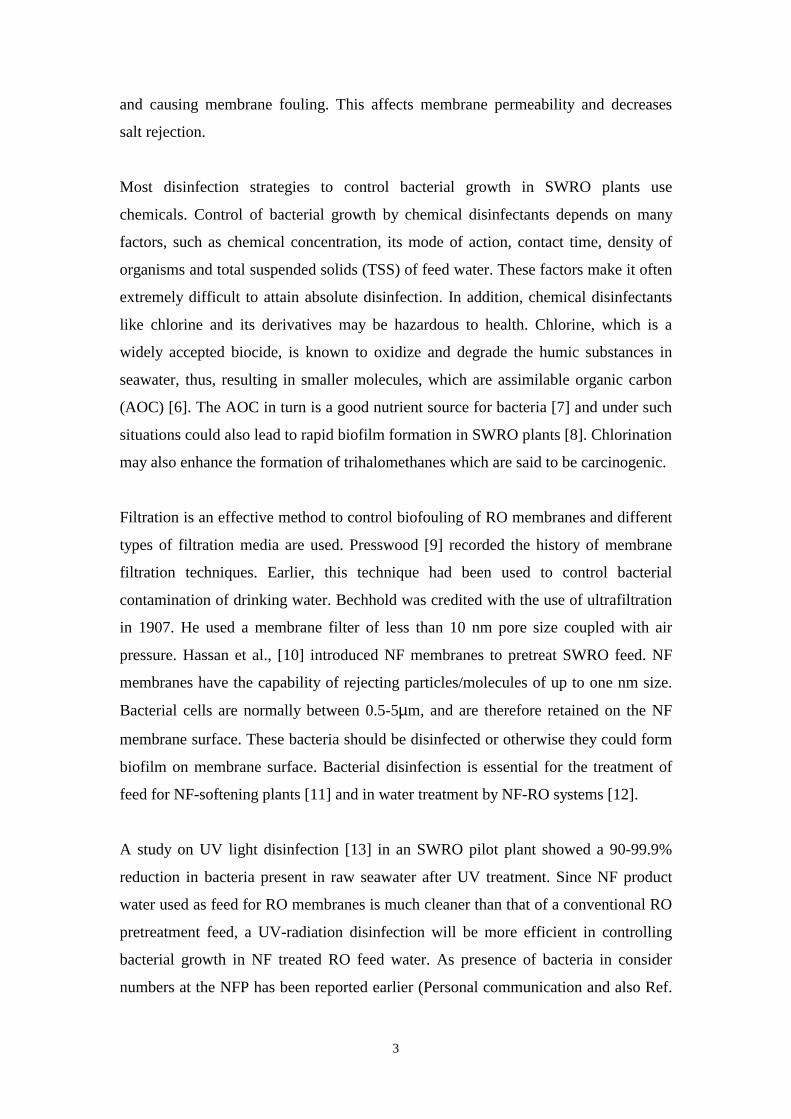
2 Plant operation with UV-radiation at RSW inlet (Figure 2): Samples were
collected from the RSW inlet, after the UV unit (AUV), AMF, ACF, NFP, and
NFB.
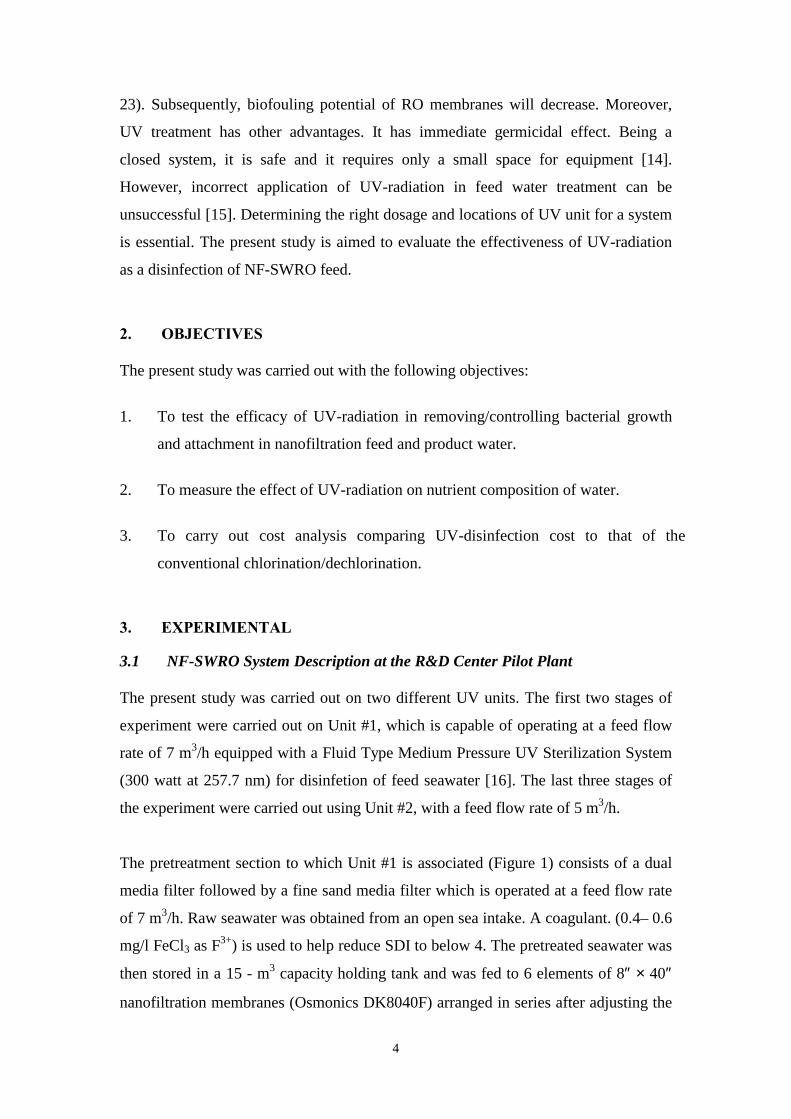
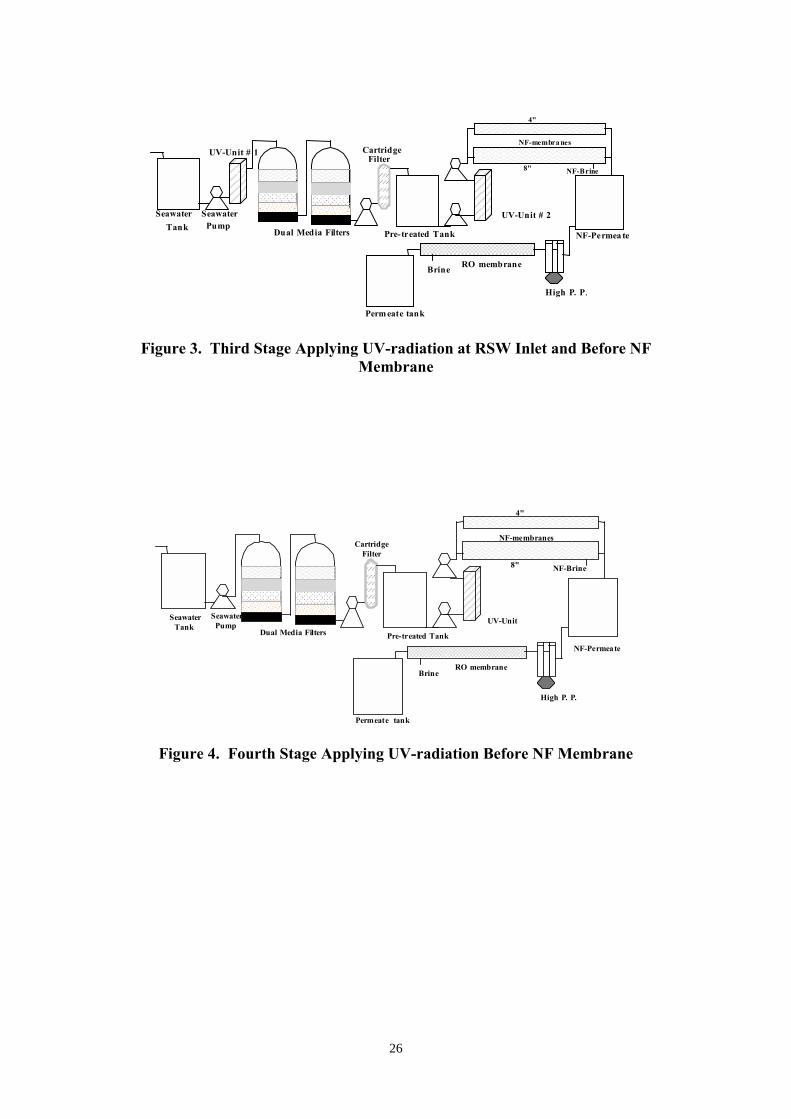
3. Operation of the plant utilizing UV-radiation (UV#1) at RSW inlet and then
before NF membrane UV#2 (Figure 3): Samples were collected from RSW,
AUV#1, AMF, ACF, AUV#2, NFP, and NFB.
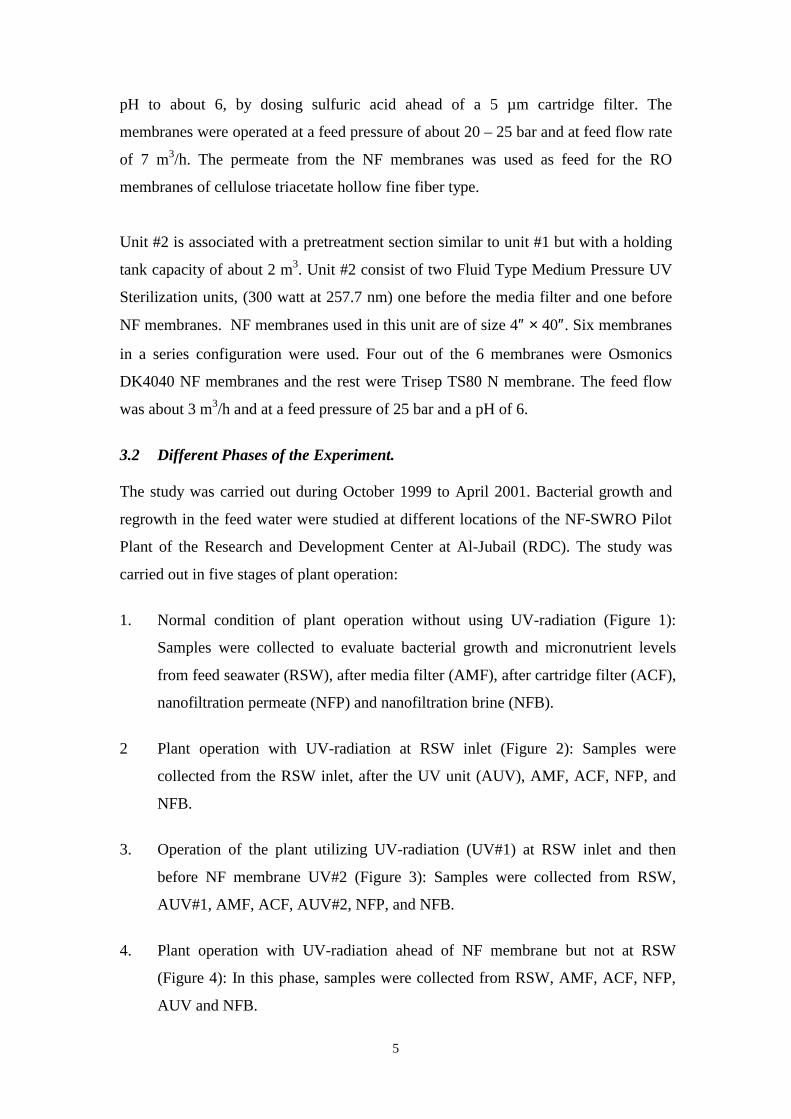
4. Plant operation with UV-radiation ahead of NF membrane but not at RSW
(Figure 4): In this phase, samples were collected from RSW, AMF, ACF, NFP,
AUV and NFB.
6
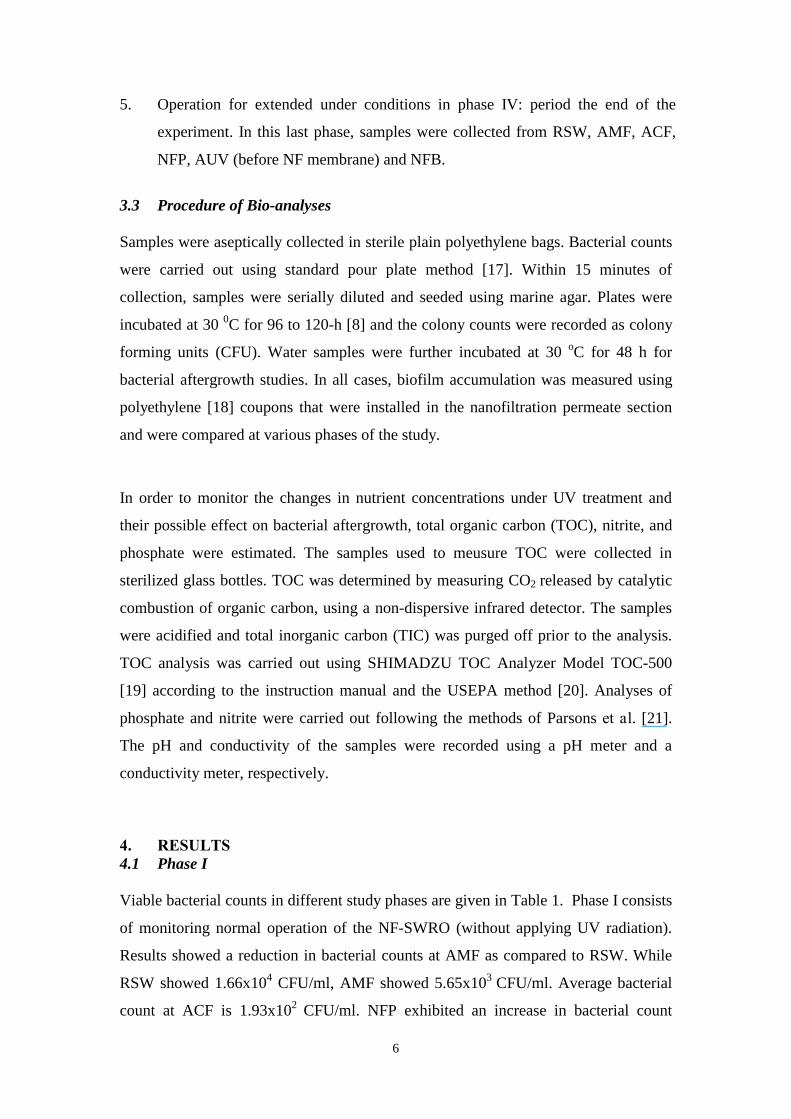
5. Operation for extended under conditions in phase IV: period the end of the
experiment. In this last phase, samples were collected from RSW, AMF, ACF,
NFP, AUV (before NF membrane) and NFB.
3.3 Procedure of Bio-analyses Samples were aseptically collected in sterile plain polyethylene bags. Bacterial counts
were carried out using standard pour plate method [17]. Within 15 minutes of
collection, samples were serially diluted and seeded using marine agar. Plates were
incubated at 30 0C for 96 to 120-h [8] and the colony counts were recorded as colony
forming units (CFU). Water samples were further incubated at 30 oC for 48 h for
bacterial aftergrowth studies. In all cases, biofilm accumulation was measured using
polyethylene [18] coupons that were installed in the nanofiltration permeate section
and were compared at various phases of the study.
In order to monitor the changes in nutrient concentrations under UV treatment and
their possible effect on bacterial aftergrowth, total organic carbon (TOC), nitrite, and
phosphate were estimated. The samples used to meusure TOC were collected in
sterilized glass bottles. TOC was determined by measuring CO2 released by catalytic
combustion of organic carbon, using a non-dispersive infrared detector. The samples
were acidified and total inorganic carbon (TIC) was purged off prior to the analysis.
TOC analysis was carried out using SHIMADZU TOC Analyzer Model TOC-500
[19] according to the instruction manual and the USEPA method [20]. Analyses of
phosphate and nitrite were carried out following the methods of Parsons et al. [21].
The pH and conductivity of the samples were recorded using a pH meter and a
conductivity meter, respectively.
4. RESULTS 4.1 Phase I Viable bacterial counts in different study phases are given in Table 1. Phase I consists
of monitoring normal operation of the NF-SWRO (without applying UV radiation).
Results showed a reduction in bacterial counts at AMF as compared to RSW. While
RSW showed 1.66x10⁴ CFU/ml, AMF showed 5.65x10³ CFU/ml. Average bacterial
count at ACF is 1.93x10² CFU/ml. NFP exhibited an increase in bacterial count
7
compared to ACF sample. Also NFB showed a slight increase in bacterial count
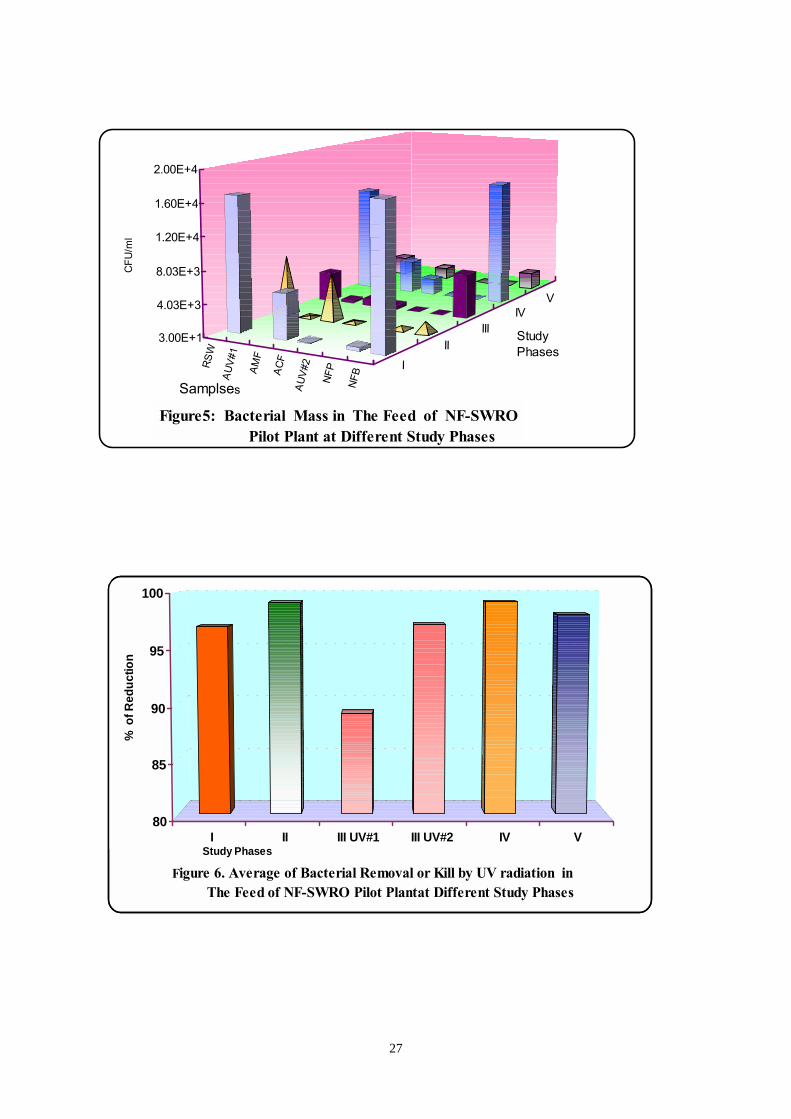
compared to RSW. Bacterial removal by NF membrane, ranged from 91.16% to
99.83% (averages 96.94%) compared to RSW reading (Table 1, Figures 5 and 6).
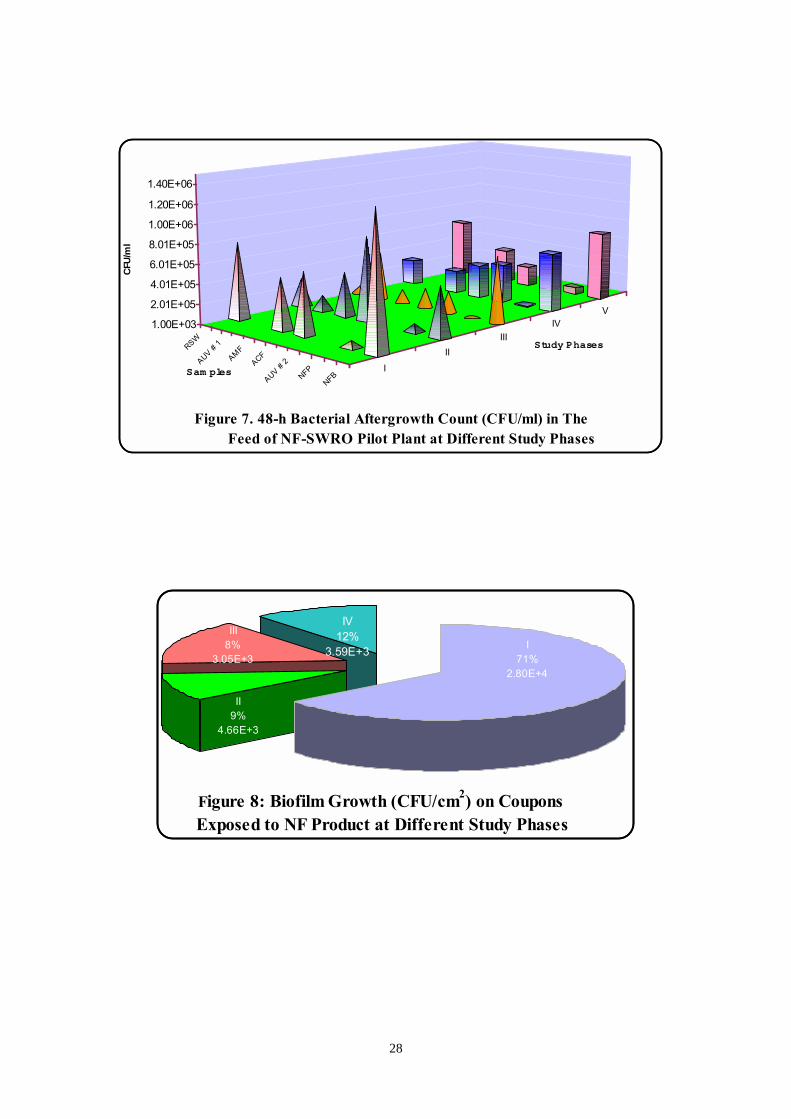
Bacterial aftergrowth (growth upon sample incubation) studies at 48-h-incubation
time at 30OC are shown in Table 2. Bacterial aftergrowth rate showed an increment in
all sampling stages. Bacterial aftergrowth at AMF and ACF are similar to RSW. NFP
has a significant increase in bacterial population while NFB has the highest bacterial
aftergrowth compared to RSW (Table 2 and Figure 7).
Study of biofilm accumulation on the coupons exposed to NFP water showed an
average value of 2.80x10⁴ CFU/ cm2 (Table 3.1, Figure 8 and Photograph 1).
Average of TOC level in RSW at 0-h was 1.29mg/l. A considerable decline of this
value in ACF and NFB was noticed. After 48-h incubation of samples, TOC levels
also showed decline especially in NFP samples. Average of Phosphate concentration
was 4.66µg/l and Nitrite was not detected (Table 4.1). Conductivity of RSW is 59000
µS/cm and NFP is 49000 µS/cm. The pH value ranged from 8.0 at RSW to 6.0 in NFP
(Table 4.2).
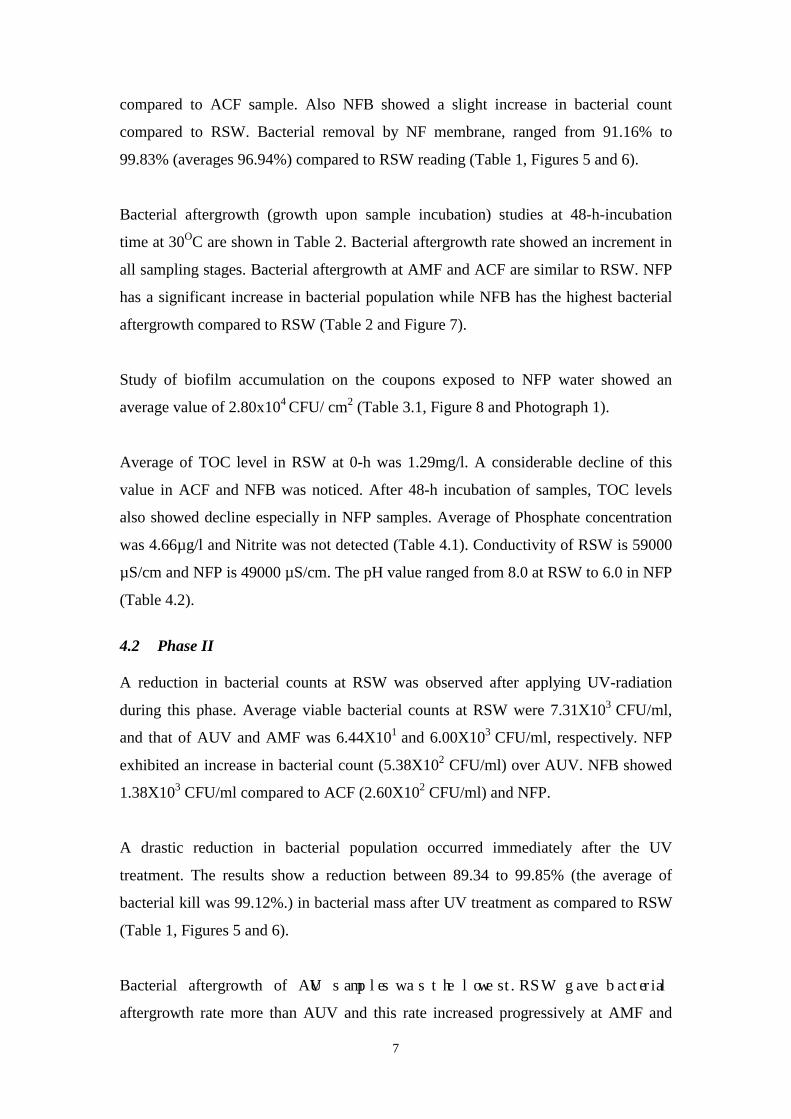
4.2 Phase II A reduction in bacterial counts at RSW was observed after applying UV-radiation
during this phase. Average viable bacterial counts at RSW were 7.31X10³ CFU/ml,
and that of AUV and AMF was 6.44X101 and 6.00X10³ CFU/ml, respectively. NFP
exhibited an increase in bacterial count (5.38X10² CFU/ml) over AUV. NFB showed
1.38X10³ CFU/ml compared to ACF (2.60X10² CFU/ml) and NFP.
A drastic reduction in bacterial population occurred immediately after the UV
treatment. The results show a reduction between 89.34 to 99.85% (the average of
bacterial kill was 99.12%.) in bacterial mass after UV treatment as compared to RSW
(Table 1, Figures 5 and 6).
Bacterial aftergrowth of AUV s amp l es wa s t he l owe st . RSW g ave b act er ial
aftergrowth rate more than AUV and this rate increased progressively at AMF and
8
ACF. Bacterial aftergrowth in NFB was similar to AMF. Increased bacterial
aftergrowth was also evident in NFP upon 48-h of incubation (Table 2 and Figure 7).
Accumulation of bacterial cells on biofilm coupons was 4.08X10³ CFU/cm2 at the
nanofiltration permeate section in this phase of the experiment (Table 3.1, Figure 8
and Photograph 2).
The RSW 0-h TOC value was 1.33mg/l. TOC value substantially declined at NFP.
AUV showed a slight increase in TOC values at 0-h. This value decreased after 48-h.
Phosphate concentration (P-PO4) in RSW was 3.10µg/l, 2.46 µg/l at AUV and
0.17µg/l in NFP at 0-h. After 48-h high consumption of phosphate was observed in all
the samples. In NFP sample P-PO4 level was below the detection limit. Nitrite
concentration showed a similar pattern to phase 1 of the study. In the NFP, nitrite
consumption was lesser than that in the other samples (Table 4.1).
Average seawater conductivity was 59700 µS/cm during this phase. NFP and AUV
conductivity values were 49000 and 59600 µS/cm, respectively. Averaged pH was 8.1
in RSW and 6.5 in NFP (Table 4.2).
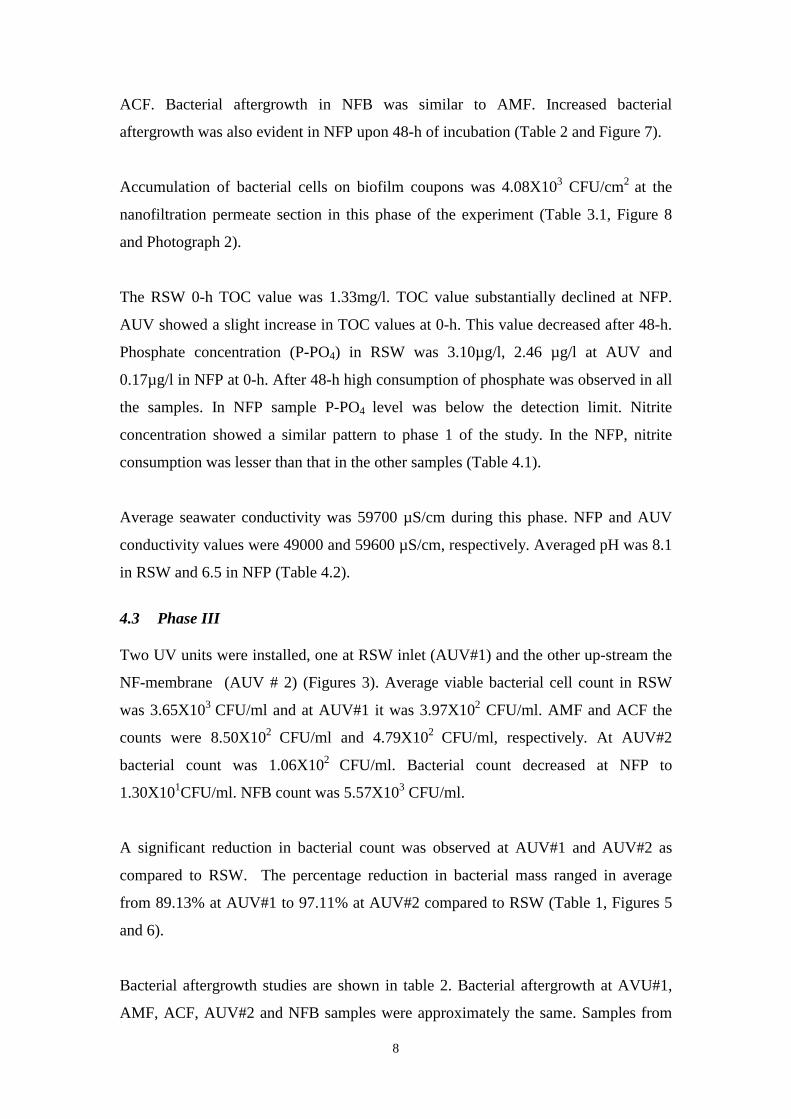
4.3 Phase III Two UV units were installed, one at RSW inlet (AUV#1) and the other up-stream the
NF-membrane (AUV # 2) (Figures 3). Average viable bacterial cell count in RSW
was 3.65X10³ CFU/ml and at AUV#1 it was 3.97X10² CFU/ml. AMF and ACF the
counts were 8.50X10² CFU/ml and 4.79X10² CFU/ml, respectively. At AUV#2
bacterial count was 1.06X10² CFU/ml. Bacterial count decreased at NFP to
1.30X101CFU/ml. NFB count was 5.57X10³ CFU/ml.
A significant reduction in bacterial count was observed at AUV#1 and AUV#2 as
compared to RSW. The percentage reduction in bacterial mass ranged in average
from 89.13% at AUV#1 to 97.11% at AUV#2 compared to RSW (Table 1, Figures 5
and 6).
Bacterial aftergrowth studies are shown in table 2. Bacterial aftergrowth at AVU#1,
AMF, ACF, AUV#2 and NFB samples were approximately the same. Samples from
9
RSW and NFP had lower bacterial aftergrowth compared to the above-mentioned
samples (Table 2 and Figure 7).
The bacterial cell density on the coupons at the nanofiltration permeate section of NF-
SWRO system was 6.67X10³ CFU/cm2 (Table 3.1, Figure 8 and Photograph 3).
TOC values were about 2.29mg/l at RSW and 2.10mg/l at AUV#1. TOC values
declined sharply at AUV#2 and NFP. Further decrease in TOC values occurred after
48-h incubation. Phosphate concentration was 2.72 µg/l in RSW, 1.80 µg/l at AUV#1,
0.88 µg/l at AUV#2 and 1.24 µg/l in NFP. After 48-h high consumption of phosphate
and nitrite was reported in these samples (Table 4.1).
Seawater conductivity value was 61410 µS/cm. Conductivity values of AUV#1 was
61300 and 61450 µS/cm at AUV#2 during this period of study. NFP conductivity was
481500 µS/cm. The pH values were 8.11 and 6.28 at RSW and AUV#1, respectively
whereas the pH of AUV#2 was 6.28 and that of NFP was 5.88 at 0h and 7.38 after 48-
h (Table 4.2).
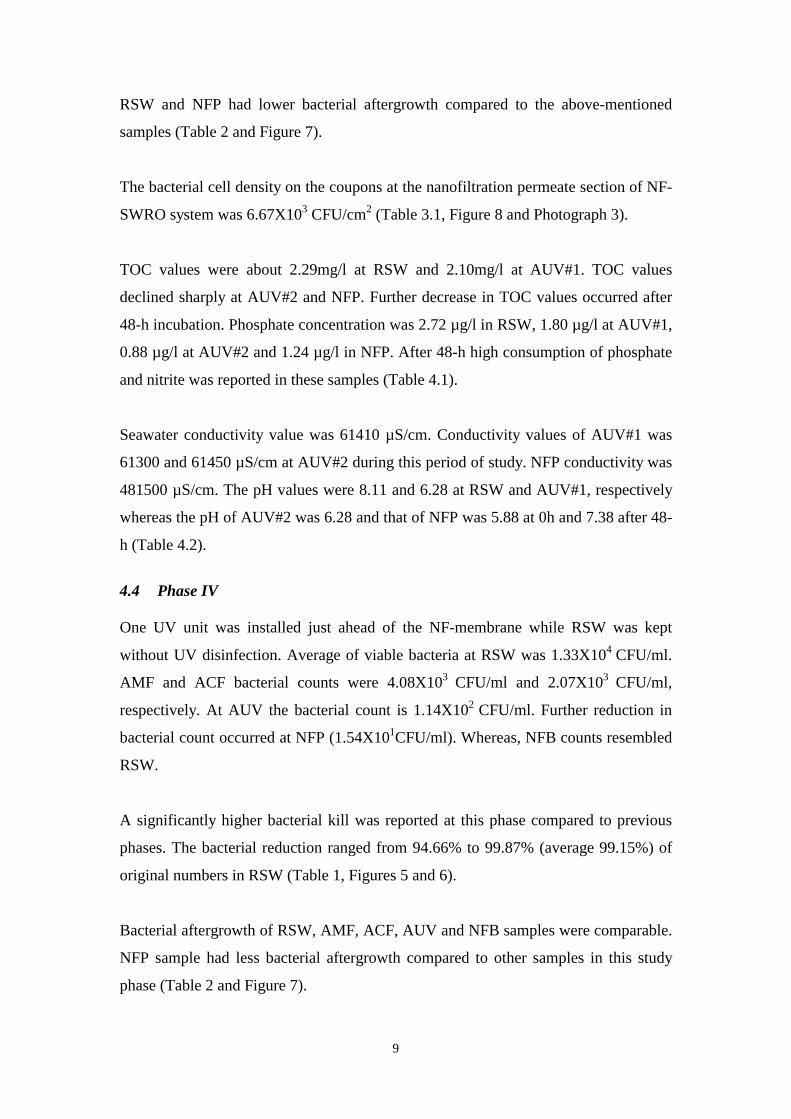
4.4 Phase IV One UV unit was installed just ahead of the NF-membrane while RSW was kept
without UV disinfection. Average of viable bacteria at RSW was 1.33X10⁴ CFU/ml.
AMF and ACF bacterial counts were 4.08X10³ CFU/ml and 2.07X10³ CFU/ml,
respectively. At AUV the bacterial count is 1.14X10² CFU/ml. Further reduction in
bacterial count occurred at NFP (1.54X101CFU/ml). Whereas, NFB counts resembled
RSW.
A significantly higher bacterial kill was reported at this phase compared to previous
phases. The bacterial reduction ranged from 94.66% to 99.87% (average 99.15%) of
original numbers in RSW (Table 1, Figures 5 and 6).
Bacterial aftergrowth of RSW, AMF, ACF, AUV and NFB samples were comparable.
NFP sample had less bacterial aftergrowth compared to other samples in this study
phase (Table 2 and Figure 7).
10
The density of biofilm growth on coupons at nanofiltration permeate was 4.66X10³
CFU/cm2 (Table 3.1, Figure 8 and Photo 4).
TOC concentration was 2.26 mg/l at RSW and 1.99mg/l at AUV with further
appreciable decline at NFP. Most decrease in TOC was noticed after 48-h of
incubation. Phosphate concentration was 4.89 µg/l at RSW, 3.45 µg/l at AUV and
0.78 µg/l at NFP. Upon 48-h incubation, high consumption of phosphate occurred in
these samples. At 0 h, the nitrite level was 3.74 µg/l in RSW, 1.27 µg/l at AUV and
0.51 µg/l at NFP. After 48 h a noticeable reduction in these values was reported
(Table 4.1).
Conductivity was 61750 µS/cm in RSW 61120 µS/cm in AUV and 49030 µS/cm in
NFP. The 0-h pH ranged from 8.16 at RSW to 6.12 at AUV. While NFP pH was 5.88
at 0-h and increased to 7.38 at 48-h (Table 4.2).
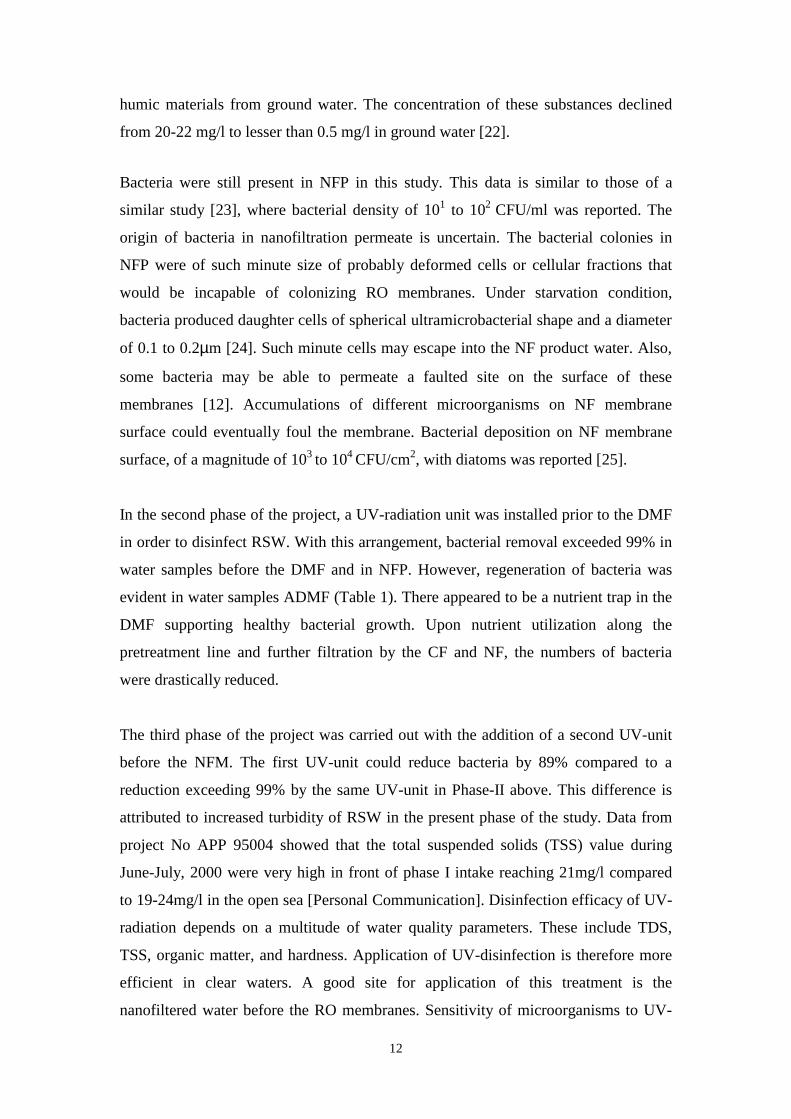
4.5 Evaluation of the UV-radiation Effect at Different Study Phases Average viable bacterial counts at different locations for the four study phases are
given in table 1. The effect of UV#1& UV#2 were as follows:
In phase I, the NF-SWRO system was operated without UV treatment, in phases II
UV#1 was placed directly after RSW inlet and before the MF. Table 1 shows a
reduction of 96.94% at NFP as compared to RSW for phases I and a reduction of
99.12% at NFP as compared to RSW for phase II.
In phase III the NF-SWRO system was operated with two UV units one (UV#1)
placed right before MF and the second (UV#2) just ahead of NF membrane (Fig. 4).
The reduction in average bacterial count as compared to RSW was 89.13% at UV#1
and 97.11% at UV#2. The reduction was only 77% at AMF as compared to RSW and
97% at NFP as compared to ACF.
In phase IV, the system was operated with UV#2 before NFP. The reduction in
average bacterial count at AUV2 as compared to RSW was 99.15%. and 99% at NFP
as compared to ACF.
11
4.6 Phase V Because of improved performance, Phase IV of the study (with the UV unit ahead of
NF-membrane) was extended for further evaluation until the conclusion of the project.
Average of viable bacteria at RSW was 2.46X10³ CFU/ml. Bacterial count at AMF
was 1.42X10³ CFU/ml, at ACF the count was 1.85X10² CFU/ml, AUV the count was
4.76X101 CFU/ml, in NFP the count was 9.58X101CFU/ml, and NFB showed
bacterial count of 1.93X10³ CFU/ml (Table 1 and Figures 5 and 6). The average
percentage reduction by the UV unit in total bacterial count is 98.06% with reference
to RSW (Table 1 and Figure 6). NFP sample has lower bacterial aftergrowth
compared to all other samples in this study phase (Table 2.0 and Figure 7).
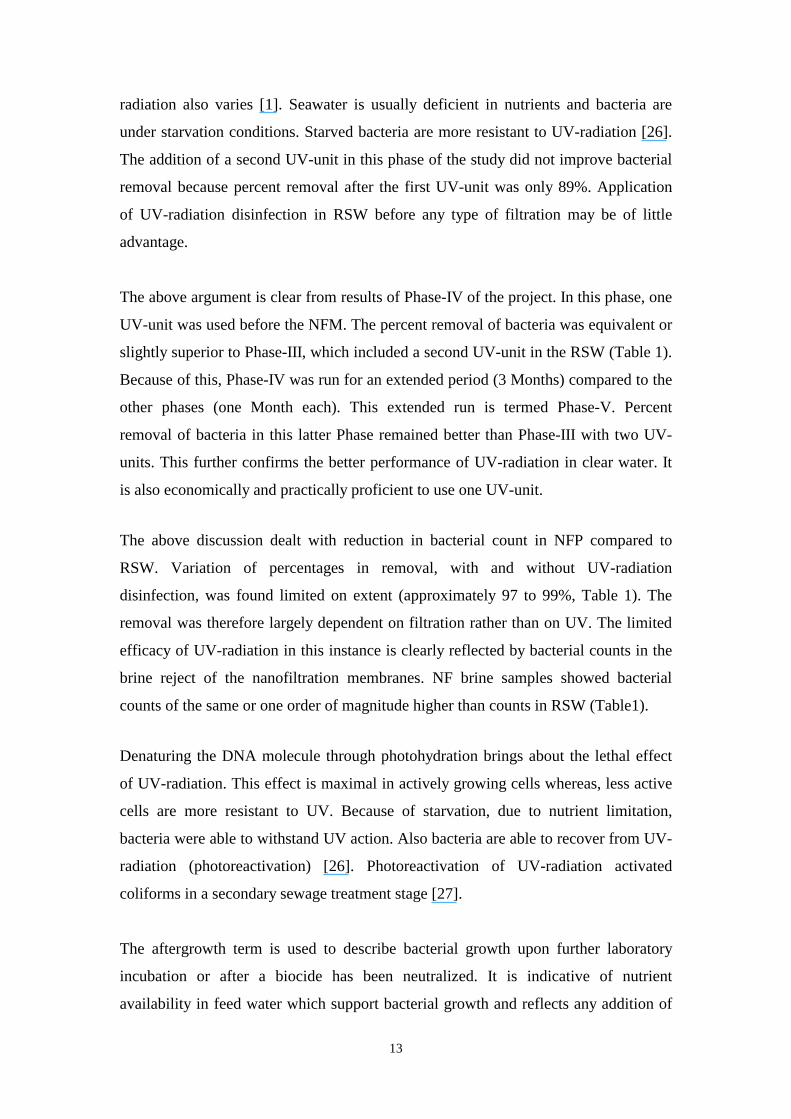
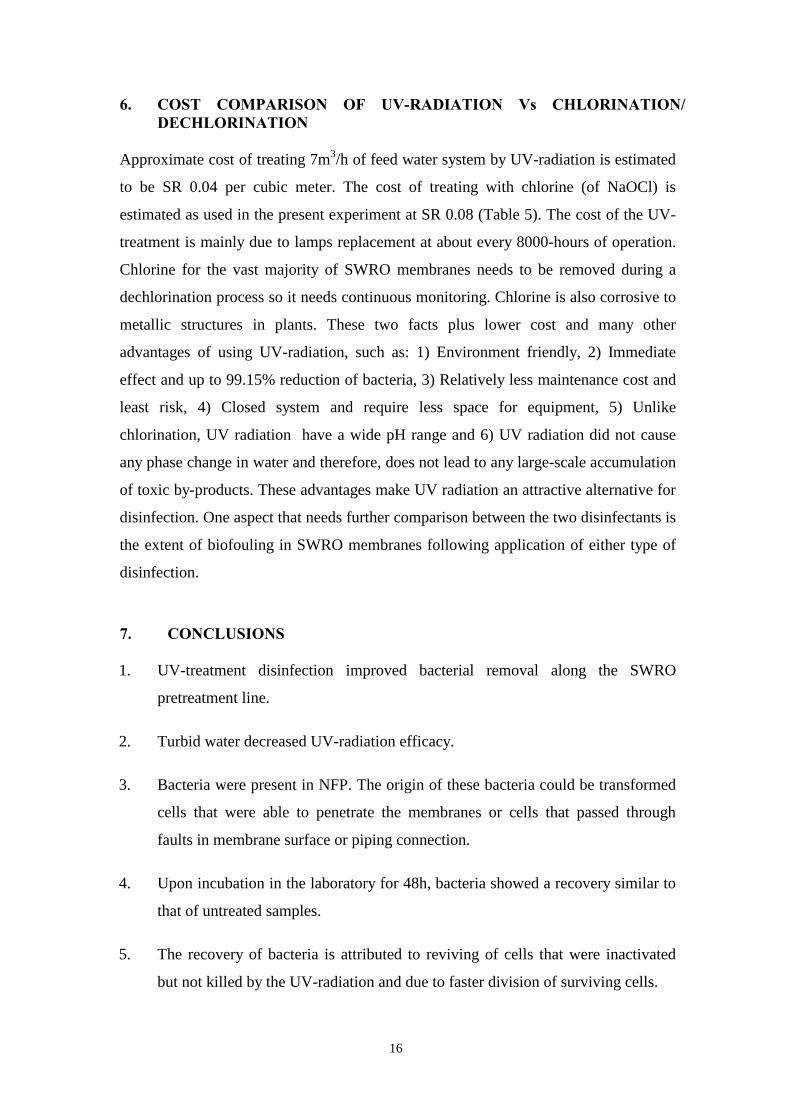
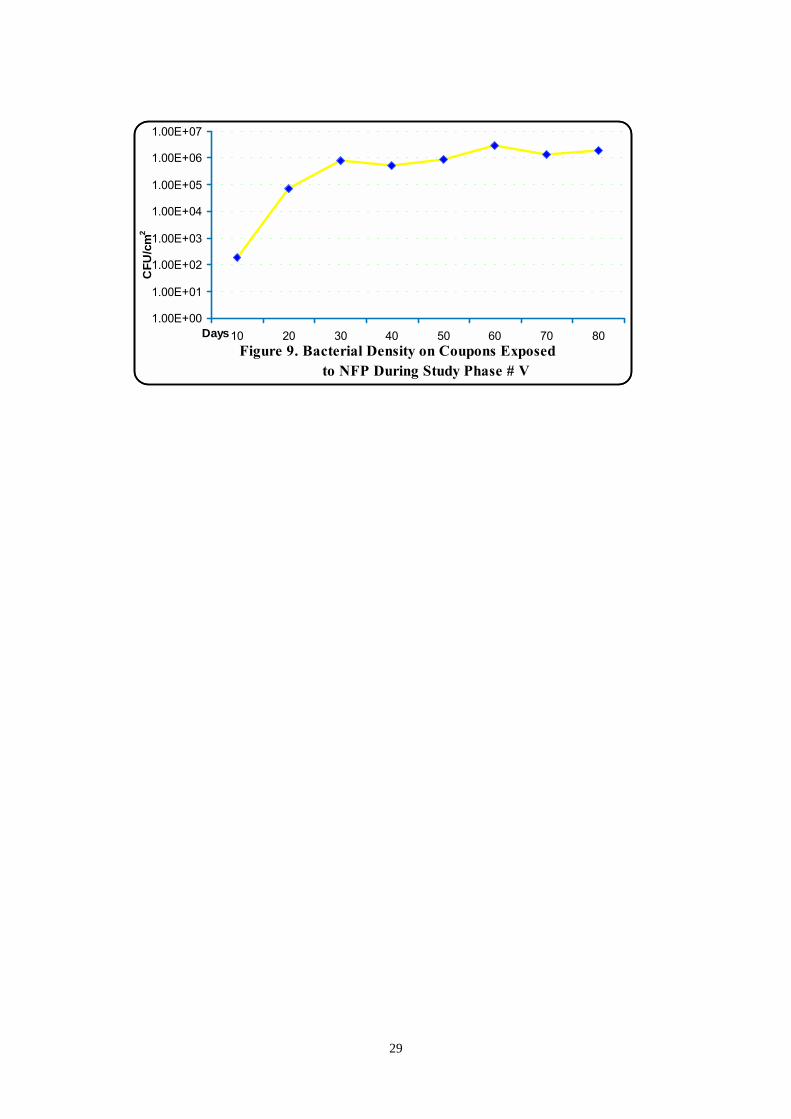
The biofilm density on coupons at NFP following 80 days exposure was as follows:
1.85X10² CFU/cm2 after 10 days, 29.3X10⁵ CFU/cm2 after 60 days (Table 3.2 and
Figure 9), and 19.7X10⁵ CFU/cm2 after 80 days.
TOC averages were 1.95mg/l at RSW, 1.68 mg/l at AUV, and 0.48 mg/l at NFP.
Phosphate concentration (P-PO4) at RSW was 34.73µg/l, 18.24 µg/l at AUV and 7.75
µg/l at NFP. After 48-h incubation, high consumption of phosphate was observed in
these samples. Initial nitrite concentration level in RSW was 5.35 µg/l, AUV 1.07µg/l
and 0.40 µg/l in NFP. After 48-h, a noticeable reduction in these values was found
(Table 4.1).
Conductivity was 60900 µS/cm in seawater, 60530 µS/cm in AUV, 44730 µS/cm in
NFP. RSW pH was 8.16, AUV pH was 6.07, and the pH of NFP was 5.81 and
increased to 7.21 after 48-h incubation (Table 4.2).
5. DISCUSSION
The viable bacterial count at different study phases of NF-SWRO system is given in
Table1 and Figures 5 & 6. Bacterial density in most seawater samples lay in the range
of 103 to 104 CFU/ml. The viable bacterial count in RSW obtained in the present study
was within this range. Bacterial removal amounted to 96.94% in NFP compared to
RSW in the first phase of the project. Nanofiltration should clear feed water from
bacteria as it rejects particles of nanometers size. It was used to remove organic and
12
humic materials from ground water. The concentration of these substances declined
from 20-22 mg/l to lesser than 0.5 mg/l in ground water [22].
Bacteria were still present in NFP in this study. This data is similar to those of a
similar study [23], where bacterial density of 101 to 102 CFU/ml was reported. The
origin of bacteria in nanofiltration permeate is uncertain. The bacterial colonies in
NFP were of such minute size of probably deformed cells or cellular fractions that
would be incapable of colonizing RO membranes. Under starvation condition,
bacteria produced daughter cells of spherical ultramicrobacterial shape and a diameter
of 0.1 to 0.2µm [24]. Such minute cells may escape into the NF product water. Also,
some bacteria may be able to permeate a faulted site on the surface of these
membranes [12]. Accumulations of different microorganisms on NF membrane
surface could eventually foul the membrane. Bacterial deposition on NF membrane
surface, of a magnitude of 103 to 104 CFU/cm2, with diatoms was reported [25].
In the second phase of the project, a UV-radiation unit was installed prior to the DMF
in order to disinfect RSW. With this arrangement, bacterial removal exceeded 99% in
water samples before the DMF and in NFP. However, regeneration of bacteria was
evident in water samples ADMF (Table 1). There appeared to be a nutrient trap in the
DMF supporting healthy bacterial growth. Upon nutrient utilization along the
pretreatment line and further filtration by the CF and NF, the numbers of bacteria
were drastically reduced.
The third phase of the project was carried out with the addition of a second UV-unit
before the NFM. The first UV-unit could reduce bacteria by 89% compared to a
reduction exceeding 99% by the same UV-unit in Phase-II above. This difference is
attributed to increased turbidity of RSW in the present phase of the study. Data from
project No APP 95004 showed that the total suspended solids (TSS) value during
June-July, 2000 were very high in front of phase I intake reaching 21mg/l compared
to 19-24mg/l in the open sea [Personal Communication]. Disinfection efficacy of UV-
radiation depends on a multitude of water quality parameters. These include TDS,
TSS, organic matter, and hardness. Application of UV-disinfection is therefore more
efficient in clear waters. A good site for application of this treatment is the
nanofiltered water before the RO membranes. Sensitivity of microorganisms to UV-
13
radiation also varies [1]. Seawater is usually deficient in nutrients and bacteria are
under starvation conditions. Starved bacteria are more resistant to UV-radiation [26].
The addition of a second UV-unit in this phase of the study did not improve bacterial
removal because percent removal after the first UV-unit was only 89%. Application
of UV-radiation disinfection in RSW before any type of filtration may be of little
advantage.
The above argument is clear from results of Phase-IV of the project. In this phase, one
UV-unit was used before the NFM. The percent removal of bacteria was equivalent or
slightly superior to Phase-III, which included a second UV-unit in the RSW (Table 1).
Because of this, Phase-IV was run for an extended period (3 Months) compared to the
other phases (one Month each). This extended run is termed Phase-V. Percent
removal of bacteria in this latter Phase remained better than Phase-III with two UV-
units. This further confirms the better performance of UV-radiation in clear water. It
is also economically and practically proficient to use one UV-unit.
The above discussion dealt with reduction in bacterial count in NFP compared to
RSW. Variation of percentages in removal, with and without UV-radiation
disinfection, was found limited on extent (approximately 97 to 99%, Table 1). The
removal was therefore largely dependent on filtration rather than on UV. The limited
efficacy of UV-radiation in this instance is clearly reflected by bacterial counts in the
brine reject of the nanofiltration membranes. NF brine samples showed bacterial
counts of the same or one order of magnitude higher than counts in RSW (Table1).
Denaturing the DNA molecule through photohydration brings about the lethal effect
of UV-radiation. This effect is maximal in actively growing cells whereas, less active
cells are more resistant to UV. Because of starvation, due to nutrient limitation,
bacteria were able to withstand UV action. Also bacteria are able to recover from UV-
radiation (photoreactivation) [26]. Photoreactivation of UV-radiation activated
coliforms in a secondary sewage treatment stage [27].
The aftergrowth term is used to describe bacterial growth upon further laboratory
incubation or after a biocide has been neutralized. It is indicative of nutrient
availability in feed water which support bacterial growth and reflects any addition of
14
nutrients in the pretreatment course of NF-SWRO feed. Also, aftergrowth can reflect
the photoreactivation of injured bacterial cells. The aftergrowth was determined
following 48-h incubation time of samples at 30oC. Bacterial counts after this
incubation period are presented in Table 2. Aftergrowth counts registered increases
over the initial counts. The average increase for each sampling location during the
five phases of the project was as follows: 1.4 order of magnitude for RSW, 3.0 (i.e.,
1000 times) for AUV#1, 1.8 for AMF, 2.8 for ACF, 3.7 for AUV#2, 2.8 for NFP, and
1.8 for NFB. The lowest increase was in the RSW. The RSW was not subjected to
chemical treatment, which could serve as a nutrient to source water. The growth of
bacteria was dependent on the original nutrients present with no additional
nourishment. The increment is highest following UV-radiation at AUV#1 and UV#2
and is more so AUV#2. Bacteria inactivated by UV light could regenerate upon
incubation, and survivors could use bacteria killed as food. In both instances, a sharp
increase in numbers would result. The numbers are higher at AUV#2 because
acidification by sulfuric acid may be source of nutrients. Acid hydrolysis liberates
nitrogen from humic substance [28], and marine bacteria grew faster on yeast extract
medium, which is rich in nitrogen [8]. Second highest aftergrowth was at AMF. This
is because a huge bacterial recover occurred at AUV#1. The bacteria, which could not
revive in the AMF, had time to recover in the MCF. Also, dead bacteria accumulated
in the sampling station next to the DMF, which is the MCF. In both instances,
significant growth of bacteria would result in the MCF. The MCF is known to be a
breeding place for bacteria because of its enormous surface area [23]. Aftergrowth
rates were lowest in the brine reject because at this extreme point of the pretreatment
line nutrient concentration diminished because of being utilized down the line.
Phosphate and nitrite concentrations could be seen exhausted as they were utilized
along the pretreatment line (Table 4.1). Similar results were reported from a SWCC
SWRO plant at Al-Birk [29, 30].
Studies of bacterial biofilm accumulation were carried out in the NFP using
polyethylene coupons. Polyethylene coupons were selected based on experiments
showing them to have better attraction to bacteria compared to other materials like
glass [18].
15
Biofilm growth starts when different organic and inorganic materials settle on
immersed/exposed substrata in an aquatic environment. These materials condition the
surface for bacterial cell adsorption. Bacteria present in water will quickly take up
these deposited materials as food source reproduce and eventually build up a biofilm.
Attached bacteria produce extracellular material (slime). The slime glues biofilm to
surfaces.
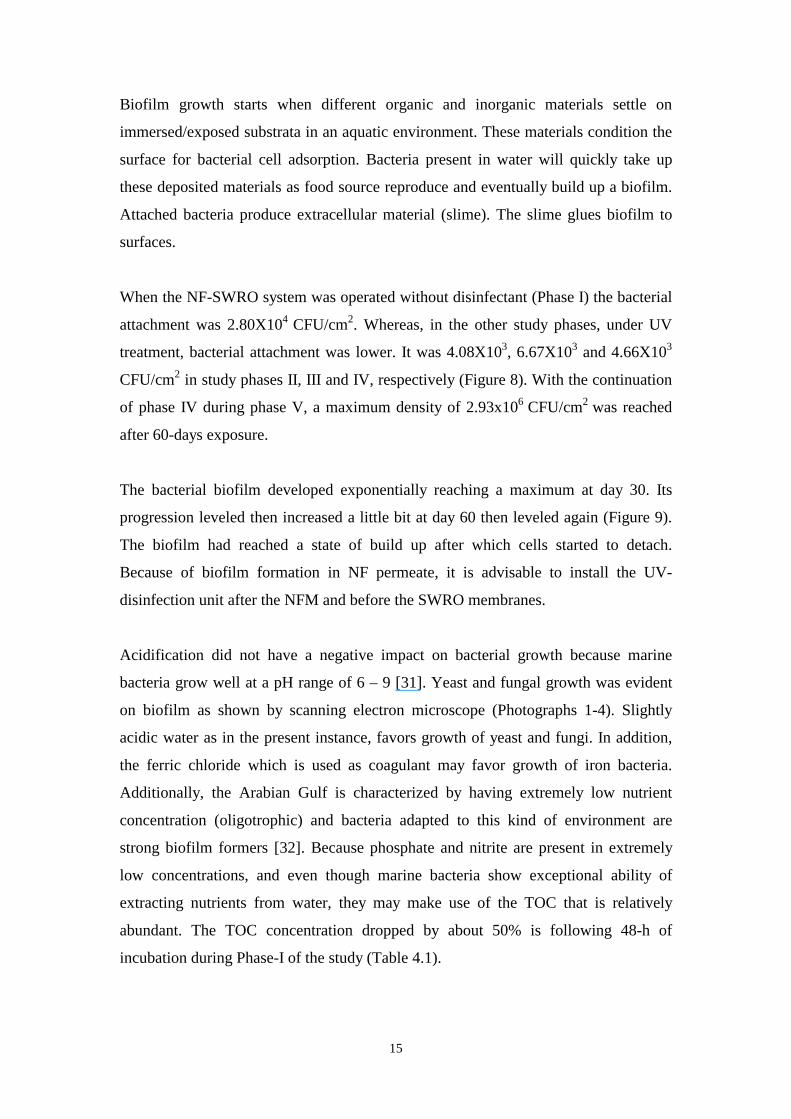
When the NF-SWRO system was operated without disinfectant (Phase I) the bacterial
attachment was 2.80X10⁴ CFU/cm2. Whereas, in the other study phases, under UV
treatment, bacterial attachment was lower. It was 4.08X10³, 6.67X10³ and 4.66X10³
CFU/cm2 in study phases II, III and IV, respectively (Figure 8). With the continuation
of phase IV during phase V, a maximum density of 2.93x10⁶ CFU/cm2 was reached
after 60-days exposure.
The bacterial biofilm developed exponentially reaching a maximum at day 30. Its
progression leveled then increased a little bit at day 60 then leveled again (Figure 9).
The biofilm had reached a state of build up after which cells started to detach.
Because of biofilm formation in NF permeate, it is advisable to install the UV-
disinfection unit after the NFM and before the SWRO membranes.
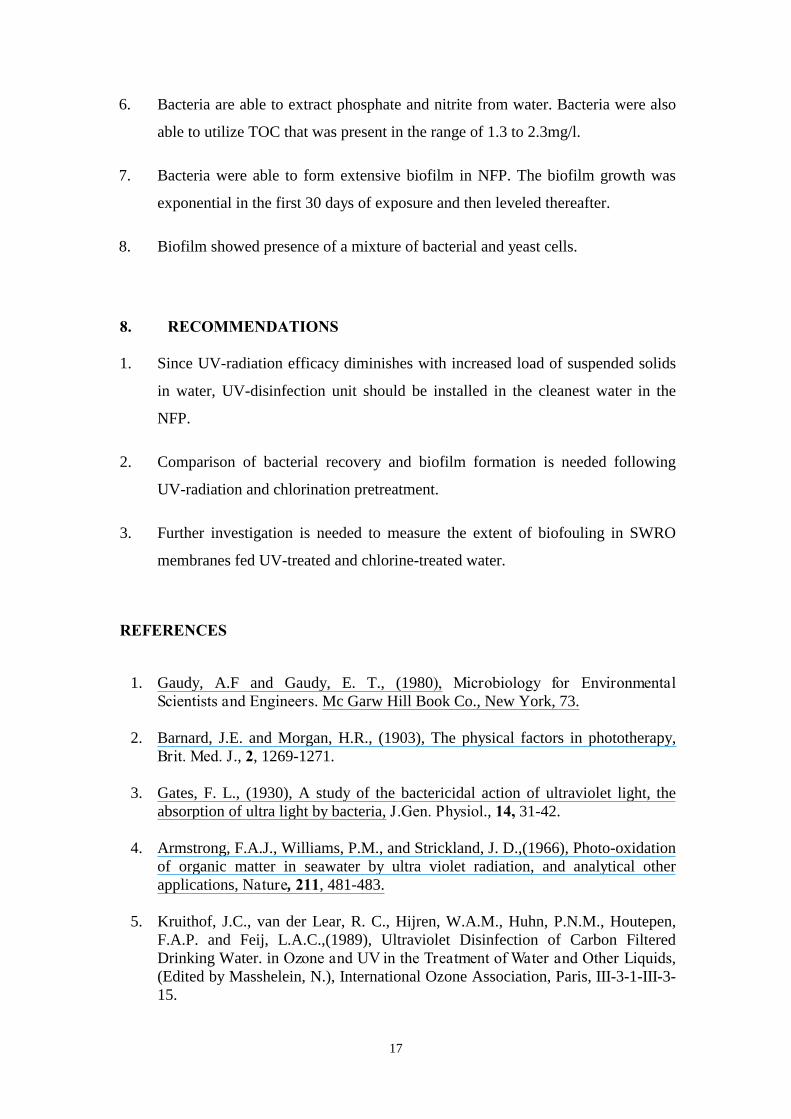
Acidification did not have a negative impact on bacterial growth because marine
bacteria grow well at a pH range of 6 – 9 [31]. Yeast and fungal growth was evident
on biofilm as shown by scanning electron microscope (Photographs 1-4). Slightly
acidic water as in the present instance, favors growth of yeast and fungi. In addition,
the ferric chloride which is used as coagulant may favor growth of iron bacteria.
Additionally, the Arabian Gulf is characterized by having extremely low nutrient
concentration (oligotrophic) and bacteria adapted to this kind of environment are
strong biofilm formers [32]. Because phosphate and nitrite are present in extremely
low concentrations, and even though marine bacteria show exceptional ability of
extracting nutrients from water, they may make use of the TOC that is relatively
abundant. The TOC concentration dropped by about 50% is following 48-h of
incubation during Phase-I of the study (Table 4.1).
16
6. COST COMPARISON OF UV-RADIATION Vs CHLORINATION/ DECHLORINATION
Approximate cost of treating 7m3/h of feed water system by UV-radiation is estimated
to be SR 0.04 per cubic meter. The cost of treating with chlorine (of NaOCl) is
estimated as used in the present experiment at SR 0.08 (Table 5). The cost of the UV-
treatment is mainly due to lamps replacement at about every 8000-hours of operation.
Chlorine for the vast majority of SWRO membranes needs to be removed during a
dechlorination process so it needs continuous monitoring. Chlorine is also corrosive to
metallic structures in plants. These two facts plus lower cost and many other
advantages of using UV-radiation, such as: 1) Environment friendly, 2) Immediate
effect and up to 99.15% reduction of bacteria, 3) Relatively less maintenance cost and
least risk, 4) Closed system and require less space for equipment, 5) Unlike
chlorination, UV radiation have a wide pH range and 6) UV radiation did not cause
any phase change in water and therefore, does not lead to any large-scale accumulation
of toxic by-products. These advantages make UV radiation an attractive alternative for
disinfection. One aspect that needs further comparison between the two disinfectants is
the extent of biofouling in SWRO membranes following application of either type of
disinfection.
7. CONCLUSIONS 1. UV-treatment disinfection improved bacterial removal along the SWRO
pretreatment line.
2. Turbid water decreased UV-radiation efficacy.
3. Bacteria were present in NFP. The origin of these bacteria could be transformed
cells that were able to penetrate the membranes or cells that passed through
faults in membrane surface or piping connection.
4. Upon incubation in the laboratory for 48h, bacteria showed a recovery similar to
that of untreated samples.
5. The recovery of bacteria is attributed to reviving of cells that were inactivated
but not killed by the UV-radiation and due to faster division of surviving cells.
17
6. Bacteria are able to extract phosphate and nitrite from water. Bacteria were also
able to utilize TOC that was present in the range of 1.3 to 2.3mg/l.
7. Bacteria were able to form extensive biofilm in NFP. The biofilm growth was
exponential in the first 30 days of exposure and then leveled thereafter.
8. Biofilm showed presence of a mixture of bacterial and yeast cells.
8. RECOMMENDATIONS 1. Since UV-radiation efficacy diminishes with increased load of suspended solids
in water, UV-disinfection unit should be installed in the cleanest water in the
NFP.
2. Comparison of bacterial recovery and biofilm formation is needed following
UV-radiation and chlorination pretreatment.
3. Further investigation is needed to measure the extent of biofouling in SWRO
membranes fed UV-treated and chlorine-treated water.
REFERENCES
1. Gaudy, A.F and Gaudy, E. T., (1980), Microbiology for Environmental Scientists and Engineers. Mc Garw Hill Book Co., New York, 73.
2. Barnard, J.E. and Morgan, H.R., (1903), The physical factors in phototherapy,
Brit. Med. J., 2, 1269-1271.
3. Gates, F. L., (1930), A study of the bactericidal action of ultraviolet light, the absorption of ultra light by bacteria, J.Gen. Physiol., 14, 31-42.
4. Armstrong, F.A.J., Williams, P.M., and Strickland, J. D.,(1966), Photo-oxidation
of organic matter in seawater by ultra violet radiation, and analytical other applications, Nature, 211, 481-483.
5. Kruithof, J.C., van der Lear, R. C., Hijren, W.A.M., Huhn, P.N.M., Houtepen,
F.A.P. and Feij, L.A.C.,(1989), Ultraviolet Disinfection of Carbon Filtered Drinking Water. in Ozone and UV in the Treatment of Water and Other Liquids, (Edited by Masshelein, N.), International Ozone Association, Paris, III-3-1-III-3-15.
18
6. Kruithof, J.C., Van der Gaag, M.A., and Van der Kooy, D., (1989), Effect of ozonation and chlorination on humic substances in water, In Aquatic Humic Substances (Edited by Sufflet, I. H. and MacCarthy, P.), Advances in Chemistry Series 219, Am. Chem. Soc. Washington D. C., 664.
7. Applegate, L. E., Erkenbrecher, C. W. and Winters, H., (1989), New chloramine
process to control aftergrowth and biofouling in PermasepR B-10 RO surface seawater plants, Desalination, 74, 51.
8. Munshi, H., Chandy, J., Al-Tisan, I., (1994), Effect of incubation, temperature
and nutrients on growth potential of marine bacteria (Al-Jubail Seawater), Proceeding of the Second Gulf Water Conference, Bahrain. Water Science and Technology Association, Manama, Bahrain, 5-9 November 1994, 89-99.
9. Presswood, W. G., (1981), Membrane Filtration, (Applications, Techniques and
Problems), Marcel Dekker, Inc., New York, 1-17. 10. Hassan, A. M., Farooque, A. M., Jammaluddin, A. T. M., Al-Amoudi, A. S., Al-
Sofi, M. A. K., Al-Rubian, A. Gurashi, M. M., Kither, N. M., Dalvi, A. G. I. And Al-Tisan, I. A. R., (1998), A new approach to membrane and thermal seawater desalination processes using nanofiltration membrane (Part 1), Desalination, 118, 35-51.
11. Redondo, J. A. and Bernaola, P., (1997), Present and Future of NF Municipal
Water Treatment Design and Operation Experience with 21000 m3/d Capacity, Proceeding IDA World Congress Desalination and Water Reuse, Madrid, Spain, 6-9 October, vol. IV, pp. 37-55.
12. Mallevialle, J. Odendaal, P.E. and Wiesner, M. R., (1996), Water Treatment
Membrane Processes, Amercan Water Work Association Research Foundation, McGraw-Hill, 9.1-9.70.
13. Munshi, H. A., Sasikumar, N., Jamaluddin, A. T. and Mohammed, K., (1999),
Evaluation of Ultra-Violet Radiation Disinfection on the Bacterial growth in the SWRO Pilot Plant Al-Jubail, Seawater), Proceeding of the Fourth Gulf Water Conference, Bahrain. Water Science and Technology Association, Manama, Bahrain, 13-18 February 1999, 603-618.
14. Haruhiko, O., (1985), Ultra Pure Water Production Technology, Saiwai Shobo
Press, Japan. 15. Luckiesh, M., (1946), Application of Germicidal, Erythermal and Infrared
Energy. Van Nostrand, New York. 16. Japanese International Cooperation Agency (JICA), (1985), Operation and
Maintenance Manual of Reverse Osmosis Pilot Plant, Jubail, Saudi Arabia. 17. American Public Health Association, American Water Works Association and
Water Pollution Control Federation, (1989), Standard Methods For The
19
Examination of Water and Waste Water, 17th ed.APHA, Washington, D. C., 1469.
18. Felecher, M., (1980), Adherence of Marine Microorganisms to Smooth surface,
In Bacterial A adherence, (Edited by E. H. Beachey), Chapman and Hall Ltd, London, 347-371.
19. Shimadzu, Instruction Manual of SHIMADZU Total Organic Carbon Analyzer
Model TOC-500, Part No. 638-90887. 20. US EPA., (1983), Method for chemical analysis of water & wastes, Method
415.1. 21. Parsons, Y. Maita, and C. M., Lalli., (1985), A Manual of Chemical and
Biological Methods for Seawater Analysis, Pergamon Press, Oxford. 22. Alborzfar, M., Jonsson, G. and Gr∅ n, C., (1998), Removal of Natural Organic
Matter from Two Types of Humic Ground Waters by Nanofiltration, Wat. Res.32, 2983-2994.
23. Hassan, A. M., Farooque, A. M., Jammaluddin, A. T. M., Al-Amoudi, A. S., Al-
Sofi, M. A. K., Al-Rubian, A. Gurashi, M. M., Kither, N. M., Dalvi, A. G. I. And Al-Tisan, I. A. R.,(1999), Optimization of NF Pretreatment of Feed to Seawater. Desalination Plants, 1999, Proceeding of IDA World Congress and Water Reuse, Sandiego, CA, USA, 29/8 to 3/9/1999.
24. Morita, R. Y., (1982), Starvation-survival of hetrotrophs in the marine
environment, Advances in Microbial Ecology, 6, 171-98. 25. Farooque, A. M., Hassan, A. M. and Al-Amoudi, A. S., (1999), Autopsy and
Characterzation of NF membranes after long Term Operation in a NF-SWRO pilot plant, Proceeding of IDA World Congress and Water Reuse, San Diego, CA, USA, 29/8 to 3/9/1999.
26. NystrÖm, T., Olsson, R. M. and Kjelleberg, S., (1992), Survival stress resistance,
and alterations in protein expression in the marine Vibrio sp. Strain S14 during starvation for different individual nutrients. Applied and Environmental microbiology, 58, 55-65.
27. Whitby, G. E., Pallamateer, G., Jook, W.G., Marshalker, J., Huber, D. and
Flood, K., (1984), Ultraviolet disinfection of secondary effluent, J. Water. Pollut. Contrl. Fed., 56, 844-850.
28. Schritzer, M. and Khan, S. U., (1972), Humic Substances in the Environment,
Marcel Dekker, Inc., New York. 29. Munshi, H., Al-Tisan, I., Chandy, J., Hamida, A., Chida, K. and Polland, H.W.,
(1995), Identification and Disinfection of Marine Microorganisms: SWCC - Du Pont, First Report of the Joint Techical Team.
20
30. Saeed, M. O., Jamaluddin, A. T. and Tisan, I. A., (1999), Biofouling in a Seawater Reverse Osmosis Plant on the Red Sea Cost, Saudi Arabia, Proceedings of IDA World Congress on Desalination, San Diego, USA, Vol. II 207-221, Aug. 29-Sep. 3, 1999.
31. Saeed, M. O, Al-Amoudi, M. M. and Al-Harbi, A. H., (1987), A Pseudomonas
associated with disease in cultured rabbifish Siganus rivulants in the Red Sea. Diseases of Aquatic Organisms, 3: 177-180.
32. Dawason, M. P., Humphry, B. A., and Marshall, K. C., (1981), Adhesion: a
tactic in the survival strategy of a marine vibrio during starvation, Curr. Microbiology, 6, PP. 195-9.
33. Price obtained from M/s e-watertechnologies, USA through Internet.
34. Price based on quotation received from M/s A. Abunayyan Trading Corporation,
Al-Khobar, dated 17 January 2001. 35. Price is for bulk purchase obtained from SWCC Central store at 2001.
21
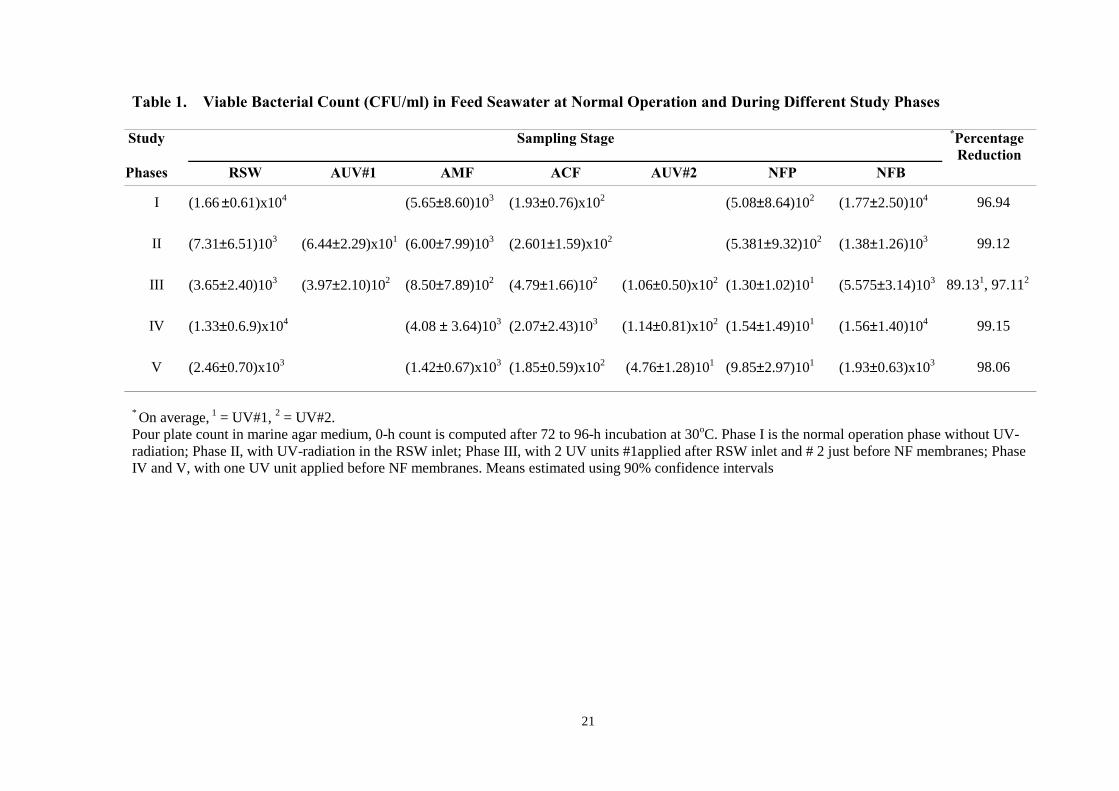
Table 1. Viable Bacterial Count (CFU/ml) in Feed Seawater at Normal Operation and During Different Study Phases
Study Sampling Stage
Phases RSW AUV#1 AMF ACF AUV#2 NFP NFB
*Percentage Reduction
I (1.66 ±0.61)x104 (5.65±8.60)103 (1.93±0.76)x102 (5.08±8.64)102 (1.77±2.50)104 96.94
II (7.31±6.51)103 (6.44±2.29)x101 (6.00±7.99)103 (2.601±1.59)x102 (5.381±9.32)102 (1.38±1.26)103 99.12
III (3.65±2.40)103 (3.97±2.10)102 (8.50±7.89)102 (4.79±1.66)102 (1.06±0.50)x102 (1.30±1.02)101 (5.575±3.14)103 89.131, 97.112
IV (1.33±0.6.9)x104 (4.08 ± 3.64)103 (2.07±2.43)103 (1.14±0.81)x102 (1.54±1.49)101 (1.56±1.40)104 99.15
V (2.46±0.70)x103 (1.42±0.67)x103 (1.85±0.59)x102 (4.76±1.28)101 (9.85±2.97)101 (1.93±0.63)x103 98.06
* On average, 1 = UV#1, 2 = UV#2. Pour plate count in marine agar medium, 0-h count is computed after 72 to 96-h incubation at 30oC. Phase I is the normal operation phase without UV- radiation; Phase II, with UV-radiation in the RSW inlet; Phase III, with 2 UV units #1applied after RSW inlet and # 2 just before NF membranes; Phase IV and V, with one UV unit applied before NF membranes. Means estimated using 90% confidence intervals
22
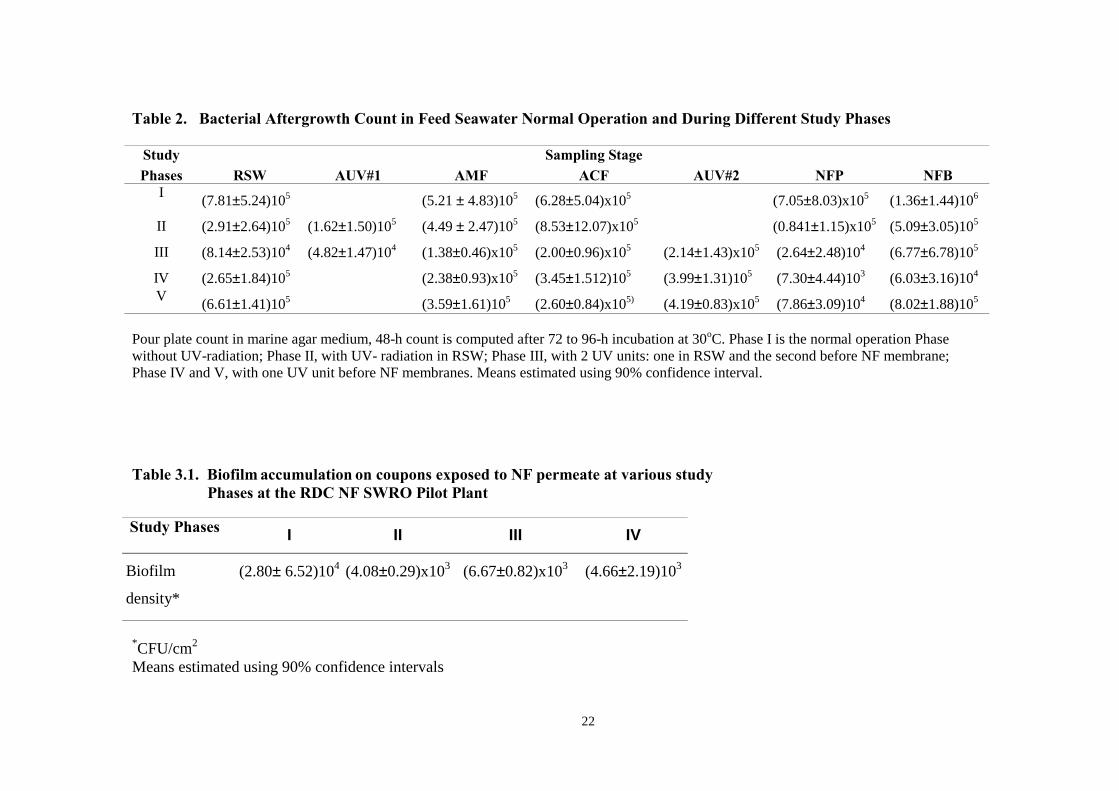
Table 2. Bacterial Aftergrowth Count in Feed Seawater Normal Operation and During Different Study Phases
Study Sampling Stage Phases RSW AUV#1 AMF ACF AUV#2 NFP NFB
I (7.81±5.24)105 (5.21 ± 4.83)105 (6.28±5.04)x105 (7.05±8.03)x105 (1.36±1.44)106
II (2.91±2.64)105 (1.62±1.50)105 (4.49 ± 2.47)105 (8.53±12.07)x105 (0.841±1.15)x105 (5.09±3.05)105
III (8.14±2.53)104 (4.82±1.47)104 (1.38±0.46)x105 (2.00±0.96)x105 (2.14±1.43)x105 (2.64±2.48)104 (6.77±6.78)105
IV (2.65±1.84)105 (2.38±0.93)x105 (3.45±1.512)105 (3.99±1.31)105 (7.30±4.44)103 (6.03±3.16)104 V (6.61±1.41)105 (3.59±1.61)105 (2.60±0.84)x105) (4.19±0.83)x105 (7.86±3.09)104 (8.02±1.88)105
Pour plate count in marine agar medium, 48-h count is computed after 72 to 96-h incubation at 30oC. Phase I is the normal operation Phase without UV-radiation; Phase II, with UV- radiation in RSW; Phase III, with 2 UV units: one in RSW and the second before NF membrane; Phase IV and V, with one UV unit before NF membranes. Means estimated using 90% confidence interval.
Table 3.1. Biofilm accumulation on coupons exposed to NF permeate at various study Phases at the RDC NF SWRO Pilot Plant Study Phases
I II III IV
Biofilm
density*
(2.80± 6.52)104 (4.08±0.29)x103 (6.67±0.82)x103 (4.66±2.19)103
*CFU/cm2 Means estimated using 90% confidence intervals
23
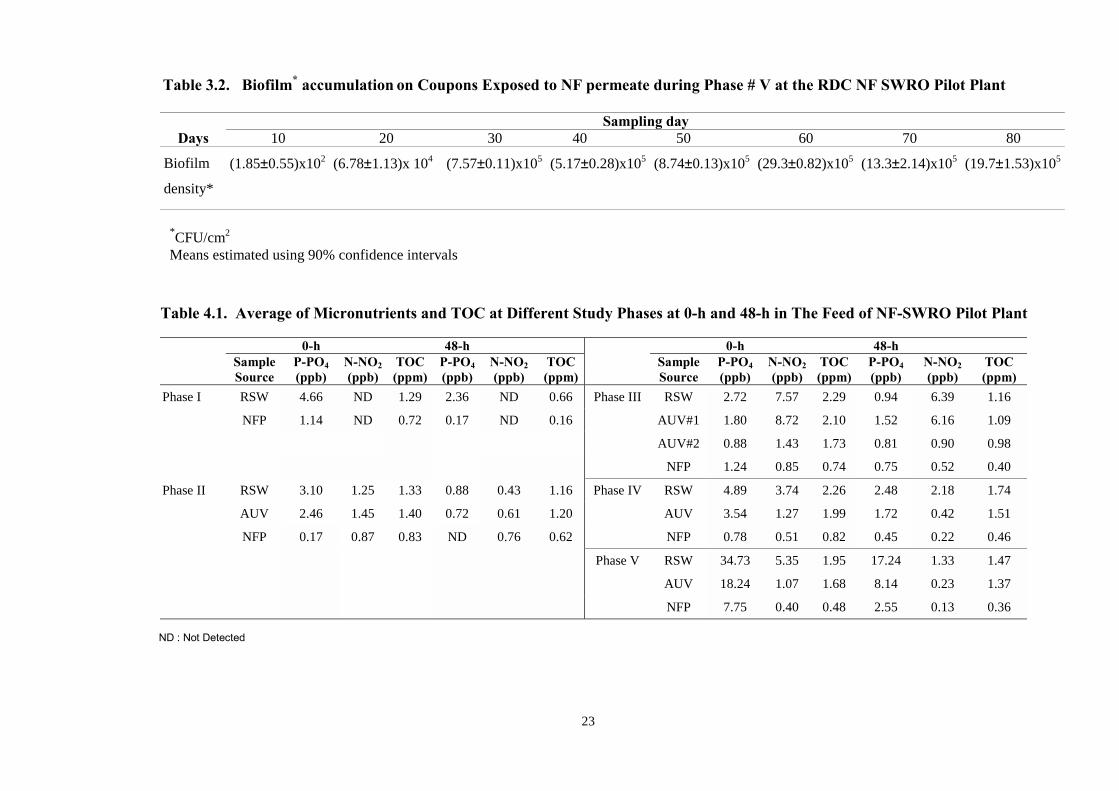
Table 3.2. Biofilm* accumulation on Coupons Exposed to NF permeate during Phase # V at the RDC NF SWRO Pilot Plant
Sampling day Days 10 20 30 40 50 60 70 80
Biofilm
density*
(1.85±0.55)x102 (6.78±1.13)x 104 (7.57±0.11)x105 (5.17±0.28)x105 (8.74±0.13)x105 (29.3±0.82)x105 (13.3±2.14)x105 (19.7±1.53)x105
*CFU/cm2 Means estimated using 90% confidence intervals
Table 4.1. Average of Micronutrients and TOC at Different Study Phases at 0-h and 48-h in The Feed of NF-SWRO Pilot Plant
0-h 48-h 0-h 48-h Sample P-PO4 N-NO2 TOC P-PO4 N-NO2 TOC Sample P-PO4 N-NO2 TOC P-PO4 N-NO2 TOC Source (ppb) (ppb) (ppm) (ppb) (ppb) (ppm) Source (ppb) (ppb) (ppm) (ppb) (ppb) (ppm)
Phase I RSW 4.66 ND 1.29 2.36 ND 0.66 Phase III RSW 2.72 7.57 2.29 0.94 6.39 1.16
NFP 1.14 ND 0.72 0.17 ND 0.16 AUV#1 1.80 8.72 2.10 1.52 6.16 1.09
AUV#2 0.88 1.43 1.73 0.81 0.90 0.98
NFP 1.24 0.85 0.74 0.75 0.52 0.40
Phase II RSW 3.10 1.25 1.33 0.88 0.43 1.16 Phase IV RSW 4.89 3.74 2.26 2.48 2.18 1.74
AUV 2.46 1.45 1.40 0.72 0.61 1.20 AUV 3.54 1.27 1.99 1.72 0.42 1.51
NFP 0.17 0.87 0.83 ND 0.76 0.62 NFP 0.78 0.51 0.82 0.45 0.22 0.46
Phase V RSW 34.73 5.35 1.95 17.24 1.33 1.47
AUV 18.24 1.07 1.68 8.14 0.23 1.37
NFP 7.75 0.40 0.48 2.55 0.13 0.36 ND : Not Detected
24
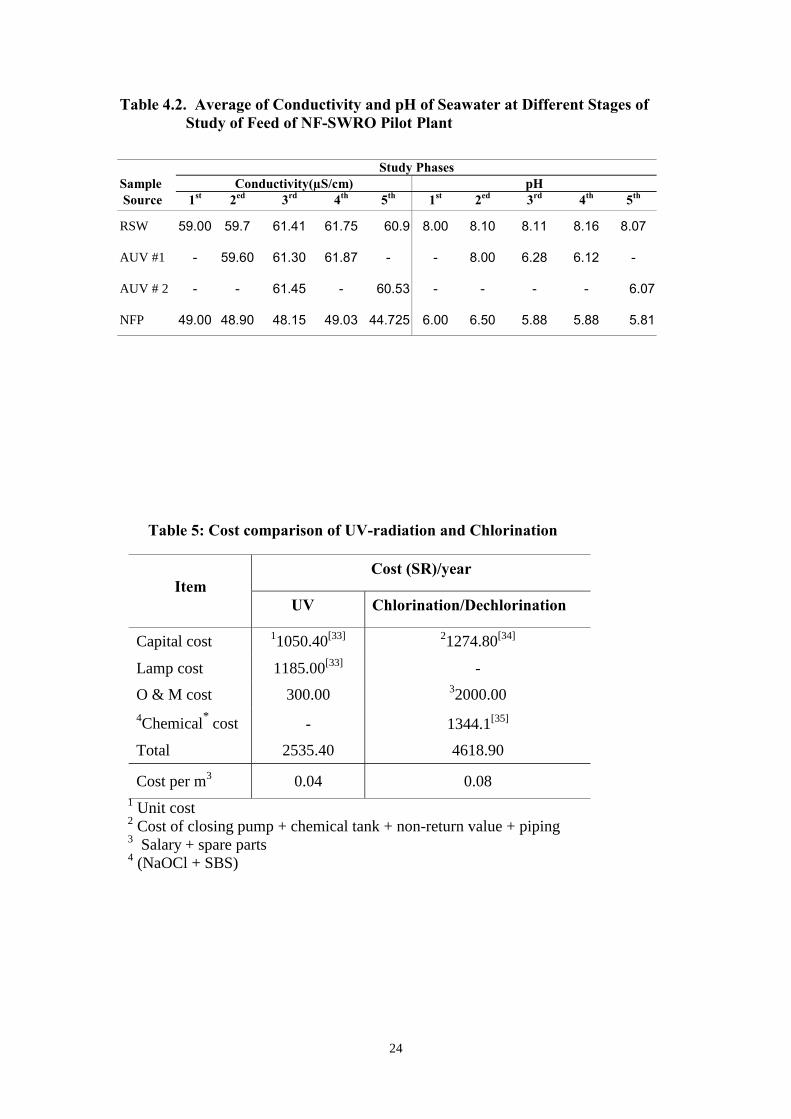
Table 4.2. Average of Conductivity and pH of Seawater at Different Stages of Study of Feed of NF-SWRO Pilot Plant
Study Phases Sample Conductivity(µS/cm) pH Source 1st 2ed 3rd 4th 5th 1st 2ed 3rd 4th 5th
RSW 59.00 59.7 61.41 61.75 60.9 8.00 8.10 8.11 8.16 8.07
AUV #1 - 59.60 61.30 61.87 - - 8.00 6.28 6.12 -
AUV # 2 - - 61.45 - 60.53 - - - - 6.07
NFP 49.00 48.90 48.15 49.03 44.725 6.00 6.50 5.88 5.88 5.81
Table 5: Cost comparison of UV-radiation and Chlorination
Cost (SR)/year Item
UV Chlorination/Dechlorination
Capital cost 11050.40[33] 21274.80[34]
Lamp cost 1185.00[33] -
O & M cost 300.00 32000.00 4Chemical* cost - 1344.1[35]
Total 2535.40 4618.90
Cost per m3 0.04 0.08
1 Unit cost 2 Cost of closing pump + chemical tank + non-return value + piping 3 Salary + spare parts 4 (NaOCl + SBS)
25
NF membranes
8"
4"
SeawaterPump
RO membraneBrine
Permeate tank
High P. P.
SeawaterTank
Pre-treated Tank
Cartridge Filter
Dual Media Filters
NF-Brine
NF-Permeate
Figure 1. First Stage Normal Operation of Pilot Plant without UV Radiation
NF membranes
8"
4"
SeawaterPump
RO membraneBrine
Permeate tank
High P. P.
SeawaterTank
Pre-treated Tank
CartridgeFilter
Dual Media Filters
NF-Brine
UV-Unit
Figure 2. Second Stage Applying UV-Radiation at RSW Inlet and Before NF Membrane
26
NF-membra nes
8"
4"
SeawaterPump
RO membraneBrine
Perm eate tank
High P. P.
SeawaterTank
Pre-treated Tank
CartridgeFilter
Dual Media Filters
NF-Brine
NF-Permea te
UV-Unit # 1
UV-Unit # 2
Figure 3. Third Stage Applying UV-radiation at RSW Inlet and Before NF Membrane
NF-membranes
8"
4"
SeawaterPump
RO membraneBrine
Permeate tank
High P. P.
SeawaterTank
Pre-treated Tank
Cartridge Filter
Dual Media Filters
NF-Brine
NF-Permeate
UV-Unit
Figure 4. Fourth Stage Applying UV-radiation Before NF Membrane
27
I II III UV#1 III UV#2 IV V
% o
f Red
uct
ion
80
85
90
95
100
Figure 6. Average of Bacterial Removal or Kill by UV radiation in The Feed of NF-SWRO Pilot Plantat Different Study Phases
Study Phases
RS
W
AU
V#1
AM
F
AC
F
AU
V#2
NF
P
NF
B I
II III
IV V
3.00E+1
4.03E+3
8.03E+3
1.20E+4
1.60E+4
2.00E+4
Figure5: Bacterial Mass in The Feed of NF-SWRO Pilot Plant at Different Study Phases
Study Phases
Samplses
CF
U/m
l
28
RSW
AUV # 1
AMF
ACF
AUV # 2
NFP
NFB I
II
III
IVV
CFU
/ml
1.00E+03
2.01E+05
4.01E+05
6.01E+05
8.01E+05
1.00E+06
1.20E+06
1.40E+06
Figure 7. 48-h Bacterial Aftergrowth Count (CFU/ml) in The Feed of NF-SWRO Pilot Plant at Different Study Phases
Sam ples
Study Phases
Figure 8: Biofilm Growth (CFU/cm2) on Coupons Exposed to NF Product at Different Study Phases
I71%
2.80E+4
II9%
4.66E+3
III8%
3.05E+3
IV12%
3.59E+3
29
Figure 9. Bacterial Density on Coupons Exposed to NFP During Study Phase # V
1.00E+00
1.00E+01
1.00E+02
1.00E+03
1.00E+04
1.00E+05
1.00E+06
1.00E+07
10 20 30 40 50 60 70 80Days
CF
U/c
m2
30
11. Photographs
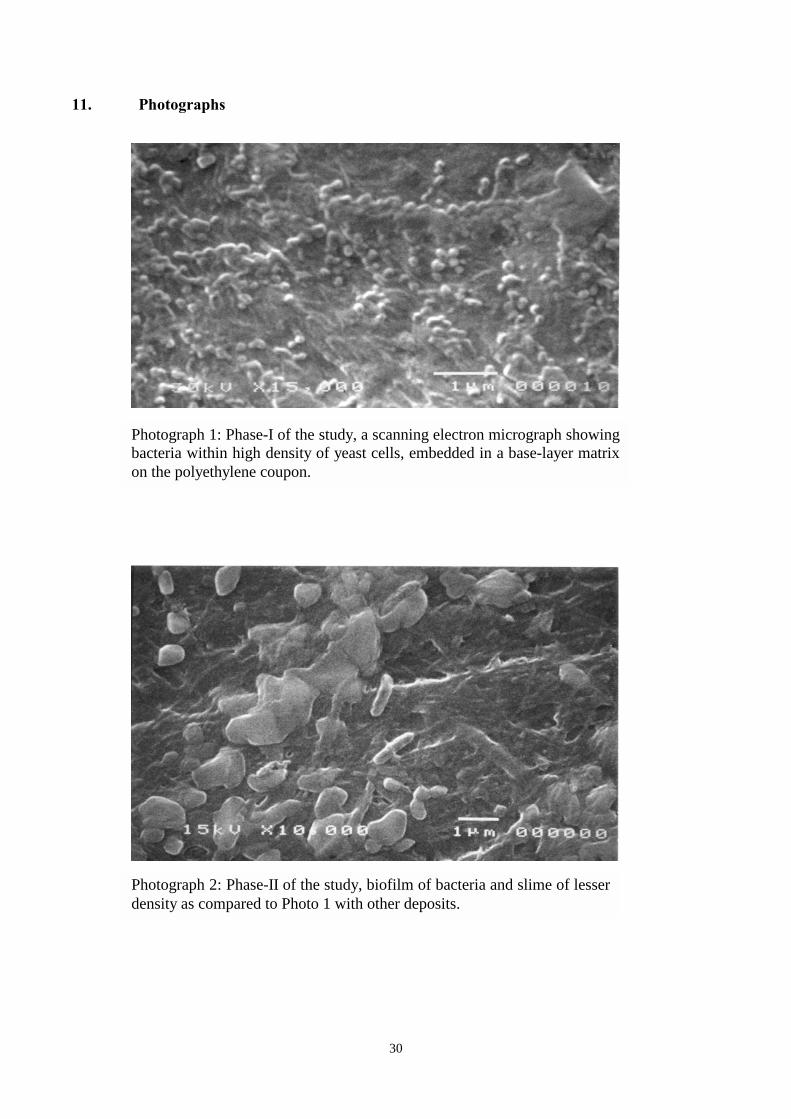
Photograph 1: Phase-I of the study, a scanning electron micrograph showing bacteria within high density of yeast cells, embedded in a base-layer matrix on the polyethylene coupon.
Photograph 2: Phase-II of the study, biofilm of bacteria and slime of lesser density as compared to Photo 1 with other deposits.
31
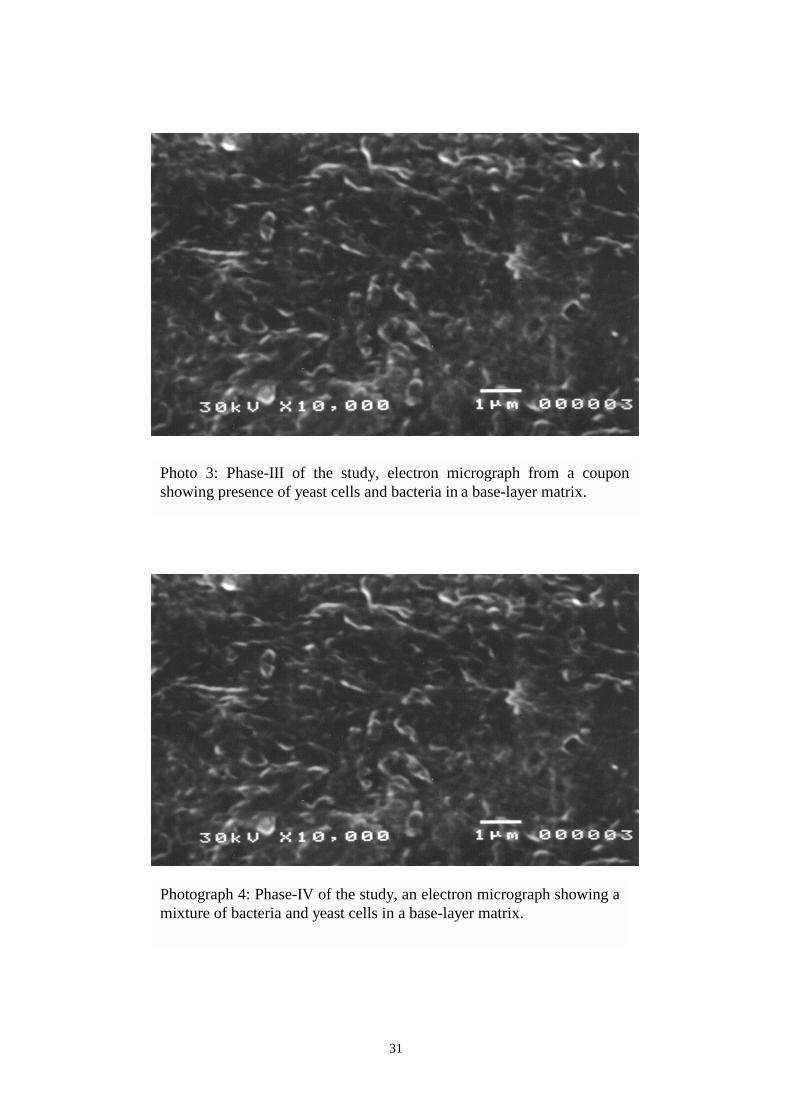
Photograph 4: Phase-IV of the study, an electron micrograph showing a mixture of bacteria and yeast cells in a base-layer matrix.
Photo 3: Phase-III of the study, electron micrograph from a coupon showing presence of yeast cells and bacteria in a base-layer matrix.
Related Documents