Application of the Transition Probability Matrix Method to High Knudsen Number Flow Past a Micro-Plate Andrew J. Christlieb , W. Nicholas G. Hitchon † , Quanhua Sun and Iain D. Boyd Department of Aerospace Engineering University of Michigan 1320 Beal Avenue Ann Arbor, MI 48109-2140 † Department of Electrical and Computer Engineering University of Wisconsin 1415 Engineering Dr. Madison, WI 53706 Abstract. In this work we present numerical results for the problem of ‘high’ (of order unity) Knudsen number gas flow past a micro-airfoil, for low flow velocity. The results are generated using an enhanced version of the transition probability matrix (TPM) method. The TPM is a non-statistical kinetic method [1] for computing neutral particle transport in high Knudsen number flows. The problem of high Knudsen number, low Mach number gas flow has been studied in the past using several computational approaches, such as the Information Preservation (IP) method [2] and the direct simulation Monte Carlo (DSMC) method [2]. For low Mach numbers, the DSMC approach suffers from statistical noise [3]. The IP method extends the range of the particle method by reducing the statistical noise of the approach. The need for a method which is capable of describing the particle distribution function for high Knudsen number flows at low flow velocities has led to an investigation of alternative kinetic approaches, such as the IP[4]. In this paper we present an altogether different approach to the problem of statistical noise, the transition probability matrix (TPM) method [1, 5, 6, 7]. We give a brief overview of the TPM method, and compare its strengths and weaknesses to those of the IP and DSMC methods. Finally, we present results for the micro-plate and compare them to the results generated by both the IP and DSMC methods. INTRODUCTION In this work we consider a low velocity flow (Mach number, M, less than 0 3) past a flat plate of length of the order of 1 10 μ m. Such flows present challenges for well established statistical approaches, such as the direct simulation Monte Carlo (DSMC). At low Mach numbers, particle based approaches require a large number of samples in order to reduce statistical scatter to a level where the flow can be resolved (sample size 10 5 for a variance less than 1 m sec ). The need for a large number of samples can render these methods impractical [3]. Figure 1 illustrates the issue for a DSMC simulation. The flow is for a Mach number of M 0 12 and a Knudsen number of K n 0 05, where K n λ PlateLength . Adaptations of statistical methods have extended their range to cover these types of flows. One such adaptation is the information preservation (IP) method [8, 2, 3, 4]. The IP method is a hybrid model that combines a particle (microscopic) description with a global (macroscopic) description. Although this extension works well for flows where K n 1 0, the continuum model used in adjusting the global information becomes of questionable validity for K n 1 0. Another approach to this problem of statistical noise is to develop a non-statistical (no random numbers used) kinetic model suited to these types of flows. To that end, we have developed a particle transport model based on the use of one step transition probability matrices, which we refer to as the transition probability matrix method (TPM) [5, 1]. (See also [6, 7, 9, 10, 11].) The TPM has been applied to the problem of flow past a micro-plate. In lieu of experimental data, we have also applied the IP, DSMC and Navier-Stokes (NS) models to the same flows. The results are qualitatively similar and they provide some insight into the strengths and weaknesses of each of the models. We find broadly similar results for the drag coefficients and the IP and TPM results exhibit similar trends in velocity. As K n increases, the domain of influence of particles coming off the plate increases in a similar manner for both the IP and TPM. The NS slip model

Welcome message from author
This document is posted to help you gain knowledge. Please leave a comment to let me know what you think about it! Share it to your friends and learn new things together.
Transcript

Application of the Transition Probability Matrix Method toHigh Knudsen Number Flow Past a Micro-Plate
Andrew J.Christlieb�, W. NicholasG. Hitchon†, QuanhuaSun
�andIain D. Boyd
��Departmentof AerospaceEngineering
University of Michigan1320BealAvenue
AnnArbor, MI 48109-2140†Department of ElectricalandComputerEngineering
University of Wisconsin1415EngineeringDr.Madison,WI 53706
Abstract. In this work we presentnumericalresultsfor the problemof ‘high’ (of orderunity) Knudsennumber gasflowpasta micro-airfoil, for low flow velocity. The resultsaregeneratedusingan enhanced versionof the transitionprobabilitymatrix (TPM) method.The TPM is a non-statisticalkinetic method[1] for computingneutralparticle transportin highKnudsennumberflows.Theproblemof high Knudsennumber, low Machnumber gasflow hasbeenstudiedin thepastusingseveralcomputationalapproaches,suchastheInformationPreservation(IP) method[2] andthedirectsimulationMonteCarlo(DSMC) method[2]. For low Machnumbers, theDSMC approachsuffers from statisticalnoise[3]. TheIP methodextendstherangeof theparticlemethodby reducingthestatisticalnoiseof theapproach. Theneedfor a methodwhich is capableofdescribingtheparticledistribution functionfor high Knudsennumber flows at low flow velocitieshasled to aninvestigationof alternativekineticapproaches,suchastheIP[4]. In thispaperwepresentanaltogetherdifferentapproachto theproblemofstatisticalnoise,thetransitionprobabilitymatrix (TPM) method[1, 5,6, 7]. Wegiveabrief overview of theTPM method,andcompareits strengthsandweaknesses to thoseof the IP andDSMC methods.Finally, we presentresultsfor themicro-plateandcomparethemto theresultsgeneratedby boththeIP andDSMCmethods.
INTRODUCTION
In thiswork weconsidera low velocityflow (Machnumber, M, lessthan0 � 3) pastaflat plateof length of theorderof110 µm. Suchflows present challenges for well establishedstatisticalapproaches,suchasthedirectsimulationMonteCarlo(DSMC).At low Machnumbers,particlebasedapproachesrequirea largenumberof samplesin orderto reducestatisticalscatterto a level wheretheflow canberesolved(samplesize � 105 for avariancelessthan1 m
sec� ). Theneedfor a large number of samplescanrender thesemethods impractical[3]. Figure1 illustratesthe issuefor a DSMCsimulation.Theflow is for a Machnumberof M � 0 � 12anda Knudsennumber of K n � 0 � 05, whereKn � λ
PlateLength .Adaptations of statisticalmethodshave extended their range to cover thesetypesof flows. Onesuchadaptation
is the information preservation (IP) method[8, 2, 3, 4]. The IP method is a hybrid model that combinesa particle(microscopic)descriptionwith aglobal(macroscopic)description.Althoughthisextensionworkswell for flowswhereKn
� 1 � 0, thecontinuummodelusedin adjustingtheglobal informationbecomesof questionable validity for K n�
1 � 0.Another approachto thisproblemof statisticalnoiseis todevelopanon-statistical(norandomnumbersused)kinetic
model suitedto thesetypesof flows.To thatend,wehavedevelopedaparticletransport modelbasedontheuseof onesteptransitionprobability matrices,which we referto asthetransitionprobability matrix method(TPM) [5, 1]. (Seealso[6, 7, 9, 10, 11].)
The TPM hasbeenappliedto the problem of flow pasta micro-plate.In lieu of experimentaldata,we have alsoappliedthe IP, DSMC andNavier-Stokes(NS) modelsto the sameflows. The resultsarequalitatively similar andthey provide someinsight into the strengths andweaknessesof eachof themodels.We find broadly similar resultsfor thedragcoefficientsandtheIP andTPM resultsexhibit similar trendsin velocity. As K n increases,thedomain ofinfluence of particlescomingoff theplateincreasesin a similar mannerfor boththeIP andTPM. TheNS slip model
admin
© 2003 American Institute of Physics 0-7354-0124-1/03/$20.00
admin
CP663,
admin
Rarefied Gas Dynamics: 23rd International Symposium,
admin
edited by A. D. Ketsdever and E. P. Muntz
admin
768

x-axis
y-ax
is
-2 -1 0 1 2 30
0.5
1
1.5
2
0.87 0.9 0.93 0.96 0.99
DSMC-n/nmaxKn=0.05
FIGURE 1. DSMCresultsfor argonflowing pastaflat plate.Theinlet flow velocity is � 40 msec� 0 0� , thetemperatureis 288K and
theKnudsennumber is 0 05.Thesamplingsize � 3 � 105 particlescell andthesimulationdomainconsistof 4000cells.
agreeswith theIP andTPM for low Kn. As Kn increases,theNSslip modelfails to capture theessentialphysics. Thedensityprofiles for theNSslip model becomemorelocalizedabouttheplateasKn increasesandthevelocitydivergesfrom thatpredictedby boththeTPM andIP models.
Webegin with abrief introductionto theTPM followedby adiscussionof thestrengthsandweaknessesof theTPMversustheIP andDSMCmodels.This is followedby adiscussionof theresults.Finally, wesummarize theresultsandgivesomeconcluding remarks.
TRANSITION PROBABILITY MATRIX (TPM) METHOD
In thissectionweprovideanoverview of theTPM [1]. Theobjectiveof theTPM is to solvethesteadystateBoltzmannequation for LMFP environments,
��v � ∇r f � �� r � �� v ��� ��
Fm
� ∇v f � �� r � �� v ��� δ fδ t
�coll ision � (1)
Insteadof directly computing f � �� r � �� v � , theTPM tracesthecollision rates,R� c � a � E � , of particlesfor eachlocation,� position � direction � energy� , of a 6D phasespacemesh[1]. The computationof R� c � a � E � is performed throughsuccessiveapplication of a one-steptransitionprobability matrix,
R� c � a � E ��� ∑c � ∑
a � ∑E � T � c � a � E : c ��� a ��� E ��� R� c � � a � � E �!� (2)
where � c � a � E � arethe coordinatesof a phasespacelocation.R� c � � a � � E � � is the number of particlesthat collided atcoordinates � c � � a � � E � � at the previous iterationandT � c � a � E : c � � a � � E � � is the probability that a particlestartingatcoordinate � c � � a � � E � � will haveits next collisionat � c � a � E � . Giventheotherphysicalparameterssuchasthemeanfreepath( λ � c � E � ), theparticlevelocity (v � E � ), andsoon,Rcanbeusedto reconstructany desiredinformationabout theflow. For examplethedensityn � c � is
n � c ��� ∑E
R� c � E � λ � c � E ��v � E � � γ � c � � (3)
wheren � c � is thedensityin cell c of thespatialmesh,R� c � E �"� ∑a R� c � a � E � , andγ � c � is thevolumeof cell c.The transportandredistribution, in energy andangle,described by T in equation 2 is brokenup into two distinct
operations,aballisticmoveoperation andacollisionalredistributeoperation,i.e.,T � R��� Tcol # Tbal � R� . Tbal � c � a � � E � :c � � a � � E � � is theprobability thata particlestartingat a spatiallocationc � moving alonga direction a � with energy E �will have its next collision in spatialcell c. Tcol � c � a � E : c � a � � E � � is theprobability thataparticlethathadacollision incell c andwasinitially moving alongthedirection a � at energy E � is redistributedwith direction a andenergy E. Theequationsfor constructingR� c � a � E � , usingTbal andTcol, are,
R� c � a � � E �!�$� ∑c � R� c ��� a ��� E ��� Tbal � c � a ��� E � : c ��� a ��� E ��� (4)
R� c � a � E �$� ∑a � ∑
E � R� c � a � � E � � Tcol � c � a � E : c � a � � E � �%� (5)
admin
769

The ballistic operation, Tbal, canbe performedefficiently through the useof a ‘propagating structure’ and localphasespaceinformationabout the flow at eachcell c. The propagatingstructurecontains geometrical informationabout fractional overlapsandaverage lengths.A fractional overlap,γ � c � a � � , is the fractionof particlesthatwill passthough c having startedin cell c � with direction a � . Theaveragelength, & L � c � a � �(' , is theaveragedistanceaparticlewilltravel whenpassingthroughcell c, sothenumberof particlesdistributedfrom location � c � � a � � E � � to location � c � a � � E � �is givenby
N � c � a ��� E ����� n � c ��� a ��� E ��� γ � c � a ��� )1 � e
λ * c + E �-,.L * c + a � , /10 (6)
wheren � c � � a � � E � � is thenumberof particlesremaining atphasespacelocation � c � � a � � E � � whenthepropagatorreachesspatiallocationc. R� c � a � � E � � is thesumof equation6 over all c � .
Tcol redistributesparticlesin energy anddirection while strictly enforcing energy andmomentum conservation.Thecurrent versionof Tcol employs oneof two functionsfor redistribution in energy ( f � E � ), eithera mono-energeticcollisionoperator or a modified BGK collision operator[5]. Thenredistribution in directionis performedthrough theuseof a polynomial,
f � a ���2� 1 � αvx � a �43 v � βvy � a �43 v � γvz � a �13 v�5� (7)
wherev is thespeedof theoutgoing particles,vx � a � , vy � a � andvz � a � arethecomponentsof velocity of theparticlesmoving in the directiona andα , β , and γ arenormalization factors.The distribution f � a � must total to one, i.e.,6
f � a � da � 1. The integral providesthe constraint neededto determine α , β , andγ . Detailsregarding f � E � canbefound in reference[5] anddetailsof f � a � canbefoundin reference[7].
In thepast,we have appliedtheTPM to 3D arbitrary spatialmeshesfor 6D phasespacemeshes[5]. However, inthecurrent version,wehave implementedtheTPM for auniformspatialmesh,for two reasons.It wasdiscoveredthatin orderto get uniform coverageof a spatialmeshfor particlesreflectingoff walls, the earlierversion of the TPM(in reference[5]) neededa ‘volume reflecting’ region behind thewall for trackingparticletransport [1]. This volumereflectingregion ensuredthatparticlescoming off thewall behaved asif they werecomingfrom sourcesbehindthewall. Without sucha region the bestthat the methodcould achieve wasa 1% variationin uniformity, which is onthe order of the densityvariations for thesehigh Kn low M flows we areinterestedin describing. With the volumereflectingregion, uniformity variationswereunder 10 7 5. Theversionusedhereandin reference[1] doesnot requirea volumereflectingregion, however theresultspresentedheremake useof one.In addition, Tbal dependsheavily ongeometric informationaboutthemesh,soa uniform meshallowedfor reduction in computationaloverheadby takingadvantageof symmetry.
A COMPARISON OF THE MODELS
Generally, DSMCis oneof themostsuccessfulparticlemethodsfor rarefiedgasflows.It is several ordersof magnitudelessnumerically expensivethanmethodsfor directlysolvingtheBoltzmannequation,andseveralordersof magnitudemoreexpensive thanconventional CFD schemes.The DSMC methodinvolvesstatisticalscattercomparableto themeanthermalvelocity of the molecules,i.e., the scatterper particle is σ �98 2RT so that the scatterper cell isσ � � σ:
N. In theprevious two expressionsT is in Kelvin andN is thenumberof samplespercell. Hence,it requiresa
hugenumber of samplesfor low speedgasflows,andbecomes almostimpossiblefor very low speedflows.The information preservation method wasproposedto solve the samplingdifficulty in the DSMC method. In IP,
particlessimulatedin the DSMC method additionally preserve macroscopic information aboutthe flow field. Thismacroscopicinformationis updatedduring collisionsbetweenparticlesandcollisionsbetweenparticlesandwalls,andis modifiedto include thepressureeffectsexclude in thecollisions.Namely, themacroscopicinformationpreservedin theparticlesis updatedaccording to theaveragebehavior of therepresentedmoleculesduring collisionswhile thepressurefield effectsareevaluatedemploying acontinuummodel to modify themacroscopicinformationcontainedinall particlesin agiven cell.Theflow field is sampledfrom themacroscopicinformationpreservedin theparticles.Thisprocessdramaticallyreducesthestatisticalnoiseof theparticlemethod for very low speedgasflows.It wasshown [4]thattheIP method, with modelsfor updating theflow field, worksverywell for low speedgasflows ranging from thecontinuum regime to thefreemolecular regime. It wasalsomentioned thatmodified modelswererequired for flowswheretheflow speedis not small.However, it is not very clearabout thephysicslost in thecollision processfor thepreservedmacroscopicinformation.Hence,it is suspectedthecurrent modelsarenotphysically correctfor very highKnudsennumberflows,but theresultsappearto support its validity for theselow speedflows.
admin
770

The Navier-Stokesequations aresolved usinga finite volumeformulation [12]. The fluxes areevaluatedwith asecond-orderaccuratemodifiedSteger- Warmingflux-vector splitting approach,andan implicit Gauss-Seidelline-relaxation methodis usedfor the time integration. Comparedwith particlemethods, theNS solver is relatively fast.However, the Navier- Stokesequations areonly accuratefor nearequilibrium flows. To enhance the validity of theequations,a Maxwellian typeslip wall model is used.Then,the Navier-Stokessolver maybeappliedto flows withKnudsennumberup to 0 � 1.
The TPM wasproposedasan alternative to statisticalparticletransport models.The drawbackto this version oftheTPM is thattheBGK modelbecomesof questionablevalidity for Kn ; 1 � 0. However, given thedifferentialcross-sectionfor a desiredspecies,theTPM couldeasilybealteredto handle collisionsexactly for high K n flows.Anotheralternative to the BGK model is to usea DSMC modelto determinethe statisticsfor collisions[7]. However, in aflow wheretherewerewidevariationsin density, pre-computing thecollisionrateswith a DSMCmodelwouldnotbepossible.
All four modelshave limitations.For DSMC, low speedflows present difficultiesbecauseof theenormousnumberof samplesneededto reducestatisticalnoise.DSMCcould beeffectivefor theselow speedflows,if enoughcomputingpowerwereavailable.However this is unlikely to happensoon.
For the IP method, it is not clearthat thecontinuummodelscurrently usedarewell suitedfor high K n. However,numerical resultsof theIP modelfor simplehigh Kn testflows arein goodagreementwith DSMC results[4]. Somethought needsto be given to understandingwhat is the essentialphysics that is lost in the IP during the averagingprocess.This mayprovide thekey to beingableto proposemodelsfor building backthe‘lost’ physics.
TheNS slip model doesnot capture theessentialphysicsof high Kn environments.Higherordercorrectionsto theNSmodel, suchastheBurnettequations,couldbeusedbut thisdoesnotaddressthefundamentalissuethatmosthighKn flows arenotwell describedby asinglemacroscopicflow velocityandtemperature.
TheTPMmaybetheapproachthatiseasiesttomodify in ordertomodelhighK n flows,becauseit is well understoodwhatadditional physicsneedsto beincludedto provideamorecompletecollisionmodel.
RESULTS
In this section,theresultsfor theTPM, IP andNS simulations, for flow pasta flat plate,arepresentedanddiscussed.All of theflows presentedarefor argon. Thefar field boundaryconditions (aninlet velocity setto � v x � 40 m
sec� � vy �0 m
sec� � vz � 0 msec� � ) areusedfor all therunspresented. Although theseboundaryconditionsarenotphysicalfor theflow
domains investigated,theseconditionswereusedbecausethey makedirectcomparisonof themodelseasier. Sincethespeedof soundin argon is around316 m
sec� , M � 0 � 12.Theflowspresentedfor all threecasesarefor Knudsennumbers
( λL ) of 0 � 05,0 � 2 and1 � 2. In thefiguresthefirst columnsarethenormalizeddensitycontours, thesecondcolumnsare
the normalizedx-velocity contours andthe the third columns arethe normalizedy-velocity contours for the TPM,IP andNS models.We alsocompare thedragcoefficient,Cd, for Kn of 0 � 05, 0 � 2, 0 � 8, and1 � 2 aspredictedby thesemodels. In addition, wepresentTPM resultsfor Kn � 10.
Figure2 is for Kn � 0 � 05. The upstreamregion is 1 12 timesthe lengthof the plate,the downstream region is 2 1
2timesthelengthof theplateandtheheightof thesimulationdomainis 2 timesthelengthof theplate.Thesimulationswererun on two different meshes.Thefirst meshusedwasthesamefor all threesimulations to make comparisonseasier. This first meshhada uniform spacingof a meanfree path,i.e., ∆M �<& λ � c � E �(' . The secondmeshusedbythe IP andNS models wasnon-uniform with many cells packed around the plate,while the secondmeshfor TPMwasauniform meshwith double theresolutionof thefirst uniform mesh.Except at theupstreamboundary, wheretheartificial fixing of thedensitycausesunphysicalbehavior in theIP andNSresults,thedensity contoursexhibit similartrendsin all cases.Themaximum andminimum densitiesdeterminedby theTPM, IP andNSfor theuniformmeshare� 1 � 012� 0 � 988� , � 1 � 035 � 0 � 975� , and � 1 � 029� 0 � 977� . WhentheTPMwasrunontheseconduniformmesh,themaximumandminimumvaluesare � 1 � 019� 0 � 981� . Foranon-uniformmesh,theIPandNSfindamaximumandminimumdensityof � 1 � 020 � 0 � 980� and � 1 � 034� 0 � 973� . Thevalues for maximumandminimum densityfor thethreemodelswith betterresolutionarecomparablealthoughtheNS givesa somewhat largervariation. Thenormalizedvelocitiesfor all threemodels alsoexhibit similar behavior. For the casesshown in figure 2, the minimum andmaximum x-velocities are� 0 � 11� 1 � 20� TPM, � 0 � 22� 1 � 18� IP, and � 0 � 22� 1 � 16� NS. The y-velocity rangesare � � 0 � 16 � 0 � 17� TPM, � � 0 � 12 � 0 � 17� IP,and � � 0 � 17� 0 � 17� NS. Only thex-velocitiesexhibit muchchangewhenthemeshis altered.Thex-velocity rangefor theTPM, onameshwith double theresolution, is � 0 � 13� 1 � 15� . For theIP andNS modelstherangesare � 0 � 13� 1 � 07� and� 0 � 16� 1 � 14� . Table1 showsthecalculateddragcoefficient for theDSMC,IP, NSandTPM models.TheDSMCresults
admin
771

x-axis
y-ax
is
-2 -1 0 1 20
0.5
1
1.50.975 0.99 0.997 1.002 1.008 1.018
TPM-n/ninfKn=0.05
a)
x-axis
y-ax
is
-2 -1 0 1 20
0.5
1
1.50.975 0.99 0.997 1.002 1.008 1.018
IP-n/ninfKn=0.05
b)
x-axis
y-ax
is
-2 -1 0 1 20
0.5
1
1.50.975 0.99 0.997 1.002 1.008 1.018
NS-n/ninfKn0.05
c)
x-axis
y-ax
is
-2 -1 0 1 20
0.5
1
1.50.105 0.35 0.65 0.85 0.99 1.13
TPM-vx/v0Kn=0.05
d)
x-axisy-
axis
-2 -1 0 1 20
0.5
1
1.50.105 0.35 0.65 0.85 0.99 1.13
IP-vx/v0Kn0.05
e)
x-axis
y-ax
is
-2 -1 0 1 2 30
0.5
1
1.50.105 0.35 0.65 0.85 0.99 1.13
NS-vx/v0Kn0.05
f)
x-axis
y-ax
is
-2 -1 0 1 20
0.5
1
1.5-0.165 -0.12 -0.08 0.04 0.12 0.17
TPM-vy/v0Kn=0.05
g)
x-axis
y-ax
is
-2 -1 0 1 20
0.5
1
1.5-0.165 -0.12 -0.08 0.04 0.12 0.17
IP-vy/v0Kn=0.05
h)
x-axis
y-ax
is
-2 -1 0 1 20
0.5
1
1.5-0.165 -0.12 -0.08 0.04 0.12 0.17
NS-vy/v0Kn=0.05
i)
FIGURE 2. Resultsfor flow pastaflat platefor theTPM, IP andNSmodelsgeneratedwith auniformgrid.Theflow is argonwithaninlet velocity of � 40m= sec 0 0� andKn > 0 05.Thefirst columnis normalizeddensity. Thesecondcolumnis thenormalizedxvelocity andthethird columnis thenormalizedy velocity.
TABLE 1. Drag coefficient for flow pasta flat plate for theDSMC , IP, NS andTPM models. In all casesKn > 0 05.
Kn grid DSMC IP NS TPM
0.05 small,uniform1 1.84 1.89 1.70 2.300.05 small,uniform2 —- —- —- 1.650.05 small,non-uniform 1.64 1.62 1.80 —-0.05 large,non-uniform 1.52 1.45 1.52 —-
aregivenherefor comparisonpurposes,although the statisticalscatteris not small enough. Thecolumndesignatedgrid specifiesthe type of meshthat the resultsweregeneratedon. ‘small, uniform1’ designates the dragcoefficientfor the plots shown in figure 2. ‘small, uniform2’ is the samedomainsizeasmentioned above but with double theresolutionof the mesh.‘small, non-uniform’ is the samedomain sizeasmentionedabove but the resultsare for anon-uniform mesh.‘large,non-uniform’ is aboutthreetimesthedomain sizeasmentionedabove andmakesuseof anon-uniform mesh.Our first observation is that thedragcoefficient is dependenton the resolutionof themesh.Thefirst row of table1 showsthat,for identicalboundaryconditionsandmeshspacing,theTPM predictsthehighestdragcoefficient (Cd � 2 � 30) while theNS givesthe lowestdragcoefficient (Cd � 1 � 70) for theseconditions.For a higherresolutionmeshneartheplateandasmallerdomain, theDSMC,IP andTPM modelsarein goodagreement, whereastheNS model predicts a valuehigher thanwhat themodelcomputedfor theuniform mesh(ascanbeseenin rows 2and3 of table1). However, theNS model agreeswell with the resultsfor the DSMC andIP methods for the largerdomain, seerow 4 of table1.
Figure3 shows thedensity, x-velocity andy-velocity contours for K n � 0 � 2. Theresultsshown in figure 3 arefortwo different meshes.TheTPM wasrun on a uniform meshwith a meshspacingof ∆M �@? λ A c B E CED
2 . The IP andNSmodels arefor anon-uniformmeshthatpackscellsaround theplate.Thedensitycontoursexhibit similarbehavior. The
admin
772
x-axis
y-ax
is
-2 -1 0 1 20
0.5
1
1.50.953 0.986 0.998 1.008 1.02
TPM-n/ninfKn=0.2
a)
x-axis
y-ax
is
-2 -1 0 1 20
0.5
1
1.50.953 0.986 0.998 1.008 1.02
IP-n/ninfKn=0.2
b)
x-axis
y-ax
is
-2 -1 0 1 20
0.5
1
1.50.953 0.986 0.998 1.008 1.02
NS-n/ninfKn=0.2
c)
x-axis
y-ax
is
-2 -1 0 1 20
0.5
1
1.50.27 0.47 0.67 0.77 0.87 0.97 1.07
TPM-vx/v0Kn=0.2
d)
x-axisy-
axis
-2 -1 0 1 20
0.5
1
1.50.27 0.47 0.67 0.77 0.87 0.97 1.07
IP-vx/v0Kn=0.2
e)
x-axis
y-ax
is
-2 -1 0 1 20
0.5
1
1.50.27 0.47 0.67 0.77 0.87 0.97 1.07
NS-vx/v0Kn=0.2
f)
x-axis
y-ax
is
-2 -1 0 1 20
0.5
1
1.5-0.13 -0.08 -0.05 0.03 0.09 0.13
TPM-vy/v0Kn=0.2
g)
x-axis
y-ax
is
-2 -1 0 1 20
0.5
1
1.5-0.13 -0.08 -0.05 0.03 0.09 0.13
IP-vy/v0Kn=0.2
h)
x-axis
y-ax
is
-2 -1 0 1 20
0.5
1
1.5-0.13 -0.08 -0.05 0.03 0.09 0.13
NS-vy/v0Kn=0.2
i)
FIGURE 3. Resultsfor flow pasta flat plate for the TPM, IP and NS models.The flow is argon with an inlet velocity of� 40m= sec 0 0� andKn > 0 2. Thefirst columnis normalizeddensity. Thesecondcolumnis thenormalizedx velocity andthethirdcolumnis thenormalizedy velocity.
maximum andminimum densitiesdeterminedby theTPM, IP andNS modelsare � 1 � 022� 0 � 985� , � 1 � 028 � 0 � 972� , and� 1 � 062� 0 � 942� . Thepeakdensity computedby theTPM is slightly off thesurfaceof theplate,whereastheIP modelpredicatesthatthemaximumandminimum densityshould beat thesurfaceof theplate.Thenormalizedvelocities forall threemodelsalsoexhibit similarbehavior. For thecasesshown in figure2, theminimum andmaximumx-velocitiesare � 0 � 28� 1 � 07� TPM, � 0 � 26� 1 � 02� IP, and � 0 � 36� 1 � 03� NS. They-velocity rangesare � � 0 � 13 � 0 � 14� TPM, � � 0 � 09 � 0 � 11� IP,and � � 0 � 11 � 0 � 11� NS.
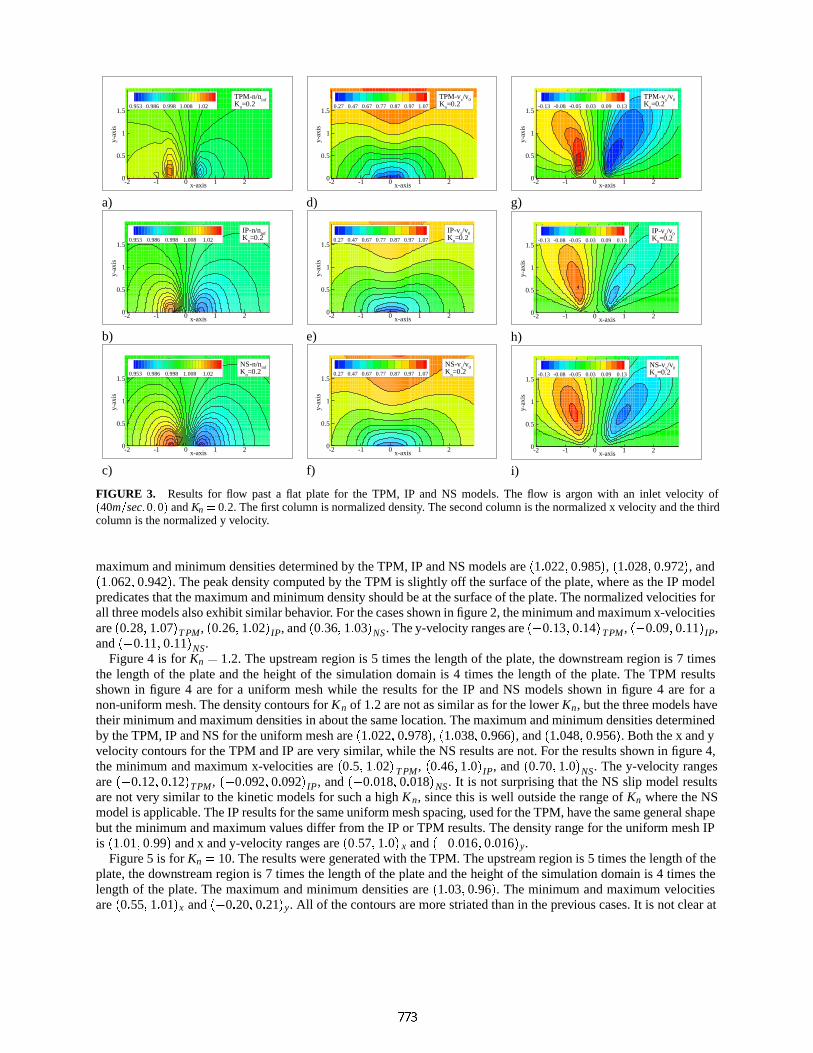
Figure4 is for Kn � 1 � 2. Theupstream region is 5 timesthe lengthof theplate,thedownstreamregion is 7 timesthe lengthof the plateandthe height of the simulationdomainis 4 timesthe lengthof the plate.The TPM resultsshown in figure 4 are for a uniform meshwhile the resultsfor the IP andNS modelsshown in figure 4 are for anon-uniform mesh.Thedensitycontours for Kn of 1 � 2 arenotassimilarasfor thelowerKn, but thethreemodelshavetheirminimum andmaximum densitiesin aboutthesamelocation. Themaximumandminimumdensitiesdeterminedby theTPM, IP andNSfor theuniform meshare � 1 � 022� 0 � 978� , � 1 � 038� 0 � 966� , and � 1 � 048� 0 � 956� . Both thex andyvelocitycontours for theTPM andIP arevery similar, while theNS resultsarenot.For theresultsshown in figure4,theminimum andmaximum x-velocities are � 0 � 5 � 1 � 02� TPM, � 0 � 46� 1 � 0� IP, and � 0 � 70� 1 � 0� NS. They-velocity rangesare � � 0 � 12� 0 � 12� TPM, � � 0 � 092 � 0 � 092� IP, and � � 0 � 018� 0 � 018� NS. It is not surprisingthat theNS slip model resultsarenot very similar to thekinetic modelsfor sucha high Kn, sincethis is well outsidetherangeof Kn wheretheNSmodel is applicable.TheIP resultsfor thesameuniform meshspacing, usedfor theTPM,havethesamegeneral shapebut theminimum andmaximum valuesdiffer from theIP or TPM results.Thedensityrange for theuniform meshIPis � 1 � 01� 0 � 99� andx andy-velocity rangesare � 0 � 57� 1 � 0� x and � � 0 � 016� 0 � 016� y.
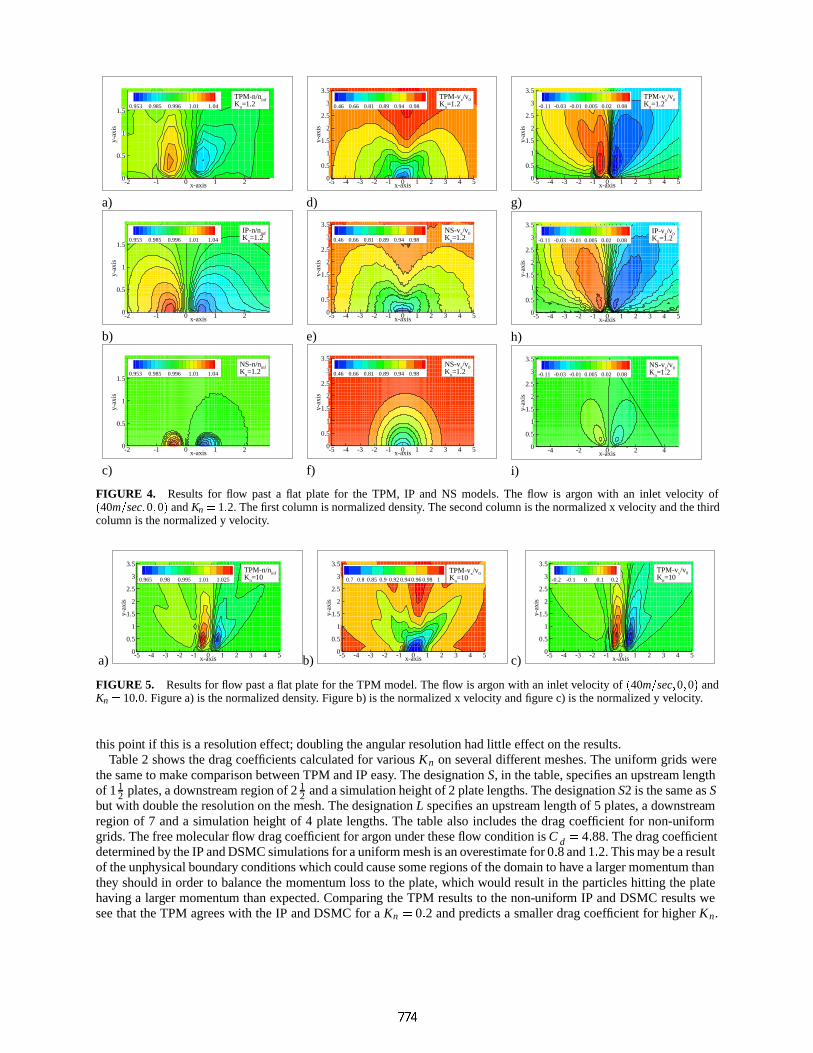
Figure5 is for Kn � 10.Theresultsweregeneratedwith theTPM. Theupstreamregion is 5 timesthelengthof theplate,thedownstreamregion is 7 timesthelengthof theplateandtheheight of thesimulationdomain is 4 timesthelengthof the plate.Themaximum andminimum densitiesare � 1 � 03� 0 � 96� . Theminimum andmaximum velocitiesare � 0 � 55� 1 � 01� x and � � 0 � 20� 0 � 21� y. All of thecontoursaremore striatedthanin thepreviouscases.It is notclearat
admin
773
x-axis
y-ax
is
-2 -1 0 1 20
0.5
1
1.50.953 0.985 0.996 1.01 1.04
TPM-n/ninfKn=1.2
a)
x-axis
y-ax
is
-2 -1 0 1 20
0.5
1
1.50.953 0.985 0.996 1.01 1.04
IP-n/ninfKn=1.2
b)
x-axis
y-ax
is
-2 -1 0 1 20
0.5
1
1.50.953 0.985 0.996 1.01 1.04
NS-n/ninfKn=1.2
c)
x-axis
y-ax
is
-5 -4 -3 -2 -1 0 1 2 3 4 50
0.5
1
1.5
2
2.5
3
3.5
0.46 0.66 0.81 0.89 0.94 0.98
TPM-vx/v0Kn=1.2
d)
x-axisy-
axis
-5 -4 -3 -2 -1 0 1 2 3 4 50
0.5
1
1.5
2
2.5
3
3.5
0.46 0.66 0.81 0.89 0.94 0.98
NS-vx/v0Kn=1.2
e)
x-axis
y-ax
is
-5 -4 -3 -2 -1 0 1 2 3 4 50
0.5
1
1.5
2
2.5
3
3.5
0.46 0.66 0.81 0.89 0.94 0.98
NS-vx/v0Kn=1.2
f)
x-axis
y-ax
is
-5 -4 -3 -2 -1 0 1 2 3 4 50
0.5
1
1.5
2
2.5
3
3.5
-0.11 -0.03 -0.01 0.005 0.02 0.08
TPM-vy/v0Kn=1.2
g)
x-axis
y-ax
is
-5 -4 -3 -2 -1 0 1 2 3 4 50
0.5
1
1.5
2
2.5
3
3.5
-0.11 -0.03 -0.01 0.005 0.02 0.08
IP-vy/v0Kn=1.2
h)
x-axis
y-ax
is
-4 -2 0 2 40
0.5
1
1.5
2
2.5
3
3.5
-0.11 -0.03 -0.01 0.005 0.02 0.08
NS-vy/v0Kn=1.2
i)
FIGURE 4. Resultsfor flow pasta flat plate for the TPM, IP and NS models.The flow is argon with an inlet velocity of� 40m= sec 0 0� andKn > 1 2. Thefirst columnis normalizeddensity. Thesecondcolumnis thenormalizedx velocity andthethirdcolumnis thenormalizedy velocity.
a) x-axis
y-ax
is
-5 -4 -3 -2 -1 0 1 2 3 4 50
0.5
1
1.5
2
2.5
3
3.5
0.965 0.98 0.995 1.01 1.025
TPM-n/ninfKn=10
b) x-axis
y-ax
is
-5 -4 -3 -2 -1 0 1 2 3 4 50
0.5
1
1.5
2
2.5
3
3.5
0.7 0.8 0.85 0.9 0.920.940.960.98 1
TPM-vx/v0Kn=1.2TPM-vx/v0Kn=10
c) x-axis
y-ax
is
-5 -4 -3 -2 -1 0 1 2 3 4 50
0.5
1
1.5
2
2.5
3
3.5
-0.2 -0.1 0 0.1 0.2
TPM-vy/v0Kn=0.2TPM-vx/v0Kn=1.2TPM-vy/v0Kn=10
FIGURE 5. Resultsfor flow pasta flat platefor theTPM model.Theflow is argonwith aninlet velocity of � 40m= sec 0 0� andKn > 10 0. Figurea) is thenormalizeddensity. Figureb) is thenormalizedx velocity andfigurec) is thenormalizedy velocity.
this point if this is a resolutioneffect;doubling theangular resolution hadlittle effectontheresults.Table2 shows thedragcoefficients calculatedfor variousKn on severaldifferentmeshes.Theuniform grids were
thesameto makecomparisonbetweenTPM andIP easy. Thedesignation S, in thetable,specifiesanupstreamlengthof 11
2 plates,adownstream region of 2 12 andasimulationheightof 2 platelengths.ThedesignationS2 is thesameasS
but with double theresolutionon themesh.ThedesignationL specifiesanupstream lengthof 5 plates,a downstreamregion of 7 anda simulationheight of 4 platelengths.The tablealsoincludesthe dragcoefficient for non-uniformgrids.Thefreemolecularflow dragcoefficient for argon under theseflow condition is Cd � 4 � 88.Thedragcoefficientdeterminedby theIPandDSMCsimulationsfor auniformmeshisanoverestimatefor 0 � 8and1 � 2.Thismaybearesultof theunphysicalboundaryconditionswhichcouldcausesomeregionsof thedomainto havea largermomentumthanthey shouldin order to balance themomentumlossto theplate,which would resultin theparticleshitting theplatehaving a larger momentum thanexpected.Comparing theTPM resultsto thenon-uniform IP andDSMC resultsweseethat theTPM agreeswith theIP andDSMC for a Kn � 0 � 2 andpredictsa smallerdragcoefficient for higherKn.
admin
774

TABLE 2. Dragcoefficient for flow pasta flat platefor theDSMC,IP, andTPM models.Kn grid-(uniform) TPM IP DSMC grid-(non-uniform) IP DSMC
0.05 S 2.30 1.89 1.84 S 1.62 1.640.05 S2 1.65 —- —- L 1.45 1.520.2 L 3.08 3.22 2.99 L 3.00 3.040.8 L 3.56 5.05 4.55 L 4.62 4.251.2 L 3.90 5.42 5.05 L 4.81 4.7610.0 L 4.39 —- —- —- —- —–
This maybedueto meshsizeeffects.It is alsoworth notingthat theTPM predicts aCd lessthanthefreemolecularflow valuefor Kn � 10,whichis probablybecausef � a � (equation 7) gives thecorrect drift velocitybut underestimatesthetransversemomentum-fluxto thesurface.
CONCLUDING REMARKS
Theproblemof accurately simulatinglow Machnumberhigh Knudsennumber flows is aninterestingchallenge.Wehave given an overview of the approachwe aredeveloping (the TPM) for this problemandhave presented resultsfor the TPM modelfor flow pasta micro-platefor variousKn. In addition, we have presented resultsfor two othermodels, the IP andNS models, for thesamerangeof Kn. The resultsfor all threemodelsexhibit similar trends, i.e.the normalizedminimum andmaximum densitiesincreaseasKn increasesandthe differencein the minimum andmaximum velocitiesdecreasesasKn increases.
Futurework will involve extending theTPM to diatomicgas,flow pastanobjectfor any angleof attack,exploringother collision models,and investigatinghow to implement irregular meshesin an efficient manner. In addition,comparisonsof all methodswill bemadewith new experimentaldatabeinggeneratedfor micro-scaleairfoils beingconductedin a micro-scalewind-tunnel[13].
ACKNOWLEDGMENTS
We would like to thankthe Air ForceOffice of ScientificResearchfor supporting the researchunder grantnumberF49620-98-1-0433.
REFERENCES
1. Christlieb,A., andHitchon,W., Conferencepaperpresentedat the23rd Symposiumon Rarefied GasDynamics(Whistler,BC, Canada,July 20-25,2002).
2. Sun,Q.,Boyd, I., andCandler, G.,Journal of ThermophysicsandHeatTransfer, 16(2), 171(2002).3. Boyd, I., andSun,Q.,39thAIAAAerospaceScienceMeeting, RenoNevada(January, 2001).4. Sun,Q.,andBoyd, I., Journal of Computational Physics, 179, 400(2002).5. Christlieb,A., andHitchon,W., PhysicalReview E, 65, Article 056708 (2002).6. Harvey, R.,Hitchon,W., andParker, G.,Journal of AppliedPhysics, 75, 1940(1994).7. Parker, G.,Hitchon,W., andKeiter, E.,PhysicalReview E, 54, 938(1996).8. Fan,J.,andShen,C.,167, 393(2001).9. Askew, J.,Journal of British NuclearEnergy Society, 5, 564(1966).10. Vujic, J.,Proceedingsof theInternational ConferenceonMathematical MethodsandSupercomputingin NuclearApplications,
Karlsruhe. (1993).11. Cale,T., Raupp,G.,andGandy, T., Journal of AppliedPhysics, 68, 3645(1990).12. MacCormack, R.,andCandler, G.,17(1), 135(1989).13. Martin, M., Boyd, I., andBernal,L., Proceedingsof 2002ASMEFluids EngineeringDivision SummerMeeting(New York,
NY. July 2002).
admin
775
Related Documents