This article appeared in a journal published by Elsevier. The attached copy is furnished to the author for internal non-commercial research and education use, including for instruction at the authors institution and sharing with colleagues. Other uses, including reproduction and distribution, or selling or licensing copies, or posting to personal, institutional or third party websites are prohibited. In most cases authors are permitted to post their version of the article (e.g. in Word or Tex form) to their personal website or institutional repository. Authors requiring further information regarding Elsevier’s archiving and manuscript policies are encouraged to visit: http://www.elsevier.com/authorsrights

Welcome message from author
This document is posted to help you gain knowledge. Please leave a comment to let me know what you think about it! Share it to your friends and learn new things together.
Transcript

This article appeared in a journal published by Elsevier. The attachedcopy is furnished to the author for internal non-commercial researchand education use, including for instruction at the authors institution
and sharing with colleagues.
Other uses, including reproduction and distribution, or selling orlicensing copies, or posting to personal, institutional or third party
websites are prohibited.
In most cases authors are permitted to post their version of thearticle (e.g. in Word or Tex form) to their personal website orinstitutional repository. Authors requiring further information
regarding Elsevier’s archiving and manuscript policies areencouraged to visit:
http://www.elsevier.com/authorsrights
Author's personal copy
Application of the Sustainable Neighborhoods for Happiness Index(SNHI) to coastal cities in the United States
Scott A. Cloutier a,*, Jenna R. Jambeck a, Norman R. Scott baCollege of Engineering, University of Georgia, Athens, GA 30606, USAbDepartment of Biological and Environmental Engineering, Cornell University, Ithaca, NY, USA
a r t i c l e i n f o
Article history:Available online 21 March 2014
a b s t r a c t
The Sustainable Neighborhoods for Happiness Index (SNHI) is a tool to assess and compare how wellindividual cities, towns, neighborhoods and communities embrace sustainable practices and how thesepractices translate to opportunities for residents to pursue happiness. Recent studies have shown thatthe majority of humanity is concentrated in coastal cities. Thus, it is crucial to consider how to develop/retrofit these areas in the coming years, as these populations continue to grow, sea levels rise and naturalresources become more stressed. We applied the SNHI to nineteen coastal cities, all members of the fiftymost populous cities in the United States, to assess the current state of sustainability and potentialopportunities for residential happiness. SNHI scores were then plotted on The Sustainable Neighbor-hoods for Happiness Distribution (SNHD) for comparison and assessment. Finally, we perform sensitivityanalysis by adjusting subjective measures, simulating reviewer bias, and comparatively rank all cities.Our results show that San Francisco has the greatest SNHI (82.73) while Detroit has the lowest (35.28)and that city rankings remain relatively stable when accounting for bias.
! 2014 Elsevier Ltd. All rights reserved.
1. Introduction
Cities are a potential solution to many of our current environ-mental, economic and social issues. In fact, if properly designed, acity can offer a number of services and a wholesome lifestyle for itsresidents. However, if designed poorly, cities can present them-selves as unsafe places to live, energy gluttons and centers ofpollution. The challenge is to develop strategies and policies thatallow for sustainable growth and the retrofit of our cities in amodern age of climate change, pollution, limited natural resourcesand an expanding human population. The majority of the humanpopulation lives in large coastal cities, many of which will beaffected by all of the aforementioned issues (Hinrichsen, 1999).Studies have also found that living near coastal areas is associatedwith improved wellbeing (White et al., 2013; Wheeler et al., 2012).Thus, it is imperative that these coastal cities seriously considertheir path of development for the future and the potential associ-ations with human welfare. The Sustainable Neighborhoods forHappiness Index (SNHI) offers a method for such development,
setting both sustainability and happy residents as the top priority(Cloutier et al., 2014). Further, the SNHI allows communities (e.g.managers) to apply the index to understand their current sustain-ability profile and potential opportunities for happiness. Once theprofile is understood, this information can be utilized to informpolicy-makers on potential reform for improvement.
The SNHI was created in response to calls for an index thatconsiders happiness (Brooks, 2008; Duncan, 2010; Schimmel, 2009;Ura, 2013) and to encourage developers, engineers, architects,planners and community stakeholders to reconsider sustainabledevelopment goals and outcomes. The SNHI accounts for ninesubsystems (see Table 3 in supplemental material) of the commu-nity development system including urban design, water manage-ment, waste management, transportation, food management,buildings & infrastructure, energy management, business & eco-nomic development and community governance. The relationshipsbetween happiness and the nine subsystems of community devel-opment are assumed to be linear, leading to the development of theSNHI (Fig. 1 and Equation (1)). The SNHI includes both performancescores (PMi) and weighted impacts ðWHi
Þ of these performancescores on happiness, as well as a baseline sustainable neighbor-hoods score (b0) indicating a city has some baseline level of sus-tainability (a non-zero score). Researchers and communities shoulduse the SNHI to assess their current community development
* Corresponding author.E-mail addresses: [email protected] (S.A. Cloutier), [email protected] (J.
R. Jambeck), [email protected] (N.R. Scott).
Contents lists available at ScienceDirect
Ocean & Coastal Management
journal homepage: www.elsevier .com/locate/ocecoaman
http://dx.doi.org/10.1016/j.ocecoaman.2014.02.0170964-5691/! 2014 Elsevier Ltd. All rights reserved.
Ocean & Coastal Management 96 (2014) 203e209

Author's personal copy
system (including the built and natural environment, strategies andpolicy) and the potential opportunities offered for happiness.
2. Materials and methods
2.1. Selection of US coastal cities
The selection of coastal cities, within the United States, wasachieved by obtaining a list of the fifty largest cities within the US,according to the US Census (2010). Cities were then deemed ascoastal given their proximity to large bodies of water, includingoceans and the Great Lakes. A coastal city is defined as any city closeto a large body of water (Great Lakes, Atlantic Ocean, Pacific Ocean,Gulf of Mexico). Coastal cities were selected from a list of the fiftymost populous cities within the United States for our study. In total,nineteen US cities were selected, including Baltimore, Boston,Chicago, Cleveland, Detroit, Jacksonville, Houston, Long Beach, LosAngeles, Miami, Milwaukee, New York City, Oakland, Portland, SanDiego, San Francisco, Seattle, Virginia Beach and Washington DC.
2.2. The Sustainable Neighborhoods for Happiness Index (SNHI)generation
An SNHI score was generated for each of nineteen coastal citiesutilizing the methods from Cloutier et al. (2014), including the datacollection methods and the SNHI formula for each city (Equation
(1)). Briefly, subsystems and their respective objective or subjectivemeasures were assessed and scores were derived for each city.Objective scores were determined by grouping all cities by popu-lation size and comparing them [500 000 people (low population),500,000 to 2.25 million people (medium population), greater than2.25 million people (high population)]. A ranked score of 10 wasgiven to the city with the best objective subsystem, while a 0 rep-resents theworst and a 5 represents the mean. All other ranked cityscores were determined using a linear regression plot and corre-sponding formula as in Cloutier et al. (2014).
Subjective subsystem scores were generated as 1e3 scoresranging from below expectations to exceeding expectations(Supplemental materials, Table 1). Next, scaling factors (Supplemental materials, Table 2) were utilized to sum all measures foreach subsystem, resulting in a 0e10 score for the overall subsystem,and summed to obtain a total score for city. As an example, theenergy management subsystem consists of two objective measures(0e10 scale) and one subjective measure (1e3 scale). In total, therewere three measures for the energy management subsystem, thesum of which should be on a 0 to 10 scale (with a 10 representing aperfect score for a subsystem). Thus, the scaling factor for theobjective measures (0e10 scale) is 0.33, while the scaling factor ofthe subjective measure (1e3 scale) is 1.11. Multiplying the rankedcity scores by these scaling factors allow the subsystemmeasures tobe summed, resulting in an overall 0e10 score for the energymanagement subsystem. This method was utilized for each sub-system, resulting in 9 subsystem scores on a 0e10 scale. Thesescores were then used to create an overall SNHI score for each citywith Equation (1).
2.3. The Sustainable Neighborhoods for Happiness DistributionComparison
The Sustainable Neighborhoods for Happiness Distribution(SNHD), as created in Cloutier et al. (2014), represents an approx-imate SNHI distribution for the United States. For this paper, weplotted the nineteen coastal city SNHI scores on the SNHD forcomparison and discussion.
2.4. SNHI sensitivity analysis
The influence of subjective measures on the SNHI is not trivial,as 13 (39.39%) of the 33 measures are subjective and are givenscores ranging from 1 to 3. Therefore, sensitivity analysis wasperformed to determine the effects of changes in subjective mea-sure scores on the overall SNHI. Specifically, all cities were rescoredin three ways:
1. Adding one point to each subjective measure score (henceforththe plus one method) unless they received a maximum score ofthree in the original SNHI scoring.
2. Subtracting one point from each subjective measure score(henceforth the minus one method) unless they received aminimum SNHI score of one.
3. Removal of the subjectivemeasures from the SNHImethodology(henceforth the removal method).
The plus one method accounts for a bias that is conservativewith points, while the minus one method accounts for a bias that istoo generous with points. The removal method eliminates bias, asall subsystem scores are then based on objective data. The scoresfor all three scenarios were then plotted on the SNHD for com-parison and assessment. A table was also generated to show therespective influence of the bias adjustment scenarios on the SNHIscore city rankings.
Fig. 1. The Sustainable Neighborhoods for Happiness Index. SNHI ¼ SustainableNeighborhoods for Happiness Index; b0 ¼ Baseline Sustainability Neighborhood Score;H20mH ¼ Water Management Weighted Impact on Happiness; EmH ¼ Energy Man-agement Weighted Impact on Happiness; UdH ¼ Urban Design Weighted Impact onHappiness; FpH ¼ Food Production Weighted Impact on Happiness; BedH ¼ Businessand Economic Development Weighted Impact on Happiness; WmH ¼ Waste Man-agement Weighted Impact on Happiness; TsH ¼ Transportation Systems WeightedImpact on Happiness; BgH ¼ Buildings and Infrastructure Weighted Impact onHappiness; CgH ¼ Community Governance Weighted Impact on Happiness;H20m ¼ Performance score for Water Management; Em ¼ Performance score forEnergy Management; Ud ¼ Performance score for Urban Design; Fp ¼ Performancescore for Food Production; Bed ¼ Performance score for Business and EconomicDevelopment; Wm ¼ Performance score for Waste Management; Ts ¼ Performancescore for Transportation; Bg ¼ Performance score for Buildings and Infrastructure;Cg ¼ Performance score for Community Governance.
S.A. Cloutier et al. / Ocean & Coastal Management 96 (2014) 203e209204
Author's personal copy
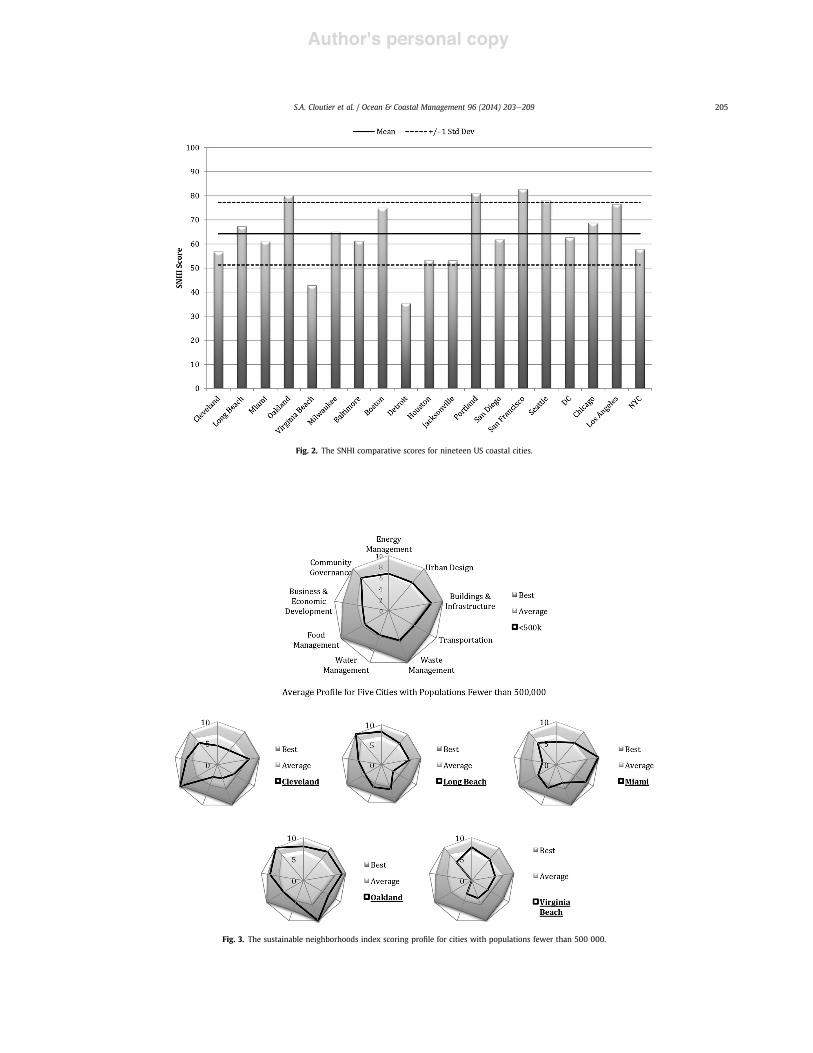
Fig. 2. The SNHI comparative scores for nineteen US coastal cities.
Fig. 3. The sustainable neighborhoods index scoring profile for cities with populations fewer than 500 000.
S.A. Cloutier et al. / Ocean & Coastal Management 96 (2014) 203e209 205
Author's personal copy
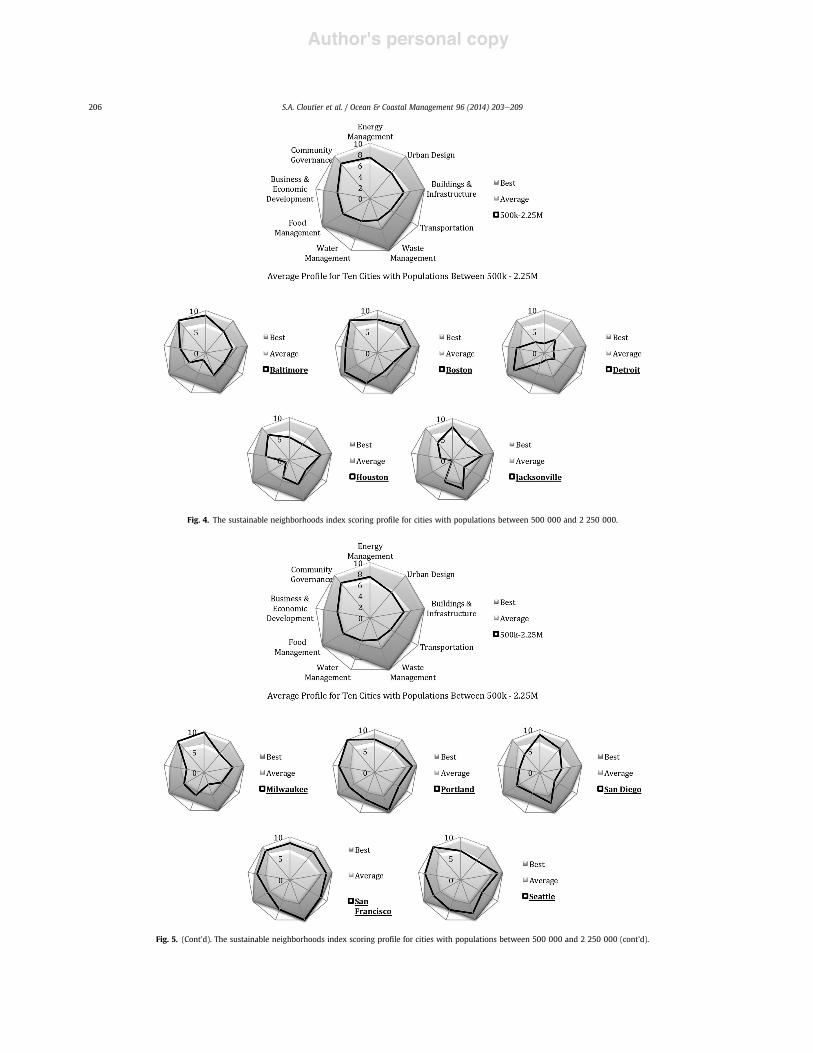
Fig. 4. The sustainable neighborhoods index scoring profile for cities with populations between 500 000 and 2 250 000.
Fig. 5. (Cont’d). The sustainable neighborhoods index scoring profile for cities with populations between 500 000 and 2 250 000 (cont’d).
S.A. Cloutier et al. / Ocean & Coastal Management 96 (2014) 203e209206
Author's personal copy
3. Results & discussion
The SNHI is proposed to serve as a means of assessing andcomparing how well individual cities, towns, neighborhoods andcommunities address sustainability issues through communitydesign and development, which is potentially associated withresidential happiness. In total, nineteen coastal cities were selectedand scored, utilizing the SNHI methodology, as indicated in Fig. 2ðx ¼ 64:24; s ¼ 12:98Þ. Many cities score highly, including Oak-land, Portland, San Francisco and Seattle, while cities like Houston,Jacksonville, Virginia Beach and Detroit score poorly. Further, someof these cities rest greater than one standard deviation above andbelow the mean, indicating they excel or underachieve whencompared to their peers.
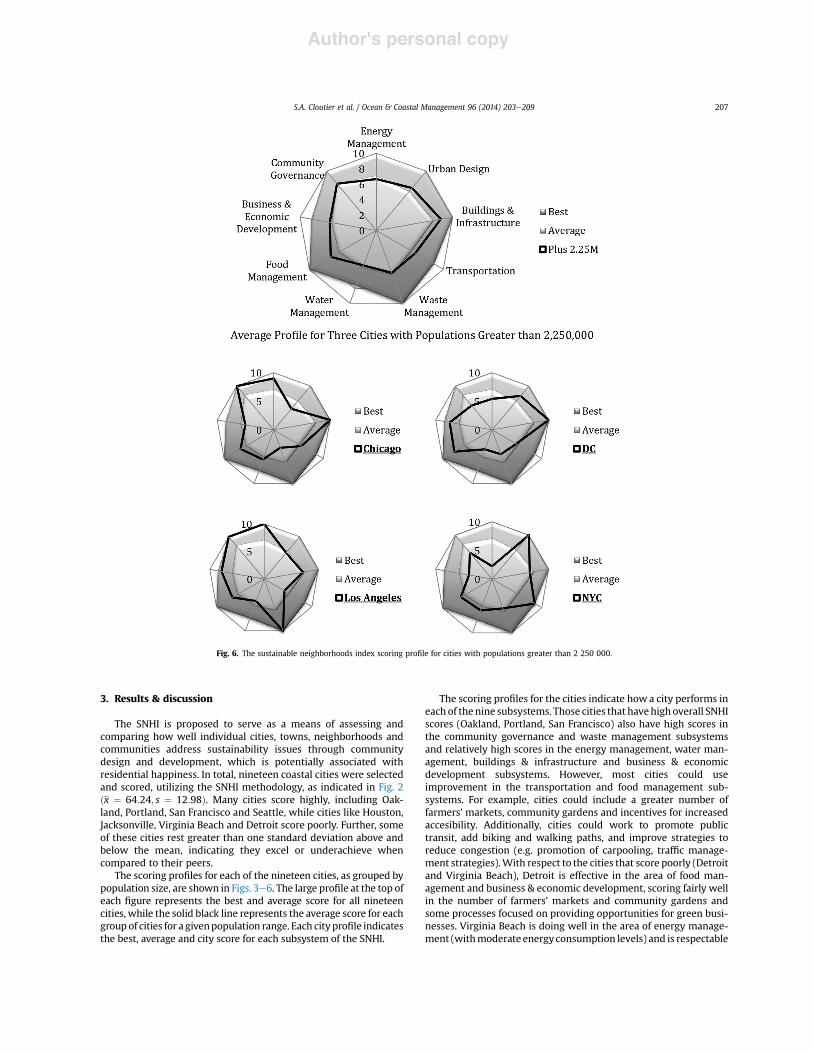
The scoring profiles for each of the nineteen cities, as grouped bypopulation size, are shown in Figs. 3e6. The large profile at the top ofeach figure represents the best and average score for all nineteencities, while the solid black line represents the average score for eachgroup of cities for a givenpopulation range. Each city profile indicatesthe best, average and city score for each subsystem of the SNHI.
The scoring profiles for the cities indicate how a city performs ineach of thenine subsystems. Those cities that havehigh overall SNHIscores (Oakland, Portland, San Francisco) also have high scores inthe community governance and waste management subsystemsand relatively high scores in the energy management, water man-agement, buildings & infrastructure and business & economicdevelopment subsystems. However, most cities could useimprovement in the transportation and food management sub-systems. For example, cities could include a greater number offarmers’ markets, community gardens and incentives for increasedaccesibility. Additionally, cities could work to promote publictransit, add biking and walking paths, and improve strategies toreduce congestion (e.g. promotion of carpooling, traffic manage-ment strategies).With respect to the cities that score poorly (Detroitand Virginia Beach), Detroit is effective in the area of food man-agement and business & economic development, scoring fairly wellin the number of farmers’ markets and community gardens andsome processes focused on providing opportunities for green busi-nesses. Virginia Beach is doing well in the area of energy manage-ment (withmoderate energy consumption levels) and is respectable
Fig. 6. The sustainable neighborhoods index scoring profile for cities with populations greater than 2 250 000.
S.A. Cloutier et al. / Ocean & Coastal Management 96 (2014) 203e209 207

Author's personal copy
in the areas of urban design (with a moderate percentage of greenspace) and community governance (with moderate environmentalmanagement programs). However, both cities struggle in all othersubsystems should focus on themeasures used in each subsystemofthe SNHI to develop strategies and policies for improvement. Forinstance, those cities struggling in the area of waste managementcould develop strategies and policies to improve their percentagesof recycled municipal waste. Examples include policies mandatingrecycling, educational programs to promote residential recyclingand distribution of recycling bins to residents.
All nineteen coastal city SNHI scores were plotted on the SNHD(Fig. 7). Oakland, Portland, San Francisco, Seattle and score verywell (>1s) on the SNHD, while Cleveland, Detroit, Houston, Jack-sonville and Virginia Beach score poorly (<1s). The SNHD is a usefulvisual tool, as cities can view themselves on an SNHI distribution,potentially providing an incentive to improve their SNHI scores.
Furthermore, those cities that score lower than their peers canconsider sustainability efforts other cities are making. The outcomecould be collaboration between cities to simultaneously improvesustainability and opportunities for happiness.
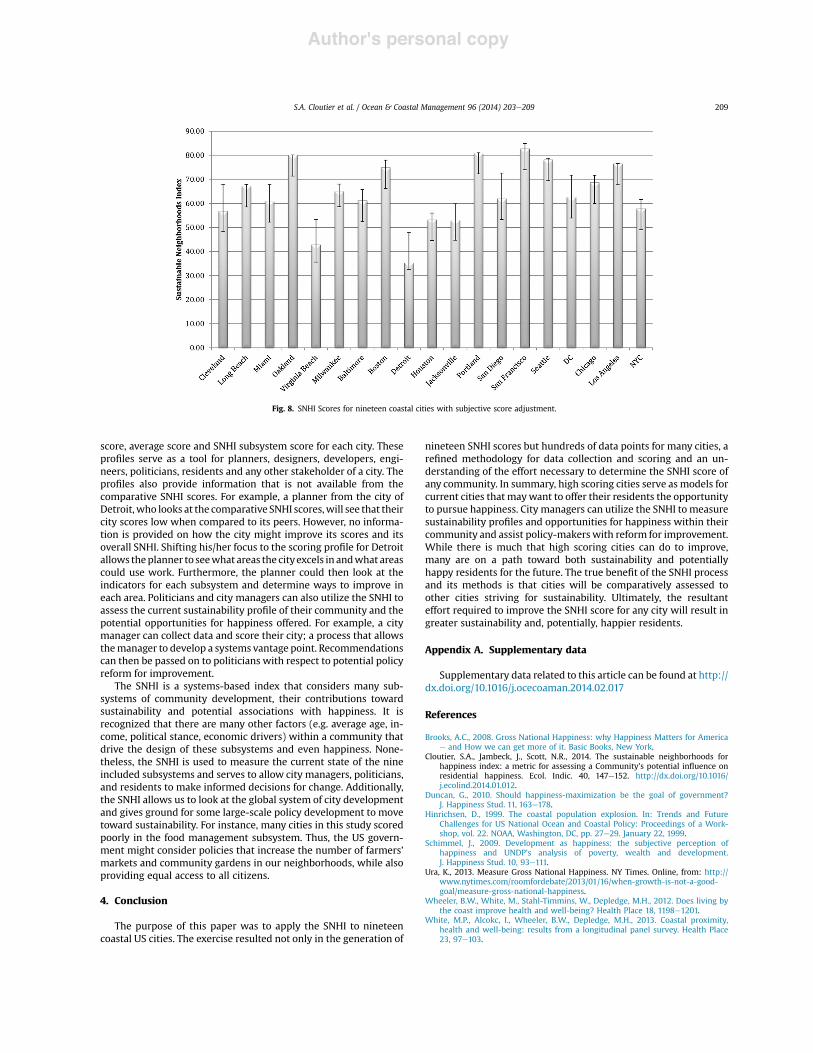
The SNHI is composed of both objective measures and subjec-tive measures and, of the 33 total measures, 13 are subjective(39.39%). Thus, the influence of the subjective indicators on theoverall SNHI scores is not trivial. In fact, if a city received a 1 in allsubjective measures and should have received a 3 in each (due to anegative bias with the assessor), it could have been shorted a totalof approximately 29 points toward the SNHI score. Table 1 sum-marizes the rankings for all nineteen coastal cities for each of thesubjective indicator adjustment scenarios. Those cities that areitalicized and bolded remained the same in ranking from theoriginal SNHI calculation. Fig. 8 shows the original SNHI scores witherror bars indicating both the plus and minus one method.
The results indicate that some cities shifted in SNHI rankingwhen adjusting for bias. Some cities experience large shifts inscores (NYC, San Diego, DC, Chicago), while other cities experiencesmall shifts (Cleveland, Virginia Beach, Detroit, Houston, Jackson-ville and San Diego) and many cities remained fairly constant (SanFrancisco, Virginia Beach, Seattle, Los Angeles, Detroit, Houston,Jacksonville). However, when looking at the position of most citiesin the original scoring method it is clear that only a few of themshift more than two or three positions. Still, these results indicatethat bias can certainly affect theway these cities are distributed andthis must be remembered when scoring cities in the future. Doc-umenting the rationale for assigning certain scores during the datacollection process can control for bias. Many cities have extensivesustainability strategies and plans for the future that address anumber of the indicators in detail. Looking for information like thismakes scoring the subjective indicators much easier. Additionally, acommittee of several people could derive subjective measurescores and they could be averaged.
Twopowerful visual tools emerged from this study, including thecomparative SNHI score chart and the scoring profile for the cities ofinterest. The comparative score chart allows cities to see how theycompare to their peers, while the scoring profiles show the best
Fig. 7. SNHD with study cities plotted.
Table 1SNHI rankings for all subjective indicator scenarios.
Rank Original Plus one Minus one Removal
1 San Francisco San Francisco San Francisco San Francisco2 Portland Portland Portland Oakland3 Oakland Oakland Oakland Portland4 Seattle Seattle Seattle Seattle5 Los Angeles Boston Los Angeles San Diego6 Boston Los Angeles Boston Boston7 Chicago San Diego Chicago DC8 Long Beach DC Milwaukee Los Angeles9 Milwaukee Chicago Long Beach Chicago10 DC Milwaukee DC Miami11 San Diego Cleveland San Diego NYC12 Baltimore Long Beach Baltimore Milwaukee13 Miami Miami Miami Cleveland14 NYC Baltimore NYC Long Beach15 Cleveland NYC Cleveland Baltimore16 Houston Jacksonville Jacksonville Jacksonville17 Jacksonville Houston Houston Houston18 Virginia Beach Virginia Beach Virginia Beach Virginia Beach19 Detroit Detroit Detroit Detroit
Note: cities that did not change position shown in bold/italics.
S.A. Cloutier et al. / Ocean & Coastal Management 96 (2014) 203e209208
Author's personal copy
score, average score and SNHI subsystem score for each city. Theseprofiles serve as a tool for planners, designers, developers, engi-neers, politicians, residents and any other stakeholder of a city. Theprofiles also provide information that is not available from thecomparative SNHI scores. For example, a planner from the city ofDetroit,who looks at the comparative SNHI scores,will see that theircity scores low when compared to its peers. However, no informa-tion is provided on how the city might improve its scores and itsoverall SNHI. Shifting his/her focus to the scoring profile for Detroitallows theplanner to seewhat areas the cityexcels in andwhat areascould use work. Furthermore, the planner could then look at theindicators for each subsystem and determine ways to improve ineach area. Politicians and city managers can also utilize the SNHI toassess the current sustainability profile of their community and thepotential opportunities for happiness offered. For example, a citymanager can collect data and score their city; a process that allowsthemanager to develop a systems vantage point. Recommendationscan then be passed on to politicians with respect to potential policyreform for improvement.
The SNHI is a systems-based index that considers many sub-systems of community development, their contributions towardsustainability and potential associations with happiness. It isrecognized that there are many other factors (e.g. average age, in-come, political stance, economic drivers) within a community thatdrive the design of these subsystems and even happiness. None-theless, the SNHI is used to measure the current state of the nineincluded subsystems and serves to allow city managers, politicians,and residents to make informed decisions for change. Additionally,the SNHI allows us to look at the global system of city developmentand gives ground for some large-scale policy development to movetoward sustainability. For instance, many cities in this study scoredpoorly in the food management subsystem. Thus, the US govern-ment might consider policies that increase the number of farmers’markets and community gardens in our neighborhoods, while alsoproviding equal access to all citizens.
4. Conclusion
The purpose of this paper was to apply the SNHI to nineteencoastal US cities. The exercise resulted not only in the generation of
nineteen SNHI scores but hundreds of data points for many cities, arefined methodology for data collection and scoring and an un-derstanding of the effort necessary to determine the SNHI score ofany community. In summary, high scoring cities serve as models forcurrent cities that maywant to offer their residents the opportunityto pursue happiness. City managers can utilize the SNHI tomeasuresustainability profiles and opportunities for happiness within theircommunity and assist policy-makers with reform for improvement.While there is much that high scoring cities can do to improve,many are on a path toward both sustainability and potentiallyhappy residents for the future. The true benefit of the SNHI processand its methods is that cities will be comparatively assessed toother cities striving for sustainability. Ultimately, the resultanteffort required to improve the SNHI score for any city will result ingreater sustainability and, potentially, happier residents.
Appendix A. Supplementary data
Supplementary data related to this article can be found at http://dx.doi.org/10.1016/j.ocecoaman.2014.02.017
References
Brooks, A.C., 2008. Gross National Happiness: why Happiness Matters for Americae and How we can get more of it. Basic Books, New York.
Cloutier, S.A., Jambeck, J., Scott, N.R., 2014. The sustainable neighborhoods forhappiness index: a metric for assessing a Community’s potential influence onresidential happiness. Ecol. Indic. 40, 147e152. http://dx.doi.org/10.1016/j.ecolind.2014.01.012.
Duncan, G., 2010. Should happiness-maximization be the goal of government?J. Happiness Stud. 11, 163e178.
Hinrichsen, D., 1999. The coastal population explosion. In: Trends and FutureChallenges for US National Ocean and Coastal Policy: Proceedings of a Work-shop, vol. 22. NOAA, Washington, DC, pp. 27e29. January 22, 1999.
Schimmel, J., 2009. Development as happiness: the subjective perception ofhappiness and UNDP’s analysis of poverty, wealth and development.J. Happiness Stud. 10, 93e111.
Ura, K., 2013. Measure Gross National Happiness. NY Times. Online, from: http://www.nytimes.com/roomfordebate/2013/01/16/when-growth-is-not-a-good-goal/measure-gross-national-happiness.
Wheeler, B.W., White, M., Stahl-Timmins, W., Depledge, M.H., 2012. Does living bythe coast improve health and well-being? Health Place 18, 1198e1201.
White, M.P., Alcokc, I., Wheeler, B.W., Depledge, M.H., 2013. Coastal proximity,health and well-being: results from a longitudinal panel survey. Health Place23, 97e103.
Fig. 8. SNHI Scores for nineteen coastal cities with subjective score adjustment.
S.A. Cloutier et al. / Ocean & Coastal Management 96 (2014) 203e209 209
Related Documents