Application of the Lake Okeechobee Regulation Schedule (LORS2008) on 5/1/2017 (ENSO Neutral Condition) Lake Okeechobee Net Inflow Outlook: The Lake Okeechobee Net Inflow Outlook has been computed using 4 methods: Croley's method 1 , the SFWMD empirical method 2 , a sub-sampling of Neutral years 3 and a sub- sampling of warm years of the Atlantic Multi-decadal Oscillation (AMO) in combination with Neutral ENSO years 4 . The results for Croley's method and the SFWMD empirical method are based on the CPC Outlook. Table of the Lake Okeechobee Net Inflow Outlooks in feet of equivalent depth. All methods are updated on a weekly basis with observed net inflow for the current month. Season Croley's Method 1* SFWMD Empirical Method 2 Sub-sampling of Neutral ENSO Years 3 Sub-sampling of AMO Warm + Neutral ENSO Years 4 Value (ft) Condition Value (ft) Condition Value (ft) Condition Value (ft) Condition Current (May- Oct) N/A N/A 2.30 Very Wet 2.63 Very Wet 3.48 Very Wet Multi Seasonal (May- Apr) N/A N/A 2.76 Wet 3.73 Wet 4.12 Wet *Croley’s Method Not Produced For This Report See Seasonal and Multi-Seasonal tables for the classification of Lake Okeechobee Outlooks. The recommended methods and values for estimating the Lake Okeechobee Net Inflow Outlook are shaded and should be used in the LORS2008 Release Guidance Flow Charts.

Welcome message from author
This document is posted to help you gain knowledge. Please leave a comment to let me know what you think about it! Share it to your friends and learn new things together.
Transcript
Application of the Lake Okeechobee Regulation Schedule (LORS2008) on 5/1/2017 (ENSO Neutral Condition)
Lake Okeechobee Net Inflow Outlook:
The Lake Okeechobee Net Inflow Outlook has been computed using 4 methods: Croley's method1, the SFWMD empirical method2, a sub-sampling of Neutral years3 and a sub-sampling of warm years of the Atlantic Multi-decadal Oscillation (AMO) in combination with Neutral ENSO years4. The results for Croley's method and the SFWMD empirical method are based on the CPC Outlook.
Table of the Lake Okeechobee Net Inflow Outlooks in feet of equivalent depth. All methods are updated on a weekly basis with observed net inflow for the current month.
Season
Croley's
Method1*
SFWMD
Empirical
Method2
Sub-sampling of
Neutral ENSO
Years3
Sub-sampling of
AMO Warm +
Neutral ENSO
Years4
Value
(ft)Condition
Value
(ft)Condition
Value
(ft)Condition
Value
(ft)Condition
Current
(May-
Oct)
N/A N/A 2.30 Very Wet 2.63 Very Wet 3.48 Very Wet
Multi
Seasonal
(May-
Apr)
N/A N/A 2.76 Wet 3.73 Wet 4.12 Wet
*Croley’s Method Not Produced For This Report
See Seasonal and Multi-Seasonal tables for the classification of Lake Okeechobee Outlooks.
The recommended methods and values for estimating the Lake Okeechobee Net Inflow Outlook are shaded and should be used in the LORS2008 Release Guidance Flow Charts.

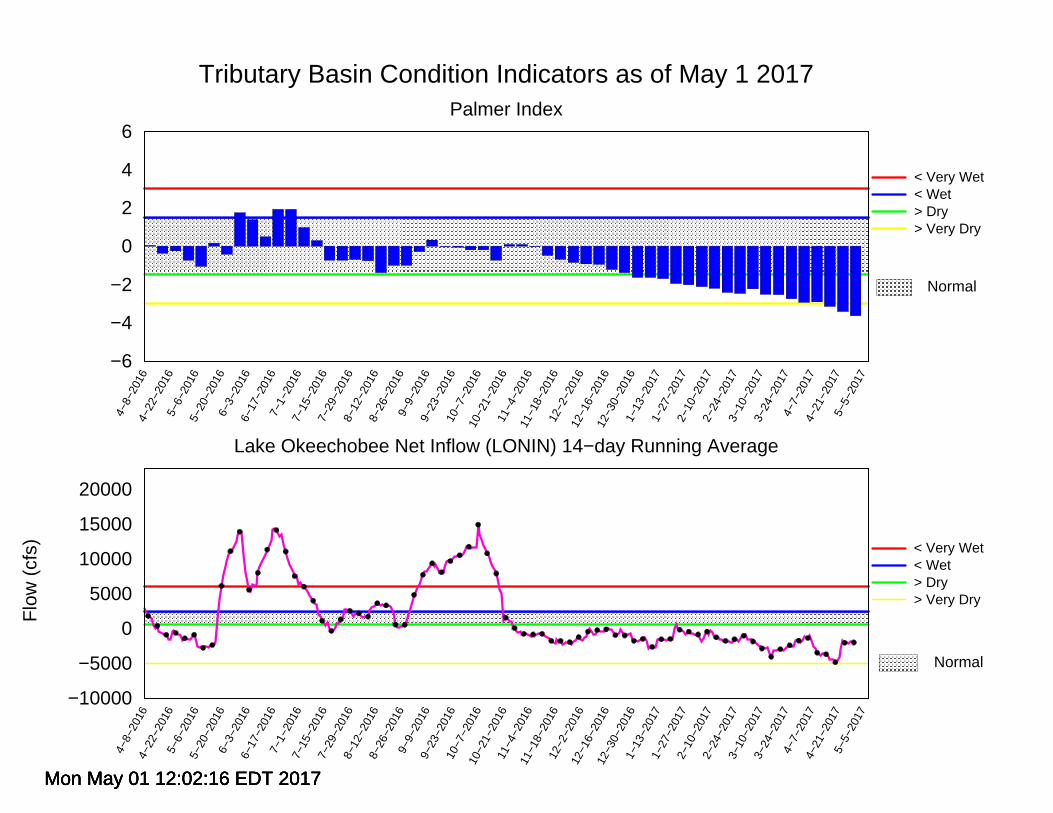
Tributary Hydrologic Conditions Graph:
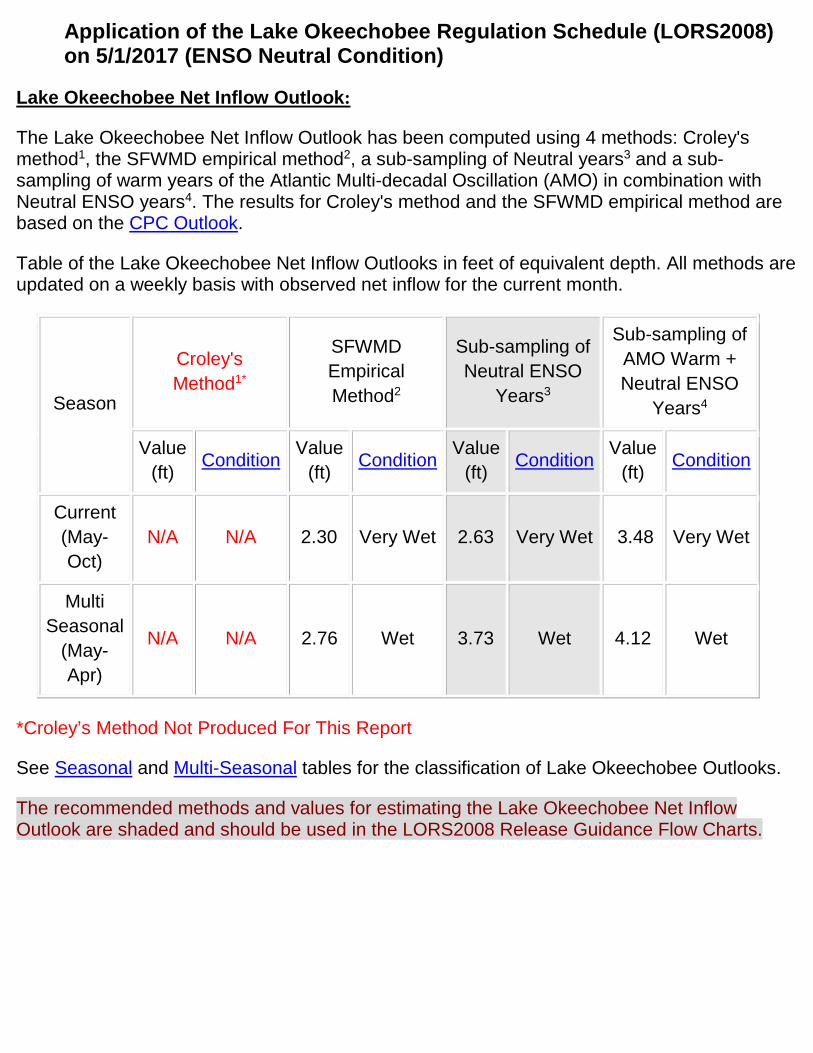
-2006 cfs 14-day running average for Lake Okeechobee Net Inflow through 5/1/2017. According to the classification in Tributary Hydrologic Conditions table, this condition is Dry.
-3.63 for Palmer Index on 4/30/2017.According to the classification in Tributary Hydrologic Conditions table, this condition is Very Dry.
The wetter of the two conditions above is Dry.
LORS2008 Classification Tables:
Lake Okeechobee Stage on 5/1/2017
Lake Okeechobee Stage: 11.61 feet
USACE Report for Lake Okeechobee
Lake Okeechobee Stage Hydrograph
Lake Okeechobee Management
Zone/Band
Bottom Elevation
(feet, NGVD)
Current
Lake Stage
High Lake Management Band 16.64
Operational
Band
High sub-band 16.01
Intermediate
sub-band 15.25
Low sub-band 13.34
Base Flow sub-band 12.60
Beneficial Use sub-band 10.95 11.61
Water Shortage Management Band
Part C of LORS2008: Discharge to WCA's
Release Guidance Flow Chart Outcome: No releases to the WCAs.
Part D of LORS2008: Discharge to Tidewater
Release Guidance Flow Chart Outcome: No releases to the Estuaries.
Technical Input Summaries from:
• Lake Okeechobee Division• Coastal Ecosystems• Everglades Ecosystems Division• Water Supply Department• Water Resource Management Release Recommendation• Kissimmee Watershed Environmental Conditions• Operations Department
Back to Lake Okeechobee Operations Main Page
Back to U.S. Army Corps of Engineers LORSS Homepage
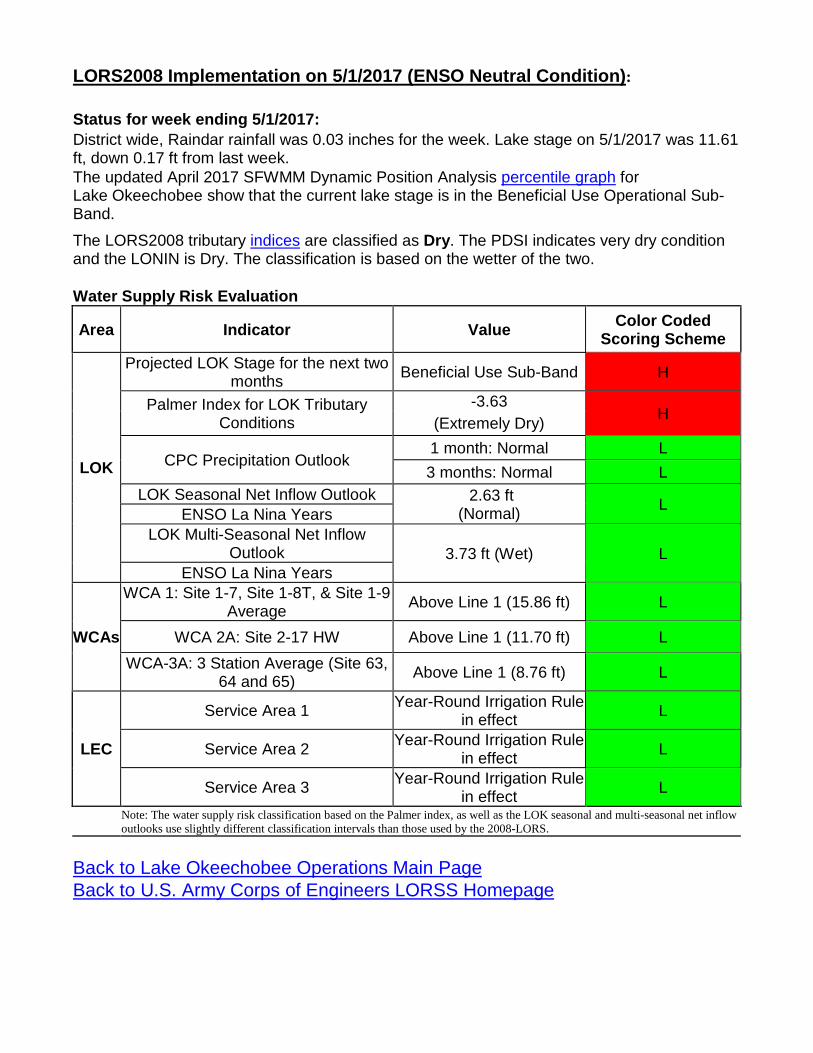
LORS2008 Implementation on 5/1/2017 (ENSO Neutral Condition):
Status for week ending 5/1/2017:
District wide, Raindar rainfall was 0.03 inches for the week. Lake stage on 5/1/2017 was 11.61ft, down 0.17 ft from last week. The updated April 2017 SFWMM Dynamic Position Analysis percentile graph for Lake Okeechobee show that the current lake stage is in the Beneficial Use Operational Sub-Band.
The LORS2008 tributary indices are classified as Dry. The PDSI indicates very dry condition and the LONIN is Dry. The classification is based on the wetter of the two.
Water Supply Risk Evaluation
Area Indicator Value Color Coded
Scoring Scheme
LOK
Projected LOK Stage for the next two months
Beneficial Use Sub-Band H
Palmer Index for LOK Tributary Conditions
-3.63 H
(Extremely Dry)
CPC Precipitation Outlook 1 month: Normal L
3 months: Normal L
LOK Seasonal Net Inflow Outlook 2.63 ft (Normal)
L ENSO La Nina Years
LOK Multi-Seasonal Net Inflow Outlook 3.73 ft (Wet) L
ENSO La Nina Years
WCAs
WCA 1: Site 1-7, Site 1-8T, & Site 1-9 Average
Above Line 1 (15.86 ft) L
WCA 2A: Site 2-17 HW Above Line 1 (11.70 ft) L
WCA-3A: 3 Station Average (Site 63, 64 and 65)
Above Line 1 (8.76 ft) L
LEC
Service Area 1 Year-Round Irrigation Rule
in effect L
Service Area 2 Year-Round Irrigation Rule
in effect L
Service Area 3 Year-Round Irrigation Rule
in effect L
Note: The water supply risk classification based on the Palmer index, as well as the LOK seasonal and multi-seasonal net inflow outlooks use slightly different classification intervals than those used by the 2008-LORS.
Back to Lake Okeechobee Operations Main PageBack to U.S. Army Corps of Engineers LORSS Homepage

Mar Apr
9
10
11
12
13
14
Sta
ge (
feet
, NG
VD
)Lake Okeechobee SFWMM Apr 2017 Dynamic Position Analysis
Percentiles PA_DPA
Mon May 1 12:05:11 EDT 2017
Historical
9
10
11
12
13
14
Mon May 1 12:05:11 EDT 2017
MAXP95P90P75P50P25P10P5MIN
Water Shortage Management Band
HLM High Inter Low BasFlo BenUse
Low Sub−Band
(See assumptions on the Position Analysis Results website)
4−8−
2016
4−22
−201
65−
6−20
165−
20−2
016
6−3−
2016
6−17
−201
67−
1−20
167−
15−2
016
7−29
−201
68−
12−2
016
8−26
−201
69−
9−20
169−
23−2
016
10−7
−201
610
−21−
2016
11−4
−201
611
−18−
2016
12−2
−201
612
−16−
2016
12−3
0−20
161−
13−2
017
1−27
−201
72−
10−2
017
2−24
−201
73−
10−2
017
3−24
−201
74−
7−20
174−
21−2
017
5−5−
2017
−10000
−5000
0
5000
10000
15000
20000
Flo
w (
cfs)
Lake Okeechobee Net Inflow (LONIN) 14−day Running Average
Mon May 01 12:02:16 EDT 2017
< Very Wet< Wet> Dry> Very Dry
Mon May 01 12:02:16 EDT 2017
4−8−
2016
4−22
−201
65−
6−20
165−
20−2
016
6−3−
2016
6−17
−201
67−
1−20
167−
15−2
016
7−29
−201
68−
12−2
016
8−26
−201
69−
9−20
169−
23−2
016
10−7
−201
610
−21−
2016
11−4
−201
611
−18−
2016
12−2
−201
612
−16−
2016
12−3
0−20
161−
13−2
017
1−27
−201
72−
10−2
017
2−24
−201
73−
10−2
017
3−24
−201
74−
7−20
174−
21−2
017
5−5−
2017
−6
−4
−2
0
2
4
6
Tributary Basin Condition Indicators as of May 1 2017Palmer Index
Mon May 01 12:02:16 EDT 2017
< Very Wet< Wet> Dry> Very Dry
Mon May 01 12:02:16 EDT 2017
Normal
Normal

Flowchart to Guide Recommendations for Lake Okeechobee Releases to the Caloosahatchee Estuary
for 2008 LORS Baseflow & for Environmental Water Supply
1The 2008 LORS Release Guidance (Part D) can suggest baseflow releases in the Intermediate, Low, or Baseflow Subbands.2Estuary “needs” water when the 30-day moving average salinity at I-75 bridge is projected to exceed 5 practical salinity units (psu) within 2 weeks.3LOWSM = Lake Okeechobee Water Shortage Management.4Tributary Hydrologic Condition (THC) is based on classification of Lake Okeechobee Net Inflow and Palmer Index.5Can release less than the “up to” limit if lower release is sufficient to reach or sustain desired estuary salinity; cfs = cubic feet per second.6After reviewing conditions in Water Conservation Areas (WCAs), Stormwater Treatment Areas (STAs), ENP, St. Lucie Estuary and Lake Okeechobee.7Should this condition be reached, the Governing Board will be briefed at their next regularly scheduled meeting as part of the State of the Water Resources agenda item.
Estuary needs water 2
& forecast basin runoff is not
enough?
2008 LORS Release Guidance suggests baseflow
release 1
Lake stage above
BaseflowSubband ?
Lake stage above
LOWSM 3
Band?
S-79 up to 450 cfs 5
(or up to 650 cfs 5,6)S-77 baseflow release
to supplement as needed
No S-77 release to the Caloosahatchee Estuary 7
unless the Governing Board recommends
otherwise
THC 4
normal or above?
NN
N
YY Y
Y
Y
N N
Y
N
< 50% chance dry season
lake stage<11 feet?
S-79 up to 450 cfs 5
S-77 baseflow release to supplement
as needed
S-79 up to 300 cfs 5,6
S-77 environmentalwater supply release
to supplement as needed
2008 LORSdoes not suggest making a release
(stage in Beneficial Use Subband or LOWSM3 Band)
Estuary needs water 2
& forecast basin runoff is not
enough?
N
YY
N
Lake stage within the BaseflowSubband
< 50% chance dry season
lake stage<11 feet?
Flowchart to Guide Recommendations for Lake Okeechobee Releases to the Caloosahatchee Estuary
for 2008 LORS Baseflow & for Environmental Water Supply (revised 9-Aug-2012)
1The 2008 LORS Release Guidance (Part D) can suggest baseflow releases in the Intermediate, Low, or Baseflow Subbands.2Estuary “needs” water when the 30-day moving average salinity at I-75 bridge is projected to exceed 5 practical salinity units (psu) within 2 weeks.3LOWSM = Lake Okeechobee Water Shortage Management.4Tributary Hydrologic Condition (THC) is based on classification of Lake Okeechobee Net Inflow and Palmer Index.5Can release less than the “up to” limit if lower release is sufficient to reach or sustain desired estuary salinity; cfs = cubic feet per second.6After reviewing conditions in Water Conservation Areas (WCAs), Stormwater Treatment Areas (STAs), ENP, St. Lucie Estuary and Lake Okeechobee.7Should this condition be reached, the Governing Board will be briefed at their next regularly scheduled meeting as part of the State of the Water Resources agenda item.
Estuary needs water 2
& forecast basin runoff is not
enough?
2008 LORS Release Guidance suggests baseflow
release 1
Lake stage above
BaseflowSubband ?
Lake stage above
LOWSM 3
Band?
S-79 up to 450 cfs 5
(or up to 650 cfs 5,6)S-77 baseflow release
to supplement as needed
No S-77 release to the Caloosahatchee Estuary 7
unless the Governing Board recommends
otherwiseNN
N
YY Y
Y
Y
N N
Y
N
< 50% chance dry season
lake stage<11 feet?
S-79 up to 450 cfs 5
S-77 baseflow release to supplement
as needed
S-79 up to 300 cfs 5,6
S-77 environmentalwater supply release
to supplement as needed
2008 LORSdoes not suggest making a release
(stage in Beneficial Use Subband or LOWSM3 Band)
Estuary needs water 2
& forecast basin runoff is not
enough?
N
YY
N
Lake stage within the BaseflowSubband
< 50% chance dry season
lake stage<11 feet?
Apr-MayOR
THC 4 is normalor above

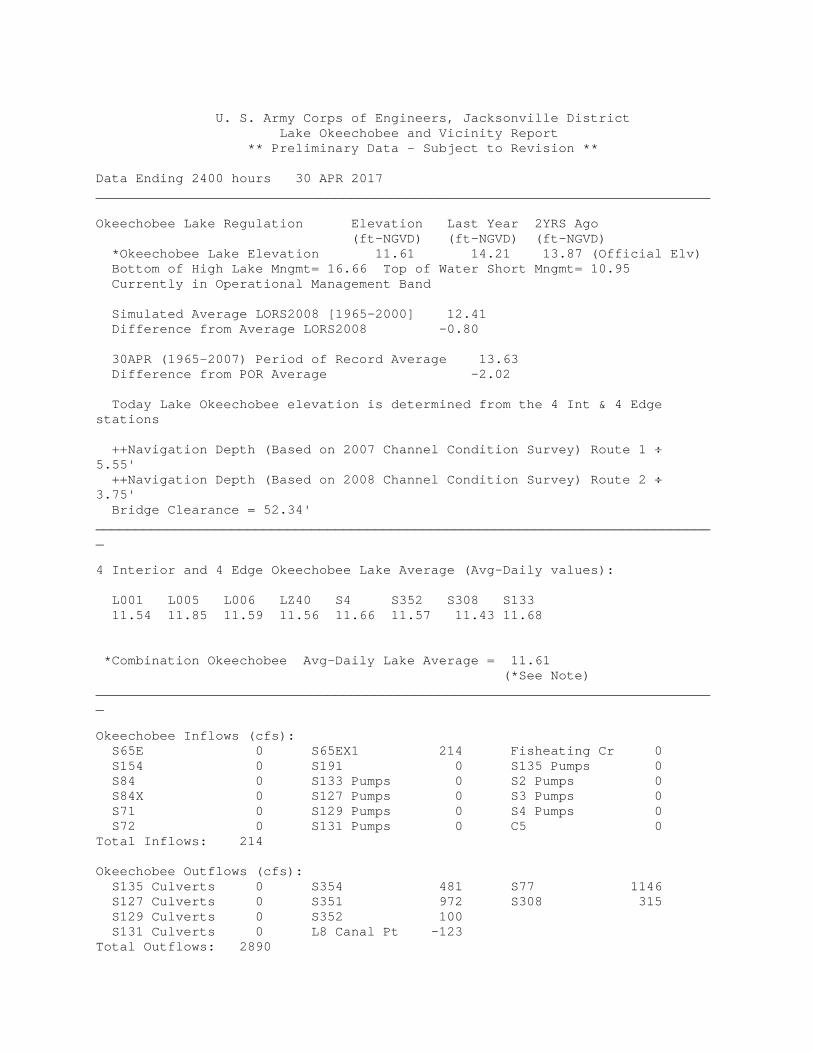
U. S. Army Corps of Engineers, Jacksonville District Lake Okeechobee and Vicinity Report ** Preliminary Data - Subject to Revision **
Data Ending 2400 hours 30 APR 2017 _____________________________________________________________________________
Okeechobee Lake Regulation Elevation Last Year 2YRS Ago (ft-NGVD) (ft-NGVD) (ft-NGVD) *Okeechobee Lake Elevation 11.61 14.21 13.87 (Official Elv) Bottom of High Lake Mngmt= 16.66 Top of Water Short Mngmt= 10.95 Currently in Operational Management Band
Simulated Average LORS2008 [1965-2000] 12.41 Difference from Average LORS2008 -0.80
30APR (1965-2007) Period of Record Average 13.63 Difference from POR Average -2.02
Today Lake Okeechobee elevation is determined from the 4 Int & 4 Edge stations
++Navigation Depth (Based on 2007 Channel Condition Survey) Route 1 ÷ 5.55' ++Navigation Depth (Based on 2008 Channel Condition Survey) Route 2 ÷ 3.75' Bridge Clearance = 52.34' ______________________________________________________________________________
4 Interior and 4 Edge Okeechobee Lake Average (Avg-Daily values):
L001 L005 L006 LZ40 S4 S352 S308 S133 11.54 11.85 11.59 11.56 11.66 11.57 11.43 11.68
*Combination Okeechobee Avg-Daily Lake Average = 11.61 (*See Note) ______________________________________________________________________________
Okeechobee Inflows (cfs): S65E 0 S65EX1 214 Fisheating Cr 0 S154 0 S191 0 S135 Pumps 0 S84 0 S133 Pumps 0 S2 Pumps 0 S84X 0 S127 Pumps 0 S3 Pumps 0 S71 0 S129 Pumps 0 S4 Pumps 0 S72 0 S131 Pumps 0 C5 0 Total Inflows: 214
Okeechobee Outflows (cfs): S135 Culverts 0 S354 481 S77 1146 S127 Culverts 0 S351 972 S308 315 S129 Culverts 0 S352 100 S131 Culverts 0 L8 Canal Pt -123 Total Outflows: 2890
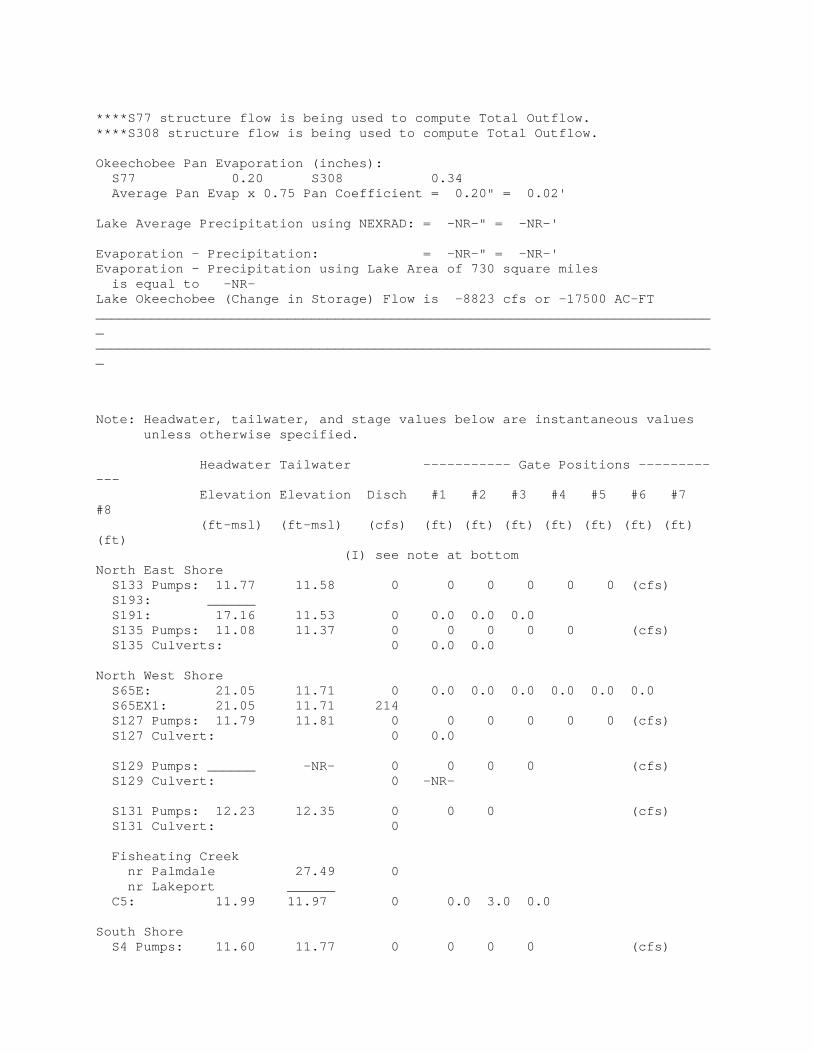
****S77 structure flow is being used to compute Total Outflow. ****S308 structure flow is being used to compute Total Outflow.
Okeechobee Pan Evaporation (inches): S77 0.20 S308 0.34 Average Pan Evap x 0.75 Pan Coefficient = 0.20" = 0.02'
Lake Average Precipitation using NEXRAD: = -NR-" = -NR-'
Evaporation - Precipitation: = -NR-" = -NR-' Evaporation - Precipitation using Lake Area of 730 square miles is equal to -NR- Lake Okeechobee (Change in Storage) Flow is -8823 cfs or -17500 AC-FT ______________________________________________________________________________ ______________________________________________________________________________
Note: Headwater, tailwater, and stage values below are instantaneous values unless otherwise specified.
Headwater Tailwater ----------- Gate Positions ------------ Elevation Elevation Disch #1 #2 #3 #4 #5 #6 #7 #8 (ft-msl) (ft-msl) (cfs) (ft) (ft) (ft) (ft) (ft) (ft) (ft) (ft) (I) see note at bottom North East Shore S133 Pumps: 11.77 11.58 0 0 0 0 0 0 (cfs) S193: ______ S191: 17.16 11.53 0 0.0 0.0 0.0 S135 Pumps: 11.08 11.37 0 0 0 0 0 (cfs) S135 Culverts: 0 0.0 0.0
North West Shore S65E: 21.05 11.71 0 0.0 0.0 0.0 0.0 0.0 0.0 S65EX1: 21.05 11.71 214 S127 Pumps: 11.79 11.81 0 0 0 0 0 0 (cfs) S127 Culvert: 0 0.0
S129 Pumps: ______ -NR- 0 0 0 0 (cfs) S129 Culvert: 0 -NR-
S131 Pumps: 12.23 12.35 0 0 0 (cfs) S131 Culvert: 0
Fisheating Creek nr Palmdale 27.49 0 nr Lakeport ______ C5: 11.99 11.97 0 0.0 3.0 0.0
South Shore S4 Pumps: 11.60 11.77 0 0 0 0 (cfs)

S169: 11.71 11.69 105 5.0 5.0 5.0 S310: 11.65 156 S3 Pumps: 11.14 11.59 0 0 0 0 (cfs) S354: 11.59 11.14 481 2.8 3.0 S2 Pumps: 11.11 11.55 0 0 0 0 0 (cfs) S351: 11.55 11.11 972 4.6 4.6 4.6 S352: 11.52 10.53 100 0.1 0.2 C10A: -NR- 11.61 0.0 8.0 8.0 8.0 8.0 L8 Canal PT 11.44 -123
_________________________________________________________________________ S351 and S352 Temporary Pumps/S354 Spillway
S351: 11.11 11.55 972 -NR--NR--NR--NR--NR--NR- S352: 10.53 11.52 100 -NR--NR--NR--NR- S354: 11.14 11.59 481 -NR--NR--NR--NR- _________________________________________________________________________
Caloosahatchee River (S77, S78, S79) S47B: 12.65 10.93 0.0 0.0 S47D: 10.90 10.89 34 6.2 S77: Spillway and Sector Flow: 11.85 10.92 ****** 0.0 3.0 3.0 0.0 Flow Due to Lockages+: 2
S77 Below USGS Flow Gage 1116
S78: Spillway and Sector Flow: 10.80 3.02 662 0.0 0.0 0.0 1.5 Flow Due to Lockages+: 16
S79: Spillway and Sector Flow: 3.19 1.50 666 0.0 0.0 0.5 1.0 0.5 0.0 0.0 0.0 Flow Due to Lockages+: 10 Percent of flow from S77 172% Chloride (ppm) 89
St. Lucie Canal (S308, S80) S308: Spillway and Sector Flow: 11.39 11.16 315.00 0.0 0.0 0.0 0.0 Flow Due to Lockages+: 0
S308 Below USGS Flow Gage 371 S153: 18.49 10.97 0 0.0 0.0 S80: Spillway and Sector Flow: 11.25 0.06 0 0.0 0.0 0.0 0.0 0.0 0.0 0.0 Flow Due to Lockages+: 19 Percent of flow from S308 NA %
Steele Point Top Salinity (mg/ml) ****
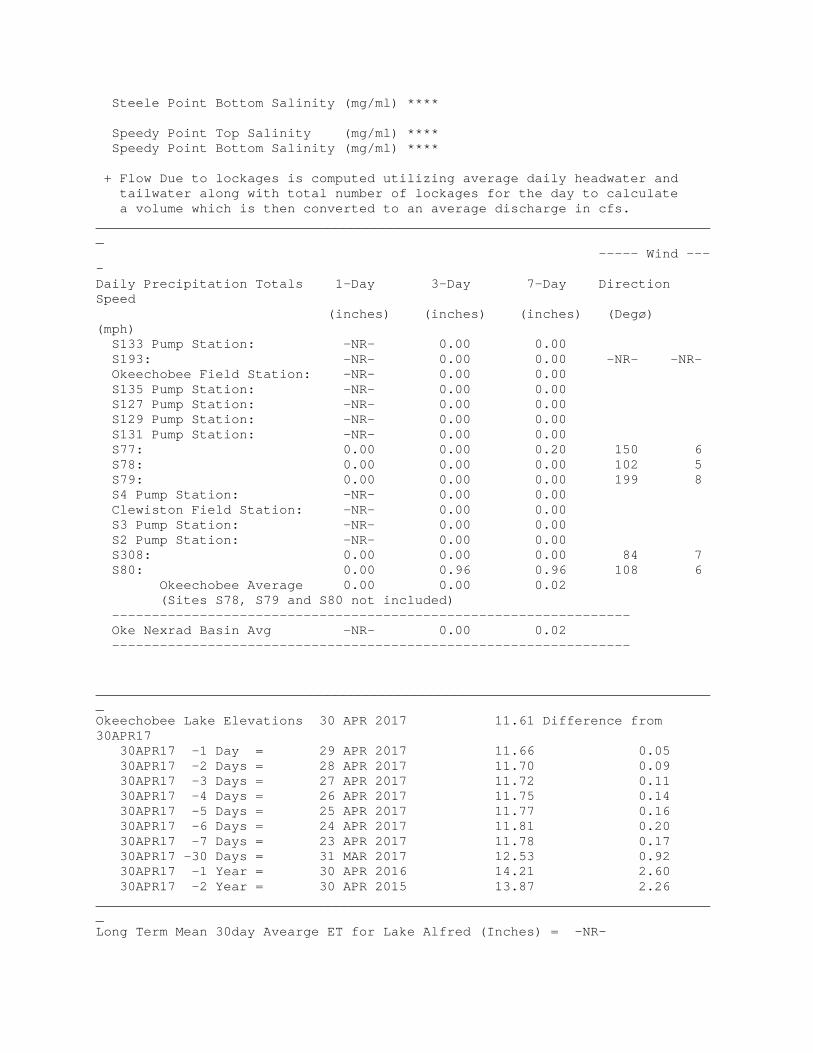
Steele Point Bottom Salinity (mg/ml) ****
Speedy Point Top Salinity (mg/ml) **** Speedy Point Bottom Salinity (mg/ml) ****
+ Flow Due to lockages is computed utilizing average daily headwater and tailwater along with total number of lockages for the day to calculate a volume which is then converted to an average discharge in cfs. ______________________________________________________________________________ ----- Wind ---- Daily Precipitation Totals 1-Day 3-Day 7-Day Direction Speed (inches) (inches) (inches) (Degø) (mph) S133 Pump Station: -NR- 0.00 0.00 S193: -NR- 0.00 0.00 -NR- -NR- Okeechobee Field Station: -NR- 0.00 0.00 S135 Pump Station: -NR- 0.00 0.00 S127 Pump Station: -NR- 0.00 0.00 S129 Pump Station: -NR- 0.00 0.00 S131 Pump Station: -NR- 0.00 0.00 S77: 0.00 0.00 0.20 150 6 S78: 0.00 0.00 0.00 102 5 S79: 0.00 0.00 0.00 199 8 S4 Pump Station: -NR- 0.00 0.00 Clewiston Field Station: -NR- 0.00 0.00 S3 Pump Station: -NR- 0.00 0.00 S2 Pump Station: -NR- 0.00 0.00 S308: 0.00 0.00 0.00 84 7 S80: 0.00 0.96 0.96 108 6 Okeechobee Average 0.00 0.00 0.02 (Sites S78, S79 and S80 not included) ----------------------------------------------------------------- Oke Nexrad Basin Avg -NR- 0.00 0.02 -----------------------------------------------------------------
______________________________________________________________________________ Okeechobee Lake Elevations 30 APR 2017 11.61 Difference from 30APR17 30APR17 -1 Day = 29 APR 2017 11.66 0.05 30APR17 -2 Days = 28 APR 2017 11.70 0.09 30APR17 -3 Days = 27 APR 2017 11.72 0.11 30APR17 -4 Days = 26 APR 2017 11.75 0.14 30APR17 -5 Days = 25 APR 2017 11.77 0.16 30APR17 -6 Days = 24 APR 2017 11.81 0.20 30APR17 -7 Days = 23 APR 2017 11.78 0.17 30APR17 -30 Days = 31 MAR 2017 12.53 0.92 30APR17 -1 Year = 30 APR 2016 14.21 2.60 30APR17 -2 Year = 30 APR 2015 13.87 2.26 ______________________________________________________________________________ Long Term Mean 30day Avearge ET for Lake Alfred (Inches) = -NR-
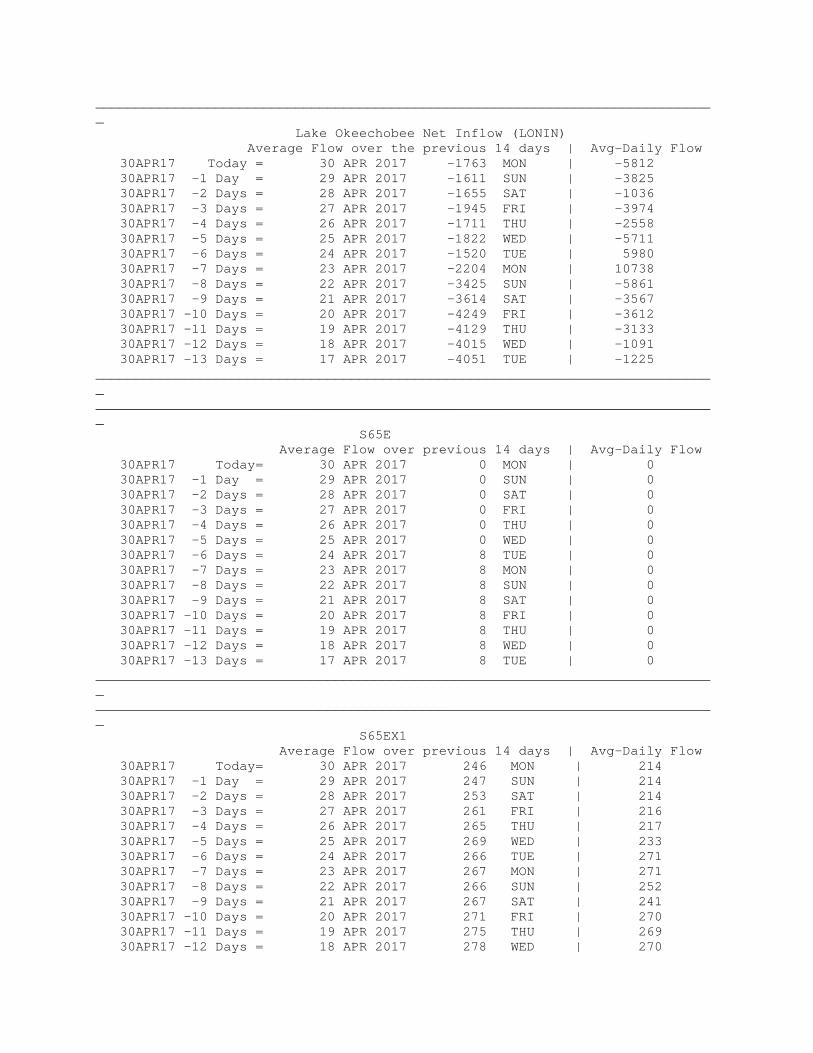
______________________________________________________________________________ Lake Okeechobee Net Inflow (LONIN) Average Flow over the previous 14 days | Avg-Daily Flow 30APR17 Today = 30 APR 2017 -1763 MON | -5812 30APR17 -1 Day = 29 APR 2017 -1611 SUN | -3825 30APR17 -2 Days = 28 APR 2017 -1655 SAT | -1036 30APR17 -3 Days = 27 APR 2017 -1945 FRI | -3974 30APR17 -4 Days = 26 APR 2017 -1711 THU | -2558 30APR17 -5 Days = 25 APR 2017 -1822 WED | -5711 30APR17 -6 Days = 24 APR 2017 -1520 TUE | 5980 30APR17 -7 Days = 23 APR 2017 -2204 MON | 10738 30APR17 -8 Days = 22 APR 2017 -3425 SUN | -5861 30APR17 -9 Days = 21 APR 2017 -3614 SAT | -3567 30APR17 -10 Days = 20 APR 2017 -4249 FRI | -3612 30APR17 -11 Days = 19 APR 2017 -4129 THU | -3133 30APR17 -12 Days = 18 APR 2017 -4015 WED | -1091 30APR17 -13 Days = 17 APR 2017 -4051 TUE | -1225 ______________________________________________________________________________ ______________________________________________________________________________ S65E Average Flow over previous 14 days | Avg-Daily Flow 30APR17 Today= 30 APR 2017 0 MON | 0 30APR17 -1 Day = 29 APR 2017 0 SUN | 0 30APR17 -2 Days = 28 APR 2017 0 SAT | 0 30APR17 -3 Days = 27 APR 2017 0 FRI | 0 30APR17 -4 Days = 26 APR 2017 0 THU | 0 30APR17 -5 Days = 25 APR 2017 0 WED | 0 30APR17 -6 Days = 24 APR 2017 8 TUE | 0 30APR17 -7 Days = 23 APR 2017 8 MON | 0 30APR17 -8 Days = 22 APR 2017 8 SUN | 0 30APR17 -9 Days = 21 APR 2017 8 SAT | 0 30APR17 -10 Days = 20 APR 2017 8 FRI | 0 30APR17 -11 Days = 19 APR 2017 8 THU | 0 30APR17 -12 Days = 18 APR 2017 8 WED | 0 30APR17 -13 Days = 17 APR 2017 8 TUE | 0 ______________________________________________________________________________ ______________________________________________________________________________ S65EX1 Average Flow over previous 14 days | Avg-Daily Flow 30APR17 Today= 30 APR 2017 246 MON | 214 30APR17 -1 Day = 29 APR 2017 247 SUN | 214 30APR17 -2 Days = 28 APR 2017 253 SAT | 214 30APR17 -3 Days = 27 APR 2017 261 FRI | 216 30APR17 -4 Days = 26 APR 2017 265 THU | 217 30APR17 -5 Days = 25 APR 2017 269 WED | 233 30APR17 -6 Days = 24 APR 2017 266 TUE | 271 30APR17 -7 Days = 23 APR 2017 267 MON | 271 30APR17 -8 Days = 22 APR 2017 266 SUN | 252 30APR17 -9 Days = 21 APR 2017 267 SAT | 241 30APR17 -10 Days = 20 APR 2017 271 FRI | 270 30APR17 -11 Days = 19 APR 2017 275 THU | 269 30APR17 -12 Days = 18 APR 2017 278 WED | 270

30APR17 -13 Days = 17 APR 2017 281 TUE | 288 ______________________________________________________________________________ Lake Okeechobee Outlets Last 14 Days
S-77 Below S-77 S-78 S-79 Discharge Discharge Discharge Discharge (ALL DAY) (ALL-DAY) (ALL DAY) (ALL DAY) DATE (AC-FT) (AC-FT) (AC-FT) (AC-FT) 30 APR 2017 2263 2214 1338 1335 29 APR 2017 2482 2665 1676 1448 28 APR 2017 1132 1263 515 276 27 APR 2017 456 603 35 13 26 APR 2017 370 98 42 108 25 APR 2017 677 536 137 1188 24 APR 2017 624 844 663 1852 23 APR 2017 1882 1857 1380 1601 22 APR 2017 1916 1530 1008 247 21 APR 2017 1019 600 28 240 20 APR 2017 950 394 32 17 19 APR 2017 1163 ****** 121 137 18 APR 2017 1827 1423 464 529 17 APR 2017 2145 1896 999 813
S-310 S-351 S-352 S-354 L8 Canal Pt Discharge Discharge Discharge Discharge Discharge (ALL DAY) (ALL DAY) (ALL DAY) (ALL DAY) (ALL DAY) DATE (AC-FT) (AC-FT) (AC-FT) (AC-FT) (AC-FT) 30 APR 2017 309 1999 178 845 -243 29 APR 2017 212 1927 18 1350 -218 28 APR 2017 210 1529 0 1868 -203 27 APR 2017 195 242 0 1801 -171 26 APR 2017 160 50 0 1624 -34 25 APR 2017 73 99 436 1479 69 24 APR 2017 20 0 0 494 -260 23 APR 2017 7 773 512 59 -230 22 APR 2017 86 1862 1327 591 -90 21 APR 2017 73 2419 1372 1616 -71 20 APR 2017 40 2477 1370 1674 -129 19 APR 2017 34 2699 1388 1816 -257 18 APR 2017 86 2737 1396 1666 -242 17 APR 2017 113 2407 1281 1354 -260
S-308 Below S-308 S-80 Discharge Discharge Discharge (ALL DAY) (ALL-DAY) (ALL-DAY) DATE (AC-FT) (AC-FT) (AC-FT) 30 APR 2017 598 735 37 29 APR 2017 550 660 53 28 APR 2017 624 583 50 27 APR 2017 622 338 37 26 APR 2017 1 269 39 25 APR 2017 542 -197 47 24 APR 2017 2058 -162 41 23 APR 2017 1228 -97 36 22 APR 2017 2316 406 64 21 APR 2017 2804 592 48
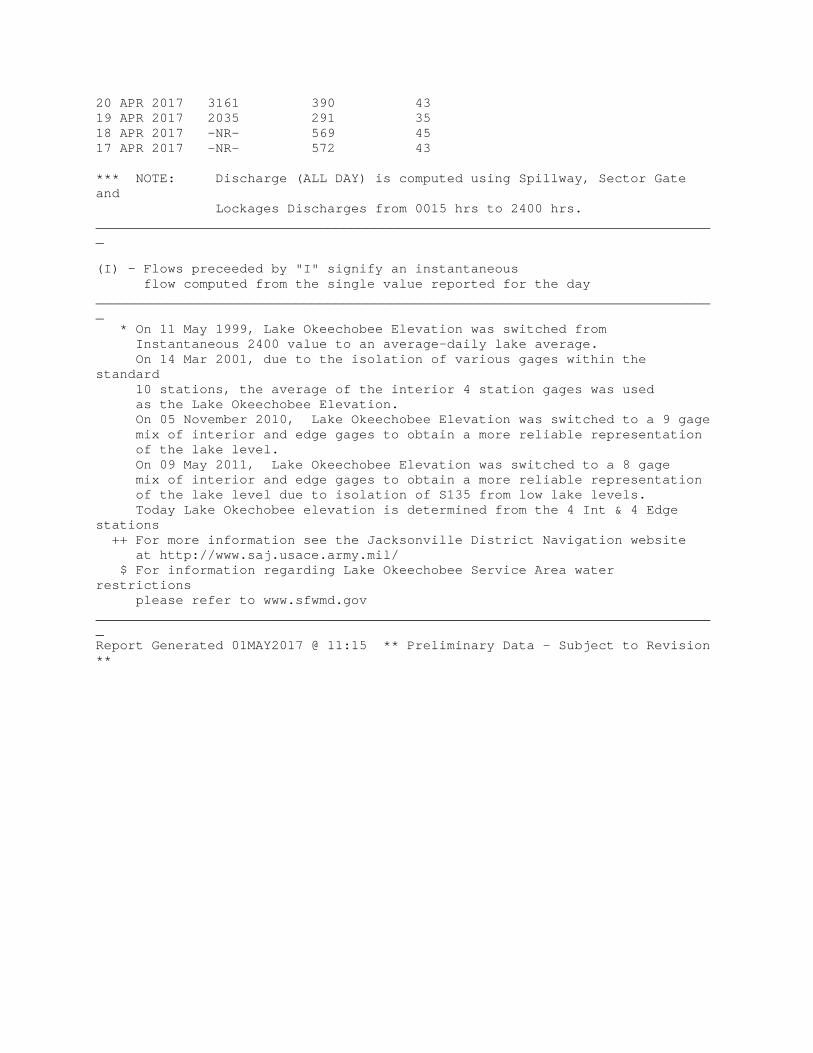
20 APR 2017 3161 390 43 19 APR 2017 2035 291 35 18 APR 2017 -NR- 569 45 17 APR 2017 -NR- 572 43
*** NOTE: Discharge (ALL DAY) is computed using Spillway, Sector Gate and Lockages Discharges from 0015 hrs to 2400 hrs. ______________________________________________________________________________
(I) - Flows preceeded by "I" signify an instantaneous flow computed from the single value reported for the day ______________________________________________________________________________ * On 11 May 1999, Lake Okeechobee Elevation was switched from Instantaneous 2400 value to an average-daily lake average. On 14 Mar 2001, due to the isolation of various gages within the standard 10 stations, the average of the interior 4 station gages was used as the Lake Okeechobee Elevation. On 05 November 2010, Lake Okeechobee Elevation was switched to a 9 gage mix of interior and edge gages to obtain a more reliable representation of the lake level. On 09 May 2011, Lake Okeechobee Elevation was switched to a 8 gage mix of interior and edge gages to obtain a more reliable representation of the lake level due to isolation of S135 from low lake levels. Today Lake Okechobee elevation is determined from the 4 Int & 4 Edge stations ++ For more information see the Jacksonville District Navigation website at http://www.saj.usace.army.mil/ $ For information regarding Lake Okeechobee Service Area water restrictions please refer to www.sfwmd.gov ______________________________________________________________________________ Report Generated 01MAY2017 @ 11:15 ** Preliminary Data - Subject to Revision **

Ja n M ar M a y J ul Se p N o v Ja n2 01 6
Ma r M a y Ju l Se p N ov Ja n2 01 7
9
1 0
1 1
1 2
1 3
1 4
1 5
1 6
1 7
1 8
1 9
Elev
in
Ft
NGVD
H i gh La k e M a na g em e nt
O k ee c ho b ee A vg El e v
A v er a ge El e v [ 1 96 5 -2 0 0 7]
W a te r S h or t a ge Ma n ag e m en t
Lake Okeechobee
01MAY17 11:17:16

WSE Classification Tables
Classification Tables
Supplemental Tables used in conjunction with the LORS2008 ReleaseGuidance Flow Charts • Class Limits for Tributary Hydrologic Conditions Table K-2 in the Lake Okeechobee Water Control Plan • 6-15 Day Precipitation Outlook Categories Table ?? in the Lake Okeechobee Water Control Plan • Classification of Lake Okeechobee Net Inflow for Seasonal Outlook Table K-3 in the Lake Okeechobee Water Control Plan • Classification of Lake Okeechobee Net Inflow for Multi-Seasonal Outlook Table K-4 in the Lake Okeechobee Water Control Plan
Back to Lake Okeechobee Operations Main Page
Back to U.S. Army Corps of Engineers Lake Okeechobee Operations Homepage
file:///Y|/LORS/STAGING/lors01182010/lors_support/class_tables.html [01/20/2010 14:47:54]

Tributary Hydrologic
Tributary HydrologicClassification*
Palmer IndexClass Limits
2-wk Mean L.O. NetInflow Class Limits
Very Wet 3.0 or greater Greater >= 6000 cfsWet 1.5 to 2.99 2500 - 5999 cfs
Near Normal -1.49 to 1.49 500 - 2499 cfsDry -2.99 to -1.5 -5000 – 500 cfs
Very Dry -3.0 or less Less than -5000 cfs* use the wettest of the two indicators
file:///Y|/LORS/STAGING/lors01182010/lors_support/lors2008_tribcond_classes.html [01/20/2010 14:47:55]

WSEwebtables_seasoutlook
Classification of Lake Okeechobee Net Inflow Seasonal Outlook*
Lake Net Inflow Prediction
[million acre-feet]
Equivalent Depth**
[feet]
Lake Okeechobee
Net Inflow
Seasonal Outlook
> 0.93 > 2.0 Very Wet
0.71 to 0.93 1.51 to 2.0 Wet
0.35 to 0.70 0.75 to 1.5 Normal
< 0.35 < 0.75 Dry
**Volume-depth conversion based on average lake surface area of 467,000 acres
file:///Y|/LORS/STAGING/lors01182010/lors_support/seasoutlook_table.html [01/20/2010 14:47:56]

WSEwebtables_multiseasoutlook
Classification of Lake Okeechobee Net Inflow Multi-Seasonal Outlook*
Lake Net Inflow Prediction
[million acre-feet]
Equivalent Depth**
[feet]
Lake Okeechobee
Net Inflow
Multi-Seasonal Outlook
> 2.0 > 4.3 Very Wet
1.18 to 2.0 2.51 to 4.3 Wet
0.5 to 1.17 1.1 to 2.5 Normal
< 0.5 < 1.1 Dry
**Volume-depth conversion based on average lake surface area of 467,000 acres
file:///Y|/LORS/STAGING/lors01182010/lors_support/multiseasoutlook_table.html [01/20/2010 14:47:55]
wsewebtable_precip
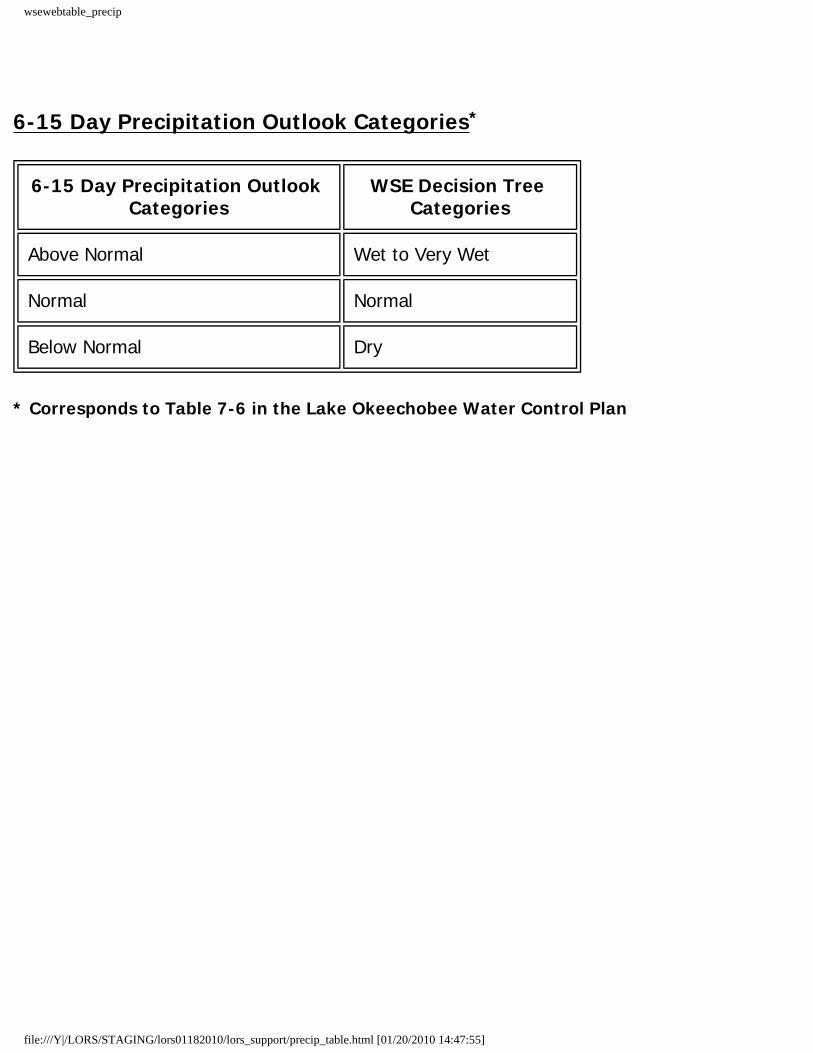
6-15 Day Precipitation Outlook Categories*
6-15 Day Precipitation Outlook Categories
WSE Decision Tree Categories
Above Normal Wet to Very Wet
Normal Normal
Below Normal Dry
* Corresponds to Table 7-6 in the Lake Okeechobee Water Control Plan
file:///Y|/LORS/STAGING/lors01182010/lors_support/precip_table.html [01/20/2010 14:47:55]
Under Construction
Related Documents