Chemical Engineering Journal 142 (2008) 87–94 Application of the distributed activation energy model to blends devolatilisation M.V. Navarro, A. Aranda, T. Garcia, R. Murillo ∗ , A.M. Mastral Instituto de Carboqu´ ımica, CSIC, M Luesma Castan 4, 50018 Zaragoza, Spain Received 4 September 2007; received in revised form 4 January 2008; accepted 23 January 2008 Abstract In this study, an investigation was carried out into the thermal behaviour of coal, petcoke and their blend as a generic feedstock in combustion and IGCC plants for energy production. The samples were pyrolysed in a TG analyzer in nitrogen atmosphere (constant flow of 0.0335 m/s) at several heating rates with temperatures ranging from 300 to 1223K. The distributed activation energy model was applied to study the effects of heating rates on the reactions of single solids. The results obtained were used in the calculation of curves mass loss vs. temperature at more realistic heating rates. The algorithm used to obtain the distribution of reactivities for single solids was successfully implemented to allow the prediction of blends performance. © 2008 Elsevier B.V. All rights reserved. Keywords: Coal; Petcoke; Devolatilisation; Kinetics; Modeling 1. Introduction The pyrolysis produces remarkable changes in chemical structure, surface morphology and porosity of the solid particle, which have an important effect on the char reactivity [1]. These changes are produced during devolatilisation of volatiles as a first step of pyrolysis itself but also combustion or gasification that can even accelerate ignition by increasing the temperature of the gas phase. Although much work has been conducted to study coal pyrolysis, extensive research on a definitive mechanism is still the subject of much discussion. It is generally assumed that gasifiers or combustors oper- ate at very high temperatures and the devolatilisation process will be completed instantaneously [2]. These conditions are very difficult to reproduce in conventional experimental systems, therefore, modeling is necessary to obtain parameters in more accessible conditions to know the particularities of the samples and lately extrapolate to real conditions. This way, effects of dif- ferent heating rates in changes in the temperature in the particle and in the oven can be taken into account in the model. Reactions of practical interest often involve a complex set of sequential and parallel unimolecular and bimolecular reac- ∗ Corresponding author. Tel.: +34 976733977; fax: +34 976733318. E-mail address: [email protected] (R. Murillo). tions that are often impossible to characterize at any significant level of detail. A kinetic analysis must capture the essence of the exceedingly complex reaction set in a tractable mathemati- cal way [3]. Simple models have been described in the literature where it is assumed that the decomposing material is consti- tuted by only one hypothetical chemical compound that reacts in a broad temperature interval [3]. However, other more realistic approximation to the decomposition kinetics of complex mate- rials is the parallel reaction model. This model assumes that the distribution of reactivity caused by the reaction complexity can be represented by a set of independent, parallel reactions. The reactivity distribution of these reactions, described by a distribu- tion of frequency factors and activation energies, can be solved mathematically. Specific mathematical forms appearing in the literature are the Gaussian, Weibull and Gamma distributions [3]. The distribution can also be a finite discrete distribution of arbitrary form. The key to the widespread usage of this last rou- tine is its flexibility to fit almost any reactivity distribution and an efficient nested nonlinear-constrained linear regression rou- tine first used by Burnham et al. [4]. Other examples of previous papers dealing with this subject are, among others, works of Miura [5], Maki et al. [6] and Arenillas et al. [7]. This work aims to find the characteristics of coal and pet- coke pyrolysis process in order to obtain operative parameters. These parameters will be used to calculate their behaviour at real 1385-8947/$ – see front matter © 2008 Elsevier B.V. All rights reserved. doi:10.1016/j.cej.2008.01.034

Welcome message from author
This document is posted to help you gain knowledge. Please leave a comment to let me know what you think about it! Share it to your friends and learn new things together.
Transcript
A
ashhb©
K
1
swcfittcs
awvtaafa
o
1d
Chemical Engineering Journal 142 (2008) 87–94
Application of the distributed activation energy modelto blends devolatilisation
M.V. Navarro, A. Aranda, T. Garcia, R. Murillo ∗, A.M. MastralInstituto de Carboquı́mica, CSIC, M Luesma Castan 4, 50018 Zaragoza, Spain
Received 4 September 2007; received in revised form 4 January 2008; accepted 23 January 2008
bstract
In this study, an investigation was carried out into the thermal behaviour of coal, petcoke and their blend as a generic feedstock in combustionnd IGCC plants for energy production. The samples were pyrolysed in a TG analyzer in nitrogen atmosphere (constant flow of 0.0335 m/s) ateveral heating rates with temperatures ranging from 300 to 1223 K. The distributed activation energy model was applied to study the effects ofeating rates on the reactions of single solids. The results obtained were used in the calculation of curves mass loss vs. temperature at more realisticeating rates. The algorithm used to obtain the distribution of reactivities for single solids was successfully implemented to allow the prediction of
lends performance.2008 Elsevier B.V. All rights reserved.
tltcwtiardbrtml[
at
eywords: Coal; Petcoke; Devolatilisation; Kinetics; Modeling
. Introduction
The pyrolysis produces remarkable changes in chemicaltructure, surface morphology and porosity of the solid particle,hich have an important effect on the char reactivity [1]. These
hanges are produced during devolatilisation of volatiles as arst step of pyrolysis itself but also combustion or gasification
hat can even accelerate ignition by increasing the temperature ofhe gas phase. Although much work has been conducted to studyoal pyrolysis, extensive research on a definitive mechanism istill the subject of much discussion.
It is generally assumed that gasifiers or combustors oper-te at very high temperatures and the devolatilisation processill be completed instantaneously [2]. These conditions areery difficult to reproduce in conventional experimental systems,herefore, modeling is necessary to obtain parameters in moreccessible conditions to know the particularities of the samplesnd lately extrapolate to real conditions. This way, effects of dif-erent heating rates in changes in the temperature in the particle
nd in the oven can be taken into account in the model.Reactions of practical interest often involve a complex setf sequential and parallel unimolecular and bimolecular reac-
∗ Corresponding author. Tel.: +34 976733977; fax: +34 976733318.E-mail address: [email protected] (R. Murillo).
atpM
cT
385-8947/$ – see front matter © 2008 Elsevier B.V. All rights reserved.oi:10.1016/j.cej.2008.01.034
ions that are often impossible to characterize at any significantevel of detail. A kinetic analysis must capture the essence ofhe exceedingly complex reaction set in a tractable mathemati-al way [3]. Simple models have been described in the literaturehere it is assumed that the decomposing material is consti-
uted by only one hypothetical chemical compound that reactsn a broad temperature interval [3]. However, other more realisticpproximation to the decomposition kinetics of complex mate-ials is the parallel reaction model. This model assumes that theistribution of reactivity caused by the reaction complexity cane represented by a set of independent, parallel reactions. Theeactivity distribution of these reactions, described by a distribu-ion of frequency factors and activation energies, can be solved
athematically. Specific mathematical forms appearing in theiterature are the Gaussian, Weibull and Gamma distributions3].
The distribution can also be a finite discrete distribution ofrbitrary form. The key to the widespread usage of this last rou-ine is its flexibility to fit almost any reactivity distribution andn efficient nested nonlinear-constrained linear regression rou-ine first used by Burnham et al. [4]. Other examples of previousapers dealing with this subject are, among others, works of
iura [5], Maki et al. [6] and Arenillas et al. [7].This work aims to find the characteristics of coal and pet-oke pyrolysis process in order to obtain operative parameters.hese parameters will be used to calculate their behaviour at real
88 M.V. Navarro et al. / Chemical Engine
Nomenclature
A(E) pre-exponential factor related to a specific activa-tion energy (s−1)
Ai pre-exponential factor (s−1)DAEM distributed activation energy modelE activation energy (kJ/kg)Ei specific activation energy (kJ/kg)fi,0 fraction of M0 which decomposes with a specific
activation energy, dimensionlessm mass of volatile matter (kg)m0(E) initial mass of volatile matter with a specific acti-
vation energy (kg)M(T) mass of the sample (kg)Mf final mass of sample (kg)Mv(t) total mass of volatile matter (kg)M0 initial mass of the sample (kg)R ideal gas constant (kJ/mol K)t time (s)T temperature (K)TGA thermogravimetric analyzerw fraction of inert material, dimensionless
cot
2
Pwfaa1icaTamcffip
tss
X
3
sCiciccscddao
dimeTgt
M
Avp
s
m
HipaHt
ww
tpt
X fraction of mass remaining
onditions as single components and to predict their behaviournce blended as a generic feedstock in plants for energy produc-ion.
. Experimental
Three different materials have been used in this study,uertollano coal, petcoke and a mixture of them (50:50 ratioith limestone in 2.46% weight) used as feedstock in a plant
or energy production. Their ultimate and proximate analysesppear in Table 1. The samples were pyrolysed in a thermobal-nce CAHN TG-2151 that can work from ambient pressure to00 bar depending on the final temperature. The reactant gas isntroduced into the system through the bottom with a predefinedomposition and total flow. In this study all the tests were run atmbient pressure and a constant flow of nitrogen of 0.0335 m/s.he sensitivity of this apparatus is 1 �g. The sample is placed inplatinum basket forming a small fixed bed with different initialass depending on the sample, 35 mg for coal, 110 mg for pet-
oke and 45 mg for the mixture. The particle size of coal rangesrom 0.5 to 1.6 mm, for petcoke ranges from 0.25 to 0.5 mm andor feedstock has and average value of 0.05 mm. Sets of exper-ments at different heating rates of 5, 10 and 20 K/min wereerformed with every sample.
The fraction of mass remaining (X) was calculated accordingo Eq. (1), where M0 is the initial sample weight, M(t) is theample weight at any time and Mf is the final weight (the weight
table after reaction).= M(t) − Mf
M0 − Mf(1)
itim
ering Journal 142 (2008) 87–94
. Results and discussion
Usually, mathematical models to describe overall decompo-ition of complex solids consider independent parallel reactions.oal is a very complex solid with a large volatile content which
s mainly released during first steps of pyrolysis, gasification andombustion processes. It has been proven that the reaction raten the devolatilisation step in gasification and combustion pro-esses is very high due to very high temperatures in the reactionhamber. Therefore, it is fairly difficult to perform in situ mea-urements in order to find kinetic parameters under these severeonditions. However, these reactions can be studied at mild con-itions to develop models which take into account the effect ofifferent variables in the reaction. Afterwards, and taking intoccount this information, it is possible to predict the behaviourf the solids at real conditions.
To study this complex process on coal and petcoke, theistributed activation energy model (DAEM) to experimentsn thermogravimetric analyzer (TGA) has been applied. This
odel assumes that a complex fuel is a mixture of components,ach of which decomposes following a first-order reaction.he complex composition produces a wide variety of chemicalroups and a continuous distribution of reactions with charac-eristic activation energy during pyrolysis [8].
Thus, the total mass, Mv(t), of volatile matter is
v(t) =∫ ∞
0m(E, t)dE (2)
ssuming that the material in the interval E to E + dE of acti-ation energy decomposes via a first-order reaction, with are-exponential factor A(E)
dm(E, t)
dt= −A(E) exp
(−E
RT
)m(E, t) (3)
o
(E, t) = m0(E) exp
[−A(E)
∫ t
0exp
(−E
RT
)dt
](4)
ere, m0(E) is the initial mass of volatile material decompos-ng with an activation energy in the interval E to E + dE. Inractice, the quantity m(E,t) cannot be measured; only the totalmounts, M(t), or the total rates of decomposition are measured.ence by integrating over all energies for a first-order reaction
he expression becomes
M(t)
M0= w +
∑Reactions,i
fi,0 exp
[−Ai
∫ t
0exp
( −Ei
RT (t)
)dt
](5)
here M(t) is the mass of the sample, which contains a fractionof inert material; M0 is the initial value of M; fi,0 is the frac-
ion of M0 which decomposes with an activation energy Ei andre-exponential factor Ai. Using experimentally measured M(t),he problem is to find fi,0, Ai and Ei. There are several approx-
mations to the DAEM for pyrolysis of coal [9], in this workhe algorithm recently developed by Scott et al. [8] has beenmplemented in a Fortran subroutine to solve this equation. Thisodel assumes increasing rate of mass loss at increasing temper-
M.V. Navarro et al. / Chemical Engineering Journal 142 (2008) 87–94 89
Table 1Proximate and ultimate analyses, and calorific value of the samples
Sample Proximate analysis (wt%) Ultimate analysis (wt%)
Moisture Ash V.M. F.C.a C H N S Oa
Coal 4.2 39.3 23.8 36.9 45.2 3.1 1.0 0.9 49.8Petcoke 0.4 0.4 10.6 89.0 87.7 3.7 1.6 5.7 1.3F
A , fixed
actde
mmetirar1t
ahdopait5afit
Faf
eedstock 0.9 23.9 17.8 58.3
ll data, except moisture, are expressed in dry basis. V.M., volatile matter. F.C.a Calculated by difference.
tures with increasing heating rates which is a general case foroal pyrolysis. This model also needs enough experimental datao produce a proper description of the conversion–temperatureependency in order to generate the activation energy and pre-xponential factor distribution.
This algorithm was applied to the results of thermogravi-etric experiments of the pyrolysis of the two different rawaterials, coal and petcoke. To introduce the thermogravimetric
xperiments data into the model Eq. (1) has been used whichakes into account the effect of inert material so, in this case, w
s zero. Two experimental sets of data obtained at low heatingates (5 and 10 K/min) were used to calculate the distribution of
ctivation energies and pre-exponential factors for every mate-ial. Subsequently three theoretical curves were generated at 5,0 and 20 K/min and compared with experimental data in ordero produce a robust test of how well the kinetics extracted by therla0
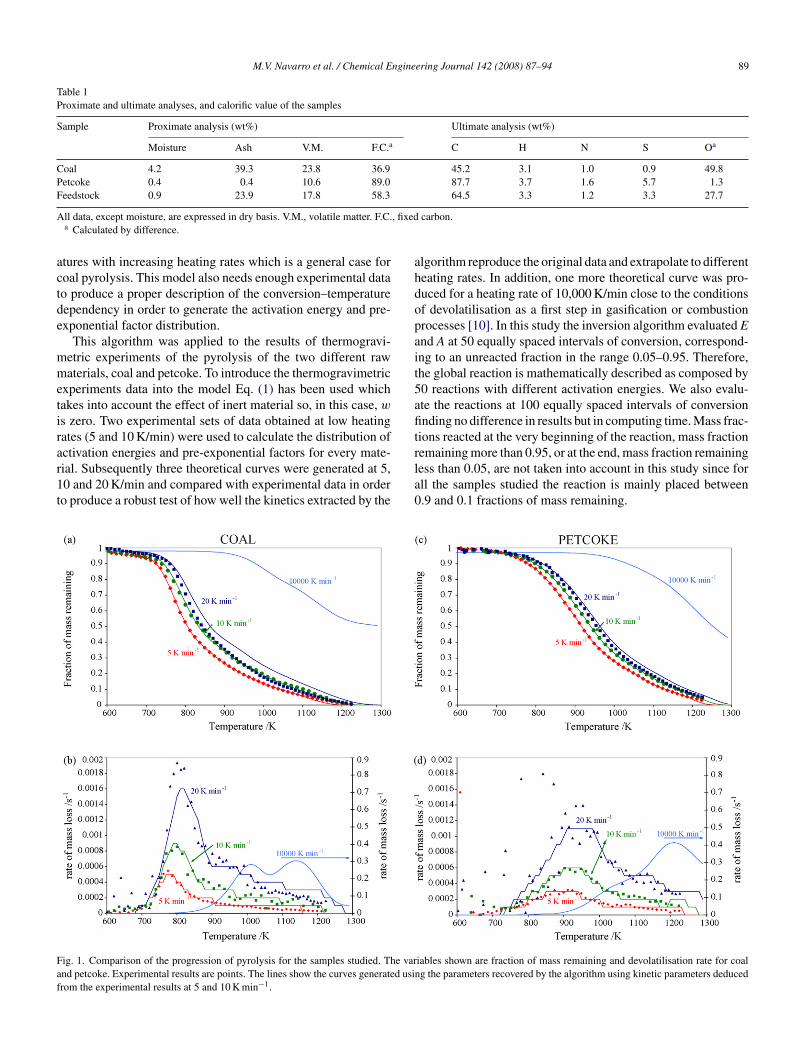
ig. 1. Comparison of the progression of pyrolysis for the samples studied. The varnd petcoke. Experimental results are points. The lines show the curves generated usinrom the experimental results at 5 and 10 K min−1.
64.5 3.3 1.2 3.3 27.7
carbon.
lgorithm reproduce the original data and extrapolate to differenteating rates. In addition, one more theoretical curve was pro-uced for a heating rate of 10,000 K/min close to the conditionsf devolatilisation as a first step in gasification or combustionrocesses [10]. In this study the inversion algorithm evaluated End A at 50 equally spaced intervals of conversion, correspond-ng to an unreacted fraction in the range 0.05–0.95. Therefore,he global reaction is mathematically described as composed by0 reactions with different activation energies. We also evalu-te the reactions at 100 equally spaced intervals of conversionnding no difference in results but in computing time. Mass frac-
ions reacted at the very beginning of the reaction, mass fraction
emaining more than 0.95, or at the end, mass fraction remainingess than 0.05, are not taken into account in this study since forll the samples studied the reaction is mainly placed between.9 and 0.1 fractions of mass remaining.iables shown are fraction of mass remaining and devolatilisation rate for coalg the parameters recovered by the algorithm using kinetic parameters deduced
9 ngine
oigespc
ealoi
mtstst
dis
Fe
0 M.V. Navarro et al. / Chemical E
Results of evolution of the remaining mass fraction and ratef mass loss vs. temperature for coal and petcoke are compiledn Fig. 1. For both samples, experimental and calculated resultsenerated by the program are compared. It is observed that thexperiments performed at heating rates of 5 and 10 K/min wereuccessfully fitted by the model. These results were used forredicting the 20 and 10,000 K/min curves. The axes are keptonstant to facilitate the comparison.
In both cases, for coal and petcoke, the algorithm producesxactly the data of fraction of mass loss vs. temperature obtained
t heating rates of 5 and 10 K/min. These data were used to calcu-ate the set of activation energies and pre-exponential fractionsf each of the 50 possible reactions involved in the devolatil-sation process. Regarding to the evolution of the fraction offpbt
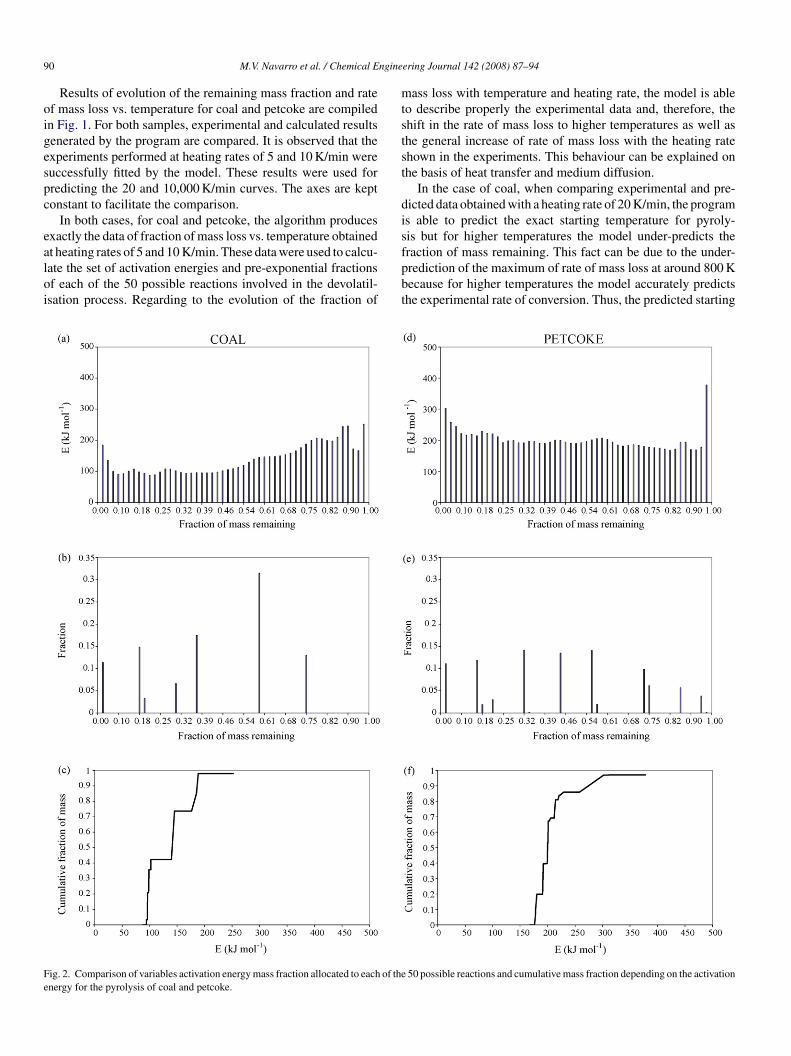
ig. 2. Comparison of variables activation energy mass fraction allocated to each of thenergy for the pyrolysis of coal and petcoke.
ering Journal 142 (2008) 87–94
ass loss with temperature and heating rate, the model is ableo describe properly the experimental data and, therefore, thehift in the rate of mass loss to higher temperatures as well ashe general increase of rate of mass loss with the heating ratehown in the experiments. This behaviour can be explained onhe basis of heat transfer and medium diffusion.
In the case of coal, when comparing experimental and pre-icted data obtained with a heating rate of 20 K/min, the programs able to predict the exact starting temperature for pyroly-is but for higher temperatures the model under-predicts the
raction of mass remaining. This fact can be due to the under-rediction of the maximum of rate of mass loss at around 800 Kecause for higher temperatures the model accurately predictshe experimental rate of conversion. Thus, the predicted starting50 possible reactions and cumulative mass fraction depending on the activation
ngine
tsb
asirthttmwg
miIcrtcvtt
mhrr
ftg3aootirff
erfl
Ffp
M.V. Navarro et al. / Chemical E
emperature of coal pyrolysis with a heating rate of 10,000 K/minhould be close to the real one although the real process coulde faster than the predicted.
In the case of petcoke, the peak of rate of mass loss is lowernd wider than the one of coal. Therefore, petcoke reaction islower and more gradual, i.e. there are more reactions involvedn petcoke devolatilisation, than the one of coal. This sort ofeaction seems to be easier to be treated by the model. Hencehe comparison between experimental and predicted data for aeating rate of 20 K/min is better than the one of coal becausehe predicted evolution of the fraction of mass remaining withemperature is closer to the real one. Generally speaking, the
odel gives a very good approximation of the temperature rangehere the reaction will take place at the high heating rates ofasification or combustion processes.
The most relevant point of the distributed activation energiesodel is the capacity of analysing the devolatilisation process
n a distribution of reactions with different activation energies.n Fig. 2 the distributions of activation energies for coal and pet-oke are shown related to the fraction of sample allocated to eacheaction and cumulative mass fraction depending on the activa-ion energy. Regarding to the distribution of activation energies,
oal and petcoke have opposite trends. For coal the highest acti-ation energies, therefore, the less favoured reactions, occur athe very beginning of the process. However, following the reac-ion (see Fig. 2a), the activation energies decrease to reach at
mp
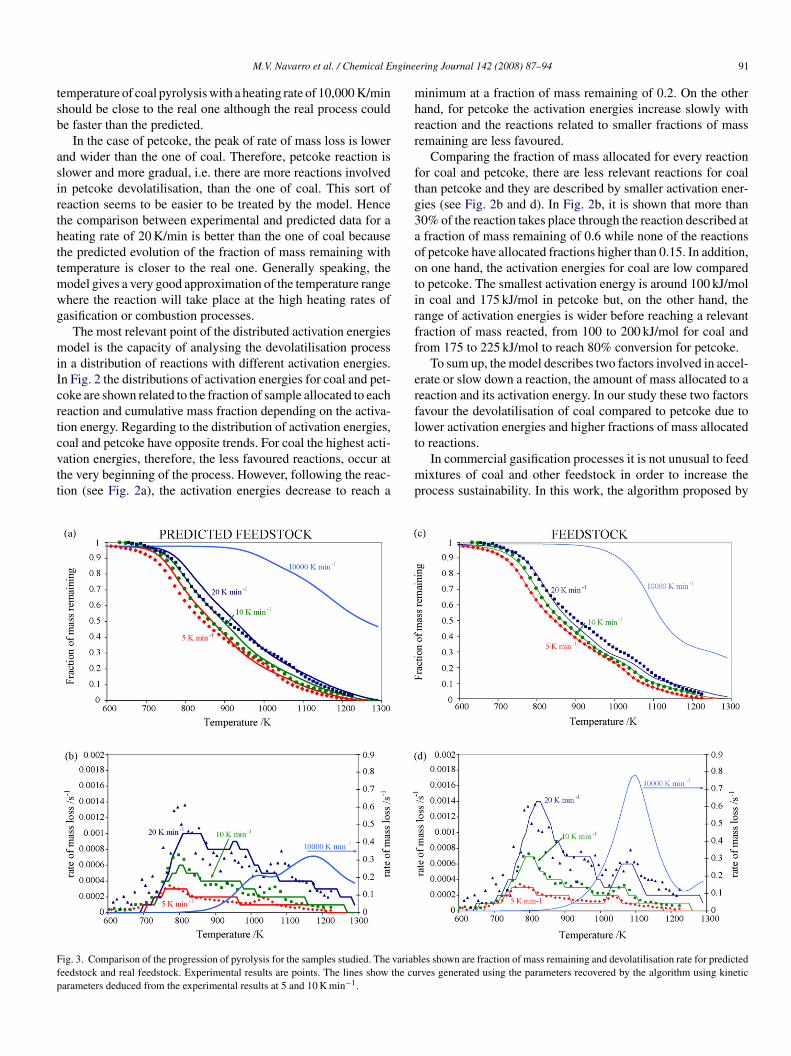
ig. 3. Comparison of the progression of pyrolysis for the samples studied. The variabeedstock and real feedstock. Experimental results are points. The lines show the cuarameters deduced from the experimental results at 5 and 10 K min−1.
ering Journal 142 (2008) 87–94 91
inimum at a fraction of mass remaining of 0.2. On the otherand, for petcoke the activation energies increase slowly witheaction and the reactions related to smaller fractions of massemaining are less favoured.
Comparing the fraction of mass allocated for every reactionor coal and petcoke, there are less relevant reactions for coalhan petcoke and they are described by smaller activation ener-ies (see Fig. 2b and d). In Fig. 2b, it is shown that more than0% of the reaction takes place through the reaction described atfraction of mass remaining of 0.6 while none of the reactionsf petcoke have allocated fractions higher than 0.15. In addition,n one hand, the activation energies for coal are low comparedo petcoke. The smallest activation energy is around 100 kJ/moln coal and 175 kJ/mol in petcoke but, on the other hand, theange of activation energies is wider before reaching a relevantraction of mass reacted, from 100 to 200 kJ/mol for coal androm 175 to 225 kJ/mol to reach 80% conversion for petcoke.
To sum up, the model describes two factors involved in accel-rate or slow down a reaction, the amount of mass allocated to aeaction and its activation energy. In our study these two factorsavour the devolatilisation of coal compared to petcoke due toower activation energies and higher fractions of mass allocated
o reactions.In commercial gasification processes it is not unusual to feedixtures of coal and other feedstock in order to increase the
rocess sustainability. In this work, the algorithm proposed by
les shown are fraction of mass remaining and devolatilisation rate for predictedrves generated using the parameters recovered by the algorithm using kinetic
9 ngineering Journal 142 (2008) 87–94
Stiee(
X
wfp
esttsartithscpppsnaro1orv
prpt
mfmsrablp
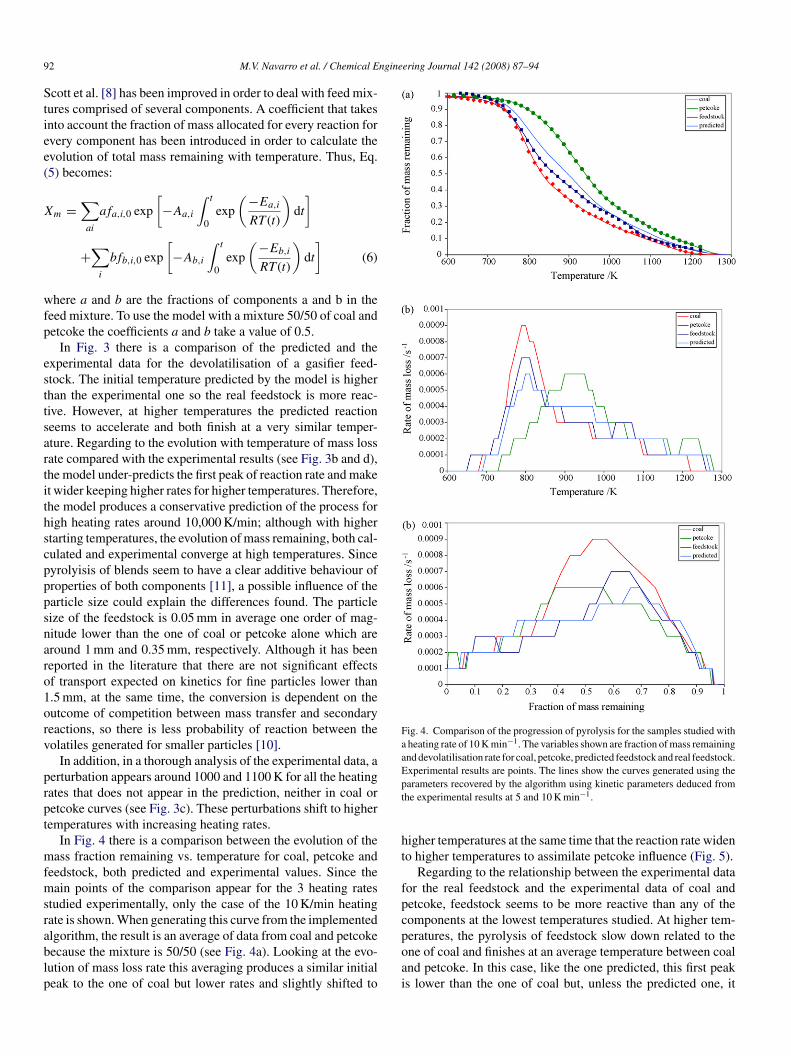
Fig. 4. Comparison of the progression of pyrolysis for the samples studied witha heating rate of 10 K min−1. The variables shown are fraction of mass remainingand devolatilisation rate for coal, petcoke, predicted feedstock and real feedstock.Experimental results are points. The lines show the curves generated using thept
ht
fpc
2 M.V. Navarro et al. / Chemical E
cott et al. [8] has been improved in order to deal with feed mix-ures comprised of several components. A coefficient that takesnto account the fraction of mass allocated for every reaction forvery component has been introduced in order to calculate thevolution of total mass remaining with temperature. Thus, Eq.5) becomes:
m =∑ai
afa,i,0 exp
[−Aa,i
∫ t
0exp
(−Ea,i
RT (t)
)dt
]
+∑
i
bfb,i,0 exp
[−Ab,i
∫ t
0exp
(−Eb,i
RT (t)
)dt
](6)
here a and b are the fractions of components a and b in theeed mixture. To use the model with a mixture 50/50 of coal andetcoke the coefficients a and b take a value of 0.5.
In Fig. 3 there is a comparison of the predicted and thexperimental data for the devolatilisation of a gasifier feed-tock. The initial temperature predicted by the model is higherhan the experimental one so the real feedstock is more reac-ive. However, at higher temperatures the predicted reactioneems to accelerate and both finish at a very similar temper-ture. Regarding to the evolution with temperature of mass lossate compared with the experimental results (see Fig. 3b and d),he model under-predicts the first peak of reaction rate and maket wider keeping higher rates for higher temperatures. Therefore,he model produces a conservative prediction of the process forigh heating rates around 10,000 K/min; although with highertarting temperatures, the evolution of mass remaining, both cal-ulated and experimental converge at high temperatures. Sinceyrolyisis of blends seem to have a clear additive behaviour ofroperties of both components [11], a possible influence of thearticle size could explain the differences found. The particleize of the feedstock is 0.05 mm in average one order of mag-itude lower than the one of coal or petcoke alone which areround 1 mm and 0.35 mm, respectively. Although it has beeneported in the literature that there are not significant effectsf transport expected on kinetics for fine particles lower than.5 mm, at the same time, the conversion is dependent on theutcome of competition between mass transfer and secondaryeactions, so there is less probability of reaction between theolatiles generated for smaller particles [10].
In addition, in a thorough analysis of the experimental data, aerturbation appears around 1000 and 1100 K for all the heatingates that does not appear in the prediction, neither in coal oretcoke curves (see Fig. 3c). These perturbations shift to higheremperatures with increasing heating rates.
In Fig. 4 there is a comparison between the evolution of theass fraction remaining vs. temperature for coal, petcoke and
eedstock, both predicted and experimental values. Since theain points of the comparison appear for the 3 heating rates
tudied experimentally, only the case of the 10 K/min heatingate is shown. When generating this curve from the implemented
lgorithm, the result is an average of data from coal and petcokeecause the mixture is 50/50 (see Fig. 4a). Looking at the evo-ution of mass loss rate this averaging produces a similar initialeak to the one of coal but lower rates and slightly shifted topoai
arameters recovered by the algorithm using kinetic parameters deduced fromhe experimental results at 5 and 10 K min−1.
igher temperatures at the same time that the reaction rate wideno higher temperatures to assimilate petcoke influence (Fig. 5).
Regarding to the relationship between the experimental dataor the real feedstock and the experimental data of coal andetcoke, feedstock seems to be more reactive than any of theomponents at the lowest temperatures studied. At higher tem-eratures, the pyrolysis of feedstock slow down related to the
ne of coal and finishes at an average temperature between coalnd petcoke. In this case, like the one predicted, this first peaks lower than the one of coal but, unless the predicted one, it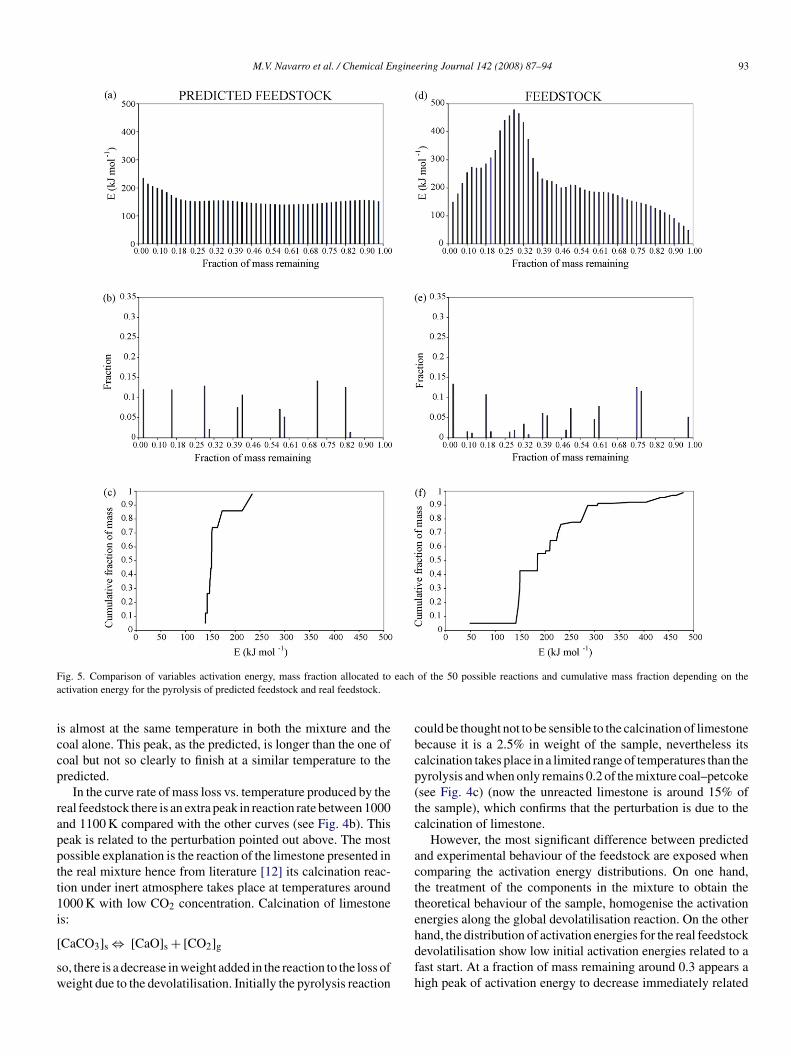
M.V. Navarro et al. / Chemical Engineering Journal 142 (2008) 87–94 93
F eacha
iccp
rapptt1i
[
sw
cbcp(tc
actte
ig. 5. Comparison of variables activation energy, mass fraction allocated toctivation energy for the pyrolysis of predicted feedstock and real feedstock.
s almost at the same temperature in both the mixture and theoal alone. This peak, as the predicted, is longer than the one ofoal but not so clearly to finish at a similar temperature to theredicted.
In the curve rate of mass loss vs. temperature produced by theeal feedstock there is an extra peak in reaction rate between 1000nd 1100 K compared with the other curves (see Fig. 4b). Thiseak is related to the perturbation pointed out above. The mostossible explanation is the reaction of the limestone presented inhe real mixture hence from literature [12] its calcination reac-ion under inert atmosphere takes place at temperatures around000 K with low CO2 concentration. Calcination of limestones:
CaCO3]s ⇔ [CaO]s + [CO2]g
o, there is a decrease in weight added in the reaction to the loss ofeight due to the devolatilisation. Initially the pyrolysis reaction
hdfh
of the 50 possible reactions and cumulative mass fraction depending on the
ould be thought not to be sensible to the calcination of limestoneecause it is a 2.5% in weight of the sample, nevertheless itsalcination takes place in a limited range of temperatures than theyrolysis and when only remains 0.2 of the mixture coal–petcokesee Fig. 4c) (now the unreacted limestone is around 15% ofhe sample), which confirms that the perturbation is due to thealcination of limestone.
However, the most significant difference between predictednd experimental behaviour of the feedstock are exposed whenomparing the activation energy distributions. On one hand,he treatment of the components in the mixture to obtain theheoretical behaviour of the sample, homogenise the activationnergies along the global devolatilisation reaction. On the other
and, the distribution of activation energies for the real feedstockevolatilisation show low initial activation energies related to aast start. At a fraction of mass remaining around 0.3 appears aigh peak of activation energy to decrease immediately related
9 ngine
tpiaaf2
atmttftdpeci
dib
4
aspo
tthmatt
im
betamit
R
[
[11] H. Sutcu, Pyrolysis by thermogravimetric analysis of blends of peat with
4 M.V. Navarro et al. / Chemical E
o the calcination of limestone pointed out above. It is a shorterturbation because the fraction of mass related to this energys small. Finally, there are also differences between the predictednd real ranges of activation energies. While the predicted onesre in a narrow range from 140 to 175 kJ/mol to reach a massraction of 0.8, in the real case, it is a wide range from 50 to50 kJ/mol to reach the same mass fraction.
The devolatilisation of a predicted (from its componentsssuming no interaction between them) and experimental mix-ure has been analysed with a distribution of activation energies
odel. From the comparison of the results, it can be concludedhat exists an influence of the particle size even for sizes smallerhan 0.25 that makes it more reactive at lower temperatures, but,or higher temperatures, the reaction slows down probably dueo heat transmission difficulties, in the sample bed because of theifferent thermodynamic and heat transfer properties of coal andetcoke. It has been also proven that the initially neglected influ-nce of limestone calcination can produce perturbances whenompared to a very different reaction as coal–petcoke devolatil-sation.
The distributed activation energy model can be used to pro-uce a very good approximation to the mixture behaviour fromts main components but there are some deviations from the idealehaviour that are not implemented yet in the model.
. Conclusions
A new algorithm of DAEM developed by Scott et al. has beenpplied to study coal and petcoke devolatilisation. By fitting twoets of data obtained in TGA with different heating rates the mainarameters are calculated and will be used to calculate a new setf data in a different heating rate.
The comparison of experimental and calculated data allowshe use of this model to generate good approximations of theemperature ranges where the reaction will take place at theigh heating rates in gasification or combustion processes. The
odel describes as well the influence of the activation energiesnd fraction of mass allocated to every reaction. Comparinghe results obtained for theses variables for coal (faster reac-ion) to petcoke (slower reaction), the devolatilisation of coal
[
ering Journal 142 (2008) 87–94
s favoured by lower activation energies and higher fractions ofass allocated to these reactions.In addition, the model was implemented to predict the
ehaviour of coal and petcoke blends, generic feedstock innergy generation plants. As a result of the comparison of predic-ions and experimental data, the DAEM can be used to produce
very good approximation to the mixture behaviour from itsain components, but, since trace components are not taken
nto account, there are some deviations from the ideal behaviourhat should be upgraded.
eferences
[1] C. Zhang, X. Jiang, L. Wei, H. Wang, Research on pyrolysis characteris-tics and kinetics of super fine and conventional pulverized coal, EnergyConversion Manag. 48 (2007) 797–802.
[2] H. Watanabe, M. Otaka, Numerical simulation of coal gasification inentrained flow coal gasifier, Fuel 85 (2006) 1935–1943.
[3] A.K. Burnham, R.L. Braun, Global kinetic analysis of complex materials,Energy Fuels 13 (1) (1999) 1–22.
[4] A.K. Burnham, R.L. Braun, H.R. Gregg, A.M. Samoun, Comparison ofmethods for measuring kerogen pyrolysis rates and fitting kinetic parame-ters, Energy Fuels 1 (1987) 452–458.
[5] K. Miura, A new and simple method to estimate f(E) and k0(E) in thedistributed activation energy model from three sets of experimental data,Energy Fuels 9 (1995) 302–307.
[6] T. Maki, A. Takatsuno, K. Miura, Analysis of pyrolysis reactions of variouscoals including argonne premium coals using a new distributed activationenergy model, Energy Fuels 11 (1997) 972–977.
[7] A. Arenillas, F. Rubiera, C. Pevida, J.J. Pis, A comparison of different meth-ods for predicting coal devolatilisation kinetics, J. Analyt. Appl. Pyrolysis58/59 (2001) 685–701.
[8] S.A. Scott, J.S. Dennis, J.F. Davidson, A.N. Hayhurst, An algorithm fordetermining the kinetics of devolatilisation of complex solid fuels fromthermogravimetric experiments, Chem. Eng. Sci. 61 (2006) 2339–2348.
[9] C.P. Please, M.J. McGuinness, D.L.S. McElwain, Approximations to thedistributed activation energy model for the pyrolysis of coal, Combust.Flame 133 (2003) 107–117.
10] D.B. Anthony, J.B. Howard, Coal devolatilization and hydrogasification,AIChE J. 22 (4) (1976) 625–656.
coals of different characteristics and biomass, J. Chin. Inst. Chem. Eng. 38(2007) 245–249.
12] I. Ar, G. Dogu, Calcination kinetics of high purity limestones, Chem. Eng.J. 83 (2001) 131–137.
Related Documents