[Sundaram, 4(3): March, 2015] ISSN: 2277-9655 Scientific Journal Impact Factor: 3.449 (ISRA), Impact Factor: 2.114 http: // www.ijesrt.com © International Journal of Engineering Sciences & Research Technology [695] IJESRT INTERNATIONAL JOURNAL OF ENGINEERING SCIENCES & RESEARCH TECHNOLOGY APPLICATION OF SWARM INTELLIGENCE PSO TECHNIQUE FOR ANALYSIS OF MULTIMEDIA TRAFFIC AND QOS PARAMETERS USING OPTIMIZED LINK STATE ROUTING PROTOCOL Dr. S. Meenakshi Sundaram*, K. Kalyanakrishnan, Dr. A. Ramesh Babu * Professor, Department of C.S.E., Don Bosco Institute of Technology, Bangalore, India Associate Professor, Department of C.S.E., M.A.M. School of Engineering, Tiruchirappalli, India Professor & Head, Dept. of Comp. Applications, Saranathan College of Engineering, Tiruchirappalli, India ABSTRACT Mobile ad hoc network (MANET) nodes include wireless transmitters and receivers. At a given point in time, depending on the positions of the nodes, their transmitter and receiver coverage patterns, communication power levels and co-channel interference levels, a wireless connectivity in the form of a random, multi hop graph or “ad hoc" network exists among the nodes. In this research, it is proposed to modify OLSR using swarm intelligence, Particle Swarm Optimization (PSO), to reduce end to end delay and improve throughput in the network by traffic shaping at the network layer. The PSO algorithm represents each solution as a ‘bird’ in the search space and is referred to as ‘particle’. It uses the objective function to evaluate its candidate solutions, and operates on the resultant fitness values. Candidate solution and its estimated fitness, and velocity give the position of the particle. It also remembers the best fitness value it achieved till then during the algorithm’s operation which is usually referred to as the individual best fitness, and the candidate solution that achieved this fitness, is the individual best position ‘pbest’. The best fitness value attained among all particles in the swarm which is called global best fitness, and the candidate solution that attained this fitness, which is called the global best position or global best candidate solution ‘gbest’. OLSR generates link state information through nodes elected as Multi Point Relays (MPRs). It is proposed to modify OLSR using particle swarm optimization to reduce end to end delay and improve network throughput. KEYWORDS: Mobile Ad hoc Networks (MANETs), Swarm Intelligence, Particle Swarm Optimization (PSO), Multi Point Relay (MPR), Throughput. INTRODUCTION Various studies have been conducted to reduce the control traffic overheads by adapting the existing OLSR routing protocol. Routing performance is improved by traffic shaping based on priority of the data packet. In this research, it is proposed to modify OLSR using swarm intelligence, PSO, to reduce end to end delay and improve throughput in the network by traffic shaping at the network layer. Particle swarm Optimization in short named as PSO which offers a quality solutions converging quickly when compared to other population based optimization algorithms such as GA. PSO is mainly based on the social behavior of birds flocking where the cooperation among entities are efficient in achieving goals. The entities/PSO particles consist of two properties such as position and velocity. Representation of a candidate solution as an objective function is performed on them. Mainly the computation in PSO based on a population and also named as swarm of the processing elements called as particles. Each particle can represent a candidate solution. PSO also shares many similarities with evolutionary computation techniques such as Genetic Algorithm's. By updating the generations, system starts with a population of random solutions and searches for optima. The search process exploits a combination of deterministic and probabilistic rules which depends on the information shared among their population members in order to enhance their search processes. No evolution operators are performed such as crossover and mutation in PSO. Each particle in the search space involves in its candidate solution over time, which makes use of its individual memory and knowledge gained by the swarm. The information sharing mechanism is considerably different in PSO when comparing with GA (Ramadan 2009).

Welcome message from author
This document is posted to help you gain knowledge. Please leave a comment to let me know what you think about it! Share it to your friends and learn new things together.
Transcript
[Sundaram, 4(3): March, 2015] ISSN: 2277-9655
Scientific Journal Impact Factor: 3.449
(ISRA), Impact Factor: 2.114
http: // www.ijesrt.com © International Journal of Engineering Sciences & Research Technology
[695]
IJESRT INTERNATIONAL JOURNAL OF ENGINEERING SCIENCES & RESEARCH
TECHNOLOGY
APPLICATION OF SWARM INTELLIGENCE PSO TECHNIQUE FOR ANALYSIS OF
MULTIMEDIA TRAFFIC AND QOS PARAMETERS USING OPTIMIZED LINK
STATE ROUTING PROTOCOL Dr. S. Meenakshi Sundaram*, K. Kalyanakrishnan, Dr. A. Ramesh Babu
* Professor, Department of C.S.E., Don Bosco Institute of Technology, Bangalore, India
Associate Professor, Department of C.S.E., M.A.M. School of Engineering, Tiruchirappalli, India
Professor & Head, Dept. of Comp. Applications, Saranathan College of Engineering, Tiruchirappalli,
India
ABSTRACT Mobile ad hoc network (MANET) nodes include wireless transmitters and receivers. At a given point in time,
depending on the positions of the nodes, their transmitter and receiver coverage patterns, communication power levels
and co-channel interference levels, a wireless connectivity in the form of a random, multi hop graph or “ad hoc"
network exists among the nodes. In this research, it is proposed to modify OLSR using swarm intelligence, Particle
Swarm Optimization (PSO), to reduce end to end delay and improve throughput in the network by traffic shaping at
the network layer. The PSO algorithm represents each solution as a ‘bird’ in the search space and is referred to as
‘particle’. It uses the objective function to evaluate its candidate solutions, and operates on the resultant fitness values.
Candidate solution and its estimated fitness, and velocity give the position of the particle. It also remembers the best
fitness value it achieved till then during the algorithm’s operation which is usually referred to as the individual best
fitness, and the candidate solution that achieved this fitness, is the individual best position ‘pbest’. The best fitness
value attained among all particles in the swarm which is called global best fitness, and the candidate solution that
attained this fitness, which is called the global best position or global best candidate solution ‘gbest’. OLSR generates
link state information through nodes elected as Multi Point Relays (MPRs). It is proposed to modify OLSR using
particle swarm optimization to reduce end to end delay and improve network throughput.
KEYWORDS: Mobile Ad hoc Networks (MANETs), Swarm Intelligence, Particle Swarm Optimization (PSO), Multi
Point Relay (MPR), Throughput.
INTRODUCTIONVarious studies have been conducted to reduce the
control traffic overheads by adapting the existing
OLSR routing protocol. Routing performance is
improved by traffic shaping based on priority of the
data packet. In this research, it is proposed to modify
OLSR using swarm intelligence, PSO, to reduce end
to end delay and improve throughput in the network
by traffic shaping at the network layer. Particle swarm
Optimization in short named as PSO which offers a
quality solutions converging quickly when compared
to other population based optimization algorithms
such as GA. PSO is mainly based on the social
behavior of birds flocking where the cooperation
among entities are efficient in achieving goals. The
entities/PSO particles consist of two properties such as
position and velocity. Representation of a candidate
solution as an objective function is performed on them.
Mainly the computation in PSO based on a population
and also named as swarm of the processing elements
called as particles. Each particle can represent a
candidate solution. PSO also shares many similarities
with evolutionary computation techniques such as
Genetic Algorithm's. By updating the generations,
system starts with a population of random solutions
and searches for optima. The search process exploits a
combination of deterministic and probabilistic rules
which depends on the information shared among their
population members in order to enhance their search
processes. No evolution operators are performed such
as crossover and mutation in PSO. Each particle in the
search space involves in its candidate solution over
time, which makes use of its individual memory and
knowledge gained by the swarm. The information
sharing mechanism is considerably different in PSO
when comparing with GA (Ramadan 2009).
[Sundaram, 4(3): March, 2015] ISSN: 2277-9655
Scientific Journal Impact Factor: 3.449
(ISRA), Impact Factor: 2.114
http: // www.ijesrt.com © International Journal of Engineering Sciences & Research Technology
[696]
Particle Swarm Optimization (Gharghory 2011) is
another derivative-free and flexible optimizer
replicating bird flocking. PSO algorithm is promising
for various optimization problems. It is effortless and
easy to realize when compared to other computation
intelligence techniques. It received attention from the
field of evolution and is a research hot spot. Though
PSO has high convergence speed, literature reveals
that PSO finds it difficult to jump out of local optima,
if it falls into minima. In literature, many approaches
were introduced to improve PSO performance, by
merging it with other evolutionary computation
techniques. Hybrid PSO, (HPSO) technique merged a
mutation operator and natural selection to solve
premature convergence. By introducing roulette wheel
selection based Cauchy mutation and evolutionary
selection, HPSO greatly reduced probability of being
trapped in local optimum.
METHODOLOGY Particle Swarm Optimization (PSO)
PSO is a searching method and was developed in 1995
based on the sociological behavior of bird flocking.
The algorithm based on PSO is trouble-free for
implementation and it is successfully applied for
solving a wide range of optimization problems in
many application fields (Zhang 2012). PSO is a
technique for maximizing objectives to find
parameters by exploring the search space of given
problem. This technique, originated from swarm
intelligence and evolutionary computation. The swarm
intelligence based on the observation of swarming
habits of birds and fishes, and the evolutionary
computation to find a local or global maximum.
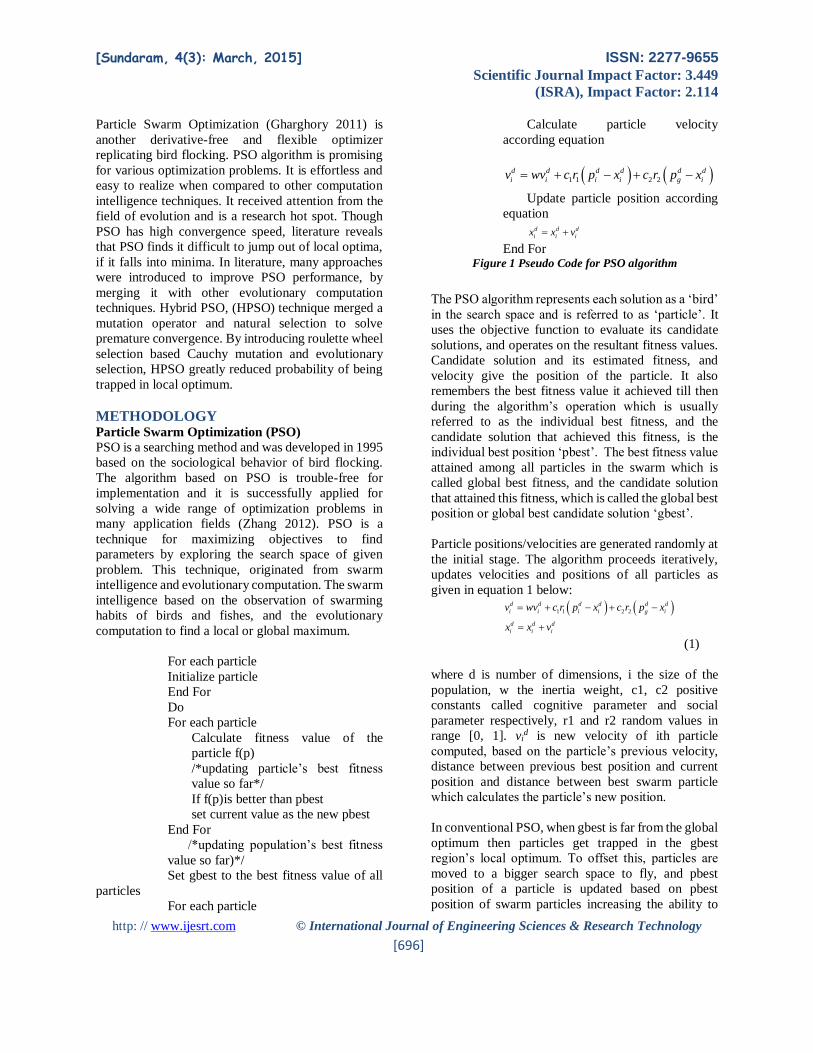
For each particle
Initialize particle
End For
Do
For each particle
Calculate fitness value of the
particle f(p)
/*updating particle’s best fitness
value so far*/
If f(p)is better than pbest
set current value as the new pbest
End For
/*updating population’s best fitness
value so far)*/
Set gbest to the best fitness value of all
particles
For each particle
Calculate particle velocity
according equation
Update particle position according
equation
End For
Figure 1 Pseudo Code for PSO algorithm
The PSO algorithm represents each solution as a ‘bird’
in the search space and is referred to as ‘particle’. It
uses the objective function to evaluate its candidate
solutions, and operates on the resultant fitness values.
Candidate solution and its estimated fitness, and
velocity give the position of the particle. It also
remembers the best fitness value it achieved till then
during the algorithm’s operation which is usually
referred to as the individual best fitness, and the
candidate solution that achieved this fitness, is the
individual best position ‘pbest’. The best fitness value
attained among all particles in the swarm which is
called global best fitness, and the candidate solution
that attained this fitness, which is called the global best
position or global best candidate solution ‘gbest’.
Particle positions/velocities are generated randomly at
the initial stage. The algorithm proceeds iteratively,
updates velocities and positions of all particles as
given in equation 1 below:
1 1 2 2
d d d d d d
i i i i g i
d d d
i i i
v wv c r p x c r p x
x x v
(1)
where d is number of dimensions, i the size of the
population, w the inertia weight, c1, c2 positive
constants called cognitive parameter and social
parameter respectively, r1 and r2 random values in
range [0, 1]. vid is new velocity of ith particle
computed, based on the particle’s previous velocity,
distance between previous best position and current
position and distance between best swarm particle
which calculates the particle’s new position.
In conventional PSO, when gbest is far from the global
optimum then particles get trapped in the gbest
region’s local optimum. To offset this, particles are
moved to a bigger search space to fly, and pbest
position of a particle is updated based on pbest
position of swarm particles increasing the ability to
1 1 2 2
d d d d d d
i i i i g i
d d d
i i i
v wv c r p x c r p x
x x v
1 1 2 2
d d d d d d
i i i i g i
d d d
i i i
v wv c r p x c r p x
x x v
[Sundaram, 4(3): March, 2015] ISSN: 2277-9655
Scientific Journal Impact Factor: 3.449
(ISRA), Impact Factor: 2.114
http: // www.ijesrt.com © International Journal of Engineering Sciences & Research Technology
[697]
avoid local optimum and improve swarm diversity.
The particle’s updating velocity is given in Equation
(2) below:
* * * d d d d d
i i i ifi dV w v c rand pbest x
(2)
where 1 , 2 ,..., i i i if f f f d refers to pbest that
particle i is used and is the dimension of particles
pbests. Two particles are randomly selected, and the
particle whose velocity is updated is excluded. The
particles pbests fitness values are compared, and the
dimension of the better one is chosen to update
velocity (Agarwal 2005). At each of iteration of PSO,
the behavior of a given particle is gets compromised
between three possible choices as follows:
Following its own way
Going towards its best previous
position
Going towards the best neighbour
The objective function establishes particles fitness
value with every iteration along with a position as
input. Entity velocities are dynamically adjusted
because they flit through the search space. A particle
is represented as best position and is computed with
the use of own information (pbest) and that of a
global best position (gbest) are searched by the
swarm. The particles modify the velocity
consequently and disembark at its new position
(Tamizhselvi 2013).
Parameters of PSO
For Particle Swarm Optimization, some parameters
are used as follows:
1. Population size
2. Number of generation cycles
3. The max. change of a particle
velocity and
4. Current position
The methods used in PSO are positions
and velocity, velocity update, and position update
(Garg 2012).
PSO computation based on swarm intelligence
In case of traffic sign recognition, the PSO mechanism
is implemented which is a simulation of the behavior
of living as a group. The individuals in the population
will adjust themselves in two different ways,
To give the best position for the
group and
To give themselves the best
position among members of the
group.
Mathematically the PSO method can be represented as
follows. The swarm size of the PSO is symbolized as
“s”. Each particle consists of the following attributes:
A current position xi in the search
space,
A current velocity νi and
A personal best position pi in the
search space.
During each of iteration, every particle in the swarm
can be updated by using Equations (3) and (4) which
are given below.
1 1 1 2 2( ) ( )i i i i g iv v c r p x c r p x
(3)
Each particle is capable to change its position based on
the updated velocity according to the following
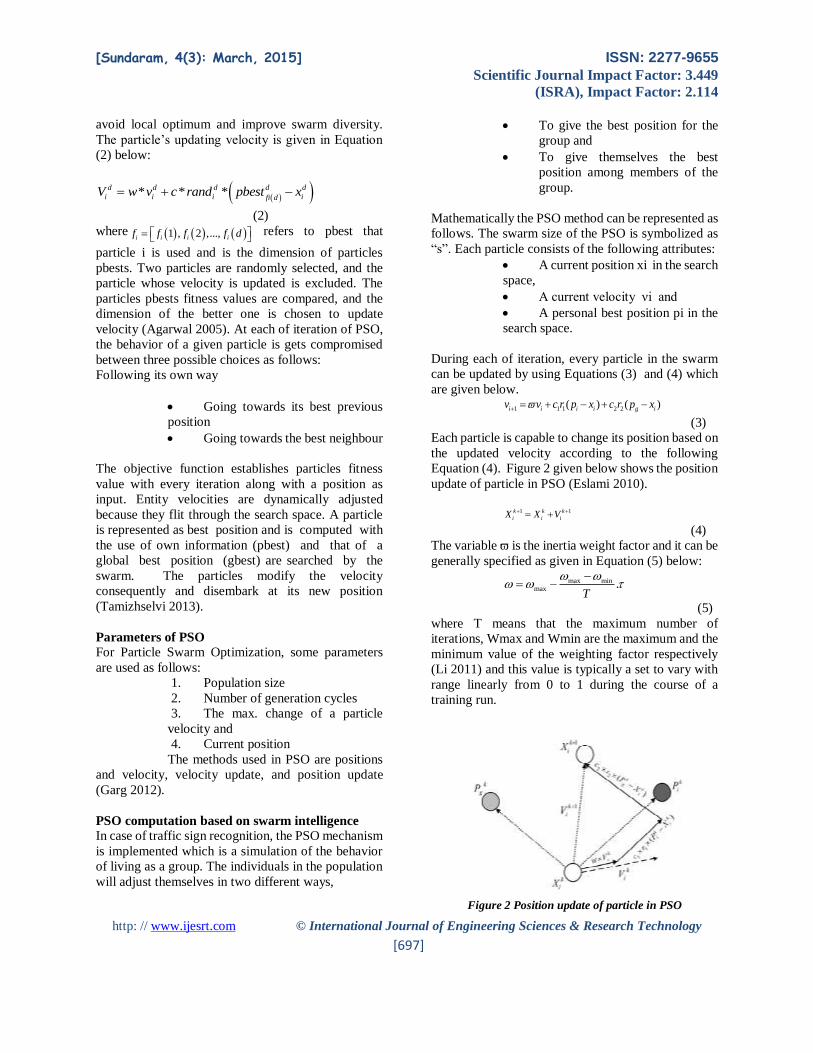
Equation (4). Figure 2 given below shows the position
update of particle in PSO (Eslami 2010).
1 1k k k
i i iX X V (4)
The variable ϖ is the inertia weight factor and it can be
generally specified as given in Equation (5) below:
max minmax .
T
(5)
where T means that the maximum number of
iterations, Wmax and Wmin are the maximum and the
minimum value of the weighting factor respectively
(Li 2011) and this value is typically a set to vary with
range linearly from 0 to 1 during the course of a
training run.
Figure 2 Position update of particle in PSO
[Sundaram, 4(3): March, 2015] ISSN: 2277-9655
Scientific Journal Impact Factor: 3.449
(ISRA), Impact Factor: 2.114
http: // www.ijesrt.com © International Journal of Engineering Sciences & Research Technology
[698]
The variables c1 and c2 are the acceleration
coefficients, which control how far a particle is moved
in a single iteration. The variables r1 and r2 are two
random numbers in the range of (0, 1). The variable pg
is the global best position which can be found by all
particles. The velocity νi of each particle can be
clamped to the range of [νmax, νmax] for reducing the
likelihood of particles leaving the search space
(Surinwarangkoon et al 2012).
Fitness function
A novel fitness function proposed is given below in
equation 6:
2
22
2( )
2
2
( )
gm
in
m ing
Jin m sm
in mg
in
J t
JJe e ds
J
F tPDR
(6)
where PDR is the Packet Delivery Ratio,
mJis the max_jitter,
in is the input_package,
g is the Generated_package_in_node,
out in g ,
[0, ]mt J
Properties of PSO
The properties of PSO are given below:
Determination of a single particle
is done to ensure “how good" is
its current position. It restores
from its problem space, the
exploration knowledge and the
knowledge obtained by sharing
with the other available particles.
A stochastic factor in each
particle's velocity makes PSO to
move through the region of
unknown problem space. By
combining this property with a
good initial distribution of the
swarm that enables an extensive
exploration of the problem space
and gives a very high chance to
find the best solutions efficiently.
The standard particle swarm optimization algorithms
perform well in case of static environments. Also, it is
specified that the original PSO is unable to handle the
dynamic environments. Hence the researchers started
to introduce a new variation of PSO to overcome its
inefficiency. Some of them are compound particle
swarm optimization, cellular PSO, etc., (Parvin 2011).
The PSO algorithm includes three steps that are
reiterated until some stopping criteria is met (Kennedy
& Eberhart 1995):
1. Fitness of each particle is
evaluated.
2. Individual and global best fitness
and positions are updated
3. Velocity and position of each
particle is updated.
If a directed graph G = (V, E) defines a communication
graph, where V is a set of n nodes and E set of m edges.
Each edge has the parameters of link quality, jitter and
packet dropped. These functions can be formulated for
a path as follows:
quality 1,....,
1,....,
_ 1,....,
i
i
i
link p L i k
jitter p J i k
Packet dropped p PD i k
Advantages of PSO
PSO has some advantages over
other similar optimization
techniques are as follows:
PSO is easier for implementation
and fewer parameters are
available to adjust.
In PSO, every particle remembers
its own previous best value as
well as the neighbourhood best
hence it has a more effective
memory capability.
PSO is more efficient in
maintaining the diversity of the
swarm since all the particles use
the information which is related to
the most successful particle in
order to improve them (Elseuofi
2012).
[Sundaram, 4(3): March, 2015] ISSN: 2277-9655
Scientific Journal Impact Factor: 3.449
(ISRA), Impact Factor: 2.114
http: // www.ijesrt.com © International Journal of Engineering Sciences & Research Technology
[699]
Disadvantages of PSO
PSO easily suffers from the
partial optimism, which may
cause the less exact at the
regulation on its speed and the
direction.
PSO unable to work out the
problems which are caused by the
scattering and optimization.
PSO is unable to work out the problems of non-
coordinate system, such as the solution to the energy
field and the moving rules of the particles in the energy
field (Bai 2010).
SIMULATION STUDY AND RESULTS The simulation is carried out using OPNET Simulator
Ver. 14.0 includes 20 nodes spread over 2000 meter
by 2000 meter with each node’s trajectory being at
random. Each node runs a multimedia application over
UDP. The data rate of each node is 11 Mbps with a
transmit power of 0.005 watts. The simulations are run
for 400 sec. The performance of the network is
evaluated based on the PDR, end to end delay, jitter
and number of TC packets for PSO and compared
with gravitational search and local search.
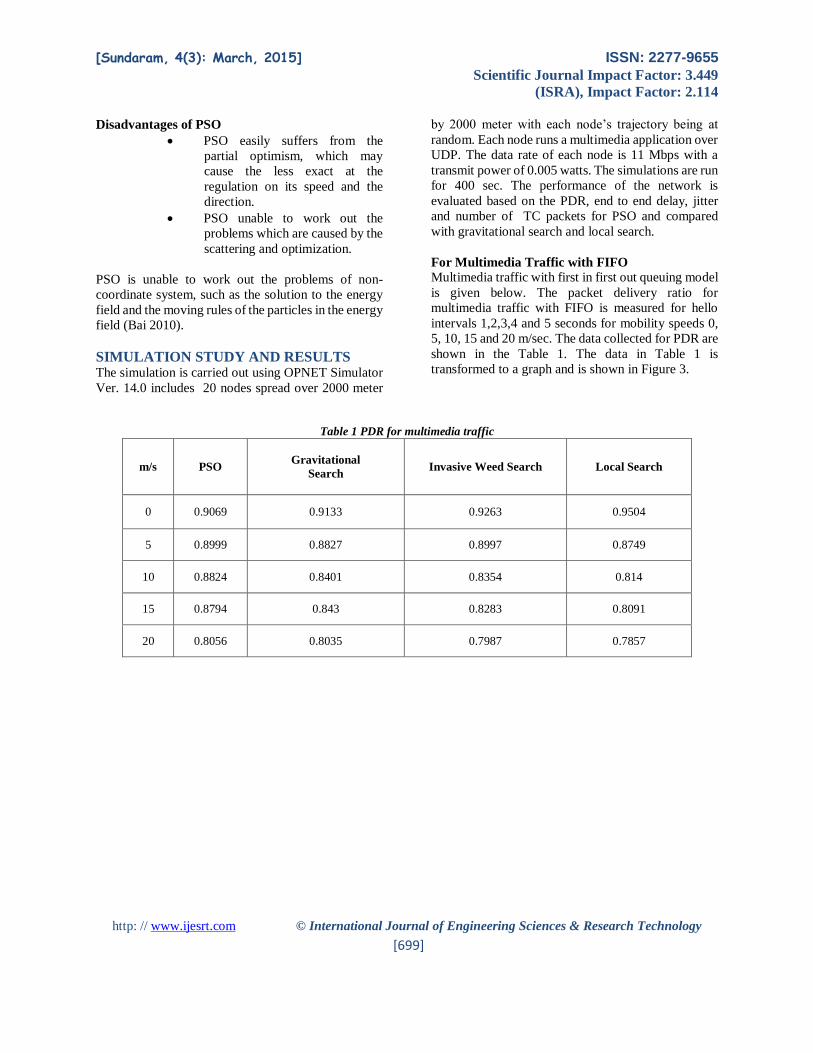
For Multimedia Traffic with FIFO
Multimedia traffic with first in first out queuing model
is given below. The packet delivery ratio for
multimedia traffic with FIFO is measured for hello
intervals 1,2,3,4 and 5 seconds for mobility speeds 0,
5, 10, 15 and 20 m/sec. The data collected for PDR are
shown in the Table 1. The data in Table 1 is
transformed to a graph and is shown in Figure 3.
Table 1 PDR for multimedia traffic
m/s PSO Gravitational
Search Invasive Weed Search Local Search
0 0.9069 0.9133 0.9263 0.9504
5 0.8999 0.8827 0.8997 0.8749
10 0.8824 0.8401 0.8354 0.814
15 0.8794 0.843 0.8283 0.8091
20 0.8056 0.8035 0.7987 0.7857
[Sundaram, 4(3): March, 2015] ISSN: 2277-9655
Scientific Journal Impact Factor: 3.449
(ISRA), Impact Factor: 2.114
http: // www.ijesrt.com © International Journal of Engineering Sciences & Research Technology
[700]
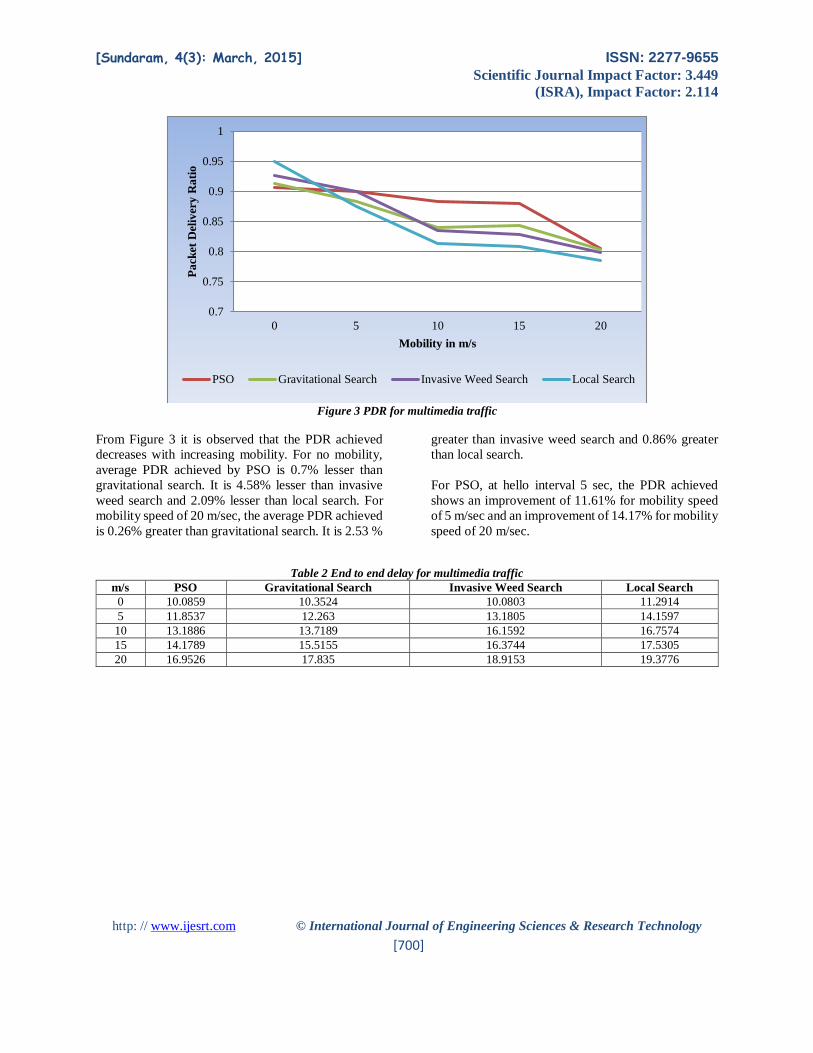
Figure 3 PDR for multimedia traffic
From Figure 3 it is observed that the PDR achieved
decreases with increasing mobility. For no mobility,
average PDR achieved by PSO is 0.7% lesser than
gravitational search. It is 4.58% lesser than invasive
weed search and 2.09% lesser than local search. For
mobility speed of 20 m/sec, the average PDR achieved
is 0.26% greater than gravitational search. It is 2.53 %
greater than invasive weed search and 0.86% greater
than local search.
For PSO, at hello interval 5 sec, the PDR achieved
shows an improvement of 11.61% for mobility speed
of 5 m/sec and an improvement of 14.17% for mobility
speed of 20 m/sec.
Table 2 End to end delay for multimedia traffic
m/s PSO Gravitational Search Invasive Weed Search Local Search
0 10.0859 10.3524 10.0803 11.2914
5 11.8537 12.263 13.1805 14.1597
10 13.1886 13.7189 16.1592 16.7574
15 14.1789 15.5155 16.3744 17.5305
20 16.9526 17.835 18.9153 19.3776
0.7
0.75
0.8
0.85
0.9
0.95
1
0 5 10 15 20
Pa
cket
Del
iver
y R
ati
o
Mobility in m/s
PSO Gravitational Search Invasive Weed Search Local Search
[Sundaram, 4(3): March, 2015] ISSN: 2277-9655
Scientific Journal Impact Factor: 3.449
(ISRA), Impact Factor: 2.114
http: // www.ijesrt.com © International Journal of Engineering Sciences & Research Technology
[701]
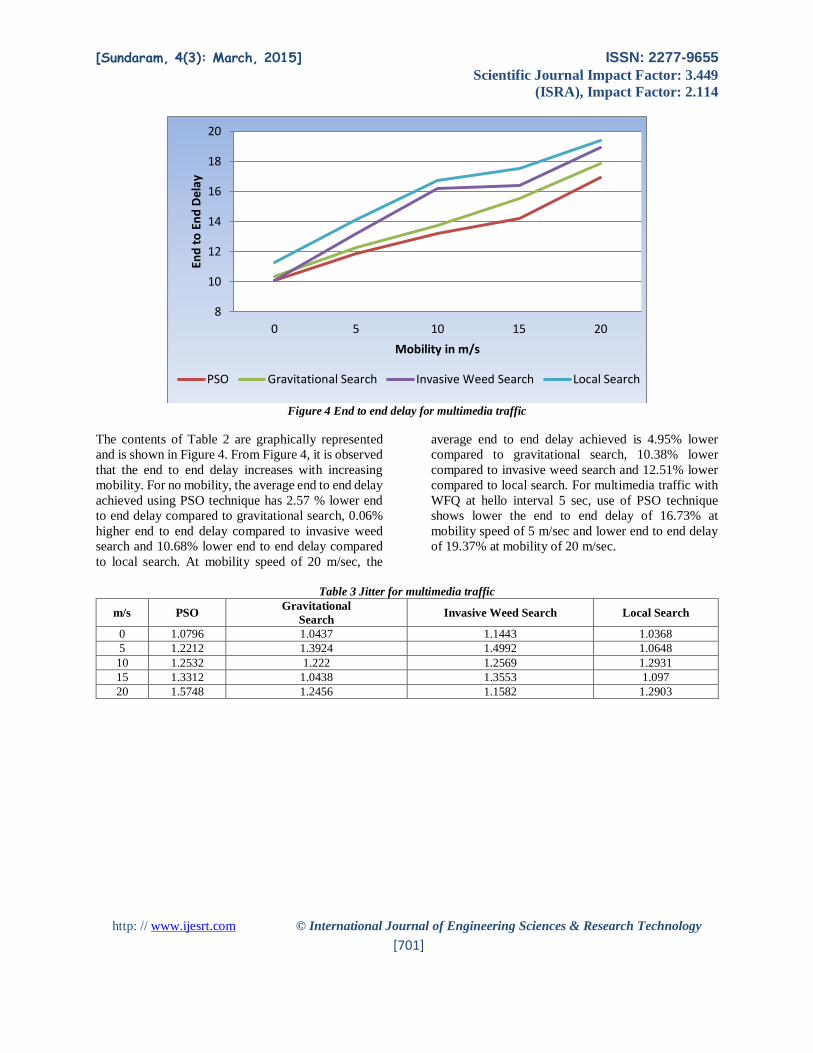
Figure 4 End to end delay for multimedia traffic
The contents of Table 2 are graphically represented
and is shown in Figure 4. From Figure 4, it is observed
that the end to end delay increases with increasing
mobility. For no mobility, the average end to end delay
achieved using PSO technique has 2.57 % lower end
to end delay compared to gravitational search, 0.06%
higher end to end delay compared to invasive weed
search and 10.68% lower end to end delay compared
to local search. At mobility speed of 20 m/sec, the
average end to end delay achieved is 4.95% lower
compared to gravitational search, 10.38% lower
compared to invasive weed search and 12.51% lower
compared to local search. For multimedia traffic with
WFQ at hello interval 5 sec, use of PSO technique
shows lower the end to end delay of 16.73% at
mobility speed of 5 m/sec and lower end to end delay
of 19.37% at mobility of 20 m/sec.
Table 3 Jitter for multimedia traffic
m/s PSO Gravitational
Search Invasive Weed Search Local Search
0 1.0796 1.0437 1.1443 1.0368
5 1.2212 1.3924 1.4992 1.0648
10 1.2532 1.222 1.2569 1.2931
15 1.3312 1.0438 1.3553 1.097
20 1.5748 1.2456 1.1582 1.2903
8
10
12
14
16
18
20
0 5 10 15 20
End
to
En
d D
elay
Mobility in m/s
PSO Gravitational Search Invasive Weed Search Local Search
[Sundaram, 4(3): March, 2015] ISSN: 2277-9655
Scientific Journal Impact Factor: 3.449
(ISRA), Impact Factor: 2.114
http: // www.ijesrt.com © International Journal of Engineering Sciences & Research Technology
[702]
Figure 5 Jitter for multimedia traffic
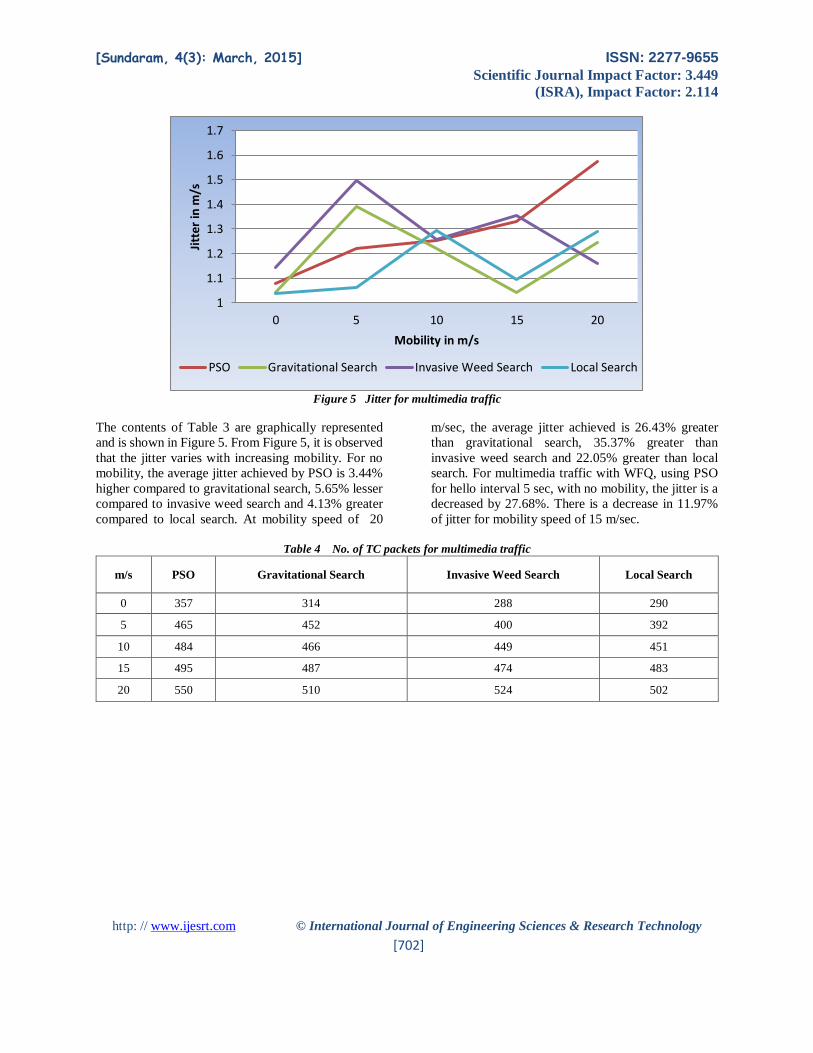
The contents of Table 3 are graphically represented
and is shown in Figure 5. From Figure 5, it is observed
that the jitter varies with increasing mobility. For no
mobility, the average jitter achieved by PSO is 3.44%
higher compared to gravitational search, 5.65% lesser
compared to invasive weed search and 4.13% greater
compared to local search. At mobility speed of 20
m/sec, the average jitter achieved is 26.43% greater
than gravitational search, 35.37% greater than
invasive weed search and 22.05% greater than local
search. For multimedia traffic with WFQ, using PSO
for hello interval 5 sec, with no mobility, the jitter is a
decreased by 27.68%. There is a decrease in 11.97%
of jitter for mobility speed of 15 m/sec.
Table 4 No. of TC packets for multimedia traffic
m/s PSO Gravitational Search Invasive Weed Search Local Search
0 357 314 288 290
5 465 452 400 392
10 484 466 449 451
15 495 487 474 483
20 550 510 524 502
1
1.1
1.2
1.3
1.4
1.5
1.6
1.7
0 5 10 15 20
Jitt
er in
m/s
Mobility in m/s
PSO Gravitational Search Invasive Weed Search Local Search
[Sundaram, 4(3): March, 2015] ISSN: 2277-9655
Scientific Journal Impact Factor: 3.449
(ISRA), Impact Factor: 2.114
http: // www.ijesrt.com © International Journal of Engineering Sciences & Research Technology
[703]
Figure 6 No. of TC packets for multimedia traffic
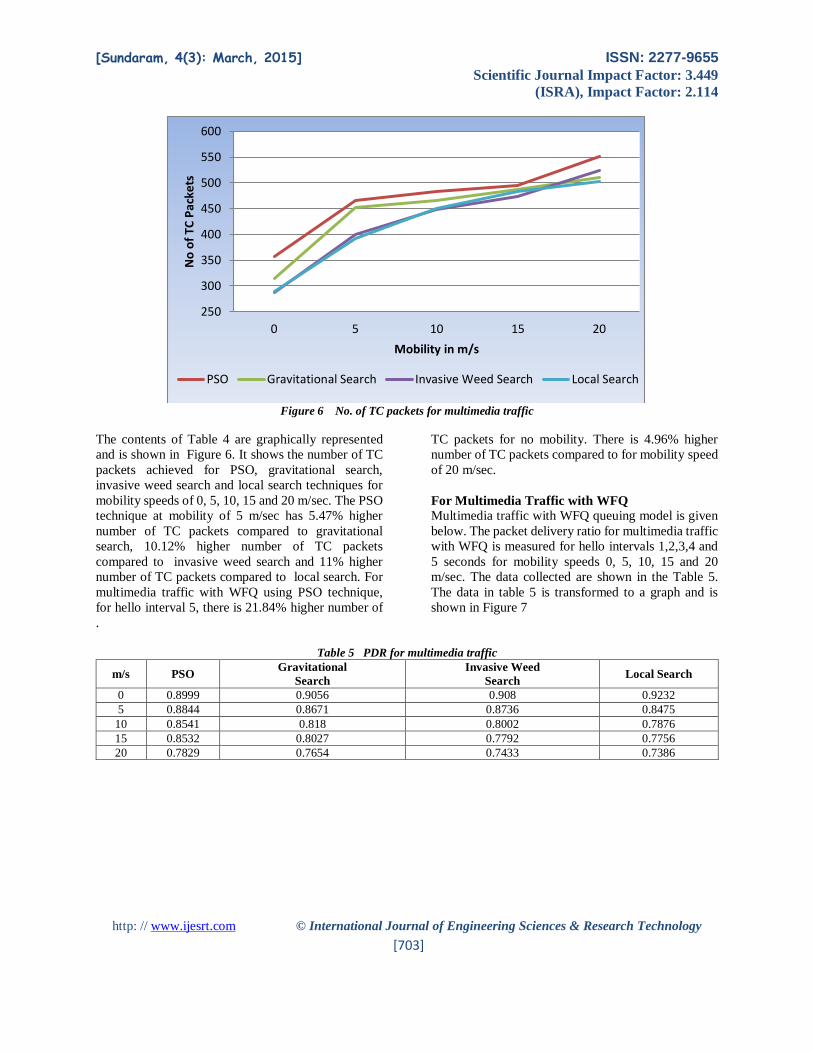
The contents of Table 4 are graphically represented
and is shown in Figure 6. It shows the number of TC
packets achieved for PSO, gravitational search,
invasive weed search and local search techniques for
mobility speeds of 0, 5, 10, 15 and 20 m/sec. The PSO
technique at mobility of 5 m/sec has 5.47% higher
number of TC packets compared to gravitational
search, 10.12% higher number of TC packets
compared to invasive weed search and 11% higher
number of TC packets compared to local search. For
multimedia traffic with WFQ using PSO technique,
for hello interval 5, there is 21.84% higher number of
TC packets for no mobility. There is 4.96% higher
number of TC packets compared to for mobility speed
of 20 m/sec.
For Multimedia Traffic with WFQ
Multimedia traffic with WFQ queuing model is given
below. The packet delivery ratio for multimedia traffic
with WFQ is measured for hello intervals 1,2,3,4 and
5 seconds for mobility speeds 0, 5, 10, 15 and 20
m/sec. The data collected are shown in the Table 5.
The data in table 5 is transformed to a graph and is
shown in Figure 7
.
Table 5 PDR for multimedia traffic
m/s PSO Gravitational
Search
Invasive Weed
Search Local Search
0 0.8999 0.9056 0.908 0.9232
5 0.8844 0.8671 0.8736 0.8475
10 0.8541 0.818 0.8002 0.7876
15 0.8532 0.8027 0.7792 0.7756
20 0.7829 0.7654 0.7433 0.7386
250
300
350
400
450
500
550
600
0 5 10 15 20
No
of
TC P
acke
ts
Mobility in m/s
PSO Gravitational Search Invasive Weed Search Local Search
[Sundaram, 4(3): March, 2015] ISSN: 2277-9655
Scientific Journal Impact Factor: 3.449
(ISRA), Impact Factor: 2.114
http: // www.ijesrt.com © International Journal of Engineering Sciences & Research Technology
[704]
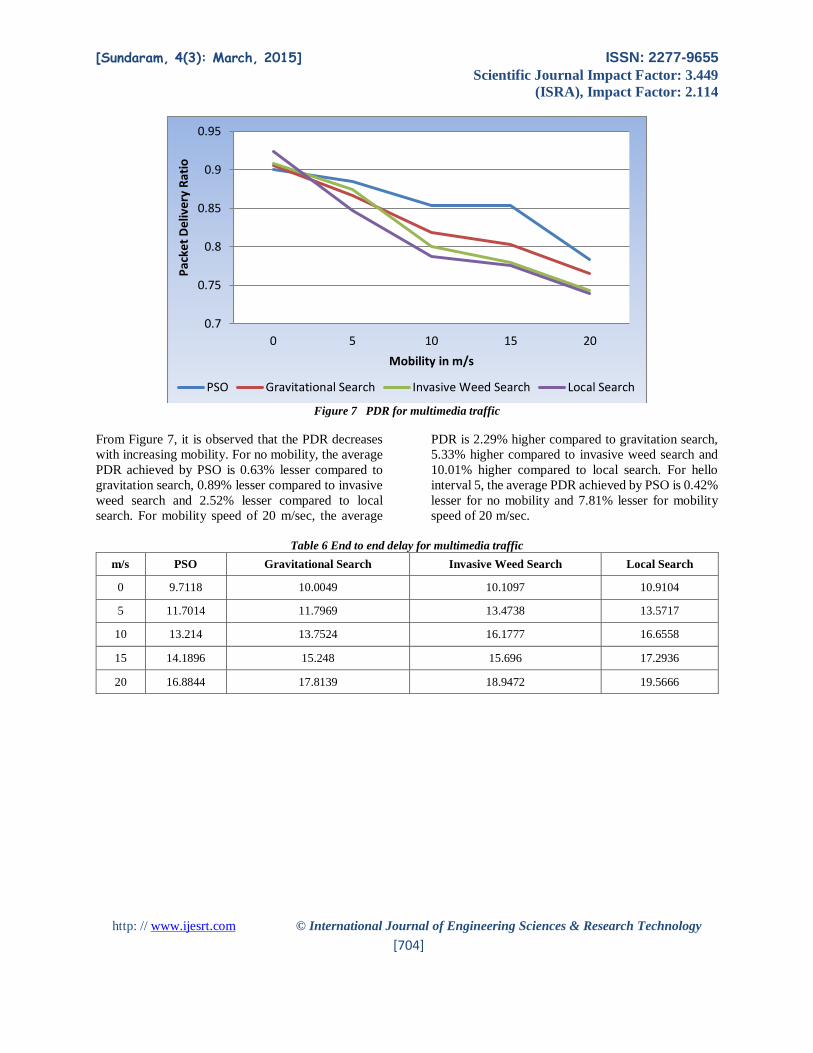
Figure 7 PDR for multimedia traffic
From Figure 7, it is observed that the PDR decreases
with increasing mobility. For no mobility, the average
PDR achieved by PSO is 0.63% lesser compared to
gravitation search, 0.89% lesser compared to invasive
weed search and 2.52% lesser compared to local
search. For mobility speed of 20 m/sec, the average
PDR is 2.29% higher compared to gravitation search,
5.33% higher compared to invasive weed search and
10.01% higher compared to local search. For hello
interval 5, the average PDR achieved by PSO is 0.42%
lesser for no mobility and 7.81% lesser for mobility
speed of 20 m/sec.
Table 6 End to end delay for multimedia traffic
m/s PSO Gravitational Search Invasive Weed Search Local Search
0 9.7118 10.0049 10.1097 10.9104
5 11.7014 11.7969 13.4738 13.5717
10 13.214 13.7524 16.1777 16.6558
15 14.1896 15.248 15.696 17.2936
20 16.8844 17.8139 18.9472 19.5666
0.7
0.75
0.8
0.85
0.9
0.95
0 5 10 15 20
Pac
ket
Del
iver
y R
atio
Mobility in m/s
PSO Gravitational Search Invasive Weed Search Local Search
[Sundaram, 4(3): March, 2015] ISSN: 2277-9655
Scientific Journal Impact Factor: 3.449
(ISRA), Impact Factor: 2.114
http: // www.ijesrt.com © International Journal of Engineering Sciences & Research Technology
[705]
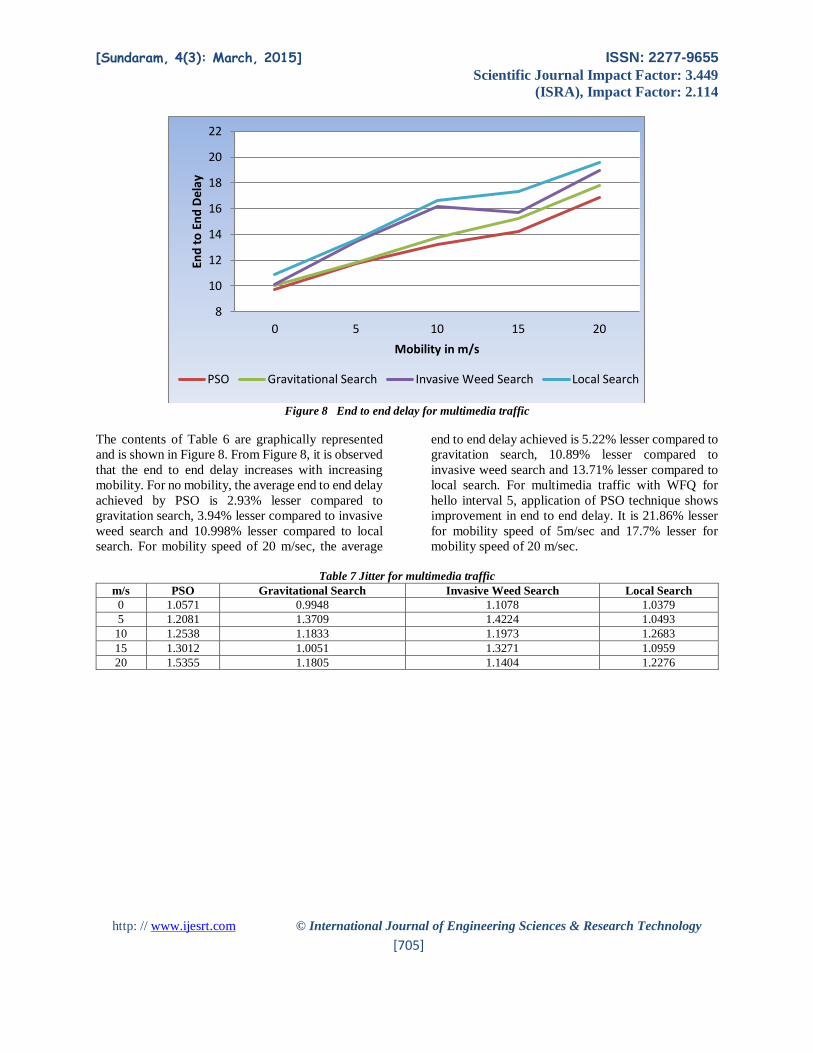
Figure 8 End to end delay for multimedia traffic
The contents of Table 6 are graphically represented
and is shown in Figure 8. From Figure 8, it is observed
that the end to end delay increases with increasing
mobility. For no mobility, the average end to end delay
achieved by PSO is 2.93% lesser compared to
gravitation search, 3.94% lesser compared to invasive
weed search and 10.998% lesser compared to local
search. For mobility speed of 20 m/sec, the average
end to end delay achieved is 5.22% lesser compared to
gravitation search, 10.89% lesser compared to
invasive weed search and 13.71% lesser compared to
local search. For multimedia traffic with WFQ for
hello interval 5, application of PSO technique shows
improvement in end to end delay. It is 21.86% lesser
for mobility speed of 5m/sec and 17.7% lesser for
mobility speed of 20 m/sec.
Table 7 Jitter for multimedia traffic
m/s PSO Gravitational Search Invasive Weed Search Local Search
0 1.0571 0.9948 1.1078 1.0379
5 1.2081 1.3709 1.4224 1.0493
10 1.2538 1.1833 1.1973 1.2683
15 1.3012 1.0051 1.3271 1.0959
20 1.5355 1.1805 1.1404 1.2276
8
10
12
14
16
18
20
22
0 5 10 15 20
End
to
En
d D
elay
Mobility in m/s
PSO Gravitational Search Invasive Weed Search Local Search
[Sundaram, 4(3): March, 2015] ISSN: 2277-9655
Scientific Journal Impact Factor: 3.449
(ISRA), Impact Factor: 2.114
http: // www.ijesrt.com © International Journal of Engineering Sciences & Research Technology
[706]
Figure 9 Jitter for multimedia traffic
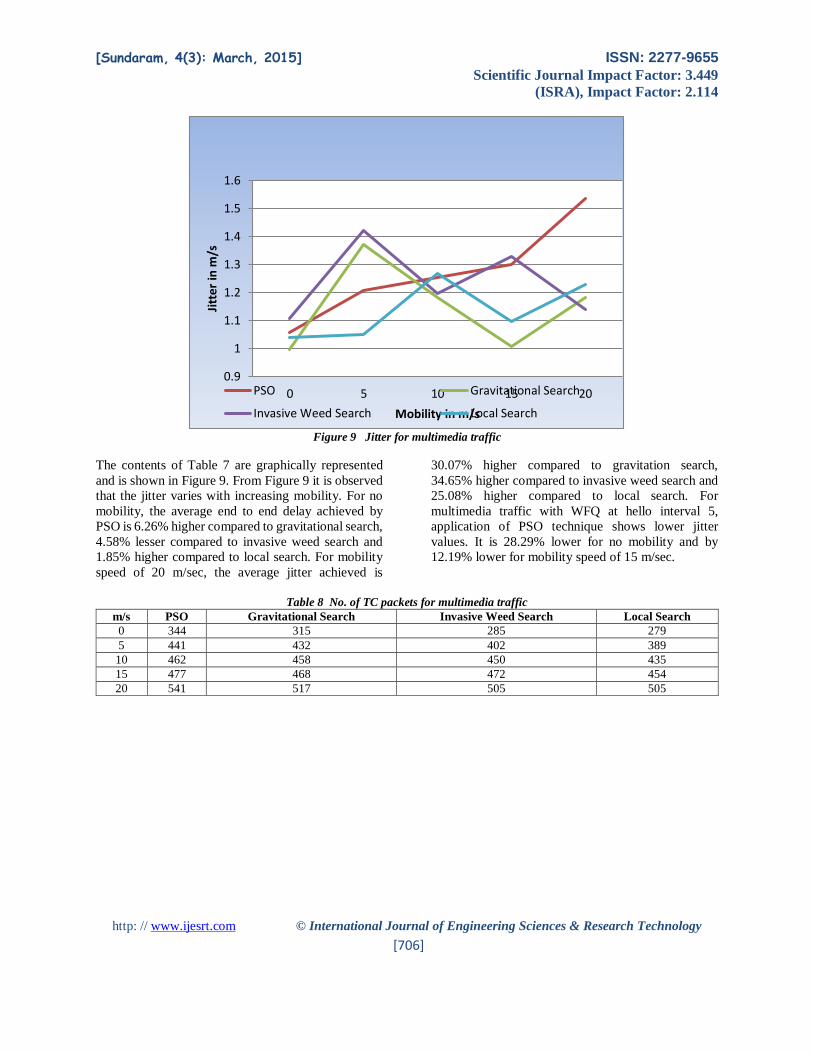
The contents of Table 7 are graphically represented
and is shown in Figure 9. From Figure 9 it is observed
that the jitter varies with increasing mobility. For no
mobility, the average end to end delay achieved by
PSO is 6.26% higher compared to gravitational search,
4.58% lesser compared to invasive weed search and
1.85% higher compared to local search. For mobility
speed of 20 m/sec, the average jitter achieved is
30.07% higher compared to gravitation search,
34.65% higher compared to invasive weed search and
25.08% higher compared to local search. For
multimedia traffic with WFQ at hello interval 5,
application of PSO technique shows lower jitter
values. It is 28.29% lower for no mobility and by
12.19% lower for mobility speed of 15 m/sec.
Table 8 No. of TC packets for multimedia traffic
m/s PSO Gravitational Search Invasive Weed Search Local Search
0 344 315 285 279
5 441 432 402 389
10 462 458 450 435
15 477 468 472 454
20 541 517 505 505
0.9
1
1.1
1.2
1.3
1.4
1.5
1.6
0 5 10 15 20
Jitt
er in
m/s
Mobility in m/s
PSO Gravitational Search
Invasive Weed Search Local Search
[Sundaram, 4(3): March, 2015] ISSN: 2277-9655
Scientific Journal Impact Factor: 3.449
(ISRA), Impact Factor: 2.114
http: // www.ijesrt.com © International Journal of Engineering Sciences & Research Technology
[707]
Figure 10 No. of TC packets for multimedia traffic
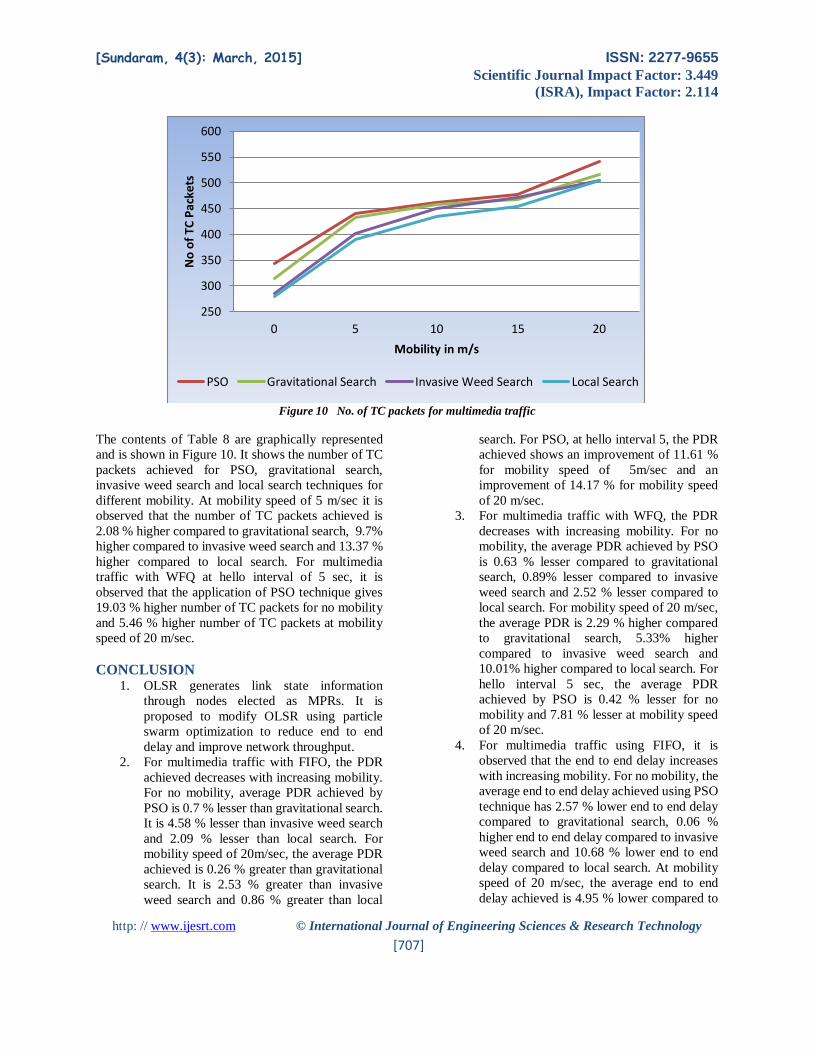
The contents of Table 8 are graphically represented
and is shown in Figure 10. It shows the number of TC
packets achieved for PSO, gravitational search,
invasive weed search and local search techniques for
different mobility. At mobility speed of 5 m/sec it is
observed that the number of TC packets achieved is
2.08 % higher compared to gravitational search, 9.7%
higher compared to invasive weed search and 13.37 %
higher compared to local search. For multimedia
traffic with WFQ at hello interval of 5 sec, it is
observed that the application of PSO technique gives
19.03 % higher number of TC packets for no mobility
and 5.46 % higher number of TC packets at mobility
speed of 20 m/sec.
CONCLUSION 1. OLSR generates link state information
through nodes elected as MPRs. It is
proposed to modify OLSR using particle
swarm optimization to reduce end to end
delay and improve network throughput.
2. For multimedia traffic with FIFO, the PDR
achieved decreases with increasing mobility.
For no mobility, average PDR achieved by
PSO is 0.7 % lesser than gravitational search.
It is 4.58 % lesser than invasive weed search
and 2.09 % lesser than local search. For
mobility speed of 20m/sec, the average PDR
achieved is 0.26 % greater than gravitational
search. It is 2.53 % greater than invasive
weed search and 0.86 % greater than local
search. For PSO, at hello interval 5, the PDR
achieved shows an improvement of 11.61 %
for mobility speed of 5m/sec and an
improvement of 14.17 % for mobility speed
of 20 m/sec.
3. For multimedia traffic with WFQ, the PDR
decreases with increasing mobility. For no
mobility, the average PDR achieved by PSO
is 0.63 % lesser compared to gravitational
search, 0.89% lesser compared to invasive
weed search and 2.52 % lesser compared to
local search. For mobility speed of 20 m/sec,
the average PDR is 2.29 % higher compared
to gravitational search, 5.33% higher
compared to invasive weed search and
10.01% higher compared to local search. For
hello interval 5 sec, the average PDR
achieved by PSO is 0.42 % lesser for no
mobility and 7.81 % lesser at mobility speed
of 20 m/sec.
4. For multimedia traffic using FIFO, it is
observed that the end to end delay increases
with increasing mobility. For no mobility, the
average end to end delay achieved using PSO
technique has 2.57 % lower end to end delay
compared to gravitational search, 0.06 %
higher end to end delay compared to invasive
weed search and 10.68 % lower end to end
delay compared to local search. At mobility
speed of 20 m/sec, the average end to end
delay achieved is 4.95 % lower compared to
250
300
350
400
450
500
550
600
0 5 10 15 20
No
of
TC P
acke
ts
Mobility in m/s
PSO Gravitational Search Invasive Weed Search Local Search
[Sundaram, 4(3): March, 2015] ISSN: 2277-9655
Scientific Journal Impact Factor: 3.449
(ISRA), Impact Factor: 2.114
http: // www.ijesrt.com © International Journal of Engineering Sciences & Research Technology
[708]
gravitational search, 10.38 % lower
compared to invasive weed search and 12.51
% lower compared to local search. For
multimedia traffic with WFQ at hello interval
5, use of PSO technique shows lower the end
to end delay of 16.73 % at mobility speed of
5 m/sec and lower end to end delay of 19.37
% at mobility of 20 m/sec.
5. For multimedia traffic using WFQ the end to
end delay increases with increasing mobility.
For no mobility, the average end to end delay
achieved by PSO 2.93 % lesser compared to
gravitation search, 3.94 % lesser compared to
invasive weed search and 10.998 % lesser
compared to local search. At mobility speed
of 20 m/sec, the average end to end delay
achieved is 5.22 % lesser compared to
gravitational search, 10.89 % lesser
compared to invasive weed search and 13.71
% lesser compared to local search. For
multimedia traffic with WFQ for hello
interval of 5 sec, application of PSO
technique shows improvement in end to end
delay. It is 21.86 % lesser at mobility speed
of 5 m/sec and 17.7 % lesser at mobility
speed of 20 m/sec.
6. For multimedia traffic using FIFO, it is
observed that the jitter varies with increasing
mobility. For no mobility, the average jitter
achieved by PSO is 3.44 % higher compared
to gravitation search, 5.65 % lesser compared
to invasive weed search and 4.13 % greater
compared to local search. At mobility speed
of 20 m/sec, the average jitter achieved is
26.43 % greater than gravitation search,
35.37% greater than invasive weed search
and 22.05 % greater than local search. For
multimedia traffic with WFQ, using PSO for
hello interval of 5 sec, with no mobility, the
jitter is a decreased by 27.68 %. There is a
decrease in 11.97 % of jitter at mobility speed
of 15 m/sec.
7. For multimedia traffic using WFQ, it is
observed that the jitter varies with increasing
mobility. For no mobility, the average end to
end delay achieved by PSO is 6.26 % higher
compared to gravitational search, 4.58 %
lesser compared to invasive weed search and
1.85 % higher compared to local search. At
mobility speed of 20 m/sec, the average jitter
achieved is 30.07 % higher compared to
gravitational search, 34.65 % higher
compared to invasive weed search and 25.08
% higher compared to local search. For
multimedia traffic with WFQ at hello interval
of 5 sec, application of PSO technique shows
lower jitter values. It is 28.29 % lower for no
mobility and is 12.19 % lower at mobility
speed of 15 m/sec.
8. For multimedia traffic using FIFO, the
number of TC packets achieved using PSO,
gravitational search, invasive weed search
and local search techniques for various
mobility speeds of 0, 5, 10, 15 and 20 m/sec
is studied. The PSO technique at mobility of
5 m/sec has 5.4 7 % higher number of TC
packets compared to gravitational search,
10.12 % higher number of TC packets
compared to invasive weed search and 11 %
higher number of TC packets compared to
local search. For multimedia traffic with
WFQ using PSO technique, for hello interval
of 5 sec, there is 21.84 % higher number of
TC packets for no mobility. There is 4.96 %
higher number of TC packets compared to
mobility speed of 20 m/sec.
9. For multimedia traffic using WFQ, the
number of TC packets achieved using PSO,
gravitational search, invasive weed search
and local search techniques for different
mobility are studied. At mobility speed of 5
m/sec it is observed that the number of TC
packets achieved is 2.08 % higher compared
to gravitational search, 9.7 % higher
compared to invasive weed search and 13.37
% higher compared to local search. For
multimedia traffic with WFQ at hello interval
of 5 sec, it is observed that the application of
PSO technique gives 19.03 % higher number
of TC packets for no mobility and 5.46 %
higher number of TC packets at mobility
speed of 20 m/sec.
10. The disadvantage of PSO and local search
algorithms is that due to the local minima,
where the solution to the problem ends up
with a sub optimal solution it is difficult to
obtain a better solution. This problem can be
overcome by applying hybrid algorithms.
REFERENCES 1. Ramadan, RM & Abdel-Kader, RF 2009,
‘Face Recognition using Particle Swarm
Optimization based selected features’,
International Journal of Signal Processing,
[Sundaram, 4(3): March, 2015] ISSN: 2277-9655
Scientific Journal Impact Factor: 3.449
(ISRA), Impact Factor: 2.114
http: // www.ijesrt.com © International Journal of Engineering Sciences & Research Technology
[709]
Image Processing and Pattern Recognition,
vol. 2, no.2, pp.51-65.
2. Gharghory, SM 2011, ‘Hybrid Of Particle
Swarm Optimization With Evolutionary
Operators to Fragile Image Watermarking
Based DCT’, International Journal of
Computer Science, vol. 3.
3. Zhang, Y 2012,‘A Robust Hybrid Restarted
Simulated Annealing Particle Swarm
Optimization Technique’, Advances in
Computer Science and its Applications 5,
vol. 1, no. 1.
4. Agrawal, A, Paulus, R, Jaiswal, AK & Singh,
A 2005, Performance Comparison of Routing
Protocols Based on Different Models in
Mobile Adhoc Network, International journal
of scientific and research publication, vol.2,
no.7.
5. Tamizhselvi 2013, Enhancing Geographical
Routing Protocol Using Swarm Intelligence,
Life Science Journal.
6. Garg,A 2012, ‘A Comparison and Analysis
of various extended Techniques of Query
Optimization’, International Journal of
Advancements in Technology, vol. 3, no. 3.
7. Eslami, M 2010, ‘Tuning of power system
stabilizers using particle swarm optimization
with passive congregation’, International
Journal of the Physical Sciences, vol. 5, no.
17, pp. 2574-2589.
8. Surinwarangkoon, T, Nitsuwat, S & Moore,
EJ 2012, Comparing Classification
Performances between Neural Networks and
Particle Swarm Optimization for Traffic Sign
Recognition, In Proc. 5th WSEAS
International Conf. on Visualization,
Imaging and Simulation, pp. 19-23.
9. Li, WT 2011,‘Pattern synthesis of conformal
arrays by a modified Particle Swarm
Optimization’, Progress In Electromagnetics
Research, vol. 117, pp. 237-252.
10. Parvin, H 2011, ‘An innovative combination
of particle swarm optimization, learning
automaton and great deluge algorithms for
dynamic environments’, International
Journal of the Physical Sciences, vol. 6, no.
22, pp. 5121-5127.
11. Kennedy, J and Eberhart, R 1995,‘Particle
swarm optimization. In Proceedings of the
IEEE’, International Conference on Neural
Networks, Piscataway, NJ, IEEE Press, vol.4,
pp. 1942-1948.
12. Bai, Q 2010,‘Analysis of Particle Swarm
Optimization Algorithm’, computer and
information science, vol.3, no.1.
13. Elseuofi, SM 2012, ‘Quality of Service
using PSO algorithm’, International Journal
of Computer Science & Information
Technology (IJCSIT), vol. 4, no. 1.
Related Documents