Application of Stereo-PIV: Propeller Wake Analysis in a Large Circulating Water Channel M. Felli, F. Pereira, G. Calcagno, F. Di Felice INSEAN (Italian Ship Model Basin) Via di Vallerano 139, 00128 Rome, Italy E-Mail: [email protected] , [email protected] , [email protected] [email protected] ABSTRACT An experimental investigation of a five blade propeller wake behind a Series 60 C b =0.6 ship model has been performed using Stereo Particle Image Velocimetry (Stereo-PIV) in a large free surface cavitation tunnel. Problems related with the application of the Stereo-PIV in a large water facility are discussed. The image pre- processing is presented and the measurement uncertainties are assessed. The investigation of the wake at different longitudinal stations and its evolution in phase with the propeller has pointed out the capability of Stereo-PIV in resolving the complexity of the flow field. The blade viscous wake, which develops from the blade surface boundary layers, the trailing vortex sheets that are due to the radial gradient of the bound circulation, and the velocity fluctuation distributions are identified and discussed. The complex interaction between the hull wake and propeller is described through the evolution of the mean velocity components and the vorticity fields. Mean vorticity distribution behind a ship model 1

Welcome message from author
This document is posted to help you gain knowledge. Please leave a comment to let me know what you think about it! Share it to your friends and learn new things together.
Transcript

Application of Stereo-PIV: Propeller Wake Analysis in a Large Circulating Water Channel
M. Felli, F. Pereira, G. Calcagno, F. Di Felice
INSEAN (Italian Ship Model Basin)
Via di Vallerano 139, 00128 Rome, Italy E-Mail: [email protected], [email protected], [email protected] [email protected]
ABSTRACT An experimental investigation of a five blade propeller wake behind a Series 60 Cb=0.6 ship model has been performed using Stereo Particle Image Velocimetry (Stereo-PIV) in a large free surface cavitation tunnel. Problems related with the application of the Stereo-PIV in a large water facility are discussed. The image pre-processing is presented and the measurement uncertainties are assessed. The investigation of the wake at different longitudinal stations and its evolution in phase with the propeller has pointed out the capability of Stereo-PIV in resolving the complexity of the flow field. The blade viscous wake, which develops from the blade surface boundary layers, the trailing vortex sheets that are due to the radial gradient of the bound circulation, and the velocity fluctuation distributions are identified and discussed. The complex interaction between the hull wake and propeller is described through the evolution of the mean velocity components and the vorticity fields.
Mean vorticity distribution behind a ship model
1

1. INTRODUCTION In the last 20 years the application of advanced optical measurement techniques like laser Doppler velocimetry (LDV) has provided a deep insight into complex flow fields like propeller flows. Most of the actual knowledge on propeller flow, especially regarding the turbulence characteristics, derives from the application of the LDV measurement technique (Min, 1978; Cenedese et al., 1985; Chesnack et al. 1998, Stella et al., 2000) and is today routinely used by the main research organizations in the world and in different fields. LDV will allow to obtain valuable information with high accuracy on the mean and fluctuating velocity fields in complex flows, which is of high relevance for their physical modeling and for the validation of computer codes. However, as any experimental technique, LDV has some limitations:
− it can hardly give an idea of the spatial characteristics of large coherent structures which are generally encountered in complex and separated flows, due to its single point measurement nature; − it can induce significant errors on the intensity of unsteady vortical structures, due to its fixed location and time averaging nature; − it needs long periods of operation of the facility to get a whole velocity field, increasing the testing costs and leading to difficulties in unsteady flows or when the facility working characteristics have to be kept constant for long periods of time.
This is the case of the experimental investigation of the propeller wake in a non-uniform inflow. This analysis requires a sufficiently dense grid into the whole measurement plane, for each different propeller angle, in order to resolve the flow structures during the propeller revolution (Felli et al., 2000; Di Felice et al., 2000). From this point of view, the particle image velocimetry (PIV) technique offers many advantages over single point techniques: the experimental analysis could be fast and easily conducted by acquiring images at each angular position of the blade, drastically reducing the testing time. Over the past decade PIV technique has experienced a considerable progress and is today considered to be a powerful whole field measurement technique, continuously broadening its range of applications. The growth of the PIV technique due to the improvement of the hardware components is clear: high-energy and nanosecond pulse duration lasers, high-resolution and low-noise CCD cameras, fast frame grabbers, as well as faster computers and large data storage hard disks are among the major factors that have raised the capabilities of the measurement approach. Recent literature demonstrates the applicability of the technique to the naval field, in particular in towing tank applications (Guj et al. 2001) and in the case of the propeller flow (Cotroni et al., 2000; Di Felice et al 2000) even if these investigations were limited only to the two velocity components in the measurement plane (planar PIV or 2C-PIV). However, it is apparent that this information is not always sufficient to characterize the flow field especially for propeller flows where the presence of strong three-dimensional flow structures with strong velocity gradients requires the knowledge of all the velocity components. Stereoscopic PIV, using two cameras to view the flow from two perspectives, is the obvious extension of planar-PIV for measuring all three velocity components in a plane. Two components of velocity nominally perpendicular to the camera optical axis are measured from each camera viewpoint. The pair of two-dimensional velocity vectors for a point in the flow are then combined to yield a three-dimensional velocity vector. By combining the vector fields from the two cameras, the three-dimensional velocity field for the plane in the fluid is computed. In the present work Stereo-PIV is applied to the analysis of a ship model with propeller in the large INSEAN Circulating Water Channel. The experiment is a partial replica of the Toda et al. (1990) experiments: measurements were performed in several cross-planes behind of a Series 60 Cb=0.6 ship model with a 5-blade MAU propeller. The Series 60 model was selected for the experiments to complement the many previous studies with this geometry. The results of the wake survey are discussed pointing out to the measurement technique capabilities in resolving the wake structures and outlining the major problems in applying stereo PIV in a large facility .
2. EXPERIMENTAL SET-UP Measurements were carried out at the INSEAN Circulating Water Channel, a free surface cavitation channel with a 10 m length, 3.6 m wide and 2.25 m depth test section which allows a 5.2 m/s water flow maximum speed. More information regarding the facilities capabilities can be found at http://www.insean.it The ship-model was a Series 60 Cb=0.6, 6.096 m length, conforming to the standard offsets with some minor modification of the stern geometry to allow the propeller installation. The propeller was a 5-blade MAU propeller, with the following features: diameter D=221.9 mm, pitch-diameter ratio P/D07=1.031, expanded area-disk area ratio Ae/A0=0.74. Tests are carried out at the propeller angular velocity of 6.7 rps with the tunnel water velocity set to 1.22 m/s, corresponding to a Froude number Fr = 0.16. In the presentation of the results and the discussion to follow, a Cartesian coordinate system is adopted in which the x,y,z axes are in the direction of the
2

uniform flow, starboard side of the hull and upward, respectively. Measurements were performed in three cross-planes orthogonal to the shaft and located downstream the propeller disk, respectively at x/L.= 0.9997, 1.0000, 1.0187 (figure 1) where L is the model length. In a reference frame with the propeller center, the above measurement planes are located at x/D= 0.59, 0.76 and 1.85 respectively. In the first plane, measurements without the propeller were also performed to have an estimate of the propeller inflow. The first plane is very close to the propeller and was selected to test the stereo-PIV capability of analyzing regions with stronger velocity gradients as expected in that plane.
Figure 1: Ship, propeller model and location of the measurement planes. The propeller is shown at θ = 0°
The experimental set-up is shown in Figure 2. The light sheet, generated by a two-head Nd-YAG laser was delivered to the measurement plane by means of underwater optics. The laser sheet generation rate was 10 Hz, with an energy output of 200 mJ per pulse. A rotary 3600-pulse/revolution encoder supplied the actual propeller position as an electrical trigger signal to the synchronizer. This in turn provided the trigger signals to the two flash lamps and two Q-switches of the double-head laser, as well as to both cameras. Therefore, the image acquisition was synchronized with the propeller angle. During the test campaign, 129 acquisitions at a given propeller angle were performed in order to obtain the mean velocity field. Propeller angles from 0° to 69° have been considered with a step of 3°.
Figure 2: Experimental set-up
3

3. STEREO PIV SYSTEM 3.1 Setup In the present experiment the angular displacement method was adopted for the optical configuration of the stereo-PIV system. The setup consisted of two cameras with a resolution of 1280x1024 pixels each and a depth of 12 bits per pixel. The first one (left camera) was located 2 m downstream the ship model in an underwater housing, with an orthogonal view of the measurement plane, and the second one (right camera) outside the tunnel test section looking at the measurement plane through the tunnel access windows. To reduce the strong diffraction and aberrations due to the thick window and to the water/glass/air interfaces a prism filled with water has been placed in front of the right camera. The adopted configuration is not symmetric and has never been presented before in previous Stereo-PIV measurements. The main reasons that led to this choice are the following:
• a symmetrical configuration, with two cameras looking at the measurement plane through the windows on the opposite sides of the test section (which guarantees the maximum accuracy, see Prasad 1993, because of the large angle between the cameras) was not practical.
• with the adopted configuration the underwater camera was directly measuring the cross-flow components V and W, maximizing the accuracy on these components. Furthermore the Scheimpflug angle needs not to be remotely controlled which would increase the complexity with a larger underwater case to host all the necessary equipment. In such way, all the errors, in the stereo reconstruction, are confined to the estimate of the longitudinal component only.
• the adopted configuration is the most accurate in the evaluation of the out-of-plane component, out of all the possible optical configurations having the cameras on the same side of the test section. This result has been assessed on a test bench by measuring a known displacement of a reference object placed on a translation stage.
3.2 Image analysis and stereo reconstruction As the first step toward the determination of the three velocity components at the measurement plane, the images are processed to obtain the vector fields viewed by the left camera and the right camera. The acquired images were analyzed using an algorithm in which the window offset correlation method has been implemented (Westerweel 1997). Furthermore a recursive processing method was used by implementing a hierarchical approach in which the sampling grid was successively refined and the size of the interrogation windows was reduced during the iterations. The interrogation window was also weighted using a Gaussian function that was stretched in the direction of the window offset to further improve the signal to noise ratio of the correlation function (Di Florio et al., 2001). In the last iteration the windows were overlapped to obtain a better reconstruction of the whole flow field especially in the regions with strong gradients. This procedure has the added capability of applying interrogation windows with size smaller than the particle image displacement increasing both the dynamic range and the spatial resolution. To eliminate the remaining spurious vectors, each data set was subjected to a validation procedure to detect and replace spurious displacement vectors (Keane and Adrian, 1992). For the results presented in the following sections, a final window size of 32x32 pixels, with 75% overlap between two adjacent windows, has been adopted as the best compromise in terms of spurious vector reduction and spatial resolution. This window size was equivalent to 7 x 7 mm2 in real space. The measurement area was defined by the overlapping region between the separate views and had a dimension of about 250 mm X 200 mm that was sufficient for investigating the whole propeller disk. In the stereo reconstruction the procedure described by Soloff et al. (1997) is used. The camera views were calibrated using a special target providing a mesh of 20X20 dots in two planes. This calibration was required to determine the transformation needed to reconstruct the 3 velocity components from the two separate planar PIV measurements. Besides the geometrical correction of the perspective, this non-linear transformation took also into account the optical distortions introduced by the presence of multiple interfaces (air, glass and water). The analysis of the acquired images presented some difficulties due to the fact that both left and right cameras were imaging the rotating propeller in the background of the measurement plane. The propeller, even if black painted, would scatter the light in particular for the plane closer to the propeller and mask the particles, thus locking the velocity at the propeller speed especially in the regions in proximity of the hub and at the blade edges. This led to the erroneous evaluation of the 3 components of the velocity field in the region extending along an horizontal radius from the hub. To overcome this problem the images have been pre-processed: a mean image has been calculated by using all the acquired images at a given angle and this reference image has been subtracted from the actual image (figure 3a) before the analysis. This procedure allows the elimination of the background propeller image and drastically improves the final result (figure 3b).
4

Figure 3: Image preprocessing: a) original image; b) image processed
3.3 Measurement uncertainty The uncertainty on the velocity measurements by each single camera is mainly due to the error on the particle displacement evaluation which can be normally considered less than 1/10th of a pixel for the present image analysis algorithm (Raffel et al., 1998), which is equivalent to approximately 4 cm/s in terms of velocity. This error is essentially present in the measurement of the instantaneous flow field, in particular in the evaluation of the cross flow components which are directly measured by the underwater camera as explained before. The error in the measurement of the longitudinal component is related mainly to the stereo reconstruction. In the present case, the configuration chosen for the experiment has been assessed on a test bench and compared with a standard arrangement, see figure 4a and 4b respectively. The angle θ between the camera looking normally to the measurement plane (i.e. the underwater camera) and the camera placed outside the tunnel test section has been varied from 10 to 70°. A target displaying a typical PIV image as in figure 3b was used and put on a flat plate, which was then moved along the normal axis by 1 mm. The errors, expressed by the measurement standard deviation, were calculated across the complete measurement plane. The results shown in figure 5 pointed out errors under 2.5% for the in-plane components V and W, with values fairly constant across the whole range of angles. The errors on the normal component U were found to reach a minimum lower than 3% between 30 and 60°, while the errors for angles outside this range were more important, as one would expect from a stereoscopic reconstruction. For indication, the error for the standard symmetrical configuration is also displayed for an angle of 104°, i.e. the double of the angle used in the experiment described here. The errors reported for this configuration are naturally inferior for all the components compared with the respective errors registered with the asymmetrical setup. However, the previous numbers could be underestimated in the facility where objectives with a longer focal length are used and with the additional window aberrations. The errors due to light reflections from the hub and from the blade edges were important in flow field regions mapped in the right or left camera in proximity of these reflection spots. The moving propeller in the background of the measurement plane is another source of error. Even if pre-processing the images mostly removes the propeller image and reduces this effect, the correlation peak is still locked at the propeller velocity, in the regions where there is a lack of particle traces. In the post-processing phase, the validation procedure is very effective to detect such spurious vectors due to the large difference between the flow and the blade velocity especially at the tip of the blade. Detected erroneous vectors are eliminated and replaced by interpolation. Nevertheless, spurious vectors might also be validated biasing the statistics especially in the proximity of the hub where the flow and propeller velocity become closer. This effect is relevant especially for the second order statistics. Finally, the accuracy of the mean velocity field definitely depends on the number of acquired samples and on the shape of the velocity probability distribution function. The probability density function in the tip vortex core and in the blade wake markedly differs from a Gaussian distribution. Furthermore, a lack of data and less samples available for statistics have been observed in these regions. However by using the t-Student distribution (for which the confidence interval at 95%, is ±1.96*rms /√(N-1), with N=129), it is possible to estimate the uncertainty on a velocity component to be about 1/6th of the measured velocity rms. Figure 6 represents the uncertainty error as a function of the displacement along the in-plane axis corresponding to the V component. The target was moved in steps corresponding to 0.1 pixel. The plot shows two distinct trends, respectively for displacements under and above 0.5 pixel. This behavior is documented elsewhere in the literature, both experimentally and theoretically, see Westerweel (1997).
5

(a)
(b)
θ 2
Figure 4: Error measurement setup: (a) current configuration, (b) standard symmetrical configuration
Figure 5: Measurement uncertainty from the three-dimensional reconstruction on U, V and W as a function of θ using the asymmetrical configuration, and corresponding values for the symmetrical configuration with θ=52°
Figure 6: Measurement uncertainty versus displacement, along the V-component axis (in-plane)
6

4. RESULTS 4.1 Near propeller wake evolution In figure 7 the evolutions of the longitudinal component U and of the cross-flow components V and W are shown for two propeller angles. The main characteristics of a propeller wake working with non uniform inflow due to the hull wake can be pointed out:
• the propeller wake loses the axisymmetrical morphology typical of an isolated propeller and the largest longitudinal velocity are achieved in the lower part of the propeller disk and at radial positions r/R=0.6-0.7 (R propeller radius) . • the thin wake released by each blade can be recognized in the longitudinal component plots even if the wake thickness is approximately of the same order of magnitude as the spatial resolution of the PIV measurement. This leads to an underestimation of the velocity defects due to the smoothing effect of the interrogation window • the tip vortex are visible in the velocity map and are pointed out by the strong velocity gradients at different angular positions at about r/R= 0.9.
Figure 7: Longitudinal component U and cross-flow components V and W for plane x/L=0.9997
7

The strong three-dimensional effects due to the blade passage in the sharp hull wake can be noticed in the vorticity evolution shown in figure 8. From the previous figure the following considerations can also be done:
• the trailing vorticity, shed from the blade trailing edge, is well identified and consists of two layers of opposite sign which overlap at about r/R =0.7, in the blade section of maximum loading;
• the link of the tip vortex with the blade trailing vorticity is more apparent with respect to the mean velocity field where this information is almost confused or lost;
• the vorticity field provides information of the radial distribution of the blade loading and points out to the differences between the five blades due to the different respective inflow conditions;
• the wake at 6 and 12 o’clock position is strongly distorted and fragmented as a consequence of the strong inflow variations in these angular positions.
Figure 8: Vorticity ( s-1) at different angles for plane x/L=0.999
Figure 9 shows the evolution of the total turbulence intensity. Even if the confidence interval on this second order statistical estimator is rather limited, due to the fact that only 129 samples have been evaluated, some important features of the turbulent wake can be outlined:
• the maximum values of turbulent intensity are achieved in the tip and hub vortex cores; • the trace of the hull wake, represented by a vertical stripe of turbulence, can still be noticed in the
measurement plane; • the passage of the blade in the hull wake produces a strong turbulence generation due to the interaction
of the hull wake with the blade tip vortex; the intense spikes in the turbulence level distribution located at the blade trailing edge, near the hub and at different propeller angles, are due to the erroneous inclusion in the statistical calculation of some spurious vectors locked at the blade velocity. This effect is attributed to the background motion of the propeller which was not completely removed by the image preprocessing and by the vector post-processing validation not able to completely filter spurious measurements as explained previously.
8
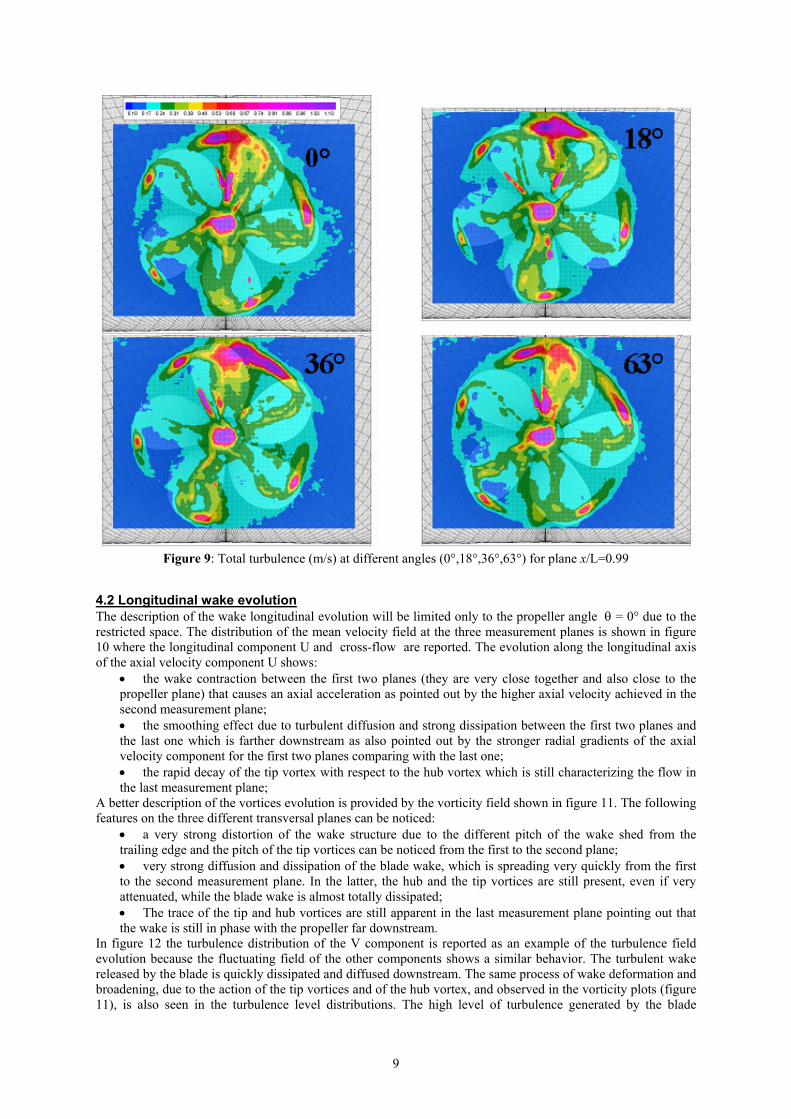
Figure 9: Total turbulence (m/s) at different angles (0°,18°,36°,63°) for plane x/L=0.99
4.2 Longitudinal wake evolution The description of the wake longitudinal evolution will be limited only to the propeller angle θ = 0° due to the restricted space. The distribution of the mean velocity field at the three measurement planes is shown in figure 10 where the longitudinal component U and cross-flow are reported. The evolution along the longitudinal axis of the axial velocity component U shows:
• the wake contraction between the first two planes (they are very close together and also close to the propeller plane) that causes an axial acceleration as pointed out by the higher axial velocity achieved in the second measurement plane; • the smoothing effect due to turbulent diffusion and strong dissipation between the first two planes and the last one which is farther downstream as also pointed out by the stronger radial gradients of the axial velocity component for the first two planes comparing with the last one; • the rapid decay of the tip vortex with respect to the hub vortex which is still characterizing the flow in the last measurement plane;
A better description of the vortices evolution is provided by the vorticity field shown in figure 11. The following features on the three different transversal planes can be noticed:
• a very strong distortion of the wake structure due to the different pitch of the wake shed from the trailing edge and the pitch of the tip vortices can be noticed from the first to the second plane; • very strong diffusion and dissipation of the blade wake, which is spreading very quickly from the first to the second measurement plane. In the latter, the hub and the tip vortices are still present, even if very attenuated, while the blade wake is almost totally dissipated; • The trace of the tip and hub vortices are still apparent in the last measurement plane pointing out that the wake is still in phase with the propeller far downstream.
In figure 12 the turbulence distribution of the V component is reported as an example of the turbulence field evolution because the fluctuating field of the other components shows a similar behavior. The turbulent wake released by the blade is quickly dissipated and diffused downstream. The same process of wake deformation and broadening, due to the action of the tip vortices and of the hub vortex, and observed in the vorticity plots (figure 11), is also seen in the turbulence level distributions. The high level of turbulence generated by the blade
9

passage at 12 o’clock is convected downstream and quickly dissipated, even if a trace is present in the far downstream plane.
Figure 10: Mean flow field evolution: longitudinal component U (left) and cross-flow components V and W (right) at 0° propeller angle for planes X/L=0.999 (top row), 1.00 (center row), 1.018 (bottom row)
10

Figure 11: Vorticity (s –1) for 0° angle at planes
x/L=0.999, 1.00, 1.018
Figure 12: Turbulence intensity of the V component (m/s) for 0° angle at planes x/L=0.999, 1.00, 1.018
11
5. CONCLUSIONS The analysis of a propeller wake behind a Series 60 ship model, in a large water channel, has been performed by using stereo-PIV. Both instantaneous and averaged velocity fields are achieved, the latter after phase sampling averaging at various angular position of the propeller blade. The experimental results reveal some of the different contributions to the complex propeller flow field of a propeller working behind a ship:
1. The viscous part of the wake generated by the boundary layers on the blade surfaces. 2. The potential part of the wake deriving from the vortex sheet at the blade trailing edge. 3. The varying load conditions of the blade during the revolution causing a strong wake deformation. 4. The complex three-dimensional behavior of the tip vortex in the wake of the hull. 5. The rapid spreading of the propeller wake in the downstream flow where the wake is faded and smoothed by turbulent diffusion and viscous dissipation.
From the experimental setup point of view and with regards to the future implementation in standard ship model testing procedures, the stereo-PIV has shown a number of advantages compared to the well assessed LDV technique. In particular, and considering the limited time usually given to these tests combined with the management and technical difficulties typical of a large testing facility, the PIV technique can provide results within a short period. Instead, the LDV technique requires up to three-four times more testing time to obtain he same information, which consequently translates into additional costs of facility occupancy. The measurement time is drastically reduced with the stereo-PIV method, where the plane of measurement is mapped instantaneously and provides all three velocity components in one single step, while the LDV technique requires a long scanning of the interrogation domain. In this sense, the PIV approach offers the freedom of extending the wake survey to a larger number of areas of interest, with very limited setup changes. The major drawbacks of the PIV technique are a reduced accuracy with respect to the LDV technique and the huge quantity of information: one must address the critical problem of storing, managing and processing this information without compromising the tests costs by extended data processing time.
ACKNOWLEDGEMENTS The authors are grateful to the INSEAN Circulating Water Channel personnel and to Mr. Tiziano Costa who supported the PIV measurements and the error analysis. This work was sponsored by the Italian Ministero delle Infrastrutture in the frame of the INSEAN 2000-2002 research plan.
REFERENCES Cenedese, A.., Accardo, L., Milone, R., "Phase sampling in the analysis of a propeller wake", Experiments in Fluids, Vol. 6, 1988, pp. 55-60. Cotroni, A., Di Felice, F., Romano, G.P., Elefante, M., “Investigation of the near wake of a propeller using particle image velocimetry”, Experiments in Fluids , 2000, pp. 227 – 236. Di Felice, F., Romano, G.P., Elefante, M., “Propeller Wake Analysis by Means of PIV”, Proceedings of the 23th Symposium on Naval Hydrodynamics, Val De Reuil, France, 1998. Di Felice, F., Felli, M., Ingenito, G., “Propeller wake analysis in non uniform inflow by LDV”, Proceedings of the Propeller and Shafting Symposium, Virginia Beach, 2000. Di Florio, D., Di Felice, F., Romano, G.P., “Windowing and Deformation of PIV Images for the Investigation of Flow with Large Velocity Gradients”, Proceedings of the 4th International Symposium on Particle Image Velocimetry, Göttingen, Germany, 2001. Felli, M., Di Felice, F., Romano, G.P., “Installed Propeller wake analysis by LDV: phase sampling technique”, Proceedings of the 9th International Symposium on Flow Visualisation, Edimburgh, 2000. Gui, L., Longo, J., Stern, F., “Towing Tank PIV Measurement System, Data and Uncertainty Assessment for DTMB Model 5512”, Experiments in Fluids, Vol.31, 2001, pp. 336-346. Keane R.D., Adrian R.J., "Theory of cross-correlation analysis of PIV images", Applied Scientific Research, Vol.49, 1992, pp.191-215. Min, K.S, "Numerical and experimental methods for prediction of field point velocities around propeller blades". Dep. of Ocean Engineering, Report no. 78-12, MIT, 1978. Prasad, A. K., Adrian RJ, “Stereoscopic particle Image Velocimetry applied to liquid flows”. Exp in Fluids with an orthogonal view of the measurement plane Vol 15, 1993, pp. 49-60. Prasad, A.K., “Stereoscopic Particle Image Velocimetry”, Experiments in Fluids, Vol.29, 2000, pp. 103-116. Raffel, M., Willert, C., Kompenhans, J., "Particle Image Velocimetry", Springer ISBN 3-540-63683-8, 1998. Soloff, S.M., Adrian, R.J., Liu, Z.C., “Distortion Compensation for Generalized Stereoscopic Particle Image Velocimetry”, Meas. Sci. Technol., Vol.8, 1997, pp. 1441-1454. Stella, A., Guj, G., Di Felice, F., “Propeller flow field analysis by means of LDV phase sampling techniques”, Experiments in Fluids, Vol.28, 2000, pp. 1-10. Westerweel, J., "Fundamentals of Digital Particle Image Velocimetry", Meas. Science and Technology Vol.8, 1997, pp.1379-1392.
12
Related Documents