Application of Statistics in Human Geography --The influence of geographic position on urban development C-level essay in Statistics, Fall 2006 Department of Economics and Society, Dalarna University Authors Boyuan Zhao Hao Luo Supervisor Johan Bring Date January, 2006

Welcome message from author
This document is posted to help you gain knowledge. Please leave a comment to let me know what you think about it! Share it to your friends and learn new things together.
Transcript

Application of Statistics in Human
Geography
--The influence of geographic position on urban development
C-level essay in Statistics, Fall 2006
Department of Economics and Society, Dalarna University
Authors Boyuan Zhao Hao Luo
Supervisor Johan Bring
Date January, 2006

Abstract
In this essay, basing the data of “China Urban Statistics Year Book 2005” and the data
of Chinese cities’ longitude and latitude, we analyze the relationship between the
urban social geography and the development degree of cities. Various methods of
statistics were applied, such as descriptive statistics, classification, etc.
According to the analysis result, selected Chinese cities are divided into 10 classes
and their development situation is studied so that the individuality and the
commonness of each class could be revealed.
After that, an in-depth analysis is made on the first class and attention is paid to three
aspects: population, resources, and environment. To make further study, we analyze
the situation of urban population, construction, traffic, water supply, and greening.
In this essay, we use two methods of classification of SPSS, k-means method and
hierarchical cluster method. At the same time, we compare two results come from
geography data and economical data.
In the end, we hope this essay could give a help and some revelation to Chinese
urbanization and regionalization.
- 2 -

Keywords:
Urban Development Descriptive Statistics Cross Table Geographic Location
Urban Management Cluster Analysis Human Geography Correlation
Analysis
Part I
Introduction
In B.C.334, Alexander the Great led his army south across the sea, then east towards
the Persian Empire. Geographer Nearcnos went along with the troops, gathering
necessary information for a “World Map”. He noticed that along the marching routes,
from west to east, the changing of seasons and the sunshine durations were nearly the
same. The geographer made an important contribution: for the first time in history, he
drew a latitude line on the map. This latitude line started from the Strait of Gibraltar
went along the Himalayas and reached the Pacific Ocean. Alexander’s empire
collapsed very soon, however in the Egyptian city which named after Alexander the
Great, a well-known museum was founded. The old curator Eratosthenes was learned
and has mastery of mathematics, astronomy and geography. Through calculation he
noted that the circumference of the earth is 46250km and drew a world map with 6
latitude lines and 7 longitude lines on it. From then on, latitude and longitude were
used to mark locations accurately.
Thereafter, an inseparable relationship was built between geography and statistics
through latitude and longitude lines.
In 21st century, cities are playing a more and more important role in the development
of society and economy. Therefore, good management and quick modernization
become a momentous meaningful issue that citizens generally pay attention to, both
theoretical and practical.
- 3 -

Part II
Description of data
Questions and step-by-step solutions
In this part, the data of the year 2004 selected from “China Urban Statistics Year
Book” and the geographical locations of various cities will be integrated through the
knowledge of latitude and longitude. All these are to be analyzed using statistical
methods and related software.
I. Data gathering and pretreatment
1. Selection of data
This essay focuses on the influence that latitude and longitude factors have on urban
development, therefore the existing sort of cities by province will not be used. What
we need to do is re-classifying the cities into several regions by the latitude and
longitude, so the accurate latitude and longitude information of every city are
necessary.
In addition, we need some indicators that can reflect the level of urban development
to some extent, so the data about the development of these cities should be gathered.
2. Source of data
In order to meet the need of data mentioned above, the analysis of this essay focuses
on the data selected from “China Urban Statistics Year Book 2005” and the latitude
and longitude information of various cities.
3. Structure of data
The process of data reduction has the following steps:
- 4 -

First, select several cities and their tables from “China Urban Statistics Year Book
2005”.
Second, establish a table that contains three columns which are names, latitude and
longitude of the cities.
At last, attach this table to the tables in “China Urban Statistics Year Book 2005” for
analysis.
4. Problems
There are totally 659 cities in “China Urban Statistics Year Book 2005”, however
among these cities, the data of 9 cities could not be obtained accurately. According to
the principle of data analysis we abandon them. Eventually we get the data of 650
cities.
II. Data transformation
Through some basic data transformation, a table containing 53 variables is confirmed.
These variables can be classified into three parts: urban names, latitude and longitude,
urban development indices. (List 1)
Considering the possible influence caused by correlation, we will apply the
correlation analysis to eliminate unnecessary variables, leaving only the most useful
ones. 13 variables are selected to represent urban development and regional advantage
from different aspects. Listed as below:
Urban names, latitude, longitude, province codes, population density, urban
population, urban area, per capita fund for urban construction and maintenance, per
capita public green areas, number of public transportation vehicles per 1000000
population, area of paved roads per 10000 persons, density of paved roads.
Part III
- 5 -

Methods
The main methods used in this essay are cluster methods, such as K-means method
and hierarchical cluster method. Clustering is the classification of similar objects into
different groups, or more precisely, the partitioning of a data set into subsets (clusters),
so that the data in each subset (ideally) share some common trait.
Part Ⅳ
Results
A
Geographical clustering
I. Data analysis
1. Descriptive analysis
A table containing 650 rows and 13 columns is established. The results of descriptive
analysis using SPSS are listed as below:
Table 1:The descriptive statistics of each variable
Descriptive Statistics
N Minimum Maximum Mean Std.DeviationLongitude 650 75.49 133.97 114.2158 8.66988 Latitude 650 18.14 50.80 33.4269 6.95958 Population density 650 25.00 11195.00 2516.0754 2297.10422 Urban population 650 2.42 1289.13 52.2434 102.01179 Urban area 650 10.00 12909.67 600.3818 1239.44341 Fund for urban construction and maintenance per person
648 3.00 14190.00 1010.5015 1213.77229
Number of public transportation vehicles per 1000000 population
620 0.23 47.97 6.1617 4.69560
- 6 -
Area of paved roads per person 650 1.53 48.73 11.0801 5.45099 Paved roads density 650 0.02 15.78 1.6757 1.64742 Daily living consumption of water per person
649 42.15 803.97 177.3334 86.53371
Per capita public green areas 649 0.25 47.12 7.2153 4.37324 Valid N(listwise) 619
From the table above, we can find maximum, minimum, mean and standard deviation
of 11 variables except urban names and province codes. For instance, it could be seen
that these cities range from 75°56’ 24 E to 133°58’ 12 W and from 18°8’ 4 N to
50°48’ S.
2. Choose the number of groups in classification analysis
Basing on the urban latitude and longitude data, we obtain the following graph using
SPSS, which means the to-be-researched geographic distribution of cities.
Graph 1: The to-be –researched geographic distribution of cities
Dot/Lines show Means
80.00 90.00 100.00 110.00 120.00 130.00
¾-¶È
20.00
30.00
40.00
50.00
γ¶È
VV
V
V
V
V
V
V
V
VV
V
VV
V
V
V
V
V
V
V
V
V
V
V
V
V
V
V
V
V
V
V
V
V
V
V
V
V
V
V
V
V
V
V
V
V
V
V
V
V
VV
V
V
V
V
V
V
VVVV
V
V
V
V
V
VV
V
V
V
V
V
V
V
V
V
V
V
V
V
V
V
VV
V
V
V
V
V
V
V
V
V
V
V
V
V
V
V
V
V
VV
V
V
V
V
V
V
V
V
V
V
V
V
V
V
V
V
V
V
V
V
V
V
V
V
V
V
V
V
V
V
V
V
V
V
V
V
V
V
V
V
V
V
V
V
V
V
V
V
V
V
V
V
V
V
V
V
V
V
V
V
V
V
V
V
V
V
V
V
V
V
V
V
V
V
V
V
V
V
V
V
V
V
V
V
V
V
V
V
V
V
V
V
V
V
V
V
V
V
V
V
V
V
V
V
V
V
V
V
V
V
V
V
V
V
V
V
V
V
V
V
V
V
V
V
V
V
V
V
V
V
V
V
V
V
V
V
V
V
V
V
V
VV
V
V
V
V
V
V
V
V
V
V
VV
V
V
V
V
V
V
V
V
V
V
V
V
V
V
V
V
V
V
V
V
V
VV
V
V
V
V
V
V
V
V
V
V
V
V
V
V
V
V
V
V
V
V
V
V
VV
V
V
V
V
V
V
V
V
V
V
V
V
V
V
V
V
V
V
V
V
V
V
V
V
V
V
V
V
V
V
V
V
V
V
V
V
V
V
V
V
V
V
V
V
V
V
V
VV
V
V
V
V
V
V
V
V
V
V
V
V
V
V
V
V
V
V
V
V
V
V
V
V
V
V
V
V
V
V
V
V
V
V
V
V
V
V
V
V
V
V
V
V
V
V
V
V
V
V
V
V
V
V
VV
V
V
V
VV
V
V
V
V
V
V
V
V
V
V
V
V
V
V
V
V
V
V
V
V
V
V
V
V
V
V
V
V
V
V
V
V
V
V
V
V
V
V
V
V
V
V
V
V
V
V
V
V
V
V
V
V
V
V
V
V
VV
V
V
V
V
V
V
V
VV
V
V
V
V
V
V
VV
V
V
V
V
V
V
V
V
V
V
V
V
V
V
V
V
V
V
V
V
V
V
V
V
V
V
V
V
V
V
V
V
V
V
V
V
V
V
V
V
V
V
V
V
V
V
V
V
V
V
VVV
V
V
V
- 7 -

Because the analysis focuses solely on cities regardless of the provinces they belong
to, we classify the cities by latitude and longitude. Knowing that the amount of data is
tremendous, we use K-means cluster analysis and have to choose the number of
groups.
The formula to decide the number of groups is the following:
Number of groups= (number of observations) - (the stage after which the distance
growth rapidly)
Using the agglomeration schedule of SPSS, we take the distance at the last step
(80218.109) as 100% and then transform all the other values to percentage you will
see that the distance does not exceed 10% up to 641st step. So the stage after which
the distance growth rapidly=640, and the number of groups=650-640=10.
Agl omer at i on Schedul e
0100002000030000400005000060000700008000090000
1 42 83 124 165 206 247 288 329 370 411 452 493 534 575 616
系列1系列2
3. Classification analysis
The output is as below:
Table 2: Number of cases in each cluster by K-means clustering method
- 8 -

Number of Cases in each Cluster
112.00092.000
127.00054.00016.00025.000
111.0005.000
41.00067.000
650.000.000
12345678910
Cluster
ValidMissing
Final cluster centers are as below
Table 3: The final cluster centers of the variable Latitude and Longitude
Final Cluster Centers Cluster
1 2 3 4 5 6 7 8 9 10
Longitude 112.25 117.82 118.94 122.98 86.39 102.92 112.30 80.14 128.56 104.35 Latitude 24.31 37.40 29.91 42.96 44.56 37.69 34.59 37.35 45.50 28.32
According to the output, we get the charts showing from different angles as below, on
the graphs, we can see the distribution of each groups on the map.
Graph 2: The distribution of each cluster in different latitude
- 9 -

AA
A
A
A
A
A
A
A
A
A
A
A
A
A
A
A
AA
A
A
A
A
A
A
A
A
A
AA
A
A
A
AAA
AAA
AA
A
A
A
A
AA
A
A
A
A
A
A
A
A
A
A
A
AA
A
A
A
A
A
A
A
A
A
A
A
A
A
A
A
A
A
A
A
A
AA
A
A
A
A
A
A
A
A
AA
A
A
A
A
AAAA
A
A
A
A
A
A
AAA
A
AA
A
A
A
A
A
A
A
AA
A
A
A
AA
A
A
A
A
A
A
A
A
A
A
A
A
A
A
A
AA
A
A
AA
A
A
A
A
AA
AA
A
A
A
AA
A
A
A
A
AA
A
AAA
A
A
A
A
A
AA
AA
A
A
A
A
AAA
A
AAA
A
A
A
A
AA
A
A
A
A
A
A
A
A
A
A
A
A
A
A
A
A
A
A
A
A
A
A
A
AA
A
A
A
A
A
A
A
A
A
A
A
AA
A
A
A
A
A
A
A
AA
AA
A
A
A
AA
A
A
A
AAA
A
AA
A
A
A
A
A
A
A
AA
A
A
A
A
A
AA
A
A
A
A
A
A
A
A
A
A
A
A
A
A
A
AA
A
A
A
AA
A
A
A
A
A
A
A
A
A
A
A
A
AA
A
A
A
A
AA
A
A
A
A
A
AAA
A
A
A
A
A
A
A
A
A
A
A
A
A
A
A
A
AAA
A
A
A
A
A
AA
A
AAA
AA
A
A
A
AA
AAA
A
A
AA
AA
A
A
A
A
AAA
A
A
A
A
A
A
A
AA
A
A
AAA
A
A
A
A
A
A
A
A
AA
AA
A
AA
A
A
AA
A
A
A
A
A
A
AA
A
A
A
A
A
A
A
A
A
A
A
AA
A
A
A
A
AAA
A
A
A
A
A
A
A
A
A
A
A
A
A
AA
A
A
AAAA
A
AA
A
A
A
A
AAA
AA
A
A
A
A
A
AA
A
A
A
A
AA
A
A
A
A
A
A
A
AA
A
A
A
A
A
A
A
A
A
A
A
A
A
A
A
A
A
A
AAA
AA
A
A
AA
AA
A
A
A
A
A
A
A
A
A
A
A
A
A
A
A
AA
A
AA
A
AAAA
A
A
AA
AA
A
A
A
A
A
A
A
A
A
A
A
A
A
A
A
A
A
A
A
A
A
A
A
A
AAA
A
AA
Dot/Lines show Means
Graph 3: The distribution of each cluster in different longitude
AAAAAAAAAAAAAAAAAAAAAAAAAAAAAAAAAAAAAAAAAAAAAAAAAAAAAAAAAAAAAAAAAAAAAAAAAAAAAAAAAAAAAAAAAAAAAAAAAAAAAAAA
AAAAAAAAAAAAAAAAAAAAAAAAAAAAAAAAAAAAAAAAAAAAAAAAAAAAAAAAAAAAAAAAAAAAAAAAAAAAAAAAAA
AAAAAAAAAAAAAAAAAAAAAAAAAAAAAAAAAAAAAAAAAAAAAAAAAAAAAAAAAAAAAAAAAAAAAAAAAAAAAAAAAAAAAAAAAAAAAAAAAAAAAAAAAAAAAAAAA
AAAAAAAAAAAAAAAAAAAAAAAAAAAAAAAAAAAAAAAAAAAAA
AAAAAAAAAAAAAA A
AAAAAAAAAAAAAAAAAAAAAAAAA
AAAAAAAAAAAAAAAAAAAAAAAAAAAAAAAAAAAAAAAAAAAAAAAAAAAAAAAAAAAAAAAAAAAAAAAAAAAAAAAAAAAAAAAAAAAAA
AA AA A
AAAAAAAAAAAAAAAAAAAAAAAAAAAAAAAAAAAA
A AAAAAAAAAAAAAAAAAAAAAAAAAAAAAAAAAAAAAAAAAAAAAAAAAAAAAAAAAAAAAAAAA
Dot/Lines show Means
4. Comparison between Two Clustering Methods
To make sure if K-means method is a better one, we analyze the data by hierarchical
cluster method with Within-group linkage and Squared Euclidean distance. The result
is as follow:
- 10 -
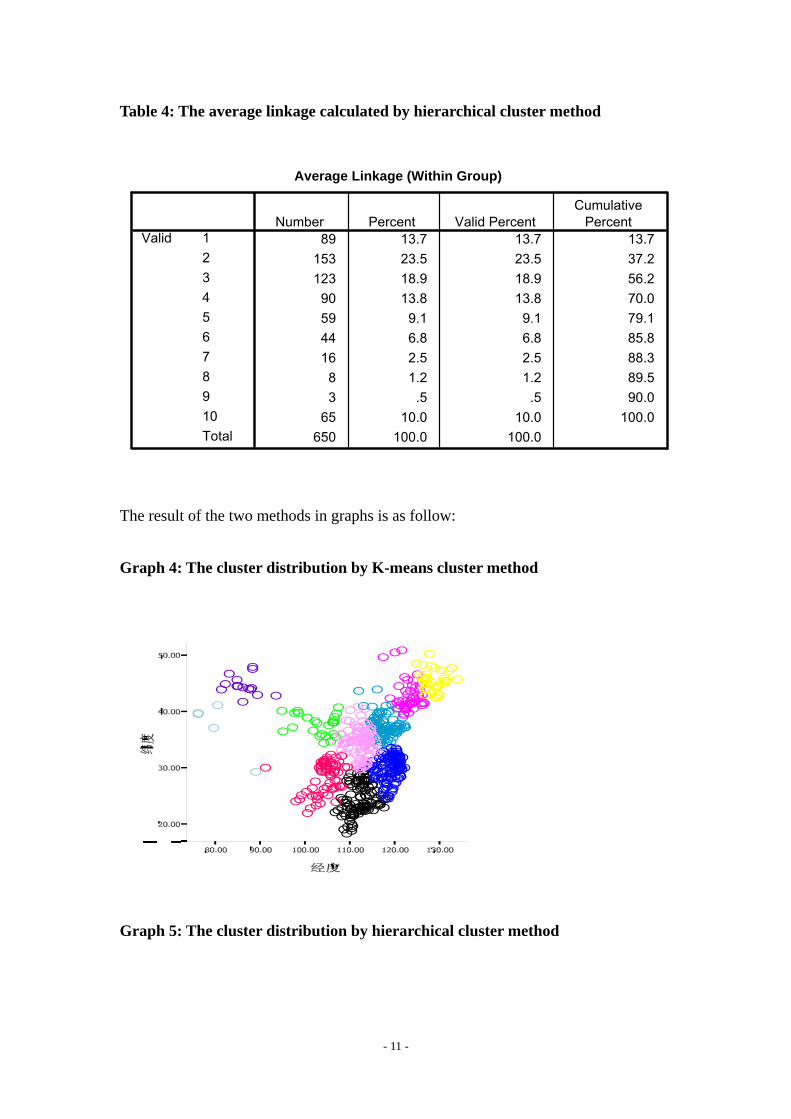
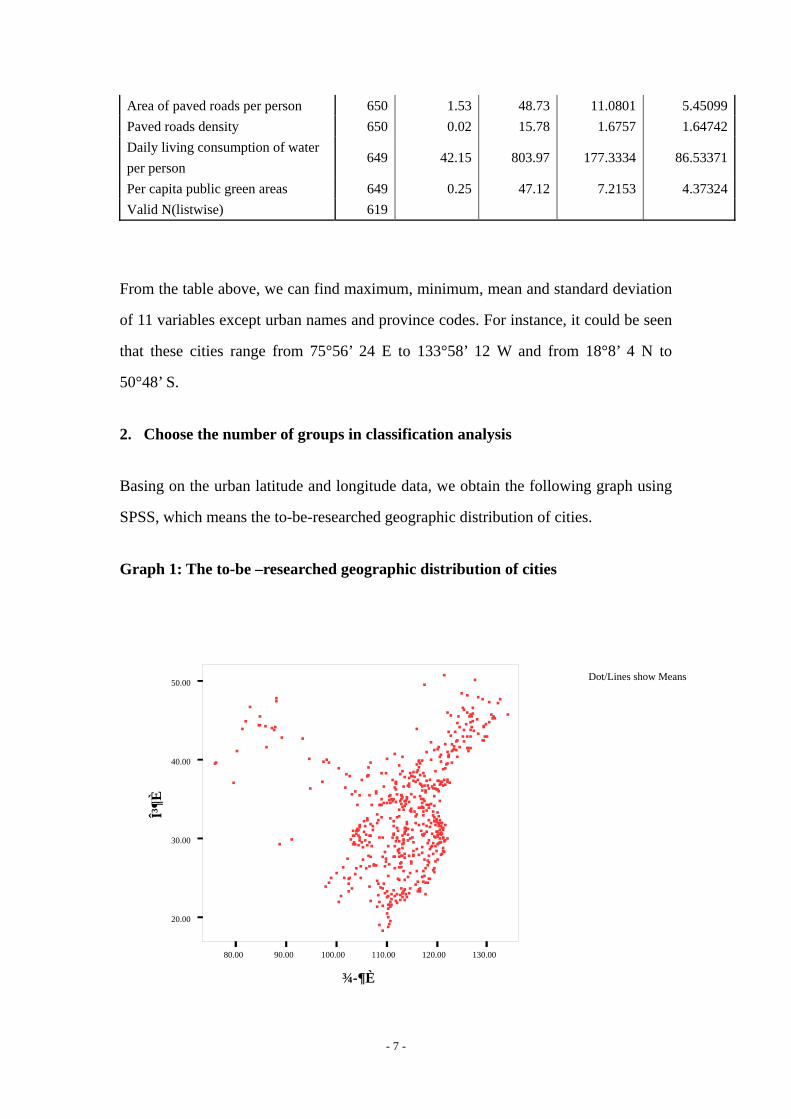
Table 4: The average linkage calculated by hierarchical cluster method
Average Linkage (Within Group)
89 13.7 13.7 13.7153 23.5 23.5 37.2123 18.9 18.9 56.2
90 13.8 13.8 70.059 9.1 9.1 79.144 6.8 6.8 85.816 2.5 2.5 88.3
8 1.2 1.2 89.53 .5 .5 90.0
65 10.0 10.0 100.0650 100.0 100.0
12345678910Total
ValidNumber Percent Valid Percent
CumulativePercent
The result of the two methods in graphs is as follow:
Graph 4: The cluster distribution by K-means cluster method
AA
A
A
A
A
A
A
A
A
A
A
A
A
A
A
A
A
A
A
A
A
AA
A
A
A
A
AA
A
A
A
AAA
A
A
A
AA
A
A
A
A
AA
A
A
A
A
A
A
A
A
A
A
A
AA
A
A
A
A
A
A
A
A
A
A
A
A
A
A
A
A
A
A
A
A
AA
A
A
A
A
A
A
A
A
AA
A
A
A
A
AAAA
A
A
A
A
A
A
AAA
A
AA
A
A
A
A
A
A
A
AA
A
A
A
AA
A
A
A
A
A
A
A
A
A
A
A
A
A
A
A
AA
A
A
AA
A
A
A
AAA
A
A
A
A
A
AA
A
A
A
A
A
A
A
AAA
A
A
A
A
A
AA
AA
A
A
A
A
AAA
A
AAA
A
A
A
A
AA
A
A
A
A
A
A
A
A
A
A
A
A
A
A
A
A
A
A
A
A
A
A
A
AA
A
A
A
A
A
A
A
A
A
A
A
AA
A
A
A
A
A
A
A
AA
AA
A
A
A
A
A
A
A
A
AAA
A
A
A
A
A
A
A
A
A
A
AA
A
A
A
A
A
A
A
A
A
A
A
A
A
A
A
A
A
A
A
A
A
A
AA
A
A
A
AA
A
A
A
A
A
A
A
A
A
A
A
A
AA
A
A
A
A
AA
A
A
A
A
A
AAA
A
A
A
A
A
A
A
A
A
A
A
A
A
A
A
A
AAA
A
A
A
A
A
AA
A
AAA
AA
A A
A
A
A
AAA
A
A
AA
AA
A
A
A
A
AAA
A
A
A
A
A
A
A
AA
A
A
AAA
A
A
A
A
A
A
A
A
AA
AA
A
A
A
A
A
AA
A
A
A
A
A
A
AA
A
A
A
A
A
A
A
A
A
A
A
AA
A
A
A
A
AAA
A
A
A
A
A
A
A
A
A
A
A
A
A
AA
A
A
AAAA
A
AA
A
A
A
A
A
AA
AA
A
A
A
A
A
AA
A
A
A
A
AA
A
A
A
A
A
A
A
A
A
A
A
A
A
A
A
A
A
A
A
A
A
A
A
A
A
A
AAAA
AA
A
A
AA
A
A
A
A
A
A
A
A
A
A
A
A
A
A
A
A
A
AA
A
AA
A
AAAA
A
A
AA
AA
A
A
A
A
A
A
A
A
A
A
A
A
A
A
A
A
A
A
A
A
A
A
A
A
AAA
A
AA
Graph 5: The cluster distribution by hierarchical cluster method
- 11 -
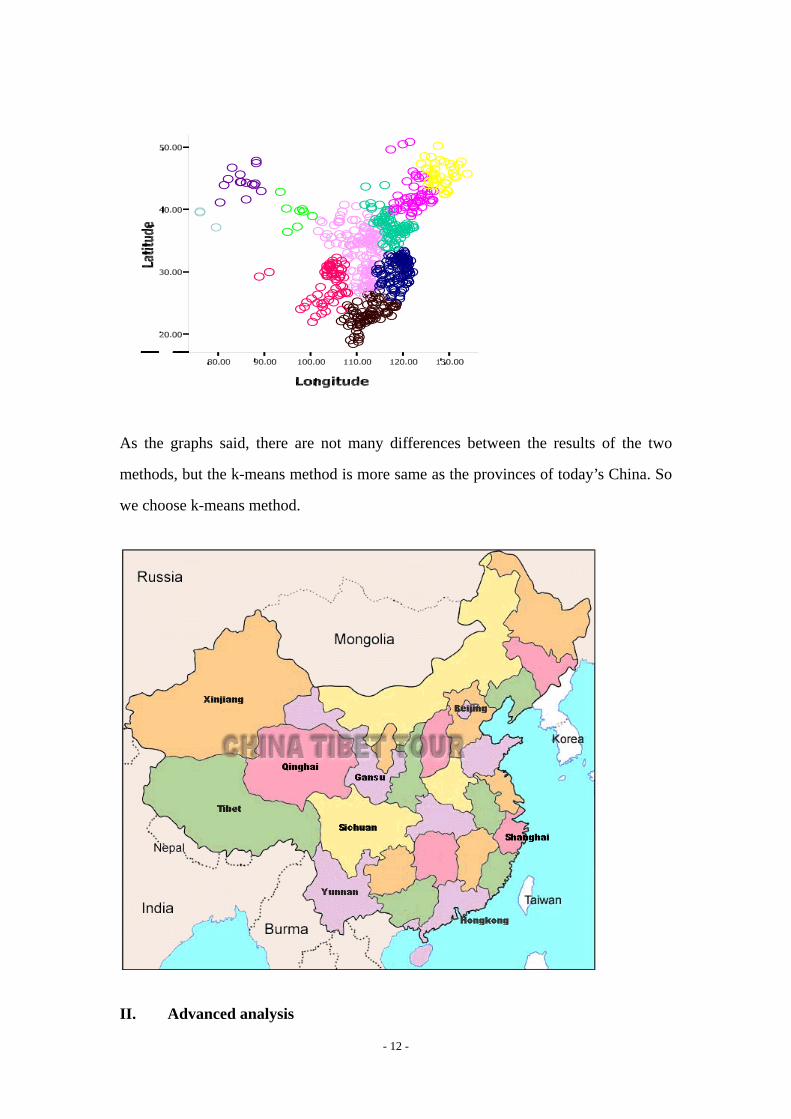
As the graphs said, there are not many differences between the results of the two
methods, but the k-means method is more same as the provinces of today’s China. So
we choose k-means method.
II. Advanced analysis
AA
A
A
A
A
A
A
A
A
A
A
A
A
A
A
A
A
A
A
A
A
A
AA
A
A
A
AA
A
A
A
A
AA
A
A
A
A
A
A
A
A
A
A
A
A
A
AA
A
A
A
A
A
A
AA
A
A
A
A
A
AA
A
A
A
A
AAAA
A
A
A
A
AAAA
AA
A
AA
A
A
A
A
A
A
AA
A
A
A
A
A
A
A
A
AA
A
A
A
A
A
AA
A
A
A
A
A
A
A
A
A
A
A
A
A
A
A
A
A
A
A
A
A
A
A
A
A
A
A
A
A
A
A
A
A
A
A
AA
A
A
A
A
A
A
A
A
A
A
A
A
A
A
A
A
A
A
A
A
A
A
AA
A
A
A
A
A
A
A
A
A
A
A
A
A
A
A
A
A
A
A
AA
A
A
A
A
A
A
A
A
A
A
A
A
A
A
A
AAA
AA
A
A
A
A
A
AAA
A
A
A
A
A
A
AA
A
A
A
A
A
A
A
A
A
A
A
A
A
A
A
A
A
A
A
A
A
A
AA
A
A
A
A
AA
A
AA
A
A
A
A
A
A
A
AA
AA
A
A
A
A
A
A
A
A
A
AA
A
AA
A
A
A
A
A
A
A
A
A
A
A
A
A
A
A
AA
A
A
A
A
A
A
A
A
A
A
A
A
A
A
AA
A
A
A
AA
A
A
A
A
A
AA
A
A
AAA
A
AA
A
A
A
A
A
A
A
A
AA
A
A
A
AA
A
A
A
A
A
A
A
AA
A
A
A
A
A
A
AA
A
A
AA
A
A
AA
AA
A
A
AA
A
A
A
A
A
A
AA
A
A
A
A
A
AA
A
A
A
A
AAAA
A
A
A
AA
A
A
A
A
A
AA
A
A
A
A
A
A
AA
A
A
A
A
AA
AA
A
A
A
AAA
A
A
AA
A
A
A
A
A
A
A
A
A
AAA
A
A
A
AA
A
A
A
A
A
A
A
A
A
A
A
A
A
A
A
A
A
A
A
A
A
A
A
A
A
A
A
A
A
A
A
A
A
A
A
A
A
A
A
A
A
AA
A
AAA
AA
A A
A
A
A
AAA
A
AA
A
A
A
AA
A
A
A
A
A
A
A
A
A
A
A
A
A
A
A
A
A
AA
A
AA
A
AAAA
A
A
A
A
AA
A
A
A
A
A
A
A
A
A
A
A
A
A
A
A
A
A
A
A
A
A
A
A
A
AAA
- 12 -

1. Summary of computation
Apply descriptive analysis to the above 10 clusters separately, the outputs are as
below (appendix):
Table 5: The geographical property of each cluster
Cluster No. CL1 CL2 RL1 RL2 MinL1 MaxL1 MinL2 MaxL2 PI
1 112 112.2 24.3 11 11.3 106.8 117.8 18.8 29.5 13,14,17,18,19,20.23
2 92 117.8 37.4 10.4 10.3 112 122.4 33.6 43.9 1,2,3,5,6,10,12,15,16
3 127 118.9 29.9 7.8 9.1 114.3 122 24.4 33.5 9.10,11,12,13,14,17
4 54 123 43 9.1 11.4 117.5 126.5 39.4 50.8 5,6,7,8
5 16 86.4 44.6 12.1 6.2 81.3 93.4 41.7 47.9 30
6 25 102.9 37.7 12.7 6.5 94.7 107.4 34.3 40.8 5,27,28,29
7 111 112.3 34.6 8.7 11.2 107.2 115.8 29.6 40.8 3,4,5,12,15,16,17,18,26,27
8 5 80.1 37.3 12.9 11.9 75.9 88.8 29.3 41.2 30,25
9 41 128.6 45.5 9.1 7.8 124.9 134 42.5 50.2 7,8
10 67 104.4 28.3 18.2 10.3 91.1 109.3 22 32.8 17,19,21,22,23,24,25
No.- Number of cities;
CL1- Central location longitude; CL2-Central location latitude
RL1- Range of longitude; RL2- Range of latitude
MinL1- Minimum longitude; MaxL1- Maximum longitude
MinL2-Minimum latitude; MaxL2-Minimum latitude
PI-Province code include
- 13 -
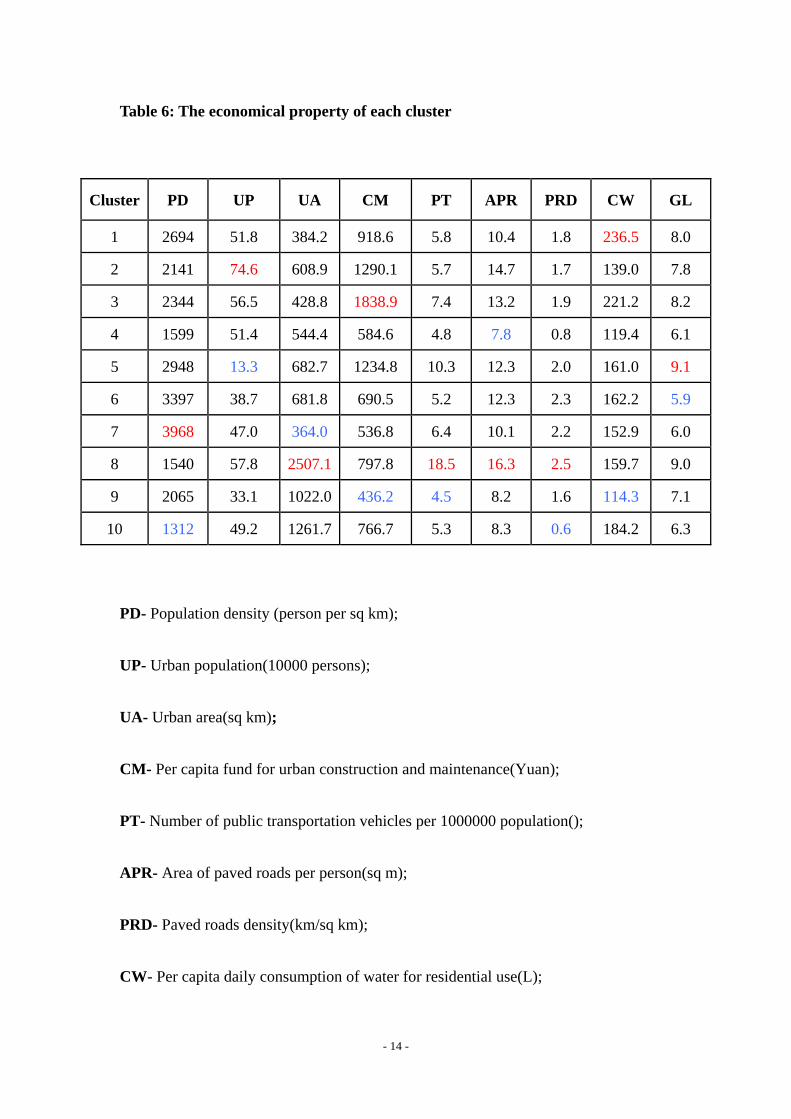
Table 6: The economical property of each cluster
Cluster PD UP UA CM PT APR PRD CW GL
1 2694 51.8 384.2 918.6 5.8 10.4 1.8 236.5 8.0
2 2141 74.6 608.9 1290.1 5.7 14.7 1.7 139.0 7.8
3 2344 56.5 428.8 1838.9 7.4 13.2 1.9 221.2 8.2
4 1599 51.4 544.4 584.6 4.8 7.8 0.8 119.4 6.1
5 2948 13.3 682.7 1234.8 10.3 12.3 2.0 161.0 9.1
6 3397 38.7 681.8 690.5 5.2 12.3 2.3 162.2 5.9
7 3968 47.0 364.0 536.8 6.4 10.1 2.2 152.9 6.0
8 1540 57.8 2507.1 797.8 18.5 16.3 2.5 159.7 9.0
9 2065 33.1 1022.0 436.2 4.5 8.2 1.6 114.3 7.1
10 1312 49.2 1261.7 766.7 5.3 8.3 0.6 184.2 6.3
PD- Population density (person per sq km);
UP- Urban population(10000 persons);
UA- Urban area(sq km);
CM- Per capita fund for urban construction and maintenance(Yuan);
PT- Number of public transportation vehicles per 1000000 population();
APR- Area of paved roads per person(sq m);
PRD- Paved roads density(km/sq km);
CW- Per capita daily consumption of water for residential use(L);
- 14 -

GL- Area of public green land per person(sq m)
Table 5 and Table 6 are conclusions of the above 10 tables. From table 15 we can see
the geographic locations of the 10 clusters, which represent the geographic
distribution traits of the 10 clusters.
2. Basic analysis of ordered quantitative data
Table 7: Ordered quantitative data of economical property in each cluster
Cluster PD UP UA CM PT APR PRD CW GL
1 7 7 2 7 6 5 5 10 7
2 5 10 5 9 5 9 4 3 6
3 6 8 3 10 8 8 6 9 8
4 3 6 4 3 2 1 2 2 3
5 8 1 7 8 9 6 7 6 10
6 9 3 6 4 3 7 9 7 1
7 10 4 1 2 7 4 8 4 2
8 2 9 10 6 10 10 10 5 9
9 4 2 8 1 1 2 3 1 5
10 1 5 9 5 4 3 1 8 4
For further analysis we convert the quantitative data in Table 6 to ordinal data as
Table 7. Now we could see the traits of every cluster more clearly. (Appendix)
Cluster 1
Maximum per capita daily consumption of water for residential use
Low urban area
High population density, urban population, per capita fund for urban construction and
- 15 -

maintenance, per capita public green areas.
3. Advanced analysis of cluster data
Because the analytical methods applied to every cluster are similar, here we just
analyze Cluster 1 as example.
For understandability, we put the locations of the cities of Cluster 1 into the frame of
Graph 4 and get the following graph:
Graph 6: The cities location distribution of Cluster 1
Dot/Lines show Means
70.00 80.00 90.00 100.00 110.00 120.00 130.00
¾-¶È
20.00
30.00
40.00
50.00
γ¶È
VV
V
V
V
V
V
V
V
V
V
V
V
V
V
V
V
VV
V
V
V
VV
V
V
V
V
VV
V
V
V
VVV
VV
V
VV
V
V
V
V
VV
V
V
V
V
V
V
V
V
V
V
V
VV
V
V
V
V
V
V
V
V
V
V
V
V
V
V
V
V
V
V
V
V
VV
V
V
V
V
V
V
V
V
VV
V
V
V
V
VVVV
VV
V
V
It could be seen from Table 4 that the 112 cities of Cluster 1 are in southeast China.
These cities belong to 7 provinces which are Hubei, Hunan, Guangdong, Guangxi,
Guizhou, Fujian and Jiangxi. Apply correlation analysis to the data except latitude and
longitude, and then we get Table 9.
Table 8: The correlation table for economical variables
- 16 -

Correlations
1 -.048 -.168 -.128 -.023 -.092 .750 -.121 -.121-.048 1 .539 .107 .117 -.015 -.045 .016 .034-.168 .539 1 .007 -.003 -.009 -.089 -.014 -.028-.128 .107 .007 1 .274 .346 -.034 .283 .280-.023 .117 -.003 .274 1 .172 .103 .381 .138-.092 -.015 -.009 .346 .172 1 .248 .199 .334.750 -.045 -.089 -.034 .103 .248 1 -.051 .004
-.121 .016 -.014 .283 .381 .199 -.051 1 .210-.121 .034 -.028 .280 .138 .334 .004 .210 1
Population densityUrban populationUrban areaFund for urban
t ti dNumber of publict t ti hi lArea of paved roads Paved roads densityDaily living
ti f tPer capita public gre
Populationdensity
Urbanpopulation
Urbanarea
Fund forurban
constructionand
maintenanceper person
Number ofpublic
transportationvehicles per
1000000population
Area ofpavedroadsper
person
Pavedroads
density
Daily livingconsumptionof water per
person
Percapitapublicgreenareas
It could be seen that population density and paved roads density are highly correlated
and the correlation coefficient is 0.753. The correlation coefficient between urban
population and urban area is 0.609. The correlation coefficient between number of
public transportation vehicles per 1000000 populations and per capita daily
consumption of water for residential use is 0.529. It has been indicated that cities of
Cluster 1 has the following traits:
Maximum per capita daily consumption of water for residential use
Low urban area
High population density, urban population, per capita fund for urban construction and
maintenance, per capita public green areas
Table 9: The geographical and economical properties of Cluster 1
No. CL1 CL2 RL1 RL2 MinL1 MaxL1 MinL2 MaxL2 PI
112 112.2 24.3 11.0 11.3 106.8 117.8 18.1 29.5 13,14,17,18,19,20,23
PD UP UA CM PT APR PRD CW GL
7 7 2 7 6 5 5 10 7
Data in Table 9 are related to Cluster 1 and could prove the result of the correlation
- 17 -

table to some extent.
Table 9 reflects urban conditions from the following five aspects: urban population,
construction, transportation, water consumption and greening. These five aspects
could reflect the important theme of human development in 21st century about
population, resources and environment. Here, we call population, resources and
environment as “Man-land relation” for short. In the magazine “Economic Geography
of China” it was said that the main purpose of optimizing and harmonizing Man-land
relation in China is: minimum destruction of environment, maximum protection of
resources, steady population, and benefit optimization in harmonious development.
The approaches to optimization and harmony of Man-land relation in China are:
Popularize environmental education and strengthening consciousness of
environmental protection; Cherish lands and explore it to its most potential; Adjust
measures to local conditions and make efficient use of the advantages of various
natural resources; Establish the environmental accountability system; Bring the
development mode of resource saving and consumption moderation into effect; Make
more efforts to explore, utilize, renovate and protect resources; Control the population
growth strictly and improve population quality by carrying on Family Planning.
Here we introduce the concept of urban management. Mentioned in “Urban
management is innovation of modern urban development” by Zhu Tiezhen, vice board
chairperson of China Research Society of Urban Development, from the angle of
government, urban management means realizing the optimization and market
operation of urban natural resources, basic facilities and humanities by means of
market economy. Here natural resources refer to urban land, mountain, water and
space, etc. Basic facilities refer to urban electricity, paved roads, communication
network, etc; Humanities refer to urban human, cultural, technology and government
resources, etc. There are several resources that derives from the resources above, such
as information, brand, figure and attention resources, etc, which could serve for the
urban management. With the development of technology and urban modernization,
- 18 -

the intension and extension of urban management resources are being enriched, new
resources will be explored, and the content of urban management will be more and
more extensive. The fundamental point of the urban management theory is that cities
are valuable entities. Cities are products of productivity growth, social division of
labor, changes in superstructure and the relations of production, human labor and
civilization. All the carriers that form the urban spaces and functions are related to
human wisdom and labor. Therefore, cities are valuable objective existing and
treasure accumulated in the history of social development. Also cities are largest
state-owned assets. Urban management requires the portfolio of valuable urban
capital elements, activation and increment of static assets by market operation so that
society and urban economy could further develop.
B
Clustering based on Economic variables
I. Data Analysis
1. The economical variables. After we got the result comes from geographical data, we use the economical data and
reclassify the cities again in order to obtain an all-sided picture of the urbanization
and regionalization of China. The economical variables are listed below:
► Population density
► Urban population
► Urban area
► Per capita fund for urban construction and maintenance
► Per capita public green areas
► Number of public transportation vehicles per 1000000 population
- 19 -

► Area of paved roads per 10000 persons
► Density of paved roads
► Per capita daily consumption of water for residential use
2. Choose the number of groups in classification analysis
Basing the formula we discussed in Part A, using the same methods, we transform the
data of Agglomeration Schedule which we get at the beginning and consider the
increase of each step. The largest increase is 14.21%, as a result, we choose the
number of data whose increase does not exceed 10% of 14.21%. For the Group
number =619-605=14, we choose 14 as the number of clusters.
Aggl omer at i on Schedul e
0
1000
2000
3000
4000
5000
6000
1 40 79 118 157 196 235 274 313 352 391 430 469 508 547 586
系列1系列2系列3系列4
3. Classification analysis
Choose numbers of clusters as 14 and maximum iterations as 10, the output of
K-Means Cluster is listed as below.
Table 10
Number of Cases in each Cluster
1 3.000
2 1.000
Cluster
3 1.000
- 20 -

4 108.000
5 55.000
6 26.000
7 1.000
8 1.000
9 2.000
10 37.000
11 133.000
12 54.000
13 6.000
14 191.000
Valid 619.000
Missing .000
According to the output of the number of cities in each cluster above, we can see that
some clusters, such as cluster 1, 2, 2, 7 and 8, only have cities less than or equal to 3.
This kind of classification has nothing to do with the management improvement of
our government. In order to fit the guidance meaning of the classification, 5 clusters
should be more appropriate.
II. 5 Groups from the Economical data
Choose numbers of clusters as 5 and maximum iterations as 10, the output of
K-Means Cluster is listed as below.
Number of Cases in each Cluster
77.000149.000330.000
57.0006.000
619.000.000
12345
Cluster
ValidMissing
According to the membership of each cluster, we get the 3-D charts listed below:
- 21 -

Graph7:The geographical distribution of Cluster 1:
c
c
c
c
c
c
cc
c
ccc
cc
c
cc
c
c
c
c
c
c
c
c
c
c
c
cc
c
c
c
c
c
c
c
c
c
c
c
c
c
c
c
c
c
cc
c
c
c
c
c
c
c
c
c
c
c
c
c
c
c
cc
c
c
c
cc
c
c
c
c
c
c
Dot/Lines show First Values
Graph 8: The geographical distribution of Cluster 2:
]
]
]
]
]
]
]
]
]
]
]
]
]
]
]
]
]
]
]
]
]
]
]
]
]
]
]
]
]
]
]
]
]
]
]
]
]
]
]
]
]
]
]
]
]
]
]
]
]
]]
]
]
]
]]
]
]
]
]
]
]
]
]
]
]
]
]
]
]
]
]
]
]
]]]
]
]
]
]
]
]
]
]
]
]
]
]
]
]
]
]
]
]
]
]
]
]
]
]]
]
]
]
]
]
]
]
]
]
]
]
]
]
]
]
]
]
]
]
]
]
]
]
]
]
]
]
]
]
]
]
]
]
]
]
]
]
Dot/Lines show First Values
- 22 -
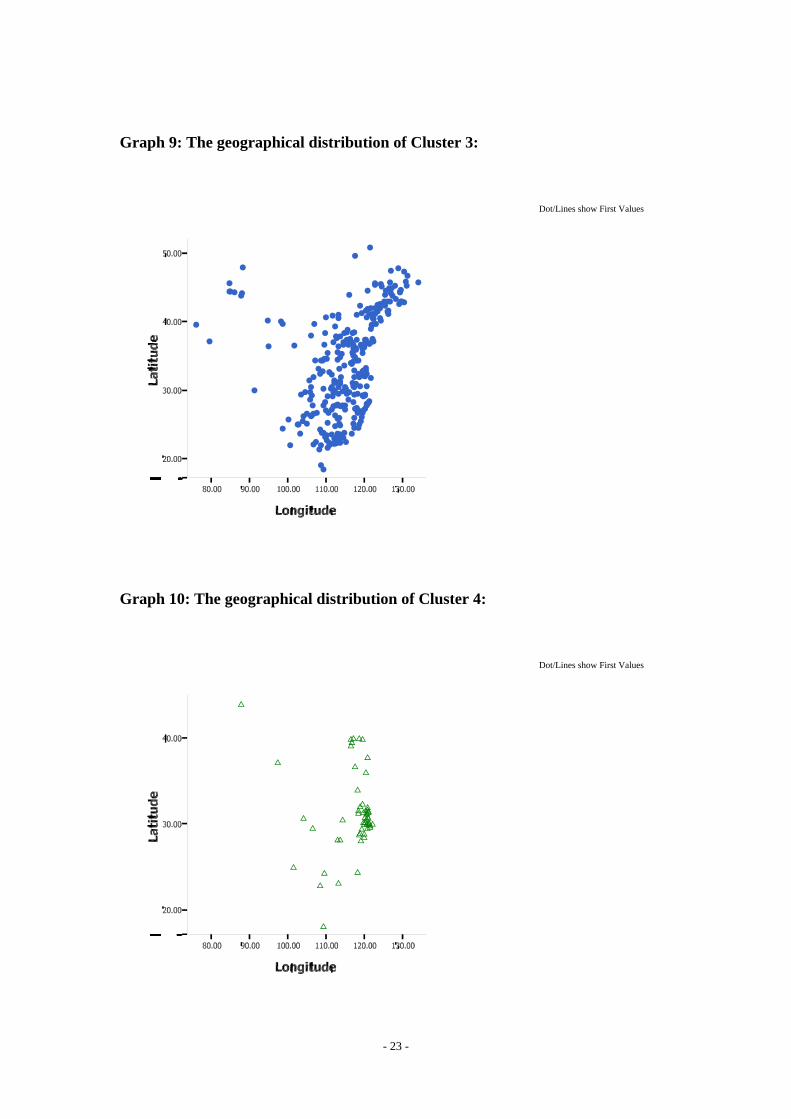
Graph 9: The geographical distribution of Cluster 3:
W
W
W
W
WW
W
W
W
W
W
W
W
W
W
W
W
W
WW
W
W
W
W
W
W
W
W
W
W
W
W
W
W
W
W
W
W
W
W
W
W
W
W
W
W
W
W
W
W
W
W
W
W
W
W
W
W
W
W
W
W
W
W
W
W
W
W
W
W
W
W
W
W
W
W
W
W
W
W
W
W
W
W
W
W
W
W
W
W
W
W
W
W
W
W
W
W
W
W
W
W
W
W
W
W
W
W
W
W
W
W
W
W
W
W
W
W
W
W
W
W
W
W
W
W
W
WW
W
W
W
W
W
W
W
W
W
W
W
W
W
W
W
W
W
W
W
W
W
W
W
W
W
W
W
W
WW
W
W
WW
W
W
W
W
W
W
W
W
W
W
W
W
W
W
W
W
W
WW
W
W
W
W
W
W
W
W
W
W
W
W
W
W
W
W
W
W
W
W
W
W
W
W
W
W
W
W
W
W
W
W
W
W
W
W
W
W
W
W
W
W
W
W
W
W
W
W
WW
W
W
W
W
W
W
W
W
W
W
W
W
W
WW
W
WW
WWW
W
WW
W
W
W
W
W
WW
W
W
W
W
W
W
W
W
W
W
W
W
W
W
W
W
W
W
W
W
W
W
W
W
W
WW
W
W
W
W
W
W
W
W
W
Dot/Lines show First Values
Graph 10: The geographical distribution of Cluster 4:
B
B
B
B
B
B
B
B
B
B
B
B
B
B
B
B
B
B
B
B
B
B
B
B
B
B
B
B
B
B
B
B
B
B
B
B
B
B
B
B
BB
B
B
B
B
B
B
B
B
B
BB
BBB
Dot/Lines show First Values
- 23 -
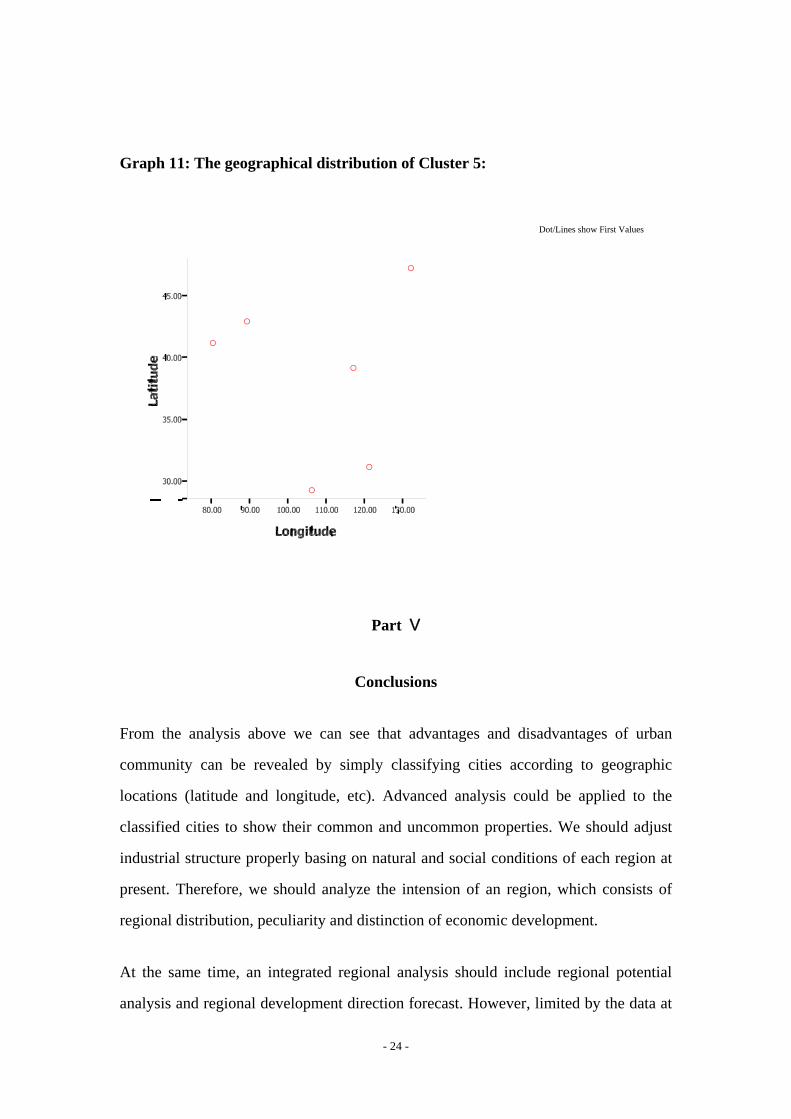
Graph 11: The geographical distribution of Cluster 5:
A
A
A
A
A
A
Dot/Lines show First Values
Part Ⅴ
Conclusions
From the analysis above we can see that advantages and disadvantages of urban
community can be revealed by simply classifying cities according to geographic
locations (latitude and longitude, etc). Advanced analysis could be applied to the
classified cities to show their common and uncommon properties. We should adjust
industrial structure properly basing on natural and social conditions of each region at
present. Therefore, we should analyze the intension of an region, which consists of
regional distribution, peculiarity and distinction of economic development.
At the same time, an integrated regional analysis should include regional potential
analysis and regional development direction forecast. However, limited by the data at
- 24 -

present, it is impossible to make an accurate forecast. This is one deficiency of this
essay.
Region is one of the basic concepts that are frequently used both in geography and
economics. As a set of cities having the same traits, region becomes the joint of
natural and cultural factors under research. The proper planning and development of
region become the very issue that every country confronts. Therefore, it is our
responsibility to harmonize man-land relationship and carry out continuous
development. Only by mastery of principles and traits can we ensure the
accomplishment of urbanization and regionalization.
Author: Boyuan Zhao, Hao Luo
- 25 -

- 26 -
References
1. “Data Mining, Technology of Customer Relationship Management”, Berri, Yuan
Wei, etc, CFEPH, 2004
2. “SPSS, Statistical Analysis Methods and Application”, Xue Wei, PHEI, 2004
3. “China Urban Statistics Year Book 2005”,China Statistics Press, 2005
4. “China Economic Geography”, Li Zhenquan, Yang Wanzhong, Lu Xinxian,
ECNUP, 2003
Related Documents