Application of Selection Mapping to Identify Genomic Regions Associated with Dairy Production in Sheep Beatriz Gutie ´ rrez-Gil 1 *, Juan Jose Arranz 1 , Ricardo Pong-Wong 2 , Elsa Garcı´a-Ga ´ mez 1 , James Kijas 3 , Pamela Wiener 2 1 Dpto. Produccio ´ n Animal, Universidad de Leo ´ n, Leo ´ n, Spain, 2 The Roslin Institute and R(D)SVS, University of Edinburgh, Roslin, Midlothian, United Kingdom, 3 Animal, Food and Health Sciences, CSIRO, Brisbane, Australia Abstract In Europe, especially in Mediterranean areas, the sheep has been traditionally exploited as a dual purpose species, with income from both meat and milk. Modernization of husbandry methods and the establishment of breeding schemes focused on milk production have led to the development of ‘‘dairy breeds.’’ This study investigated selective sweeps specifically related to dairy production in sheep by searching for regions commonly identified in different European dairy breeds. With this aim, genotypes from 44,545 SNP markers covering the sheep autosomes were analysed in both European dairy and non-dairy sheep breeds using two approaches: (i) identification of genomic regions showing extreme genetic differentiation between each dairy breed and a closely related non-dairy breed, and (ii) identification of regions with reduced variation (heterozygosity) in the dairy breeds using two methods. Regions detected in at least two breeds (breed pairs) by the two approaches (genetic differentiation and at least one of the heterozygosity-based analyses) were labeled as core candidate convergence regions and further investigated for candidate genes. Following this approach six regions were detected. For some of them, strong candidate genes have been proposed (e.g. ABCG2, SPP1), whereas some other genes designated as candidates based on their association with sheep and cattle dairy traits (e.g. LALBA, DGAT1A) were not associated with a detectable sweep signal. Few of the identified regions were coincident with QTL previously reported in sheep, although many of them corresponded to orthologous regions in cattle where QTL for dairy traits have been identified. Due to the limited number of QTL studies reported in sheep compared with cattle, the results illustrate the potential value of selection mapping to identify genomic regions associated with dairy traits in sheep. Citation: Gutie ´ rrez-Gil B, Arranz JJ, Pong-Wong R, Garcı ´a-Ga ´ mez E, Kijas J, et al. (2014) Application of Selection Mapping to Identify Genomic Regions Associated with Dairy Production in Sheep. PLoS ONE 9(5): e94623. doi:10.1371/journal.pone.0094623 Editor: Bernhard Kaltenboeck, Auburn University, United States of America Received November 19, 2013; Accepted March 19, 2014; Published May 1, 2014 Copyright: ß 2014 Gutie ´ rrez-Gil et al. This is an open-access article distributed under the terms of the Creative Commons Attribution License, which permits unrestricted use, distribution, and reproduction in any medium, provided the original author and source are credited. Funding: The authors gratefully acknowledge support from the Spanish Ministry of Economy and Competitiveness (Project AGL2009-07000), Institute Strategic Grant funding from the UK Biotechnology and Biological Sciences Research Council (BBSRC) and the financial support of the European Science Foundation through the GENOMIC-RESOURCES Exchange Grant awarded to Beatriz Gutierrez (EX/3723). BGG is funded through the Spanish ‘‘Ramo ´ n y Cajal’’ Programme from the Spanish Ministry of Economy and Competitiveness (State Secretariat for Research, Development and Innovation). The funders had no role in study design, data collection and analysis, decision to publish, or preparation of the manuscript. Competing Interests: The authors have declared that no competing interests exist. * E-mail: [email protected] Introduction Since their domestication 8 000–9 000 years ago (reviewed by [1]), sheep (Ovis aries) have been used by humans for the production of wool, meat and milk. Adaptation to very different geographic and climatic conditions and the specialization for specific characteristics have resulted in a phenotypically highly diverse species. The first documented modifications to sheep by human-imposed selection had taken place by the time that illustrations and records first appeared c. 3 000 BC and primarily concerned morphological and coat colour traits with the initial major morphological changes including reduction in the length of the legs, lengthening of the tail and alteration of horn shape [2]. Initially, sheep were kept solely for meat, milk and skins. Archaeological evidence suggests that selection for woolly sheep may have begun around 6000 BC. Dairy sheep are mainly found in Europe, especially in Mediterranean areas, where they have been traditionally exploited as a dual purpose species, with income from both meat and milk. Sheep milk has a higher solid content than cow or goat milk, which means that it is particularly suited to processing into cheese. Historically, most sheep milk has been produced by multipurpose local breeds with low-to-medium milk yields and raised under traditional husbandry conditions [3]. More recently, moderniza- tion of husbandry methods and the establishment of breeding schemes focused on milk production have led to the development of ‘‘dairy breeds’’, facilitated by the implementation of quantitative genetics-based breeding and the use of artificial insemination [2]. The market for sheep milk and sheep dairy products appears to be growing, even in those countries without a history of sheep dairying [4]. Selection sweep mapping strategies, in which regions of the genome are identified that show patterns consistent with positive selection, can be used as a complementary approach to linkage mapping and genome-wide association study (GWAS) analysis to identify regions of the genome that influence important traits in livestock. Various methods have been applied to livestock and other domesticated animals, with the aim of identifying genomic regions with characteristics that reflect the influence of selection: extended low diversity haplotypes [5], overall low heterozygosity PLOS ONE | www.plosone.org 1 May 2014 | Volume 9 | Issue 5 | e94623

Welcome message from author
This document is posted to help you gain knowledge. Please leave a comment to let me know what you think about it! Share it to your friends and learn new things together.
Transcript
Application of Selection Mapping to Identify GenomicRegions Associated with Dairy Production in SheepBeatriz Gutierrez-Gil1*, Juan Jose Arranz1, Ricardo Pong-Wong2, Elsa Garcıa-Gamez1, James Kijas3,
Pamela Wiener2
1 Dpto. Produccion Animal, Universidad de Leon, Leon, Spain, 2 The Roslin Institute and R(D)SVS, University of Edinburgh, Roslin, Midlothian, United Kingdom, 3 Animal,
Food and Health Sciences, CSIRO, Brisbane, Australia
Abstract
In Europe, especially in Mediterranean areas, the sheep has been traditionally exploited as a dual purpose species, withincome from both meat and milk. Modernization of husbandry methods and the establishment of breeding schemesfocused on milk production have led to the development of ‘‘dairy breeds.’’ This study investigated selective sweepsspecifically related to dairy production in sheep by searching for regions commonly identified in different European dairybreeds. With this aim, genotypes from 44,545 SNP markers covering the sheep autosomes were analysed in both Europeandairy and non-dairy sheep breeds using two approaches: (i) identification of genomic regions showing extreme geneticdifferentiation between each dairy breed and a closely related non-dairy breed, and (ii) identification of regions withreduced variation (heterozygosity) in the dairy breeds using two methods. Regions detected in at least two breeds (breedpairs) by the two approaches (genetic differentiation and at least one of the heterozygosity-based analyses) were labeled ascore candidate convergence regions and further investigated for candidate genes. Following this approach six regions weredetected. For some of them, strong candidate genes have been proposed (e.g. ABCG2, SPP1), whereas some other genesdesignated as candidates based on their association with sheep and cattle dairy traits (e.g. LALBA, DGAT1A) were notassociated with a detectable sweep signal. Few of the identified regions were coincident with QTL previously reported insheep, although many of them corresponded to orthologous regions in cattle where QTL for dairy traits have beenidentified. Due to the limited number of QTL studies reported in sheep compared with cattle, the results illustrate thepotential value of selection mapping to identify genomic regions associated with dairy traits in sheep.
Citation: Gutierrez-Gil B, Arranz JJ, Pong-Wong R, Garcıa-Gamez E, Kijas J, et al. (2014) Application of Selection Mapping to Identify Genomic Regions Associatedwith Dairy Production in Sheep. PLoS ONE 9(5): e94623. doi:10.1371/journal.pone.0094623
Editor: Bernhard Kaltenboeck, Auburn University, United States of America
Received November 19, 2013; Accepted March 19, 2014; Published May 1, 2014
Copyright: � 2014 Gutierrez-Gil et al. This is an open-access article distributed under the terms of the Creative Commons Attribution License, which permitsunrestricted use, distribution, and reproduction in any medium, provided the original author and source are credited.
Funding: The authors gratefully acknowledge support from the Spanish Ministry of Economy and Competitiveness (Project AGL2009-07000), Institute StrategicGrant funding from the UK Biotechnology and Biological Sciences Research Council (BBSRC) and the financial support of the European Science Foundationthrough the GENOMIC-RESOURCES Exchange Grant awarded to Beatriz Gutierrez (EX/3723). BGG is funded through the Spanish ‘‘Ramon y Cajal’’ Programme fromthe Spanish Ministry of Economy and Competitiveness (State Secretariat for Research, Development and Innovation). The funders had no role in study design,data collection and analysis, decision to publish, or preparation of the manuscript.
Competing Interests: The authors have declared that no competing interests exist.
* E-mail: [email protected]
Introduction
Since their domestication 8 000–9 000 years ago (reviewed by
[1]), sheep (Ovis aries) have been used by humans for the
production of wool, meat and milk. Adaptation to very different
geographic and climatic conditions and the specialization for
specific characteristics have resulted in a phenotypically highly
diverse species. The first documented modifications to sheep by
human-imposed selection had taken place by the time that
illustrations and records first appeared c. 3 000 BC and primarily
concerned morphological and coat colour traits with the initial
major morphological changes including reduction in the length of
the legs, lengthening of the tail and alteration of horn shape [2].
Initially, sheep were kept solely for meat, milk and skins.
Archaeological evidence suggests that selection for woolly sheep
may have begun around 6000 BC.
Dairy sheep are mainly found in Europe, especially in
Mediterranean areas, where they have been traditionally exploited
as a dual purpose species, with income from both meat and milk.
Sheep milk has a higher solid content than cow or goat milk,
which means that it is particularly suited to processing into cheese.
Historically, most sheep milk has been produced by multipurpose
local breeds with low-to-medium milk yields and raised under
traditional husbandry conditions [3]. More recently, moderniza-
tion of husbandry methods and the establishment of breeding
schemes focused on milk production have led to the development
of ‘‘dairy breeds’’, facilitated by the implementation of quantitative
genetics-based breeding and the use of artificial insemination [2].
The market for sheep milk and sheep dairy products appears to be
growing, even in those countries without a history of sheep
dairying [4].
Selection sweep mapping strategies, in which regions of the
genome are identified that show patterns consistent with positive
selection, can be used as a complementary approach to linkage
mapping and genome-wide association study (GWAS) analysis to
identify regions of the genome that influence important traits in
livestock. Various methods have been applied to livestock and
other domesticated animals, with the aim of identifying genomic
regions with characteristics that reflect the influence of selection:
extended low diversity haplotypes [5], overall low heterozygosity
PLOS ONE | www.plosone.org 1 May 2014 | Volume 9 | Issue 5 | e94623
(e.g. [6,7]), specific diversity patterns [8], extreme allele frequen-
cies [9] and between-breed differentiation [10,11,12]. Because of
their well-documented selection pressures and highly-developed
genetic resources, domesticated animal species also provide a
valuable resource with the potential to identify the molecular
pathways underlying phenotypic traits through the use of selection
mapping approaches [10,13].
To perform a search for signatures of selection related to dairy
production in sheep, we used genotypes obtained with the Illumina
OvineSNP50 BeadChip (Illumina Inc., San Diego, CA) for a number
of European breeds genotyped within the framework of the Sheep
HapMap Project [14]. These breeds include several selected
primarily for dairy production and others not used for dairy. In
order to specifically target regions under dairy-related selection
and not related to other traits that may have been under selection
in the sheep populations, only selection signatures commonly
identified in different European dairy breeds were considered. We
applied two approaches for the detection of selection sweeps: (i) we
looked for regions with extreme genetic differentiation between
each dairy breed and a closely related non-dairy breed, and (ii) we
looked for regions of the genome with reduced heterozygosity in
the dairy breeds using two methods. We then searched for
candidate genes that could be selection targets within the regions
that were identified in multiple breeds and using multiple analysis
methods. For these regions we also looked for correspondence with
previously reported QTL related to dairy production traits in
cattle or sheep. Although the selection history of dairy cattle is
quite different from that of dairy sheep, in particular because
breeding schemes in sheep are focused on more localized (and in
many cases isolated) breeds than the global dairy cattle population,
comparison of our results with studies in cattle allowed us to
evaluate whether some of the same regions/genes show evidence
of selection in both dairy sheep and dairy cattle.
Materials and Methods
DataSamples. We analysed a subset of the dataset generated in
the Ovine HapMap project [14], which included 5 dairy and 5
non-dairy sheep breeds (Table 1).
Genotypes. After an initial quality control procedure de-
scribed in detail elsewhere [14], this dataset provides the genotypes
of 49,034 SNPs (using the Illumina OvineSNP50 BeadChip) distrib-
uted across the 26 autosomal ovine chromosomes and chromo-
some X (only one of the markers genotyped belongs to
chromosome Y). Markers were filtered to exclude loci assigned
to unmapped contigs. The analyses reported here focused on the
remaining 44,545 of these SNP located on autosomes. The
positions of the markers according to the Sheep Genome Assembly
v2.0 (update September 2011) were used for the analyses.
Selection Sweep Mapping Analysis Methods
(i) Genetic differentiation: Pair-wise FST calculations.In order to search for genomic regions that have been under
divergent selection in dairy and non-dairy breeds, we
examined genetic differentiation across the genome for five
breed pairs. The selection of sheep breeds to serve as non-
dairy partners for dairy breeds was based on the shortest
divergence time estimates reported by the Sheep HapMap
project (based on the extent of haplotype sharing and
correlation of linkage disequilibrium values; Supplementary
Information Figure S10 and Figure 3 in [14]), and close
relationships according to additional Principal Component
Analyses (PCA) performed in a selection of breeds (described
in detail in File S1).
The following pairs of breeds of European ancestry were
considered in the differentiation analysis:
a. Chios (Greek, dairy) vs Sakiz (Turkey, non-specialized)
b. Churra (Spanish, dairy) vs Ojalada (Spanish, meat)
c. Comisana (Italian, dairy) vs Australian Poll Merino (Austra-
lian, originated in southwest Europe, wool)
d. East Friesian Brown (highly specialized dairy) vs Finnsheep
(Finland, primary wool, more recently used as a meat
producing breed)
e. Milk Lacaune (French, highly specialized dairy) vs Australian
Poll Merino (Australian, originated in southwest Europe,
wool)
f. Milk Lacaune (French, highly specialized dairy) vs Meat
Lacaune (French, meat)
For each of these pairs, unbiased estimates of Weir and
Cockerham’s FST [15], a measure of genetic differentiation, were
calculated as functions of variance components, as detailed in
Akey et al. [16]. This type of approach to selection mapping,
exploiting between-breed allele frequency differences, has been
applied in studies of humans [16] and domesticated animals
[10,11,12,17,18] where it has been demonstrated to be effective in
identifying genes that are associated with breed differentiation.
(ii) Reduced diversity: Observed heterozygosity. For all
the breeds included in the pair-wise FST calculations,
observed heterozygosity (ObsHtz) was calculated for each
SNP marker. This approach has previously been applied in
selection mapping studies of chickens [6,7], pigs [19] and
dogs [20].
(iii) Reduced diversity: Regression analysis for detec-tion of regions with asymptotic heterozygositypatterns. For all the breeds included in the pair-wise FST
calculations, tests of significant asymptotic relationships
between heterozygosity and distance from a test position
were performed across the genome based on the approach of
Wiener and Pong-Wong [8]. This method detects regions
with patterns of variation consistent with positive selection:
an asymptotic increase in marker variation (heterozygosity; y)
with increasing distance (x) from a selected locus y = A +B Rx
(where R is the asymptotic rate of increase; B is the difference
between heterozygosity at the test position and the
asymptotic level; A is the asymptotic level of heterozygosity).
For each regression (performed in Genstat, [21]), we
recorded the parameters of the asymptotic regression, their
standard errors, the significance level associated with the
regression (p) and the variance explained by the curve.
Positive and increasing regressions (0,R,1, B,0) were
considered as being in the direction predicted by positive
selection. Analysis of simulated data suggests improved
precision of this selection mapping approach compared to
an alternative haplotype-based method as well as robustness
to demographic influences [8].
Protocols for Selection Mapping AnalysesIn order to determine appropriate parameters for the above-
mentioned analyses, we investigated their behaviour on a test
genomic region encompassing the myostatin (GDF-8) gene, which
is known to have been under selection in the Texel breed (details
in File S2).
Window/bracket sizes. Based on the analysis of the
myostatin gene (File S2), window and bracket sizes for the three
methods were established. For the differentiation and reduced
heterozygosity analyses, FST and ObsHtz values, respectively, were
Selection Signatures in Dairy Sheep
PLOS ONE | www.plosone.org 2 May 2014 | Volume 9 | Issue 5 | e94623
averaged across sliding windows of 9 SNPs (FST-9SNPW, ObsHtz-
9SNPW). For the regression analysis, the test position was moved
every 50 Kb across each chromosome and all markers within
10 Mb of this position (10 Mb-bracket size) were considered in the
asymptotic regression. A –log(p) value was determined for each test
position.
Identification of selection signals by individual
methods. Evidence of positive selection was interpreted for
window estimates in the extreme of the empirical distributions, as
suggested by Akey et al. [10,16] and employed in various
subsequent studies (e.g. [11,13]. Specifically, we considered the
positions showing signatures of selection as the top 0.5th percent of
the distributions for differentiation (FST) and asymptotic regression
(–log(p), for regressions in the predicted direction) or the bottom
0.5th percent for observed heterozygosity. Based on the results of
the analysis of the myostatin gene (File S2), a selected ‘‘region’’ was
defined as the range of positions within 2 Mb of each other
showing evidence of selection by any of the three methods. An
additional criterion for selected regions was that they were
identified in at least two breed pairs, for FST, or two dairy breeds,
for heterozygosity-based methods (with distances up to 2 Mb
allowed between the regions identified for different breeds). For
genetic differentiation, we further required that regions of extreme
FST must be detected in at least two different pairs of dairy – non-
dairy breeds that did not share a common breed (e.g. top regions
found only in the Milk Lacaune-Australian Poll Merino and
Comisana-Australian Poll Merino but not in other studied pairs
were not included in the list of differentiated regions). By requiring
at least two breeds (or breed pairs) for the initial identification of
candidate regions for each methodology, this selection mapping
strategy will not identify dairy gene variants occurring in only one
breed.
Criteria for Identification of Regions with SharedSelection Signals
Based on the selected ‘‘regions’’ identified by the individual
methods through the overlapping of at least two breeds or breed
pairs, and taking into account that the FST-based method is
expected to specifically target traits relevant for dairy production,
whereas signals detected by heterozygosity-based methods may not
be specific for dairy-related selection, we defined a ‘‘convergent
candidate region’’ (CCR) as one where a signal was identified by
the pair-wise FST comparison and at least one of the reduced
heterozygosity methods. Hence, a CCR was labelled where there
was overlap between the position ranges of the candidate regions
identified by the genetic differentiation methodology and at least
one of the two heterozygosity-based methods, such that each CCR
was associated with a region identified in at least two breeds (breed
pairs) and using at least two different methods.
Identification of Candidate Genes within CCR RegionsWe identified the genes mapping to the end of each CCR using
the genome browser of the sheep genome reference sequence
(v2.0; http://www.livestockgenomics.csiro.au/cgi-bin/gbrowse/
oarv2.0/) and identified the corresponding orthologous regions
in the bovine genome (Cow (UMD3.1) using Ensembl (http://
www.ensembl.org/Bos_taurus/Info/Index). A systematic extrac-
tion of all the annotated genes contained within the orthologous
genomic ranges in cattle was performed using Biomart (www.
biomart.org). Subsequently, an exhaustive search was performed
for candidate genes previously linked to cattle dairy traits [22]. In
addition, genes not included in this database but reported as
candidate genes in the literature in relation to milk production or
dairy-related traits were also identified. We also looked for
correspondence with genes for which signatures of selection have
been reported in studies of dairy cattle [23,24,25] and sheep
[14,26].
We evaluated correspondence of the CCR with QTL reported
for milk production and other functional traits related to dairy
production in sheep (based on the SheepQTL database, http://
www.animalgenome.org/cgi-bin/QTLdb/OA/index). We also
examined overlap between the CCR and QTL influencing milk-
related traits, mastitis and other functional traits related to dairy
production in cattle (based on the CattleQTL database; http://
www.animalgenome.org/cgi-bin/QTLdb/BT/index), positioned
on the bovine genome reference sequence (UMD_version 3.1).
Results
Regions Identified by Individual MethodsGenetic differentiation. The level and range of the top
0.5% of FST values averaged in sliding windows of 9 SNPs (FST-
9SNPW) varied among the five breed pairs (Figure 1). The lowest
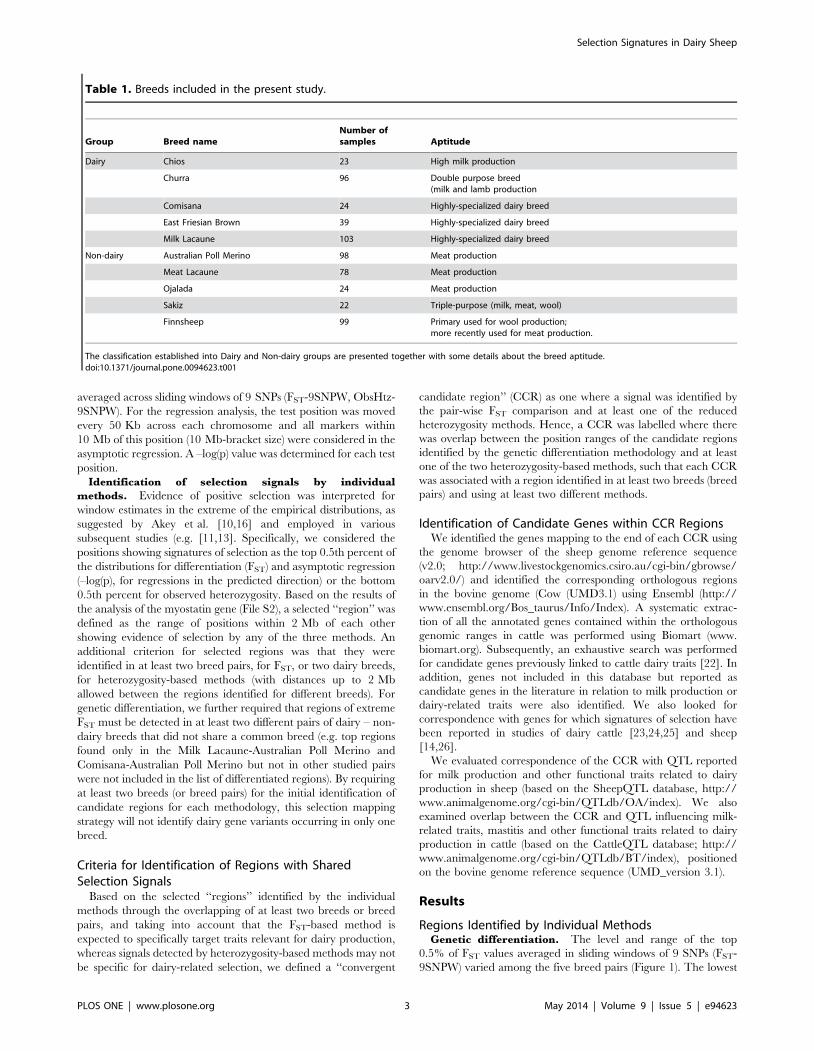
Table 1. Breeds included in the present study.
Group Breed nameNumber ofsamples Aptitude
Dairy Chios 23 High milk production
Churra 96 Double purpose breed(milk and lamb production
Comisana 24 Highly-specialized dairy breed
East Friesian Brown 39 Highly-specialized dairy breed
Milk Lacaune 103 Highly-specialized dairy breed
Non-dairy Australian Poll Merino 98 Meat production
Meat Lacaune 78 Meat production
Ojalada 24 Meat production
Sakiz 22 Triple-purpose (milk, meat, wool)
Finnsheep 99 Primary used for wool production;more recently used for meat production.
The classification established into Dairy and Non-dairy groups are presented together with some details about the breed aptitude.doi:10.1371/journal.pone.0094623.t001
Selection Signatures in Dairy Sheep
PLOS ONE | www.plosone.org 3 May 2014 | Volume 9 | Issue 5 | e94623
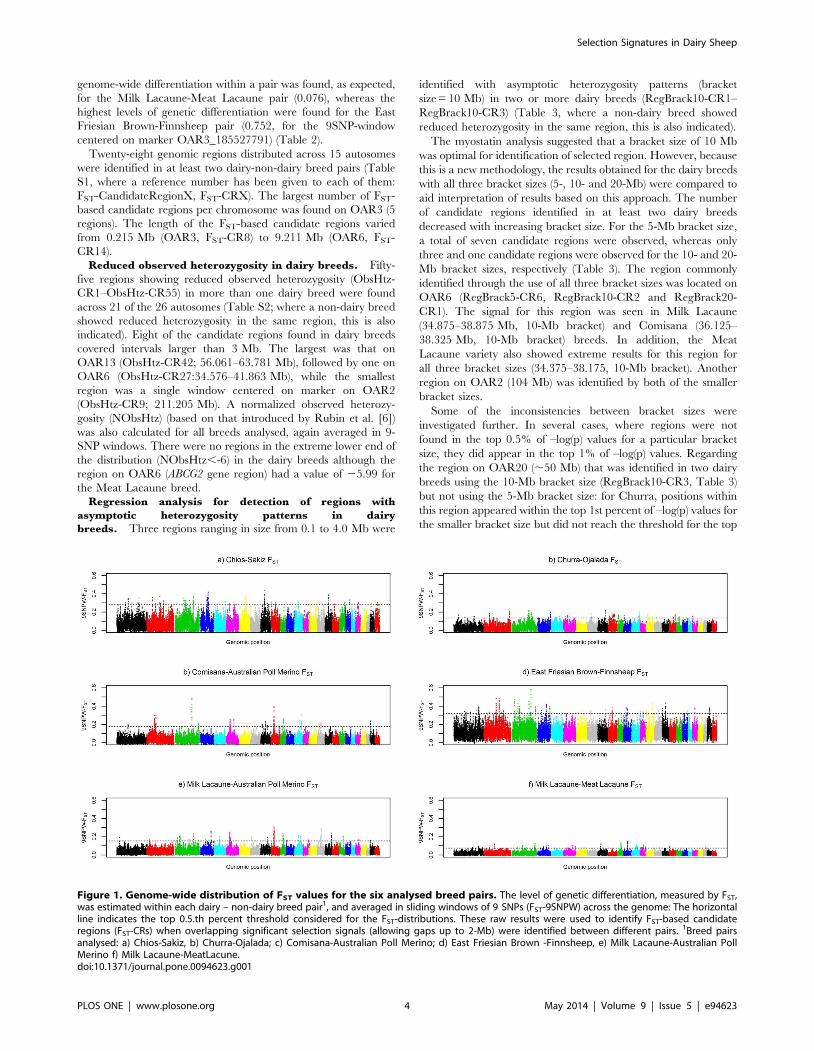
genome-wide differentiation within a pair was found, as expected,
for the Milk Lacaune-Meat Lacaune pair (0.076), whereas the
highest levels of genetic differentiation were found for the East
Friesian Brown-Finnsheep pair (0.752, for the 9SNP-window
centered on marker OAR3_185527791) (Table 2).
Twenty-eight genomic regions distributed across 15 autosomes
were identified in at least two dairy-non-dairy breed pairs (Table
S1, where a reference number has been given to each of them:
FST-CandidateRegionX, FST-CRX). The largest number of FST-
based candidate regions per chromosome was found on OAR3 (5
regions). The length of the FST-based candidate regions varied
from 0.215 Mb (OAR3, FST-CR8) to 9.211 Mb (OAR6, FST-
CR14).
Reduced observed heterozygosity in dairy breeds. Fifty-
five regions showing reduced observed heterozygosity (ObsHtz-
CR1–ObsHtz-CR55) in more than one dairy breed were found
across 21 of the 26 autosomes (Table S2; where a non-dairy breed
showed reduced heterozygosity in the same region, this is also
indicated). Eight of the candidate regions found in dairy breeds
covered intervals larger than 3 Mb. The largest was that on
OAR13 (ObsHtz-CR42; 56.061–63.781 Mb), followed by one on
OAR6 (ObsHtz-CR27:34.576–41.863 Mb), while the smallest
region was a single window centered on marker on OAR2
(ObsHtz-CR9; 211.205 Mb). A normalized observed heterozy-
gosity (NObsHtz) (based on that introduced by Rubin et al. [6])
was also calculated for all breeds analysed, again averaged in 9-
SNP windows. There were no regions in the extreme lower end of
the distribution (NObsHtz,-6) in the dairy breeds although the
region on OAR6 (ABCG2 gene region) had a value of 25.99 for
the Meat Lacaune breed.
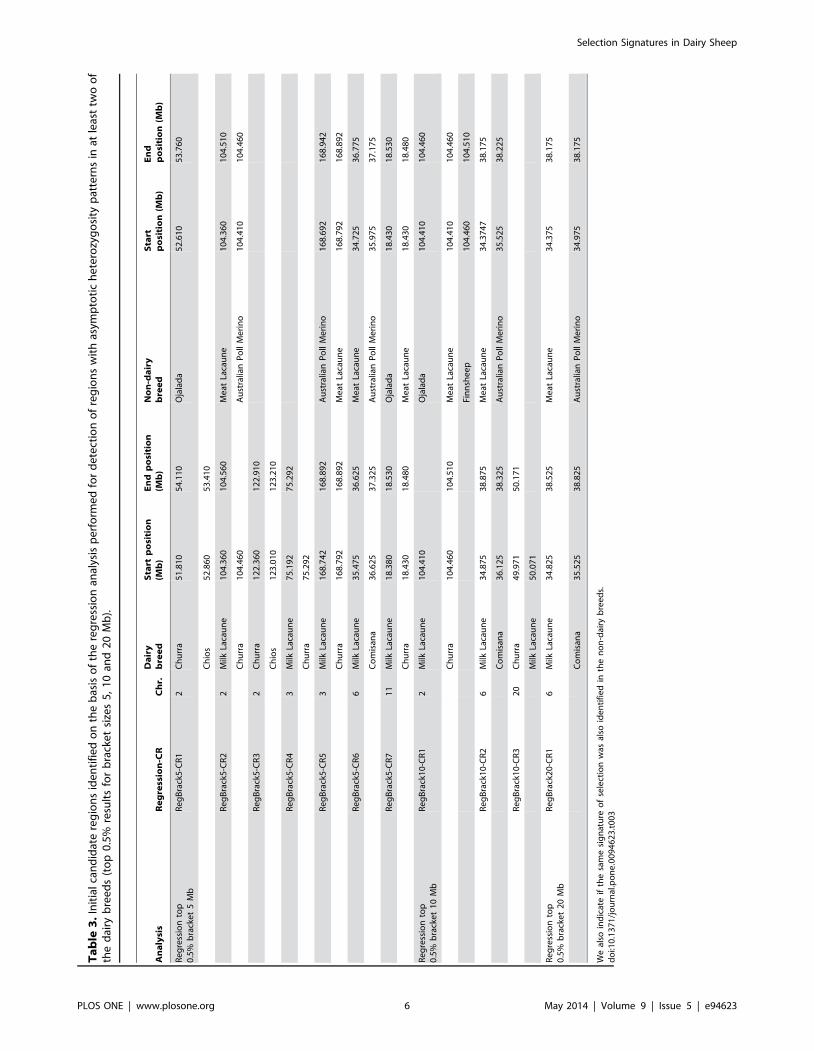
Regression analysis for detection of regions with
asymptotic heterozygosity patterns in dairy
breeds. Three regions ranging in size from 0.1 to 4.0 Mb were
identified with asymptotic heterozygosity patterns (bracket
size = 10 Mb) in two or more dairy breeds (RegBrack10-CR1–
RegBrack10-CR3) (Table 3, where a non-dairy breed showed
reduced heterozygosity in the same region, this is also indicated).
The myostatin analysis suggested that a bracket size of 10 Mb
was optimal for identification of selected region. However, because
this is a new methodology, the results obtained for the dairy breeds
with all three bracket sizes (5-, 10- and 20-Mb) were compared to
aid interpretation of results based on this approach. The number
of candidate regions identified in at least two dairy breeds
decreased with increasing bracket size. For the 5-Mb bracket size,
a total of seven candidate regions were observed, whereas only
three and one candidate regions were observed for the 10- and 20-
Mb bracket sizes, respectively (Table 3). The region commonly
identified through the use of all three bracket sizes was located on
OAR6 (RegBrack5-CR6, RegBrack10-CR2 and RegBrack20-
CR1). The signal for this region was seen in Milk Lacaune
(34.875–38.875 Mb, 10-Mb bracket) and Comisana (36.125–
38.325 Mb, 10-Mb bracket) breeds. In addition, the Meat
Lacaune variety also showed extreme results for this region for
all three bracket sizes (34.375–38.175, 10-Mb bracket). Another
region on OAR2 (104 Mb) was identified by both of the smaller
bracket sizes.
Some of the inconsistencies between bracket sizes were
investigated further. In several cases, where regions were not
found in the top 0.5% of –log(p) values for a particular bracket
size, they did appear in the top 1% of –log(p) values. Regarding
the region on OAR20 (,50 Mb) that was identified in two dairy
breeds using the 10-Mb bracket size (RegBrack10-CR3, Table 3)
but not using the 5-Mb bracket size: for Churra, positions within
this region appeared within the top 1st percent of –log(p) values for
the smaller bracket size but did not reach the threshold for the top
Figure 1. Genome-wide distribution of FST values for the six analysed breed pairs. The level of genetic differentiation, measured by FST,was estimated within each dairy – non-dairy breed pair1, and averaged in sliding windows of 9 SNPs (FST-9SNPW) across the genome: The horizontalline indicates the top 0.5.th percent threshold considered for the FST-distributions. These raw results were used to identify FST-based candidateregions (FST-CRs) when overlapping significant selection signals (allowing gaps up to 2-Mb) were identified between different pairs. 1Breed pairsanalysed: a) Chios-Sakiz, b) Churra-Ojalada; c) Comisana-Australian Poll Merino; d) East Friesian Brown -Finnsheep, e) Milk Lacaune-Australian PollMerino f) Milk Lacaune-MeatLacune.doi:10.1371/journal.pone.0094623.g001
Selection Signatures in Dairy Sheep
PLOS ONE | www.plosone.org 4 May 2014 | Volume 9 | Issue 5 | e94623
0.5th percent, whereas for Milk Lacaune, this region was identified
using both bracket sizes. Regarding the five regions (Table 3) that
were identified in two dairy breeds using 5-Mb bracket size but not
10-Mb, four of the regions were in the top 1st percent of –log(p)
values for one or both of the dairy breeds. Two of these regions
(RegBrack5-CR1 and RegBrack5-CR3) were found in Chios and
Churra, however, while these regions were found for Churra using
both the 5- and 10-Mb bracket sizes, for the 10-Mb bracket size,
the top –log(p) values for Chios were dominated by regions on
OAR13 and OAR16, which did not feature in the top –log(p)
values for the other dairy breeds. Thus, these Chios-specific signals
may have overwhelmed the more general dairy signals for the
larger bracket size in this breed. The region labelled as
RegBrack5-CR4, identified at ,75 Mb on OAR3 for Churra
and Milk Lacaune using the 5-Mb bracket size, did not feature in
the top 1st percent of the –log(p) values for the 10-Mb bracket for
either of these breeds. It is worth noting that regions identified
using one bracket size but not a smaller one could reflect more
recent selection events for which the pattern of heterozygosity with
respect to distance from the selected locus appears linear rather
than asymptotic in the smaller bracket.
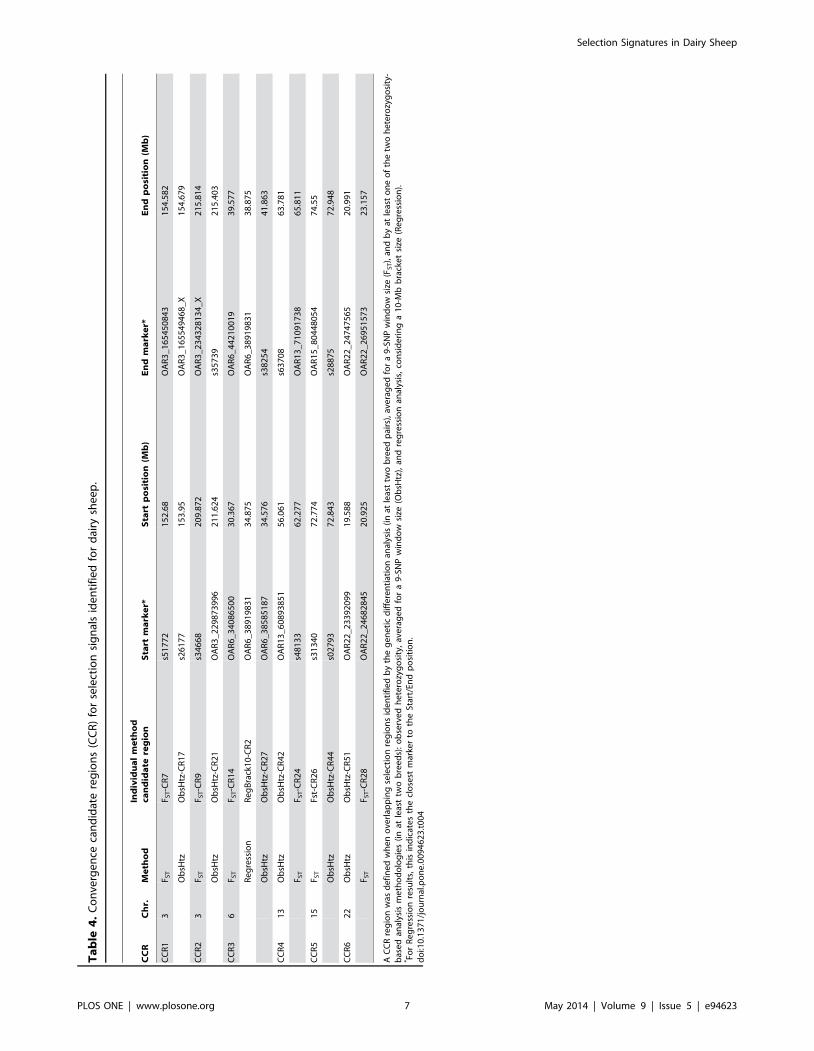
Convergence Candidate Regions (CCR)Six candidate regions were detected in at least two breed pairs
by the pair-wise FST comparison and in at least two breeds by a
heterozygosity-based analysis (Table 4). One of the regions, CCR3
(OAR6:30.367–41.863 Mb), was identified by all three analysis
methods. The orthologous bovine genomic regions corresponding
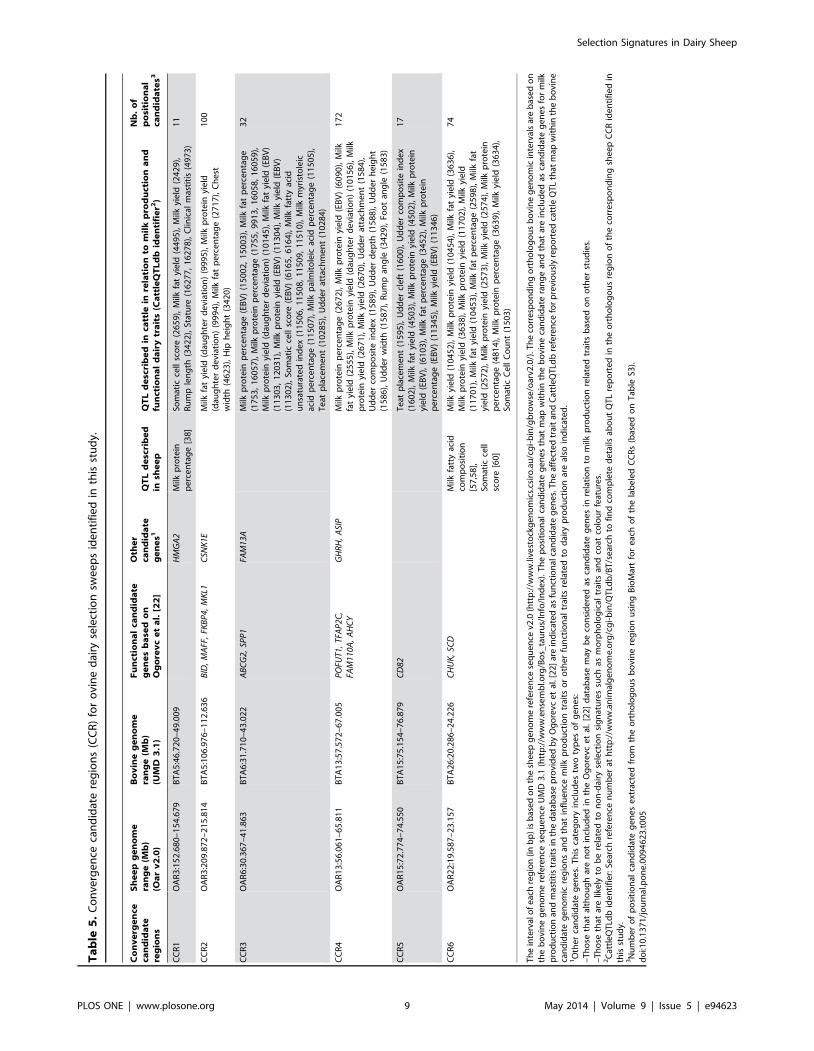
to each of the CCR are shown in Table 5. A total of 406 genes
(positional candidate genes) were found in these six core regions
(Table S3). There were three other regions where an FST-CR
signals was less than 1 Mb from an ObsHtz-CR signal
(OAR3:18.648–19.360 Mb, OAR3:167.711–168.959 Mb, and
OAR13:95.801–98.865 Mb) but because they did not overlap,
they were not considered as CCR.
Among the positional candidate genes extracted from the six
CCRs, a search for functional candidates for milk production traits
and mastitis was performed by comparison with the genes
included in the Ogorevc et al. [22] database of cattle candidate
genes for dairy-related traits. A total of 13 genes were common to
these two lists (Table 5). The evidence for relationships with milk
production traits for these genes was based on the different aspects
considered in the Ogorevc et al. [22] database such as gene
expression studies related to mammary gland (TFAP2C, FAM110A,
CD82, ABCG2) or mastitis (BID, MAFF, AHCY), mouse model
studies in which gene knockouts or expression of transgenes
resulted in phenotypes associated with the mammary gland
(FKBP4, MKL1, POFUT1, CHUK) and association studies of milk
production traits (ABCG2, SPP1, SCD).
In order to assess whether there was greater overlap between the
CCRs and candidate genes than expected by chance, we
repeatedly (1 000 000 times) assigned regions of the same length
as the CCR at random positions on the bovine genome and
checked overlap with all candidate genes from the Ogorevc et al.
[22] database that could be positioned on the bovine genome (423
genes). Although we could not do the test with the sheep genome
as the annotation is not as complete, the length of the sheep and
bovine genomes is very similar and so we expect this test would
provide similar results. The number of overlaps between CCR
regions and candidate genes based on a model with random
positioning of CCR regions was very different from the actual
situation: only 8.4% of the replicates contained any overlaps and
the maximum number of overlaps was 4.
Some other positional candidate genes not included in the
Ogorevc et al. [22] database were identified as possible functional
candidates based on their known biological function and an
exhaustive literature review of reported signatures of selection in
dairy cattle (Table 5). There was also correspondence between the
CCR and QTL previously reported in dairy cattle and sheep for
milk production traits or functional traits related to dairy
production (Table 5), which is discussed below.
Discussion
This study reports the first genome-wide analysis of regions
under selection for dairy traits in sheep. For this we have used the
valuable information generated in the International Sheep
HapMap project [14], through the use of the Illumina OvineSNP50
BeadChip, to evaluate a range of European sheep breeds that have
been selected for dairy production. With the aim of identifying the
signatures of selection specifically due to dairy selection and not
related to other traits that may have been selection target in the
studied sheep populations (e.g. coat colour), we also included in
our study other non-dairy European sheep breeds. Furthermore,
because of the difficulties in distinguishing between the effects
caused in the genome by genuine selective sweeps rather than
demographic events such as population expansion or contraction
[16], we used three different analysis methods and only considered
for further exploration those six regions identified by the FST-
based method and at least one of the two heterozygosity-based
methodologies.
Candidate Dairy Selection RegionsBased on the convergence among the three different analysis
methods, six core regions were identified as candidate regions
under positive selection in dairy sheep. Based on the comparison
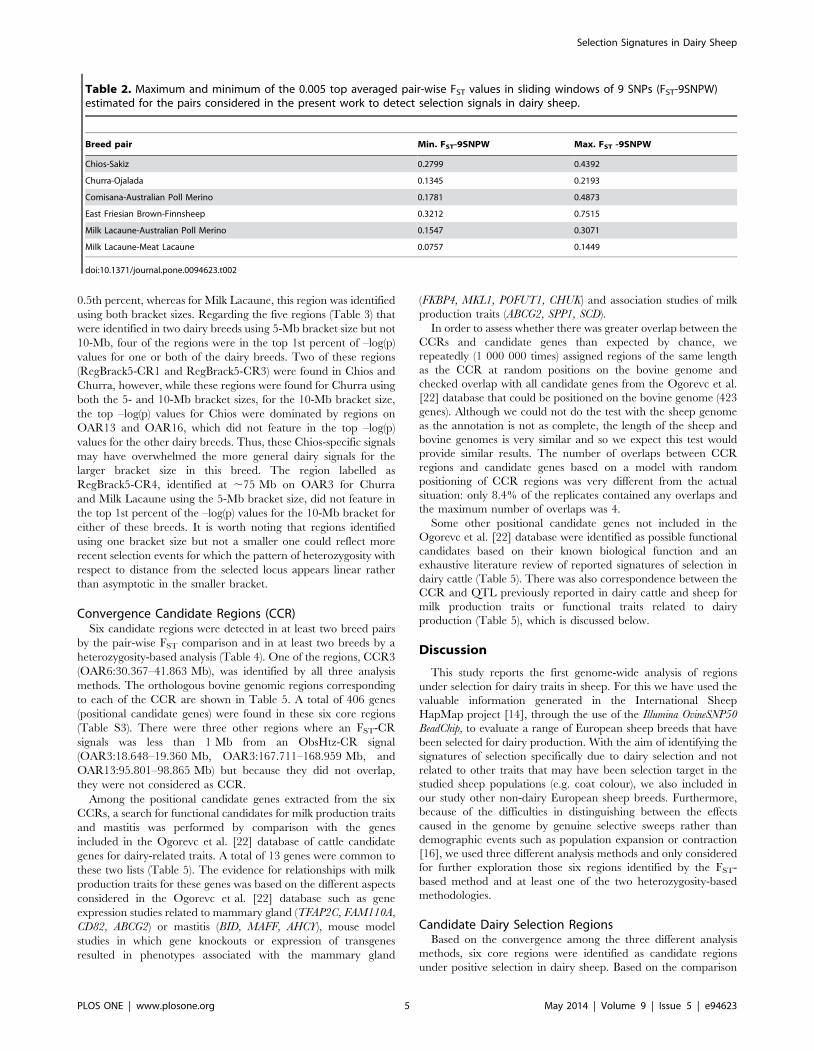
Table 2. Maximum and minimum of the 0.005 top averaged pair-wise FST values in sliding windows of 9 SNPs (FST-9SNPW)estimated for the pairs considered in the present work to detect selection signals in dairy sheep.
Breed pair Min. FST-9SNPW Max. FST -9SNPW
Chios-Sakiz 0.2799 0.4392
Churra-Ojalada 0.1345 0.2193
Comisana-Australian Poll Merino 0.1781 0.4873
East Friesian Brown-Finnsheep 0.3212 0.7515
Milk Lacaune-Australian Poll Merino 0.1547 0.3071
Milk Lacaune-Meat Lacaune 0.0757 0.1449
doi:10.1371/journal.pone.0094623.t002
Selection Signatures in Dairy Sheep
PLOS ONE | www.plosone.org 5 May 2014 | Volume 9 | Issue 5 | e94623
Ta
ble
3.
Init
ial
can
did
ate
reg
ion
sid
en
tifi
ed
on
the
bas
iso
fth
ere
gre
ssio
nan
alys
isp
erf
orm
ed
for
de
tect
ion
of
reg
ion
sw
ith
asym
pto
tic
he
tero
zyg
osi
typ
atte
rns
inat
leas
ttw
oo
fth
ed
airy
bre
ed
s(t
op
0.5
%re
sult
sfo
rb
rack
et
size
s5
,1
0an
d2
0M
b).
An
aly
sis
Re
gre
ssio
n-C
RC
hr.
Da
iry
bre
ed
Sta
rtp
osi
tio
n(M
b)
En
dp
osi
tio
n(M
b)
No
n-d
air
yb
ree
dS
tart
po
siti
on
(Mb
)E
nd
po
siti
on
(Mb
)
Re
gre
ssio
nto
p0
.5%
bra
cke
t5
Mb
Re
gB
rack
5-C
R1
2C
hu
rra
51
.81
05
4.1
10
Oja
lad
a5
2.6
10
53
.76
0
Ch
ios
52
.86
05
3.4
10
Re
gB
rack
5-C
R2
2M
ilkLa
cau
ne
10
4.3
60
10
4.5
60
Me
atLa
cau
ne
10
4.3
60
10
4.5
10
Ch
urr
a1
04
.46
0A
ust
ralia
nP
oll
Me
rin
o1
04
.41
01
04
.46
0
Re
gB
rack
5-C
R3
2C
hu
rra
12
2.3
60
12
2.9
10
Ch
ios
12
3.0
10
12
3.2
10
Re
gB
rack
5-C
R4
3M
ilkLa
cau
ne
75
.19
27
5.2
92
Ch
urr
a7
5.2
92
Re
gB
rack
5-C
R5
3M
ilkLa
cau
ne
16
8.7
42
16
8.8
92
Au
stra
lian
Po
llM
eri
no
16
8.6
92
16
8.9
42
Ch
urr
a1
68
.79
21
68
.89
2M
eat
Laca
un
e1
68
.79
21
68
.89
2
Re
gB
rack
5-C
R6
6M
ilkLa
cau
ne
35
.47
53
6.6
25
Me
atLa
cau
ne
34
.72
53
6.7
75
Co
mis
ana
36
.62
53
7.3
25
Au
stra
lian
Po
llM
eri
no
35
.97
53
7.1
75
Re
gB
rack
5-C
R7
11
Milk
Laca
un
e1
8.3
80
18
.53
0O
jala
da
18
.43
01
8.5
30
Ch
urr
a1
8.4
30
18
.48
0M
eat
Laca
un
e1
8.4
30
18
.48
0
Re
gre
ssio
nto
p0
.5%
bra
cke
t1
0M
bR
eg
Bra
ck1
0-C
R1
2M
ilkLa
cau
ne
10
4.4
10
Oja
lad
a1
04
.41
01
04
.46
0
Ch
urr
a1
04
.46
01
04
.51
0M
eat
Laca
un
e1
04
.41
01
04
.46
0
Fin
nsh
ee
p1
04
.46
01
04
.51
0
Re
gB
rack
10
-CR
26
Milk
Laca
un
e3
4.8
75
38
.87
5M
eat
Laca
un
e3
4.3
74
73
8.1
75
Co
mis
ana
36
.12
53
8.3
25
Au
stra
lian
Po
llM
eri
no
35
.52
53
8.2
25
Re
gB
rack
10
-CR
32
0C
hu
rra
49
.97
15
0.1
71
Milk
Laca
un
e5
0.0
71
Re
gre
ssio
nto
p0
.5%
bra
cke
t2
0M
bR
eg
Bra
ck2
0-C
R1
6M
ilkLa
cau
ne
34
.82
53
8.5
25
Me
atLa
cau
ne
34
.37
53
8.1
75
Co
mis
ana
35
.52
53
8.8
25
Au
stra
lian
Po
llM
eri
no
34
.97
53
8.1
75
We
also
ind
icat
eif
the
sam
esi
gn
atu
reo
fse
lect
ion
was
also
ide
nti
fie
din
the
no
n-d
airy
bre
ed
s.d
oi:1
0.1
37
1/j
ou
rnal
.po
ne
.00
94
62
3.t
00
3
Selection Signatures in Dairy Sheep
PLOS ONE | www.plosone.org 6 May 2014 | Volume 9 | Issue 5 | e94623
Ta
ble
4.
Co
nve
rge
nce
can
did
ate
reg
ion
s(C
CR
)fo
rse
lect
ion
sig
nal
sid
en
tifi
ed
for
dai
rysh
ee
p.
CC
RC
hr.
Me
tho
dIn
div
idu
al
me
tho
dca
nd
ida
tere
gio
nS
tart
ma
rke
r*S
tart
po
siti
on
(Mb
)E
nd
ma
rke
r*E
nd
po
siti
on
(Mb
)
CC
R1
3F S
TF
ST-C
R7
s51
77
21
52
.68
OA
R3
_1
65
45
08
43
15
4.5
82
Ob
sHtz
Ob
sHtz
-CR
17
s26
17
71
53
.95
OA
R3
_1
65
54
94
68
_X
15
4.6
79
CC
R2
3F S
TF
ST-C
R9
s34
66
82
09
.87
2O
AR
3_
23
43
28
13
4_
X2
15
.81
4
Ob
sHtz
Ob
sHtz
-CR
21
OA
R3
_2
29
87
39
96
21
1.6
24
s35
73
92
15
.40
3
CC
R3
6F S
TF
ST-C
R1
4O
AR
6_
34
08
65
00
30
.36
7O
AR
6_
44
21
00
19
39
.57
7
Re
gre
ssio
nR
eg
Bra
ck1
0-C
R2
OA
R6
_3
89
19
83
13
4.8
75
OA
R6
_3
89
19
83
13
8.8
75
Ob
sHtz
Ob
sHtz
-CR
27
OA
R6
_3
85
85
18
73
4.5
76
s38
25
44
1.8
63
CC
R4
13
Ob
sHtz
Ob
sHtz
-CR
42
OA
R1
3_
60
89
38
51
56
.06
1s6
37
08
63
.78
1
F ST
FS
T-C
R2
4s4
81
33
62
.27
7O
AR
13
_7
10
91
73
86
5.8
11
CC
R5
15
F ST
Fst-
CR
26
s31
34
07
2.7
74
OA
R1
5_
80
44
80
54
74
.55
Ob
sHtz
Ob
sHtz
-CR
44
s02
79
37
2.8
43
s28
87
57
2.9
48
CC
R6
22
Ob
sHtz
Ob
sHtz
-CR
51
OA
R2
2_
23
39
20
99
19
.58
8O
AR
22
_2
47
47
56
52
0.9
91
F ST
FS
T-C
R2
8O
AR
22
_2
46
82
84
52
0.9
25
OA
R2
2_
26
95
15
73
23
.15
7
AC
CR
reg
ion
was
de
fin
ed
wh
en
ove
rlap
pin
gse
lect
ion
reg
ion
sid
en
tifi
ed
by
the
ge
ne
tic
dif
fere
nti
atio
nan
alys
is(i
nat
leas
ttw
ob
ree
dp
airs
),av
era
ge
dfo
ra
9-S
NP
win
do
wsi
ze(F
ST),
and
by
atle
ast
on
eo
fth
etw
oh
ete
rozy
go
sity
-b
ase
dan
alys
ism
eth
od
olo
gie
s(i
nat
leas
ttw
ob
ree
ds)
:o
bse
rve
dh
ete
rozy
go
sity
,av
era
ge
dfo
ra
9-S
NP
win
do
wsi
ze(O
bsH
tz),
and
reg
ress
ion
anal
ysis
,co
nsi
de
rin
ga
10
-Mb
bra
cke
tsi
ze(R
eg
ress
ion
).* Fo
rR
eg
ress
ion
resu
lts,
this
ind
icat
es
the
clo
sest
mar
ker
toth
eSt
art/
End
po
siti
on
.d
oi:1
0.1
37
1/j
ou
rnal
.po
ne
.00
94
62
3.t
00
4
Selection Signatures in Dairy Sheep
PLOS ONE | www.plosone.org 7 May 2014 | Volume 9 | Issue 5 | e94623
to predicted overlaps for randomly-positioned CCR, these regions
were highly enriched for candidate dairy-related loci. We discuss
further the CCR regions that meet specific criteria.
Region Identified by all the Three Methods– CCR3 (OAR6:30.367–41.863 Mb). The three analysis
methods identified this region of positive selection in the first
half of OAR6, which includes the ABCG2 (ATP-binding
cassette, sub-family G (white), member 2) and SPP1 (osteo-
pontin) genes (at 36.565–36.610 Mb and 36.708–36.720 Mb
respectively), and is orthologous to the region of the bovine
genome on BTA6 where several QTL for milk production
traits have been reported (See Table 5 for QTL identifier
number in the CattleQTLdb). This region also includes the
FAM13A (family with sequence similarity 13, member A) gene,
which has been shown to be associated with mastitis in Jersey
cows [27]. In dairy cattle, strong selection signals have
previously been identified [23,24] in the proximity of the
ABCG2 gene, which harbors one of the few causal mutations or
Quantitative Trait Nucleotide (QTN) described in livestock
species [28]. In sheep, a selection signal in the ABCG2 region
has also been identified in a work focused on Altamurana
sheep, where differences in allele frequencies were compared
for animals with high and low milk yields [29].
The identification of a selection signature in this region of
OAR6 by the pair-wise FST comparison (FST-CR14) was based on
four breed pairs. For the Milk Lacaune-Australian Poll Merino
and the Comisana-Australian Poll Merino pairs, the signal of
genetic differentiation involved the ABCG2 and SPP1 genes,
whereas for the two other pairs, the identified signal was upstream
(Chios-Sakiz; OAR6:30.367–30.380 Mb) or downstream (Churra-
Ojalada; OAR6:39.316–39.577 Mb) of these genes. The ObsHtz
analysis showed a selection signal (ObsHtz-CR27) for Milk
Lacaune, Comisana and Churra dairy breeds, and also for three
non-dairy breeds, Australian Poll Merino, Meat Lacaune and
Ojalada. Both Lacaune breeds showed low values of ObsHtz
extended for long intervals (3.48 and 5.47 Mb for Milk Lacaune
and Meat Lacaune, respectively). With regard to the regression-
based analysis, this region was the only one detected in multiple
breeds for all three bracket sizes (for Milk Lacaune, Comisana,
Meat Lacaune and Australian Poll Merino breeds).
Together these results suggest that CCR3 shows selection for
dairy traits in several sheep breeds, and that this signal may be
related to the documented effects of the ABCG2 [28] or SPP1 [30]
genes on milk production and lactation regulation, respectively.
The selection signal positioned directly at ABCG2 and SPP1 was
only seen in the highly specialized breeds Milk Lacaune and
Comisana (FST, ObsHtz and Regression). In other dairy breeds for
which the selection is more recent and less efficient (e.g. Churra
and Chios), selection may not have substantially altered the
frequencies of favoured alleles at these loci, which could explain
why a strong selection signal directly at these genes was not
observed. A previous study in Churra sheep found suggestive
associations between the ABCG2 gene and milk fat percentage and
milk yield [31] while no studies to date have tested the effects of
these two genes on dairy traits in the Lacaune and Comisana
breeds.
The results reported in the current study also suggest that in this
region of OAR6 there could be a selection signal related to meat
specialized breeds such as Meat Lacaune, Australian Poll Merino
and Ojalada. In this regard, it is worth noting that several QTL for
growth and carcass traits have been described in the orthologous
bovine region [32,33]. Hence, analogous to the observations in the
orthologous bovine region, this region of the sheep genome may
influence both dairy and meat production traits.
Regions with High FST in more than Two Breed PairsThis criterion was used to highlight the CCR regions where the
genetic differentiation analysis showed a particularly strong
indication of a dairy selection signature, as this is possibly the
most effective analysis performed in this study to detect regions
specifically affected by dairy selection rather than selection acting
on non-dairy-related traits. With the aim of establishing stringent
criteria we consider in this section only those regions where more
than two breed pairs (none sharing a common breed, as explained
above) showed the selection signal. In addition to CCR3 discussed
above, this category also includes the following two regions:
– CCR1 (OAR3:152.680 to 154.679 Mb). This core region,
for which the FST-selection signals were identified for the
Churra-Ojalada, Comisana-Australian Poll Merino and East
Friesian Brown-Finnsheep pairs, includes HMGA2 (high
mobility group AT-hook 2), a gene associated with human
stature [34]. The identification of this gene as a selection target
was also found in an analysis of dogs with divergent stature
[10]. The bovine region orthologous to CCR1 includes QTL
related to stature (with the HMGA2 gene suggested as a possible
causative locus [35]) and rump length (see Table 5). Hence, the
CCR1 signal identified in the present study might indicate
selection targeting sheep body conformation traits. This
hypothesis would agree with the differences in body size
between some of the pairs involved in this selection signal. For
example, the adult weight of Australian Poll Merino is
significantly higher than that of Lacaune and Comisana;
Churra and East Friesian Brown are also generally heavier
than their comparison breeds. HGMA2 has also been suggested
as a candidate gene related to ear size and shape in both pigs
and dogs [36,37], thus further investigation is required to assess
whether there are differences in ear morphology between the
sheep breeds showing this selection signal. Although the
confidence interval of a QTL for protein percentage reported
in Churra sheep [38] (Table 5) overlaps with CCR1, the causal
mutation for that QTL was later found in the LALBA gene
[39], which maps outside of this core region.
– CCR2 (OAR3:209.872–215.814 Mb). Four candidate
genes in the orthologous bovine region to this CCR (distal
end of BTA5) were identified from the Ogorevc et al. [22]
database. Two of them were related to mastitis in a disease-
induced mouse-model study [40]: BID (BH3 interacting
domain death agonist), which is a pro-apoptotic induced gene,
and MAFF (v-maf avian musculoaponeurotic fibrosarcoma
oncogene homolog F), which is related to cell proliferation. The
identification of two other genes as candidates for dairy traits in
this regions, FKBP4 (FK506 binding protein 4) and MLK1
(mixed lineage protein kinase), was also based on mouse model
studies (http://www.informatics.jax.org/). Furthermore,
FKBP4 is expressed in breast cancer tissue (Genes-to-Systems
Breast Cancer database, G2SBC, http://www.itb.cnr.it/
breastcancer//index.html) and MLK1 is expressed in epithelial
tumor cell lines of colonic, breast and esophageal origin [41].
QTL effects described in the bovine region orthologous to
CCR2 (on BTA5) influence milk production and some
conformation traits (Table 5). A previous study in dairy cows
found a selection signature in this region [23]. In that case, the
gene displaying the strongest evidence of selection was CD163,
which is involved in the innate immune response and clearance
of plasma hemoglobin [42]. This region also includes the gene
coding for CSNK1e (casein-kinase epsilon), which is related to
Selection Signatures in Dairy Sheep
PLOS ONE | www.plosone.org 8 May 2014 | Volume 9 | Issue 5 | e94623
Ta
ble
5.
Co
nve
rge
nce
can
did
ate
reg
ion
s(C
CR
)fo
ro
vin
ed
airy
sele
ctio
nsw
ee
ps
ide
nti
fie
din
this
stu
dy.
Co
nv
erg
en
ceca
nd
ida
tere
gio
ns
Sh
ee
pg
en
om
era
ng
e(M
b)
(Oa
rv
2.0
)
Bo
vin
eg
en
om
era
ng
e(M
b)
(UM
D3
.1)
Fu
nct
ion
al
can
did
ate
ge
ne
sb
ase
do
nO
go
rev
ce
ta
l.[2
2]
Oth
er
can
did
ate
ge
ne
s1Q
TL
de
scri
be
din
she
ep
QT
Ld
esc
rib
ed
inca
ttle
inre
lati
on
tom
ilk
pro
du
ctio
na
nd
fun
ctio
na
ld
air
ytr
ait
s(C
att
leQ
TL
db
ide
nti
fie
r2)
Nb
.o
fp
osi
tio
na
lca
nd
ida
tes3
CC
R1
OA
R3
:15
2.6
80
–1
54
.67
9B
TA
5:4
6.7
20
–4
9.0
09
HM
GA
2M
ilkp
rote
inp
erc
en
tag
e[3
8]
Som
atic
cell
sco
re(2
65
9),
Milk
fat
yie
ld(4
49
5),
Milk
yie
ld(2
42
9),
Ru
mp
len
gth
(34
22
),St
atu
re(1
62
77
,1
62
78
),C
linic
alm
asti
tis
(49
73
)1
1
CC
R2
OA
R3
:20
9.8
72
–2
15
.81
4B
TA
5:1
06
.97
6–
11
2.6
36
BID
,M
AFF
,FK
BP
4,M
KL1
CSN
K1E
Milk
fat
yie
ld(d
aug
hte
rd
evi
atio
n)
(99
95
),M
ilkp
rote
inyi
eld
(dau
gh
ter
de
viat
ion
)(9
99
4),
Milk
fat
pe
rce
nta
ge
(27
17
),C
he
stw
idth
(46
23
),H
iph
eig
ht
(34
20
)
10
0
CC
R3
OA
R6
:30
.36
7–
41
.86
3B
TA
6:3
1.7
10
–4
3.0
22
AB
CG
2,SP
P1
FAM
13A
Milk
pro
tein
pe
rce
nta
ge
(EB
V)
(15
00
2,
15
00
3),
Milk
fat
pe
rce
nta
ge
(17
53
,1
60
57
),M
ilkp
rote
inp
erc
en
tag
e(1
75
5,
99
13
,1
60
58
,1
60
59
),M
ilkp
rote
inyi
eld
(dau
gh
ter
de
viat
ion
)(1
01
45
),M
ilkfa
tyi
eld
(EB
V)
(11
30
3,
12
03
1),
Milk
pro
tein
yie
ld(E
BV
)(1
13
04
),M
ilkyi
eld
(EB
V)
(11
30
2),
Som
atic
cell
sco
re(E
BV
)(6
16
5,
61
64
),M
ilkfa
tty
acid
un
satu
rate
din
de
x(1
15
06
,1
15
08
,1
15
09
,1
15
10
),M
ilkm
yris
tole
icac
idp
erc
en
tag
e(1
15
07
),M
ilkp
alm
ito
leic
acid
pe
rce
nta
ge
(11
50
5),
Te
atp
lace
me
nt
(10
28
5),
Ud
de
rat
tach
me
nt
(10
28
4)
32
CC
R4
OA
R1
3:5
6.0
61
–6
5.8
11
BT
A1
3:5
7.5
72
–6
7.0
05
PO
FUT1
,TF
AP
2C,
FAM
110A
,A
HC
YG
HR
H,
ASI
PM
ilkp
rote
inp
erc
en
tag
e(2
67
2),
Milk
pro
tein
yie
ld(E
BV
)(6
09
0),
Milk
fat
yie
ld(2
55
5),
Milk
pro
tein
yie
ld(d
aug
hte
rd
evi
atio
n)
(10
15
6),
Milk
pro
tein
yie
ld(2
67
1),
Milk
yie
ld(2
67
0),
Ud
de
rat
tach
me
nt
(15
84
),U
dd
er
com
po
site
ind
ex
(15
89
),U
dd
er
de
pth
(15
88
),U
dd
er
he
igh
t(1
58
6),
Ud
de
rw
idth
(15
87
),R
um
pan
gle
(34
29
),Fo
ot
ang
le(1
58
3)
17
2
CC
R5
OA
R1
5:7
2.7
74
–7
4.5
50
BT
A1
5:7
5.1
54
–7
6.8
79
CD
82T
eat
pla
cem
en
t(1
59
5),
Ud
de
rcl
eft
(16
00
),U
dd
er
com
po
site
ind
ex
(16
02
),M
ilkfa
tyi
eld
(45
03
),M
ilkp
rote
inyi
eld
(45
02
),M
ilkp
rote
inyi
eld
(EB
V),
(61
03
),M
ilkfa
tp
erc
en
tag
e(3
45
2),
Milk
pro
tein
pe
rce
nta
ge
(EB
V)
(11
34
5),
Milk
yie
ld(E
BV
)(1
13
46
)
17
CC
R6
OA
R2
2:1
9.5
87
–2
3.1
57
BT
A2
6:2
0.2
86
–2
4.2
26
CH
UK
,SC
DM
ilkfa
tty
acid
com
po
siti
on
[57
,58
],So
mat
icce
llsc
ore
[60
]
Milk
yie
ld(1
04
52
),M
ilkp
rote
inyi
eld
(10
45
4),
Milk
fat
yie
ld(3
63
6),
Milk
pro
tein
yie
ld(3
63
8),
Milk
pro
tein
yie
ld(1
17
02
),M
ilkyi
eld
(11
70
1),
Milk
fat
yie
ld(1
04
53
),M
ilkfa
tp
erc
en
tag
e(2
59
8),
Milk
fat
yie
ld(2
57
2),
Milk
pro
tein
yie
ld(2
57
3),
Milk
yie
ld(2
57
4),
Milk
pro
tein
pe
rce
nta
ge
(48
14
),M
ilkp
rote
inp
erc
en
tag
e(3
63
9),
Milk
yie
ld(3
63
4),
Som
atic
Ce
llC
ou
nt
(15
03
)
74
Th
ein
terv
alo
fe
ach
reg
ion
(in
bp
)is
bas
ed
on
the
she
ep
ge
no
me
refe
ren
cese
qu
en
cev2
.0(h
ttp
://w
ww
.live
sto
ckg
en
om
ics.
csir
o.a
u/c
gi-
bin
/gb
row
se/o
arv2
.0/)
.Th
eco
rre
spo
nd
ing
ort
ho
log
ou
sb
ovi
ne
ge
no
mic
inte
rval
sar
eb
ase
do
nth
eb
ovi
ne
ge
no
me
refe
ren
cese
qu
en
ceU
MD
3.1
(htt
p:/
/ww
w.e
nse
mb
l.org
/Bo
s_ta
uru
s/In
fo/I
nd
ex)
.T
he
po
siti
on
alca
nd
idat
eg
en
es
that
map
wit
hin
the
bo
vin
eca
nd
idat
era
ng
ean
dth
atar
ein
clu
de
das
can
did
ate
ge
ne
sfo
rm
ilkp
rod
uct
ion
and
mas
titi
str
aits
inth
ed
atab
ase
pro
vid
ed
by
Og
ore
vce
tal
.[2
2]
are
ind
icat
ed
asfu
nct
ion
alca
nd
idat
eg
en
es.
Th
eaf
fect
ed
trai
tan
dC
attl
eQ
TLd
bre
fere
nce
for
pre
vio
usl
yre
po
rte
dca
ttle
QT
Lth
atm
apw
ith
inth
eb
ovi
ne
can
did
ate
ge
no
mic
reg
ion
san
dth
atin
flu
en
cem
ilkp
rod
uct
ion
trai
tso
ro
the
rfu
nct
ion
altr
aits
rela
ted
tod
airy
pro
du
ctio
nar
eal
soin
dic
ate
d.
1O
the
rca
nd
idat
eg
en
es.
Th
isca
teg
ory
incl
ud
es
two
typ
es
of
ge
ne
s:–
Th
ose
that
alth
ou
gh
are
no
tin
clu
de
din
the
Og
ore
vce
tal
.[2
2]
dat
abas
em
ayb
eco
nsi
de
red
asca
nd
idat
eg
en
es
inre
lati
on
tom
ilkp
rod
uct
ion
rela
ted
trai
tsb
ase
do
no
the
rst
ud
ies.
–T
ho
seth
atar
elik
ely
tob
ere
late
dto
no
n-d
airy
sele
ctio
nsi
gn
atu
res
such
asm
orp
ho
log
ical
trai
tsan
dco
atco
lou
rfe
atu
res.
2C
attl
eQ
TLd
bid
en
tifi
er:
Sear
chre
fere
nce
nu
mb
er
ath
ttp
://w
ww
.an
imal
ge
no
me
.org
/cg
i-b
in/Q
TLd
b/B
T/s
ear
chto
fin
dco
mp
lete
de
tails
abo
ut
QT
Lre
po
rte
din
the
ort
ho
log
ou
sre
gio
no
fth
eco
rre
spo
nd
ing
she
ep
CC
Rid
en
tifi
ed
inth
isst
ud
y.3N
um
be
ro
fp
osi
tio
nal
can
did
ate
ge
ne
se
xtra
cte
dfr
om
the
ort
ho
log
ou
sb
ovi
ne
reg
ion
usi
ng
Bio
Mar
tfo
re
ach
of
the
lab
ele
dC
CR
s(b
ase
do
nT
able
S3).
do
i:10
.13
71
/jo
urn
al.p
on
e.0
09
46
23
.t0
05
Selection Signatures in Dairy Sheep
PLOS ONE | www.plosone.org 9 May 2014 | Volume 9 | Issue 5 | e94623
circadian rhythms. In a study of the human milk fat globule
transcriptome, CSNK1e was identified as one of the nine core
‘‘clock’’ genes that showed differential expression over a 24-
hour period time in lactating women [43]. Of particular
interest is the finding that this OAR3 region was labelled as a
CCR based on the overlap of candidate regions detected by
pair-wise-FST in the pairs including the most highly specialized
dairy breeds (Milk Lacaune, Comisana and East Friesian
Brown), which may have been under selection for circadian-
related adaptation of milk production to intensive milking.
Other Regions– CCR4 (OAR13:56.061 to 65.811 Mb). Several genes
included in this core candidate region were also found in the
Ogorevc et al. [22] database. The POFUT1 (protein O-
fucosyltransferase 1) gene plays a crucial role in Notch
signaling, which regulates mammary stem cell function and
luminal cell-fate commitment [44]. TFAP2C (transcription
factor AP-2 gamma; activating enhancer binding protein 2
gamma) is involved in mammary development, differentiation,
and oncogenesis playing a critical role in gene regulation in
hormone responsive breast cancer [45], and AHCY (adeno-
sylhomocysteinase) has been suggested as potentially involved
in mastitis defense based on its disease-associated expression
[46]. Another positional candidate gene for this core region is
the GHRH (growth hormone-releasing hormone) gene. Al-
though the direct relationship of this gene and milk production
traits is still not clear [47,48], its link to the somatotropic axis
and other functional candidate genes included in the Ogorevc
et al. [22] database (GH, GHR, GHRHR) suggest a possible
influence, directly or indirectly, on dairy traits. In addition to
these candidate dairy-related genes, the ASIP (Agoutı signaling
protein) gene is also located in this region (OAR13:63.028–
63.033 Mb). This gene has a major role in metabolic processes
[49] and coat colour pigmentation in mammalian species [50].
Based on the known associations between polymorphisms at
this gene and coat colour patterns in sheep [51] it is possible
that the identified selection signal results from coat colour
selection. In their analysis of the complete HapMap dataset,
Kijas et al. [14] also identified a selection signal near ASIP.
– CCR5 (OAR15:72.774–74.550 Mb). This region included
the CD82 (CD82 molecule) gene, which is included in the
Ogorevc et al. [22] database based on its expression in the
mammary gland. This gene is included in the group of genes
that regulate breast cancer metastasis, as a metastasis
suppressor [52]. Whereas no studies have reported an
association of this gene with dairy related traits, there is a
functional relationship between CD82 and ERBB3 (Receptor
tyrosine-protein kinase erbB-3) [53], which is related to normal
mammary development [54].
– CCR6: (OAR22:19.588–23.157 Mb). Two functional can-
didate genes [22] were found in this region: SCD (Stearoyl-CoA
desaturase) and CHUK (conserved helix-loop-helix ubiquitous
kinase). The SCD gene encodes a multifunctional complex
enzyme important in the cellular biosynthesis of fatty acids.
Several studies in different populations of dairy cattle have
reported associations between polymorphisms at this gene with
milk production traits [55] and milk fatty acid composition
[56]. In sheep, the SCD gene has been suggested as positional
and functional candidate gene for a QTL identified on OAR22
in a Sarda 6 Lacaune back-cross population for the ratio of
conjugated linoleic acid to vaccenic acid in sheep milk [57]. A
later study in Churra sheep also identified a QTL on OAR22
for the same trait close to the SCD position, although various
analyses questioned this gene as responsible for the identified
effect [58]. The CHUK gene is listed in the Ogorevc et al. [22]
database because it is expressed in breast cancer tumors and is
a regulator of mammary epithelial proliferation [59]. Accord-
ing to the SheepQTL database, this region includes a QTL for
somatic cell score described in an Awassi x Merino cross
population [60] and it has also been identified as a selection
signal by the analysis of allele frequency differences between
animals with divergent milk yields reported in Altamurana
sheep [29].
The bovine region orthologous to CCR6 (on BTA26), overlaps
with a region showing a selection signature in dairy cattle [23],
where the C10ORF76 (chromosome 10 open reading frame 76)
gene was associated with the strongest selection signal. Although
there is not a reported association of this gene with milk
production traits, it is expressed in the mammary gland and it is
altered in breast cancer cells, based on the G2SBC database.
Inconsistencies between this Study and Previous QTLand Selection Mapping Studies of Cattle and Sheep
Although all six CCR overlapped with QTL for dairy traits in
sheep or cattle (Table 4 and discussed above), our study did not
identify a selection signal close to several genes previously
associated with dairy traits in sheep and cattle. For example,
there were no CCR near the LALBA (alpha-lactalbumin) gene
(OAR3:137 Mb), where a particular variant has been recently
been proposed to explain a QTL for milk protein percentage
identified in Churra sheep [39]. The lack of signal near this QTL
in the FST analysis of Churra vs Ojalada is consistent with the fact
that the causative mutation is still segregating in Churra, which
allowed its identification as QTL.
In addition, in their analysis of the complete Sheep HapMap
dataset, Kijas et al. [14] reported positive selection surrounding
the PRLR gene, which is associated with milk traits in dairy cattle
[61]. In our study, although none of the CCRs map to OAR16,
where this gene is located (39.250–39.284 Mb), it is worth
mentioning that this gene is included in the interval of FST-
CR27 (OAR16:37.347–40.850 Mb), which was identified based
on the signals detected in three breed pairs involving the most
specialized dairy breeds in this study (East Friesian Brown-
Finnsheep, Milk Lacaune-Australian Poll Merino and Comisana-
Australian Poll Merino) but was not classified a CCR due to the
lack of selection signals from the heterozygosity-based methods.
Other regions that were detected by the FST-pairwise comparison
for many breed pairs but that were not supported by the
heterozygosity-based methods were found on OAR2 (FST-
CR2:52.346–53.409 Mb) and OAR9 (57.363–60.849 Mb).
Whereas the first region does not include any functional candidate
gene for dairy traits, the region in OAR9 included three genes
related to the metabolism of fatty acids (FABP4, FABP5 and
FABP9). FABP4 and FABP5 have been shown to be highly
expressed in the mammary gland during lactation [62] and
significant associations have been found between FABP4 and fatty
acid composition of bovine milk [63]. We acknowledge that one or
more of these regions may represent false negatives that were
missed by our stringent selection signal criteria. However, because
of the difficulty in linking a sweep signal to a given phenotype, we
suggest that application of stringent criteria in this type of study is
an appropriate option to avoid reporting long lists of candidate
regions based on spurious results.
We also did not find evidence of selection on some major
candidate genes for milk production for which selection signatures
have been observed in cattle (e.g. DGAT1: OAR9:13.534–
13,543 Mb; GHR: OAR16:32.068–32.231). In contrast to our
Selection Signatures in Dairy Sheep
PLOS ONE | www.plosone.org 10 May 2014 | Volume 9 | Issue 5 | e94623
results, the GHR gene (BTA20) showed the largest difference in
sliding window average allele frequencies in a study of divergent
selection between dairy and beef cattle [24], and also showed
significant extended haplotype homozygosity [25]. With regard to
DGAT1, evidence of selection has also been identified when
comparing dairy and beef cattle breeds [24].
In their study, Kijas et al. [14] also identified a strong selection
signal on OAR10, associated to the presence or absence of horns
and close to the gene responsible of the polled phenotype, RXFP2
(relaxin/insulin-like family peptide receptor 2) gene
(OAR10:27.602–27.646 Mb). In our study, a selection signal was
identified in this region based on the ObsHtz-based method
(ObsHtz-CR33:24.856–27.897 Mb, for the dairy breeds Comi-
sana, Churra and Milk Lacaune) and the FST-based method
(OAR10:25.540–28.983 Mb). However because the FST signal
was due only to the two breed pairs involving the Australian Poll
Merino, this was not labelled as FST-CR.
Apart from the overlap between two CCRs (CCR3 on OAR6
and CCR6 on OAR22) with the selection signals identified in
Altamurana sheep for milk yield [29], we did not find evidence of
selection near the signals reported for this Italian breed. This lack
of correspondence may derive from breed-specific signals reported
for Altamurana.
Comparison of the Three Selection Mapping MethodsFrom our point of view, the analysis method that involved the
estimation of pair-wise FST for pairs of related breeds showing
divergent specialization (one for milk production, one not) should
be the most powerful analysis in terms of identifying selection
specifically related to dairy production. Four out of the 28
candidate regions showing multiple pair-wise FST signals were
detected in four out of the six breed pairs (FST-CR3, FST-CR9,
FST-CR14 and FST-CR18). Of these, FST-CR3 (OAR2:52.346–
53.409 Mb) was not included as a CCR due to the lack of
consistency with the ObsHtz or 10-Mb Regression analysis results,
although the same region was identified by the 5-Mb Regression
analysis (RegBrack5-CR1 in Table 3) in two dairy breeds (Churra
and Chios) and one non-dairy breed (Ojalada). Given that no
functional candidate genes from the Ogorevc et al. [22] database
were found in the orthologous bovine region, it is possible that this
region underlies breed differentiation not directly related to dairy
traits.
Among the 55 candidate regions identified based on the
ObsHtz analysis (ObsHtz-CRs, Table S2), there were only twelve
regions showing a signal in dairy but not in non-dairy breeds
(ObsHtz-CR3, 7, 8, 10, 12, 25, 28, 29, 31, 41, 45 and 55).
Considering that the background genome has been previously
selected for meat, maternal characteristics, and other traits,
whereas the development of dairy breeds is much more recent,
it would be expected that the selection signals specifically related to
dairy traits would not be seen in the other breeds (although Meat
Lacaune could be an exception). However, as none of these
regions showing a reduction of heterozygosity exclusively in dairy
breeds were identified by the FST-based method, they were not
identified as final core CCRs (and thus are not present in Table 4).
Although the evidence linking these regions to dairy-related
selection is weaker than for the CCRs, we performed an additional
search for functional candidate genes and dairy-related QTL
mapping within these regions, similar to that performed in the
eight identified CCRs (see Table S4). A total of 118 genes were
extracted from the orthologous bovine regions of these eleven
dairy-breed-limited regions of reduced heterozygosity (data not
shown). Among them, only the HSPD1 (Heat shock 60 kDa
protein 1; chaperonin) gene is included in the Ogorevc et al. [22]
database, due to its expression in the mammary gland. This gene is
also included in the G2SBC database although no studies have
reported so far its association with milk production traits.
Interestingly, among the dairy QTL detected in these regions
there is greater overlap with ovine QTL for milk production traits
(Table S4) than for the list of core CCRs. Hence, these regions
identified exclusively by ObsHtz could include gene variants
occurring in individual dairy breeds, as it is the case for many of
the QTL described in sheep.
There were eight regions that overlapped between those
identified by FST (including a full set of regions, including those
that contained pairs with the same breeds that were removed from
Table S1) and ObsHtz (out of 35 and 55, respectively). The
explanation for the higher number of regions identified by ObsHz
is that the regions identified using FST were slightly larger
(incorporated more windows) than those identified using ObsHtz.
There were far fewer signals identified using the Regression
approach than either FST or ObsHtz. Although the top (or bottom)
0.5th percent results were considered as signals of selection for all
methods, the Regression method first filtered out the intervals with
non-significant and non-asymptotic regression patterns, and thus
the total number of eligible intervals was substantially reduced
compared to the other approaches in which the distribution of
FST/ObsHtz values for all markers (with the exception of those on
the very ends of the chromosomes) was considered. Thus the
implementation of Regression in this study was more stringent
than the other methods.
The regions identified by the Regression method showed
greater overlap with ObsHtz than FST, which is not surprising
since both Regression and ObsHtz are designed to detect regions
with a reduction in diversity. For the 10-Mb bracket size (results
considered for the identification of CCR), all three regions
identified with the Regression approach overlapped with those
identified with ObsHtz while one out of the three, RegBrack10-
CR2, overlapped with the regions identified with FST, and was
therefore considered as CCR (CCR3).
Conclusions
The results reported here provide a genome-wide map of
selection signatures in the dairy sheep genome. The six core
candidate regions identified are likely to influence traits of
economic interest in dairy sheep production and can be
considered as starting points for future studies aimed at the
identification of the causal genetic variation underlying these
signals. For some of these regions, strong candidate genes have
been proposed (e.g. ABCG2, SPP1), whereas some other genes
designated as candidates based on their association with sheep and
cattle dairy traits (e.g. LALBA, DGAT1A) were not associated with a
detectable sweep signal. Discrepancies between selection signals in
dairy sheep and cattle may be explained either by statistical or
biological factors, such as the limited statistical power of the
analyses to identify effects of small magnitude or the fact that the
genetic architecture of milk production and dairy-related traits
substantially differs from sheep to cattle and also between the
different breeds of dairy sheep, which have been subjected to
different levels of selection pressure. Many of the identified regions
corresponded to orthologous regions in cattle where QTL for
dairy traits have been identified. Due to the limited number of
QTL studies reported in sheep compared with cattle, the results
illustrate the potential value of the study of selection signatures to
uncover mutations with potential effects on quantitative dairy
sheep traits. Additional studies are needed to confirm and refine
the results reported here. To this end, the recent availability of the
Selection Signatures in Dairy Sheep
PLOS ONE | www.plosone.org 11 May 2014 | Volume 9 | Issue 5 | e94623
high-density ovine chip (700 K) will provide a valuable tool to
perform more powerful and precise selection mapping studies.
Supporting Information
Table S1 Candidate regions for signatures of selection identified
on the basis of the pair-wise FST analysis.
(PDF)
Table S2 Candidate regions identified based on reduced
heterozygosity signals identified in at least two of the dairy breeds.
(PDF)
Table S3 List of all genes from the orthologous bovine genome
regions corresponding to the six convergence candidate regions
(CCR) for dairy selection sweeps identified in this study, extracted
using the Biomart tool (http://www.biomart.org/).
(XLSX)
Table S4 Candidate regions identified by the analysis based on
observed heterozygosity (ObsHtz-CR), averaged in sliding win-
dows of 9 SNPs (ObsHtz-9SNPW), that were exclusively detected
in dairy breeds.
(PDF)
File S1 Summary of the criteria for selection of breedsto be included in the study, including the results of aPrincipal Component Analysis (PCA) performed with theinitial set of breeds considered.
(PDF)
File S2 Summary of the results of the analysis per-formed in this work in relation to the myostatin (GDF-8)gene region. These results were evaluated to establish criteria for
the analyses performed to detect dairy selection signatures in the
dairy breeds.
(PDF)
Acknowledgments
We thank Samantha Wilkinson for providing R scripts.
Author Contributions
Conceived and designed the experiments: BGG PW JJA. Analyzed the
data: BGG PW. Contributed reagents/materials/analysis tools: RPW JJA
EGG JK. Wrote the paper: BGG PW JJA RPW JK. Conceived the study:
BGG PW.
References
1. Legge T (1996) The beginning of caprine domestication. In: Harris DR, editor.
The Origins and Spread of Agriculture and Pastoralism in Eurasia. Smithsonian
New York: Institution Press. pp. 238–262.
2. Maijala K (1997) Genetic aspects of domestication, common breeds and their
origin. In: Piper L, Ruvinsky A, editors. The genetics of sheep. Oxford: CAB Int.
pp. 539–564.
3. Barillet F (1997) Genetics of milk production. In: Piper L, Ruvinsky A, editors.
The genetics of sheep. Oxford: CAB Int. pp. 539–564.
4. Ida A, Vicovan PG, Radu R, Vicovan A, Cutova N, et al. (2012) Improving the
milk production at the breeds and populations of sheep from various geo-
climatic zones. Lucrari Stiintifice - Seria Zootehnie 57: 17.
5. Gibbs RA, Taylor JF, Van Tassell CP, Barendse W, Eversole KA, et al. (2009)
Genome-wide survey ofSNP variation uncovers the genetic structure of cattle
breeds. Science 324: 528–532.
6. Rubin CJ, Zody MC, Eriksson J, Meadows JR, Sherwood E, et al. (2010) Whole-
genome resequencing reveals loci under selection during chicken domestication.
Nature 464: 587–591.
7. Elferink MG, Megens HJ, Vereijken A, Hu X, Crooijmans RP et al. (2012)
Signatures of selection in the genomes of commercial and non-commercial
chicken breeds. PLoS One 7: ve32720.
8. Wiener P, Pong-Wong R (2011) A regression-based approach to selection
mapping. J Hered 102: 294–305.
9. Stella A, Ajmone-Marsan P, Lazzari B, Boettcher P (2010) Identification of
selection signatures in cattle breeds selected for dairy production. Genetics 185:
1451–1461.
10. Akey JM, Ruhe AL, Akey DT, Wong AK, Connelly CF, et al. (2010) Tracking
footprints of artificial selection in the dog genome. Proc Natl Acad Sci USA 107:
1160–1165.
11. Vaysse A, Ratnakumar A, Derrien T, Axelsson E, Rosengren Pielberg G, et al.
(2011) Identification of genomic regions associated with phenotypic variation
between dog breeds using selection mapping. PLoS Genet 10: e1002316.
12. Ai H, Huang L, Ren J (2013) Genetic diversity, linkage disequilibrium and
selection signatures in chinese and Western pigs revealed by genome-wide SNP
markers. PLoS One 8: e56001.
13. Boyko AR, Quignon P, Li L, Schoenebeck JJ, Degenhardt JD, et al. (2010) A
simple genetic architecture underlies morphological variation in dogs. PLoS Biol
8: e1000451.
14. Kijas JW, Lenstra JA, Hayes B, Boitard S, Porto Neto LR, et al. (2012a)
Genome-wide analysis of the world’s sheep breeds reveals high levels of historic
mixture and strong recent selection. PLoS Biol 10: e1001258.
15. Weir BS, Cockerham CC (1984) Estimating F-Statistics for the Analysis of
Population Structure. Evolution 38: 1358–1370.
16. Akey JM, Zhang G, Zhang K, Jin L, Shriver MD (2002) Interrogating a high-
density SNP map for signatures of natural selection. Genome Res 12: 1805–
1814.
17. Wilkinson S, Lu ZH, Megens HJ, Archibald AL, Haley C, et al. (2013)
Signatures of diversifying selection in European pig breeds. PLoS Genet 9:
e1003453.
18. Barendse W, Harrison BE, Bunch RJ, Thomas MB, Turner LB (2009) Genome
wide signatures of positive selection: the comparison of independent samples and
the identification of regions associated to traits. BMC Genomics 10: 178.
19. Rubin CJ, Megens HJ, Martinez Barrio A, Maqbool K, Sayyab S, et al. (2012)
Strong signatures of selection in the domestic pig genome. Proc Natl Acad Sci
USA. 109: 19529–19536.
20. Axelsson E, Ratnakumar A, Arendt ML, Maqbool K, Webster MT, et al. (2013)
The genomic signature of dog domestication reveals adaptation to a starch-rich
diet. Nature 495: 360–364.
21. Payne RW, Murray DA, Harding SA, Baird DB, Soutar DM (2007) GenStat for
Windows (10th Edition) Introduction. Hemel Hempstead: VSN. International.
22. Ogorevc J, Kunej T, Razpet A, Dovc P (2009) Database of cattle candidate
genes and genetic markers for milk production and mastitis. Anim Genet 40:
832–851.
23. Flori L, Fritz S, Jaffrezic F, Boussaha M, Gut I, et al. (2009) The genome
response to artificial selection: a case study in dairy cattle. PLoS One 4: e6595.
24. Hayes BJ, Chamberlain AJ, Maceachern S, Savin K, McPartlan H, et al. (2009)
A genome map of divergent artificial selection between Bos taurus dairy cattle
and Bos taurus beef cattle. Anim Genet 40: 176–184.
25. Qanbari S, Pimentel EC, Tetens J, Thaller G, Lichtner P, et al. (2010) A
genome-wide scan for signatures of recent selection in Holstein cattle. Anim
Genet 41: 377–389.
26. Moradi MH, Nejati-Javaremi A, Moradi-Shahrbabak M, Dodds K G, McEwan
JC (2012) Genomic scan of selective sweeps in thin and fat tail sheep breeds for
identifying of candidate regions associated with fat deposition. BMC Genet 13:
10.
27. Kowalewska-Łuczak I, Kulig H (2013) Polymorphism of the FAM13A, ABCG2,
OPN, LAP3, HCAP-G, PPARGC1A genes and somatic cell count of Jersey
cows - Preliminary study. Res Vet Sci 94: 252–255.
28. Olsen HG, Nilsen H, Hayes B, Berg PR, Svendsen M, et al. (2007) Genetic
support for a quantitative trait nucleotide in the ABCG2 gene affecting milk
composition of dairy cattle. BMC Genet 8: 32.
29. Moioli B1, Scata MC, Steri R, Napolitano F, Catillo G (2013) Signatures of
selection identify loci associated with milk yield in sheep. BMC Genet 14: 76.
30. Sheehy PA, Riley LG, Raadsma HW, Williamson P, Wynn PC (2009) A
functional genomics approach to evaluate candidate genes located in a QTL
interval for milk production traits on BTA6. Anim Genet 40: 492–498.
31. Garcıa-Fernandez M, Gutierrez-Gil B, Sanchez JP, Moran JA, Garcıa-Gamez
E, et al. (2011) The role of bovine causal genes underlying dairy traits in Spanish
Churra sheep. Anim Genet 42: 415–420.
32. Eberlein A, Takasuga A, Setoguchi K, Pfuhl R, Flisikowski K, et al. (2009)
Dissection of genetic factors modulating fetal growth in cattle indicates a
substantial role of the non-SMC condensin I complex, subunit G (NCAPG)
gene. Genetics 183: 951–964.
33. Gutierrez-Gil B, Wiener P, Williams JL, Haley CS (2012) Investigation of the
genetic architecture of a bone carcass weight QTL on BTA6. Anim Genet 43:
654–661.
34. Yang TL, Guo Y, Zhang LS, Tian Q, Yan H, et al. (2010) HMGA2 is confirmed
to be associated with human adult height. Ann Hum Genet 74: 11–16.
35. Pryce JE, Hayes BJ, Bolormaa S, Goddard ME (2011) Polymorphic regions
affecting human height also control stature in cattle. Genetics 187: 981–984.
36. Li P, Xiao S, Wei N, Zhang Z, Huang R, et al. (2012) Fine mapping of a QTL
for ear size on porcine chromosome 5 and identification of high mobility group
AT-hook 2 (HMGA2) as a positional candidate gene. Genet Sel Evol 44: 6.
Selection Signatures in Dairy Sheep
PLOS ONE | www.plosone.org 12 May 2014 | Volume 9 | Issue 5 | e94623
37. Boyko AR, Quignon P, Li L, Schoenebeck JJ, Degenhardt JD, et al. (2010) A
simple genetic architecture underlies morphological variation in dogs. PLoS Biol
8: e1000451.
38. Gutierrez-Gil B, El-Zarei MF, Alvarez L, Bayon Y, de la Fuente LF et al. (2009)
Quantitative trait loci underlying milk production traits in sheep. Anim Genet
40: 423–434.
39. Garcıa-Gamez E, Gutierrez-Gil B, Sahana G, Sanchez JP, Bayon Y, et al. (2012)
GWA analysis for milk production traits in dairy sheep and genetic support for a
QTN influencing milk protein percentage in the LALBA gene. PLoS One 7:
e47782.
40. Zheng J, Watson AD, Kerr DE (2006) Genome-wide expression analysis of
lipopolysaccharide-induced mastitis in a mouse model. Infect Immun 74: 1907–
1915.
41. Dorow DS, Devereux L, Dietzsch E, De Kretser T (1993) Identification of a new
family of human epithelial protein kinases containing two leucine/isoleucine-
zipper domains. Eur J Biochem 213: 701–710.
42. Schaer DJ, Schaer CA, Buehler PW, Boykins RA, Schoedon G, et al. (2006)
CD163 is the macrophage scavenger receptor for native and chemically
modified hemoglobins in the absence of haptoglobin. Blood 107: 373–380.
43. Maningat PD, Sen P, Rijnkels M, Sunehag AL, Hadsell DL, et al. (2009) Gene
expression in the human mammary epithelium during lactation: the milk fat
globule transcriptome. Physiol Genomics. 37: 12–22.
44. Bouras T, Pal B, Vaillant F, Harburg G, Asselin-Labat ML, et al. (2008) Notch
signaling regulates mammary stem cell function and luminal cell-fate
commitment. Cell Stem Cell 3: 429–441.
45. Woodfield GW, Chen Y, Bair TB, Domann FE, Weigel RJ (2010) Identification
of primary gene targets of TFAP2C in hormone responsive breast carcinoma
cells. Genes Chromosomes Cancer 49: 948–962.
46. Schwerin M, Czernek-Schafer D, Goldammer T, Kata SR, Womack JE, et al.
(2003) Application of disease-associated differentially expressed genes–mining for
functional candidate genes for mastitis resistance in cattle. Genet Sel Evol 35
Suppl 1: S19–34.
47. Dybus A, Grzesiak W (2006) GHRH/HaeIII gene polymorphism and its
associations with milk production traits in Polish Black-and-White cattle. Arch
Tierz Dummerstorf 49: 434–438.
48. Szatkowskaac I, Dybusac A, Grzesiakab W, Jedrzejczakac M, Muszynskaac M
(2009). Association between the growth hormone releasing hormone (GHRH)
gene polymorphism and milk production traits of dairy cattle. J Appl Anim Res
36: 119–12.
49. Wolff GL, Roberts DW, Mountjoy KG (1999) Physiological consequences of
ectopic agouti gene expression: The yellow obese mouse syndrome. Physiol
Genomics 1: 151–163.
50. Bennett DC, Lamoreux ML (2003) The colour loci of mice–A genetic century.
Pigment Cell Res 16: 333–344.51. Norris BJ, Whan VA (2008) A gene duplication affecting expression of the ovine
ASIP gene. Genome Res 18: 1282–1293.
52. Debies MT, Welch DR (2001) Genetic basis of human breast cancer metastasis.J Mammary Gland Biol Neoplasia 6: 441–451.
53. Odintsova E, Voortman J, Gilbert E, Berditchevski F (2003) Tetraspanin CD82regulates compartmentalisation and ligand-induced dimerization of EGFR. J Cell
Sci 116: 4557–4566.
54. Lahlou H, Muller T, Sanguin-Gendreau V, Birchmeier C, Muller WJ (2012)Uncoupling of PI3K from ErbB3 impairs mammary gland development but
does not impact on ErbB2-induced mammary tumorigenesis. Cancer Res 72:3080–3090.
55. Alim MA, Fan YP, Wu XP, Xie Y, Zhang Y, et al. (2012) Genetic effects ofstearoyl-coenzyme A desaturase (SCD) polymorphism on milk production traits
in the Chinese dairy population. Mol Biol Rep 39: 8733–8740.
56. Moioli B, Contarini G, Avalli A, Catillo G, Orru L, et al. (2007) Shortcommunication: effect of stearoyl-coenzyme A desaturase polymorphism on fatty
acid composition of milk. J Dairy Res 90: 3553–3558.57. Carta A, Sechi T, Usai MG, Addis M, M Fiori, et al. (2006) Evidence for a QTL
affecting the synthesis of linoleic conjugated acid cis-9, trans-11 from 11-c 18:1
acid on ovine chromosome 22. Proc. 8th World Congress on Genetics Appliedto Livestock Production. Belo Horizonte, Brazil. Commun. no. 12–03. Instituto
Prociencia, Belo Horizonte, Brazil.58. Garcıa-Fernandez M, Gutierrez-Gil B, Garcıa-Gamez E, Sanchez JP, Arranz JJ
(2010) Detection of quantitative trait loci affecting the milk fatty acid profile onsheep chromosome 22: role of the stearoyl-CoA desaturase gene in Spanish
Churra sheep. J Dairy Sci 93: 348–357.
59. Cao Y, Luo JL, Karin M (2007) IkappaB kinase alpha kinase activity is requiredfor self-renewal of ErbB2/Her2-transformed mammary tumor-initiating cells.
Proc Natl Acad Sci USA 104: 15852–15857.60. Raadsma HW, Jonas E, McGill D, Hobbs M, Lam MK, et al. (2009). Mapping
quantitative trait loci (QTL) in sheep. II. Meta-assembly and identification of
novel QTL for milk production traits in sheep. Genet Sel Evol 41: 45.61. Viitala S, Szyda J, Blott S, Schulman N, Lidauer M, et al. (2006) The role of the
bovine growth hormone receptor and prolactin receptor genes in milk, fat andprotein production in Finnish Ayrshire dairy cattle. Genetics 173: 2151–2164.
62. Sumner-Thomson JM, Vierck JL, McNamara JP (2011) Differential expressionof genes in adipose tissue of first-lactation dairy cattle. J Dairy Sci 94: 361–369.
63. Nafikov RA, Schoonmaker JP, Korn KT, Noack K, Garrick DJ, et al. (200
Association of polymorphisms in solute carrier family 27, isoform A6 (SLC27A6)and fatty acid-binding protein-3 and fatty acid-binding protein-4 (FABP3 and
FABP4) with fatty acid composition of bovine milk. J Dairy Sci 96: 6007–6021.
Selection Signatures in Dairy Sheep
PLOS ONE | www.plosone.org 13 May 2014 | Volume 9 | Issue 5 | e94623
1
File S1 for Application of selection mapping to identify genomic regions
associated with dairy production in sheep
Authors: Beatriz Gutiérrez-Gil1*, Juan Jose Arranz1, Ricardo Pong-Wong2, Elsa García-
Gámez1, James Kijas3, Pamela Wiener2
File S1. Summary of the criteria for selection of breeds to be included in the study,
including the results of a Principal component analysis (PCA) performed with the initial set
of breeds considered.
Selection of breeds for analysis
From the breeds analysed in the SheepHapMap project [1], a group of five European breeds
was selected to be analysed as “dairy group” in the present study: Chios, Chura, Comisana,
East Friesian Brown and Milk Lacaune (Table 1). This group included breeds showing
different levels of dairy specialization (See Supporting Table 1 for additional breed
information) with some highly-specialized dairy breeds such as East Friesian Brown and
Milk Lacaune, and some others for which official dairy breeding improvement is more
recent.
With the aim of providing an appropriate comparison set that could help identify the
selection signals specifically related to dairy selection, we selected another group of non-
dairy breeds to be included in the study. The initial selection of the non-dairy breeds was
2
based on the estimated divergence time between ovine breeds reported by Kijas et al. [1]
from the extent of haplotype sharing that persists at increasing physical distances between
SNP pairs (Supporting Information Figure S10 and Figure 3 of Kijas et al. [1]), choosing,
for each dairy breed, the most closely related non-dairy breed to which it could be
compared. Based on this, a group of six non-dairy breeds were selected, including both
meat-specialized breeds and also breeds that have not been under specific selection pressure
(i.e. traditional triple purpose breeds). For one of the dairy breeds, EastFriesianBrown, two
potential comparison non-dairy breeds (Finnsheep and Scottish Texel) were initially
investigated (Table 1). For the Milk Lacaune, in addition to a meat-specialized breed, the
Australian Poll Merino, the Meat Lacaune variety was also considered for comparison. The
Australian Poll Merino was also selected as comparative breed for the (dairy) Italian
Comisana breed. The estimated divergence times between the initially selected pairs ranged
from 80-160 generations (Milk Lacaune vs Meat Lacaune pair) and 480-560 (East Friesian
Brown vs Finnsheep pair) [1].
The initial selection of non-dairy breeds was refined based on the results of a Principal
Component Analysis (PCA) of allele sharing performed using smartpca implemented in
Eigensoft [2] for the total list of breeds included in Table 1. Due to differences in the
number of samples available for each breed, we selected 22 samples for each breed (the
maximum number available for all selected breeds) to performed an N-balanced PCA
analysis. This analysis helped to determine the clustering pattern within the initial selected
dataset and, in conjunction with the haplotype similarities previously described [1], was
used to choose related dairy and non-dairy breed pairs for subsequent genetic
differentiation analysis.
3
This PCA analysis also included the Galway and Border Leicester breeds for comparison
with the Scottish Texel breed in the pair-wise FST analysis of the myostatin gene region as a
test case of a gene known to be under selection. According to Kijas et al. [1], these two
breeds showed the closest phylogenetic relationship with Scottish Texel based on the extent
of haplotype sharing (80-160 generations of divergence) and neither is known to carry the
allele associated with muscle hypertrophy.
From this analysis, the proportion of variance explained by each component was obtained
by dividing the eigenvalue corresponding to each component by the sum of all eigenvalues
identified (for a total of 20 PC estimated).
Population structure analysis and selection of dairy and non-dairy breed pairs
The results of the PCA of allele sharing were plotted to show direct comparison of
Principal Component 1 (PC1) against PC2 to PC5 (Supporting Figure S1). The two largest
principal components (A) separated four differentiated clusters related to the geographical
groups represented in the initial selected dataset: the mainland Mediterranean breeds
(Lacaunes, Churra, Ojalada, Australian Poll Merino and Comisana), the island
Mediterranean breeds (Chios, Sakiz and Cyprus Fat Tail), the mainland NorthEuropean
breeds (Finnsheep and East Frisian Brown) and the island NorthEuropean breeds (Scottish
Texel, Galway and Border Leicester). Based on this clustering, the Finnsheep was selected
as the comparison breed for East Friesian Brown for subsequent analyses, rather than
Scottish Texel.
The Australian Poll Merino showed a close relationship with all the other mainland
Mediterranean breeds, and therefore was considered as the non-dairy breed to compare with
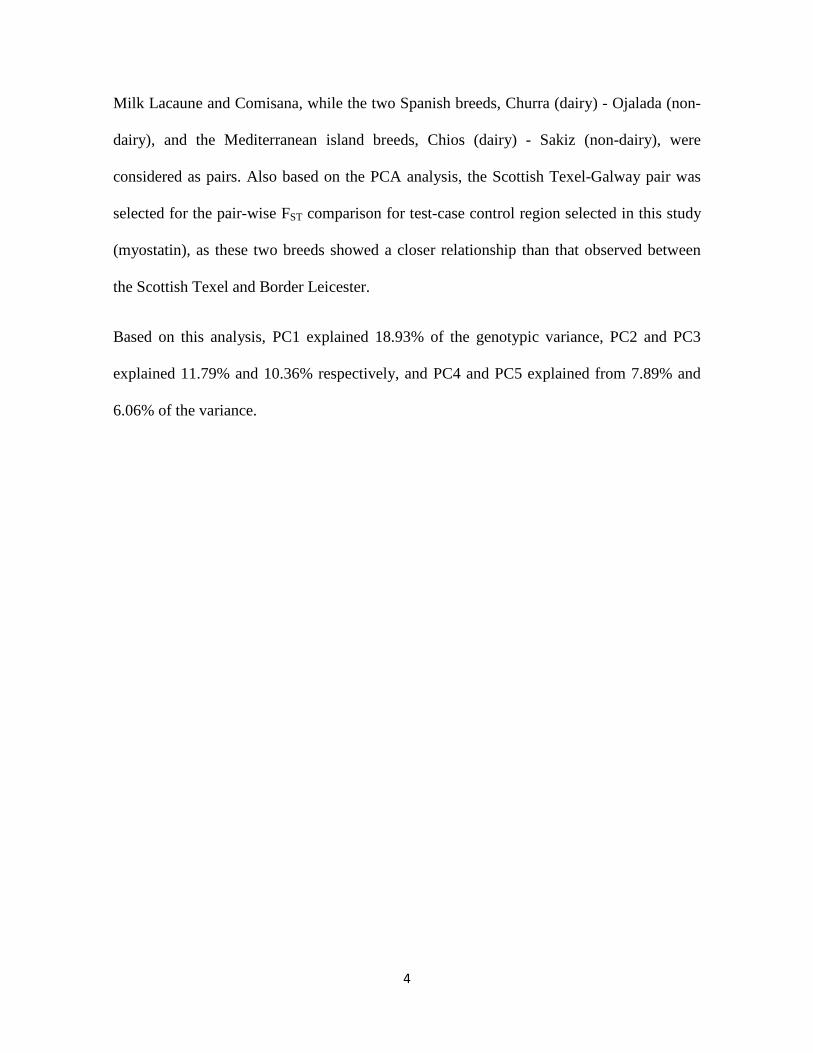
4
Milk Lacaune and Comisana, while the two Spanish breeds, Churra (dairy) - Ojalada (non-
dairy), and the Mediterranean island breeds, Chios (dairy) - Sakiz (non-dairy), were
considered as pairs. Also based on the PCA analysis, the Scottish Texel-Galway pair was
selected for the pair-wise FST comparison for test-case control region selected in this study
(myostatin), as these two breeds showed a closer relationship than that observed between
the Scottish Texel and Border Leicester.
Based on this analysis, PC1 explained 18.93% of the genotypic variance, PC2 and PC3
explained 11.79% and 10.36% respectively, and PC4 and PC5 explained from 7.89% and
6.06% of the variance.
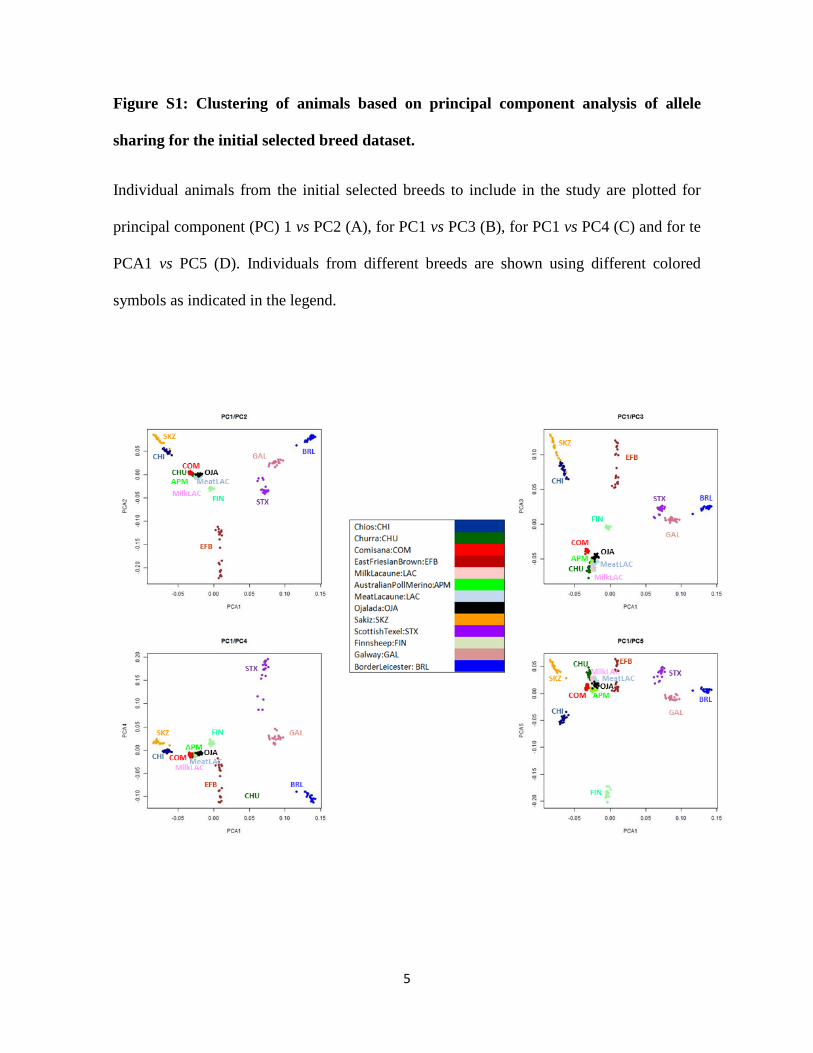
5
Figure S1: Clustering of animals based on principal component analysis of allele
sharing for the initial selected breed dataset.
Individual animals from the initial selected breeds to include in the study are plotted for
principal component (PC) 1 vs PC2 (A), for PC1 vs PC3 (B), for PC1 vs PC4 (C) and for te
PCA1 vs PC5 (D). Individuals from different breeds are shown using different colored
symbols as indicated in the legend.

6
References
1. Kijas JW, Lenstra JA, Hayes B, Boitard S, Porto Neto LR, et al. (2012) Genome-
wide analysis of the world's sheep breeds reveals high levels of historic mixture and
strong recent selection. PLoS Biol 10: e1001258.
2. Patterson N, Price AL, Reich D. (2006) Population structure and eigenanalysis.
PLoS Genet 2: e190.
1
File S2 for Application of selection mapping to identify genomic regions
associated with dairy production in sheep
Authors: Beatriz Gutiérrez-Gil1*, Juan Jose Arranz1, Ricardo Pong-Wong2, Elsa García-
Gámez1, James Kijas3, Pamela Wiener2
File S2: Summary of the results of the analysis performed in this work in relation to the
myostatin (GDF-8) gene region. These results were evaluated to establish criteria for the
analyses performed to detect dairy selection signatures in the dairy breeds analysed.
Methods: Test Case Analysis: Myostatin (GDF-8) Gene Region The myostatin gene (GDF-8), variation at which is associated with muscle hypertrophy in the
Belgian Texel breed [1] and other related sheep breeds [2], was considered as a test case to
assess the ability of the different analyses to detect genomic regions that have been subject to
selection pressure. This region was also used to evaluate the influence of parameters used for
the analyses implemented in this study. Kijas et al. [3] showed that a selection signature in
the GDF-8 gene region could be identified in three geographically distinct populations of
Texel, including the Scottish Texel, which was considered as the reference breed for this test
case assessment.
Based on the PCA analysis described in Supporting Information File 1, the Scottish Texel
breed was compared to the Galway breed in the pair-wise FST analysis. Regions of low
observed heterozygosity were also assessed for the Scottish Texel breed following the
2
methods described for the dairy and non-dairy breeds in the Selection sweep mapping
analysis methods section of the main text of the manuscript. These analyses were
implemented across the whole genome using sliding windows of 9-, 13- and 17- SNPs and
the results obtained near the GDF-8 gene (OAR2: 118.573 – 118.579 Mb) were evaluated to
establish criteria for the analyses performed to detect dairy selection signatures. The results
of the regression analysis for detection of regions with asymptotic heterozygosity patterns
performed in the Scottish Texel breed, which was performed as described in the Selection
sweep mapping analysis methods section of the main text of the manuscript, for the three
tested bracket sizes (5, 10 and 20 Mbp) were also assessed for chromosome OAR2, in
relation to the position of the GDF-8 gene.
Results: Mapping accuracy of GDF-8 and setting of criteria for further analyses
Differentiation: For two of the window sizes (9- and 17-SNP) used to obtain the averaged FST
for the Scottish Texel-Galway pair, the top result genome-wide was found in the OAR2
region carrying the GDF-8 gene, whereas for the 13-SNP window the top position was found
on OAR7 (33.45 Mb). The top location for the 9-SNP window size (at 115.28 Mb) was much
closer to the actual position of GDF-8 (118.57 Mb) than seen for the case of the 17-SNP
window size (top position at 113.25 Mb). Based on these results, a 9-SNP window size was
selected to calculate the average pair-wise FST values for the dairy vs non-dairy breed pairs.
Furthermore, the distribution of identified positions near GDF-8 was considered to determine
the criteria to define a single selection signal. Among positions on OAR2 that were in the top
0.5 percent of the 9-SNP window FST (FST-9SNPW) values for the Scottish-Texel-Galway
pair, 55 of 68 of them were found between 109.62 Mb and 122.62 Mb, with inter-marker
distances less than or equal to 1.97 Mb (Supporting Figure S2a). The gaps flanking the
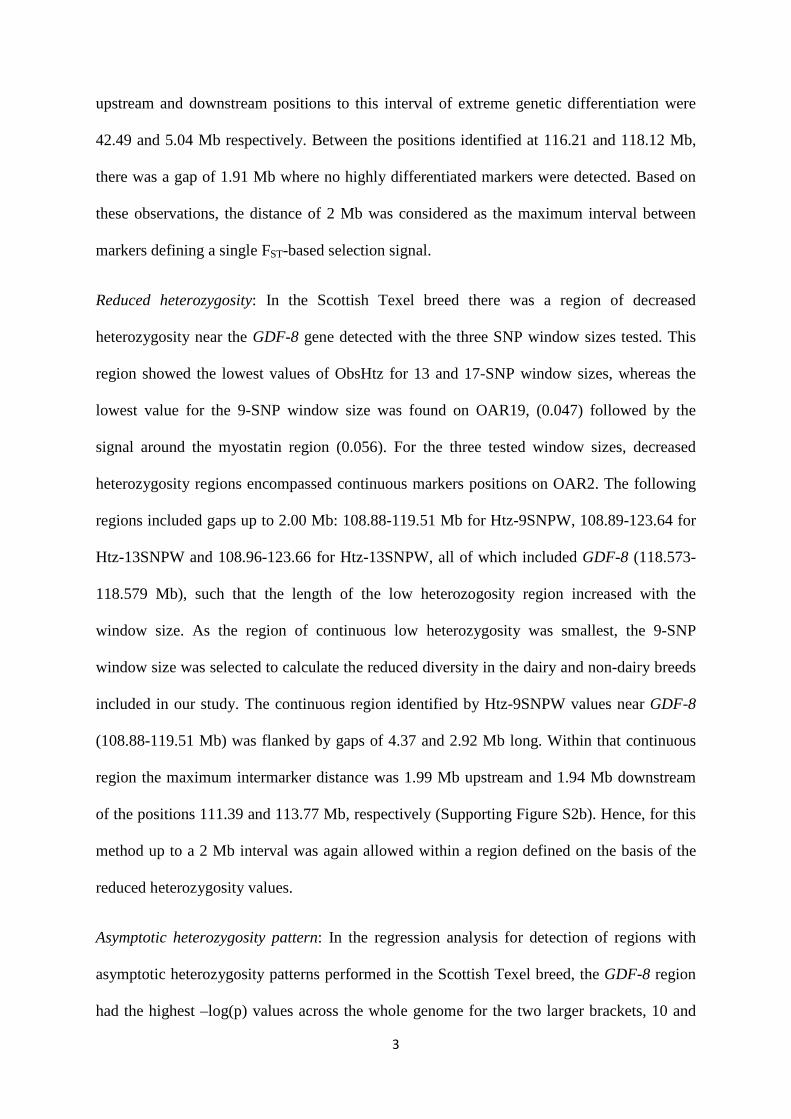
3
upstream and downstream positions to this interval of extreme genetic differentiation were
42.49 and 5.04 Mb respectively. Between the positions identified at 116.21 and 118.12 Mb,
there was a gap of 1.91 Mb where no highly differentiated markers were detected. Based on
these observations, the distance of 2 Mb was considered as the maximum interval between
markers defining a single FST-based selection signal.
Reduced heterozygosity: In the Scottish Texel breed there was a region of decreased
heterozygosity near the GDF-8 gene detected with the three SNP window sizes tested. This
region showed the lowest values of ObsHtz for 13 and 17-SNP window sizes, whereas the
lowest value for the 9-SNP window size was found on OAR19, (0.047) followed by the
signal around the myostatin region (0.056). For the three tested window sizes, decreased
heterozygosity regions encompassed continuous markers positions on OAR2. The following
regions included gaps up to 2.00 Mb: 108.88-119.51 Mb for Htz-9SNPW, 108.89-123.64 for
Htz-13SNPW and 108.96-123.66 for Htz-13SNPW, all of which included GDF-8 (118.573-
118.579 Mb), such that the length of the low heterozogosity region increased with the
window size. As the region of continuous low heterozygosity was smallest, the 9-SNP
window size was selected to calculate the reduced diversity in the dairy and non-dairy breeds
included in our study. The continuous region identified by Htz-9SNPW values near GDF-8
(108.88-119.51 Mb) was flanked by gaps of 4.37 and 2.92 Mb long. Within that continuous
region the maximum intermarker distance was 1.99 Mb upstream and 1.94 Mb downstream
of the positions 111.39 and 113.77 Mb, respectively (Supporting Figure S2b). Hence, for this
method up to a 2 Mb interval was again allowed within a region defined on the basis of the
reduced heterozygosity values.
Asymptotic heterozygosity pattern: In the regression analysis for detection of regions with
asymptotic heterozygosity patterns performed in the Scottish Texel breed, the GDF-8 region
had the highest –log(p) values across the whole genome for the two larger brackets, 10 and
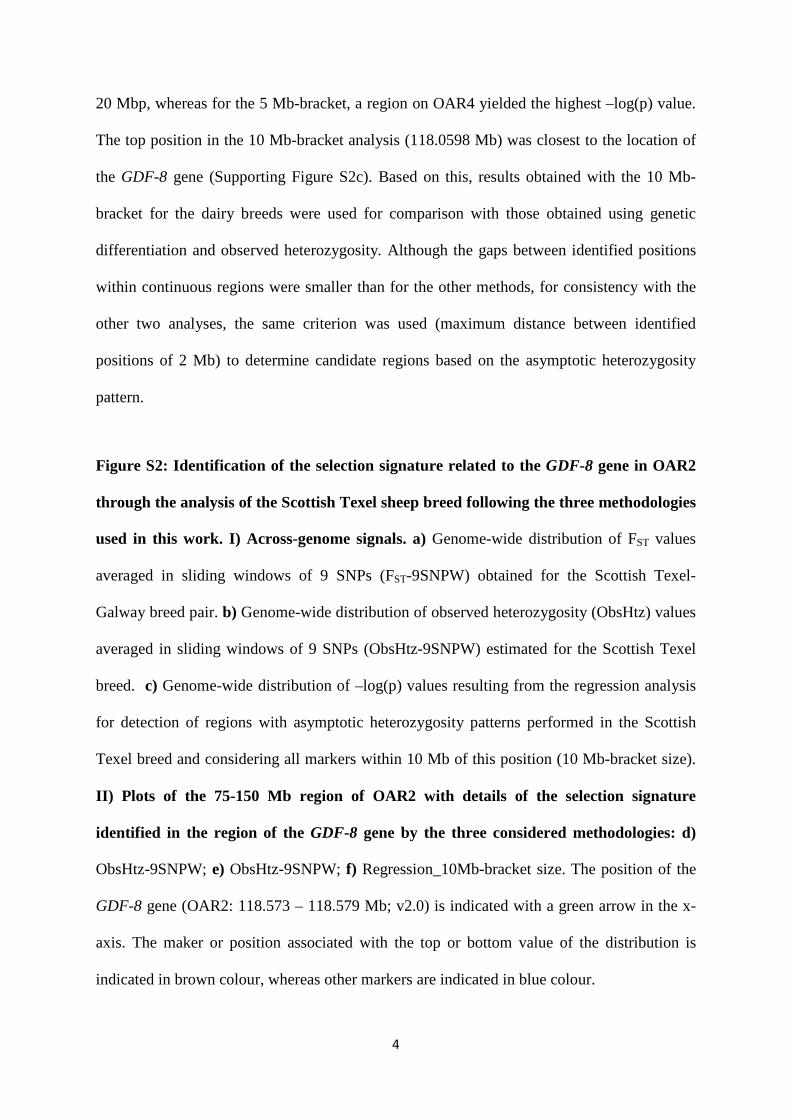
4
20 Mbp, whereas for the 5 Mb-bracket, a region on OAR4 yielded the highest –log(p) value.
The top position in the 10 Mb-bracket analysis (118.0598 Mb) was closest to the location of
the GDF-8 gene (Supporting Figure S2c). Based on this, results obtained with the 10 Mb-
bracket for the dairy breeds were used for comparison with those obtained using genetic
differentiation and observed heterozygosity. Although the gaps between identified positions
within continuous regions were smaller than for the other methods, for consistency with the
other two analyses, the same criterion was used (maximum distance between identified
positions of 2 Mb) to determine candidate regions based on the asymptotic heterozygosity
pattern.
Figure S2: Identification of the selection signature related to the GDF-8 gene in OAR2
through the analysis of the Scottish Texel sheep breed following the three methodologies
used in this work. I) Across-genome signals. a) Genome-wide distribution of FST values
averaged in sliding windows of 9 SNPs (FST-9SNPW) obtained for the Scottish Texel-
Galway breed pair. b) Genome-wide distribution of observed heterozygosity (ObsHtz) values
averaged in sliding windows of 9 SNPs (ObsHtz-9SNPW) estimated for the Scottish Texel
breed. c) Genome-wide distribution of –log(p) values resulting from the regression analysis
for detection of regions with asymptotic heterozygosity patterns performed in the Scottish
Texel breed and considering all markers within 10 Mb of this position (10 Mb-bracket size).
II) Plots of the 75-150 Mb region of OAR2 with details of the selection signature
identified in the region of the GDF-8 gene by the three considered methodologies: d)
ObsHtz-9SNPW; e) ObsHtz-9SNPW; f) Regression_10Mb-bracket size. The position of the
GDF-8 gene (OAR2: 118.573 – 118.579 Mb; v2.0) is indicated with a green arrow in the x-
axis. The maker or position associated with the top or bottom value of the distribution is
indicated in brown colour, whereas other markers are indicated in blue colour.
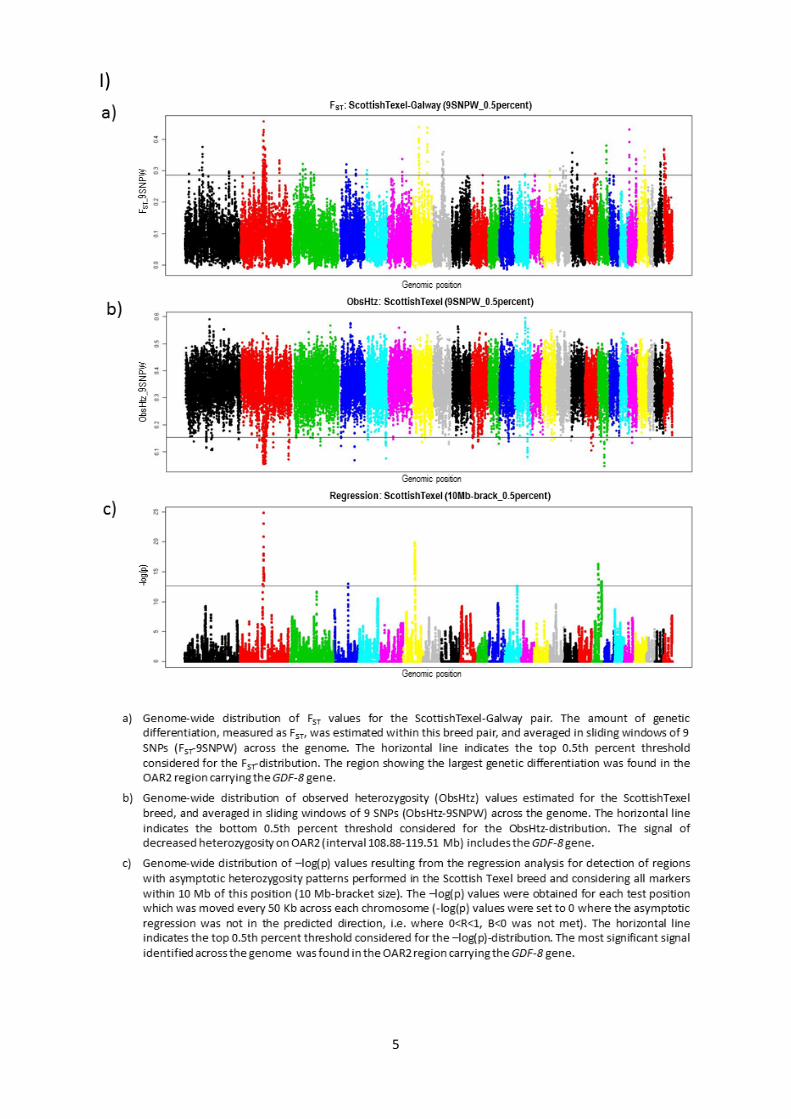
5
I)
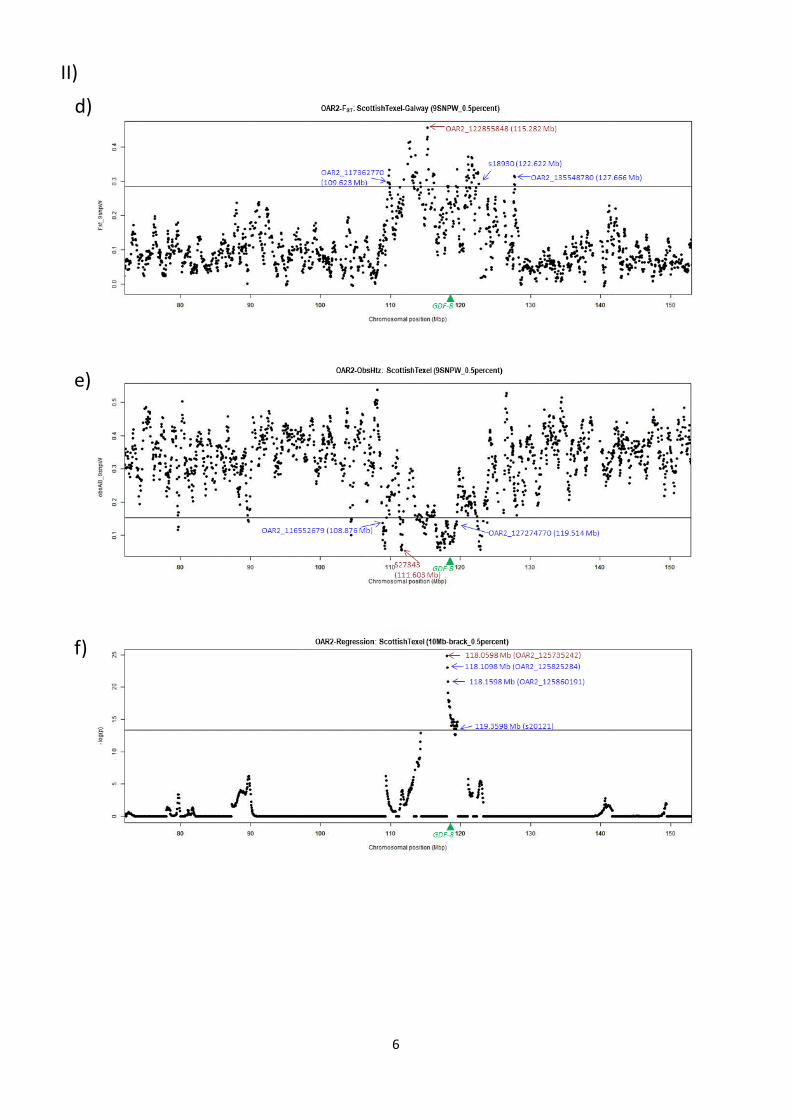
6
II) d)
e)
f)
7
REFERENCES
1. Clop A, Marcq F, Takeda H, Pirottin D, Tordoir X, et al. (2006) A mutation creating a
potential illegitimate microRNA target site in the myostatin gene affects muscularity
in sheep. Nat Genet 38: 813-818.
2. Bignell CW, Malau-Aduli AE, Nichols PD, McCulloch R, Kijas JW (2010) East
Friesian sheep carry a Myostatin allele known to cause muscle hypertrophy in other
breeds. Anim Genet 41: 445-446.
3. Kijas JW, Lenstra JA, Hayes B, Boitard S, Porto Neto LR, et al. (2012). Genome-
wide analysis of the world's sheep breeds reveals high levels of historic mixture and
strong recent selection. PLoS Biol 10: e1001258.
Table S1 for
Application of selection mapping to identify genomic regions
associated with dairy production in sheep
Authors: Beatriz Gutiérrez-Gil1*, Juan Jose Arranz1, Ricardo Pong-Wong2, Elsa García-
Gámez1, James Kijas3, Pamela Wiener2
Table S1. Candidate regions for signatures of selection identified on the basis of the
pairwise FST analysis performed on six dairy–non-dairy breed pairs. For each dairy-non-
dairy breed pair, the results contain the top 0.5th percent of the distributions of FST values,
averaged in sliding windows of 9 SNPs. Only the regions that were found in at least two
pairs of breeds (that did not have a breed in common) were labeled as FST-based
candidate regions (FST-CRs). Gaps up to 2 Mb were allowed between positions identified
within the same breed pair and between different breed pairs to consider a single selection
signal. Positions of the markers (Mb) are referred to the Sheep Genome Assembly v2.0
(update September 2011).
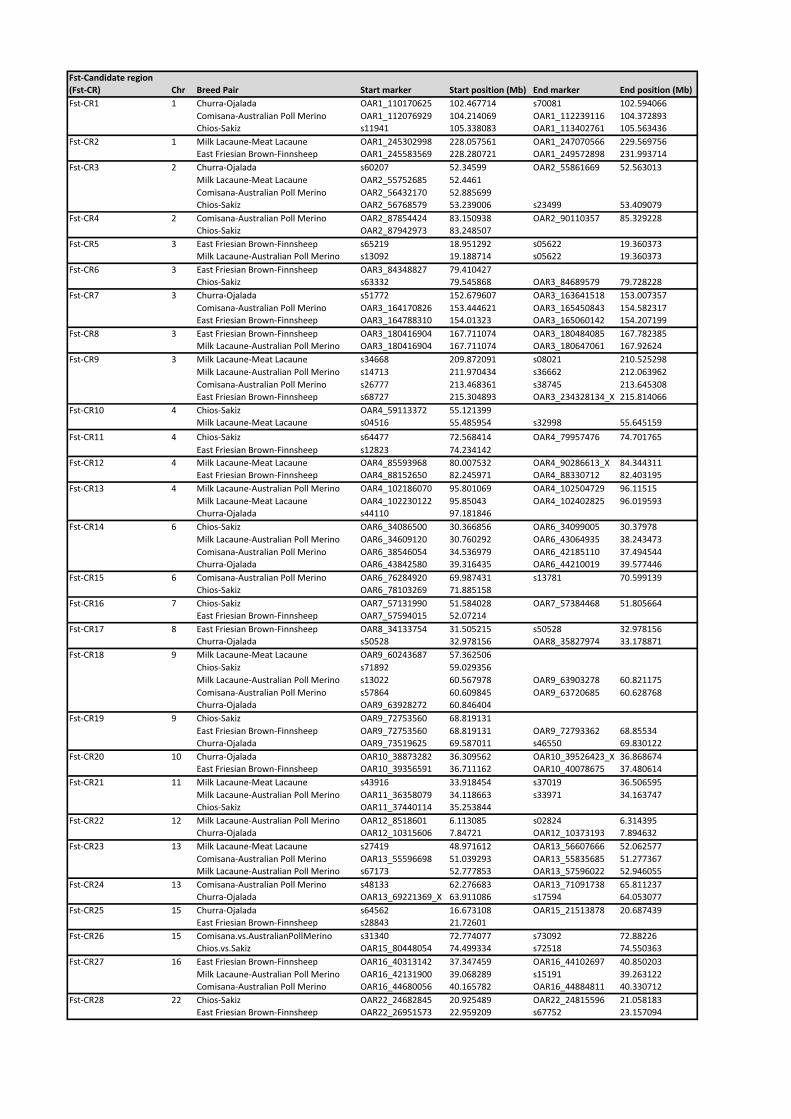
Fst‐Candidate region
(Fst‐CR) Chr Breed Pair Start marker Start position (Mb) End marker End position (Mb)
Fst‐CR1 1 Churra‐Ojalada OAR1_110170625 102.467714 s70081 102.594066
Comisana‐Australian Poll Merino OAR1_112076929 104.214069 OAR1_112239116 104.372893
Chios‐Sakiz s11941 105.338083 OAR1_113402761 105.563436
Fst‐CR2 1 Milk Lacaune‐Meat Lacaune OAR1_245302998 228.057561 OAR1_247070566 229.569756
East Friesian Brown‐Finnsheep OAR1_245583569 228.280721 OAR1_249572898 231.993714
Fst‐CR3 2 Churra‐Ojalada s60207 52.34599 OAR2_55861669 52.563013
Milk Lacaune‐Meat Lacaune OAR2_55752685 52.4461
Comisana‐Australian Poll Merino OAR2_56432170 52.885699
Chios‐Sakiz OAR2_56768579 53.239006 s23499 53.409079
Fst‐CR4 2 Comisana‐Australian Poll Merino OAR2_87854424 83.150938 OAR2_90110357 85.329228
Chios‐Sakiz OAR2_87942973 83.248507
Fst‐CR5 3 East Friesian Brown‐Finnsheep s65219 18.951292 s05622 19.360373
Milk Lacaune‐Australian Poll Merino s13092 19.188714 s05622 19.360373
Fst‐CR6 3 East Friesian Brown‐Finnsheep OAR3_84348827 79.410427
Chios‐Sakiz s63332 79.545868 OAR3_84689579 79.728228
Fst‐CR7 3 Churra‐Ojalada s51772 152.679607 OAR3_163641518 153.007357
Comisana‐Australian Poll Merino OAR3_164170826 153.444621 OAR3_165450843 154.582317
East Friesian Brown‐Finnsheep OAR3_164788310 154.01323 OAR3_165060142 154.207199
Fst‐CR8 3 East Friesian Brown‐Finnsheep OAR3_180416904 167.711074 OAR3_180484085 167.782385
Milk Lacaune‐Australian Poll Merino OAR3_180416904 167.711074 OAR3_180647061 167.92624
Fst‐CR9 3 Milk Lacaune‐Meat Lacaune s34668 209.872091 s08021 210.525298
Milk Lacaune‐Australian Poll Merino s14713 211.970434 s36662 212.063962
Comisana‐Australian Poll Merino s26777 213.468361 s38745 213.645308
East Friesian Brown‐Finnsheep s68727 215.304893 OAR3_234328134_X 215.814066
Fst‐CR10 4 Chios‐Sakiz OAR4_59113372 55.121399
Milk Lacaune‐Meat Lacaune s04516 55.485954 s32998 55.645159
Fst‐CR11 4 Chios‐Sakiz s64477 72.568414 OAR4_79957476 74.701765
East Friesian Brown‐Finnsheep s12823 74.234142
Fst‐CR12 4 Milk Lacaune‐Meat Lacaune OAR4_85593968 80.007532 OAR4_90286613_X 84.344311
East Friesian Brown‐Finnsheep OAR4_88152650 82.245971 OAR4_88330712 82.403195
Fst‐CR13 4 Milk Lacaune‐Australian Poll Merino OAR4_102186070 95.801069 OAR4_102504729 96.11515
Milk Lacaune‐Meat Lacaune OAR4_102230122 95.85043 OAR4_102402825 96.019593
Churra‐Ojalada s44110 97.181846
Fst‐CR14 6 Chios‐Sakiz OAR6_34086500 30.366856 OAR6_34099005 30.37978
Milk Lacaune‐Australian Poll Merino OAR6_34609120 30.760292 OAR6_43064935 38.243473
Comisana‐Australian Poll Merino OAR6_38546054 34.536979 OAR6_42185110 37.494544
Churra‐Ojalada OAR6_43842580 39.316435 OAR6_44210019 39.577446
Fst‐CR15 6 Comisana‐Australian Poll Merino OAR6_76284920 69.987431 s13781 70.599139
Chios‐Sakiz OAR6_78103269 71.885158
Fst‐CR16 7 Chios‐Sakiz OAR7_57131990 51.584028 OAR7_57384468 51.805664
East Friesian Brown‐Finnsheep OAR7_57594015 52.07214
Fst‐CR17 8 East Friesian Brown‐Finnsheep OAR8_34133754 31.505215 s50528 32.978156
Churra‐Ojalada s50528 32.978156 OAR8_35827974 33.178871
Fst‐CR18 9 Milk Lacaune‐Meat Lacaune OAR9_60243687 57.362506
Chios‐Sakiz s71892 59.029356
Milk Lacaune‐Australian Poll Merino s13022 60.567978 OAR9_63903278 60.821175
Comisana‐Australian Poll Merino s57864 60.609845 OAR9_63720685 60.628768
Churra‐Ojalada OAR9_63928272 60.846404
Fst‐CR19 9 Chios‐Sakiz OAR9_72753560 68.819131
East Friesian Brown‐Finnsheep OAR9_72753560 68.819131 OAR9_72793362 68.85534
Churra‐Ojalada OAR9_73519625 69.587011 s46550 69.830122
Fst‐CR20 10 Churra‐Ojalada OAR10_38873282 36.309562 OAR10_39526423_X 36.868674
East Friesian Brown‐Finnsheep OAR10_39356591 36.711162 OAR10_40078675 37.480614
Fst‐CR21 11 Milk Lacaune‐Meat Lacaune s43916 33.918454 s37019 36.506595
Milk Lacaune‐Australian Poll Merino OAR11_36358079 34.118663 s33971 34.163747
Chios‐Sakiz OAR11_37440114 35.253844
Fst‐CR22 12 Milk Lacaune‐Australian Poll Merino OAR12_8518601 6.113085 s02824 6.314395
Churra‐Ojalada OAR12_10315606 7.84721 OAR12_10373193 7.894632
Fst‐CR23 13 Milk Lacaune‐Meat Lacaune s27419 48.971612 OAR13_56607666 52.062577
Comisana‐Australian Poll Merino OAR13_55596698 51.039293 OAR13_55835685 51.277367
Milk Lacaune‐Australian Poll Merino s67173 52.777853 OAR13_57596022 52.946055
Fst‐CR24 13 Comisana‐Australian Poll Merino s48133 62.276683 OAR13_71091738 65.811237
Churra‐Ojalada OAR13_69221369_X 63.911086 s17594 64.053077
Fst‐CR25 15 Churra‐Ojalada s64562 16.673108 OAR15_21513878 20.687439
East Friesian Brown‐Finnsheep s28843 21.72601
Fst‐CR26 15 Comisana.vs.AustralianPollMerino s31340 72.774077 s73092 72.88226
Chios.vs.Sakiz OAR15_80448054 74.499334 s72518 74.550363
Fst‐CR27 16 East Friesian Brown‐Finnsheep OAR16_40313142 37.347459 OAR16_44102697 40.850203
Milk Lacaune‐Australian Poll Merino OAR16_42131900 39.068289 s15191 39.263122
Comisana‐Australian Poll Merino OAR16_44680056 40.165782 OAR16_44884811 40.330712
Fst‐CR28 22 Chios‐Sakiz OAR22_24682845 20.925489 OAR22_24815596 21.058183
East Friesian Brown‐Finnsheep OAR22_26951573 22.959209 s67752 23.157094
Table S2 for
Application of selection mapping to identify genomic regions
associated with dairy production in sheep
Authors: Beatriz Gutiérrez-Gil1*, Juan Jose Arranz1, Ricardo Pong-Wong2, Elsa García-
Gámez1, James Kijas3, Pamela Wiener2
Table S2. Candidate regions identified based on reduced heterozygosity signals identified
in at least two of the analyzed dairy breeds. Non-dairy breeds showing a coincident
reduced heterozygosity signal are also indicated. For each breed, the results contain the
bottom 0.5th percent of the distributions of observed heterozygosity values, averaged in
sliding windows of 9 SNPs. Only the regions that were found in at least two dairy breeds
were labeled as candidate regions based on the reduction of observed heterozygosity
(ObsHtz-CRs). Gaps up to 2 Mb were allowed between positions identified within the same
breed and between different breeds to consider a single selection signal. Positions of the
markers (Mb) are referred to the Sheep Genome Assembly v2.0 (update September
2011).
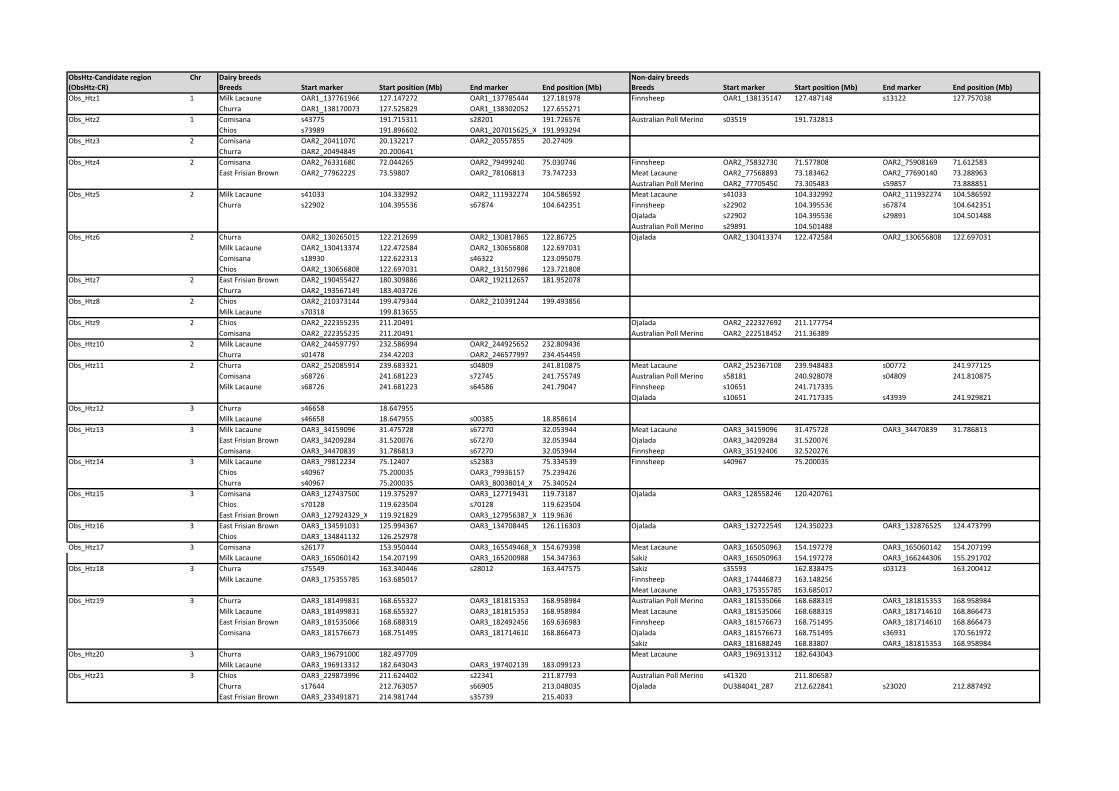
ObsHtz‐Candidate region Chr Dairy breeds Non‐dairy breeds
(ObsHtz‐CR) Breeds Start marker Start position (Mb) End marker End position (Mb) Breeds Start marker Start position (Mb) End marker End position (Mb)
Obs_Htz1 1 Milk Lacaune OAR1_137761966 127.147272 OAR1_137785444 127.181978 Finnsheep OAR1_138135147 127.487148 s13122 127.757038
Churra OAR1_138170073 127.525829 OAR1_138302052 127.655271
Obs_Htz2 1 Comisana s43775 191.715311 s28201 191.726576 Australian Poll Merino s03519 191.732813
Chios s73989 191.896602 OAR1_207015625_X 191.993294
Obs_Htz3 2 Comisana OAR2_20411070 20.132217 OAR2_20557855 20.27409
Churra OAR2_20494849 20.200641
Obs_Htz4 2 Comisana OAR2_76331680 72.044265 OAR2_79499240 75.030746 Finnsheep OAR2_75832730 71.577808 OAR2_75908169 71.612583
East Frisian Brown OAR2_77962229 73.59807 OAR2_78106813 73.747233 Meat Lacaune OAR2_77568893 73.183462 OAR2_77690140 73.288963
Australian Poll Merino OAR2_77705450 73.305483 s59857 73.888851
Obs_Htz5 2 Milk Lacaune s41033 104.332992 OAR2_111932274 104.586592 Meat Lacaune s41033 104.332992 OAR2_111932274 104.586592
Churra s22902 104.395536 s67874 104.642351 Finnsheep s22902 104.395536 s67874 104.642351
Ojalada s22902 104.395536 s29891 104.501488
Australian Poll Merino s29891 104.501488
Obs_Htz6 2 Churra OAR2_130265015 122.212699 OAR2_130817865 122.86725 Ojalada OAR2_130413374 122.472584 OAR2_130656808 122.697031
Milk Lacaune OAR2_130413374 122.472584 OAR2_130656808 122.697031
Comisana s18930 122.622313 s46322 123.095079
Chios OAR2_130656808 122.697031 OAR2_131507986 123.721808
Obs_Htz7 2 East Frisian Brown OAR2_190455427 180.309886 OAR2_192112657 181.952078
Churra OAR2_193567149 183.403726
Obs_Htz8 2 Chios OAR2_210373144 199.479344 OAR2_210391244 199.493856
Milk Lacaune s70318 199.813655
Obs_Htz9 2 Chios OAR2_222355235 211.20491 Ojalada OAR2_222327692 211.177754
Comisana OAR2_222355235 211.20491 Australian Poll Merino OAR2_222518452 211.36389
Obs_Htz10 2 Milk Lacaune OAR2_244597797 232.586994 OAR2_244925652 232.809436
Churra s01478 234.42203 OAR2_246577997 234.454459
Obs_Htz11 2 Churra OAR2_252085914 239.683321 s04809 241.810875 Meat Lacaune OAR2_252367108 239.948483 s00772 241.977125
Comisana s68726 241.681223 s72745 241.755749 Australian Poll Merino s58181 240.928078 s04809 241.810875
Milk Lacaune s68726 241.681223 s64586 241.79047 Finnsheep s10651 241.717335
Ojalada s10651 241.717335 s43939 241.929821
Obs_Htz12 3 Churra s46658 18.647955
Milk Lacaune s46658 18.647955 s00385 18.858614
Obs_Htz13 3 Milk Lacaune OAR3_34159096 31.475728 s67270 32.053944 Meat Lacaune OAR3_34159096 31.475728 OAR3_34470839 31.786813
East Frisian Brown OAR3_34209284 31.520076 s67270 32.053944 Ojalada OAR3_34209284 31.520076
Comisana OAR3_34470839 31.786813 s67270 32.053944 Finnsheep OAR3_35192406 32.520276
Obs_Htz14 3 Milk Lacaune OAR3_79812234 75.12407 s52383 75.334539 Finnsheep s40967 75.200035
Chios s40967 75.200035 OAR3_79936157 75.239426
Churra s40967 75.200035 OAR3_80038014_X 75.340524
Obs_Htz15 3 Comisana OAR3_127437500 119.375297 OAR3_127719431 119.73187 Ojalada OAR3_128558246 120.420761
Chios s70128 119.623504 s70128 119.623504
East Frisian Brown OAR3_127924329_X 119.921829 OAR3_127956387_X 119.9636
Obs_Htz16 3 East Frisian Brown OAR3_134591031 125.994367 OAR3_134708445 126.116303 Ojalada OAR3_132722549 124.350223 OAR3_132876525 124.473799
Chios OAR3_134841132 126.252978
Obs_Htz17 3 Comisana s26177 153.950444 OAR3_165549468_X 154.679398 Meat Lacaune OAR3_165050963 154.197278 OAR3_165060142 154.207199
Milk Lacaune OAR3_165060142 154.207199 OAR3_165200988 154.347363 Sakiz OAR3_165050963 154.197278 OAR3_166244306 155.291702
Obs_Htz18 3 Churra s75549 163.340446 s28012 163.447575 Sakiz s35593 162.838475 s03123 163.200412
Milk Lacaune OAR3_175355785 163.685017 Finnsheep OAR3_174446873 163.148256
Meat Lacaune OAR3_175355785 163.685017
Obs_Htz19 3 Churra OAR3_181499831 168.655327 OAR3_181815353 168.958984 Australian Poll Merino OAR3_181535066 168.688319 OAR3_181815353 168.958984
Milk Lacaune OAR3_181499831 168.655327 OAR3_181815353 168.958984 Meat Lacaune OAR3_181535066 168.688319 OAR3_181714610 168.866473
East Frisian Brown OAR3_181535066 168.688319 OAR3_182492456 169.636983 Finnsheep OAR3_181576673 168.751495 OAR3_181714610 168.866473
Comisana OAR3_181576673 168.751495 OAR3_181714610 168.866473 Ojalada OAR3_181576673 168.751495 s36931 170.561972
Sakiz OAR3_181688249 168.83807 OAR3_181815353 168.958984
Obs_Htz20 3 Churra OAR3_196791000 182.497709 Meat Lacaune OAR3_196913312 182.643043
Milk Lacaune OAR3_196913312 182.643043 OAR3_197402139 183.099123
Obs_Htz21 3 Chios OAR3_229873996 211.624402 s22341 211.87793 Australian Poll Merino s41320 211.806587
Churra s17644 212.763057 s66905 213.048035 Ojalada DU384041_287 212.622841 s23020 212.887492
East Frisian Brown OAR3_233491871 214.981744 s35739 215.4033
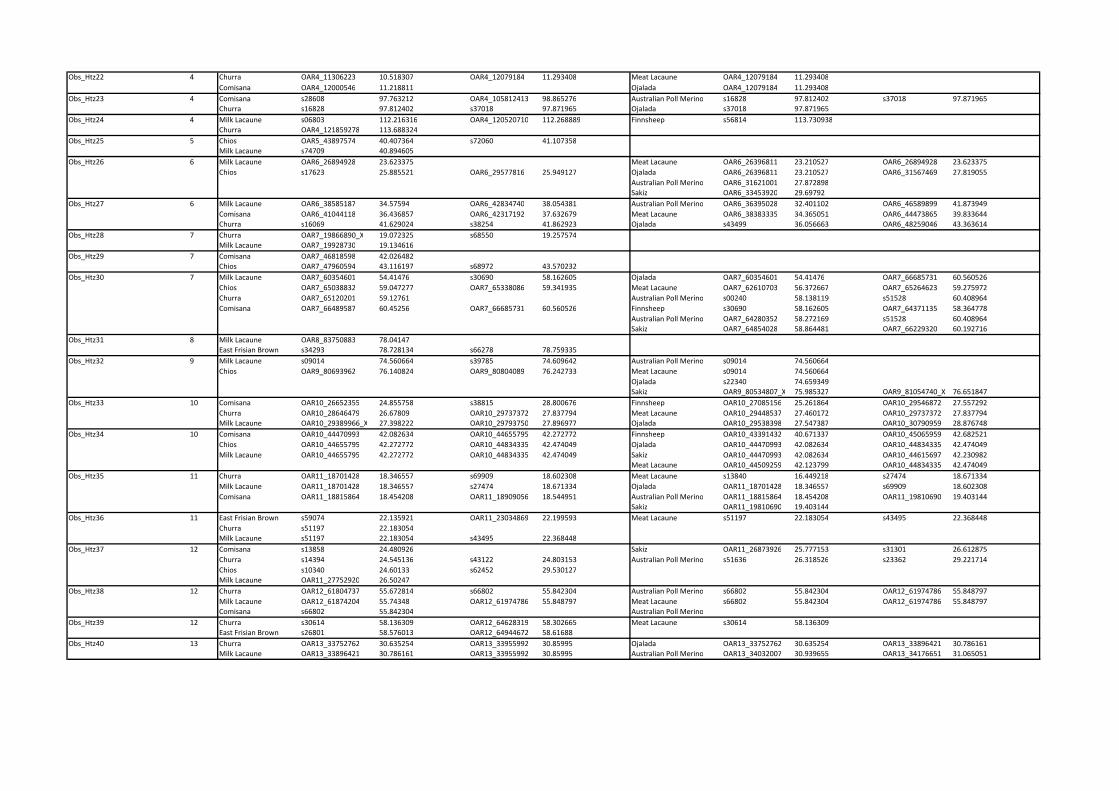
Obs_Htz22 4 Churra OAR4_11306223 10.518307 OAR4_12079184 11.293408 Meat Lacaune OAR4_12079184 11.293408
Comisana OAR4_12000546 11.218811 Ojalada OAR4_12079184 11.293408
Obs_Htz23 4 Comisana s28608 97.763212 OAR4_105812413 98.865276 Australian Poll Merino s16828 97.812402 s37018 97.871965
Churra s16828 97.812402 s37018 97.871965 Ojalada s37018 97.871965
Obs_Htz24 4 Milk Lacaune s06803 112.216316 OAR4_120520710 112.268889 Finnsheep s56814 113.730938
Churra OAR4_121859278 113.688324
Obs_Htz25 5 Chios OAR5_43897574 40.407364 s72060 41.107358
Milk Lacaune s74709 40.894605
Obs_Htz26 6 Milk Lacaune OAR6_26894928 23.623375 Meat Lacaune OAR6_26396811 23.210527 OAR6_26894928 23.623375
Chios s17623 25.885521 OAR6_29577816 25.949127 Ojalada OAR6_26396811 23.210527 OAR6_31567469 27.819055
Australian Poll Merino OAR6_31621001 27.872898
Sakiz OAR6_33453920 29.69792
Obs_Htz27 6 Milk Lacaune OAR6_38585187 34.57594 OAR6_42834740 38.054381 Australian Poll Merino OAR6_36395028 32.401102 OAR6_46589899 41.873949
Comisana OAR6_41044118 36.436857 OAR6_42317192 37.632679 Meat Lacaune OAR6_38383335 34.365051 OAR6_44473865 39.833644
Churra s16069 41.629024 s38254 41.862923 Ojalada s43499 36.056663 OAR6_48259046 43.363614
Obs_Htz28 7 Churra OAR7_19866890_X 19.072325 s68550 19.257574
Milk Lacaune OAR7_19928730 19.134616
Obs_Htz29 7 Comisana OAR7_46818598 42.026482
Chios OAR7_47960594 43.116197 s68972 43.570232
Obs_Htz30 7 Milk Lacaune OAR7_60354601 54.41476 s30690 58.162605 Ojalada OAR7_60354601 54.41476 OAR7_66685731 60.560526
Chios OAR7_65038832 59.047277 OAR7_65338086 59.341935 Meat Lacaune OAR7_62610703 56.372667 OAR7_65264623 59.275972
Churra OAR7_65120201 59.12761 Australian Poll Merino s00240 58.138119 s51528 60.408964
Comisana OAR7_66489587 60.45256 OAR7_66685731 60.560526 Finnsheep s30690 58.162605 OAR7_64371135 58.364778
Australian Poll Merino OAR7_64280352 58.272169 s51528 60.408964
Sakiz OAR7_64854028 58.864481 OAR7_66229320 60.192716
Obs_Htz31 8 Milk Lacaune OAR8_83750883 78.04147
East Frisian Brown s34293 78.728134 s66278 78.759335
Obs_Htz32 9 Milk Lacaune s09014 74.560664 s39785 74.609642 Australian Poll Merino s09014 74.560664
Chios OAR9_80693962 76.140824 OAR9_80804089 76.242733 Meat Lacaune s09014 74.560664
Ojalada s22340 74.659349
Sakiz OAR9_80534807_X 75.985327 OAR9_81054740_X 76.651847
Obs_Htz33 10 Comisana OAR10_26652355 24.855758 s38815 28.800676 Finnsheep OAR10_27085156 25.261864 OAR10_29546872 27.557292
Churra OAR10_28646479 26.67809 OAR10_29737372 27.837794 Meat Lacaune OAR10_29448537 27.460172 OAR10_29737372 27.837794
Milk Lacaune OAR10_29389966_X 27.398222 OAR10_29793750 27.896977 Ojalada OAR10_29538398 27.547387 OAR10_30790959 28.876748
Obs_Htz34 10 Comisana OAR10_44470993 42.082634 OAR10_44655795 42.272772 Finnsheep OAR10_43391432 40.671337 OAR10_45065959 42.682521
Chios OAR10_44655795 42.272772 OAR10_44834335 42.474049 Ojalada OAR10_44470993 42.082634 OAR10_44834335 42.474049
Milk Lacaune OAR10_44655795 42.272772 OAR10_44834335 42.474049 Sakiz OAR10_44470993 42.082634 OAR10_44615697 42.230982
Meat Lacaune OAR10_44509259 42.123799 OAR10_44834335 42.474049
Obs_Htz35 11 Churra OAR11_18701428 18.346557 s69909 18.602308 Meat Lacaune s13840 16.449218 s27474 18.671334
Milk Lacaune OAR11_18701428 18.346557 s27474 18.671334 Ojalada OAR11_18701428 18.346557 s69909 18.602308
Comisana OAR11_18815864 18.454208 OAR11_18909056 18.544951 Australian Poll Merino OAR11_18815864 18.454208 OAR11_19810690 19.403144
Sakiz OAR11_19810690 19.403144
Obs_Htz36 11 East Frisian Brown s59074 22.135921 OAR11_23034869 22.199593 Meat Lacaune s51197 22.183054 s43495 22.368448
Churra s51197 22.183054
Milk Lacaune s51197 22.183054 s43495 22.368448
Obs_Htz37 12 Comisana s13858 24.480926 Sakiz OAR11_26873926 25.777153 s31301 26.612875
Churra s14394 24.545136 s43122 24.803153 Australian Poll Merino s51636 26.318526 s23362 29.221714
Chios s10340 24.60133 s62452 29.530127
Milk Lacaune OAR11_27752920 26.50247
Obs_Htz38 12 Churra OAR12_61804737 55.672814 s66802 55.842304 Australian Poll Merino s66802 55.842304 OAR12_61974786 55.848797
Milk Lacaune OAR12_61874204 55.74348 OAR12_61974786 55.848797 Meat Lacaune s66802 55.842304 OAR12_61974786 55.848797
Comisana s66802 55.842304 Australian Poll Merino
Obs_Htz39 12 Churra s30614 58.136309 OAR12_64628319 58.302665 Meat Lacaune s30614 58.136309
East Frisian Brown s26801 58.576013 OAR12_64944672 58.61688
Obs_Htz40 13 Churra OAR13_33752762 30.635254 OAR13_33955992 30.85995 Ojalada OAR13_33752762 30.635254 OAR13_33896421 30.786161
Milk Lacaune OAR13_33896421 30.786161 OAR13_33955992 30.85995 Australian Poll Merino OAR13_34032007 30.939655 OAR13_34176651 31.065051
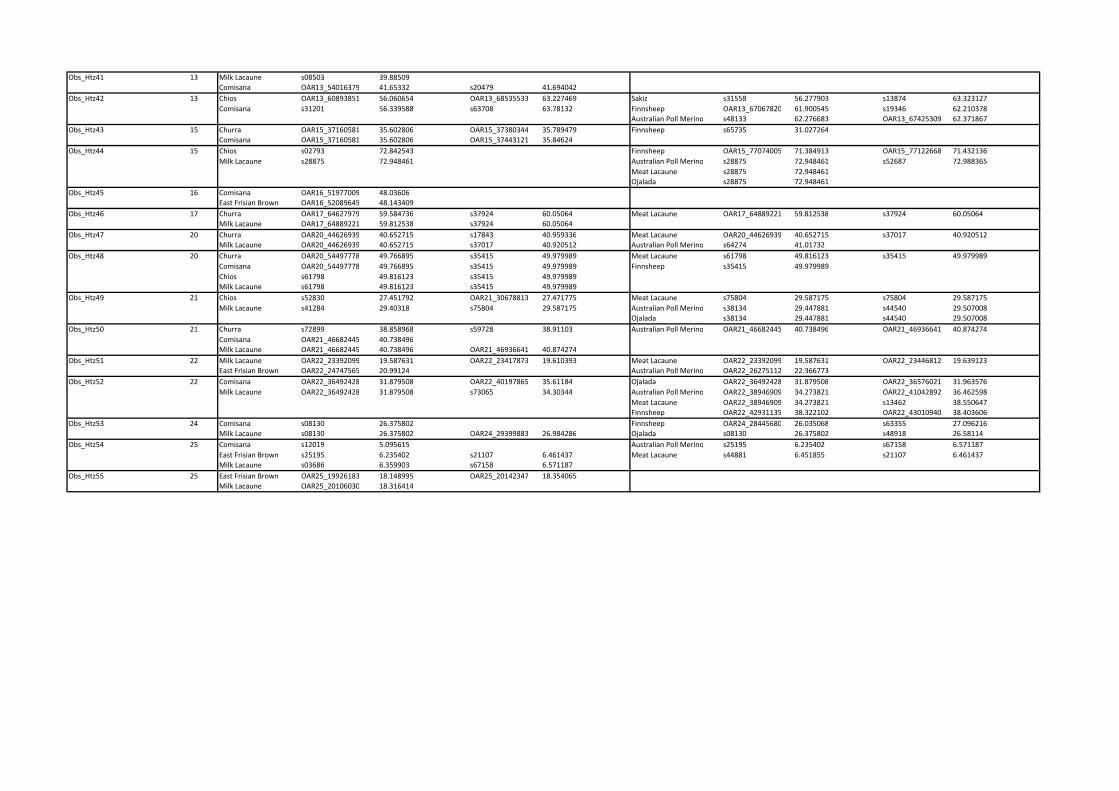
Obs_Htz41 13 Milk Lacaune s08503 39.88509
Comisana OAR13_54016379 41.65332 s20479 41.694042
Obs_Htz42 13 Chios OAR13_60893851 56.060654 OAR13_68535533 63.227469 Sakiz s31558 56.277903 s13874 63.323127
Comisana s31201 56.339588 s63708 63.78132 Finnsheep OAR13_67067820 61.900545 s19346 62.210378
Australian Poll Merino s48133 62.276683 OAR13_67425309 62.371867
Obs_Htz43 15 Churra OAR15_37160581 35.602806 OAR15_37380344 35.789479 Finnsheep s65735 31.027264
Comisana OAR15_37160581 35.602806 OAR15_37443121 35.84624
Obs_Htz44 15 Chios s02793 72.842543 Finnsheep OAR15_77074005 71.384913 OAR15_77122668 71.432136
Milk Lacaune s28875 72.948461 Australian Poll Merino s28875 72.948461 s52687 72.988365
Meat Lacaune s28875 72.948461
Ojalada s28875 72.948461
Obs_Htz45 16 Comisana OAR16_51977009 48.03606
East Frisian Brown OAR16_52089645 48.143409
Obs_Htz46 17 Churra OAR17_64627979 59.584736 s37924 60.05064 Meat Lacaune OAR17_64889221 59.812538 s37924 60.05064
Milk Lacaune OAR17_64889221 59.812538 s37924 60.05064
Obs_Htz47 20 Churra OAR20_44626939 40.652715 s17843 40.959336 Meat Lacaune OAR20_44626939 40.652715 s37017 40.920512
Milk Lacaune OAR20_44626939 40.652715 s37017 40.920512 Australian Poll Merino s64274 41.01732
Obs_Htz48 20 Churra OAR20_54497778 49.766895 s35415 49.979989 Meat Lacaune s61798 49.816123 s35415 49.979989
Comisana OAR20_54497778 49.766895 s35415 49.979989 Finnsheep s35415 49.979989
Chios s61798 49.816123 s35415 49.979989
Milk Lacaune s61798 49.816123 s35415 49.979989
Obs_Htz49 21 Chios s52830 27.451792 OAR21_30678813 27.471775 Meat Lacaune s75804 29.587175 s75804 29.587175
Milk Lacaune s41284 29.40318 s75804 29.587175 Australian Poll Merino s38134 29.447881 s44540 29.507008
Ojalada s38134 29.447881 s44540 29.507008
Obs_Htz50 21 Churra s72899 38.858968 s59728 38.91103 Australian Poll Merino OAR21_46682445 40.738496 OAR21_46936641 40.874274
Comisana OAR21_46682445 40.738496
Milk Lacaune OAR21_46682445 40.738496 OAR21_46936641 40.874274
Obs_Htz51 22 Milk Lacaune OAR22_23392099 19.587631 OAR22_23417873 19.610393 Meat Lacaune OAR22_23392099 19.587631 OAR22_23446812 19.639123
East Frisian Brown OAR22_24747565 20.99124 Australian Poll Merino OAR22_26275112 22.366773
Obs_Htz52 22 Comisana OAR22_36492428 31.879508 OAR22_40197865 35.61184 Ojalada OAR22_36492428 31.879508 OAR22_36576021 31.963576
Milk Lacaune OAR22_36492428 31.879508 s73065 34.30344 Australian Poll Merino OAR22_38946909 34.273821 OAR22_41042892 36.462598
Meat Lacaune OAR22_38946909 34.273821 s13462 38.550647
Finnsheep OAR22_42931135 38.322102 OAR22_43010940 38.403606
Obs_Htz53 24 Comisana s08130 26.375802 Finnsheep OAR24_28445680 26.035068 s63355 27.096216
Milk Lacaune s08130 26.375802 OAR24_29399883 26.984286 Ojalada s08130 26.375802 s48918 26.58114
Obs_Htz54 25 Comisana s12019 5.095615 Australian Poll Merino s25195 6.235402 s67158 6.571187
East Frisian Brown s25195 6.235402 s21107 6.461437 Meat Lacaune s44881 6.451855 s21107 6.461437
Milk Lacaune s03686 6.359903 s67158 6.571187
Obs_Htz55 25 East Frisian Brown OAR25_19926183 18.148995 OAR25_20142347 18.354065
Milk Lacaune OAR25_20106030 18.316414
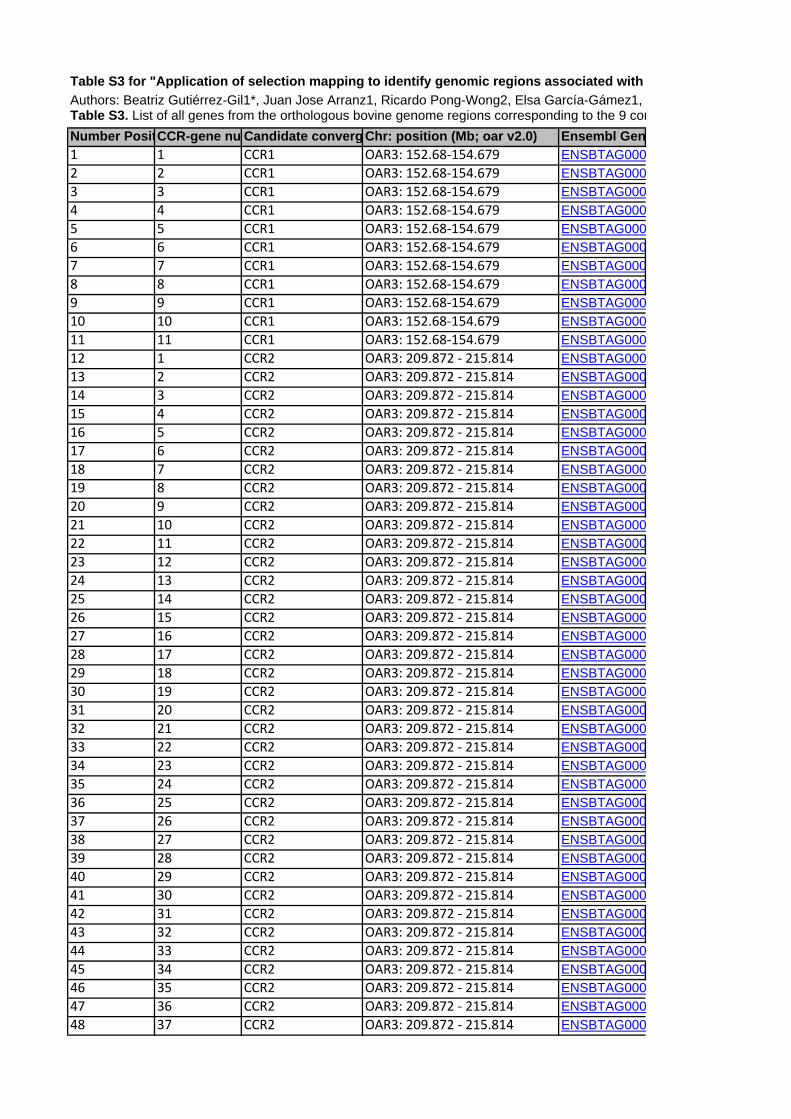
Table S3 for "Application of selection mapping to identify genomic regions associated with Authors: Beatriz Gutiérrez-Gil1*, Juan Jose Arranz1, Ricardo Pong-Wong2, Elsa García-Gámez1, Table S3. List of all genes from the orthologous bovine genome regions corresponding to the 9 conNumber PositCCR-gene nu Candidate converg Chr: position (Mb; oar v2.0) Ensembl Gen1 1 CCR1 OAR3: 152.68‐154.679 ENSBTAG0002 2 CCR1 OAR3: 152.68‐154.679 ENSBTAG0003 3 CCR1 OAR3: 152.68‐154.679 ENSBTAG0004 4 CCR1 OAR3: 152.68‐154.679 ENSBTAG0005 5 CCR1 OAR3: 152.68‐154.679 ENSBTAG0006 6 CCR1 OAR3: 152.68‐154.679 ENSBTAG0007 7 CCR1 OAR3: 152.68‐154.679 ENSBTAG0008 8 CCR1 OAR3: 152.68‐154.679 ENSBTAG0009 9 CCR1 OAR3: 152.68‐154.679 ENSBTAG00010 10 CCR1 OAR3: 152.68‐154.679 ENSBTAG00011 11 CCR1 OAR3: 152.68‐154.679 ENSBTAG00012 1 CCR2 OAR3: 209.872 ‐ 215.814 ENSBTAG00013 2 CCR2 OAR3: 209.872 ‐ 215.814 ENSBTAG00014 3 CCR2 OAR3: 209.872 ‐ 215.814 ENSBTAG00015 4 CCR2 OAR3: 209.872 ‐ 215.814 ENSBTAG00016 5 CCR2 OAR3: 209.872 ‐ 215.814 ENSBTAG00017 6 CCR2 OAR3: 209.872 ‐ 215.814 ENSBTAG00018 7 CCR2 OAR3: 209.872 ‐ 215.814 ENSBTAG00019 8 CCR2 OAR3: 209.872 ‐ 215.814 ENSBTAG00020 9 CCR2 OAR3: 209.872 ‐ 215.814 ENSBTAG00021 10 CCR2 OAR3: 209.872 ‐ 215.814 ENSBTAG00022 11 CCR2 OAR3: 209.872 ‐ 215.814 ENSBTAG00023 12 CCR2 OAR3: 209.872 ‐ 215.814 ENSBTAG00024 13 CCR2 OAR3: 209.872 ‐ 215.814 ENSBTAG00025 14 CCR2 OAR3: 209.872 ‐ 215.814 ENSBTAG00026 15 CCR2 OAR3: 209.872 ‐ 215.814 ENSBTAG00027 16 CCR2 OAR3: 209.872 ‐ 215.814 ENSBTAG00028 17 CCR2 OAR3: 209.872 ‐ 215.814 ENSBTAG00029 18 CCR2 OAR3: 209.872 ‐ 215.814 ENSBTAG00030 19 CCR2 OAR3: 209.872 ‐ 215.814 ENSBTAG00031 20 CCR2 OAR3: 209.872 ‐ 215.814 ENSBTAG00032 21 CCR2 OAR3: 209.872 ‐ 215.814 ENSBTAG00033 22 CCR2 OAR3: 209.872 ‐ 215.814 ENSBTAG00034 23 CCR2 OAR3: 209.872 ‐ 215.814 ENSBTAG00035 24 CCR2 OAR3: 209.872 ‐ 215.814 ENSBTAG00036 25 CCR2 OAR3: 209.872 ‐ 215.814 ENSBTAG00037 26 CCR2 OAR3: 209.872 ‐ 215.814 ENSBTAG00038 27 CCR2 OAR3: 209.872 ‐ 215.814 ENSBTAG00039 28 CCR2 OAR3: 209.872 ‐ 215.814 ENSBTAG00040 29 CCR2 OAR3: 209.872 ‐ 215.814 ENSBTAG00041 30 CCR2 OAR3: 209.872 ‐ 215.814 ENSBTAG00042 31 CCR2 OAR3: 209.872 ‐ 215.814 ENSBTAG00043 32 CCR2 OAR3: 209.872 ‐ 215.814 ENSBTAG00044 33 CCR2 OAR3: 209.872 ‐ 215.814 ENSBTAG00045 34 CCR2 OAR3: 209.872 ‐ 215.814 ENSBTAG00046 35 CCR2 OAR3: 209.872 ‐ 215.814 ENSBTAG00047 36 CCR2 OAR3: 209.872 ‐ 215.814 ENSBTAG00048 37 CCR2 OAR3: 209.872 ‐ 215.814 ENSBTAG000
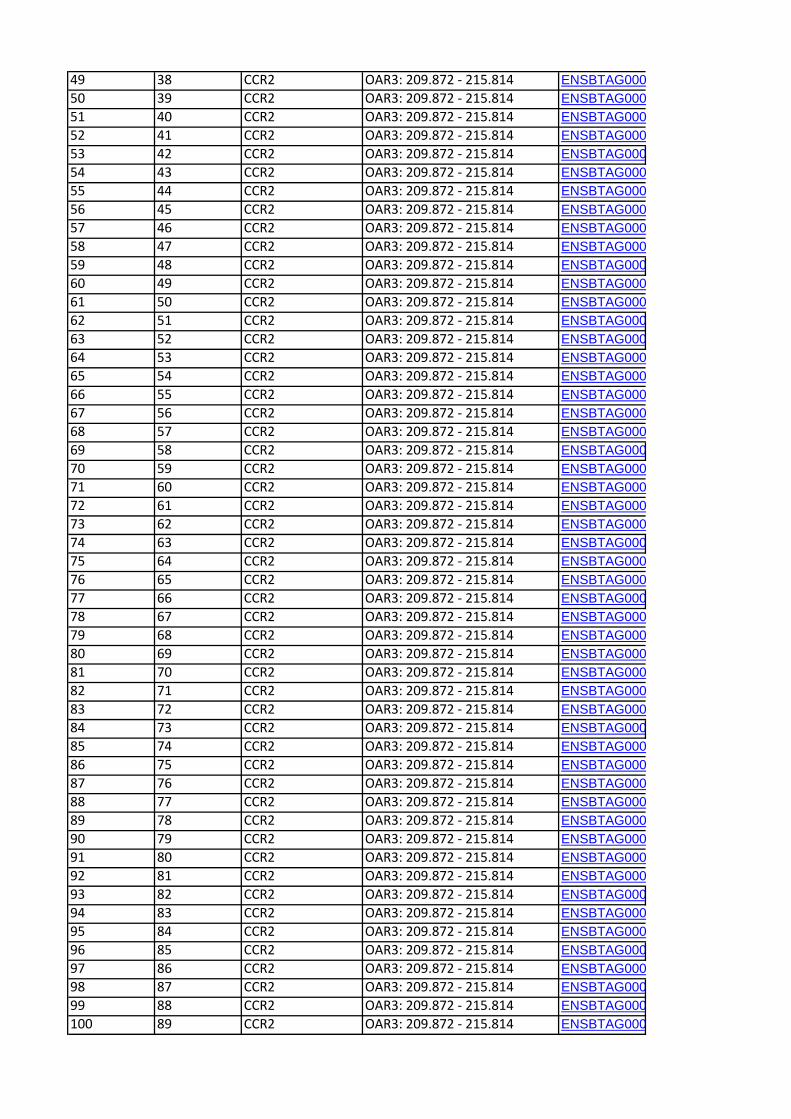
49 38 CCR2 OAR3: 209.872 ‐ 215.814 ENSBTAG00050 39 CCR2 OAR3: 209.872 ‐ 215.814 ENSBTAG00051 40 CCR2 OAR3: 209.872 ‐ 215.814 ENSBTAG00052 41 CCR2 OAR3: 209.872 ‐ 215.814 ENSBTAG00053 42 CCR2 OAR3: 209.872 ‐ 215.814 ENSBTAG00054 43 CCR2 OAR3: 209.872 ‐ 215.814 ENSBTAG00055 44 CCR2 OAR3: 209.872 ‐ 215.814 ENSBTAG00056 45 CCR2 OAR3: 209.872 ‐ 215.814 ENSBTAG00057 46 CCR2 OAR3: 209.872 ‐ 215.814 ENSBTAG00058 47 CCR2 OAR3: 209.872 ‐ 215.814 ENSBTAG00059 48 CCR2 OAR3: 209.872 ‐ 215.814 ENSBTAG00060 49 CCR2 OAR3: 209.872 ‐ 215.814 ENSBTAG00061 50 CCR2 OAR3: 209.872 ‐ 215.814 ENSBTAG00062 51 CCR2 OAR3: 209.872 ‐ 215.814 ENSBTAG00063 52 CCR2 OAR3: 209.872 ‐ 215.814 ENSBTAG00064 53 CCR2 OAR3: 209.872 ‐ 215.814 ENSBTAG00065 54 CCR2 OAR3: 209.872 ‐ 215.814 ENSBTAG00066 55 CCR2 OAR3: 209.872 ‐ 215.814 ENSBTAG00067 56 CCR2 OAR3: 209.872 ‐ 215.814 ENSBTAG00068 57 CCR2 OAR3: 209.872 ‐ 215.814 ENSBTAG00069 58 CCR2 OAR3: 209.872 ‐ 215.814 ENSBTAG00070 59 CCR2 OAR3: 209.872 ‐ 215.814 ENSBTAG00071 60 CCR2 OAR3: 209.872 ‐ 215.814 ENSBTAG00072 61 CCR2 OAR3: 209.872 ‐ 215.814 ENSBTAG00073 62 CCR2 OAR3: 209.872 ‐ 215.814 ENSBTAG00074 63 CCR2 OAR3: 209.872 ‐ 215.814 ENSBTAG00075 64 CCR2 OAR3: 209.872 ‐ 215.814 ENSBTAG00076 65 CCR2 OAR3: 209.872 ‐ 215.814 ENSBTAG00077 66 CCR2 OAR3: 209.872 ‐ 215.814 ENSBTAG00078 67 CCR2 OAR3: 209.872 ‐ 215.814 ENSBTAG00079 68 CCR2 OAR3: 209.872 ‐ 215.814 ENSBTAG00080 69 CCR2 OAR3: 209.872 ‐ 215.814 ENSBTAG00081 70 CCR2 OAR3: 209.872 ‐ 215.814 ENSBTAG00082 71 CCR2 OAR3: 209.872 ‐ 215.814 ENSBTAG00083 72 CCR2 OAR3: 209.872 ‐ 215.814 ENSBTAG00084 73 CCR2 OAR3: 209.872 ‐ 215.814 ENSBTAG00085 74 CCR2 OAR3: 209.872 ‐ 215.814 ENSBTAG00086 75 CCR2 OAR3: 209.872 ‐ 215.814 ENSBTAG00087 76 CCR2 OAR3: 209.872 ‐ 215.814 ENSBTAG00088 77 CCR2 OAR3: 209.872 ‐ 215.814 ENSBTAG00089 78 CCR2 OAR3: 209.872 ‐ 215.814 ENSBTAG00090 79 CCR2 OAR3: 209.872 ‐ 215.814 ENSBTAG00091 80 CCR2 OAR3: 209.872 ‐ 215.814 ENSBTAG00092 81 CCR2 OAR3: 209.872 ‐ 215.814 ENSBTAG00093 82 CCR2 OAR3: 209.872 ‐ 215.814 ENSBTAG00094 83 CCR2 OAR3: 209.872 ‐ 215.814 ENSBTAG00095 84 CCR2 OAR3: 209.872 ‐ 215.814 ENSBTAG00096 85 CCR2 OAR3: 209.872 ‐ 215.814 ENSBTAG00097 86 CCR2 OAR3: 209.872 ‐ 215.814 ENSBTAG00098 87 CCR2 OAR3: 209.872 ‐ 215.814 ENSBTAG00099 88 CCR2 OAR3: 209.872 ‐ 215.814 ENSBTAG000100 89 CCR2 OAR3: 209.872 ‐ 215.814 ENSBTAG000
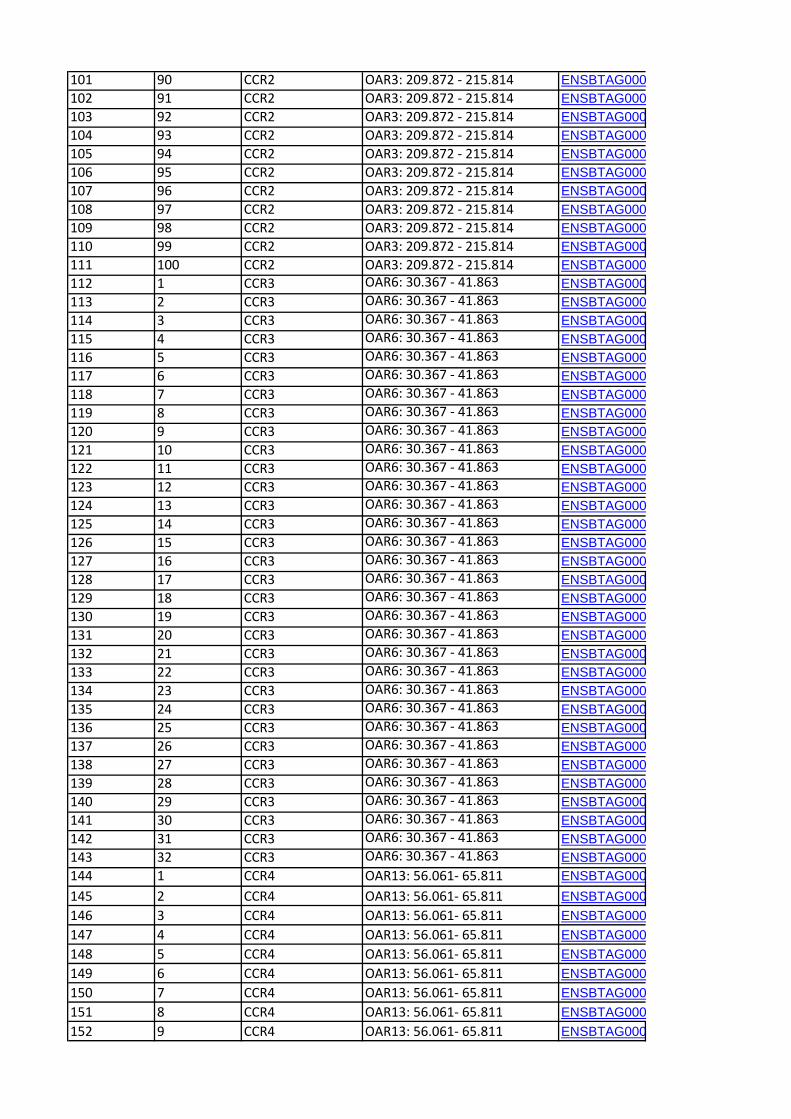
101 90 CCR2 OAR3: 209.872 ‐ 215.814 ENSBTAG000102 91 CCR2 OAR3: 209.872 ‐ 215.814 ENSBTAG000103 92 CCR2 OAR3: 209.872 ‐ 215.814 ENSBTAG000104 93 CCR2 OAR3: 209.872 ‐ 215.814 ENSBTAG000105 94 CCR2 OAR3: 209.872 ‐ 215.814 ENSBTAG000106 95 CCR2 OAR3: 209.872 ‐ 215.814 ENSBTAG000107 96 CCR2 OAR3: 209.872 ‐ 215.814 ENSBTAG000108 97 CCR2 OAR3: 209.872 ‐ 215.814 ENSBTAG000109 98 CCR2 OAR3: 209.872 ‐ 215.814 ENSBTAG000110 99 CCR2 OAR3: 209.872 ‐ 215.814 ENSBTAG000111 100 CCR2 OAR3: 209.872 ‐ 215.814 ENSBTAG000112 1 CCR3 OAR6: 30.367 ‐ 41.863 ENSBTAG000113 2 CCR3 OAR6: 30.367 ‐ 41.863 ENSBTAG000114 3 CCR3 OAR6: 30.367 ‐ 41.863 ENSBTAG000115 4 CCR3 OAR6: 30.367 ‐ 41.863 ENSBTAG000116 5 CCR3 OAR6: 30.367 ‐ 41.863 ENSBTAG000117 6 CCR3 OAR6: 30.367 ‐ 41.863 ENSBTAG000118 7 CCR3 OAR6: 30.367 ‐ 41.863 ENSBTAG000119 8 CCR3 OAR6: 30.367 ‐ 41.863 ENSBTAG000120 9 CCR3 OAR6: 30.367 ‐ 41.863 ENSBTAG000121 10 CCR3 OAR6: 30.367 ‐ 41.863 ENSBTAG000122 11 CCR3 OAR6: 30.367 ‐ 41.863 ENSBTAG000123 12 CCR3 OAR6: 30.367 ‐ 41.863 ENSBTAG000124 13 CCR3 OAR6: 30.367 ‐ 41.863 ENSBTAG000125 14 CCR3 OAR6: 30.367 ‐ 41.863 ENSBTAG000126 15 CCR3 OAR6: 30.367 ‐ 41.863 ENSBTAG000127 16 CCR3 OAR6: 30.367 ‐ 41.863 ENSBTAG000128 17 CCR3 OAR6: 30.367 ‐ 41.863 ENSBTAG000129 18 CCR3 OAR6: 30.367 ‐ 41.863 ENSBTAG000130 19 CCR3 OAR6: 30.367 ‐ 41.863 ENSBTAG000131 20 CCR3 OAR6: 30.367 ‐ 41.863 ENSBTAG000132 21 CCR3 OAR6: 30.367 ‐ 41.863 ENSBTAG000133 22 CCR3 OAR6: 30.367 ‐ 41.863 ENSBTAG000134 23 CCR3 OAR6: 30.367 ‐ 41.863 ENSBTAG000135 24 CCR3 OAR6: 30.367 ‐ 41.863 ENSBTAG000136 25 CCR3 OAR6: 30.367 ‐ 41.863 ENSBTAG000137 26 CCR3 OAR6: 30.367 ‐ 41.863 ENSBTAG000138 27 CCR3 OAR6: 30.367 ‐ 41.863 ENSBTAG000139 28 CCR3 OAR6: 30.367 ‐ 41.863 ENSBTAG000140 29 CCR3 OAR6: 30.367 ‐ 41.863 ENSBTAG000141 30 CCR3 OAR6: 30.367 ‐ 41.863 ENSBTAG000142 31 CCR3 OAR6: 30.367 ‐ 41.863 ENSBTAG000143 32 CCR3 OAR6: 30.367 ‐ 41.863 ENSBTAG000144 1 CCR4 OAR13: 56.061‐ 65.811 ENSBTAG000145 2 CCR4 OAR13: 56.061‐ 65.811 ENSBTAG000146 3 CCR4 OAR13: 56.061‐ 65.811 ENSBTAG000147 4 CCR4 OAR13: 56.061‐ 65.811 ENSBTAG000148 5 CCR4 OAR13: 56.061‐ 65.811 ENSBTAG000149 6 CCR4 OAR13: 56.061‐ 65.811 ENSBTAG000150 7 CCR4 OAR13: 56.061‐ 65.811 ENSBTAG000151 8 CCR4 OAR13: 56.061‐ 65.811 ENSBTAG000152 9 CCR4 OAR13: 56.061‐ 65.811 ENSBTAG000
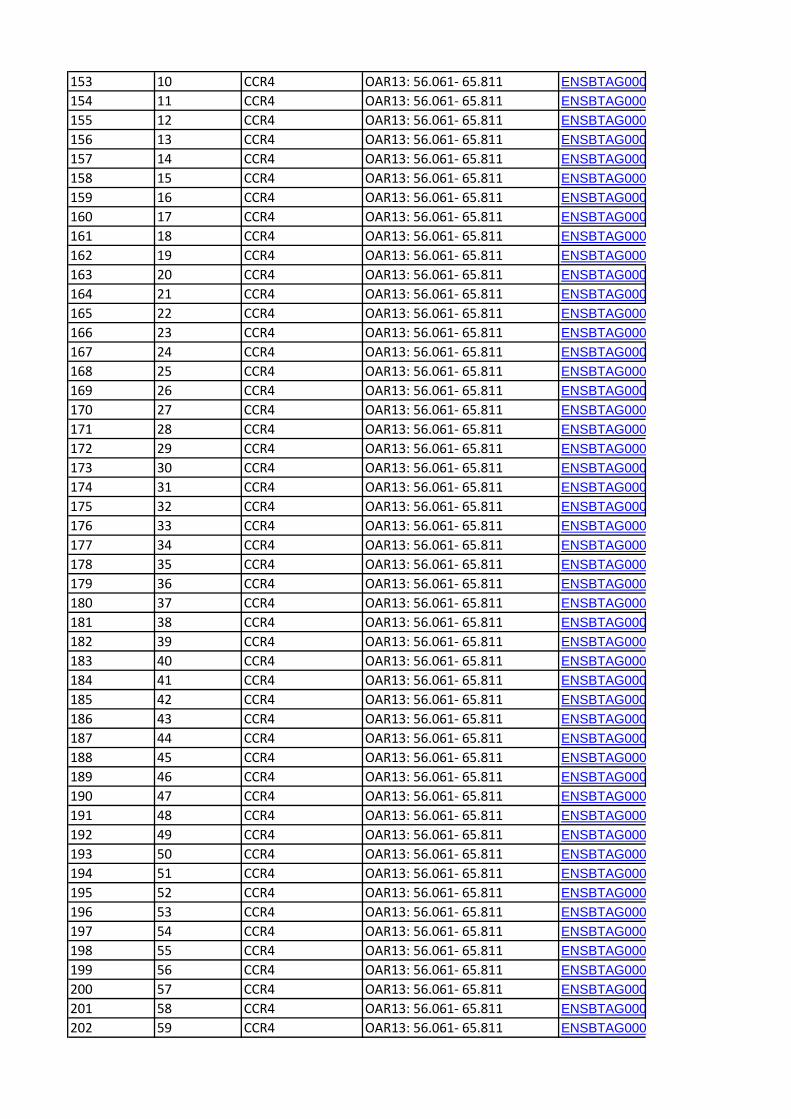
153 10 CCR4 OAR13: 56.061‐ 65.811 ENSBTAG000154 11 CCR4 OAR13: 56.061‐ 65.811 ENSBTAG000155 12 CCR4 OAR13: 56.061‐ 65.811 ENSBTAG000156 13 CCR4 OAR13: 56.061‐ 65.811 ENSBTAG000157 14 CCR4 OAR13: 56.061‐ 65.811 ENSBTAG000158 15 CCR4 OAR13: 56.061‐ 65.811 ENSBTAG000159 16 CCR4 OAR13: 56.061‐ 65.811 ENSBTAG000160 17 CCR4 OAR13: 56.061‐ 65.811 ENSBTAG000161 18 CCR4 OAR13: 56.061‐ 65.811 ENSBTAG000162 19 CCR4 OAR13: 56.061‐ 65.811 ENSBTAG000163 20 CCR4 OAR13: 56.061‐ 65.811 ENSBTAG000164 21 CCR4 OAR13: 56.061‐ 65.811 ENSBTAG000165 22 CCR4 OAR13: 56.061‐ 65.811 ENSBTAG000166 23 CCR4 OAR13: 56.061‐ 65.811 ENSBTAG000167 24 CCR4 OAR13: 56.061‐ 65.811 ENSBTAG000168 25 CCR4 OAR13: 56.061‐ 65.811 ENSBTAG000169 26 CCR4 OAR13: 56.061‐ 65.811 ENSBTAG000170 27 CCR4 OAR13: 56.061‐ 65.811 ENSBTAG000171 28 CCR4 OAR13: 56.061‐ 65.811 ENSBTAG000172 29 CCR4 OAR13: 56.061‐ 65.811 ENSBTAG000173 30 CCR4 OAR13: 56.061‐ 65.811 ENSBTAG000174 31 CCR4 OAR13: 56.061‐ 65.811 ENSBTAG000175 32 CCR4 OAR13: 56.061‐ 65.811 ENSBTAG000176 33 CCR4 OAR13: 56.061‐ 65.811 ENSBTAG000177 34 CCR4 OAR13: 56.061‐ 65.811 ENSBTAG000178 35 CCR4 OAR13: 56.061‐ 65.811 ENSBTAG000179 36 CCR4 OAR13: 56.061‐ 65.811 ENSBTAG000180 37 CCR4 OAR13: 56.061‐ 65.811 ENSBTAG000181 38 CCR4 OAR13: 56.061‐ 65.811 ENSBTAG000182 39 CCR4 OAR13: 56.061‐ 65.811 ENSBTAG000183 40 CCR4 OAR13: 56.061‐ 65.811 ENSBTAG000184 41 CCR4 OAR13: 56.061‐ 65.811 ENSBTAG000185 42 CCR4 OAR13: 56.061‐ 65.811 ENSBTAG000186 43 CCR4 OAR13: 56.061‐ 65.811 ENSBTAG000187 44 CCR4 OAR13: 56.061‐ 65.811 ENSBTAG000188 45 CCR4 OAR13: 56.061‐ 65.811 ENSBTAG000189 46 CCR4 OAR13: 56.061‐ 65.811 ENSBTAG000190 47 CCR4 OAR13: 56.061‐ 65.811 ENSBTAG000191 48 CCR4 OAR13: 56.061‐ 65.811 ENSBTAG000192 49 CCR4 OAR13: 56.061‐ 65.811 ENSBTAG000193 50 CCR4 OAR13: 56.061‐ 65.811 ENSBTAG000194 51 CCR4 OAR13: 56.061‐ 65.811 ENSBTAG000195 52 CCR4 OAR13: 56.061‐ 65.811 ENSBTAG000196 53 CCR4 OAR13: 56.061‐ 65.811 ENSBTAG000197 54 CCR4 OAR13: 56.061‐ 65.811 ENSBTAG000198 55 CCR4 OAR13: 56.061‐ 65.811 ENSBTAG000199 56 CCR4 OAR13: 56.061‐ 65.811 ENSBTAG000200 57 CCR4 OAR13: 56.061‐ 65.811 ENSBTAG000201 58 CCR4 OAR13: 56.061‐ 65.811 ENSBTAG000202 59 CCR4 OAR13: 56.061‐ 65.811 ENSBTAG000
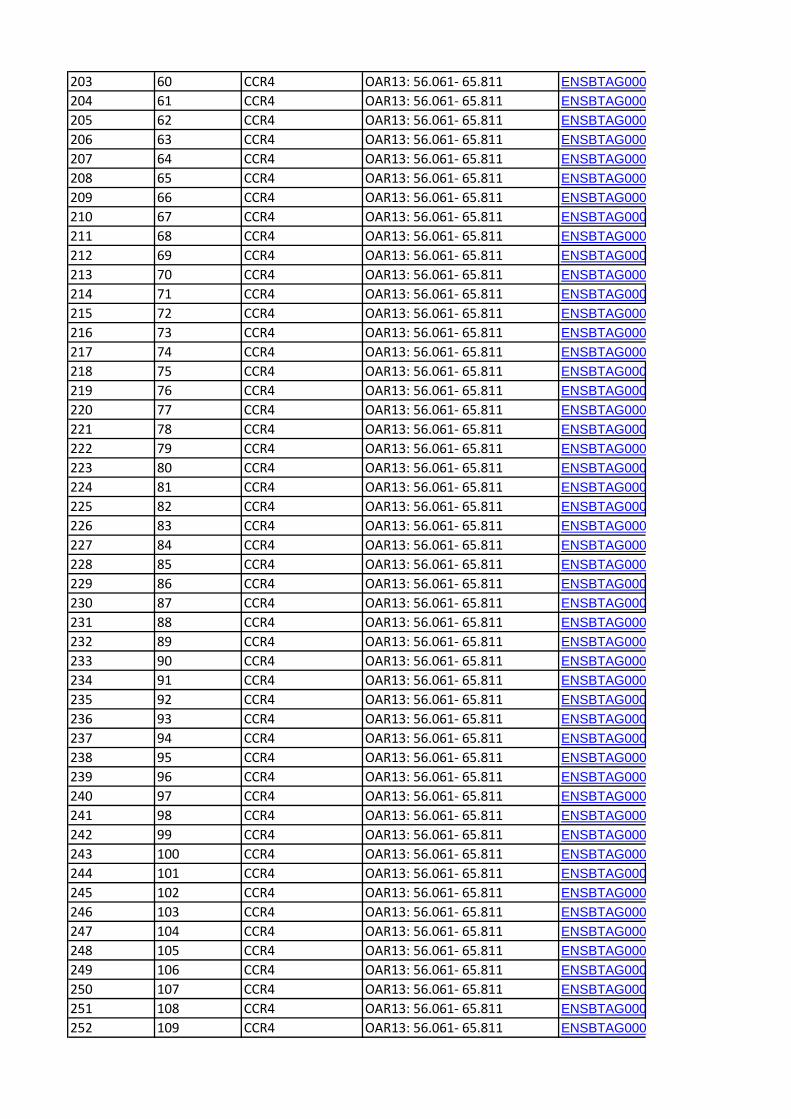
203 60 CCR4 OAR13: 56.061‐ 65.811 ENSBTAG000204 61 CCR4 OAR13: 56.061‐ 65.811 ENSBTAG000205 62 CCR4 OAR13: 56.061‐ 65.811 ENSBTAG000206 63 CCR4 OAR13: 56.061‐ 65.811 ENSBTAG000207 64 CCR4 OAR13: 56.061‐ 65.811 ENSBTAG000208 65 CCR4 OAR13: 56.061‐ 65.811 ENSBTAG000209 66 CCR4 OAR13: 56.061‐ 65.811 ENSBTAG000210 67 CCR4 OAR13: 56.061‐ 65.811 ENSBTAG000211 68 CCR4 OAR13: 56.061‐ 65.811 ENSBTAG000212 69 CCR4 OAR13: 56.061‐ 65.811 ENSBTAG000213 70 CCR4 OAR13: 56.061‐ 65.811 ENSBTAG000214 71 CCR4 OAR13: 56.061‐ 65.811 ENSBTAG000215 72 CCR4 OAR13: 56.061‐ 65.811 ENSBTAG000216 73 CCR4 OAR13: 56.061‐ 65.811 ENSBTAG000217 74 CCR4 OAR13: 56.061‐ 65.811 ENSBTAG000218 75 CCR4 OAR13: 56.061‐ 65.811 ENSBTAG000219 76 CCR4 OAR13: 56.061‐ 65.811 ENSBTAG000220 77 CCR4 OAR13: 56.061‐ 65.811 ENSBTAG000221 78 CCR4 OAR13: 56.061‐ 65.811 ENSBTAG000222 79 CCR4 OAR13: 56.061‐ 65.811 ENSBTAG000223 80 CCR4 OAR13: 56.061‐ 65.811 ENSBTAG000224 81 CCR4 OAR13: 56.061‐ 65.811 ENSBTAG000225 82 CCR4 OAR13: 56.061‐ 65.811 ENSBTAG000226 83 CCR4 OAR13: 56.061‐ 65.811 ENSBTAG000227 84 CCR4 OAR13: 56.061‐ 65.811 ENSBTAG000228 85 CCR4 OAR13: 56.061‐ 65.811 ENSBTAG000229 86 CCR4 OAR13: 56.061‐ 65.811 ENSBTAG000230 87 CCR4 OAR13: 56.061‐ 65.811 ENSBTAG000231 88 CCR4 OAR13: 56.061‐ 65.811 ENSBTAG000232 89 CCR4 OAR13: 56.061‐ 65.811 ENSBTAG000233 90 CCR4 OAR13: 56.061‐ 65.811 ENSBTAG000234 91 CCR4 OAR13: 56.061‐ 65.811 ENSBTAG000235 92 CCR4 OAR13: 56.061‐ 65.811 ENSBTAG000236 93 CCR4 OAR13: 56.061‐ 65.811 ENSBTAG000237 94 CCR4 OAR13: 56.061‐ 65.811 ENSBTAG000238 95 CCR4 OAR13: 56.061‐ 65.811 ENSBTAG000239 96 CCR4 OAR13: 56.061‐ 65.811 ENSBTAG000240 97 CCR4 OAR13: 56.061‐ 65.811 ENSBTAG000241 98 CCR4 OAR13: 56.061‐ 65.811 ENSBTAG000242 99 CCR4 OAR13: 56.061‐ 65.811 ENSBTAG000243 100 CCR4 OAR13: 56.061‐ 65.811 ENSBTAG000244 101 CCR4 OAR13: 56.061‐ 65.811 ENSBTAG000245 102 CCR4 OAR13: 56.061‐ 65.811 ENSBTAG000246 103 CCR4 OAR13: 56.061‐ 65.811 ENSBTAG000247 104 CCR4 OAR13: 56.061‐ 65.811 ENSBTAG000248 105 CCR4 OAR13: 56.061‐ 65.811 ENSBTAG000249 106 CCR4 OAR13: 56.061‐ 65.811 ENSBTAG000250 107 CCR4 OAR13: 56.061‐ 65.811 ENSBTAG000251 108 CCR4 OAR13: 56.061‐ 65.811 ENSBTAG000252 109 CCR4 OAR13: 56.061‐ 65.811 ENSBTAG000
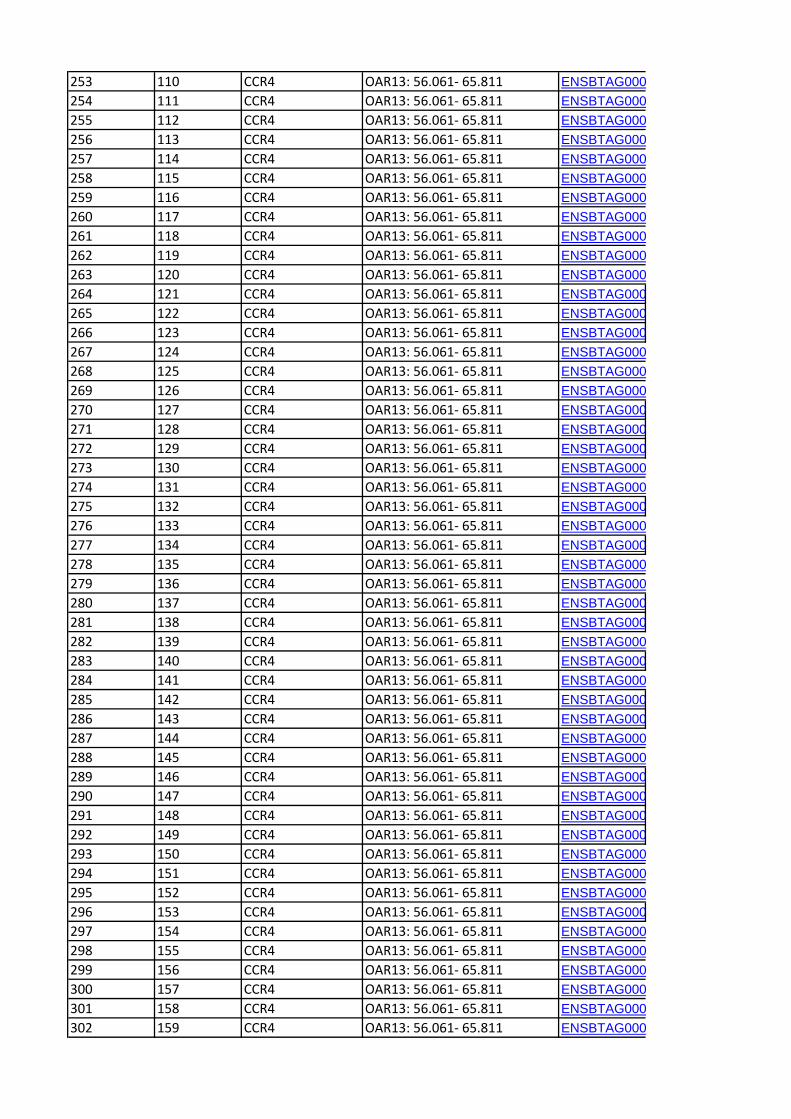
253 110 CCR4 OAR13: 56.061‐ 65.811 ENSBTAG000254 111 CCR4 OAR13: 56.061‐ 65.811 ENSBTAG000255 112 CCR4 OAR13: 56.061‐ 65.811 ENSBTAG000256 113 CCR4 OAR13: 56.061‐ 65.811 ENSBTAG000257 114 CCR4 OAR13: 56.061‐ 65.811 ENSBTAG000258 115 CCR4 OAR13: 56.061‐ 65.811 ENSBTAG000259 116 CCR4 OAR13: 56.061‐ 65.811 ENSBTAG000260 117 CCR4 OAR13: 56.061‐ 65.811 ENSBTAG000261 118 CCR4 OAR13: 56.061‐ 65.811 ENSBTAG000262 119 CCR4 OAR13: 56.061‐ 65.811 ENSBTAG000263 120 CCR4 OAR13: 56.061‐ 65.811 ENSBTAG000264 121 CCR4 OAR13: 56.061‐ 65.811 ENSBTAG000265 122 CCR4 OAR13: 56.061‐ 65.811 ENSBTAG000266 123 CCR4 OAR13: 56.061‐ 65.811 ENSBTAG000267 124 CCR4 OAR13: 56.061‐ 65.811 ENSBTAG000268 125 CCR4 OAR13: 56.061‐ 65.811 ENSBTAG000269 126 CCR4 OAR13: 56.061‐ 65.811 ENSBTAG000270 127 CCR4 OAR13: 56.061‐ 65.811 ENSBTAG000271 128 CCR4 OAR13: 56.061‐ 65.811 ENSBTAG000272 129 CCR4 OAR13: 56.061‐ 65.811 ENSBTAG000273 130 CCR4 OAR13: 56.061‐ 65.811 ENSBTAG000274 131 CCR4 OAR13: 56.061‐ 65.811 ENSBTAG000275 132 CCR4 OAR13: 56.061‐ 65.811 ENSBTAG000276 133 CCR4 OAR13: 56.061‐ 65.811 ENSBTAG000277 134 CCR4 OAR13: 56.061‐ 65.811 ENSBTAG000278 135 CCR4 OAR13: 56.061‐ 65.811 ENSBTAG000279 136 CCR4 OAR13: 56.061‐ 65.811 ENSBTAG000280 137 CCR4 OAR13: 56.061‐ 65.811 ENSBTAG000281 138 CCR4 OAR13: 56.061‐ 65.811 ENSBTAG000282 139 CCR4 OAR13: 56.061‐ 65.811 ENSBTAG000283 140 CCR4 OAR13: 56.061‐ 65.811 ENSBTAG000284 141 CCR4 OAR13: 56.061‐ 65.811 ENSBTAG000285 142 CCR4 OAR13: 56.061‐ 65.811 ENSBTAG000286 143 CCR4 OAR13: 56.061‐ 65.811 ENSBTAG000287 144 CCR4 OAR13: 56.061‐ 65.811 ENSBTAG000288 145 CCR4 OAR13: 56.061‐ 65.811 ENSBTAG000289 146 CCR4 OAR13: 56.061‐ 65.811 ENSBTAG000290 147 CCR4 OAR13: 56.061‐ 65.811 ENSBTAG000291 148 CCR4 OAR13: 56.061‐ 65.811 ENSBTAG000292 149 CCR4 OAR13: 56.061‐ 65.811 ENSBTAG000293 150 CCR4 OAR13: 56.061‐ 65.811 ENSBTAG000294 151 CCR4 OAR13: 56.061‐ 65.811 ENSBTAG000295 152 CCR4 OAR13: 56.061‐ 65.811 ENSBTAG000296 153 CCR4 OAR13: 56.061‐ 65.811 ENSBTAG000297 154 CCR4 OAR13: 56.061‐ 65.811 ENSBTAG000298 155 CCR4 OAR13: 56.061‐ 65.811 ENSBTAG000299 156 CCR4 OAR13: 56.061‐ 65.811 ENSBTAG000300 157 CCR4 OAR13: 56.061‐ 65.811 ENSBTAG000301 158 CCR4 OAR13: 56.061‐ 65.811 ENSBTAG000302 159 CCR4 OAR13: 56.061‐ 65.811 ENSBTAG000
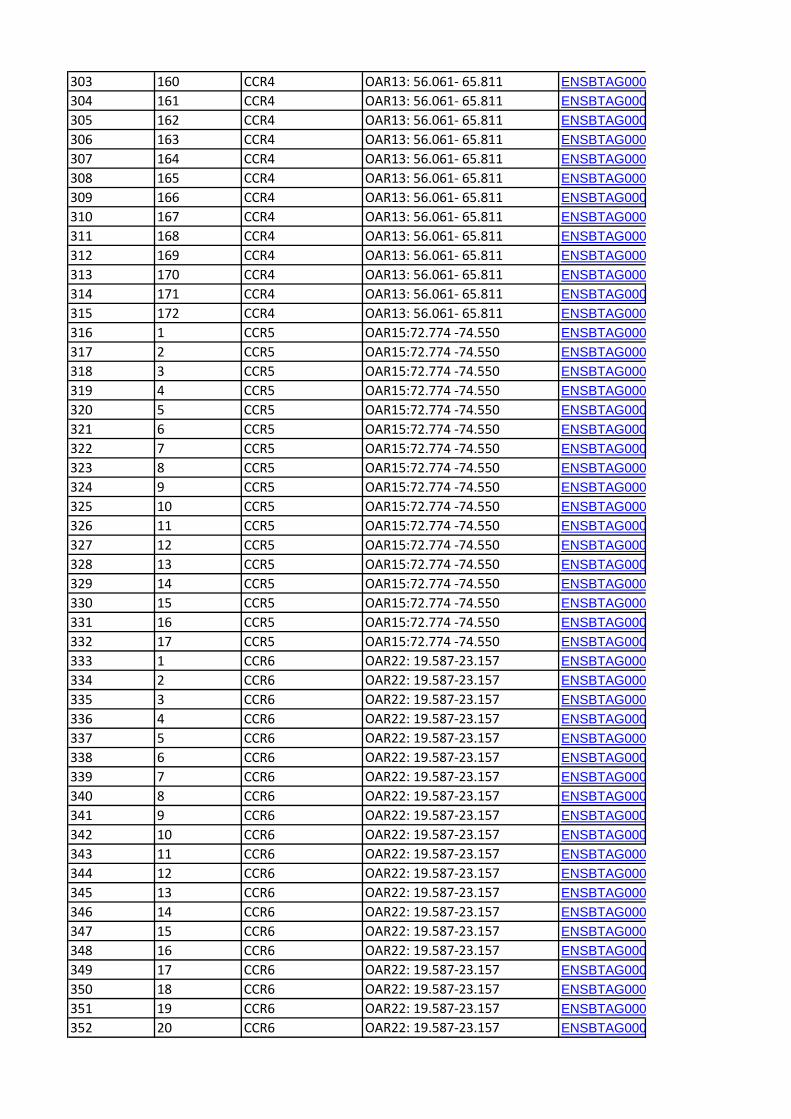
303 160 CCR4 OAR13: 56.061‐ 65.811 ENSBTAG000304 161 CCR4 OAR13: 56.061‐ 65.811 ENSBTAG000305 162 CCR4 OAR13: 56.061‐ 65.811 ENSBTAG000306 163 CCR4 OAR13: 56.061‐ 65.811 ENSBTAG000307 164 CCR4 OAR13: 56.061‐ 65.811 ENSBTAG000308 165 CCR4 OAR13: 56.061‐ 65.811 ENSBTAG000309 166 CCR4 OAR13: 56.061‐ 65.811 ENSBTAG000310 167 CCR4 OAR13: 56.061‐ 65.811 ENSBTAG000311 168 CCR4 OAR13: 56.061‐ 65.811 ENSBTAG000312 169 CCR4 OAR13: 56.061‐ 65.811 ENSBTAG000313 170 CCR4 OAR13: 56.061‐ 65.811 ENSBTAG000314 171 CCR4 OAR13: 56.061‐ 65.811 ENSBTAG000315 172 CCR4 OAR13: 56.061‐ 65.811 ENSBTAG000316 1 CCR5 OAR15:72.774 ‐74.550 ENSBTAG000317 2 CCR5 OAR15:72.774 ‐74.550 ENSBTAG000318 3 CCR5 OAR15:72.774 ‐74.550 ENSBTAG000319 4 CCR5 OAR15:72.774 ‐74.550 ENSBTAG000320 5 CCR5 OAR15:72.774 ‐74.550 ENSBTAG000321 6 CCR5 OAR15:72.774 ‐74.550 ENSBTAG000322 7 CCR5 OAR15:72.774 ‐74.550 ENSBTAG000323 8 CCR5 OAR15:72.774 ‐74.550 ENSBTAG000324 9 CCR5 OAR15:72.774 ‐74.550 ENSBTAG000325 10 CCR5 OAR15:72.774 ‐74.550 ENSBTAG000326 11 CCR5 OAR15:72.774 ‐74.550 ENSBTAG000327 12 CCR5 OAR15:72.774 ‐74.550 ENSBTAG000328 13 CCR5 OAR15:72.774 ‐74.550 ENSBTAG000329 14 CCR5 OAR15:72.774 ‐74.550 ENSBTAG000330 15 CCR5 OAR15:72.774 ‐74.550 ENSBTAG000331 16 CCR5 OAR15:72.774 ‐74.550 ENSBTAG000332 17 CCR5 OAR15:72.774 ‐74.550 ENSBTAG000333 1 CCR6 OAR22: 19.587‐23.157 ENSBTAG000334 2 CCR6 OAR22: 19.587‐23.157 ENSBTAG000335 3 CCR6 OAR22: 19.587‐23.157 ENSBTAG000336 4 CCR6 OAR22: 19.587‐23.157 ENSBTAG000337 5 CCR6 OAR22: 19.587‐23.157 ENSBTAG000338 6 CCR6 OAR22: 19.587‐23.157 ENSBTAG000339 7 CCR6 OAR22: 19.587‐23.157 ENSBTAG000340 8 CCR6 OAR22: 19.587‐23.157 ENSBTAG000341 9 CCR6 OAR22: 19.587‐23.157 ENSBTAG000342 10 CCR6 OAR22: 19.587‐23.157 ENSBTAG000343 11 CCR6 OAR22: 19.587‐23.157 ENSBTAG000344 12 CCR6 OAR22: 19.587‐23.157 ENSBTAG000345 13 CCR6 OAR22: 19.587‐23.157 ENSBTAG000346 14 CCR6 OAR22: 19.587‐23.157 ENSBTAG000347 15 CCR6 OAR22: 19.587‐23.157 ENSBTAG000348 16 CCR6 OAR22: 19.587‐23.157 ENSBTAG000349 17 CCR6 OAR22: 19.587‐23.157 ENSBTAG000350 18 CCR6 OAR22: 19.587‐23.157 ENSBTAG000351 19 CCR6 OAR22: 19.587‐23.157 ENSBTAG000352 20 CCR6 OAR22: 19.587‐23.157 ENSBTAG000
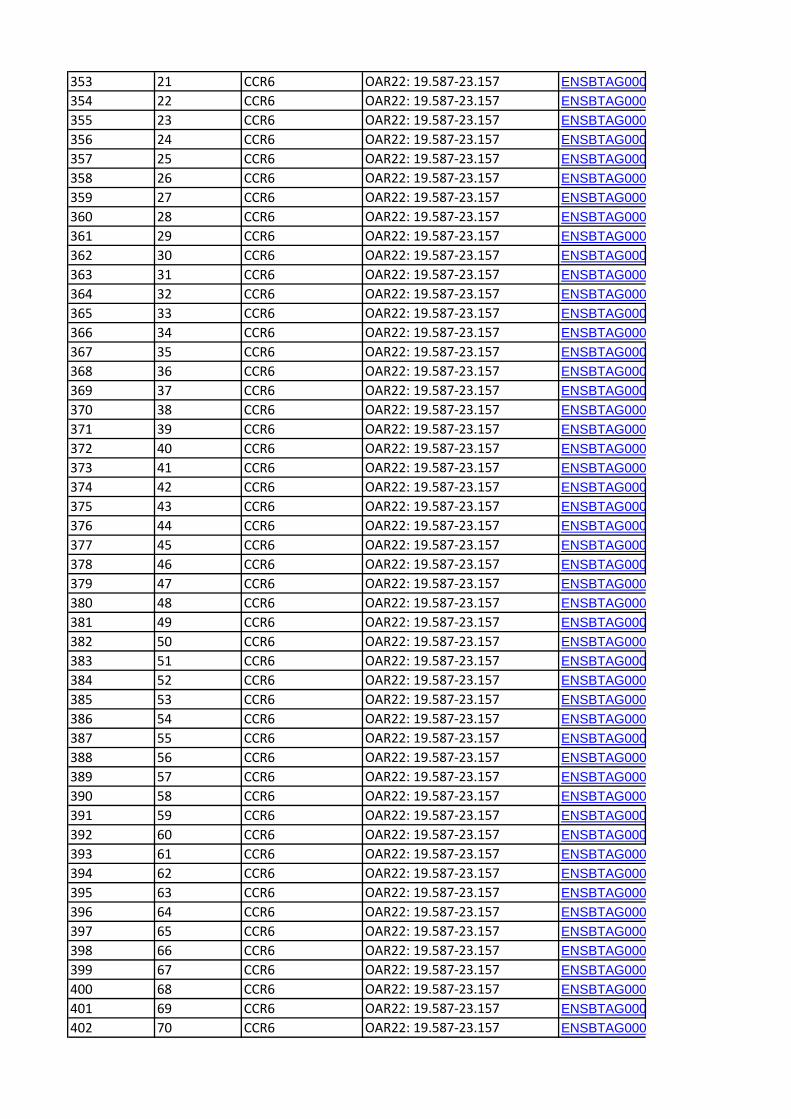
353 21 CCR6 OAR22: 19.587‐23.157 ENSBTAG000354 22 CCR6 OAR22: 19.587‐23.157 ENSBTAG000355 23 CCR6 OAR22: 19.587‐23.157 ENSBTAG000356 24 CCR6 OAR22: 19.587‐23.157 ENSBTAG000357 25 CCR6 OAR22: 19.587‐23.157 ENSBTAG000358 26 CCR6 OAR22: 19.587‐23.157 ENSBTAG000359 27 CCR6 OAR22: 19.587‐23.157 ENSBTAG000360 28 CCR6 OAR22: 19.587‐23.157 ENSBTAG000361 29 CCR6 OAR22: 19.587‐23.157 ENSBTAG000362 30 CCR6 OAR22: 19.587‐23.157 ENSBTAG000363 31 CCR6 OAR22: 19.587‐23.157 ENSBTAG000364 32 CCR6 OAR22: 19.587‐23.157 ENSBTAG000365 33 CCR6 OAR22: 19.587‐23.157 ENSBTAG000366 34 CCR6 OAR22: 19.587‐23.157 ENSBTAG000367 35 CCR6 OAR22: 19.587‐23.157 ENSBTAG000368 36 CCR6 OAR22: 19.587‐23.157 ENSBTAG000369 37 CCR6 OAR22: 19.587‐23.157 ENSBTAG000370 38 CCR6 OAR22: 19.587‐23.157 ENSBTAG000371 39 CCR6 OAR22: 19.587‐23.157 ENSBTAG000372 40 CCR6 OAR22: 19.587‐23.157 ENSBTAG000373 41 CCR6 OAR22: 19.587‐23.157 ENSBTAG000374 42 CCR6 OAR22: 19.587‐23.157 ENSBTAG000375 43 CCR6 OAR22: 19.587‐23.157 ENSBTAG000376 44 CCR6 OAR22: 19.587‐23.157 ENSBTAG000377 45 CCR6 OAR22: 19.587‐23.157 ENSBTAG000378 46 CCR6 OAR22: 19.587‐23.157 ENSBTAG000379 47 CCR6 OAR22: 19.587‐23.157 ENSBTAG000380 48 CCR6 OAR22: 19.587‐23.157 ENSBTAG000381 49 CCR6 OAR22: 19.587‐23.157 ENSBTAG000382 50 CCR6 OAR22: 19.587‐23.157 ENSBTAG000383 51 CCR6 OAR22: 19.587‐23.157 ENSBTAG000384 52 CCR6 OAR22: 19.587‐23.157 ENSBTAG000385 53 CCR6 OAR22: 19.587‐23.157 ENSBTAG000386 54 CCR6 OAR22: 19.587‐23.157 ENSBTAG000387 55 CCR6 OAR22: 19.587‐23.157 ENSBTAG000388 56 CCR6 OAR22: 19.587‐23.157 ENSBTAG000389 57 CCR6 OAR22: 19.587‐23.157 ENSBTAG000390 58 CCR6 OAR22: 19.587‐23.157 ENSBTAG000391 59 CCR6 OAR22: 19.587‐23.157 ENSBTAG000392 60 CCR6 OAR22: 19.587‐23.157 ENSBTAG000393 61 CCR6 OAR22: 19.587‐23.157 ENSBTAG000394 62 CCR6 OAR22: 19.587‐23.157 ENSBTAG000395 63 CCR6 OAR22: 19.587‐23.157 ENSBTAG000396 64 CCR6 OAR22: 19.587‐23.157 ENSBTAG000397 65 CCR6 OAR22: 19.587‐23.157 ENSBTAG000398 66 CCR6 OAR22: 19.587‐23.157 ENSBTAG000399 67 CCR6 OAR22: 19.587‐23.157 ENSBTAG000400 68 CCR6 OAR22: 19.587‐23.157 ENSBTAG000401 69 CCR6 OAR22: 19.587‐23.157 ENSBTAG000402 70 CCR6 OAR22: 19.587‐23.157 ENSBTAG000

403 71 CCR6 OAR22: 19.587‐23.157 ENSBTAG000404 72 CCR6 OAR22: 19.587‐23.157 ENSBTAG000405 73 CCR6 OAR22: 19.587‐23.157 ENSBTAG000406 74 CCR6 OAR22: 19.587‐23.157 ENSBTAG000
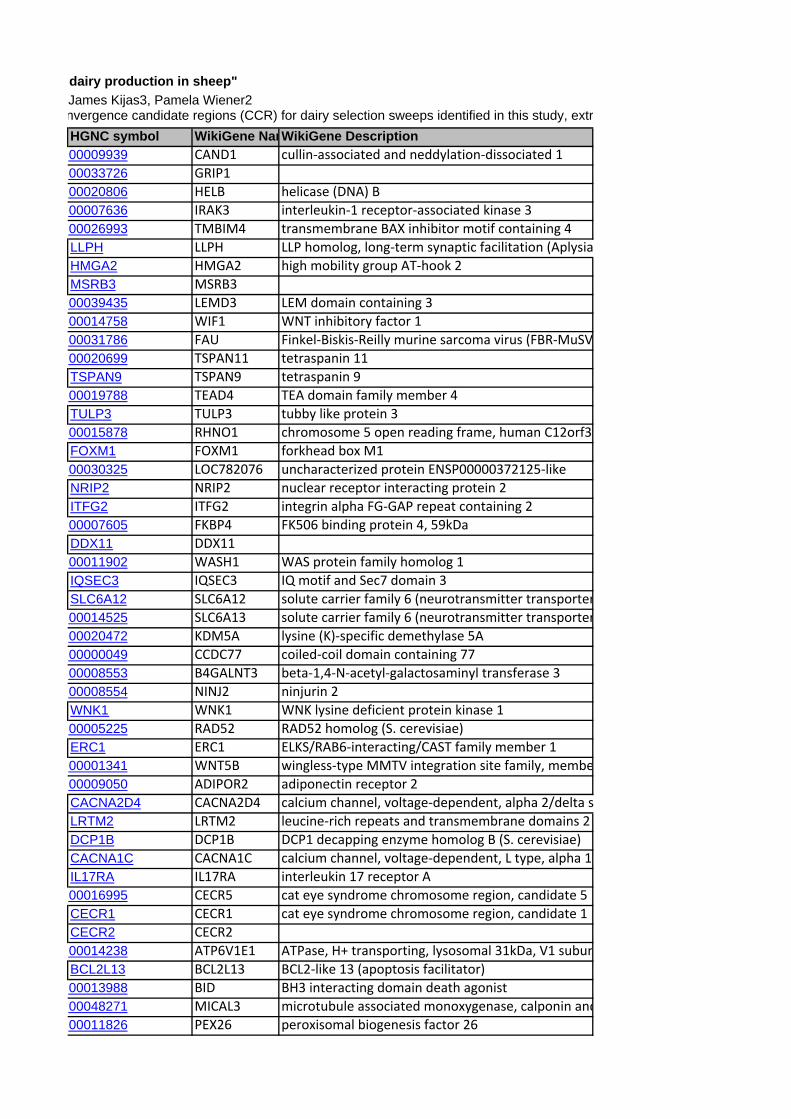
dairy production in sheep"James Kijas3, Pamela Wiener2nvergence candidate regions (CCR) for dairy selection sweeps identified in this study, extrHGNC symbol WikiGene NamWikiGene Description00009939 CAND1 cullin‐associated and neddylation‐dissociated 1
00033726 GRIP1
00020806 HELB helicase (DNA) B
00007636 IRAK3 interleukin‐1 receptor‐associated kinase 3
00026993 TMBIM4 transmembrane BAX inhibitor motif containing 4
LLPH LLPH LLP homolog, long‐term synaptic facilitation (Aplysia
HMGA2 HMGA2 high mobility group AT‐hook 2
MSRB3 MSRB3
00039435 LEMD3 LEM domain containing 3
00014758 WIF1 WNT inhibitory factor 1
00031786 FAU Finkel‐Biskis‐Reilly murine sarcoma virus (FBR‐MuSV
00020699 TSPAN11 tetraspanin 11
TSPAN9 TSPAN9 tetraspanin 9
00019788 TEAD4 TEA domain family member 4
TULP3 TULP3 tubby like protein 3
00015878 RHNO1 chromosome 5 open reading frame, human C12orf3
FOXM1 FOXM1 forkhead box M1
00030325 LOC782076 uncharacterized protein ENSP00000372125‐like
NRIP2 NRIP2 nuclear receptor interacting protein 2
ITFG2 ITFG2 integrin alpha FG‐GAP repeat containing 2
00007605 FKBP4 FK506 binding protein 4, 59kDa
DDX11 DDX11
00011902 WASH1 WAS protein family homolog 1
IQSEC3 IQSEC3 IQ motif and Sec7 domain 3
SLC6A12 SLC6A12 solute carrier family 6 (neurotransmitter transporter
00014525 SLC6A13 solute carrier family 6 (neurotransmitter transporter
00020472 KDM5A lysine (K)‐specific demethylase 5A
00000049 CCDC77 coiled‐coil domain containing 77
00008553 B4GALNT3 beta‐1,4‐N‐acetyl‐galactosaminyl transferase 3
00008554 NINJ2 ninjurin 2
WNK1 WNK1 WNK lysine deficient protein kinase 1
00005225 RAD52 RAD52 homolog (S. cerevisiae)
ERC1 ERC1 ELKS/RAB6‐interacting/CAST family member 1
00001341 WNT5B wingless‐type MMTV integration site family, membe
00009050 ADIPOR2 adiponectin receptor 2
CACNA2D4 CACNA2D4 calcium channel, voltage‐dependent, alpha 2/delta s
LRTM2 LRTM2 leucine‐rich repeats and transmembrane domains 2
DCP1B DCP1B DCP1 decapping enzyme homolog B (S. cerevisiae)
CACNA1C CACNA1C calcium channel, voltage‐dependent, L type, alpha 1
IL17RA IL17RA interleukin 17 receptor A
00016995 CECR5 cat eye syndrome chromosome region, candidate 5
CECR1 CECR1 cat eye syndrome chromosome region, candidate 1
CECR2 CECR2
00014238 ATP6V1E1 ATPase, H+ transporting, lysosomal 31kDa, V1 subun
BCL2L13 BCL2L13 BCL2‐like 13 (apoptosis facilitator)
00013988 BID BH3 interacting domain death agonist
00048271 MICAL3 microtubule associated monoxygenase, calponin and
00011826 PEX26 peroxisomal biogenesis factor 26
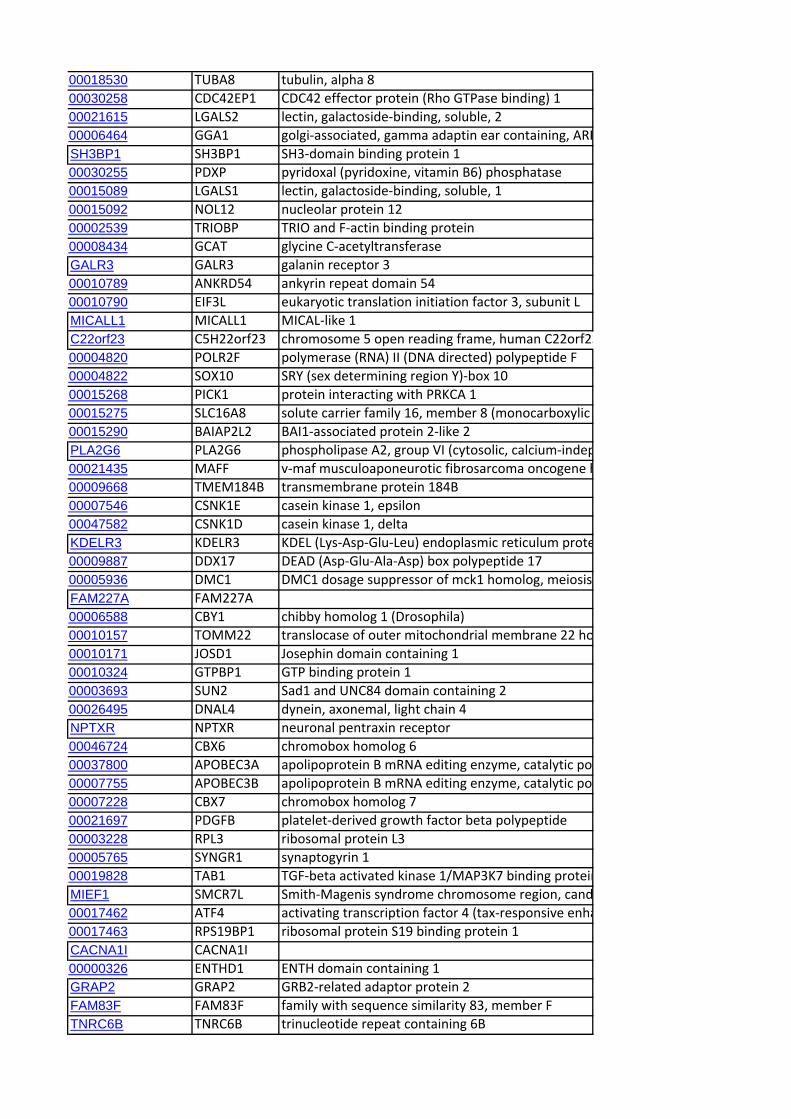
00018530 TUBA8 tubulin, alpha 8
00030258 CDC42EP1 CDC42 effector protein (Rho GTPase binding) 1
00021615 LGALS2 lectin, galactoside‐binding, soluble, 2
00006464 GGA1 golgi‐associated, gamma adaptin ear containing, ARF
SH3BP1 SH3BP1 SH3‐domain binding protein 1
00030255 PDXP pyridoxal (pyridoxine, vitamin B6) phosphatase
00015089 LGALS1 lectin, galactoside‐binding, soluble, 1
00015092 NOL12 nucleolar protein 12
00002539 TRIOBP TRIO and F‐actin binding protein
00008434 GCAT glycine C‐acetyltransferase
GALR3 GALR3 galanin receptor 3
00010789 ANKRD54 ankyrin repeat domain 54
00010790 EIF3L eukaryotic translation initiation factor 3, subunit L
MICALL1 MICALL1 MICAL‐like 1
C22orf23 C5H22orf23 chromosome 5 open reading frame, human C22orf23
00004820 POLR2F polymerase (RNA) II (DNA directed) polypeptide F
00004822 SOX10 SRY (sex determining region Y)‐box 10
00015268 PICK1 protein interacting with PRKCA 1
00015275 SLC16A8 solute carrier family 16, member 8 (monocarboxylic
00015290 BAIAP2L2 BAI1‐associated protein 2‐like 2
PLA2G6 PLA2G6 phospholipase A2, group VI (cytosolic, calcium‐indep
00021435 MAFF v‐maf musculoaponeurotic fibrosarcoma oncogene h
00009668 TMEM184B transmembrane protein 184B
00007546 CSNK1E casein kinase 1, epsilon
00047582 CSNK1D casein kinase 1, delta
KDELR3 KDELR3 KDEL (Lys‐Asp‐Glu‐Leu) endoplasmic reticulum prote
00009887 DDX17 DEAD (Asp‐Glu‐Ala‐Asp) box polypeptide 17
00005936 DMC1 DMC1 dosage suppressor of mck1 homolog, meiosis
FAM227A FAM227A
00006588 CBY1 chibby homolog 1 (Drosophila)
00010157 TOMM22 translocase of outer mitochondrial membrane 22 ho
00010171 JOSD1 Josephin domain containing 1
00010324 GTPBP1 GTP binding protein 1
00003693 SUN2 Sad1 and UNC84 domain containing 2
00026495 DNAL4 dynein, axonemal, light chain 4
NPTXR NPTXR neuronal pentraxin receptor
00046724 CBX6 chromobox homolog 6
00037800 APOBEC3A apolipoprotein B mRNA editing enzyme, catalytic po
00007755 APOBEC3B apolipoprotein B mRNA editing enzyme, catalytic po
00007228 CBX7 chromobox homolog 7
00021697 PDGFB platelet‐derived growth factor beta polypeptide
00003228 RPL3 ribosomal protein L3
00005765 SYNGR1 synaptogyrin 1
00019828 TAB1 TGF‐beta activated kinase 1/MAP3K7 binding protein
MIEF1 SMCR7L Smith‐Magenis syndrome chromosome region, cand
00017462 ATF4 activating transcription factor 4 (tax‐responsive enha
00017463 RPS19BP1 ribosomal protein S19 binding protein 1
CACNA1I CACNA1I
00000326 ENTHD1 ENTH domain containing 1
GRAP2 GRAP2 GRB2‐related adaptor protein 2
FAM83F FAM83F family with sequence similarity 83, member F
TNRC6B TNRC6B trinucleotide repeat containing 6B
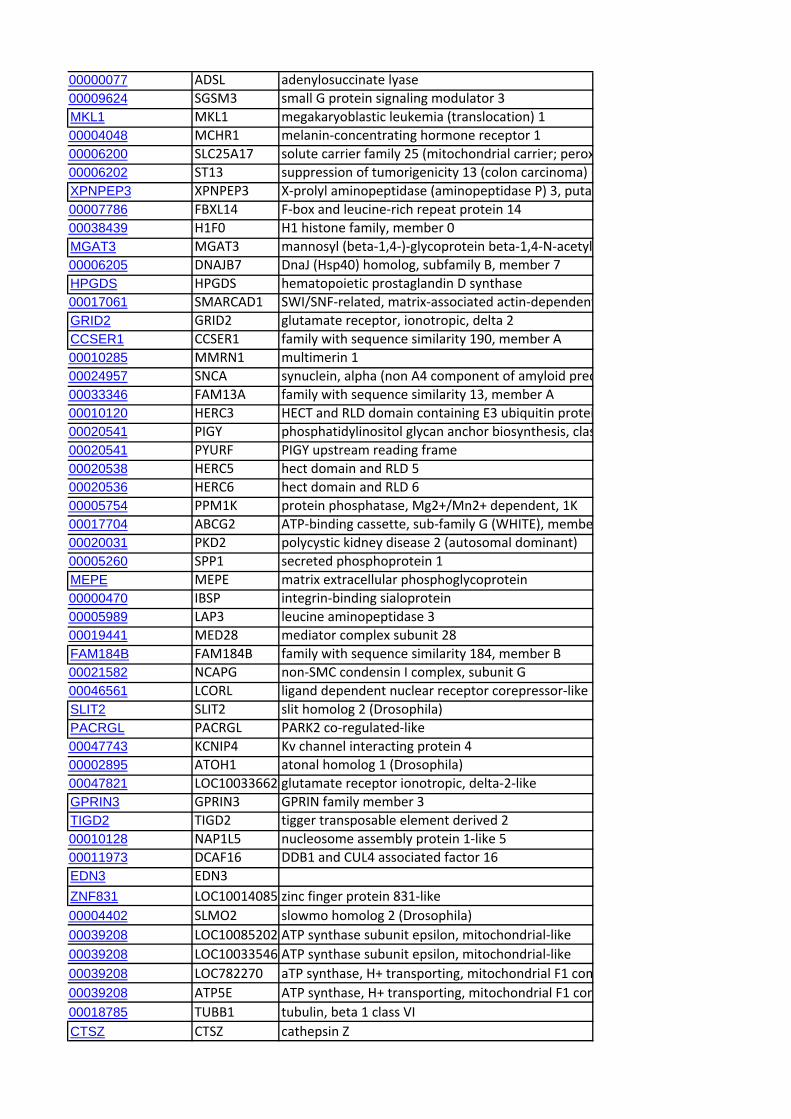
00000077 ADSL adenylosuccinate lyase
00009624 SGSM3 small G protein signaling modulator 3
MKL1 MKL1 megakaryoblastic leukemia (translocation) 1
00004048 MCHR1 melanin‐concentrating hormone receptor 1
00006200 SLC25A17 solute carrier family 25 (mitochondrial carrier; perox
00006202 ST13 suppression of tumorigenicity 13 (colon carcinoma) (
XPNPEP3 XPNPEP3 X‐prolyl aminopeptidase (aminopeptidase P) 3, putat
00007786 FBXL14 F‐box and leucine‐rich repeat protein 14
00038439 H1F0 H1 histone family, member 0
MGAT3 MGAT3 mannosyl (beta‐1,4‐)‐glycoprotein beta‐1,4‐N‐acetyl
00006205 DNAJB7 DnaJ (Hsp40) homolog, subfamily B, member 7
HPGDS HPGDS hematopoietic prostaglandin D synthase
00017061 SMARCAD1 SWI/SNF‐related, matrix‐associated actin‐dependent
GRID2 GRID2 glutamate receptor, ionotropic, delta 2
CCSER1 CCSER1 family with sequence similarity 190, member A
00010285 MMRN1 multimerin 1
00024957 SNCA synuclein, alpha (non A4 component of amyloid prec
00033346 FAM13A family with sequence similarity 13, member A
00010120 HERC3 HECT and RLD domain containing E3 ubiquitin protei
00020541 PIGY phosphatidylinositol glycan anchor biosynthesis, clas
00020541 PYURF PIGY upstream reading frame
00020538 HERC5 hect domain and RLD 5
00020536 HERC6 hect domain and RLD 6
00005754 PPM1K protein phosphatase, Mg2+/Mn2+ dependent, 1K
00017704 ABCG2 ATP‐binding cassette, sub‐family G (WHITE), membe
00020031 PKD2 polycystic kidney disease 2 (autosomal dominant)
00005260 SPP1 secreted phosphoprotein 1
MEPE MEPE matrix extracellular phosphoglycoprotein
00000470 IBSP integrin‐binding sialoprotein
00005989 LAP3 leucine aminopeptidase 3
00019441 MED28 mediator complex subunit 28
FAM184B FAM184B family with sequence similarity 184, member B
00021582 NCAPG non‐SMC condensin I complex, subunit G
00046561 LCORL ligand dependent nuclear receptor corepressor‐like
SLIT2 SLIT2 slit homolog 2 (Drosophila)
PACRGL PACRGL PARK2 co‐regulated‐like
00047743 KCNIP4 Kv channel interacting protein 4
00002895 ATOH1 atonal homolog 1 (Drosophila)
00047821 LOC10033662 glutamate receptor ionotropic, delta‐2‐like
GPRIN3 GPRIN3 GPRIN family member 3
TIGD2 TIGD2 tigger transposable element derived 2
00010128 NAP1L5 nucleosome assembly protein 1‐like 5
00011973 DCAF16 DDB1 and CUL4 associated factor 16
EDN3 EDN3
ZNF831 LOC10014085 zinc finger protein 831‐like
00004402 SLMO2 slowmo homolog 2 (Drosophila)
00039208 LOC100852024ATP synthase subunit epsilon, mitochondrial‐like
00039208 LOC10033546 ATP synthase subunit epsilon, mitochondrial‐like
00039208 LOC782270 aTP synthase, H+ transporting, mitochondrial F1 com
00039208 ATP5E ATP synthase, H+ transporting, mitochondrial F1 com
00018785 TUBB1 tubulin, beta 1 class VI
CTSZ CTSZ cathepsin Z
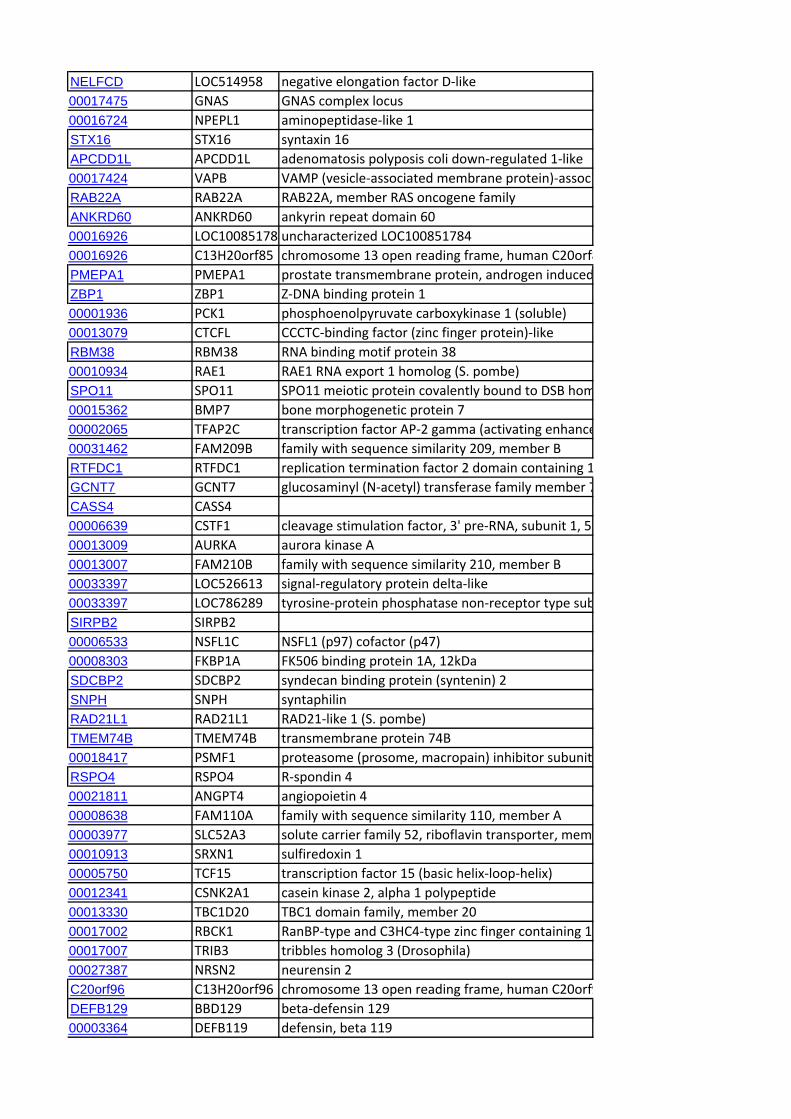
NELFCD LOC514958 negative elongation factor D‐like
00017475 GNAS GNAS complex locus
00016724 NPEPL1 aminopeptidase‐like 1
STX16 STX16 syntaxin 16
APCDD1L APCDD1L adenomatosis polyposis coli down‐regulated 1‐like
00017424 VAPB VAMP (vesicle‐associated membrane protein)‐associ
RAB22A RAB22A RAB22A, member RAS oncogene family
ANKRD60 ANKRD60 ankyrin repeat domain 60
00016926 LOC100851784uncharacterized LOC100851784
00016926 C13H20orf85 chromosome 13 open reading frame, human C20orf8
PMEPA1 PMEPA1 prostate transmembrane protein, androgen induced
ZBP1 ZBP1 Z‐DNA binding protein 1
00001936 PCK1 phosphoenolpyruvate carboxykinase 1 (soluble)
00013079 CTCFL CCCTC‐binding factor (zinc finger protein)‐like
RBM38 RBM38 RNA binding motif protein 38
00010934 RAE1 RAE1 RNA export 1 homolog (S. pombe)
SPO11 SPO11 SPO11 meiotic protein covalently bound to DSB hom
00015362 BMP7 bone morphogenetic protein 7
00002065 TFAP2C transcription factor AP‐2 gamma (activating enhance
00031462 FAM209B family with sequence similarity 209, member B
RTFDC1 RTFDC1 replication termination factor 2 domain containing 1
GCNT7 GCNT7 glucosaminyl (N‐acetyl) transferase family member 7
CASS4 CASS4
00006639 CSTF1 cleavage stimulation factor, 3' pre‐RNA, subunit 1, 50
00013009 AURKA aurora kinase A
00013007 FAM210B family with sequence similarity 210, member B
00033397 LOC526613 signal‐regulatory protein delta‐like
00033397 LOC786289 tyrosine‐protein phosphatase non‐receptor type sub
SIRPB2 SIRPB2
00006533 NSFL1C NSFL1 (p97) cofactor (p47)
00008303 FKBP1A FK506 binding protein 1A, 12kDa
SDCBP2 SDCBP2 syndecan binding protein (syntenin) 2
SNPH SNPH syntaphilin
RAD21L1 RAD21L1 RAD21‐like 1 (S. pombe)
TMEM74B TMEM74B transmembrane protein 74B
00018417 PSMF1 proteasome (prosome, macropain) inhibitor subunit
RSPO4 RSPO4 R‐spondin 4
00021811 ANGPT4 angiopoietin 4
00008638 FAM110A family with sequence similarity 110, member A
00003977 SLC52A3 solute carrier family 52, riboflavin transporter, mem
00010913 SRXN1 sulfiredoxin 1
00005750 TCF15 transcription factor 15 (basic helix‐loop‐helix)
00012341 CSNK2A1 casein kinase 2, alpha 1 polypeptide
00013330 TBC1D20 TBC1 domain family, member 20
00017002 RBCK1 RanBP‐type and C3HC4‐type zinc finger containing 1
00017007 TRIB3 tribbles homolog 3 (Drosophila)
00027387 NRSN2 neurensin 2
C20orf96 C13H20orf96 chromosome 13 open reading frame, human C20orf9
DEFB129 BBD129 beta‐defensin 129
00003364 DEFB119 defensin, beta 119
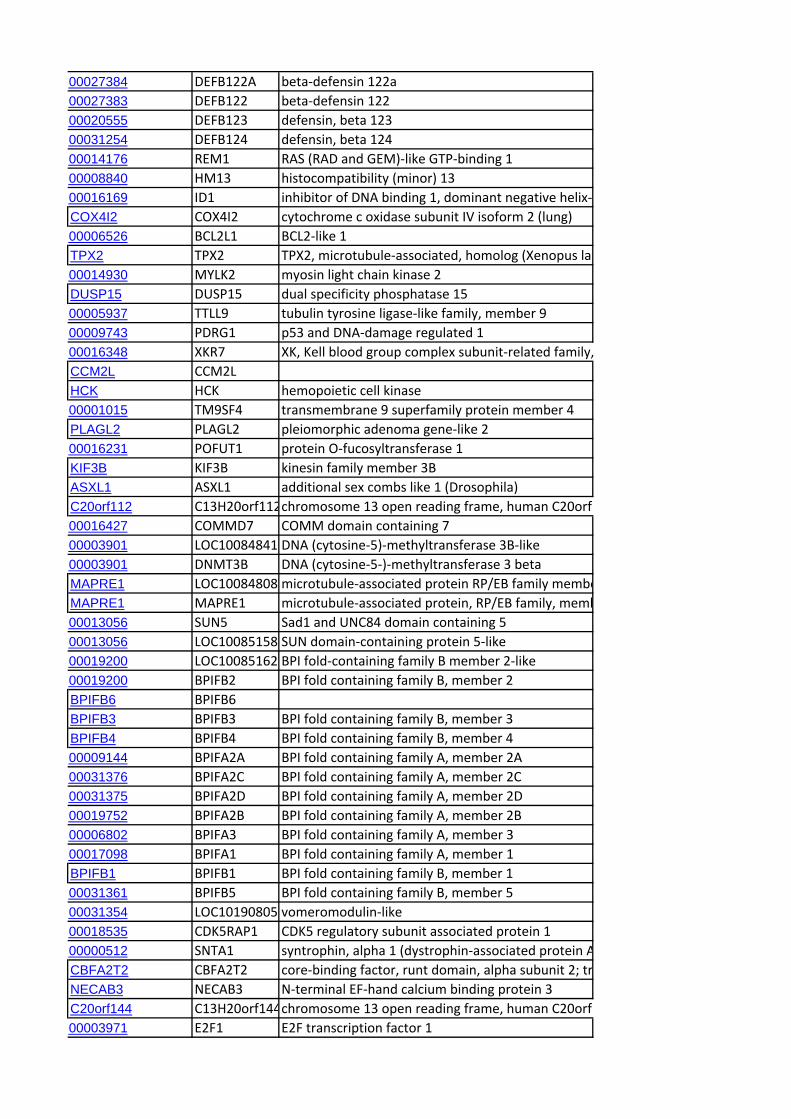
00027384 DEFB122A beta‐defensin 122a
00027383 DEFB122 beta‐defensin 122
00020555 DEFB123 defensin, beta 123
00031254 DEFB124 defensin, beta 124
00014176 REM1 RAS (RAD and GEM)‐like GTP‐binding 1
00008840 HM13 histocompatibility (minor) 13
00016169 ID1 inhibitor of DNA binding 1, dominant negative helix‐
COX4I2 COX4I2 cytochrome c oxidase subunit IV isoform 2 (lung)
00006526 BCL2L1 BCL2‐like 1
TPX2 TPX2 TPX2, microtubule‐associated, homolog (Xenopus lae
00014930 MYLK2 myosin light chain kinase 2
DUSP15 DUSP15 dual specificity phosphatase 15
00005937 TTLL9 tubulin tyrosine ligase‐like family, member 9
00009743 PDRG1 p53 and DNA‐damage regulated 1
00016348 XKR7 XK, Kell blood group complex subunit‐related family,
CCM2L CCM2L
HCK HCK hemopoietic cell kinase
00001015 TM9SF4 transmembrane 9 superfamily protein member 4
PLAGL2 PLAGL2 pleiomorphic adenoma gene‐like 2
00016231 POFUT1 protein O‐fucosyltransferase 1
KIF3B KIF3B kinesin family member 3B
ASXL1 ASXL1 additional sex combs like 1 (Drosophila)
C20orf112 C13H20orf112chromosome 13 open reading frame, human C20orf1
00016427 COMMD7 COMM domain containing 7
00003901 LOC10084841 DNA (cytosine‐5)‐methyltransferase 3B‐like
00003901 DNMT3B DNA (cytosine‐5‐)‐methyltransferase 3 beta
MAPRE1 LOC10084808 microtubule‐associated protein RP/EB family membe
MAPRE1 MAPRE1 microtubule‐associated protein, RP/EB family, memb
00013056 SUN5 Sad1 and UNC84 domain containing 5
00013056 LOC10085158 SUN domain‐containing protein 5‐like
00019200 LOC10085162 BPI fold‐containing family B member 2‐like
00019200 BPIFB2 BPI fold containing family B, member 2
BPIFB6 BPIFB6
BPIFB3 BPIFB3 BPI fold containing family B, member 3
BPIFB4 BPIFB4 BPI fold containing family B, member 4
00009144 BPIFA2A BPI fold containing family A, member 2A
00031376 BPIFA2C BPI fold containing family A, member 2C
00031375 BPIFA2D BPI fold containing family A, member 2D
00019752 BPIFA2B BPI fold containing family A, member 2B
00006802 BPIFA3 BPI fold containing family A, member 3
00017098 BPIFA1 BPI fold containing family A, member 1
BPIFB1 BPIFB1 BPI fold containing family B, member 1
00031361 BPIFB5 BPI fold containing family B, member 5
00031354 LOC10190805 vomeromodulin‐like
00018535 CDK5RAP1 CDK5 regulatory subunit associated protein 1
00000512 SNTA1 syntrophin, alpha 1 (dystrophin‐associated protein A
CBFA2T2 CBFA2T2 core‐binding factor, runt domain, alpha subunit 2; tr
NECAB3 NECAB3 N‐terminal EF‐hand calcium binding protein 3
C20orf144 C13H20orf144chromosome 13 open reading frame, human C20orf1
00003971 E2F1 E2F transcription factor 1
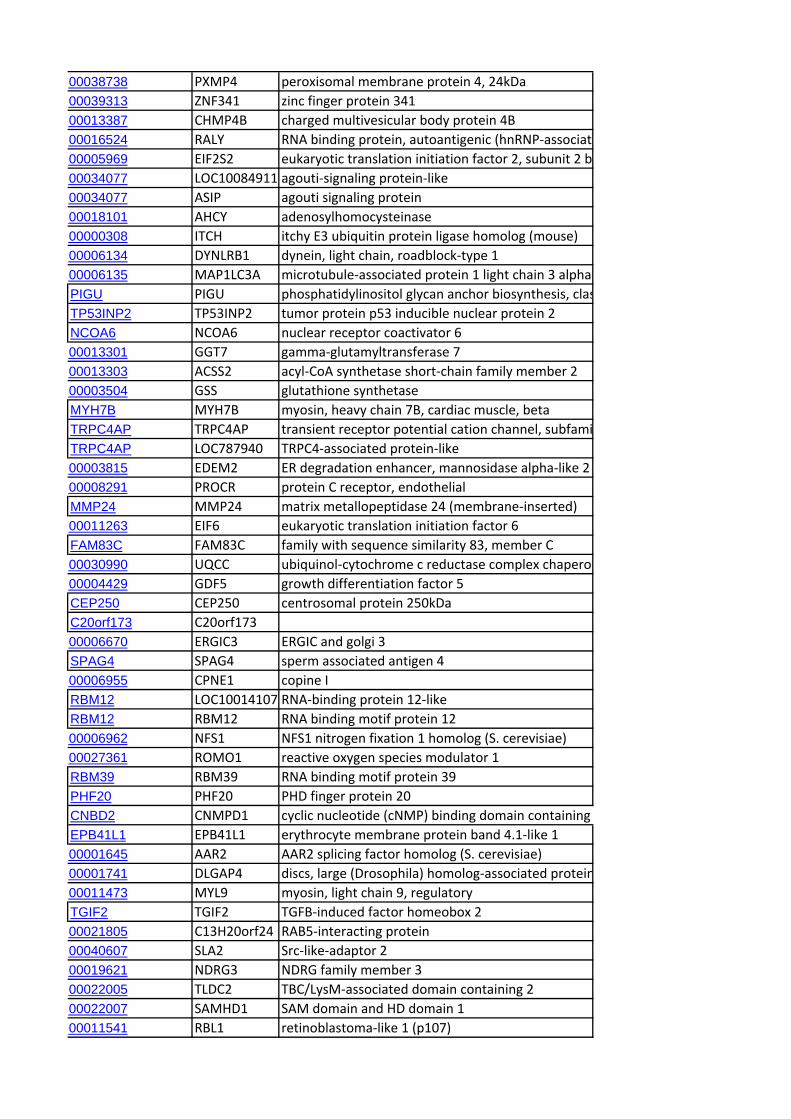
00038738 PXMP4 peroxisomal membrane protein 4, 24kDa
00039313 ZNF341 zinc finger protein 341
00013387 CHMP4B charged multivesicular body protein 4B
00016524 RALY RNA binding protein, autoantigenic (hnRNP‐associat
00005969 EIF2S2 eukaryotic translation initiation factor 2, subunit 2 b
00034077 LOC10084911 agouti‐signaling protein‐like
00034077 ASIP agouti signaling protein
00018101 AHCY adenosylhomocysteinase
00000308 ITCH itchy E3 ubiquitin protein ligase homolog (mouse)
00006134 DYNLRB1 dynein, light chain, roadblock‐type 1
00006135 MAP1LC3A microtubule‐associated protein 1 light chain 3 alpha
PIGU PIGU phosphatidylinositol glycan anchor biosynthesis, clas
TP53INP2 TP53INP2 tumor protein p53 inducible nuclear protein 2
NCOA6 NCOA6 nuclear receptor coactivator 6
00013301 GGT7 gamma‐glutamyltransferase 7
00013303 ACSS2 acyl‐CoA synthetase short‐chain family member 2
00003504 GSS glutathione synthetase
MYH7B MYH7B myosin, heavy chain 7B, cardiac muscle, beta
TRPC4AP TRPC4AP transient receptor potential cation channel, subfami
TRPC4AP LOC787940 TRPC4‐associated protein‐like
00003815 EDEM2 ER degradation enhancer, mannosidase alpha‐like 2
00008291 PROCR protein C receptor, endothelial
MMP24 MMP24 matrix metallopeptidase 24 (membrane‐inserted)
00011263 EIF6 eukaryotic translation initiation factor 6
FAM83C FAM83C family with sequence similarity 83, member C
00030990 UQCC ubiquinol‐cytochrome c reductase complex chapero
00004429 GDF5 growth differentiation factor 5
CEP250 CEP250 centrosomal protein 250kDa
C20orf173 C20orf173
00006670 ERGIC3 ERGIC and golgi 3
SPAG4 SPAG4 sperm associated antigen 4
00006955 CPNE1 copine I
RBM12 LOC10014107 RNA‐binding protein 12‐like
RBM12 RBM12 RNA binding motif protein 12
00006962 NFS1 NFS1 nitrogen fixation 1 homolog (S. cerevisiae)
00027361 ROMO1 reactive oxygen species modulator 1
RBM39 RBM39 RNA binding motif protein 39
PHF20 PHF20 PHD finger protein 20
CNBD2 CNMPD1 cyclic nucleotide (cNMP) binding domain containing
EPB41L1 EPB41L1 erythrocyte membrane protein band 4.1‐like 1
00001645 AAR2 AAR2 splicing factor homolog (S. cerevisiae)
00001741 DLGAP4 discs, large (Drosophila) homolog‐associated protein
00011473 MYL9 myosin, light chain 9, regulatory
TGIF2 TGIF2 TGFB‐induced factor homeobox 2
00021805 C13H20orf24 RAB5‐interacting protein
00040607 SLA2 Src‐like‐adaptor 2
00019621 NDRG3 NDRG family member 3
00022005 TLDC2 TBC/LysM‐associated domain containing 2
00022007 SAMHD1 SAM domain and HD domain 1
00011541 RBL1 retinoblastoma‐like 1 (p107)
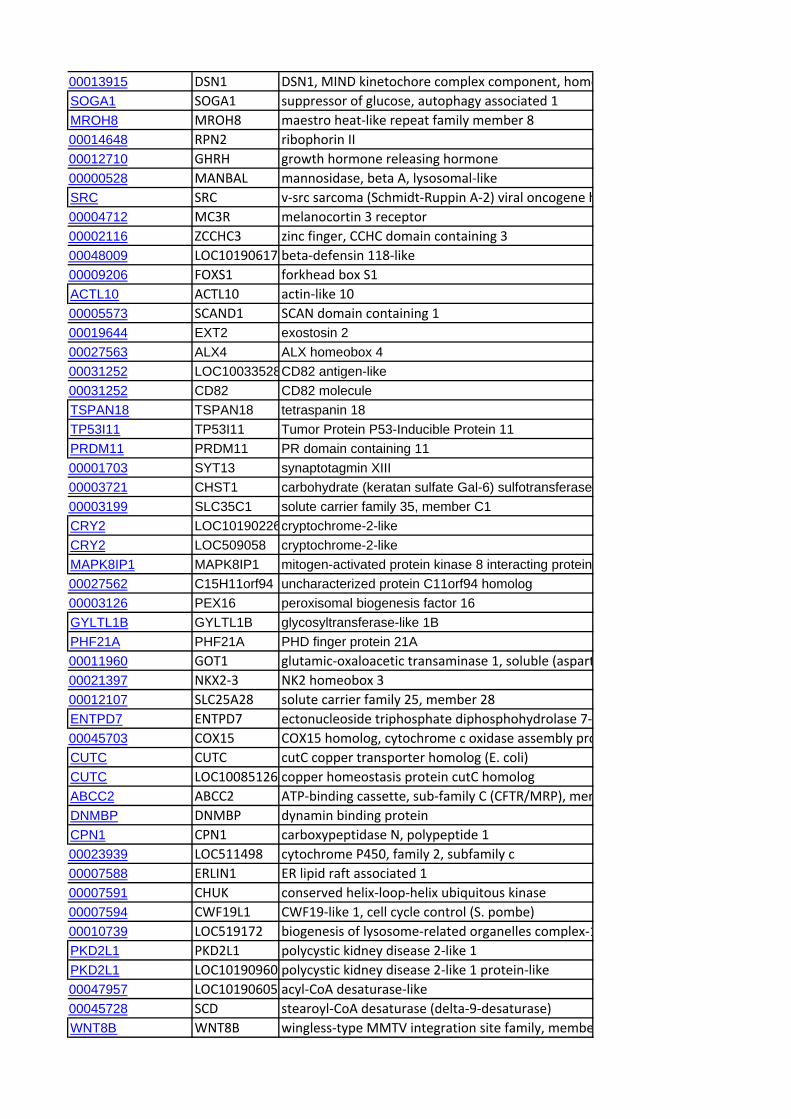
00013915 DSN1 DSN1, MIND kinetochore complex component, homo
SOGA1 SOGA1 suppressor of glucose, autophagy associated 1
MROH8 MROH8 maestro heat‐like repeat family member 8
00014648 RPN2 ribophorin II
00012710 GHRH growth hormone releasing hormone
00000528 MANBAL mannosidase, beta A, lysosomal‐like
SRC SRC v‐src sarcoma (Schmidt‐Ruppin A‐2) viral oncogene h
00004712 MC3R melanocortin 3 receptor
00002116 ZCCHC3 zinc finger, CCHC domain containing 3
00048009 LOC10190617 beta‐defensin 118‐like
00009206 FOXS1 forkhead box S1
ACTL10 ACTL10 actin‐like 10
00005573 SCAND1 SCAN domain containing 1
00019644 EXT2 exostosin 200027563 ALX4 ALX homeobox 400031252 LOC10033528CD82 antigen-like00031252 CD82 CD82 moleculeTSPAN18 TSPAN18 tetraspanin 18TP53I11 TP53I11 Tumor Protein P53-Inducible Protein 11PRDM11 PRDM11 PR domain containing 1100001703 SYT13 synaptotagmin XIII00003721 CHST1 carbohydrate (keratan sulfate Gal-6) sulfotransferase 00003199 SLC35C1 solute carrier family 35, member C1CRY2 LOC10190226cryptochrome-2-likeCRY2 LOC509058 cryptochrome-2-likeMAPK8IP1 MAPK8IP1 mitogen-activated protein kinase 8 interacting protein00027562 C15H11orf94 uncharacterized protein C11orf94 homolog00003126 PEX16 peroxisomal biogenesis factor 16GYLTL1B GYLTL1B glycosyltransferase-like 1BPHF21A PHF21A PHD finger protein 21A00011960 GOT1 glutamic‐oxaloacetic transaminase 1, soluble (aspart
00021397 NKX2‐3 NK2 homeobox 3
00012107 SLC25A28 solute carrier family 25, member 28
ENTPD7 ENTPD7 ectonucleoside triphosphate diphosphohydrolase 7‐
00045703 COX15 COX15 homolog, cytochrome c oxidase assembly pro
CUTC CUTC cutC copper transporter homolog (E. coli)
CUTC LOC10085126 copper homeostasis protein cutC homolog
ABCC2 ABCC2 ATP‐binding cassette, sub‐family C (CFTR/MRP), mem
DNMBP DNMBP dynamin binding protein
CPN1 CPN1 carboxypeptidase N, polypeptide 1
00023939 LOC511498 cytochrome P450, family 2, subfamily c
00007588 ERLIN1 ER lipid raft associated 1
00007591 CHUK conserved helix‐loop‐helix ubiquitous kinase
00007594 CWF19L1 CWF19‐like 1, cell cycle control (S. pombe)
00010739 LOC519172 biogenesis of lysosome‐related organelles complex‐1
PKD2L1 PKD2L1 polycystic kidney disease 2‐like 1
PKD2L1 LOC10190960 polycystic kidney disease 2‐like 1 protein‐like
00047957 LOC10190605 acyl‐CoA desaturase‐like
00045728 SCD stearoyl‐CoA desaturase (delta‐9‐desaturase)
WNT8B WNT8B wingless‐type MMTV integration site family, membe
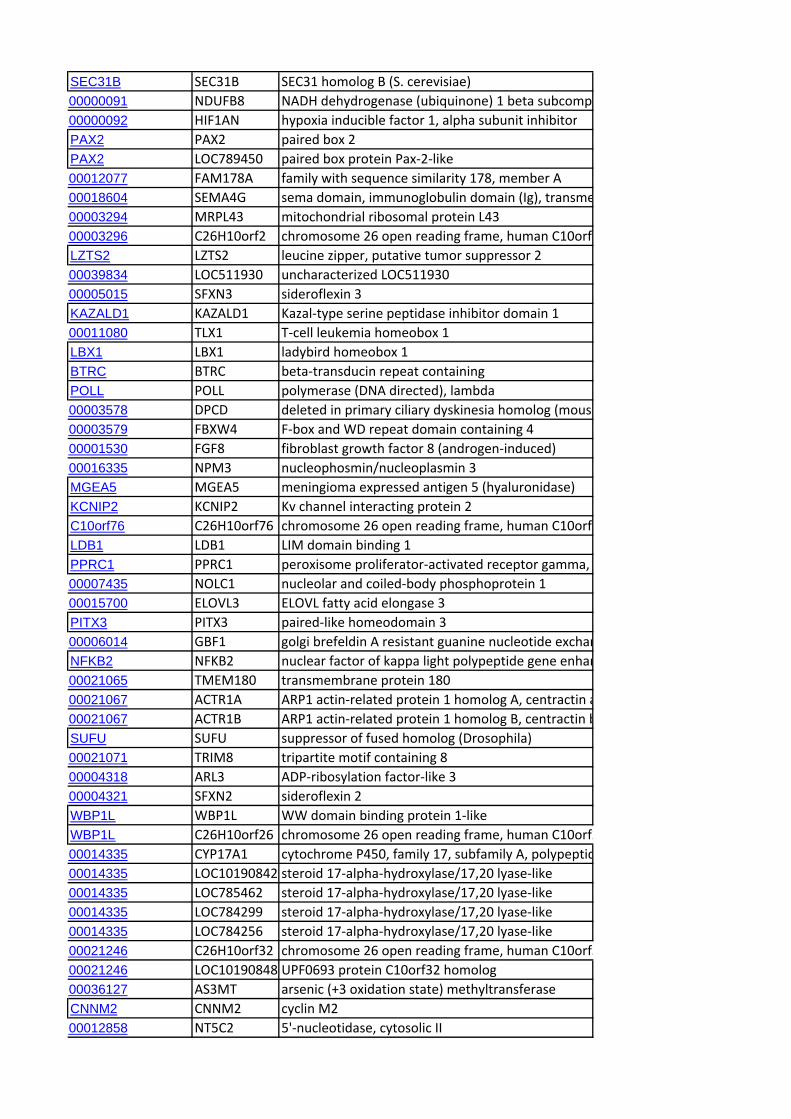
SEC31B SEC31B SEC31 homolog B (S. cerevisiae)
00000091 NDUFB8 NADH dehydrogenase (ubiquinone) 1 beta subcomp
00000092 HIF1AN hypoxia inducible factor 1, alpha subunit inhibitor
PAX2 PAX2 paired box 2
PAX2 LOC789450 paired box protein Pax‐2‐like
00012077 FAM178A family with sequence similarity 178, member A
00018604 SEMA4G sema domain, immunoglobulin domain (Ig), transme
00003294 MRPL43 mitochondrial ribosomal protein L43
00003296 C26H10orf2 chromosome 26 open reading frame, human C10orf
LZTS2 LZTS2 leucine zipper, putative tumor suppressor 2
00039834 LOC511930 uncharacterized LOC511930
00005015 SFXN3 sideroflexin 3
KAZALD1 KAZALD1 Kazal‐type serine peptidase inhibitor domain 1
00011080 TLX1 T‐cell leukemia homeobox 1
LBX1 LBX1 ladybird homeobox 1
BTRC BTRC beta‐transducin repeat containing
POLL POLL polymerase (DNA directed), lambda
00003578 DPCD deleted in primary ciliary dyskinesia homolog (mous
00003579 FBXW4 F‐box and WD repeat domain containing 4
00001530 FGF8 fibroblast growth factor 8 (androgen‐induced)
00016335 NPM3 nucleophosmin/nucleoplasmin 3
MGEA5 MGEA5 meningioma expressed antigen 5 (hyaluronidase)
KCNIP2 KCNIP2 Kv channel interacting protein 2
C10orf76 C26H10orf76 chromosome 26 open reading frame, human C10orf
LDB1 LDB1 LIM domain binding 1
PPRC1 PPRC1 peroxisome proliferator‐activated receptor gamma,
00007435 NOLC1 nucleolar and coiled‐body phosphoprotein 1
00015700 ELOVL3 ELOVL fatty acid elongase 3
PITX3 PITX3 paired‐like homeodomain 3
00006014 GBF1 golgi brefeldin A resistant guanine nucleotide exchan
NFKB2 NFKB2 nuclear factor of kappa light polypeptide gene enhan
00021065 TMEM180 transmembrane protein 180
00021067 ACTR1A ARP1 actin‐related protein 1 homolog A, centractin a
00021067 ACTR1B ARP1 actin‐related protein 1 homolog B, centractin b
SUFU SUFU suppressor of fused homolog (Drosophila)
00021071 TRIM8 tripartite motif containing 8
00004318 ARL3 ADP‐ribosylation factor‐like 3
00004321 SFXN2 sideroflexin 2
WBP1L WBP1L WW domain binding protein 1‐like
WBP1L C26H10orf26 chromosome 26 open reading frame, human C10orf2
00014335 CYP17A1 cytochrome P450, family 17, subfamily A, polypeptid
00014335 LOC10190842 steroid 17‐alpha‐hydroxylase/17,20 lyase‐like
00014335 LOC785462 steroid 17‐alpha‐hydroxylase/17,20 lyase‐like
00014335 LOC784299 steroid 17‐alpha‐hydroxylase/17,20 lyase‐like
00014335 LOC784256 steroid 17‐alpha‐hydroxylase/17,20 lyase‐like
00021246 C26H10orf32 chromosome 26 open reading frame, human C10orf3
00021246 LOC10190848 UPF0693 protein C10orf32 homolog
00036127 AS3MT arsenic (+3 oxidation state) methyltransferase
CNNM2 CNNM2 cyclin M2
00012858 NT5C2 5'‐nucleotidase, cytosolic II

00002717 INA internexin neuronal intermediate filament protein, a
PCGF6 PCGF6 polycomb group ring finger 6
00009709 TAF5 TAF5 RNA polymerase II, TATA box binding protein (T
00021942 HPS6 Hermansky‐Pudlak syndrome 6
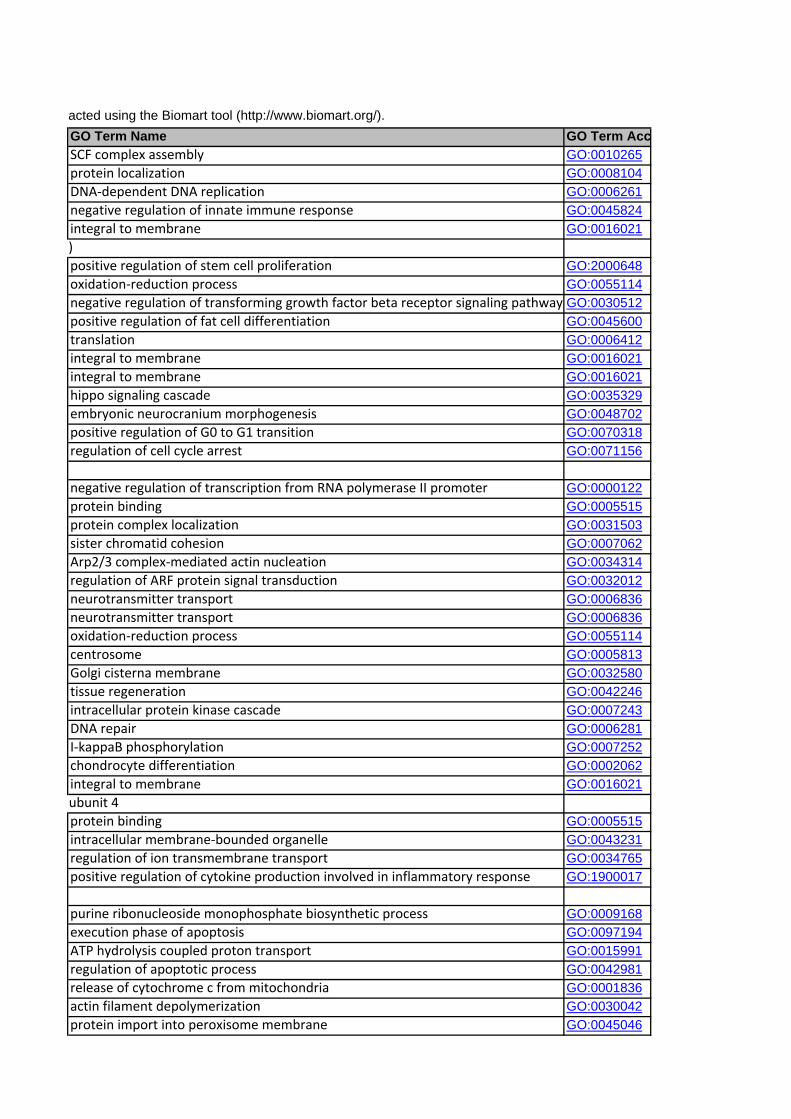
racted using the Biomart tool (http://www.biomart.org/). GO Term Name GO Term AccSCF complex assembly GO:0010265protein localization GO:0008104DNA‐dependent DNA replication GO:0006261negative regulation of innate immune response GO:0045824integral to membrane GO:0016021)
positive regulation of stem cell proliferation GO:2000648oxidation‐reduction process GO:0055114negative regulation of transforming growth factor beta receptor signaling pathway GO:0030512positive regulation of fat cell differentiation GO:0045600translation GO:0006412integral to membrane GO:0016021integral to membrane GO:0016021hippo signaling cascade GO:0035329embryonic neurocranium morphogenesis GO:0048702positive regulation of G0 to G1 transition GO:0070318regulation of cell cycle arrest GO:0071156
negative regulation of transcription from RNA polymerase II promoter GO:0000122protein binding GO:0005515protein complex localization GO:0031503sister chromatid cohesion GO:0007062Arp2/3 complex‐mediated actin nucleation GO:0034314regulation of ARF protein signal transduction GO:0032012neurotransmitter transport GO:0006836neurotransmitter transport GO:0006836oxidation‐reduction process GO:0055114centrosome GO:0005813Golgi cisterna membrane GO:0032580tissue regeneration GO:0042246intracellular protein kinase cascade GO:0007243DNA repair GO:0006281I‐kappaB phosphorylation GO:0007252chondrocyte differentiation GO:0002062integral to membrane GO:0016021ubunit 4
protein binding GO:0005515intracellular membrane‐bounded organelle GO:0043231regulation of ion transmembrane transport GO:0034765positive regulation of cytokine production involved in inflammatory response GO:1900017
purine ribonucleoside monophosphate biosynthetic process GO:0009168execution phase of apoptosis GO:0097194ATP hydrolysis coupled proton transport GO:0015991regulation of apoptotic process GO:0042981release of cytochrome c from mitochondria GO:0001836actin filament depolymerization GO:0030042protein import into peroxisome membrane GO:0045046
protein polymerization GO:0051258regulation of cell shape GO:0008360carbohydrate binding GO:0030246intracellular protein transport GO:0006886signal transduction GO:0007165cellular response to ATP GO:0071318T cell costimulation GO:0031295nucleolus GO:0005730positive regulation of substrate adhesion‐dependent cell spreading GO:1900026biosynthetic process GO:0009058negative regulation of adenylate cyclase activity GO:0007194nucleocytoplasmic transport GO:0006913regulation of translational initiation GO:0006446protein binding GO:00055153
transcription from RNA polymerase I promoter GO:0006360oligodendrocyte differentiation GO:0048709protein kinase C‐activating G‐protein coupled receptor signaling pathway GO:0007205organic anion transport GO:0015711filopodium assembly GO:0046847cardiolipin biosynthetic process GO:0032049regulation of epidermal cell differentiation GO:0045604integral to membrane GO:0016021positive regulation of proteasomal ubiquitin‐dependent protein catabolic process GO:0032436positive regulation of proteasomal ubiquitin‐dependent protein catabolic process GO:0032436protein retention in ER lumen GO:0006621post‐embryonic development GO:0009791synapsis GO:0007129
protein localization GO:0008104protein import into mitochondrial outer membrane GO:0045040proteolysis GO:0006508positive regulation of mRNA catabolic process GO:0061014centrosome localization GO:0051642microtubule‐based process GO:0007017
negative regulation of transcription from RNA polymerase II promoter GO:0000122metabolic process GO:0008152DNA cytosine deamination GO:0070383negative regulation of transcription from RNA polymerase II promoter GO:0000122positive regulation of DNA biosynthetic process GO:2000573translation GO:0006412regulation of long‐term neuronal synaptic plasticity GO:0048169heart morphogenesis GO:0003007mitochondrial fusion GO:0008053gluconeogenesis GO:0006094nucleoplasm GO:0005654regulation of ion transmembrane transport GO:0034765
endosome GO:0005768
positive regulation of nuclear‐transcribed mRNA catabolic process, deadenylation‐dGO:1900153
purine ribonucleotide biosynthetic process GO:0009152positive regulation of protein catabolic process GO:0045732smooth muscle cell differentiation GO:0051145G‐protein coupled receptor signaling pathway GO:0007186AMP transport GO:0080121response to stress GO:0006950glomerular filtration GO:0003094protein ubiquitination involved in ubiquitin‐dependent protein catabolic process GO:0042787nucleosome assembly GO:0006334protein N‐linked glycosylation GO:0006487
prostaglandin metabolic process GO:0006693histone H4 deacetylation GO:0070933cellular protein localization GO:0034613
vesicle‐mediated transport GO:0016192cellular response to copper ion GO:0071280signal transduction GO:0007165protein ubiquitination involved in ubiquitin‐dependent protein catabolic process GO:0042787GPI anchor biosynthetic process GO:0006506GPI anchor biosynthetic process GO:0006506regulation of defense response to virus GO:0050688protein ubiquitination GO:0016567protein dephosphorylation GO:0006470urate metabolic process GO:0046415negative regulation of G1/S transition of mitotic cell cycle GO:2000134response to vitamin D GO:0033280negative regulation of bone mineralization GO:0030502biomineral tissue development GO:0031214proteolysis GO:0006508negative regulation of smooth muscle cell differentiation GO:0051151
mitotic chromosome condensation GO:0007076regulation of transcription from RNA polymerase II promoter GO:0006357axon extension involved in axon guidance GO:0048846binding GO:0005488regulation of ion transmembrane transport GO:0034765positive regulation of inner ear receptor cell differentiation GO:2000982
DNA binding GO:0003677nucleosome assembly GO:0006334protein ubiquitination GO:0016567inositol phosphate‐mediated signaling GO:0048016metal ion binding GO:0046872mitochondrion GO:0005739proton transport GO:0015992proton transport GO:0015992proton transport GO:0015992proton transport GO:0015992protein polymerization GO:0051258epithelial tube branching involved in lung morphogenesis GO:0060441
negative regulation of transcription, DNA‐dependent GO:0045892energy reserve metabolic process GO:0006112proteolysis GO:0006508retrograde transport, endosome to Golgi GO:0042147
positive regulation of viral genome replication GO:0045070nucleocytoplasmic transport GO:0006913protein binding GO:0005515
85
WW domain binding GO:0050699positive regulation of type I interferon‐mediated signaling pathway GO:0060340gluconeogenesis GO:0006094histone methylation GO:0016571regulation of RNA splicing GO:0043484cellular response to organic cyclic compound GO:0071407synapsis GO:0007129positive regulation of hyaluranon cable assembly GO:1900106male gonad development GO:0008584
1
membrane GO:0016020phosphorelay signal transduction system GO:0000160protein binding GO:0005515mitotic cell cycle GO:0000278
protein binding GO:0005515protein binding GO:0005515protein binding GO:0005515Golgi stack GO:0005795regulation of ryanodine‐sensitive calcium‐release channel activity GO:0060314cytoplasm GO:0005737cytoplasmic microtubule GO:0005881double‐strand break repair GO:0006302
proteasome complex GO:0000502
positive regulation of endothelial cell migration GO:0010595spindle pole GO:0000922cellular response to heat GO:0034605response to oxidative stress GO:0006979neuromuscular process controlling posture GO:0050884protein phosphorylation GO:0006468positive regulation of Rab GTPase activity GO:0032851protein linear polyubiquitination GO:0097039regulation of glucose transport GO:0010827neuronal cell body GO:004302596
defense response GO:0006952defense response to bacterium GO:0042742
defense response to bacterium GO:0042742defense response to bacterium GO:0042742defense response to bacterium GO:0042742defense response to bacterium GO:0042742GTP catabolic process GO:0006184membrane protein proteolysis GO:0033619negative regulation of sequence‐specific DNA binding transcription factor activity GO:0043433mitochondrial membrane GO:0031966negative regulation of intrinsic apoptotic signaling pathway GO:2001243regulation of mitotic spindle organization GO:0060236cardiac muscle tissue morphogenesis GO:0055008dephosphorylation GO:0016311cellular protein modification process GO:0006464protein folding GO:0006457 member 7
protein phosphorylation GO:0006468integral to membrane GO:0016021regulation of transcription from RNA polymerase II promoter GO:0006357somitogenesis GO:0001756spindle assembly involved in mitosis GO:0090307negative regulation of retinoic acid receptor signaling pathway GO:0048387112
tumor necrosis factor‐mediated signaling pathway GO:0033209negative regulation of histone H3‐K9 methylation GO:0051573negative regulation of histone H3‐K9 methylation GO:0051573negative regulation of microtubule polymerization GO:0031115negative regulation of microtubule polymerization GO:0031115spermatogenesis GO:0007283spermatogenesis GO:0007283lipid binding GO:0008289lipid binding GO:0008289lipid binding GO:0008289cytoplasm GO:0005737lipid binding GO:0008289lipid binding GO:0008289lipid binding GO:0008289lipid binding GO:0008289lipid binding GO:0008289lipid binding GO:0008289extracellular region GO:0005576extracellular space GO:0005615lipid binding GO:0008289
RNA modification GO:0009451regulation of sodium ion transmembrane transport GO:1902305positive regulation of neuron projection development GO:0010976regulation of amyloid precursor protein biosynthetic process GO:0042984144
negative regulation of transcription involved in G1/S transition of mitotic cell cycle GO:0071930
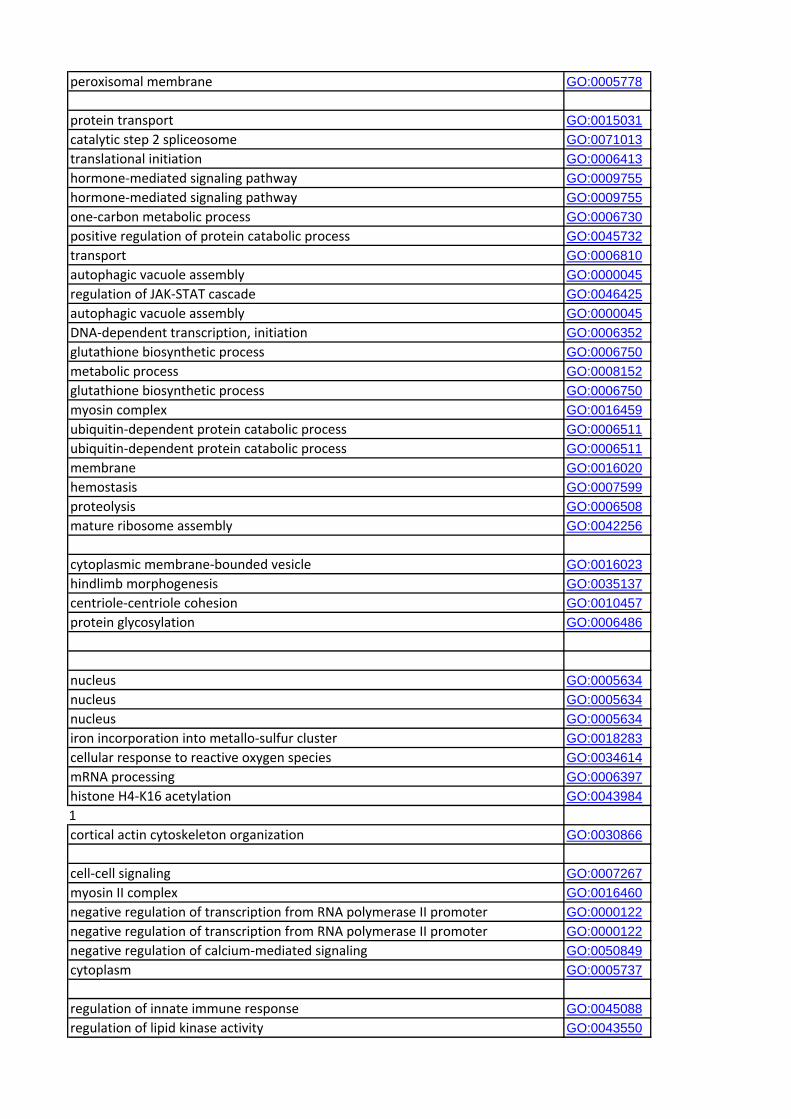
peroxisomal membrane GO:0005778
protein transport GO:0015031catalytic step 2 spliceosome GO:0071013translational initiation GO:0006413hormone‐mediated signaling pathway GO:0009755hormone‐mediated signaling pathway GO:0009755one‐carbon metabolic process GO:0006730positive regulation of protein catabolic process GO:0045732transport GO:0006810autophagic vacuole assembly GO:0000045regulation of JAK‐STAT cascade GO:0046425autophagic vacuole assembly GO:0000045DNA‐dependent transcription, initiation GO:0006352glutathione biosynthetic process GO:0006750metabolic process GO:0008152glutathione biosynthetic process GO:0006750myosin complex GO:0016459ubiquitin‐dependent protein catabolic process GO:0006511ubiquitin‐dependent protein catabolic process GO:0006511membrane GO:0016020hemostasis GO:0007599proteolysis GO:0006508mature ribosome assembly GO:0042256
cytoplasmic membrane‐bounded vesicle GO:0016023hindlimb morphogenesis GO:0035137centriole‐centriole cohesion GO:0010457protein glycosylation GO:0006486
nucleus GO:0005634nucleus GO:0005634nucleus GO:0005634iron incorporation into metallo‐sulfur cluster GO:0018283cellular response to reactive oxygen species GO:0034614mRNA processing GO:0006397histone H4‐K16 acetylation GO:00439841
cortical actin cytoskeleton organization GO:0030866
cell‐cell signaling GO:0007267myosin II complex GO:0016460negative regulation of transcription from RNA polymerase II promoter GO:0000122negative regulation of transcription from RNA polymerase II promoter GO:0000122negative regulation of calcium‐mediated signaling GO:0050849cytoplasm GO:0005737
regulation of innate immune response GO:0045088regulation of lipid kinase activity GO:0043550
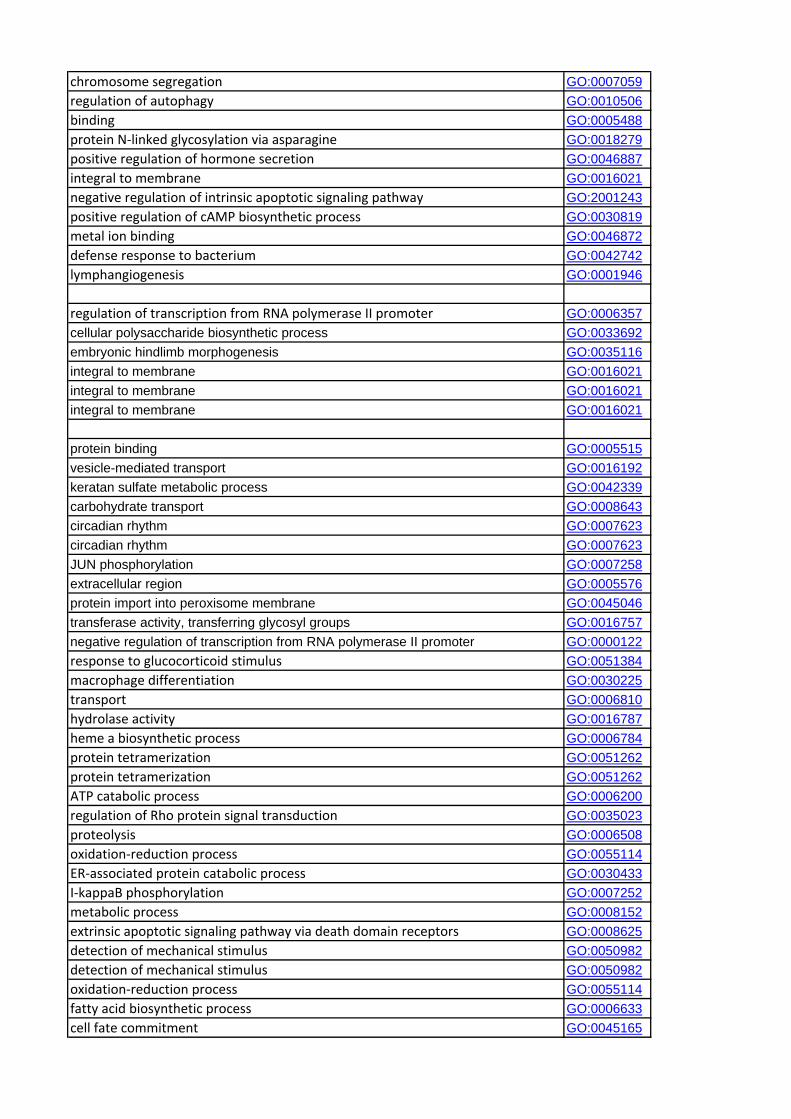
chromosome segregation GO:0007059regulation of autophagy GO:0010506binding GO:0005488protein N‐linked glycosylation via asparagine GO:0018279positive regulation of hormone secretion GO:0046887integral to membrane GO:0016021negative regulation of intrinsic apoptotic signaling pathway GO:2001243positive regulation of cAMP biosynthetic process GO:0030819metal ion binding GO:0046872defense response to bacterium GO:0042742lymphangiogenesis GO:0001946
regulation of transcription from RNA polymerase II promoter GO:0006357cellular polysaccharide biosynthetic process GO:0033692embryonic hindlimb morphogenesis GO:0035116integral to membrane GO:0016021integral to membrane GO:0016021integral to membrane GO:0016021
protein binding GO:0005515vesicle-mediated transport GO:0016192keratan sulfate metabolic process GO:0042339carbohydrate transport GO:0008643circadian rhythm GO:0007623circadian rhythm GO:0007623JUN phosphorylation GO:0007258extracellular region GO:0005576protein import into peroxisome membrane GO:0045046transferase activity, transferring glycosyl groups GO:0016757negative regulation of transcription from RNA polymerase II promoter GO:0000122response to glucocorticoid stimulus GO:0051384macrophage differentiation GO:0030225transport GO:0006810hydrolase activity GO:0016787heme a biosynthetic process GO:0006784protein tetramerization GO:0051262protein tetramerization GO:0051262ATP catabolic process GO:0006200regulation of Rho protein signal transduction GO:0035023proteolysis GO:0006508oxidation‐reduction process GO:0055114ER‐associated protein catabolic process GO:0030433I‐kappaB phosphorylation GO:0007252metabolic process GO:0008152extrinsic apoptotic signaling pathway via death domain receptors GO:0008625detection of mechanical stimulus GO:0050982detection of mechanical stimulus GO:0050982oxidation‐reduction process GO:0055114fatty acid biosynthetic process GO:0006633cell fate commitment GO:0045165
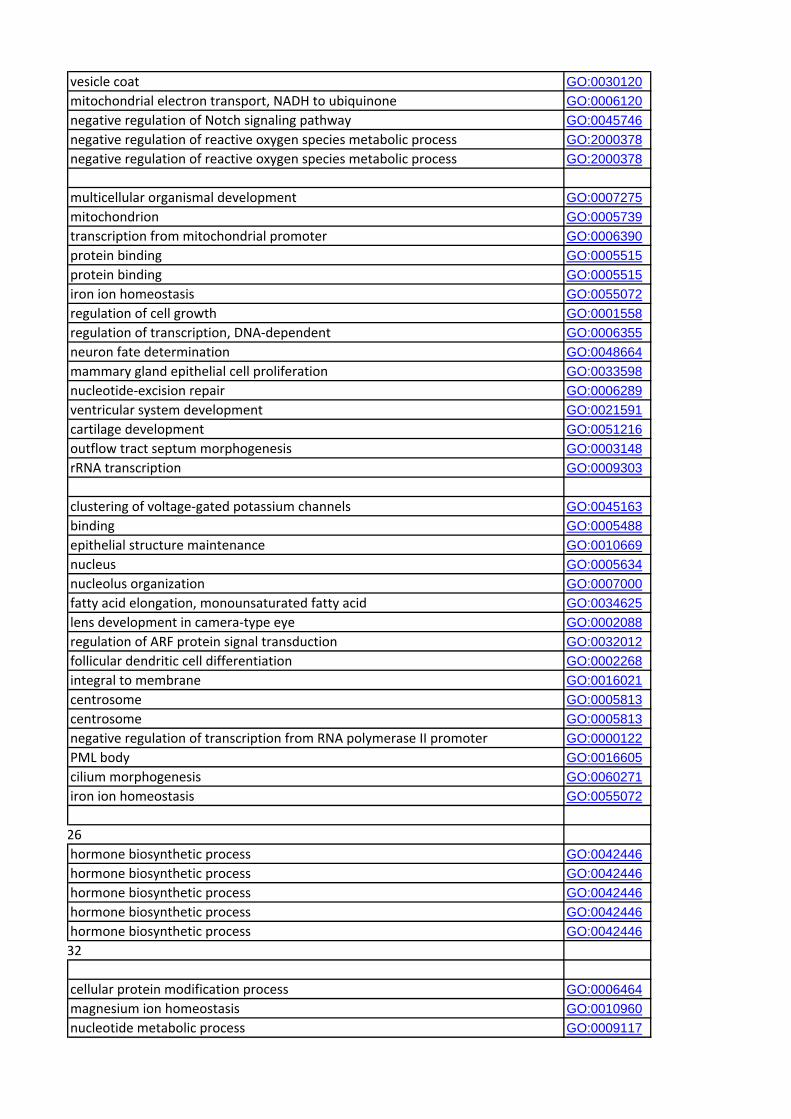
vesicle coat GO:0030120mitochondrial electron transport, NADH to ubiquinone GO:0006120negative regulation of Notch signaling pathway GO:0045746negative regulation of reactive oxygen species metabolic process GO:2000378negative regulation of reactive oxygen species metabolic process GO:2000378
multicellular organismal development GO:0007275mitochondrion GO:0005739transcription from mitochondrial promoter GO:0006390protein binding GO:0005515protein binding GO:0005515iron ion homeostasis GO:0055072regulation of cell growth GO:0001558regulation of transcription, DNA‐dependent GO:0006355neuron fate determination GO:0048664mammary gland epithelial cell proliferation GO:0033598nucleotide‐excision repair GO:0006289ventricular system development GO:0021591cartilage development GO:0051216outflow tract septum morphogenesis GO:0003148rRNA transcription GO:0009303
clustering of voltage‐gated potassium channels GO:0045163binding GO:0005488epithelial structure maintenance GO:0010669nucleus GO:0005634nucleolus organization GO:0007000fatty acid elongation, monounsaturated fatty acid GO:0034625lens development in camera‐type eye GO:0002088regulation of ARF protein signal transduction GO:0032012follicular dendritic cell differentiation GO:0002268integral to membrane GO:0016021centrosome GO:0005813centrosome GO:0005813negative regulation of transcription from RNA polymerase II promoter GO:0000122PML body GO:0016605cilium morphogenesis GO:0060271iron ion homeostasis GO:0055072
26
hormone biosynthetic process GO:0042446hormone biosynthetic process GO:0042446hormone biosynthetic process GO:0042446hormone biosynthetic process GO:0042446hormone biosynthetic process GO:004244632
cellular protein modification process GO:0006464magnesium ion homeostasis GO:0010960nucleotide metabolic process GO:0009117

nervous system development GO:0007399negative regulation of transcription, DNA‐dependent GO:0045892transcription initiation from RNA polymerase II promoter GO:0006367pigmentation GO:0043473
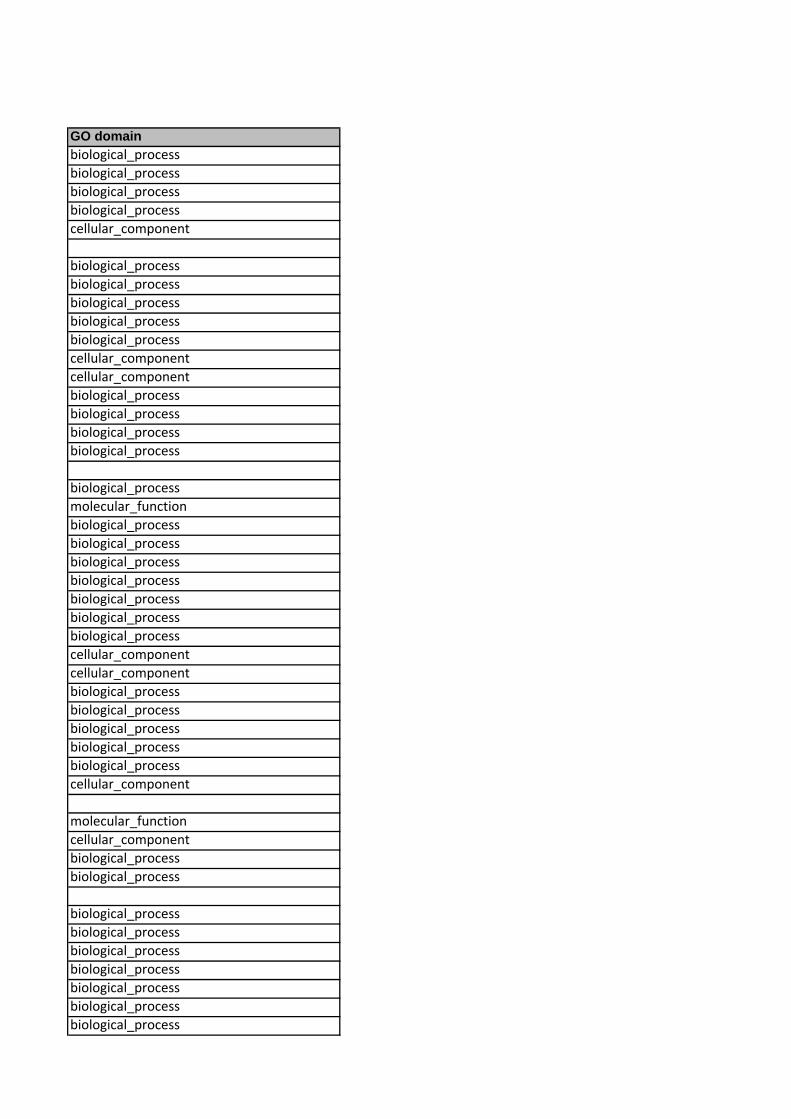
GO domainbiological_process
biological_process
biological_process
biological_process
cellular_component
biological_process
biological_process
biological_process
biological_process
biological_process
cellular_component
cellular_component
biological_process
biological_process
biological_process
biological_process
biological_process
molecular_function
biological_process
biological_process
biological_process
biological_process
biological_process
biological_process
biological_process
cellular_component
cellular_component
biological_process
biological_process
biological_process
biological_process
biological_process
cellular_component
molecular_function
cellular_component
biological_process
biological_process
biological_process
biological_process
biological_process
biological_process
biological_process
biological_process
biological_process
biological_process
biological_process
molecular_function
biological_process
biological_process
biological_process
biological_process
cellular_component
biological_process
biological_process
biological_process
biological_process
biological_process
molecular_function
biological_process
biological_process
biological_process
biological_process
biological_process
biological_process
biological_process
cellular_component
biological_process
biological_process
biological_process
biological_process
biological_process
biological_process
biological_process
biological_process
biological_process
biological_process
biological_process
biological_process
biological_process
biological_process
biological_process
biological_process
biological_process
biological_process
biological_process
biological_process
biological_process
cellular_component
biological_process
cellular_component
biological_process

biological_process
biological_process
biological_process
biological_process
biological_process
biological_process
biological_process
biological_process
biological_process
biological_process
biological_process
biological_process
biological_process
biological_process
biological_process
biological_process
biological_process
biological_process
biological_process
biological_process
biological_process
biological_process
biological_process
biological_process
biological_process
biological_process
biological_process
biological_process
biological_process
biological_process
biological_process
biological_process
molecular_function
biological_process
biological_process
molecular_function
biological_process
biological_process
biological_process
molecular_function
cellular_component
biological_process
biological_process
biological_process
biological_process
biological_process
biological_process
biological_process
biological_process
biological_process
biological_process
biological_process
biological_process
molecular_function
molecular_function
biological_process
biological_process
biological_process
biological_process
biological_process
biological_process
biological_process
biological_process
cellular_component
biological_process
molecular_function
biological_process
molecular_function
molecular_function
molecular_function
cellular_component
biological_process
cellular_component
cellular_component
biological_process
cellular_component
biological_process
cellular_component
biological_process
biological_process
biological_process
biological_process
biological_process
biological_process
biological_process
cellular_component
biological_process
biological_process
biological_process
biological_process
biological_process
biological_process
biological_process
biological_process
biological_process
cellular_component
biological_process
biological_process
biological_process
biological_process
biological_process
biological_process
biological_process
cellular_component
biological_process
biological_process
biological_process
biological_process
biological_process
biological_process
biological_process
biological_process
biological_process
biological_process
biological_process
molecular_function
molecular_function
molecular_function
cellular_component
molecular_function
molecular_function
molecular_function
molecular_function
molecular_function
molecular_function
cellular_component
cellular_component
molecular_function
biological_process
biological_process
biological_process
biological_process
biological_process
cellular_component
biological_process
cellular_component
biological_process
biological_process
biological_process
biological_process
biological_process
biological_process
biological_process
biological_process
biological_process
biological_process
biological_process
biological_process
biological_process
cellular_component
biological_process
biological_process
cellular_component
biological_process
biological_process
biological_process
cellular_component
biological_process
biological_process
biological_process
cellular_component
cellular_component
cellular_component
biological_process
biological_process
biological_process
biological_process
biological_process
biological_process
cellular_component
biological_process
biological_process
biological_process
cellular_component
biological_process
biological_process
biological_process
biological_process
molecular_function
biological_process
biological_process
cellular_component
biological_process
biological_process
molecular_function
biological_process
biological_process
biological_process
biological_processbiological_processcellular_componentcellular_componentcellular_component
molecular_functionbiological_processbiological_processbiological_processbiological_processbiological_processbiological_processcellular_componentbiological_processmolecular_functionbiological_processbiological_process
biological_process
biological_process
molecular_function
biological_process
biological_process
biological_process
biological_process
biological_process
biological_process
biological_process
biological_process
biological_process
biological_process
biological_process
biological_process
biological_process
biological_process
biological_process
biological_process
cellular_component
biological_process
biological_process
biological_process
biological_process
biological_process
cellular_component
biological_process
molecular_function
molecular_function
biological_process
biological_process
biological_process
biological_process
biological_process
biological_process
biological_process
biological_process
biological_process
biological_process
biological_process
molecular_function
biological_process
cellular_component
biological_process
biological_process
biological_process
biological_process
biological_process
cellular_component
cellular_component
cellular_component
biological_process
cellular_component
biological_process
biological_process
biological_process
biological_process
biological_process
biological_process
biological_process
biological_process
biological_process
biological_process

biological_process
biological_process
biological_process
biological_process
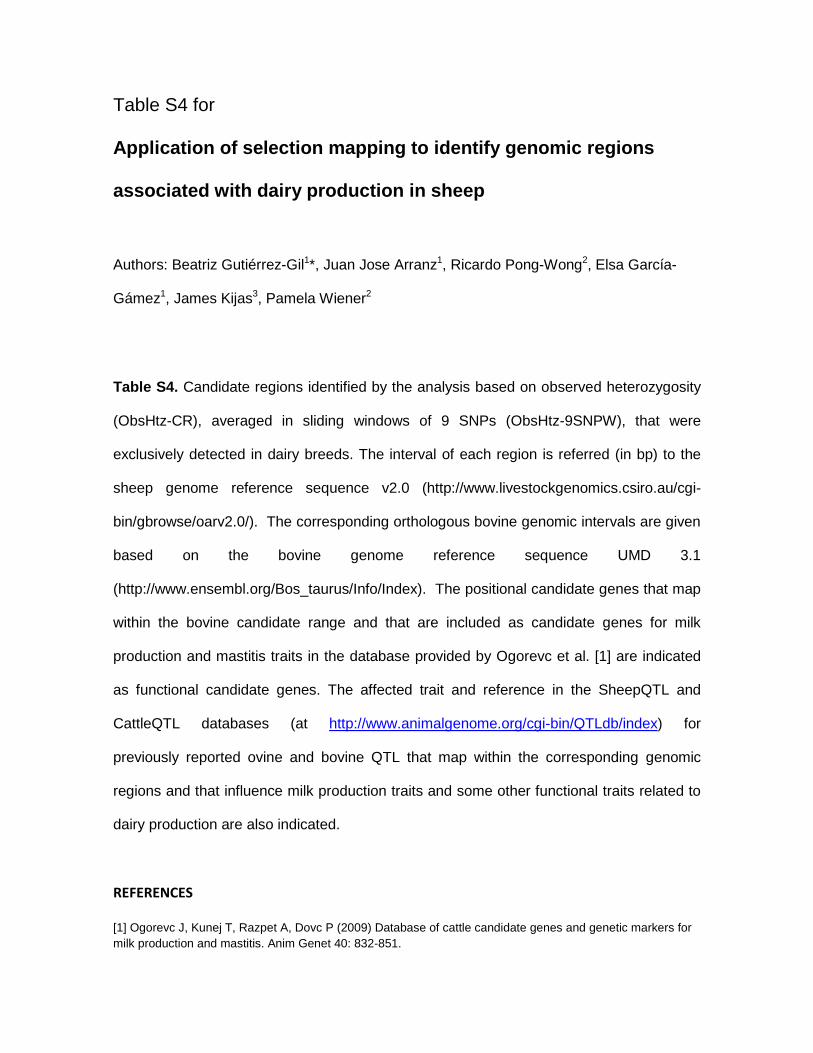
Table S4 for
Application of selection mapping to identify genomic regions
associated with dairy production in sheep
Authors: Beatriz Gutiérrez-Gil1*, Juan Jose Arranz1, Ricardo Pong-Wong2, Elsa García-
Gámez1, James Kijas3, Pamela Wiener2
Table S4. Candidate regions identified by the analysis based on observed heterozygosity
(ObsHtz-CR), averaged in sliding windows of 9 SNPs (ObsHtz-9SNPW), that were
exclusively detected in dairy breeds. The interval of each region is referred (in bp) to the
sheep genome reference sequence v2.0 (http://www.livestockgenomics.csiro.au/cgi-
bin/gbrowse/oarv2.0/). The corresponding orthologous bovine genomic intervals are given
based on the bovine genome reference sequence UMD 3.1
(http://www.ensembl.org/Bos_taurus/Info/Index). The positional candidate genes that map
within the bovine candidate range and that are included as candidate genes for milk
production and mastitis traits in the database provided by Ogorevc et al. [1] are indicated
as functional candidate genes. The affected trait and reference in the SheepQTL and
CattleQTL databases (at http://www.animalgenome.org/cgi-bin/QTLdb/index) for
previously reported ovine and bovine QTL that map within the corresponding genomic
regions and that influence milk production traits and some other functional traits related to
dairy production are also indicated.
REFERENCES
[1] Ogorevc J, Kunej T, Razpet A, Dovc P (2009) Database of cattle candidate genes and genetic markers for milk production and mastitis. Anim Genet 40: 832-851.
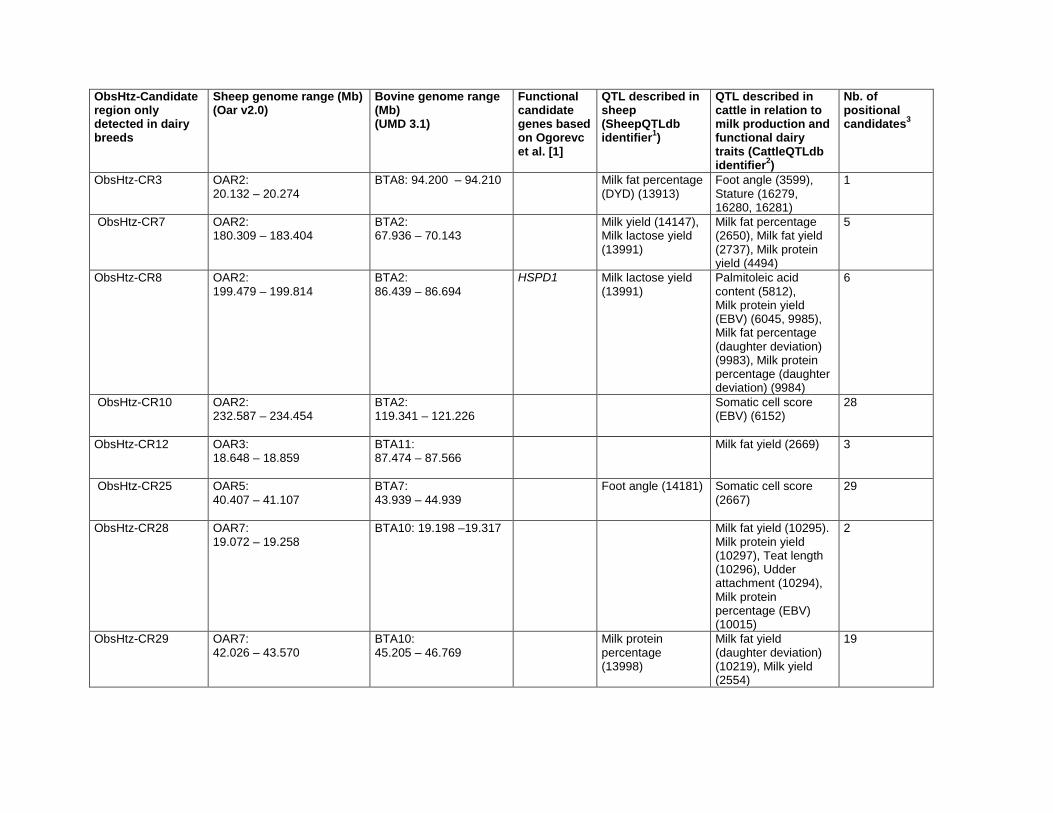
ObsHtz-Candidate region only detected in dairy breeds
Sheep genome range (Mb) (Oar v2.0)
Bovine genome range (Mb) (UMD 3.1)
Functional candidate genes based on Ogorevc et al. [1]
QTL described in sheep (SheepQTLdb identifier1)
QTL described in cattle in relation to milk production and functional dairy traits (CattleQTLdb identifier2)
Nb. of positional candidates3
ObsHtz-CR3 OAR2: 20.132 – 20.274
BTA8: 94.200 – 94.210 Milk fat percentage (DYD) (13913)
Foot angle (3599), Stature (16279, 16280, 16281)
1
ObsHtz-CR7 OAR2: 180.309 – 183.404
BTA2: 67.936 – 70.143
Milk yield (14147), Milk lactose yield (13991)
Milk fat percentage (2650), Milk fat yield (2737), Milk protein yield (4494)
5
ObsHtz-CR8 OAR2: 199.479 – 199.814
BTA2: 86.439 – 86.694
HSPD1 Milk lactose yield (13991)
Palmitoleic acid content (5812), Milk protein yield (EBV) (6045, 9985), Milk fat percentage (daughter deviation) (9983), Milk protein percentage (daughter deviation) (9984)
6
ObsHtz-CR10 OAR2: 232.587 – 234.454
BTA2: 119.341 – 121.226
Somatic cell score (EBV) (6152)
28
ObsHtz-CR12 OAR3: 18.648 – 18.859
BTA11: 87.474 – 87.566
Milk fat yield (2669) 3
ObsHtz-CR25 OAR5: 40.407 – 41.107
BTA7: 43.939 – 44.939
Foot angle (14181) Somatic cell score (2667)
29
ObsHtz-CR28 OAR7: 19.072 – 19.258
BTA10: 19.198 –19.317 Milk fat yield (10295). Milk protein yield (10297), Teat length (10296), Udder attachment (10294), Milk protein percentage (EBV) (10015)
2
ObsHtz-CR29 OAR7: 42.026 – 43.570
BTA10: 45.205 – 46.769
Milk protein percentage (13998)
Milk fat yield (daughter deviation) (10219), Milk yield (2554)
19
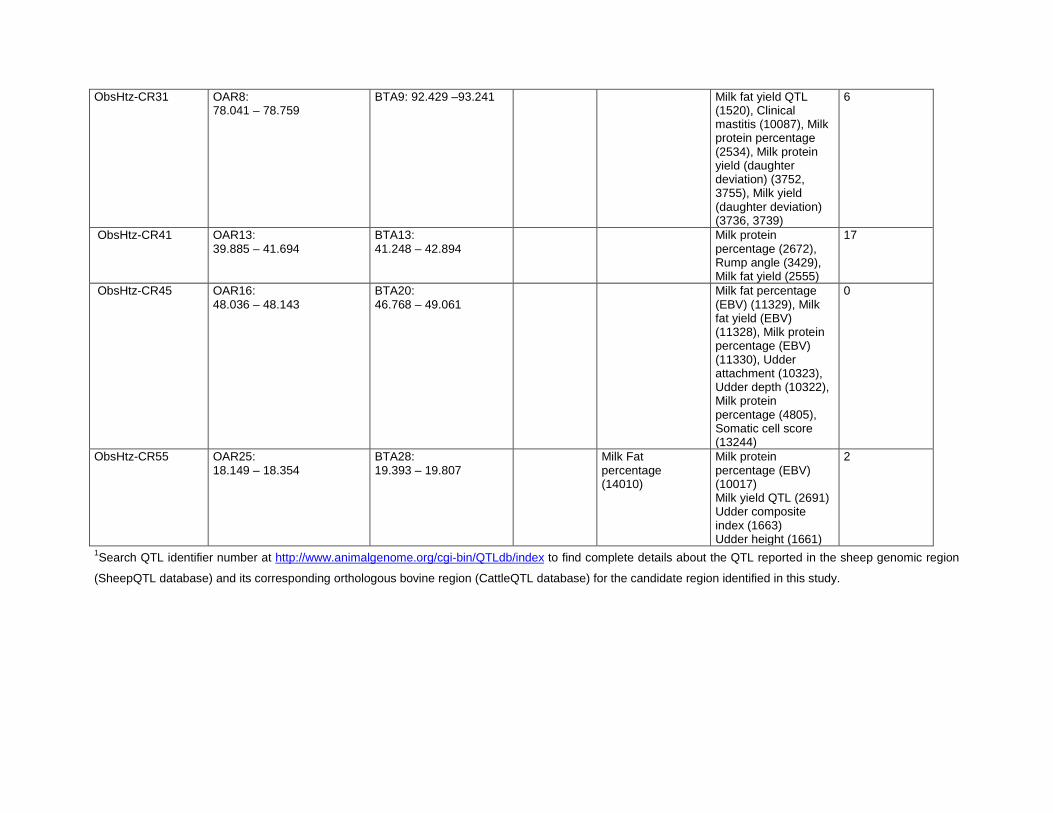
ObsHtz-CR31 OAR8: 78.041 – 78.759
BTA9: 92.429 –93.241 Milk fat yield QTL (1520), Clinical mastitis (10087), Milk protein percentage (2534), Milk protein yield (daughter deviation) (3752, 3755), Milk yield (daughter deviation) (3736, 3739)
6
ObsHtz-CR41 OAR13: 39.885 – 41.694
BTA13: 41.248 – 42.894
Milk protein percentage (2672), Rump angle (3429), Milk fat yield (2555)
17
ObsHtz-CR45 OAR16: 48.036 – 48.143
BTA20: 46.768 – 49.061
Milk fat percentage (EBV) (11329), Milk fat yield (EBV) (11328), Milk protein percentage (EBV) (11330), Udder attachment (10323), Udder depth (10322), Milk protein percentage (4805), Somatic cell score (13244)
0
ObsHtz-CR55 OAR25: 18.149 – 18.354
BTA28: 19.393 – 19.807
Milk Fat percentage (14010)
Milk protein percentage (EBV) (10017) Milk yield QTL (2691) Udder composite index (1663) Udder height (1661)
2
1Search QTL identifier number at http://www.animalgenome.org/cgi-bin/QTLdb/index to find complete details about the QTL reported in the sheep genomic region
(SheepQTL database) and its corresponding orthologous bovine region (CattleQTL database) for the candidate region identified in this study.
Related Documents