Instructions for use Title Development of non-thermal microbial inactivation techniques : application of ohmic heating and irradiation of UVC by light-emitting diode Author(s) 村下, 卓 Citation 北海道大学. 博士(農学) 甲第13145号 Issue Date 2018-03-22 DOI 10.14943/doctoral.k13145 Doc URL http://hdl.handle.net/2115/70191 Type theses (doctoral) File Information Suguru_Murashita.pdf Hokkaido University Collection of Scholarly and Academic Papers : HUSCAP

Welcome message from author
This document is posted to help you gain knowledge. Please leave a comment to let me know what you think about it! Share it to your friends and learn new things together.
Transcript
Instructions for use
Title Development of non-thermal microbial inactivation techniques : application of ohmic heating and irradiation of UVCby light-emitting diode
Author(s) 村下, 卓
Citation 北海道大学. 博士(農学) 甲第13145号
Issue Date 2018-03-22
DOI 10.14943/doctoral.k13145
Doc URL http://hdl.handle.net/2115/70191
Type theses (doctoral)
File Information Suguru_Murashita.pdf
Hokkaido University Collection of Scholarly and Academic Papers : HUSCAP

Development of non-thermal microbial inactivation
techniques: application of ohmic
heating and irradiation of UVC by light-emitting
diode
(非熱的殺菌技術の開発:
通電加熱と発光ダイオードによる UVC照射)
Hokkaido University
Graduate School of Agriculture
Division of Biosystems Sustainability
Doctor Course
Suguru Murashita

Acknowledgements
i
Acknowledgements
I would like to grab this opportunity to extend my gratitude to all the people who guided
and encouraged me during the completion of this project. Foremost I want to thank, Prof.
Shigenobu KOSEKI, my major supervisor, who always encouraged me to focus and achieve
the goal with his valuable help throughout the completion of my dissertation. I am equally
thankful to Prof. Dr. Shuso KWAMURA, Prof. Kazunori IWAMUCHI, and my committee
member, who was always there to help me with his valuable advice, support and encouraged
me, and support.
The financial support from the Mitsubishi UFJ trust scholarship foundation is gratefully
acknowledged.
Finally, my warmest thanks go my family members. Without your help, I wouldn’t have
been here
Table of contents
ii
Table of Contents
Page
Acknowledgements ·························································································· i
Table of Contents ···························································································· · ii
List of Tables ···································································································· iii
List of Figures ·································································································· iv
Chapter 1 General introduction ·································································································
1
1.1. Microbial inactivation techniques in food processing ··························································· 1
1.2. Non-thermal effect in novel thermal processing technologies ·············································· 2
1.2.1. Ohmic heating ····················································································································· 3
1.2.2. Microwave heating ············································································································ · 4
1.2.3. Ultrasounds ·························································································································· 5
1.3. Non-thermal effect in emerging non-thermal food processing ············································· 6
1.3.1. High hydrostatic pressure processing (HHP) ································································· 7
1.3.2. Pulsed electric fields (PEF) ························································································· ······ 8
1.3.3. Ultra violet (UV) irradiation ····························································································· 9
1.4. Objectives of this study ·············································································································· 10
Chapter 2 Effects of Ohmic Heating on Thermal Inactivation of Bacterial Spores ···· 11
2.1. Introduction ································································································································· 11
2.2. Materials and methods ··············································································································· 13
2.2.1. Bacterial strains ················································································································· 13
2.2.2. Preparation of spore suspension ····················································································· 13
2.2.3. Ohmic heating (OH) treatment ······················································································· 14
2.2.4. Conventional external heating (CH) treatment ···························································· 15
2.2.5. Microbiological analysis ••••••••••••••••••••••••••••••••••••••••••••••••••••••••••••••••••••••••••••••••••••••••••• 16

Table of contents
ii
2.2.6. Survival kinetics analysis •••••••••••••••••••••••••••••••••••••••••••••••••••••••••••••••••••••••••••••••••••••••••• 16
2.3. Results ····························································································································· ············· 18
2.4. Discussion ···················································································· ················································ 24
Chapter 3 Inactivation of bacteria in water and ice using an ultra violet C light-emitting
diode ·········································································································· ···········································
27
3.1. Introduction ································································································································· 27
3.2. Materials and methods ··············································································································· 30
3.2.1. Bacterial strains ················································································································· 30
3.2.2. Sample preparation ··········································································································· 30
3.2.3. Experimental apparatus ··································································································· 31
3.2.4. Distilled water-inactivation experiment by UVC ························································ 32
3.2.5. Ice-inactivation experiment by UVC ············································································ 32
3.2.6. Microbiological analysis ································································································· 32
3.2.7. Statistical analysis ························································································· ··················· 33
3.3. Results ····························································································································· ············· 34
3.3.1. Performance of the UVC-LED ······················································································· 34
3.3.2. Inactivation of E. coli and pathogens in distilled water by UVC irradiation ·········· 36
3.3.3. Inactivation of E. coli and other pathogens in ice by UVC irradiation ···················· 39
3.4. Discussion ••••••••••••••••••••••••••••••••••••••••••••••••••••••••••••••••••••••••••••••••••••••••••••••••••••••••••••••••••••••••••• 42
Chapter 4 Maximize the characteristics of UVC-LED light-emitting diode for hygienic
ice production ····································································································································
47
4.1. Introduction ································································································································· 47
4.2. Materials and methods ··············································································································· 49
4.2.1. Bacterial strains ················································································································· 49
4.2.2. Sample preparation ··········································································································· 50
4.2.3. Experimental apparatus ··································································································· 50
Table of contents
ii
4.2.4. Effect of multiple UVC-LEDs and multiple irradiation directions on bacterial
inactivation in ice ······························································································································· 53
4.2.5. UVC irradiation by bench-scale test UVC-LED apparatus ······································· 53
4.2.6 Microbiological analysis ·································································································· 53
4.2.7. Statistical analysis ············································································································ 54
4.3. Result ············································································································································ 54
4.3.1. Effect of UV intensity on bacterial inactivation in ice by using different numbers of
UVC-LEDs from same direction ····································································································· 54
4.3.2. Effect of UVC irradiation from different directions on bacterial inactivation in ice 56
4.3.3. Performance of bench-scale UVC-LEDs test apparatus for ice •••••••••••••••••••••••••••••• 64
4.4. Discussion ••••••••••••••••••••••••••••••••••••••••••••••••••••••••••••••••••••••••••••••••••••••••••••••••••••••••••••••••••••••••••• 65
Chapter 5 Disinfection of raw vegetable using ultra violet C light-emitting diode ····· 68
5.1. Introduction ································································································································· 68
5.2. Materials and methods ································································· ·············································· 70
5.2.1. Bacterial strains ················································································································· 70
5.2.2. Sample preparation ··········································································································· 70
5.2.3. UVC irradiation treatment ······························································································ 71
5.2.4. Firmness and color measurement ··················································································· 71
5.3. Results and discussion ··············································································································· 72
Chapter 6 Summary ·····················································································································
77
References ···························································································································· ··············
80

List of Tables
iii
List of Tables
Table
Page
2-1 Survival kinetics parameters for B. subtilis spore inactivation at 101°C in sodium chloride
aqueous solution with or without ohmic heating at different electric fields and frequencies. ··
·········································································21
3-1 UV sensitivity of E. coli ATCC 25922 in distilled water for UVC-LED and low-pressure
UV lamp. ································································39
List of Figures
iv
List of Figures
Figure
Page
2-1. Schematic diagram of the experimental ohmic heating apparatus. ·················15
2-2. Temperature history (a) and applied electric field history (b) for solutions with various
concentrations of sodium chloride solution during ohmic heating. ····················19
2-3. Survival kinetics of Bacillus subtilis in a sodium chloride solution (0.05 (○), 0.2 (◇), 0.6
(□) %). The results are presented as means from triplicate experiments, and the error bars
indicate standard errors. Means with different letters are significantly different (P < 0.05). ··
·········································································20
2-4. Survival kinetics of Bacillus subtilis in a sodium chloride solution treated by conventional
external heating (□) at 101°C and ohmic heating at 5 V/cm (◇), 10 V/cm (△), and 20 V/cm
(○) at 101°C and at 20 kHz. The results are presented as means from triplicate experiments,
and the error bars indicate standard errors. Means with different letters are significantly
different (P < 0.05). ························································22
2-5. Survival kinetics for B. subtilis in a sodium chloride solution treated by conventional
external heating (■) at 101°C and ohmic heating at 20 V/cm with 20 kHz (◇), 40 kHz (△),
and 60 kHz (●) at 101°C. The results are presented as means from triplicate experiments,
and error bars indicate standard errors. Means with different letters are significantly different
(P < 0.05). ·······························································23
3-1. Changes in the intensity of UVC-LED depending on the distance between UVC-LED and
the objective. ·····························································35
3-2. The intensity of UVC-LED when the distance and temperature changes. 2 cm (○), 6 cm

List of Figures
iv
(△), and 10cm (□) at room temperature and 2 cm (●), 6 cm (▲), and 10cm (■) at –30°C.
·········································································36
3-3. Changes in the survival ratio of E. coli ATCC 25922 in distilled water irradiated by UVC-
LED at each UV intensities of 0.085 mW/cm2 (○), 0.025 mW/cm2 (△), 0.013 mW/cm2 (□),
0.007 mW/cm2 (◇), and 0.005 mW/cm2 (☓), and irradiated by a UV lamp (●) at a UV
intensity of 0.025 mW/cm2 at room temperature. ·································38
3-4. The reduction of E. coli ATCC 25922 on the ice at different UV intensities of 0.085
mW/cm2 (○), 0.025 mW/cm2 (△), 0.013 mW/cm2 (□), 0.007 mW/cm2 (◇), and 0.005
mW/cm2 (☓) at –30°C. ·····················································40
3-5. Comparison of the inactivation effects of E. coli ATCC 25922 in ice between UVC-LED
(○) and a conventional UV lamp at a UV intensity 0.025 mW/cm2 (△) at –30°C. ·······
·········································································41
3-6. Comparison of the inactivation effects of E. coli O157:H7 (○), S. Typhimurium (△), and
L. monocytogenes (□) in ice by UV irradiation using UVC-LED at a UV intensity of 0.085
mW/cm2 at –30°C. ·······················································42
4-1. A schematic diagram of installation of multiple UVC-LEDs. (a): using one UVC-LED,
(b): using two UVC-LEDs from same or different directions, (c): using three UVC-LEDs from
same and different directions. ················································51
4-2. A schematic diagram of the bench-scale test UVC apparatus. (a) upper side, (b) and sides,
(c) inside of the apparatus. ···················································52
4-3. The changes in the viable bacterial cell counts during UVC irradiation by one LED (○),
two LEDs (△), and three LEDs (□) placed above ice (6cm) from the same direction. Each
UVC-LED has UV intensity of 0.013–0.015 mW/cm2. (a) E. coli O157:H7, (b) S. Typhimurium,
(c) L. monocytogenes. ······················································56
4-4. The changes in the viable cell counts in ice during UVC irradiation at -30˚C by using two
UVC-LEDs from same (○) or different directions (△). Each UVC-LED has UV intensity of
0.013–0.015 mW/cm2. The error bars represent mean values with standard deviation (n = 3).
List of Figures
iv
Values with different letter means statistical significant difference. (a) E. coli O157:H7, (b) S.
Typhimurium, (c) L. monocytogenes. ··········································60
4-5. The changes in the viable bacterial cell counts in ice during UVC irradiation at -30˚C by
using three UVC-LED from the same (○) and different (△) directions. Each UVC-LED has
UV intensity of 0.013–0.015 mW/cm2.The error bars represent mean values with standard
deviation (n = 3). Values with different letter means statistical significant difference. (a) E. coli
O157:H7, (b) S. Typhimurium, (c) L. monocytogenes. ·····························63
Fig. 4-6. The changes in the viable cell counts of E. coli O157:H7 (○), S. Typhimurium (△),
L. monocytogenes (□) in ice during UVC irradiation at -30°C by using a bench-scale test
UVC-LED apparatus that has eight UVC-LEDs placed on different directions. Estimated UV
intensity was 0.119 mW/cm2. The error bars represent mean values with standard deviation (n
= 3). Values with different letter means statistical significant difference. ·················
·········································································64
5-1. Number of food poisoning accidents in Japan. ································69
5-2. The source of food poisoning in Japan (2016). ································70
5-3. The changes in the viable bacterial cell counts on lettuce (○) and cherry tomato (△) by
UVC-LED at 0.013 mW/cm2. The error bars represent mean values with standard deviation (n
= 3). ····································································73
5-4. The changes of firmness of cherry tomato (a) and lettuce (b) by UVC-LED at 0.013
mW/cm2. The error bars represent mean values with standard deviation (n = 5). ········75
5-5. The changes of firmness of cherry tomato (a) and lettuce (b) by UVC-LED at 0.013
mW/cm2. The error bars represent mean values with standard deviation (n = 3). ········76

Chapter 1 General introduction
1
Chapter 1
General Introduction
1.1. Microbial inactivation techniques in food processing
The most important aspect in microbial inactivation is to secure food safety by reducing
the number of spoilage bacteria and also eliminating pathogenic bacteria in foods. However,
microbial inactivation has to be managed to balance securing food safety and minimizing
degradation of food quality. The most common technique for microbial inactivation is presently
thermal processing. Food products are normally processed at high temperature for ensuring
microbiological food safety. However, excessive higher thermal treatment with high pressure
causes thermal deterioration of the food materials such as change in flavor, texture, taste, and
nutrient composition. In addition, conventional thermal processing that usually conducts by
external heating could cause thermal damage on foods by overheating. Because the time for
sufficient heat transfer into the center of food is normally required for long time in a real
processing scale, thermal damage is inevitable (Pereira, 2009). Thus, minimally thermal
processing technique and/or non-thermal processing technique will play a key role in
preventing thermal deterioration or processed foods.
Recently, electromagnetic technologies in food processing have emerged to replace the
traditional conventional thermal processesing (Vicente and Castro, 2007). Electromagnetic
technologies in food processing could shorten heating time and/or reduce heating temperature.
Internal heating produres including ohmic heating and microwave heating are promising
Chapter 1 General introduction
2
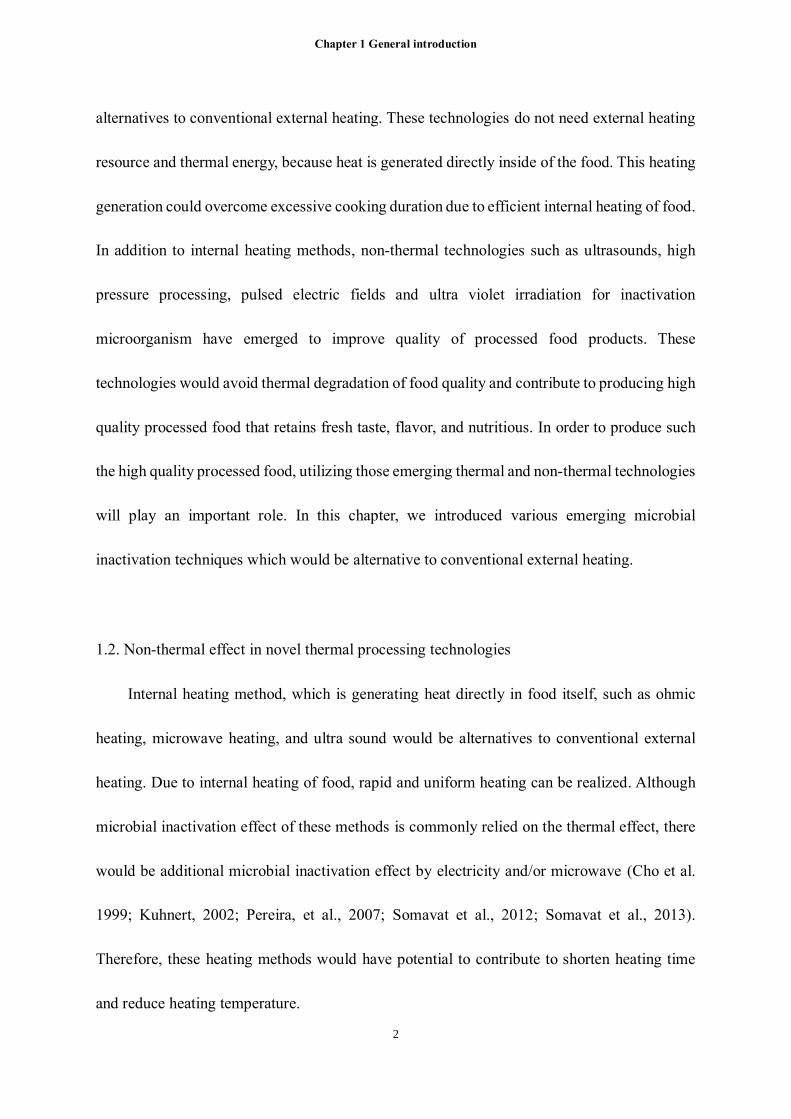
alternatives to conventional external heating. These technologies do not need external heating
resource and thermal energy, because heat is generated directly inside of the food. This heating
generation could overcome excessive cooking duration due to efficient internal heating of food.
In addition to internal heating methods, non-thermal technologies such as ultrasounds, high
pressure processing, pulsed electric fields and ultra violet irradiation for inactivation
microorganism have emerged to improve quality of processed food products. These
technologies would avoid thermal degradation of food quality and contribute to producing high
quality processed food that retains fresh taste, flavor, and nutritious. In order to produce such
the high quality processed food, utilizing those emerging thermal and non-thermal technologies
will play an important role. In this chapter, we introduced various emerging microbial
inactivation techniques which would be alternative to conventional external heating.
1.2. Non-thermal effect in novel thermal processing technologies
Internal heating method, which is generating heat directly in food itself, such as ohmic
heating, microwave heating, and ultra sound would be alternatives to conventional external
heating. Due to internal heating of food, rapid and uniform heating can be realized. Although
microbial inactivation effect of these methods is commonly relied on the thermal effect, there
would be additional microbial inactivation effect by electricity and/or microwave (Cho et al.
1999; Kuhnert, 2002; Pereira, et al., 2007; Somavat et al., 2012; Somavat et al., 2013).
Therefore, these heating methods would have potential to contribute to shorten heating time
and reduce heating temperature.

Chapter 1 General introduction
3
1.2.1. Ohmic heating
Ohmic heating is the process of passing alternating electrical current (AC) through food
products such as liquid and liquid-particulate food system. Heat is generated and distributed
internally in the foods when an electrical current is passed through a food due to the electrical
resistance of the food. The defining characteristics of ohmic heating are the frequency and
waveforms of the electric field, and the presence of electrodes that contact the material. The
most important factor is the electrical conductivity of the product and its temperature
dependence (Sarang, 2008). A major advantage claimed for ohmic heating is its ability to heat
materials rapidly and uniformly, including products containing particulates, resulting in less
thermal damage to the product in comparison to conventional heating (Pereira, 2007). In ohmic
heating, the principal mechanisms of microbial inactivation are supposed to thermal in nature.
However, Ohmic heating is expected to inactivate bacteria not only by thermal effects, but also
by non-thermal effects via electricity (Cho et al., 1999; Pereira et al., 2007; Baysal and Ichier,
2010; Somavat et. al., 2013; Park et al., 2013). Park et al. (2013) compared the inactivation
effect of ohmic heating on E. coli O157:H7, S. Typhimurium, and L. monocytogenes in peptone
water and apple juice with those of conventional external heating. They found that the electric
effect of ohmic heating was a very important factor for reducing process times and
temperatures by enhancing levels of inactivation of these bacteria. Pereira et al. (2007)
compered the effect of both techniques on E. coli in goat milk and Bacillus licheniformis in
cloudberry jam. They found that ohmic heating could shorten D-values of E. coli and B.
licheniformis and Z-value of E. coli. On the other hand, Z-value of B. licheniformis was not
Chapter 1 General introduction
4
significantly different. Cho et al. (1999) concluded that spore inactivation during ohmic heating
was primarily due to the thermal effect but there was an additional killing effect caused by the
electric current.
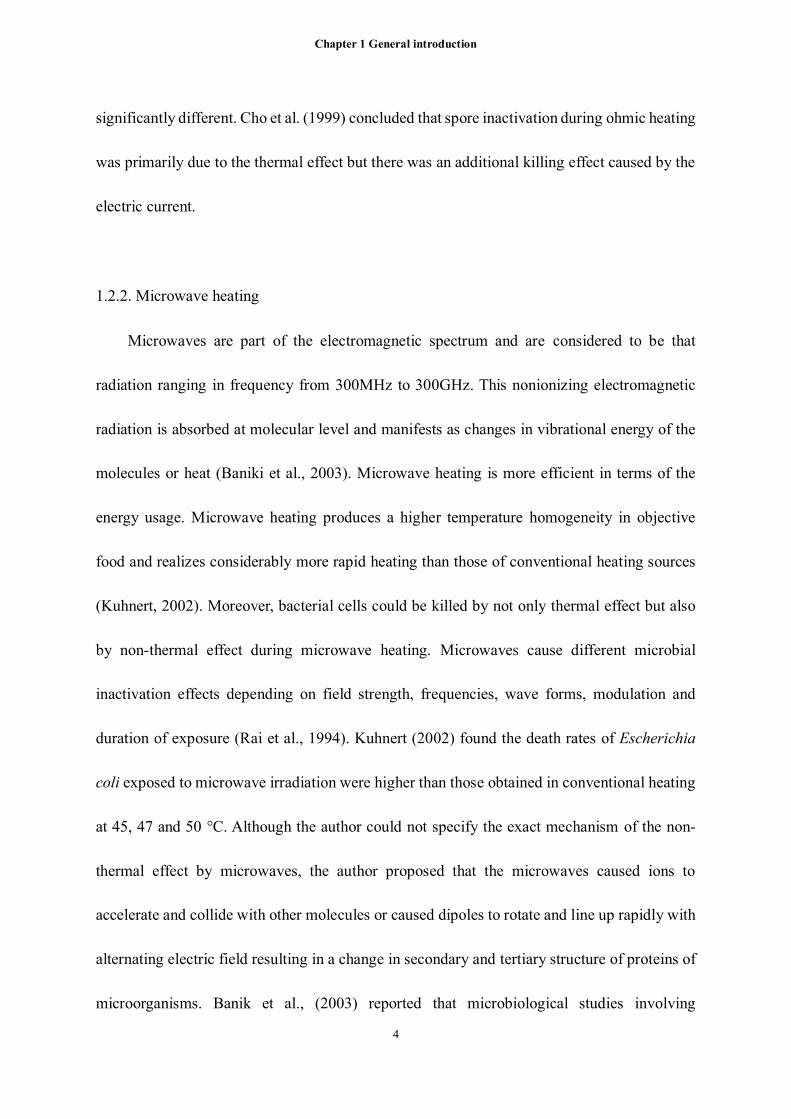
1.2.2. Microwave heating
Microwaves are part of the electromagnetic spectrum and are considered to be that
radiation ranging in frequency from 300MHz to 300GHz. This nonionizing electromagnetic
radiation is absorbed at molecular level and manifests as changes in vibrational energy of the
molecules or heat (Baniki et al., 2003). Microwave heating is more efficient in terms of the
energy usage. Microwave heating produces a higher temperature homogeneity in objective
food and realizes considerably more rapid heating than those of conventional heating sources
(Kuhnert, 2002). Moreover, bacterial cells could be killed by not only thermal effect but also
by non-thermal effect during microwave heating. Microwaves cause different microbial
inactivation effects depending on field strength, frequencies, wave forms, modulation and
duration of exposure (Rai et al., 1994). Kuhnert (2002) found the death rates of Escherichia
coli exposed to microwave irradiation were higher than those obtained in conventional heating
at 45, 47 and 50 °C. Although the author could not specify the exact mechanism of the non-
thermal effect by microwaves, the author proposed that the microwaves caused ions to
accelerate and collide with other molecules or caused dipoles to rotate and line up rapidly with
alternating electric field resulting in a change in secondary and tertiary structure of proteins of
microorganisms. Banik et al., (2003) reported that microbiological studies involving
Chapter 1 General introduction
5
microwave irradiation have resulted in the following two conflicting conclusions; cell death
was solely the result of heat produced by microwave irradiation; death was due to not only heat
but also microwave electric field.
1.2.3. Ultrasounds
Ultrasonic waves (0.1–20 MHz) have emerged in recent years in food processing due to
their ability to influence the physical or microbiological properties of food. Ultrasonic waves
propagating in a liquid medium causes cavitation, which has been attributed to the main
mechanism for cell disruption (Sala et al., 1995). This lethal effect would be due to the extreme
pressure variations caused by implosions or bubble collapse. Implosion also releases localized
high temperatures or hot spots. Therefore, ultrasonic is considered both a thermal and a non-
thermal treatment by effect of its mechanism of action (Feng and Yang, 2010). Although
microorganisms can withstand high pressures, they are incapable of withstanding quick
alternating pressures produced during cavitation. While ultrasound could inactivate vegetative
bacterial cells, insignificant reduction of bacterial spores has been reported even with an
extended ultra sound treatment (Guan and Hoover, 2005). While Ultrasound can be used in the
product sanitization process to improve the efficacy of the washing process (Guan and Hoover,
2005). Ultrasonic waves are effective in inactivating vegetative microbial cells, especially
when used in conjunction with other treatments including heat, pH modification, and
chlorination. Seymour (2002) demonstrated that ultrasound combined with chlorinated water
reduced the population of Salmonella Typhimurium on iceberg lettuce by 1.7 log cycles

Chapter 1 General introduction
6
compared to 0.7 log cycle reduction by ultrasonic alone. Several researchers have observed an
enhancement in the nutritional value of ultrasonicated foods while others have shown a
reduction after sonication and the loss was exacerbated during subsequent storage (Banerjee et
al., 1996; Portenlanger and Heusinger,1992; Silver, 2007).
1.3. Non-thermal effect in emerging non-thermal food processing
Non-thermal technologies for inactivating microorganisms have been developed in the
world because the demand of fresh and natural food products was increased. There is a great
need for a non-thermal method for inactivating microorganisms that is economical, compact,
energy efficient, safe, and socially and environmentally acceptable and does not adversely
affect nutrition, texture, and flavor of the treated foods. The following sections detail non-
thermal food processing techniques that have been recently commercialized or are close to
being commercialized.
1.3.1. High hydrostatic pressure processing (HHP)
HHP is an emerging non-thermal food processing technology whereby foods are subjected
to high hydrostatic pressure, generally in the range of 100-1000 MPa, at or around room
temperature. The application of HHP on foodstuffs is currently a subject of major interest for
both food preservation and food preparation once it inactivates vegetative microorganisms by
using pressure rather than heat to achieve pasteurization (Rendueles et al., 2011).
Microorganisms related to food such as vegetative bacteria, human infectious viruses, fungi,

Chapter 1 General introduction
7
protozoa and parasites could be significantly reduced when subjected to high pressure
(Patterson, 2005; Vanlint et al., 2012; Whitney et al., 2007). HHP contributes to extending the
shelf-life of processed foods and reduction of numbers of pathogenic bacteria while retaining
the food’s inherent color, flavor, nutrients and texture (Farkas and Hoover, 2000; San Martin
et al., 2002). The application of HHP has been explored by numerous food research institutions
as well as the food industries with the goal of enhancing the safety, quality, nutritional, and
functional properties of a wide variety of foods with minimal deleterious effects on their
nutritional and organoleptic characteristics (Jung et al., 2011; Tewari, 2007). The mechanism
of microbial control and inactivation is supposed to be a combination of processes such as the
breakdown of non-covalent bonds in large macromolecules, biochemical effects, effects on the
genetic mechanisms of cells, morphological changes and the disruption and permeabilization
of the cell membrane (Patterson et al., 2005; Considine et al., 2008).
1.3.2. Pulsed electric fields (PEF)
PEF processing involves the application of high-voltage pulses to foods located between
a series of electrode pairs. The electrical fields (generally at 20–80 kV/cm) are achieved
through capacitors that store electrical energy from direct current power supplies (Guan and
Hoover, 2005). When a short electric pulse (1–100 μsec) was applied to food, there was a
pronounced lethal effect on microorganisms (Ohlsson and Bengtsson, 2002). The precise
mechanisms by which the microorganisms are destroyed by electric fields are not fully
understood although it is considered thought that cell inactivation occurs by several

Chapter 1 General introduction
8
mechanisms, including the formation of pores in cell membranes (Toepfl et al., 2007),
formation of electrolytic products or highly reactive free radicals, oxidation and reduction
reactions within the cell structure that disrupt metabolic processes, disruption of internal
organelles and structural changes (Barbosa-Canovas et al., 1999), and production of heat
produced by transformation of induced electrical energy. The antimicrobial efficacy of the PEF
process varies as a function of numerous processing parameters, including the electric field
strength, number of pulses, pulse duration, pulse shape, processing temperature, and
physiological state of the bacteria. Other factors that also influence the degree of inactivation
include the temperature of the food, pH, ionic strength, and electrical conductivity (Vega-
Mercado et al., 1999). Several reports have presented the promising PEF- induced inactivation
of microorganisms on food matrices (Cserhalm et al, 2011; Ou et al., 2017; Sotelo et al., 2018).
PEF research has mostly focused on the inactivation of microorganisms suspended in various
pumpable non-particulate foods with free flowing characteristics including fruit juices, liquid
eggs, milk, and pea soup (Vega-Mercado et al., 1999).
1.3.3. Ultra violet (UV) irradiation
UV is one of the range of electromagnetic wave. The UV spectrum is customarily divided
into three regions: UV-A with a wavelength of 320–400 nm, UV-B with a wavelength of 280–
320 nm, and UV-C with a wavelength of 200–280 nm (Clydesdale et al., 2001; Sharma, 2010).
UV-C possesses germicidal properties, for example, UV-C irradiation at a dose rate of 1000
J/m2 or more, exhibitas as much as 4-log reductions of bacteria, yeasts, and viruses (Neetoo
Chapter 1 General introduction
9
and Chen, 2014). The mechanism of inactivation and cell death is considered absorption of UV
by DNA and RNA (Sharma, 2010). The effect of UV on microorganisms depends on a
multitude of factors (Sharma, 2010). For example, the range of wavelengths used to irradiate
the cells, treatment time, treatment intensity, and target species will affect the lethality of the
process (Sharma, 2010). UV radiation may denature proteins, enzymes, and aromatic amino
acids, leading to changes in the composition of the food (Neetoo and Chen, 2014). The
application of UV light has been used in three areas: air disinfection, liquid sterilization and
inhibition of microorganisms in surface (Bintsis et al., 2000). One of the main limitations of
UV is its low penetration (Falguera et al., 2011). The presence of dissolved organic solutes and
compounds in liquid foods leads to strong UV attenuation effect (Falguera et al., 2011). In
addition, the main source of UVC has been UV lamp which contains mercury and fragile lamp.
Furthermore, UV irradiation can change the flavor profile in certain products (Neetoo and Chen,
2014). UV light not only causes several undesirable chemical reactions, but can bring about
deterioration in product quality. The use of UV in food industry has been limited because of
these reasons. We need to overcome these negative aspects of UV irradiation in the practical
use although UV irradiation can non-thermally and efficiently inactivate bacteria.
Chapter 1 General introduction
10
1.4. Objectives of this study
The novel thermal and non-thermal technologies mentioned above would be able to
contribute to produce high quality processed foods through inactivating microorganism by non-
thermal effect. In the present study, we focused on ohmic heating as an alternative thermal
treatment, and focused on UV-C irradiation as a promising non-thermal treatment. In particular,
we focused on UV-C light emitting diode (UVC-LED) as a new UV source and investigated
the usage of UVC-LED for non-thermal treatment.
Accordingly, objective of this study was evaluation of microbial inactivation effect by
non-thermal energy for minimizing deterioration of the food by heat. In chapter 2, we
investigated the non-thermal effects of Ohmic heating on the inactivation of bacterial spores
and evaluated the effects of the magnitude of the electric fields and electric frequency. We
evaluated the effect of electricity on bacterial spores by comparing inactivation effect of ohmic
heating with that of conventional external heating at the same heating temperature. From
chapter 3 to chapter 5, we evaluated the performance of UVC-LED by investigating the effect
of distance between UVC-LED and irradiated material and the effect of temperature on UV
intensity of UVC-LED. In addition, we investigated the non-thermal effects of UVC-LED for
practical usage such as water, ice and vegetable. In particular, we aimed to develop a new value
such as inactivation of microorganism in ice and disinfection of raw food just before eating by
non-thermal energy.
Chapter 2 Effects of Ohmic Heating on Thermal Inactivation of Bacterial Spores
11
Chapter 2
Effects of Ohmic Heating on Thermal Inactivation of Bacterial Spores
2.1. Introduction
The essential goal of microbial inactivation is to secure food safety by reducing spoilage
and eliminating pathogenic bacteria. Microbial inactivation is simultaneously required to
secure food safety and maintain food quality. Thermal processing is the most common
technology for microbial inactivation. However, high-temperature treatments induce the
deterioration of food, resulting in changes in flavor, taste, and texture or the loss of nutrients.
To overcome the limitations of thermal processing, various non-thermal microbial inactivation
techniques, such as high-pressure processing and high electric field pluses, ultrasonic sonic,
have been developed. However, without heating foods excessively, most non-thermal
processing methods do not completely inactivate bacterial spores, and accordingly do not
sufficiently meet the needs of the food industry (Cserhalmi et al., 2002; Raso et al., 2006;
Evelyn and Silva, 2016).
Ohmic heating (OH) is a heating procedure in which an alternating electric current is
applied to foods. OH rapidly and uniformly heats materials (Jun and Sastry, 2005) and achieves
close to 100% energy transfer efficiency because heat is generated and distributed internally in
foods (Sastry and Salengke, 1998). OH has the potential to reduce thermal damage and retain
the quality of processed foods (Leizerson and Shimoni, 2005; Yildiz-Turp et al., 2013), unlike
conventional external heating (CH), owing to the highly efficient temperature increase.
Chapter 2 Effects of Ohmic Heating on Thermal Inactivation of Bacterial Spores
12
In addition, OH is expected to inactivate bacterial spores not only by thermal effects, but
also by non-thermal effects via electricity (Cho et al., 1999; Pereira et al., 2007, Baysal and
Icier, 2010; Somavat et al., 2012; Somavat et al., 2013). Cho et al. (1999) compared the effects
of OH and CH on Bacillus subtilis spores at various temperatures and concluded that Bacillus
subtilis spores heated in water with 0.1% NaCl at 92.3°C showed a significant reduction in the
D-value under OH treatment. However, there was no significant difference in D-values
between OH and CH at 88.0°C. Moreover, Cho et al. (1999) concluded that the z-value is not
significantly different between the two methods. Pereira et al., (2007) compared the effects of
OH with those of CH on B. licheniformis spores at various temperatures and concluded that B.
licheniformis spores heated in cloudberry jam at 70°C, 75°C, and 80°C showed a significantly
reduced D-values under OH treatment. However, there was no significant difference in D-
values between OH and CH at 90°C and the z-values for the two methods were not significantly
different. In contrast, the effect of OH was not significantly (P > 0.05) different from that of
CH on B. licheniformis spores inactivation (Tola and Ramaswamy, 2014).
Although OH is expected to have non-thermal effects on bacterial spores and contribute
to reductions in the food heating temperature and time, the results of previous studies have
been variable. Conflicting results may be explained by unstable or fluctuating electric field
stress during OH treatment. It is technically difficult to maintain a constant temperature and
apply a constant electric field simultaneously because the temperature of the heating medium
increases as a constant electric current is applied. In previous studies, the electric field has been
increased or decreased to maintain a constant the temperature (Cho et al., 1999; Pereira et al.,

Chapter 2 Effects of Ohmic Heating on Thermal Inactivation of Bacterial Spores
13
2007, Baysal and Icier, 2010; Somavat et al., 2012; Somavat et al., 2013). In the present study,
an electric field was applied constantly and continuously by maintaining the heating medium
at the boiling point. Electric field stress was constantly applied to bacterial spores using the
procedure examined in the present study. The objective of this study was to clarify the non-
thermal effects of OH on the inactivation of B. subtilis spores when a constant electric field is
applied. In addition, the effects of the magnitude of the electric fields and electric frequency
on B. subtilis spore inactivation were evaluated.
2.2. Materials and methods
2.2.1. Bacterial strains
Bacillus subtilis (NBRC13719) was used as a representative bacterial spore because
NBRC13719 has the highest thermal resistance strain among B. subtilis strains in our laboratory.
A stock culture maintained on nutrient agar (Difco, Becton-Dickinson and Company, Sparks,
MD, USA) slants at 3°C was inoculated into glucose broth (GB; 2 g of beef extract, 3g of yeast
extract, 10 g of peptone, 5 g of dextrose, 5 g of sodium chloride, and 1 liter of deionized water,
pH 7.0) and incubated at 37°C for 48 h for the activation of the bacterial cells.
2.2.2. Preparation of spore suspension
To induce the sporulation of B. subtilis cells, an aliquot of activated bacterial cells was
inoculated on a nutrient agar plate and then incubated at 37°C for 24 h. The colonies that
formed on the nutrient agar were inoculated into 25 ml of Difco Sporulation Medium (8 g of
Chapter 2 Effects of Ohmic Heating on Thermal Inactivation of Bacterial Spores
14
Bacto nutrient broth (Difco), 10 ml of KCl, 10 ml of MgSO4•7H2O, 1 M NaOH (pH to 7.6), 1
ml of Ca(NO3)2, 1 ml of MnCl2, 1 ml of FeSO4, and 1 liter of deionized water) and incubated
at 37°C for 48 h. Greater than 90% of sporulation was obtained, as verified by observations of
refractile spores under phase-contrast microscopy. The culture was centrifuged at 3000 × g for
20 min. Recovered spores were washed with distilled water 4 times with repeated
centrifugation for 10 min at 3000 × g. Between the second and third centrifugation steps, the
suspension was pasteurized at 80°C for 20 min to eliminate vegetative cells. The suspensions
were stored at 4°C until use.
2.2.3. Ohmic heating (OH) treatment
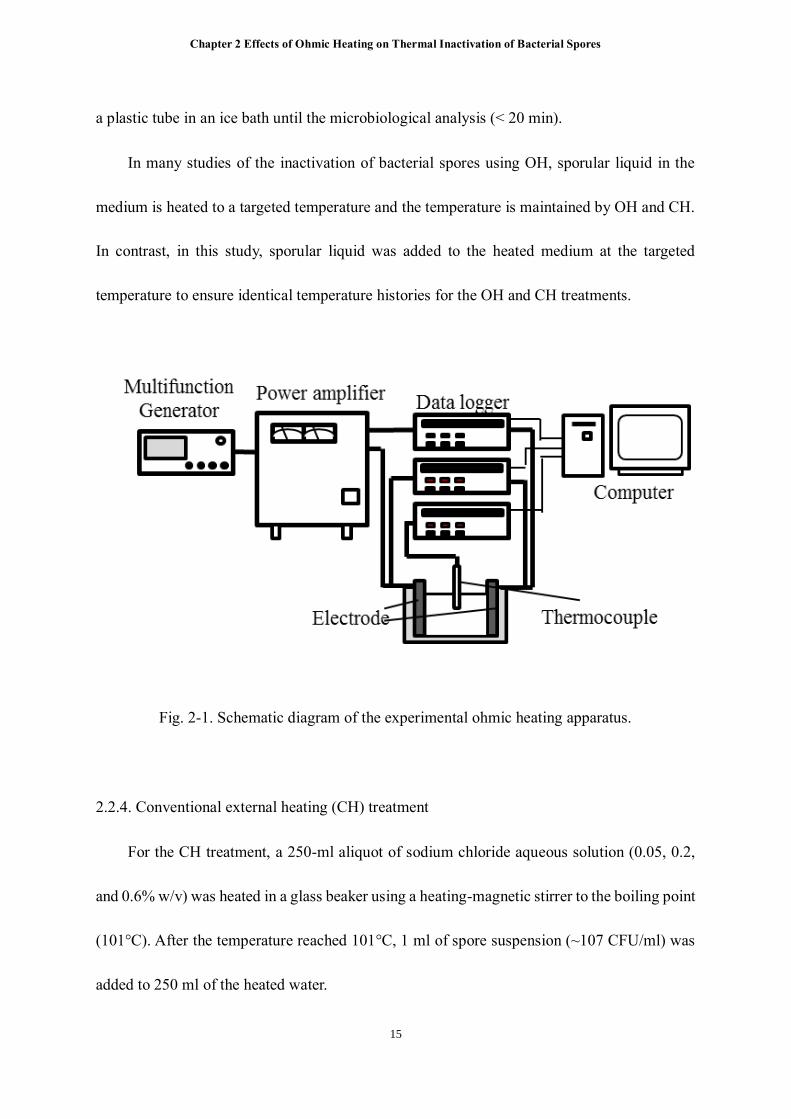
A schematic diagram depicting the OH treatments is shown in Fig. 2-1. The heating unit
consisted of titanium square electrodes (length: 110 mm, width: 110 mm, thickness: 2 mm) in
contact with the sample, a Teflon vessel (thickness: 10 mm, height: 110 mm, width: 123 mm,
depth: 55 mm), and a thermocouple (K-type) inserted at the center of the Teflon vessel with a
capacity of 300 ml. The distance between the two titanium square electrodes was 30 mm.
For the OH treatment, a 250-ml aliquot sodium chloride aqueous solution (0.05, 0.2 and
0.6% w/v) was added to the Teflon vessel and heated to the boiling point (101°C) by applying
a constant electric field. Once the desired temperature was reached in the salt water, 1 ml of
spore suspension (~107 CFU/ml) was added to 250 ml of the heating medium. The electric field
intensity (5, 10, and 20 V/cm) and the frequency (20, 40, and 60 kHz) were controlled by the
power supply. Every 2 min, a 1-ml aliquot was collected from the heating medium and kept in
Chapter 2 Effects of Ohmic Heating on Thermal Inactivation of Bacterial Spores
15
a plastic tube in an ice bath until the microbiological analysis (< 20 min).
In many studies of the inactivation of bacterial spores using OH, sporular liquid in the
medium is heated to a targeted temperature and the temperature is maintained by OH and CH.
In contrast, in this study, sporular liquid was added to the heated medium at the targeted
temperature to ensure identical temperature histories for the OH and CH treatments.
Fig. 2-1. Schematic diagram of the experimental ohmic heating apparatus.
2.2.4. Conventional external heating (CH) treatment
For the CH treatment, a 250-ml aliquot of sodium chloride aqueous solution (0.05, 0.2,
and 0.6% w/v) was heated in a glass beaker using a heating-magnetic stirrer to the boiling point
(101°C). After the temperature reached 101°C, 1 ml of spore suspension (~107 CFU/ml) was
added to 250 ml of the heated water.
Chapter 2 Effects of Ohmic Heating on Thermal Inactivation of Bacterial Spores
16
2.2.5. Microbiological analysis
To determine the number of surviving spores at each sampling point (every 2 min) during
the heat treatment, appropriate serial dilutions (1:10) were performed with sterile 0.1% peptone
water and were plated on duplicate tryptic soy agar plates. The plates were then incubated at
37°C for 24 h.
2.2.6. Survival kinetics analysis
Survival kinetics were analyzed by using the Geeraerd and Van Impe inactivation model-
fitting tool (GInaFiT; Ver. 1.6 ), a freely available add-in for Microsoft Excel (Geeraerd et al.,
2005). The Weibull model, the log-linear regression model, and the log-linear regression plus
shoulder model were used.
The Weibull model is represented by the following formula:
Log 𝑆(𝑡) = log𝑁(𝑡)
𝑁0= − (
𝑡
𝛿)
𝑝 (1)
where S (t) is the momentary survival ratio and N(t) and N0 are the momentary and initial
counts at 101°C, respectively. The initial counts (N0) were viable cell counts at the time zero.
The parameters δ and p represent the survival rate and kinetics curvature, respectively. The
parameter δ is the first time at which a ten-fold reduction in the viable cells is observed, and p
is the shape parameter.
The log-linear regression model is described by the following formula:
Log 𝑆(𝑡) = log𝑁(𝑡)
𝑁0= −
𝑘𝑚𝑎𝑥∙𝑡
ln (10) (2)
where S(t) is the momentary survival ratio and N(t) and N0 are the momentary and initial
Chapter 2 Effects of Ohmic Heating on Thermal Inactivation of Bacterial Spores
17
counts at 101°C, respectively. The parameter kmax is a first-order inactivation constant.
Therefore, the traditional decimal reduction time (D-value) can be calculated from the kmax
parameter according to the equation: D = 2.303/kmax.
The log-linear regression with shoulder model is described by the following formula:
Log 𝑆(𝑡) = log𝑁(𝑡)
𝑁0= −
𝑘𝑚𝑎𝑥∙𝑡
ln(10)+
𝑘𝑚𝑎𝑥∙𝑆𝑙
ln(10)− 𝐿𝑜𝑔(1 + 𝑒(𝑘𝑚𝑎𝑥∙𝑆𝑙) − 1) ∙ 𝑒(𝑘𝑚𝑎𝑥∙𝑡) (3)
where kmax is the first-order inactivation constant and Sl is the shoulder length. This
model describes the survival curves based on two parameters, i.e., the shoulder length (Sl),
defined as the time until exponential inactivation begins, and the inactivation rate (kmax),
defined as the slope of the exponential portion of the survival curve. Therefore, the traditional
decimal reduction time (D-value) can be calculated from the kmax parameter, as mentioned
above.
Statistical analysis. All experiments were repeated three times and each data point was
determined based on duplicate plates counts. Data from three samples subjected to each
treatment in each of three independent replicate experiments were analyzed. For the statistical
evaluation, significant differences (P < 0.05) in the survival ratio between the OH and CH
treatments at each heating time and the parameters for the model fits for OH and CH were
analyzed using the Tukey–Kramer method. The statistical analysis was conducted using the R
statistical environment (Ver.3.2.4 for Mac OS URL; http://www.R-project.org)
Chapter 2 Effects of Ohmic Heating on Thermal Inactivation of Bacterial Spores
18
2.3. Results
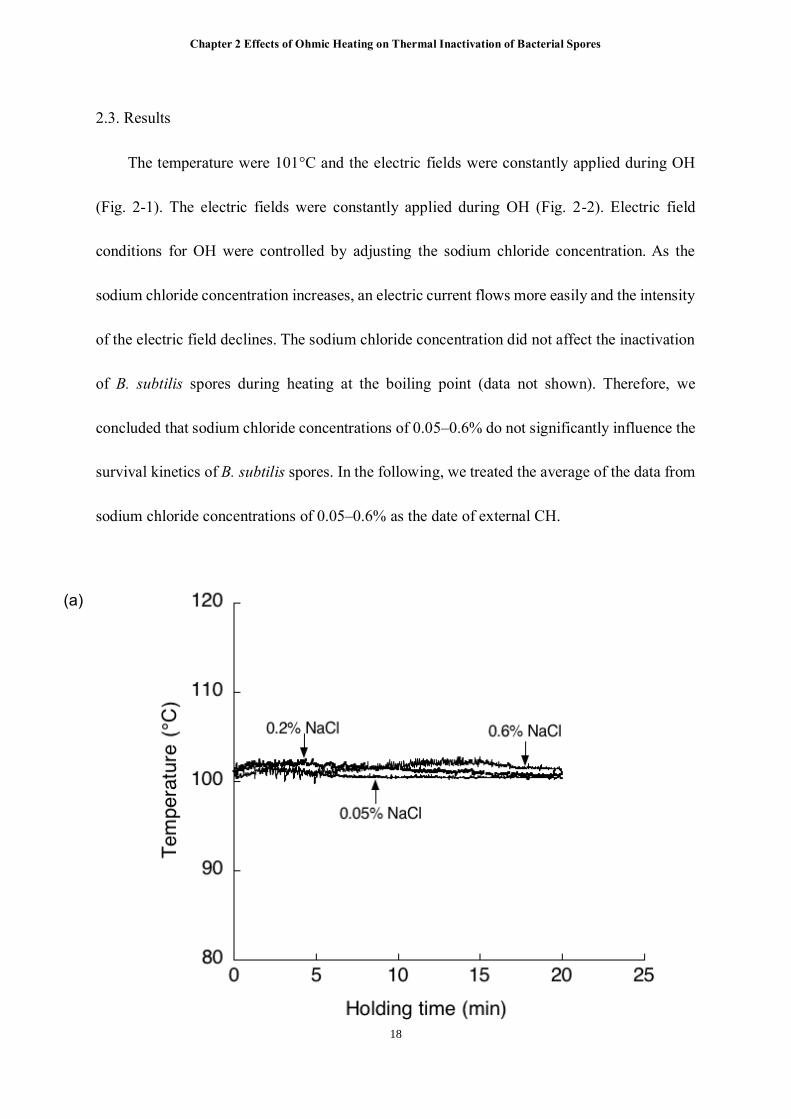
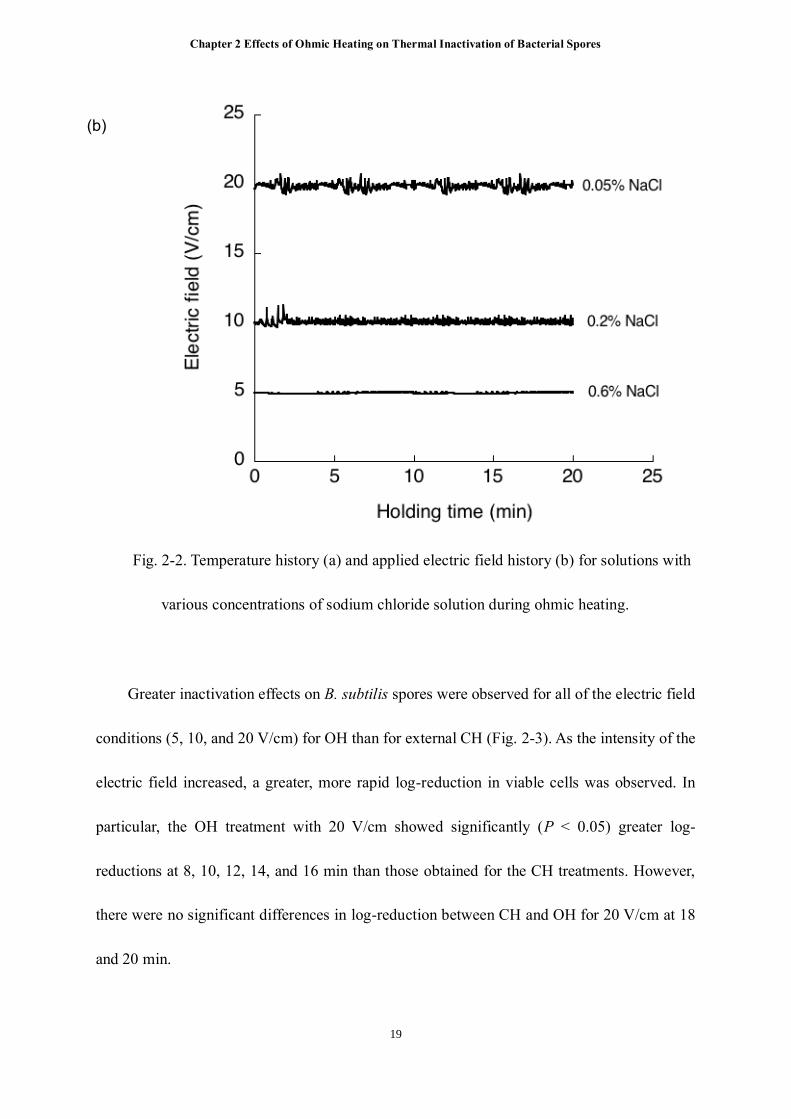
The temperature were 101°C and the electric fields were constantly applied during OH
(Fig. 2-1). The electric fields were constantly applied during OH (Fig. 2-2). Electric field
conditions for OH were controlled by adjusting the sodium chloride concentration. As the
sodium chloride concentration increases, an electric current flows more easily and the intensity
of the electric field declines. The sodium chloride concentration did not affect the inactivation
of B. subtilis spores during heating at the boiling point (data not shown). Therefore, we
concluded that sodium chloride concentrations of 0.05–0.6% do not significantly influence the
survival kinetics of B. subtilis spores. In the following, we treated the average of the data from
sodium chloride concentrations of 0.05–0.6% as the date of external CH.
(a)
Chapter 2 Effects of Ohmic Heating on Thermal Inactivation of Bacterial Spores
19
Fig. 2-2. Temperature history (a) and applied electric field history (b) for solutions with
various concentrations of sodium chloride solution during ohmic heating.
Greater inactivation effects on B. subtilis spores were observed for all of the electric field
conditions (5, 10, and 20 V/cm) for OH than for external CH (Fig. 2-3). As the intensity of the
electric field increased, a greater, more rapid log-reduction in viable cells was observed. In
particular, the OH treatment with 20 V/cm showed significantly (P < 0.05) greater log-
reductions at 8, 10, 12, 14, and 16 min than those obtained for the CH treatments. However,
there were no significant differences in log-reduction between CH and OH for 20 V/cm at 18
and 20 min.
(b)

Chapter 2 Effects of Ohmic Heating on Thermal Inactivation of Bacterial Spores
20
Fig. 2-3. Survival kinetics of Bacillus subtilis in a sodium chloride solution (0.05 (○),
0.2 (◇), 0.6 (□) %). The results are presented as means from triplicate experiments, and the
error bars indicate standard errors. Means with different letters are significantly different (P <
0.05).
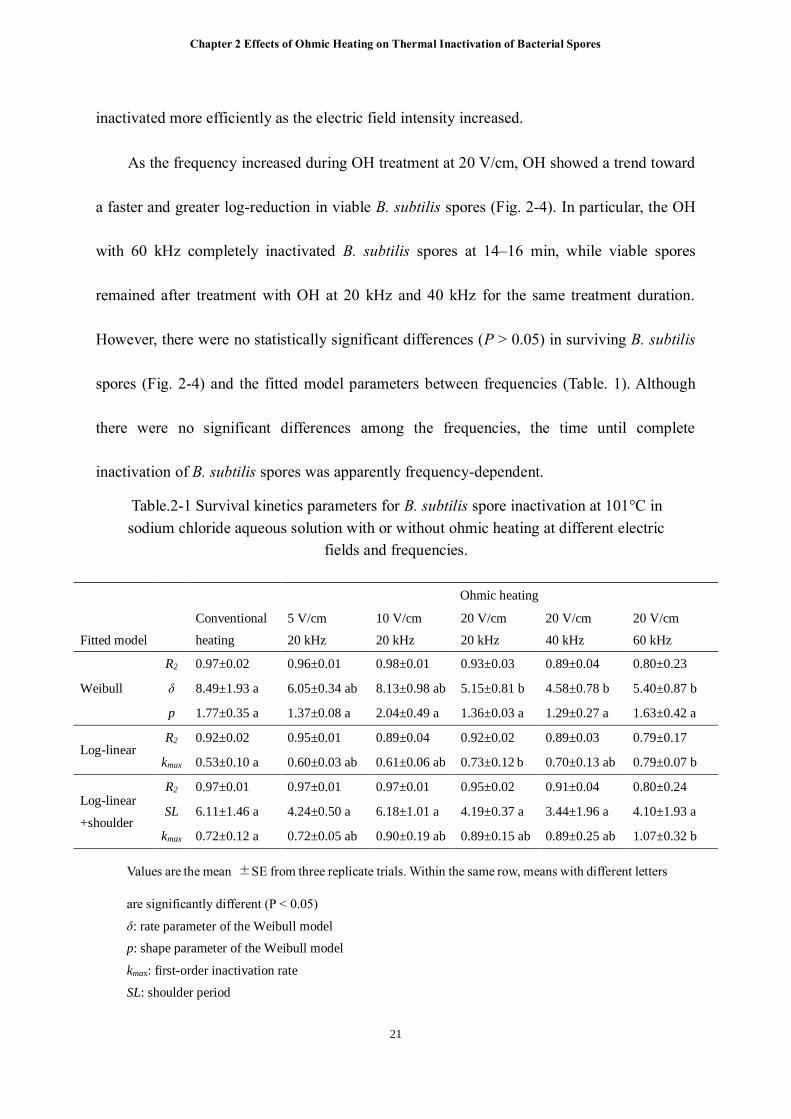
In the log-linear model, the log-linear-plus shoulder model, and the Weibull model, kmax
of OH tended to be higher and δ of OH tended to be lower than those of CH (Table. 2-1). In
the Weibull model and the log-linear model, there were significant differences (P < 0.05) in δ
and kmax between OH at 20 V/cm and CH. These results showed that B. subtilis spores were
Chapter 2 Effects of Ohmic Heating on Thermal Inactivation of Bacterial Spores
21
inactivated more efficiently as the electric field intensity increased.
As the frequency increased during OH treatment at 20 V/cm, OH showed a trend toward
a faster and greater log-reduction in viable B. subtilis spores (Fig. 2-4). In particular, the OH
with 60 kHz completely inactivated B. subtilis spores at 14–16 min, while viable spores
remained after treatment with OH at 20 kHz and 40 kHz for the same treatment duration.
However, there were no statistically significant differences (P > 0.05) in surviving B. subtilis
spores (Fig. 2-4) and the fitted model parameters between frequencies (Table. 1). Although
there were no significant differences among the frequencies, the time until complete
inactivation of B. subtilis spores was apparently frequency-dependent.
Table.2-1 Survival kinetics parameters for B. subtilis spore inactivation at 101°C in
sodium chloride aqueous solution with or without ohmic heating at different electric
fields and frequencies.
Ohmic heating
Fitted model
Conventional
heating
5 V/cm
20 kHz
10 V/cm
20 kHz
20 V/cm
20 kHz
20 V/cm
40 kHz
20 V/cm
60 kHz
Weibull
R2 0.97±0.02 0.96±0.01 0.98±0.01 0.93±0.03 0.89±0.04 0.80±0.23
δ 8.49±1.93 a 6.05±0.34 ab 8.13±0.98 ab 5.15±0.81 b 4.58±0.78 b 5.40±0.87 b
p 1.77±0.35 a 1.37±0.08 a 2.04±0.49 a 1.36±0.03 a 1.29±0.27 a 1.63±0.42 a
Log-linear R2 0.92±0.02 0.95±0.01 0.89±0.04 0.92±0.02 0.89±0.03 0.79±0.17
kmax 0.53±0.10 a 0.60±0.03 ab 0.61±0.06 ab 0.73±0.12 b 0.70±0.13 ab 0.79±0.07 b
Log-linear
+shoulder
R2 0.97±0.01 0.97±0.01 0.97±0.01 0.95±0.02 0.91±0.04 0.80±0.24
SL 6.11±1.46 a 4.24±0.50 a 6.18±1.01 a 4.19±0.37 a 3.44±1.96 a 4.10±1.93 a
kmax 0.72±0.12 a 0.72±0.05 ab 0.90±0.19 ab 0.89±0.15 ab 0.89±0.25 ab 1.07±0.32 b
Values are the mean ±SE from three replicate trials. Within the same row, means with different letters
are significantly different (P < 0.05)
δ: rate parameter of the Weibull model
p: shape parameter of the Weibull model
kmax: first-order inactivation rate
SL: shoulder period

Chapter 2 Effects of Ohmic Heating on Thermal Inactivation of Bacterial Spores
22
Fig. 2-4. Survival kinetics of Bacillus subtilis in a sodium chloride solution treated by
conventional external heating (□) at 101°C and ohmic heating at 5 V/cm (◇), 10 V/cm (△),
and 20 V/cm (○) at 101°C and at 20 kHz. The results are presented as means from triplicate
experiments, and the error bars indicate standard errors. Means with different letters are
significantly different (P < 0.05).

Chapter 2 Effects of Ohmic Heating on Thermal Inactivation of Bacterial Spores
23
Fig. 2-5. Survival kinetics for B. subtilis in a sodium chloride solution treated by
conventional external heating (■) at 101°C and ohmic heating at 20 V/cm with 20 kHz (◇),
40 kHz (△), and 60 kHz (●) at 101°C. The results are presented as means from triplicate
experiments, and error bars indicate standard errors. Means with different letters are
significantly different (P < 0.05).

Chapter 2 Effects of Ohmic Heating on Thermal Inactivation of Bacterial Spores
24
2.4. Discussion
A few studies have compared the efficiency of bacterial spores inactivation between OH
and CH. Cho et al. (1999) studied the inactivation kinetics of inactivation of B. subtilis spores
using OH and CH and reported that OH has a greater inactivation effect than CH. Moreover,
Cho et al. (1999) indicated that bacterial spore inactivation during ohmic heating is primarily
attributed to the thermal effect, but an additional killing effect occurs via the electric current.
In the present study, the electric field and frequency had additional effects because B. subtilis
was inactivated not only by OH but also by CH. B. subtilis would be damaged by heat as well
as increases in the electric field and frequency.
The additional effect of the electric field on bacteria may be primarily explained by a
related phenomenon, electroporation. High electric fields, such as pulsed electric fields (> 10
kV/cm), caused electroporation and low frequencies (usually 50–60 Hz) allow cell walls to
build up charges and form pores (USA-FDA United States of America, 2015). Park and Kang
(2013) studied the effects of electric field-induced ohmic heating on the inactivation of
Escherichia coli O157:H7, Salmonella enterica serovar Typhimurium, and Listeria
monocytogenes in buffered peptone water and apple juice at 30 V/cm and 60 V/cm. The authors
found that bacterial reduction differed significantly between OH and CH treatments. Moreover,
propidium iodide values (an index of cell membrane damage) were significantly different
between OH and CH treatments. Yoon et al. (2002) investigated the effects of OH on the
structure and permeability of the cell membrane of Saccharomyces cerevisiae. They found that
the amount of exuded protein increased significantly as the electric field increased from 10 to
Chapter 2 Effects of Ohmic Heating on Thermal Inactivation of Bacterial Spores
25
20 V/cm, while the amount of exuded protein increased when higher frequencies (600 Hz, 6
kHz, and 60 kHz) were applied. Thus, vegetative bacterial cells and yeast cells would be
damaged by higher electric fields and frequencies similar to electroporation.
However, the responses of bacterial spores to various electric fields and frequencies are
unclear. Baysal and Icier (2010) studied the effect of electric field (30, 40, and 50 V/cm) on
Alicyclobacillus acidoterrestris spores heated by OH. Baysal and Icier (2010) reported that
while there were significant differences among the electric fields at 70°C, there were no
significant differences among the electric fields at 80°C and 90°C. Somavat et al. (2012)
indicated that 10 kHz treatment results in comparatively more effective inactivation than 60
Hz for Geobacillus stearothermophilus spores. In contrast, Somavat et al. (2013) observed that
60 Hz treatments for B. coagulans spores tend to more efficiently inactivate spores than 10 kHz
treatments.
Because a constant electric field was not applied to maintain the temperature in order to
avoid over-heating in these previous studies, the effects of electric fields are expected to be
variable. In contrast, in the present study, a constant electric field was applied at the boiling
point during OH treatment and a higher electric field and frequency increased the non-thermal
effect of OH on B. subtilis. These results demonstrated that the continual application of a
certain electric field would increases non-thermal effects on bacterial spores. Moreover, the
effect of frequency on the inactivation of spores is pronounced under a constant certain electric
field.
Although the mechanism by which electric field and frequency influence bacterial spores
Chapter 2 Effects of Ohmic Heating on Thermal Inactivation of Bacterial Spores
26
is unclear, it is common for ion molecules, such as hydrogen ions, to be drawn by electric fields
and polar substances, such as water molecules, vibrate in response to electric fields. These
attractive forces and vibrations may cause the changes in cell structure or the leakage of
intercellular substances in bacterial spores. The heat resistance of bacterial spores may decline
above a certain frequency, which may explain why higher frequencies increase the non-thermal
effects of OH on B. subtilis. In the future, it is necessary to investigate the effects of electric
field and frequency on other kind of bacterial spore types by applying a contrast electric field.
In conclusion, the results of the present study indicated that non-thermal B. subtilis spore
inactivation results from OH when an electric field is constantly applied. The OH conditions
with higher electric field intensities and higher frequencies improve the efficiency of B. subtilis
spore inactivation and reduce the heating time to inactivate B. subtilis spores. Consequently,
although we will need to examine the effect of OH on food quality and/or sensory evaluation,
the OH treatment would have a potential for reducing thermal treatment time for ensuring food
safety.
Chapter 3
Inactivation of bacteria in water and ice using an ultra violet C light-emitting diode
27
Chapter 3
Inactivation of bacteria in water and ice using an ultra violet C light-
emitting diode
3.1. Introduction
Ice is widely used to cool foods, such as drinking water, seafood, and fresh produce. Ice
is mainly made by home freezers or by ice-making machines in restaurants, cafes, and ice-
making companies. Importantly, ice must be microbiologically and chemically safe because
consumers eat ice directly or eat foods that come in direct contact with ice. However, ice can
be microbially contaminated (Moore et al., 1953; Tsuno et al., 1984; Falcão, 2002; Falcão et
al., 2004; Lateef et al., 2006; Chavasit et al, 2011; Gerokomou et al., 2011; Economou et al.,
2016) and thus can cause food poisoning (Khan et al., 1994; Chavasit et al., 2011). Gerokomou
et al. (2011) investigated bacterial contamination in 100 ice samples were collected at 10
different retail points in the region of Epirus in Greece. They found the presence of Escherichia
coli and Salmonella in 15% and 4% of ice samples, respectively, ranging from 102 to 103
CFU/ml. Lateef et al. (2006) evaluated the microbiological safety of commercial ice using ice
collected from four ice manufacturing factories in Ogmonoso, Nigeria. They found that all the
samples were microbially contaminated and that the microbial load ranged from 1.88 to 3.20
× 104 CFU/ml.
Microorganisms can be contaminated in ice owing to the poor quality of source water
used, and/or a lack of hygiene during production or handling (Moore et al., 1953). Moreover,
Burnett et al. (Burnett et al., 1994) indicated that ice-making machines can be contaminated
Chapter 3
Inactivation of bacteria in water and ice using an ultra violet C light-emitting diode
28
due to seeding from the mains supply, faulty plumbing allowing backflow from the drains, and
irregular cleaning of ice machines. Once ice-making machines are contaminated, contaminated
ice will be produced until ice-making machines are cleaned.
In order to prevent food poisoning by ice, sufficiently hygienic water should be used, and
ice-making machines should be cleaned regularly. However, both of these processes require
additional work and utilize chemicals that can be problematic. Additionally, it is particularly
difficult to evaluate the safety of water and cleaning of ice-making machines, which can be
individually owned or automatic vending machines. Therefore, development of an inactivation
technique for microorganisms in ice may be the most effective approach for preventing ice
contamination. However, because such a technique must be non-thermal and nondestructive
technique, no studies have yet reported the direct microbial inactivation of ice.
Ultra violet (UV) irradiation is a common non-thermal microbial inactivation technique.
UV light covers a wavelength spectrum from 100–380 nm and is subdivided into three regions
by wavelength: UVA (320–400 nm), UVB (280–320 nm), and UVC (200–280 nm) (Song et
al., 2016). UV radiation is believed to inactivate microorganisms by acting directly on the DNA
in the cell, blocking cellular reproduction. In general, UVC radiation is believed to have high
inactivation effects because DNA mainly absorbs UV radiation from 200–300 nm with an
absorbance peak around 260 nm. UV treatment can inactivate all types of microorganisms
because UV acts directly on DNA. However, the main UV sources are mercury lamps, which
are fragile and contain toxic mercury. In contrast, UV light-emitting diodes (UV-LEDs) have
recently emerged as new source for UV irradiation. UV-LED has several advantages such as
Chapter 3
Inactivation of bacteria in water and ice using an ultra violet C light-emitting diode
29
compactness, robustness, faster start-up time, less energy consumption, longer lifetime, ability
to turn on and off with high frequency, and lack of mercury (Würtele et al., 2011). However,
few studies have evaluated the microbial inactivation effect by UV-LED. Song et al. (2016)
reviewed the effects UV dose by UV-LED on various microorganisms from published literature
and concluded there are many cases where the results are inconsistent because there has been
a lack of uniformity in research materials and methods. Different UV-LEDs have various
radiation patterns, such as emission spectra, viewing angles, and radiation distributions.
Similarly, there have been few studies comparing the effects of UV-LEDs with those of
conventional UV lamps. Bowker et al. (2011) compared the inactivation effect of a 254-nm
UV lamp with 275-nm and 255-nm of UVC-LEDs in which the UV intensities were 0.34,
0.094–0.11, and 0.049–0.060 mW/cm2, respectively. The log reduction for the same UV dose
increased with the increase in UV intensity. Bowker (2011) assumed that lower UV intensity
may cause the lower inactivation rates, despite using the same UV dose. Thus, fundamental
knowledge of the effects of UVC-LEDs on microbes in ice is necessary for evaluation of its
applicability.
Accordingly, in the present study, we evaluated the effects of a UVC-LED for bacterial
inactivation in ice. The objectives of this study were to evaluate the performance of the UVC-
LED and to investigate the effects of the UVC-LED on bacterial inactivation in the ice. Our
results provide insights into the performance and practical applicability of UVC-LED
irradiation in the inactivation of microorganisms in ice.
Chapter 3
Inactivation of bacteria in water and ice using an ultra violet C light-emitting diode
30
3.2. Materials and methods
3.2.1. Bacterial strains
E. coli (ATCC 25922), four strains of E. coli O157:H7 (RIMD 0509939, RIMD 05091896,
RIMD 05091897, and HIPH 12361), five strains of S. Typhimurium (RIMD 1985007, RIMD
1985009, ATCC29057, ATCC29629, and ATCC29630), and six strains of Listeria
monocytogenes (ATCC13932, ATCC15313, ATCC19111, ATCC19117, ATCC19118, and
ATCC35152) were used in this study. These strains were maintained at −80°C in tryptic soy
broth (TSB) containing 10% glycerol. A platinum loop was used to transfer the frozen bacterial
cultures by scratching the surface of the frozen culture into tryptic soy agar (TSA) plates. The
inoculated plates were incubated at 37°C for 24 h, and an isolated colony of each bacterium
was then transferred to fresh 5 ml TSB in a sterile plastic tube. The cultures were transferred
using loop inocula at two successive 24-h intervals to obtain a more homogeneous and stable
cell population. Grown cells were collected by centrifugation (3000 × g, 10 min), and the
resulting pellet was washed by sterile 0.1% peptone water three times and subsequently
resuspended in 10 ml sterile 0.1% peptone water, corresponding to approximately 108−109
CFU/ml. Strains of three pathogenic species, except E. coli ATCC 25922, were combined to
prepare culture cocktails for use in experiments. The suspensions were stored at 5°C until use.
3.2.2. Sample preparation
For distilled water-inactivation experiments, an aliquot of 1 ml of E. coli ATCC 25922
suspension (108−109 CFU/ml) was added to 50 ml distilled water in a glass beaker such that

Chapter 3
Inactivation of bacteria in water and ice using an ultra violet C light-emitting diode
31
the initial concentration of the inoculum was approximately 107−108 CFU/ml. For an ice-
inactivation experiments, an aliquot of 1 ml of E. coli ATCC 25922 suspension and the cocktail
suspensions of each pathogen were added to 25 ml distilled water in a glass beaker. The
inoculated distilled water was placed into an ice cube tray (length: 30 mm, width: 30 mm,
thickness: 30 mm) and then frozen at −80°C for 5 to 6 h. The initial concentration of E. coli
and other pathogens in the ice was approximately 106−107 CFU/ml, because viable bacterial
numbers were reduced by one log during the freezing process.
3.2.3. Experimental apparatus
One UVC-LED module (UVC-EC910ZA; Panasonic Photo lighting, Co. Ltd., Osaka,
Japan; diameter: 5.5 mm, height: 0.2 mm) with a wavelength of 270–280 nm was connected
onto a direct-current power supply (GW Instek, Taipei, Taiwan). The electric current and
voltage were 120 mA, 9−10 V, respectively. The UVC-LED and UV lamp were placed in the
vertical direction relative to the sample. The intensity of UVC was adjusted by varying the
distance between the samples and the LED. The intensity of the UV was determined with a
spectrometer (UV-37SD; Custom, Tokyo, Japan). The UV intensity was maintained constant
for 30 min. A low-pressure UV lamp (Handy UV lamp SUV-16; As one, Osaka, Japan; length:
336 mm, width: 82.3 mm, height: 65 mm) with a peak wavelength of 254 nm was used to
compare the effects of the UVC-LED. The UV lamp was housed in a UV collimated beam
apparatus (Bolton et al., 2003).

Chapter 3
Inactivation of bacteria in water and ice using an ultra violet C light-emitting diode
32
3.2.4. Distilled water-inactivation experiment by UVC
Water samples containing E. coli ATCC 25922 in a glass beaker were irradiated by UVC-
LED irradiation at various UV intensities (0.084, 0.025, 0.013, 0.007, and 0.005 mW/cm2) or
by UV lamp at a UV intensity of 0.025 mW/cm2 at room temperature (20−25°C). A 1-ml
aliquot was collected by pipetting at each sampling time during UVC irradiation treatment.
3.2.5. Ice-inactivation experiment by UVC
In this experiment, all ice samples (width: 30 mm, depth: 30 mm, height: 28 mm) on the
petri dishes were irradiated at −30°C in a deep freezer. Ice samples containing E. coli ATCC
25922 were irradiated by a UVC-LED of various UV intensities (0.084, 0.025, 0.013, 0.007,
and 0.005 mW/cm2) or by a UV lamp at a UV intensity of 0.025 mW/cm2 at room temperature
(20−25°C). Ice samples containing pathogens, such as E. coli O157:H7, S. Typhimurium, and
L. monocytogenes, were irradiated by a UVC-LED at 0.084 mW/cm2. Irradiated ice samples
were completely melted at room temperature. A 1-ml aliquot of sample was collected from
melted ice. Samples were irradiated with UVC for a maximum of 30 min.
3.2.6. Microbiological analysis
After UV irradiation treatment, to determine the number of surviving bacteria at each UV
dosages, appropriate serial dilutions (1:10) were performed with sterile 0.1% peptone water
and were plated on duplicate TSA plates. The plates were then incubated at 37°C for 24−48
h.
Chapter 3
Inactivation of bacteria in water and ice using an ultra violet C light-emitting diode
33
Survival kinetics analysis. The sensitivity of microorganisms to UV radiation can be
evaluated by following formula (Hijnen et al., 2006):
log𝑁(𝑡)
𝑁0= −𝑘 × UV dose (1)
where N(t) and N0 are the momentary and initial counts, respectively. The initial counts
(N0) were viable cell counts at the time zero. The parameter k (cm2/mJ) is the inactivation rate
from the linear portion of the relationship between log inactivation and the applied UV dose.
3.2.7. Statistical analysis
All experiments were repeated three times, and each data point was determined based on
duplicate plates counts. Data from three samples subjected to each treatment in each of three
independent replicate experiments were analyzed. To determine statistical significance (P <
0.05) between the UV treatment conditions and type of pathogenic bacteria, we used Students’
paired t-tests in the case of comparisons with two groups, such as the UVC-LED versus the
UV lamp, and we used Tukey-Kramer’s method for multiple comparison tests of comparisons
of more than three groups, such as UV intensities and type of pathogenic bacteria. All statistical
analyses were conducted using the R statistical environment (Ver.3.2.4 for Mac OS URL;
http://www.R-project.org).

Chapter 3
Inactivation of bacteria in water and ice using an ultra violet C light-emitting diode
34
3.3. Results
3.3.1. Performance of the UVC-LED
Changes in the irradiation intensity of the UVC-LED depending on the irradiation distance
were examined. As shown in Fig. 3-1, the UV intensity decreased as the irradiation distance
became longer. While the UV intensity was 0.084 mW/cm2 at a distance of 2 cm, the UV
intensity was decreased by 0.005 mW/cm2 at a distance of 10 cm. We also evaluated the
durability of the UVC-LED as another aspect of the performance of the UVC-LED. Changes
in the UV intensity of the UVC-LED for 30 min at room temperature and −30°C are shown
in Fig. 3-2. The UV intensity was almost constant during the 30-min irradiation, and
temperature did not affect the intensity of the UVC-LED.

Chapter 3
Inactivation of bacteria in water and ice using an ultra violet C light-emitting diode
35
Fig. 3-1. Changes in the intensity of UVC-LED depending on the distance between UVC-
LED and the objective.

Chapter 3
Inactivation of bacteria in water and ice using an ultra violet C light-emitting diode
36
Fig. 3-2. The intensity of UVC-LED when the distance and temperature changes. 2 cm (○), 6
cm (△), and 10cm (□) at room temperature and 2 cm (●), 6 cm (▲), and 10cm (■) at –30°C.
3.3.2. Inactivation of E. coli and pathogens in distilled water by UVC irradiation
E. coli ATCC 25922 in distilled water decreased as the UV dose of the UVC-LED
increased (Fig. 3-3). The reduction of E. coli depended on the UV dose at all UV intensities
except for 0.084 mW/cm2. E. coli ATCC 25922 was inactivated completely at 4 mJ/cm2 when
the UV intensity was 0.084 mW/cm2. In contrast, E. coli was completely inactivated at 1–2
mJ/cm2 when other UV intensities were applied. The kinetic parameter inactivation rate k value

Chapter 3
Inactivation of bacteria in water and ice using an ultra violet C light-emitting diode
37
of the UVC-LED at a 0.084 UV intensity of mW/cm2 was significantly lower (P < 0.05) than
that at other UV intensities (Table. 3-1).
Furthermore, we compared the performance of the UVC-LED with that of a conventional
UV lamp at a UV intensity of 0.025 mW/cm2 (Fig. 3-4). The UVC-LED could inactivate E.
coli ATCC 25922 in distilled water more efficiently than the UVC lamp at the same UV dose
(Fig. 3). The k values of UVC-LED and that of UV lamp at 0.025 mW/cm2 were significantly
different (4.27 ± 0.49 versus 0.50 ± 0.02, respectively; P < 0.05; Table. 3-1).

Chapter 3
Inactivation of bacteria in water and ice using an ultra violet C light-emitting diode
38
Fig. 3-3. Changes in the survival ratio of E. coli ATCC 25922 in distilled water
irradiated by UVC-LED at each UV intensities of 0.085 mW/cm2 (○), 0.025 mW/cm2 (△),
0.013 mW/cm2 (□), 0.007 mW/cm2 (◇), and 0.005 mW/cm2 (☓), and irradiated by a UV
lamp (●) at a UV intensity of 0.025 mW/cm2 at room temperature.

Chapter 3
Inactivation of bacteria in water and ice using an ultra violet C light-emitting diode
39
Table.3-1 UV sensitivity of E. coli ATCC 25922 in distilled water for UVC-LED and
low-pressure UV lamp.
Values are the mean ±SE from three replicate. Within the same column, means with different letters
are significantly different (P < 0.05)
k: Inactivation rate from the linear portion of relationship between log inactivation and the
applied UV dose
3.3.3. Inactivation of E. coli and other pathogens in ice by UVC irradiation
We next investigated the inactivation effects of the UVC-LED on bacterial pathogens in
ice cube. As shown in Fig. 3-4, the reduction of E. coli ATCC 25922 in ice depended on the
UV dose at all UV intensity conditions, unlike the case in distilled water (Fig. 3-4). E. coli
ATCC 25922 required a higher UV dose to be inactivated in ice (160 mJ/cm2) than that in
distilled water (1–4 mJ/cm2). However, the UVC-LED could inactivate E. coli ATCC 25922 in
ice more efficiently than the UVC lamp (Fig. 3-5), similar to the results observed in distilled
water. There were significantly differences (P < 0.05) between the survival ratios of pathogens
with the UVC-LED and the UV lamp at UV dose of 1.52, 6.08, and 45.8 mJ/cm2, but there
were no significant differences at 15.2 mJ/cm2.
Furthermore, a contamination level of 106–107 CFU/ml of E. coli O157:H7, S.
Typhimurium, and L. monocytogenes in the ice was efficiently inactivated by UVC-LED
UVC-LED UV lamp
UV intensity (mW/cm2)
0.084 0.025 0.013 0.007 0.005 0.025
k (cm2/mJ) 1.69±0.14 ad 4.27±0.49 bc 3.66±0.42 b 5.02±0.20 bc 5.45±0.11 c 0.50±0.02 d
R2 0.94±0.02 0.95±0.01 0.96±0.01 0.89±0.03 0.91±0.01 0.97±0.01
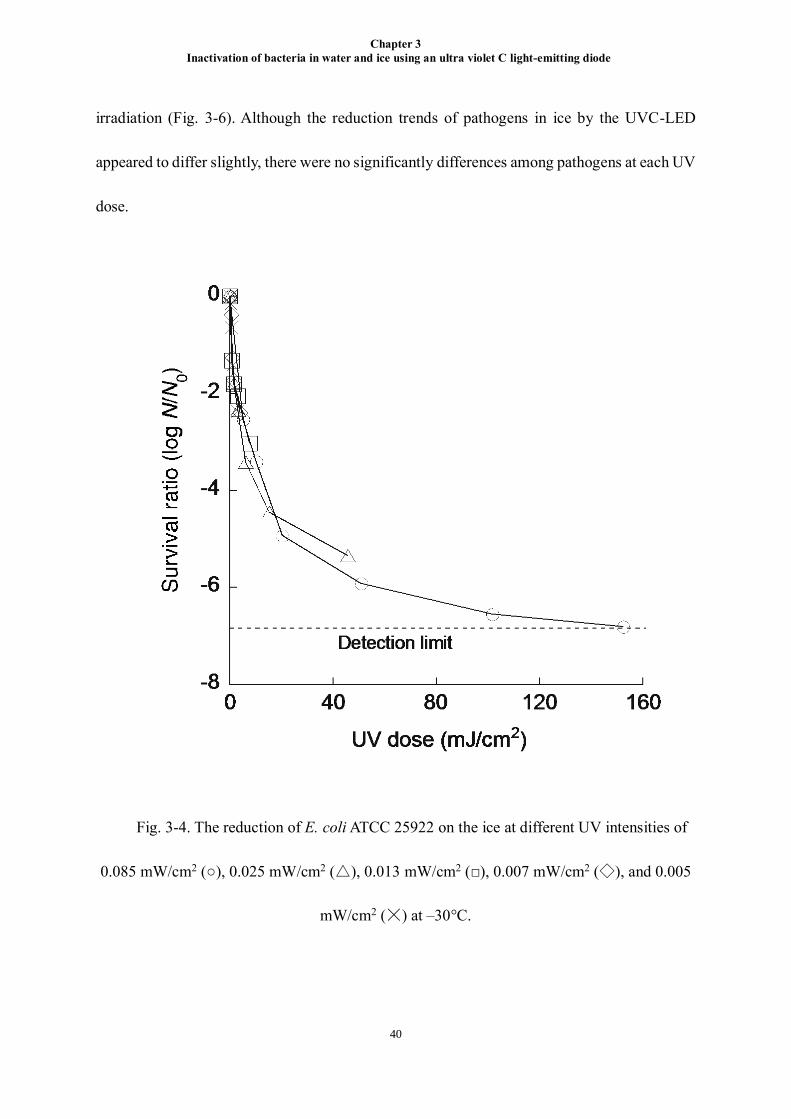
Chapter 3
Inactivation of bacteria in water and ice using an ultra violet C light-emitting diode
40
irradiation (Fig. 3-6). Although the reduction trends of pathogens in ice by the UVC-LED
appeared to differ slightly, there were no significantly differences among pathogens at each UV
dose.
Fig. 3-4. The reduction of E. coli ATCC 25922 on the ice at different UV intensities of
0.085 mW/cm2 (○), 0.025 mW/cm2 (△), 0.013 mW/cm2 (□), 0.007 mW/cm2 (◇), and 0.005
mW/cm2 (☓) at –30°C.

Chapter 3
Inactivation of bacteria in water and ice using an ultra violet C light-emitting diode
41
Fig. 3-5. Comparison of the inactivation effects of E. coli ATCC 25922 in ice between
UVC-LED (○) and a conventional UV lamp at a UV intensity 0.025 mW/cm2 (△) at –30°C.

Chapter 3
Inactivation of bacteria in water and ice using an ultra violet C light-emitting diode
42
Fig. 3-6. Comparison of the inactivation effects of E. coli O157:H7 (○), S. Typhimurium
(△), and L. monocytogenes (□) in ice by UV irradiation using UVC-LED at a UV intensity of
0.085 mW/cm2 at –30°C.
3.4. Discussion
In this study, we evaluated the ability of a UVC-LED to inactivate pathogens in distilled
water and ice. The results indicated that the microbial inactivation effect of the UVC-LED
depended on the UV dose at all UV intensity conditions in distilled water and ice, and the UVC-
LED could more efficiently inactivate E. coli ATCC 25922 in distilled water and ice than the
Chapter 3
Inactivation of bacteria in water and ice using an ultra violet C light-emitting diode
43
UV lamp.
Notably, E. coli ATCC 25922 in distilled water was not inactivated more efficiently at
higher intensities such as 0.084 mW/cm2, compared with that at other UV intensities. Notably,
microbial inactivation by UV irradiation appeared to be dependent on UV dose. However,
Sommer (1998) reported that a higher UV intensity and shorter exposure time were more
effective for E. coli inactivation than a lower UV intensity and longer exposure time when the
UV dose is the same, inconsistent with our current results. This discrepancy may be related to
the inability of the sample to absorb the UV light at an intensity of 0.084 mW/cm2 due to the
linearity of UVC-LED. Kim et al. (2015) reported that light from UV-LEDs converges at one
point vertically, whereas UV lamps scatter light over a large area. Song. et al. (2016) reported
that UV-LED is a point source and that uniform irradiance is not expected on the water sample
surface. Distilled water could not be uniformly irradiated by the UVC-LED when the distance
between distilled water and the UVC-LED was short because the UVC-LED light exhibited
straightness. Thus, the UVC-LED may not be able to inactivate microorganisms in a liquid
efficiently when the distance between the UVC-LED and irradiated material is small. Notable,
distance did not affect the inactivation of E. coli ATCC 25922 in the ice, potentially owing to
scattering of light. Indeed, UV light could be dispersed throughout ice by bumping into
molecular crystals in ice, whereas UV light was passed straight into water. Thus, our current
findings supported that the efficiency of the UVC-LED was different depending on the material
being irradiated when the UVC-LED and sample were close.
In the present study, the UVC-LED could more efficiently inactivate E. coli ATCC 25922
Chapter 3
Inactivation of bacteria in water and ice using an ultra violet C light-emitting diode
44
in distilled water and ice than the UVC lamp, consistent with the finding of Chatterley et al.
(2010) and Kim et al. (2015). Chatterley et al. (2010) compared the log reduction of E. coli
K12 by irradiation from low-pressure lamps (254 nm) and LEDs (265 nm) and concluded that
the UV-LED could slightly improve inactivation compared with the UV lamp, although there
was no significant difference at a 95% confidence level. Kim et al. (2015) studied the reduction
levels of E. coli O157:H7, S. Typhimurium, and L. monocytogenes spread on selective media
after treating at a 254-nm UV lamp or the 266-nm UV-LED. They concluded that UV-LED
treatment at a UV dose of 0.7 mJ/cm2 inactivated nearly all inoculated pathogens, whereas the
UV lamp resulted in 3.06-, 1.42-, and 0.34-log reductions of E. coli O157:H7, S. Typhimurium,
and L. monocytogenes, respectively, which were significantly less (P < 0.05) than the UV-LED
inactivation levels at the same dose. However, Song et al. (19) compared the average of k
values for E. coli inactivation using a UV lamp at 254 nm with the k values of UV-LEDs at
different wavelengths (255, 265, 272, 275, and 280 nm) from previous studies and concluded
that the average k value of the UV lamp was 0.506 cm2/ml, which was higher than those of
UV-LEDs (0.170–0.422 cm2/ml). Thus, the results of comparisons of inactivation by UV-LEDs
and UV lamps have been inconsistent, potentially because of a lack of uniformity in research
materials and methods, including individual differences in UV-LEDs. However, our results
showed the potential of UVC-LEDs to inactivate bacterial cells efficiency compared with
conventional UV lamps.
In this study, the reduction of pathogens in ice by UVC-LED depended on the type of
bacteria. Although L. monocytogenes was completely inactivated at 40 mJ/cm2, 102 CFU/ml

Chapter 3
Inactivation of bacteria in water and ice using an ultra violet C light-emitting diode
45
of E. coli O157:H7 and S. Typhimurium survived, even at 100 mJ/cm2. In general, gram-
positive bacteria, such as L. monocytogenes are more resistant to UV light than gram-negative
bacteria, such as E. coli O157:H7 and S. Typhimurium, providing an explanation for these
finding. However, Koutchma (2009) assumed that the UV sensitivities of L. monocytogenes,
and Salmonella in liquid foods were similar to UV sensitivity of E. coli. Kim et al. (2015)
studied the viable-count reduction levels of E. coli O157:H7, S. Typhimurium, and L.
monocytogenes spread on selective media after treatment with a 254-nm UV lamp or 266-nm
UV-LED. They found that the inactivation level was lowest for L. monocytogenes, similar to
our study.
One unit of the UVC-LED used in this study inactivated 106–107 CFU/ml of the pathogens,
although the effect was depended on the type of bacterial strain. These strains are highly
pathogenic and can cause food poisoning when present at only 101–102 CFU/ml. Notably, a
UV dose of more than 160 mJ/cm2 is needed to prevent the food poisoning if the initial
pathogen concentrations of more than 107 CFU/ml would rarely be encountered in commercial
ice (Nichols et al., 2000; Gerokomou et al., 2011).
Finally, we found that bacterial pathogens in ice were not always inactivated completely
at a UV dose of 160 mJ/cm2. We assumed that the cloudiness of the ice, produced by air bubbles,
could explain to this result. In general, the penetration of light is lower when the liquid has the
greater color or turbidity. The presence of dissolved organic solutes and compounds in liquid
foods leads to strong UV attenuation effects (Fan and Geveke, 2007). Moreover, the cloudiness
of ice could prevent the penetration of UV light into the ice. The ice used in the present study

Chapter 3
Inactivation of bacteria in water and ice using an ultra violet C light-emitting diode
46
was not clear because we intended to obtain fundamental data for evaluating the microbial
inactivation effect of UVC-LED in commercial ice.
the efficiency of the UVC-LED. In the future, we will need to investigate the effects of
cloudiness of ice, the number of UVC-LED modules used for treatment, and changing the angle
of UVC-LED on the results of bacterial inactivation.
In summary, our results demonstrated that the use of UVC-LEDs rather than UV lamps
may contribute to efficient microbial control in ice and to ensure the safety of ice in the food
industry.
Chapter 4 Maximize the characteristics of UVC-LED light-emitting diode for hygienic ice production
47
Chapter 4
Maximize the characteristics of UVC-LED light-emitting diode for hygienic
ice production
4.1. Introduction
UV irradiation is a common non-thermal and non-destructive microbial inactivation
technology. UV light treatment is commonly used for liquid sterilization, air disinfection, and
inhibition of microorganisms in surface (Falguera et al., 2011). UV treatment has several
advantages such as relatively inexpensive equipment, easy to use, and wide spectrum of lethal
effect of microorganism (Bintsis et al., 2000). On the other hand, UV has been limited for
applying to food industry because of the limitation of the shape of mercury lamp and its low
penetration influencing by the characteristics of the irradiated material (Koutchma et al., 2007;
Koutchma, 2009; Falguera et al., 2011). The presence of dissolved organic solutes and
compounds in liquid foods leads to strong UV attenuation effects (Fan et al., 2007) and solid
food such as vegetable, fruit, meat is disinfected only its surface (Guerrero-Beltran and
Barbosa-Canovas, 2004; Allende et al., 2006; Manzocco et al., 2011; Lim and Harrison, 2016).
In addition, bacteria are not inactivated efficiently when the distance between UVC apparatus
and irradiated material is large because UV intensity depends on distance (Song et al., 2016).
Thus, developing UV-irradiation system which can shed UV light on food efficiently is
important for efficient disinfection.
Although there are weak points of UVC irradiation as described above, the strong and
wide spectrum effect on various microorganisms under appropriate usage condition has long

Chapter 4 Maximize the characteristics of UVC-LED light-emitting diode for hygienic ice production
48
been reported by numerous literature. The issues of UV irradiation are summarized in the
influence of unevenness and shade of objectives. However, if these issues could be turned over
technically, the technique of UVC irradiation would be more worth applying to food processors
for ensuring microbiological food safety. To maximize the effect of UVC irradiation,
conventional UV lamp technologies would not enable to respond to the industrial demands.
Thus, we focused on an emerging technology of UVC irradiation by light-emitting-diode
(LED).
UVC-LEDs have recently emerged as a new source for UVC irradiation. UVC-LEDs
would allow novel and flexible design of UV inactivation devices because UV-LED has several
advantages such as compactness (5 − 9 mm diameter) (Chatterley and Linden, 2010),
robustness, faster start-up time, less energy consumption, longer lifetime, ability to turn on and
off with high frequency, and lack of mercury (Würtele et al., 2011). UVC-LEDs could be
located on various places because of its compactness and have the potential to irradiate from
multiple sides. Irradiation from multiple sides could inactivate microorganism efficiently
because that way would help to evenly irradiate on food and would reduce the influence of
shade area where microorganism could hide. Thus, we hypothesized that the bactericidal effect
would be maximized using multiple UVC-LEDs from different angles.
In the previous study, we focused on inactivation of pathogenic bacteria such as
Escherichia coli O157:H7, Salmonella Typhimurium, and Listeria monocytogenes in ice by
using UVC-LED (Murashita et al., 2017). As a result, a UVC-LED irradiation enable to
demonstrate more efficient bactericidal effect in ice cube than that of UV lamp irradiation.

Chapter 4 Maximize the characteristics of UVC-LED light-emitting diode for hygienic ice production
49
While basic bactericidal effects by UVC-LED for ice have been investigated, the optimal
procedure for bacterial inactivation will be needed for a practical usage.
In the present study, we aimed at examining the inactivation effect on pathogenic bacteria
in ice by using multiple UVC-LED modules and multiple irradiation directions of UVC-LED.
Furthermore, a bench-scale UVC irradiation apparatus that is installed eight UVC-LED
modules was developed for maximizing bactericidal effect in ice. We determined the
bactericidal performance of multiple irradiation directions and/or multiple intensities of UVC-
LED to be practically used in the future.
4.2. Materials and methods
4.2.1. Bacterial strains
Four strains of E. coli O157:H7 (RIMD 0509939, RIMD 05091896, RIMD 05091897,
and HIPH 12361), five strains of S. Typhimurium (RIMD 1985007, RIMD 1985009,
ATCC29057, ATCC29629, and ATCC29630), and six strains of L. monocytogenes
(ATCC13932, ATCC15313, ATCC19111, ATCC19117, ATCC19118, and ATCC35152) were
used in this study. These strains were maintained at −80°C in tryptic soy broth (TSB)
containing 10% glycerol. A platinum loop was used to transfer the frozen bacterial cultures by
scratching the surface of the frozen culture into tryptic soy agar (TSA) plates. The inoculated
plates were incubated at 37°C for 24 h, and an isolated colony of each bacterium was then
transferred to fresh 5 ml TSB in a sterile plastic tube. The cultures were transferred using loop
inocula at two successive 24-h intervals to obtain a more homogeneous and stable cell
Chapter 4 Maximize the characteristics of UVC-LED light-emitting diode for hygienic ice production
50
population. Grown cells were collected by centrifugation (3000 × g, 10 min), and the resulting
pellet was washed by sterile 0.1% peptone water three times and subsequently resuspended in
10 ml sterile 0.1% peptone water, corresponding to approximately 108−109 CFU/ml. Strains
of three pathogenic species were combined to prepare culture cocktails for use in experiments.
The suspensions were stored at 5°C until use.
4.2.2. Sample preparation
An aliquot of 1 ml of the cocktail suspensions of each pathogen were added to 25 ml
distilled water in a glass beaker. The inoculated distilled water was placed into an ice cube tray
(length: 30 mm, width: 30 mm, thickness: 30 mm) and then frozen at −80°C for 5 to 6 h. The
initial concentration of pathogens in the ice sample (width: 30 mm, depth: 30 mm, height: 28
mm) was approximately 106−107 CFU/ml, because viable bacterial numbers were reduced by
one log during the freezing process.
4.2.3 Experimental apparatus
UVC-LED modules (UVC-EC910ZA; Panasonic Photo lighting, Co. Ltd., Osaka, Japan;
diameter: 5.5 mm, height: 0.2 mm) with a wavelength of 270–280 nm was connected on a
direct-current power supply (GW Instek, Taipei, Taiwan). The electric current and voltage were
120 mA, 9−10 V per one UVC-LED, respectively. As the same direction condition, 1–3 UVC-
LEDs was placed in the vertical direction relative to the sample. As different direction
conditions (Fig.4-1), 1–3 UVC-LEDs placed in the vertical and horizontal direction relative to

Chapter 4 Maximize the characteristics of UVC-LED light-emitting diode for hygienic ice production
51
the sample. The distance between ice and UVC-LED was 6 cm in all experiment. The intensity
of the UV was determined with a spectrometer (UV-37SD; Custom, Tokyo, Japan). The UV
intensity was maintained constant for 30 min.
A bench-scale UVC-LED test apparatus was rectangular device and contained eight UVC-
LEDs modules (Fig. 2 + picture).
An ice, which contained pathogens, on the plastic table (diameter: 5.4 mm, height: 1.0
mm) was placed in the center of the UVC-LED apparatus.
Fig. 4-1. A schematic diagram of installation of multiple UVC-LEDs. (a): using one
UVC-LED, (b): using two UVC-LEDs from same or different directions, (c): using three
UVC-LEDs from same and different directions.
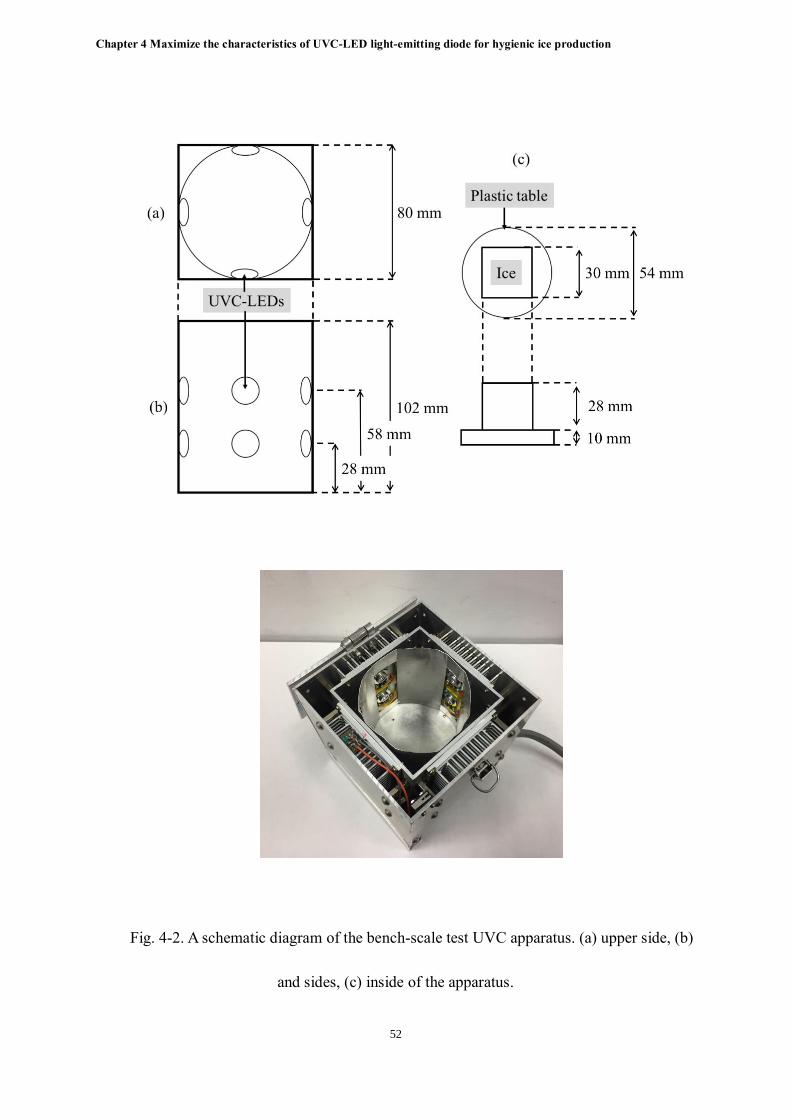
Chapter 4 Maximize the characteristics of UVC-LED light-emitting diode for hygienic ice production
52
Fig. 4-2. A schematic diagram of the bench-scale test UVC apparatus. (a) upper side, (b)
and sides, (c) inside of the apparatus.
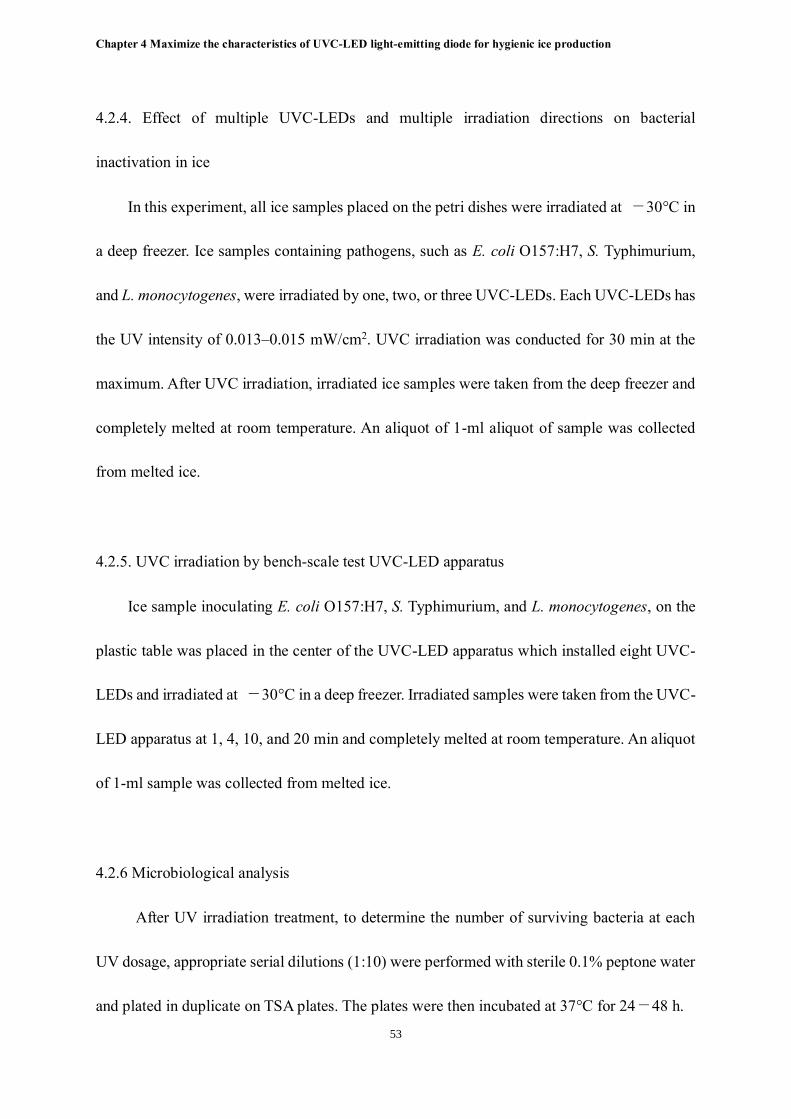
Chapter 4 Maximize the characteristics of UVC-LED light-emitting diode for hygienic ice production
53
4.2.4. Effect of multiple UVC-LEDs and multiple irradiation directions on bacterial
inactivation in ice
In this experiment, all ice samples placed on the petri dishes were irradiated at −30°C in
a deep freezer. Ice samples containing pathogens, such as E. coli O157:H7, S. Typhimurium,
and L. monocytogenes, were irradiated by one, two, or three UVC-LEDs. Each UVC-LEDs has
the UV intensity of 0.013–0.015 mW/cm2. UVC irradiation was conducted for 30 min at the
maximum. After UVC irradiation, irradiated ice samples were taken from the deep freezer and
completely melted at room temperature. An aliquot of 1-ml aliquot of sample was collected
from melted ice.
4.2.5. UVC irradiation by bench-scale test UVC-LED apparatus
Ice sample inoculating E. coli O157:H7, S. Typhimurium, and L. monocytogenes, on the
plastic table was placed in the center of the UVC-LED apparatus which installed eight UVC-
LEDs and irradiated at −30°C in a deep freezer. Irradiated samples were taken from the UVC-
LED apparatus at 1, 4, 10, and 20 min and completely melted at room temperature. An aliquot
of 1-ml sample was collected from melted ice.
4.2.6 Microbiological analysis
After UV irradiation treatment, to determine the number of surviving bacteria at each
UV dosage, appropriate serial dilutions (1:10) were performed with sterile 0.1% peptone water
and plated in duplicate on TSA plates. The plates were then incubated at 37°C for 24−48 h.

Chapter 4 Maximize the characteristics of UVC-LED light-emitting diode for hygienic ice production
54
4.2.7. Statistical analysis
All experiments were repeated three times, and each data point was determined based on
duplicate plates counts. Data from three samples subjected to each treatment in each of three
independent replicate experiments were analyzed. To determine statistical significant (P <
0.05) between the UV treatment conditions and type of pathogenic bacteria, we used Students’
paired t-tests in the case of comparisons with two groups, such as the effect of the same
direction of UVC-LED versus different direction of UVC-LED, and we used Tukey-Kramer’s
method for multiple comparison tests of comparisons of more than three groups, such as
inactivation of pathogenic bacteria by UVC apparatus. All statistical analyses were conducted
using the R statistical environment (Ver.3.2.4 for Mac OS URL; http://www.R-project.org).
4.3. Result
4.3.1. Effect of UV intensity on bacterial inactivation in ice by using different numbers of
UVC-LEDs from same direction
E. coli O157:H7, S. Typhimurium, and L. monocytogenes in ice were inactivated
efficiently by the UVC irradiation from the same direction as the number of UVC-LED
increased (Figs. 4-3). There seemed to be a slight difference in the sensitivity to UVC
irradiation within 10 min treatment between kind of pathogenic bacteria. However, as the
irradiation duration was longer, there was no significant difference in sensitivity to UVC
between the kind of bacteria. Furthermore, longer irradiation duration that means higher UV
dose did not show significant difference between the used number of UVC-LED.
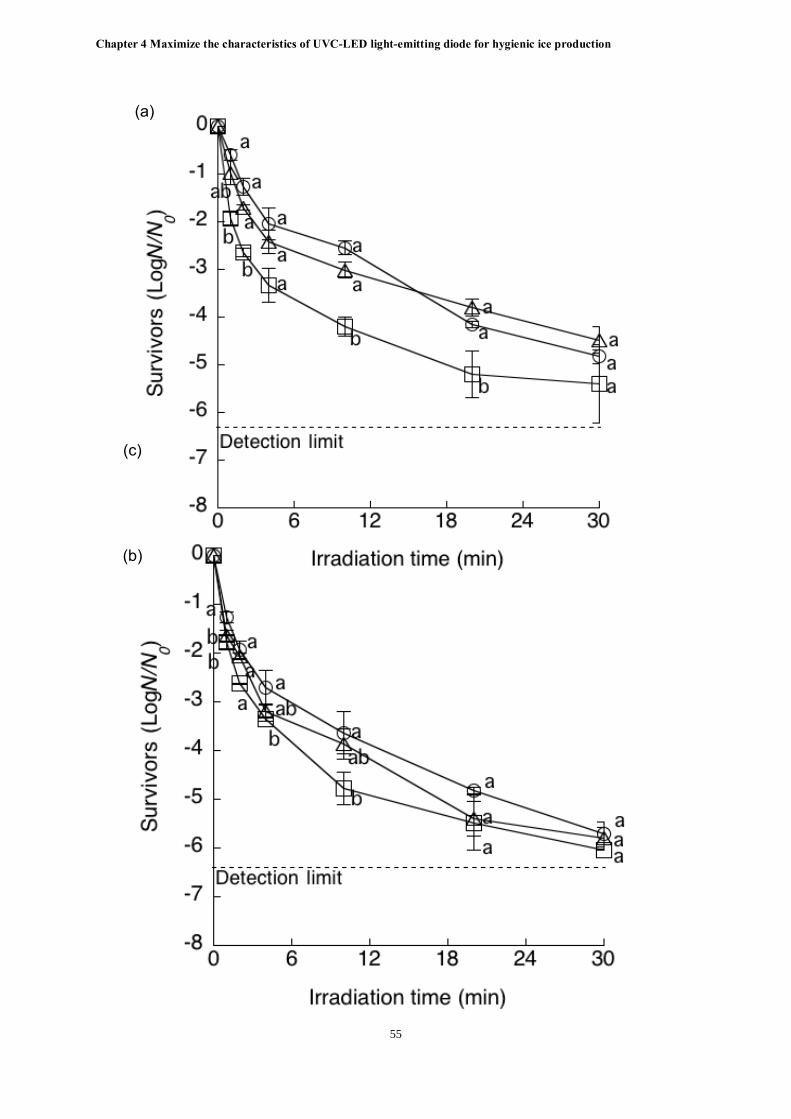
Chapter 4 Maximize the characteristics of UVC-LED light-emitting diode for hygienic ice production
55
(a)
(b)
(c)

Chapter 4 Maximize the characteristics of UVC-LED light-emitting diode for hygienic ice production
56
Figs. 4-3. The changes in the viable bacterial cell counts during UVC irradiation by one
LED (○), two LEDs (△), and three LEDs (□) placed above ice (6cm) from the same
direction. Each UVC-LED has UV intensity of 0.013–0.015 mW/cm2. (a) E. coli O157:H7,
(b) S. Typhimurium, (c) L. monocytogenes.
4.3.2. Effect of UVC irradiation from different directions on bacterial inactivation in ice
E. coli O157:H7 and S. Typhimurium were more efficiently inactivated by two UVC-
LEDs irradiations from different directions than those of the same direction of those (Fig. 4-
4a, 4-4b). In particular, two UVC-LEDs irradiation from the different directions showed
significantly (P < 0.05) greater log-reductions of E. coli O157:H7 at 3.75, 18.8, 56.3 mJ/cm2

Chapter 4 Maximize the characteristics of UVC-LED light-emitting diode for hygienic ice production
57
and S. Typhimurium at 18.8 mJ/cm2 than those of irradiation from the same direction. However,
there were no significant difference (P < 0.05) in survivors of L. monocytogenes regardless of
the irradiation directions at each UV dose (Fig. 4-4c).
The similar reduction trends were found in the case of three of UVC-LEDs irradiation,
although there were no significant differences (P > 0.05) in survivors of E. coli O157:H7, S.
Typhimurium, and L. monocytogenes at each UV dose regardless of the irradiation directions
of three UVC-LEDs except for S. Typhimurium at 10.6 mJ/cm2 (Figs. 4-5). E. coli O157:H7,
S. Typhimurium and L. monocytogenes was completely inactivated by UVC irradiation at 80,
60, 60 mJ/cm2, respectively, from the different directions. In contrast, these bacteria were alive
by three UVC-LED irradiations at the same UV dose by the same direction.

Chapter 4 Maximize the characteristics of UVC-LED light-emitting diode for hygienic ice production
58
(a)

Chapter 4 Maximize the characteristics of UVC-LED light-emitting diode for hygienic ice production
59
(b)

Chapter 4 Maximize the characteristics of UVC-LED light-emitting diode for hygienic ice production
60
Fig. 4-4. The changes in the viable cell counts in ice during UVC irradiation at -30˚C by
using two UVC-LEDs from same (○) or different directions (△). Each UVC-LED has UV
intensity of 0.013–0.015 mW/cm2. The error bars represent mean values with standard
deviation (n = 3). Values with different letter means statistical significant difference. (a) E. coli
O157:H7, (b) S. Typhimurium, (c) L. monocytogenes.
(c)

Chapter 4 Maximize the characteristics of UVC-LED light-emitting diode for hygienic ice production
61
(a)

Chapter 4 Maximize the characteristics of UVC-LED light-emitting diode for hygienic ice production
62
(b)
Chapter 4 Maximize the characteristics of UVC-LED light-emitting diode for hygienic ice production
63
Fig. 4-5. The changes in the viable bacterial cell counts in ice during UVC irradiation at
-30˚C by using three UVC-LED from the same (○) and different (△) directions. Each UVC-
LED has UV intensity of 0.013–0.015 mW/cm2.The error bars represent mean values with
standard deviation (n = 3). Values with different letter means statistical significant difference.
(a) E. coli O157:H7, (b) S. Typhimurium, (c) L. monocytogenes.
(c)
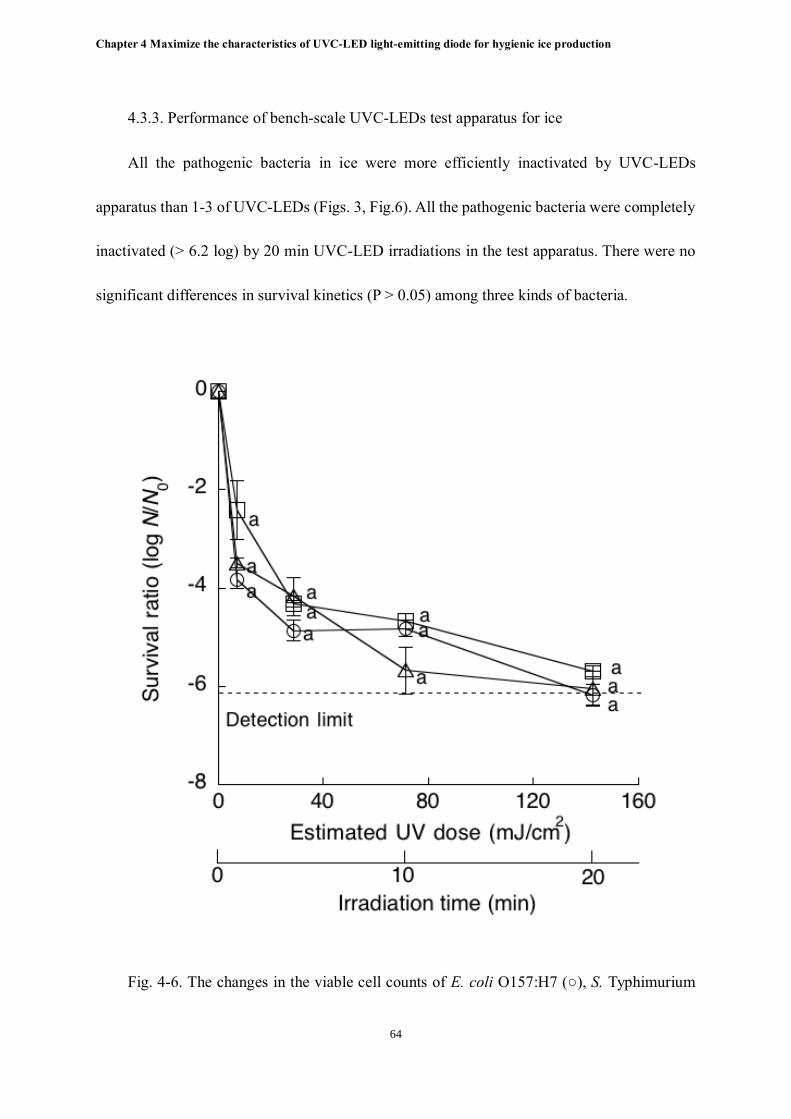
Chapter 4 Maximize the characteristics of UVC-LED light-emitting diode for hygienic ice production
64
4.3.3. Performance of bench-scale UVC-LEDs test apparatus for ice
All the pathogenic bacteria in ice were more efficiently inactivated by UVC-LEDs
apparatus than 1-3 of UVC-LEDs (Figs. 3, Fig.6). All the pathogenic bacteria were completely
inactivated (> 6.2 log) by 20 min UVC-LED irradiations in the test apparatus. There were no
significant differences in survival kinetics (P > 0.05) among three kinds of bacteria.
Fig. 4-6. The changes in the viable cell counts of E. coli O157:H7 (○), S. Typhimurium

Chapter 4 Maximize the characteristics of UVC-LED light-emitting diode for hygienic ice production
65
(△), L. monocytogenes (□) in ice during UVC irradiation at -30°C by using a bench-scale test
UVC-LED apparatus that has eight UVC-LEDs placed on different directions. Estimated UV
intensity was 0.119 mW/cm2. The error bars represent mean values with standard deviation (n
= 3). Values with different letter means statistical significant difference.
4.4 Discussion
In this study, we evaluated the bacterial inactivation effect of multiple UVC-LEDs and
effect of different irradiation direction of UVC-LEDs in ice. The results indicated that the
reductions of survival E. coli O157:H7, S. Typhimurium, and L. monocytogenes in ice were
more efficient as the number of UVC-LED increased when the irradiations of UVC-LEDs were
from the same direction. Commonly, microbial inactivation by UVC irradiation are dependent
on UV dose, which is defined as the product of UV intensity and exposure time (Sommer et
al., 1998). In our previous study, we evaluated the effect of UV intensity (0.084, 0.025, 0.013,
0.007, and 0.005 mW/cm2) of a UVC-LED on pathogenic bacteria in ice and we found that
inactivation effect was depended on UV dose at all UV intensity conditions (Murashita et al.,
2017). Thus, increasing the number of UVC-LEDs during UVC irradiation from the same
direction would have similar effect to increasing the intensity of a UVC-LED.
The UVC irradiation using two UVC-LEDs from different directions demonstrated more
efficient bacterial inactivation effect than those from the same direction. This result indicated
that the UVC light could be easily transmitted internal ice by different direction of UVC-LEDs.
However, in the case of using three UVC-LEDs, there was no significant difference (P > 0.05)
Chapter 4 Maximize the characteristics of UVC-LED light-emitting diode for hygienic ice production
66
regardless of the irradiation direction. The result suggested that the difference of the irradiation
direction would not influence on bacterial inactivation when UV intensity was sufficient.
Because using three UVC-LEDs showed higher UV intensity than that of two of UVC-LEDs,
the penetration of the UVC light by using three UVC-LEDs would not be different regardless
of the irradiation direction. Thus, increase of the number of UVC-LED and using multiple
irradiation directions had potential to inactivate microorganism more efficiently than the same
direction of UVC-LED, while the effect of irradiation from different directions was small under
sufficient UV intensity. UVC-LED will be suitable for locating more places and irradiating
from many directions than UV lamp because of its compactness. The results obtained in the
present study suggest that using multiple UVC-LEDs and irradiation from multiple direction
will enable to eliminate irradiation shade and irradiate evenly and efficiently to the objectives.
As a result, highly efficient bacterial inactivation would be realized by using multiple UVC-
LEDs.
Based on the results obtained in the present study, we developed a bench-scale test UVC-
LED irradiation apparatus that was installed eight UVC-LED in different directions to enable
to be irradiated from various aspects. UVC irradiation by the test UVC-LED apparatus
decreased by 104−105 CFU/ml of pathogenic bacteria in ice as is within 5 min under -30˚C,
while it took 20 min to kill all the bacteria completely in ice. Using multiple (eight) UVC-
LEDs and the irradiation from multiple directions would enhance the bacterial inactivation by
the UVC irradiation. The bacterial cells located near cloudiness of ice produced by air bubbles
would not be efficiently inactivated. Because the penetration of light is lower when the liquid
Chapter 4 Maximize the characteristics of UVC-LED light-emitting diode for hygienic ice production
67
has greater color or turbidity, the presence of dissolved organic solutes and compounds in liquid
foods leads to strong UV attenuation effects (Fan and Geveke, 2007). Thus, the cloudiness of
ice could prevent the penetration of UV light into the ice.
In conclusion, UVC-LEDs will have a potential to enhance hygienic ice production based
on the results presented in this study. Although UV irradiation has disadvantage that lightproof
food is disinfect only its surface (Falguera et al., 2011) and it was less effective on rough surface
cuts of meat because bacteria were partly shielded from radiation (Stermer et al., 1987), the
UVC irradiation using multiple UVC-LEDs from multiple directions enables to overcome the
weakness of conventional UV irradiation. Thus, the findings presented here for ice would be
applied to other various foods as well.
Chapter 5 Disinfection of vegetables by using UVC-LED
68
Chapter 5 Disinfection of vegetables by using UVC-LED
5.1. Introduction
Distribution process of agricultural commodities, meat and meat products, fish and fishery
products to consumers are recently very complex. There would be many chances of
contamination of pathogens for most foods during distribution and processing. The number of
accident by food poisoning per year in Japan had been more than 1000 since 2000 to 2016 (Fig.
5-1). In particular, seafoods, composite cooked foods, meats and vegetables are main source of
food poisoning in 2016 (Fig. 5-2). Inactivation, removing, and/or eliminating of pathogenic
microorganisms just before eating will play a key role in ensuring microbiological food safety.
Raw meats and fishes are commonly heated (cooked) just before eating at restaurant and/or
home. However, there are no enough method to inactivate microorganisms which contaminate
raw food such as vegetable. The simple way to disinfect raw vegetable is washing in portable
water. However, the efficacy of this treatment is few. 10-fold to 100-fold reductions can
sometimes be achieved by that treatment (Beuchat et al., 1998). Chlorine has been used as the
most effective sanitizers to assure the safety of vegetables. However, there is a trend in
eliminating chlorine from food process because of concern about the environmental and health
risks associated with the formation of carcinogenic halogenated disinfection by-products
(Allenda eta al., 2008, Gii et al., 2009). Most of the current studies have been focused on the
search for alternative sanitizers based on assuring the quality and safety of the fresh-cut
produce (Gii et al., 2009). UVC offers several advantages to food processors as it does not
leave a residue, does not have legal restrictions and does not require extensive safety equipment
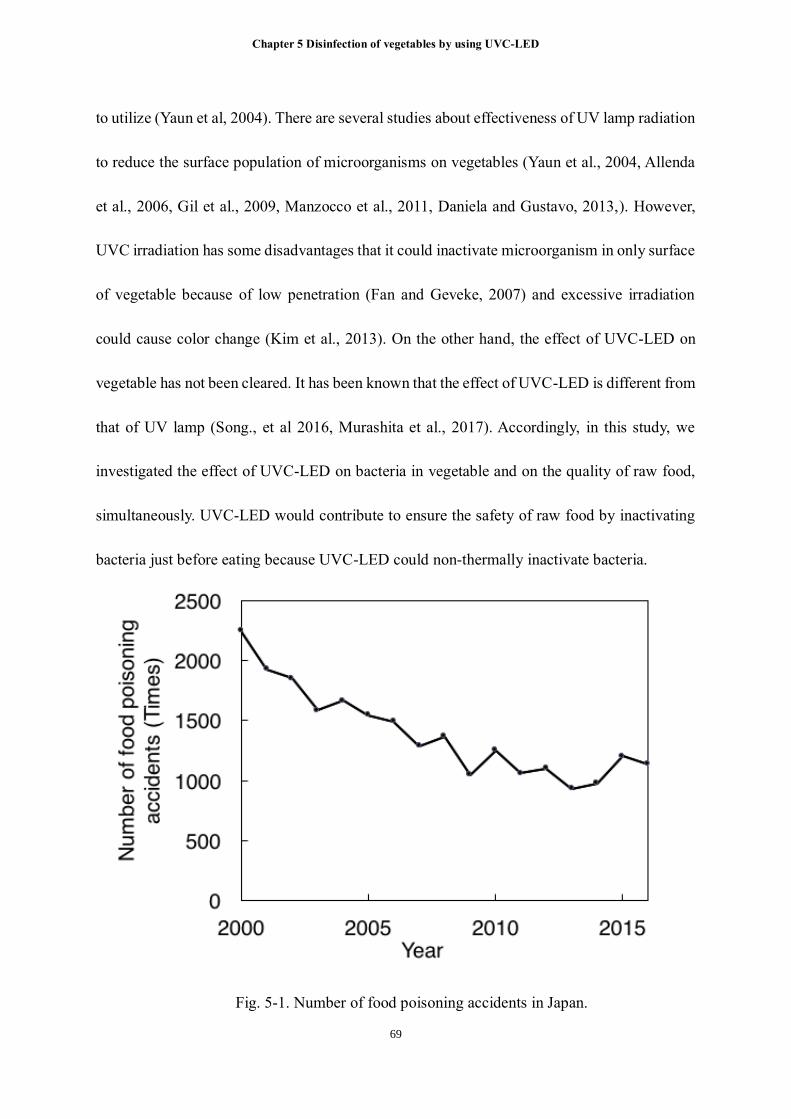
Chapter 5 Disinfection of vegetables by using UVC-LED
69
to utilize (Yaun et al, 2004). There are several studies about effectiveness of UV lamp radiation
to reduce the surface population of microorganisms on vegetables (Yaun et al., 2004, Allenda
et al., 2006, Gil et al., 2009, Manzocco et al., 2011, Daniela and Gustavo, 2013,). However,
UVC irradiation has some disadvantages that it could inactivate microorganism in only surface
of vegetable because of low penetration (Fan and Geveke, 2007) and excessive irradiation
could cause color change (Kim et al., 2013). On the other hand, the effect of UVC-LED on
vegetable has not been cleared. It has been known that the effect of UVC-LED is different from
that of UV lamp (Song., et al 2016, Murashita et al., 2017). Accordingly, in this study, we
investigated the effect of UVC-LED on bacteria in vegetable and on the quality of raw food,
simultaneously. UVC-LED would contribute to ensure the safety of raw food by inactivating
bacteria just before eating because UVC-LED could non-thermally inactivate bacteria.
Fig. 5-1. Number of food poisoning accidents in Japan.
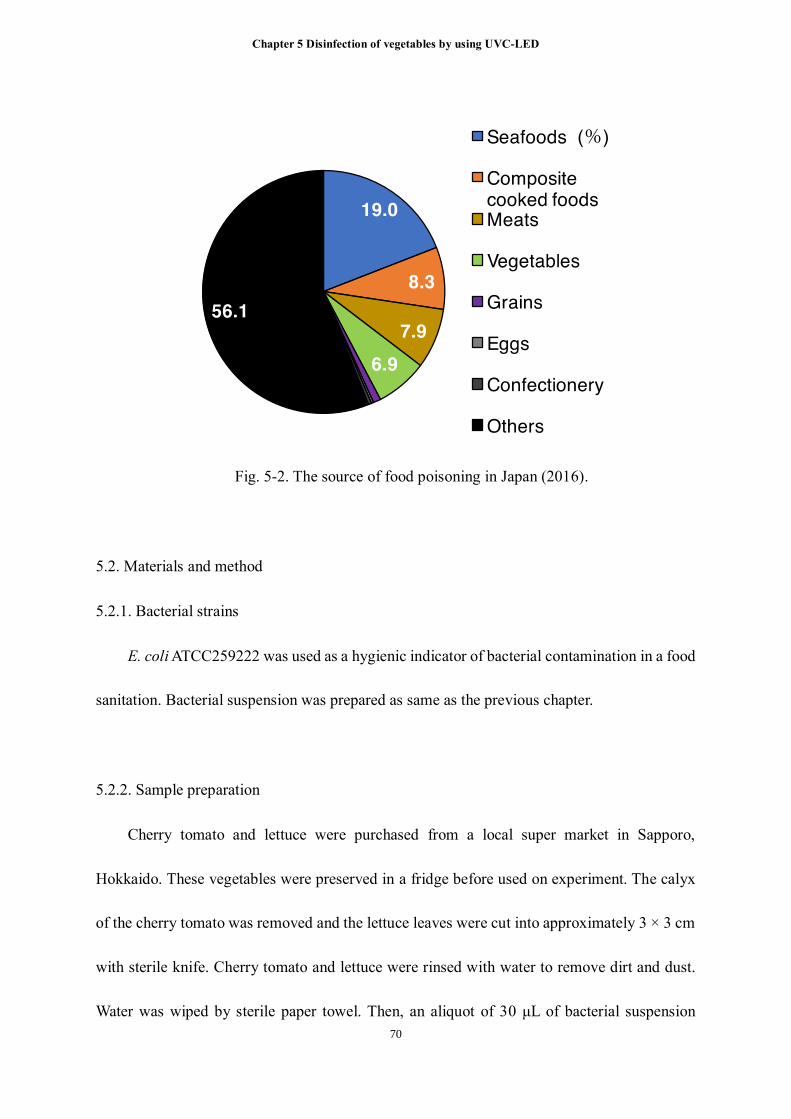
Chapter 5 Disinfection of vegetables by using UVC-LED
70
Fig. 5-2. The source of food poisoning in Japan (2016).
5.2. Materials and method
5.2.1. Bacterial strains
E. coli ATCC259222 was used as a hygienic indicator of bacterial contamination in a food
sanitation. Bacterial suspension was prepared as same as the previous chapter.
5.2.2. Sample preparation
Cherry tomato and lettuce were purchased from a local super market in Sapporo,
Hokkaido. These vegetables were preserved in a fridge before used on experiment. The calyx
of the cherry tomato was removed and the lettuce leaves were cut into approximately 3 × 3 cm
with sterile knife. Cherry tomato and lettuce were rinsed with water to remove dirt and dust.
Water was wiped by sterile paper towel. Then, an aliquot of 30 μL of bacterial suspension
(%)

Chapter 5 Disinfection of vegetables by using UVC-LED
71
(approximately 108−109 CFU/ml) were spotted on the surface of the vegetables. After
inoculating, vegetables were air-dried at ambient temperature for 2 h in a biological safety
cabinet.
5.2.3. UVC irradiation treatment
Inoculated area of the sample vegetable was irradiated for maximum 10 min by one UVC-
LED module that was placed in the vertical direction. The distance between the UVC-LED and
the sample was 6 cm and the UV intensity was 0.013 mW/cm2. After irradiation, the UVC-
treated tomatoes and lettuces were individually placed in a sterile stomacher bag with 0.1%
peptone water (20 mL). These vegetables were manually shaken and hand-rubbed at the
inoculation spot for 1 min according to UV lamp inactivation of vegetable (Lim et al, 2016).
The suspension was serially diluted by 0.1% peptone water and then plated on TSA plates in
duplicate as well as the previous chapter.
5.2.4. Firmness and color measurement
Firmness and color (L*, a*, and b*) of cherry tomatoes and lettuces after irradiation by
UVC-LED for 0, 4, and 10 min were determined in order to identify quality change by UVC.
Firmness was determined by a rheometer (Rheotech, Tokyo, Japan). The samples were punched
by a cylindrical probe with 3 mm diameter. Crosshead speed was set at 3 cm/min. Force–
distance curves were obtained from the penetration tests and firmness was taken as the force
(N) required to puncture the sample.

Chapter 5 Disinfection of vegetables by using UVC-LED
72
Color of samples were measured by a colorimeter (CR-400; Konica minolta, Tokyo,
Japan). The instrument was standardized against a white tile before measurement. Color was
expressed in L*, a*, and b* parameters.
5.3. Results and discussion
The UV-C irradiation by UVC-LED with 10 mJ/cm2 reduced the number of E. coli
inoculated on tomatoes and lettuce by 2 log-cycles (Fig. 5-3). This reduction was considerably
less than those in distilled water and in ice. Because bacterial suspension would be absorbed
into vegetables and just only bacteria in surface would be inactivated. Commonly, solid foods
such as vegetables, fish, meats, are disinfected only its surface because UV light does not
penetrate into their insides.
Yaun et al., (2004) found that Salmonella inoculated on tomatoes were reduced by 2.19
log CFU/tomato when a maximum UV-C dose of 24 mJ/cm2 by using a UV lamp. Song et al.
(2011) reported that UV-C at 500 mJ/cm2 decreased S. Typhimurium on light red cherry
tomatoes by 2.58 logs using UV lamp. Disinfection of vegetable by non-thermal effect of UV
irradiation might be around 2-3 log reduction. Smoothness of vegetable surface would affect
on the results. UV radiation does not penetrate most opaque materials, it was less effective on
rough surface such as round steak because bacteria were partly shielded from the radiation
(Stermer et al, 1987). Bermudez-Aguirre et al. (2013) also mentioned the effect of smoothness
of vegetable on microorganism inactivation. Bermudez-Aguirre et al. (2013) compared the
effect of UV lamp on E. coli in carrots, lettuce, and tomatoes and they found E. coli in tomatoes

Chapter 5 Disinfection of vegetables by using UVC-LED
73
were more efficiently inactivated than that in carrots and lettuce. They mentioned because
tomatoes have a smooth surface and the protective sites are limited, microorganisms were
exposed to the radiation and inactivation was achieved compared with those in carrots and
lettuce.
Fig. 5-3. The changes in the viable bacterial cell counts on lettuce (○) and cherry tomato
(△) by UVC-LED at 0.013 mW/cm2. The error bars represent mean values with standard
deviation (n = 3).
Firmness and color were not significantly changed by the UV-C irradiation by UVC-LED
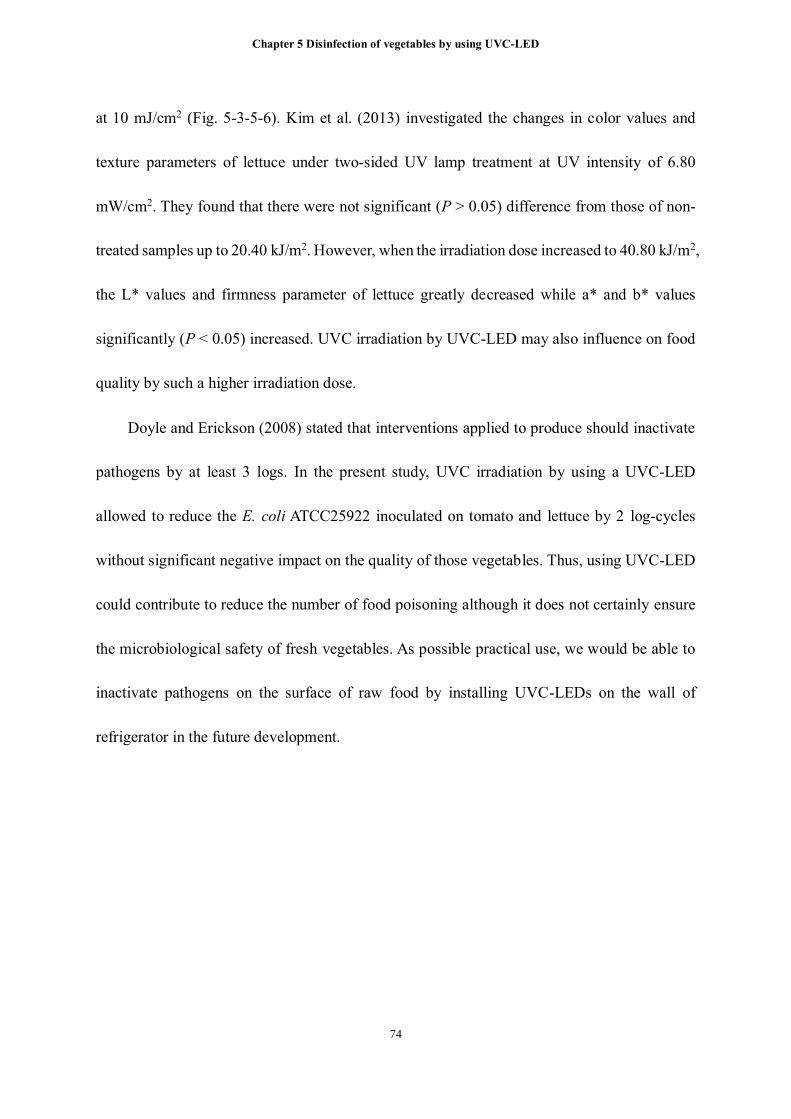
Chapter 5 Disinfection of vegetables by using UVC-LED
74
at 10 mJ/cm2 (Fig. 5-3-5-6). Kim et al. (2013) investigated the changes in color values and
texture parameters of lettuce under two-sided UV lamp treatment at UV intensity of 6.80
mW/cm2. They found that there were not significant (P > 0.05) difference from those of non-
treated samples up to 20.40 kJ/m2. However, when the irradiation dose increased to 40.80 kJ/m2,
the L* values and firmness parameter of lettuce greatly decreased while a* and b* values
significantly (P < 0.05) increased. UVC irradiation by UVC-LED may also influence on food
quality by such a higher irradiation dose.
Doyle and Erickson (2008) stated that interventions applied to produce should inactivate
pathogens by at least 3 logs. In the present study, UVC irradiation by using a UVC-LED
allowed to reduce the E. coli ATCC25922 inoculated on tomato and lettuce by 2 log-cycles
without significant negative impact on the quality of those vegetables. Thus, using UVC-LED
could contribute to reduce the number of food poisoning although it does not certainly ensure
the microbiological safety of fresh vegetables. As possible practical use, we would be able to
inactivate pathogens on the surface of raw food by installing UVC-LEDs on the wall of
refrigerator in the future development.

Chapter 5 Disinfection of vegetables by using UVC-LED
75
Fig. 5-4. The changes of firmness of cherry tomato (a) and lettuce (b) by UVC-LED at
0.013 mW/cm2. The error bars represent mean values with standard deviation (n = 5).
Chapter 5 Disinfection of vegetables by using UVC-LED
76
Fig. 5-5. Changes in the color of cherry tomato (a) and lettuce (b) by UVC-LED at 0.013
mW/cm2. The error bars represent mean values with standard deviation (n = 3).

Chapter 6 Summary
77
Chapter 6 Summary
6. Summary
In the present study, we investigated non-thermal microbial effect by ohmic heating and
UVC-LED.
In chapter 2, we investigated. the non-thermal effects of Ohmic heating on Bacillus
subtilis spores in a sodium chloride aqueous solution at 101°C (i.e., the boiling point) as well
as the effects of electric field intensity and frequency during Ohmic heating. The inactivation
effect on B. subtilis was greater for all electric field conditions (5, 10, and 20 V/cm) than for
conventional external heating. In particular, 20 V/cm showed a significantly higher inactivation
effect (P < 0.05) on B. subtilis than those of CH at 8, 10, 12, 14, and 16 min. However, there
were no significant differences (P > 0.05) in survival kinetics between 20 kHz, 40 kHz, and,
60 kHz; B. subtilis spores were inactivated more efficiently as the frequency increased. B.
subtilis spores were almost completely inactivated at 14–16 min for the 60 kHz treatment, but
spores were still alive at 20 kHz and 40 kHz for the same treatment times. These results
demonstrated that Ohmic heating inactivates B. subtilis spores more effectively than
conventional heating. Ohmic heating conditions with high electric field intensities and high
frequencies resulted in efficient B. subtilis spore inactivation
In chapter 3, we evaluated the applicability of an ultraviolet C light-emitting diode (UVC-
LED) for microbial inactivation in ice. The effects of UV intensity and UV dose of the UVC-
LED on Escherichia coli ATCC 25922 and the effects of the UVC-LED compared with a
conventional UV lamp on distilled water and ice cubes were investigated to evaluate the
Chapter 6 Summary
78
performance of the UVC-LED. Finally, we assessed the effects of the UVC-LED on pathogens
such as E. coli O157:H7, Salmonella Typhimurium, and Listeria monocytogenes in an ice cubes.
The results indicated that the microbial inactivation effect of the UVC-LED depended on the
UV dose at all UV intensity conditions in distilled water and ice, and the UVC-LED could
more efficiently inactivate E. coli ATCC 25922 in distilled water and ice than the UV lamp.
Furthermore, UVC-LED irradiation reduced the viable numbers of pathogen by 6–7 log cycles
under 160 mJ/cm2, although the bactericidal effect was slightly dependent on the type of
bacteria. L. monocytogenes in ice was relatively more sensitive to UVC irradiation than E. coli
O157:H7, and S. Typhimurium. These results demonstrated that UVC-LED irradiation could
contribute to assuring the safety of ice in the food industry.
In chapter 4, to maximize the characteristics of UVC-LED, we examined the effect of
multiple UVC-LEDs and the different irradiation angles of UVC on objective ice cube.
Furthermore, we developed a bench-scale test apparatus that is installed eight UVC-LED
modules placing in different angles and height. The bactericidal results indicated that increase
in the number of applying UVC-LED modules and increase in the directions of irradiation
tended to efficiently inactivate pathogenic bacteria in ice. In particular, irradiation by two
UVC-LED from two different directions showed significantly (P < 0.05) greater log-cycle
reductions of E. coli O157:H7 at 3.75, 18.8, and 56.3 mJ/cm2 and S. Typhimurium at 18.8
mJ/cm2 than those of the irradiation from same direction. However, there was no significant
difference (P > 0.05) in inactivation of L. monocytogenes between the irradiation procedures.
The similar bactericidal effect was found in the case of using three UVC-LEDs, while there

Chapter 6 Summary
79
were no significant differences (P > 0.05) regardless of the irradiation directions and kind of
bacteria. All the pathogenic bacteria in an ice cube were completely inactivated (> 6.2 log
CFU/mL) within 20 min irradiation by the developed bench scale test UVC-LED apparatus
under -30˚C environment. The results obtained in the present study would illustrate the
effective usage of UVC-LED for optimizing the bacterial inactivation by UVC irradiation.
In chapter 6, we investigated the effect of UVC-LED on bacteria in vegetable and on the
quality of vegetable, simultaneously. As the result, The UV-C irradiation by UVC-LED with
10 mJ/cm2 reduced the number of E. coli inoculated on tomatoes and lettuce by 2 log-cycles
without significant negative impact on the quality of those vegetables. Thus, using UVC-LED
could contribute to reduction of food poisoning although it does not certainly ensure the safety
of fresh vegetables.
These insights would contribute to reduction of thermal degradation of the food and
disinfection of the food which are not suitable for heating.

References
80
References
Allende, A., J. L. McEvoy, Y. Luo, F. Artes, and C. Y. Wang. 2006. Effectiveness of two-sided
UV-C treatments in inhibiting natural microflora and extending the shelf-life of minimally
processed “Red Oak Leaf” lettuce. Food Microbiol. 23:241–249.
Allenda Anonymous 2008. Role of commercial sanitizers and washing systems on epiphytic
microorganisms and sensory quality of fresh-cut escarole and lettuce. Postharvest Biology and
Technology. Elsevier 49:155–163.
Banerjee R, Chen H, Wu J. 1996. Milk protein-based edible film mechanical strength changes
due to ultrasound process. Journal of Food Science 61: 824–828.
Banik, S., S. Bandyopadhyay, and S. Ganguly. 2003. Bioeffects of microwave––a brief review.
Bioresource Technology 87:155–159.
Barbosa-Canovas, G. V., Gongora-Nieto, M. M., Pothakamury, U. R., Swanson, B. G. 1999.
Fundamentals of high-intensity pulsed electric fields (PEF). In "Preservation of foods with
pulsed electric fields". G. V. Barbosa-Canovas et al. edited. Academic Press. San Diego, CA,
USA. p. 1-19, 76-107, 108-155.
Baysal, A. H., and F. Icier. 2010. Inactivation kinetics of Alicyclobacillus acidoterrestris spores
in orange juice by ohmic heating: effects of voltage gradient and temperature on inactivation.
J. Food Prot. 73:299–304.
Bermudez-Aguirre, D., and G. V. Barbosa Canovas. 2013. Disinfection of selected vegetables
under nonthermal treatments: Chlorine, acid citric, ultraviolet light and ozone. Food Control.
Elsevier 29:82–90.
Beuchat, L.R., 1998. Surface Decontamination of Fruits and Veg-etables Eaten Raw:
A Review. World Health Organization, Gen-eva, Switzerland.
Bintsis, T., E. Litopoulou Tzanetaki, and R. K. Robinson. 2000. Existing and potential

References
81
applications of ultraviolet light in the food industry – a critical review. Journal of the Science
of Food and Agriculture. John Wiley & Sons, Ltd. 80:637–645.
Bolton, J. R., and K. G. Linden. 2003. Standardization of methods for fluence (UV dose)
determination in bench-scale UV experiments. J. Environ. Eng. 129:209–215.
Bowker, C., A. Sain, M. Shatalov, and J. Ducoste. 2011. Microbial UV fluence-response
assessment using a novel UV-LED collimated beam system. Water Res. 45:2011–2019.
Burnett, I. A., G. R. Weeks, and D. M. Harris. 1994. A hospital study of ice-making machines:
their bacteriology, design, usage and upkeep. J. Hosp. Infect. 28:305–313.
Chatterley, C., and K. Linden. 2010. Demonstration and evaluation of germicidal UV-LEDs
for point-of-use water disinfection. Journal of Water and Health 8:479–486.
Chavasit, V., K. Sirilaksanamanon, and P. Phithaksantayothin. 2011. Measures for controlling
safety of crushed ice and tube ice in developing country. Food Control 22:118–123.
Cho, H. Y., A. E. Yousef, and S. K. Sastry. 1999. Kinetics of inactivation of Bacillus subtilis
spores by continuous or intermittent ohmic and conventional heating. Biotechnol. Bioeng.
62:368–372.
Clydesdale, G. J., G. W. Dandie, and H. K. Muller. 2001. Ultraviolet light induced injury:
immunological and inflammatory effects. Immunol. Cell Biol. Nature Publishing Group
79:547–568.
Considine, K. M., A. L. Kelly, G. F. Fitzgerald, C. Hill, and R. D. Sleator. 2008. High‐pressure
processing – effects on microbial food safety and food quality. FEMS Microbiology Letters.
Blackwell Publishing Ltd 281:1–9.
Cserhalmi, Z., I. Vidacs, J. Beczner, and B. Czukor. 2002. Inactivation of Saccharomyces
cerevisiae and Bacillus cereus by pulsed electric fields technology. Innovative Food Science &
Emerging Technologies 3:41–45.
Doyle, M. P., and M. C. Erickson. 2008. Summer meeting 2007 the problems with fresh
References
82
produce: an overview. Journal of Applied Microbiology. Blackwell Publishing Ltd 105:317–
330.
Economou, V., P. Gousia, D. Kemenetzi, H. Sakkas, and C. Papadopoulou. 2016. Microbial
quality and histamine producing microflora analysis of the ice used for fish preservation. J.
Food Safety 37:e12285.
Evelyn, and F. V. M. Silva. 2016. High pressure thermal processing for the inactivation of
Clostridium perfringens spores in beef slurry. Innovative Food Science & Emerging
Technologies 33:26–31.
Falcão, J. 2002. Microbiological quality of ice used to refrigerate foods. Food Microbiol.
19:269–276.
Falcão, J. P., D. P. Falcão, and T. A. T. Gomes. 2004. Ice as a vehicle for diarrheagenic
Escherichia coli. Int. J. Food Microbiol. 91:99–103.
Falguera, V., J. Pagan, S. Garza, A. Garvín, and A. Ibarz. 2011. Ultraviolet processing of liquid
food: A review. Part 1: Fundamental engineering aspects. Food Res. Int. 44:1571–1579.
Falguera, V., J. Pagan, S. Garza, A. Garvín, and A. Ibarz. 2011. Ultraviolet processing of liquid
food: A review Part 2: Effects on microorganisms and on food components and properties.
Food Res. Int. 44:1580–1588.
Fan, X., and D. J. Geveke. 2007. Furan Formation in Sugar Solution and Apple Cider upon
Ultraviolet Treatment. J. Agric. Food Chem. American Chemical Society 55:7816–7821.
Farkas, D., & Hoover, D. G. 2000. High pressure processing. Journal of Food Science,
Supplement e Kinetics of Microbial Inactivation for Alternative Food Processing Technologies,
65, 47e64.
Feng H, Yang W. 2010. Power ultrasound. In: Hui YH (ed) Handbook of Food Science,
Technology and Engineering. Boca Raton, FL: CRC Press, pp. 121–127.
F. Sala, J. Burgos, S. Condo n, P. Lopez, J. Raso, in: New Methods of Food Preservation,

References
83
Blackie Academic & Professional, London, 1995, pp. 176–204.
Geeraerd, A. H., V. P. Valdramidis, and J. F. Van Impe. 2005. GInaFiT, a freeware tool to assess
non-log-linear microbial survivor curves. Int. J. Food Microbiol. 102:95–105.
Gerokomou, V., C. Voidarou, A. Vatopoulos, E. Velonakis, G. Rozos, A. Alexopoulos, S.
Plessas, E. Stavropoulou, E. Bezirtzoglou, P. G. Demertzis, and K. Akrida-Demertzi. 2011.
Physical, chemical and microbiological quality of ice used to cool drinks and foods in Greece
and its public health implications. Anaerobe 17:351–353.
Guan D, Hoover DG. 2005. Novel nonthermal treatments. In: Sapers GM, Gorny JR Yousef
AE (eds) Microbiology of Fruits And Vegetables. Boca Raton, FL: CRC Press, pp. 497–523.
Gil, M. I., M. V. Selma, F. López-Galvez, and A. Allende. 2009. Fresh-cut product sanitation
and wash water disinfection: Problems and solutions. Int. J. Food Microbiol. Elsevier 134:37–
45.
Guerrero-Beltran, J. A., and G. V. Barbosa-Canovas. 2004. Advantages and Limitations on
Processing Foods by UV Light. Food Science and Technology International 10:137–147.
Hijnen, W. A. M., E. F. Beerendonk, and G. J. Medema. 2006. Inactivation credit of UV
radiation for viruses, bacteria and protozoan (oo)cysts in water: a review. Water Res. 40:3–22.
Jun, S., and S. Sastry. 2005. Modeling and optimization of ohmic heating of foods inside a
flexible package. Journal of Food Process Engineering 28:417–436.
Jung S, Tonello-Samson C, Lamballerie-Anton MD. 2011. High hydrostatic pressure food
processing. In: Proctor A (ed) Alternatives to Conventional Food Processing. London: RSC
Publishing, pp. 254–306.
Khan, A. S., C. L. Moe, R. I. Glass, S. S. Monroe, M. K. Estes, L. E. Chapman, X. Jiang, C.
Humphrey, E. Pon, and J. K. Iskander. 1994. Norwalk virus-associated gastroenteritis traced to
ice consumption aboard a cruise ship in Hawaii: comparison and application of molecular
method-based assays. J. Clin. Microbiol. American Society for Microbiology (ASM) 32:318–

References
84
322.
Kim, Y.-H., S.-G. Jeong, K.-H. Back, K.-H. Park, M.-S. Chung, and D.-H. Kang. 2013. Effect
of various conditions on inactivation of Escherichia coli O157:H7, Salmonella Typhimurium,
and Listeria monocytogenes in fresh-cut lettuce using ultraviolet radiation. Int. J. Food
Microbiol. 166:349–355.
Kim, S.-J., D.-K. Kim, and D.-H. Kang. 2015. Using UVC light-emitting diodes at wavelengths
of 266 to 279 nanometers to inactivate foodborne pathogens and pasteurize sliced cheese. Appl.
Environ. Microbiol. 82:11–17.
Koutchma, T., B. Parisi, and E. Patazca. 2007. Validation of UV coiled tube reactor for fresh
juices. Journal of Environmental Engineering and Science 6:319–328.
Koutchma, T. 2009. Advances in ultraviolet light technology for non-thermal processing of
liquid foods. Food Bioprocess Technol. 2:138–155.
Kuhnert, N. 2002. Microwave-assisted reactions in organic synthesis--are there any nonthermal
microwave effects? Angew. Chem. Int. Ed. Engl. 41:1863–1866.
Lateef, A., J. K. Oloke, E. Kana, and E. Pacheco. 2006. The microbiological quality of ice used
to cool drinks and foods in Ogbomoso Metropolis, Southwest, Nigeria. Int. J. Food Safety
8:39–43.
Leizerson, S., and E. Shimoni. 2005. Effect of ultrahigh-temperature continuous ohmic heating
treatment on fresh orange juice. J. Agric. Food Chem. 53:3519–3524.
Lim, W., and M. A. Harrison. 2016. Effectiveness of UV light as a means to reduce Salmonella
contamination on tomatoes and food contact surfaces. Food Control 66:166–173.
Manzocco, L., S. Da Pieve, A. Bertolini, I. Bartolomeoli, M. Maifreni, A. Vianello, and M. C.
Nicoli. 2011. Surface decontamination of fresh-cut apple by UV-C light exposure: Effects on
structure, colour and sensory properties. Postharvest Biology and Technology 61:165–171.
Moore, E. W., E. W. Brown, and E. M. Hall. 1953. Sanitation of crushed ice for iced drinks.
References
85
Am J Public Health Nations Health 43:1265–1269.
Murashita, S., S. Kawamura, and S. Koseki. 2017. Inactivation of Nonpathogenic Escherichia
coli, Escherichia coli O157:H7, Salmonella enterica Typhimurium, and Listeria
monocytogenes in Ice Using a UVC Light-Emitting Diode. J. Food Prot. International
Association for Food Protection 80:1198–1203.
Neetoo, H., and H. Chen. 2014. Alternative Food Processing TechnologiesFood Processing.
John Wiley & Sons, Ltd, Chichester, UK.
Nichols, G., I. Gillespie, and J. de Louvois. 2000. The microbiological quality of ice used to
cool drinks and ready-to-eat food from retail and catering premises in the United Kingdom. J.
Food Prot. 63:78–82.
Ohlsson T, Bengtsson N. 2002. Minimal processing of foods with nonthermal methods. In:
Ohlsson T, Bengtsson N (eds) Minimal Processing Technologies in the Food Industry.
Cambridge: Woodhead Publishing, pp. 34–60.
Ou, Q.-X., M. Nikolic-Jaric, and M. Ganzle. 2017. Mechanisms of inactivation of Candida
humilis and Saccharomyces cerevisiae by pulsed electric fields. Bioelectrochemistry 115:47–
55.
Park, I.-K., and D.-H. Kang. 2013. Effect of electropermeabilization by ohmic heating for
inactivation of Escherichia coli O157:H7, Salmonella enterica serovar Typhimurium, and
Listeria monocytogenes in buffered peptone water and apple juice. Appl. Environ. Microbiol.
79:7122–7129.
Park, I.-K., J.-W. Ha, and D.-H. Kang. 2017. Investigation of optimum ohmic heating
conditions for inactivation of Escherichia coli O157:H7, Salmonella enterica serovar
Typhimurium, and Listeria monocytogenes in apple juice. BMC Microbiology. BioMed
Central 17:47.
Patterson MF. 2005. Microbiology of pressure-treated foods. Journal of Applied Microbiology

References
86
98: 1400–1409.
Pereira, R., J. Martins, C. Mateus, J. Teixeira, and A. Vicente. 2007. Death kinetics of
Escherichia coli in goat milk and Bacillus licheniformis in cloudberry jam treated by ohmic
heating. Chemical Papers 61.
Portenlanger G, Heusinger H. 1992. Chemical reactions induced by ultrasound and γ-rays in
aqueous solutions of L-ascorbic acid. Carbohydrate Research 232: 291–301.
Rai, S., Singh, U.P., Mishra, G.D., Singh, S.P., Samarketu, S.P., 1994. Effect of WaterOs
microwaves power density memory on fungal spore germination. Electro Magnetobiol. 13 (3),
247–252.
Raso, J., M. L. Calderón, M. Góngora, G. V. Barbosa Canovas, and B. G. Swanson. 2006.
Inactivation of Zygosaccharomyces Bailii in Fruit Juices by Heat, High Hydrostatic Pressure
and Pulsed Electric Fields. J. Food Sci. 63:1042–1044.
Rendueles, E., Omer, M. K., Alvseike, O., Alonso-Calleja, C., Capita, R., & Prieto, M. 2011.
Microbiological food safety assessment of high hydrostatic pressure processing: A re-
view. LWT–Food Science and Technology, 44, 1251–1260.
San Martin, M. F., Barbosa-Canovas, G. V., & Swanson, B. G. 2002. Food processing by high
hydrostatic pressure. Critical Reviews in Food Science and Nutrition, 42 (6), 627e645.
Sarang, S., S. K. Sastry, L. K. J. O. F. Engineering, 2008. Electrical conductivity of fruits and
meats during ohmic heating. Journal of Food Engineering 87:351–356.
Sastry, S. K., and S. SALENGKE. 1998. Ohmic heating of solid-liquid mixtures: a comparison
of mathematical models under worst-case heating comditions. Journal of Food Process
Engineering. Blackwell Publishing Ltd 21:441–458.
Seymour IJ. 2002. Ultrasound decontamination of minimally processed fruits and vegetables.
International Journal of Food Science and Technology 37: 547–550.
Sharma G. 2010. Ultraviolet light. In: Hui YH (ed) Handbook of Food Science, Technology

References
87
and Engineering. Boca Raton, FL: CRC Press, 122: 1–12.
Somavat, R., H. M. H. Mohamed, Y.-K. Chung, A. E. Yousef, and S. K. Sastry. 2012.
Accelerated inactivation of Geobacillus stearothermophilus spores by ohmic heating. Journal
of Food Engineering 108:69–76.
Somavat, R., H. M. H. Mohamed, and S. K. Sastry. 2013. Inactivation kinetics of Bacillus
coagulans spores under ohmic and conventional heating. LWT - Food Science and Technology
54:194–198.
Sommer, R., T. Haider, A. Cabaj, W. Pribil, and M. LHOTSKY. 1998. Time dose reciprocity in
UV disinfection of water. Water Science and Technology. No longer published by Elsevier
38:145–150.
Song, H. J., Choi, D. W., & Song, K. B. 2011. Effect of aqueous chlorine dioxide and UV-C
treatment on the microbial reduction and color of cherry tomatoes. Horticulture, Environment,
and Biotechnology, 52, 488e493.
Song, K., M. Mohseni, and F. Taghipour. 2016. Application of ultraviolet light-emitting diodes
(UV-LEDs) for water disinfection: A review. Water Res. 94:341–349.
Sotelo, K. A. G., N. Hamid, I. Oey, C. Pook, N. Gutierrez-Maddox, Q. Ma, S. Ying Leong, and
J. Lu. 2018. Red cherries (Prunus avium var. Stella) processed by pulsed electric field - Physical,
chemical and microbiological analyses. Food Chem. 240:926–934.
Stermer, R. A., M. Lasater-Smith, and C. F. Brasingtin. 1987. Ultraviolet Radiation—An
Effective Bactericide for Fresh Meat. J. Food Prot. 50:108–111.
Stojanovic J, Silva JL. 2007. Influence of osmotic concentration, continuous high frequency
ultrasound and dehydration on antioxidants, color and chemical properties of rabbiteye
blueberries. Food Chemistry 101: 898–906.
Tewari G. 2007. Microwave and radiofrequency heating. In: Tewari G, Juneja V K (eds)
Advances in Thermal and Non- Thermal Food Preservation. Ames, IA: Blackwell Publishing,
References
88
pp. 91–98.
Toepfl S, Heinz V, Knorr D. 2007. High intensity pulsed electric fields applied for food
preservation. Chemical Engineering and Processing 46: 537–546.
Tola, Y. B., and H. S. Ramaswamy. 2014. Thermal destruction kinetics of Bacillus
licheniformis spores in carrot juice extract as influenced by pH, type of acidifying agent and
heating method. LWT - Food Science and Technology 56:131–137.
Tsuno, M., M. Thungchai, D. Bhanthumkosol, Y. Tonogai, C. Jaengsawang, and A. Kingkate.
1984. Bacteriological survey of water and ice for general uses in Thailand. Food Microbiol.
Academic Press 1:123–128.
USA-FDA United States of America. 2015. Kinetics of microbial inactivation for alternative
food processing technologies -- ohmic and inductive heating. Available at:
http://www.fda.gov/Food/FoodScienceResearch/SafePracticesforFoodProcesses/ucm101246.
htm. Accessed 14 July 2016.
Vanlint D, Rutten N, Michiels CW, Aertsen A. 2012. Emergence and stability of high-pressure
resistance in different foodborne pathogens. Applied and Environmental Microbiology 78:
3234–3241.
Vega-Mercado H, Gongora-Nieto MM, Barbosa-Canovas GV, Swanson BG. 1999. Nonthermal
preservation of liquid foods using pulsed electric fields. In: Rahman MS (ed) Handbook of
Food Preservation. New York: Marcel Dekker, pp. 487–520.
Vicente, A., & Castro, I. 2007. Novel thermal processing technologies. In G. Tewari
& V. Juneja (Eds.), Advances in thermal and non-thermal food preservation. Oxford,
UK: Blackwell Publishing.
Whitney BM, Williams RC, Eifert J, Marcy J. 2007. High pres- sure resistance variation of
Escherichia coli O157: H7 strains and Salmonella serovars in tryptic soy broth, distilled water
and fruit juice. Journal of Food Protection 70: 2078–2083.

References
89
Würtele, M. A., T. Kolbe, M. Lipsz, A. Külberg, M. Weyers, M. Kneissl, and M. Jekel. 2011.
Application of GaN-based ultraviolet-C light emitting diodes--UV LEDs--for water
disinfection. Water Res. 45:1481–1489.
Yaun, B. R., S. S. Sumner, J. D. Eifert, and J. E. Marcy. 2004. Inhibition of pathogens on fresh
produce by ultraviolet energy. Int. J. Food Microbiol. 90:1–8.
Yildiz-Turp, G., I. Y. Sengun, P. Kendirci, and F. Icier. 2013. Effect of ohmic treatment on
quality characteristic of meat: a review. Meat Sci. 93:441–448.
Yoon, S., C. Yung, K. Lee, and C. Lee. 2002. Leakage of cellular materials from
Saccharomyces cerevisiae by ohmic heating. J Microbiol Biotechnol. 12: 183-188.
Development of non-thermal microbial inactivation techniques:
application of ohmic
heating and irradiation of UVC by light-emitting diode
March, 2016
Suguru Murashita
Laboratory of Agricultural and Food Process Engineering
Division of Biosystems Sustainability
Graduate School of Agricultural Science, Hokkaido University
Kita-9, Nishi-9, Kita-ku, Sapporo, Hokkaido, Japan
Tel. and Fax.: +81-11-706-2558
Related Documents