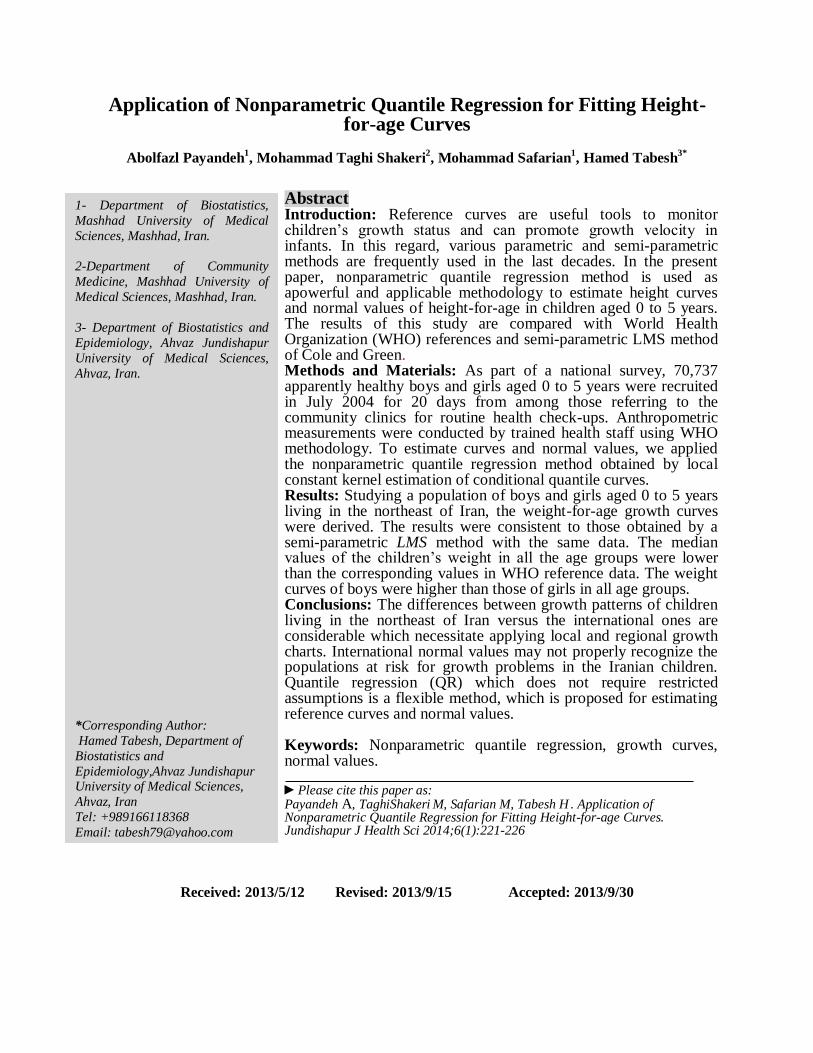
Application of Nonparametric Quantile Regression for Fitting Height- for-age Curves Abolfazl Payandeh 1 , Mohammad Taghi Shakeri 2 , Mohammad Safarian 1 , Hamed Tabesh 3* Abstract Introduction: Reference curves are useful tools to monitor children’s growth status and can promote growth velocity in infants. In this regard, various parametric and semi-parametric methods are frequently used in the last decades. In the present paper, nonparametric quantile regression method is used as apowerful and applicable methodology to estimate height curves and normal values of height-for-age in children aged 0 to 5 years. The results of this study are compared with World Health Organization (WHO) references and semi-parametric LMS method of Cole and Green. Methods and Materials: As part of a national survey, 70,737 apparently healthy boys and girls aged 0 to 5 years were recruited in July 2004 for 20 days from among those referring to the community clinics for routine health check-ups. Anthropometric measurements were conducted by trained health staff using WHO methodology. To estimate curves and normal values, we applied the nonparametric quantile regression method obtained by local constant kernel estimation of conditional quantile curves. Results: Studying a population of boys and girls aged 0 to 5 years living in the northeast of Iran, the weight-for-age growth curves were derived. The results were consistent to those obtained by a semi-parametric LMS method with the same data. The median values of the children’s weight in all the age groups were lower than the corresponding values in WHO reference data. The weight curves of boys were higher than those of girls in all age groups. Conclusions: The differences between growth patterns of children living in the northeast of Iran versus the international ones are considerable which necessitate applying local and regional growth charts. International normal values may not properly recognize the populations at risk for growth problems in the Iranian children. Quantile regression (QR) which does not require restricted assumptions is a flexible method, which is proposed for estimating reference curves and normal values. Keywords: Nonparametric quantile regression, growth curves, normal values. ►Please cite this paper as: Payandeh A, TaghiShakeri M, Safarian M, Tabesh H . Application of Nonparametric Quantile Regression for Fitting Height-for-age Curves. Jundishapur J Health Sci 2014;6(1):221-226 Received: 2013/5/12 Revised: 2013/9/15 Accepted: 2013/9/30 1- Department of Biostatistics, Mashhad University of Medical Sciences, Mashhad, Iran. 2-Department of Community Medicine, Mashhad University of Medical Sciences, Mashhad, Iran. 3- Department of Biostatistics and Epidemiology, Ahvaz Jundishapur University of Medical Sciences, Ahvaz, Iran. *Corresponding Author: Hamed Tabesh, Department of Biostatistics and Epidemiology,Ahvaz Jundishapur University of Medical Sciences, Ahvaz, Iran Tel: +989166118368 Email: [email protected]

Welcome message from author
This document is posted to help you gain knowledge. Please leave a comment to let me know what you think about it! Share it to your friends and learn new things together.
Transcript
Application of Nonparametric Quantile Regression for Fitting Height-for-age Curves
Abolfazl Payandeh
1, Mohammad Taghi Shakeri
2, Mohammad Safarian
1, Hamed Tabesh
3*
Abstract Introduction: Reference curves are useful tools to monitor children’s growth status and can promote growth velocity in infants. In this regard, various parametric and semi-parametric methods are frequently used in the last decades. In the present paper, nonparametric quantile regression method is used as apowerful and applicable methodology to estimate height curves and normal values of height-for-age in children aged 0 to 5 years. The results of this study are compared with World Health Organization (WHO) references and semi-parametric LMS method of Cole and Green. Methods and Materials: As part of a national survey, 70,737 apparently healthy boys and girls aged 0 to 5 years were recruited in July 2004 for 20 days from among those referring to the community clinics for routine health check-ups. Anthropometric measurements were conducted by trained health staff using WHO methodology. To estimate curves and normal values, we applied the nonparametric quantile regression method obtained by local constant kernel estimation of conditional quantile curves. Results: Studying a population of boys and girls aged 0 to 5 years living in the northeast of Iran, the weight-for-age growth curves were derived. The results were consistent to those obtained by a semi-parametric LMS method with the same data. The median values of the children’s weight in all the age groups were lower than the corresponding values in WHO reference data. The weight curves of boys were higher than those of girls in all age groups. Conclusions: The differences between growth patterns of children living in the northeast of Iran versus the international ones are considerable which necessitate applying local and regional growth charts. International normal values may not properly recognize the populations at risk for growth problems in the Iranian children. Quantile regression (QR) which does not require restricted assumptions is a flexible method, which is proposed for estimating reference curves and normal values. Keywords: Nonparametric quantile regression, growth curves, normal values. ►Please cite this paper as: Payandeh A, TaghiShakeri M, Safarian M, Tabesh H . Application of Nonparametric Quantile Regression for Fitting Height-for-age Curves. Jundishapur J Health Sci 2014;6(1):221-226
Received: 2013/5/12 Revised: 2013/9/15 Accepted: 2013/9/30
1- Department of Biostatistics,
Mashhad University of Medical
Sciences, Mashhad, Iran.
2-Department of Community
Medicine, Mashhad University of
Medical Sciences, Mashhad, Iran.
3- Department of Biostatistics and
Epidemiology, Ahvaz Jundishapur
University of Medical Sciences,
Ahvaz, Iran.
*Corresponding Author:
Hamed Tabesh, Department of
Biostatistics and
Epidemiology,Ahvaz Jundishapur University of Medical Sciences,
Ahvaz, Iran
Tel: +989166118368
Email: [email protected]
Application of Nonparametric Quantile …. 222
Jundishapur Journal of Health Sciences, Vol.6, Serial No.1, Winter 2014
Introduction Age and sex specified reference curve is a
tool to routinely monitor children’s
anthropometric data such as height growth.
Determining growth pattern in children for
some specific percentiles of anthropometric
measurements is of significance in health
policy. In addition, special attention to
height-for-age and weight-for-age has made
the two charts essential for children’s
growth monitoring.
For a random variable H(height), reference
curve presents the interval between two pre-
specified centiles (e.g. third and 97th) of the
distribution of H, FH(h). In health sciences,
abnormality may be suspected if observed
height (h) lies below the lower reference
limit or above the upper limit. There are
several methods to construct child growth
curves but Box-Cox power exponential
(BCPE), HRY and LMS are probably the
most widely applied approaches in practice
(1). For example WHO(2003) constructed
child growth curves based on the BCPE(2),
Cole et al. (1995) fitted summary centile
curves to body mass index data by using
LMS method and penalized likelihood(3).
Although existence of several methods
provide researchers with more options to
choose the best based data from,the methods
are not easy to use, systematically efficient
or robust to outliers(4,5).
Quantile regression is a superseded powerful
and applicable method to construct growth
curves. In the present study, we designed
height-for-age curves, which is an essential
component of the children toolkit (6), for
children aged 0-5 in Khorasan province in
northeast of Iran. We applied nonparametric
quantile regression method for estimating
conditional quantile curves. This method
estimated quantiles as a smooth function of
covariates without procrustean distributional
assumptions necessary for parametric
methods (6).Furthermore, this method is
robust to outliers.
Methods and Materials Koenker and Bassett (1978) proposed a
quantile regression method to estimate
conditional quantile functions. In their
proposed method, quantiles of distribution
of a dependent factor were determined as
functions of observed covariates. In this
method, the sum of the absolute deviations
of the error terms is minimized, whereas in
the ordinary regression method sum of
squared residuals is minimized(7). Quantile
regression can be parametric or
nonparametric. In general, the parametric
type is called quantile regression (QR).
In the parametric type, when covariates X
are considered, the linear conditional
quantile function, ( | ) ( ), can be estimated through:
( ) ∑
( )
for any quantile ( ).
The quantity ( ) is called the th
regression quantile(4, 8).
In the present paper, the nonparametric
quantile regression method was used to
estimate height curves and normal values.
This method was obtained by local constant
kernel estimation of conditional
quantiles(LCKECQ).To fit proposed
nonparametric quantile regression (NQR),
the “quantreq” package in the R program
was used. Furthermore respects subjective
choice method and also Gaussian kernel
were applied during analysis to assess
smoothing parameter (9).
223 Abolfazl Payandeh et al
Jundishapur Journal of Health Sciences, Vol.6, Serial No.1, Winter 2014
Results In our data set of 70,737 individuals, 36,034
(50.9%) are boys and 34,703 (49.1%) are
girls. Non-normality distribution of height in
the two sex groups (P < 0.000) and the
existence of some outliers in the data set,
suggested proposed and flexible QR method
to estimate growth curves and normal values
of height for age. Separately potting scatter
diagrams of height versus age for the boys
and the girls, did not propose any specified
pattern. Therefore, we used the
nonparametric type of the quantile
regression based on LCKECQ.
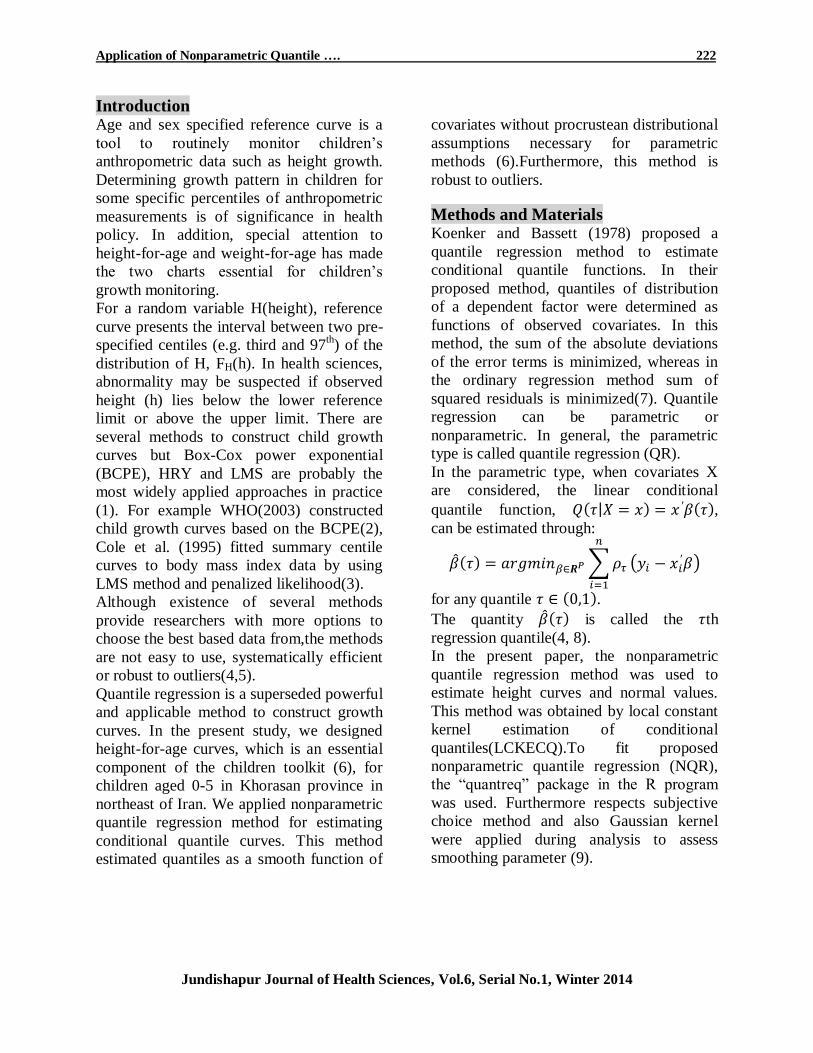
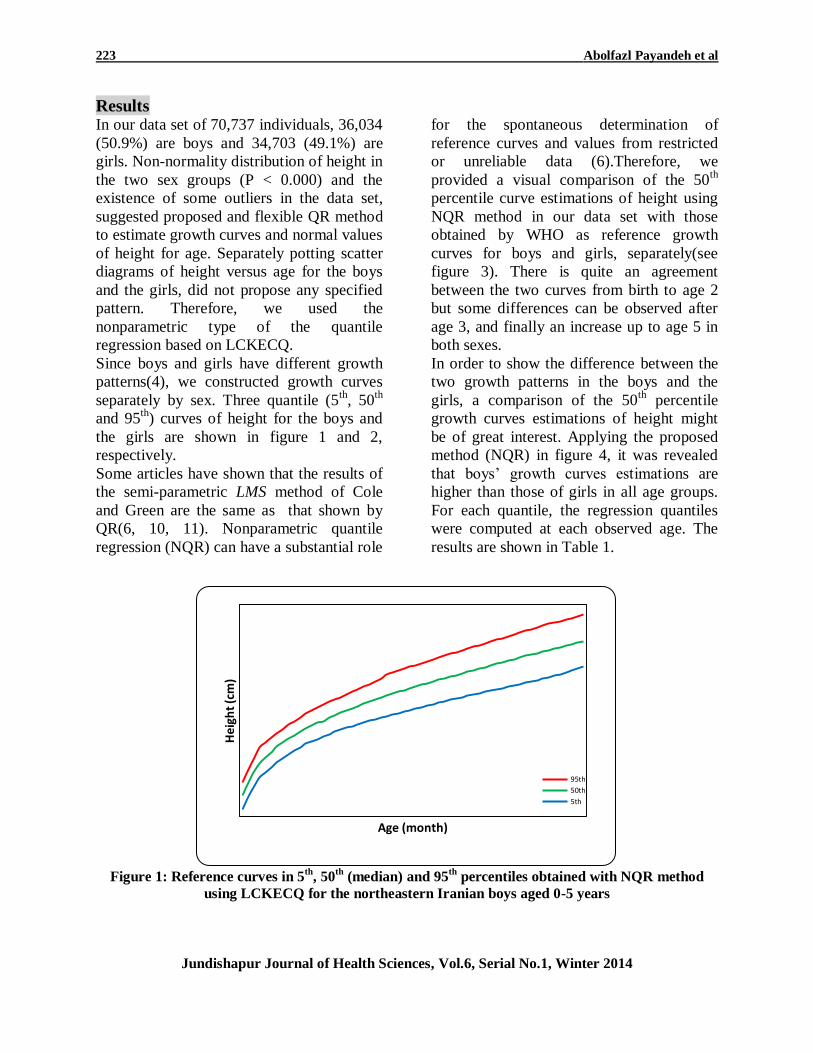
Since boys and girls have different growth
patterns(4), we constructed growth curves
separately by sex. Three quantile (5th
, 50th
and 95th
) curves of height for the boys and
the girls are shown in figure 1 and 2,
respectively.
Some articles have shown that the results of
the semi-parametric LMS method of Cole
and Green are the same as that shown by
QR(6, 10, 11). Nonparametric quantile
regression (NQR) can have a substantial role
for the spontaneous determination of
reference curves and values from restricted
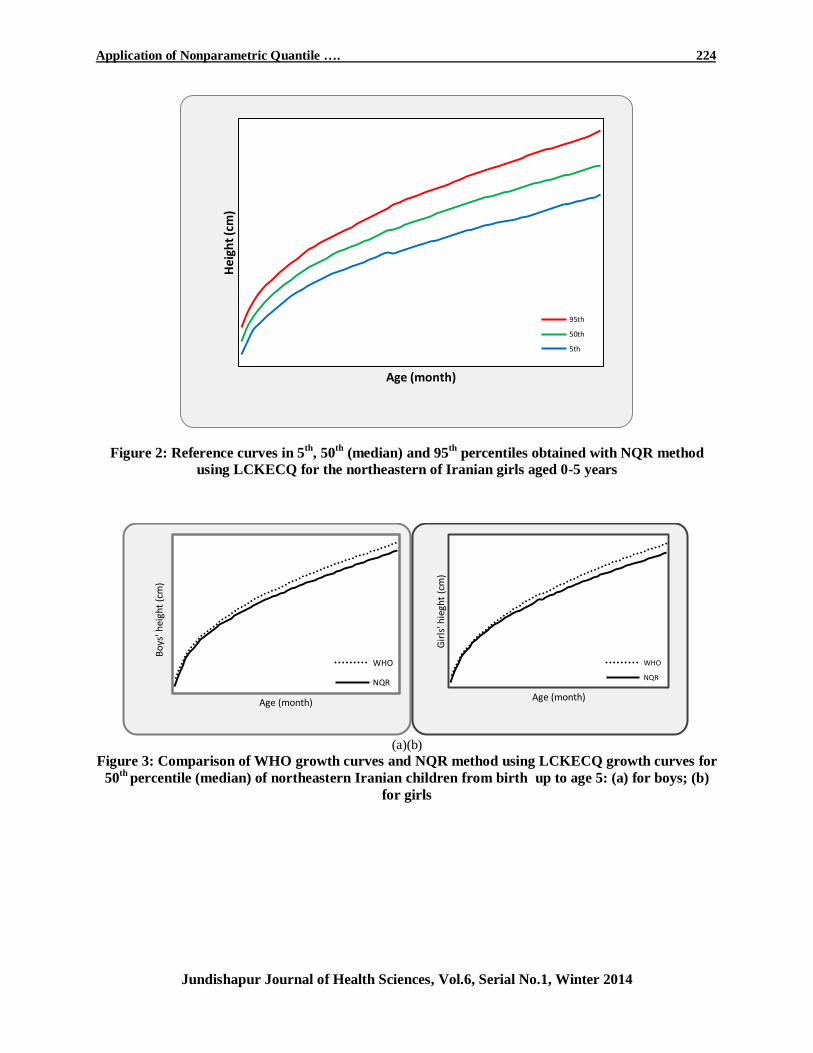
or unreliable data (6).Therefore, we
provided a visual comparison of the 50th
percentile curve estimations of height using
NQR method in our data set with those
obtained by WHO as reference growth
curves for boys and girls, separately(see
figure 3). There is quite an agreement
between the two curves from birth to age 2
but some differences can be observed after
age 3, and finally an increase up to age 5 in
both sexes.
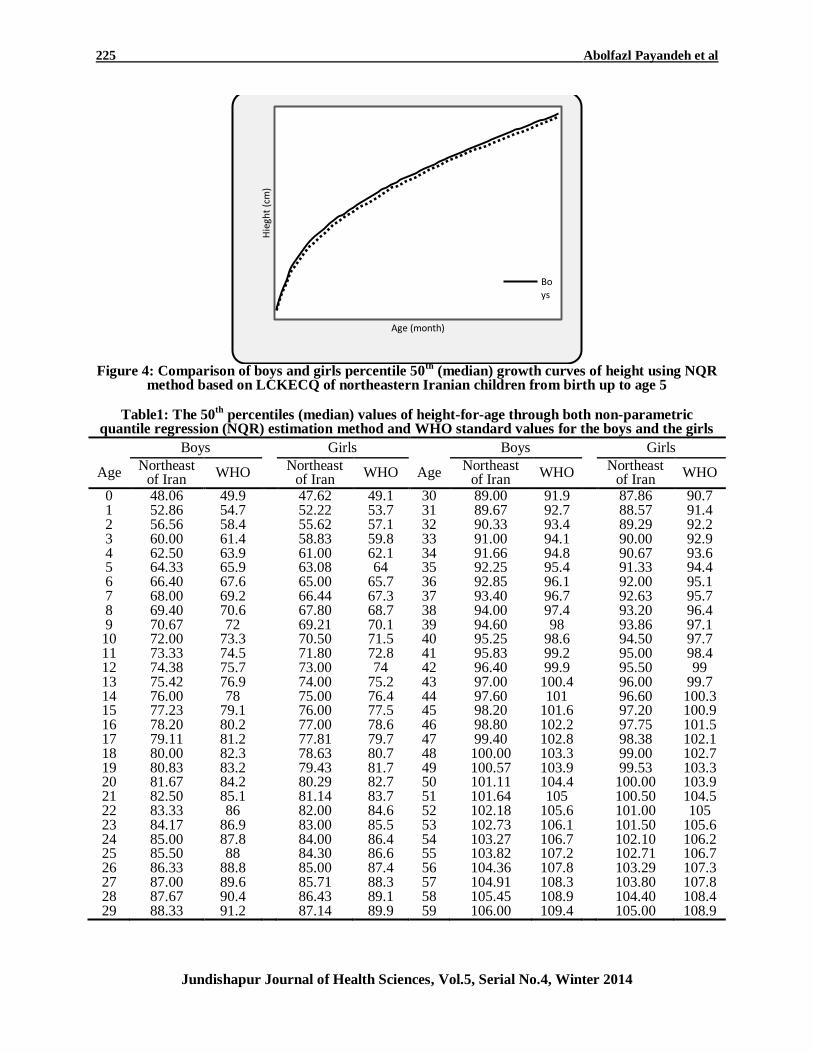
In order to show the difference between the
two growth patterns in the boys and the
girls, a comparison of the 50th
percentile
growth curves estimations of height might
be of great interest. Applying the proposed
method (NQR) in figure 4, it was revealed
that boys’ growth curves estimations are
higher than those of girls in all age groups.
For each quantile, the regression quantiles
were computed at each observed age. The
results are shown in Table 1.
Figure 1: Reference curves in 5
th, 50
th (median) and 95
th percentiles obtained with NQR method
using LCKECQ for the northeastern Iranian boys aged 0-5 years
Hei
ght
(cm
)
Age (month)
95th
50th
5th
Application of Nonparametric Quantile …. 224
Jundishapur Journal of Health Sciences, Vol.6, Serial No.1, Winter 2014
Figure 2: Reference curves in 5th
, 50th
(median) and 95th
percentiles obtained with NQR method
using LCKECQ for the northeastern of Iranian girls aged 0-5 years
(a)(b)
Figure 3: Comparison of WHO growth curves and NQR method using LCKECQ growth curves for
50th
percentile (median) of northeastern Iranian children from birth up to age 5: (a) for boys; (b)
for girls
Hei
ght
(cm
)
Age (month)
95th
50th
5th
Bo
ys' h
eigh
t (c
m)
Age (month)
WHO
NQR
Gir
ls' h
iegh
t (c
m)
Age (month)
WHO
NQR
225 Abolfazl Payandeh et al
Jundishapur Journal of Health Sciences, Vol.5, Serial No.4, Winter 2014
Figure 4: Comparison of boys and girls percentile 50
th (median) growth curves of height using NQR
method based on LCKECQ of northeastern Iranian children from birth up to age 5
Table1: The 50th
percentiles (median) values of height-for-age through both non-parametric quantile regression (NQR) estimation method and WHO standard values for the boys and the girls
Boys Girls
Boys Girls
Age Northeast
of Iran WHO
Northeast of Iran
WHO Age Northeast
of Iran WHO
Northeast of Iran
WHO
0 48.06 49.9 47.62 49.1 30 89.00 91.9 87.86 90.7 1 52.86 54.7 52.22 53.7 31 89.67 92.7 88.57 91.4 2 56.56 58.4 55.62 57.1 32 90.33 93.4 89.29 92.2 3 60.00 61.4 58.83 59.8 33 91.00 94.1 90.00 92.9 4 62.50 63.9 61.00 62.1 34 91.66 94.8 90.67 93.6 5 64.33 65.9 63.08 64 35 92.25 95.4 91.33 94.4 6 66.40 67.6 65.00 65.7 36 92.85 96.1 92.00 95.1 7 68.00 69.2 66.44 67.3 37 93.40 96.7 92.63 95.7 8 69.40 70.6 67.80 68.7 38 94.00 97.4 93.20 96.4 9 70.67 72 69.21 70.1 39 94.60 98 93.86 97.1 10 72.00 73.3 70.50 71.5 40 95.25 98.6 94.50 97.7 11 73.33 74.5 71.80 72.8 41 95.83 99.2 95.00 98.4 12 74.38 75.7 73.00 74 42 96.40 99.9 95.50 99 13 75.42 76.9 74.00 75.2 43 97.00 100.4 96.00 99.7 14 76.00 78 75.00 76.4 44 97.60 101 96.60 100.3 15 77.23 79.1 76.00 77.5 45 98.20 101.6 97.20 100.9 16 78.20 80.2 77.00 78.6 46 98.80 102.2 97.75 101.5 17 79.11 81.2 77.81 79.7 47 99.40 102.8 98.38 102.1 18 80.00 82.3 78.63 80.7 48 100.00 103.3 99.00 102.7 19 80.83 83.2 79.43 81.7 49 100.57 103.9 99.53 103.3 20 81.67 84.2 80.29 82.7 50 101.11 104.4 100.00 103.9 21 82.50 85.1 81.14 83.7 51 101.64 105 100.50 104.5 22 83.33 86 82.00 84.6 52 102.18 105.6 101.00 105 23 84.17 86.9 83.00 85.5 53 102.73 106.1 101.50 105.6 24 85.00 87.8 84.00 86.4 54 103.27 106.7 102.10 106.2 25 85.50 88 84.30 86.6 55 103.82 107.2 102.71 106.7 26 86.33 88.8 85.00 87.4 56 104.36 107.8 103.29 107.3 27 87.00 89.6 85.71 88.3 57 104.91 108.3 103.80 107.8 28 87.67 90.4 86.43 89.1 58 105.45 108.9 104.40 108.4 29 88.33 91.2 87.14 89.9 59 106.00 109.4 105.00 108.9
Hie
ght
(cm
)
Age (month)
Boys
Application of Nonparametric Quantile …. 226
Jundishapur Journal of Health Sciences, Vol.6, Serial No.1, Winter 2014
Conclusion We have presented a practical approach to draw
height growth charts through utilizing NQR, which
can also be applied for other growth charts such as
weight and Body Mass Index (BMI). Since the target
data used were reference data, the constructed charts
could be used as reference growth charts(12).
Our findings showed flexible ability of NQR for
handling the growth curve estimation problems.
Although NQR with local constant kernel estimation needs extra effort in comparison with parametric and
semi-parametric methods, NQR does not require
restricted assumptions. Therefore, it is proposed for
reference curves and normal values estimation.
Another advantage of using NQR for growth curves
is the ability to extend the conventional unconditional
models depending only on the subjects’ age to
models that contribute priorities and some other
covariates (11).
Some dissimilarities between northeastern of Iranian
children growth pattern versus international ones
necessitate using local growth curves. World Health Organization norms may lead us to misclassification
of abnormality for growth problems in the Iranian
children, thus, probably misleading for our healthcare
system. To achieve this important goal, the current
paper recommends using proposed nonparametric
quantile regression with special above mentioned
functions and advantages.
Acknowledgments
This research as an MSc thesis was supported by the
vice-president for research of Mashhad University of
Medical Sciences (MUMS) of Iran. The authors wish
to thank Dr. Yadollah Mehrabi for reading and
commenting on earlier versions of this paper.
References 1-Wright EM, Royston P. A comparison of statistical methods for age-related reference intervals. J Royal
Stat Soc (A)1997;160:47-69.
2-Onis M, Onyango A, Borghi E, Siyam A, Pinol A.
WHO Child Growth Standards. Geneva: WHO;
2006.
3-Cole TJ, Freeman JV, Preece MA. Body mass
index reference curves for the UK, 1990. Arch Dis
Child 1995;73(1):25-9.
4-Chen C. An introduction to quintile regression and
the QUANTREG procedure. Proceedings of the 30th
Annual SAS Users Group International Conference,
Cary, NC: SAS Institute Inc. 2005 April 10–13; Philadelphia, USA. P. 213–30. 5-Koenker R, Hallock KF. Quantile regression: An
introduction. Eco Pers 2001;15:43-56.
6-Gannoun A, Girard S, Guinot C, Saracco J.
Reference curves based on non-parametric quantile
regression. Stat Med 2002;21(20):3119-35.
7-Koenker R. Quantile regression. Cambridge:
Cambridge University Press;2005.
8-Buhai S. Quantile Regression: Overview and
Selected Applications. Ad Astra 2005;4:1-17.
9-Jamshidi F, Fallah Z, Keshavarz M. [Data and Statistics Density Estimate]. Tehran: Statistical
Research and Training Center; 2005. [In Persian]
10-Aslam M, Altfa S. Construction of Growth Charts
of Body Mass Index for Adults in Pakistan: A
Quantile Regression Approach. Pakistan J Nutr
2011;10(12):1179-82.
11-Wei Y, Pere A, Koenker R, He X. Quantile
regression methods for reference growth charts. Stat
Med 2006;25(8):1369-82.
12-Chen C. Growth Charts of Body Mass Index
(BMI) with Quantile Regression. Cary, NC: SAS
Institute Inc; 2005.
Related Documents