Journal of Chromatography A, 1218 (2011) 5047–5054 Contents lists available at ScienceDirect Journal of Chromatography A jou rn al h om epage: www.elsevier.com/locat e/chroma Application of multiwall carbon nanotubes-based matrix solid phase dispersion extraction for determination of hormones in butter by gas chromatography mass spectrometry Rui Su, Xinghua Wang, Xu Xu, Ziming Wang, Dan Li, Xin Zhao, Xueyuan Li, Hanqi Zhang, Aimin Yu ∗ College of Chemistry, Jilin University, 2699 Qianjin Street, Changchun 130012, China a r t i c l e i n f o Article history: Received 26 February 2011 Received in revised form 20 May 2011 Accepted 23 May 2011 Available online 1 June 2011 Keywords: Matrix solid phase dispersion extraction MWCNTs Estrogens Progestogens Butter samples a b s t r a c t The multiwall carbon nanotubes (MWCNTs)-based matrix solid phase dispersion (MSPD) was applied for the extraction of hormones, including 17--ethinylestradiol, 17--estradiol, estriol, 17--estradiol, estrone, medroxyprogesterone, progesterone and norethisterone acetate in butter samples. The method includes MSPD extraction of the target analytes from butter samples, derivatization of hormones with heptafluorobutyric acid anhydride–acetonitrile mixture, and determination by gas chromatography–mass spectrometry. The mixture containing 0.30 g graphitized MWCNTs and 0.10 g MWCNTs was selected as absorbent. Ethyl acetate was used as elution solvent. The elution solvent vol- ume and flow rate were 12 mL and 0.9 mL min −1 , respectively. The recoveries of hormones obtained by analyzing the five spiked butter samples were from 84.5 to 111.2% and relative standard deviations from 1.9 to 8.9%. Limits of detection and quantification for determining the analytes were in the range of 0.2–1.3 and 0.8–4.5 g kg −1 , respectively. Compared with other traditional methods, the proposed method is simpler in the operation and shorter in the sample pretreatment time. © 2011 Elsevier B.V. All rights reserved. 1. Introduction Butter is a kind of dairy and a valuable nutrient source for humans. However, the previous reports have questioned its safety because of steroid hormone contamination in butter [1,2]. The hor- mones including estrogen and progesterone are present in milk. The hormones cannot be destroyed or eliminated in the produc- tion of the butter with milk. The hormones are lipophilic and can be concentrated in the fat phase of dairy products [3]. The hormones at low-ng L −1 concentration could affect biological processes of humans due to their extremely high biological activities [4–6]. The information which comes from a German nutritional study indicate that a man would consume about 0.06 mg hormones daily and dairy products might account for up to 60% [3]. With increasing consump- tion of dairy products such as butter, amount of hormones to be consumed by humans increased. Bosland et al. reported that estro- gens influence prostate development and may also be involved in prostate carcinogenesis [7–10], and other researchers have specifi- cally stated that the estrogens may play a role of increasing the risk of breast cancer of women who consume more dairy [11–13]. It also was considered that estrogens have the sufficient biological activity to lead an increase of mitotic activity of endometrial cells and DNA ∗ Corresponding author. Tel.: +86 431 85168399; fax: +86 431 85112355. E-mail addresses: [email protected] (R. Su), [email protected] (A. Yu). replication errors [14]. In view of the importance and harmfulness of these compounds, to develop a rapid and sensitive method to detect the compounds in butter is necessary. Conventional methods for the determination of hormones usu- ally include gas chromatography–mass spectrometry (GC–MS) [15–18], liquid chromatography–MS [19], GC–tandem MS [20,21] and liquid chromatography–tandem MS [22,23]. Most of the researches were focused on environmental water and sediments. Up to now, several researchers quantified estrogens in skim milk [24–26] and whole milk [19,27,28], but few quantified estrogen and progesterone in butter. Actually, 1 kg of milk may produce approx- imately 3 g of butter. Moreover, most hormones have lipophilic characteristics and the concentrations of the hormones in the fat fraction of butter are higher than those in milk. To separate hor- mones from matrix of high level fat is difficult. Because of the complexity of biomatrices and the low concentration in samples, the determination of residual hormones in butter became a chal- lenging task. Currently, the acknowledged sensitive methods for determin- ing steroid hormones are radioimmunoassay (RIA) [28–32] and enzyme immunoassay (EIA) [33,34]. Although RIA and EIA are sensitive, they often suffer from poor specificity, accuracy and/or reproducibility due to the cross-reaction and lot-to-lot variation of antibodies [13]. What is more, the cost of experiment is so expen- sive that ordinary laboratory cannot afford the expense. Solid phase extraction (SPE) is often used to concentrate and purify hormones 0021-9673/$ – see front matter © 2011 Elsevier B.V. All rights reserved. doi:10.1016/j.chroma.2011.05.088

Welcome message from author
This document is posted to help you gain knowledge. Please leave a comment to let me know what you think about it! Share it to your friends and learn new things together.
Transcript
Aes
RC
a
ARRAA
KMMEPB
1
hbmTtbahitptcgpcowt
0d
Journal of Chromatography A, 1218 (2011) 5047– 5054
Contents lists available at ScienceDirect
Journal of Chromatography A
jou rn al h om epage: www.elsev ier .com/ locat e/chroma
pplication of multiwall carbon nanotubes-based matrix solid phase dispersionxtraction for determination of hormones in butter by gas chromatography masspectrometry
ui Su, Xinghua Wang, Xu Xu, Ziming Wang, Dan Li, Xin Zhao, Xueyuan Li, Hanqi Zhang, Aimin Yu ∗
ollege of Chemistry, Jilin University, 2699 Qianjin Street, Changchun 130012, China
r t i c l e i n f o
rticle history:eceived 26 February 2011eceived in revised form 20 May 2011ccepted 23 May 2011vailable online 1 June 2011
eywords:
a b s t r a c t
The multiwall carbon nanotubes (MWCNTs)-based matrix solid phase dispersion (MSPD) was appliedfor the extraction of hormones, including 17-�-ethinylestradiol, 17-�-estradiol, estriol, 17-�-estradiol,estrone, medroxyprogesterone, progesterone and norethisterone acetate in butter samples. Themethod includes MSPD extraction of the target analytes from butter samples, derivatization ofhormones with heptafluorobutyric acid anhydride–acetonitrile mixture, and determination by gaschromatography–mass spectrometry. The mixture containing 0.30 g graphitized MWCNTs and 0.10 g
atrix solid phase dispersion extractionWCNTs
strogensrogestogensutter samples
MWCNTs was selected as absorbent. Ethyl acetate was used as elution solvent. The elution solvent vol-ume and flow rate were 12 mL and 0.9 mL min−1, respectively. The recoveries of hormones obtainedby analyzing the five spiked butter samples were from 84.5 to 111.2% and relative standard deviationsfrom 1.9 to 8.9%. Limits of detection and quantification for determining the analytes were in the rangeof 0.2–1.3 and 0.8–4.5 �g kg−1, respectively. Compared with other traditional methods, the proposedmethod is simpler in the operation and shorter in the sample pretreatment time.
. Introduction
Butter is a kind of dairy and a valuable nutrient source forumans. However, the previous reports have questioned its safetyecause of steroid hormone contamination in butter [1,2]. The hor-ones including estrogen and progesterone are present in milk.
he hormones cannot be destroyed or eliminated in the produc-ion of the butter with milk. The hormones are lipophilic and cane concentrated in the fat phase of dairy products [3]. The hormonest low-ng L−1 concentration could affect biological processes ofumans due to their extremely high biological activities [4–6]. The
nformation which comes from a German nutritional study indicatehat a man would consume about 0.06 mg hormones daily and dairyroducts might account for up to 60% [3]. With increasing consump-ion of dairy products such as butter, amount of hormones to beonsumed by humans increased. Bosland et al. reported that estro-ens influence prostate development and may also be involved inrostate carcinogenesis [7–10], and other researchers have specifi-ally stated that the estrogens may play a role of increasing the risk
f breast cancer of women who consume more dairy [11–13]. It alsoas considered that estrogens have the sufficient biological activityo lead an increase of mitotic activity of endometrial cells and DNA
∗ Corresponding author. Tel.: +86 431 85168399; fax: +86 431 85112355.E-mail addresses: [email protected] (R. Su), [email protected] (A. Yu).
021-9673/$ – see front matter © 2011 Elsevier B.V. All rights reserved.oi:10.1016/j.chroma.2011.05.088
© 2011 Elsevier B.V. All rights reserved.
replication errors [14]. In view of the importance and harmfulnessof these compounds, to develop a rapid and sensitive method todetect the compounds in butter is necessary.
Conventional methods for the determination of hormones usu-ally include gas chromatography–mass spectrometry (GC–MS)[15–18], liquid chromatography–MS [19], GC–tandem MS [20,21]and liquid chromatography–tandem MS [22,23]. Most of theresearches were focused on environmental water and sediments.Up to now, several researchers quantified estrogens in skim milk[24–26] and whole milk [19,27,28], but few quantified estrogen andprogesterone in butter. Actually, 1 kg of milk may produce approx-imately 3 g of butter. Moreover, most hormones have lipophiliccharacteristics and the concentrations of the hormones in the fatfraction of butter are higher than those in milk. To separate hor-mones from matrix of high level fat is difficult. Because of thecomplexity of biomatrices and the low concentration in samples,the determination of residual hormones in butter became a chal-lenging task.
Currently, the acknowledged sensitive methods for determin-ing steroid hormones are radioimmunoassay (RIA) [28–32] andenzyme immunoassay (EIA) [33,34]. Although RIA and EIA aresensitive, they often suffer from poor specificity, accuracy and/or
reproducibility due to the cross-reaction and lot-to-lot variation ofantibodies [13]. What is more, the cost of experiment is so expen-sive that ordinary laboratory cannot afford the expense. Solid phaseextraction (SPE) is often used to concentrate and purify hormones
5 gr. A 1
itsdpma
mwmotcapaugfdtr
aNpotdwtMTtmfiias
2
2
��pcctfmUBs1wc
pNp
048 R. Su et al. / J. Chromato
n tissue, serum and water. Liquid–liquid extraction as a tradi-ional technology was applied to the extraction of hormones fromamples frequently [5,35], but usually followed with some obviousisadvantages, including the use of large volume of organic solvent,ollution and relatively high cost [36]. Ultrasonic extraction of hor-ones using organic solvent was reported, but SPE was required for
further purification [37–41].Matrix solid-phase dispersion (MSPD) as a sample preparation
ethod was first introduced in 1989 by Barker et al. [42]. MSPDas usually applied to solid and semisolid samples, including ani-al tissues and foods with a high lipidic content [43]. Application
f MSPD in food analysis revealed that MSPD has some advan-ages over classical extraction methods. MSPD presents a reducedonsumption of organic solvents, provides high extraction yieldsnd offers a considerable degree of selectivity. MSPD method com-rises sample homogenization, cellular disruption, fractionation,nd purification in a single process [44]. There are few papers aboutsing MSPD to extract hormones in fatty foods. Eight free progesto-ens were extracted from eggs by MSPD [45]. A automated systemor extracting acetylgestagens from kidney fat by MSPD [46] waseveloped. To the best of our knowledge, the simultaneous extrac-ion of estrogen and progesterone in butter by the MSPD is noteported.
Multiwall carbon nanotubes are carbon-based nanomaterials of kind [43]. As a supporting materials of dispersant sorbents, MWC-Ts show great potential to apply to the purification in samplereparation. In theory, MWCNTs have excellent adsorption abilitywing to their extremely large surface area and structural charac-eristics. The high adsorption ability for MWCNTs may be primarilyue to their dramatically hydrophobic surface and unique structureith internal tube cavity [47]. In order to simplify pre-treatment of
he samples, the mixture of 0.30 g graphitized MWCNTs and 0.10 gWCNTs was used as adsorbent material of MSPD in this paper.
he oxidized MWCNTs were used as the solid-phase micro extrac-ion fiber for extraction of phenols in aqueous samples [48], and the
ost robust results of the purification ability of carbon nanotubesor oil have also been provided [49]. The main purpose of this works to evaluate the application of MWCNTs in determining hormonesn butter samples by the MSPD extraction combined with GC–MSnalysis. MWCNTs were firstly used as adsorbents for the butterample cleanup and extraction of target hormones in MSPD.
. Experimental
.1. Chemicals and materials
The hormone standards (purity, 96.8–99.5%) including 17--ethinylestradiol (CEE), 17-�-estradiol (EE2), estriol (E3), 17--estradiol (E2), estrone (E1), medroxyprogesterone (MPG),rogesterone (PG) and norethisterone acetate (NEA) were pur-hased from Dr. Ehrenstorfer GmbH (Augsburg, Germany). Thehemical structures of the compounds are shown in Table 1. Hep-afluorobutyric acid anhydride (HFBA, purity > 98%) was purchasedrom J&K Chemical Ltd. (Beijing, China). HPLC grade acetonitrile,
ethanol and isooctane were obtained from Fisher Scientific (NJ,SA). Analytical-reagent grade ethyl acetate was obtained fromeijing Chemical Factory (Beijing, China). The mixed standard stockolution containing the eight hormones was prepared by dissolving0.0 mg of each compound in 10.0 mL methanol. The stock solutionas stored at 4 ◦C and diluted with methanol to give the required
oncentration.
MWCNTs (10–20 nm outer diameter, 10–30 �m length, >95%urity and >200 m2 g−1 special surface area), Graphitized MWC-Ts (GMWCNTs, 8–15 nm outer diameter, ∼50 �m length, >99.9%urity and >117 m2 g−1 special surface area) and Carboxyl MWC-
218 (2011) 5047– 5054
NTs (<8 nm outer diameter, 10–30 �m length, 3.86 wt.% –COOHcontent, >95% purity and >500 m2 g−1 special surface area) werepurchased from Chengdu Organic Chemistry Company (Chengdu,China).
2.2. Samples
Five kinds of butter samples which were produced in NewZealand (sample 1), France (sample 2), China (sample 3), Argentina(sample 4) and Denmark (sample 5), respectively, were purchasedfrom the supermarkets and stored at −20 ◦C in refrigerator beforeanalysis. Spiked samples were prepared by adding a proper vol-ume of standard working solution at required concentration into0.5 g of butter sample. The mixtures were homogenized by grind-ing for 15 min and then letting stand for 1 h at room temperature inthe dark. In this study, all experiments were carried out with sam-ple 1 except for the experiment mentioned in Section 3.4 in whichsamples 1–5 were used.
2.3. MSPD extraction
0.50 g of butter sample was added into an agate mortar. Then,0.40 g of adsorbent was added into it. The mixture was ground inthe mortar for 10 min until a homogenous paste was obtained. Themixture was transferred into a 5 mL column with a filter paper(Whatman no. 2, Maidstone, UK) at the bottom of the column. Thenthe mixture in the column was gently compressed using a syringepiston with another filter paper on the top of the sample mixture.
The analytes were eluted with 10 mL of ethyl acetate, and thenthe eluate was collected in the flask and evaporated to drynessunder the low pressure at 40 ◦C in a Heidolph-Laborata 4000 rotaryevaporator (Heizbad WB). Subsequently, the residue was dissolvedin 1.0 mL acetonitrile and the flask was washed with 0.4 mL ace-tonitrile. The resulting acetonitrile solutions were combined andcentrifuged at 15,000 rpm at −4 ◦C for 10.0 min. After centrifuga-tion, white floc was deposited on the bottom of the centrifuge tubeat low temperature. And 1.0 mL supernatant was rapidly passedthrough a 0.22 �m PTFE filter membrane and the resulting solutionwas referred to as sample solution.
2.4. Derivatization of hormones
The sample solution was evaporated to dryness under a gen-tle N2 stream, and the derivatization reaction was performed byadding 360 �L of HFBA–acetonitrile mixture (1:5, v/v) in the residueand then sealing the reaction system. After the reaction was per-formed at 65 ◦C for 1 h in water-bath [50,51], the resulting solutionwas cooled and evaporated to just dryness under a gentle streamof nitrogen. The residue was dissolved in 200 �L of isooctane andthe resulting solution was referred to as analytical solution.
2.5. GC–MS analysis
The analytical solution was analyzed using GC–MS QP 2010 (Shi-madzu, Kyoto, Japan). The derivatives of hormones were separatedwith a DB-5MS capillary column (30 m × 0.25 mm I.D., 0.25 �mfilm thickness, J&W Scientific, Folsom, CA, USA). Helium (purity,99.999%) was used as carrier gas at a constant flow of 1.0 mL min−1.The injection volume of analytical solution was 1 �L in the splitlessmode. The oven temperature was programmed as follows: 100 ◦Cfor 1 min; ramp to 200 ◦C at a rate of 30 ◦C min−1, held for 1 minand then ramp to 280 ◦C at a rate of 15 ◦C min−1, held for 10 min.
Mass spectrometric parameters: electron impact ionizationmode with an ionizing energy of 70 eV, injector temperature 280 ◦C,interface temperatures 250 ◦C, ion source temperature 200 ◦C. Sol-vent delay 9.5 min. The mass spectrometer was operated in the
R. Su et al. / J. Chromatogr. A 1218 (2011) 5047– 5054 5049
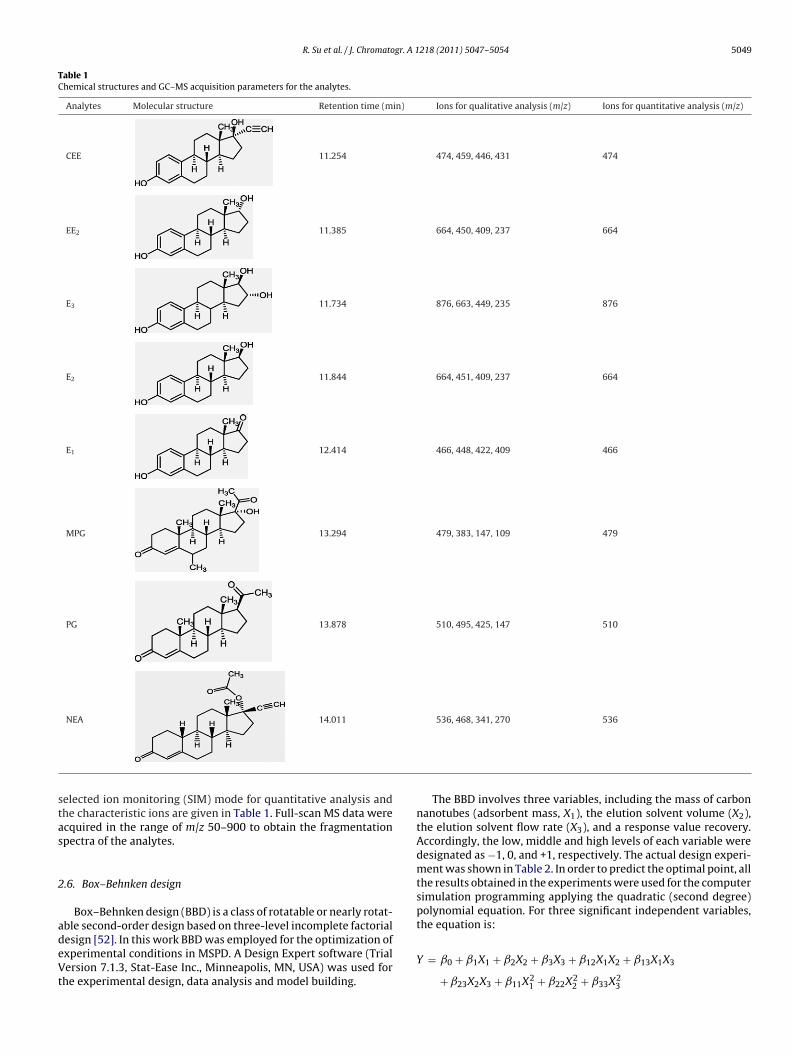
Table 1Chemical structures and GC–MS acquisition parameters for the analytes.
Analytes Molecular structure Retention time (min) Ions for qualitative analysis (m/z) Ions for quantitative analysis (m/z)
CEE 11.254 474, 459, 446, 431 474
EE2 11.385 664, 450, 409, 237 664
E3 11.734 876, 663, 449, 235 876
E2 11.844 664, 451, 409, 237 664
E1 12.414 466, 448, 422, 409 466
MPG 13.294 479, 383, 147, 109 479
PG 13.878 510, 495, 425, 147 510
NEA 14.011 536, 468, 341, 270 536
stas
2
adeVt
elected ion monitoring (SIM) mode for quantitative analysis andhe characteristic ions are given in Table 1. Full-scan MS data werecquired in the range of m/z 50–900 to obtain the fragmentationpectra of the analytes.
.6. Box–Behnken design
Box–Behnken design (BBD) is a class of rotatable or nearly rotat-ble second-order design based on three-level incomplete factorial
esign [52]. In this work BBD was employed for the optimization ofxperimental conditions in MSPD. A Design Expert software (Trialersion 7.1.3, Stat-Ease Inc., Minneapolis, MN, USA) was used forhe experimental design, data analysis and model building.
The BBD involves three variables, including the mass of carbonnanotubes (adsorbent mass, X1), the elution solvent volume (X2),the elution solvent flow rate (X3), and a response value recovery.Accordingly, the low, middle and high levels of each variable weredesignated as −1, 0, and +1, respectively. The actual design experi-ment was shown in Table 2. In order to predict the optimal point, allthe results obtained in the experiments were used for the computersimulation programming applying the quadratic (second degree)polynomial equation. For three significant independent variables,the equation is:
Y = ˇ0 + ˇ1X1 + ˇ2X2 + ˇ3X3 + ˇ12X1X2 + ˇ13X1X3
+ ˇ23X2X3 + ˇ11X21 + ˇ22X2
2 + ˇ33X23
5050 R. Su et al. / J. Chromatogr. A 1218 (2011) 5047– 5054
Table 2Experimental results based on BBD.
Experiments Coded levels Response: hormone recoveries (%)
X1 Adsorbentamount (g)
X2 Elution solventvolume (mL)
X3 Elution solvent flowrate (mL min−1)
CEE EE2 E3 E2 E1 MPG PG NEA
1 −1 (0.2) +1 (14.0) 0 (1.0) 26.9 21.2 26.9 24.0 24.1 21.8 33.3 37.12 0 (0.4) 0 (10.0) 0 (1.0) 90.3 83.2 85.2 67.6 113.0 95.3 86.5 94.73 +1 (0.6) 0 (10.0) −1 (0.5) 33.6 26.4 33.2 13.0 20.0 10.3 36.0 44.14 0 (0.4) −1 (6.0) +1 (1.5) 44.8 19.4 52.3 18.4 17.3 13.8 77.9 36.45 −1 (0.2) −1 (6.0) 0 (1.0) 52.2 20.8 33.2 12.9 16.0 18.9 56.6 50.76 0 (0.4) 0 (10.0) 0 (1.0) 99.3 66.6 102.7 64.5 73.3 65.4 89.4 87.17 0 (0.4) 0 (10.0) 0 (1.0) 109.0 68.3 95.0 84.4 114.1 94.3 93.4 88.78 0 (0.4) +1 (14.0) −1 (0.5) 48.5 14.2 16.4 16.2 22.6 15.2 42.8 31.99 0 (0.4) −1 (6.0) −1 (0.5) 51.5 17.1 33.5 46.0 34.6 22.3 91.9 52.3
10 +1 (0.6) 0 (10.0) +1 (1.5) 38.1 14.3 23.5 14.3 13.7 12.7 35.5 48.611 −1 (0.2) 0 (10.0) +1 (1.5) 54.5 25.6 32.8 22.1 25.0 23.0 66.8 63.012 0 (0.4) 0 (10.0) 0 (1.0) 83.6 83.2 92.1 86.0 114.5 88.2 102.5 91.013 +1 (0.6) −1 (6.0) 0 (1.0) 41.8 43.4 64.0 50.3 69.8 11.9 40.4 58.314 −1 (0.2) 0 (10.0) −1 (0.5) 36.6 17.3 26.9 49.9 73.1 16.2 36.2 41.5
80.6 55.2 44.2 43.6 48.0 60.1 42.1 53.838.8 36.3 32.0 14.4 12.3 13.0 67.2 64.499.3 80.2 90.1 89.3 103.5 85.1 99.2 80.9
wctc
3
3
ertwt
3
MMlHcycNtGfpGNimete3w
3
te
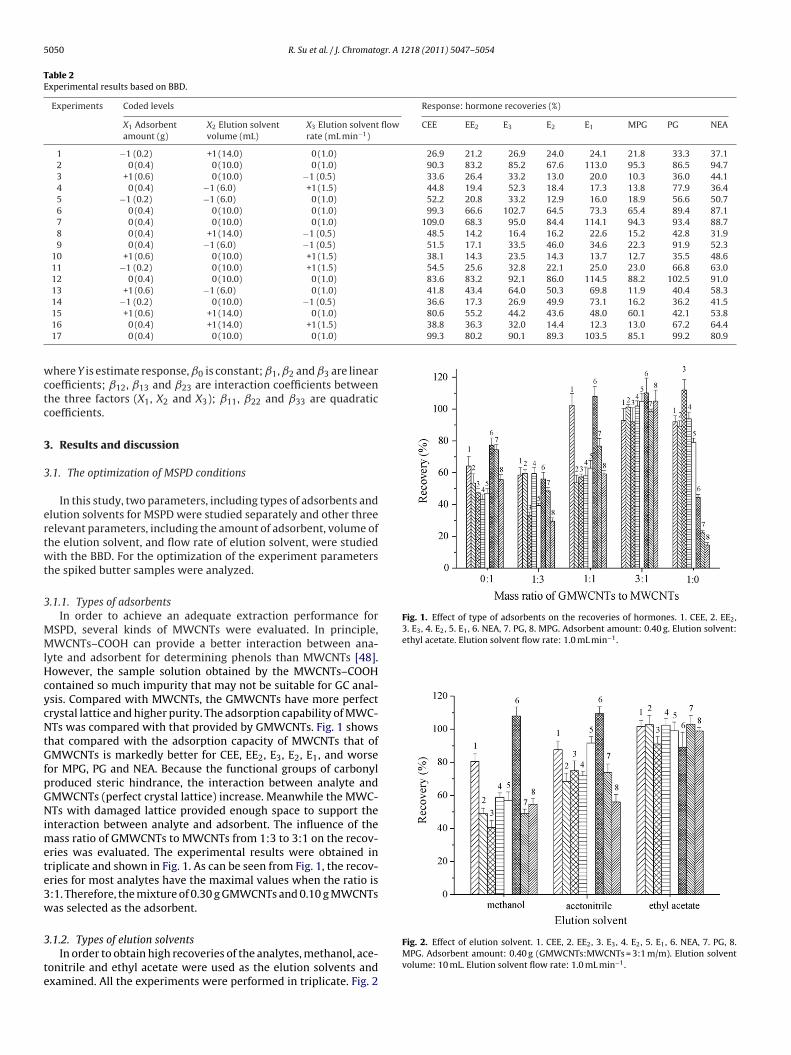
Fig. 1. Effect of type of adsorbents on the recoveries of hormones. 1. CEE, 2. EE2,3. E3, 4. E2, 5. E1, 6. NEA, 7. PG, 8. MPG. Adsorbent amount: 0.40 g. Elution solvent:ethyl acetate. Elution solvent flow rate: 1.0 mL min−1.
15 +1 (0.6) +1 (14.0) 0 (1.0)
16 0 (0.4) +1 (14.0) +1 (1.5)
17 0 (0.4) 0 (10.0) 0 (1.0)
here Y is estimate response, ˇ0 is constant; ˇ1, ˇ2 and ˇ3 are linearoefficients; ˇ12, ˇ13 and ˇ23 are interaction coefficients betweenhe three factors (X1, X2 and X3); ˇ11, ˇ22 and ˇ33 are quadraticoefficients.
. Results and discussion
.1. The optimization of MSPD conditions
In this study, two parameters, including types of adsorbents andlution solvents for MSPD were studied separately and other threeelevant parameters, including the amount of adsorbent, volume ofhe elution solvent, and flow rate of elution solvent, were studiedith the BBD. For the optimization of the experiment parameters
he spiked butter samples were analyzed.
.1.1. Types of adsorbentsIn order to achieve an adequate extraction performance for
SPD, several kinds of MWCNTs were evaluated. In principle,WCNTs–COOH can provide a better interaction between ana-
yte and adsorbent for determining phenols than MWCNTs [48].owever, the sample solution obtained by the MWCNTs–COOHontained so much impurity that may not be suitable for GC anal-sis. Compared with MWCNTs, the GMWCNTs have more perfectrystal lattice and higher purity. The adsorption capability of MWC-Ts was compared with that provided by GMWCNTs. Fig. 1 shows
hat compared with the adsorption capacity of MWCNTs that ofMWCNTs is markedly better for CEE, EE2, E3, E2, E1, and worse
or MPG, PG and NEA. Because the functional groups of carbonylroduced steric hindrance, the interaction between analyte andMWCNTs (perfect crystal lattice) increase. Meanwhile the MWC-Ts with damaged lattice provided enough space to support the
nteraction between analyte and adsorbent. The influence of theass ratio of GMWCNTs to MWCNTs from 1:3 to 3:1 on the recov-
ries was evaluated. The experimental results were obtained inriplicate and shown in Fig. 1. As can be seen from Fig. 1, the recov-ries for most analytes have the maximal values when the ratio is:1. Therefore, the mixture of 0.30 g GMWCNTs and 0.10 g MWCNTsas selected as the adsorbent.
.1.2. Types of elution solventsIn order to obtain high recoveries of the analytes, methanol, ace-
onitrile and ethyl acetate were used as the elution solvents andxamined. All the experiments were performed in triplicate. Fig. 2
Fig. 2. Effect of elution solvent. 1. CEE, 2. EE2, 3. E3, 4. E2, 5. E1, 6. NEA, 7. PG, 8.MPG. Adsorbent amount: 0.40 g (GMWCNTs:MWCNTs = 3:1 m/m). Elution solventvolume: 10 mL. Elution solvent flow rate: 1.0 mL min−1.
gr. A 1218 (2011) 5047– 5054 5051
sesa[
3r
mve
TrioiPTdm
Bsteat
ehrapatfltosp
sv
3
hd2dt
cnim
M
wpsw
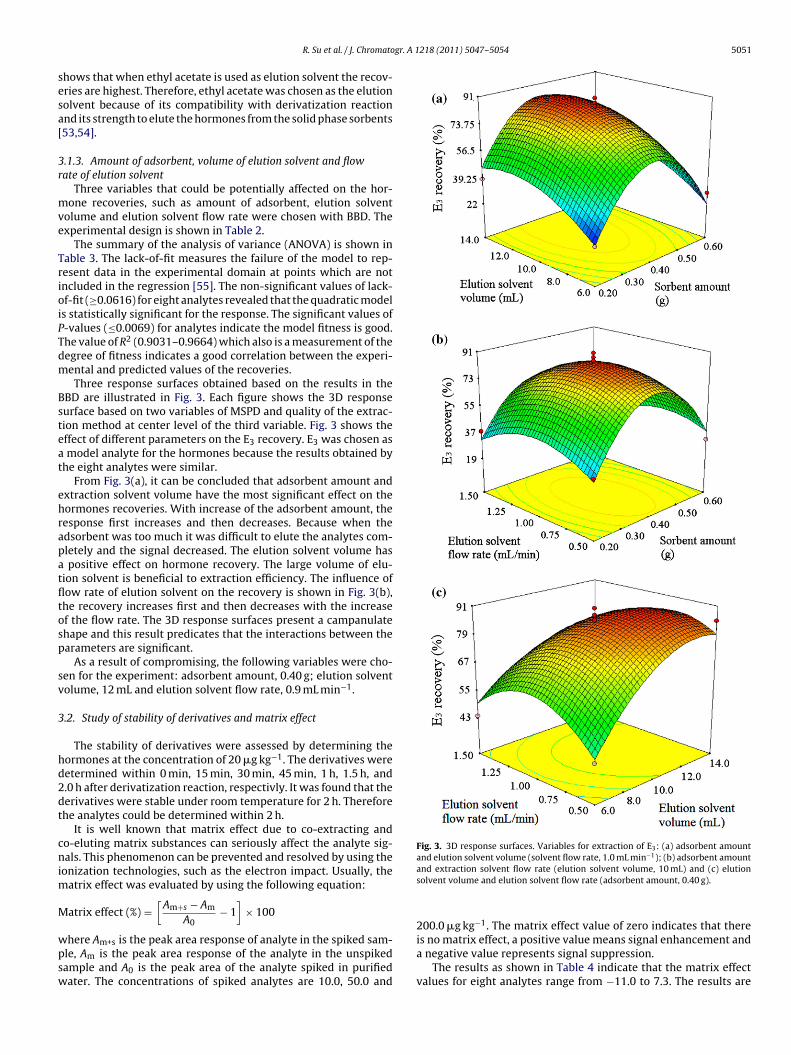
Fig. 3. 3D response surfaces. Variables for extraction of E3: (a) adsorbent amountand elution solvent volume (solvent flow rate, 1.0 mL min−1); (b) adsorbent amount
R. Su et al. / J. Chromato
hows that when ethyl acetate is used as elution solvent the recov-ries are highest. Therefore, ethyl acetate was chosen as the elutionolvent because of its compatibility with derivatization reactionnd its strength to elute the hormones from the solid phase sorbents53,54].
.1.3. Amount of adsorbent, volume of elution solvent and flowate of elution solvent
Three variables that could be potentially affected on the hor-one recoveries, such as amount of adsorbent, elution solvent
olume and elution solvent flow rate were chosen with BBD. Thexperimental design is shown in Table 2.
The summary of the analysis of variance (ANOVA) is shown inable 3. The lack-of-fit measures the failure of the model to rep-esent data in the experimental domain at points which are notncluded in the regression [55]. The non-significant values of lack-f-fit (≥0.0616) for eight analytes revealed that the quadratic models statistically significant for the response. The significant values of-values (≤0.0069) for analytes indicate the model fitness is good.he value of R2 (0.9031–0.9664) which also is a measurement of theegree of fitness indicates a good correlation between the experi-ental and predicted values of the recoveries.Three response surfaces obtained based on the results in the
BD are illustrated in Fig. 3. Each figure shows the 3D responseurface based on two variables of MSPD and quality of the extrac-ion method at center level of the third variable. Fig. 3 shows theffect of different parameters on the E3 recovery. E3 was chosen as
model analyte for the hormones because the results obtained byhe eight analytes were similar.
From Fig. 3(a), it can be concluded that adsorbent amount andxtraction solvent volume have the most significant effect on theormones recoveries. With increase of the adsorbent amount, theesponse first increases and then decreases. Because when thedsorbent was too much it was difficult to elute the analytes com-letely and the signal decreased. The elution solvent volume has
positive effect on hormone recovery. The large volume of elu-ion solvent is beneficial to extraction efficiency. The influence ofow rate of elution solvent on the recovery is shown in Fig. 3(b),he recovery increases first and then decreases with the increasef the flow rate. The 3D response surfaces present a campanulatehape and this result predicates that the interactions between thearameters are significant.
As a result of compromising, the following variables were cho-en for the experiment: adsorbent amount, 0.40 g; elution solventolume, 12 mL and elution solvent flow rate, 0.9 mL min−1.
.2. Study of stability of derivatives and matrix effect
The stability of derivatives were assessed by determining theormones at the concentration of 20 �g kg−1. The derivatives wereetermined within 0 min, 15 min, 30 min, 45 min, 1 h, 1.5 h, and.0 h after derivatization reaction, respectivly. It was found that theerivatives were stable under room temperature for 2 h. Thereforehe analytes could be determined within 2 h.
It is well known that matrix effect due to co-extracting ando-eluting matrix substances can seriously affect the analyte sig-als. This phenomenon can be prevented and resolved by using the
onization technologies, such as the electron impact. Usually, theatrix effect was evaluated by using the following equation:
atrix effect (%) =[
Am+s − Am
A0− 1
]× 100
here Am+s is the peak area response of analyte in the spiked sam-le, Am is the peak area response of the analyte in the unspikedample and A0 is the peak area of the analyte spiked in purifiedater. The concentrations of spiked analytes are 10.0, 50.0 and
and extraction solvent flow rate (elution solvent volume, 10 mL) and (c) elutionsolvent volume and elution solvent flow rate (adsorbent amount, 0.40 g).
200.0 �g kg−1. The matrix effect value of zero indicates that thereis no matrix effect, a positive value means signal enhancement and
a negative value represents signal suppression.The results as shown in Table 4 indicate that the matrix effectvalues for eight analytes range from −11.0 to 7.3. The results are
5052 R. Su et al. / J. Chromatogr. A 1218 (2011) 5047– 5054
Table 3Parameters for the BBD.
ˇ0 ˇ1 ˇ2 ˇ3 ˇ12 ˇ13 ˇ23 ˇ11 ˇ22 ˇ33 P-value of the mode Lack of fit value R2
CEE 92.24 1.85 7.56 −2.14 16.28 −5.88 −9.00 −29.54 −12.57 −19.52 0.0010 0.0845 0.9486EE2 78.70 6.81 10.03 −0.91 −2.15 −10.13 −8.55 −35.71 −2.84 −17.11 0.0006 0.1949 0.9550E3 84.22 −1.22 10.67 −4.26 −0.26 −4.09 −6.27 −38.81 −11.71 −14.29 0.0002 0.1239 0.9664E2 86.16 0.77 11.45 −9.12 −7.95 −7.20 −2.80 −35.56 −14.41 −22.26 0.0080 0.1314 0.9031E1 92.88 4.39 11.68 −7.89 −2.55 −11.88 −4.25 −37.43 −14.45 −25.23 0.0014 0.1607 0.9434MPG 85.66 5.62 12.89 −6.44 3.80 −6.10 −0.93 −34.02 −15.99 −31.09 0.0023 0.5634 0.9343PG 90.80 2.02 14.20 −4.68 −5.01 −12.27 −5.39 −35.17 −16.31 −19.52 0.0069 0.1572 0.9074NEA 86.68 8.31 9.19 −7.43 −0.48 −8.00 −6.65 −37.95 −13.50 −20.68 0.0003 0.0616 0.9655
Table 4Analytical performances and matrix effect.
Analyte Linear range (�g kg−1) LOD (�g kg−1) LOQ (�g kg−1) R Matrix effect (%)
CEE 5–300 1.3 4.5 0.9982 −11.0EE2 2–300 0.5 1.8 0.9989 −8.2E3 2–300 0.5 1.7 0.9986 −6.4E2 1–300 0.3 0.9 0.9985 1.8E1 1–300 0.2 0.8 0.9981 −4.7
am
3
fsiA(tmtba
F8
MPG 2–300 0.4
PG 2–300 0.5
NEA 2–300 0.4
cceptable and it can be concluded that the matrix effect of theethod is not serious, and the sample pretreatment is successful.
.3. Method performance
In order to evaluate the performances of the proposed methodor quantitative determination of hormones in butter, some spikedamples were used for constructing calibration curves and obtain-ng other analytical performances under the optimized condition.s shown in Table 4, limit of detection (LOD) and quantification
LOQ) are regarded as the lowest concentrations of the analyteshat can be confidently identified and quantified by the proposed
ethod, respectively. The LOD and LOQ are the analyte concentra-ions producing signal/noise ratio of 3 and 10, respectively. As cane seen in Table 4, the LODs and LOQs are in the range of 0.2–1.3nd 0.8–4.5 �g kg−1, respectively. To establish the linearity of the
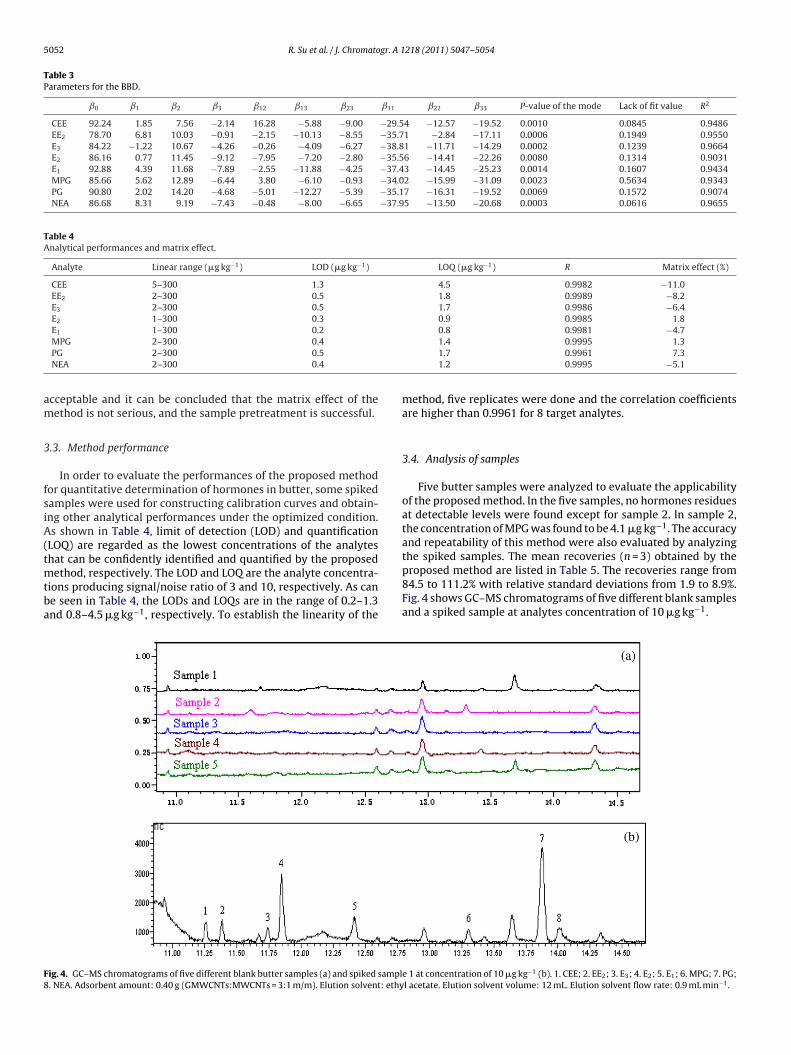
ig. 4. GC–MS chromatograms of five different blank butter samples (a) and spiked sampl. NEA. Adsorbent amount: 0.40 g (GMWCNTs:MWCNTs = 3:1 m/m). Elution solvent: ethy
1.4 0.9995 1.31.7 0.9961 7.31.2 0.9995 −5.1
method, five replicates were done and the correlation coefficientsare higher than 0.9961 for 8 target analytes.
3.4. Analysis of samples
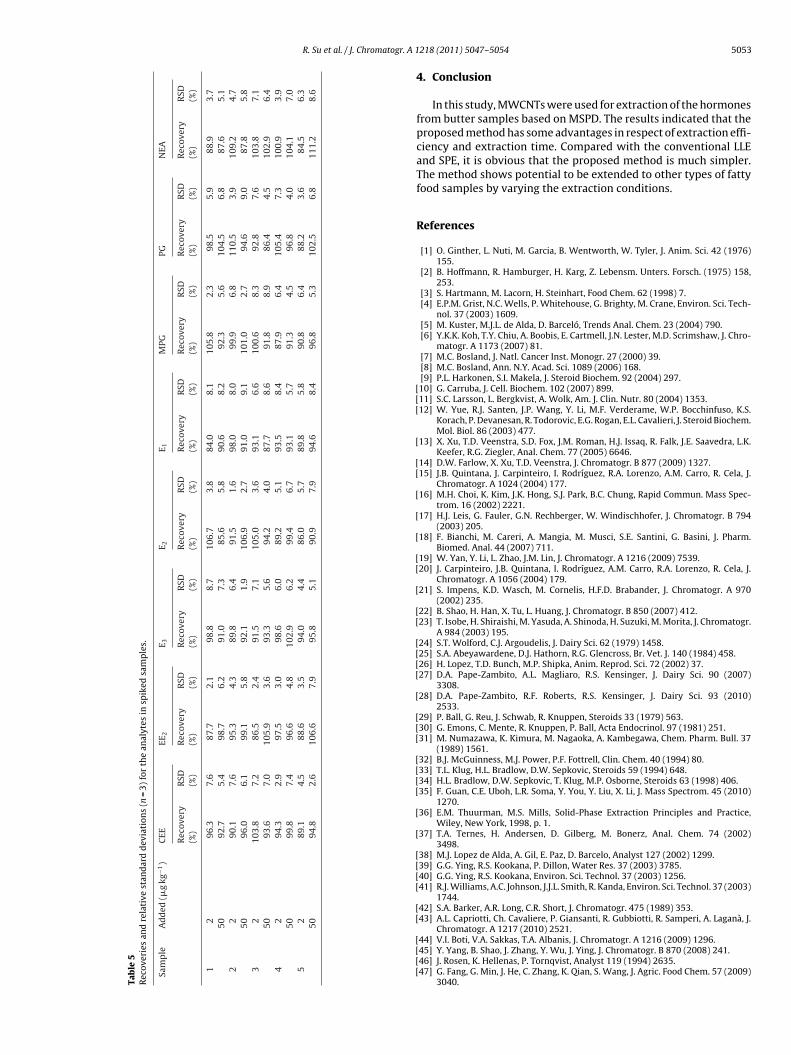
Five butter samples were analyzed to evaluate the applicabilityof the proposed method. In the five samples, no hormones residuesat detectable levels were found except for sample 2. In sample 2,the concentration of MPG was found to be 4.1 �g kg−1. The accuracyand repeatability of this method were also evaluated by analyzingthe spiked samples. The mean recoveries (n = 3) obtained by the
proposed method are listed in Table 5. The recoveries range from84.5 to 111.2% with relative standard deviations from 1.9 to 8.9%.Fig. 4 shows GC–MS chromatograms of five different blank samplesand a spiked sample at analytes concentration of 10 �g kg−1.e 1 at concentration of 10 �g kg−1 (b). 1. CEE; 2. EE2; 3. E3; 4. E2; 5. E1; 6. MPG; 7. PG;l acetate. Elution solvent volume: 12 mL. Elution solvent flow rate: 0.9 mL min−1.
R. Su et al. / J. Chromatogr. A 1
Tab
le
5R
ecov
erie
s
and
rela
tive
stan
dar
d
dev
iati
ons
(n
=
3)
for
the
anal
ytes
in
spik
ed
sam
ple
s.
Sam
ple
Ad
ded
(�g
kg−1
)C
EEEE
2E 3
E 2E 1
MPG
PG
NEA
Rec
over
y(%
)R
SD(%
)R
ecov
ery
(%)
RSD
(%)
Rec
over
y(%
)R
SD(%
)R
ecov
ery
(%)
RSD
(%)
Rec
over
y(%
)R
SD(%
)R
ecov
ery
(%)
RSD
(%)
Rec
over
y(%
)R
SD(%
)R
ecov
ery
(%)
RSD
(%)
12
96.3
7.6
87.7
2.1
98.8
8.7
106.
7
3.8
84.0
8.1
105.
8
2.3
98.5
5.9
88.9
3.7
5092
.7
5.4
98.7
6.2
91.0
7.3
85.6
5.8
90.6
8.2
92.3
5.6
104.
5
6.8
87.6
5.1
22
90.1
7.6
95.3
4.3
89.8
6.4
91.5
1.6
98.0
8.0
99.9
6.8
110.
5 3.
9
109.
2
4.7
50
96.0
6.1
99.1
5.8
92.1
1.9
106.
9
2.7
91.0
9.1
101.
0
2.7
94.6
9.0
87.8
5.8
32
103.
8
7.2
86.5
2.4
91.5
7.1
105.
0
3.6
93.1
6.6
100.
6
8.3
92.8
7.6
103.
8
7.1
50
93.6
7.0
105.
9
3.6
93.3
5.6
94.2
4.0
87.7
8.6
91.8
8.9
86.4
4.5
102.
9
6.4
42
94.3
2.9
97.5
3.0
98.6
6.0
89.2
5.1
93.5
8.4
87.9
6.4
105.
4
7.3
100.
9
3.9
5099
.8
7.4
96.6
4.8
102.
9
6.2
99.4
6.7
93.1
5.7
91.3
4.5
96.8
4.0
104.
1
7.0
52
89.1
4.5
88.6
3.5
94.0
4.4
86.0
5.7
89.8
5.8
90.8
6.4
88.2
3.6
84.5
6.3
50
94.8
2.6
106.
6
7.9
95.8
5.1
90.9
7.9
94.6
8.4
96.8
5.3
102.
5
6.8
111.
2
8.6
[[[
[
[[
[
[
[
[[
[
[[
[[[[
[
[[[
[[[[
[
[
[[[[
[[
[[[[
218 (2011) 5047– 5054 5053
4. Conclusion
In this study, MWCNTs were used for extraction of the hormonesfrom butter samples based on MSPD. The results indicated that theproposed method has some advantages in respect of extraction effi-ciency and extraction time. Compared with the conventional LLEand SPE, it is obvious that the proposed method is much simpler.The method shows potential to be extended to other types of fattyfood samples by varying the extraction conditions.
References
[1] O. Ginther, L. Nuti, M. Garcia, B. Wentworth, W. Tyler, J. Anim. Sci. 42 (1976)155.
[2] B. Hoffmann, R. Hamburger, H. Karg, Z. Lebensm. Unters. Forsch. (1975) 158,253.
[3] S. Hartmann, M. Lacorn, H. Steinhart, Food Chem. 62 (1998) 7.[4] E.P.M. Grist, N.C. Wells, P. Whitehouse, G. Brighty, M. Crane, Environ. Sci. Tech-
nol. 37 (2003) 1609.[5] M. Kuster, M.J.L. de Alda, D. Barceló, Trends Anal. Chem. 23 (2004) 790.[6] Y.K.K. Koh, T.Y. Chiu, A. Boobis, E. Cartmell, J.N. Lester, M.D. Scrimshaw, J. Chro-
matogr. A 1173 (2007) 81.[7] M.C. Bosland, J. Natl. Cancer Inst. Monogr. 27 (2000) 39.[8] M.C. Bosland, Ann. N.Y. Acad. Sci. 1089 (2006) 168.[9] P.L. Harkonen, S.I. Makela, J. Steroid Biochem. 92 (2004) 297.10] G. Carruba, J. Cell. Biochem. 102 (2007) 899.11] S.C. Larsson, L. Bergkvist, A. Wolk, Am. J. Clin. Nutr. 80 (2004) 1353.12] W. Yue, R.J. Santen, J.P. Wang, Y. Li, M.F. Verderame, W.P. Bocchinfuso, K.S.
Korach, P. Devanesan, R. Todorovic, E.G. Rogan, E.L. Cavalieri, J. Steroid Biochem.Mol. Biol. 86 (2003) 477.
13] X. Xu, T.D. Veenstra, S.D. Fox, J.M. Roman, H.J. Issaq, R. Falk, J.E. Saavedra, L.K.Keefer, R.G. Ziegler, Anal. Chem. 77 (2005) 6646.
14] D.W. Farlow, X. Xu, T.D. Veenstra, J. Chromatogr. B 877 (2009) 1327.15] J.B. Quintana, J. Carpinteiro, I. Rodríguez, R.A. Lorenzo, A.M. Carro, R. Cela, J.
Chromatogr. A 1024 (2004) 177.16] M.H. Choi, K. Kim, J.K. Hong, S.J. Park, B.C. Chung, Rapid Commun. Mass Spec-
trom. 16 (2002) 2221.17] H.J. Leis, G. Fauler, G.N. Rechberger, W. Windischhofer, J. Chromatogr. B 794
(2003) 205.18] F. Bianchi, M. Careri, A. Mangia, M. Musci, S.E. Santini, G. Basini, J. Pharm.
Biomed. Anal. 44 (2007) 711.19] W. Yan, Y. Li, L. Zhao, J.M. Lin, J. Chromatogr. A 1216 (2009) 7539.20] J. Carpinteiro, J.B. Quintana, I. Rodríguez, A.M. Carro, R.A. Lorenzo, R. Cela, J.
Chromatogr. A 1056 (2004) 179.21] S. Impens, K.D. Wasch, M. Cornelis, H.F.D. Brabander, J. Chromatogr. A 970
(2002) 235.22] B. Shao, H. Han, X. Tu, L. Huang, J. Chromatogr. B 850 (2007) 412.23] T. Isobe, H. Shiraishi, M. Yasuda, A. Shinoda, H. Suzuki, M. Morita, J. Chromatogr.
A 984 (2003) 195.24] S.T. Wolford, C.J. Argoudelis, J. Dairy Sci. 62 (1979) 1458.25] S.A. Abeyawardene, D.J. Hathorn, R.G. Glencross, Br. Vet. J. 140 (1984) 458.26] H. Lopez, T.D. Bunch, M.P. Shipka, Anim. Reprod. Sci. 72 (2002) 37.27] D.A. Pape-Zambito, A.L. Magliaro, R.S. Kensinger, J. Dairy Sci. 90 (2007)
3308.28] D.A. Pape-Zambito, R.F. Roberts, R.S. Kensinger, J. Dairy Sci. 93 (2010)
2533.29] P. Ball, G. Reu, J. Schwab, R. Knuppen, Steroids 33 (1979) 563.30] G. Emons, C. Mente, R. Knuppen, P. Ball, Acta Endocrinol. 97 (1981) 251.31] M. Numazawa, K. Kimura, M. Nagaoka, A. Kambegawa, Chem. Pharm. Bull. 37
(1989) 1561.32] B.J. McGuinness, M.J. Power, P.F. Fottrell, Clin. Chem. 40 (1994) 80.33] T.L. Klug, H.L. Bradlow, D.W. Sepkovic, Steroids 59 (1994) 648.34] H.L. Bradlow, D.W. Sepkovic, T. Klug, M.P. Osborne, Steroids 63 (1998) 406.35] F. Guan, C.E. Uboh, L.R. Soma, Y. You, Y. Liu, X. Li, J. Mass Spectrom. 45 (2010)
1270.36] E.M. Thuurman, M.S. Mills, Solid-Phase Extraction Principles and Practice,
Wiley, New York, 1998, p. 1.37] T.A. Ternes, H. Andersen, D. Gilberg, M. Bonerz, Anal. Chem. 74 (2002)
3498.38] M.J. Lopez de Alda, A. Gil, E. Paz, D. Barcelo, Analyst 127 (2002) 1299.39] G.G. Ying, R.S. Kookana, P. Dillon, Water Res. 37 (2003) 3785.40] G.G. Ying, R.S. Kookana, Environ. Sci. Technol. 37 (2003) 1256.41] R.J. Williams, A.C. Johnson, J.J.L. Smith, R. Kanda, Environ. Sci. Technol. 37 (2003)
1744.42] S.A. Barker, A.R. Long, C.R. Short, J. Chromatogr. 475 (1989) 353.43] A.L. Capriotti, Ch. Cavaliere, P. Giansanti, R. Gubbiotti, R. Samperi, A. Laganà, J.
Chromatogr. A 1217 (2010) 2521.
44] V.I. Boti, V.A. Sakkas, T.A. Albanis, J. Chromatogr. A 1216 (2009) 1296.45] Y. Yang, B. Shao, J. Zhang, Y. Wu, J. Ying, J. Chromatogr. B 870 (2008) 241.46] J. Rosen, K. Hellenas, P. Tornqvist, Analyst 119 (1994) 2635.47] G. Fang, G. Min, J. He, C. Zhang, K. Qian, S. Wang, J. Agric. Food Chem. 57 (2009)3040.

5 gr. A 1
[[[
[
054 R. Su et al. / J. Chromato
48] X. Liu, Y. Ji, Y. Zhang, H. Zhang, M. Liu, J. Chromatogr. A 1165 (2007) 10.49] S. López-Feria, S. Cárdenas, M. Valcárcel, J. Chromatogr. A 1216 (2009) 7346.50] C.S. Aman, A. Pastor, G. Cighetti, M. de la Guardia, Anal. Bioanal. Chem. 386
(2006) 1869.51] J. Chen, Q. Liang, H. Hua, Y. Wang, G. Luo, M. Hu, Y. Na, Talanta 80 (2009) 826.
[[[
[
218 (2011) 5047– 5054
52] E. Martendal, D. Budziak, E. Carasek, J. Chromatogr. A 1148 (2007) 131.53] J. Tso, D.S. Aga, J. Chromatogr. A 1217 (2010) 4784.54] J.P. Antignac, I.G. Hirret, H. Naegeli, R. Cariou, C. Elliott, B.L. Bizec, Anal. Chim.
Acta 637 (2009) 55.55] M. Khajeh, J. Supercrit. Fluids 55 (2011) 944.
Related Documents