Copyright (c) 2011 IEEE. Personal use is permitted. For any other purposes, permission must be obtained from the IEEE by emailing [email protected]. This article has been accepted for publication in a future issue of this journal, but has not been fully edited. Content may change prior to final publication. > TMI-2012-0082.R1 < 1 Abstract— Micro-computed tomography (micro-CT) has been widely used to generate high-resolution 3D tissue images from small animals non-destructively, especially for mineralized skeletal tissues. However, its application to the analysis of soft cardiovascular tissues has been limited by poor inter-tissue contrast. Recent ex vivo studies have shown that contrast between muscular and connective tissue in micro-CT images can be enhanced by staining with iodine. In the present study, we apply this novel technique for imaging of cardiovascular structures in canine hearts. We optimize the method to obtain high resolution X-ray micro-CT images of the canine atria and its distinctive regions - including the Bachmann's bundle, atrioventricular node, pulmonary arteries and veins - with clear inter-tissue contrast. The imaging results are used to reconstruct and segment the detailed 3D geometry of the atria. Structure tensor analysis shows that the arrangement of atrial fibers can also be characterized using the enhanced micro-CT images, as iodine preferentially accumulates within the muscular fibers rather than in connective Manuscript received July 13, 2012. This work was supported by a project grant from the British Heart Foundation (PG/10/69/28524) and partially by grants from the Engineering and Physical Sciences Research Council (EP/F007906 and EP/I029826/1), all UK. T. Nikolaidou was supported by a fellowship to from the NIHR Manchester Biomedical Research Centre, UK. O. V. Aslanidi and T. Nikolaidou equally contributed to this work. O. V. Aslanidi is with the Department of Biomedical Engineering, Division of Imaging Sciences & Biomedical Engineering, King's College London, London SE1 7EH, UK (Corresponding author - phone: +44-20-718- 87188; fax: +44-20-718- 85442; e-mail: [email protected]). T. Nikolaidou and M. R. Boyett are with the Faculty of Medical & Human Sciences, University of Manchester, Manchester M13 9NT, UK (e-mails: [email protected] and [email protected]). J. Zhao and B. H. Smaill are with Auckland Bioengineering Institute, University of Auckland, Auckland 1010, New Zealand (e-mails: [email protected] and [email protected]). S. H. Gilbert is with L'Institut de Rythmologie et modelisation Cardiaque, Centre de Recherche Cardio-Thoracique, Universite Bordeaux Segalen, 33076 Bordeaux, France (email: [email protected]). A.V. Holden is with the Institute of Membrane & Systems Biology, University of Leeds, Leeds LS2 9JT, UK (emails: [email protected]). T. Lowe and P. J. Withers are with the Henry Moseley X-ray Imaging Facility, University of Manchester, Manchester M13 9NT, UK (e-mails: [email protected] and [email protected]). R. S. Stephenson and J. C. Jarvis are with the Institute of Ageing & Chronic Disease, University of Liverpool, Liverpool L69 3GA, UK (e-mails: [email protected] and [email protected]). J. C. Hancox is with the School of Physiology & Pharmacology, University of Bristol, Bristol BS8 1TD, UK (email: [email protected]). H. Zhang is with the School of Physics & Astronomy, University of Manchester, M13 9PL, UK (e-mail: [email protected]). Copyright (c) 2010 IEEE. Personal use of this material is permitted. However, permission to use this material for any other purposes must be obtained from the IEEE by sending a request to [email protected]. tissues. This novel technique can be particularly useful in non- destructive imaging of 3D cardiac architectures from large animals and humans, due to the combination of relatively high speed (~1 hour per scan of the large canine heart) and high voxel resolution (36 μm) provided. In summary, contrast micro-CT facilitates fast and non-destructive imaging and segmenting of detailed 3D cardiovascular geometries, as well as measuring fiber orientation, which are crucial in constructing biophysically detailed computational cardiac models. Index Terms—X-ray imaging and computed tomography, Heart, Animal models and imaging, Tissue modelling. I. INTRODUCTION TRUCTURAL information, such as cardiovascular tissue geometry and fiber architecture, is important for understanding the associated function, both in health and disease [1, 2]. Thus, the distinctive conduction pathways formed by cardiac bundles determine the sequence of electrical activation of the healthy heart: the normal activation starts in the sinus node, spreads to the right atrium (RA) and through the muscular Bachmann's bundle (BB) into the left atrium (LA), and then through the atrioventricular node (AVN) into the ventricles. Mapping 3D architecture of the myocardium is also important in relation to cardiac arrhythmias, and can guide clinical ablation treatments. For example, myocardial sleeves of the pulmonary veins (PVs) in the LA are recognized as primary sources of ectopic electrical activity during the most common cardiac arrhythmia, atrial fibrillation (AF), and ablation of the PVs is widely used to terminate AF [3, 4]. Connections between the atria via the BB allow fast synchronized atrial activation in healthy hearts [2], but can also be involved in atrial arrhythmogenesis [5]. Therefore, functional studies of atrial conduction and AF require detailed structural reconstruction of both atria, the BB and PV sleeves, as well as the AVN which protects the ventricles from fast atrial rates during AF and other arrhythmias [6]. Understanding of the electrophysiological mechanisms underlying cardiac arrhythmias often emerges from biophysically detailed computational models [7, 8] that use structural data as the source of 3D computational domains (geometry) and related sub-domains (tissue types). However, structural complexity can make it difficult to quantify fine 3D Application of Micro-Computed Tomography with Iodine Staining to Cardiac Imaging, Segmentation and Computational Model Development Oleg V Aslanidi, Theodora Nikolaidou, Jichao Zhao, Bruce H Smaill, Stephen H Gilbert, Arun V Holden, Tristan Lowe, Philip J Withers, Robert S Stephenson, Jonathan C Jarvis, Jules C Hancox, Mark R Boyett and Henggui Zhang S

Welcome message from author
This document is posted to help you gain knowledge. Please leave a comment to let me know what you think about it! Share it to your friends and learn new things together.
Transcript

Copyright (c) 2011 IEEE. Personal use is permitted. For any other purposes, permission must be obtained from the IEEE by emailing [email protected].
This article has been accepted for publication in a future issue of this journal, but has not been fully edited. Content may change prior to final publication.
> TMI-2012-0082.R1 <
1
Abstract— Micro-computed tomography (micro-CT) has been
widely used to generate high-resolution 3D tissue images from
small animals non-destructively, especially for mineralized
skeletal tissues. However, its application to the analysis of soft
cardiovascular tissues has been limited by poor inter-tissue
contrast. Recent ex vivo studies have shown that contrast between
muscular and connective tissue in micro-CT images can be
enhanced by staining with iodine. In the present study, we apply
this novel technique for imaging of cardiovascular structures in
canine hearts. We optimize the method to obtain high resolution
X-ray micro-CT images of the canine atria and its distinctive
regions - including the Bachmann's bundle, atrioventricular node,
pulmonary arteries and veins - with clear inter-tissue contrast.
The imaging results are used to reconstruct and segment the
detailed 3D geometry of the atria. Structure tensor analysis shows
that the arrangement of atrial fibers can also be characterized
using the enhanced micro-CT images, as iodine preferentially
accumulates within the muscular fibers rather than in connective
Manuscript received July 13, 2012. This work was supported by a project
grant from the British Heart Foundation (PG/10/69/28524) and partially by
grants from the Engineering and Physical Sciences Research Council
(EP/F007906 and EP/I029826/1), all UK. T. Nikolaidou was supported by a
fellowship to from the NIHR Manchester Biomedical Research Centre, UK.
O. V. Aslanidi and T. Nikolaidou equally contributed to this work.
O. V. Aslanidi is with the Department of Biomedical Engineering,
Division of Imaging Sciences & Biomedical Engineering, King's College
London, London SE1 7EH, UK (Corresponding author - phone: +44-20-718-
87188; fax: +44-20-718- 85442; e-mail: [email protected]).
T. Nikolaidou and M. R. Boyett are with the Faculty of Medical & Human
Sciences, University of Manchester, Manchester M13 9NT, UK (e-mails:
[email protected] and [email protected]).
J. Zhao and B. H. Smaill are with Auckland Bioengineering Institute,
University of Auckland, Auckland 1010, New Zealand (e-mails:
[email protected] and [email protected]).
S. H. Gilbert is with L'Institut de Rythmologie et modelisation Cardiaque,
Centre de Recherche Cardio-Thoracique, Universite Bordeaux Segalen,
33076 Bordeaux, France (email: [email protected]).
A.V. Holden is with the Institute of Membrane & Systems Biology,
University of Leeds, Leeds LS2 9JT, UK (emails: [email protected]).
T. Lowe and P. J. Withers are with the Henry Moseley X-ray Imaging
Facility, University of Manchester, Manchester M13 9NT, UK (e-mails:
[email protected] and [email protected]).
R. S. Stephenson and J. C. Jarvis are with the Institute of Ageing &
Chronic Disease, University of Liverpool, Liverpool L69 3GA, UK (e-mails:
[email protected] and [email protected]).
J. C. Hancox is with the School of Physiology & Pharmacology, University
of Bristol, Bristol BS8 1TD, UK (email: [email protected]).
H. Zhang is with the School of Physics & Astronomy, University of
Manchester, M13 9PL, UK (e-mail: [email protected]).
Copyright (c) 2010 IEEE. Personal use of this material is permitted.
However, permission to use this material for any other purposes must be
obtained from the IEEE by sending a request to [email protected].
tissues. This novel technique can be particularly useful in non-
destructive imaging of 3D cardiac architectures from large
animals and humans, due to the combination of relatively high
speed (~1 hour per scan of the large canine heart) and high voxel
resolution (36 µm) provided. In summary, contrast micro-CT
facilitates fast and non-destructive imaging and segmenting of
detailed 3D cardiovascular geometries, as well as measuring fiber
orientation, which are crucial in constructing biophysically
detailed computational cardiac models.
Index Terms—X-ray imaging and computed tomography,
Heart, Animal models and imaging, Tissue modelling.
I. INTRODUCTION
TRUCTURAL information, such as cardiovascular tissue
geometry and fiber architecture, is important for
understanding the associated function, both in health and
disease [1, 2]. Thus, the distinctive conduction pathways
formed by cardiac bundles determine the sequence of electrical
activation of the healthy heart: the normal activation starts in
the sinus node, spreads to the right atrium (RA) and through
the muscular Bachmann's bundle (BB) into the left atrium
(LA), and then through the atrioventricular node (AVN) into
the ventricles. Mapping 3D architecture of the myocardium is
also important in relation to cardiac arrhythmias, and can
guide clinical ablation treatments. For example, myocardial
sleeves of the pulmonary veins (PVs) in the LA are recognized
as primary sources of ectopic electrical activity during the
most common cardiac arrhythmia, atrial fibrillation (AF), and
ablation of the PVs is widely used to terminate AF [3, 4].
Connections between the atria via the BB allow fast
synchronized atrial activation in healthy hearts [2], but can
also be involved in atrial arrhythmogenesis [5]. Therefore,
functional studies of atrial conduction and AF require detailed
structural reconstruction of both atria, the BB and PV sleeves,
as well as the AVN which protects the ventricles from fast
atrial rates during AF and other arrhythmias [6].
Understanding of the electrophysiological mechanisms
underlying cardiac arrhythmias often emerges from
biophysically detailed computational models [7, 8] that use
structural data as the source of 3D computational domains
(geometry) and related sub-domains (tissue types). However,
structural complexity can make it difficult to quantify fine 3D
Application of Micro-Computed Tomography with
Iodine Staining to Cardiac Imaging, Segmentation
and Computational Model Development
Oleg V Aslanidi, Theodora Nikolaidou, Jichao Zhao, Bruce H Smaill, Stephen H Gilbert,
Arun V Holden, Tristan Lowe, Philip J Withers, Robert S Stephenson, Jonathan C Jarvis,
Jules C Hancox, Mark R Boyett and Henggui Zhang
S
Copyright (c) 2011 IEEE. Personal use is permitted. For any other purposes, permission must be obtained from the IEEE by emailing [email protected].
This article has been accepted for publication in a future issue of this journal, but has not been fully edited. Content may change prior to final publication.
> TMI-2012-0082.R1 <
2
details, such as distributions of tissue types and fiber
orientation. Thus, even the most detailed 3D models of atrial
activation have not included full descriptions of tissue
architecture throughout the atrial chambers, although some
have incorporated prescribed bundle anisotropy to account for
the role of specialized conduction pathways [9, 10].
Although both experimental functional studies and
computational modelling require accurate imaging of 3D
structures, few widely applicable methods exist for non-
destructive whole-volume imaging of soft tissues. The most
established method for imaging soft tissues has been
histological sectioning [7, 11, 12]. Magnetic resonance
imaging (MRI) methods, such as diffusion tensor MRI, gained
in prominence for reconstructing the tissue geometry and fiber
architecture non-destructively [13-16]. However, such
techniques are relatively slow. An alternative non-destructive
method of X-ray micro-computed tomography (micro-CT) has
shorter acquisition times and is widely used for imaging
diverse mineralized tissues [17, 18], but has been disregarded
in soft tissue imaging due to the poor inter-tissue contrast.
X-ray contrast enhancement agents are used routinely in
clinical radiography, but only recently have been shown to
allow quantitative characterization of soft tissues ex vivo.
Thus, Metscher [19] has used micro-CT to visualize fine soft-
tissue detail in embryos stained with iodine: the radio-opaque
staining varied the tissue density and thereby resulted in the
differential attenuation of X-rays. Micro-CT with iodine
staining has also been used for imaging of cardiac geometries
at various stages of embryogenesis in small animals [20].
Iodine staining of smooth muscular tissues has recently
produced clear inter-tissue contrast in micro-CT images, as
iodine preferentially accumulated in muscular fibers rather
than in connective tissue [21]. Finally, Stephenson et al. [22]
for the first time applied the contrast micro-CT to reconstruct
cardiac structures, primarily the cardiac conduction system in
small animal hearts.
We apply the contrast micro-CT for high resolution imaging
of cardiovascular architectures in a large canine heart -
primarily, to reconstruct structures involved in the electrical
activation of the atria. Such a reconstruction can be used to
create detailed 3D computational models of the atria and
explore electro-anatomical factors responsible for the
development and maintenance of AF.
II. METHODS
A. Tissue preparation
The heart was removed after euthanasia of a healthy adult
female boxer dog, ~8 years old, and body weight 36 kg. The
dog was euthanized with pentobarbital sodium and its body
was donated to Glasgow Veterinary School in accordance with
UK Veterinary Surgeons Act (1966). The body was
immediately chilled to 4°C, and the heart was removed within
24 hours. Heart removal was with attached lung, to preserve
PV anatomy. The heart was washed in saline and immersion
fixed in 10% neutral buffered formaldehyde (NBF, Sigma-
Aldrich). The heart was stored immersed in NBF until
imaging. To study atrial anatomy and fiber orientation, dog
atria were dissected and stained using a method described
recently [22]. Staining was optimized in 8 sequential
experiments with the same tissue sample and varying
concentrations of iodine potassium iodide solution (5-10%
I2KI) and also varying duration of sample incubation in the
solution (4-7 days). Each time the tissue sample was stained
and micro-CT imaged, after which the contrast agent was
leached out by placing the tissue in NBF for at least a week.
The leached sample was afterwards re-stained and re-scanned.
Optimal contrast of micro-CT images was achieved after 7
days of incubation with 7.5% I2KI. After staining, the tissue
was rinsed with NBF, excess solution drained and the sample
was mounted in a plastic container onto the rotatory micro-CT
scanner stage.
B. Micro-CT scanning
Samples were scanned using a Nikon Metris 225/320 KV
housed in a customized bay system at the Henry Moseley X-
ray imaging facility, University of Manchester. During the
analysis the specimen was rotated through 360 degrees and the
projections were recorded on a 2K x 2K Perkin Elmer 1621-
16-bit amorphous silicon flat-panel detector with 200 pixel
pitch. X-ray beam energy was adjusted to optimize resolution
using a Mo-target, Cu-filter (thickness 0.5 mm) combination.
The following settings were used for the analysis: scanning
time 60 minutes, voltage 150 KV, current 125 µA, gain 16. As
a result, 2001 projections per specimen were collected using a
frame rate of 2000 ms and a voxel resolution of 36 µm.
Relation between the voxel resolution and the effective tissue
resolution that can be used for computational purposes is
discussed below (see Discussion).
C. Tissue segmentation
Post processing of the raw micro-CT data included its
reconstruction using Nikon Metrolasis CT-Pro software
(Metris XT 1.6) and visualization using Avizo 6.3.1 standard
edition. Segmentation based on the iodine-enhanced inter-
tissue contrast and subsequent volume rendering was used to
reconstruct 3D atrial structures. Briefly, areas with distinctive
fiber structure, such as atrial walls and myocardial bands of the
BB and PV sleeves, had relatively high contrast in the
acquired micro-CT images due to the preferential
accumulation of iodine within the fibers. Such continuous
high-contrast areas were tracked and segmented using the
semi-automatic 'Confidence Connected' method in Avizo. In
case when the semi-automatic tracking was not effective - for
example, due to small tissue heterogeneity or sharp edges -
manual image-by-image segmentation aimed at tracking over
such heterogeneities was applied. The AVN was segmented
manually through a series of images, as it stained differentially
from the surrounding connective and myocardial tissues.
D. Structure tensor analysis
Grayscale intensity gradient information obtained from
imaging can relate the structure of objects in an image to
features of interest, e.g., the long axis of myocytes. The
structure tensor method, representing gradient information for
3D imaging problems [12, 23], was implemented. The
Copyright (c) 2011 IEEE. Personal use is permitted. For any other purposes, permission must be obtained from the IEEE by emailing [email protected].
This article has been accepted for publication in a future issue of this journal, but has not been fully edited. Content may change prior to final publication.
> TMI-2012-0082.R1 <
3
structure tensor contains gradient information at each voxel in
3D volume in form of a matrix. The tensor field is smoothed
by convolving it with a Gaussian kernel before an eigenvalue
decomposition solver is applied to obtain the eigenvalues and
eigenvectors of the tensor field. Local fiber alignment is
modelled as the orientation with the least signal variation,
which corresponds to the eigenvector paired with the smallest
eigenvalue. At the final stage, the fiber field is further
smoothed by averaging fiber orientations in the neighborhood
of each voxel. State of the art reconstruction methods for atrial
fiber tracking using the structure tensor have been developed
previously [12]. A simple line interpolation algorithm was
used: the 3D trajectory propagates along a line starting from a
seed point in a region of interest with a predefined sub-pixel
size and varying vector orientation, and the vector orientation
keeps itself updating by averaging eight neighboring vectors in
any new coordinate during propagation.
III. RESULTS
Fig. 1 shows the 3D tissue geometry of a canine heart
reconstructed from micro-CT images. High resolution
achieved with micro-CT allows for the high level of detail in
the 3D geometry, such as fine structures of separate blood
vessels (Fig. 1A) and pectinate muscles (PMs) in the right
atrial appendage (RAA) of the heart (Fig. 1B). Note that
micro-CT imaging of the heart at 36 µm voxel resolution took
about ~1 hour, which is considerably faster than MRI
techniques - for comparison, 300 µm reconstruction of the
same heart on 3T medical MRI scanner took ~16 hours.
Importantly, the 3D tissue geometry can be reconstructed from
micro-CT either with or without iodine staining.
Atria of the heart seen in Fig. 1 were dissected by removing
lung tissue and most of the ventricles (Fig. 2A) - however,
parts of the ventricles were kept in order to preserve the AVN.
The resultant atrial sample was stained with iodine and
scanned to produce micro-CT images with both high voxel
resolution (36 µm) and high inter-tissue contrast (Fig. 2B).
The images and the knowledge of well-known anatomic
features allowed us to (i) segment both atrial chambers and
large blood vessels, (ii) segment smaller, but distinctive atrial
structures - the BB, PVs and AVN - that play important roles
in AF, and (iii) reconstruct fiber orientation in these structures.
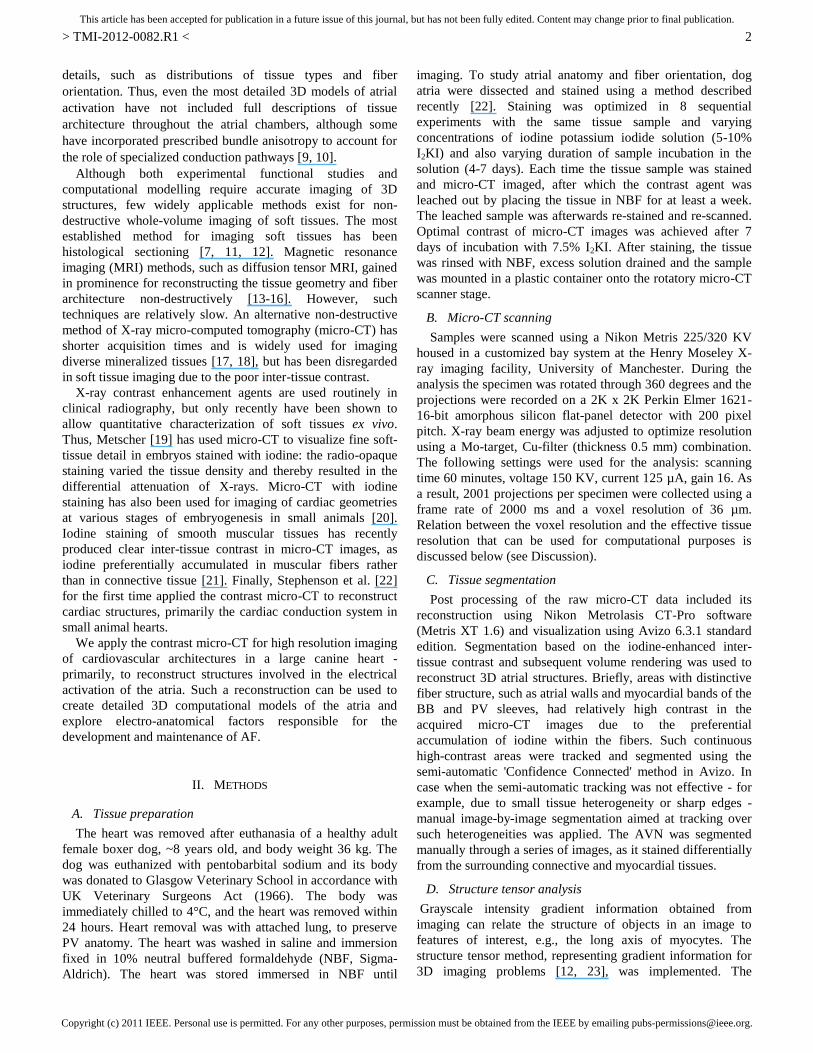
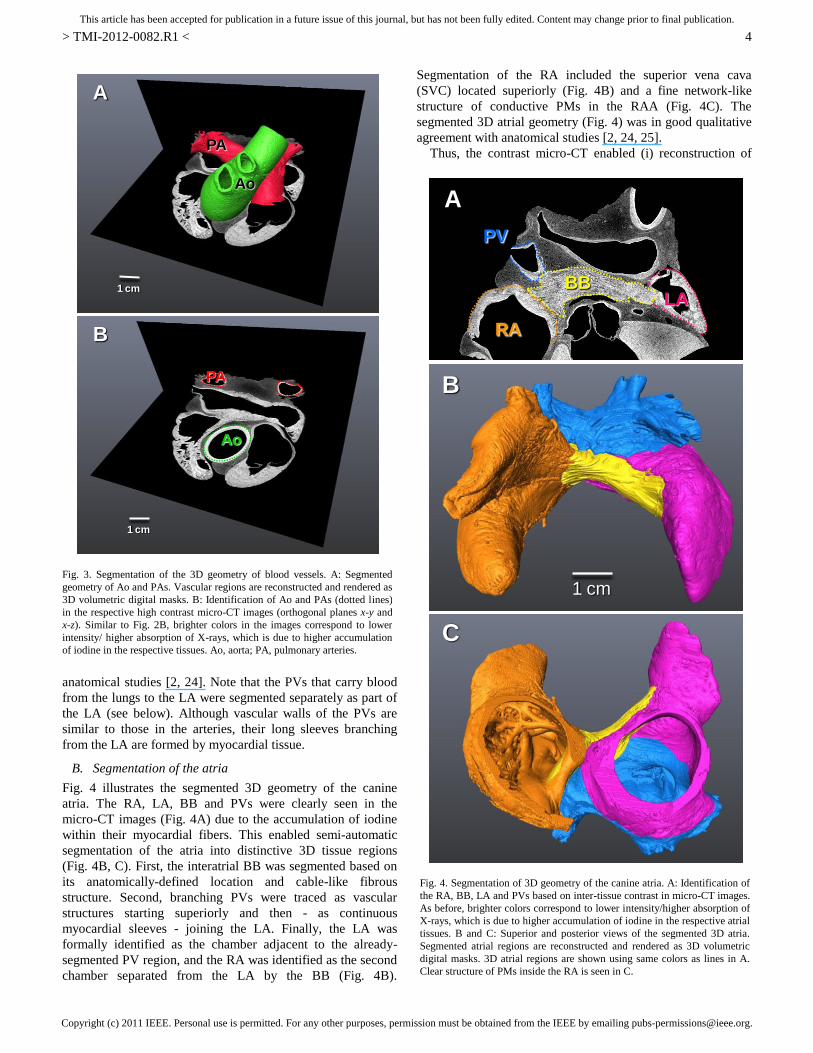
A. Segmentation of blood vessels
The aorta (Ao) and pulmonary arteries (PAs) are large
blood vessels that carry blood from the left and right
ventricles, respectively. Smooth muscles forming the vascular
walls (i) can be easily stained with iodine [21] and (ii) are
anatomically distinctive from myocardial tissues of the atria
[24]. This enabled semi-automatic reconstruction of the blood
vessels from the contrast micro-CT images (Fig. 3). Fig. 3A
shows the segmented volumetric 3D structures of Ao and PAs,
and Fig. 3B illustrates the identification of these structures
based on inter-tissue contrast in the images. Thus, micro-CT
with iodine staining provides relatively fast and easy means for
reconstructing geometries of blood vessels, which are in good
agreement with more established but more time demanding
PMsRAA
A B
1 cm
RV
Lung
Fig. 1. 3D geometry of the canine heart reconstructed from micro-CT. A:
Epicardial view. B: Endocardial view. Isosurfaces of the X-ray intensity in
micro-CT images are shown, with isovalues chosen such that the epicardial
and endocardial surfaces of the heart are seen. Fine tissue structures, such as
small blood vessels in the RV (A) and the network of PMs inside the RAA
(B) can be resolved from the high resolution (voxel size of 36 m) images.
RAA, right atrial appendage; RV, right ventricle; PMs, pectinate muscles.
RAALA
RV
A
Ao
PA
1 cm
RAALA
RV
B
Ao
PA
1 cm
Fig. 2. Non-segmented 3D geometry of the canine atria. A: 3D volume
rendering of the dissected atria (X-ray intensity is color-coded using a "hot
metal" palette) shows the direct 3D volume renderings - this is also. Details
of anatomical structures are not clear, for example large Ao is obscured by
other tissues. B: Respective micro-CT images (two orthogonal planes x-y
and x-z) with clear inter-tissue contrast between structures, which enables
segmentation of the 3D geometries (see below). Micro-CT image brightness
in A and B is related to the X-ray intensity: brighter colors correspond to
lower intensity/higher absorption of X-rays, which is due to higher levels of
iodine accumulation in the respective tissues. Ao, aorta; PA, pulmonary
artery; RAA, right atrial appendage; LA, left atrium, RV, right ventricle.
Copyright (c) 2011 IEEE. Personal use is permitted. For any other purposes, permission must be obtained from the IEEE by emailing [email protected].
This article has been accepted for publication in a future issue of this journal, but has not been fully edited. Content may change prior to final publication.
> TMI-2012-0082.R1 <
4
anatomical studies [2, 24]. Note that the PVs that carry blood
from the lungs to the LA were segmented separately as part of
the LA (see below). Although vascular walls of the PVs are
similar to those in the arteries, their long sleeves branching
from the LA are formed by myocardial tissue.
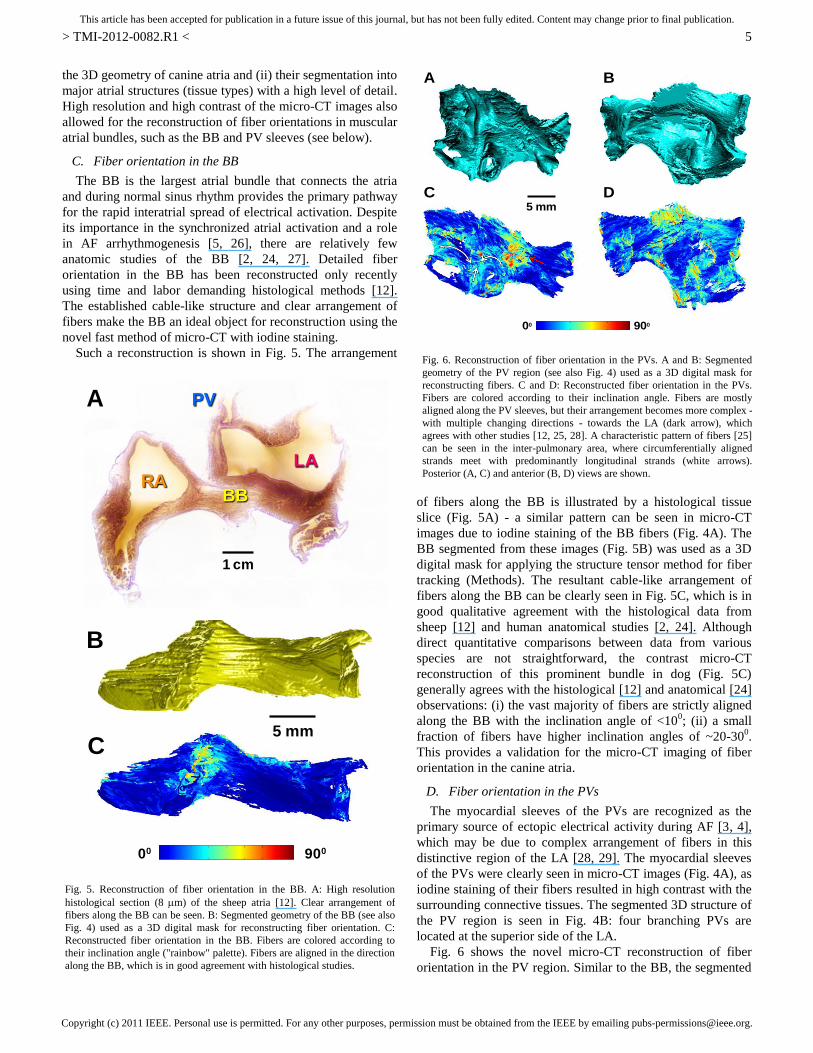
B. Segmentation of the atria
Fig. 4 illustrates the segmented 3D geometry of the canine
atria. The RA, LA, BB and PVs were clearly seen in the
micro-CT images (Fig. 4A) due to the accumulation of iodine
within their myocardial fibers. This enabled semi-automatic
segmentation of the atria into distinctive 3D tissue regions
(Fig. 4B, C). First, the interatrial BB was segmented based on
its anatomically-defined location and cable-like fibrous
structure. Second, branching PVs were traced as vascular
structures starting superiorly and then - as continuous
myocardial sleeves - joining the LA. Finally, the LA was
formally identified as the chamber adjacent to the already-
segmented PV region, and the RA was identified as the second
chamber separated from the LA by the BB (Fig. 4B).
Segmentation of the RA included the superior vena cava
(SVC) located superiorly (Fig. 4B) and a fine network-like
structure of conductive PMs in the RAA (Fig. 4C). The
segmented 3D atrial geometry (Fig. 4) was in good qualitative
agreement with anatomical studies [2, 24, 25].
Thus, the contrast micro-CT enabled (i) reconstruction of
Ao
PA
A
1 cm
Ao
PA
B
1 cm
Fig. 3. Segmentation of the 3D geometry of blood vessels. A: Segmented
geometry of Ao and PAs. Vascular regions are reconstructed and rendered as
3D volumetric digital masks. B: Identification of Ao and PAs (dotted lines)
in the respective high contrast micro-CT images (orthogonal planes x-y and
x-z). Similar to Fig. 2B, brighter colors in the images correspond to lower
intensity/ higher absorption of X-rays, which is due to higher accumulation
of iodine in the respective tissues. Ao, aorta; PA, pulmonary arteries.
C
A
PV
RA
LABB
B
1 cm
Fig. 4. Segmentation of 3D geometry of the canine atria. A: Identification of
the RA, BB, LA and PVs based on inter-tissue contrast in micro-CT images.
As before, brighter colors correspond to lower intensity/higher absorption of
X-rays, which is due to higher accumulation of iodine in the respective atrial
tissues. B and C: Superior and posterior views of the segmented 3D atria.
Segmented atrial regions are reconstructed and rendered as 3D volumetric
digital masks. 3D atrial regions are shown using same colors as lines in A.
Clear structure of PMs inside the RA is seen in C.
Copyright (c) 2011 IEEE. Personal use is permitted. For any other purposes, permission must be obtained from the IEEE by emailing [email protected].
This article has been accepted for publication in a future issue of this journal, but has not been fully edited. Content may change prior to final publication.
> TMI-2012-0082.R1 <
5
the 3D geometry of canine atria and (ii) their segmentation into
major atrial structures (tissue types) with a high level of detail.
High resolution and high contrast of the micro-CT images also
allowed for the reconstruction of fiber orientations in muscular
atrial bundles, such as the BB and PV sleeves (see below).
C. Fiber orientation in the BB
The BB is the largest atrial bundle that connects the atria
and during normal sinus rhythm provides the primary pathway
for the rapid interatrial spread of electrical activation. Despite
its importance in the synchronized atrial activation and a role
in AF arrhythmogenesis [5, 26], there are relatively few
anatomic studies of the BB [2, 24, 27]. Detailed fiber
orientation in the BB has been reconstructed only recently
using time and labor demanding histological methods [12].
The established cable-like structure and clear arrangement of
fibers make the BB an ideal object for reconstruction using the
novel fast method of micro-CT with iodine staining.
Such a reconstruction is shown in Fig. 5. The arrangement
of fibers along the BB is illustrated by a histological tissue
slice (Fig. 5A) - a similar pattern can be seen in micro-CT
images due to iodine staining of the BB fibers (Fig. 4A). The
BB segmented from these images (Fig. 5B) was used as a 3D
digital mask for applying the structure tensor method for fiber
tracking (Methods). The resultant cable-like arrangement of
fibers along the BB can be clearly seen in Fig. 5C, which is in
good qualitative agreement with the histological data from
sheep [12] and human anatomical studies [2, 24]. Although
direct quantitative comparisons between data from various
species are not straightforward, the contrast micro-CT
reconstruction of this prominent bundle in dog (Fig. 5C)
generally agrees with the histological [12] and anatomical [24]
observations: (i) the vast majority of fibers are strictly aligned
along the BB with the inclination angle of <100; (ii) a small
fraction of fibers have higher inclination angles of ~20-300.
This provides a validation for the micro-CT imaging of fiber
orientation in the canine atria.
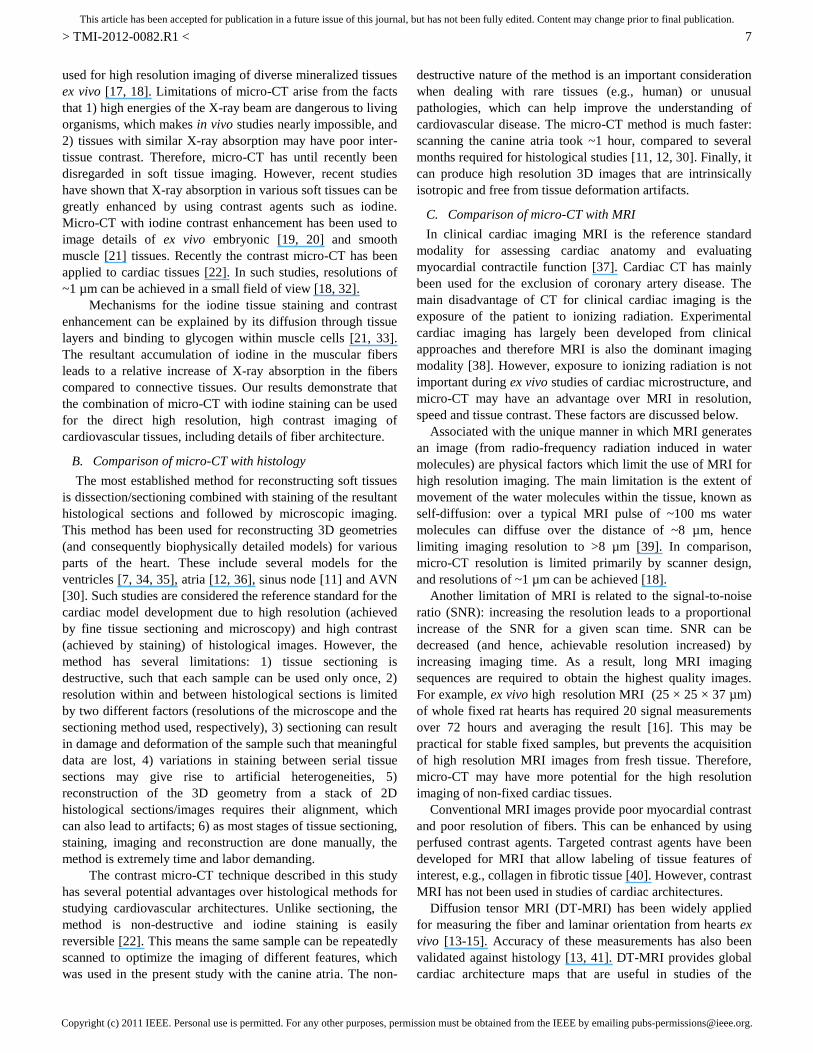
D. Fiber orientation in the PVs
The myocardial sleeves of the PVs are recognized as the
primary source of ectopic electrical activity during AF [3, 4],
which may be due to complex arrangement of fibers in this
distinctive region of the LA [28, 29]. The myocardial sleeves
of the PVs were clearly seen in micro-CT images (Fig. 4A), as
iodine staining of their fibers resulted in high contrast with the
surrounding connective tissues. The segmented 3D structure of
the PV region is seen in Fig. 4B: four branching PVs are
located at the superior side of the LA.
Fig. 6 shows the novel micro-CT reconstruction of fiber
orientation in the PV region. Similar to the BB, the segmented
00
5 mm
B
C
900
RALA
PV
BB
A
1 cm
Fig. 5. Reconstruction of fiber orientation in the BB. A: High resolution
histological section (8 m) of the sheep atria [12]. Clear arrangement of
fibers along the BB can be seen. B: Segmented geometry of the BB (see also
Fig. 4) used as a 3D digital mask for reconstructing fiber orientation. C:
Reconstructed fiber orientation in the BB. Fibers are colored according to
their inclination angle ("rainbow" palette). Fibers are aligned in the direction
along the BB, which is in good agreement with histological studies.
A B
C D
00 900
5 mm
Fig. 6. Reconstruction of fiber orientation in the PVs. A and B: Segmented
geometry of the PV region (see also Fig. 4) used as a 3D digital mask for
reconstructing fibers. C and D: Reconstructed fiber orientation in the PVs.
Fibers are colored according to their inclination angle. Fibers are mostly
aligned along the PV sleeves, but their arrangement becomes more complex -
with multiple changing directions - towards the LA (dark arrow), which
agrees with other studies [12, 25, 28]. A characteristic pattern of fibers [25]
can be seen in the inter-pulmonary area, where circumferentially aligned
strands meet with predominantly longitudinal strands (white arrows).
Posterior (A, C) and anterior (B, D) views are shown.

Copyright (c) 2011 IEEE. Personal use is permitted. For any other purposes, permission must be obtained from the IEEE by emailing [email protected].
This article has been accepted for publication in a future issue of this journal, but has not been fully edited. Content may change prior to final publication.
> TMI-2012-0082.R1 <
6
PV region (Figs. 6A, B) was used as a digital 3D mask for
applying the structure tensor method for fiber tracking. The
resultant fiber orientation was in agreement with available
(however, limited) knowledge of this region [12, 25]. Fibers
were aligned along the myocardial sleeves of the PVs, but the
orientation became complex - with fibers arranged in multiple
directions and changes in the arrangement - as the PV sleeves
extended towards the LA (Figs. 6C, D). Such a complex
arrangement of fibers at the PV-LA junctions is difficult to
characterize [25]. However, characteristic changes in the
orientation of fiber strands can be seen in the inter-pulmonary
areas, where obliquely or circumferentially aligned strands
meet with predominantly longitudinally aligned strands [25].
Qualitatively similar patterns are observed in the micro-CT
reconstruction (see Fig. 6C, with arrows showing the strand
directions), as well as in histological [12] and electro-
anatomical [28] studies. Along with the recent histological
reconstruction by Zhao et al. [12], this study provides unique
high resolution information on the fiber orientation in the PVs.
E. Atrioventricular node
The AVN plays a key role in coordinating electrical
conduction from atria to the ventricles. Studies of the AVN
have been limited due to its small size, complex anatomy and
inaccessible location in depth of the atrioventricular septum [6,
30]. Micro-CT with iodine staining provides high resolution
and high contrast images, and allows for non-destructive in-
depth tissue studies. This novel method combined with the
knowledge of cardiac anatomy is perfectly suited for fast
tracing of the AVN and reconstruction of its 3D geometry.
The AVN was segmented by tracing its margins through
serial images. Its location near the thick fibrous skeleton that
connects the central fibrous body with the aortic, mitral and
tricuspid valves was clearly seen in the micro-CT images.
Image contrast allowed us to define 3D geometry of the AVN
in situ, without distorting its relation to the surrounding fine
structures (Fig. 7). Primarily, the AVN was identified at the
crest of the ventricular septum and traced posteriorly and
anteriorly along the septum based on the inter-tissue contrast
(Figs. 7A, B). The reconstructed 3D geometry was further
subdivided into the posterior nodal extension (PNE), the
compact node (CN) and AV bundle (AVB) (Fig. 7C). Note
that the subdivision was based on the knowledge from
previous studies of the AVN anatomy and function [30, 31].
Note also that a histological validation for the micro-CT
segmentation for the atrioventricular conduction axis in a small
rat heart has been performed recently [22] (see Discussion).
Thus, the contrast micro-CT enabled the reconstruction of the
3D structure of such a small (~13.0×4.0×0.5 mm3) and
complex anatomical object as the canine AVN.
IV. DISCUSSION
We have demonstrated a variety of applications of X-ray
micro-CT with iodine staining to imaging of cardiovascular
tissues. The high resolution (voxel size of 36 µm) and high
contrast imaging was used to (i) reconstruct 3D geometry of
the canine atria (Fig. 1), (ii) segment the atria into major
myocardial tissue types - RA, LA, BB and PV (Fig. 4), (iii)
segment large vascular structures - Ao and PAs (Fig. 3), (iv)
segment fine structure of the AVN (Fig. 7), and (v) reconstruct
fiber orientation of distinctive atrial bundles - the BB (Fig. 5)
and sleeves of the PV (Fig. 6). Such segmented 3D geometries
and fiber orientations are crucial in constructing biophysically
detailed computational models and applying them to study
mechanisms of arrhythmias. Thus, the detailed 3D architecture
of the atria reconstructed from micro-CT can be used to create
computational models for exploring atrial conduction and AF
arrhythmogenesis. Below we discuss potential applications of
our methods and results, as well as their limitations.
A. Micro-CT with iodine staining
X-ray micro-CT is a high resolution version of medical CT
scanning, which has been increasingly used in non-clinical
research over the last decade. A sample is placed in the path of
an X-ray beam to generate a projection image on an X-ray-
sensitive detector. After the sample is rotated and imaged at a
large number of angles, the sequence of projection images is
used to reconstruct the X-ray attenuation at each point within
the scanned 3D volume. Thus, micro-CT imaging represents
the sample as a 3D matrix of intensity values, equivalent to a
stack of aligned 2D digital images.
Advantages of micro-CT include 1) non-destructive
approach to tissue imaging, 2) relatively short image
acquisition times, 3) high resolution (up to ~1 µm) of the
images and 4) high contrast between tissues with differential
attenuation of X-rays. Therefore, the method has been widely
PNE CN
AVB
LA
RV
Ao
RA
Ao
AS
VS
AVN
AVN
A B
C D
5 mm
5 mm
Fig. 7. Reconstruction of the AVN from the contrast micro-CT images. A:
Identification of the AVN margins (dotted line) in the contrast-enhanced
images. B: Segmented 3D structure of the AVN. As in Figs. 3-6, the
segmented region is reconstructed and rendered as a 3D volumetric digital
mask. C: Anatomy of the AVN. The PNE is identified at the base of the
tricuspid valve and continues anteriorly as the CN and AVB. D:
Relationship of the segmented AVN to surrounding tissues seen in micro-CT
images. Ao, aorta; AS and VS, atrial and ventricular septum; PNE, posterior
nodal extension; CN, compact node; AVB, atrioventricular bundle; RV,
right ventricle; RA and LA, right and left atria.
Copyright (c) 2011 IEEE. Personal use is permitted. For any other purposes, permission must be obtained from the IEEE by emailing [email protected].
This article has been accepted for publication in a future issue of this journal, but has not been fully edited. Content may change prior to final publication.
> TMI-2012-0082.R1 <
7
used for high resolution imaging of diverse mineralized tissues
ex vivo [17, 18]. Limitations of micro-CT arise from the facts
that 1) high energies of the X-ray beam are dangerous to living
organisms, which makes in vivo studies nearly impossible, and
2) tissues with similar X-ray absorption may have poor inter-
tissue contrast. Therefore, micro-CT has until recently been
disregarded in soft tissue imaging. However, recent studies
have shown that X-ray absorption in various soft tissues can be
greatly enhanced by using contrast agents such as iodine.
Micro-CT with iodine contrast enhancement has been used to
image details of ex vivo embryonic [19, 20] and smooth
muscle [21] tissues. Recently the contrast micro-CT has been
applied to cardiac tissues [22]. In such studies, resolutions of
~1 µm can be achieved in a small field of view [18, 32].
Mechanisms for the iodine tissue staining and contrast
enhancement can be explained by its diffusion through tissue
layers and binding to glycogen within muscle cells [21, 33].
The resultant accumulation of iodine in the muscular fibers
leads to a relative increase of X-ray absorption in the fibers
compared to connective tissues. Our results demonstrate that
the combination of micro-CT with iodine staining can be used
for the direct high resolution, high contrast imaging of
cardiovascular tissues, including details of fiber architecture.
B. Comparison of micro-CT with histology
The most established method for reconstructing soft tissues
is dissection/sectioning combined with staining of the resultant
histological sections and followed by microscopic imaging.
This method has been used for reconstructing 3D geometries
(and consequently biophysically detailed models) for various
parts of the heart. These include several models for the
ventricles [7, 34, 35], atria [12, 36], sinus node [11] and AVN
[30]. Such studies are considered the reference standard for the
cardiac model development due to high resolution (achieved
by fine tissue sectioning and microscopy) and high contrast
(achieved by staining) of histological images. However, the
method has several limitations: 1) tissue sectioning is
destructive, such that each sample can be used only once, 2)
resolution within and between histological sections is limited
by two different factors (resolutions of the microscope and the
sectioning method used, respectively), 3) sectioning can result
in damage and deformation of the sample such that meaningful
data are lost, 4) variations in staining between serial tissue
sections may give rise to artificial heterogeneities, 5)
reconstruction of the 3D geometry from a stack of 2D
histological sections/images requires their alignment, which
can also lead to artifacts; 6) as most stages of tissue sectioning,
staining, imaging and reconstruction are done manually, the
method is extremely time and labor demanding.
The contrast micro-CT technique described in this study
has several potential advantages over histological methods for
studying cardiovascular architectures. Unlike sectioning, the
method is non-destructive and iodine staining is easily
reversible [22]. This means the same sample can be repeatedly
scanned to optimize the imaging of different features, which
was used in the present study with the canine atria. The non-
destructive nature of the method is an important consideration
when dealing with rare tissues (e.g., human) or unusual
pathologies, which can help improve the understanding of
cardiovascular disease. The micro-CT method is much faster:
scanning the canine atria took ~1 hour, compared to several
months required for histological studies [11, 12, 30]. Finally, it
can produce high resolution 3D images that are intrinsically
isotropic and free from tissue deformation artifacts.
C. Comparison of micro-CT with MRI
In clinical cardiac imaging MRI is the reference standard
modality for assessing cardiac anatomy and evaluating
myocardial contractile function [37]. Cardiac CT has mainly
been used for the exclusion of coronary artery disease. The
main disadvantage of CT for clinical cardiac imaging is the
exposure of the patient to ionizing radiation. Experimental
cardiac imaging has largely been developed from clinical
approaches and therefore MRI is also the dominant imaging
modality [38]. However, exposure to ionizing radiation is not
important during ex vivo studies of cardiac microstructure, and
micro-CT may have an advantage over MRI in resolution,
speed and tissue contrast. These factors are discussed below.
Associated with the unique manner in which MRI generates
an image (from radio-frequency radiation induced in water
molecules) are physical factors which limit the use of MRI for
high resolution imaging. The main limitation is the extent of
movement of the water molecules within the tissue, known as
self-diffusion: over a typical MRI pulse of ~100 ms water
molecules can diffuse over the distance of ~8 µm, hence
limiting imaging resolution to >8 µm [39]. In comparison,
micro-CT resolution is limited primarily by scanner design,
and resolutions of ~1 µm can be achieved [18].
Another limitation of MRI is related to the signal-to-noise
ratio (SNR): increasing the resolution leads to a proportional
increase of the SNR for a given scan time. SNR can be
decreased (and hence, achievable resolution increased) by
increasing imaging time. As a result, long MRI imaging
sequences are required to obtain the highest quality images.
For example, ex vivo high resolution MRI (25 × 25 × 37 µm)
of whole fixed rat hearts has required 20 signal measurements
over 72 hours and averaging the result [16]. This may be
practical for stable fixed samples, but prevents the acquisition
of high resolution MRI images from fresh tissue. Therefore,
micro-CT may have more potential for the high resolution
imaging of non-fixed cardiac tissues.
Conventional MRI images provide poor myocardial contrast
and poor resolution of fibers. This can be enhanced by using
perfused contrast agents. Targeted contrast agents have been
developed for MRI that allow labeling of tissue features of
interest, e.g., collagen in fibrotic tissue [40]. However, contrast
MRI has not been used in studies of cardiac architectures.
Diffusion tensor MRI (DT-MRI) has been widely applied
for measuring the fiber and laminar orientation from hearts ex
vivo [13-15]. Accuracy of these measurements has also been
validated against histology [13, 41]. DT-MRI provides global
cardiac architecture maps that are useful in studies of the

Copyright (c) 2011 IEEE. Personal use is permitted. For any other purposes, permission must be obtained from the IEEE by emailing [email protected].
This article has been accepted for publication in a future issue of this journal, but has not been fully edited. Content may change prior to final publication.
> TMI-2012-0082.R1 <
8
myocardial organization and can be applied as computational
domains in 3D cardiac modelling [8, 11, 42]. However, the
maximum resolution of DT-MRI reported in the ex vivo
myocardium is ~100 µm, with acquisition times of ~10 hours
for volumetric scans of a small mouse heart [15]. DT-MRI is
limited to this resolution as the SNR of the imaging is
inherently low [15] and the tensor estimation is highly noise-
sensitive. As a result, DT-MRI images with low SNR result in
poorly assigned fiber orientations [43].
D. Effective atrial tissue resolution
3D atrial tissue architectures were reconstructed in this
study from the contrast micro-CT data at the voxel resolution
of 36 μm. However, the latter value is not the "true" tissue
resolution that can be incorporated into computational models
as the space step of numerical integration. There is no
straightforward procedure for measuring the "true" tissue
resolution from micro-CT imaging data. This is because the
reconstructed resolution may depend upon several factors: (i)
The focal spot size on the target sample. In our experiments
this was 3 μm for the voltage of 150 KV, however the size
generally varies from experiment to experiment depending on
the used voltage value. (ii) The sample to source and sample to
detector distances. (iii) The signal to noise ratio. A clear signal
is obtained by empirically selecting the correct voltage and
current for the sample, such that a ~30% transmission of X-
rays through the sample is obtained. The signal is afterwards
maximized, which was done in our experiments through
~50000 counts on the X-ray detector. The reported voxel size
of 36 μm was calculated during the reconstruction stage by the
Nikon Metrolasis CT-Pro software, which takes into account
factors (i)-(ii), but not (iii). As an empirical rule, for the Nikon
Metris custom bay system and the signal-to-noise ratio
optimization procedure used the "true" resolution is about (or
less than) twice the voxel size. Hence, the effective resolution
of the reconstructed atrial tissue is approximately 70 μm. This
value can be used in computational modelling of the 3D atria.
Note that the integration space step of 70 μm is more than
sufficient for computational purposes. For example, Zhao et al.
[12] histologically reconstructed the 3D sheep atrial model
with the voxel resolution of 50 μm; in simulations performed
with the model, no quantitative difference between results
obtained with the space steps of 50 and 100 μm was observed.
E. Computational models of the atria
Computational models with high degree of biophysical
detail have been developed for major parts of the heart.
Primarily, anatomically detailed 3D geometries have been
developed for the ventricles utilizing histological [7, 34, 35]
and later MRI [13, 14] techniques, and used as computational
domains in cardiac function modelling [8, 42].
Models of the atria have been based on the histologically
reconstructed Visible Female human geometry [9, 10, 36].
Reconstructions based on volumetric MRI [44] and CT [45]
have also been used to obtain generic surface geometries of the
atria. While these models included various details of atrial
anatomy, their segmentation into electrophysiologically and
anatomically distinctive tissue sub-domains was either absent
[36, 44] or based on phenomenological estimations of the sub-
domain locations [9, 45]. Moreover, even the most detailed 3D
models have not included accurate descriptions of fiber
architecture in the atria. Only few models have incorporated
prescribed local bundle anisotropy to account for the role of
specialized atrial conduction pathways, such as the BB [9, 10].
The model of the human atria by Aslanidi et al. [10]
overcame many limitations of earlier models by considering
detailed 3D geometry, as well as accurate electrophysiological
heterogeneity and local anisotropy (which was partly based on
DT-MRI data [11]). The latter two features of the model were
particularly important in simulations of AF arrhythmogenesis.
Primarily, the simulations showed that tissue heterogeneity
caused the break-down of the normal activation wavefronts at
rapid pacing rates, which initiated a pair of re-entrant scroll
waves - and tissue anisotropy resulted in a further break-down
of the scrolls into multiple meandering wavelets characteristic
of AF. This provided insights into the 3D dynamics of AF in
depth of the atria, which is beyond the current technical
capabilities of experimental or clinical set-ups.
However, even the most detailed 3D atrial model [10] has
not accounted for electrophysiological heterogeneity and
anisotropy of the PV sleeves, which are crucial in the genesis
of AF [3, 28, 29]. The contrast micro-CT method used in this
study provides (i) the novel segmentation of the PV sub-
domain and (ii) reconstruction of detailed fiber orientation in
the PV sleeves. Moreover, the method reconstructs the entire
segmented 3D atria with the effective resolution of ~70 µm,
which is a great improvement over the resolution of 330 µm
provided by the widely used Visible Female dataset. A new
family of heterogeneous electrophysiological models for the
canine RA, LA, BB and PV cells has been developed recently
[46]. Currently these models are being incorporated into a new
3D computational model that integrates the atrial cell
electrophysiology with the tissue geometry and fiber
orientations reconstructed from the contrast micro-CT data.
F. Limitations
Although time and labor intensive histological experiments
were beyond the scope of this study, a histological validation
will ultimately be required in order to evaluate the accuracy of
reconstruction of structural features (such as fiber orientations
in the BB and PVs) reconstructed using micro-CT.
Currently, we can only qualitatively compare the micro-
CT reconstruction of canine atria with histological results from
sheep atria [12]. Quantitative comparisons between various
experimental studies of the atrial fibers are extremely difficult
considering the varying atrial shape, size, wall thickness and
complex fiber pattern. Thus, Zhao et al. [47] have recently
compared fibers in human and sheep atria and illustrated
qualitative similarities of the structure of large atrial bundles in
these two species. But the same study has also suggested that
quantitative comparisons between atrial micro-architectures
from two different species were virtually impossible as the
Copyright (c) 2011 IEEE. Personal use is permitted. For any other purposes, permission must be obtained from the IEEE by emailing [email protected].
This article has been accepted for publication in a future issue of this journal, but has not been fully edited. Content may change prior to final publication.
> TMI-2012-0082.R1 <
9
fiber information belonged to different tissue geometries.
Hence, qualitative similarities between the contrast micro-CT
reconstruction of the PVs (Fig. 6) and the respective
histological [12], anatomical [25] and electro-anatomical data
[28] may be the only validation currently available for this
region. Note that although direct quantitative comparisons
between data from various species are not straightforward,
fiber inclination angles in the prominent BB reconstructed
from the contrast micro-CT (Fig. 5) were in good agreement
with histological [12] and anatomical [24] observations.
For the AVN segmented from the contrast micro-CT
images (Fig. 7), a direct histological validation was once again
beyond the scope of the present study. However, a histological
validation for the contrast micro-CT segmentation of the
atrioventricular conduction axis in a rat heart has been done
[22]. Direct comparisons of the micro-CT and histological
images of the same AVN tissue have shown that structures
~100 μm can be distinguished, and only individual cardiac
myocytes (<20 μm) are unclear. The canine AVN segmented
in the present study is ~13000 × 4000 × 500 μm and hence
sufficiently large to be reconstructed from micro-CT images.
Note that even high resolution histology may not always
provide clear information about atrial fiber directions. For the
sheep atrial free wall, Zhao et al. [12, 47] have histologically
reconstructed fiber orientation in several segments with the
resolution of 50 μm, and concluded that the fiber micro-
architecture in the wall is highly complex, with no clear fiber
direction in many regions. This is consistent with anatomical
observations [25]. Our preliminary reconstruction of fiber
orientation in a segment of the canine atrial free wall (not
shown) also reveals a complex fiber pattern. Efforts of
quantifying atrial micro-architectures in different species and
using various techniques (and hence, providing validated data
for computational modelling) are ongoing.
V. CONCLUSION
Understanding the spatio-temporal electrical dynamics during
normal sinus rhythm and atrial arrhythmias (such as AF)
requires full in-depth access to the atria. This is extremely
difficult to implement in an experimental or clinical set-up.
Computational models of the 3D atria, which are based on
multiple imaging modalities, can provide biophysical validated
means for dissecting and explaining electrical processes
underlying the normal and arrhythmic atrial dynamics.
Recent developments in semi-automated volumetric
histology [12, 35] and MRI/DT-MRI [13-16] have enabled
faster and higher resolution imaging of cardiovascular tissues,
but the problem of efficient reconstruction of computational
domains for biophysical modelling is still not fully resolved.
Micro-CT with iodine staining can have an advantage over
other methods in non-destructive imaging of 3D cardiac
architectures from large animals and humans, due to the
unique combination of high speed (~1 hour/scan for a large
canine heart) and high voxel resolution (36 µm) provided.
However, further validation of this novel method may be
needed. As none of the existing techniques has yet delivered
the golden standard for cardiovascular imaging, a combination
of multiple mutually-validating modalities may provide the
required solution. A combination of DT-MRI, used for non-
destructive reconstruction of fiber orientation, with subsequent
histological sectioning, to obtain fine details of the tissue
structure, has been applied to create a small-scale 3D model of
the sinus node [11]. Combining contrast micro-CT, for fast
non-destructive imaging of 3D tissue geometries and fiber
orientation, with semi-automated volumetric histology and
microscopy [12], for further validation of the fiber orientation
and tissue characteristics, may provide means for effective
high-throughput generation of large-scale computational
models of cardiac chambers and the entire heart.
ACKNOWLEDGMENT
We thank Dr Maureen Bain from the School of Veterinary
Medicine at the University of Glasgow (UK) for providing and
preparing the canine heart.
REFERENCES
[1] D. Noble, "Modeling the heart – from genes to cells to the whole organ,"
Science, vol. 295, pp. 1678-82, 2002.
[2] S.Y. Ho, and D. Sanchez-Quintana, "The importance of atrial structure
and fibers," Clinical Anatomy, vol. 22, pp. 52-63, 2009.
[3] M. Haissaguerre, P. Jais, D.C. Shah, et al., "Spontaneous initiation of
atrial fibrillation by ectopic beats originating in the pulmonary veins,"
N. Engl. J. Med., vol. 339, pp. 659-66, 1998.
[4] H. Calkins, K.H. Kuck, R. Cappato, et al., "2012 HRS/EHRA/ECAS
expert consensus statement on catheter and surgical ablation of atrial
fibrillation: recommendations for patient selection, procedural
techniques, patient management and follow-up, definitions, endpoints,
and research trial design," Heart Rhythm, vol. 9, pp. 632-96, 2012.
[5] F.X. Roithinger, J. Cheng, A. Sippens-Groenewegen, R.J. Lee, L.A.
Saxon, M.M. Scheinman, and M.D. Lesh, "Use of electroanatomic
mapping to delineate transseptal atrial conduction in humans,"
Circulation, vol. 100, pp. 1791-97, 1999.
[6] T. Kurian, C. Ambrosi, W. Hucker, V.V. Fedorov, and I.R. Efimov,
"Anatomy and electrophysiology of the human AV node," Pacing &
Clin. Electrophysiol., vol. 33, pp. 754-62, 2010.
[7] P.J. Hunter, A.J. Pullan, and B.H. Smaill, "Modeling total heart
function," Ann. Rev. Biomed. Eng., vol. 5, pp. 147-77, 2003.
[8] N.P. Smith, P.J. Hunter, and D.J. Paterson, "The Cardiac Physiome: at
the heart of coupling models to measurement," Exp. Physiol., vol. 94,
pp. 469-71, 2009.
[9] G. Seemann, C. Hoper, F.B. Sachse, O. Dossel, A.V. Holden, H. Zhang,
"Heterogeneous 3-dimensional anatomical and electrophysiological
model of human atria," Phil. Trans. A, vol. 364, pp. 1465-81, 2006.
[10] O.V. Aslanidi, M.A. Colman, J. Stott, H. Dobrzynski, M.R. Boyett,
A.V. Holden, and H. Zhang, "3D virtual human atria: a computational
platform for studying clinical atrial fibrillation," Prog. Biophys. Mol.
Biol., vol. 107, pp. 156-68, 2011.
[11] N. Chandler, O.V. Aslanidi, D. Buckley, et al., "Computer three-
dimensional anatomical reconstruction of the human sinus node and a
novel paranodal area," Anat. Rec. (Hoboken), vol. 294, pp. 970-79,
2011.
[12] J. Zhao, T.D. Butters, H. Zhang, A.J. Pullan, I.J. LeGrice, G.B. Sands,
and B.H. Smaill, "An image-based model of atrial muscular
architecture: Structural anisotropy and electrical activation," Circ.
Arrhythmia Electrophysiol., vol. 5, pp. 361-70, 2012.
[13] E.W. Hsu, A.L. Muzikant, S.A. Matulevicius, R.C. Penland, and C.S.
Henriquez, "Magnetic resonance myocardial fiber-orientation mapping
with direct histological correlation," Am. J. Physiol., vol. 274, pp.
H1627-34, 1998.
[14] D.F. Scollan, A. Holmes, J. Zhang, and R.L. Winslow, "Reconstruction
of cardiac ventricular geometry and fiber orientation using magnetic
resonance imaging," Ann. Biomed. Eng., vol. 28, pp. 934-44, 2000.
Copyright (c) 2011 IEEE. Personal use is permitted. For any other purposes, permission must be obtained from the IEEE by emailing [email protected].
This article has been accepted for publication in a future issue of this journal, but has not been fully edited. Content may change prior to final publication.
> TMI-2012-0082.R1 <
10
[15] Y. Jiang, K. Pandya, O. Smithies, and E.W. Hsu, "Three-dimensional
diffusion tensor microscopy of fixed mouse hearts," Magn. Reson.
Med., vol. 52, pp. 453-60, 2004.
[16] S.H. Gilbert, D. Benoist, A.P. Benson, et al., "Visualization and
quantification of whole rat heart laminar structure using high-spatial
resolution contrast-enhanced MRI," Am. J. Physiol., vol. 302, pp. H287-
98, 2012.
[17] F. Neues, and M. Epple, "X-ray microcomputed tomography for the
study of biomineralized endo- and exoskeletons of animals," Chem.
Rev., vol. 108, pp. 4734-41, 2008.
[18] M.W. Westneat, J.J. Socha, and W.K. Lee, "Advances in biological
structure, function, and physiology using synchrotron X-ray imaging,"
Annu. Rev. Physiol., vol. 70, pp. 119-42, 2008.
[19] B.D. Metscher, "MicroCT for comparative morphology: simple staining
methods allow high-contrast 3D imaging of diverse non-mineralized
animal tissues," BMC Physiol., vol. 9, pp. 11-25, 2009.
[20] K. Degenhardt, A.C. Wright, D. Horng, A. Padmanabhan, and J.A.
Epstein, "Rapid 3D phenotyping of cardiovascular development in
mouse embryos by micro-CT with iodine staining," Circ. Cardiovasc.
Imaging, vol. 3, pp. 314-22, 2010.
[21] N.S. Jeffery, R.S. Stephenson, J.A. Gallagher, J.C. Jarvis, and P.G. Cox.
"Micro-computed tomography with iodine staining resolves the
arrangement of muscle fibers," J. Biomech., vol. 44, pp. 189-92, 2011.
[22] R.S. Stephenson, M.R. Boyett, G. Hart, et al., "Contrast enhanced
micro-computed tomography resolves the 3-dimensional morphology of
the cardiac conduction system in mammalian hearts," PLoS One, vol. 7,
p. e35299, 2012.
[23] M. Krause, J.M. Hausherr, B. Burgeth, C. Herrmann, and W. Krenkel,
"Determination of the fiber orientation in composites using the structure
tensor and local X-ray transform," J. Mater. Sci., vol. 45, pp. 888-96,
2010.
[24] K. Wang, S.Y. Ho, D.G. Gibson, and R.H. Anderson, "Architecture of
atrial musculature in humans," Br. Heart. J., vol. 73, pp. 559-65, 1995.
[25] S.Y. Ho, J.A. Cabrera, and D. Sanchez-Quintana, "Left atrial anatomy
revisited," Circ. Arrhythm. Electrophysiol., vol. 5, pp. 220-28, 2012.
[26] D. O'Donnell, J.P. Bourke, and S.S. Furniss, "Interatrial transseptal
electrical conduction: comparison of patients with atrial fibrillation and
normal controls," J. Cardiovasc. Electrophysiol., vol. 13, pp. 1111-17,
2002.
[27] R. Lemery, G. Guiraudon, and J.P. Veinot, "Anatomic description of
Bachmann's bundle and its relation to the atrial septum," Am. J.
Cardiol., vol. 91, pp. 1482-85, 2003.
[28] M. Hocini, S.Y. Ho, T. Kawara, et al., "Electrical conduction in canine
pulmonary veins: electrophysiological and anatomic correlation,"
Circulation, vol. 105, pp. 2442-48, 2002.
[29] P. Sanders, O. Berenfeld, M. Hocini, et al., "Spectral analysis identifies
sites of high-frequency activity maintaining atrial fibrillation in
humans," Circulation, vol. 112, pp. 789-97, 2005.
[30] J. Li, I.D. Greener, S. Inada, et al., "Computer three-dimensional
reconstruction of the atrioventricular node," Circ. Res., vol. 102, pp.
975-85, 2008.
[31] L. Sherf, T.N. James, and W.T. Woods, "Function of the atrioventricular
node considered on the basis of observed histology and fine structure,"
J. Am. Coll. Cardiol., vol. 5, pp. 770-80, 1985.
[32] B.D. Metscher, and G.B. Muller, "MicroCT for molecular imaging:
quantitative visualization of complete three-dimensional distributions of
gene products in embryonic limbs," Dev. Dyn., vol. 240, pp. 2301-18,
2011.
[33] D.N. Lecker, S. Kumari, and A. Khan, "Iodine binding capacity and
iodine binding energy of glycogen," J. Polymer. Sci. A, vol. 35, pp.
1409-12, 1997.
[34] F.J. Vetter, and A.D. McCulloch, "Three-dimensional analysis of
regional cardiac function: a model of rabbit ventricular anatomy," Prog.
Biophys. Mol. Biol., vol. 69, pp. 157-83, 1998
[35] G.B. Sands, D.A. Gerneke, D.A. Hooks, C.R. Green, B.H. Smaill, and
I.J. Legrice, "Automated imaging of extended tissue volumes using
confocal microscopy," Microsc. Res. Tech., vol. 67, pp. 227-239, 2005.
[36] D Harrild, and C. Henriquez, "A computer model of normal conduction
in the human atria," Circ. Res., vol. 87, pp. 25-36, 2000.
[37] G. Constantine, K. Shan, S.D. Flamm, and M.U. Sivananthan, "Role of
MRI in clinical cardiology," Lancet, vol. 363, pp. 2162-71, 2004.
[38] R.M. Botnar, and M.R. Makowski, "Cardiovascular magnetic resonance
imaging in small animals," Prog. Mol. Biol. Transl. Sci., vol. 105, pp.
227-61, 2012.
[39] P. Glover, and P. Mansfield, "Limits to magnetic resonance
microscopy," Rep. Prog. Phys., vol. 65, pp. 1489-1511, 2002.
[40] E. Spuentrup, K.M. Ruhl, R.M. Botnar, et al., "Molecular magnetic
resonance imaging of myocardial perfusion with EP-3600, a collagen-
specific contrast agent: initial feasibility study in a swine model,"
Circulation, vol. 119, pp. 1768-75, 2009.
[41] G.L. Kung, T.C. Nguyen, A. Itoh, et al., "The presence of two local
myocardial sheet populations confirmed by diffusion tensor MRI and
histological validation," J. Magn. Reson. Imaging, vol. 34, pp. 1080-91,
2011.
[42] A.P. Benson, O.V. Aslanidi, H. Zhang, and A.V. Holden, "The canine
virtual ventricular wall: a platform for dissecting pharmacological
effects on propagation and arrhythmogenesis," Prog. Biophys. Mol.
Biol., vol. 96, pp. 187-208, 2008.
[43] P.G. Batchelor, D. Atkinson, D.L. Hill, F. Calamante, and A. Connelly,
"Anisotropic noise propagation in diffusion tensor MRI sampling
schemes," Magn. Reson. Med., vol. 49, pp. 1143-51, 2003.
[44] V. Jacquemet, A. van Oosterom, J.-M. Vesin, and L. Kappenberger,
"Analysis of electrocardiograms during atrial fibrillation. A biophysical
model approach," IEEE Eng. Med. Biol. Mag., vol. 25, pp. 79-88, 2006.
[45] M. Ridler, D.M. McQueen, C.S. Peskin, and E. Vigmond, "Action
potential duration gradient protects the right atrium from fibrillating," In
Conf. Proc. 2006 IEEE Eng. Med. Biol. Soc., pp. 3978-81.
[46] O.V. Aslanidi, T.D. Butters, C.X. Ren, G. Ryecroft, and H. Zhang,
"Electrophysiological models for the heterogeneous canine atria:
computational platform for studying rapid atrial arrhythmias," In Conf.
Proc. 2011 IEEE Eng. Med. Biol. Soc., pp. 1693-96.
[47] J. Zhao, M.W. Krueger, G. Seemann, et al., "Myofiber orientation and
electrical activation in human and sheep atrial models," In Conf. Proc.
2012 IEEE Eng. Med. Biol. Soc., to be published.
Related Documents