Application of Low Field and Solid-State NMR Spectroscopy to Study the Liquid/Liquid Interface in Porous Space of Clay Minerals and Shales Artem Borysenko, 1 Ben Clennell, 2 Iko Burgar, 3 David Dewhurst, 2 Rossen Sedev, 1 John Ralston 1 1 Ian Wark Research Institute UniSA – Adelaide, Australia 2 CSIRO Petroleum – Perth, Australia 3 CSIRO Materials Science and Engineering – Melbourne. Australia Corresponding author: Artem Borysenko, Ian Wark Research Institute UniSA – Adelaide, Mawson Lakes SA 5095, Australia, E-Mail: [email protected] (received 7 July 2008, accepted 19 January 2009) Abstract In petroleum research understanding displacement, redistribution, and adsorption of oil and water plays an important role. To study complex multi-component systems such as liquid/liquid/mineral interactions in the porous space of clays and shales we applied low field (2 – 15 MHz) and high resolution (300 MHz) NMR spectroscopy. The detailed NMR analysis shows that the results from low field NMR measurements are in good correlation with the solid-state data. Consequently the process of liquid/liquid displacement can be characterised by considering the relaxation times, signal amplitudes and chemical shifts together. Keywords Low field NMR, solid-state NMR, shale, clay, wettability 1. Introduction Low field NMR spectroscopy is widely used for the study of fluids in porous mediums such as rocks and minerals [1]. High resolution NMR methods also find application for the characterization of interactions between fluid and rock surfaces within the porous space [2]. In our research we combined low field NMR spectroscopy with high resolution NMR methods as well as wettability characterization [3] to investigate the effect of liquid adsorption on the wettability of porous rock depending on mineralogical structure and liquid viscosity. The Open-Access Journal for the Basic Principles of Diffusion Theory, Experiment and Application The Open-Access Journal for the Basic Principles of Diffusion Theory, Experiment and Application © 2009, A. Borysenko Diffusion Fundamentals 10 (2009) 2.1 - 2.4 1

Welcome message from author
This document is posted to help you gain knowledge. Please leave a comment to let me know what you think about it! Share it to your friends and learn new things together.
Transcript

Application of Low Field and Solid-State NMR Spectroscopy to Study the Liquid/Liquid Interface in Porous Space of Clay
Minerals and Shales
Artem Borysenko,1 Ben Clennell,2 Iko Burgar,3 David Dewhurst,2
Rossen Sedev,1 John Ralston1
1 Ian Wark Research Institute UniSA – Adelaide, Australia 2 CSIRO Petroleum – Perth, Australia
3 CSIRO Materials Science and Engineering – Melbourne. Australia
Corresponding author: Artem Borysenko, Ian Wark Research Institute UniSA – Adelaide, Mawson Lakes SA 5095, Australia, E-Mail: [email protected]
(received 7 July 2008, accepted 19 January 2009)
Abstract In petroleum research understanding displacement, redistribution, and adsorption of oil and
water plays an important role. To study complex multi-component systems such as liquid/liquid/mineral interactions in the porous space of clays and shales we applied low field (2 – 15 MHz) and high resolution (300 MHz) NMR spectroscopy. The detailed NMR analysis shows that the results from low field NMR measurements are in good correlation with the solid-state data. Consequently the process of liquid/liquid displacement can be characterised by considering the relaxation times, signal amplitudes and chemical shifts together.
Keywords Low field NMR, solid-state NMR, shale, clay, wettability
1. Introduction Low field NMR spectroscopy is widely used for the study of fluids in porous mediums
such as rocks and minerals [1]. High resolution NMR methods also find application for the characterization of interactions between fluid and rock surfaces within the porous space [2]. In our research we combined low field NMR spectroscopy with high resolution NMR methods as well as wettability characterization [3] to investigate the effect of liquid adsorption on the wettability of porous rock depending on mineralogical structure and liquid viscosity.
The Open-Access Journal for the Basic Principles of Diffusion Theory, Experiment and ApplicationThe Open-Access Journal for the Basic Principles of Diffusion Theory, Experiment and Application
© 2009, A. BorysenkoDiffusion Fundamentals 10 (2009) 2.1 - 2.4 1
2. Samples and Methods For our investigation we selected two shale minerals with distinctively different wetting behaviour [3]: hydrophobic O1A (Quartz 41%, Kaolin 42%, Mica 16%, Hematite <1%, Siderite <1%) and hydrophilic L1_390 (Quartz 20%, Orthoclase 11%, Illite 49%, Chlorite 2%, Hematite 5%, Dolomite 13%). They were tested in dried, powdered state and then saturated with two different crude oils (C - light crude oil: 45
API; viscosity 3 mPas, and H - heavy crude oil: 20 API; viscosity 220 mPas at 20° C) and sea water (35,000 salinity). The liquid distribution within mineral packs was studied by determination of the transverse
nuclear spin relaxation time decay T2 using the Carr–Purcell–Meiboom–Gill (CPMG) pulse sequence on a Maran Ultra NMR spectrometer (2 MHz) and a Bruker NMR Surface Analyser MOUSE - MObile Universal Surface Explorer (15 MHz). High-resolution solid-state 13C NMR spectra were obtained on Varian Unity-plus 300 MHz NMR spectrometer by the use of magic-angle spinning (MAS) and 1H high-power dipolar decoupling (DD).
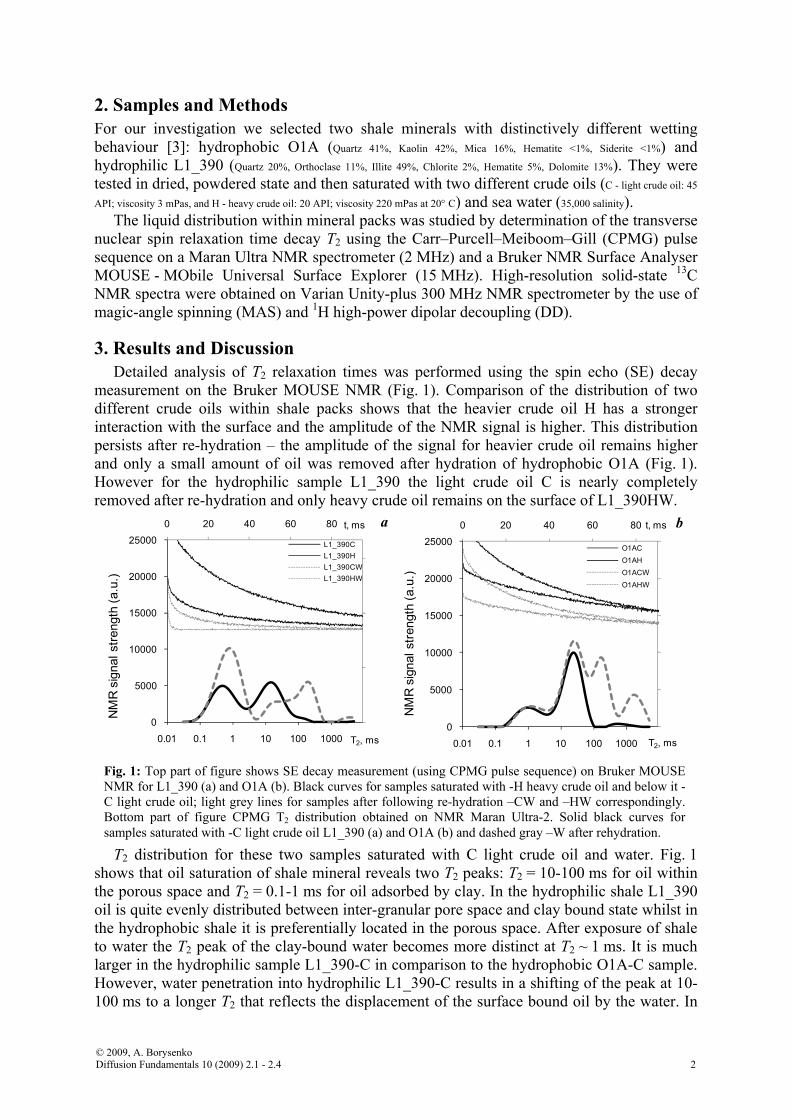
3. Results and Discussion Detailed analysis of T2 relaxation times was performed using the spin echo (SE) decay
measurement on the Bruker MOUSE NMR (Fig. 1). Comparison of the distribution of two different crude oils within shale packs shows that the heavier crude oil H has a stronger interaction with the surface and the amplitude of the NMR signal is higher. This distribution persists after re-hydration – the amplitude of the signal for heavier crude oil remains higher and only a small amount of oil was removed after hydration of hydrophobic O1A (Fig. 1). However for the hydrophilic sample L1_390 the light crude oil C is nearly completely removed after re-hydration and only heavy crude oil remains on the surface of L1_390HW.
0 20 40 60 80
-25
-10
5
20
0
5000
10000
15000
20000
25000
0.01 0.1 1 10 100 1000
t, ms
NM
R s
igna
l stre
ngth
(a.u
.)
T2, ms
L1_390CL1_390HL1_390CWL1_390HW
a 0 20 40 60 80
-25
-15
-5
5
15
25
0
5000
10000
15000
20000
25000
0.01 0.1 1 10 100 1000
t, ms
NM
R s
igna
l stre
ngth
(a.u
.)
T2, ms
O1ACO1AHO1ACWO1AHW
b
T2 distribution for these two samples saturated with C light crude oil and water. Fig. 1
shows that oil saturation of shale mineral reveals two T2 peaks: T2 = 10-100 ms for oil within the porous space and T2 = 0.1-1 ms for oil adsorbed by clay. In the hydrophilic shale L1_390 oil is quite evenly distributed between inter-granular pore space and clay bound state whilst in the hydrophobic shale it is preferentially located in the porous space. After exposure of shale to water the T2 peak of the clay-bound water becomes more distinct at T2 ~ 1 ms. It is much larger in the hydrophilic sample L1_390-C in comparison to the hydrophobic O1A-C sample. However, water penetration into hydrophilic L1_390-C results in a shifting of the peak at 10-100 ms to a longer T2 that reflects the displacement of the surface bound oil by the water. In
Fig. 1: Top part of figure shows SE decay measurement (using CPMG pulse sequence) on Bruker MOUSE NMR for L1_390 (a) and O1A (b). Black curves for samples saturated with -H heavy crude oil and below it -C light crude oil; light grey lines for samples after following re-hydration –CW and –HW correspondingly. Bottom part of figure CPMG T2 distribution obtained on NMR Maran Ultra-2. Solid black curves for samples saturated with -C light crude oil L1_390 (a) and O1A (b) and dashed gray –W after rehydration.
© 2009, A. BorysenkoDiffusion Fundamentals 10 (2009) 2.1 - 2.4 2
comparison, water penetration into hydrophobic shale O1A-C is accompanied by the appearance of water peaks at T2 > 100 ms, reflecting filling of inter-particle pore space, where water avoids the surfaces and does not cause liquid/liquid displacement.
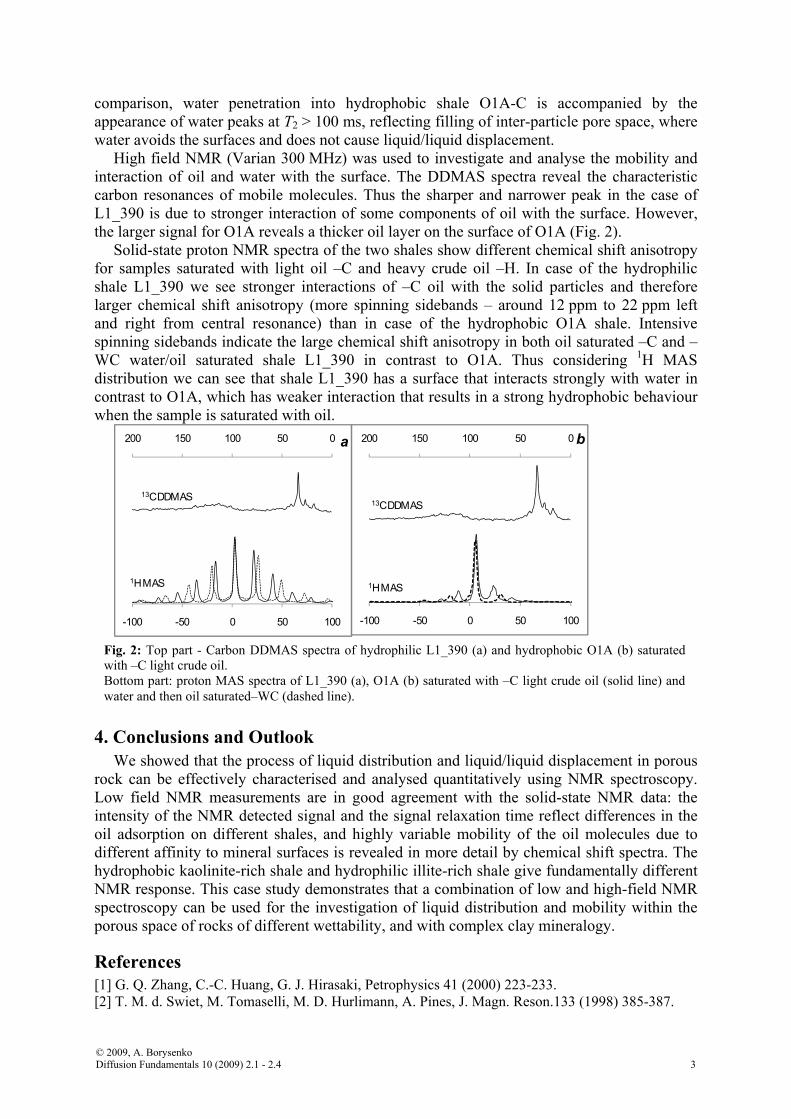
High field NMR (Varian 300 MHz) was used to investigate and analyse the mobility and interaction of oil and water with the surface. The DDMAS spectra reveal the characteristic carbon resonances of mobile molecules. Thus the sharper and narrower peak in the case of L1_390 is due to stronger interaction of some components of oil with the surface. However, the larger signal for O1A reveals a thicker oil layer on the surface of O1A (Fig. 2).
Solid-state proton NMR spectra of the two shales show different chemical shift anisotropy for samples saturated with light oil –C and heavy crude oil –H. In case of the hydrophilic shale L1_390 we see stronger interactions of –C oil with the solid particles and therefore larger chemical shift anisotropy (more spinning sidebands – around 12 ppm to 22 ppm left and right from central resonance) than in case of the hydrophobic O1A shale. Intensive spinning sidebands indicate the large chemical shift anisotropy in both oil saturated –C and –WC water/oil saturated shale L1_390 in contrast to O1A. Thus considering 1H MAS distribution we can see that shale L1_390 has a surface that interacts strongly with water in contrast to O1A, which has weaker interaction that results in a strong hydrophobic behaviour when the sample is saturated with oil.
050100150200
-100 -50 0 50 100
a
13C DDMAS
1HMAS
050100150200
-100 -50 0 50 100
b
1HMAS
13C DDMAS
Fig. 2: Top part - Carbon DDMAS spectra of hydrophilic L1_390 (a) and hydrophobic O1A (b) saturated with –C light crude oil. Bottom part: proton MAS spectra of L1_390 (a), O1A (b) saturated with –C light crude oil (solid line) and water and then oil saturated–WC (dashed line).
4. Conclusions and Outlook We showed that the process of liquid distribution and liquid/liquid displacement in porous
rock can be effectively characterised and analysed quantitatively using NMR spectroscopy. Low field NMR measurements are in good agreement with the solid-state NMR data: the intensity of the NMR detected signal and the signal relaxation time reflect differences in the oil adsorption on different shales, and highly variable mobility of the oil molecules due to different affinity to mineral surfaces is revealed in more detail by chemical shift spectra. The hydrophobic kaolinite-rich shale and hydrophilic illite-rich shale give fundamentally different NMR response. This case study demonstrates that a combination of low and high-field NMR spectroscopy can be used for the investigation of liquid distribution and mobility within the porous space of rocks of different wettability, and with complex clay mineralogy.
References [1] G. Q. Zhang, C.-C. Huang, G. J. Hirasaki, Petrophysics 41 (2000) 223-233. [2] T. M. d. Swiet, M. Tomaselli, M. D. Hurlimann, A. Pines, J. Magn. Reson.133 (1998) 385-387.
© 2009, A. BorysenkoDiffusion Fundamentals 10 (2009) 2.1 - 2.4 3

[3] A. Borysenko, B. Clennell, R. Sedev, J. Ralston, M. Raven, D. Dewhurst, SCA International Symposium, Trondheim,Norway, 12-16 September. SCA2006-03 (2006) 1-12.
© 2009, A. BorysenkoDiffusion Fundamentals 10 (2009) 2.1 - 2.4 4
Related Documents