Application of landscape mosaics for the assessment of subtidal macroalgae communities using the CFR index Xabier Guinda a,n , Ana Gracia a , Araceli Puente a , José Antonio Juanes a , Yuri Rzhanov b , Larry Mayer b a Institute of Environmental Hydraulics (IH Cantabria), Universidad de Cantabria, PCTCAN, C/Isabel Torres no.15, 39011, Santander, Spain b Center for Coastal & Ocean Mapping – Joint Hydrographic Center, University of New Hampshire, Jere A. Chase Ocean Engineering Lab, 24 Colovos Road, Durham, NH 03824, USA article info Keywords: Landscape mosaics CFR index Subtidal macroalgae Sample size Water Framework Directive abstract The assessment of anthropogenic impacts and ecological status of coastal waters is an important task to accomplish under the European Water Framework Directive (WFD 2000/60/EEC). Macroalgae are one of the biological quality elements that must be considered, but their assessment has been generally limited to intertidal areas due to the difficulties and costs associated with working in subtidal areas. In this work, the suitability of using landscape mosaicing techniques is analyzed for the application of the “Quality of Rocky Bottoms” index (CFR by its Spanish acronym) in subtidal areas. For this purpose, the sensitivity and accuracy of both the indicators that compose the CFR index (characteristic macroalgae coverage, fraction of opportunistics and characteristic macroalgae richness) and the index itself were tested against different sampling surfaces and validated through direct applications of the CFR carried out in situ by scuba divers. The study was carried out at three sites, located on the coast of Cantabria (N. Spain), covering a variety of environmental conditions (depth ranges and anthropogenic pressures). Underwater video transects of 5–20 m length were recorded by scuba divers and processed with specialized software to build continuous image mosaics of the assessment sites. Each mosaic was inserted into a Geographical Information System where all distinguishable macroalgal species were identified and their coverages were estimated. Replicated subsamples of different areas (0.25 m 2 , 0.5 m 2 ,1m 2 and 2.5 m 2 ) were tested from each mosaic for the estimation of both the single indicators and the CFR index itself. Main results showed that larger subsample areas produced higher and more accurate CFR values, mainly related to higher srichness values and to smaller variability within the replicates. Accordingly, the minimum sample size required to carry out this type of studies was estimated to be of 2.5 m 2 , showing no significant differences with the total mosaics. At this spatial scale, the assessments of the CFR index using mosaics showed a significant correlation and an excellent agreement with the results obtained in situ. In summary, underwater video mosaicing techniques proved to be a useful tool for the application of the CFR index and could also be of great interest for the study of subtidal environments by allowing visualization of extensive seafloor areas. & 2013 Elsevier Ltd. All rights reserved. 1. Introduction During the last decade, the requirements established by the European Water Framework Directive (WFD 2000/60/EEC) have motivated the development of several biotic indices for the assessment of different biological quality elements (phytoplank- ton, macroalgae, angiosperms, benthic invertebrates and fishes). Regarding macroalgae communities, most European countries have limited their assessments to the intertidal fringe due to costs and difficulties associated with working in subtidal areas. In this sense, most of the developed indices have been focused on their application to intertidal areas (e.g., Ballesteros et al., 2007; Bermejo et al., 2012; Díez et al., 2012a; Neto et al., 2012; Orfanidis et al., 2003; Pinedo et al., 2007; Wells et al., 2007) but only a few of them are appropriate for subtidal areas (Derrien and Legal, 2010; Carpentier et al., 2011) or for both intertidal and subtidal areas (Juanes et al., 2008). Most of these indices require precise species identifications, which makes their application in subtidal areas difficult. However, the “Quality of Rocky Bottoms” index (CFR by its Spanish acronym) (Juanes et al., 2008; Guinda et al., 2014) uses an easy to apply methodology that does not require very precise taxonomical identi- fications because it is based on the assessment of general coverages Contents lists available at ScienceDirect journal homepage: www.elsevier.com/locate/dsr2 Deep-Sea Research II 0967-0645/$ - see front matter & 2013 Elsevier Ltd. All rights reserved. http://dx.doi.org/10.1016/j.dsr2.2013.09.037 n Corresponding author. Tel.: þ34 942 20 16 16x1118; fax: þ34 942 26 63 61. E-mail address: [email protected] (X. Guinda). Please cite this article as: Guinda, X., et al., Application of landscape mosaics for the assessment of subtidal macroalgae communities using the CFR index. Deep-Sea Res. II (2013), http://dx.doi.org/10.1016/j.dsr2.2013.09.037i Deep-Sea Research II ∎ (∎∎∎∎) ∎∎∎–∎∎∎

Application of landscape mosaics for the biological quality assessment of subtidal macroalgae communities using the CFR index
Jul 21, 2015
Welcome message from author
This document is posted to help you gain knowledge. Please leave a comment to let me know what you think about it! Share it to your friends and learn new things together.
Transcript
Application of landscape mosaics for the assessment of subtidalmacroalgae communities using the CFR index
Xabier Guinda a,n, Ana Gracia a, Araceli Puente a, José Antonio Juanes a,Yuri Rzhanov b, Larry Mayer b
a Institute of Environmental Hydraulics (IH Cantabria), Universidad de Cantabria, PCTCAN, C/Isabel Torres no. 15, 39011, Santander, Spainb Center for Coastal & Ocean Mapping – Joint Hydrographic Center, University of New Hampshire, Jere A. Chase Ocean Engineering Lab, 24 Colovos Road,Durham, NH 03824, USA
a r t i c l e i n f o
Keywords:Landscape mosaicsCFR indexSubtidal macroalgaeSample sizeWater Framework Directive
a b s t r a c t
The assessment of anthropogenic impacts and ecological status of coastal waters is an important task toaccomplish under the European Water Framework Directive (WFD 2000/60/EEC). Macroalgae are one ofthe biological quality elements that must be considered, but their assessment has been generally limitedto intertidal areas due to the difficulties and costs associated with working in subtidal areas. In this work,the suitability of using landscape mosaicing techniques is analyzed for the application of the “Quality ofRocky Bottoms” index (CFR by its Spanish acronym) in subtidal areas. For this purpose, the sensitivity andaccuracy of both the indicators that compose the CFR index (characteristic macroalgae coverage, fractionof opportunistics and characteristic macroalgae richness) and the index itself were tested againstdifferent sampling surfaces and validated through direct applications of the CFR carried out in situ byscuba divers. The study was carried out at three sites, located on the coast of Cantabria (N. Spain),covering a variety of environmental conditions (depth ranges and anthropogenic pressures). Underwatervideo transects of 5–20 m length were recorded by scuba divers and processed with specialized softwareto build continuous image mosaics of the assessment sites. Each mosaic was inserted into a GeographicalInformation System where all distinguishable macroalgal species were identified and their coverageswere estimated. Replicated subsamples of different areas (0.25 m2, 0.5 m2, 1 m2 and 2.5 m2) were testedfrom each mosaic for the estimation of both the single indicators and the CFR index itself. Main resultsshowed that larger subsample areas produced higher and more accurate CFR values, mainly related tohigher srichness values and to smaller variability within the replicates. Accordingly, the minimumsample size required to carry out this type of studies was estimated to be of 2.5 m2, showing nosignificant differences with the total mosaics. At this spatial scale, the assessments of the CFR index usingmosaics showed a significant correlation and an excellent agreement with the results obtained in situ. Insummary, underwater video mosaicing techniques proved to be a useful tool for the application of theCFR index and could also be of great interest for the study of subtidal environments by allowingvisualization of extensive seafloor areas.
& 2013 Elsevier Ltd. All rights reserved.
1. Introduction
During the last decade, the requirements established by theEuropean Water Framework Directive (WFD 2000/60/EEC) havemotivated the development of several biotic indices for theassessment of different biological quality elements (phytoplank-ton, macroalgae, angiosperms, benthic invertebrates and fishes).Regarding macroalgae communities, most European countrieshave limited their assessments to the intertidal fringe due to costs
and difficulties associated with working in subtidal areas. In thissense, most of the developed indices have been focused on theirapplication to intertidal areas (e.g., Ballesteros et al., 2007; Bermejoet al., 2012; Díez et al., 2012a; Neto et al., 2012; Orfanidis et al., 2003;Pinedo et al., 2007; Wells et al., 2007) but only a few of them areappropriate for subtidal areas (Derrien and Legal, 2010; Carpentieret al., 2011) or for both intertidal and subtidal areas (Juanes et al.,2008). Most of these indices require precise species identifications,which makes their application in subtidal areas difficult. However,the “Quality of Rocky Bottoms” index (CFR by its Spanish acronym)(Juanes et al., 2008; Guinda et al., 2014) uses an easy to applymethodology that does not require very precise taxonomical identi-fications because it is based on the assessment of general coverages
Contents lists available at ScienceDirect
journal homepage: www.elsevier.com/locate/dsr2
Deep-Sea Research II
0967-0645/$ - see front matter & 2013 Elsevier Ltd. All rights reserved.http://dx.doi.org/10.1016/j.dsr2.2013.09.037
n Corresponding author. Tel.: þ34 942 20 16 16x1118; fax: þ34 942 26 63 61.E-mail address: [email protected] (X. Guinda).
Please cite this article as: Guinda, X., et al., Application of landscape mosaics for the assessment of subtidal macroalgae communitiesusing the CFR index. Deep-Sea Res. II (2013), http://dx.doi.org/10.1016/j.dsr2.2013.09.037i
Deep-Sea Research II ∎ (∎∎∎∎) ∎∎∎–∎∎∎
of large characteristic macroalgae and opportunistic species. Thissimplification of the assessment procedure makes fast application ofthe index possible (e.g. Guinda et al., 2008), which is very practical forextensive monitoring works or for its application to subtidal areas.
Most of the studies carried out at subtidal rocky bottomsrequire in situ sampling works that are usually performed byscuba divers. These studies are very time-consuming because theyrequire visual assessments at various sampling units or quantita-tive sample collection works. In the case of visual assessments,divers must be skilled in taxonomic identification and assessmentprocedures and quantitative sample collections are extremelytime-consuming and limited to small sampling areas. Theseinconveniences reduce the number of sampling units and the totalareas that can be covered at each dive. To facilitate these surveys,other sampling techniques, such as underwater photography andvideo, have been used as an alternative. Photo-transect techniqueshave been successfully used for the study of several aspectsregarding benthic communities, such as their structure anddynamics (Garrabou et al., 2002), long-term temporal changes(Kollmann and Stachowitsch, 2001), continuous changes alongdepth gradients (Smale, 2008), coral reef recovery after hurricaneimpacts (Coles and Brown, 2007), algal bed ecological monitoring(Ducrotoy and Simpson, 2001) and general monitoring works (VanRein et al., 2011). Video techniques have been applied by Norriset al. (1997) for the assessment of subtidal seagrasses or, combinedwith hydroacoustic techniques, for the seafloor substrate classifi-cation (Rooper and Zimmermann, 2007). Combinations of under-water imagery and hydroacoustic techniques, together withmodeling and automated classification techniques, have beenuseful for the development of predictive habitat distribution maps(Ierodiaconou et al., 2011; Holmes et al., 2008), which are veryvaluable for the extensive management of subtidal areas.
In addition to the reduced scientific expertise needed for diversand the reduced diving times needed for video recordings or photo-graphs, these techniques provide the added benefit of permanentvisual records, which can be later analyzed in the laboratory, lookingfor additional information in the images. However, one of the mainweaknesses of the photography and video surveys is their lowresolution; species must be identified from a photograph or fromindividual video frames, which can be difficult in case of small-sizedorganisms. This limitation is partially compensated by the possibilityof having information from large surveyed areas, which are especiallyattractive for extensive assessments or monitoring studies. A stepforward in this sense has been achieved with the development ofvideo and photomosaicing techniques (e.g. Gracias and Santos-Victor,1998; Marks et al., 1995; Rzhanov et al., 2000; Rzhanov et al., 2007)that allow the creation of large images of the seafloor by mosaicingseveral photographs or video frames, thus providing a wide vision ofthe structure and composition of benthic assemblages in the surveyedarea. In this aspect, Parravicini et al. (2009) and Kaiser (2003)considered that sampling unit size, rather than sampling method, isthe crucial factor to take into account in sampling design. Conse-quently, it is necessary to define, according to the pursued objectives,the minimum sampling area required for each type of study. Moststudies of subtidal environments use small sampling quadrats thatgenerally range between 0.025 and 1m2 (e.g. Carpentier et al., 2011;Álvaro et al., 2008; Garrabou et al., 2002; Parravicini et al., 2010). Incontrast, video mosaic analyses are based on records of wide areasthat can range between 10 and 600 m2 (e.g. Lirman et al., 2007;Lirman et al., 2010; Ludvigsen et al., 2007) and subsampling ofdifferent quadrats with areas between 0.25 and 1m2 (Lirman et al.,2007, 2010). Video-mosaicing techniques have been used in differenttypes of underwater studies, such as the assessment of coral reefstatus (Lirman et al., 2007), recovery of reefs after injuries suffered byvessel groundings (Lirman et al., 2010) and by hurricane impacts(Gleason et al., 2007). Besides biological applications, these techniques
have been also used in deep-sea archeological surveys (Søreide andJasinski, 2005; Ludvigsen et al., 2007). Geographic Information Sys-tems (GIS) provide a very useful tool for these applications, as theyallow carrying out spatial analyses (e.g. estimation of coveragepercentages of different biological species) over large geo-referencedvideomosaics (Jerosch et al., 2006).
The use of Remotely Operated Vehicles (ROVs) and underwatertowed cameras has provided an additional tool to survey deep subtidalareas (e.g Guinan et al., 2009; Lorance and Trenkel, 2006; Norcrossand Mueter, 1999; Rzhanov et al., 2007). These systems reduce theinherent limitations of scuba divers because they can reach deeperdepths and provide longer underwater time, thereby increasing thepossibility of carrying out more extensive surveys at greater depthranges. In shallow areas, the use of ROVs can be also very useful asthey allow surveying a great number of sampling stations in the sameday, which is not possible by scuba diving, thus reducing the temporalvariability and costs of the surveys. This advantage can be even moreinteresting in highly hydrodynamic coastal regions, such as theCantabrian Sea (Castanedo et al., 2006; Valencia et al., 2004), wherethe number of subtidal surveying available days can be very limited.
Finally, the use of non-destructive sampling methods, included inthe recommendations of the International Council for the Explorationof the Sea (ICES, 2001), assumes less environmental damage andabsence of laboratory work, thereby simplifying data processing andnotably reducing the total monitoring costs (Ballesteros et al., 2007;DEFRA, 2004; García-Castrillo et al., 2000). Non-destructive samplingmethods in underwater surveys require fast visual assessments thatusually cannot allow for detailed taxonomical identifications (e.g.Guinda et al., 2012). In this sense, the level of taxonomic detailrequired in the studies should be taken into account based on thepursued objectives. Since Ellis (1985) introduced the concept oftaxonomic sufficiency, many studies have demonstrated that, insome cases, identification of organisms to higher taxonomic levels,such as family or order, is sufficient to achieve the desired objectives(Díez et al., 2010; Ferraro and Cole, 1990; Puente and Juanes, 2008;Somerfield and Clarke, 1995; Warwick, 1988a, 1988b).
The assessment of the CFR index is based on an ecologicalapproach that does not require a precise taxonomical identifica-tion of macroalgal species and which application should be carriedout over extensive survey areas. Hence, considering all the abovementioned aspects, the use of underwater videomosaics as largesubtidal sampling units, combined with the use of GIS applicationsfor the identification and quantification of main macroalgalspecies, and the application of the CFR index (Juanes et al.,2008), might be a low-cost and effective strategy for the rapidassessment of subtidal macroalgae assemblages in order to carryout extensive management or monitoring works. In that sense, oneof the main aspects that should be solved is the minimumsampling area required for accurate and reliable results.
According to these guidelines, the aim of this work is to assess thesuitability of using seafloor video mosaics for the application of theCFR index in subtidal areas. For this purpose, two specific objectivesare established: (i) to analyze the sensitivity and accuracy of theestimation of both the indicators that compose the CFR index(characteristic macroalgae coverage, fraction of opportunistics andcharacteristic macroalgae richness) and the index itself using differ-ent sampling surfaces and (ii) to validate the obtained resultsthrough direct applications of the CFR index in the field.
2. Material and methods
2.1. Study area
The study was carried out during the summer of 2011 inthe coast of Cantabria (N. Spain) (Fig. 1). This coastal region is
X. Guinda et al. / Deep-Sea Research II ∎ (∎∎∎∎) ∎∎∎–∎∎∎2
Please cite this article as: Guinda, X., et al., Application of landscape mosaics for the assessment of subtidal macroalgae communitiesusing the CFR index. Deep-Sea Res. II (2013), http://dx.doi.org/10.1016/j.dsr2.2013.09.037i
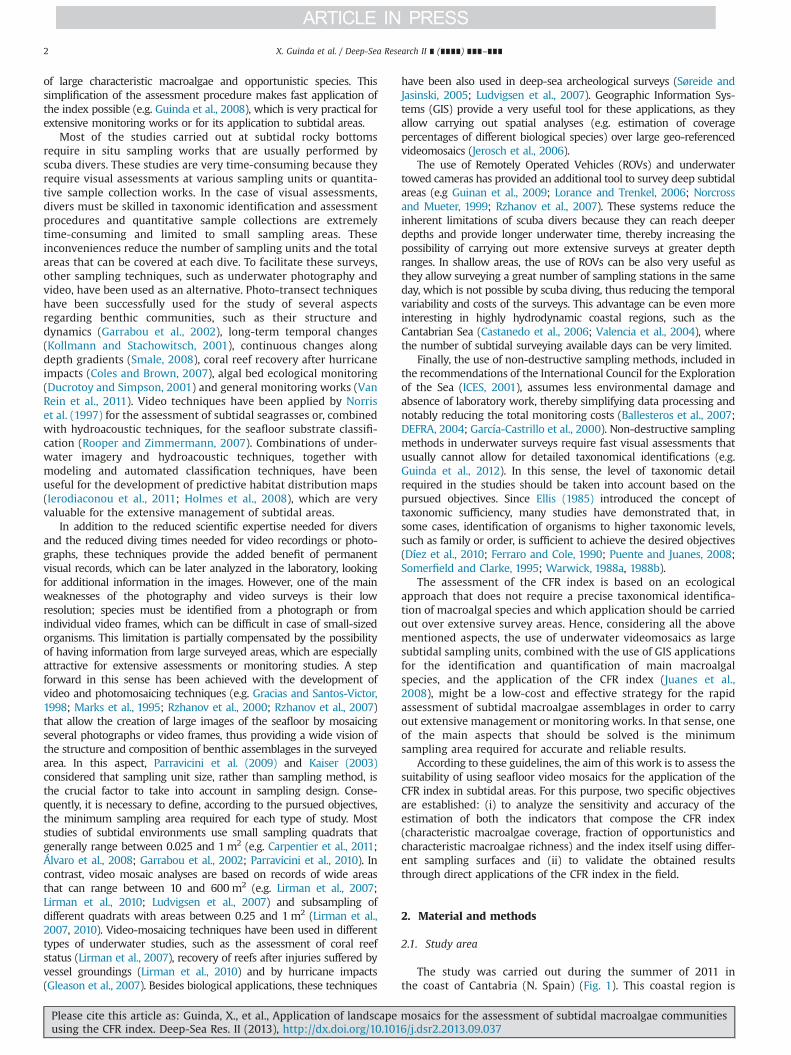
characterized by low chlorophyll values along the year (back-ground concentrations of o0.5 mg/m3), but exposed to seasonalblooms associated to large scale climatic and oceanographicconditions occurring in the Bay of Biscay (Garcia-Soto and Pingree,2009, 2012). Three sampling locations were selected trying toaccomplish for different environmental conditions affectingmacroalgae development. At the first site, Castro (CA), an urbaneffluent is discharged through a submarine outfall. The secondplace, Ontón (ON), is located near the industrial effluent of afluoride factory that discharges directly to the intertidal zone. Thethird site, Callejos de Bamboa (CB), is located between Castro andOntón. Three sampling stations were established in Castro andOntón and two were established in Callejos de Bamboa. Thestations were classified according to three depth ranges; shallow(S), between 10 and 15 m depth, was only represented by ON-1station, medium (M), between 15 and 20 m, was represented byCA-1, CB-1 and ON-2, and deep (D), between 20 and 25 m, wasrepresented by CA-2, CA-3, CB-2 and ON-3.
2.2. Survey methodology
At each station, two to three transects of 5–20 m length and1 m wide were video recorded by scuba divers over stable rocky
substrates that were suitable for macroalgae colonization. At thebeginning of each transect, a 50 � 50 cm2 was set as a referencescale in order to obtain the real dimensions of the transects in thefinal mosaics. In addition, the CFR index (Juanes et al., 2008) wasvisually applied in situ by skilled divers over the whole area ofeach transect, according to the last version accepted in theEuropean Intercalibration process for the Water Framework Direc-tive implementation (Guinda et al., 2014; JRC, 2011).
2.3. Mosaic construction
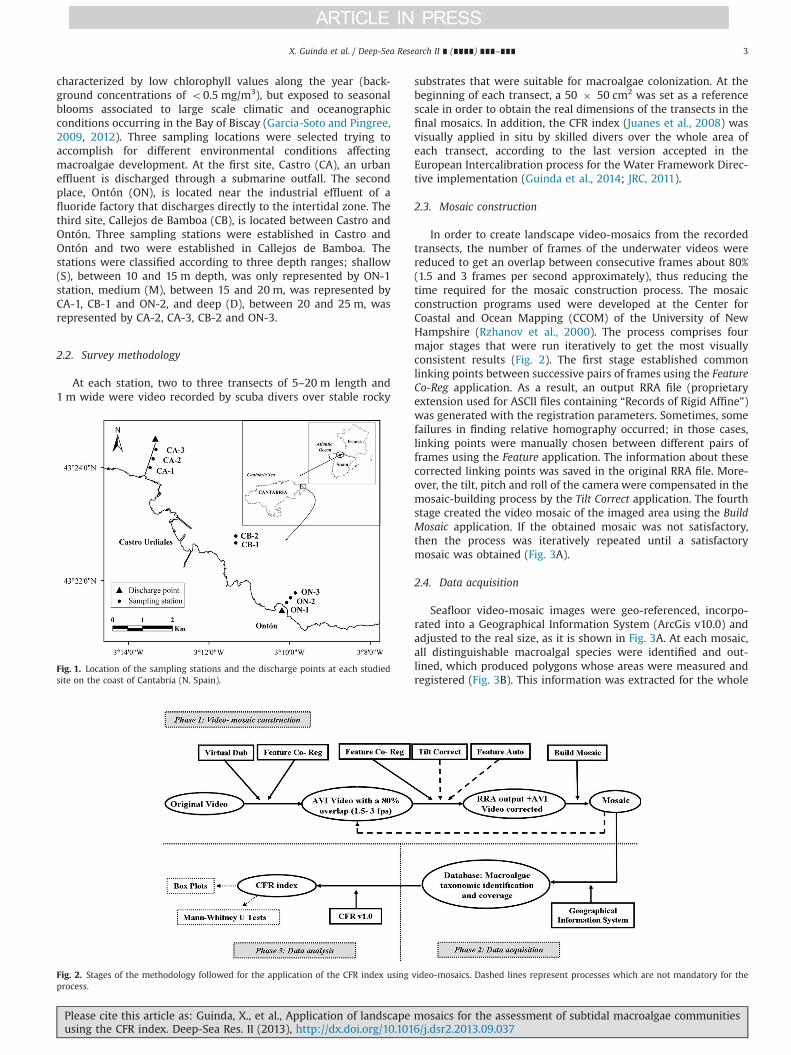
In order to create landscape video-mosaics from the recordedtransects, the number of frames of the underwater videos werereduced to get an overlap between consecutive frames about 80%(1.5 and 3 frames per second approximately), thus reducing thetime required for the mosaic construction process. The mosaicconstruction programs used were developed at the Center forCoastal and Ocean Mapping (CCOM) of the University of NewHampshire (Rzhanov et al., 2000). The process comprises fourmajor stages that were run iteratively to get the most visuallyconsistent results (Fig. 2). The first stage established commonlinking points between successive pairs of frames using the FeatureCo-Reg application. As a result, an output RRA file (proprietaryextension used for ASCII files containing “Records of Rigid Affine”)was generated with the registration parameters. Sometimes, somefailures in finding relative homography occurred; in those cases,linking points were manually chosen between different pairs offrames using the Feature application. The information about thesecorrected linking points was saved in the original RRA file. More-over, the tilt, pitch and roll of the camera were compensated in themosaic-building process by the Tilt Correct application. The fourthstage created the video mosaic of the imaged area using the BuildMosaic application. If the obtained mosaic was not satisfactory,then the process was iteratively repeated until a satisfactorymosaic was obtained (Fig. 3A).
2.4. Data acquisition
Seafloor video-mosaic images were geo-referenced, incorpo-rated into a Geographical Information System (ArcGis v10.0) andadjusted to the real size, as it is shown in Fig. 3A. At each mosaic,all distinguishable macroalgal species were identified and out-lined, which produced polygons whose areas were measured andregistered (Fig. 3B). This information was extracted for the whole
Fig. 1. Location of the sampling stations and the discharge points at each studiedsite on the coast of Cantabria (N. Spain).
Fig. 2. Stages of the methodology followed for the application of the CFR index using video-mosaics. Dashed lines represent processes which are not mandatory for theprocess.
X. Guinda et al. / Deep-Sea Research II ∎ (∎∎∎∎) ∎∎∎–∎∎∎ 3
Please cite this article as: Guinda, X., et al., Application of landscape mosaics for the assessment of subtidal macroalgae communitiesusing the CFR index. Deep-Sea Res. II (2013), http://dx.doi.org/10.1016/j.dsr2.2013.09.037i
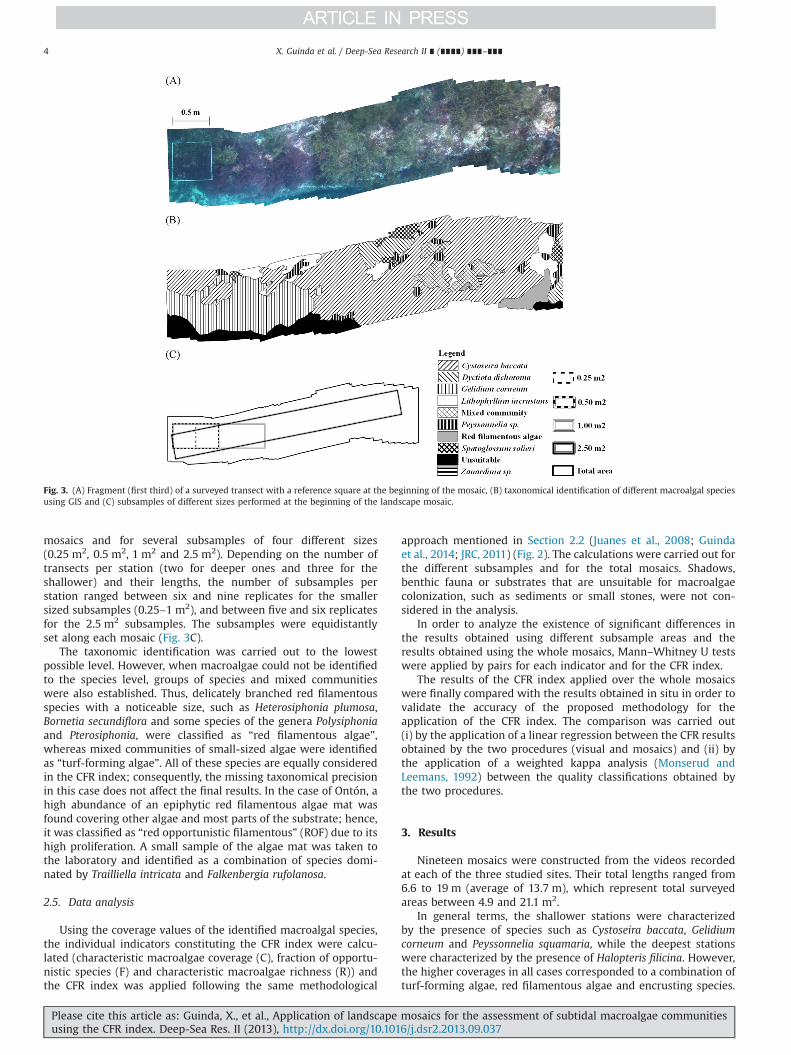
mosaics and for several subsamples of four different sizes(0.25 m2, 0.5 m2, 1 m2 and 2.5 m2). Depending on the number oftransects per station (two for deeper ones and three for theshallower) and their lengths, the number of subsamples perstation ranged between six and nine replicates for the smallersized subsamples (0.25–1 m2), and between five and six replicatesfor the 2.5 m2 subsamples. The subsamples were equidistantlyset along each mosaic (Fig. 3C).
The taxonomic identification was carried out to the lowestpossible level. However, when macroalgae could not be identifiedto the species level, groups of species and mixed communitieswere also established. Thus, delicately branched red filamentousspecies with a noticeable size, such as Heterosiphonia plumosa,Bornetia secundiflora and some species of the genera Polysiphoniaand Pterosiphonia, were classified as “red filamentous algae”,whereas mixed communities of small-sized algae were identifiedas “turf-forming algae”. All of these species are equally consideredin the CFR index; consequently, the missing taxonomical precisionin this case does not affect the final results. In the case of Ontón, ahigh abundance of an epiphytic red filamentous algae mat wasfound covering other algae and most parts of the substrate; hence,it was classified as “red opportunistic filamentous” (ROF) due to itshigh proliferation. A small sample of the algae mat was taken tothe laboratory and identified as a combination of species domi-nated by Trailliella intricata and Falkenbergia rufolanosa.
2.5. Data analysis
Using the coverage values of the identified macroalgal species,the individual indicators constituting the CFR index were calcu-lated (characteristic macroalgae coverage (C), fraction of opportu-nistic species (F) and characteristic macroalgae richness (R)) andthe CFR index was applied following the same methodological
approach mentioned in Section 2.2 (Juanes et al., 2008; Guindaet al., 2014; JRC, 2011) (Fig. 2). The calculations were carried out forthe different subsamples and for the total mosaics. Shadows,benthic fauna or substrates that are unsuitable for macroalgaecolonization, such as sediments or small stones, were not con-sidered in the analysis.
In order to analyze the existence of significant differences inthe results obtained using different subsample areas and theresults obtained using the whole mosaics, Mann–Whitney U testswere applied by pairs for each indicator and for the CFR index.
The results of the CFR index applied over the whole mosaicswere finally compared with the results obtained in situ in order tovalidate the accuracy of the proposed methodology for theapplication of the CFR index. The comparison was carried out(i) by the application of a linear regression between the CFR resultsobtained by the two procedures (visual and mosaics) and (ii) bythe application of a weighted kappa analysis (Monserud andLeemans, 1992) between the quality classifications obtained bythe two procedures.
3. Results
Nineteen mosaics were constructed from the videos recordedat each of the three studied sites. Their total lengths ranged from6.6 to 19 m (average of 13.7 m), which represent total surveyedareas between 4.9 and 21.1 m2.
In general terms, the shallower stations were characterizedby the presence of species such as Cystoseira baccata, Gelidiumcorneum and Peyssonnelia squamaria, while the deepest stationswere characterized by the presence of Halopteris filicina. However,the higher coverages in all cases corresponded to a combination ofturf-forming algae, red filamentous algae and encrusting species.
Fig. 3. (A) Fragment (first third) of a surveyed transect with a reference square at the beginning of the mosaic, (B) taxonomical identification of different macroalgal speciesusing GIS and (C) subsamples of different sizes performed at the beginning of the landscape mosaic.
X. Guinda et al. / Deep-Sea Research II ∎ (∎∎∎∎) ∎∎∎–∎∎∎4
Please cite this article as: Guinda, X., et al., Application of landscape mosaics for the assessment of subtidal macroalgae communitiesusing the CFR index. Deep-Sea Res. II (2013), http://dx.doi.org/10.1016/j.dsr2.2013.09.037i
In the case of Ontón, high coverages of T. intricata and F. rufolanosa(ROF) were also detected. According to the information summar-ized in Table 1, Cystoseira baccata was the dominant characteristicmacroalgae in the medium-depth stations of Castro (CA-1) andCallejos de Bamboa (CB-1), reaching an average coverage of 74.1%in Castro. The deepest stations of Castro (CA-2, CA-3) and Callejosde Bamboa (CB-2) had H. filicina as the dominant characteristic
macroalgal species, with coverages that reached 32.3% in Castro.At the deepest station of Ontón (ON-3) only low coverages ofH. filicina were detected. Calliblepharis ciliata appeared only atmid-depth in Ontón (ON-2), with a coverage of 8%, and bothCodium tomentosum and G. corneum were found only at shallowand medium-depth stations with sparse coverage values (o5.6%).In addition, a low coverage of Corallina sp. was identified in the
Table 1Average macroalgae coverage per station corresponding to total transect surfaces and related standard deviation (R: Red, B: Brown, G: Green species).
Species/Station Average macroalgae coverage per station (%)
CA-1 CA-2 CA-3 CB-1 CB-2 ON-1 ON-2 ON-3
Characteristic macroalgae:Calliblepharis ciliata (R) 8.0277.02Codium tomentosum (G) 0.2370.32 0.1770.2 0.2870.36Corallina sp. (R) 0.0470.07Cystoseira baccata (B) 74.1716.4 0.0770.1 15.4717.9Dictyopteris membranacea (B) 0.1670.22Dictyota dichotoma (B) 7.4177.14 3.0570.73 7.9570.53 12.973.2Gelidium corneum (R) 0.2970.4 5.5971.88 1.2272.03Halopteris filicina (B) 24.5714.1 32.3379.6 0.3170.41 9.8877.03 1.9070.22Halydris siliquosa (B) 10.776.4 0.9271.3Laminaria ochroleuca (B) 0.0170.01Peyssonnelia squamaria (R) 0.0570.07 5.9771.39 0.1770.24 1.4870.44 0.4670.33Spatoglossum solieri (B) 1.5670.44 0.0470.01 2.34711.6 4.973.23 0.0270.03
Other macroalgae:Red filamentous algae (R) 4.9672.84 10.2875.9 29.4715.2 1.270.49 17.371.1 0.57 .048 2.8471.19Lithophyllum incrustans (R) 2.0972.57 3.8874.38 5.1273.75 13.374.01 5.9873.98 1.5570.5 1.9270.87Mesophyllum lichenoides (R) 1.0571.48 26.2713.6Encrusting Peyssonnelia (R) 0.2870.39 0.7770.8Turf-forming algae (Mixed) 2.9074.1 27.7071.1 26.2775.7 44.8719.4 22.972.88 32.5177.9 44.673.55 46.5670.1Zanardinia sp. (B) 2.3870.9 2.0170.47 5.8072.97
Opportunistic speciesRed opportunistic filamentous (R) 32.5177.9 44.4673.4 46.5670.1
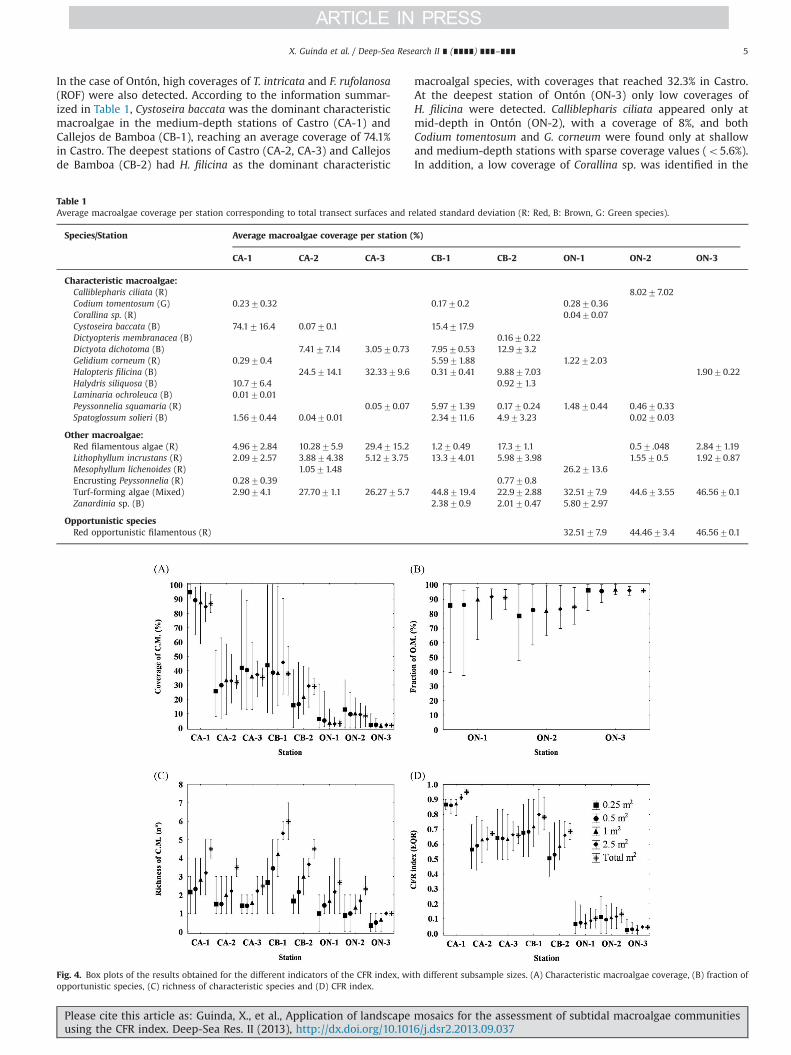
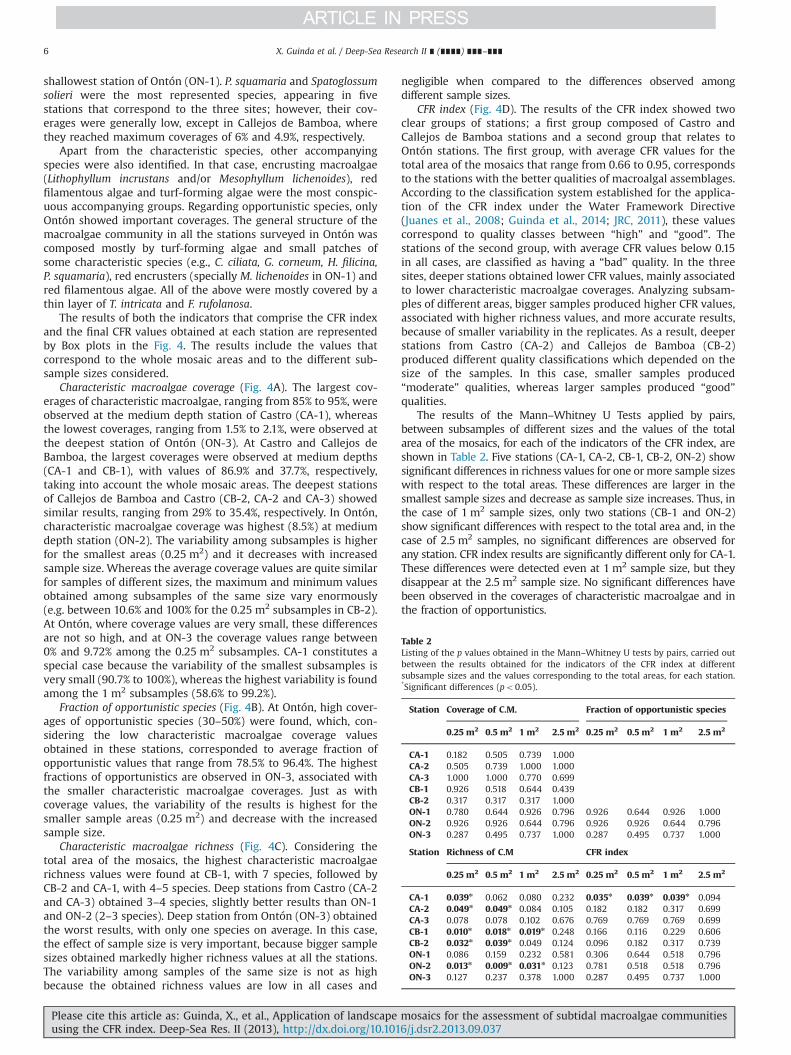
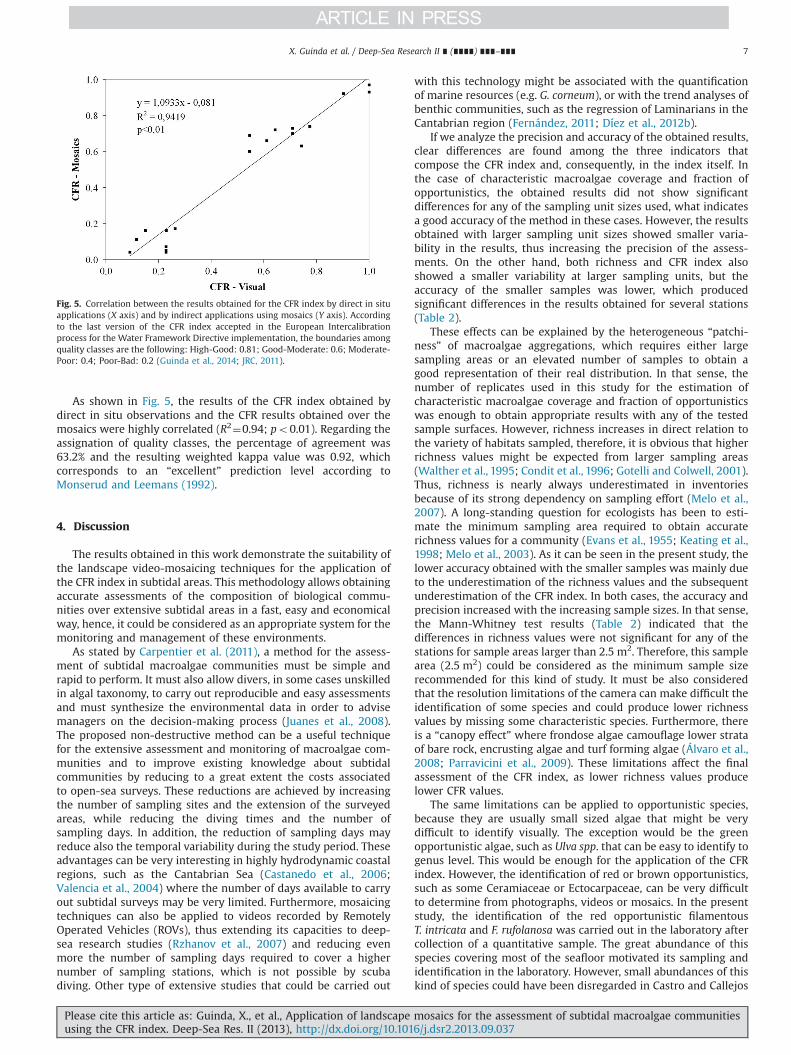
Fig. 4. Box plots of the results obtained for the different indicators of the CFR index, with different subsample sizes. (A) Characteristic macroalgae coverage, (B) fraction ofopportunistic species, (C) richness of characteristic species and (D) CFR index.
X. Guinda et al. / Deep-Sea Research II ∎ (∎∎∎∎) ∎∎∎–∎∎∎ 5
Please cite this article as: Guinda, X., et al., Application of landscape mosaics for the assessment of subtidal macroalgae communitiesusing the CFR index. Deep-Sea Res. II (2013), http://dx.doi.org/10.1016/j.dsr2.2013.09.037i
shallowest station of Ontón (ON-1). P. squamaria and Spatoglossumsolieri were the most represented species, appearing in fivestations that correspond to the three sites; however, their cov-erages were generally low, except in Callejos de Bamboa, wherethey reached maximum coverages of 6% and 4.9%, respectively.
Apart from the characteristic species, other accompanyingspecies were also identified. In that case, encrusting macroalgae(Lithophyllum incrustans and/or Mesophyllum lichenoides), redfilamentous algae and turf-forming algae were the most conspic-uous accompanying groups. Regarding opportunistic species, onlyOntón showed important coverages. The general structure of themacroalgae community in all the stations surveyed in Ontón wascomposed mostly by turf-forming algae and small patches ofsome characteristic species (e.g., C. ciliata, G. corneum, H. filicina,P. squamaria), red encrusters (specially M. lichenoides in ON-1) andred filamentous algae. All of the above were mostly covered by athin layer of T. intricata and F. rufolanosa.
The results of both the indicators that comprise the CFR indexand the final CFR values obtained at each station are representedby Box plots in the Fig. 4. The results include the values thatcorrespond to the whole mosaic areas and to the different sub-sample sizes considered.
Characteristic macroalgae coverage (Fig. 4A). The largest cov-erages of characteristic macroalgae, ranging from 85% to 95%, wereobserved at the medium depth station of Castro (CA-1), whereasthe lowest coverages, ranging from 1.5% to 2.1%, were observed atthe deepest station of Ontón (ON-3). At Castro and Callejos deBamboa, the largest coverages were observed at medium depths(CA-1 and CB-1), with values of 86.9% and 37.7%, respectively,taking into account the whole mosaic areas. The deepest stationsof Callejos de Bamboa and Castro (CB-2, CA-2 and CA-3) showedsimilar results, ranging from 29% to 35.4%, respectively. In Ontón,characteristic macroalgae coverage was highest (8.5%) at mediumdepth station (ON-2). The variability among subsamples is higherfor the smallest areas (0.25 m2) and it decreases with increasedsample size. Whereas the average coverage values are quite similarfor samples of different sizes, the maximum and minimum valuesobtained among subsamples of the same size vary enormously(e.g. between 10.6% and 100% for the 0.25 m2 subsamples in CB-2).At Ontón, where coverage values are very small, these differencesare not so high, and at ON-3 the coverage values range between0% and 9.72% among the 0.25 m2 subsamples. CA-1 constitutes aspecial case because the variability of the smallest subsamples isvery small (90.7% to 100%), whereas the highest variability is foundamong the 1 m2 subsamples (58.6% to 99.2%).
Fraction of opportunistic species (Fig. 4B). At Ontón, high cover-ages of opportunistic species (30–50%) were found, which, con-sidering the low characteristic macroalgae coverage valuesobtained in these stations, corresponded to average fraction ofopportunistic values that range from 78.5% to 96.4%. The highestfractions of opportunistics are observed in ON-3, associated withthe smaller characteristic macroalgae coverages. Just as withcoverage values, the variability of the results is highest for thesmaller sample areas (0.25 m2) and decrease with the increasedsample size.
Characteristic macroalgae richness (Fig. 4C). Considering thetotal area of the mosaics, the highest characteristic macroalgaerichness values were found at CB-1, with 7 species, followed byCB-2 and CA-1, with 4–5 species. Deep stations from Castro (CA-2and CA-3) obtained 3–4 species, slightly better results than ON-1and ON-2 (2–3 species). Deep station from Ontón (ON-3) obtainedthe worst results, with only one species on average. In this case,the effect of sample size is very important, because bigger samplesizes obtained markedly higher richness values at all the stations.The variability among samples of the same size is not as highbecause the obtained richness values are low in all cases and
negligible when compared to the differences observed amongdifferent sample sizes.
CFR index (Fig. 4D). The results of the CFR index showed twoclear groups of stations; a first group composed of Castro andCallejos de Bamboa stations and a second group that relates toOntón stations. The first group, with average CFR values for thetotal area of the mosaics that range from 0.66 to 0.95, correspondsto the stations with the better qualities of macroalgal assemblages.According to the classification system established for the applica-tion of the CFR index under the Water Framework Directive(Juanes et al., 2008; Guinda et al., 2014; JRC, 2011), these valuescorrespond to quality classes between “high” and “good”. Thestations of the second group, with average CFR values below 0.15in all cases, are classified as having a “bad” quality. In the threesites, deeper stations obtained lower CFR values, mainly associatedto lower characteristic macroalgae coverages. Analyzing subsam-ples of different areas, bigger samples produced higher CFR values,associated with higher richness values, and more accurate results,because of smaller variability in the replicates. As a result, deeperstations from Castro (CA-2) and Callejos de Bamboa (CB-2)produced different quality classifications which depended on thesize of the samples. In this case, smaller samples produced“moderate” qualities, whereas larger samples produced “good”qualities.
The results of the Mann–Whitney U Tests applied by pairs,between subsamples of different sizes and the values of the totalarea of the mosaics, for each of the indicators of the CFR index, areshown in Table 2. Five stations (CA-1, CA-2, CB-1, CB-2, ON-2) showsignificant differences in richness values for one or more sample sizeswith respect to the total areas. These differences are larger in thesmallest sample sizes and decrease as sample size increases. Thus, inthe case of 1 m2 sample sizes, only two stations (CB-1 and ON-2)show significant differences with respect to the total area and, in thecase of 2.5 m2 samples, no significant differences are observed forany station. CFR index results are significantly different only for CA-1.These differences were detected even at 1 m2 sample size, but theydisappear at the 2.5 m2 sample size. No significant differences havebeen observed in the coverages of characteristic macroalgae and inthe fraction of opportunistics.
Table 2Listing of the p values obtained in the Mann–Whitney U tests by pairs, carried outbetween the results obtained for the indicators of the CFR index at differentsubsample sizes and the values corresponding to the total areas, for each station.*Significant differences (po0.05).
Station Coverage of C.M. Fraction of opportunistic species
0.25 m2 0.5 m2 1 m2 2.5 m2 0.25 m2 0.5 m2 1 m2 2.5 m2
CA-1 0.182 0.505 0.739 1.000CA-2 0.505 0.739 1.000 1.000CA-3 1.000 1.000 0.770 0.699CB-1 0.926 0.518 0.644 0.439CB-2 0.317 0.317 0.317 1.000ON-1 0.780 0.644 0.926 0.796 0.926 0.644 0.926 1.000ON-2 0.926 0.926 0.644 0.796 0.926 0.926 0.644 0.796ON-3 0.287 0.495 0.737 1.000 0.287 0.495 0.737 1.000
Station Richness of C.M CFR index
0.25 m2 0.5 m2 1 m2 2.5 m2 0.25 m2 0.5 m2 1 m2 2.5 m2
CA-1 0.039n 0.062 0.080 0.232 0.035n 0.039n 0.039n 0.094CA-2 0.049n 0.049n 0.084 0.105 0.182 0.182 0.317 0.699CA-3 0.078 0.078 0.102 0.676 0.769 0.769 0.769 0.699CB-1 0.010n 0.018n 0.019n 0.248 0.166 0.116 0.229 0.606CB-2 0.032n 0.039n 0.049 0.124 0.096 0.182 0.317 0.739ON-1 0.086 0.159 0.232 0.581 0.306 0.644 0.518 0.796ON-2 0.013n 0.009n 0.031n 0.123 0.781 0.518 0.518 0.796ON-3 0.127 0.237 0.378 1.000 0.287 0.495 0.737 1.000
X. Guinda et al. / Deep-Sea Research II ∎ (∎∎∎∎) ∎∎∎–∎∎∎6
Please cite this article as: Guinda, X., et al., Application of landscape mosaics for the assessment of subtidal macroalgae communitiesusing the CFR index. Deep-Sea Res. II (2013), http://dx.doi.org/10.1016/j.dsr2.2013.09.037i
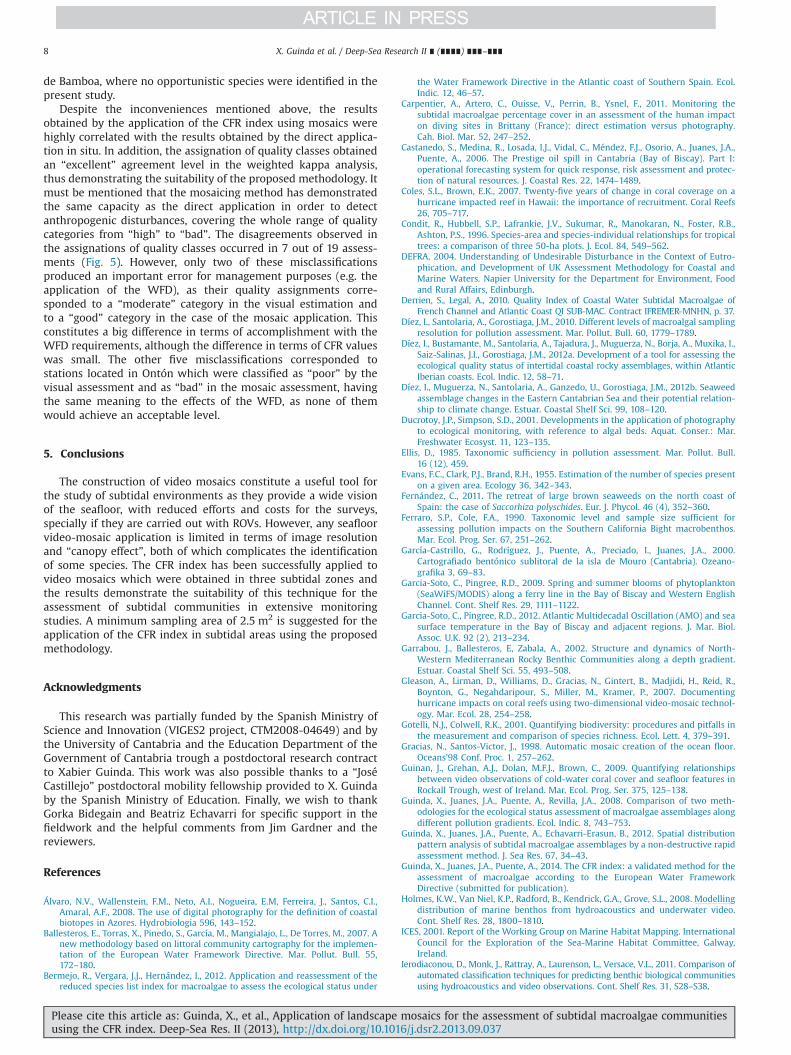
As shown in Fig. 5, the results of the CFR index obtained bydirect in situ observations and the CFR results obtained over themosaics were highly correlated (R2¼0.94; po0.01). Regarding theassignation of quality classes, the percentage of agreement was63.2% and the resulting weighted kappa value was 0.92, whichcorresponds to an “excellent” prediction level according toMonserud and Leemans (1992).
4. Discussion
The results obtained in this work demonstrate the suitability ofthe landscape video-mosaicing techniques for the application ofthe CFR index in subtidal areas. This methodology allows obtainingaccurate assessments of the composition of biological commu-nities over extensive subtidal areas in a fast, easy and economicalway, hence, it could be considered as an appropriate system for themonitoring and management of these environments.
As stated by Carpentier et al. (2011), a method for the assess-ment of subtidal macroalgae communities must be simple andrapid to perform. It must also allow divers, in some cases unskilledin algal taxonomy, to carry out reproducible and easy assessmentsand must synthesize the environmental data in order to advisemanagers on the decision-making process (Juanes et al., 2008).The proposed non-destructive method can be a useful techniquefor the extensive assessment and monitoring of macroalgae com-munities and to improve existing knowledge about subtidalcommunities by reducing to a great extent the costs associatedto open-sea surveys. These reductions are achieved by increasingthe number of sampling sites and the extension of the surveyedareas, while reducing the diving times and the number ofsampling days. In addition, the reduction of sampling days mayreduce also the temporal variability during the study period. Theseadvantages can be very interesting in highly hydrodynamic coastalregions, such as the Cantabrian Sea (Castanedo et al., 2006;Valencia et al., 2004) where the number of days available to carryout subtidal surveys may be very limited. Furthermore, mosaicingtechniques can also be applied to videos recorded by RemotelyOperated Vehicles (ROVs), thus extending its capacities to deep-sea research studies (Rzhanov et al., 2007) and reducing evenmore the number of sampling days required to cover a highernumber of sampling stations, which is not possible by scubadiving. Other type of extensive studies that could be carried out
with this technology might be associated with the quantificationof marine resources (e.g. G. corneum), or with the trend analyses ofbenthic communities, such as the regression of Laminarians in theCantabrian region (Fernández, 2011; Díez et al., 2012b).
If we analyze the precision and accuracy of the obtained results,clear differences are found among the three indicators thatcompose the CFR index and, consequently, in the index itself. Inthe case of characteristic macroalgae coverage and fraction ofopportunistics, the obtained results did not show significantdifferences for any of the sampling unit sizes used, what indicatesa good accuracy of the method in these cases. However, the resultsobtained with larger sampling unit sizes showed smaller varia-bility in the results, thus increasing the precision of the assess-ments. On the other hand, both richness and CFR index alsoshowed a smaller variability at larger sampling units, but theaccuracy of the smaller samples was lower, which producedsignificant differences in the results obtained for several stations(Table 2).
These effects can be explained by the heterogeneous “patchi-ness” of macroalgae aggregations, which requires either largesampling areas or an elevated number of samples to obtain agood representation of their real distribution. In that sense, thenumber of replicates used in this study for the estimation ofcharacteristic macroalgae coverage and fraction of opportunisticswas enough to obtain appropriate results with any of the testedsample surfaces. However, richness increases in direct relation tothe variety of habitats sampled, therefore, it is obvious that higherrichness values might be expected from larger sampling areas(Walther et al., 1995; Condit et al., 1996; Gotelli and Colwell, 2001).Thus, richness is nearly always underestimated in inventoriesbecause of its strong dependency on sampling effort (Melo et al.,2007). A long-standing question for ecologists has been to esti-mate the minimum sampling area required to obtain accuraterichness values for a community (Evans et al., 1955; Keating et al.,1998; Melo et al., 2003). As it can be seen in the present study, thelower accuracy obtained with the smaller samples was mainly dueto the underestimation of the richness values and the subsequentunderestimation of the CFR index. In both cases, the accuracy andprecision increased with the increasing sample sizes. In that sense,the Mann-Whitney test results (Table 2) indicated that thedifferences in richness values were not significant for any of thestations for sample areas larger than 2.5 m2. Therefore, this samplearea (2.5 m2) could be considered as the minimum sample sizerecommended for this kind of study. It must be also consideredthat the resolution limitations of the camera can make difficult theidentification of some species and could produce lower richnessvalues by missing some characteristic species. Furthermore, thereis a “canopy effect” where frondose algae camouflage lower strataof bare rock, encrusting algae and turf forming algae (Álvaro et al.,2008; Parravicini et al., 2009). These limitations affect the finalassessment of the CFR index, as lower richness values producelower CFR values.
The same limitations can be applied to opportunistic species,because they are usually small sized algae that might be verydifficult to identify visually. The exception would be the greenopportunistic algae, such as Ulva spp. that can be easy to identify togenus level. This would be enough for the application of the CFRindex. However, the identification of red or brown opportunistics,such as some Ceramiaceae or Ectocarpaceae, can be very difficultto determine from photographs, videos or mosaics. In the presentstudy, the identification of the red opportunistic filamentousT. intricata and F. rufolanosa was carried out in the laboratory aftercollection of a quantitative sample. The great abundance of thisspecies covering most of the seafloor motivated its sampling andidentification in the laboratory. However, small abundances of thiskind of species could have been disregarded in Castro and Callejos
Fig. 5. Correlation between the results obtained for the CFR index by direct in situapplications (X axis) and by indirect applications using mosaics (Y axis). Accordingto the last version of the CFR index accepted in the European Intercalibrationprocess for the Water Framework Directive implementation, the boundaries amongquality classes are the following: High-Good: 0.81; Good-Moderate: 0.6; Moderate-Poor: 0.4; Poor-Bad: 0.2 (Guinda et al., 2014; JRC, 2011).
X. Guinda et al. / Deep-Sea Research II ∎ (∎∎∎∎) ∎∎∎–∎∎∎ 7
Please cite this article as: Guinda, X., et al., Application of landscape mosaics for the assessment of subtidal macroalgae communitiesusing the CFR index. Deep-Sea Res. II (2013), http://dx.doi.org/10.1016/j.dsr2.2013.09.037i
de Bamboa, where no opportunistic species were identified in thepresent study.
Despite the inconveniences mentioned above, the resultsobtained by the application of the CFR index using mosaics werehighly correlated with the results obtained by the direct applica-tion in situ. In addition, the assignation of quality classes obtainedan “excellent” agreement level in the weighted kappa analysis,thus demonstrating the suitability of the proposed methodology. Itmust be mentioned that the mosaicing method has demonstratedthe same capacity as the direct application in order to detectanthropogenic disturbances, covering the whole range of qualitycategories from “high” to “bad”. The disagreements observed inthe assignations of quality classes occurred in 7 out of 19 assess-ments (Fig. 5). However, only two of these misclassificationsproduced an important error for management purposes (e.g. theapplication of the WFD), as their quality assignments corre-sponded to a “moderate” category in the visual estimation andto a “good” category in the case of the mosaic application. Thisconstitutes a big difference in terms of accomplishment with theWFD requirements, although the difference in terms of CFR valueswas small. The other five misclassifications corresponded tostations located in Ontón which were classified as “poor” by thevisual assessment and as “bad” in the mosaic assessment, havingthe same meaning to the effects of the WFD, as none of themwould achieve an acceptable level.
5. Conclusions
The construction of video mosaics constitute a useful tool forthe study of subtidal environments as they provide a wide visionof the seafloor, with reduced efforts and costs for the surveys,specially if they are carried out with ROVs. However, any seafloorvideo-mosaic application is limited in terms of image resolutionand “canopy effect”, both of which complicates the identificationof some species. The CFR index has been successfully applied tovideo mosaics which were obtained in three subtidal zones andthe results demonstrate the suitability of this technique for theassessment of subtidal communities in extensive monitoringstudies. A minimum sampling area of 2.5 m2 is suggested for theapplication of the CFR index in subtidal areas using the proposedmethodology.
Acknowledgments
This research was partially funded by the Spanish Ministry ofScience and Innovation (VIGES2 project, CTM2008-04649) and bythe University of Cantabria and the Education Department of theGovernment of Cantabria trough a postdoctoral research contractto Xabier Guinda. This work was also possible thanks to a “JoséCastillejo” postdoctoral mobility fellowship provided to X. Guindaby the Spanish Ministry of Education. Finally, we wish to thankGorka Bidegain and Beatriz Echavarri for specific support in thefieldwork and the helpful comments from Jim Gardner and thereviewers.
References
Álvaro, N.V., Wallenstein, F.M., Neto, A.I., Nogueira, E.M, Ferreira, J., Santos, C.I.,Amaral, A.F., 2008. The use of digital photography for the definition of coastalbiotopes in Azores. Hydrobiologia 596, 143–152.
Ballesteros, E., Torras, X., Pinedo, S., García, M., Mangialajo, L., De Torres, M., 2007. Anew methodology based on littoral community cartography for the implemen-tation of the European Water Framework Directive. Mar. Pollut. Bull. 55,172–180.
Bermejo, R., Vergara, J.J., Hernández, I., 2012. Application and reassessment of thereduced species list index for macroalgae to assess the ecological status under
the Water Framework Directive in the Atlantic coast of Southern Spain. Ecol.Indic. 12, 46–57.
Carpentier, A., Artero, C., Ouisse, V., Perrin, B., Ysnel, F., 2011. Monitoring thesubtidal macroalgae percentage cover in an assessment of the human impacton diving sites in Brittany (France): direct estimation versus photography.Cah. Biol. Mar. 52, 247–252.
Castanedo, S., Medina, R., Losada, I.J., Vidal, C., Méndez, F.J., Osorio, A., Juanes, J.A.,Puente, A., 2006. The Prestige oil spill in Cantabria (Bay of Biscay). Part I:operational forecasting system for quick response, risk assessment and protec-tion of natural resources. J. Coastal Res. 22, 1474–1489.
Coles, S.L., Brown, E.K., 2007. Twenty-five years of change in coral coverage on ahurricane impacted reef in Hawaii: the importance of recruitment. Coral Reefs26, 705–717.
Condit, R., Hubbell, S.P., Lafrankie, J.V., Sukumar, R., Manokaran, N., Foster, R.B.,Ashton, P.S., 1996. Species-area and species-individual relationships for tropicaltrees: a comparison of three 50-ha plots. J. Ecol. 84, 549–562.
DEFRA, 2004. Understanding of Undesirable Disturbance in the Context of Eutro-phication, and Development of UK Assessment Methodology for Coastal andMarine Waters. Napier University for the Department for Environment, Foodand Rural Affairs, Edinburgh.
Derrien, S., Legal, A., 2010. Quality Index of Coastal Water Subtidal Macroalgae ofFrench Channel and Atlantic Coast QI SUB-MAC. Contract IFREMER-MNHN, p. 37.
Díez, I., Santolaria, A., Gorostiaga, J.M., 2010. Different levels of macroalgal samplingresolution for pollution assessment. Mar. Pollut. Bull. 60, 1779–1789.
Díez, I., Bustamante, M., Santolaria, A., Tajadura, J., Muguerza, N., Borja, A., Muxika, I.,Saiz-Salinas, J.I., Gorostiaga, J.M., 2012a. Development of a tool for assessing theecological quality status of intertidal coastal rocky assemblages, within AtlanticIberian coasts. Ecol. Indic. 12, 58–71.
Díez, I., Muguerza, N., Santolaria, A., Ganzedo, U., Gorostiaga, J.M., 2012b. Seaweedassemblage changes in the Eastern Cantabrian Sea and their potential relation-ship to climate change. Estuar. Coastal Shelf Sci. 99, 108–120.
Ducrotoy, J.P., Simpson, S.D., 2001. Developments in the application of photographyto ecological monitoring, with reference to algal beds. Aquat. Conser.: Mar.Freshwater Ecosyst. 11, 123–135.
Ellis, D., 1985. Taxonomic sufficiency in pollution assessment. Mar. Pollut. Bull.16 (12), 459.
Evans, F.C., Clark, P.J., Brand, R.H., 1955. Estimation of the number of species presenton a given area. Ecology 36, 342–343.
Fernández, C., 2011. The retreat of large brown seaweeds on the north coast ofSpain: the case of Saccorhiza polyschides. Eur. J. Phycol. 46 (4), 352–360.
Ferraro, S.P., Cole, F.A., 1990. Taxonomic level and sample size sufficient forassessing pollution impacts on the Southern California Bight macrobenthos.Mar. Ecol. Prog. Ser. 67, 251–262.
García-Castrillo, G., Rodríguez, J., Puente, A., Preciado, I., Juanes, J.A., 2000.Cartografiado bentónico sublitoral de la isla de Mouro (Cantabria). Ozeano-grafika 3, 69–83.
Garcia-Soto, C., Pingree, R.D., 2009. Spring and summer blooms of phytoplankton(SeaWiFS/MODIS) along a ferry line in the Bay of Biscay and Western EnglishChannel. Cont. Shelf Res. 29, 1111–1122.
Garcia-Soto, C., Pingree, R.D., 2012. Atlantic Multidecadal Oscillation (AMO) and seasurface temperature in the Bay of Biscay and adjacent regions. J. Mar. Biol.Assoc. U.K. 92 (2), 213–234.
Garrabou, J., Ballesteros, E, Zabala, A., 2002. Structure and dynamics of North-Western Mediterranean Rocky Benthic Communities along a depth gradient.Estuar. Coastal Shelf Sci. 55, 493–508.
Gleason, A., Lirman, D., Williams, D., Gracias, N., Gintert, B., Madjidi, H., Reid, R.,Boynton, G., Negahdaripour, S., Miller, M., Kramer, P., 2007. Documentinghurricane impacts on coral reefs using two-dimensional video-mosaic technol-ogy. Mar. Ecol. 28, 254–258.
Gotelli, N.J., Colwell, R.K., 2001. Quantifying biodiversity: procedures and pitfalls inthe measurement and comparison of species richness. Ecol. Lett. 4, 379–391.
Gracias, N., Santos-Victor, J., 1998. Automatic mosaic creation of the ocean floor.Oceans'98 Conf. Proc. 1, 257–262.
Guinan, J., Grehan, A.J., Dolan, M.F.J., Brown, C., 2009. Quantifying relationshipsbetween video observations of cold-water coral cover and seafloor features inRockall Trough, west of Ireland. Mar. Ecol. Prog. Ser. 375, 125–138.
Guinda, X., Juanes, J.A., Puente, A., Revilla, J.A., 2008. Comparison of two meth-odologies for the ecological status assessment of macroalgae assemblages alongdifferent pollution gradients. Ecol. Indic. 8, 743–753.
Guinda, X., Juanes, J.A., Puente, A., Echavarri-Erasun, B., 2012. Spatial distributionpattern analysis of subtidal macroalgae assemblages by a non-destructive rapidassessment method. J. Sea Res. 67, 34–43.
Guinda, X., Juanes, J.A., Puente, A., 2014. The CFR index: a validated method for theassessment of macroalgae according to the European Water FrameworkDirective (submitted for publication).
Holmes, K.W., Van Niel, K.P., Radford, B., Kendrick, G.A., Grove, S.L., 2008. Modellingdistribution of marine benthos from hydroacoustics and underwater video.Cont. Shelf Res. 28, 1800–1810.
ICES, 2001. Report of the Working Group on Marine Habitat Mapping. InternationalCouncil for the Exploration of the Sea-Marine Habitat Committee, Galway,Ireland.
Ierodiaconou, D., Monk, J., Rattray, A., Laurenson, L., Versace, V.L., 2011. Comparison ofautomated classification techniques for predicting benthic biological communitiesusing hydroacoustics and video observations. Cont. Shelf Res. 31, S28–S38.
X. Guinda et al. / Deep-Sea Research II ∎ (∎∎∎∎) ∎∎∎–∎∎∎8
Please cite this article as: Guinda, X., et al., Application of landscape mosaics for the assessment of subtidal macroalgae communitiesusing the CFR index. Deep-Sea Res. II (2013), http://dx.doi.org/10.1016/j.dsr2.2013.09.037i
Jerosch, K., Schluter, M., Pesch, R., 2006. Spatial analysis of marine categoricalinformation using indicator kriging applied to georeferenced video mosaics ofthe Deep-Sea Hakon Mosby Mud Volcano. Ecol. Inf. 1 (4), 391–406.
J.R.C., 2011. WFD Intercalibration Phase 2: Milestone 6 Report. Coastal Water/NEA-GIG/Macroalgae and Angiosperms. Joint Research Centre, EuropeanCommission.
Juanes, J.A., Guinda, X., Puente, A., Revilla, J.A., 2008. Macroalgae, a suitableindicator of the ecological status of coastal rocky communities in the NEAtlantic. Ecol. Indic. 8, 351–359.
Kaiser, M.J., 2003. Detecting the effects of fishing on seabed community diversity:importance of scale and sample size. Conserv. Biol. 17, 512–520.
Keating, K.A., Quinn, J.F., Ivie, M.A., Ivie, L., 1998. Estimating the effectiveness offurther sampling in species inventories. Ecol.l Appl. 8, 1239–1249.
Kollmann, H., Stachowitsch, M., 2001. Long-term changes in the Benthos of theNorthern Adriatic Sea: a phototransect approach. Mar. Ecol. 22 (1-2), 135–154.
Lirman, D., Gracias, N., Gintert, B., Gleason, A., Reid, R., Negahdaripour, S., Kramer, P.,2007. Development and application of a video-mosaic survey technology todocument the status of coral reef communities. Environ. Monit. Assess. 125,59–73.
Lirman, D., Gracias, N., Gintert, B., Gleason, A.C.R., Deangelo, G., Dick, M., Martinez, E.,Reid, R.P., 2010. Damage and recovery assessment of vessel grounding injuries oncoral reef habitats by use of georeferenced landscape video mosaics. Limnol.Oceanogr.: Methods 8, 88–97.
Lorance, P., Trenkel, V.M., 2006. Variability in natural behaviour, and observedreactions to an ROV, by mid-slope fish species. J. Exp. Mar. Biol. Ecol. 332 (1),106–119.
Ludvigsen, M., Sortland, B., Johnsen, G., Hanumant, S., 2007. Applications of geo-referenced underwater photo mosaics in marine biology and archaeology.Oceanography 20 (4), 140–149.
Marks, R.L., Rock, S.M., Lee, M.J., 1995. Real-time video mosaicing of the ocean floor.IEEE J. Ocean Eng. 20 (3), 229–241.
Melo, A.S., Bini, L.M., Thomaz, S.M., 2007. Assessment of methods to estimateaquatic macrophyte species richness in extrapolated sample sizes. Aquat. Bot.86, 377–384.
Melo, A.S., Pereira, R.A.S., Santos, A.J., Shepherd, G.J., Machado, G., Medeiros, H.F.,Sawaya, R.J., 2003. Comparing species richness among assemblages usingsample units: why not use extrapolation methods to standardize differentsample sizes? Oikos 101, 398–410.
Monserud, R., Leemans, R., 1992. Comparing global vegetation maps with the Kappastatistic. Ecol. Modell. 62, 275–293.
Neto, J.M., Gaspar, R., Pereira, L., Marques, J.C., 2012. Marine Macroalgae AssessmentTool (MarMAT) for intertidal rocky shores. Quality assessment under the scopeof the European Water Framework Directive. Ecol. Indic. 19, 39–47.
Norcross, B.L., Mueter, F.J., 1999. The use of an ROV in the study of juvenile flatfish.Fish. Res. 39 (3), 241–251.
Norris, J.G., Wyllie-Echeverria, S., Mumford, T., Bailey, A., Turner, T., 1997. Estimat-ing basal area coverage of subtidal seagrass beds using underwater videogra-phy. Aquat. Bot. 58, 269–287.
Orfanidis, S., Panayotidis, P., Stamatis, N., 2003. An insight to the ecologicalevaluation index (EEI). Ecol. Indic. 3, 27–33.
Parravicini, V., Micheli, F., Montefalcone, M, Villa, E., Morri, C, Bianchi, C.N., 2010.Rapid assessment of epibenthic communities: a comparison between twovisual sampling techniques. J. Exp. Mar. Biol. Ecol. 395, 21–29.
Parravicini, V., Morri, C, Ciribilli, G., Montefalcone, M., Albertelli, G., Bianchi, C.N.,2009. Size matters more than method: visual quadrats vs photography inmeasuring human impact on Mediterranean rocky reef communities. EstuarineCoastal Shelf Sci. 81, 359–367.
Pinedo, S., García, M., Satta, M.P., de Torres, M., Ballesteros, E., 2007. Rocky-shorecommunities as indicators of water quality: a case study in the NorthwesternMediterranean. Mar. Pollut. Bull. 55, 126–135.
Puente, A., Juanes, J.A., 2008. Testing taxonomic resolution, data transformation andselection of species for monitoring macroalgae communities. Estuarine CoastalShelf Sci. 78, 327–340.
Rooper, C.N., Zimmermann, M., 2007. A bottom-up methodology for integratingunderwater video and acoustic mapping for seafloor substrate classification.Cont. Shelf Res. 27, 947–957.
Rzhanov, Y., Linnett, L.M., Forbes, R., 2000. Underwater video mosaicing for seabedmapping. Proc. ICIP, 2000.
Rzhanov, Y., Mayer, L., Beaulieu, S., Soule, S.A., Shank, T. 2007. The Generation ofGeoreferenced Video Mosaics in Support of Submersible and ROV Operations.CenSeam Standardisation Working Group and Data Analysis Working GroupMeeting. Dartington Hall, Plymouth, UK.
Smale, D.A., 2008. Continuous benthic community change along a depth gradient inAntarctic shallows: evidence of patchiness but not zonation. Polar Biol. 31,189–198.
Somerfield, P.J., Clarke, K.R., 1995. Taxonomic levels in marine community studiesrevisited. Mar. Ecol. Prog. Ser. 127, 113–119.
Søreide, F., Jasinski, M.E., 2005. Ormen Lange: Investigation and excavation of ashipwreck in 170-m depth. In: Proceedings of OCEANS 2005, Washington DC,September 18–23, 2006, vol. III. Marine Technology Society and Institute ofElectrical and Electronics Engineers, pp. 2334–2,338.
Valencia, V., Borja, A., Franco, J., Fontán, A., 2004. Hydrography of the SoutheasternBay of Biscay. In: Borja, A., Collins, M. (Eds.), Oceanography and MarineEnvironment of the Basque Country. Elsevier, pp. 159–194.
Van Rein, H., Schoeman, D.S., Brown, C.J., Quinn, R., Breen, J., 2011. Development ofbenthic monitoring methods using photoquadrats and scuba on heterogeneoushard-substrata: a boulder-slope community case study. Aquat. Conserv.: Mar.Freshwater Ecosyst. 21, 676–689.
Walther, B.A., Cotgreave, P., Price, R.D., Gregory, R.D., Clayton, D.H., 1995. Samplingeffort and parasite species richness. Parasitol. Today 11, 306–310.
Warwick, R.M., 1988a. Analysis of community attributes of the macrobenthos ofFrierfjord/Langesundfjord at taxonomic levels higher than species. Mar. Ecol.Prog. Ser. 46, 167–170.
Warwick, R.M., 1988b. The level of taxonomic discrimination required to detectpollution effects on marine benthic community. Mar. Pollut. Bull. 19, 259–268.
Wells, E., Wilkinson, M., Wood, P., Scanlan, C., 2007. The use of macroalgal speciesrichness and composition on intertidal rocky shores in the assessment ofecological quality under the European Water Framework Directive. Mar. Pollut.Bull. 55, 151–161.
X. Guinda et al. / Deep-Sea Research II ∎ (∎∎∎∎) ∎∎∎–∎∎∎ 9
Please cite this article as: Guinda, X., et al., Application of landscape mosaics for the assessment of subtidal macroalgae communitiesusing the CFR index. Deep-Sea Res. II (2013), http://dx.doi.org/10.1016/j.dsr2.2013.09.037i
Related Documents