Application of High Resolution Melt analysis (HRM) for screening haplotype variation in non-model plants: a case study of Honeybush ( Cyclopia Vent.) Nicholas C Galuszynski Corresp., 1 , Alastair J Potts 1 1 Department of Botany, Nelson Mandela University, Port Elizabeth, Eastern Cape, South Africa Corresponding Author: Nicholas C Galuszynski Email address: [email protected] Aim. This study has three broad aims: a) to develop genus-specific primers for High Resolution Melt analysis (HRM) of members of Cyclopia Vent., b) test the haplotype discrimination of HRM compared to Sanger sequencing, and C) provide a case study using HRM to detect novel haplotype variation in wild C. subternata Vogel. populations. Location. The Cape Floristic Region (CFR), located along the southern Cape of South Africa. Methods. Polymorphic loci were detected through a screening process of sequencing 12 non-coding chloroplast DNA regions across 14 Cyclopia species. Twelve genus-specific primer combinations were designed around variable cpDNA loci, four of which failed to amplify under PCR, and the eight remaining were applied to test the specificity, sensitivity, and accuracy of HRM. The three top-performing HRM regions were then applied to detect haplotypes in wild C. subternata populations, and phylogeographic patterns of C. subternata were explored. Results. We present a framework for applying HRM to non-model systems. HRM accuracy varied across the regions screened using the genus-specific primers developed, ranging between 56 and 100 %. The nucleotide variation failing to produce distinct melt curves is discussed. The top three performing regions, having 100 % specificity (i.e. different haplotypes were never grouped into the same cluster, no false negatives), were able to detect novel haplotypes in wild C. subternata populations with high accuracy (96%). Sensitivity below 100 % (i.e. single haplotypes being clustered as unique during HRM curve analysis, false positives) was resolved through sequence confirmation of each cluster resulting in a final accuracy of 100 %. Phylogeographic analyses revealed that wild C. subternata populations tend to exhibit phylogeographic structuring across mountain ranges (accounting for 73.8 % of genetic variation base on an AMOVA), and genetic differentiation between populations increases with distance (p < 0.05 for IBD analyses). Conclusions. After screening for regions with high HRM clustering specificity — akin to the screening process associated with most PCR based markers — the technology was found to be a high throughput tool for detecting genetic variation in non-model plants. PeerJ reviewing PDF | (2019:12:43978:0:1:NEW 27 Jan 2020) Manuscript to be reviewed . CC-BY-NC 4.0 International license author/funder. It is made available under a The copyright holder for this preprint (which was not peer-reviewed) is the . https://doi.org/10.1101/2020.02.05.921080 doi: bioRxiv preprint

Welcome message from author
This document is posted to help you gain knowledge. Please leave a comment to let me know what you think about it! Share it to your friends and learn new things together.
Transcript

Application of High Resolution Melt analysis (HRM) forscreening haplotype variation in non-model plants: a casestudy of Honeybush ( Cyclopia Vent.)Nicholas C Galuszynski Corresp., 1 , Alastair J Potts 1
1 Department of Botany, Nelson Mandela University, Port Elizabeth, Eastern Cape, South Africa
Corresponding Author: Nicholas C GaluszynskiEmail address: [email protected]
Aim. This study has three broad aims: a) to develop genus-specific primers for High Resolution Meltanalysis (HRM) of members of Cyclopia Vent., b) test the haplotype discrimination of HRM compared toSanger sequencing, and C) provide a case study using HRM to detect novel haplotype variation in wild C.subternata Vogel. populations.
Location. The Cape Floristic Region (CFR), located along the southern Cape of South Africa.
Methods. Polymorphic loci were detected through a screening process of sequencing 12 non-codingchloroplast DNA regions across 14 Cyclopia species. Twelve genus-specific primer combinations weredesigned around variable cpDNA loci, four of which failed to amplify under PCR, and the eight remainingwere applied to test the specificity, sensitivity, and accuracy of HRM. The three top-performing HRMregions were then applied to detect haplotypes in wild C. subternata populations, and phylogeographicpatterns of C. subternata were explored.
Results. We present a framework for applying HRM to non-model systems. HRM accuracy varied acrossthe regions screened using the genus-specific primers developed, ranging between 56 and 100 %. Thenucleotide variation failing to produce distinct melt curves is discussed. The top three performingregions, having 100 % specificity (i.e. different haplotypes were never grouped into the same cluster, nofalse negatives), were able to detect novel haplotypes in wild C. subternata populations with highaccuracy (96%). Sensitivity below 100 % (i.e. single haplotypes being clustered as unique during HRMcurve analysis, false positives) was resolved through sequence confirmation of each cluster resulting in afinal accuracy of 100 %. Phylogeographic analyses revealed that wild C. subternata populations tend toexhibit phylogeographic structuring across mountain ranges (accounting for 73.8 % of genetic variationbase on an AMOVA), and genetic differentiation between populations increases with distance (p < 0.05for IBD analyses).
Conclusions. After screening for regions with high HRM clustering specificity — akin to the screeningprocess associated with most PCR based markers — the technology was found to be a high throughputtool for detecting genetic variation in non-model plants.
PeerJ reviewing PDF | (2019:12:43978:0:1:NEW 27 Jan 2020)
Manuscript to be reviewed.CC-BY-NC 4.0 International licenseauthor/funder. It is made available under a
The copyright holder for this preprint (which was not peer-reviewed) is the. https://doi.org/10.1101/2020.02.05.921080doi: bioRxiv preprint

1 Application of High Resolution Melt analysis (HRM) for
2 screening haplotype variation in non-model plants: a
3 case study of Honeybush (Cyclopia Vent.).4
5 Abstract6 Aim. This study has three broad aims: a) to develop genus-specific primers for High Resolution
7 Melt analysis (HRM) of members of Cyclopia Vent., b) test the haplotype discrimination of HRM
8 compared to Sanger sequencing, and c) provide a case study using HRM to detect novel
9 haplotype variation in wild C. subternata Vogel. populations.
10 Location. The Cape Floristic Region (CFR), located along the southern Cape of South Africa.
11 Methods. Polymorphic loci were detected through a screening process of sequencing 12 non-
12 coding chloroplast DNA regions across 14 Cyclopia species. Twelve genus-specific primer
13 combinations were designed around variable cpDNA loci, four of which failed to amplify under
14 PCR, the eight remaining were applied to test the specificity, sensitivity and accuracy of HRM.
15 The three top performing HRM regions were then applied to detect novel haplotypes in wild C.
16 subternata populations, and phylogeographic patterns of C. subternata were explored.
17 Results. We present a framework for applying HRM to non-model systems. HRM accuracy
18 varied across the regions screened using the genus-specific primers developed, ranging
19 between 56 and 100 %. The nucleotide variation failing to produce distinct melt curves is
20 discussed. The top three performing regions, having 100 % specificity (i.e. different haplotypes
21 were never grouped into the same cluster, no false negatives), were able to detect novel
22 haplotypes in wild C. subternata populations with high accuracy (96%). Sensitivity below 100 %
23 (i.e. a single haplotype being clustered into multiple unique groups during HRM curve analysis,
24 false positives) was resolved through sequence confirmation of each cluster resulting in a final
25 accuracy of 100 %. Phylogeographic analyses revealed that wild C. subternata populations tend
26 to exhibit phylogeographic structuring across mountain ranges (accounting for 73.8 % of genetic
27 variation base on an AMOVA), and genetic differentiation between populations increases with
28 distance (p < 0.05 for IBD analyses).
29 Conclusions. After screening for regions with high HRM clustering specificity — akin to the
30 screening process associated with most PCR based markers — the technology was found to be
31 a high throughput tool for detecting genetic variation in non-model plants.
32
33
34 Introduction
35 Describing intra-population genetic diversity across a species range requires access to
36 sufficiently variable genetic markers that can be applied to large sample sets in an efficient and
37 cost effective manner. The lack of widely transferable marker systems with these qualities has
38 impeded phylogeographic work in the past, especially in developing countries that harbour
39 much of the planet's biodiversity (Beheregaray 2008). High Resolution Melt analysis (HRM,
40 sometimes acronymed to HRMA) is a high throughput and cost effective means of screening
PeerJ reviewing PDF | (2019:12:43978:0:1:NEW 27 Jan 2020)
Manuscript to be reviewed.CC-BY-NC 4.0 International licenseauthor/funder. It is made available under a
The copyright holder for this preprint (which was not peer-reviewed) is the. https://doi.org/10.1101/2020.02.05.921080doi: bioRxiv preprint

41 sequence variation post Polymerase Chain Reaction (PCR), offering the unique
42 advantage of providing rapid insights into the levels of sequence variation amoung samples
43 through melt curve clustering. Having the flexibility to lend itself to a variety of applications, the
44 technology has been widely adopted in clinical (reviewed by Vossen et al. 2009) and crop
45 research (reviewed by Simko 2016). However, despite its apparent benefits, HRM appears to be
46 underutilized for non-model organisms.
47 The HRM process is briefly described here. The inclusion of a DNA saturating fluorescent dye
48 during PCR produces double stranded DNA molecules with dye bound to each base pair. As
49 such, the presence of double stranded PCR product is measured by its fluorescence. As the
50 PCR products are heated the double stranded DNA molecules dissociate, or melt, releasing the
51 dye, resulting in a decrease in detected fluorescence. The rate at which a DNA fragment melts
52 is dependent on the binding chemistry of the nucleotide sequence under analysis. Therefore, by
53 plotting the decrease in fluorescence against the steady rate of temperature increase, a melt
54 curve determined by the DNA template under analysis is produced. The resultant melt curve
55 differences (curve shape and melt peak [Tm]) are potentially indicative of sequence variation
56 among PCR products.
57 The genotyping and mutation scanning abilities of HRM have been tested using well described
58 systems in the past, including: artificially generated SNPs (Reed & Wittwer 2004) and loci from
59 the human genome (Ebili & Ilyas 2015; Garritano et al. 2009; Li et al. 2014; Reed & Wittwer
60 2004), where the technology was found to be highly sensitive and specific, with reproducible
61 results. These studies suggest that HRM is capable of detecting single SNP variation with an
62 average sensitivity of 95% (sd=8 %) and specificity of 97% (sd=7%) in amplicons of various
63 lengths (50-1000 bp, Reed & Wittwer 2004; 51-547 bp, Li et al. 2014; and 211-400 bp, Garritano
64 et al. 2009). However, such accuracy is only possible if the starting DNA template is of sufficient
65 quality and quantity (Ebili & Ilyas 2015). Being non-destructive in nature, the PCR products can
66 also be Sanger sequenced post HRM (Vossen et al. 2009). The power of the HRM approach to
67 screen sequence variation is that it helps to avoid redundant sequencing of identical nucleotide
68 motifs (Dang et al. 2012; Vossen et al. 2009), thereby potentially reducing overall sequencing
69 costs of projects where intra-population genetic variation may be low, as in the slow evolving
70 chloroplast genome of plants (Schaal et al. 1998). In addition, HRM has been shown to be more
71 sensitive than traditional gel electrophoresis methods for microsatellite genotyping (Distefano et
72 al. 2012). Fast, reliable and cost effective — HRM appears to be an ideal molecular tool for
73 studies that require the characterization of a large number of samples that are likely to exhibit
74 low nucleotide variation.
75 Despite its apparent utility, HRM has rarely featured in phylogeographic work. Smith et al.
76 (2010) were some of the first to apply HRM to population genetics. By melting short amplicons
77 (40-60 bp) that targeted known SNPs, they successfully genotyped 121 accessions from five
78 wild swordfish (Xiphias gladius Bloch, Xiphiidae) populations. Cubry et al. (2015) were
79 successful in applying HRM for the discrimination of four cpDNA haplotypes that corresponded
80 with the geographic structuring of black alder (Alnus glutinosa (L.) Gaertn., Betulaceae),
81 screening 154 accessions across 23 populations. These studies, and most others applying
82 HRM to non-model organisms (Dang et al. 2012; Li et al. 2012; Radvansky et al. 2011), set out
83 to develop HRM primers having prior knowledge of the nucleotide variation under analyses.
84 Unfortunately, such knowledge is generally not available for the study of non-model organisms
PeerJ reviewing PDF | (2019:12:43978:0:1:NEW 27 Jan 2020)
Manuscript to be reviewed.CC-BY-NC 4.0 International licenseauthor/funder. It is made available under a
The copyright holder for this preprint (which was not peer-reviewed) is the. https://doi.org/10.1101/2020.02.05.921080doi: bioRxiv preprint

85 and the application of HRM for detecting of novel genetic variation in wild populations is still rare
86 (Nunziata et al. 2019; Sillo et al. 2017). High Resolution Melt analysis appears to be an
87 underutilized resource by phylogeographers.
88 Here we test the application of HRM for non-model taxa, Cyclopia, a commercially important
89 plant genus endemic to the CFR. This study: a) develops a set of genus-specific primers for the
90 HRM analysis of non-coding cpDNA loci to test: b) the haplotype descrimination sensitivity,
91 specificity, and accuracy of HRM, and c) the potential application of HRM for haplotype
92 detection in wild Cyclopia populations, focusing here on C. subternata. This study demonstrates
93 that (when optimized) HRM is a fast, accurate, and cost effective tool for haplotype detection in
94 non-model organisms, successfully describing the geographic structuring of genetic diversity in
95 wild C. subternata populations.
96
97 Materials & Methods98 Taxonomic background and sampling 99 This study focuses on members of the genus Cyclopia Vent., which is endemic to the Cape
100 Floristic Region (CFR) and consists of 23 described species; two of which are considered
101 extinct (Cyclopia filiformis Kies, Cyclopia laxiflora Benth.) and various others ranging from
102 critically endangered to vulnerable (SANBI, 2012). Cyclopia species and populations tend to
103 exhibit highly localised distributions (Schutte 1997), making them potentially vulnerable to
104 genetic pollution from foreign genotypes translocated for the cultivation of Honeybush tea and
105 associated products (Ellstrand & Elam 1993; Levin et al. 1996; Potts 2017; Schutte 1997) — an
106 increasingly common practice in the CFR (McGregor 2017). The characterization and
107 conservation of wild Cyclopia genetic diversity is therefore of high importance.
108 To maximise the amount of genetic variation detected and the transferability of the primers
109 designed across the genus, 14 species (summarized in Table 1, closed circles in Fig 1) were
110 sampled from the full geographic range of the genus. Additionally, eight wild populations (open
111 circles in Fig 1) of C. subternata Vogel. were sampled to test the potential application of HRM
112 for haplotype detection using the genus-specific primers generated. Between 10 and 24
113 samples were collected per C. subternata population. Fresh leaf material was clipped from the
114 growing tips of wild specimens over the period of 2015-2018 and placed directly into a silica
115 desiccating medium for a minimum of two weeks prior to DNA extraction. All sampling was
116 approved by the relevant permitting agencies, Cape Nature (Permit number: CN35-28-4367),
117 the Eastern Cape Department of Economic Development, Environmental Affairs and Tourism
118 (Permit numbers: CRO 84/ 16CR, CRO 85/ 16CR), and the Eastern Cape Parks and Tourism
119 Agency (Permit number: RA_0185).
120 DNA extraction 121 Whole genomic DNA was extracted from silica-dried leaf material using a CTAB approach
122 modified from Doyle and Doyle (1987), the full extraction protocol is described in S1. Extracted
123 DNA was suspended in 50 µL molecular grade water for PCR amplification with the products
124 sequenced using Sanger sequencing (Sanger et al. 1977). Samples that failed to amplify during
125 PCR, were subject to repeat DNA extracted from new leaf material and then PCR amplified.
126 Developing Cyclopia specific HRM primers
PeerJ reviewing PDF | (2019:12:43978:0:1:NEW 27 Jan 2020)
Manuscript to be reviewed.CC-BY-NC 4.0 International licenseauthor/funder. It is made available under a
The copyright holder for this preprint (which was not peer-reviewed) is the. https://doi.org/10.1101/2020.02.05.921080doi: bioRxiv preprint

127 While HRM has been shown to successfully detect sequence variation in PCR products of
128 various sizes (see introduction), it has been suggested that shorter PCR products are likely to
129 produce more pronounced melt curve differences than larger products with the same nucleotide
130 variation (Dang et al. 2012; Dobrowolski et al. 2009; Li et al. 2014; Liew et al. 2004; Taylor et al.
131 2011). Universal marker systems, such as those developed by Shaw et al. (2005, 2007) are
132 therefore unlikely to be directly transferable to HRM, as they amplify relatively large PCR
133 products, thus HRM specific primers must be developed to target shorter, variable regions.
134 To develop HRM primers requires prior knowledge of the nucleotide variation of regions across
135 samples. The means of acquiring such data is dependent on the resources available to the
136 researcher and the availability of existing sequence data for the study organisms. Thus template
137 data could range from Next Generation Sequencing derived genomic data to the application of
138 HRM to existing microsatellite markers, or existing data available from international nucleotide
139 sequence databases such as GenBank (https://www.ncbi.nlm.nih.gov/genbank/).
140 For Cyclopia, however, existing sequence data (predominantly from the ribosomal ITS region)
141 exhibited low levels of differentiation amongst species (Galuszynski and Potts 2017; Van Der
142 Bank et al. 2002), lacking the variation required for population level analyses. Therefore,
143 polymorphic loci were identified from non-coding cpDNA regions via Sanger sequencing
144 (Sanger et al. 1977) of PCR products amplified using the protocols and universal primers
145 described by Shaw et al. (2005, 2007, summarised in S1). A total of 16 non-coding cpDNA
146 regions under went PCR, however four regions failed to amplify (and could not be sequenced).
147 The 12 regions that were sequenced are summarized in Table S1.
148 Sequences were assembled using CondonCode Aligner [v2.0.1] (Codon Code Corp, http://www.
149 codoncode.com). The PHRED base-calling program (Ewing et al. 1998) was used to assign a
150 quality score for each sequence, then sequences were automatically aligned using ClustalW
151 (Thompson et al. 1994) and visually inspected for quality. All short indels (< 3 bp) occurring in
152 homopolymer repeat regions were considered alignment errors and removed from the
153 alignment. The consensus sequence alignment for polymorphic regions were exported and
154 utilized in HRM primer design.
155 Primer design was guided by two constraining factors: (1) sequences had to contain
156 conservative regions with a high GC content that could form the primer binding template, and
157 (2) these regions had to flank polymorphic sites. Wherever possible, internal HRM primers were
158 designed in a way that would split a region into neighbouring loci, as suggested by Dang et al.
159 (2012). This approach allows for adjacent loci to be sequenced in a single run by amplifying the
160 full region, and then during alignment, split the region into the neighboring loci that underwent
161 HRM analysis. This approach reduces the time involved in sequence alignment and number of
162 samples required to be sequenced for HRM clustering verification.
163 High Resolution Melt specific primers were designed using the online resource Primer-Blast
164 (www.ncbi.nlm.nih.gov/tools/primer-blast/). The sub-family Faboideae was used as the
165 reference taxon to check for primer specificity searched against the NCBI Reference Sequence
166 representative genomes (www.ncbi.nlm.nih.gov/refseq/); PCR product size was limited to
167 between 50 and 550 bp (as this falls within the amplicon size predicted to produce the highest
168 levels of genotyping accuracy; Dang et al. 2012; Dobrowolski et al. 2009; Li et al. 2014; Liew et
169 al. 2004; Taylor et al. 2011), primer melting temperature was set at 60 °C (± 3 °C) (as
170 suggested by Taylor et al. 2011) and a maximum of 20 primer pairs were returned per search.
PeerJ reviewing PDF | (2019:12:43978:0:1:NEW 27 Jan 2020)
Manuscript to be reviewed.CC-BY-NC 4.0 International licenseauthor/funder. It is made available under a
The copyright holder for this preprint (which was not peer-reviewed) is the. https://doi.org/10.1101/2020.02.05.921080doi: bioRxiv preprint

171 The positions of these primers within their respective region alignment were manually evaluated
172 to ensure that they occurred in well conserved sites, i.e. any priomers occurring across
173 polymorphic loci were discarded.
174 Eleven genus-specific primer pairs (Table S2) were developed from seven of the twelve non-
175 coding cpDNA regions, of which eight primer pairs successfully amplified PCR products and
176 were thus selected for HRM screening (Table 1). The remaining three were excluded from the
177 analysis due to poor PCR amplification. The primer pairs selected for HRM screening amplified
178 between four and six unique haplotypes each, across five cpDNA regions (nucleotide
179 differences are summarized in Table 2). Primers selected for the evaluation of HRM accuracy
180 are reported in Table 1.
181 Testing PCR amplification of HRM primers182 Samples that amplified unique haplotypes (as determined from the sequence data used to
183 develop HRM primers) were diluted to 5 ng/µL for HRM analysis. High Resolution Melt analysis
184 was conducted for all primer pairs developed, with 16 replicates amplified per sample
185 (haplotype). Only replicates that produced sufficient PCR product, as determined from PCR
186 amplification curves (see examples in Figs 2 and 3) were, however, included in the evaluation of
187 HRM haplotype discrimination. This PCR amplification screening approach was adopted as the
188 aim of this phase of the study was to test the haplotype discrimination abilities of HRM based on
189 the underlying nucleotide differences between hapolotypes and not the quanitiy of PCR product
190 under analysis (which can vary due to pippetting errors). Regions that failed to consistent PCR
191 amplification curves (possibly due to non-specific primer binding), were excluded from
192 subsequent analysis (Figs 2 and 3).
193 PCR and HRM reactions 194 All reactions (PCR amplification and subsequent HRM) took place in a 96 well plate CFX
195 Connect (Bio-Rad Laboratories, Hercules, California, U.S.A.) in 10 µL reaction setups,
196 consisting of 4 µL genomic DNA (5 ng/µL), 1 µL each primer (10 mM) and 5 µL Precision Melt
197 Supermix containing hot-start iTaqTM DNA polymerase, dNTPs, MgCl2, EvaGreen dye (Bio-
198 Rad Laboratories, Hercules, California, U.S.A.).
199 Polymerase Chain Reaction amplification and melt conditions were as per manufacturer's
200 specifications (Table 3) and the annealing temperature set to the primer pair's mean Tm
201 (melting temperature), reported in Table 1. The automated clustering algorithm of the High
202 Precision Melt software™ (Bio-Rad Laboratories, Hercules, California, U.S.A.) was used to
203 group melt curves into clusters that represent putative haplotypes. HRM clustering settings used
204 were ΔTm threshold at 0.05 ℃ and curve shape sensitivity settings and temperature correction,
205 70% and 20 respectively.
206 HRM discrimination of sequenced haplotypes 207 Following the descriptions of Altman and Bland (1994), HRM discrimination (sensitivity,
208 specificity and accuracy) was determined for each of the haplotypes amplified by the eight HRM
209 primers that produced sufficient PCR product for HRM analysis. Sensitivity, or the true positive
210 rate, refers to HRM's ability to correctly assign haplotype replicates into the same HRM cluster.
211 Sesitivity =TP/( TP+FN )
212 TP=TruePositive FN=FalseNegative
PeerJ reviewing PDF | (2019:12:43978:0:1:NEW 27 Jan 2020)
Manuscript to be reviewed.CC-BY-NC 4.0 International licenseauthor/funder. It is made available under a
The copyright holder for this preprint (which was not peer-reviewed) is the. https://doi.org/10.1101/2020.02.05.921080doi: bioRxiv preprint

213 Specificity, or true negative rate, is the measure of HRM's ability to correctly discern between
214 haplotypes, grouping them into different HRM clusters.
215 Specificity =TN/( TN+FP )
216 TN=TrueNegative FP=FalsePositive
217 The accuracy of HRM refers to how close haplotype clustering reflects the true identities of the
218 haplotypes and was measured as:
219 Accuracy=( TP+TN ) /( TP+FP+TN+FN )
220 Since sensitivity below 100 % will be accounted for during HRM cluster (i.e. putative haplotype)
221 confirmation by sequencing (with a subset of samples from each unique HRM cluster
222 sequenced), all regions with 100 % specificity were included for the detection of novel
223 haplotypes in wild C. subternata populations.
224 The potential for HRM to detect haplotype variation in wild populations
225 Only three regions (MLT S1 - MLT S2, MLT S3 - MLT S4, and MLT U1 - MLT U2) were found to
226 have an HRM clustering specificity of 100%. Thus these regions were screened for haplotype
227 variation across 142 accessions from eight wild C. subternata populations.
228 The same approach as Dang et al. (2012) was employed, with each sample run in duplicate and
229 haplotype clustering performed on a single population basis with the intention of reducing errors
230 resulting from variation of PCR product concentration and quality across samples from different
231 population extractions. This was achieved by using the built in well group function in the CFX
232 Manager™ Software (Bio-Rad Laboratories, Hercules, California, U.S.A.), thus multiple
233 populations could be included in a run, but analyses separately for HRM clustering.
234 The cpDNA regions that were used to design the primers used for HRM haplotype detection
235 were amplified and sequenced (following the same protocols as before) to confirm the haplotype
236 identity of HRM clusters. The loci amplified by MLT S1- MLT S2 and MLT S3 - MLT S4 are
237 adjacent to one another and by sequencing the full atpI-atpH intergenic spacer, the sequence
238 identity of both loci could be confirmed with reduced sequencing and alignment effort. Moreover,
239 the position of the loci amplified by the HRM primers occurred near the center of their respective
240 parent regions and unidirectional sequencing using the reverse primers of Shaw et al. (2007)
241 proved sufficient for verifying the sequence motifs under HRM analysis. A minimum of three
242 accessions representing each HRM cluster (i.e. putative haplotype) in each population were
243 sequenced for haplotype verification. Samples whose replicates were classified as two different
244 clusters, thus having uncertain haplotype identify, were also sequenced to ensure they were
245 assigned the correct haplotype identity. A total of 46 and 38 accessions were sequenced for the
246 atpI-atpH intergenic spacer and ndhA intron respectively. Haplotype discrimination by HRM was
247 calculated using the C. subternata samples sequenced for haplotype confirmation, following the
248 same formula as before.
249 Phylogeographic analysis of C. subternata
250 The haplotypes detected via HRM clustering and confirmed by sequencing were assembled
251 following the same procedure described under ‘Developing Cyclopia specific HRM primers’. All
252 wild C. subternata samples that underwent HRM analysis were then assigned the haplotype
PeerJ reviewing PDF | (2019:12:43978:0:1:NEW 27 Jan 2020)
Manuscript to be reviewed.CC-BY-NC 4.0 International licenseauthor/funder. It is made available under a
The copyright holder for this preprint (which was not peer-reviewed) is the. https://doi.org/10.1101/2020.02.05.921080doi: bioRxiv preprint

253 identity of the HRM cluster they belonged using a custom R script written by A.J.P (provided
254 elsewhere, S1).
255 The genealogical relationships among haplotypes were determined from a Statistical Parsimony
256 (SP) network (Fig 4) constructed in TCS [v1.2.1] (Clement et al. 2000). Default options were
257 used to build the network and all indels were reduced to single base-pairs as the software treats
258 a multiple base pair gap as multiple mutations. Haplotype distributions were mapped (Fig 4) in
259 QGIS [v3.2.2] (QGIS Development Team 2018).
260 The following population genetic differentiation measures were calculated: pairwise Gst (Nei
261 1973), G""st (Hedrick 2005) (both indicators of allele fixation) Jost’s D (Jost 2008), which
262 measures allelic differentiation between populations, and Prevosi’s dist (Prevosti et al. 1975) a
263 measure of pairwise genetic distance that counts gaps as evolutionary events (all gaps were
264 reduced to single base pair events). These measures provide insight into current allele
265 distributions without assuming historical gene flow patterns (Jost et al. 2018). Isolation By
266 Distance (IBD) was evaluated among populations testing the correlation between these genetic
267 differentiation measures and pairwise geographic distance using a Mantel test (Wright 1943)
268 with 9999 permutations, as implemented using the ade4 [v1.7] library (Dray & Dufour 2007;
269 Kamvar et al. 2014) in R [v3.5.1] (R Core Team 2018). In order to account for the possibility of
270 non linear population expansion, relationship between population differentiation measures and
271 the natural logarithm of geographic distance was tested following the same approach (Rousset,
272 1997). Finally, genetic differentiation across the mountain ranges that populations were sampled
273 from was tested via an Analysis of Molecular Variance (AMOVA) (Excoffier et al. 1992). The
274 mountain ranges included in the AMOVA included: the Tsitzikamma (3 populations, 52
275 samples), Outeniqua east (2 populations, 31 samples), Outeniqua west (2 populations, 35
276 samples), and Langeberg (1 population, 24 samples) ranges.
277 Results278 HRM discrimination of sequenced haplotypes279 High Resolution Melt curve clustering of haplotypes identified via sequencing for primer
280 development produced variable results: sensitivity ranged from 56 % - 100 %, specificity ranged
281 from 27 % - 100 %, and accuracy ranged from 36 % - 100 % (all values reported in Table 2 and
282 summarized in Fig 5).
283 Nucleotide differences between haplotypes failing to produce distinct melt curves, and thus
284 undifferentiated by HRM clustering, are summarized in Table 5. Of the haplotypes not
285 differentiated by HRM: two haplotypes differ by indels, while the remaining 15 comparisons
286 differ by at least one transversion, and two comparisons differed by a transversion and
287 transition. The haplotypes that did produce distinct melt curves differed by at least a transition
288 (26 cases), or multiple SNPs (16 cases), one haplotype differed by a 19 bp indel, and another
289 by a 6 bp indel. All haplotype sequence variation is summarized in Table 2. As previously
290 stated, the three HRM primer combinations with specificity of 100% (MLT S1 -S2, MLT S3 -
291 MLT S4, MLT U1 - U2) were selected for haplotype discovery in wild C. subternata populations.
292 Detection of haplotype variation in wild populations via HRM293 High Resolution Melt curve analysis of accessions from wild C. subternata populations revealed
294 no variation in the region amplified by the MLT S3 - MLT S4 primer combination, confirmed by
295 sequencing, and the locus was subsequently excluded from further analyses. Five distinct
PeerJ reviewing PDF | (2019:12:43978:0:1:NEW 27 Jan 2020)
Manuscript to be reviewed.CC-BY-NC 4.0 International licenseauthor/funder. It is made available under a
The copyright holder for this preprint (which was not peer-reviewed) is the. https://doi.org/10.1101/2020.02.05.921080doi: bioRxiv preprint

296 haplotypes were verified by sequencing a subset of samples (ranging from three to eight
297 individuals per population) from each HRM cluster for the remaining two primer combinations.
298 Of the 142 samples less than 29 % were required to be sequenced for haplotype confirmation.
299 Both loci were found to have 100 % specificity, i.e. HRM successfully discriminated amongst all
300 haplotypes detected in wild C. subternata populations. However, haplotype richness was
301 overestimated by HRM (sensitivity of 87.6 % and 95.5 % for MLT S1 - MLT S2 and MLT U1 -
302 MLT U2 respectively), both regions had accuracies of 96 %. However, as these additional
303 clusters were sequenced for haplotype confirmation, samples were assigned the true identity of
304 haplotypes resolving any potential issues of low sensitivity.
305 The final cpDNA dataset comprised 561 bp, 217 bp from the atp1-atpH region (MLT S1 - MLT
306 S2) and 344 bp from the ndhAx1-ndhAx2 region (MLT U1 - MLT U2), with a GC content of 29
307 %. An additional 310 base pairs (bp) were amplified by MLT S3 - MLT S4, revealing no
308 nucleotide variation. The dataset contained 5 polymorphic sites; 4 transversions, 1 transition,
309 and a 7 bp indel (nucleotide differences summarised in Table S3).
310 Cyclopia subternata phylogeography
311 The SP network revealed a radiation from a central ancestral haplotype, with few mutations
312 separating haplotypes (Fig 4). The ancestral haplotype was present in all populations, except
313 the western most Garcia’s Pass population located in the Langeberg Mountains. This population
314 contains a single, unique haplotype. An additional two populations (Kareedow Pass and
315 Bloukranz Bridge) were also found to contain rare, localized haplotypes and a low frequency
316 haplotype was detected in two populations located in the Tsitsikamma and Outeniqua
317 mountains (Fig 4). Population genetic differentiation measures increased with geographic
318 distance (R^2 = 0.77, 0.74, 0.70, and 0.76 for Gst, G’’st, Jost’s D and Provesti’s dist
319 respectively, p < 0.05 for all measures), with significance increasing when tested against log
320 transformed geographic distance (R^2=0.64, 0.67, 0.61, and 0.65 for Gst, G’’st, Jost’s D and
321 Provesti’s dist as before, p < 0.05 for all measures). The AMOVA revealed significant (p <0.05)
322 structuring across mountain ranges, accounting for 73.8 % of genetic variation.
323 Discussion324 A nested framework (Fig 3) was developed to test and apply HRM to non-model organisms,
325 members of the Cape endemic plant genus Cyclopia. Polymorphic sites were identified via
326 sequencing 12 non-coding cpDNA regions across 14 Cyclopia species. PCR primers for HRM
327 analysis were designed to flank these variable sites, producing 11 HRM primer pairs across 7
328 regions. Eight of these pairs successfully amplified PCR products and were subsequently
329 analysed via HRM. Specificity of 100% was detected for three of the primer pairs, which were
330 then used to detect haplotype variation in wild C. subternata populations with a haplotypes
331 detection accuracy of 96 %. Haplotype detection errors were due to false negatives reducing
332 HRM sensitivity. False negatives occur when HRM incorrectly assigns a single haplotype to
333 multiple clustering groups, an issue that is resolved when the haplotype identity of HRM clusters
334 is confirmed by sequencing. Optimized HRM was demonstrated to be a powerful tool for
335 detecting genetic variation in non-model organisms, providing immediate insights into within
336 population genetic variation via automated melt curve clustering and substantially reduced
PeerJ reviewing PDF | (2019:12:43978:0:1:NEW 27 Jan 2020)
Manuscript to be reviewed.CC-BY-NC 4.0 International licenseauthor/funder. It is made available under a
The copyright holder for this preprint (which was not peer-reviewed) is the. https://doi.org/10.1101/2020.02.05.921080doi: bioRxiv preprint

337 sequencing efforts. The framework provided here offers a straightforward approach to develop
338 and test the potential application of HRM to non-model systems.
339 HRM discrimination of sequenced haplotypes
340 Differences in DNA melt curves, as detected by HRM, stem from the effects nucleotide
341 sequence chemistry has on melt peak intensity and curve shape. While HRM is reported to be
342 capable of discriminating between any SNP type, the approach may be constrained by physical
343 and chemical properties of the DNA fragment under melt analysis (Gundry et al. 2008). Some
344 nucleotide variations, namely class 3 (C ↔ G) and class 4 (A ↔ T) SNPS , tend to produce
345 negligible changes in melt behaviour (curve shape and melt peak) and are often poorly detected
346 by HRM (Dang et al. 2012; Gundry et al. 2008; Yamagata et al. 2018). This is likely to be
347 exaggerated when analysing longer PCR products, as shorter PCR products produce more
348 pronounced melt curve differences than longer produces with the same SNP variation (Li et al.
349 2014; Liew et al. 2004; Taylor et al. 2011; Tindall et al. 2009). Furthermore, nearest neighbour
350 chemistry (the identity of nucleotides directly adjacent to the SNP under investigation) has been
351 shown to impact the melt peak of PCR products, negating any change in melt peak produced by
352 class 3 and 4 SNPs in some cases (Yamagata et al. 2018).
353 Many of these observations are supported by the findings of this study, however some important
354 deviations were detected. Haplotypes that were successfully discriminated by HRM tended to
355 have a class 1 SNP (transitions, C ↔ T and A ↔ G) or multiple SNPs differentiating them.
356 However, seven haplotypes differing by multiple SNPs did not produce distinct melt curves
357 (Table 5), suggesting that some SNPs may potentially counteract one anothers impact on the
358 melt curve. Furthermore, haplotypes that differed by a class 2 (transversions, C ↔ A, G ↔ T)
359 and, as predicted, class 4 SNPs do not appear to have detectable melt curve differences. It is,
360 however, uncertain why in this study some class 2 SNPs produced distinct melt curves in some
361 cases (MLT M1 - MLT M2 and MLT S3 - MLT S4), but not in others (MLT C1-C4 and MLT C3 -
362 C4). Nearest neighbor chemistry does not appear to be provide insights into this as the SNPs
363 had the same neighbouring base pairs across PCR products. Furthermore, a class 2 SNP was
364 differentiated by HRM in a larger PCR product (527 bp) and not in the smaller products (386 bp
365 and 236 bp), indicating that shorter DNA fragments do not necessarily produce more distinct
366 melt curves than larger fragments with the same mutation.
367 The primer design choices in this study were largely based on the suggestions that nucleotide
368 variation in shorter DNA strands will have a more pronounced impact on melt curve shape and
369 intensity. This appears to have not been the case and larger PCR products performed as well, if
370 not better, than smaller regions, as detected elsewhere (Dang et al. 2012; Dobrowolski et al.
371 2009). Future HRM primer design efforts should possibly explore larger target regions that are
372 more likely to cover multiple SNPs and thus produce more distinct melt curves (Dang et al.
373 2012), such as the products amplified by primer combinations; MLT S1- MLT S2, MLT S3 - MLT
374 S4, and MLT U1- MLT U2. This opens HRM up to exploration of existing universal primers, such
375 as those of Shaw et al. (2005, 2007), but additional PCR optimization may be required prior to
376 being applied to HRM.
377 Detection of haplotype variation in wild Cyclopia populations via HRM
PeerJ reviewing PDF | (2019:12:43978:0:1:NEW 27 Jan 2020)
Manuscript to be reviewed.CC-BY-NC 4.0 International licenseauthor/funder. It is made available under a
The copyright holder for this preprint (which was not peer-reviewed) is the. https://doi.org/10.1101/2020.02.05.921080doi: bioRxiv preprint
378 High Resolution Melt analysis using the two best performing primer pairs that amplified variable
379 regions proved to be a highly accurate (96 % for both regions screened) means of detecting
380 haplotypes variation in wild Cyclopia populations with no cases of different haplotypes occurring
381 in the same cluster (specificity = 100 %).
382 A remarkable feature of HRM is its high and rapid throughput. Running samples in duplicate on
383 a 96 well plate allowed for 48 samples to be screened every three hours. As such, all 142 wild
384 C. subternata samples were screened across the two cpDNA regions in two days, with
385 immediate insights into the underlying levels of genetic variation (based on HRM clusterings).
386 This rapid data production comes at a minimal cost per sample, which in this study amounted to
387 $ 11.09 including all PCR amplification and sequencing for the phylogeographic analysis of C.
388 subternata. A costing analysis (Table S4) based on quotes obtained in 2017, for a broader
389 Cyclopia research project that employed Anchored Hybrid Enrichment (Lemmon et al. 2012) for
390 nucleotide sequence generation, revealed that, while the cost per bp was not greatly reduced
391 when applying HRM ($ 0.013 /bp) as compared to Sanger sequencing ($ 0.015 /bp), and more
392 costly than high throughput sequencing approaches ($ 0.0005 /bp, excluding library preparation
393 and bioinformatic services). The true value of HRM lies in the ability to screen large numbers of
394 samples, with the cost per sample for HRM being 40 % that of Sanger sequencing and 16 %
395 that of Anchored Hybrid Enrichment.
396 Distribution of C. subternata genetic diversity397 Despite the relatively low genetic differentiation and variation detected across wild C. subternata
398 populations, with a widespread haplotype detected in all populations sampled in the
399 Tsitsikamma and Outeniqua mountains, genetic diversity does appear to be spatially structured.
400 Geographically isolated haplotypes were detected in populations in the Tsitsikamma mountains,
401 and complete haplotype turnover was detected in Garcia’s Pass population from the Langeberg;
402 possibly a consequence of a genetic bottleneck resulting from a small founding population,
403 facilitating rapid fixation of rare alleles (Klopfstein et al. 2006). These, and an additional low
404 frequency haplotype shared between Langekloof and Outeniqua populations, provided sufficient
405 divergence across mountain ranges to be detected by an AMOVA and roughly coincide with NJ
406 clustering of populations (Fig S1). The transition between mountain ranges represents steps of
407 increased genetic differentiation between populations (supported by significant IBD, Slatkin
408 1993), and the movement of seed and seedlings across these isolating barriers for Honeybush
409 cultivation should be avoided.
410 The population divergence described above is in contrast to that reported for the nuclear
411 genome of C. subternata (Niemandt et al. 2018). While Niemand et al. (2018) also detected a
412 genetically unique population (located in Harlem), this population appears to be C. plicata Kies
413 (Pers. obs., iNaturalist observation 14257580). No genetic divergence was reported between
414 the two wild C. subternata populations (sampled from the Tsitsikamma and Outeniqua
415 mountains) screened and the Agricultural Research Council’s (ARC) genebank accessions.
416 Genetic material from this genebank is commonly utilized for the establishment of cultivated
417 Honeybush stands, including in the Langeberg that supports the genetically distinct GAR
418 population (Joubert et al. 2011; Niemandt et al. 2018). The effective population size of the C.
419 subternata nuclear genome is a scale of magnitude larger than the cpDNA due to the species
420 high ploidy level (2n = 54, Motsa et al. 2018; Schutte 1997), as such drift may occur more
PeerJ reviewing PDF | (2019:12:43978:0:1:NEW 27 Jan 2020)
Manuscript to be reviewed.CC-BY-NC 4.0 International licenseauthor/funder. It is made available under a
The copyright holder for this preprint (which was not peer-reviewed) is the. https://doi.org/10.1101/2020.02.05.921080doi: bioRxiv preprint

421 slowly. Additionally, pollen dispersal by carpenter bees (Xylocopa spp) may reduce population
422 divergence through rare long distance dispersal events. Seed, in contrast, is dispersed locally
423 by ants and dehiscent seed pods and long distance dispersal is extremely unlikely, unless
424 anthropogenically mediated; this has likely been the case with ARC seed used to establish
425 cultivated populations across the CFR (Joubert et al. 2011).
426 The geographic distribution of C. subternata genetic diversity, as described here, indicates that:
427 a) unique haplotypes occur within populations, and b) these unique haplotypes are spatially
428 structured. These patterns of genetic diversity need to be acknowledged in the management of
429 this economically important species, with seed and seedling not translocated outside of the
430 mountain range that they were sourced from.
431 Conclusions432 This study demonstrates that HRM is capable of discerning between cpDNA haplotypes, with
433 variable levels of success. Despite some haplotypes producing undifferentiated melt curves,
434 haplotypes screened using the top performing HRM regions were consistently differentiated by
435 HRM. When these top performing HRM regions were applied to screening genetic variation in
436 wild populations of the non-model organism, C. subternata, all haplotypes were differentiated.
437 The framework described here provides a clear guideline on generating the tools required for
438 applying HRM to non-model systems. This approach reduced overall project costs by avoiding
439 redundant sequencing of haplotypes. The high throughput of HRM offers the molecular
440 ecologist the opportunity to increase intrapopulation sample numbers, while the automated
441 clustering provides real time insights into the underlying levels of genetic variation. Furthermore,
442 this technology may be particularly well suited to the study of conserved and slow mutating
443 nuclear regions and the chloroplast genome of plants (Schaal et al. 1998) where low
444 intrapopulation genetic variation is predicted and redundant sequencing of the same nucleotide
445 motifs is likely.
446 The Cyclopia specific primers developed here provide a starting point for assessing potential
447 issues of genetic pollution associated with the transition to commercial Honeybush cultivation
448 (Potts 2017). However, further resolution may be required for more in depth population studies
449 and additional cpDNA regions as well as low copy nuclear loci should be explored for HRM
450 primer development. Furthermore, the tools produced here, while suitable for phylogeographic
451 work (as demonstrated here), are limited 452 to the maternally inherited chloroplast genome
453 and are not suitable for exploration of 454 interspecific hybrid detection in cultivated
455 Honeybush populations.
456 Acknowledgements457 We would like to thank Gillian McGregor and her students for their assistance during sampling. 458459 ReferencesAltman, D. G., & Bland, J. M. (1994). Diagnostic tests. 1: Sensitivity and specificity. 460 BMJ (Clinical research ed.), 308(6943), 1552. 461 Beheregaray, L. B. (2008). Twenty years of phylogeography: The state of the field and the
462 challenges for the Southern Hemisphere. Mol. Ecol., 17(17), 3754-3774.
463 Clement, M., Posada, D., & Crandall, K. A. (2000). TCS: A computer program to estimate gene
464 genealogies. Mol. Ecol., 9(10), 1657-1659.
PeerJ reviewing PDF | (2019:12:43978:0:1:NEW 27 Jan 2020)
Manuscript to be reviewed.CC-BY-NC 4.0 International licenseauthor/funder. It is made available under a
The copyright holder for this preprint (which was not peer-reviewed) is the. https://doi.org/10.1101/2020.02.05.921080doi: bioRxiv preprint
465 Cubry, P., Gallagher, E., O'Connor, E., & Kelleher, C. T. (2015). Phylogeography and
466 population genetics of black alder (Alnus glutinosa (L.) Gaertn.) in Ireland: putting it in a
467 European context. Tree Genet. Genomes, 11(5), 99.
468 Dang, X. D., Kelleher, C. T., Howard-Williams, E., & Meade, C. V. (2012). Rapid identification of
469 chloroplast haplotypes using High Resolution Melting analysis. Mol. Ecol. Resour., 12(5), 894-
470 908.
471 Distefano, G., Caruso, M., La Malfa, S., Gentile, A., & Wu, S.-B. (2012). High resolution melting
472 analysis is a more sensitive and effective alternative to gel-based platforms in analysis of SSR:
473 An example in citrus. PLoS One, 7(8), e44202.
474 Dobrowolski, S. F., Hendricks, A. T. M., van den Bosch, B. J. C., Smeets, H. J. M., Gray, J.,
475 Miller, T., & Sears, M. (2009). Identifying sequence variants in the human mitochondrial genome
476 using high-resolution melt (HRM) profiling. Hum. Mutat., 30(6), 891-898.
477 Doyle, J. J., & Doyle, J. L. (1987). A rapid DNA isolation procedure for small quantities of fresh
478 leaf tissue. Phytochem. Bull., 19, 11-15.
479 Dray, S., & Dufour, A.-B. (2007). The ade4 Package: Implementing the duality diagram for
480 ecologists. J. Stat. Softw., 22(4).
481 Ebili, H., & Ilyas, M. (2015). High resolution melt analysis, DNA template quantity disparities and
482 result reliability. Clin. Lab., 61(1-2), 155-159.
483 Ellstrand, N. C., & Elam, D. R. (1993). Population genetic consequences of small population
484 size: Implications for plant conservation. Annu. Rev. Ecol. Evol. Syst., 24(1), 217-242.
485 Ewing, B., Hillier, L., Wendl, M. C., & Green, P. (1998). Base-calling of automated sequencer
486 traces using phred. I. Accuracy assessment. Genome Res., 8(3), 175-185.
487 Excoffier, L., Smouse, P. E., & Quattro, J. M. (1992). Analysis of molecular variance inferred
488 from metric distances among DNA haplotypes: Application to human mitochondrial DNA
489 restriction data. Genetics, 131(2), 479-491.
490 Garritano, S., Gemignani, F., Voegele, C., Nguyen-Dumont, T., Le Calvez-Kelm, F., De Silva D.,
491 Lesueur F., Landi S., Tavtigian S.V. (2009). Determining the effectiveness of High Resolution
492 Melting analysis for SNP genotyping and mutation scanning at the TP53 locus. BMC Genet., 10,
493 5.
494 Gundry, C. N., Dobrowolski, S. F., Martin, Y. R., Robbins, T. C., Nay, L. M., Boyd, N., Teng, D.
495 H. F. (2008). Base-pair neutral homozygotes can be discriminated by calibrated high-resolution
496 melting of small amplicons. Nucleic Acids Res., 36(10), 3401-3408.
497 Hedrick, P. W. (2005). A standardized genetic differentiation measure. Evolution, 59(8), 1633-
498 1638.
499 Jost, L. (2008). GST and its relatives do not measure differentiation. Mol. Ecol., 17(18), 4015-
500 4026.
501 Jost, L., Archer, F., Flanagan, S., Gaggiotti, O., Hoban, S., & Latch, E. (2018). Differentiation
502 measures for conservation genetics. Evol. Appl., 11(7), 1139-1148.
503 Joubert, E., Joubert, M. E., Bester, C., de Beer, D., & De Lange, J. H. (2011). Honeybush
504 (Cyclopia spp.): From local cottage industry to global markets: The catalytic and supporting role
505 of research. S. Afr. J. Bot., 77(4), 887-907.
506 Kamvar, Z. N., Tabima, J. F., & Granwald, N. J. (2014). Poppr: An R package for genetic
507 analysis of populations with clonal, partially clonal, and/or sexual reproduction. PeerJ, 2, e281.
PeerJ reviewing PDF | (2019:12:43978:0:1:NEW 27 Jan 2020)
Manuscript to be reviewed.CC-BY-NC 4.0 International licenseauthor/funder. It is made available under a
The copyright holder for this preprint (which was not peer-reviewed) is the. https://doi.org/10.1101/2020.02.05.921080doi: bioRxiv preprint
508 Klopfstein, S., Currat, M., & Excoffier, L. (2006). The fate of mutations surfing on the wave of a
509 range expansion. Mol. Biol. Evol., 23(3), 482-490.
510 Lemmon, A. R., Emme, S. A., & Lemmon, E. M. (2012). Anchored hybrid enrichment for
511 massively high-throughput phylogenomics. Syst. Biol., 61(5), 727-744.
512 Levin, D. A., Francisco-Ortega, J., & Jansen, R. K. (1996). Hybridization and the extinction of
513 rare plant species. Conserv. Biol., 10(1), 10-16.
514 Li, F., Niu, B., Huang, Y., & Meng, Z. (2012). Application of high-resolution DNA melting for
515 genotyping in lepidopteran non-model species: Ostrinia furnacalis (Crambidae). PLoS One,
516 7(1), e29664.
517 Li, M., Zhou, L., Palais, R. A., & Wittwer, C. T. (2014). Genotyping accuracy of high-resolution
518 DNA melting instruments. Clin. Chem., 60(6), 864-872.
519 Liew, M., Pryor, R., Palais, R., Meadows, C., Erali, M., Lyon, E., & Wittwer, C. (2004).
520 Genotyping of single-nucleotide polymorphisms by high-resolution melting of small amplicons.
521 Clin. Chem., 50(7), 1156-1164.
522 McGregor, G. K. (2017). Industry Review: An overview of the honeybush industry. Retrieved
523 from: Department of Environmental Affairs and Development Planning, Cape Town,
524 https://www.westerncape.gov.za/eadp/files/atoms/files/eadp696_an_overview_of_the_honeybus
525 h_industry_may2017_0.pdf.
526 Motsa, M. M., Bester, C., Slabbert, M. M., Hannweg, K., & Booyse, M. (2018). Flow cytometry:
527 A quick method to determine ploidy levels in honeybush (Cyclopia spp.). Genet. Resour. Crop
528 Evol., 65(6), 1711-1724.
529 Nei, M. (1973). Analysis of gene diversity in subdivided populations. Proc. Natl. Acad. Sci.,
530 70(12), 3321-3323.
531 Niemandt, M., Roodt-Wilding, R., Tobutt, K. R., & Bester, C. (2018). Microsatellite marker
532 applications in Cyclopia (Fabaceae) species. S. Afr. J. Bot., 116, 52-60.
533 Nunziata, A., De Benedetti, L., Marchioni, I., & Cervelli, C. (2019). High throughput measure of
534 diversity in cytoplasmic and nuclear traits for unraveling geographic distribution of rosemary.
535 Ecol. Evol., 9(7), 3728-3739.
536 Potts, A. J. (2017). Genetic risk and the transition to cultivation in Cape endemic crops:The
537 example of honeybush (Cyclopia)? S. Afr. J. Bot., 110, 52-56.
538 Prevosti, A., Ocana, J., Alonso, G., Ocaa, J., & Alonso, G. (1975). Distances between
539 populations of Drosophila subobscura, based on chromosome arrangement frequencies. Theor.
540 Appl. Genet., 45(6), 231-241.
541 Radvansky, J., Bazsalovicsova, E., Kralova-Hromadova, I., Minarik, G., & Kadasi, L. (2011).
542 Development of high-resolution melting (HRM) analysis for population studies of Fascioloides
543 magna (Trematoda, Fasciolidae), the giant liver fluke of ruminants. Parasitol. Res., 108(1), 201-
544 209.
545 Reed, G. H., & Wittwer, C. T. (2004). Sensitivity and specificity of single-nucleotide
546 polymorphism scanning by high-resolution melting analysis. Clin. Chem., 50(10), 1748-1754.
547 Rousset, F. (1997). Genetic differentiation and estimation of gene flow from F-statistics under
548 isolation by distance. Genetics, 145(4), 1219-1228.
549 SANBI. (2019). Threatened Species Programme: SANBI Red List of South African Plants.
550 Retrieved from: http://redlist.sanbi.org/index.php.
PeerJ reviewing PDF | (2019:12:43978:0:1:NEW 27 Jan 2020)
Manuscript to be reviewed.CC-BY-NC 4.0 International licenseauthor/funder. It is made available under a
The copyright holder for this preprint (which was not peer-reviewed) is the. https://doi.org/10.1101/2020.02.05.921080doi: bioRxiv preprint

551 Sanger, F., Nicklen, S., & Coulson, A. R. (1977). DNA sequencing with chain-terminating
552 inhibitors. Proc. Natl. Acad. Sci. U. S. A., 74(12), 5463-5467.
553 Schaal, B. A., Hayworth, D. A., Olsen, K. M., Rauscher, J. T., & Smith, W. A. (1998).
554 Phylogeographic studies in plants: Problems and prospects. Mol. Ecol., 7(4), 465-474.
555 Schaal, B. A., Hayworth, D. A., Olsen, K. M., Rauscher, J. T., & Smith, W. A. (1998).
556 Phylogeographic studies in plants: Problems and prospects. Mol. Ecol., 7(4), 465-474.
557 Schutte, A. L. (1997). Systematics of the genus Cyclopia Vent. (Fabaceae, Podalyrieae).
558 Edinburgh J. Bot., 54(2), 125-170.
559 Shaw, J., Lickey, E. B., Beck, J. T., Farmer, S. B., Liu, W., Miller, J., & Small, R. L. (2005). The
560 tortoise and the hare II: Relative utility of 21 noncoding chloroplast DNA sequences for
561 phylogenetic analysis. Am. J. Bot., 92(1), 142-166.
562 Shaw, J., Lickey, E. B., Schilling, E. E., & Small, R. L. (2007). Comparison of whole chloroplast
563 genome sequences to choose noncoding regions for phylogenetic studies in angiosperms: The
564 tortoise and the hare III. Am. J. Bot., 94(3), 275-288.
565 Sillo, F., Giordano, L., Zampieri, E., Lione, G., De Cesare, S., & Gonthier, P. (2017). HRM
566 analysis provides insights on the reproduction mode and the population structure of
567 Gnomoniopsis castaneae in Europe. Plant Pathol., 66(2), 293-303.
568 Simko, I. (2016). High-resolution DNA melting analysis in plant research. Trends Plant Sci.,
569 21(6), 528-537.
570 Slatkin, M. (1993). Isolation by distance in equilibrium and non-equilibrium populations.
571 Evolution, 47(1), 264-279.
572 Smith, B. L., Lu, C. P., & Alvarado Bremer, J. R. (2010). High-resolution melting analysis
573 (HRMA): a highly sensitive inexpensive genotyping alternative for population studies. Mol. Ecol.
574 Resour., 10(1), 193-196.
575 Taylor, S., Scott, R., Kurtz, R., Fisher, C., Patel, V., & Bizouarn, F. (2011). A practical guide to
576 high resolution melt analysis genotyping. Retrieved from: http://www.bio-
577 rad.com/webroot/web/pdf/lsr/literature/Bulletin_6004.pdf.
578 Thompson, J. D., Higgins, D. G., & Gibson, T. J. (1994). CLUSTAL W: Improving the sensitivity
579 of progressive multiple sequence alignment through sequence weighting, position-specific gap
580 penalties and weight matrix choice. Nucleic Acids Res., 22(22), 4673-4680.
581 Tindall, E. A., Petersen, D. C., Woodbridge, P., Schipany, K., & Hayes, V. M. (2009). Assessing
582 high-resolution melt curve analysis for accurate detection of gene variants in complex DNA
583 fragments. Hum. Mutat., 30(6), 876-883.
584 Vossen, R. H., Aten, E., Roos, A., & den Dunnen, J. T. (2009). High-resolution melting analysis
585 (HRMA): More than just sequence variant screening. Hum. Mutat., 30(6), 860-866.
586 Wright, S. (1943). Isolation by distance. Genetics, 28(2), 114-138.
587 Yamagata, Y., Yoshimura, A., Anai, T., & Watanabe, S. (2018). Selection criteria for SNP loci
588 to maximize robustness of high-resolution melting analysis for plant breeding. Breed. Sci., 68(4),
589 488-498.
590
PeerJ reviewing PDF | (2019:12:43978:0:1:NEW 27 Jan 2020)
Manuscript to be reviewed.CC-BY-NC 4.0 International licenseauthor/funder. It is made available under a
The copyright holder for this preprint (which was not peer-reviewed) is the. https://doi.org/10.1101/2020.02.05.921080doi: bioRxiv preprint

Figure 1Sample distribution map
Study domain superimposed with the distribution of the CFRs fynbos biome, to whichCyclopia is endemic. Inset indicates the position of the study domain in relation to SouthAfrica and the African continent. Distribution of samples included in non-coding cpDNAhaplotype screening for HRM primer development are displayed (filled circles) in conjunctionwith the locations of the C. subternata populations included in the phylogeographic analysis(open circles).
PeerJ reviewing PDF | (2019:12:43978:0:1:NEW 27 Jan 2020)
Manuscript to be reviewed.CC-BY-NC 4.0 International licenseauthor/funder. It is made available under a
The copyright holder for this preprint (which was not peer-reviewed) is the. https://doi.org/10.1101/2020.02.05.921080doi: bioRxiv preprint

Figure 2High Resolution Melt curve examples
Melt curves and their difference curves for the PCR products amplified by three of the genusspecific primers developed. Curves are ordered in decreasing order of HRM clusteringaccuracy and the bottom curves (E,D) represents a primer pair that was excluded from HRManalysis due to poor amplification. HRM curves (A,C,E), the change in florescence associatedwith PCR product dissociation when heated, are used to detect PCR product melt domain, thearea between the red and green bars. This process was automated by the HRM software inthis study. A reference melt curve is selected and used as a baseline to plot melt curvedifferences across the melt domain, therefore difference curves (B,D,E) have different X axes.HRM clusters are automatically generated and colorised by the HRM software used. Meltcurves were generated using the primer pairs, MLT S1 - MLT S2 (A,B), MLT C3 - MLT C4 (C,D),and MLT R1 – MLT R2 (E,F).
PeerJ reviewing PDF | (2019:12:43978:0:1:NEW 27 Jan 2020)
Manuscript to be reviewed.CC-BY-NC 4.0 International licenseauthor/funder. It is made available under a
The copyright holder for this preprint (which was not peer-reviewed) is the. https://doi.org/10.1101/2020.02.05.921080doi: bioRxiv preprint

Figure 3Workflow used to developed, test, and apply HRM to the genus Cyclopia , a group ofnon-model organisms.
PeerJ reviewing PDF | (2019:12:43978:0:1:NEW 27 Jan 2020)
Manuscript to be reviewed.CC-BY-NC 4.0 International licenseauthor/funder. It is made available under a
The copyright holder for this preprint (which was not peer-reviewed) is the. https://doi.org/10.1101/2020.02.05.921080doi: bioRxiv preprint

Figure 4Summary of the sensitivity, specificity and accuracy for the regions used to testhaplotype discrimination by HRM.
PeerJ reviewing PDF | (2019:12:43978:0:1:NEW 27 Jan 2020)
Manuscript to be reviewed.CC-BY-NC 4.0 International licenseauthor/funder. It is made available under a
The copyright holder for this preprint (which was not peer-reviewed) is the. https://doi.org/10.1101/2020.02.05.921080doi: bioRxiv preprint
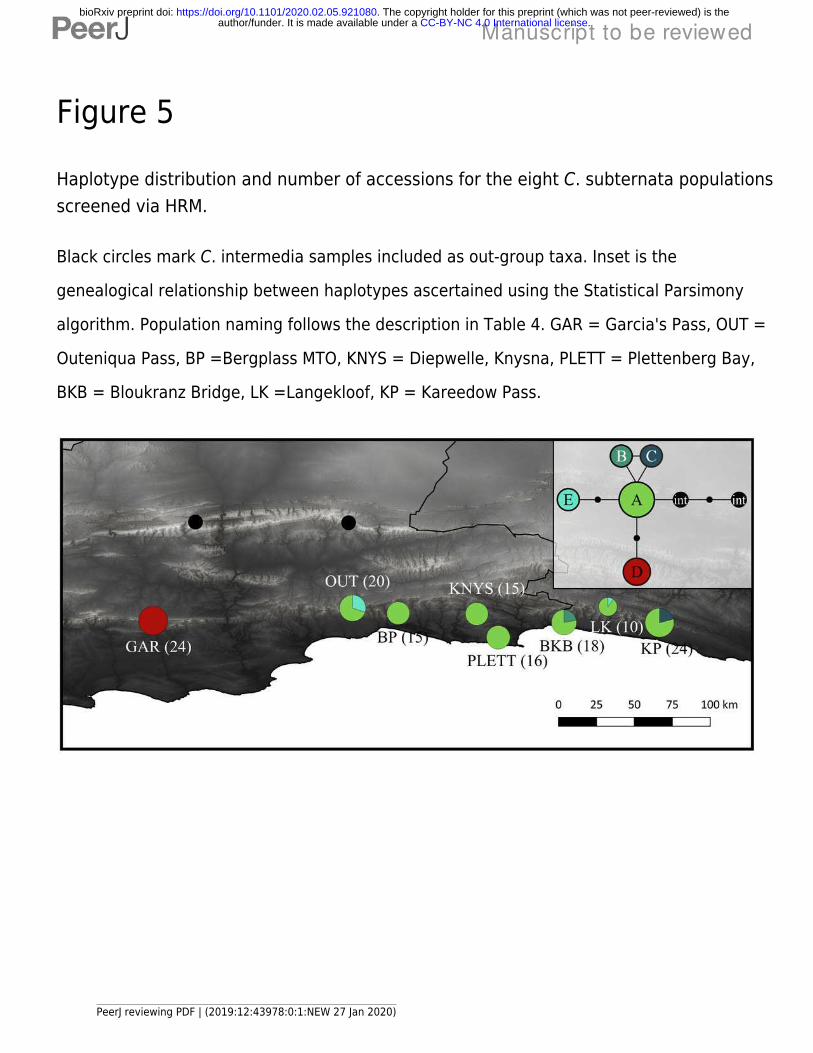
Figure 5Haplotype distribution and number of accessions for the eight C. subternata populationsscreened via HRM.
Black circles mark C. intermedia samples included as out-group taxa. Inset is thegenealogical relationship between haplotypes ascertained using the Statistical Parsimonyalgorithm. Population naming follows the description in Table 4. GAR = Garcia's Pass, OUT =Outeniqua Pass, BP =Bergplass MTO, KNYS = Diepwelle, Knysna, PLETT = Plettenberg Bay,BKB = Bloukranz Bridge, LK =Langekloof, KP = Kareedow Pass.
PeerJ reviewing PDF | (2019:12:43978:0:1:NEW 27 Jan 2020)
Manuscript to be reviewed.CC-BY-NC 4.0 International licenseauthor/funder. It is made available under a
The copyright holder for this preprint (which was not peer-reviewed) is the. https://doi.org/10.1101/2020.02.05.921080doi: bioRxiv preprint
Table 1(on next page)
<!--?xml version="1.0" encoding="UTF-8"?--> LyX Document Cyclopia specific primersdesigned for testing HRM haplotype discrimination
<!--?xml version="1.0" encoding="UTF-8"?--> LyX Document Primers used to screenhaplotype variation in wild C. subternata populations are indicated in bold. All genus-specificprimers, primer pairings and the length of the PCR product amplified are reported in TableS2.
PeerJ reviewing PDF | (2019:12:43978:0:1:NEW 27 Jan 2020)
Manuscript to be reviewed.CC-BY-NC 4.0 International licenseauthor/funder. It is made available under a
The copyright holder for this preprint (which was not peer-reviewed) is the. https://doi.org/10.1101/2020.02.05.921080doi: bioRxiv preprint

1
2
Region Primer TM ( C) GC (%) Sequence (5'→3')
TrnG intron
MLT_C1 59.1 43 ACTCCTCTTCTATTCATGGGGA
MLT_C3 61.8 41 TCAACGAACGATTCGAGGAATA
MLT_C4 61.1 45 TGCTTCAATCTCTCCTACCCAA
MLT_M1 58 43 TGTCGAGAACCCTTATACTCTCA
MLT_M2 58.7 48 TACCAAGGGTGTCTTTCGAGT
MLT_S1 64.3 50 TGGGGGTTTCAAAGCAAAGG
MLT_S2 61.5 45 ATTACAGATGAAACGGAAGGGC
MLT_S3 66.4 36 TTCCCGTTTCATTCATTCACATTCA
ndh intronMLT_U1 59.1 40 AGGTACTTCTGAATTGATCTCATCC
MLT_U2 62.2 52 GCAGTACTCCCCACAATTCCA
MLT_V1 59.9 60.0 CTCCTTCCCTAAGAGCAGCG
MLT_V2 59.2 40.0 GTTGGAATAATCTGAATTAGCCGGA
pctL-psbE intergenic spacer
atpI-atpH intergenic spacer
rpl32-trnL intergenic spacer
PeerJ reviewing PDF | (2019:12:43978:0:1:NEW 27 Jan 2020)
Manuscript to be reviewed.CC-BY-NC 4.0 International licenseauthor/funder. It is made available under a
The copyright holder for this preprint (which was not peer-reviewed) is the. https://doi.org/10.1101/2020.02.05.921080doi: bioRxiv preprint

Table 2(on next page)
Nucleotide differences and HRM clustering of Cyclopia accessions
<!--?xml version="1.0" encoding="UTF-8"?--> LyX Document Sample ID of the accessionsthat were PCR amplified in replicates of 16, the number of replicates that successfullyamplified during PCR and underwent HRM analysis (N), HRM haplotype discrimination(sensitivity, specificity and accuracy), the clustering results for each haplotype, and thenucleotide differences between haplotypes.
PeerJ reviewing PDF | (2019:12:43978:0:1:NEW 27 Jan 2020)
Manuscript to be reviewed.CC-BY-NC 4.0 International licenseauthor/funder. It is made available under a
The copyright holder for this preprint (which was not peer-reviewed) is the. https://doi.org/10.1101/2020.02.05.921080doi: bioRxiv preprint

Primer pair Sample ID N Sensit ivity Specif icity Accuracy Nucleot ide dif ference summary
1 2 3 4 5 6 7 8 9 10 11
19 20 72 205
T A T A
A CYC031 14 71 94 88 2 10 2 G T G .
B CYC132 16 69 44 52 11 4 1 . . . .
C CYC172 11 91 49 58 10 1 . . . C
D CYC239 11 73 44 50 8 1 3 . . G .
41 62
T # A
A CYC030 14 100 43 57 14 . # T
B CYC068 16 56 27 36 9 6 1 . - .
C CYC132 12 58 79 75 4 7 1 G # .
D CYC172 14 79 36 46 11 3 . # .
84 88 110 118
G G G A
A CYC082 15 93 98 97 14 1 A . . .
B CYC274 16 94 67 74 15 1 . . . .
C CYC360 14 93 98 97 1 13 . T . .
D CYC382 16 94 67 74 15 1 . . T G
75 76 117 267 281 287 382
T A - G C C T C *
A CYC031 14 100 79 83 14 . . - . T . . . -
B CYC083 10 80 100 98 8 2 . . - A . . . . -
C CYC082 14 100 79 83 14 . . - . T . . . *
D CYC430 14 86 100 98 12 2 A C # . . T G . *
E CYC360 16 100 100 100 16 . . - A . . . A -
F CYC382 14 71 100 95 10 2 2 A C - . . T G . *
# = CATAGATAACTAGTTAGTT, * = TTTTC
53 54 95
T A - G
A CYC430 12 100 100 100 12 . . - .
B CYC031 15 100 100 100 15 . . - A
C CYC360 11 100 100 100 11 A C - .
D CYC382 14 100 100 100 14 A C # .
# = TTCATAGATAACTAGTTAG
52 66 72 167
C C T C -
A CYC031 15 100 100 100 15 T . . . -
B CYC083 12 92 100 95 11 1 . . . . -
C CYC082 11 91 100 95 10 1 T . . . #
D CYC430 16 100 100 100 16 . T G . #
E CYC360 14 93 100 95 13 1 . . . A -
15 22 47 79 149 172 183 220 253 289
T T G C # C A A G T A
A CYC077 16 100 100 100 16 . . . . # . . . . . .
B CYC168 11 73 100 96 8 3 . C . A # A C G . G T
C CYC188 15 93 100 99 14 1 C . . . # . . . . . .
D CYC194 16 63 100 91 10 3 2 1 . . A . # . . . . . .
E CYC196 12 92 100 99 11 1 . . A . - . . . A . .
56 104
# T T
A CYC028 14 86 65 71 12 2 - . .
B CYC031 10 91 99 98 10 # . .
C CYC038 12 92 66 73 12 # A A
Number of t imes assigned to a haplotye cluster
MLT C1-C4(150 bp)
MLT C3-C4(236 bp)
48-55
# = AAAAATTG
MLT M1-M2(170 bp)
MLT S1-4(527 bp)
86-104
477-481
MLT S1-2(217 bp)
62-80
MLT S3-4(310 bp)
262-266
# = TTTTC
MLT U1-2(345 bp)
135-141
# = TATCCCC
MLT V1-2(340 bp)
34-38PeerJ reviewing PDF | (2019:12:43978:0:1:NEW 27 Jan 2020)
Manuscript to be reviewed.CC-BY-NC 4.0 International licenseauthor/funder. It is made available under a
The copyright holder for this preprint (which was not peer-reviewed) is the. https://doi.org/10.1101/2020.02.05.921080doi: bioRxiv preprint

Table 3(on next page)
<!--?xml version="1.0" encoding="UTF-8"?--> LyX Document Protocol for PCRamplification and subsequent HRM curve generation. Primer Tm given in Table 1.
PeerJ reviewing PDF | (2019:12:43978:0:1:NEW 27 Jan 2020)
Manuscript to be reviewed.CC-BY-NC 4.0 International licenseauthor/funder. It is made available under a
The copyright holder for this preprint (which was not peer-reviewed) is the. https://doi.org/10.1101/2020.02.05.921080doi: bioRxiv preprint

1
2
3
Process Step Temperature Time Number of Cycles
PCR Amplification
Initial Denaturing 95°C 2 min 1
Denaturing 95°C 10 sec
40Annealing/Extension + Plate Read Primers mean Tm 30 sec
Extension + Plate Read 72°C 30 sec
HRM Analysis
Heteroduplex Formation95°C 30 sec 1
60°C 1 min 1
HRM + Plate Read 10 sec/step 165–95°C
(in 0.2°C increments)
PeerJ reviewing PDF | (2019:12:43978:0:1:NEW 27 Jan 2020)
Manuscript to be reviewed.CC-BY-NC 4.0 International licenseauthor/funder. It is made available under a
The copyright holder for this preprint (which was not peer-reviewed) is the. https://doi.org/10.1101/2020.02.05.921080doi: bioRxiv preprint

Table 4(on next page)
Cyclopia subternata population locations
Cyclopia subternata populations including, <!--?xml version="1.0" encoding="UTF-8"?-->LyX Document geographic co-ordinates, number of accessions screened via HRM, andhaplpotype frequencies (as detected by HRM and verified by sequencing). Nucleotidedifferences among haplotypes are provided in Table S3.
PeerJ reviewing PDF | (2019:12:43978:0:1:NEW 27 Jan 2020)
Manuscript to be reviewed.CC-BY-NC 4.0 International licenseauthor/funder. It is made available under a
The copyright holder for this preprint (which was not peer-reviewed) is the. https://doi.org/10.1101/2020.02.05.921080doi: bioRxiv preprint

1
2
3
4Population
Co-ordinatesN
Haplotype
S E A B C D E
Garcia's pass (GAR) -33.96 21.22 24 - - - 24 -
Outeniqua Pass (OUT) -33.88 22.40 20 14 - - - 6
Bergplaas MTO (BP) -33.91 22.67 15 15 - - - -
Diepwelle, Knysna (KNYS) -33.92 23.14 15 15 - - - -
Plettenberg bay (PLETT) -34.06 23.26 16 16 - - - -
Bloukranz Bridge (BKB) -33.97 23.65 18 14 - 4 - -
Langekloof (LK) -33.87 23.91 10 9 - - - 1
Kareedow pass (KP) -33.97 24.22 24 19 5 - - -
PeerJ reviewing PDF | (2019:12:43978:0:1:NEW 27 Jan 2020)
Manuscript to be reviewed.CC-BY-NC 4.0 International licenseauthor/funder. It is made available under a
The copyright holder for this preprint (which was not peer-reviewed) is the. https://doi.org/10.1101/2020.02.05.921080doi: bioRxiv preprint

Table 5(on next page)
Nucleotide varition not differentiated by HRM
PeerJ reviewing PDF | (2019:12:43978:0:1:NEW 27 Jan 2020)
Manuscript to be reviewed.CC-BY-NC 4.0 International licenseauthor/funder. It is made available under a
The copyright holder for this preprint (which was not peer-reviewed) is the. https://doi.org/10.1101/2020.02.05.921080doi: bioRxiv preprint

1
2
3
4
5 Primers Haplotypes Nucleot ide dif ference Specif icity
MLT C1-C4
C-D T ↔ G & C ↔ A 18
B-C A ↔ C 20
B-D T ↔ G 29
A-C GT ↔ TA, G ↔ T & T ↔ A 88
A-D G ↔ T & T ↔ A 88
A-B GT ↔ TA & G ↔ T 93
MLT C3-C4
A-D T ↔ A 11
A-B 8 bp indel & T ↔ A 22
B-D 8 bp indel 33
B-C T ↔ G & 8 bp indel 65
C-D G ↔ T 73
A-C T ↔ G & T ↔ A 83
MLT M1-M2A-C G ↔ T & A ↔ G 6
B-D A ↔ G & G ↔ T 93
MLT S1-S3 A-C 5 bp indel 0
MLT V1-V2
A-C 6bp indel, T ↔ A & T ↔ A 11
A-D 6bp indel & T ↔ A 93
C-D A ↔ T 96
PeerJ reviewing PDF | (2019:12:43978:0:1:NEW 27 Jan 2020)
Manuscript to be reviewed.CC-BY-NC 4.0 International licenseauthor/funder. It is made available under a
The copyright holder for this preprint (which was not peer-reviewed) is the. https://doi.org/10.1101/2020.02.05.921080doi: bioRxiv preprint

Important declarations
Please remove this info from manuscript text if it is also present there.
Associated Data
New DNA/RNA/peptide etc. sequences were reported.Sequences supplied by author here:The sequences for the non-coding chloroplast regions described here are available via GenBankaccession numbers MN879573 - MN879581, MN883511 - MN883531, and MN930746 - MN930802.
Data supplied by the author:Haplotype clustering data used to determine the accuracy of High Resolution Melt analysis is availableat Figshare (10.6084/m9.figshare.11370444) and the sample to haplotype assignment of accessionsincluded in the phylogeographic analysis is available at Figshare (10.6084/m9.figshare.11370465).
Required StatementsCompeting Interest statement:Alastair J. Potts is an Academic Editor for PeerJ.Funding statement:This work was supported by the National Research Fund of South Africa (Grant No. 99034, 95992,114687) and the Table Mountain Fund (Grant no. TM2499).
.CC-BY-NC 4.0 International licenseauthor/funder. It is made available under aThe copyright holder for this preprint (which was not peer-reviewed) is the. https://doi.org/10.1101/2020.02.05.921080doi: bioRxiv preprint
Related Documents