APPLICATION OF GIS IN ECOTOURISM DEVELOPMENT: A CASE STUDY IN SUNDARBANS, BANGLADESH A Masters Thesis Presented to Mid-Sweden University In Partial Fulfillment Of the Requirements for the Degree Master of Arts, Human Geography Focusing on Tourism By Md. Azizur Rahman June 2010

Welcome message from author
This document is posted to help you gain knowledge. Please leave a comment to let me know what you think about it! Share it to your friends and learn new things together.
Transcript

APPLICATION OF GIS IN ECOTOURISM DEVELOPMENT:
A CASE STUDY IN SUNDARBANS, BANGLADESH
A Masters Thesis
Presented to
Mid-Sweden University
In Partial Fulfillment
Of the Requirements for the Degree
Master of Arts, Human Geography Focusing on Tourism
By
Md. Azizur Rahman June 2010

ii
Copyright 2010 by Md. Azizur Rahman

APPLICATION OF GIS IN ECOTOURISM DEVELOPMENT: A CASE STUDY
IN SUNDARBANS, BANGLADESH
Department of Social Science
Mid-Sweden University, June 2010
Master of Arts
Md. Azizur Rahman
ABSTRACT GIS can be used in tourism as a decision supporting tool for sustainable tourism
planning, impact assessment, visitor flow management, and tourism site selection. Therefore, the potential for GIS applications in tourism is significant. The purpose of the study was fixed to explore the potential of using GIS for planning resources pertinent to ecotourism development. The study investigated a case study in Sundarbans which is the largest mangrove forest region of the world, located in the southern part of Bangladesh and the Indian region of west Bengal. However, the current study considered only the Bangladesh part of Sundarbans for study and prepared ecotourism planning for this region. The Sundarbans plays an important role for the national economy of Bangladesh because of its natural resources and tourism activities. Moreover, this forest has been facing some problems due to unplanned development and tourism activities. The ultimate result of unplanned development is land use change, increasing deforestation, biodiversity losses and decreasing upstream flows. Therefore, the study considered this mangrove for ecotourism planning and development and GIS used as decision supporting tools. Moreover, this study tried to find some answers from the research questions. Tourism is a phenomenon, which often highlights that lack of planning and management in terms of environmental concern. For ecotourism planning this thesis quantifies land use change in the Sundarbans over 33 years (1977-2010) using Landsat TM, ETM & MSS satellite imagery and prepared vector maps based on LGED map for ecotourism mapping in Sundarbans, GIS assist in this process. The study found that, the land use of Sundarbans changed over the study period and the density of forest declined at the same time. However, the change occurred because of various human activities and climate change effects. Tourism has a little bit of contribution in the periphery area for this change but tourism has not yet been considered responsible for these effects largely as it is at a very early stage. This research proposed for community development and involvement for local people as a part of hospitality services in ecotourism industries in this region because they can assist tourists according to their experience as guides in the forest. Moreover, they can be employed in the service industries operating or accompanying jungle boat trips and wilderness trails and assisting in transport operation. For ecosystem protection in Sundarbans this study proposed a 300 meters buffer zone around the sanctuaries. Finally, this study proposed an outline for ecotourism planning in the Bangladesh part of Sundarbans where GIS assist in the planning process. KEY WORDS: Ecotourism, planning, GIS, land use change, Sundarbans, Bangladesh
iii

APPLICATION OF GIS IN ECOTOURISM DEVELOPMENT: A CASE STUDY
IN SUNDARBANS, BANGLADESH
By
Md. Azizur Rahman
A Masters Thesis Submitted to MIUN
For the degree of Master of Arts, Human Geography Focusing on Tourism
June 2010
Approved:
Advisor Prof. Dr. Dimitri loannides
Examiner Prof. Dr. Robert Pettersson
iv

ACKNOWLEDGEMENTS
I would like to thank the following people for their support during the course of my graduate studies; my supervisor, Dimitri Ioannides for his effective guidance from proposal writing to the end of this research, all teachers and staffs of the tourism department for supporting me during study period and my friends for their help to improving the final thesis.
DEDICATED TO: MY PARENTS
v

TABLE OF CONTENTS
1 Introduction……………………………………………………………………… 1 1.1 Background……………………………………………………………….. 1 1.2 Scope of this research……………………………………………………... 2 1.3 Research problem…………………………………………………………. 3 1.4 Research objective………………………………………………………… 4 1.5 Research questions…...……………………………………………….….... 5 1.6 Data, Software and Materials……………………………………………… 5 1.7 Method used…………………………………………………………..…… 6 1.7.1 Introduction…………………………………………………....... 6 1.7.2 Research stages………………………………………………….. 6 1.7.2.1 Preparation stage………………………………………. 7 1.7.2.2 Processing and description stage………………………. 7 1.7.2.3 Mapping, analysis and evolution stage………………... 7 1.7.2.4 Reporting stage………………………………………… 8 2 Review of literature and conceptual background……………………………… 9 2.1 GIS application in tourism………………………………………………… 9 2.1.1 GIS application in tourism planning…………………………….. 10 2.1.2 Applications of GIS in ecotourism planning……………………. 11 2.1.3 Application of GIS in tourism service management…………….. 12 2.1.4 GIS Applications in tourism resource inventories………………. 13 2.1.5 GIS application to location suitability under conflicting demands 14 2.1.6 Monitor and control tourism activities…………………………... 14 2.1.7 Application of GIS in tourism marketing………………………... 15 2.1.8 Use of GIS in visual impact analysis in tourism research……….. 15 2.1.9 Use of GIS community involvement and participation in tourism
research…………………………………………………………..
16 2.1.10 GIS uses as a decision supporting tools in tourism research…….. 17 2.2 Conceptual background of Geographical Information System (GIS)……... 18 2.2.1 Basic concept of GIS…………………………………………….. 18 2.2.2 Definitions of GIS……………………………………………….. 19 2.2.3 Capacity of GIS………………………………………………….. 20 3 Study area description ………………………………………………………… 23 3.1 Introduction………………………………………………………………... 23 3.2 Geographical location……………………………………………………... 25 3.3 Physical feature……………………………………………………………. 25 3.4 Climate…………………………………………………………………….. 26 3.4.1 Temperature……………………………………………………... 27 3.4.2 Rainfall…………………………………………………………... 27 3.4.3 Wind……………………………………………………………... 28 3.4.4 Hydrology and Salinity………………………………………….. 29 3.5 Biodiversity………………………………………………………………... 29
vi
3.6 Local human population…………………………………………………... 31 3.7 Cultural heritage…………………………………………………………... 32 3.8 Conservation value………………………………………………………... 32 3.9 Management……………………………………………………………….. 33 3.10 Present situation of tourism in Sundarbans…………………………….. 34 3.11 Existing tourism facilities and lacking of facilities in Sundarbans…….. 35 4 Research methods ……………………………………………………………… 38 4.1 Data collection…………………………………………………………….. 38 4.2 Digital Image classification……………………………………………….. 38 4.2.1 Preprocessing of raw satellite images…………………………… 39 4.2.2 Image Enhancement 39 4.2.3 Image Classification and Analysis 39 4.2.3.1 The Normalized Differential Vegetation Index (NDVI) 40 4.2.3.2 Maximum likelihood classification 42 4.3 Accuracy assessment 43 4.4 Ecotourism planning 44 5 Data analysis and ecotourism planning………………………………………… 46 5.1 Land use changes in Sundarbans…………………………………………. 46 5.1.1 Maximum likelihood classification result……………………….. 46 5.1.2 Maximum likelihood classification result comparisons…………. 50 5.1.3 Normalized Differential Vegetation Index (NDVI)……………... 51 5.1.4 Normalized Differential Vegetation Index (NDVI) comparisons.. 51 5.2 Causes of land use change in Sundarbans………………………………... 52 5.3 Ecotourism and land use change in Sundarbans………………………….. 54 5.4 Ecotourism planning………………………………………………………. 54 5.4.1 Various issues of ecotourism planning…………………………... 55 5.4.2 Ecotourism planning in Sundarbans……………………………... 56 5.4.3 Proposed plan for ecotourism development in Sundarbans……... 60 5.4.3.1 Ecosystem protection………………………………….. 61 5.4.3.2 Monitoring tourism effect……………………………... 61 5.4.3.3 Tourism facilities Development……………………….. 61 5.4.3.4 Government and nongovernmental cooperation ……… 62 5.4.3.5 Community involvement………………………………. 62 5.4.3.6 Tourism marketing…………………………………….. 63 6 Conclusions and recommendations…………………………………………….. 64 6.1 Conclusion……………………………………………………………… 64 6.2 Recommendations…………………………………………………………. 65 6.3 Study limitations and future research scope………………………………. 67 References……………………………………………………………………… 68 Appendices……………………………………………………………………... 73 Appendix A. The location map of Bangladesh……………………………. 73 Appendix B. The total number of visitors in recent in years in Sundarbans,
vii

Bangladesh………………………………………………………………… 73 Appendix C. Statistics of damaged forest areas caused by cyclone Sidr in
2007…………………………………………………………..
74 Appendix D. Satellite image analysis error matrix………………………... 74 Appendix E. Landsat TM & MSS bands characteristics………………….. 76 Appendix F. Proposed ecotourism infrastructure development area……… 77 Appendix G. Sundarbans wildlife sanctuaries…………………………….. 78 Appendix H. Tourist map of Bangladesh………………………………….. 79
viii
LIST OF TABLES
Table 1 Data uses in this research………………………………………………... 6 Table 2 Software uses in this research…………………………………………… 6 Table 3 Definition of GIS………………………………………………………… 20 Table 4 Capacity of GIS………………………………………………………….. 21 Table 5 Common tourism-related issues and GIS applications………………….. 22 Table 6 Total biodiversity recorded to date from in Sundarbans
mangroves………………………………………………………………..
31 Table 7 Tourism attractions of Sundarbans, Bangladesh………………………… 36 Table 8 Statistics of changes in areas (hectares) of forest cover classes between
the years 1989-2010……………………………………………………...
50
ix

LIST OF FIGURES Figure 1 Flowchart of the research methodology…………………………………. 7 Figure 2 Conceptual role of tourism knowledge system………………………….. 18 Figure 3 GIS is an integrating technology………………………………………… 19 Figure 4 Geographic referencing/coordinate systems…………………………….. 19 Figure 5 Satellite map of Sundarbans…………………………………………….. 23 Figure 6 Location map of Sundarbans, Bangladesh……………………………. 24 Figure 7 Physical features of Sundarbans, Bangladesh…………………………… 26 Figure 8 The average minimum and maximum temperature in Sundarbans……… 27 Figure 9 Monthly average precipitation amounts in Sundarbans…………………. 28 Figure 10 Monthly average maximum wind speeds in Sundarbans………………... 29 Figure 11 Salinity zones of Sundarbans, Bangladesh………………………………. 30 Figure 12 The biodiversity of Sundarbans………………………………………….. 33 Figure 13 The number of visitors in Sundarbans, Bangladesh……………………... 34 Figure 14 Visitor and seasonality in Sundarbans…………………………………... 35 Figure 15 Schematic diagram of the image classification………………………….. 41 Figure 16 NDVI is calculated from the visible and near-infrared light reflected by
vegetation………………………………………………………………...
42 Figure 17 Methodology of Ecotourism planning in Sundarbans…………………… 45 Figure 18 Land use map of Sundarbans, 1989…………………………………….. 47 Figure 19 Land use of Sundarbans in 1989………………………………………… 47 Figure 20 Land use map of Sundarbans, 2000…………………………………….. 48 Figure 21 Land use of Sundarbans in 2000………………………………………… 48 Figure 22 Land use map of Sundarbans, 2010…………………………………….. 49 Figure 23 Land use of Sundarbans in 2010………………………………………… 49 Figure 24 Land use changes of Sundarbans between 1989-2010………………….. 50 Figure 25 Vegetation density map of Sundarbans between 1977-2010……………. 52 Figure 26 Causes of changes of Sundarbans mangrove forest……………………... 53 Figure 27 Administrative information map of Sundarbans………………………… 57 Figure 28 Accessibility map of Sundarbans………………………………………... 58 Figure 29 Land use map of Sundarbans……………………………………………. 58 Figure 30 Existing facilities map of Sundarbans…………………………………… 59 Figure 31 Ecotourism map of Sundarbans………………………….......................... 59 Figure 32 Major components of tourism planning in Sundarbans…………………. 60
x

Application of GIS in Ecotourism Development: A case study in Sundarbans, Bangladesh
1
CHAPTER 1
1. INTRODUCTION
This chapter describes the overall backgrounds of the study, objectives, research
question, scope of the study, data and software used and research methods.
1.1 Background
For the sustainable development of a region, it is important to consider the interest
of its local population. In terms of tourism development recently, researchers have begun
to examine how local residents can be involved in tourism activities and get benefits from
these. Due to the development of alternative forms of tourism these activities have begun
attracting the interest of governments, communities and researchers. However,
environmental conservation plays an important role in ecotourism development. ‘Many
scholars now agree that ecotourism should require a two-way link between tourism and
environmental conservation’ (Ryngnga, 2008, p. 50). So, tourism needs to be developed
in a planned way and Geographical Information System (GIS) can assist as a decision
support system with this planning process.
GIS integrates hardware, software, and data for capturing, managing, analyzing,
and displaying all forms of geographically referenced information (Environmental
Systems Research Institute [ESRI], 2010). It has a wide range of uses. For instance, GIS
has been adopted as a useful tool by a wide range of activities such as environmental
planning, property management, infrastructure setting, emergence planning, automobile
navigation systems, urban studies, market analyses, and business demographics (Chen,
2007). It can also be used to determine the best site for a newly built tourist destination.
The application of GIS is limited in tourism but recently it has been used for park
management, facility monitoring, visual resource assessment, and identifying suitable
areas for developing tourism activities.
GIS also can be a valuable tool for investigating specific questions that pertain to
tourism development including location, condition of the area, trends and changes,
routing to and through the site, and patterns associated with resource use (Dye & Shaw,
2007). However, ‘currently no tourism research has taken a GIS approach to address land

Application of GIS in Ecotourism Development: A case study in Sundarbans, Bangladesh
use and land use change at the parcel level’ (Allen and Potts, 2002, p. 288). Nevertheless,
it has a strong relationship between tourism development and land use change.
The benefits of using GIS can be summarized in three ways (Wang & Stauffer,
1996) as follows:
GIS helps to portray characteristics of the earth and monitor changes of the
environment in space and time;
GIS helps to deeply understand the meaning of spatial information and how that
information can more faithfully reflect the true nature of spatially distributed
processes;
GIS helps to model alternatives of actions and process operating in the
environment to anticipate possible results of planning decisions and to aid in
making better decisions.
Moreover, by using this technology it is also possible to service management,
visitor flow management, facility inventory and resource use management and assessing
impacts of tourism development.
1.2 Scope of this research
The use of Remote Sensing (RS) and GIS can certainly play an important role in
ecotourism planning. In general, these geospatial technologies provide efficient tools to
store manipulate and analyze a great variety of spatial data. More specifically, it can be
used to map out land covers and habitats, monitor landscape changes, model species
distribution and predict suitable habitats for different species. The availability of high
resolution satellite imagery like IKONOS and Quickbird makes it easy to provide more
detailed spatial information. These systems have been used for various applications and
functions including: mapping of mangroves and wetlands tree species identification
monitoring of natural vegetation studies of forest degradation and country park
monitoring and management. These data certainly enhances the spatial database with
more detailed and updated spatial information for management and planning (Fung &
Wong, 2007).
Thus, nowadays because of impressive technological developments it is almost
impossible to make a quick and suitable planning decision without utilizing support of
2
Application of GIS in Ecotourism Development: A case study in Sundarbans, Bangladesh
any technology. GIS can assist in a huge range of applications including ecotourism
because of its large capacity. This technology uses spatial and non spatial data for making
a quick decision a fact which is also important in sustainable ecotourism development.
Ecotourism itself is meant to be a sustainable form of natural resource-based
tourism. It focuses primarily on experiencing and learning about nature, its landscape,
flora, fauna and their habitats, as well as cultural artifacts from the locality. A symbiotic
and complex relationship between the environment and tourist activities is possible when
this philosophy can be translated into appropriate policy, careful planning and tactful
practicum. So, simply GIS can help transfer recommendations for ecotourism
development into an effective planning action for future sustainable development (Fung
& Wong, 2007).
The major importance of this research is to demonstrate the use of GIS in
ecotourism planning. It will examine a case study where it will discuss how to plan the
Sundarbans regions in Bangladesh by using GIS technology for the future development
of ecotourism.
1.3 Research problem
Decision-making in tourism development and planning is becoming increasingly
complex because of the interrelationship with various phenomenon including local
people, stakeholders, local culture and natural environment. Cost-benefit plays an
important role to developing tourism in a sustainable manner. GIS can be considered as a
toolbox that provides techniques and technologies to achieve sustainable tourism
development (Bahaire & White, 1999). GIS is considered as a set of powerful tools to
process spatially referenced data and this spatial data can be used to identify conflict,
analyse impacts over time and find a suitable solution for a specific problem. Tourism
activities generally can create various negative effects on surroundings. Impact
assessment and simulation are increasingly important in tourism development and GIS
can play a role in auditing environmental conditions, examining the suitability of
locations for proposed developments site, identifying conflicting interests and modeling
relationships (Bahaire & White, 1999). We need to use GIS in ecotourism development
for some specific reasons such as follows:
3

Application of GIS in Ecotourism Development: A case study in Sundarbans, Bangladesh
It can organize structured information about Ecotourism to planners and
developers;
We can use it to utilize and find locational suitability under conflicting demands;
It can facilitate monitoring and controlling of ecotourism activities;
It identifies how stakeholders can become responsible for ecotourism marketing;
It analyzes different aspects of community involvement and participation time
space management and visual impact;
It can be also used to analyze the characteristics of potential customers;
This current research will be based on a case study of Sundarbans which is the
largest mangrove forest region of the world located in the southern part of Bangladesh
and the Indian region of west Bengal. This forest plays an important role for the national
economy of Bangladesh because of its natural resources and tourism activities. Moreover,
it has been recognized globally for its importance as a reservoir of biodiversity. However,
it has been facing some problems due to unplanned development and tourism activities.
These problems can be described as follows:
Increasing deforestation;
Biodiversity losses;
Decreasing upstream flows;
Thus, it is very important to develop Sundarbans in combination with a clear-cut
planning effort. To plan Sundarbans and hopefully, encourage the development of
tourism in a manner that meets the tenets of sustainable development it is imperative to
utilize GIS technology. Additionally, we can use GIS as a decision supporting tool for
identifying problems and preparing systematic solutions.
1.4 Research Objective
The main purpose of the study is to explore the potential of using GIS and Remote
Sensing for planning resources pertinent to ecotourism development in Sundarbans
Bangladesh. Built on that, the study will be guided by the following specific objectives:
1. Describe the use of GIS & RS in ecotourism planning;
4

Application of GIS in Ecotourism Development: A case study in Sundarbans, Bangladesh
2. Identify land use change over the last 33 years using satellite data, (Landsat
Thematic Mapper (TM) & Enhanced Thematic Mapper (ETM) since 1977-2010)
in the Sundarbans mangrove Bangladesh;
3. Plan Sundarbans by using GIS technique to protect biodiversity and ecotourism
development.
1.5 Research Question
The following research questions need to be addressed in achieving the above
mentioned objectives.
What is the importance of GIS in ecotourism planning?
How are local people involved in the planning process?
How is it possible to plan for Sundarbans including its 2 million existing
residents?
What is the present land use and land cover in the study area?
Which major land use and land cover types have changed in the area between
1977 and 2010?
What is the relationship between tourism and land use change?
Which factors are more responsible in terms of creating this change?
1.6 Data, Software and Materials
Two important and relevant sets of data (Table 1) will be used in this research.
Landsat satellite images from 1977 to 2010 will be used for land use classification and
Local Government Engineering and Development (LGED), vector maps will be used as
reference map when digital image classified. Moreover, image processing and GIS
software (Table 2) should used to create database, simple statistic analysis, and image
processing.
5
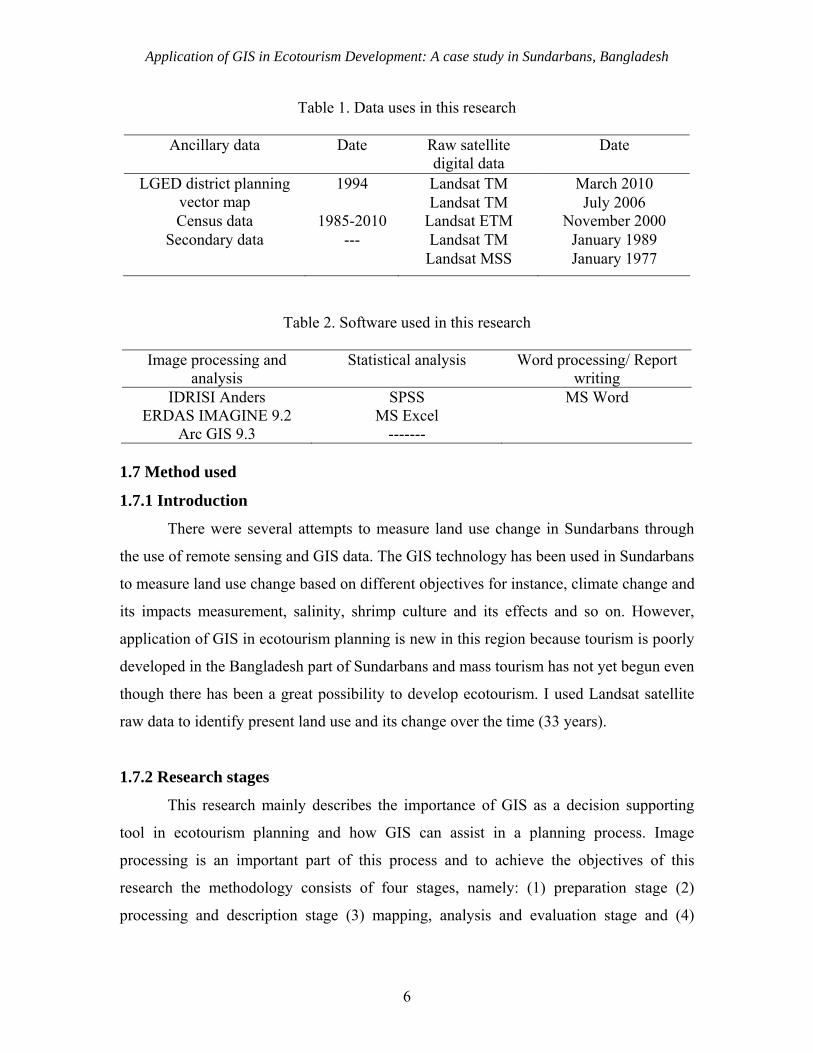
Application of GIS in Ecotourism Development: A case study in Sundarbans, Bangladesh
Table 1. Data uses in this research
Ancillary data Date Raw satellite
digital data Date
1994 Landsat TM March 2010 LGED district planning vector map Landsat TM July 2006 Census data 1985-2010 Landsat ETM November 2000
Secondary data --- Landsat TM January 1989 Landsat MSS January 1977
Table 2. Software used in this research
Image processing and analysis
Statistical analysis Word processing/ Report writing
IDRISI Anders SPSS MS Word ERDAS IMAGINE 9.2 MS Excel
Arc GIS 9.3 ------- 1.7 Method used
1.7.1 Introduction
There were several attempts to measure land use change in Sundarbans through
the use of remote sensing and GIS data. The GIS technology has been used in Sundarbans
to measure land use change based on different objectives for instance, climate change and
its impacts measurement, salinity, shrimp culture and its effects and so on. However,
application of GIS in ecotourism planning is new in this region because tourism is poorly
developed in the Bangladesh part of Sundarbans and mass tourism has not yet begun even
though there has been a great possibility to develop ecotourism. I used Landsat satellite
raw data to identify present land use and its change over the time (33 years).
1.7.2 Research stages
This research mainly describes the importance of GIS as a decision supporting
tool in ecotourism planning and how GIS can assist in a planning process. Image
processing is an important part of this process and to achieve the objectives of this
research the methodology consists of four stages, namely: (1) preparation stage (2)
processing and description stage (3) mapping, analysis and evaluation stage and (4)
6

Application of GIS in Ecotourism Development: A case study in Sundarbans, Bangladesh
reporting stage (Figure 1 presents the flow chart of the methodology which is
implemented in this research).
1.7.2.1 Preparation stage: After findings the study problems, the related literature was
reviewed, followed by the collection of necessary satellite images and LGED vector map
of Sundarbans. This stage has been completed in computer lab in Mid Sweden University
(MIUN) Sweden, also used personal computer and software to assist this research.
LGED Vector Map Landsat Satellite ImagesLiterature review
Preparation Stage
Processing and Description Stage
Mapping Analysis and Evolutions Stage
Geometric Correction Image Processing Identifying Land use Change
Mapping Land use Change Measure Accuracy Assessment
Reporting Stages
Figure 1. Flowchart of the research methodology 1.7.2.2 Processing and description stage: This stage included all the stages related to
satellite image processing, including geometric correction, features extraction, geo-
processing, resampling, and image filtering of raw satellite images. Finally image
classification will be performed to identify land use changes.
1.7.2.3 Mapping, analysis and evaluation stage: On this stage vector maps are
prepared by the Arc view 3.2a and Arc GIS 9.3 software and digital images processing,
7

Application of GIS in Ecotourism Development: A case study in Sundarbans, Bangladesh
accuracy assessments and data analysis performed by the ERDAS IMAGINE 9.2 and
EDRISI Andes image processing software.
1.7.2.4 Reporting stage: This is the final stage of this research and this stage prepares
final report, maps and diagramed for final result of this thesis.
8

Application of GIS in Ecotourism Development: A case study in Sundarbans, Bangladesh
9
CHAPTER 2
2. REVIEW OF LITERATURE AND CONCEPTUAL BACKGROUND
This chapter provides brief descriptions of the review of literature and the
applications of GIS in tourism planning. Moreover, the conceptual background of GIS
has also been illustrated in this chapter.
2.1 GIS application in tourism
The application of GIS in tourism research has been minimal though GIS
technology has been discussed in the tourism literature for over a decade (Gunn and
Larsen, 1988). This technology has been used in tourism research including that which
relates to ecotourism planning, visual resource assessment and management, recreation
and park management, facility monitoring, suitable location identification. Additionally
and very recently, analysts have begun using GIS in a limited fashion in applications
relating to tourism marketing. Although, GIS has only a recent and limited use in leisure
and tourism research, it has already achieved a good reputation in this research. Mainly,
this technology uses tourism research to drive specific benefits as a supporting tool of
decision making process. The benefit of using GIS in tourism and leisure research is that
GIS has the ability to manipulate both data, spatial and attributes. Moreover, it has
provided necessary value added information (Bahaire and White, 1999). It can minimize
conflict in the case of allocating resources between what are often conflicting demands to
identify, needs and data change over time, and their ability to identify patterns or
relationships based on particular criteria and support in this way of decision-making.
Moreover, GIS can be used to provide a more holistic approach towards problem
solving in which qualitative and quantitative information has to be processed. Generally,
this technology is used for collecting spatial information, storage, analysis, and display of
results in the form of graphs or maps which are more effective to be understood by users.
It is also used to promote participation at decision-making level. An integration of RS
and GIS can also play an important role in ecotourism planning because this technology
is considered to act as effective tools for storing, manipulating and analyzing a great

Application of GIS in Ecotourism Development: A case study in Sundarbans, Bangladesh
variety of spatial data. More specifically, ‘GIS can be used to map out land covers and
habitats’ ‘monitor landscape changes’ ‘model species distribution’ and ‘predict suitable
habitats for different species’ (Fung & Wong, 2007, P. 88).
Points, lines and polygons are three important elements which are used to
represent spatial information and these three terms are often used in GIS to represent
spatial data. In tourism research GIS is used to characterize tourism destinations by using
points, lines and polygons especially different landscape. Point features represent
individual tourist attractions, for example, a campground in a park, or a historic site along
the highway. Coastal beaches and resorts often follow a linear pattern, while big theme
parks or natural parks are characteristics of a polygon feature (Giles, 2003).
However, due to the lack of budget and lack of proper databases these technology
applications in ecotourism are limited. For instance, there is very little site-specific
information about sources of visitors origin and destination, travel motivation, spatial
patterns of recreation and tourism use, visitor expenditure patterns, levels of use and
impacts, and suitability of sites for recreation/tourism development - all of which are
suitable application areas of GIS. Therefore, GIS application in ecotourism development
has been limited to tourism-based land management, recreational facility inventory,
visitor impact assessment, recreation-wildlife conflicts, mapping wilderness perceptions,
tourism information management system and decision support systems (Giles, 2003).
2.1.1 GIS application in tourism planning
‘The use of GIS in regional tourism planning is illustrated by Culbertson et al.
(1994) in the case of Banff, Canada and Colorado, USA. Culbertson et al. (1994) note the
great potential for GIS technology in planning for sustainable development, as an
extension of its traditional use in environmental analysis. Berry (1991) provides an early
illustration of the utility of this kind of map analysis in the US Virgin Islands’ (Bahaire &
Elliot-White, 1999, p. 163).
Site selection, is also an important use of GIS in tourism planning. For instance,
by using suitable location identification tools and topology it is simply possible to
identify potential areas for further tourism development. These tools are also used to
10
Application of GIS in Ecotourism Development: A case study in Sundarbans, Bangladesh
define conservation and recreation areas, facility monitoring, and visitor management and
so on. Best locations have been determined according to engineering, aesthetics, and
environmental constraints. Similarly, Boyd and Butler (1996) demonstrated how GIS was
used to identify areas suitable for ecotourism in Northern Ontario. Williams et al. (1996)
also used GIS to record and analyze tourism resource inventory information in British
Columbia.
Bahaire and Elliott-White (1999) has provided a brief description of various
applications of GIS in tourism planning in the United Kingdom. These applications
included data integration and management (for example data on tourism destination types
and accommodation), landscape resource inventory, designation of tourist areas in terms
of use levels, tourism suitability analysis, and pre- and post-tourism visual impact
analysis. The capability of a GIS to allow rapid modification, addition or removal of
constraints and to investigate the complex interrelations between the thematic layers is
attractive for resource management and planning problems (Beedasy & Whyatt, 1999).
Farsari and Prastacos, (2004) mentioned some practical opportunities for using
GIS in tourism planning. For instance, these are related to visitor flow management,
facility inventory and resource use, assessing impacts of tourism development, and
retailed management related to tourism. They described that GIS can identify principal
tourist activity spaces within a destination and the flows among destinations and
authorities may implement strategic plans for superior infrastructure. Moreover, this
technology can be used to minimize conflict in terms of resource management because
unbalanced tourism development for a region is not a good sign if tourism development
may not benefit all segments of society equally. However, GIS can be used to
demonstrate tourism impacts on various industrial sectors in a time-series and spatial
format (Chen, 2006).
2.1.2 Application of GIS in ecotourism planning
Boyd and Butler (1996) demonstrate the application of GIS in the identification of
areas suitable for ecotourism in Northern Ontario, Canada; in particular natural areas,
containing rare or endangered species or habitats in remote/peripheral areas. Basically
they produce an inventory of various characteristics associated with natural landscapes.
11
Application of GIS in Ecotourism Development: A case study in Sundarbans, Bangladesh
GIS was used for inventory mapping, buffering (identifying areas of human intrusion)
and overlays mapping (Bahaire & White, 1999, p. 163). GIS used for identifying location
suitability and resource inventories according to environmental concern. Ecotourism
development is a very sensitive issue in a particular destination in terms of complex
ecosystem and local population habits. To identify untouched areas GIS can play an
important role. By analyzing satellite images it is possible to identify complex areas
inside the deep forest or trained mountain region even in the deep ocean where a general
survey method is almost impossible. Impact analysis is related to this application as GIS
can be used to evaluate potential impact of tourism development on the natural
environment (Bahaire & White, 1999).
In ecotourism planning the first issue that emerges is the environment and its
conservation. An ecotourism destination must in no way be developed without planning
in terms of environmental concern. Referring to the Gray rocks reservoir in Wyoming
US, for example Gribb (1991) described a planning endeavor where the aim was to come
up with a recreation development plan that would contribute at the same time to
environmental conservation of the reservoir.
2.1.3 Application of GIS in tourism service management
The use of GIS has a potentiality in tourism service management especially
tourism business related shopping center. It can be used for displaying large volumes of
diverse data. In the United Kingdom (UK) for instance, fifty-three percent of the major
retailers had adopted GIS by 1998 (Hernadez et al., 1999). Brick and mortar businesses
can use GIS applications to compete with the convenience of Internet retailing (Chen,
2007). To an extent the idea, Chen, (2007) has provided some good examples relating to
uses of GIS in service management. According to her opinion, ‘a retailer can develop a
map of its store using GIS software to calculate the actual dimensions of a store. This can
even handle multilevel stores and shelf depths. When a retailer has the store mapped, a
consumer can view the map on a live website, and know the exact location of the item
within the store. While using the virtual map, the consumer can see how many items are
in stock, detailed information about the product, and any associated items that are on sale
or available for purchase’.
12
Application of GIS in Ecotourism Development: A case study in Sundarbans, Bangladesh
The smart card is another important use of GIS in service management. This card
is considered a computer-enhanced shopping cart and it is designed with a map or
database of the store in which a customer can query a specific item as they walk through
the store (Chen, 2007). The smart cart will locate the item within the store, direct the
customer to that item using a map, provide additional information about the item, and
offer supplementary items needed and their locations.
Day by day, people depend more on the internet to collect information before
visiting a tourist site. Thus, it is also important to provide the right information according
to visitor requirements. GIS has been used in tourism for providing useful and accurate
location based information to the visitor for example, by web based GIS spatial and
attribute information can possible to put in internet. Recently, the web based GIS have
started to deliver tourism related information via the internet. The US National Park
Service, for instance, maintains an Internet GIS web site known as Interactive Map
Center (http://www.nps.gov/gis/index.html) that allows users to find information about
national park locations and navigation to and within the national parks. Environmental
Systems Research Institute (ESRI, Redlands, CA) also hosts an Internet GIS tourism site
for San Diego, California (http://maps.esri.com) (Dye & Shaw, 2007).
2.1.4 GIS Applications in tourism resource inventories
Tourism resource inventories have been developed to offer organized, structured
information about parameters, which are of interest for tourism planners and developers
(Farsari, 2004). Tourism resources include natural resources, especially sea beaches,
natural forests, mines, mountains, rivers and channels, waterfalls, national parks, safari
parks and so on. They also include tourism infrastructure, historical places,
demographics, natural and cultural heritage sites. GIS is capable of capturing, analyzing
and displaying both spatial and non spatial (attribute) data related to tourism resources.
Additionally, by analyzing both types of data it is possible to make a prediction for a
destination hypothetically and examine its future from the lab before tourism
development. Resource inventories are useful as well as tourism planning, identification
of locational suitability, impact assessment for natural resource uses, examine conflicting
13
Application of GIS in Ecotourism Development: A case study in Sundarbans, Bangladesh
demand and so on. For example, Boyd and Butler (1996) used a resource inventory to
identify potential ecotourism sites in Northern Ontario in Canada.
2.1.5 GIS application to location suitability under conflicting demands
To develop tourism, local people’s interest is an important factor for sustainable
tourism planning and development. Similarly, the local cultural and natural environments
are other important issues to be considered in the planning process and overall
sustainable development. By contrast, nowadays tourism has been considered one of the
largest industries throughout the world because it makes money from small-scale to
large-scale places; sometimes a country’s GDP depends heavily on tourism as is the case
in Nepal (7.4%) and Indonesia (7.9%). Due to increasing mass tourism, impact
assessment and simulation are increasingly important to tourism development on nature
based tourism and GIS can play a role in examining the suitability of locations for
proposed developments, identifying conflicting interests and modeling relationships.
Systematic evaluation of environmental impact is often hindered by information
deficiencies. This is in order to manage and control tourism development considering
conflicting or complimentary land uses and activities, infrastructure available, natural
resources and therefore define the capabilities and capacities of an area (Butler, 1993). It
would be a potential case if GIS can be used to identify areas suitable for ecotourism
development. For example, Boyd et al. (1994) and Boyd and Butler (1996) illustrate a
methodology for identifying areas with potential for ecotourism in Northern Ontario,
Canada. At first, a resource inventory and a list of ecotourism criteria were developed.
The next stage GIS techniques were used to measure the ranking of different sites
according to the set criteria and, therefore, identify those with the best potential (Farsari,
2003).
2.1.6 Monitor and control tourism activities
Tourism is an activity which is related to the complex interaction among all
related participants as well as stockholders, local peoples and the local cultural and
natural environment. Naturally tourism needs to control for further degradation by
this activities especially local cultural and natural environment. GIS can be used to
14

Application of GIS in Ecotourism Development: A case study in Sundarbans, Bangladesh
monitor and control tourism activities through time and across space. In a tourist
destination, carrying capacity is an important factor, because over crowdedness is not
a good sign for a tourist region because, it can destroy the local environment. Indeed,
tourism needs to developed planned way and GIS can assist in planning process,
because GIS has integration capacity. Butler (1993) mentioned that the integration
capabilities of GIS can facilitate the identification and monitoring of indicators related to
tourism. Moreover, exploitation of its analytic techniques may provide more complex
measures which are often required for monitoring sustainable development.
2.1.7 Application of GIS in tourism marketing
At its core, the tourism industry sells images of the geography of different parts of
the world. Before visiting a destination nowadays, tourists in most of the cases try to
collect information through the internet to recognize the tourism and leisure related
facilities of that region. So, the demand for marketing in tourism sector has increased and
GIS can play an important role in tourism marketing. Beaumont (1991) argues that the
use and popularity of GIS for marketing goods and services is the primary reason that
GIS has now become central to much geographical research. In tourism marketing both
are important, not only tourism marketers but also their client because tourist movement
depends on geodemographic characteristics, experience, cultural similarities even time
space factors. Elliot-White & Finn (1998) advocate, geodemographics and lifestyle
analysis which can be performed by a GIS, could have a significant contribution in the
needs of post-modern tourism marketing. So, it can use to locate and analyze the
characteristics of potential customers.
Moreover, by using GIS software it can possible to make a Digital Elevation
Model (DEM) for a particular landscape and also possible to linkage between digital
maps in internet and 3D model using hot link tools. So that, before visiting the
destination tourist can visit through internet virtually for his/her future destination.
2.1.8 Use of GIS in visual impact analysis in tourism research
Visual impact analysis is increasingly playing a significant role in contributing to
environmental impact assessments. Mainly, it can assist in guiding newly proposed
15
Application of GIS in Ecotourism Development: A case study in Sundarbans, Bangladesh
tourism destination developments as well as predicting the impact of proposed structures
into the planning process. GIS is capable for analyzing the visibility of a proposed
destination by using visual impact analysis tools. This technology has also 3D tools
which is very effective to analyze visual impact on the earth virtually. 3D tools can
perform 3-D visualization of an existing area as well as to simulate a proposed
development and visualize it in the context of the existing setting. Visual impact analysis
is important in tourism research due to sustainable development. This analysis can prove
very useful for tourism planning especially in the case of scenic or of high aesthetic value
environments. Selman et al. (1991) produced a Digital Terrain Model (DTM) for the
Aonach Mor in Scotland. This was used to provide a visibility analysis of a skiing facility
development.
2.1.9 Use of GIS community involvement and participation in tourism research
Decision making in tourism planning is really complex in terms of multiple
interactions among all responsible organization, stakeholders and local community
peoples. However, local community involvement in decision making process provides an
opportunity to sustainable way of planning. The participatory research methods offer
opportunities to bring research and action, researcher and participant together in quite a
different way.
These approaches emphasize the process rather than the product of research
(Milne et al, 2005). It is a method to give chance to the community to express their
thought and experience. Its extensive and growing menu of methods includes visuals
such as mapping and diagramming. Hasse & Milne, (2005) noted that these approaches
have a lot to offer the tourism planning process and can contribute to better-informed
decision-making that serves the needs of local communities. They have also divided two
categories of participatory techniques: (1) diagramming, which includes making maps,
models and seasonal calendars; and (2) ranking techniques and scoring exercises, which
include matrix ranking to explore local criteria for choices and preferences.
Mowforth and Munt (1998) illustrated that, community participation is seen as
important for asserting some degree of local control over decisions on development plans
and for enhancing commitment to their implementation. Not only community
16

Application of GIS in Ecotourism Development: A case study in Sundarbans, Bangladesh
involvement is necessary to planning process but also all stakeholders, responsible
agencies and organizations participation of group or individual from different disciplines
are required to make a sustainable plan.
2.1.10 GIS uses as a decision supporting tools in tourism research
GIS has a great ability of querying spatial relationships and analyzing attributes
and spatial data. Moreover, by analyzing spatial data it can also display results by
graphical arrangement and thematic approach in a map to produce a final modeling.
Therefore, this technology is considered as a decision supporting tool in various planning
processes.
Mainly, this tool is used for capturing various spatial data and storing,
manipulating, analyzing and displaying this in the process of decision making. Although,
this system is not a Decision Support System (DSS) itself, it can function as a decision
support system as with its functions and applications (such as those preceding) can
provide the necessary information in different forms (tabular, maps etc), perform
calculations, visualize results and therefore, support a number of decisions (Farsari,
2003). Overall, GIS can assist as a supporting tool in decision making process. For
example, Beedasy and Whyatt (1999) developed a decision support system (SpaME) to
assist tourism planning in Mauritius. SpaME is designed to take into account all criteria
simultaneously and to facilitate a user’s understanding of the decision problem as well as
of the interactions which may take place between these criteria on a dynamic
environment.
To create links between spatial and attribute data and prepare topology in spatial
features it is possible to make a feature layer, as an overlay within the feature, analyze,
search, select by theme and so on. These kinds of characteristics make us use GIS as a
tool of decision support such as location analysis, land use plan, and tourism
development plan. The overall conclusion is that, GIS is an efficient and effective means
of helping the various stakeholders examine the implications of land-use decisions in
tourism development (Giles, 2003). The conceptual role of tourism knowledge system
(Figure 2) illustrated by Kim (2002) which is follow:
17

Application of GIS in Ecotourism Development: A case study in Sundarbans, Bangladesh
18
Figure: 2. Conceptual Role of Tourism Knowledge System (Kim, 2002)
2.2 Conceptual background of Geographical Information System (GIS)
2.2.1 Basic concept of GIS
GIS is a computer-based tool for mapping and analyzing feature events on earth.
GIS technology integrates common database operations, such as query and statistical
analysis, with maps (figure 3). GIS manages location-based information and provides
tools for display and analysis of various statistics, including population characteristics,
economic development opportunities, and vegetation types. GIS allows us to link
databases and maps to create dynamic displays. Additionally, it provides tools to
visualize, query, and overlay those databases in ways not possible with traditional
spreadsheets. These abilities distinguish GIS from other information systems, and make it
valuable to a wide range of public and private enterprises for explaining events,
predicting outcomes, and planning strategies.

Application of GIS in Ecotourism Development: A case study in Sundarbans, Bangladesh
Figure 3. GIS is an integrating technology
2.2.2 Definitions of GIS
GIS is a computerized information system. However, there is an important
difference between other databases and a GIS is that all information in the GIS must be
linked to a geographic (spatial) reference (latitude/longitude or other spatial coordinates)
(figure 4). The United States Geological Survey (USGS) defined ‘a GIS as a computer
hardware and software system designed to collect, manage, analyze and display
geographically (spatially) referenced data’. According to ESRI webpage, GIS as an
organized collection of computer hardware, software, geographic data and personnel
designed to efficiently capture, store, update, manipulate, analyze and display
geographically referenced information. In terms of geographical information
geographically referenced information is a must.
Figure 4. Geographic referencing/coordinate systems (ESRI, 2010)
19

Application of GIS in Ecotourism Development: A case study in Sundarbans, Bangladesh
Grimshaw, (1993) provides an overall definition of GIS which is ‘GIS is simplest
level a technology that enables decision-makers to explore the geographical dimension of
data’. Basically, definitions of GIS fall into one of the five categories as follows (Table
3):
Table 3. Definition of GIS
Properties of GIS GIS Analytical
Functions
A process A system for capturing, storing,
checking, manipulating, analyzing
and displaying data which are
spatially referenced to the earth
(DoE, 1987: 132).
A toolbox Containing tools for collecting,
storing, retrieving, transforming
and displaying spatial data
(Burrough, 1986: 6).
Presentation and
thematic mapping
Data Query
Spatial Query
Database
integration Route
finding
A data base Of spatially referenced entities
(Smith et al., 1987).
An application Cadastral information system,
marketing information system,
planning information system, etc.
A decision support
system
Integrating spatial data within a
problem solving environment
(Cowen, 1988).
Point in polygon
analysis Overlays
Buffering
Visualization and
3D modelling
Source: Bahaire & White, 1999, p. 161
2.2.3 Capacity of GIS
GIS has a remarkable capacity to capture, manipulate, analysis spatial referenced
data and it can display the result within a map or graphs. Moreover this technology can
create links between various databases to assist a decision-making process. There are five
basic questions GIS can provide answers to. These are as follows:
20
Application of GIS in Ecotourism Development: A case study in Sundarbans, Bangladesh
What exists at a particular location? GIS can give the answer with a geographic
reference; it must describe the features of that location. Another important question
which can be solved by GIS relates to where can specific features be found? This is the
converse of the first question for example, where are the districts with rainfall greater
than 500 mm and less than less than 750 mm? The third question is what has changed
over time? This involves answering both questions above. For instance, at what locations
is the forest showing change or declining over the last five years. What spatial patterns
exist? And what- if? GIS can give answer by analysis and modeling.
In tourism research, tourism resource inventories have often been used for a
specific region. These aim at identifying the most suitable locations for development,
tourism impact assessment, and visitor flows management, analyze relationships
associated with resource use, and assess potential impacts of tourism development.
Common tourism-related issues and GIS applications are tourism development as follow
(table 4 and table 5):
Table 4 Capacity of GIS
Functional Capabilities of a
GIS
GIS Basic Questions Tourism Applications
Data entry, storage and manipulation Map production Database integration and management Data queries and searches Spatial analysis Spatial modeling Decision support
Location Condition Trend Routing Pattern Modelling
What is at? Where is it? What has Changed? Which is the best route? What is the pattern? What if…?
Tourism Resource Inventories Identify most suitable locations for development Measure tourism impacts Visitor management/flows Analyze relationships associated with resource use Assess potential impacts of tourism development
Source: Bahaire & White, 1999, p. 159
21
Application of GIS in Ecotourism Development: A case study in Sundarbans, Bangladesh
Table 5. Common tourism-related issues and GIS applications
Problems GIS Application Benchmark/database Environmental management Conflicts Tourism behavior Carrying capacity Prediction Data integration Development control and direction
Systematic inventory of tourism resources Facilitating monitoring of specific indicators Mapping recreational conflicts: recreation-wildlife; user conflict Wilderness perceptions Identify suitable locations for tourism/recreation development Simulating and modeling spatial outcomes of proposed tourism development Integrating socio-economic and environmental datasets within a given spatial unit Decision support systems
Source: Adapted from Butler 1993, p. 33 (cited in Bahaire and White, 1999, P.162).
The above mentioned capacity of GIS and application of GIS in tourism gives us
a general idea about the demand of GIS in tourism. However, GIS is not common tools in
tourism field but it has enough potentiality to use in tourism planning as a decision
supporting tools for sustainable tourism planning and development.
22

Application of GIS in Ecotourism Development: A case study in Sundarbans, Bangladesh
23
CHAPTER 3
3. STUDY AREA DESCRIPTION
This chapter deals with the description of the area where this research was
conducted. The description includes the geographical location and setting, biodiversity
and tourism facilities of the study area.
3.1 Introduction
Bangladesh laying 23° 42′ 0″ N, & 90° 21′ 0″ E which is a country in South Asia
situated north of the Bay of Bengal, on land it borders India and Myanmar, and it is a
close neighbor to China, Thailand, Nepal and Bhutan (Appendix A) and this country is a
heavily populated country (162,221,000 population, & 1,099.3/km2). This country has the
small extent of forested land. Out of a total land (approximately 144 000 km2), only 15%
is classified as government forest land. However, the actual forested area is only 9%
(FAO, 1998). The Sundarbans mangrove reserve forest (Figure 5) is the largest single
forest resource in the country, representing 51% of the country's total reserved forest
estate. It contributes about 41% of total forest revenue and 45% of all timber and fuel
wood. At least 2 million people live within the proximity of the boundary and this
number is doubling every 34 years (FAO, 1998).
Figure 5. Satellite map of Sundarbans (Landsat 7, November, 2000)

Application of GIS in Ecotourism Development: A case study in Sundarbans, Bangladesh
Sundarbans situated in the southern part of Bangladesh along the cost of Bay of
Bengal (Figure 6). This mangrove forests is an excellent example of a rich biodiversity
and ongoing ecological processes, displaying the effects of monsoon rains, delta
formation, tidal influence and plant colonization. This mangrove is famous for its wide
range of fauna including birds, reptiles, the Royal Bengal tiger and other threatened
species, such as the estuarine crocodile and then Indian python (Salam et al, 2000). The
total area of Sundarbans is 272,510 hectares: 139,500 hectors are in Bangladesh and the
remaining 133,010 hectares form the Indian part. In 1947, the area was divided into two
parts by international boundaries. Bangladesh received 2/3 of the forest and the rest is on
India side (West Bengal). The Sundarbans (Bangladesh part) was designated as a world
heritage sites in 1997 by the UNESCO. However, it has been reducing day by day due to
climate change effects economic and tourism activities. Climate change is a big threat to
this forest because Sundarbans is only 3m above from the sea levels in Bangladeshi side
and 10m at almost in India side.
Figure 6. Location map of Sundarbans, Bangladesh
24
Application of GIS in Ecotourism Development: A case study in Sundarbans, Bangladesh
3.2 Geographical location
The Sundarbans forest is situated a little to the south of the Tropic of Cancer and
is bounded by the northern limits of the Bay of Bengal between the latitudes 21º30´N and
22º30´N, and the longitudes 89º00´E and 89º55´E. This forest is a part of World Heritage
Sites and it consists of three wildlife sanctuaries (Sundarbans West, East and South) lying
on deltaic islands in the Sundarbans Forest Division of Khulna district, close to the
border with India and just west of the main outflow of the Ganges, Brahmaputra and
Meghna rivers (Encyclopedia of earth, 2010).
3.3 Physical feature
The Sundarbans, covering some 10,000 square kilometers (sq.km) of land and
water, is part of the world's largest delta (80,000sq.km) formed from sediments deposited
by three great rivers, the Ganges, Brahmaputra and Meghna, which converge on the
Bengal Basin (Encyclopedia of earth, 2010). This mangrove forest consists of 200
islands, separated by some 400 interconnected tidal rivers, creeks and canals. However,
this region is known to be of relatively recent origin, and the extent of its coverage has
changed considerably since its formation (Iftekhar and Islam, 2004). This change has
been occurring due to a complex interaction of sea level change sedimentation rates, and
neo-tectonic subsidence (Islam and Tooley, 1999).
The landscape is one of low-lying forested alluvial islands (56 in the Indian
sector), muddy banks with sandy beaches, and dunes along the coast. The forest swamp is
extensively embanked and empoldered and is an essential buffer for inland areas against
the ravages of frequent cyclones from the Bay of Bengal (UNEP, 2008).
The soil type and its present distribution and thickness formed during Holocene
era by the cause of deposition and neo-technique activities. The sediment composition of
the Sundarbans originates from alluvial sand from the Gangetic plain and silt from the
Bay of Bengal deposited through prevailing ocean currents (Barlaw, 2009).
The physical features map of Sundarbans, Bangladesh is following (Figure 7)
25

Application of GIS in Ecotourism Development: A case study in Sundarbans, Bangladesh
Sundarbans
Figure 7. Physical features map of Sundarbans, Bangladesh (MODIS, NASA, 2001)
3.4 Climate
The Sundarbans climate can be classified as maritime, humid, and tropical, where
seasonality is very strong. The humidity (80%) and rainfall is very high due to the
proximity of the Bay of Bengal. Maximum rainfall happening during the monsoon which
is almost 80% of annual rainfall and this monsoon start from early June and continuing
until September. Others seasons can be describe as dry (December-February), pre-
monsoon (March-May), and post-monsoon (October-November) (Iftekhar and Islam,
2004). During the monsoon the weather is characterized by a warm, wet and humid
season in this region when 77-80% of annual rainfall occurs but in winter very little
rainfall falls while this part of the year has the lowest temperature and humidity. The pre-
monsoon season has the highest temperature and evaporation rates of the year and has
periodic thunder showers receiving about 381–508 mm of the total annual rainfall
(Hussain, 2006). The cyclonic storms originating in the high seas during April-May and
26

Application of GIS in Ecotourism Development: A case study in Sundarbans, Bangladesh
October-November associated with tidal wave severally affect the tidal area, when crops,
livestock, property and human lives are lost.
3.4.1 Temperature
The Sundarbans mangrove region’s temperature fluctuates from January to
December but January is the coldest time and March is summer. Temperature rises from
daily minimums of 2-4°C in the winter to over 32°C during the monsoon and a maximum
around 43°C in March. The mean annual maximum temperature recorded is 34°C and the
average minimum temperature is 20°C. However, recently weather forecast reports
indicate that the air temperature in this region (The Sundarbans and adjacent parts of the
Bay of Bengal) is gradually increasing (Figure 8).
Figure 8. The average minimum and maximum temperature in Sundarbans
Temperature in Sundarbans
0
10
20
30
40
50
Jan Feb Mar Apr May Jun Jul Aug Sep Oct Nov Dec
Month
Tem
p C
elsi
us
Absolute max
Average Max
Average Min
Absolute Min
3.4.2 Rainfall
The rainfall over the Ganga-Brahmaputra deltaic region decreases from east to
west and from south to the north (Gopal et al, 2006). The majority of rainfall (80 % of the
yearly rainfall) occurs during the monsoon (wet season). The annual rainfall ranges from
about 1,800 mm in Khulna near the north of the Sundarbans to 2,790 mm on the coast. A
little precipitation is received in the latter half of the hot season and in October.
According to the previous record there was little variation in the rainfall over the 20th
century. More specifically, during the first half of the 20th century, the highest and
lowest annual rainfalls were only 142 % (in 1933) and 62 % (in 1935) of the normal
27
Application of GIS in Ecotourism Development: A case study in Sundarbans, Bangladesh
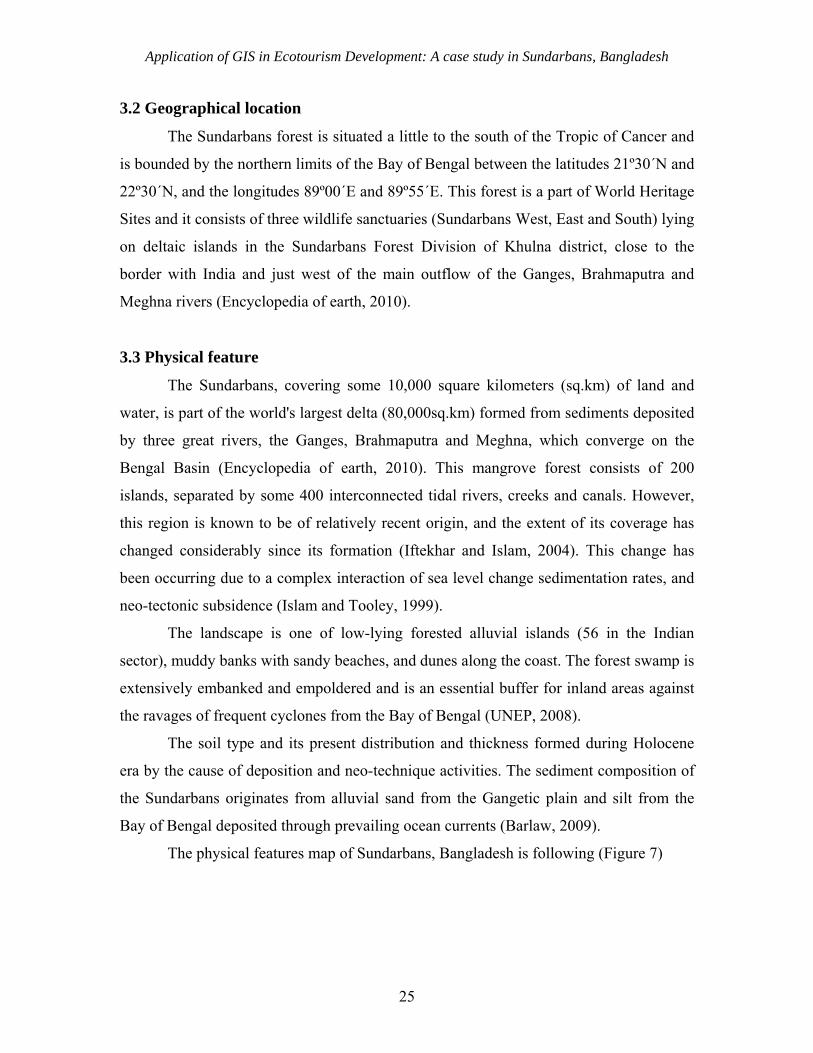
respectively (Gopal at al, 2006). Sundarbans received on an average 80 rainy days in a
year (Figure 9).
050
100150200250300350400
(mm)
Jan Mar May Jul Sep Nov
Month
Precipitation Amount (mm) in Sundarbans
Precipitation (mm)
Figure 9. Monthly average precipitation amounts in Sundarbans
3.4.3 Wind
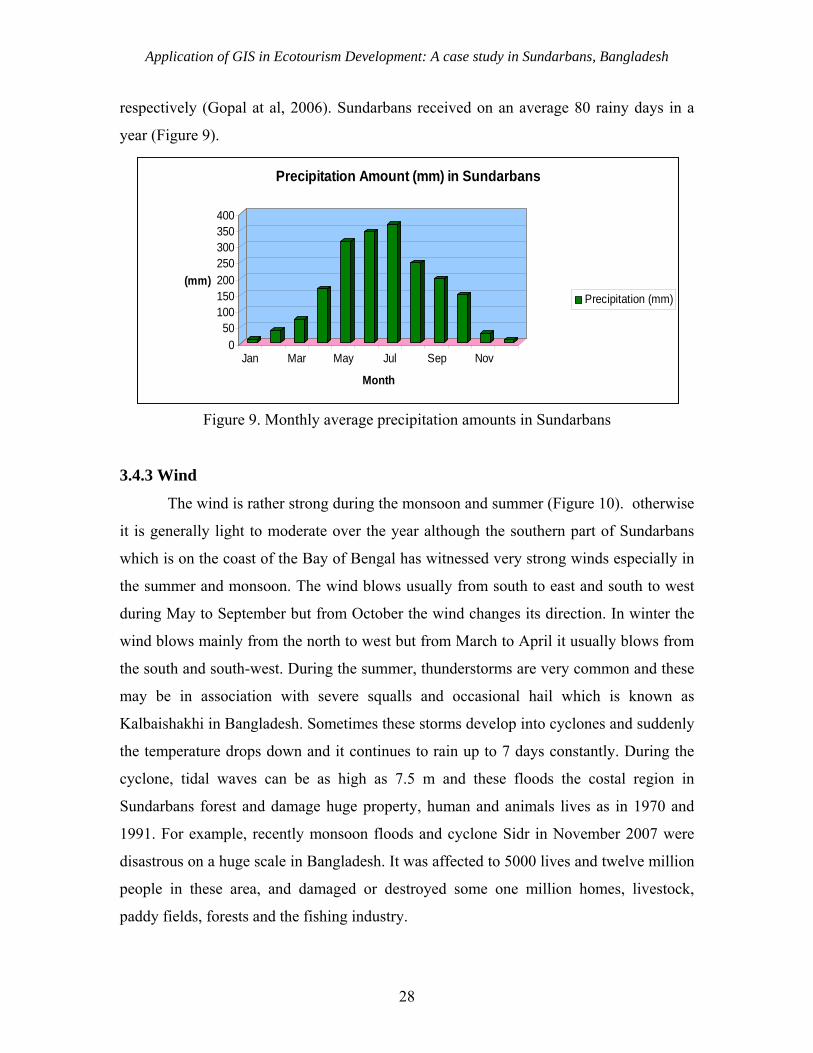
The wind is rather strong during the monsoon and summer (Figure 10). otherwise
it is generally light to moderate over the year although the southern part of Sundarbans
which is on the coast of the Bay of Bengal has witnessed very strong winds especially in
the summer and monsoon. The wind blows usually from south to east and south to west
during May to September but from October the wind changes its direction. In winter the
wind blows mainly from the north to west but from March to April it usually blows from
the south and south-west. During the summer, thunderstorms are very common and these
may be in association with severe squalls and occasional hail which is known as
Kalbaishakhi in Bangladesh. Sometimes these storms develop into cyclones and suddenly
the temperature drops down and it continues to rain up to 7 days constantly. During the
cyclone, tidal waves can be as high as 7.5 m and these floods the costal region in
Sundarbans forest and damage huge property, human and animals lives as in 1970 and
1991. For example, recently monsoon floods and cyclone Sidr in November 2007 were
disastrous on a huge scale in Bangladesh. It was affected to 5000 lives and twelve million
people in these area, and damaged or destroyed some one million homes, livestock,
paddy fields, forests and the fishing industry.
28

Application of GIS in Ecotourism Development: A case study in Sundarbans, Bangladesh
Wind speed Max (kph) in Sundarbans
7067
7478
637476
5263
8376
67
JanFebMarApr
MayJunJul
AugSepOctNovDec
Mo
nth
Wind speed Max (kph)
Wind speed Max
Figure 10. Monthly average maximum wind speeds (kph) in Sundarbans
3.4.4 Hydrology and Salinity
The hydrology of the Sundarban is dominated by the freshwater flows from three
great rivers including Ganga, Brahmaputra and Meghna which exhibit very high seasonal
variation in their discharge, and the tides which range in height from 2 to 5.94 m. Tidal
influence extends to more than 50 km inland from the shoreline and surges increase
considerably during the cyclonic storms (Gopal at al, 2006). The salinity is affected by
tidal action and the fresh water follows from the rivers. Basically, fresh water flows from
the rivers and the tidal ingress result in a gradient of salinity (Figure 11) that varies both
spatially and temporally. However, the coastal region is more affected by salinity
problems than the inland region because of upstream flows.
3.5 Biodiversity
The biodiversity of Sundarbans is based on a complex mangrove ecosystem and
the name of this forest comes from the Sundari trees (Heritiera fomes). The dominant
species are sundari (Heritiera fomes), gewa (Excoecaria agallocha), goran (Ceriops
decandra) and keora (Sonneratia apetala). These Sundari trees dominate where the soil
water is comparatively fresh, more specifically, in the northeast part and on higher
ground in this forest. The Sundari trees are very useful for the purposes of commercial
timber production.
29

Application of GIS in Ecotourism Development: A case study in Sundarbans, Bangladesh
Figure 11. Salinity zones map of Sundarbans, Bangladesh
The mangroves of the Sundarbans are unique compared with the non-deltaic
coastal mangrove forests and they are the home of Royal Bengal tigers. Today, we can
find the name of the Bengal tiger in the endangered animal list mainly because of the
animal’s shrinking habitat and illegal hunting. This forest has a great population
biodiversity such as 50 species of reptiles, including the Indian python, and 30000
spotted deer, saltwater crocodiles, Gangetic river dolphins, 120 species of fish, 260 of
birds and so on. Biodiversity in both the Bangladeshi and Indian part of this forest
displays little variation. Total biodiversity recorded to date from the Indian Sundarban
mangroves is as follows (Table 6):
30

Application of GIS in Ecotourism Development: A case study in Sundarbans, Bangladesh
Table 6. Total biodiversity recorded to date from in Sundarban mangroves
Group of Organisms No. of
Species
Group of Organisms No. of Species
Flowering Plants Pteridophytes (Ferns & Fern allies) Algae Lichens Vertebrates Chondrichthyes Osteichthyes (Fishes) Amphibians Reptiles Birds Mammals Phylum- Sarcomastigophora Aplicom plexa Myxozoa Ciliophora Invertebrates Porifera Cnidaria Ctenophora Platyhelminthes
105
150 32 445 22 154 8 58 163 40
45 24 4 31 1 33 2 41
Turbellaria Monogenera Trematoda Cestoda Nemathelminthes Acanthocephala Nemertinea Rotifera Mollusca Sipuncula Echiura Annelida Polychaeta Oligochaeta Hirudinea Arthropoda Crustacea Insecta Arachnida Merostomata Entoprocta Bryozoa Brachiopoda Chaetognatha Echinodermata Hemichordata
1 21 13 6 68 3 2 4
143 2 3 78 69 6 3
476 240 201 33 2 1 3 1 4 20 1
Source: Gopal & Chauhan, 2006, p. 343.
3.6 Local human population
According to the 1981 census, approximately 2.5 million people lived in small
villages surrounding the Sundarbans which by 1991 had increased to 3 million. Total
35,330 people worked in the forest, 4,580 of whom collected timber and firewood, 1,350
collected honeys and beeswax and 4,500 harvested the natural resources and hunted
mainly deer, and 24,900 were fisherman and shrimp farmers (UNEP, 2008). The
Sundarbans provides a livelihood at certain periods of the year for an estimated 300,000
people who work in various economic activities like, wood-cutting, fishing, and gathering
31

Application of GIS in Ecotourism Development: A case study in Sundarbans, Bangladesh
of honey, golpatta leaves (Nipa fruticans) and grass. In the Bangladeshi part every year
around 4500 people are employed as contactors in the commercial logging of sundari and
other timber, which is 45% of all that produced in state-owned forests. This timber is
prepared to supply local newspaper mils, as well as match and board mills.
The local populations who depend on the forest and waterway for their livelihood
are, extremely poor. Every year more than 10000 people come from far away during the
fishing, and honey collection season and they stay for only three month in winter before
returning home at the start of the monsoon season in April. The Sundarbans has a
notorious background; approximately 300 people per year are killed by tigers and
crocodiles within this region.
3.7 Cultural heritage
The culture of the local people in the Sundarbans region developed by their own
beliefs and this culture built based on the relationship between communities and the
forest. The local culture also influences by the two major religions such as Islam and
Hinduism. Most of the peoples are illiterate and they completely depend on nature for
their livelihoods. They still use a variety of religious and other spiritual approaches
increase their safety in the jungle. Before entering the forest, usually local people arrange
a special religious program to pray for their safe journey into the forest and safe return.
Also, blessings are sought from local spiritual/religious leaders and offerings are made to
forest deities such as Banbibi, Dakshin Rai, and Badi Ghazi Khan (Barlaw, 2009). The
local spiritual leaders are supply blessed pieces of red cloth and other charms to keep
villagers safe during their trip to the forest.
3.8 Conservation value
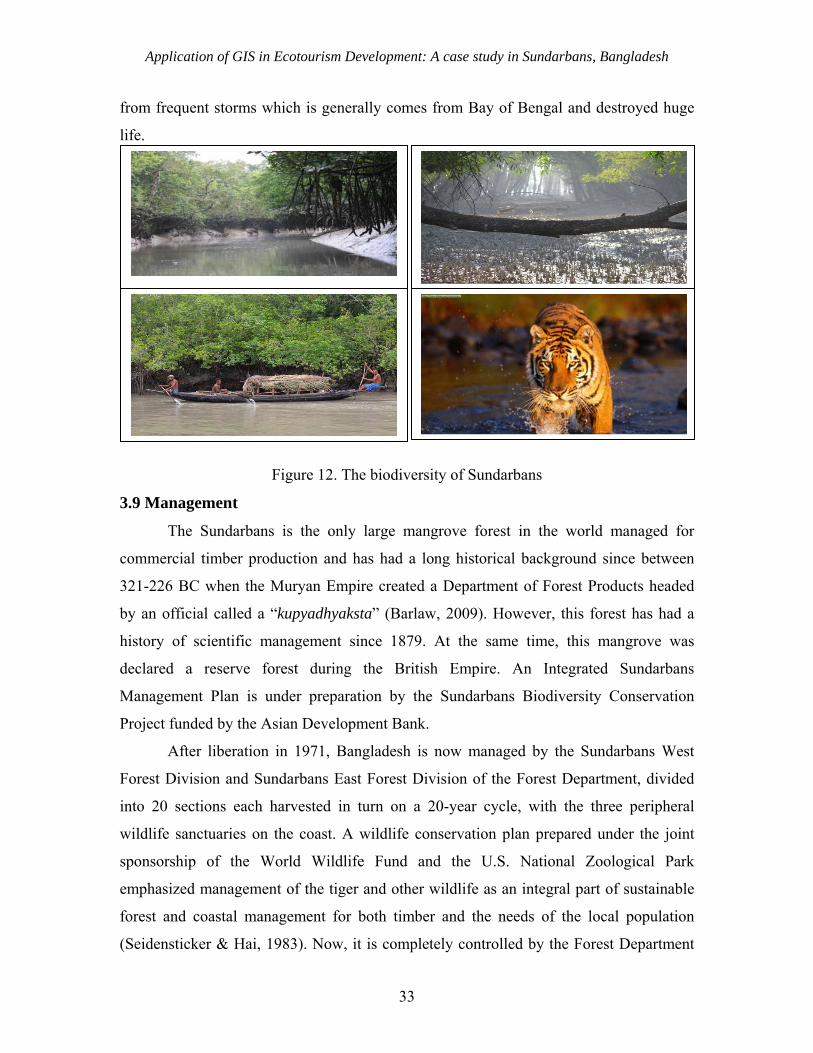
The biodiversity of the mangrove forest (Figure 12) of Sundarbans is one of the
richest and most extensive in the world. The Sundarbans covers 6% of the total land area
in Bangladesh. Moreover, this forest represents over half of the country's remaining
natural forest. This forest has significance as a source of timber, fishing, shrimps and
natural resources. Its green belt besides the cost makes a natural barrier to protect the land
32
Application of GIS in Ecotourism Development: A case study in Sundarbans, Bangladesh
from frequent storms which is generally comes from Bay of Bengal and destroyed huge
life.
Figure 12. The biodiversity of Sundarbans
3.9 Management
The Sundarbans is the only large mangrove forest in the world managed for
commercial timber production and has had a long historical background since between
321-226 BC when the Muryan Empire created a Department of Forest Products headed
by an official called a “kupyadhyaksta” (Barlaw, 2009). However, this forest has had a
history of scientific management since 1879. At the same time, this mangrove was
declared a reserve forest during the British Empire. An Integrated Sundarbans
Management Plan is under preparation by the Sundarbans Biodiversity Conservation
Project funded by the Asian Development Bank.
After liberation in 1971, Bangladesh is now managed by the Sundarbans West
Forest Division and Sundarbans East Forest Division of the Forest Department, divided
into 20 sections each harvested in turn on a 20-year cycle, with the three peripheral
wildlife sanctuaries on the coast. A wildlife conservation plan prepared under the joint
sponsorship of the World Wildlife Fund and the U.S. National Zoological Park
emphasized management of the tiger and other wildlife as an integral part of sustainable
forest and coastal management for both timber and the needs of the local population
(Seidensticker & Hai, 1983). Now, it is completely controlled by the Forest Department
33
Application of GIS in Ecotourism Development: A case study in Sundarbans, Bangladesh
of Bangladesh and there are no options to enter in the forest to collect forest resources
without permission from Forest Department. The responsible Department also issues
hunting licenses under the Bangladesh Wildlife (Preservation) (Amendment) Act, 1974.
The Sundarbans is now effectively closed to legal hunting. Under the provision of this
Act, activities prohibited within the wildlife sanctuaries, include residence, cultivation of
land, damage to vegetation, hunting, introduction of domestic animals and setting of fires.
3.10 Present situation of tourism in Sundarbans:
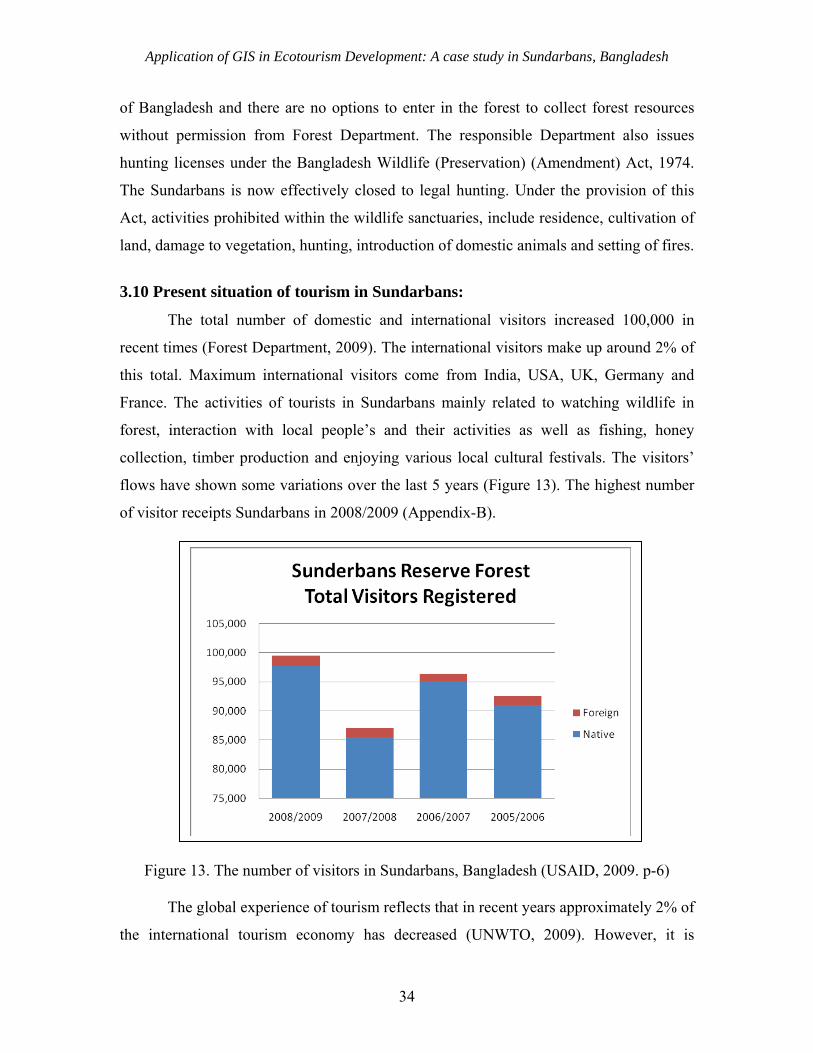
The total number of domestic and international visitors increased 100,000 in
recent times (Forest Department, 2009). The international visitors make up around 2% of
this total. Maximum international visitors come from India, USA, UK, Germany and
France. The activities of tourists in Sundarbans mainly related to watching wildlife in
forest, interaction with local people’s and their activities as well as fishing, honey
collection, timber production and enjoying various local cultural festivals. The visitors’
flows have shown some variations over the last 5 years (Figure 13). The highest number
of visitor receipts Sundarbans in 2008/2009 (Appendix-B).
Figure 13. The number of visitors in Sundarbans, Bangladesh (USAID, 2009. p-6)
The global experience of tourism reflects that in recent years approximately 2% of
the international tourism economy has decreased (UNWTO, 2009). However, it is
34
Application of GIS in Ecotourism Development: A case study in Sundarbans, Bangladesh
important to recognize that the tourism economy of Bangladesh has not contracted during
that time (USAID, 2009). Moreover, the number of visitors in Sundarbans increased by
14% between 2007/8 and 2008/9 due to increasing domestic travelers. Therefore, it is
important for Sundarbans to make a guideline for ecotourism planning and visitor
management. This is an imperative issue to promote sustainable tourism development in
this region.
3.11 Existing tourism facilities and lacking of facilities in Sundarbans:
The most visited site in the Sundarbans is Karamjal, which is in the Eastern
Sundarbans. Approximately 81% of total visitors to the reserve visit this one area
(USAID, 2009). Katka, Nilkamal (Hiron point), Kochikhali, Mandabaria, and Dublarchar
are also popular sites in Sundarbans for both local and international visitors (Figure 13).
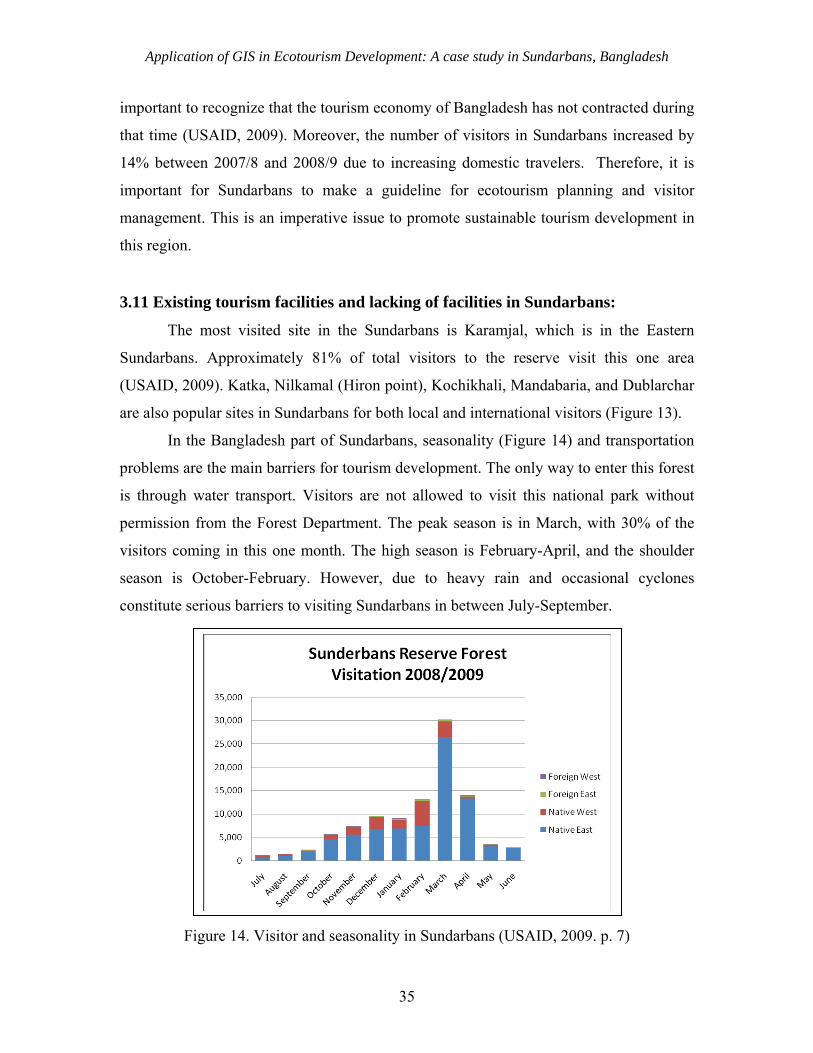
In the Bangladesh part of Sundarbans, seasonality (Figure 14) and transportation
problems are the main barriers for tourism development. The only way to enter this forest
is through water transport. Visitors are not allowed to visit this national park without
permission from the Forest Department. The peak season is in March, with 30% of the
visitors coming in this one month. The high season is February-April, and the shoulder
season is October-February. However, due to heavy rain and occasional cyclones
constitute serious barriers to visiting Sundarbans in between July-September.
Figure 14. Visitor and seasonality in Sundarbans (USAID, 2009. p. 7)
35
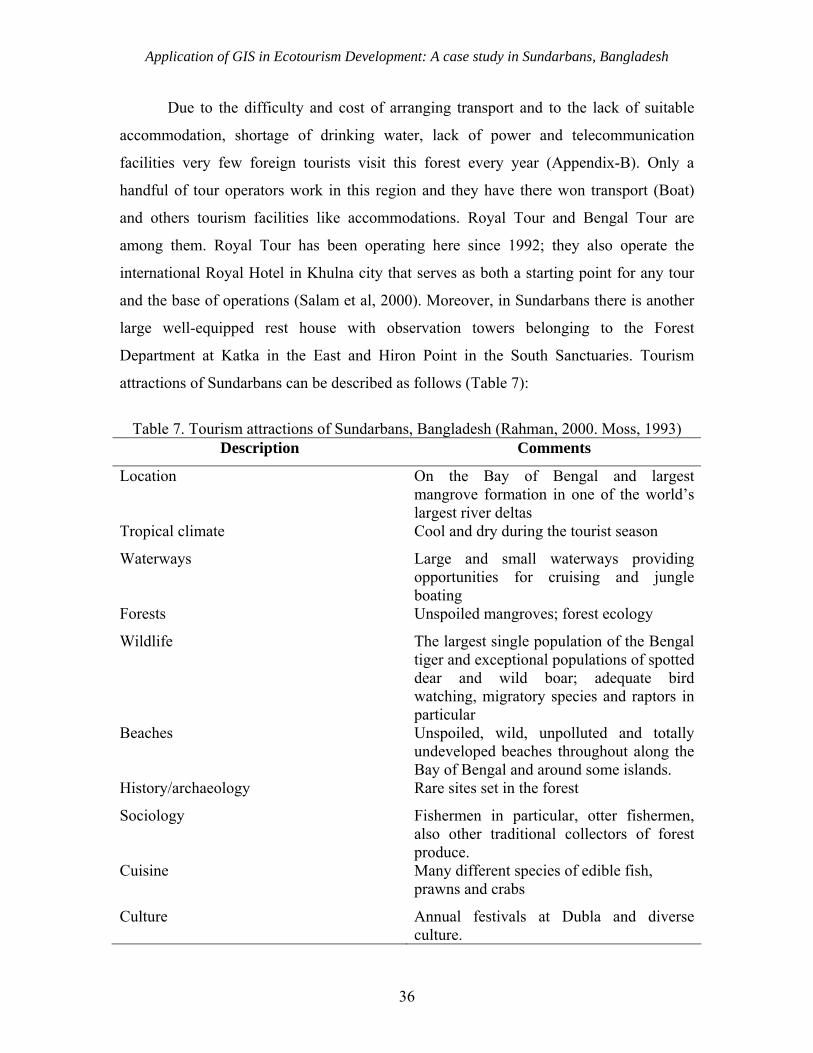
Application of GIS in Ecotourism Development: A case study in Sundarbans, Bangladesh
Due to the difficulty and cost of arranging transport and to the lack of suitable
accommodation, shortage of drinking water, lack of power and telecommunication
facilities very few foreign tourists visit this forest every year (Appendix-B). Only a
handful of tour operators work in this region and they have there won transport (Boat)
and others tourism facilities like accommodations. Royal Tour and Bengal Tour are
among them. Royal Tour has been operating here since 1992; they also operate the
international Royal Hotel in Khulna city that serves as both a starting point for any tour
and the base of operations (Salam et al, 2000). Moreover, in Sundarbans there is another
large well-equipped rest house with observation towers belonging to the Forest
Department at Katka in the East and Hiron Point in the South Sanctuaries. Tourism
attractions of Sundarbans can be described as follows (Table 7):
Table 7. Tourism attractions of Sundarbans, Bangladesh (Rahman, 2000. Moss, 1993)
Description Comments
Location On the Bay of Bengal and largest mangrove formation in one of the world’s largest river deltas
Tropical climate Cool and dry during the tourist season
Waterways Large and small waterways providing opportunities for cruising and jungle boating
Forests Unspoiled mangroves; forest ecology
Wildlife The largest single population of the Bengal tiger and exceptional populations of spotted dear and wild boar; adequate bird watching, migratory species and raptors in particular
Beaches Unspoiled, wild, unpolluted and totally undeveloped beaches throughout along the Bay of Bengal and around some islands.
History/archaeology Rare sites set in the forest
Sociology Fishermen in particular, otter fishermen, also other traditional collectors of forest produce.
Cuisine Many different species of edible fish, prawns and crabs
Culture Annual festivals at Dubla and diverse culture.
36

Application of GIS in Ecotourism Development: A case study in Sundarbans, Bangladesh
Considering all the above information an ecotourism plan for Sundarbans has
been prepared and GIS tools have been used as a decision support system in this research.
The next chapter will discuss the method which is used in this research for ecotourism
planning.
37
Application of GIS in Ecotourism Development: A case study in Sundarbans, Bangladesh
38
CHAPTER 4
4. RESEARCH METHODS
The main theme of this chapter is to identify land use change over the last 33
years using satellite data and use these data for ecotourism planning in Sundarbans
Bangladesh. The research is designed to investigate causes and the extent of ecological
and physical changes pertaining to changes of land use patterns due to human activities,
tourism development, and natural hazards over time. This chapter also describes different
methods used for data collection, satellite image processing methods, accuracy
assessments and ecotourism planning.
4.1 Data collection
Raw satellite images of Sundarbans have been downloaded from the United States
Geological Survey (USGS) website (http://glovis.usgs.gov/). Landsat TM, ETM and
Multispectral Scanner (MSS) satellite images from 1977 to 2010 have been used for land
use classification and change detection. Local Government Engineering and
Development (LGED) vector maps have been used as a reference map for digital image
classification. Ground observation information has been used to classify the image.
Moreover, images have been calibrated using sun elevation and sun azimuth. Census data
and other secondary data of ecotourism in Sundarbans have been collected from available
literature in the form of books, journal and magazine articles, and annual reports.
4.2 Digital Image classification
To identify changes in vegetation, first Normalized Differential Vegetation Index
(NDVI) (Rouse et al., 1973) images have been generated using images from different
years. Subsequently, the maximum likelihood technique (Foody et al., 1992) has been
used to classify the image. Finally, both interclass and within same class change have
been detected through area calculation. The whole classification and change detection
process can be separated into the following major steps:
o Preprocessing
o Image Enhancement
Application of GIS in Ecotourism Development: A case study in Sundarbans, Bangladesh
o Image Classification and Analysis
4.2.1 Preprocessing of raw satellite images
Before final analysis of satellite data, preprocessing is done to reduce any
unwanted noises and geometric errors so that, we can have the desired outputs from the
image. These enhance the quality of the image data by reducing or eliminating various
radiometric and geometric errors caused by internal and external conditions (Bruce et al,
2006). Radiometric corrections include both errors system detector and environmental
attenuation error. Geometric corrections include correcting for geometric distortions due
to sensor Earth geometry variations and conversion of the data to real world coordinates
(e.g. latitude and longitude) on the Earth's surface.
4.2.2 Image Enhancement
Remotely sensed data is influenced by the number of atmospheric factors
including atmospheric particles. The processes that are caused due to the atmosphere
include absorptions, scattering, emissions, etc. Enhancement operations have been
performed on each image to improve the interpretability of the image by increasing
apparent contrast among various features in the scene. These operations improve the
appearance of the image to assist in visual interpretation and analysis which is also
important for signature making process when finally the image should be classified.
Contrast stretching and spatial filtering are some good examples of image enhancement
where contrast stretching increases the tonal distinction among various features in a scene
and spatial filtering enhances specific spatial patterns in an image.
4.2.3 Image Classification and Analysis
Digital image classification methods can be divided into two major categories
including supervised classification and unsupervised classification. In a supervised
classification, it is important to identify in the imagery homogeneous representative
samples of the different surface cover types of interest. This is called signature. Thus, the
researcher is supervising the categorization of a set of specific classes. It means,
supervised classifiers require the user to decide which classes exist in the image, and then
to delineate samples of these classes. These samples (known as training areas) are then
39
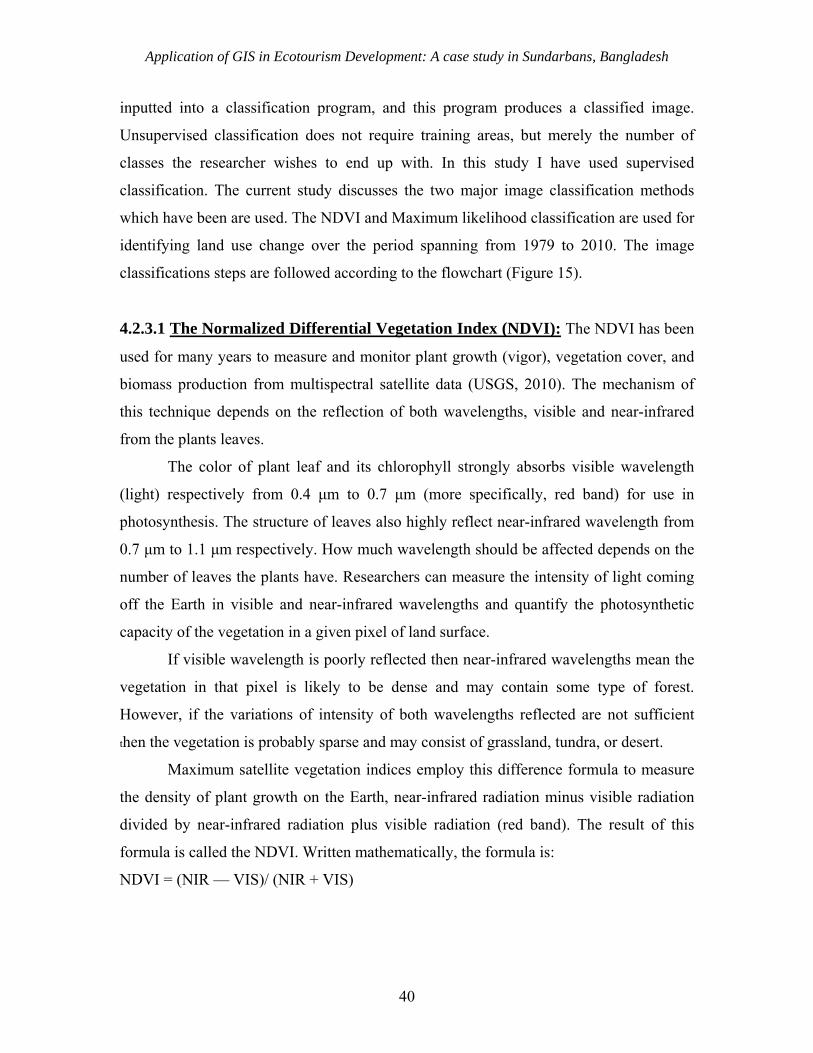
Application of GIS in Ecotourism Development: A case study in Sundarbans, Bangladesh
inputted into a classification program, and this program produces a classified image.
Unsupervised classification does not require training areas, but merely the number of
classes the researcher wishes to end up with. In this study I have used supervised
classification. The current study discusses the two major image classification methods
which have been are used. The NDVI and Maximum likelihood classification are used for
identifying land use change over the period spanning from 1979 to 2010. The image
classifications steps are followed according to the flowchart (Figure 15).
4.2.3.1 The Normalized Differential Vegetation Index (NDVI): The NDVI has been
used for many years to measure and monitor plant growth (vigor), vegetation cover, and
biomass production from multispectral satellite data (USGS, 2010). The mechanism of
this technique depends on the reflection of both wavelengths, visible and near-infrared
from the plants leaves.
The color of plant leaf and its chlorophyll strongly absorbs visible wavelength
(light) respectively from 0.4 μm to 0.7 μm (more specifically, red band) for use in
photosynthesis. The structure of leaves also highly reflect near-infrared wavelength from
0.7 μm to 1.1 μm respectively. How much wavelength should be affected depends on the
number of leaves the plants have. Researchers can measure the intensity of light coming
off the Earth in visible and near-infrared wavelengths and quantify the photosynthetic
capacity of the vegetation in a given pixel of land surface.
If visible wavelength is poorly reflected then near-infrared wavelengths mean the
vegetation in that pixel is likely to be dense and may contain some type of forest.
However, if the variations of intensity of both wavelengths reflected are not sufficient
then the vegetation is probably sparse and may consist of grassland, tundra, or desert.
Maximum satellite vegetation indices employ this difference formula to measure
the density of plant growth on the Earth, near-infrared radiation minus visible radiation
divided by near-infrared radiation plus visible radiation (red band). The result of this
formula is called the NDVI. Written mathematically, the formula is:
NDVI = (NIR — VIS)/ (NIR + VIS)
40

Application of GIS in Ecotourism Development: A case study in Sundarbans, Bangladesh
LGED map Raw satellite image
MSS-1977 TM-1989 ETM-2000 TM-2006 TM-2010
Geometric and radiometric correction LGED vector map
Resample
Vector map of Sundarbans Image pre-processing
Study area extraction Overlay
NDVI of NDVI of NDVI of NDVI of MSS-1977 TM-1989 ETM-2000 TM-2010
Supervised classification
Calculating the DN values of each class and preparing land use map Locating the land use
type with GPS in field
Change detecting of the environmental features through statistical analysis.
Detecting the area under different land use
Findings Accuracy assessment
Conclusion
Figure 15. Schematic diagram of the image classification
41

Application of GIS in Ecotourism Development: A case study in Sundarbans, Bangladesh
Calculations of NDVI for a given pixel always result in a number that ranges from
minus one (-1) to plus one (+1); however, no green leaves gives a value close to zero
(Figure 16). A zero means no vegetation and close to +1 (0.8 - 0.9) indicates the highest
possible density of green leaves (NASA, 2010).
Figure 16. NDVI is calculated from the visible and near-infrared light reflected by vegetation
4.2.3.2 Maximum likelihood classification: The maximum likelihood classification is
the most common and powerful classifier in the supervised classification method which is
used for remote sensing image data. This classifier is based on Bayesian probability
theory. The procedure of this technique is related to statistical analysis (mean;
variance/covariance), where (Bayesian) probabilities function is calculated from the
inputs for classes established from training sites. Each pixel is then judged as to the class
to which it most probably belongs. In this study, I have used maximum likelihood
42
Application of GIS in Ecotourism Development: A case study in Sundarbans, Bangladesh
classification technique because this method provides much better result then others
common supervised classification methods (PIPED and MINDIST).
The key theme in this mechanism depends on a set of signature files and the
probability density function work associated with a particular training area. In this
process of classification pixels are represented by the most likely classes based on the
comparison of the priority and probability that it belongs to each of the signatures and
this signature being considered as a data file. It can be precise as a single value and this
value can count homogenous to all pixels within an image.
4.3 Accuracy assessment
The accuracy assessment in digital image classification is the way to support
classifications validity. Before using the classification result from satellite images current
research needs to support the forest classification process. Accuracy assessment can be
considered a matrix or table that displays statistics for assessing image classification
accuracy by showing the degree of misclassification among classes. The error matrix is
also known as a confusion matrix, a contingency table or a classified error matrix. The
mechanism of error matrix permits the calculation of a range of measures that describes
the accuracy of the classified map with respect to the reference map. In this process error
matrix measured accuracy compares two thematic maps. These two thematic maps are
often known respectively as a ground truth map (the reference map) and an automated
image classification (the classified map) map. To generate the error matrix, thematic
information is recorded from sample pixels that display the same ground area on the two
maps. Calibration data are recorded from the reference map and validation data from the
classified map.
This thesis adapted confusion matrix and Kappa statistic accuracy methods.
Accuracy assessment was done using independent sample points (Appendix D). The
ground truth sample points were collected by field investigations in January 2010(one of
my friend collect it on be half of me). Accuracy assessments have been performed by
comparing two sources of information respectively, that is digital image classification
data and ground truth reference data. The estimate of a measure of overall agreement
between image data and the reference (ground truth) data is called Kappa or kˆ (The error
43

Application of GIS in Ecotourism Development: A case study in Sundarbans, Bangladesh
matrix tables have been included within the Appendix part in this report). To measure the
kappa coefficient the following formula is applicable as below.
Where, i+ X is the sum of the its row, i X + is the sum of the its column, and ii X is the
count of observations at row i and column i. However r is the number of rows and
columns in the error matrix, while the total number of observations is N. If the raters are
in complete agreement then κ = 1 but, if there is no agreement among the raters (other
than what would be expected by chance) then κ ≤ 0
4.4 Ecotourism planning
‘Ecotourism planning requires exploring diverse types of natural and cultural
attractions along with demographic characteristics, to provide the base for designing the
travel industry different from the mass tourism standard’ (Banerjee et al, 2002, p. 2). To
plan ecotourism in Sundarbans a GIS and Remote Sensing approach has been used. By
using this technique Banerjee et al. (2002) have done their research for ecotourism
planning and investigated a case study in western Midnapore, West Bengal, India.
In this study, I have followed their method partially. The current case study is
based on Sundarbans and this mangrove is a forest reservation meaning that it is largely a
protected area with a limited scope of developing infrastructure or any other tourism
based facilities as well as roads network, hotels and recreation center. Moreover, in the
Bangladesh part of Sundarbans water transport is the only way to enter this forest. This
study considered the vegetation density map, land use/land cover map and accessibility
map of Sundarbans for planning ecotourism in this region. Major river channels were
considered main accessible point in this study. Existing tourism facilities were also
considered as part of this planning process. The methodology is given in the figure 17.
44

Application of GIS in Ecotourism Development: A case study in Sundarbans, Bangladesh
Administrative Information
Landsat Image Data
Vector Map Study Area Extraction
Accessibility MapExisting Tourism Facility Map Landuse Map
Ecotourism Planning
Figure 17. Methodology of Ecotourism planning in Sundarbans
In the planning process digital Image classification maps, administrative
information (included international boundary, range office, existing rest house and its
facilities) existing tourism facilities maps and major water bodies (river channel) are
overlay into the same map for preparing a ecotourism map and takes decision for
sustainable planning in Sundarbans, Bangladesh.
The next chapter will discuss satellite data analysis result, based on land cover
change in Sundarbans and various planning issues related to ecotourism planning in this
region.
45

Application of GIS in Ecotourism Development: A case study in Sundarbans, Bangladesh
46
CHAPTER 5
5. DATA ANALYSIS AND ECOTOURISM PLANNING
This chapter describes the results obtained through data processing following the
methods of this research. Moreover, the chapter illustrates various ecotourism planning
issues, causes of land use change, and proposes an ecotourism plan for Sundarbans.
5.1 Land use changes in Sundarbans
Landsat TM, Landsat ETM and Landsat MSS data have been classified for the
study area and analyzed to evaluate forest cover changes between the years 1977 and
2010. Two different methods were used in this research to quantify mangrove forest
change in the Sundarbans. The maximum likelihood classifier has been used to identify
forest cover change and NDVI used for forest density measurements. Both techniques
revealed different information about the spatial distribution of forest cover change in the
Sundarbans. The first section describes the results of maximum likelihood classification
change detection then NDVI differencing results will sketch for forest density change.
5.1.1 Maximum likelihood classification result
The change summaries describe the variation in areas occupied by each class
between sensing periods and class-by-class reports illustrate changes by area. The
classification result has been divided into three parts. The first part represents a digital
image classification map. Then, the second part shows classification results graphically
and finally the last part leads to comparisons and a discussion.
The results of maximum likelihoods classification are as follows (Figure 18-23).

Application of GIS in Ecotourism Development: A case study in Sundarbans, Bangladesh
Land use Map 1989
Figure 18. Land use map of Sundarbans, 1989
Land use in 1989
2%16%
46%
11%
25%
Keora and Bare Land Gewa Sundri Sundri and Gewa Pussur and Baen
Figure 19. Land use of Sundarbans in 1989
47

Application of GIS in Ecotourism Development: A case study in Sundarbans, Bangladesh
Land use Map 2000
Figure 20. Land use map of Sundarbans, 2000
Land use in 2000
3% 11%
53%
24%
9%
Keora and Bare Land Gewa Sundri Sundri and Gewa Pussur and Baen
Figure 21. Land use of Sundarbans in 2000
48

Application of GIS in Ecotourism Development: A case study in Sundarbans, Bangladesh
Land use Map 2010
Figure 22. Land use map of Sundarbans, 2010
Land use in 2010
4%
22%
35%
7%
32%
Keora and Bare Land Gew a Sundri Sundri and Gew a Pussur and Baen
Figure 23. Land use of Sundarbans in 2010
49

Application of GIS in Ecotourism Development: A case study in Sundarbans, Bangladesh
5.1.2 Maximum likelihood classification result comparisons
The comparison of the land use in 1989 with that for 2010 shows the change that
has taken place during the past 20 years. Bare land has been increased by 2% during this
period. However, the major trees of this forest are Sundri which its numbers have seen
decrease dramatically. Although, a major portion of Sundarbans is covered by Sundri,
these trees have decreased from 45.66% to 34.82% during the 20 year period (Figure 18-
23). Only Gewa trees have increased slightly (5%). Table 8 and Figure 24 shows the
detail comparison of forest change for each class and area measured based on classified
imagery of Landsat TM, ETM and MSS.
Table 8. Statistics of changes in areas (hectares) of forest cover classes between the years
1989-2010.
Land use Classes 1989 2000 2010
Areas (ha) % Areas (ha) % Areas (ha) %
Keora and Bare Land 8204.212 1.96 14683.14 3.55 16472.43 4.01
Gewa 67728.25 16.23 46756.35 11.33 89243.55 21.75
Sundri 190599.8 45.66 218411.6 52.91 142942.3 34.82
Sundri and Gewa 103082.2 24.70 97624.62 23.66 132424 32.27
Pussur and Baen 47846.56 11.45 35267.490 8.55 29319.3 7.15
Land use Change between 1989-2010
0
50000
100000
150000
200000
250000
1989 2000 2010
Are
as (
hec
tare
s) Keora and Bare Land
Gewa
Sundri
Sundri and Gewa
Pussur and Baen
Figure 24. Land use changes of Sundarbans ‘between’ 1989-2010
50
Application of GIS in Ecotourism Development: A case study in Sundarbans, Bangladesh
5.1.3 Normalized Differential Vegetation Index (NDVI)
This section describes the results of the NDVI differencing. The result of NDVI
represents vegetation density and this data can be used to identify and declare potential
sites for ecotourism (Bannerjee et al, 2002). Vegetation change is defined as an alteration
in the surface components of the vegetation cover or as a spectral/spatial movement of a
vegetation entity over time. NDVI differencing is interrelated with various vegetation
parameters as well as green leaf and biomass. NDVI values range between minus one (-1)
to plus one (+1) where no green leaves gives a value close to zero and close to +1
indicates the highest possible density of green leaves. However, researchers can expand
this value scale (if required) to more visualized in a map. In this study, NDVI value scale
has been expanded between 0-1.13. Landsat TM, ETM & MSS data have been classified
for NDVI differencing between the year of 1977 and 2010 (Figure 25).
5.1.4 Normalized Differential Vegetation Index (NDVI) comparisons
The NDVI difference map reveals that, the density of the forest has decreased
over the study period ‘between’ 1977-2010 (Figure 25). In 1977 the NDVI map
represents the highest value of density which is 1.13 it means very dense forest but by 2010 it was
only 0.90 because of deforestation over the time. Most of the deforestation occurred in
the southeastern corner and western edge of the study area. However, NDVI values
increased in the north-central part and southwestern part of the study areas. Density of
forest decreased along the cost regular basis, because of tidal waves, floods, cyclones and
human and tourism activities. The accessibility of this forest in only water channels,
therefore, human disturbance influenced the change besides rivers and canals channels.
Vegetation density decreased consequently over the study period.
In 1989, the south central and south eastern parts of the NDVI map looks dark due
to cloud cover. The comparative result from NDVI ‘between’ 1977-2010 has been
illustrated in figure 25.
51
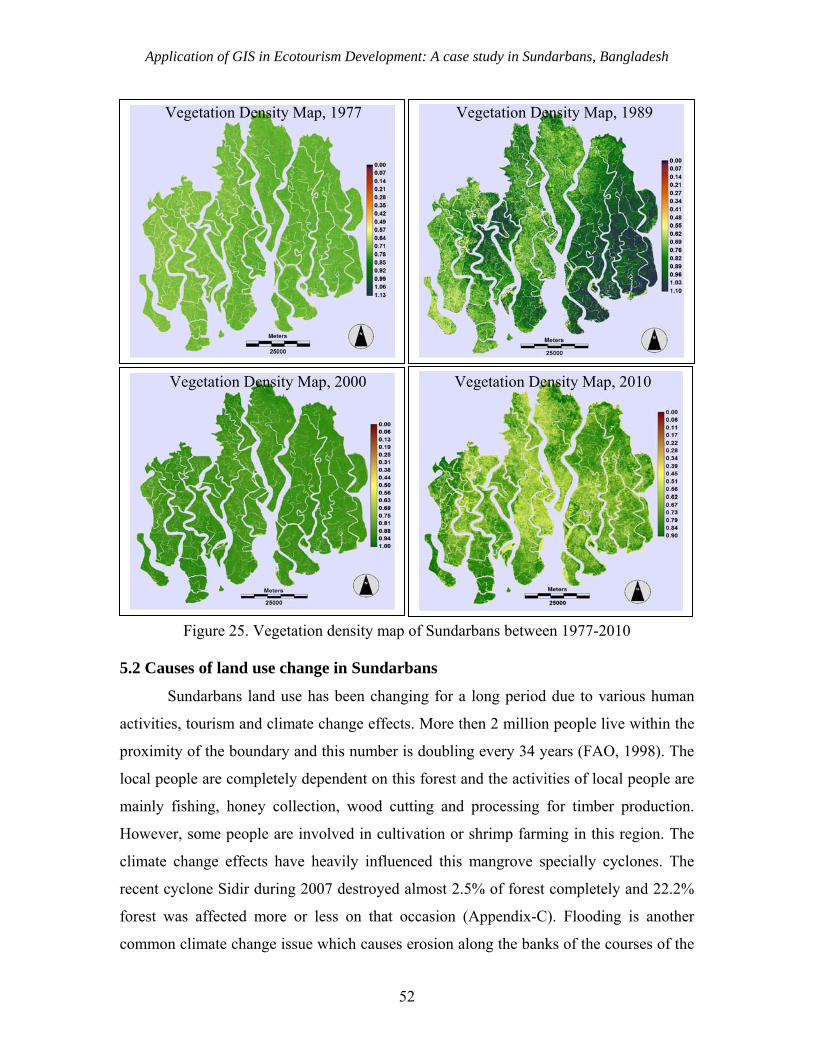
Application of GIS in Ecotourism Development: A case study in Sundarbans, Bangladesh
52
Vegetation Density Map, 1977 Vegetation Density Map, 1989
Vegetation Density Map, 2000 Vegetation Density Map, 2010
Figure 25. Vegetation density map of Sundarbans between 1977-2010 5.2 Causes of land use change in Sundarbans
Sundarbans land use has been changing for a long period due to various human
activities, tourism and climate change effects. More then 2 million people live within the
proximity of the boundary and this number is doubling every 34 years (FAO, 1998). The
local people are completely dependent on this forest and the activities of local people are
mainly fishing, honey collection, wood cutting and processing for timber production.
However, some people are involved in cultivation or shrimp farming in this region. The
climate change effects have heavily influenced this mangrove specially cyclones. The
recent cyclone Sidir during 2007 destroyed almost 2.5% of forest completely and 22.2%
forest was affected more or less on that occasion (Appendix-C). Flooding is another
common climate change issue which causes erosion along the banks of the courses of the
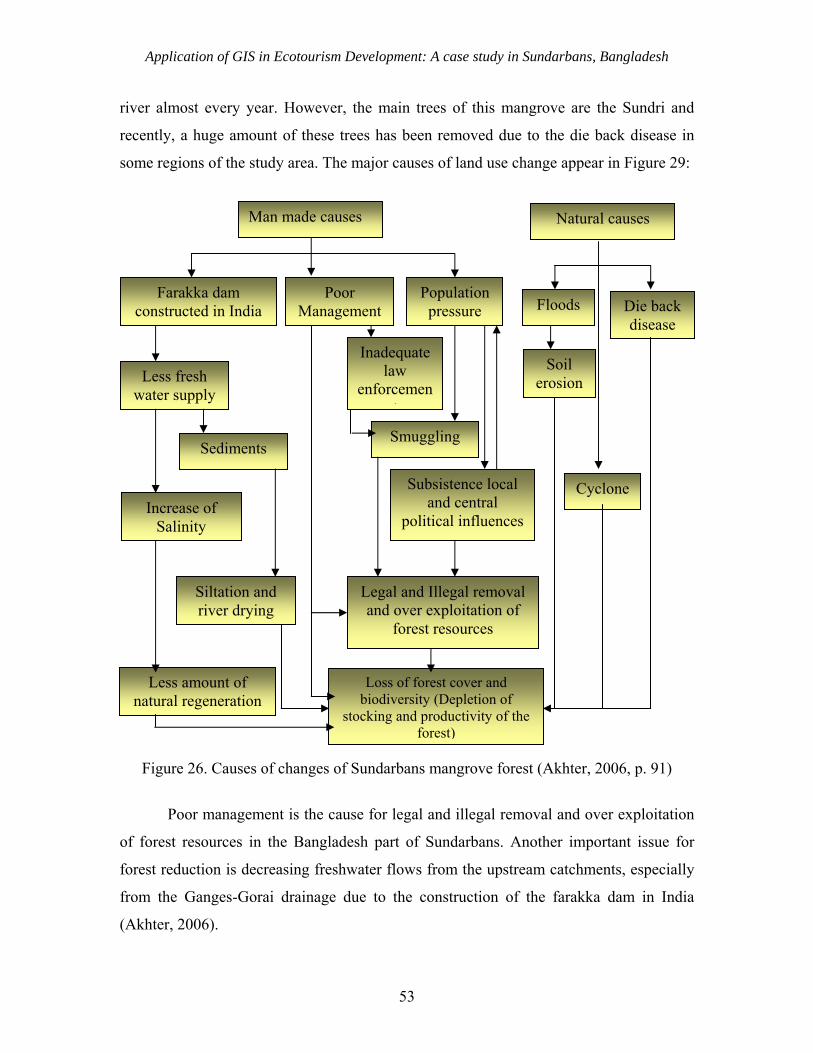
Application of GIS in Ecotourism Development: A case study in Sundarbans, Bangladesh
river almost every year. However, the main trees of this mangrove are the Sundri and
recently, a huge amount of these trees has been removed due to the die back disease in
some regions of the study area. The major causes of land use change appear in Figure 29:
Smuggling
Man made causes
Farakka dam constructed in India
Poor Management
Population pressure
Inadequate law
enforcement
Subsistence local and central
political influences
Less fresh water supply
Sediments
Increase of Salinity
Siltation and river drying
Less amount of natural regeneration
Loss of forest cover and biodiversity (Depletion of
stocking and productivity of the forest)
Legal and Illegal removal and over exploitation of
forest resources
Floods Die back disease
Soil erosion
Cyclone
Natural causes
Figure 26. Causes of changes of Sundarbans mangrove forest (Akhter, 2006, p. 91)
Poor management is the cause for legal and illegal removal and over exploitation
of forest resources in the Bangladesh part of Sundarbans. Another important issue for
forest reduction is decreasing freshwater flows from the upstream catchments, especially
from the Ganges-Gorai drainage due to the construction of the farakka dam in India
(Akhter, 2006).
53

Application of GIS in Ecotourism Development: A case study in Sundarbans, Bangladesh
5.3 Ecotourism and land use change in Sundarbans
In Bangladesh, the tourism industry is growing rapidly especially in two
destinations which are internationally recognized (Appendix H). These are the
Sundarbans mangrove forest and Cox’s Bazar sea beach. The tourism industry is
frequently referenced in Bangladesh as a highly important stakeholder/user group with
the potential to provide extensive benefits to the Sundarbans Reserve Forest (USAID,
2009, p. 6). However, recently, even though Sundarbans received 100,000 visitors only
2% of these were foreign while the rest were domestic visitors (Forest Department,
2009). The domestic visitors increased consequently (Appendix B) and the impact of
tourism increased rapidly due to environmental damages. Nevertheless, tourism is not as
problematic compared to other factors of land use change in the study area. However, the
rapid increase of visitors in Sundarbans can be considered a warning signal for tourism
development in this region. Indeed, ecotourism planning is must needed for sustainable
tourism development in this reserve mangrove forest.
5.4 Ecotourism planning
Ecotourism has increased very quickly in recent years especially in developing
countries. However, in western society, travel to experience wild nature is not a new
phenomenon. Historically, it started in 1872 in the United States with Yellowstone Park,
in 1879 in Australia with Royal Park and in 1885 in Canada with Banff Park and Niagara
Falls, when governments set aside natural areas for protection and recreation in the form
of national parks (Eagles, 1997).
Due to the rapid growth of ecotourism the industry has begun with a challenge for
decision maker, how they manage tourism negative impact, therefore, planning is a must
for future development in a sustainable way to protect the natural environment of
ecotourism destinations. In recent years, policy makers have begun to advocate
sustainable destination planning for tourism with a set of management approaches that
can help ensure that tourism is not environmentally damaging, contributes to
conservation and local community development, and provides opportunities for enhanced
conservation and sustainable development.
54

Application of GIS in Ecotourism Development: A case study in Sundarbans, Bangladesh
5.4.1 Various issues of ecotourism planning
Ecotourism destinations are always environmentally sensitive because ecotourism
activities directly involve various environmental phenomena including bird watching,
trekking, mountaineering, horse riding and elephant riding within the forest wilderness
trail, staying in natural caves, studying about flora and fauna, simple bush walking,
fishing, animal behavior study, ecological studies. The United Nations World Tourism
Organization (UNWTO) published an important guideline in 2004 to Indicators of
Sustainable Development for Tourism Destinations. This guideline is the result of efforts
from over 60 authors working in 20 countries, covering a wide variety of case
circumstances for tourism development in both developed and developing countries. Its
intent is to provide a process by which policy makers can use research based indicators to
make decisions on guiding the development of sustainable tourism. According to
UNWTO, sustainability issues and indicators in tourism destination development are the
following:
Wellbeing of Host Communities
Community Participation in Tourism
Tourist Satisfaction
Health and Safety
Capturing Economic Benefits from Tourism
Sustaining Cultural and Natural Heritage
Managing Scarce Natural Resources
Limiting Impacts of Tourism Activity and Controlling
Use Intensity
Products Development and Marketing
Sustainability of Tourism Operations and Services
Baseline Issues and Baseline Indicators of Sustainable Tourism
The above mentioned tourism planning issues are overall applicable for any kinds of
sustainable destinations management and planning. However, Eagles (1997) mentioned
55

Application of GIS in Ecotourism Development: A case study in Sundarbans, Bangladesh
some key points for planning and management of ecotourism destinations based on his
study. These are the following:
Tourist travel motives and marketing
Management of environmental quality
Limits of acceptable change
Management of tourist use
Allocation of access
Market specialisation
Management of recreation conflict
Enforcement and monitoring
Consumer assurance of quality
Facility design
Community development
Financial Viability
Public and Private Sector Co-operation
The current study considered some key issues for planning Sundarbans for
ecotourism development according to UNWTO destinations guideline.
5.4.2 Ecotourism planning in Sundarbans
Tourism has been considered recently as an important component of the
management and development of the Sundarbans. In recent years, Sundarbans received a
lot of international and domestic visitors especially after 2007 when cyclone Sidr
destroyed a large portion of this forest and international media concentrated on this story.
Indeed, the impact of tourism increased rapidly due to environmental damage but there is
no consistent analysis of tourism impacts on the ecosystem or neighboring communities.
Moreover, in the Bangladesh part of Sundarbans there is no existing tourism plan in
effect to help measure how tourism management is functioning at present, nor is there
any management authority within the reserve that has tourism management as part of its
mandate. Therefore, ecotourism planning is necessary for sustainable tourism
development and forest management in this region.
56

Application of GIS in Ecotourism Development: A case study in Sundarbans, Bangladesh
The current study has considered various planning issues related to Sundarbans
and a set of GIS databases has been prepared for ecotourism planning. The ultimate goal
of the GIS database was fixed to produce an ecotourism map for Sundarbans. The GIS
database which was prepared is based on some specific information as well as
administrative information, present land use, accessibility, and existing tourism facilities
in Sundarbans. In the process of mapping, initially land use change has been identified
from Landsat satellite TM, ETM and MSS data over last 33 years (1977-2010) then
present land use specified from Landsat TM 2010. In the second stage, a vector map
prepared based on LGED map included accessibility map, existing tourism facilities map
and administrative information map. Finally, all individual maps ware overlapped to
produce an ecotourism map of Sundarbans (Figure 34). All vector maps are as follows
(Figure 30-34):
Figure 27. Administrative information map of Sundarbans
N
EW
S
Administrative Information Map of Sundarbans, Bangladesh
89º00´ 89º30´ 90º00´
22º30´ 22º30´
22º10´
21º50´
89º00´ 89º30´ 90º00´
21º50´
22º10´
10 0 10 20 Kilometers
Bay of Bengal
India
Bangladesh
Katka
Hiron Point
Sibsha R
iver
Sar
ankh
ola
Ran
ge
Cha
nd
pai R
ang
eKhu
lna
Ra
ng
e
Bur
igoa
lina
Ran
ge
c
c
c cc c
c
c
cc
c
cc c
c
c
ccc
c cccc
ccc
c
cccccccccccc
c cccccc
cccccc
c
ccc
cc
cccccccccc
cc
ccc
ccc
c
cc
c c
cc
cc
c
c
ccc
c
Ha
riaba
ndha
Riv
er
Rai
mon
gal River
Jam
un
a R
ive
r
Ma
lan
ch
a R
ive
Sib
sa
Riv
er
P as u
r R
ive
rB
alesw
ar R
iver
Bay of Bangal
Vegetation
Water Bodies
c Range Office in Sundarbans
LEGEND
57

Application of GIS in Ecotourism Development: A case study in Sundarbans, Bangladesh
N
EW
S
Sundarbans, Bangladesh
90º00´
22º30´
90º00´
21º50´
22º10´
LEGEND
Water Bodies
Accessibility Map of
89º00´ 89º30´
22º30´
22º10´
21º50´
89º00´ 89º30´
Kilometers
Bay of Bengal
Bangladesh
Figure 28. Accessibility map of Sundarbans
Figure 29. Land use map of Sundarbans
10 0 10 20
India
Kat
Hiron Point
Sibsha R
iver
Cha
nd
pa
i Ra
ng
eKhu
lna
Ra
ng
e
Bu
rig
oalin
a R
ang
e
ka
Sar
ank
hola
Ran
ge
Haria
band
ha R
iver
Rai
mongal Rive
r
Jam
un
a R
ive
r
Ma
lanc
ha R
ive
Sibsa
Rive
r
P asur
Ri v
er
B
Balesw
ar R
iver
ay of Bangal
N
EW
S
Landuse Map of Sundarbans, Bangladesh
89º00´ 89º30´ 90º00´
22º30´ 22º30´
22º10´
21º50´
89º00´ 89º30´ 90º00´
21º50´
22º10´
LEGEND
Sundari
Passur
Others
Keora
Goran
Gewa
10 0 10 20 Kilometers
India
Bangladesh
Katka
Hiron Point
Sibsha R
iver
Sar
ank
hola
Ran
ge
Cha
nd
pa
i Ra
ng
eKhu
lna
Ra
ng
e
Jam
un
a R
ive
r
Ma
lanc
ha R
ive
Sibsa
Rive
r
Bay of Bangal
58
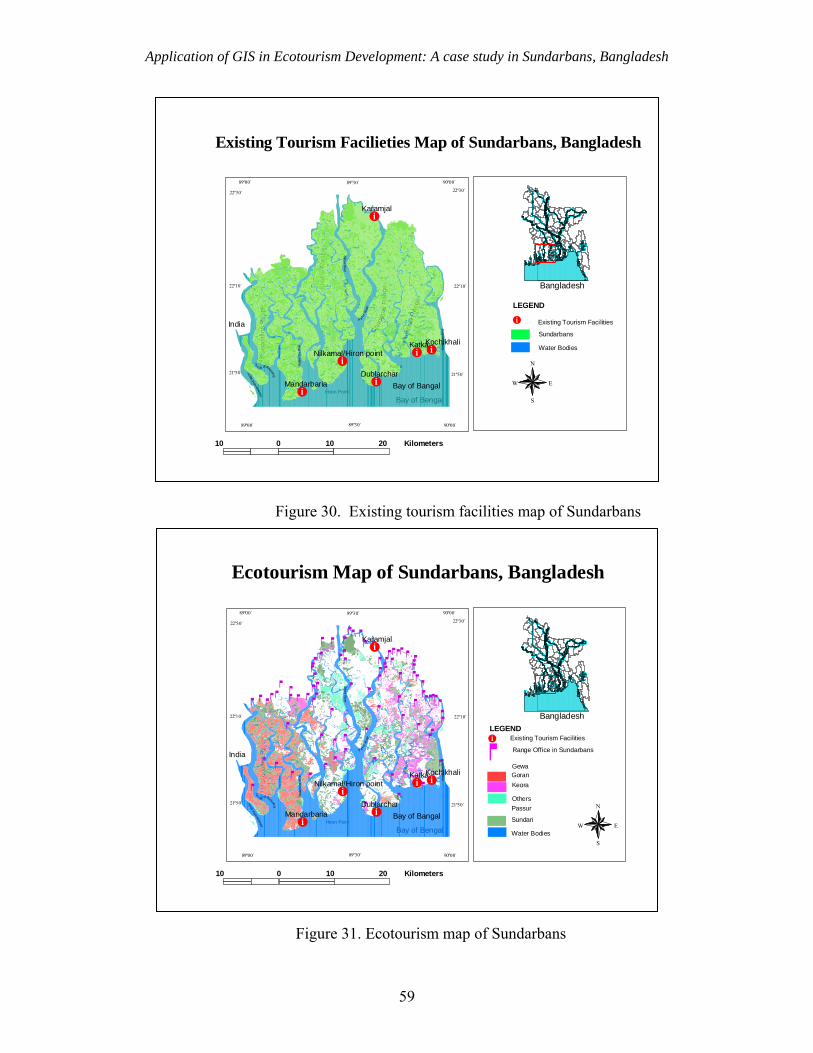
Application of GIS in Ecotourism Development: A case study in Sundarbans, Bangladesh
59
Figure 30. Existing tourism facilities map of Sundarbans
Figure 31. Ecotourism map of Sundarbans
N
EW
S
Map of Sundarbans, Bangladesh
90º00´
22º30´
90º00´
21º50´
22º10´
LEGEND
Existing Tourism Facilities
Existing Tourism Facilieties
89º00´ 89º30´
22º30´
22º10´
21º50´
89º00´ 89º30´
#þ
Sundarbans
Water Bodies
10 0 10 20
Bay
India
Kilometers
of Bengal
Bangladesh
Katka
Hiron Point
Sibsha R
iver
Sa
Cha
nd
pai
Ra
ngeK
huln
a R
an
ge
Bur
igoa
lina
Ran
ge
r ank
hola
Ran
ge
#þ
#þ
#þ
#þ #þ
#þ
Katka
Karamjal
Dublarchar
Kochikhali
Mandarbaria
Nilkamal/Hiron point
Ha
riaba
ndha
Riv
er
Rai
mon
gal River
Jam
un
a R
ive
r
Ma
lan
ch
a R
ive
Sib
sa
Riv
er
P as ur
Riv
er
Ba
lesw
ar R
ive
r
Bay of Bangal
N
EW
S
Ecotourism Map of Sundarbans, Bangladesh
89º00´ 89º30´ 90º00´
22º30´ 22º30´
22º10´
21º50´
89º00´ 89º30´ 90º00´
21º50´
22º10´
LEGENDExisting Tourism Facilities
Range Office in Sundarbans
Sundari
Passur
Others
Keora
Gewa
Water Bodies
#þ
cGoran
10 0 10 20 Kilometers
Bay of Bengal
India
Bangladesh
Katka
Hiron Point
Sibsha R
iver
Sar
ank
hola
Ran
ge
Cha
nd
pai
Ra
ngeK
huln
a R
ang
e
Bu
rigoa
lina
Ran
ge
c
c
c
c cc
c
c
c cc c
c
cc
c
c
ccc
c cccc
ccc
c
cccccccccccc
c cccccc
ccccc
c
ccc
cc
cccccccccc
cc
ccc
ccc
c
cc
c c
cc
cc
c
c
ccc
c
Katka
Karamjal
Dublarchar
Kochikhali
Mandarbaria
Nilkamal/Hiron point
Haria
band
ha R
ive
r
Rai
mong
al River
Jam
un
a R
ive
r
Ma
lanc
ha
Riv
e
Sib
sa
Rive
r
P as u
r Ri v
erB
alesw
ar R
ive
r
Bay of Bangal #þ
#þ
#þ
#þ #þ
#þ

Application of GIS in Ecotourism Development: A case study in Sundarbans, Bangladesh
In the planning process the present situation of tourism and existing tourism
facilities and the lack of tourism facilities in Sundarbans are considered prime factors for
a proposed plan for ecotourism development in this region.
5.4.3 Proposed plan for ecotourism development in Sundarbans
‘The Sundarbans should be considered a site for low volume high-cost ecotourism
rather than for a wider, less affluent mass market’ (Rahman, 2000. p-147) due to difficult
terrain of mangrove area. In order to plan for ecotourism development in Sundarbans
ecosystem protection is the first issue, because tourism development in an environmental
sensitive area generally creates problems for natural ecosystem. The current study found
that this mangrove has been reduced since long because of various human activities and
natural causes. In recent years ecotourist flows into this region have increased radically
therefore, ecotourism planning has become an important issue for reduced future
environmental damages.
For sustainable tourism planning in Sundarbans 6 major components are proposed
in this study to developing ecotourism in this region (Figure 35).
Ecosystem protection
Community involvement
Government & NGO coo
Figure 32. Major components of tourism planning in Sundarbans, Bangladesh
Ecotourism Development
peration
Monitoring tourism effect
Tourism facilities develo
Marketing
pment
60
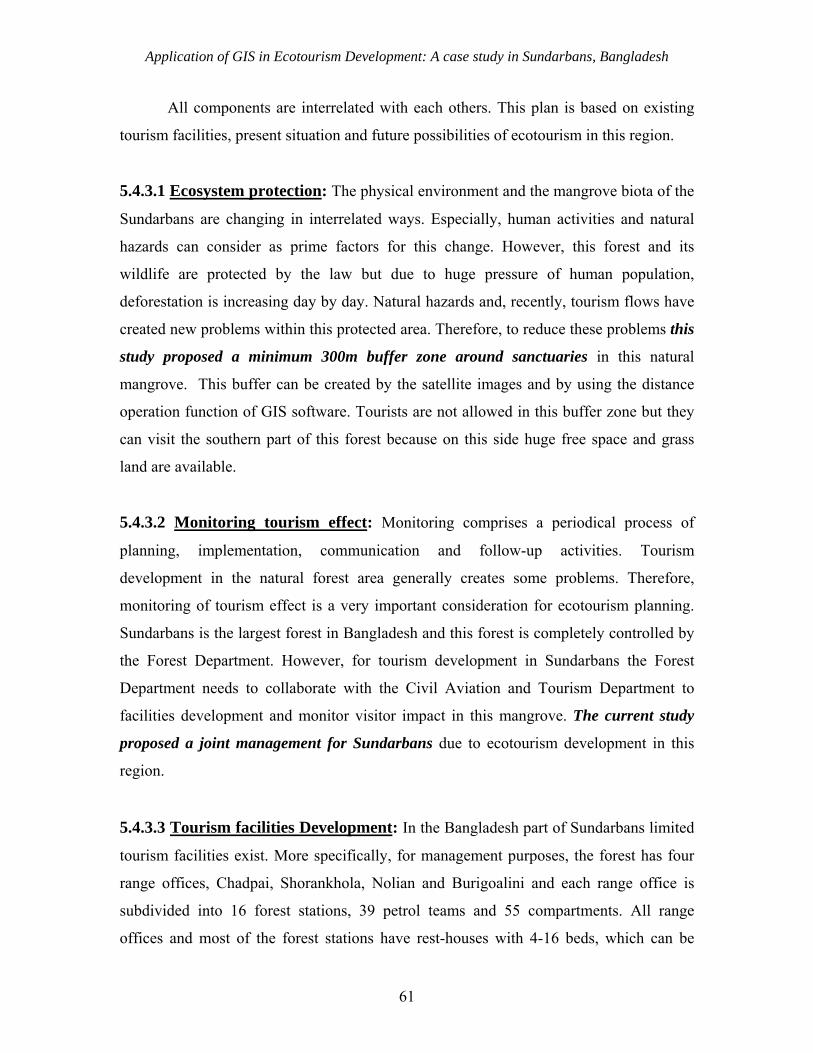
Application of GIS in Ecotourism Development: A case study in Sundarbans, Bangladesh
All components are interrelated with each others. This plan is based on existing
tourism facilities, present situation and future possibilities of ecotourism in this region.
5.4.3.1 Ecosystem protection: The physical environment and the mangrove biota of the
Sundarbans are changing in interrelated ways. Especially, human activities and natural
hazards can consider as prime factors for this change. However, this forest and its
wildlife are protected by the law but due to huge pressure of human population,
deforestation is increasing day by day. Natural hazards and, recently, tourism flows have
created new problems within this protected area. Therefore, to reduce these problems this
study proposed a minimum 300m buffer zone around sanctuaries in this natural
mangrove. This buffer can be created by the satellite images and by using the distance
operation function of GIS software. Tourists are not allowed in this buffer zone but they
can visit the southern part of this forest because on this side huge free space and grass
land are available.
5.4.3.2 Monitoring tourism effect: Monitoring comprises a periodical process of
planning, implementation, communication and follow-up activities. Tourism
development in the natural forest area generally creates some problems. Therefore,
monitoring of tourism effect is a very important consideration for ecotourism planning.
Sundarbans is the largest forest in Bangladesh and this forest is completely controlled by
the Forest Department. However, for tourism development in Sundarbans the Forest
Department needs to collaborate with the Civil Aviation and Tourism Department to
facilities development and monitor visitor impact in this mangrove. The current study
proposed a joint management for Sundarbans due to ecotourism development in this
region.
5.4.3.3 Tourism facilities Development: In the Bangladesh part of Sundarbans limited
tourism facilities exist. More specifically, for management purposes, the forest has four
range offices, Chadpai, Shorankhola, Nolian and Burigoalini and each range office is
subdivided into 16 forest stations, 39 petrol teams and 55 compartments. All range
offices and most of the forest stations have rest-houses with 4-16 beds, which can be
61

Application of GIS in Ecotourism Development: A case study in Sundarbans, Bangladesh
hired in advance at rates of US$ 5-10 per night (FAO/UNDP 1994). However, it is not
enough to develop ecotourism in Sundarbans. Moreover, there is no scope to develop any
commercial hotel or tourism infrastructure (road, resort center, Children parks) inside the
forest. Therefore, this research proposed development tourism facilities in Khulna city
(Appendix-F) which is considered the gateway city to the Sundarbans, where all tourism
modern facilities can be developed. Moreover, Mongla is a small port city in this region
and from this city it is simply possible to go Karamjal and Katka tourist sport in
Sundarbans by boat. Mongla city can be considered another option for tourism
infrastructure development in this region.
5.4.3.4 Government and nongovernmental cooperation: For tourism development
to occur government and nongovernmental organization cooperation is a must.
Government should be a policy maker and all other stockholders should be involved in
tour operating and visitor hospitality management. In Sundarbans, a few tour operators
are involved in these activities but the government urgently needs support them for
training, proper guideline, financing for skill development. This study proposed to
collaboration for both government and non government organizations. The
Governments can start special scheme to provide low interest loan for tourism invertors.
5.4.3.5 Community involvement: Local people’s interest is a big issue when a tourism
destination is developed according to a plan. Local cultures, traditions and costumes can
also attract tourists to visit a tourist site. These provide an opportunity to share experience
and culture for both host communities and travelers. There are no permanent residents
inside the Sundarbans but almost 2 million peoples are living around this reserve forest.
All people depend on this forest for earning their livelihood. For planning tourism in this
region, the local people can be considered as a part of hospitality services, because they
can assist tourists according to their experience as guides in the forest. Moreover, they
can be employed in the service industries operating or accompanying jungle boat trips
and wilderness trails and assisting in transport operation.
In addition, small handicrafts industries, including basket work, weaving, leather
goods, brass ware, jute products and clay pots can be established in nearby villages. The
62
Application of GIS in Ecotourism Development: A case study in Sundarbans, Bangladesh
study recommended that local people should be involved in the planning process under
participatory approaches, meaning when decision makers prepare a plan then they must
consider local people’s opinions and their interest.
5.4.3.6 Tourism marketing: Tourism marketing is considered another important issue
in tourism planning. Due to technological developments tourist are able to research for
necessary information before visiting a place. Therefore, all necessary information needs
to be included in a national portal and this information needs to be regularly updated.
Moreover, a tourism destination should develop based on a target tourist’s market.
Indeed, marketing strategy should focus according to target groups and target traveler’s
motives. Generally, Bangladesh focused on international media as a country of natural
hazards but most people around the world are not informed that this country has a major
contribution of ‘world largest mangrove forest of Sundarbans’. The current research
proposed to prepare a marketing strategy for both international and domestic tourists.
The next and final chapter will discuss the conclusions and additional
recommendations will be made considering ecotourism planning and development in the
Bangladesh part of Sundarbans.
63

Application of GIS in Ecotourism Development: A case study in Sundarbans, Bangladesh
64
CHAPTER 6
6. CONCLUSIONS AND RECOMMENDATIONS
This chapter provides the conclusions and recommendations for ecotourism
planning in the Bangladesh part of Sundarbans. Moreover, the study limitations and
future research scope are included in this chapter.
6.1 Conclusion
Tourism is a highly complex activity and, thus, requires tools that aid in effective
decision making and fulfill the competing economic, social, and environmental demands
of sustainable development. Applications of GIS in tourism and recreation planning
illustrate that GIS is a strong and effective tool that can aid in tourism planning and
decision-making (Giles, 2003). This technology can play an important role in auditing
environmental conditions, examining the suitability of locations for proposed
developments sites, impact assessment for tourism activities, visitor flow management,
and identifying conflicting.
This study evaluates the potentiality of GIS for ecotourism planning in
Sundarbans and GIS has been used for ecotourism planning as a decision supporting
tools. The study found that GIS technology is a set of effective tools for ecotourism
planning in Sundarbans. Using these tools it is possible to identify land use change over
time. Therefore, it can be recommended that GIS can be used for monitoring tourism
effects over time in an environmentally sensitive region.
The current study investigated Sundarbans to prepare ecotourism planning for
sustainable development in this region. In the planning process the study considered
some important issues related to ecotourism planning including present land use of
Sundarbans, land use change over the last 33 years (1977-2010), causes of land use
change, existing tourism facilities, present status of tourism, and lack of tourism facilities,
accessibility information and administrative information. All information was assembled
to produce an ecotourism map of Sundarbans. GIS tools assisted in the mapping process.
Application of GIS in Ecotourism Development: A case study in Sundarbans, Bangladesh
The study found that, the land use of Sundarbans changed over the study period
and the density of forest declined at the same time. However, the change occurred
because of various human activities and climate change effects. Human activities are
includes fishing, agriculture, shrimp farming, wood cutting, timber production and
tourism. However, tourism has not yet been considered responsible enough for these
effects as it is at a very early stage but the rapid increase of visitors in Sundarbans is
considered a warning signal regarding tourism development and its possible negative
effects in this region. The present land use of the Sundarbans has been classified from
Landsat TM images (2010).
For ecosystem protection in Sundarbans this study proposed a 300 meters buffer
zone around the sanctuaries. The Sundarbans of Bangladesh already protected by the law
and any kinds of damages (flora and fauna) prohibited within this reserve forest.
Therefore, the authority of this forest established 3 sanctuaries for wildlife protection but
this study proposed 300 meters buffer zone around the existing sanctuaries (Appendix-G)
for tourism planning. Because, tourism activities generally make some environmental
problems due to various activities of tourist so, it is important to make a save distance
from sanctuaries.
The involvement of local people can be considered as a part of hospitality
services in ecotourism industries in this region, because they can assist tourists according
to their experience as guides in the forest. Moreover, they can be employed in the service
industries operating or accompanying jungle boat trips and wilderness trails and assisting
in transport operation. This study recommended that the local people should be involved
in the planning process under participatory approaches which is refers, when decision
makers prepare a plan, they must consider local people’s opinions and their interest.
The number of visitors in Sundarbans has been increasing regularly in recent
years. Therefore, it is important for the Sundarbans authority to make an ecotourism plan
for sustainable tourism management in this region.
6.2 Recommendations
Based on the study some important planning issues are recommended as follows:
Ecosystem protection will get first priority in the ecotourism planning in
this region
65

Application of GIS in Ecotourism Development: A case study in Sundarbans, Bangladesh
Local peoples interest must be involved in planning
A joint management within all responsible departments (Forest, Tourism,
Environment & Local govt.) required for monitoring, evolution and
development.
Close collaboration for both countries management (Bangladesh-India) is
essential for sustainable development in this region.
Various tourism facilities can be developed in Khulna city and Mongla
area which are includes;
o Information and education center for both international and
domestic visitor
o National information portal based on web pages
o Hotel, motel, and parks
Establishment of a Mangrove Interpretation and Visitor Centre in
Karamjal, at the boundary of Sundarbans
Government can help interested tour operators organization by
o Provide easy license
o Low interest loan
o Training and guidelines
Product promotions for national and international tourist
o Published photography book of Sundarbans
o Wildlife videos
o Environmental awareness issues
Identification and promotion of local craft products from micro-enterprises
of the impact zone
Developed environmental friendly boat for safety journey in Sundarbans
Marketing strategy for both domestic and international tourists.
All above recommendations can be considered guidelines for ecotourism planning
in the Bangladesh part of Sundarbans. The Sundarbans mangrove region is divided by an
international boundary between Bangladesh and India; therefore, both countries must
collaborate to promote sustainable development in the entire region.
66

Application of GIS in Ecotourism Development: A case study in Sundarbans, Bangladesh
Khulna city is the gateway city of Sundarbans forest (Appendix F). Moreover, this
city is a divisional city in Bangladesh. It has all municipal facilities, airport and good
transport system with the capital city of Dhaka including railway, road, water and air.
Therefore, Khulna can be developed as the main tourism infrastructure area for
ecotourism development in Sundarbans.
6.3 Study limitations and future research scope
There are some specific limitations, which should be addressed as a means of
improvement for further study. This study was prepared based on raw satellite data and
field ground truth information used for image processing but it was not possible to carry
out a questionnaire survey in the field because of time limits. Planning is never complete
without local people’s opinions included. Therefore, this study should not be considered a
complete strategy for ecotourism planning in Sundarbans. Yet, this research will expose
opportunities for further research and investigation, and help decision makers to review
what options exist for improving tourism facilities in Sundarbans and how they can better
ecotourism planning especially, from a point of reducing the negative impacts from
tourism development in this region.
Another important research is necessary in this region for local population’s
development. Because, local peoples are completely depends on this forest for their living
hoods. Therefore, occupations pattern change is must for sustainable forest management
and ecotourism developments in Sundarbans.
67

Application of GIS in Ecotourism Development: A case study in Sundarbans, Bangladesh
68
REFERENCES Abu Syed, M. & Hussin, Y.A. (2005). Assessment of fragmented mangroves of the Sundarbans, Bangladesh using optical and radar satellite images. In: Asian journal of geoinformatics, 5 (3), 87-99. Allen, J.S., Lu, K.S, Potts, T.D (1999). A GIS-based analysis and prediction of parcel land-use change in a coastal tourism destination area. Presented at the 1999 World Congress on Coastal and Marine Tourism Vancouver, British Columbia, Canada. Akter, M. (2006). Remote sensing for developing an operational monitoring scheme for the Sundarban Reserved Forest, Bangladesh. (Doctoral dissertation), Technische Universität Dresden, Germany.
Bahaire M., & Elliot-White. (1999). The Application of Geographical Information Systems (GIS) in Sustainable Tourism Planning: A Review. Journal of Sustainable Tourism, 7(2), 159-174.
Banerjee, U.K., Smrita,K., Paul. S.K. & Sudhakar, S. (2002). Remote Sensing and GIS based ecotourism planning: A case study for western Midnapore, West Bengal, India. ESRI, publications (GISdevelopment.net). Bangladesh Forest Department (BFD) (2008). Sidr and Coastal Forest Damages report.
Banglapedia (The National Encyclopedia of Bangladesh). (2006): Asiatic Society, Dhaka, Bangladesh.
Barlow, C.D. A.,(2009). The Sundarbans tiger adaptation, population status, and conflict management. (Doctoral dissertation), the university of Minnesota, USA. Beaumont, J.R. (1991). GIS and Market Analysis. In Maguire, D.F., Goodchild, M.F. & Rhind, D.W. (Eds.), Geographical Information Sptems,2, 139-151. Beedasy, J. & Whyatt, D. (1999), Diverting the tourists: A spatial decision-support system for tourism planning on a developing island. ITC-Journal, 3-4. Bhandari, S.P., Hussin, Y.A. & Sharifi, M.A. (2004). Detection and characterization of selective logging using remote sensing and GIS in tropical forest of East Kalimantan. In: Asian journal of geoinformatics, 3, 57-70. Blower, J. (1985). Sunderbans Forest Inventory Project, Bangladesh. Wildlife Conservation in the Sundarbans. Project Report 151. Overseas Development Administration, Land Resources Development Centre, Surbiton, U.K.
Blower, J.H. (1985). Wildlife conservation in the Sundarbans: Sundarbans forest inventory project, Bangladesh, 151, Overseas Development Administration, Surrey, England
Application of GIS in Ecotourism Development: A case study in Sundarbans, Bangladesh
Boyd, S.W., Butler, R.W., Haider, W., Perera, A., (1994). Identifying areas for ecotourism in northern Ontario: application of a geographic information system methodology. Journal of Applied Recreation Research 19 (1), 41-66. Canada Centre for Remote Sensing (CCRS), Fundamentals of Remote Sensing, National Resources Canada. Retrieved April 19, 2010 (http://www.ccrs.nrcan.gc.ca). Chen, R.J.C (2007). Geographic information systems (GIS) applications in retail tourism and teaching curriculum. Journal of Retailing and Consumer Services, 14, 289–295. Davis, H. D., & J. A. Simmons (1982). World Bank experience with tourism projects. Tourism Management, 3(4), 212-17. Dye, A. S & Shaw, L.S (2006). A GIS-based spatial decision support system for tourists of Great Smoky Mountains National Park. Journal of Retailing and Consumer Services, 14, 269–27. Eagles, Paul F. J. (1997). International Ecotourism Management: Using Australia and Africa as Case Studies. Retrieved May19, 2010 (http://www.ahs.uwaterloo.ca/rec/ecotour.htm). Elliott-White, M.P., Finn, M., (1997). Growing in sophistication: the application of geographic information systems in post-modern tourism marketing. Journal of Travel and Tourism Marketing 7 (1), 65–84. Encyclopedia of Earth (2010), Sundarbans, Bangladesh. Retrieved April 25, 2010 (http://www.eoearth.org/article/Sundarbans,_Bangladesh). Farsari, Y. & Prastacos, P. (2004) GIS applications in the planning and management of tourism. In A. A. Lew, C. M. Hall, & A. M. Williams (Eds.), A Companion to Tourism, 596-607. Fauzi, A., Hussin, Y.A. & Weir, M.J.C. (2005) A comparison of neural networks and maximum likelihood remotely sensed data classifiers to detect logged - over tropical rain forest in Indonesia. International journal of geoinformatics, 1(2), 47-5. Foody G. M., Campbell, N A., Trodd, N. M., & Wood, T. F. (1992). Derivation and Applications of Probabilistic Measures of Class Membership from the Maximum-likelihood Classification. Photogrammetric Engineering & Remote Sensing, 58(9), 1335-1341. Fung, T. (1990). An assessment of TM imagery for land-cover change detection. IEEE Transactions on Geoscience and Remote Sensing, 28(4), 681-84. Fung, T. (1990). An assessment of TM imagery for land-cover change detection. IEEE Transactions on Geoscience and Remote Sensing, 28(4), 681-84.
69
Application of GIS in Ecotourism Development: A case study in Sundarbans, Bangladesh
Fung, T. & Wong, F. K.K.(2007). Ecotourism planning using multiple criteria evaluation with GIS', Geocarto International, 22(2), 87-105.
Gopal, B & Chauhan, M. (2006). Biodiversity and its conservation in the Sundarban Mangrove Ecosystem. Aquat. Sci. 68, 338–354
Gribb, W. (1991). Integrating Visitor Surveys, Environmental factors, and GIS into Recreation Planning: Site Development at Grayrocks Reservoir, Wyoming. GIS/LIS .91 Proceedings, 1, American Congress on Surveying and mapping, US. Gunn, C.A., and Larsen, Terry R. (1988).Tourism Potential-Aided by Computer Cartography. Aix-en-Provence, France: Centres des Hautes Etudes Touristiques. Hasse, Julia C. & Milne, S. (2005). Participatory Approaches and Geographical Information Systems (PAGIS) in Tourism Planning. Tourism Geographies, 7 (3), 272- 289 Hernadez, D., Bennison, S., Cornelius, H., Scholten, M., Van Der Beek & M. Biasiotto, Explaining Retail GIS: The Adoption, Use and Development of GIS within Retailing in the Netherlands, the UK and Canada. Netherlands Geographical Studies. Heywood, D.I. (1994). Mountain regions and geographic information systems: an overview. Mountain Environments and Geographic Information Systems. Eds. Martin F. Price and D. Ian Heywood. Bristol: Taylor & Francis, Inc, 1-24. Hossain, M. S., Chowdhury S.R., Das N.G., Sharifuzzaman S.M., & Sultana A. (2008). Integration of GIS and multicriteria decision analysis for urban aquaculture development in Bangladesh. Landscape and Urban Planning, 90, 119–133. Hossain, M. S., (2001). Biological aspects of the coastal and marine environment of Bangladesh. Ocean and Coastal Management, 44, 261-282. Hossain, S., Lin C., Kwei & Hussain, M. Z., (2003). Remote Sensing and GIS Applications for Suitable Mangrove Afforestation Area Selection in the Coastal Zone of Bangladesh. Geocarto International, 18(1), 61-65. Hussin, Y.A., Mahfud, M., & Zuhair M. W., (1999). Monitoring Mangrove Forests using Remote Sensing and GIS. GIS development proceedings, ACRS Iftekhar, M. & Islam, M. (2004). Degeneration of Bangladesh’s Sundarbans Mangroves: a Management Issue. Integrated Coastal Zone Management Plan Project, Dhaka, Bangladesh. Integrated Protected Area Co-Management (IPAC): Strengths, Weaknesses Opportunities, &Threats (SWOT) of Tourism in the Sundarbans Reserve Forest, report 2009, USAID.
70

Application of GIS in Ecotourism Development: A case study in Sundarbans, Bangladesh
Islam, Md. S. & Wahab, M. A (2005). A review of the present status and management of mangrove wetland habitat resources in Bangladesh with emphasis on mangrove fisheries and aquaculture. Hydrobiologia, 542, 165–190. Ismail,M.H & Jusoff, K (2008). Satellite Data Classification Accuracy Assessment Based from Reference Dataset. International Journal of Computer and Information Science and Engineering, 2(2), 96-102. Kabir, D. S., & Muzaffar, S.B. (2002). A review of the present state of the protected areas of Bangladesh. Bangladesh Environment. BAPA Bangladesh Poribesh Andolon, Dhaka. Khan, M. (1986). Wildlife in Bangladesh mangrove ecosystem. Journal of the Bombay Natural History Society, 83, 32-48. Kim. D. (2002). GIS for a Policy Decision Support in National Tourism Portal. Retrieved April 10, 2010 (http://proceedings.esri.com/library/userconf/proc04/docs/pap1277.pdf). Kundu, D. P. (1990). Landsat Image Enhancement and Analysis Approach for Geological Studies of Central Part of Goa, India. Journal of the Indian Society of Remote Sensing, 18, (3), 32-42. Malczewski, J., (1996). A GIS-based approach to multiple criteria group decision making. Int. J. Geog. Info. Sys., 10, 955–971. Mas, J.F., (1999). Monitoring land cover changes: a comparison of change detection techniques. Int. J. Remote Sens., 20, 139–152. Michael, E. & Marc, P. (2006) Mangrove Forest Cover Change in the Bangladesh Sundarbans from 1989-2000: A Remote Sensing Approach. Geocarto International, 21, (1), 5-12. Minh, N.D., (2007). Building a GIS database for ecotourism development in Ba Vi District, Ha Tay Province, Vietnam. VNU Journal of Science, Earth Sciences, 23, 146‐151. Mowforth & Munt (1998) A. Mowforth and I. Munt, Tourism & sustainability: New tourism in the third world, Routledge, London, UK (1998). M. Wayne, G. (2003), GIS Application in Tourism Planning. GIS 340 – GIS Seminar. Nguyen, D. M. (2007). Building a GIS database for ecotourism development in Ba Vi District, Ha Tay Province. VNU Journal of Science, Earth Sciences, 23, 146-151. PAGE, S.J. & Dowling, R.K. ( 2002). Ecotourism. New York: Pearson.
71

Application of GIS in Ecotourism Development: A case study in Sundarbans, Bangladesh
Price, and Heywood, D.I. ( 1994). Mountain environments and geographic information systems. Taylor and Francis, 309 pp. Rahman, L.M (2000). The Sundarbans: A Unique Wilderness of the World. USDA Forest Service Proceedings RMRS,2,143-148
Reich, R.M. & Hussin, Y.A. (1993) Estimating average stand biomass for a regional forest inventory using radar backscatter. In: ITC journal : bulletin de l'ITC, 1, 82-87.
Rouse J. W., Haas R. H, Schell, J. A, Deering, D. W., (1973), Monitoring Vegetation Systems in the Great Plains with ERTS. Proceedings of The 3rd Earth Resources Technology Satellite-1 Symposium. Ryngnga, P. K., (2008). Ecotourism Prioritization : A Geographical Information System Approach. South Asian Journal of Tourism and Heritage, 1, 49-56. Salam , M.A., Lindsay, G., Ross & C. M. Beveridge (2000). Eco-tourism to protect the reserve mangrove forest the Sundarbans and its flora and fauna. Anatolia,11 (1), 56-66. Schaller , T.D. (1999), Indigenous Ecotourism and Sustainable Development: The Case of Río Blanco, Ecuador. Retrieved April 30, 2010 (http://www.eduweb.com/schaller/RioBlancoSummary.html) Selman, P., Davidson, D., Watson, A. & Winterbotomm, S. (1991). GIS in Rural Environmental Planning: Visual and LandUse Analysis of Major Development Proposals. Town Planning Review, 62 (2), 215-223. Sujan, S. (2009). Climate Change, Livelihood and Human Rights: A Case Study. Norwegian University of Science and Technology (NTNU), Trondheim, Norway. UNESCO World Heritage Committee (2002). Report on the 26th Session of the Committee. Paris Wildlife In India (2001). Bengal Tiger Current Status. UNEP report (2008). Sundarbans national park, India the Sundarbans, Bangladesh. Viju, I.C. (1995). Issues in the management of the environment and natural resources in Bangladesh. Journal of Environmental Management, 45 (4), 319-332. Williams, P.W., Paul, J. & Hainsworth, D. (1996) Keeping track of what really counts: Tourism resource inventory systems in British Columbia, Canada. In L.C. Harrison and W. Husbands (eds) Practising Responsible Tourism: International Case Studies in Tourism Planning, Policy & Development, 404–421. Xinhao, W., & Stauffer, B., (1995). Application of GIS for Environmental impact analysis in a traffic relief study. Compuete., Environment., and Urban Systems, 19(4), 275-286.
72

Application of GIS in Ecotourism Development: A case study in Sundarbans, Bangladesh
73
APPENDICES
Appendix A. The location map of Bangladesh
Appendix B. The total number of visitors in recent in years in Sundarbans, Bangladesh
Categories 2008/2009 2007/2008 2006/2007 2005/2006 Native 97,721 85,473 95,102 91,039 Foreign 1,745 1,540 1,257 1,581 Total 99,466 87,013 96,359 92,620
Source: (USAID, 2009. p-6)

Application of GIS in Ecotourism Development: A case study in Sundarbans, Bangladesh
Appendix C. Statistics of damaged forest areas caused by cyclone Sidr in 2007
Type of damage Area(ha) Damage by Category (%)
Damage by total area of the
Sundarban (%) Highly affected
14,840 11 2.5
Moderately affected 91,420
69 15.2
Slightly affected
26,700 20 4.5
Total 132,960 100 22.2 Source: (CEGIS, 2007) Appendix D. Satellite image analysis error matrix Error Matrix Analysis of CLASS-ISO (columns: truth) against CLASS (rows: mapped) 1 2 3 4 5 -------------------------------------------------- | 1 | 0 0 0 13451 75738 1.0000 2 | 0 0 0 693627 266555 1.0000 3 | 0 266744 747886 270359 288981 0.5291 4 | 0 931596 532387 0 0 1.0000 5 | 0 313997 9054 0 0 1.0000 -------------------------------------------------- Total | 5470657 1512337 1289327 977437 631274 ErrorO | 1.0000 1.0000 0.4199 1.0000 1.0000 6 Total ErrorC ------------------------------ | | 1 | 93838 | 183027 1.0000 2 | 31413 | 991595 1.0000 3 | 14278 | 1588248 0.5291 4 | 7395 | 1471378 1.0000 5 | 2719 | 325770 1.0000 ------------------------------ Total | 149643 | 10030675 ErrorO | 1.0000 | 0.9254 ErrorO = Errors of Omission (expressed as proportions) ErrorC = Errors of Commission (expressed as proportions)
74

Application of GIS in Ecotourism Development: A case study in Sundarbans, Bangladesh
90% Confidence Interval = +/- 0.0001 (0.9253 - 0.9256) 95% Confidence Interval = +/- 0.0002 (0.9253 - 0.9256) 99% Confidence Interval = +/- 0.0002 (0.9252 - 0.9257) KAPPA INDEX OF AGREEMENT (KIA) ------------------------------ Using CLASS as the reference image... Category KIA ------------ ------------ 1 -1.1997 2 -0.1775 3 0.3928 4 -0.1080 5 -0.0672 CLASS-ISO Category KIA ------------ ------------ 1 -0.1097 2 0.5011 3 -0.1719 4 -0.0336 5 0.0000 Overall Kappa = 0.8163
Note: The Kappa coefficient lies typically on a scale between 0 and 1, where the
latter indicates complete agreement, and is often multiplied by 100 to give a percentage
measure of classification accuracy, Kappa values are also characterized into 3 groups: a
value greater than 0.80(80%) represents strong agreement, a value between 0.40 and 0.80
(40 to 80%) represents moderate agreement, and a value below 0.40(40%) represents
poor agreement.
According to the accuracy assessments (error matrix result) the present study
image analysis represents a strong agreement which is 81%.
75

Application of GIS in Ecotourism Development: A case study in Sundarbans, Bangladesh
Appendix E. Landsat TM & MSS bands characteristics
TM Bands Channel Wavelength
Range (µm) Application
TM 1 0.45 - 0.52 (blue) soil/vegetation discrimination; bathymetry/coastal mapping; cultural/urban feature identification
TM 2 0.52 - 0.60 (green)
green vegetation mapping (measures reflectance peak); cultural/urban feature identification
TM 3 0.63 - 0.69 (red) vegetated vs. non-vegetated and plant species discrimination (plant chlorophyll absorption); cultural/urban feature identification
TM 4 0.76 - 0.90 (near IR)
identification of plant/vegetation types, health, and biomass content; water body delineation; soil moisture
TM 5 1.55 - 1.75 (short wave IR)
sensitive to moisture in soil and vegetation; discriminating snow and cloud-covered areas
TM 6 10.4 - 12.5 (thermal IR)
vegetation stress and soil moisture discrimination related to thermal radiation; thermal mapping (urban, water)
TM 7 2.08 - 2.35 (short wave IR)
discrimination of mineral and rock types; sensitive to vegetation moisture content
Landsat MSS Bands
Band Wavelength Region (µm) Resolution (m) 1 0.5-0.6 (green) 80 2 0.6-0.7 (red) 80 3 0.7-0.8 (red - near-IR) 80 4 0.8-1.0 (near-IR) 80 Source: (CCRS, 2010)
76
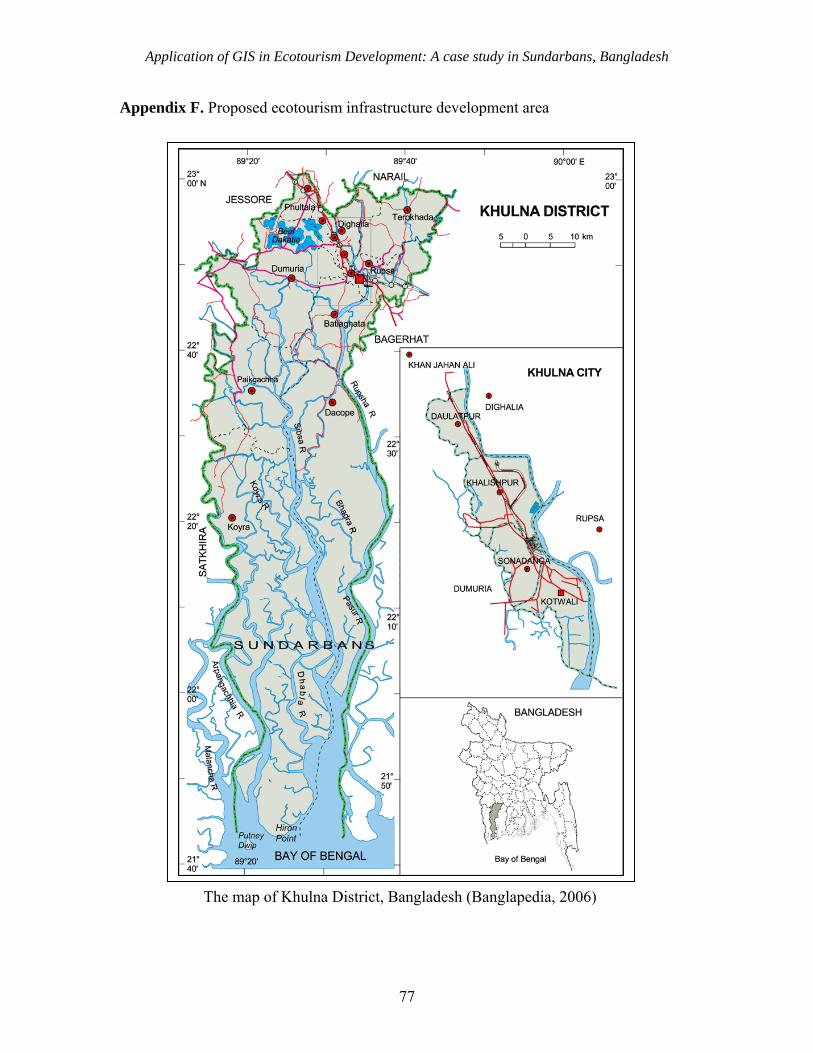
Application of GIS in Ecotourism Development: A case study in Sundarbans, Bangladesh
Appendix F. Proposed ecotourism infrastructure development area
The map of Khulna District, Bangladesh (Banglapedia, 2006)
77

Application of GIS in Ecotourism Development: A case study in Sundarbans, Bangladesh
Appendix G. Sundarbans wildlife sanctuaries
Source: (Banglapedia, 2006)
78
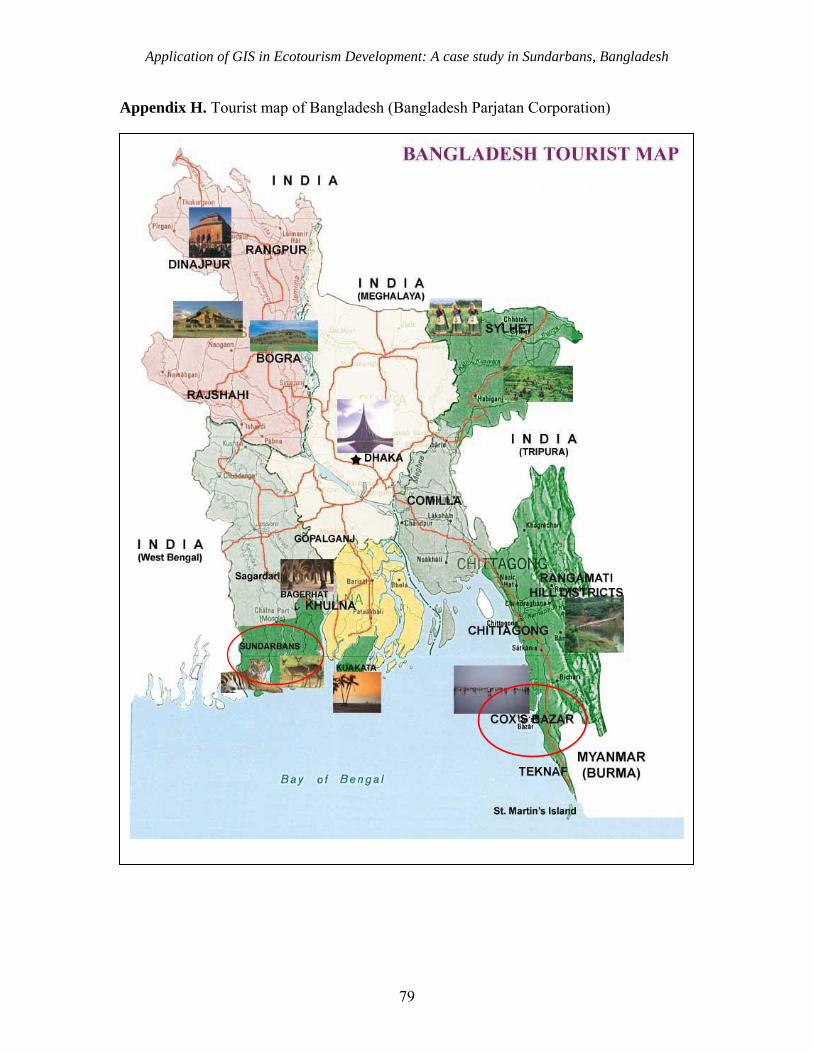
Application of GIS in Ecotourism Development: A case study in Sundarbans, Bangladesh
79
Appendix H. Tourist map of Bangladesh (Bangladesh Parjatan Corporation)
Related Documents