Introduction Until recently, assessments of rehabilitated tailings dams have been largely subjective and based on visual inspection (Randall, 2004). Rehabilitation progress has been judged mostly on the successful establishment of vegetation on tailings dams. Hence, much of the research so far carried out has focused on species trials and optimum conditions for plant growth on tailings (Hill, 1977, 1978; Northard and Figg, 1992; Nyakudya et al., 2011). Consequently, as noted by Ruiz-Jaen and Aide (2005), ecological processes have not been measured as much as vegetation structure and diversity in assessing rehabilitation success. Thompson and Thompson (2004) have also discussed the inadequacy of most current rehabilitation evaluation and monitoring methods that focus on a single species. The ecosystem function analysis (EFA) method addresses this shortfall by integrating ecosystem function with vegetation structure and complexity. The method is also diagnostic, as it specifically identifies vulnerable processes in an ecosystem, thus facilitating remedial action early in the rehabilitation process (Tongway and Hindley, 2004). EFA is a monitoring procedure that establishes how well an ecosystem functions as a biophysical system through the use of visually assessed indicators (Tongway and Hindley, 2004). The notion of ecosystem function is based upon the observation that highly functional ecosystems strongly retain vital resources (water, soil, nutrients, and organic matter). However, as function deteri- orates there is an increasing ‘leakage’ of these vital resources from the landscape. Since Mhangura Copper Mine stopped operations in 2000 due to viability problems (Sango et al., 2006), no follow-up studies have been carried out on the rehabilitated slimes dams to assess their development with respect to ecosystem function and long-term recovery. It is a requirement of Zimbabwean law (Zimbabwe Environmental Management Act 13, 2002, Chapter 20: 27) that rehabili- tation work should restore biota and ecological processes as far as possible. An approach involving the measurement of ecological processes was, therefore, necessary for such Application of ecosystem function analysis (EFA) in assessing mine tailings rehabilitation: an example from the Mhangura Copper Mine tailings, Zimbabwe by G.M. Dowo*, S. Kativu*, and D.J. Tongway † Synopsis The widespread environmental damage caused by slimes dam construction requires rehabilitation as one of the key management strategies towards land restoration. From the time when Mhangura Copper Mine in Zimbabwe was shut down in 2000 due to viability problems, no follow-up studies were carried out on the slimes dams to assess their development with respect to ecosystem function and long- term recovery. The ecosystem function analysis (EFA) method was thus employed to achieve this end. EFA is a monitoring procedure that establishes how well an ecosystem functions as a biophysical system through the use of rapidly assessed field indicators. The field procedure makes use of simple visual indicators that are related to various soil surface processes. Conventional sampling methods are used to collect the vegetation data. The data was first analysed using landscape function analysis (LFA) software packages and then with various multivariate statistical techniques. In total 27 species were recorded from 14 families; 21 of them occurring in the acacia woodland and only 8 on the slimes dams. Hyparrhenia sp. was the dominant grass on Dam 5 and Imperata cylindrica dominated Dam 6. Acacia saligna was the most abundant tree species on the dams. The tree layer on the slimes dams was not as developed as the grass layer. The rehabilitated slimes dams converged with the natural woodland for the LFA indices of stability, nutrient cycling, and infiltration, which suggested a high level of functionality. The main factors affecting the sustainability of the rehabilitation are postulated to be fire, grazing, and tree harvesting. The study contributed to the importance of, and methods used for, assessing ecosystem function on rehabilitated slimes dams in Zimbabwe, which are often ignored as most efforts focus on the establishment of vegetation on the dams. Keywords ecosystem function analysis, EFA, mine tailings, rehabilitation, monitoring, Mhangura Copper Mine, ecosystem function. * Tropical Resource Ecology Programme, Department of Biological Science, University of Zimbabwe, Mount Pleasant, Harare, Zimbabwe. † Coppin Place, Weetangara, Australia. © The Southern African Institute of Mining and Metallurgy, 2013. ISSN 2225-6253. Paper received Jun. 2011; revised paper received May 2013. 923 The Journal of The Southern African Institute of Mining and Metallurgy VOLUME 113 DECEMBER 2013 ▲

Welcome message from author
This document is posted to help you gain knowledge. Please leave a comment to let me know what you think about it! Share it to your friends and learn new things together.
Transcript
Introduction
Until recently, assessments of rehabilitatedtailings dams have been largely subjective andbased on visual inspection (Randall, 2004).Rehabilitation progress has been judgedmostly on the successful establishment ofvegetation on tailings dams. Hence, much ofthe research so far carried out has focused onspecies trials and optimum conditions for plantgrowth on tailings (Hill, 1977, 1978; Northardand Figg, 1992; Nyakudya et al., 2011).Consequently, as noted by Ruiz-Jaen and Aide(2005), ecological processes have not been
measured as much as vegetation structure anddiversity in assessing rehabilitation success.Thompson and Thompson (2004) have alsodiscussed the inadequacy of most currentrehabilitation evaluation and monitoringmethods that focus on a single species. Theecosystem function analysis (EFA) methodaddresses this shortfall by integratingecosystem function with vegetation structureand complexity. The method is also diagnostic,as it specifically identifies vulnerable processesin an ecosystem, thus facilitating remedialaction early in the rehabilitation process(Tongway and Hindley, 2004).
EFA is a monitoring procedure thatestablishes how well an ecosystem functionsas a biophysical system through the use ofvisually assessed indicators (Tongway andHindley, 2004). The notion of ecosystemfunction is based upon the observation thathighly functional ecosystems strongly retainvital resources (water, soil, nutrients, andorganic matter). However, as function deteri-orates there is an increasing ‘leakage’ of thesevital resources from the landscape.
Since Mhangura Copper Mine stoppedoperations in 2000 due to viability problems(Sango et al., 2006), no follow-up studieshave been carried out on the rehabilitatedslimes dams to assess their development withrespect to ecosystem function and long-termrecovery. It is a requirement of Zimbabweanlaw (Zimbabwe Environmental ManagementAct 13, 2002, Chapter 20: 27) that rehabili-tation work should restore biota and ecologicalprocesses as far as possible. An approachinvolving the measurement of ecologicalprocesses was, therefore, necessary for such
Application of ecosystem function analysis(EFA) in assessing mine tailingsrehabilitation: an example from theMhangura Copper Mine tailings, Zimbabweby G.M. Dowo*, S. Kativu*, and D.J. Tongway†
SynopsisThe widespread environmental damage caused by slimes damconstruction requires rehabilitation as one of the key managementstrategies towards land restoration. From the time when MhanguraCopper Mine in Zimbabwe was shut down in 2000 due to viabilityproblems, no follow-up studies were carried out on the slimes dams toassess their development with respect to ecosystem function and long-term recovery. The ecosystem function analysis (EFA) method wasthus employed to achieve this end. EFA is a monitoring procedure thatestablishes how well an ecosystem functions as a biophysical systemthrough the use of rapidly assessed field indicators. The fieldprocedure makes use of simple visual indicators that are related tovarious soil surface processes. Conventional sampling methods areused to collect the vegetation data. The data was first analysed usinglandscape function analysis (LFA) software packages and then withvarious multivariate statistical techniques. In total 27 species wererecorded from 14 families; 21 of them occurring in the acacia woodlandand only 8 on the slimes dams. Hyparrhenia sp. was the dominantgrass on Dam 5 and Imperata cylindrica dominated Dam 6. Acaciasaligna was the most abundant tree species on the dams. The treelayer on the slimes dams was not as developed as the grass layer. Therehabilitated slimes dams converged with the natural woodland for theLFA indices of stability, nutrient cycling, and infiltration, whichsuggested a high level of functionality. The main factors affecting thesustainability of the rehabilitation are postulated to be fire, grazing,and tree harvesting. The study contributed to the importance of, andmethods used for, assessing ecosystem function on rehabilitatedslimes dams in Zimbabwe, which are often ignored as most effortsfocus on the establishment of vegetation on the dams.
Keywordsecosystem function analysis, EFA, mine tailings, rehabilitation,monitoring, Mhangura Copper Mine, ecosystem function.
* Tropical Resource Ecology Programme,Department of Biological Science, University ofZimbabwe, Mount Pleasant, Harare, Zimbabwe.
† Coppin Place, Weetangara, Australia.© The Southern African Institute of Mining and
Metallurgy, 2013. ISSN 2225-6253. Paper receivedJun. 2011; revised paper received May 2013.
923The Journal of The Southern African Institute of Mining and Metallurgy VOLUME 113 DECEMBER 2013 ▲
Application of ecosystem function analysis (EFA) in assessing mine tailings rehabilitation
an evaluation to be undertaken. The EFA method wasemployed as a tool to achieve this end. The study aimed atascertaining the success or otherwise of the rehabilitation ofclad mine dams at Mhangura Copper Mine through anexamination of ecosystem development. The approachcentred on whether ecosystem processes on the dumps havedeveloped to the extent that biotic and abiotic elements canbegin to sustain their continued development withoutexternal intervention.
The specific objectives of the study were to comparespecific ecosystem processes such as nutrient cycling, surfacestability, and infiltration of the rehabilitated sites with thereference sites in order to determine the current status ofrehabilitation with regards to long-term sustainability, todetermine the key species acting as the drivers of the aboveprocesses, and to identify factors that influence slimes dumprehabilitation success and sustainability.
Materials and methods
Study area
Mhangura Copper Mine lies approximately 186 km northwestof the city of Harare. It is located in the Mashonaland WestProvince of Zimbabwe, at approximately 16˚53'S and 30˚09'E(Figure 1). The mine area is surrounded by farmland that isused mainly for maize cultivation and, to a lesser extent,livestock grazing. Mhangura lies in Natural (Agro-climatic)Region II (Vincent and Thomas, 1960), which is charac-terized by high rainfall (750–1000 mm a-1) and intensivefarming. This includes a dry, cool season from May toSeptember when very little rain falls. The wet season isusually characterized by heavy rainfall from November toMarch. Geologically, Mhangura is one of the largeststratabound copper occurrences within the Proterozoicmetasediments of the Lomagundi Basin (Mhangura Copper
Mines, 1999). The mine’s original resource was estimated tocomprise some 60 Mt at 1.2% Cu, with 15–20 ppm silver andminor quantities of gold, platinum, and palladium (MhanguraCopper Mines, 1999).
Stratification
The study focused on rehabilitated slimes dams (Dams 4, 5,and 6) within the Miriam Shaft Complex. Although they wereconstructed separately, Dams 4 and 5 coalesce, such that theyappear to be a single landform. Hence, for simplicity, in thepresent study Dams 4 and 5 are referred to as Dam 5. Thisparticular slimes dam is older, having been constructed in theearly 1970s, whereas Dam 6 was constructed in the early1980s. The substrate on the dams is homogenous for allsites, although a cladding of organic matter in the form ofdomestic waste was also used. Sites were initially stratifiedaccording to dam number, which is related to dam age, thusresulting in a pseudo-chronosequence. If succession wastaking place on the dams, it was assumed that differentvegetation types would be observed based on the differentages of the dumps. Aspect provided a second criterion forstratification. Sampling sites were located on the north,south, east, and west sides of the dumps (Figure 2). Suchstratification bore significance on the naming of the studysites. There was a delineation between sampling sites andunits. The whole side of a dam was considered as a samplingunit in which several sites were delineated, e.g. D5N-01,D5N-02, and D5N-03 were different sampling sites withinsampling unit D5N (i.e. northern slope of Dam 5). Stratifiedrandom sampling techniques were employed for thedelineation with the aid of Google Earth® software. In eachcase, sampling sites were named in accordance with theslimes dam number first, followed by the aspect and thetransect number. Thus, D5N-02 would be the secondtransect/site surveyed on the north side of Dam 5.
Reference sites
An acacia woodland lying to the north of and adjacent toDam 8 was used as a reference site, representing a natural
▲
924 DECEMBER 2013 VOLUME 113 The Journal of The Southern African Institute of Mining and Metallurgy
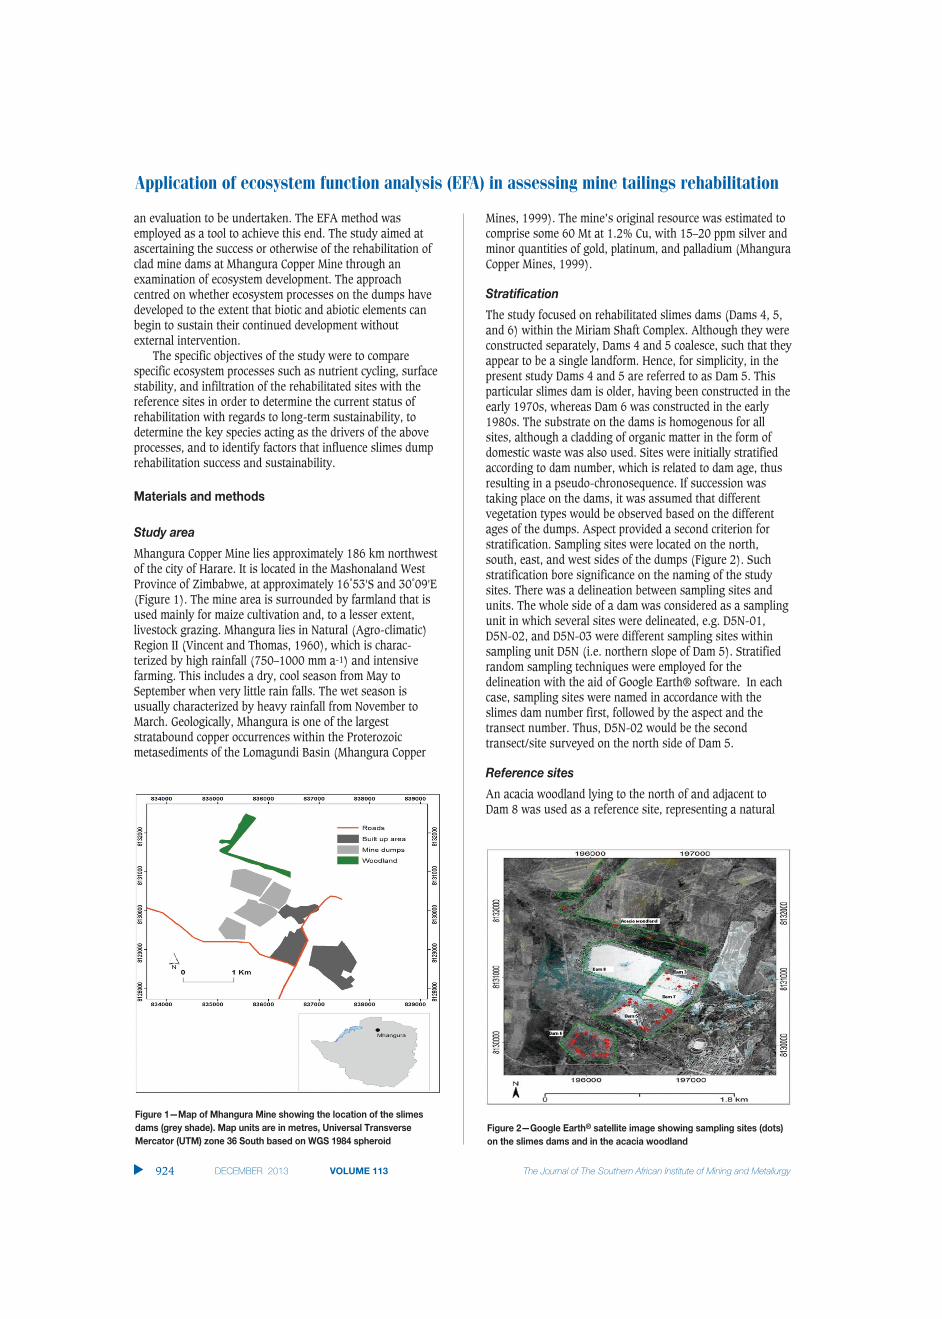
Figure 1—Map of Mhangura Mine showing the location of the slimesdams (grey shade). Map units are in metres, Universal TransverseMercator (UTM) zone 36 South based on WGS 1984 spheroid
Figure 2—Google Earth® satellite image showing sampling sites (dots)on the slimes dams and in the acacia woodland
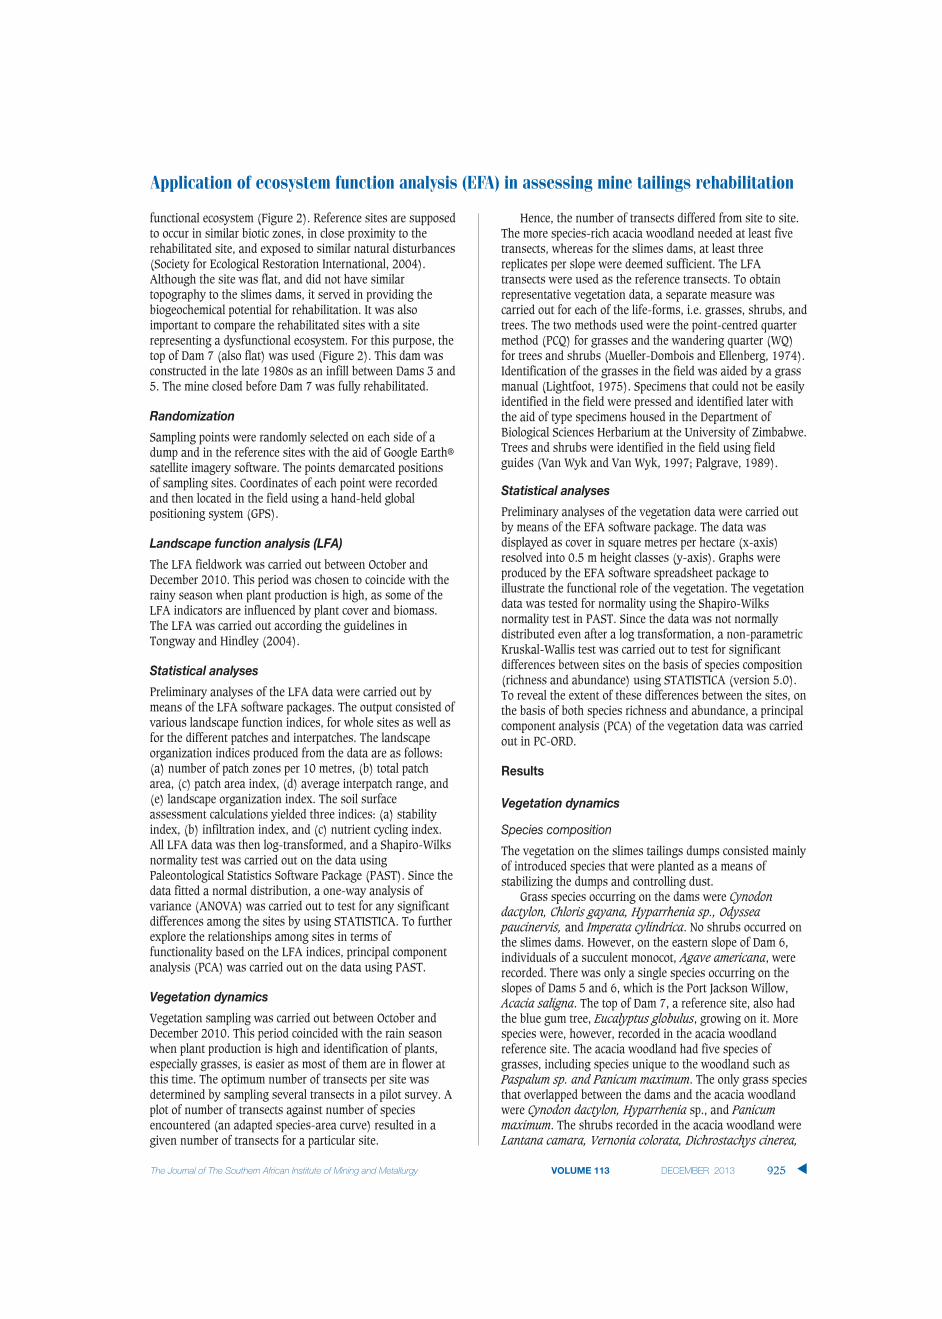
functional ecosystem (Figure 2). Reference sites are supposedto occur in similar biotic zones, in close proximity to therehabilitated site, and exposed to similar natural disturbances(Society for Ecological Restoration International, 2004).Although the site was flat, and did not have similartopography to the slimes dams, it served in providing thebiogeochemical potential for rehabilitation. It was alsoimportant to compare the rehabilitated sites with a siterepresenting a dysfunctional ecosystem. For this purpose, thetop of Dam 7 (also flat) was used (Figure 2). This dam wasconstructed in the late 1980s as an infill between Dams 3 and5. The mine closed before Dam 7 was fully rehabilitated.
Randomization
Sampling points were randomly selected on each side of adump and in the reference sites with the aid of Google Earth®
satellite imagery software. The points demarcated positionsof sampling sites. Coordinates of each point were recordedand then located in the field using a hand-held globalpositioning system (GPS).
Landscape function analysis (LFA)
The LFA fieldwork was carried out between October andDecember 2010. This period was chosen to coincide with therainy season when plant production is high, as some of theLFA indicators are influenced by plant cover and biomass.The LFA was carried out according the guidelines inTongway and Hindley (2004).
Statistical analyses
Preliminary analyses of the LFA data were carried out bymeans of the LFA software packages. The output consisted ofvarious landscape function indices, for whole sites as well asfor the different patches and interpatches. The landscapeorganization indices produced from the data are as follows:(a) number of patch zones per 10 metres, (b) total patcharea, (c) patch area index, (d) average interpatch range, and(e) landscape organization index. The soil surfaceassessment calculations yielded three indices: (a) stabilityindex, (b) infiltration index, and (c) nutrient cycling index.All LFA data was then log-transformed, and a Shapiro-Wilksnormality test was carried out on the data usingPaleontological Statistics Software Package (PAST). Since thedata fitted a normal distribution, a one-way analysis ofvariance (ANOVA) was carried out to test for any significantdifferences among the sites by using STATISTICA. To furtherexplore the relationships among sites in terms offunctionality based on the LFA indices, principal componentanalysis (PCA) was carried out on the data using PAST.
Vegetation dynamics
Vegetation sampling was carried out between October andDecember 2010. This period coincided with the rain seasonwhen plant production is high and identification of plants,especially grasses, is easier as most of them are in flower atthis time. The optimum number of transects per site wasdetermined by sampling several transects in a pilot survey. Aplot of number of transects against number of speciesencountered (an adapted species-area curve) resulted in agiven number of transects for a particular site.
Hence, the number of transects differed from site to site.The more species-rich acacia woodland needed at least fivetransects, whereas for the slimes dams, at least threereplicates per slope were deemed sufficient. The LFAtransects were used as the reference transects. To obtainrepresentative vegetation data, a separate measure wascarried out for each of the life-forms, i.e. grasses, shrubs, andtrees. The two methods used were the point-centred quartermethod (PCQ) for grasses and the wandering quarter (WQ)for trees and shrubs (Mueller-Dombois and Ellenberg, 1974).Identification of the grasses in the field was aided by a grassmanual (Lightfoot, 1975). Specimens that could not be easilyidentified in the field were pressed and identified later withthe aid of type specimens housed in the Department ofBiological Sciences Herbarium at the University of Zimbabwe.Trees and shrubs were identified in the field using fieldguides (Van Wyk and Van Wyk, 1997; Palgrave, 1989).
Statistical analyses
Preliminary analyses of the vegetation data were carried outby means of the EFA software package. The data wasdisplayed as cover in square metres per hectare (x-axis)resolved into 0.5 m height classes (y-axis). Graphs wereproduced by the EFA software spreadsheet package toillustrate the functional role of the vegetation. The vegetationdata was tested for normality using the Shapiro-Wilksnormality test in PAST. Since the data was not normallydistributed even after a log transformation, a non-parametricKruskal-Wallis test was carried out to test for significantdifferences between sites on the basis of species composition(richness and abundance) using STATISTICA (version 5.0).To reveal the extent of these differences between the sites, onthe basis of both species richness and abundance, a principalcomponent analysis (PCA) of the vegetation data was carriedout in PC-ORD.
Results
Vegetation dynamics
Species composition
The vegetation on the slimes tailings dumps consisted mainlyof introduced species that were planted as a means ofstabilizing the dumps and controlling dust.
Grass species occurring on the dams were Cynodondactylon, Chloris gayana, Hyparrhenia sp., Odysseapaucinervis, and Imperata cylindrica. No shrubs occurred onthe slimes dams. However, on the eastern slope of Dam 6,individuals of a succulent monocot, Agave americana, wererecorded. There was only a single species occurring on theslopes of Dams 5 and 6, which is the Port Jackson Willow,Acacia saligna. The top of Dam 7, a reference site, also hadthe blue gum tree, Eucalyptus globulus, growing on it. Morespecies were, however, recorded in the acacia woodlandreference site. The acacia woodland had five species ofgrasses, including species unique to the woodland such asPaspalum sp. and Panicum maximum. The only grass speciesthat overlapped between the dams and the acacia woodlandwere Cynodon dactylon, Hyparrhenia sp., and Panicummaximum. The shrubs recorded in the acacia woodland wereLantana camara, Vernonia colorata, Dichrostachys cinerea,
Application of ecosystem function analysis (EFA) in assessing mine tailings rehabilitation
925The Journal of The Southern African Institute of Mining and Metallurgy VOLUME 113 DECEMBER 2013 ▲
Application of ecosystem function analysis (EFA) in assessing mine tailings rehabilitation
Cordia monoica, and Euclia natalensis. Unlike the slimesdams, the acacia woodland contained a wide variety ofindigenous acacias and other tree species as listed in Table I.There was no overlap in woody species between the slimesdams and the acacia woodland. Eucalyptus globulus wasrestricted to the top of Dam 7 only. Hyparrhenia sp.dominated the grass layer in all sites except Dam 6 (Table I).This dominance was most expressed on Dam 5, whereHyparrhenia covered almost the whole dam except for a fewpatches of Cynodon dactylon and Imperata cylindrica. Onother sites, however, the relatively high abundance ofCynodon dactylon individuals reduced the relative dominanceof Hyparrhenia sp. The dominant grass species on Dam 6was Imperata cylindrica (Cogon grass). Other grass speciesthat occurred in relatively small numbers in their respectivesites were Heteropogon contortus and Panicum maximum inthe acacia woodland; Panicum maximum and Imperatacylindrica on Dam 5; and Odyssea paucinervis on Dam 6.Dam 7 was dominated by Hyparrhenia sp., followed by arelatively even distribution of Cynodon dactylon and Chlorisgayana. The exotic tree Acacia saligna was the mostdominant woody species on the slimes dams, achievingrelative abundance levels of 1.000 on Dams 5 and 6 and0.760 on Dam 7, where Eucalyptus globulus was the onlyother species. The picture was different in the native acaciawoodland, where there was greater species richness (Figure 3) and where even the most dominant species, Acaciapolyacantha, had a relative abundance of 0.375. This waslow compared to the relative abundance levels of Acaciasaligna on the dam sites. Species that occurred at very low
frequencies in the acacia woodland included Acacia nilotica,Ozoroa insignis, Cordia monoica, Combretum adenogonium,Acacia rehmaniana, and Flacourtia indica, all of which had arelative abundance of 0.005 (Table I).
Species richness
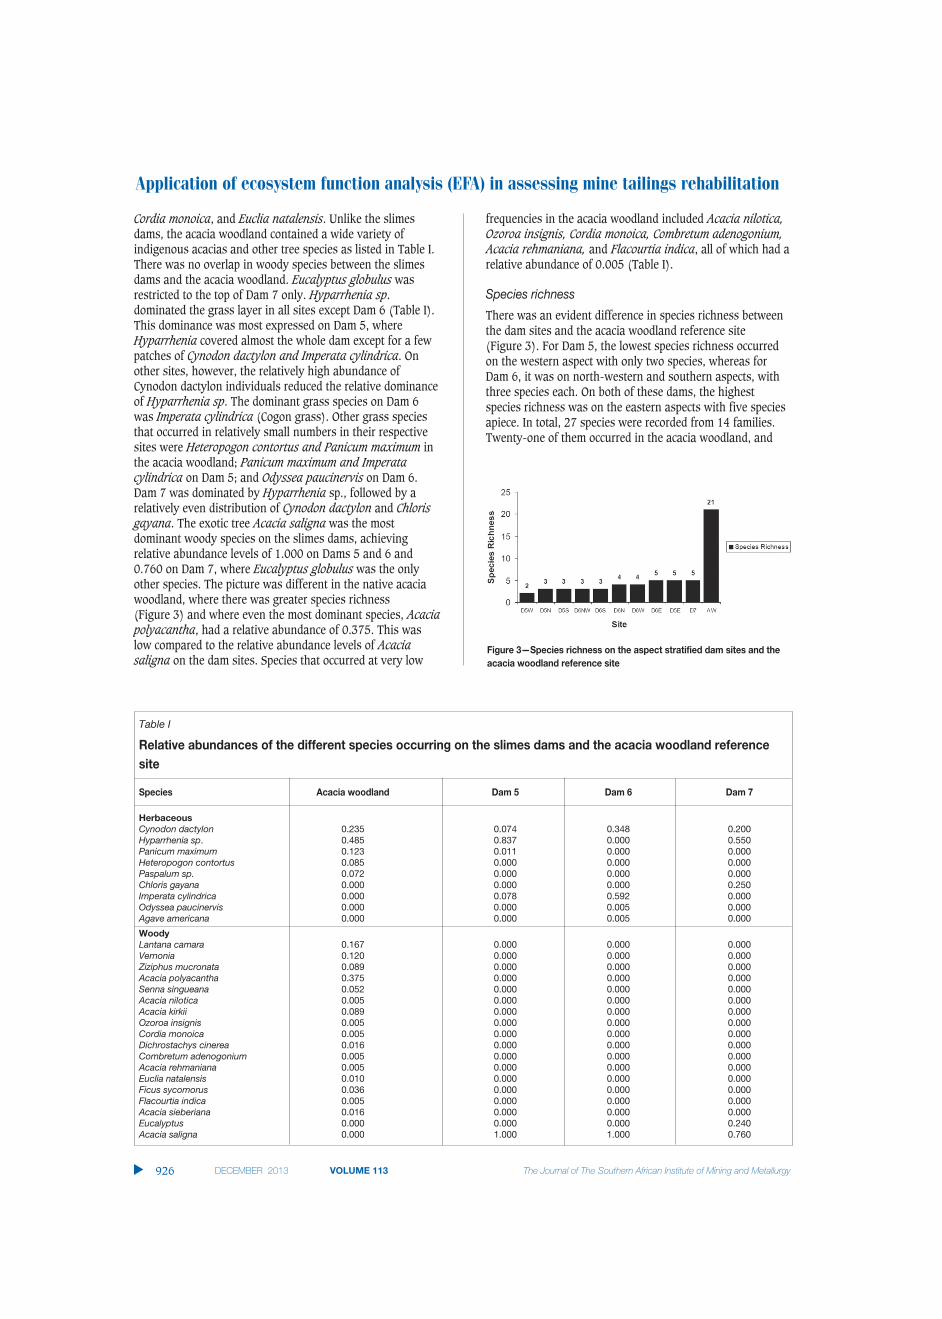
There was an evident difference in species richness betweenthe dam sites and the acacia woodland reference site (Figure 3). For Dam 5, the lowest species richness occurredon the western aspect with only two species, whereas forDam 6, it was on north-western and southern aspects, withthree species each. On both of these dams, the highestspecies richness was on the eastern aspects with five speciesapiece. In total, 27 species were recorded from 14 families.Twenty-one of them occurred in the acacia woodland, and
▲
926 DECEMBER 2013 VOLUME 113 The Journal of The Southern African Institute of Mining and Metallurgy
Table I
Relative abundances of the different species occurring on the slimes dams and the acacia woodland referencesite
Species Acacia woodland Dam 5 Dam 6 Dam 7
HerbaceousCynodon dactylon 0.235 0.074 0.348 0.200Hyparrhenia sp. 0.485 0.837 0.000 0.550Panicum maximum 0.123 0.011 0.000 0.000Heteropogon contortus 0.085 0.000 0.000 0.000Paspalum sp. 0.072 0.000 0.000 0.000Chloris gayana 0.000 0.000 0.000 0.250Imperata cylindrica 0.000 0.078 0.592 0.000Odyssea paucinervis 0.000 0.000 0.005 0.000Agave americana 0.000 0.000 0.005 0.000
WoodyLantana camara 0.167 0.000 0.000 0.000Vernonia 0.120 0.000 0.000 0.000Ziziphus mucronata 0.089 0.000 0.000 0.000Acacia polyacantha 0.375 0.000 0.000 0.000Senna singueana 0.052 0.000 0.000 0.000Acacia nilotica 0.005 0.000 0.000 0.000Acacia kirkii 0.089 0.000 0.000 0.000Ozoroa insignis 0.005 0.000 0.000 0.000Cordia monoica 0.005 0.000 0.000 0.000Dichrostachys cinerea 0.016 0.000 0.000 0.000Combretum adenogonium 0.005 0.000 0.000 0.000Acacia rehmaniana 0.005 0.000 0.000 0.000Euclia natalensis 0.010 0.000 0.000 0.000Ficus sycomorus 0.036 0.000 0.000 0.000Flacourtia indica 0.005 0.000 0.000 0.000Acacia sieberiana 0.016 0.000 0.000 0.000Eucalyptus 0.000 0.000 0.000 0.240Acacia saligna 0.000 1.000 1.000 0.760
Figure 3—Species richness on the aspect stratified dam sites and theacacia woodland reference site
only eight occurred on the slimes dams. There was an overlapof three species between the slimes dams and the acaciawoodland.
Functional role of vegetation
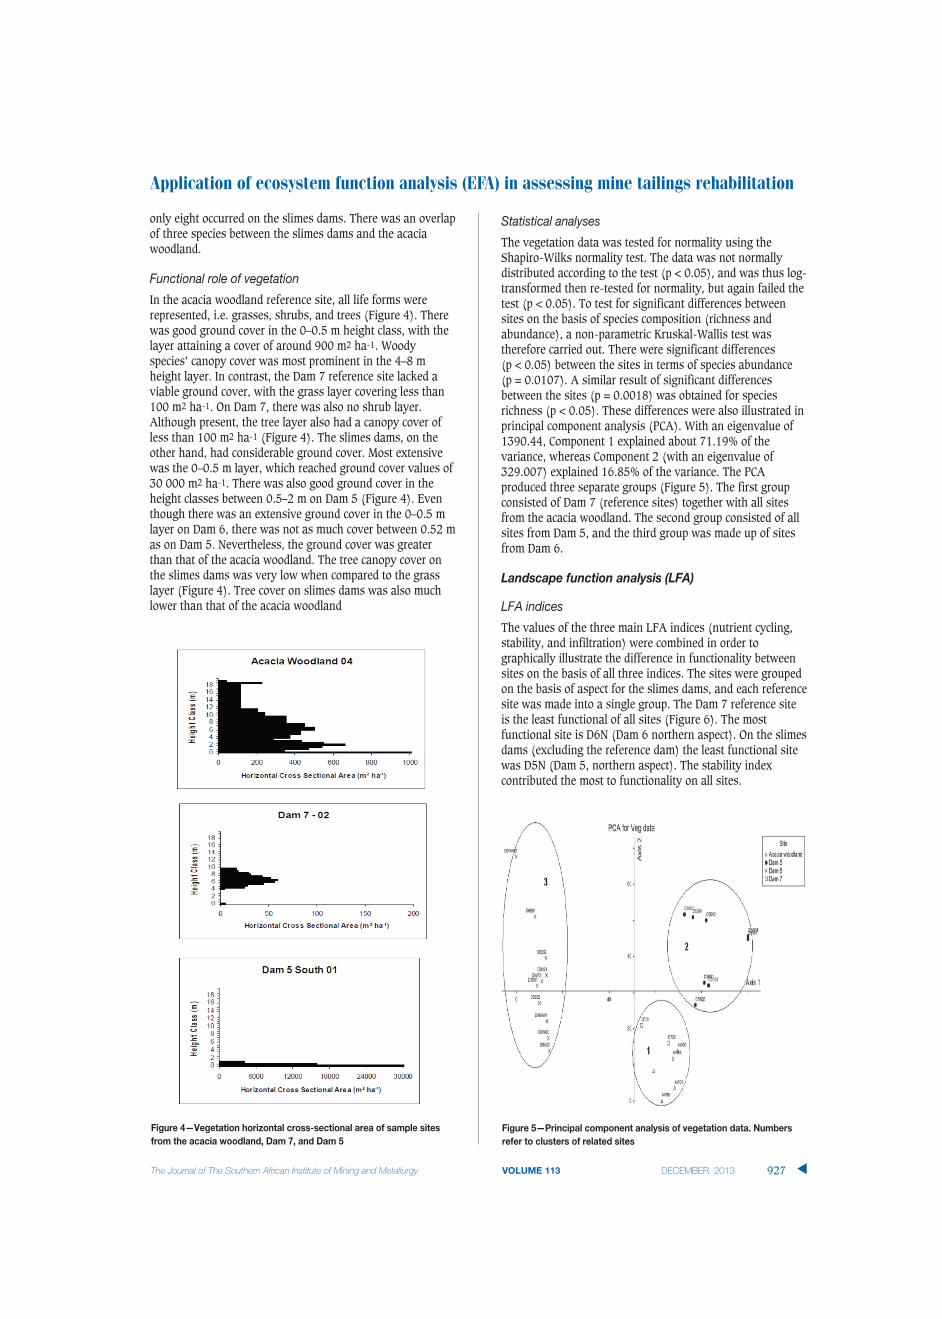
In the acacia woodland reference site, all life forms wererepresented, i.e. grasses, shrubs, and trees (Figure 4). Therewas good ground cover in the 0–0.5 m height class, with thelayer attaining a cover of around 900 m2 ha-1. Woodyspecies’ canopy cover was most prominent in the 4–8 mheight layer. In contrast, the Dam 7 reference site lacked aviable ground cover, with the grass layer covering less than100 m2 ha-1. On Dam 7, there was also no shrub layer.Although present, the tree layer also had a canopy cover ofless than 100 m2 ha-1 (Figure 4). The slimes dams, on theother hand, had considerable ground cover. Most extensivewas the 0–0.5 m layer, which reached ground cover values of30 000 m2 ha-1. There was also good ground cover in theheight classes between 0.5–2 m on Dam 5 (Figure 4). Eventhough there was an extensive ground cover in the 0–0.5 mlayer on Dam 6, there was not as much cover between 0.52 mas on Dam 5. Nevertheless, the ground cover was greaterthan that of the acacia woodland. The tree canopy cover onthe slimes dams was very low when compared to the grasslayer (Figure 4). Tree cover on slimes dams was also muchlower than that of the acacia woodland
Statistical analyses
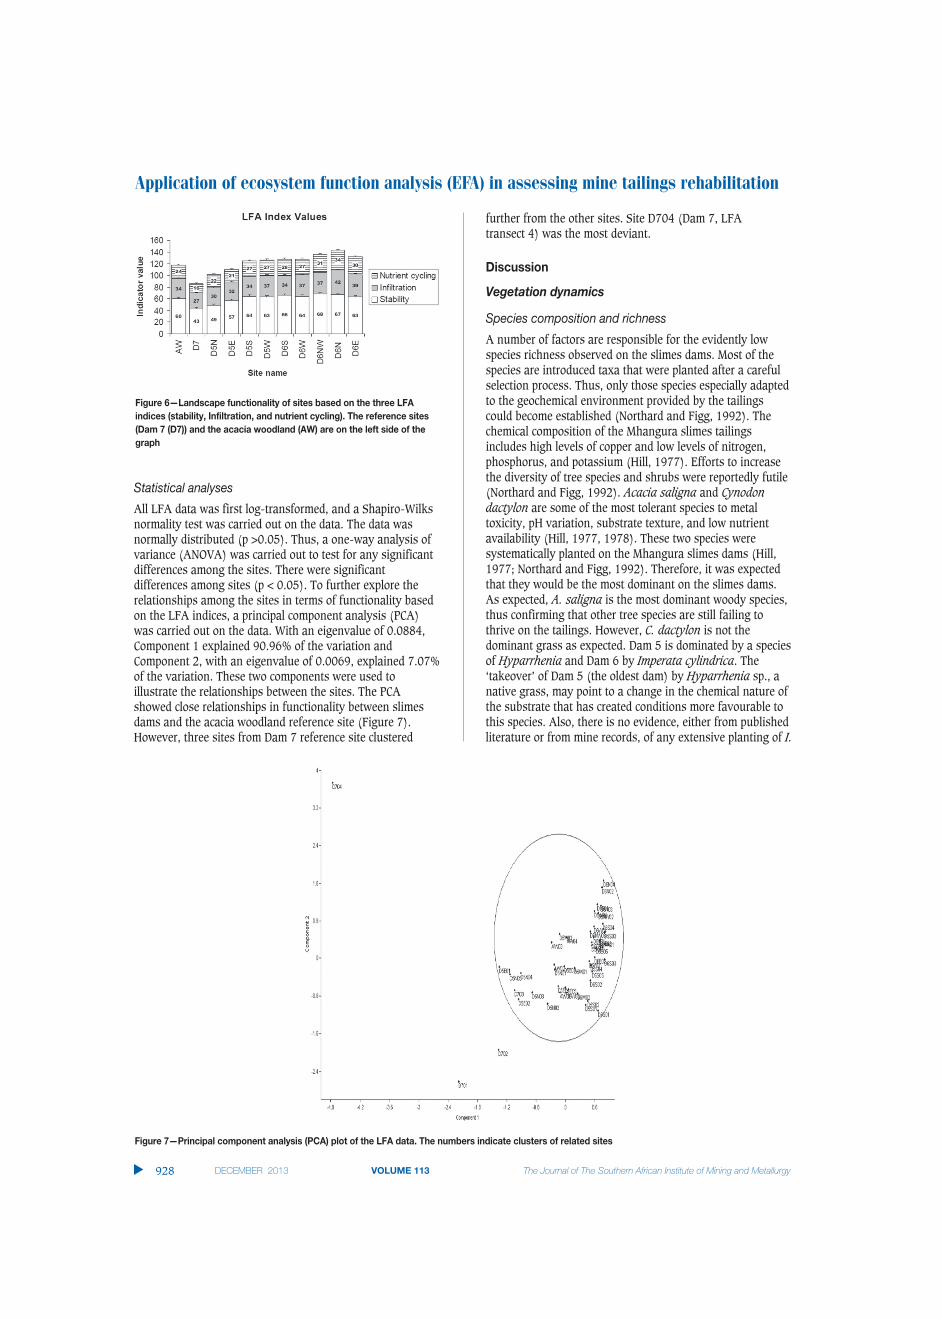
The vegetation data was tested for normality using theShapiro-Wilks normality test. The data was not normallydistributed according to the test (p < 0.05), and was thus log-transformed then re-tested for normality, but again failed thetest (p < 0.05). To test for significant differences betweensites on the basis of species composition (richness andabundance), a non-parametric Kruskal-Wallis test wastherefore carried out. There were significant differences (p < 0.05) between the sites in terms of species abundance (p = 0.0107). A similar result of significant differencesbetween the sites (p = 0.0018) was obtained for speciesrichness (p < 0.05). These differences were also illustrated inprincipal component analysis (PCA). With an eigenvalue of1390.44, Component 1 explained about 71.19% of thevariance, whereas Component 2 (with an eigenvalue of329.007) explained 16.85% of the variance. The PCAproduced three separate groups (Figure 5). The first groupconsisted of Dam 7 (reference sites) together with all sitesfrom the acacia woodland. The second group consisted of allsites from Dam 5, and the third group was made up of sitesfrom Dam 6.
Landscape function analysis (LFA)
LFA indices
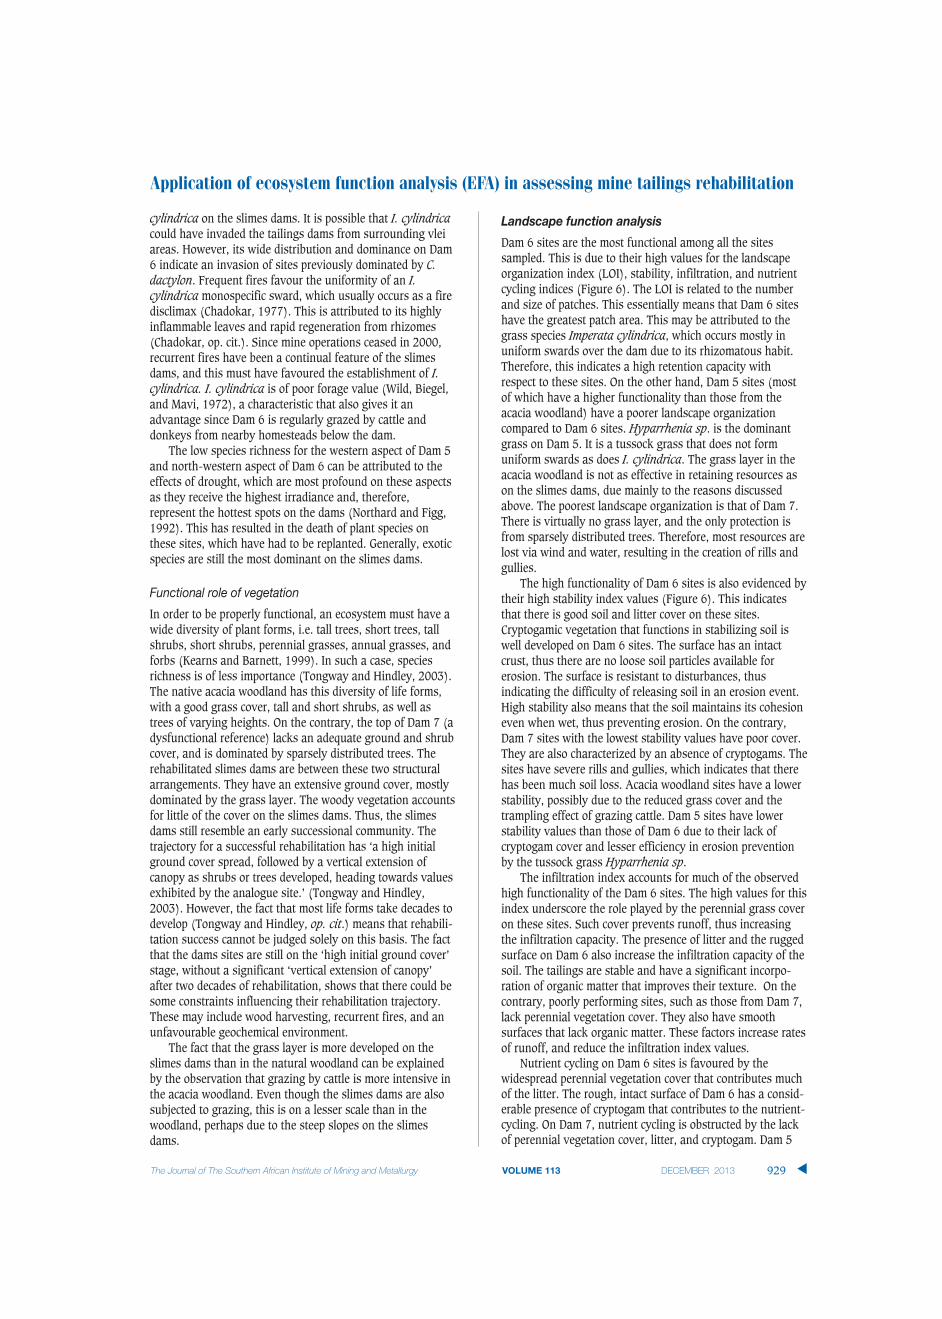
The values of the three main LFA indices (nutrient cycling,stability, and infiltration) were combined in order tographically illustrate the difference in functionality betweensites on the basis of all three indices. The sites were groupedon the basis of aspect for the slimes dams, and each referencesite was made into a single group. The Dam 7 reference siteis the least functional of all sites (Figure 6). The mostfunctional site is D6N (Dam 6 northern aspect). On the slimesdams (excluding the reference dam) the least functional sitewas D5N (Dam 5, northern aspect). The stability indexcontributed the most to functionality on all sites.
Application of ecosystem function analysis (EFA) in assessing mine tailings rehabilitation
The Journal of The Southern African Institute of Mining and Metallurgy VOLUME 113 DECEMBER 2013 927 ▲
Figure 4—Vegetation horizontal cross-sectional area of sample sitesfrom the acacia woodland, Dam 7, and Dam 5
Figure 5—Principal component analysis of vegetation data. Numbersrefer to clusters of related sites
Application of ecosystem function analysis (EFA) in assessing mine tailings rehabilitation
Statistical analyses
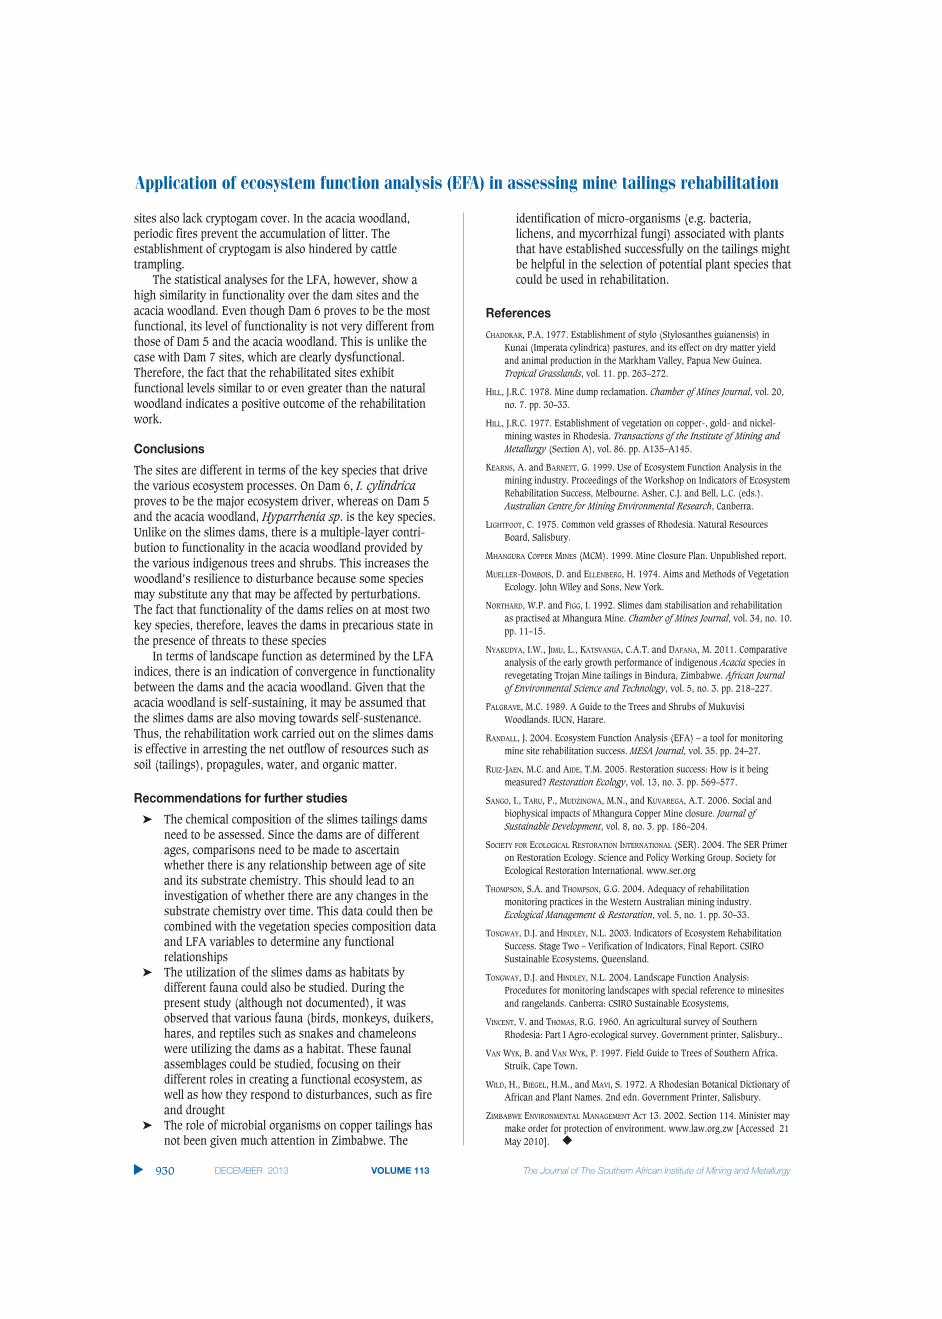
All LFA data was first log-transformed, and a Shapiro-Wilksnormality test was carried out on the data. The data wasnormally distributed (p >0.05). Thus, a one-way analysis ofvariance (ANOVA) was carried out to test for any significantdifferences among the sites. There were significantdifferences among sites (p < 0.05). To further explore therelationships among the sites in terms of functionality basedon the LFA indices, a principal component analysis (PCA)was carried out on the data. With an eigenvalue of 0.0884,Component 1 explained 90.96% of the variation andComponent 2, with an eigenvalue of 0.0069, explained 7.07%of the variation. These two components were used toillustrate the relationships between the sites. The PCAshowed close relationships in functionality between slimesdams and the acacia woodland reference site (Figure 7).However, three sites from Dam 7 reference site clustered
further from the other sites. Site D704 (Dam 7, LFA transect 4) was the most deviant.
Discussion
Vegetation dynamics
Species composition and richness
A number of factors are responsible for the evidently lowspecies richness observed on the slimes dams. Most of thespecies are introduced taxa that were planted after a carefulselection process. Thus, only those species especially adaptedto the geochemical environment provided by the tailingscould become established (Northard and Figg, 1992). Thechemical composition of the Mhangura slimes tailingsincludes high levels of copper and low levels of nitrogen,phosphorus, and potassium (Hill, 1977). Efforts to increasethe diversity of tree species and shrubs were reportedly futile(Northard and Figg, 1992). Acacia saligna and Cynodondactylon are some of the most tolerant species to metaltoxicity, pH variation, substrate texture, and low nutrientavailability (Hill, 1977, 1978). These two species weresystematically planted on the Mhangura slimes dams (Hill,1977; Northard and Figg, 1992). Therefore, it was expectedthat they would be the most dominant on the slimes dams.As expected, A. saligna is the most dominant woody species,thus confirming that other tree species are still failing tothrive on the tailings. However, C. dactylon is not thedominant grass as expected. Dam 5 is dominated by a speciesof Hyparrhenia and Dam 6 by Imperata cylindrica. The‘takeover’ of Dam 5 (the oldest dam) by Hyparrhenia sp., anative grass, may point to a change in the chemical nature ofthe substrate that has created conditions more favourable tothis species. Also, there is no evidence, either from publishedliterature or from mine records, of any extensive planting of I.
▲
928 DECEMBER 2013 VOLUME 113 The Journal of The Southern African Institute of Mining and Metallurgy
Figure 7—Principal component analysis (PCA) plot of the LFA data. The numbers indicate clusters of related sites
Figure 6—Landscape functionality of sites based on the three LFAindices (stability, Infiltration, and nutrient cycling). The reference sites(Dam 7 (D7)) and the acacia woodland (AW) are on the left side of thegraph
cylindrica on the slimes dams. It is possible that I. cylindricacould have invaded the tailings dams from surrounding vleiareas. However, its wide distribution and dominance on Dam6 indicate an invasion of sites previously dominated by C.dactylon. Frequent fires favour the uniformity of an I.cylindrica monospecific sward, which usually occurs as a firedisclimax (Chadokar, 1977). This is attributed to its highlyinflammable leaves and rapid regeneration from rhizomes(Chadokar, op. cit.). Since mine operations ceased in 2000,recurrent fires have been a continual feature of the slimesdams, and this must have favoured the establishment of I.cylindrica. I. cylindrica is of poor forage value (Wild, Biegel,and Mavi, 1972), a characteristic that also gives it anadvantage since Dam 6 is regularly grazed by cattle anddonkeys from nearby homesteads below the dam.
The low species richness for the western aspect of Dam 5and north-western aspect of Dam 6 can be attributed to theeffects of drought, which are most profound on these aspectsas they receive the highest irradiance and, therefore,represent the hottest spots on the dams (Northard and Figg,1992). This has resulted in the death of plant species onthese sites, which have had to be replanted. Generally, exoticspecies are still the most dominant on the slimes dams.
Functional role of vegetation
In order to be properly functional, an ecosystem must have awide diversity of plant forms, i.e. tall trees, short trees, tallshrubs, short shrubs, perennial grasses, annual grasses, andforbs (Kearns and Barnett, 1999). In such a case, speciesrichness is of less importance (Tongway and Hindley, 2003).The native acacia woodland has this diversity of life forms,with a good grass cover, tall and short shrubs, as well astrees of varying heights. On the contrary, the top of Dam 7 (adysfunctional reference) lacks an adequate ground and shrubcover, and is dominated by sparsely distributed trees. Therehabilitated slimes dams are between these two structuralarrangements. They have an extensive ground cover, mostlydominated by the grass layer. The woody vegetation accountsfor little of the cover on the slimes dams. Thus, the slimesdams still resemble an early successional community. Thetrajectory for a successful rehabilitation has ‘a high initialground cover spread, followed by a vertical extension ofcanopy as shrubs or trees developed, heading towards valuesexhibited by the analogue site.’ (Tongway and Hindley,2003). However, the fact that most life forms take decades todevelop (Tongway and Hindley, op. cit.) means that rehabili-tation success cannot be judged solely on this basis. The factthat the dams sites are still on the ‘high initial ground cover’stage, without a significant ‘vertical extension of canopy’after two decades of rehabilitation, shows that there could besome constraints influencing their rehabilitation trajectory.These may include wood harvesting, recurrent fires, and anunfavourable geochemical environment.
The fact that the grass layer is more developed on theslimes dams than in the natural woodland can be explainedby the observation that grazing by cattle is more intensive inthe acacia woodland. Even though the slimes dams are alsosubjected to grazing, this is on a lesser scale than in thewoodland, perhaps due to the steep slopes on the slimesdams.
Landscape function analysis
Dam 6 sites are the most functional among all the sitessampled. This is due to their high values for the landscapeorganization index (LOI), stability, infiltration, and nutrientcycling indices (Figure 6). The LOI is related to the numberand size of patches. This essentially means that Dam 6 siteshave the greatest patch area. This may be attributed to thegrass species Imperata cylindrica, which occurs mostly inuniform swards over the dam due to its rhizomatous habit.Therefore, this indicates a high retention capacity withrespect to these sites. On the other hand, Dam 5 sites (mostof which have a higher functionality than those from theacacia woodland) have a poorer landscape organizationcompared to Dam 6 sites. Hyparrhenia sp. is the dominantgrass on Dam 5. It is a tussock grass that does not formuniform swards as does I. cylindrica. The grass layer in theacacia woodland is not as effective in retaining resources ason the slimes dams, due mainly to the reasons discussedabove. The poorest landscape organization is that of Dam 7.There is virtually no grass layer, and the only protection isfrom sparsely distributed trees. Therefore, most resources arelost via wind and water, resulting in the creation of rills andgullies.
The high functionality of Dam 6 sites is also evidenced bytheir high stability index values (Figure 6). This indicatesthat there is good soil and litter cover on these sites.Cryptogamic vegetation that functions in stabilizing soil iswell developed on Dam 6 sites. The surface has an intactcrust, thus there are no loose soil particles available forerosion. The surface is resistant to disturbances, thusindicating the difficulty of releasing soil in an erosion event.High stability also means that the soil maintains its cohesioneven when wet, thus preventing erosion. On the contrary,Dam 7 sites with the lowest stability values have poor cover.They are also characterized by an absence of cryptogams. Thesites have severe rills and gullies, which indicates that therehas been much soil loss. Acacia woodland sites have a lowerstability, possibly due to the reduced grass cover and thetrampling effect of grazing cattle. Dam 5 sites have lowerstability values than those of Dam 6 due to their lack ofcryptogam cover and lesser efficiency in erosion preventionby the tussock grass Hyparrhenia sp.
The infiltration index accounts for much of the observedhigh functionality of the Dam 6 sites. The high values for thisindex underscore the role played by the perennial grass coveron these sites. Such cover prevents runoff, thus increasingthe infiltration capacity. The presence of litter and the ruggedsurface on Dam 6 also increase the infiltration capacity of thesoil. The tailings are stable and have a significant incorpo-ration of organic matter that improves their texture. On thecontrary, poorly performing sites, such as those from Dam 7,lack perennial vegetation cover. They also have smoothsurfaces that lack organic matter. These factors increase ratesof runoff, and reduce the infiltration index values.
Nutrient cycling on Dam 6 sites is favoured by thewidespread perennial vegetation cover that contributes muchof the litter. The rough, intact surface of Dam 6 has a consid-erable presence of cryptogam that contributes to the nutrient-cycling. On Dam 7, nutrient cycling is obstructed by the lackof perennial vegetation cover, litter, and cryptogam. Dam 5
Application of ecosystem function analysis (EFA) in assessing mine tailings rehabilitation
The Journal of The Southern African Institute of Mining and Metallurgy VOLUME 113 DECEMBER 2013 929 ▲
Application of ecosystem function analysis (EFA) in assessing mine tailings rehabilitation
sites also lack cryptogam cover. In the acacia woodland,periodic fires prevent the accumulation of litter. Theestablishment of cryptogam is also hindered by cattletrampling.
The statistical analyses for the LFA, however, show ahigh similarity in functionality over the dam sites and theacacia woodland. Even though Dam 6 proves to be the mostfunctional, its level of functionality is not very different fromthose of Dam 5 and the acacia woodland. This is unlike thecase with Dam 7 sites, which are clearly dysfunctional.Therefore, the fact that the rehabilitated sites exhibitfunctional levels similar to or even greater than the naturalwoodland indicates a positive outcome of the rehabilitationwork.
Conclusions
The sites are different in terms of the key species that drivethe various ecosystem processes. On Dam 6, I. cylindricaproves to be the major ecosystem driver, whereas on Dam 5and the acacia woodland, Hyparrhenia sp. is the key species.Unlike on the slimes dams, there is a multiple-layer contri-bution to functionality in the acacia woodland provided bythe various indigenous trees and shrubs. This increases thewoodland’s resilience to disturbance because some speciesmay substitute any that may be affected by perturbations.The fact that functionality of the dams relies on at most twokey species, therefore, leaves the dams in precarious state inthe presence of threats to these species
In terms of landscape function as determined by the LFAindices, there is an indication of convergence in functionalitybetween the dams and the acacia woodland. Given that theacacia woodland is self-sustaining, it may be assumed thatthe slimes dams are also moving towards self-sustenance.Thus, the rehabilitation work carried out on the slimes damsis effective in arresting the net outflow of resources such assoil (tailings), propagules, water, and organic matter.
Recommendations for further studies
➤ The chemical composition of the slimes tailings damsneed to be assessed. Since the dams are of differentages, comparisons need to be made to ascertainwhether there is any relationship between age of siteand its substrate chemistry. This should lead to aninvestigation of whether there are any changes in thesubstrate chemistry over time. This data could then becombined with the vegetation species composition dataand LFA variables to determine any functionalrelationships
➤ The utilization of the slimes dams as habitats bydifferent fauna could also be studied. During thepresent study (although not documented), it wasobserved that various fauna (birds, monkeys, duikers,hares, and reptiles such as snakes and chameleonswere utilizing the dams as a habitat. These faunalassemblages could be studied, focusing on theirdifferent roles in creating a functional ecosystem, aswell as how they respond to disturbances, such as fireand drought
➤ The role of microbial organisms on copper tailings hasnot been given much attention in Zimbabwe. The
identification of micro-organisms (e.g. bacteria,lichens, and mycorrhizal fungi) associated with plantsthat have established successfully on the tailings mightbe helpful in the selection of potential plant species thatcould be used in rehabilitation.
References
CHADOKAR, P.A. 1977. Establishment of stylo (Stylosanthes guianensis) inKunai (Imperata cylindrica) pastures, and its effect on dry matter yieldand animal production in the Markham Valley, Papua New Guinea.Tropical Grasslands, vol. 11. pp. 263–272.
HILL, J.R.C. 1978. Mine dump reclamation. Chamber of Mines Journal, vol. 20,no. 7. pp. 30–33.
HILL, J.R.C. 1977. Establishment of vegetation on copper-, gold- and nickel-mining wastes in Rhodesia. Transactions of the Institute of Mining andMetallurgy (Section A), vol. 86. pp. A135–A145.
KEARNS, A. and BARNETT, G. 1999. Use of Ecosystem Function Analysis in themining industry. Proceedings of the Workshop on Indicators of EcosystemRehabilitation Success, Melbourne. Asher, C.J. and Bell, L.C. (eds.).Australian Centre for Mining Environmental Research, Canberra.
LIGHTFOOT, C. 1975. Common veld grasses of Rhodesia. Natural ResourcesBoard, Salisbury.
MHANGURA COPPER MINES (MCM). 1999. Mine Closure Plan. Unpublished report.
MUELLER-DOMBOIS, D. and ELLENBERG, H. 1974. Aims and Methods of VegetationEcology. John Wiley and Sons, New York.
NORTHARD, W.P. and FIGG, I. 1992. Slimes dam stabilisation and rehabilitationas practised at Mhangura Mine. Chamber of Mines Journal, vol. 34, no. 10.pp. 11–15.
NYAKUDYA, I.W., JIMU, L., KATSVANGA, C.A.T. and DAFANA, M. 2011. Comparativeanalysis of the early growth performance of indigenous Acacia species inrevegetating Trojan Mine tailings in Bindura, Zimbabwe. African Journalof Environmental Science and Technology, vol. 5, no. 3. pp. 218–227.
PALGRAVE, M.C. 1989. A Guide to the Trees and Shrubs of MukuvisiWoodlands. IUCN, Harare.
RANDALL, J. 2004. Ecosystem Function Analysis (EFA) – a tool for monitoringmine site rehabilitation success. MESA Journal, vol. 35. pp. 24–27.
RUIZ-JAEN, M.C. and AIDE, T.M. 2005. Restoration success: How is it beingmeasured? Restoration Ecology, vol. 13, no. 3. pp. 569–577.
SANGO, I., TARU, P., MUDZINGWA, M.N., and KUVAREGA, A.T. 2006. Social andbiophysical impacts of Mhangura Copper Mine closure. Journal ofSustainable Development, vol. 8, no. 3. pp. 186–204.
SOCIETY FOR ECOLOGICAL RESTORATION INTERNATIONAL (SER). 2004. The SER Primeron Restoration Ecology. Science and Policy Working Group. Society forEcological Restoration International. www.ser.org
THOMPSON, S.A. and THOMPSON, G.G. 2004. Adequacy of rehabilitationmonitoring practices in the Western Australian mining industry.Ecological Management & Restoration, vol. 5, no. 1. pp. 30–33.
TONGWAY, D.J. and HINDLEY, N.L. 2003. Indicators of Ecosystem RehabilitationSuccess. Stage Two – Verification of Indicators, Final Report. CSIROSustainable Ecosystems, Queensland.
TONGWAY, D.J. and HINDLEY, N.L. 2004. Landscape Function Analysis:Procedures for monitoring landscapes with special reference to minesitesand rangelands. Canberra: CSIRO Sustainable Ecosystems,
VINCENT, V. and THOMAS, R.G. 1960. An agricultural survey of SouthernRhodesia: Part I Agro-ecological survey. Government printer, Salisbury..
VAN WYK, B. and VAN WYK, P. 1997. Field Guide to Trees of Southern Africa.Struik, Cape Town.
WILD, H., BIEGEL, H.M., and MAVI, S. 1972. A Rhodesian Botanical Dictionary ofAfrican and Plant Names. 2nd edn. Government Printer, Salisbury.
ZIMBABWE ENVIRONMENTAL MANAGEMENT ACT 13. 2002. Section 114. Minister maymake order for protection of environment. www.law.org.zw [Accessed 21May 2010]. ◆
▲
930 DECEMBER 2013 VOLUME 113 The Journal of The Southern African Institute of Mining and Metallurgy
Related Documents