Application of decision-making simulation games in teaching management skills DOCTORAL DISSERTATION Marcin Wardaszko Supervisor: Prof. Witold Tomasz Bielecki, Ph.D. Warsaw, 2013

Welcome message from author
This document is posted to help you gain knowledge. Please leave a comment to let me know what you think about it! Share it to your friends and learn new things together.
Transcript
Application of decision-making simulation games in teaching
management skills DOCTORAL DISSERTATION
Marcin Wardaszko
Supervisor:
Prof. Witold Tomasz Bielecki, Ph.D.
Warsaw, 2013
2
Table of contents
Chapter I....................................................................................................................................... 4
1.1 Introduction ............................................................................................................................. 4
1.2 Objectives of the paper .................................................................................................................. 7
1.3 Methodology and theses of the paper .......................................................................................... 9
1.4 Research issues of the paper ....................................................................................................... 13
1.5 Structure of the paper .................................................................................................................. 17
Chapter II .................................................................................................................................... 20
2.1 Social context of games and plays ............................................................................................... 20
2.2 Definition of game........................................................................................................................ 23
2.3 Simulation games ......................................................................................................................... 33
2.4 Decision-making simulation games .............................................................................................. 38
2.5 History of games .......................................................................................................................... 42
2.5.1 Board games .......................................................................................................................... 42
2.5.2 History of war games ............................................................................................................ 43
2.5.3 History of business games ..................................................................................................... 46
2.6 Classification of games ................................................................................................................. 49
2.7 Managerial simulation games ...................................................................................................... 53
2.8 Current state of science and research in the scope of games and simulations ........................... 59
Chapter III ................................................................................................................................... 62
3.1 Teaching through business games ............................................................................................... 62
3.2 Education theory context ............................................................................................................. 64
3.3 Teaching through simulation games ............................................................................................ 74
3.4 Knowledge creation through experience ..................................................................................... 81
3.5 Teaching during gameplay of a simulation game ........................................................................ 88
3.5.1 The “magical circle”............................................................................................................... 88
3.5.2 Organizational development support model ........................................................................ 92
3.5.3 Process-interaction model .................................................................................................... 94
Chapter IV ................................................................................................................................ 103
4.1 Overview of decision-making simulation games in teaching management .............................. 103
4.1.1 The beer distribution game ................................................................................................. 104
4.1.2 MANAGER ........................................................................................................................... 107
4.1.3 Marketplace© ..................................................................................................................... 111
4.1.4 TOPSiM General Management II ......................................................................................... 115
3
4.1.4 Blue Ocean Strategy Simulation .......................................................................................... 120
4.2 Application of management theory in simulation games on selected examples ...................... 123
4.2.1 SysTeamsChange ................................................................................................................. 123
4.2.2 Hotel Stars ........................................................................................................................... 141
Chapter V ................................................................................................................................. 153
5.1 Simulation game as a research method ..................................................................................... 153
5.2 Simulation games in research methodology .............................................................................. 154
5.3 Simulation games compared to other research methods ......................................................... 161
5.4 Overview of research on the effectiveness of application of simulation games in education .. 163
5.5 Own studies in the scope of application of simulation games in education ............................. 171
5.5.1 The impact of cognitive assessment system of a team on the free rider problem in
decision-making game-based courses ......................................................................................... 173
5.5.2 A game inside a simulation game – the concept and design of research method ............. 184
Chapter VI ................................................................................................................................ 200
6.1 Conclusion .................................................................................................................................. 200
7. List of sources and references ................................................................................................ 205
8. List of figures ........................................................................................................................ 221
9. List of tables.......................................................................................................................... 222
Appendix no. 1. Examples of calculations of the score of Accumulated Scorecard in Marketplace
simulation game ....................................................................................................................... 223
Appendix no. 2. Table of the final score of team presentation according to AACSB methodology 232
Appendix no. 3. Integration of advertising model into the base model of demand in Hotel Stars . 236
Appendix no. 4. Survey of preferences in terms of point distribution.......................................... 238
Appendix no. 5. Assessment of the system of two decision-making games ................................. 240
Appendix no. 6. Articles of association of a simulation game team ............................................. 242
4
Chapter I
1.1 Introduction
Computer games and simulations have become a permanent element of life of contemporary
people. This is especially noticeable in the Western world, where in 2010 games were played
in 72% of households and 97% of youth aged under 18 were reported to have played
computer and video games. Today it seems that not only youngsters are gamers, though. The
average age of a gamer is 37, and a quarter of gamers are over 50. Moreover, women
constitute as much as 40% of the whole gamer population (The Entertainment Software
Association, 2011, 2012, 2013). Games owe their popularity to the universality of their
message and to the high level of involvement of players. This is exactly what Richard Duke
(1974), a pioneer of research and application of games in education, pointed to in his book
entitled “Gaming: The future’s language”. His in-depth analysis led him to the conclusion
that games and simulations would change the face of entertainment, work and education.
Duke’s ‘prophecy’ appears to be happening right in front of our very own eyes thanks to the
rapid development of technology and social changes brought about by mass on-line games.
Games also change the landscape of methods used in education. Active teaching methods
based on “gaming” methodology have been incorporated into all levels of education. The
scope of application of games is much ahead of knowledge of that phenomenon, hence the
author’s aim to bridge this gap at least to some extent.
Decision-making simulation games became a significant addition to economics education in
the academic environment. Towards the end of the 1990s, 97.5% of American business
schools from among the leading business education centers belonging to Association to
Advance Collegiate Schools of Business (AACSB) were using decision-making games to
teach management skills (Faria and Nulsen, 1998). Despite the lack of up-to-date studies in
that area, the author believes that the percentage of education facilities employing simulation
games in their teaching programs has increased close to 100%.
The author of the paper is an experienced practitioner in the area of implementing simulation
games in academic education. He has been actively involved in creating, promoting and
implementing simulation games and providing relevant training to subsequent generations of
coaches since 2003. Moreover, he is also an author and co-author of many scientific and
5
theoretical papers devoted to the topic of simulation games, and as a member of Association
for Business Simulation and Experiential Learning and International Simulation and Gaming
Association, he organizes and participates in numerous meetings and conferences – both on
domestic and international level. Still, even though the number of supporters of use of
simulation games in economics education is quite large and keeps growing systematically, the
number of skeptics seems to be increasing as well. The author believes that the most common
cause of this skepticism is bad user experience with such innovative education-training tools.
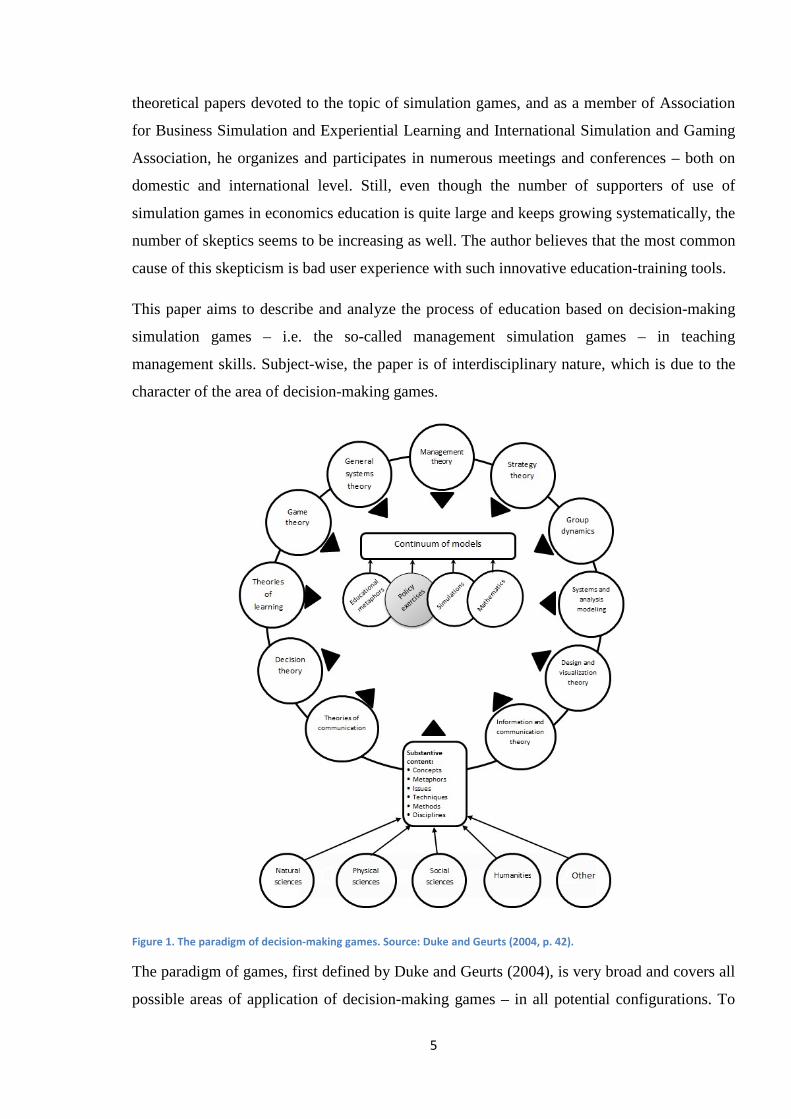
This paper aims to describe and analyze the process of education based on decision-making
simulation games – i.e. the so-called management simulation games – in teaching
management skills. Subject-wise, the paper is of interdisciplinary nature, which is due to the
character of the area of decision-making games.
Figure 1. The paradigm of decision-making games. Source: Duke and Geurts (2004, p. 42).
The paradigm of games, first defined by Duke and Geurts (2004), is very broad and covers all
possible areas of application of decision-making games – in all potential configurations. To
6
describe the means of application of simulation games, the author focused on five subject
areas: organizational science theory (games as depictions of organizations), economic theory
of entrepreneurship (games as economic systems), social and cultural aspects (games as social
systems), the field of information technology and the scope of its application (games as
technical systems) and the area of education theory (games as education systems). In terms of
history, we can speak of four fundamental areas (Keys and Wolfe, 1990) that have led to the
emergence of simulation games: war games, operations research, computer technology, and
education theory. Interestingly enough, game theory – seemingly closest to the subject in
question, will not be used as a basis for analysis of this subject. Game theory, and especially
mathematical game theory, is a completely separate discipline, and its application in the
process of implementation of games and simulations in education is limited. The author uses
this discipline to analyze gamers’ behavior, but game theory alone does not constitute an
analytical basis for the subject of application of games in economics education.
In management science, there is a strong trend of organizational games. According to this
trend, organization is viewed as a game between its participants (Latusek and Koźmiński,
2011). There are two key concepts for this discipline. The first of them is by Crozier and
Friedberg (2011) who see organization as a specific “field of play” where many actors
involved in both formal and informal framework use sources of power to achieve their own
goals. “The functioning of an organization is thus an outcome of play where the point of
departure is its formal framework, and its driving force is a combination of interests, power,
and particular strategies of individual members and their respective groups” (own translation,
Latusek and Koźmiński, 2011: 68). Based on the concept of Crozier and Friedberg (1982), it
can be seen how the concept of organizational-dynamic games emerges from the theory of
systemic management as a combination of actors and organizations in a systemic perspective.
The second key theory is the concept of controlled-environment game by Koźmiński and
Zawiślak (1982). This theory views organization as a multi-level non-zero-sum game where
the participants compete – individually or in groups – for their position and gains in particular
configurations. This concept emphasizes the fact of, so to speak, ‘obligation’ to join the game
after being accepted to an organization or a social system. These two concepts are only one
step to the definition of simulation games, which also have their roots in systemic
management. Contemporary decision-making management games provide very accurate
representations of organizational systems along with their formal and informal structures. The
next natural step is to let the actual or potential participants practice, test, and verify their
7
strategic decisions within the framework of organizational-dynamic games in an environment
free from both financial and social risks (Bielecki, 1999). Modern decision-making simulation
games are very diverse and scalable, which lets us place actors in different contexts and
various types of organizations, which in turn ensures that simulation games are very up-to-
date and effective education tools.
1.2 Objectives of the paper
Before naming the objectives of the paper, the author would like to point to a certain
education gap which is a result of the increasing dynamics of business environment. Many
authors from the area of both education and business (Bielecki et al., 1986, 2010, 2011 et al.)
highlighted the need for adapting of education system in the field of economic science – and
especially in the area of management, to the needs of the fast-changing environment and
reality. Today’s graduates should be better prepared for the role of soon-to-be employees, as
the expectations they have to face are higher and higher, and the obstacles they have to
confront – more complex and challenging in terms of speed of decision-making. The response
to the growing requirements that graduates have to deal with can be seen in education systems
based not only on knowledge and abilities, but also on experience.
The primary objective of the paper will be to create an education model based on decision-
making simulation games offering their participants not only factual knowledge and abilities,
but also valuable experience. The simulation models and information technology of today
make it possible to create very advanced and very realistic simulation games. They are
available in plenty on the market, but the knowledge of how to implement them in education-
related processes and how to evaluate the effects of their application is fragmentary and
dispersed. This leads to the primary objective of the paper, which is to standardize, analyze,
and systematize the above-mentioned knowledge. Thus, the author has ultimately created a
model of implementation, use and evaluation of comprehensive application of simulation
games in the process of teaching management skills.
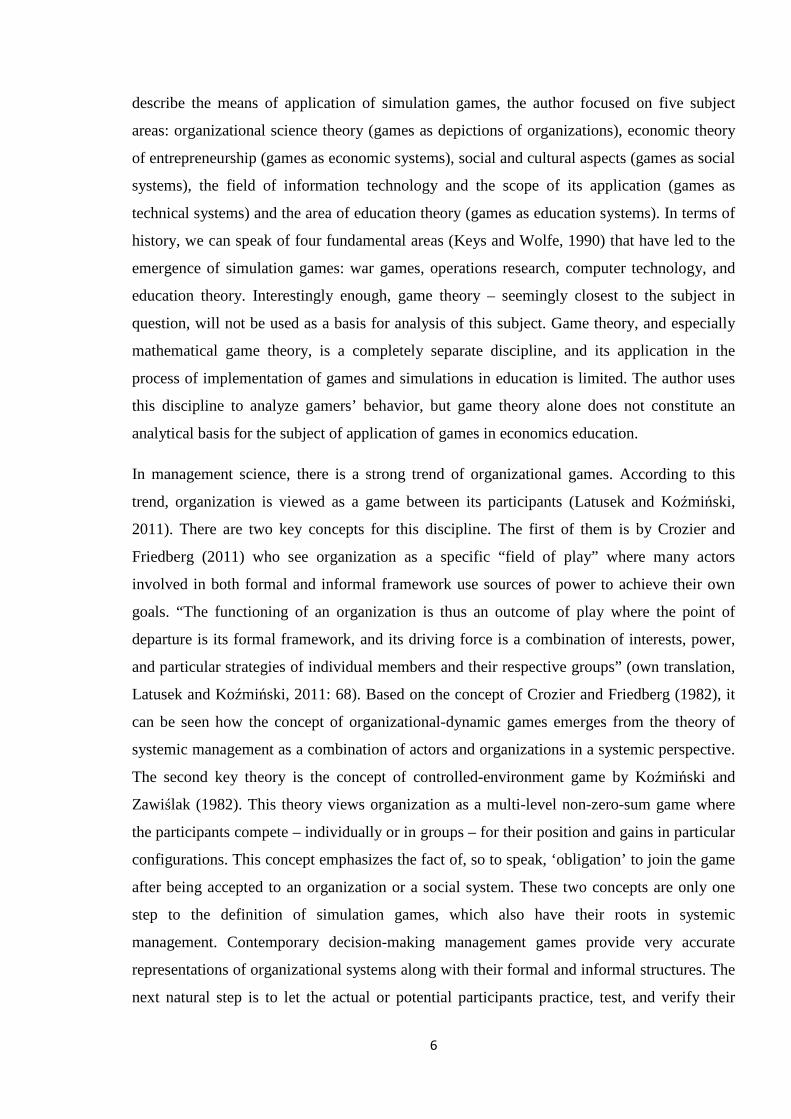
The metaphor of such approach is the process of educating plane pilots, who as part of this
process shall not only possess the appropriate theoretical background and relevant skills in the
scope of flying techniques, aircraft construction, meteorology, navigation, aerodynamics, etc.,
but also spend a particular number of hours in a flight simulator. During the training spent in
8
the simulator pilots are exposed to a number of scenarios and have to deal with different tasks,
ranging from routine flights to critical scenarios.
Figure 2. The cockpit of a passenger plane flight simulator. Source: TOPSiM facilitator materials.
The time spent in the simulator lets pilots gain the necessary experience and get used to
various – often very difficult – situations and decisions to be dealt with, and all that in an
environment free from risk, but not from pressure. Based on that, managers become pilots
‘steering’ their companies – also in conditions of economic turbulence, which is why it is
important to offer them an opportunity to gain practical experience generated by way of
simulation, apart from the usual theoretical knowledge and skills in the scope of accounting,
finance, marketing, human resource management, operational management, production,
logistics, etc. Managers should be able to face scenarios of both boom and crisis, to manage
organizations on both operational and strategic management level, and to handle whole chains
of supply – even on the international level. This way we can help both current and future
managers adapt to the dynamically changing and increasingly global market quicker and
easier – the same way the time spent in a simulator helps plane pilots make conscious
decisions in both routine and critical situations.
9
1.3 Methodology and theses of the paper
The paper is based on exploratory paradigm, which means that no hypotheses have been
made, and the objective of the paper is supported by main and auxiliary theses. This is due to
the subject covered by the paper and to the dynamic nature of the field of research of
simulation games. Making hypotheses on such general level would mean that they would also
need to be very general, which could lead to trivialization of the subject matter. That is why
the author decided to adopt exploratory paradigm, which seems most suitable for the logic of
the paper. The research experimental methodology based on computer simulations is well-
known. For over 25 years, it has been successfully applied in the naturalistic decision-making
theory. Creation of microworlds (computer simulations) has come to existence as a natural
bridge between field and laboratory research (Gonzalez, Vanyukov and Martin, 2005).
Researchers are familiar with both pros and cons of this methodology. Its biggest merit is the
possibility to control the scope and content of experiments, which is a clear advantage over
field research where the scope and results are very unpredictable. Further, microworld-based
experimental research makes it also possible to gain a deeper insight into decision-making
processes related to selected aspects, a much more detailed insight than in the case of field
research (Funke, 1995). At the same time, such form of research has a clear advantage over
laboratory research in that it offers far more realistic results, since the objects of research act
in a more natural way (Gonzalez, Stermann et al., 1989). This methodology is, however, not
without limitations. First of all, compared to field research, the scope of observation is much
more narrow, and the construction of cause-and-effect relations is harder because there are far
more elements beyond researchers’ control (Brehmer and Dörner, 1993). Researchers are
well-aware of the trade-off between the scope of research, the realism of the system and
control (Frensch and Funke, 1988). So is the author, who has taken all of the above-
mentioned elements into consideration when designing own research. The author would also
like to draw attention to the fact that experimental methodology borrowed from the research
area of dynamic decision making and human-computer interaction required some adaptation
in the process of its adjustment to the shape and nature of research on decision-making
simulation games. The fundamental difference is the transition from the level of single-player
decisions versus computer (simulation) to dynamic multiplayer games in the form of ‘players
versus players’ system. The dynamics of such play and research is much bigger, which
required adaptation of the classical method (Bielecki and Wardaszko, 2010; Wardaszko,
2011), and the nature of the scope of research on application of simulation games as tools of
10
education causes the class to become our research “field”, so to speak. After analyzing both
advantages and disadvantages of different research methods, the microworld-based research
methodology appeared to be most appropriate to prove the theses proposed in this paper.
What is more, although the author uses mainly the above-mentioned experimental
methodology, he does not exclude qualitative research in the form of interviews and
observations, as well as quantitative research such as surveys, content analyses, or game
outcome. Still, these methods are complementary to the core experimental methodology.
On the level of particular experimental research projects, some cases involved research
hypotheses and questions concerning very specific and detailed elements to be verified. On
the detailed level and in justified cases it was possible to formulate hypotheses, since such
cases concerned a narrow scope of research set in a context of experiment or research. The
hypotheses set in such way, as trivial as they might sometimes seem, served actually as a
strong support to the objective and nature of the research on that exact level. This made it
possible to provide an answer to the previously formulated research questions.
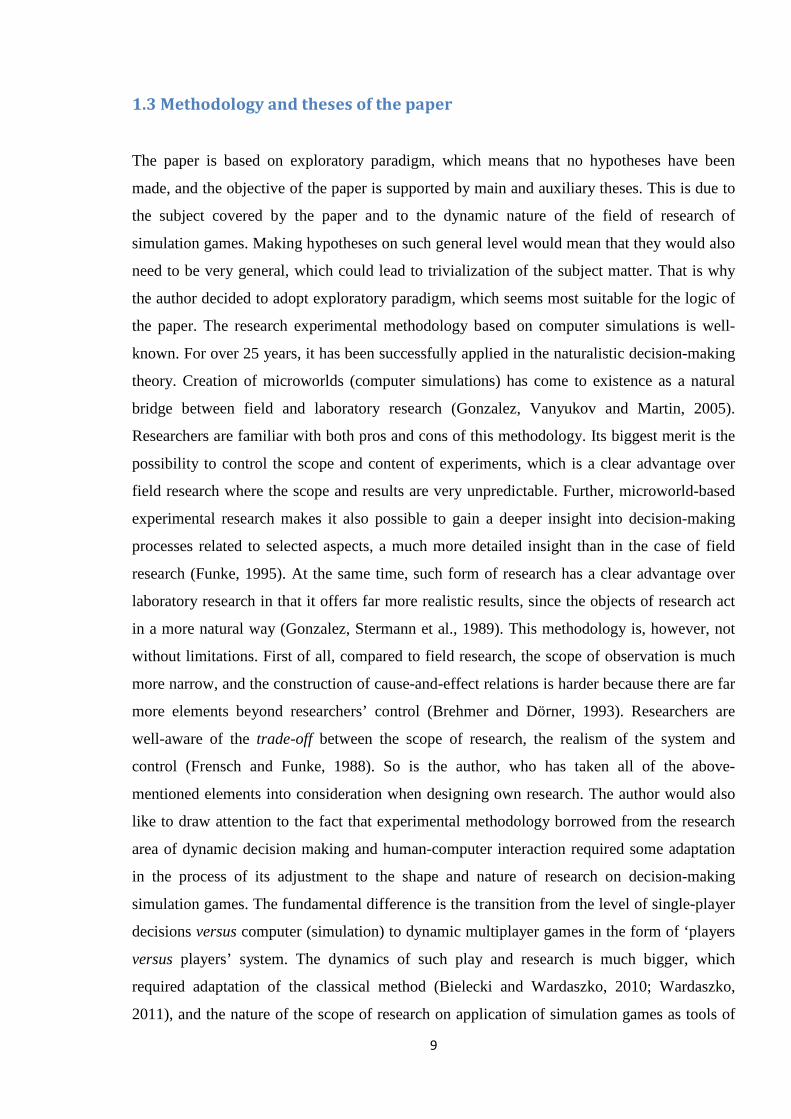
Main thesis:
It is possible to design a comprehensive and efficient system of teaching management skills, which will make it possible to acquire knowledge, skills, and experience.
Auxiliary thesis I:
Decision-making simulation games make it possible to effectively generate experience in the process of educating managers.
Auxiliary thesis II:
The present knowledge in the scope of application and implementation of decision-making simulation games in education provides an effective support for the process of teaching.
Research question I:
To what extent and in what situations can decision-making simulation games be used as research methodology?
Research question II:
How can decision-making simulation games support the process of acquiring knowledge, skills, competence, and experience?
11
The key role of theses and research questions is to provide strong support in the process of
obtaining the objectives of the paper. The main thesis is placed in the context of general
methodology of education, based on revised Bloom’s taxonomy (Anderson, Kathwohl et al.,
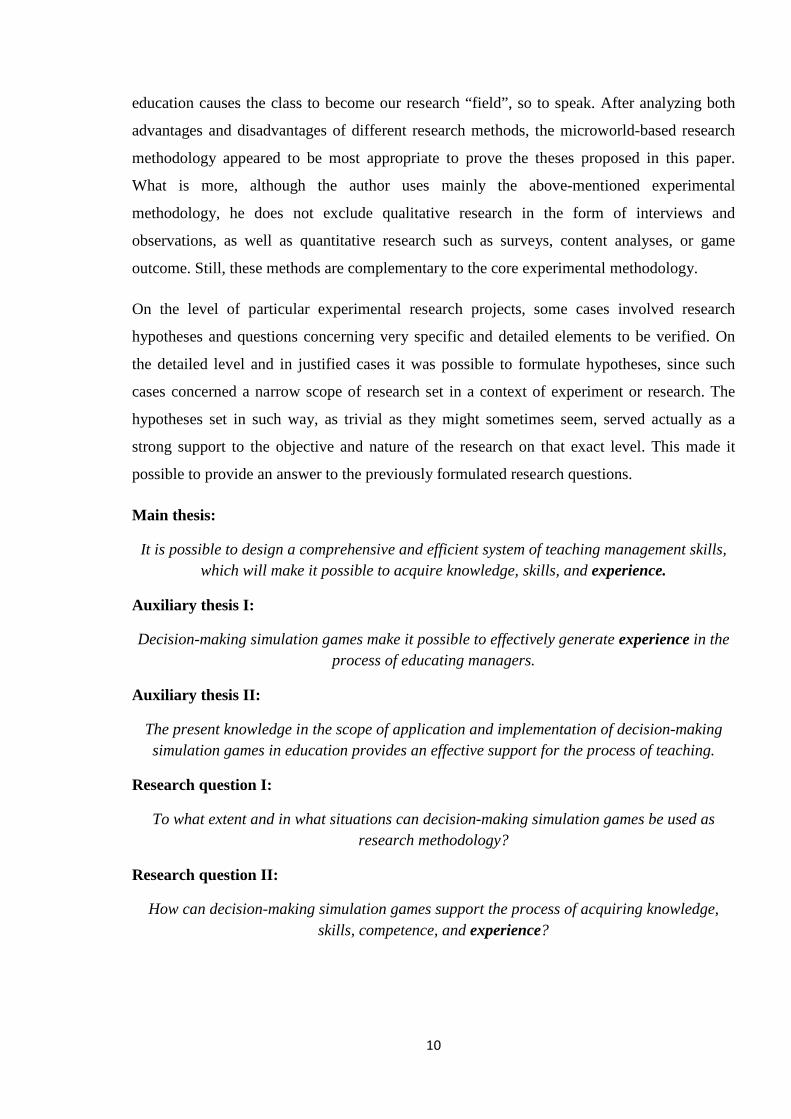
2001). The main thesis is the keynote and a vision which assumes that incorporation of
methods based on teaching through experience into the general methodology of education will
make it possible to prepare the managers of both today and tomorrow to their increasingly
demanding work better. The target model is an evolutionary model of education enabling
generating experience through simulation and lifelike experience.
Figure 3. Evolution of the model of education, based on inclusion of experience-based teaching. Own work.
Comparative analysis of the classical and the evolutionary model leads to yet another model
of approach of working with students majoring in management and administration, which – if
applied properly – can make it possible to meet our primary goal, which is to bridge the
aforesaid education gap. Yet, the author would not like to imply that the classical model is
wrong or worse. Quite the opposite – it is crucial for the two first steps of the suggested
process. Still, if we wish to arrive at the third step, we need something more than that. What
we need is an “overlay” that would serve as a supplement and evolution, not a competition.
12
Owing to simulations and other “teaching-through-experience” activities, the “third step”
model grants a substantial dose of meta-cognitive knowledge.
The first supportive thesis is a statement that refers hermetically to both practical and
theoretical present possibilities existing in the analyzed area of knowledge. The author would
like to point to the lack of element of technology in that description. This is due to the fact
that the speed of development of the area of use and application of technology of games and
simulations exceeds our ability to study and describe it. This is of course understandable,
since the fundamental principle of simulation games is the methodology of learning by doing.
This thesis is also the basis for research and cognitive approach to that area. Division into
various levels of detail and different views of the issue of application of simulation games in
educating managers let the author arrive at a multidimensional analysis of the subject and
focus on the objectives of the paper at the same time, while retaining an organized structure of
the whole.
The second supportive thesis is a logical complement to the whole and serves as the answer to
the fundamental question arising from the main thesis, which is “how to ensure an effective
system of education that would make gaining experience possible?” The foundation of the
second auxiliary thesis involves an assumption that if we use the current knowledge about
different fields and sources where we deal with teaching through experience – and especially
with simulation games, and combine it with the best available practices in education and with
the latest IT technology, it will result in a comprehensive education system that would offer
knowledge, skills, and experience. This experience is, in fact, a highly significant element
supporting the effectiveness of managers who are to face the ever-increasing challenges of the
business environment of today and tomorrow.
13
1.4 Research issues of the paper
In this paper, the author concentrated on research on application and use of simulation games
in education, especially – but not only – management-related. On account of
multidisciplinarity of the subject matter of the paper, literature research covers works from
fields like social science, game theory, system dynamics, education and learning theory,
computer game design and creation, which are all of crucial importance to the topic of the
paper, as well as a review of publications on broadly-understood games and simulations,
published since the 1950s. The literature research focuses on the analysis of a wide spectrum
of publications aimed at providing a multidimensional evaluation of the presented issues.
There has been a number of research and publications pertaining to the area of managerial
simulation games. There are also plenty of international, regional, and national organizations
(International Simulation and Gaming Association, Association of Business Simulation and
Experiential Learning, Japanese Simulation and Gaming Association, Swiss Austrian German
Simulation and Gaming Association, SagaNet from the Netherlands, and others) for
researchers, game authors, and coaches. The above-mentioned organizations have been active
for a few dozen years already. Moreover, the last decade has seen an increase in the number
of publications, conferences and workshops devoted to the use of decision-making simulation
games. This clearly indicates that the interest in simulation games is growing, as is the level
of knowledge of that area. The bases of publications and data, obtained from leading
organizations embracing both practitioners and theoreticians of application of games and
simulations made it possible to review over five thousand publications from the last 40 years.
As a coach, the author takes the subject matter of simulation games a step further than the
presently available knowledge of the matter.
The literature of the subject covers several dozens of key works on application simulation
games in the area of educating managers. One such work is an article published in 1990 in
“Journal of Management” by two leaders of the time in the field of decision-making
simulation games – Keys and Wolfe. This article became, so to speak, a manifest for
application of decision-making games in educating managers, and set the first milestone for
this area of knowledge.
The author focuses in his own research mainly on the best and most in-depth description of
application of simulation games in the process of education. The diagram presented below
shows the research framework of the issues presented in the paper.
14
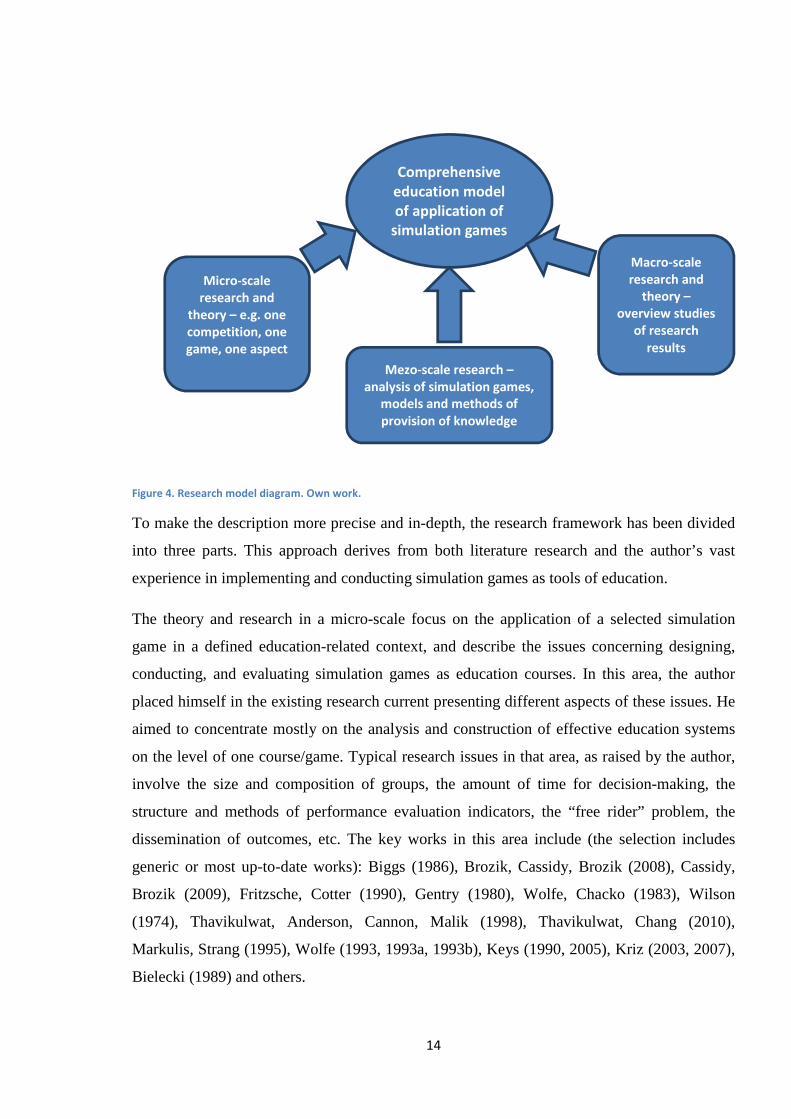
Figure 4. Research model diagram. Own work.
To make the description more precise and in-depth, the research framework has been divided
into three parts. This approach derives from both literature research and the author’s vast
experience in implementing and conducting simulation games as tools of education.
The theory and research in a micro-scale focus on the application of a selected simulation
game in a defined education-related context, and describe the issues concerning designing,
conducting, and evaluating simulation games as education courses. In this area, the author
placed himself in the existing research current presenting different aspects of these issues. He
aimed to concentrate mostly on the analysis and construction of effective education systems
on the level of one course/game. Typical research issues in that area, as raised by the author,
involve the size and composition of groups, the amount of time for decision-making, the
structure and methods of performance evaluation indicators, the “free rider” problem, the
dissemination of outcomes, etc. The key works in this area include (the selection includes
generic or most up-to-date works): Biggs (1986), Brozik, Cassidy, Brozik (2008), Cassidy,
Brozik (2009), Fritzsche, Cotter (1990), Gentry (1980), Wolfe, Chacko (1983), Wilson
(1974), Thavikulwat, Anderson, Cannon, Malik (1998), Thavikulwat, Chang (2010),
Markulis, Strang (1995), Wolfe (1993, 1993a, 1993b), Keys (1990, 2005), Kriz (2003, 2007),
Bielecki (1989) and others.
Comprehensive
education model
of application of
simulation games
Micro-scale
research and
theory – e.g. one
competition, one
game, one aspect
Mezo-scale research –
analysis of simulation games,
models and methods of
provision of knowledge
Macro-scale
research and
theory –
overview studies
of research
results
15
The author presents two of his micro-scale studies, concerning:
1. The influence of cognitive system of player team assessment on the “free rider” effect
as part of courses based on decision-making games – an experiment conducted in a
group of 167 BA/BSc students of Kozminski University in 2010.
2. Introduction of an individual system of assessment in the form of an investment game
as an additional element of assessment as part of courses based on decision-making
games, and the influence of introduction of such system on the outcome of simulation
and course satisfaction – a pilot study conducted as an experiment on a group of 28
MA/MSc students of Kozminski University in the academic year 2011/2012.
The above-mentioned studies were conducted in the form of experiments carried out among
participants of courses of decision-making simulation games at Kozminski University in the
period of 2010-2012. Most of the results of these studies were also published or presented
during conferences with researchers of decision-making simulation games who provided their
critical assessment. This made let the author develop his research skills even further.
As for the mezo-level research, the author has reviewed a number of decision-making
simulation games from the area of management and related disciplines. The aim of the review
was to arrive at a systematic assessment of the available games and simulations which can be
useful in educating managers, and to prove that the offer of the available education tools in
the scope of games and simulations is adequate to fulfill the needs for appropriate tools for
each specialty from the fields of organization and management. Five of these simulations
were analyzed in detail in order to gain a better insight in terms of their fulfillment of
education criteria. These simulations present programs from different management-related
specialties, as well as a number of management issues and their origins (national versus
international) from various perspectives. This analysis let the author prove that there exist
enough tools to make it possible to obtain the desired effects of teaching in the field of
management-related education. Next, the author analyzed two simulation games with respect
to implementation of knowledge and theory on management featured therein:
• SysTeamChange simulation game (by Willy C. Kriz and Hanja Hansen) teaching
change management in theory and in practice, which features an analysis of
application and implementation of change management theory, as well as the forms of
its transmission and evaluation;
16
• Hotel Stars simulation game designed to teach fundamentals of economics and
business in upper-secondary schools, where the author analyzed the way of
implementation of various elements of economics and management, as well as the
forms of their assessment from an econometric model perspective.
On the macro level, the author concentrated on the meta-analysis of cross-sectional research
describing the effectiveness of decision-making simulation games used as teaching tools over
the last several dozen years.
17
1.5 Structure of the paper
The structure of this dissertation reflects the state-of-the-art of the application of decision-
making simulation games in management education. The first fundamental issue the author
had to deal with is the multidisciplinarity of the area that the paper encompasses. The second
issue indicated by the author is the chaos in the literature on the subject. The third issue is the
lack of generally accepted methodology of research of use of simulation games as a research
tool.
In order to solve all the above-mentioned issues, the author adopted the following structure of
the paper. It is divided into two main parts. Chapters I to III provide a more theoretical
content, while chapters IV-VI provide a more empirical input to the paper.
The theoretical part of the paper is where the objective, the theses and the research area of the
paper are presented, and where the author tackles the chaos in the literature on the subject.
Based on the review of the available literature and on own experience in research, the author
proposes the key definitions for the subject area. The logic presented in the paper is both
evolutionary (e.g. definition of game and play) and motivated by selection of key definitions,
e.g. Klabbers (2006). In pursuit of order, the author was often forced to make difficult choices
between different theories and areas of knowledge, aiming to determine the most important
and most recognized theories and definitions, and on the other hand – to present the diversity
of theories available in the area of games and simulations. Moreover, the author addresses the
above-mentioned issues using the funnel approach, trying to show the subject of fun, gaming,
and simulation games in a broad sociocultural context, and then moves on to more detailed
aspects, ending at concrete definitions and illustrating examples. The outline of the history of
games and application of simulation games in management education is to present the sources
of games and their application in education. Chapter II finishes with indication of criteria of
division and classification of decision-making simulation games, description of managerial
simulation games, and division and categorization of the theoretical research area within the
field of games and simulations. Chapter III provides an analysis of the educational context of
teaching through experience – particularly through simulation games. This chapter follows the
same logic as chapter II. The author commences with definition of a general educational
taxonomy, and then, through an analysis of particular aspects of teaching and creation of
knowledge and experience, proceeds gradually to a detailed description of planning and
running educational courses in the form of theoretical models. These models provide a multi-
18
dimensional way of describing different aspects of education through decision-making
simulation games. The chapter closes with a model created by the author, designed based on
own experience and prior research work of the author. Such structure of the chapter is to
ensure a smooth transition from the theoretical part to the empirical part of the paper.
The second part of the paper aims to present the widest possible review of empirical
application of decision-making simulation games in education and scientific research. Chapter
IV contains an overview of simulation games, where the selection of games was based on
their diversity in terms of the represented area of management, the mode of play, and the form
of outcome evaluation. The reason behind such selection was the need for support of the main
thesis of the paper, which implies that games are able to provide their users with experience in
every specialty from the area of management. At the end of the chapter the author presents
two cases of simulation games analyzed in more detail. The analysis shows how specific
knowledge from different functional areas is incorporated into simulation games and then
transferred in the form of knowledge and experience to players through their interaction with
the game itself and with other players as part of a course. The author intends to use these
examples to highlight his own contribution into the development of simulation games, since
in the case of SysTeamsChange, he was responsible for translating and ‘polonizing’ the game
for the needs of the Polish audience. In the case of Hotel Stars, the author is the leader of the
team involved in designing and creating this simulation game.
Chapter V opens with a methodological analysis of application of simulation games as a
research tool, and research on the use of simulation games and positioning of application of
simulation games as a research tool compared to other research methods. This methodological
analysis is followed by a literature analysis based on meta-analyses of research on
effectiveness of application of simulation games in education. These two subchapters aim to
place simulation games on the map of research tools, as well as to support the thesis of the
paper, which implies that simulation games are an effective tool of education. The chapter
ends with the author’s own studies. The first of them presents an experiment involving
application of a simulation game in education. The second study is based on a concept where
one simulation game is a mechanism, while another is a research tool, which in general is a
new and innovative idea. The paper closes with a conclusion in chapter VI, where the author
summarizes and analyzes the results of his review, creative and research work.

19
The paper may at first appear to be very interdisciplinary and variegated, but this impression
is intentional. The reasons behind organizing the paper in the way as described above is the
need to show the biggest possible number of aspects of the subject matter – with their origins
in various fields of science. Moreover, the analysis conducted from different points of view
makes it possible to provide an effective verification of the theses proposed in the paper.
20
Chapter II
2.1 Social context of games and plays
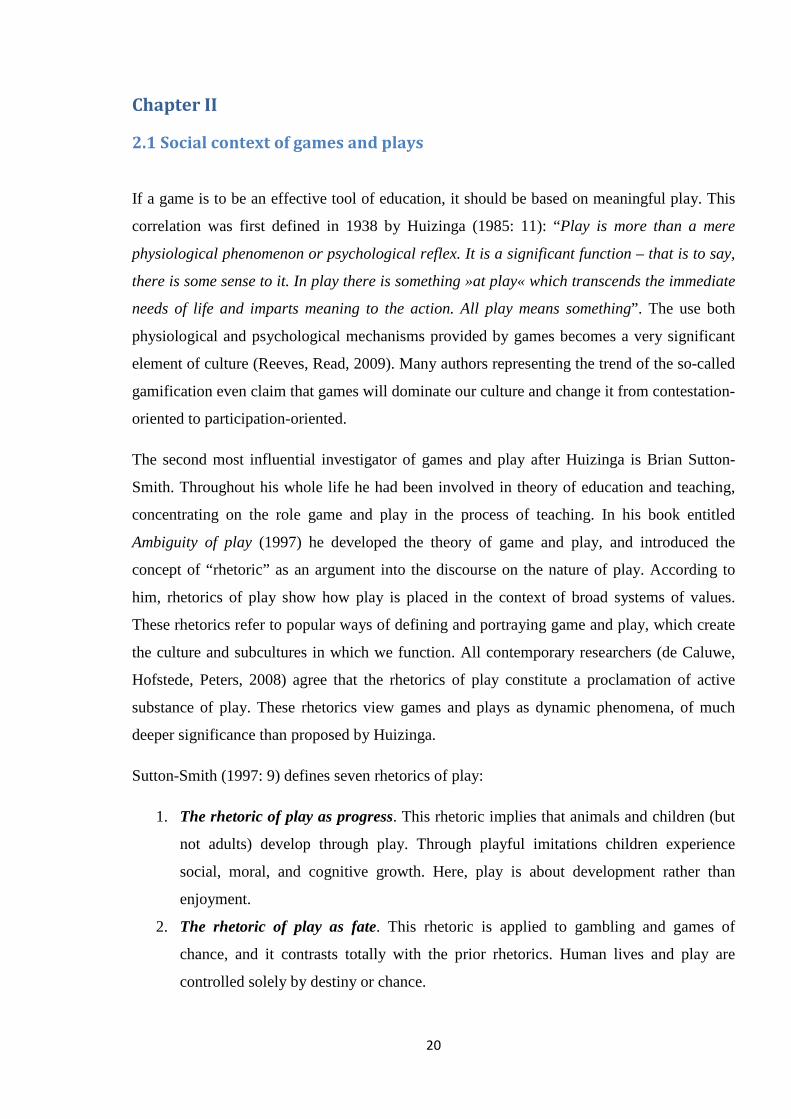
If a game is to be an effective tool of education, it should be based on meaningful play. This
correlation was first defined in 1938 by Huizinga (1985: 11): “Play is more than a mere
physiological phenomenon or psychological reflex. It is a significant function – that is to say,
there is some sense to it. In play there is something »at play« which transcends the immediate
needs of life and imparts meaning to the action. All play means something”. The use both
physiological and psychological mechanisms provided by games becomes a very significant
element of culture (Reeves, Read, 2009). Many authors representing the trend of the so-called
gamification even claim that games will dominate our culture and change it from contestation-
oriented to participation-oriented.
The second most influential investigator of games and play after Huizinga is Brian Sutton-
Smith. Throughout his whole life he had been involved in theory of education and teaching,
concentrating on the role game and play in the process of teaching. In his book entitled
Ambiguity of play (1997) he developed the theory of game and play, and introduced the
concept of “rhetoric” as an argument into the discourse on the nature of play. According to
him, rhetorics of play show how play is placed in the context of broad systems of values.
These rhetorics refer to popular ways of defining and portraying game and play, which create
the culture and subcultures in which we function. All contemporary researchers (de Caluwe,
Hofstede, Peters, 2008) agree that the rhetorics of play constitute a proclamation of active
substance of play. These rhetorics view games and plays as dynamic phenomena, of much
deeper significance than proposed by Huizinga.
Sutton-Smith (1997: 9) defines seven rhetorics of play:
1. The rhetoric of play as progress. This rhetoric implies that animals and children (but
not adults) develop through play. Through playful imitations children experience
social, moral, and cognitive growth. Here, play is about development rather than
enjoyment.
2. The rhetoric of play as fate. This rhetoric is applied to gambling and games of
chance, and it contrasts totally with the prior rhetorics. Human lives and play are
controlled solely by destiny or chance.
21
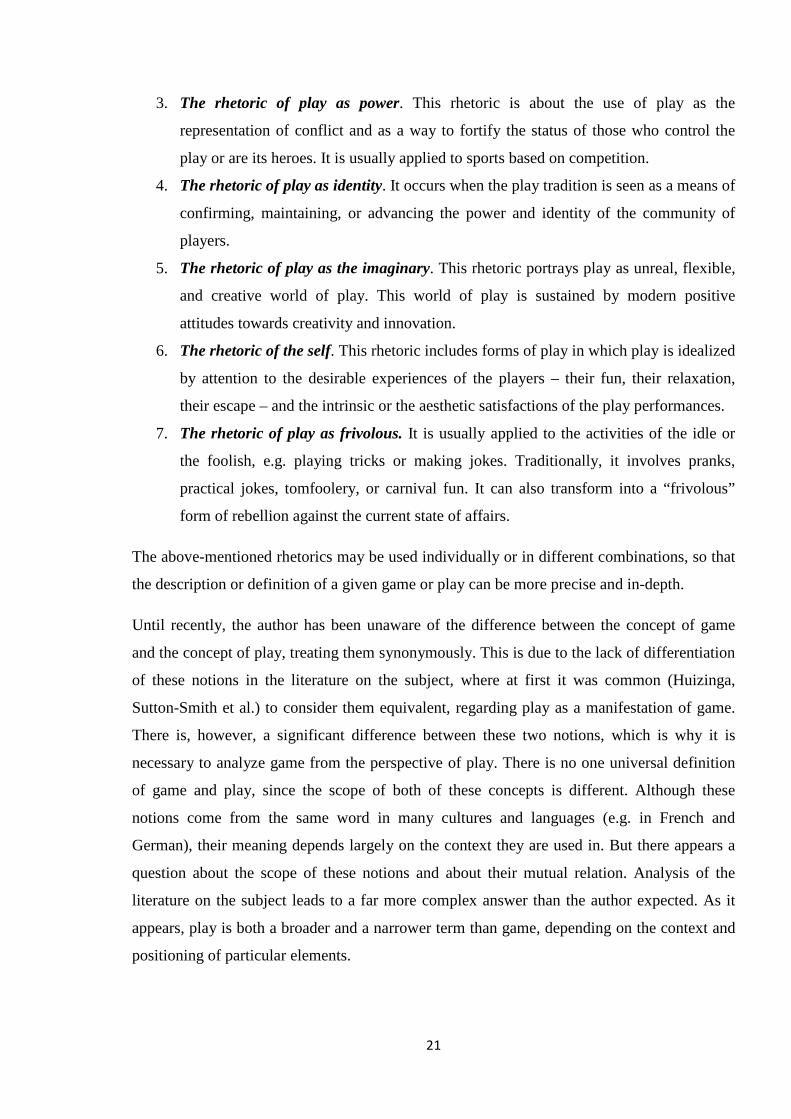
3. The rhetoric of play as power. This rhetoric is about the use of play as the
representation of conflict and as a way to fortify the status of those who control the
play or are its heroes. It is usually applied to sports based on competition.
4. The rhetoric of play as identity. It occurs when the play tradition is seen as a means of
confirming, maintaining, or advancing the power and identity of the community of
players.
5. The rhetoric of play as the imaginary. This rhetoric portrays play as unreal, flexible,
and creative world of play. This world of play is sustained by modern positive
attitudes towards creativity and innovation.
6. The rhetoric of the self. This rhetoric includes forms of play in which play is idealized
by attention to the desirable experiences of the players – their fun, their relaxation,
their escape – and the intrinsic or the aesthetic satisfactions of the play performances.
7. The rhetoric of play as frivolous. It is usually applied to the activities of the idle or
the foolish, e.g. playing tricks or making jokes. Traditionally, it involves pranks,
practical jokes, tomfoolery, or carnival fun. It can also transform into a “frivolous”
form of rebellion against the current state of affairs.
The above-mentioned rhetorics may be used individually or in different combinations, so that
the description or definition of a given game or play can be more precise and in-depth.
Until recently, the author has been unaware of the difference between the concept of game
and the concept of play, treating them synonymously. This is due to the lack of differentiation
of these notions in the literature on the subject, where at first it was common (Huizinga,
Sutton-Smith et al.) to consider them equivalent, regarding play as a manifestation of game.
There is, however, a significant difference between these two notions, which is why it is
necessary to analyze game from the perspective of play. There is no one universal definition
of game and play, since the scope of both of these concepts is different. Although these
notions come from the same word in many cultures and languages (e.g. in French and
German), their meaning depends largely on the context they are used in. But there appears a
question about the scope of these notions and about their mutual relation. Analysis of the
literature on the subject leads to a far more complex answer than the author expected. As it
appears, play is both a broader and a narrower term than game, depending on the context and
positioning of particular elements.
22
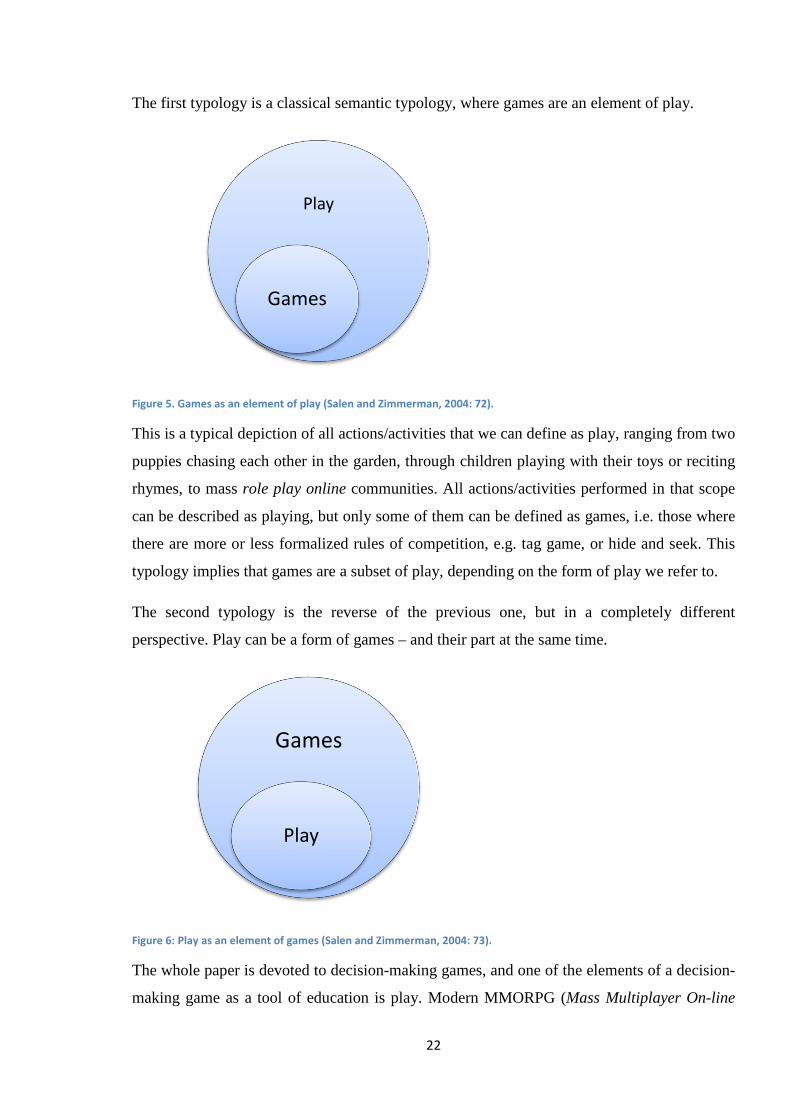
The first typology is a classical semantic typology, where games are an element of play.
Figure 5. Games as an element of play (Salen and Zimmerman, 2004: 72).
This is a typical depiction of all actions/activities that we can define as play, ranging from two
puppies chasing each other in the garden, through children playing with their toys or reciting
rhymes, to mass role play online communities. All actions/activities performed in that scope
can be described as playing, but only some of them can be defined as games, i.e. those where
there are more or less formalized rules of competition, e.g. tag game, or hide and seek. This
typology implies that games are a subset of play, depending on the form of play we refer to.
The second typology is the reverse of the previous one, but in a completely different
perspective. Play can be a form of games – and their part at the same time.
Figure 6: Play as an element of games (Salen and Zimmerman, 2004: 73).
The whole paper is devoted to decision-making games, and one of the elements of a decision-
making game as a tool of education is play. Modern MMORPG (Mass Multiplayer On-line
Play
Games
Games
Play
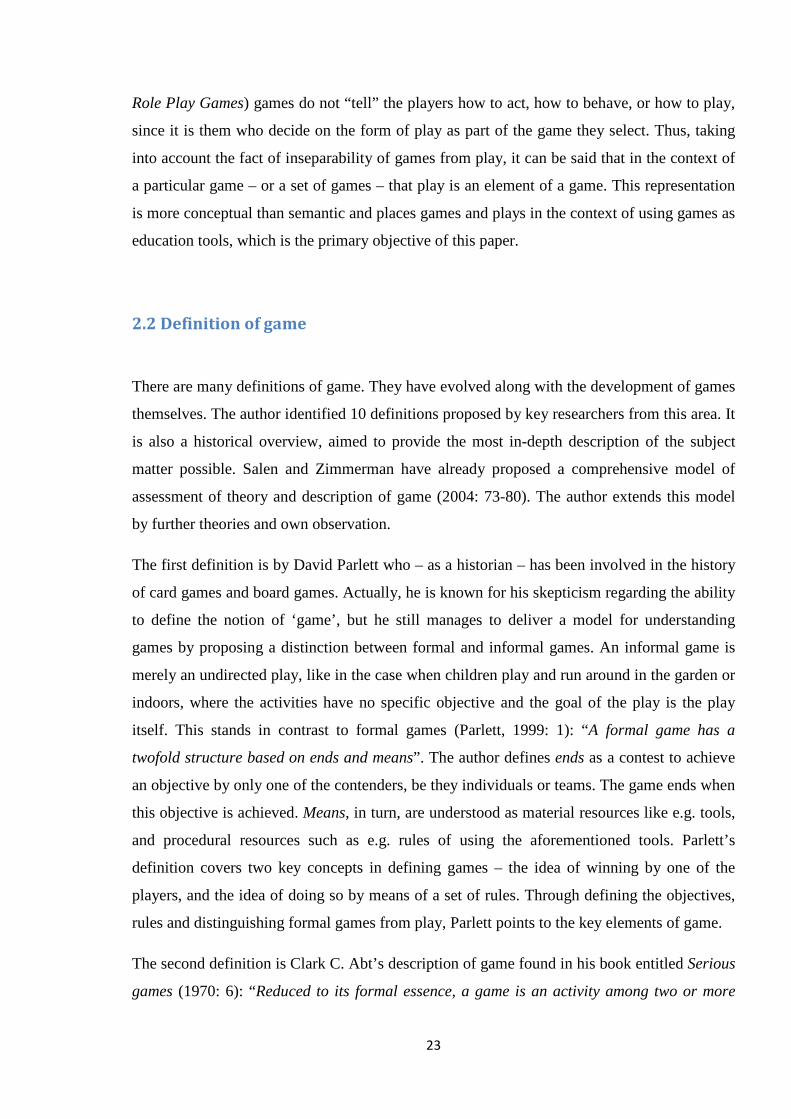
23
Role Play Games) games do not “tell” the players how to act, how to behave, or how to play,
since it is them who decide on the form of play as part of the game they select. Thus, taking
into account the fact of inseparability of games from play, it can be said that in the context of
a particular game – or a set of games – that play is an element of a game. This representation
is more conceptual than semantic and places games and plays in the context of using games as
education tools, which is the primary objective of this paper.
2.2 Definition of game
There are many definitions of game. They have evolved along with the development of games
themselves. The author identified 10 definitions proposed by key researchers from this area. It
is also a historical overview, aimed to provide the most in-depth description of the subject
matter possible. Salen and Zimmerman have already proposed a comprehensive model of
assessment of theory and description of game (2004: 73-80). The author extends this model
by further theories and own observation.
The first definition is by David Parlett who – as a historian – has been involved in the history
of card games and board games. Actually, he is known for his skepticism regarding the ability
to define the notion of ‘game’, but he still manages to deliver a model for understanding
games by proposing a distinction between formal and informal games. An informal game is
merely an undirected play, like in the case when children play and run around in the garden or
indoors, where the activities have no specific objective and the goal of the play is the play
itself. This stands in contrast to formal games (Parlett, 1999: 1): “A formal game has a
twofold structure based on ends and means”. The author defines ends as a contest to achieve
an objective by only one of the contenders, be they individuals or teams. The game ends when
this objective is achieved. Means, in turn, are understood as material resources like e.g. tools,
and procedural resources such as e.g. rules of using the aforementioned tools. Parlett’s
definition covers two key concepts in defining games – the idea of winning by one of the
players, and the idea of doing so by means of a set of rules. Through defining the objectives,
rules and distinguishing formal games from play, Parlett points to the key elements of game.
The second definition is Clark C. Abt’s description of game found in his book entitled Serious
games (1970: 6): “Reduced to its formal essence, a game is an activity among two or more
24
independent decision-makers seeking to achieve their objectives in some limiting context. A
more conventional definition would say that a game is a context with rules among adversaries
trying to win objectives”. Abt’s definition offers an understanding of games as active interplay
between players. There are four key elements of this definition:
• activity – a game is an activity, a process, an event,
• decision-makers – games require players actively making decisions,
• objectives – as with Parlett’s definitions, games have goals as the criteria of victory,
• limiting context – rules that limit and structure the activity of the game.
Comparing Parlett’s and Abt’s definitions, we can find some common characteristics, such as
objectives and rules, but Abt adds the idea of rules as intrinsically limiting barriers for the
players. Yet, the most interesting element of Abt’s definition is his acknowledgment that
games are a contestant-centered activity in which competing players make decisions actively.
Still, this innovation becomes at the same time the basis for criticism of Abt’s definition,
which the author clearly admits further in his book (1970: 7). Not all games are based on
contests or played between at least two players. There are many games involving cooperation
or solitaire play against the system, forces of nature, or fate. The concept of presenting
conflict as a game is still a very important element of games, especially in the context of
business games, where competition is a vital driving force behind human activity.
Interestingly enough, Abt’s definition is quite close to the definition found in game theory.
Von Neumann and Morgenstern avoided defining games in their original work (1947: 49), but
they still managed to define their fundamental elements. A statement which seems to be
closest to a definition is one which implies that game is a sum of rules describing it, but this
description is still too narrow to call it a definition. The notion of game does still not appear in
later works concerning game theory, but the authors do mention when we have to do with
games from the game-theory perspective (Straffin, 2001: 1), and this is when:
• there are at least two players,
• each player has a certain number of possible strategies to choose from,
• the outcome of the game is determined by the combination of strategies selected by
the players,
• there is a collection of numerical payoffs associated with each possible outcome of the
game.
25
Extraction of these elements from game theory is purely utilitarian and hence very narrow,
since from the perspective of game theory, game is just a tool of interplay. Moreover, from
the point of view of the game theoreticians cited above, game is a subject of description and
research. Due to the narrow specificity and very limited nature of this game-theory-
perspective-based description of game, they tend to reject it, and the author concurs with this
approach.
To recapitulate the analysis of definitions by Parlett and Abt, we can use the example of golf.
From the game objective perspective, it is a sport where you need to hit a ball into a hole
using as few strokes as possible. It would thus seem that the most reasonable strategy would
be to take the ball, head to the hole and throw it inside this hole. However, golf players agreed
(rules) to use clubs (means) and hit the ball in a strictly specific way. This led to formation of
a challenge and an area for competition for many players, with a predefined end and a set of
defined rules.
The third definition sees game as a description of play, and originates from the aforecited
Johan Huizinga’s groundbreaking book entitled Homo ludens (1985). Huizinga does not
provide a direct definition of game, but his description and analysis of play seem actually to
define the key features of game; according to him, play (Huizinga, 1985: 19–28):
• is outside “ordinary” life,
• is not serious,
• is utterly absorbing,
• is not to be associated with material interest or profit,
• takes place in its own boundaries of time and space,
• proceeds according to rules,
• creates social groups that separate themselves from the outside world.
In his definition, Huizinga manages to identify and capture some of the most difficult –
elusive and abstract – elements of game. His description provides a precise and accurate
portrayal of humans in the state of play – flippant and utterly absorbed at the same time. On
the other hand, it is not clear if these elements based on players’ experience could help to
define a game, since a poorly designed or poorly organized game fails to be absorbing, but is
still a game. Other aspects of this definition that need critical evaluation include: separation
from the reality, limitation by time and space, and the lack of material motivation to play. All
26
these elements are more common for play than game, and to the issue of intrinsic
“artificiality” of games. To summarize, it can be stated that Huizinga’s definition includes
many interesting and vital ideals, but it is still too general, and it does not provide a clear
distinction between game and play.
The fourth definition is by Roger Caillois, a French sociologist who expanded the work of
Huizinga during the 1960s. His book entitled Man, Play, and Games was a direct response to
Homo ludens. It is there where Caillois presents his definition of game and elements thereof
(Caillois, 2001: 9–10), describing it as:
• free – playing is not obligatory; if it were, it would lose its attractiveness as a form of
diversion,
• separate – limited in time and space, defined and fixed in advance,
• uncertain – both outcome and result cannot be determined or attained beforehand,
which leaves the space for players’ initiative and innovation.
• unproductive – creating neither goods, nor wealth, nor new elements of any kind; and,
except for the exchange of property among players, ending in a situation identical to
that prevailing at the beginning of the game.
• governed by rules – under conventions that suspend ordinary laws, and for the
moment establish new legislation, which alone counts.
• make-believe – accompanied by a special awareness of a “second” reality or of a free
“unreality”, as against real life.
Some of these ideas were already present in the previous definitions. So far, every one of
them includes a reference to the fact that game is governed by rules. The ideas that games
exist in a separate time and space, and do not involve exchange of capital are borrowed from
Huizinga. However, Caillois proceeds further by stating that game is free and involuntary,
pointing at the same to the fact that the end of a game is uncertain and non-determined.
Moreover, this definition places game in an alternative “reality” created by players. The
analysis of elements of this definition leads to an image similar to that of Huizinga, especially
since Caillois was heavily influenced by the former. Hence, the question is: are all elements of
theory related to game, or rather to play? If we summarize Caillois’ definition, our
conclusions will be close to those proposed by Huizinga, which means that the precision of
the definition of game gives way to its breadth, and this leads in turn to its vagueness.
27
The fifth definition comes from Bernard Suits, a philosopher with a strong interest in games.
His book entitled Grasshopper: Games, Life, and Utopia is a playful retelling of the popular
fable about the Grasshopper and the Ants, and an in-depth analysis of the nature of games.
Suits offers a definition of game (Suits, 1990: 34), which implies that it is a free decision of
players to overcome unnecessary obstacles. In addition, it can be done only by means of
following a specific set of rules which limit the effectiveness of players, and make their effort
bearable. Suits’ definition may at first seem to be quite far from classical game theories, but it
still includes some familiar elements such as:
• activity – as with Abt, Suits emphasizes the activity of players,
• voluntariness – games are freely entered into,
• aiming to a specific state of affairs – games have a goal,
• rules – as in the previous definitions, Suits identifies rules as component of games,
• inefficiency – the rules of games limit behavior, making it less efficient,
• rules are accepted – joining a game means accepting the rules.
Suits’ definition is new in that it adds the notion of overcoming unnecessary obstacles. Suits
is the first one to notice a very important element – if the set of rules forces inefficiency, it
makes the game more challenging and, consequently, more absorbing. His definition is very
insightful, but focuses more on the act of playing a game, and not on game itself. This is true
also in the case of the definitions proposed by Huizinga and Caillois, where the emphasis is
more on the act of playing than on the game.
Definition number six is by Chris Crawford, a pioneering computer game designer who has
written a number of works about creating and designing games. He devotes the first chapter of
The Art of Computer Games Design (1984) – his influential book which has become the bible
of many computer game creators – to defining games, defining their four primary qualities:
• representation – a game is a closed formal system with a subjective subset of rules
creating an alternative reality;
• interaction – games include an interactive element; players explore the game and its
mechanics, generate causes and observe effects;
• conflict – a common element in all games is conflict, which arises naturally from the
interaction in a game. Players are active in the pursuit of their goals. Obstacles –
28
including other players – prevent them from achieving these goals, which makes the
game more challenging;
• safety – conflict implies danger; danger means risk of harm/loss; harm/loss is
undesirable. Therefore, a game is an artifice for providing the psychological
experiences of conflict and danger – and the ways of dealing with them – while
excluding their physical consequences. In short – games are a safe way to experience
reality.
Each of these qualities may be considered separately. The notion of representation is
reminiscent of the quality of make-believe proposed by Caillois, but Crawford takes this
concept one step further, linking the game’s capacity for representation directly to its rules,
portraying it for the first time as a system. Defining games as systems has far-reaching
consequences from the perspective of work. Every organization may be defined as a system,
which implies that business games may be considered as representations of organizations in
the form of a system with a defined set of rules. Crawford is the first author writing from a
digital game point of view, which strongly affects his model of portraying games in general.
The seventh definition is by Greg Costikyan. He is a game designer and an author of many
articles on games, and proposes his own definition of game in his essay entitled I Have No
Words and I Must Design (1994): “A game is a form of art in which participants, termed
players, make decisions in order to manage resources through game tokens in the pursuit of a
goal”.
The key elements in his definition are:
• art – games are identified as a form of art and culture,
• decision-making players – games require active participation as choices are made,
• resource management – player decisions hinge on manipulating resources,
• symbolic items (tokens) – the means by which players enact their decisions,
• goal – a game has an objective.
Like Crawford, Costikyan is strongly influenced by digital game design and shares the
emphasis on decision-making and interactive quality of game playing. Yet, his definition
includes some new elements. First, he is the only one to leave out the special quality of rules
in defining a game. Second, his definition is the first to introduce the notion of tokens as one
of the most vital elements defining games and their quality, which is very significant in the
29
context of business games focusing on resource management. Third, Costikyan is the only
writer to link games to art, placing them in a cultural context, which has led to a heated
discussion on labelling games as manifestations of mass culture, be it high or low.
Definition number eight is by the aforementioned and aforecited Brian Sutton-Smith who
together with Elliot Avedon arrived at a very interesting and significant definition of game,
which they offered in their book entitled The Study of Games (1971: 405): “Games are an
exercise of voluntary control systems, in which there is a contest between powers, confined by
rules in order to produce a disequilibrial outcome”.
The key elements of this definition are:
• exercise of control systems – games require intellectual or physical activity,
• voluntariness – games are freely entered into,
• contest between powers – games embody a conflict between players,
• confined by rules – the limiting nature of rules is emphasized,
• disequilibrial outcome – the outcome of a game is a goal-state which is different
than the starting state of the game.
None of the elements of the Avedon and Sutton-Smith’s definition is new, but their definition
includes two significant and key advantages. Firstly, it addresses games directly – unlike
other definitions which usually focus on play itself and/or the process of playing games. This
makes their formulation the most comprehensive definition of game so far. Secondly, even
though it does not provide any new elements, it does follow an elegant composition and
clearly demarcates games from less formal play activities. Yet, the element of disequilibrial
outcome gives some ground for criticism, as it is possible to achieve the same or similar
outcome in many games.
The ninth definition is provided by Katie Salen and Eric Zimmerman and comes from their
groundbreaking book entitled Rules of Play (2004), which organized the available knowledge
in the field of games, devoting particular attention to digital games. The authors analyzed
many definitions and based on that – as well as on their own observations – introduced a new
definition of game (2004: 80): “A game is a system in which players engage in an artificial
conflict, defined by rules, that results in a quantifiable outcome”.
30
The key elements of this definition are:
• system – a game is a system,
• players – a game requires at least one player,
• artificial reality – a game remains separate from the real world in time and space,
• conflict – all games embody a contest of powers; the contest can take many forms,
from cooperation to competition, from solo conflict with a game system or forces of
nature to multiplayer social conflict in the form of mass on-line role-play games
involving many fractions,
• rules – rules are a crucial part of games; rules provide the structure out of which play
emerges,
• quantifiable outcome – games have a quantifiable goal or outcome; at the conclusion
of a game, a player either wins or loses, or receives some kind of numerical score.
Salen and Zimmerman’s definition contains features similar to that found in the previous
definitions. The new element is the one concerning quantifiable outcome, which is a new
element specifying the elements of the system, rules, and objectives of the game.
Furthermore, the authors leave out the concept of voluntariness, but retain the element of
separation from the reality. The definition is mostly criticized for being very uneven with
respect to the scope of particular elements, from the very general – such as system or rules, to
the very specific – such as quantifiable goal or conflict.
The last – tenth – definition is by Jane McGonigal, who is the author of Reality is broken – a
bestseller on contemporary trends in application of games and their place in the reality of
today. She proposes her own definition of games based on four elements (McGonigal, 2011:
21):
• Goal – is a specific outcome that players will work to achieve. A clearly defined goal
makes players focus on achieving it throughout the game. The goal provides players
with a sense of purpose;
• Rules – they place limitations on how players can achieve the goal. Rules push players
to explore previously uncharted possibility spaces by removing or limiting the obvious
way of getting to the goal. Limitations support creativity and foster strategic thinking;
• Feedback system – a system that tells players how close they are to achieving the goal.
It can be based on a simple graphic representation in the form of e.g. a progress bar, or
31
on more complex solutions like e.g. scoreboards, multi-dimensional real-time player
performance indicators. Real-time feedback system serves as a promise that the goal is
definitely achievable, and it provides motivation to keep playing;
• Voluntary participation – it requires that everyone who is playing the game knowingly
and willingly accepts the goal, the rules, and the feedback. Knowingness establishes
common ground for multiple people to play together. The freedom to enter or leave a
game at will changes the intentionally stressful and challenging work into a safe and
pleasant activity.
This definition features several known elements like goal, rules, and voluntary participation,
but there is also a new element – the system of feedback. The notion of feedback system is
somewhat similar to Salen and Zimmerman’s concept of quantifiable outcome, but the
argument is held on a much higher level of generality without compromising on the precision
of the description. This definition concentrates more on playing a game rather than on a
comprehensive description of game, but its main advantage is the focus on effectiveness and
involvement that the game generates among the players (Selen and Zimmerman, 2004).
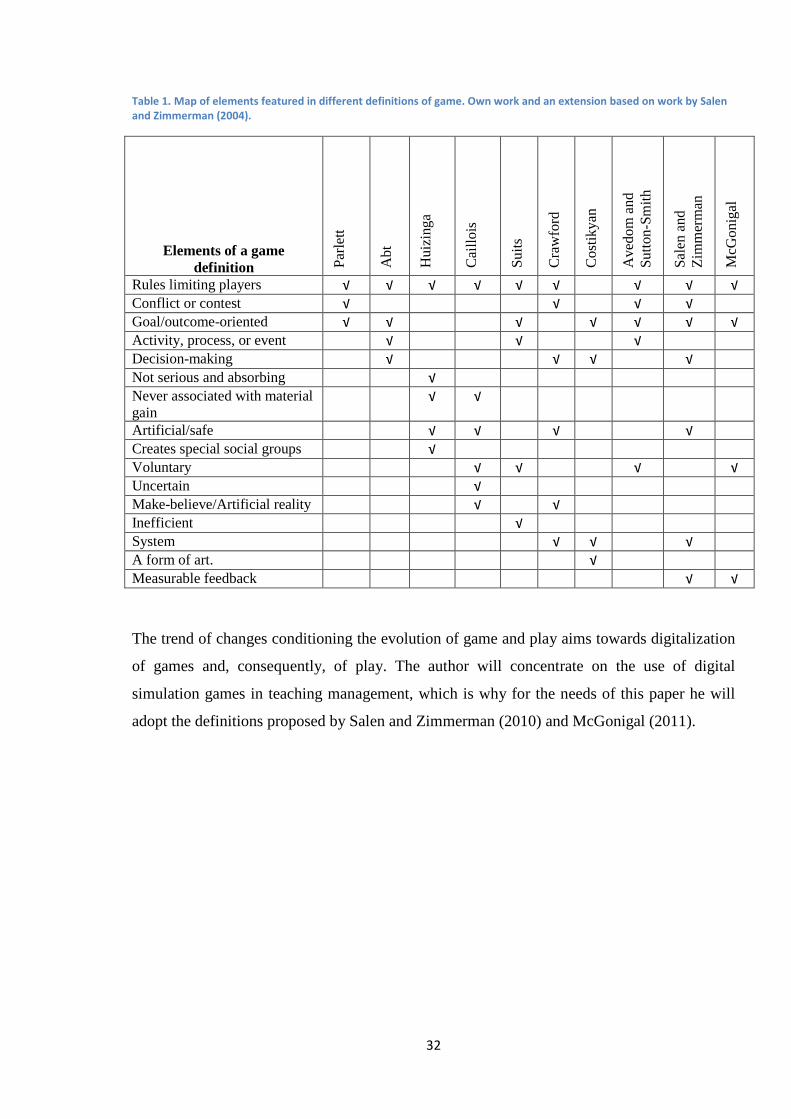
The abovementioned definitions are summarized in table 1 below. Definitions of game and
play have evolved along our understanding of the social processes related to gaming and
playing, and along with the development of games. We have seen games develop in all their
forms and variations, the same way we have witnessed the dynamic technological progress in
recent times, which all in all led to a change in both the nature and the ways of application of
games. This naturally triggered a change in the definition of game.
32
Table 1. Map of elements featured in different definitions of game. Own work and an extension based on work by Salen
and Zimmerman (2004).
Elements of a game definition P
arle
tt
Abt
Hui
zing
a
Cai
llois
Sui
ts
Cra
wfo
rd
Cos
tikya
n
Ave
dom
and
S
utto
n-S
mith
Sal
en a
nd
Zim
mer
man
McG
onig
al
Rules limiting players √ √ √ √ √ √ √ √ √
Conflict or contest √ √ √ √
Goal/outcome-oriented √ √ √ √ √ √ √
Activity, process, or event √ √ √
Decision-making √ √ √ √
Not serious and absorbing √
Never associated with material gain
√ √
Artificial/safe √ √ √ √
Creates special social groups √
Voluntary √ √ √ √
Uncertain √
Make-believe/Artificial reality √ √
Inefficient √
System √ √ √
A form of art. √
Measurable feedback √ √
The trend of changes conditioning the evolution of game and play aims towards digitalization
of games and, consequently, of play. The author will concentrate on the use of digital
simulation games in teaching management, which is why for the needs of this paper he will
adopt the definitions proposed by Salen and Zimmerman (2010) and McGonigal (2011).
33
2.3 Simulation games
An organization can be viewed as one big complex game played between all of its participants
and the surrounding environment. “An organization can be thus considered as a set of games,
more or less explicitly defined, between groups of partners who have to play with each other.
These games are played according to some informal rules which cannot be easily predicted
from the prescribed roles of the formal structure. One can discover, however, these rules, as
well as the pay-offs and the possible rational strategies of the participants by analyzing the
players’ recurrent behaviour. This could eventually be formalized according to rough game
theory models” (Crozier, 1976: 196).
As for the definition of the concept of simulation games, the literature on the subject is
somewhat inconsistent in that scope and based on an unwritten assumption that readers know
what a simulation game is. The author believes that there are two reasons for this situation.
First, there are many synonymous terms defining this concept – simulation game, simulator,
simulation model, managerial game, etc. Second, people who deal with games and application
thereof are experts from many various areas of knowledge. The simulation games they write
about are very different from one another, as they have become a part of many disciplines,
ranging from science to the humanities. Today, almost every thematic field includes some
kind of games and simulations. This leads to the aforementioned inconsistency in definitions.
The author inclines towards the systemic approach suggested by Klabbers (2006: 29–30) –
one of the most renowned researchers in the area of simulation games. Klabbers follows the
definitions of game and play by Huizinga, Abt, and Ellington as cited and analyzed previously
in the paper (except for the definition by Ellington, which is much like the one by Abt).
However, he does not limit himself – like other authors – to those definitions only, but also
offers definitions for model, simulation, simulator and practice. Klabbers clearly aimed to
introduce a kind of order to arrive at a more precise description and classification of the world
of games and simulations. His division is based on indication of a definition or a group of
features which are crucial to and representative for a given definition.
A play involves spending time on pleasant activities, participating in games, including people
into teams/groups, following, following certain steps according to the rules of a given game.
A game, apart from the definitions analyzed before, can also include the following activities
and features:

34
• activities or sports which involve skills, knowledge, or fate (chance), and where
players follow a set of predefined rules and try to win or solve a problem,
• an occasion or a meeting, mostly organized in advance, where games are played,
• a part of or a full match like e.g. tennis, bridge, or golf, i.e. composed of a defined and
finite number of game/victory points,
• a level of skills or style which a given player employs in a particular game,
• equipment which is used or necessary to participate in a game,
• an activity involving role-playing and pretending to be someone else using toys and/or
special artifacts,
• a situation treated not seriously,
• a behaviour of a person who follows a certain plan to achieve advantage or some
particular goal,
• organized events and meetings that involve competition or many different types of
contests in different disciplines.
If we look at the above list, we can assume that Klabbers intended to include as big number of
games as possible in his definition, forming a certain conglomeration of different disciplines.
The fundamental problem with this description is its chaotic nature, but this, actually, makes
it reflect the character of games, where chaos is, in fact, one of the components thereof – at
least to some extent, like in the case of e.g. games of luck/chance
A model can assume the following forms:
• a physical representation of an object, where the aim of this representation is to show
what that object looks like and operates or functions,
• a theoretical description of a system or process, where the aim of this description is to
elucidate how that system or process functions,
• an example created and organized especially to present its scope of functionality,
• an example of behavior or appearance of a person we imitate, because we admire that
person and wish to be or look like that person.
A simulation is a process of reflecting and copying a set of circumstances and/or conditions
in order to reproduce reality or a certain situation. At the same time, it is an approach to solve
an issue using a mathematical model representing a given issue or a course of events along
with the potential consequences thereof, usually using a computer as calculating device.
35
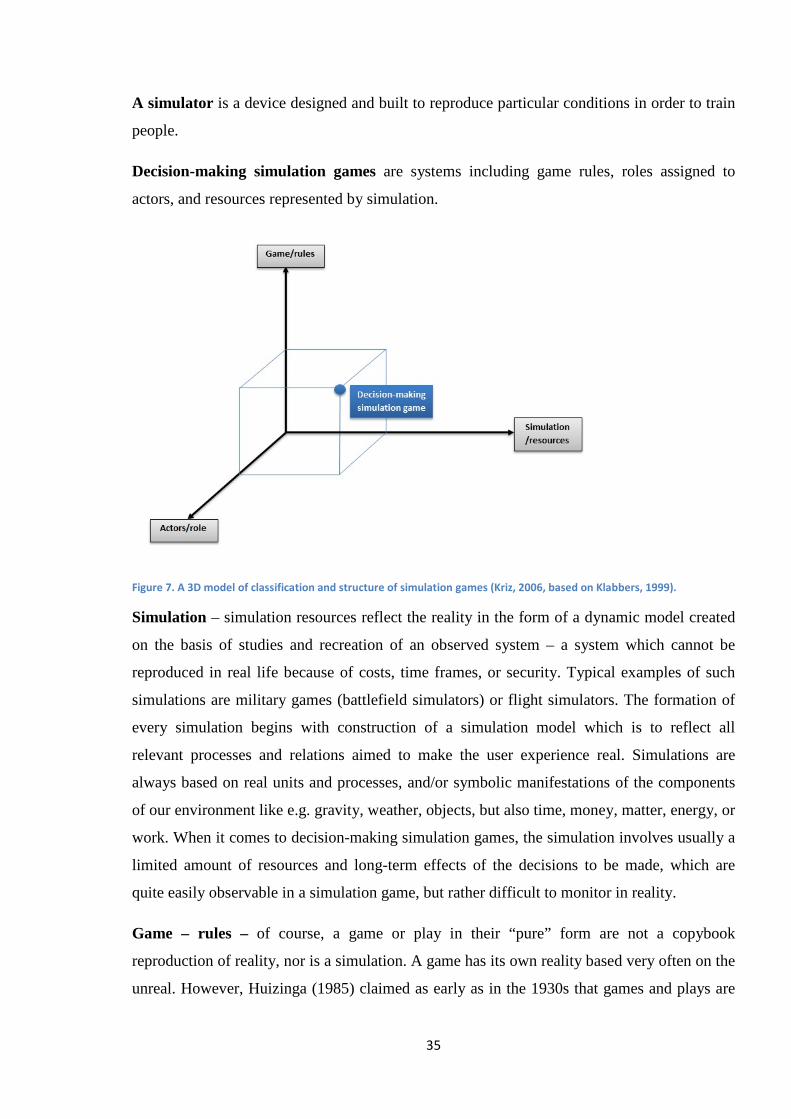
A simulator is a device designed and built to reproduce particular conditions in order to train
people.
Decision-making simulation games are systems including game rules, roles assigned to
actors, and resources represented by simulation.
Figure 7. A 3D model of classification and structure of simulation games (Kriz, 2006, based on Klabbers, 1999).
Simulation – simulation resources reflect the reality in the form of a dynamic model created
on the basis of studies and recreation of an observed system – a system which cannot be
reproduced in real life because of costs, time frames, or security. Typical examples of such
simulations are military games (battlefield simulators) or flight simulators. The formation of
every simulation begins with construction of a simulation model which is to reflect all
relevant processes and relations aimed to make the user experience real. Simulations are
always based on real units and processes, and/or symbolic manifestations of the components
of our environment like e.g. gravity, weather, objects, but also time, money, matter, energy, or
work. When it comes to decision-making simulation games, the simulation involves usually a
limited amount of resources and long-term effects of the decisions to be made, which are
quite easily observable in a simulation game, but rather difficult to monitor in reality.
Game – rules – of course, a game or play in their “pure” form are not a copybook
reproduction of reality, nor is a simulation. A game has its own reality based very often on the
unreal. However, Huizinga (1985) claimed as early as in the 1930s that games and plays are
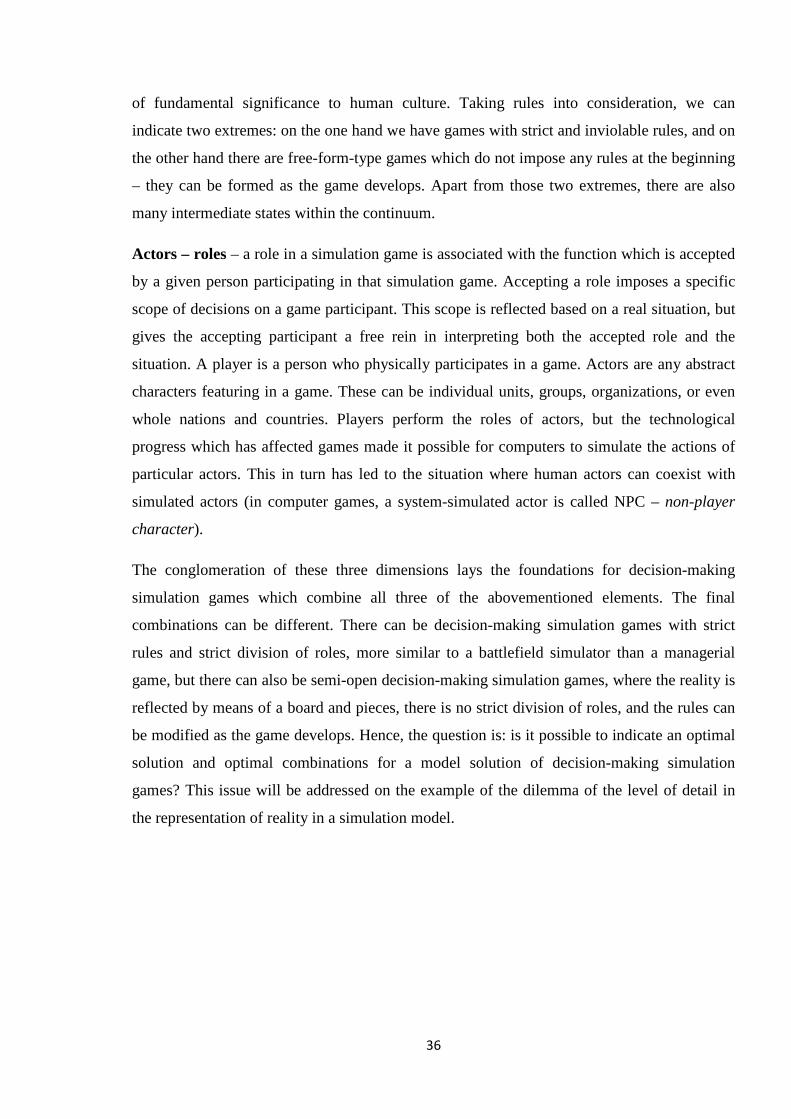
36
of fundamental significance to human culture. Taking rules into consideration, we can
indicate two extremes: on the one hand we have games with strict and inviolable rules, and on
the other hand there are free-form-type games which do not impose any rules at the beginning
– they can be formed as the game develops. Apart from those two extremes, there are also
many intermediate states within the continuum.
Actors – roles – a role in a simulation game is associated with the function which is accepted
by a given person participating in that simulation game. Accepting a role imposes a specific
scope of decisions on a game participant. This scope is reflected based on a real situation, but
gives the accepting participant a free rein in interpreting both the accepted role and the
situation. A player is a person who physically participates in a game. Actors are any abstract
characters featuring in a game. These can be individual units, groups, organizations, or even
whole nations and countries. Players perform the roles of actors, but the technological
progress which has affected games made it possible for computers to simulate the actions of
particular actors. This in turn has led to the situation where human actors can coexist with
simulated actors (in computer games, a system-simulated actor is called NPC – non-player
character).
The conglomeration of these three dimensions lays the foundations for decision-making
simulation games which combine all three of the abovementioned elements. The final
combinations can be different. There can be decision-making simulation games with strict
rules and strict division of roles, more similar to a battlefield simulator than a managerial
game, but there can also be semi-open decision-making simulation games, where the reality is
reflected by means of a board and pieces, there is no strict division of roles, and the rules can
be modified as the game develops. Hence, the question is: is it possible to indicate an optimal
solution and optimal combinations for a model solution of decision-making simulation
games? This issue will be addressed on the example of the dilemma of the level of detail in
the representation of reality in a simulation model.
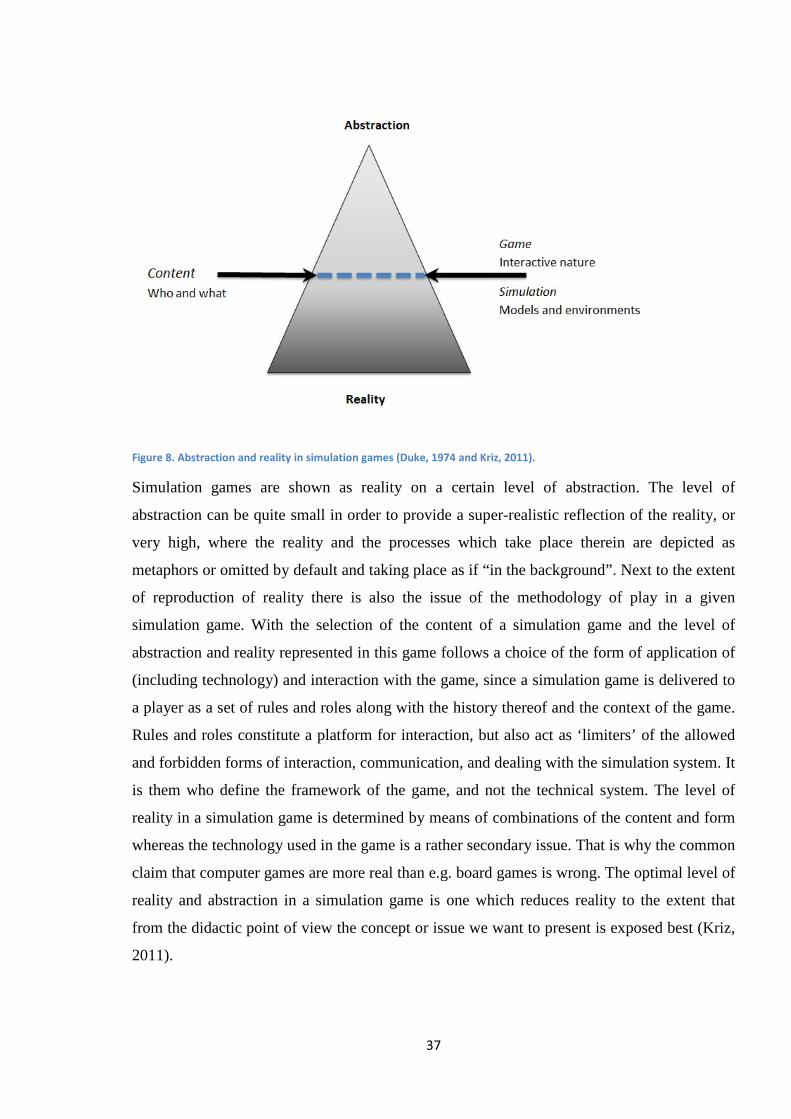
37
Figure 8. Abstraction and reality in simulation games (Duke, 1974 and Kriz, 2011).
Simulation games are shown as reality on a certain level of abstraction. The level of
abstraction can be quite small in order to provide a super-realistic reflection of the reality, or
very high, where the reality and the processes which take place therein are depicted as
metaphors or omitted by default and taking place as if “in the background”. Next to the extent
of reproduction of reality there is also the issue of the methodology of play in a given
simulation game. With the selection of the content of a simulation game and the level of
abstraction and reality represented in this game follows a choice of the form of application of
(including technology) and interaction with the game, since a simulation game is delivered to
a player as a set of rules and roles along with the history thereof and the context of the game.
Rules and roles constitute a platform for interaction, but also act as ‘limiters’ of the allowed
and forbidden forms of interaction, communication, and dealing with the simulation system. It
is them who define the framework of the game, and not the technical system. The level of
reality in a simulation game is determined by means of combinations of the content and form
whereas the technology used in the game is a rather secondary issue. That is why the common
claim that computer games are more real than e.g. board games is wrong. The optimal level of
reality and abstraction in a simulation game is one which reduces reality to the extent that
from the didactic point of view the concept or issue we want to present is exposed best (Kriz,
2011).
38
2.4 Decision-making simulation games
Definitions of games and decision-making simulation games in the Polish literature on the
subject shall begin with the one by Pszczołowski (1978: 74) who generally defines a game as:
“… an autotelic (play) or negative-cooperation-type heterotelic (e.g. competition) activity
performed according to a set of certain pre-arranged rules” (own translation). This definition
bears strong traits of influence of Huizinga’s classical game theory. By definition, autotelism
is an activity that has its own purpose within itself, and the only reason for performing such
activity is exactly the performance of this activity, which is tantamount to pure play.
Heterotelism, in turn, is a perfect antithesis of autotelism, as the purpose of its existence or
occurrence is only outside of or apart from itself, which corresponds to the concept of
competition and serious game. Further on, Pszczołowski (1978) provides the following
detailed definition of game: “From the perspective of game theory, a game is any situation
involving conflict and at least two opposite interest groups represented by e.g. two or more
game participants (opponents, players), where each of them represents only one interest
group” (own translation). The analysis of the above proves that the general definition has
been strongly affected by the classical game theory. Unfortunately, like in the case of the
abovementioned analysis of definition of game, this analysis is rather narrow and one-sided,
as it focuses only on the heterolitic part of games. Still, this definition is very significant,
since it served as the basis for other – further – definitions and descriptions. One such
definition is that proposed by Balcerak (2001: 31), concerning serious games. According to
her, serious games are simulation games that meet the following criteria:
• they are of heterolitic nature; apart from game-specific objectives, such games also
involve external utilitarian goals,
• they provide support in the process of learning, in the process of cognition of the
reproduced original, in acquiring skills and abilities, in changing one’s opinions and/or
attitudes,
• they proceed according to the following pattern: introduction, main part of the game,
game summary,
• they are supervised and organized by managing entities called facilitators/facilitators.
Apart from elements common for both Balcerak and Pszczołowski, this definition contains
also elements associated strictly with organization of serious games, which are the sole
39
process of playing a game, and the feature of game-managing entities in the form of
facilitators/facilitators.
One of the more ‘mature’ definitions of decision-making simulation games is that proposed
by Bielecki (1999: 129): “Decision-making simulation games involve inclusion of human
decision-makers in the process of simulation based on a complex mathematical model” (own
translation). This definition applies to the course and to the participants of a game.
Interestingly enough, it is one of the very few definitions which omit the issue of both rules
and objectives of participants or the game itself. Still, it is one of the most concise definitions
in that scope.
Polish literature on the subject includes also many other definitions of decision-making
simulation games. Among the most cited ones are those by Metera, Pańków, and Wach (1983:
12–13): “A decision-making simulation game is a simulation which features humans-
participants who make decisions within a simulated system, and which meets the following
conditions:
1. the objective of the game is defined,
2. the dynamic model of the simulated system is specified,
3. the participants are a part of the model,
4. the scenario of the game is set in the form of rules,
5. the game summary is pre-set and pre-defined,
6. the game is managed by a facilitators”.
Metera, Pańków, and Wach (1983) adopt the following definition of simulation:
“A simulation is an investigation of a subject system (real or hypothetical) by means of
monitoring the changes taking place in the dynamic model of that system, affected by the
changing conditions both internal and external with respect to the system itself” (own
translation).
The authors of that definition assumed that the conditions which are crucial for the
functionality of a simulation game are those numbered 2-4. Others are optional and their
significance depends on the type of game.
A more detailed definition of simulation games is provided by Balcerak and Pełech (2000),
but they propose not one, but two definitions. The first definition is a general description
(Balceark and Pełech, 2000: 11-12): “A simulation game is a simulation model whose
components are humans (at least one) performing roles in which they can affect the rest of the
model and discover and explore at least some fragments of the state of this model, and where
a part of interplay relations in any role is freely selectable” (own translation).
40
This definition is strictly in line with the aforementioned definition by Metera, Pańków, and
Wach (1983), but here, the authors highlight the human and social element, and use the
freedom of choice to refer to the concept of voluntary participation in the game. Further,
Balcerak and Pełech (2000: 11-12) offer a structural definition which alludes to typical
elements of a simulation game.
“A simulation game is a simulation model composed of the following elements:
• roles (played by humans-actors);
• scenario (also including a potential set of external influence);
• rules (defining the allowable and imperative actions of actors);
• reaction simulator (reproducing the effects of actions taken by actors performing their
respective roles) which – as a separate item – is necessary for one role, but may not
be necessary with two or more roles;
• loops:
- role – reaction simulator – role;
- scenario – role;
- scenario – reaction simulator;
- rules – role.
Every role is defined by:
• indication of the fragment of the original which is reproduced by a given role;
• goals to be achieved during the play;
• a set of possible effects on the rest of the model, with at least one effect selected freely
by the actor;
• a set of achievable information about the other parts of the model” (own translation).
For the purpose of this definition, Balcerak and Pełech (2000) adopted the following
definition of simulation model: “A simulation model is a model which makes it possible to
generate an at least three-element history of its states – treated as the history of states of the
original, where each state of the model – except for the initial state – may be set only based
on the directly preceding state” (own translation).
The second definition is a very functional description of conducting a simulation game rather
than of a simulation game itself. The definition of simulation model is similar to the definition
of computer-modelled dynamic environment.
Another structural definition that can be used as an example of mechanistic approach is a
definition proposed by Walkowiak (1981: 203, as cited in Balcerak, 2001: 28): “A decision-
41
making simulation game is a simulation of unlimited scope of application, which features
humans-participants or a human-participant making decisions within a simulated system
according to predefined rules, and where the objective of the game and the previous states of
the real or hypothetical subject simulated system are known” (own translation). The central
idea of Walkowiak’s definition is a decision-making human, hence the mechanistic quality of
this approach. Both of these structural definitions have been criticized because of their
reference only to the so-called rigid games, based on mathematical-computer models
governed by strict and non-modifiable rules. Yet, the dynamic development of technology and
knowledge about games and social behaviour makes it possible to create and use the so-called
free-form games, where both objectives and rules can evolve or be changed arbitrarily, and
where participants can actively affect the applicable rules and define objectives at their own
discretion.
42
2.5 History of games
The origins of games and play go back to the beginnings of civilization and humankind, and it
is hard to indicate the exact time of birth of these forms of activities. Huizinga (1985) claimed
that all mammals played, reaching back to the very beginnings of species in his deliberations.
There has been a number of works devoted to the history of games and play published over
the years. However, the intention of the author of this paper is to present a concise overview
of this history, as a detailed description would go much beyond the scope of the paper.
Almost all cultures (Caillois, 2001) have invented and developed games with formal
structures and sets of rules. Imitative games are the oldest known type of games, and their aim
was to prepare their participants – mostly children – to their future roles. This form of
‘education’ was highly appreciated in ancient Rome. An interesting fact is that words ‘school’
and ‘play’ have the same equivalent in Latin, which is ludus, and ‘teacher’ is literally the
‘master of play’ – magister ludi. Imitative games and plays are probably the foundation of
serious games and the point of departure for application thereof in education.
2.5.1 Board games
The oldest board games including a set of defined rules and objectives are Wei-chi, dated to
3,000 years BC, and Chaturanga, dated to 2,000 years BC (Balcerak and Pełech, 1999).
These were social ‘party’ games, not of serious type. Chaturanga was played on an 8 x 8
board and featured different kinds of pieces which symbolized elephants, chariots, and
infantry, and despite its military qualities, it was also considered a social game. It is also
believed that this game is the ancestor of chess as we know it. Chess evolved from a social
game into sport, and it is precisely this game which had its rules officially listed, and tactics
written and recorded in textbooks (Balcerak and Pełech, 1999). The history of games is
usually divided (Pełech, 1991) into two periods separated by a very long interval. These two
periods are: from ancient times to approximately AD 360, and from 1730 to the present times.
This interval is due to the lack of information on the condition, use, and popularity of games.
Board games evolve in modern times, and become more and more diverse and numerous. The
most common example is chess, which has also undergone a certain evolution and
transformation over time. Balcerak and Pełech (1999: 32) point to 4 periods of development
and use of board games in contemporary era:
43
- the royal period, from about 1730 to the period of the French Revolution and the third
partition of Poland,
- the Napoleonic period, from about 1795 to 1824 – this is a period of transition, where
games from the royal period lost popularity or disappeared, and attracted less and less
interest,
- the Prussian period, from the introduction of Kriegsspiel (literally ‘war play’) by von
Reisswitzes to the Prussian army to the post-WWII period of 1954-1957,
- the mass period, where it is very difficult to indicate the border between digitalization
of war games and first arrival of tycoon games (1957–1958) followed by
popularization of political games.
This description is of course fragmentary and rather selective, since it is only to show the
significance of application of games in the process of education.
2.5.2 History of war games
Military-themed games seem to have earned a special place in the history of mankind. They
have been used for both analytical and training purposes. The list below is organized in a
chronological order and presents a selection of games and ways of application thereof in
military doctrine and training (Jackson, 1959; Giżycki, 1973; Keys and Wolfe, 1990; Wolfe,
1993; Barczak, 1996; Pełech, 1991; Balcerak and Radosiński, 1998; Balcerak and Pełech,
1999 et al.).
ca 3,000 years BC – WEI-CHI (China). An abstract logic board game (“encircling game”).
ca 2,000 years BC – CHATURANGA (India). An 8 x 8 board game involving battles of 4-
element platoons (elephant, chariot, 3 horses, 5 foot-soldiers). This game is the predecessor of
chess.
ca 14th century – PERFECT CHESS (Tamerlane, Asia). A modified version of chess – the
game is played on a 11 x 10 board with 11 types of pieces including general, vizir, elephant,
giraffe, camel, war engine, knights.
AD 1664 – KOENIGSSPIEL or ROYAL CHESS (Christopher Weikhman). A modern version
of war chess. A game for 4, played on a cross-shaped board, where the aim was to checkmate
the opponent’s king.
44
AD 1741 – CORMONTAIGNE (Louis de Cormontaigne). An analysis of defensive
capabilities of fortresses based on the principles of regular offensive defined in a game
textbook called the “siege logbook”. This game used to be played in an officers’ school in
Mézières in France, and was an element of officer training course. It was also the first war
game to introduce an economic element in the form of army and fortress supplies.
AD 1753–1758 – GUIBERT (Jacques A.H. de Guibert). An analysis of battle course tactics
through a board game with an element of field reconnaissance.
AD 1770 – OELSNITZ (von Oelsnitz). A comprehensive analysis of military actions,
conducted in the form of the so-called open game. An element of cadet course at the School
of Chivalry in Warsaw. It is also the first known example of application of a serious game in
Poland. It had been used until the third partition of Poland in 1795.
AD 1779 – CLERK (John Clerk). The first British war game, considered also the first naval
game.
AD 1780 – ESTRALOGRAPHY or KRIEGSCHACHSPEL (Helwig of Braunschweig).
Military chess – the board reproduced the quantity of army units. This game became a basis
for a whole further series of military games with strict rules and predefined objectives, the so-
called closed games.
AD 1797 – NEUER KRIEGSSPIEL (Georg Venturini). A modified version of Estralography,
also in chess form.
AD 1811 – KRIEGSSPIEL (Johann von Reisswitz). The first war game (Kriegsschachspiel in
German) in the form of a board game similar to chess, improved further by the son of the
inventor, who replaced the table with a board and developed its mathematical model. He also
abandoned the classical concept of chess – the rules of the game and the moves of pieces
allowed on the board. In 1824 the game was officially approved as the recommended form of
education of officers in the Prussian army. While previous games were mostly logic-type
games or played for fun, the war game by von Reisswitzes is considered to be the first fully-
legitimate didactic game.
AD 1814 – BOUSMARD (Henri J. Bousmard). An analysis of a siege of field and permanent
fortifications. Also, an element of officer training course in Mézières in France.
45
AD 1889 – McCARTY (William McCarty Little). Naval war games played at US Naval War
College in Newport.
AD 1892–1906 – VON SCHLIEFFEN (Alfred von Schlieffen). Application of war games in
planning the strike on France. It was played by the General Staff of the German army.
AD 1905 – SUKHOMLINOV (Sukhomlinov). A war game used in analysis of the strategy of
the Russian army during the invasion on East Prussia, played by the General Staff of the
Russian army.
AD 1929 – VON MANSTEIN (Erich von Manstein). A planning game focused on analysis of
the effects of Poland’s invasion on Germany, played by the General Staff of the Reichswehr.
AD 1940 – ARDENENS (von Stülpnagel). A war game analyzing the scenario of attack on
France and the possibility of crossing the Ardennes, played at Wehrmacht’s Supreme
Headquarters.
AD 1955 – MONOPOLOGS (Rand Corporation, USA). A war game dealing with the issues
of supplies for the USAF, developed to train officers responsible for managing supplies and
supply chains.
The above list is still selective, but aims to present the most significant milestones in the
history of war games. Interestingly enough, war games had been more of a pastime and a
‘logical puzzle’ than an element of military training until as late as the 18th century. It was not
until the reforms in the Kingdom of Prussia by Frederick the Great (Balcerak and Pełech,
1999) – a renowned reformer of military training system, and an enthusiast of modern
methods of officer training – that war games were included into the canon of military training.
Anthony Leopold von Oelsnitz, a former officer of Frederick the Great’s Prussian army,
introduced war games to Stanisław August Poniatowski’s Shool of Chivalry, and considered
them “regular” methods of education; he also did not regard himself as their inventor or
author, so he must have learned of them during his time the Prussian army.
In later times, war games have been included and present in many different aspects of military
training. The above list ends with Monopologs for a reason, as this war game bears traits of
simulation management games of today; after all, it is considered the predecessor of modern
business games.
46
2.5.3 History of business games
The earliest business games were imitative games, first mentioned as long ago as in the times
of ancient Rome (Pełech, 1991) and involving participants assuming the roles of judges and
witnesses. While performing these roles, they decided on the course of the game, and at the
end the facilitator (or facilitators) provided their judgment on the course of the game and on
the sentence passed. The sources are, however, quite vague about this matter, and rather
fragmentary.
We can trace first mentions of an imitative game in modern times in Considerations on the
Government of Poland by J.J. Rousseau, published in 1772. He describes a didactic game
called Etat exterieur, addressed to young citizens of Berne from rich families – the future
patricians of this Swiss canton. This game involved students role-playing different figures
based on a real state administration system: senators, ministers, lawyers, and officials, and
then taking decisions related to public finance management and politics. However, the
description of this game is nowhere to be found except for the aforementioned work by
Rousseau, so it is not clear if it had been really used in teaching. Yet, the sole fact of
appearance of so detailed and well-thought-out concept of game seems to be noteworthy.
References to the first not fully ‘management-oriented’ but most certainly ‘economy-oriented’
game go back to the beginnings of the 20th century, and precisely to 1928 when Sir Ralph
Norman Angell published a description and materials to be used with a game called The
Money Game. According to the game’s inventor, its objective was to teach schoolchildren the
fundamentals of finance and banking by means of visual aids. Although it was not a
management game, it still was the first didactic economic game. There was also another game
which came to existence and started evolving around the same time – Monopoly, which, as we
know, has become one of the most popular board games in history. It was first released
officially under its current name in 1934 by Parker Brothers. Yet, it should be mentioned that
the precursor of Monopoly was a game called The Landlord’s Game by E.J. Magie (developed
in 1904). It was a simple game which involved trading and renting land.
Europe had a very interesting episode of application of games for education-related and non-
military purposes. Here, the key figure was Maria Birsztejn from Leningrad Higher School of
Art and Industry, who created a whole program of development and application of serious
games for the purpose of training USSR’s industry staff and directors. In 1932, she and her
team developed Starting management game (own translation) – their first game which gained
wider popularity; it was a simulation of initiating mass production of typewriters in a factory
47
in Ligovo, near Saint Petersburg. The game was based on war games, where the standard
board was replaced with an “economic-technical” one (Wolfe, 1993), which was to represent
the technical and social work environment. Birsztejn’s team developed and implemented
approximately 30 other different didactic games over the course of the following years, but
the outbreak of WWII put an end to the state support for such didactic projects, and the team
was disbanded. The most famous game from that period is the one called Krasnyj tkacz
(literally: red weaver) created in 1934.
The subject system described in the game was a textile factory of the same name, which was
to be re-profiled production-wise. The game was addressed to the directors and management
staff of the factory, and one of its first versions was played for about 48 hours (Wolfe, 1993).
The objective of the game was to plan and implement a work reorganization scheme with a
simultaneous maintenance of performance on a certain level, as well as to deal with a number
of random incidents at the same time.
Keys and Wolfe (1990) consider the aforementioned Monopologos as the first business game,
which was originally designed as a war game, but its later versions were adapted to both
civilian and strictly business application (Faria, 1989). It is believed that the first fully-civilian
management business game is Top Management Decision Simulation, also known as AMA
Game. It was developed at American Management Association in 1957 (Keys and Wolfe,
1990), and the team responsible for its development, led by Riccardi, was inspired to create it
after a visit to the Naval War College. AMA Game gained rapid success and paved the way for
many other competing games to emerge on the market (Faria, 1989; Greenlaw et al. 1962),
the number of which grew abruptly by the end of the 1950s. There appeared also many
different versions of AMA Game alone. Management simulation games created at that time,
such as UCLA Executive Game No. 2 and No. 3 (1957 and 1959), IBM Management Decision-
Making Laboratory (1958), Harvard Business School Game (1958), Carnegie Tech
Management Game (1959), International Operations Simulation University of Chicago
(1960), etc. sparked off a revolution in management education in the USA. The manual
Business Management Game, also known as McKinsey Game (as it was created for and
ordered by McKinsey & Company, shortly after the release of AMA Game), developed by
G.R. Andlinger and J.R Greene in 1957 (implemented in 1958) deserves a special mention
too. It was a game addressed to superior management staff, educating in the principles of
competition. The first game applied in education on an academic level was Top Management
Decision Game created and implemented by Schreiber to his course in management at the
University of Washington in the academic year of 1957/1958 (Watson, 1981).
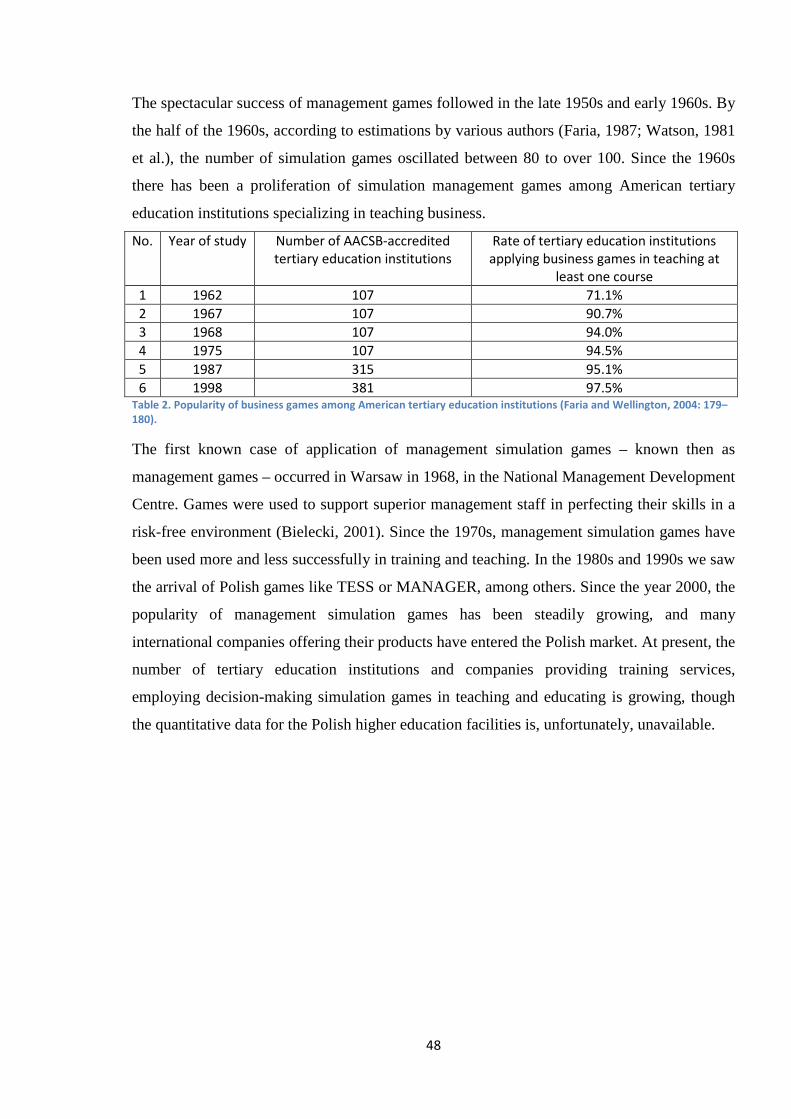
48
The spectacular success of management games followed in the late 1950s and early 1960s. By
the half of the 1960s, according to estimations by various authors (Faria, 1987; Watson, 1981
et al.), the number of simulation games oscillated between 80 to over 100. Since the 1960s
there has been a proliferation of simulation management games among American tertiary
education institutions specializing in teaching business.
No. Year of study Number of AACSB-accredited
tertiary education institutions
Rate of tertiary education institutions
applying business games in teaching at
least one course
1 1962 107 71.1%
2 1967 107 90.7%
3 1968 107 94.0%
4 1975 107 94.5%
5 1987 315 95.1%
6 1998 381 97.5% Table 2. Popularity of business games among American tertiary education institutions (Faria and Wellington, 2004: 179–
180).
The first known case of application of management simulation games – known then as
management games – occurred in Warsaw in 1968, in the National Management Development
Centre. Games were used to support superior management staff in perfecting their skills in a
risk-free environment (Bielecki, 2001). Since the 1970s, management simulation games have
been used more and less successfully in training and teaching. In the 1980s and 1990s we saw
the arrival of Polish games like TESS or MANAGER, among others. Since the year 2000, the
popularity of management simulation games has been steadily growing, and many
international companies offering their products have entered the Polish market. At present, the
number of tertiary education institutions and companies providing training services,
employing decision-making simulation games in teaching and educating is growing, though
the quantitative data for the Polish higher education facilities is, unfortunately, unavailable.
49
2.6 Classification of games
The biggest challenge in defining simulation games is drawing a distinction between
individual definitions and thematic areas. Huizinga, for instance, did not attempt to classify
games or forms of play. Instead, he placed play in the context of history and culture, and
focused on its role in the society. Only Caillois (2001) – as a continuator of Huizinga’s work
– introduced a certain order with respect to two forms of game rules and four dimensions of
cultural activities. He introduced two categories based on the structure and the presence of
rules in a game:
• Paida – a wild, free-form, improvisational play – here, the rules are uncodified and
based on an open model. These rules are not defined and can be freely modified as
necessary at the players’ discretion, or are improvised depending on the situation.
• Ludus – a rule-bound, regulated, formalized play – here, the rules are strict and often
codified; they are to be followed by game participants and are not to be questioned.
Caillois defined the abovementioned dimensions as continuum extremes, since many games
are, in fact, combinations of paida–ludus, containing elements of both of these two. In his
further analysis, Caillois goes on to propose a division into four game types based on their
roles in culture and on the possibility to affect the in-game events by the players:
� Agõn – competition – competitive games involving equal chances of winning. Players
remain in full control over the events and their behaviour and actions taken within the
game. The best known examples of such games are sports contests, decision-making
card games, and different types of races.
� Mimicry – imitation, make-believe – games where players assume the role of someone
else. Here, players also remain in control of the game and their role therein. Examples
of such games include children’s ‘make-believe’ plays, staging theatre plays and
performances, role-play games, and cabaret shows.
� Alea – fate, chance – games based on fate, luck, and chance. Here, players lose their
control of and influence on the results of the game. These are games such as betting,
roulette, lotteries, heads or tails.
� Ilinx – vertigo, excitement, bewilderment – games aimed to provide players with
unique experiences, emotions, and to disturb the stability of perception (i.e. to
experience something new and extraordinary). Here, players lose control of the results
50
of the game, as well as of the course of the game. Such games and plays are, for
instance, dancing, bungee jumping, or fast motorcycling.
Each of the aforementioned categories encompasses different games in terms of their qualities
related to the aspects of paida and ludus. Caillois knew perfectly that many game categories
interpenetrate, so he conducted an analysis of six possible pairs:
• competition and chance – (agõn – alea),
• competition and imitation (agõn – mimicry),
• competition and vertigo (agõn – ilinx),
• chance and imitation (alea – mimicry),
• chance and vertigo (alea – ilinx),
• imitation and vertigo (mimicry – illinx).
One of Caillois’ biggest achievements is defining the relations between these pairs/categories.
Ilinx and agõn are incompatible, since the conditions prerequisite for ilinx to occur exclude
the symmetry and clarity of rules and control over the course of game, as well as the need of
victory, which are the key ideas of agõn. Similarly, mimicry and alea are also mutually
exclusive for the same reasons as in the case of ilinx and agõn. The analysis of possible
combinations proves that ilinx and alea, as well as agõn and mimicry are able to coexist with
each other well. The first pair shows that fate and chance are quite frequently elements that
make the game more exciting. In the second pair, in turn, decision-making simulation games
involve a competition among players, who at the same time need also to assume the roles of
decision-makers, managers, politicians, etc.
Caillois (2001) considers the relationship between agõn and alea as simply symmetrical and
complementary. Sports or decision-making games are not deprived of the element of fate or
chance, so even games based almost solely on the skills of players and with a strictly-defined
set of rules always involve an element of chance, just like in the case of e.g. golf, football,
monopoly, scrabble, bridge. Caillois links these categories and combinations thereof to the
world of games.
Mimicry and ilinx form the second ‘natural’ pair of categories which are mutually
complementary. Both have their roots in improvisation and new experiences, and for both the
rules are fluid, or even absent. Caillois links these categories and combinations thereof to the
world of play.
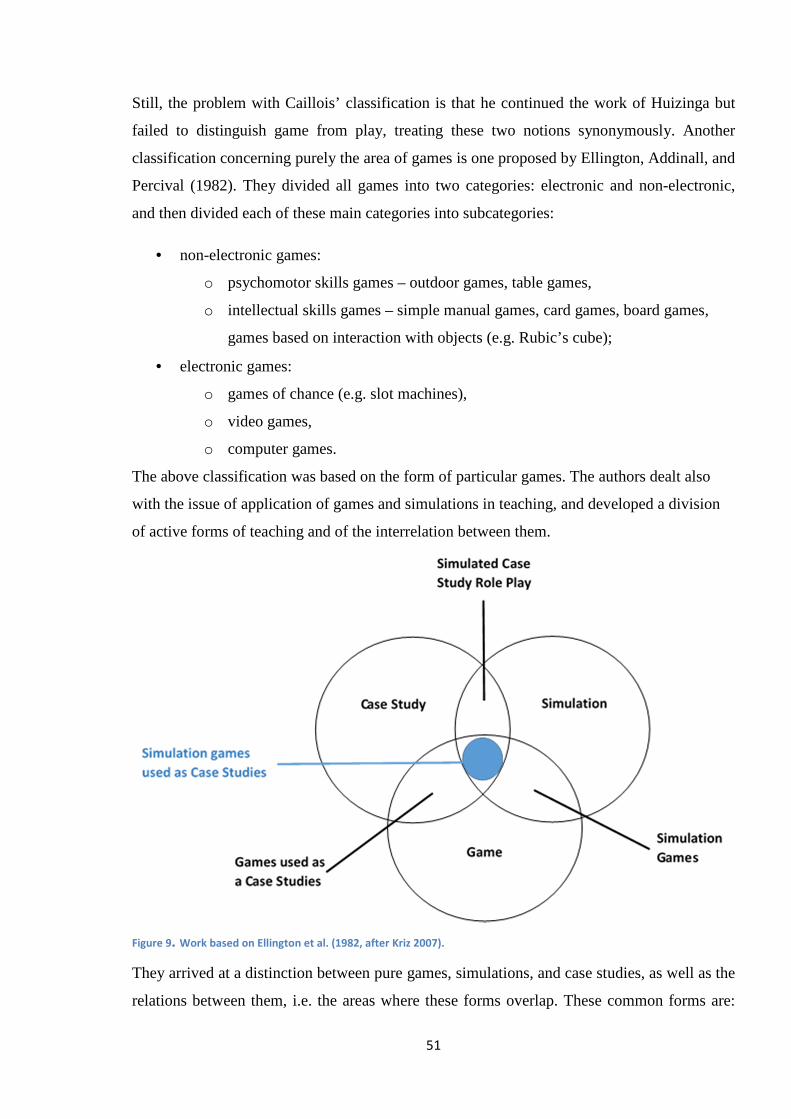
51
Still, the problem with Caillois’ classification is that he continued the work of Huizinga but
failed to distinguish game from play, treating these two notions synonymously. Another
classification concerning purely the area of games is one proposed by Ellington, Addinall, and
Percival (1982). They divided all games into two categories: electronic and non-electronic,
and then divided each of these main categories into subcategories:
• non-electronic games:
o psychomotor skills games – outdoor games, table games,
o intellectual skills games – simple manual games, card games, board games,
games based on interaction with objects (e.g. Rubic’s cube);
• electronic games:
o games of chance (e.g. slot machines),
o video games,
o computer games.
The above classification was based on the form of particular games. The authors dealt also
with the issue of application of games and simulations in teaching, and developed a division
of active forms of teaching and of the interrelation between them.
Figure 9. Work based on Ellington et al. (1982, after Kriz 2007).
They arrived at a distinction between pure games, simulations, and case studies, as well as the
relations between them, i.e. the areas where these forms overlap. These common forms are:

52
simulation games, games used as case studies, simulated case studies, and simulations used as
case studies. According to their definition, pure games are exercises involving competition in
accordance with a set of pre-defined rules. This definition is actually very close to the
category of agõn/ludus from the aforecited classification by Caillois (2001). Pure simulations
are exercises based on dynamic models representing reality. Pure case studies are non-
interactive, in-depth analyses of cases and/or situations typical for a given organization or
industry, or based on historical description.
53
2.7 Managerial simulation games
The author’s area of interest is games which used to be first called management games and
which have their scientific roots in practical training based on simulation. That is why today
we speak of managerial simulation games, but it is also important to note that terms like
decision-making simulation games, management games, or management simulation games are
used interchangeably. However, it is generally believed that managerial simulation games are
a sub-category of decision-making simulation games (Bielecki, 1997).
The Polish term symulacyjne gry menedżerskie, or symulacyjne gry kierownicze, has two
equivalents in Anglo-Saxon literature; these are: management games (or simulations) and
business games (or simulations). Elgood (1993: 12) claimed that business games are all games
based on simulations of the functioning of economy, trade, and finance, and that management
games are games centered on the issues of planning and managing various organizations or
enterprises, where profit is not the only criterion of success. Players are taught how to master
the ability of making decisions in the conditions of uncertainty and necessity to pursue and,
ultimately, accomplish many – and often conflicting – goals.
The most accurate definition of business games found in Polish literature is considered to be
that proposed by Metera, Pańków, and Wach (1983: 17): “A business game is a simulation of
a model of the subject system of an organization, and the state of that model depends on the
sequence (composed of at least two elements) of decisions taken by game participants
performing management roles defined in the game scenario, according to pre-defined rules…
A business game is a kind of structure composed of a subject system model, a game scenario,
a set of rules, and a system of roles assigned to game participants” (own translation).
An analysis of affiliation of business games points to the following structure (Elgood, 1993;
Bielecki, 1997; Balcerak, 2001):
I. Simulation games:
1. Entertainment simulation games
2. Serious simulation games:
a. War simulation games
b. Political simulation games
c. Business simulation games:
i. Didactic games
ii. Scientific games
54
iii. Communication games
There are many typologies of divisions of decision-making simulation games. Metera,
Pańków, and Wach (1983: 22), cited above, also provide their own typology according to the
criteria listed below.
Criterion of interaction among game participants:
- interactive games (featuring a common part): competitive, cooperative, competitive-
cooperative,
- non-interactive games (featuring an isolated model, solo, simultaneous).
This criterion is especially important from the perspective of education, as learning may occur
through observation of system reactions (non-interactive games) or as a result of observation
of decisions and reactions of other game participants (interactive games). This issue will be
elaborated on in the third chapter, devoted to the mechanisms of teaching.
Criterion of the scope of reproduction, i.e. of the level of detail of the described
microworld:
- general games (total, complex): reproducing the subject system in full;
- functional games: reproducing a fragment or a selected aspect of the subject system.
This division of business games is vital from the point of view of objectives of education. The
category of total games includes top management or strategy games, whose aim and function
is to provide practical tools to develop strategic management skills, and to improve strategic
and implemental thinking. Functional games are reproductions of organizations on the
operational level, and focus usually on some part of an organization, like e.g. marketing
management or production management. A significant element of this division is also the
level of complexity of both types of these games. In the case of total games in particular, there
is a strong temptation to ‘overcomplicate’ the decision system and model, which may lead to
excessive development of the game and as a result of the influx of decisions to be made and
of the amount of details, players can lose sight of the main objective – the practice of strategic
skills. The division between total games and functional games is often quite fluid, as there are
games which offer many versions and levels of difficulty (Marketplace©, for instance, offers
47 levels of difficulty and several scenarios per each level), and there are options to adjust the
amount of decisions to be made, as well as to set the parameters of appearance/disappearance
of functional areas (in e.g. TOPSiM simulation game the number and the time of appearance
of decisions to be made can be freely adjusted).
55
Criterion of the reaction of game system to actions of the actors:
- open (free) games, where at least a part of reactions to actions of the actors is settled
by a human (facilitator),
- strict (closed) games, where all reactions to actions of the actors are based on an
algorithm.
Another criterion is the possibility of modification of the model:
- contour games (skeleton games, frame games), allowing for changes in the model,
- games with a permanent structure of the model.
Both of the abovementioned criteria are very close to each other and from the point of view of
the course of a business game as a teaching tool – even identical to some extent. A vast
majority of contemporary management games is based on computer mathematical simulation
models, the dynamic changes whereof are used to reproduce the consequences of particular
decisions. These are strict solutions, typical for permanent-structure models. A big
disadvantage of such solutions is the fact that there is a finite number of in-game strategies,
which limits the players in their innovation and flexibility. Yet, the uniformity of the achieved
goals and the repeatability of actions and results speak in favor of such solutions, as this
translates into ‘hard results’ of education. Open and contour games have an advantage in that
they involve creativity of actions and innovative and often unpredictable results. They are,
however, much less popular, as their biggest advantage is at the same time their biggest
disadvantage – the unpredictability of the outcome makes such games much harder to conduct
and parameterize with respect to the objectives of teaching. Still, open games are an
invaluable “ice-breaking” tool, supporting players in thinking outside the box and arriving at
innovative solutions. In the light of the above, the author of this work would like to add an
intermediate category – a category of semi-open and quasi-contour games, where a part of
system reaction is strictly parameterized by game model algorithm, but from a certain
moment, some parameters of this algorithm may be modified as a result of group negotiations
or of actions of game participants.
We can also name the criterion of the presence of random factor and divide games into:
- deterministic,
- probabilistic.
The presence of random factor in games is a very important element, but there is still a
question of what is actually random and if this ‘randomness’ is not inherent to interactive
56
games, as even if we deal with a deterministic interactive game, random factor may manifest
itself in the form of unexpected decisions of other players. Hence, we can consider a non-
interactive deterministic game (a solo game against a deterministic model of the game) a pure
deterministic simulation.
The next criterion of division is the criterion of model transparency:
- games with a covert model (the so-called Black Box Models),
- games with an overt model (Glass Box Model).
This criterion is becoming more and more important. The question which is very interesting
with respect to teaching through simulation games is whether game participants learn more
from covert-model-based or overt-model-based games. Application of covert models is
justified by the need of teaching sole mechanisms and the ability to identify them, followed
by skills to use those mechanisms in achieving the goals of a given simulation game. The
downside of such solution is that players often limit their strategies to trial and error until they
work the model out but are left with no time to use the gained knowledge in practice. Overt
models involve observation of the reactions of game participants, as well as on the analysis of
their strategies and decisions, which is also very valuable. However, the drawback is that
mechanisms are handed to players on a plate, so they will not be remembered well.
Criterion of the method of decision processing:
- computer games,
- manual games,
- computer-manual games.
This criterion is rather fluid, as there are business games launched originally as manual
versions and which only later evolved into computer and computer-manual versions, like e.g.
Beer Distribution Game (Sterman, 1984).
Another criterion involves division of business games with respect to the dominant didactic
objectives:
- affective games: their main objective is to shape certain skills (e.g. decision-making
skills, negotiation skills, leadership skills),
- cognitive games: their main goal is to serve as a means to improve the knowledge of
the reproduced system.
57
Division based on the above criterion is quite symbolic, since the majority of business games
applied in practice in teaching meet both of these criteria.
Elgood (1993, as cited in Bielecki, 1999: 139) came with one of the most comprehensive
reviews of simulation games, proposing the following division:
• games designed for acquiring knowledge,
• games designed to improve teamwork performance,
• games designed for teaching organization skills,
• business games based on simulation models,
• interactive and non-interactive computer-controlled management games.
The basic criterion in the above division is surely the aim of application and the outcome of
simulation.
In the case of computer decision-making simulation games, the fundamental classification
was introduced by Bielecki (1999: 137–138), who divided all decision-making simulation
games based on two criteria. In the first case, computer-aided simulation games are divided
into two groups depending on the game subject:
� general decision-making simulation games are systems which aim to mimic the
whole complex of functions typical of an organization against the competing market in
a given industry. Such games are often called total enterprise or top management
games. Among their biggest advantages are the high level of realism owed to the
complexity of the simulated environment, and the self-confidence-building quality
owed to gaining success in such complex and difficult simulated environments;
� functional decision-making simulation games are systems concentrated on a
particular selected area or department of a company, the aim of which is to provide
means to perfect the chosen management functions, such as e.g. marketing, finance, or
research and development. The biggest merit of such simulation games is the fact that
they offer the possibility to understand and learn of the mechanisms governing a given
functional area.
The second criterion introduced by Bielecki (1999) is the criterion of the connections
between game entities:
• interactive: the simulated entities interplay with one another within the game;
58
• simultaneous: game participants solve an identical problem in a parallel way or at
the same time and in the same conditions of the simulated system.
The criteria of differentiation and classification of decision-making simulation games may be
multiplied endlessly, but the author of this work intends to present only a certain
representative set of such criteria, which can provide an in-depth view on the current state of
the art and on the present division of games.
59
2.8 Current state of science and research in the scope of games and
simulations
Games and simulations developed greatly in the 1970s; this was also the time when
application of simulation games as we know them became much more widespread. Since
then, ISAGA (International Simulation and Gaming Association) has been actively involved
in mapping the areas of interest and research of both the creators and users of simulation
games. ISAGA singled out the following areas of interest (ISAGA, as cited in Klabbers,
2006) for simulation games:
• Theory and methodology
• Design
• Assessment and evaluation
The above areas can be explored further and expanded into more detailed thematic and
research scopes as follows:
• Learning and education
• Individual and collective (social) competence
• Communication
• Management development and managerial decision making
• Organizational and institutional change
• Formation and development of policies
The abovementioned thematic and research areas are by no means mutually exclusive. Quite
the opposite – they often share the quality of inertia and synergy. Furthermore, they do not
exclude any elements from outside the abovementioned research areas – a feature noticed by
the author following an analysis of post-conference monographs from recent years. What is
more, there appear also new themes and research areas, such as e.g. digital games or virtual
reality and entertainment.
From the perspective of application of simulation games, the present list of areas of
application is as follows:
• Management
• Public administration
60
• Natural environment (ecology)
• Entertainment
• Health protection
• Human and cultural resources (demography)
• Geography and settlement
• International relations
• Military science
• Natural resources
• Religion
• Services
• Technology
In the last decade, the scope of research has much shifted towards digital games. These games
aim mainly to provide entertainment. Investigators focus mainly on studying interactive and
multimedia qualities of these games, on exploring the forms of transmitting of information
(narration), and on analyzing computer applications. The results of such research are
transposed to more classical areas of interest and application, such as military, police, and
firefighting training, leadership training, management training, etc.
In the light of the topic of this paper, the author considers naturally the area of theory and
methodology, as well as the area of assessment and evaluation as the most interesting areas of
application of simulation games. As for the design of such games, although this topic is
getting more and more attention in various publications, the model proposed by the author is
solution- and application-based. From the point of view of the thematic areas of the paper, the
key idea is synergy between the area of education and learning, and the aspect of development
of management and organizational change. The author concentrates on these three thematic
scopes. Table 3 below has been developed to make the relationship between all these areas,
thematic scopes, and functional areas of application more visible. It provides an organized
division of the subject matter. It also includes inertia and synergy between particular areas and
themes. Moreover, the table emphasizes the multidisciplinary quality of the paper, which
stems from the multidisciplinary nature of the area of knowledge in question.
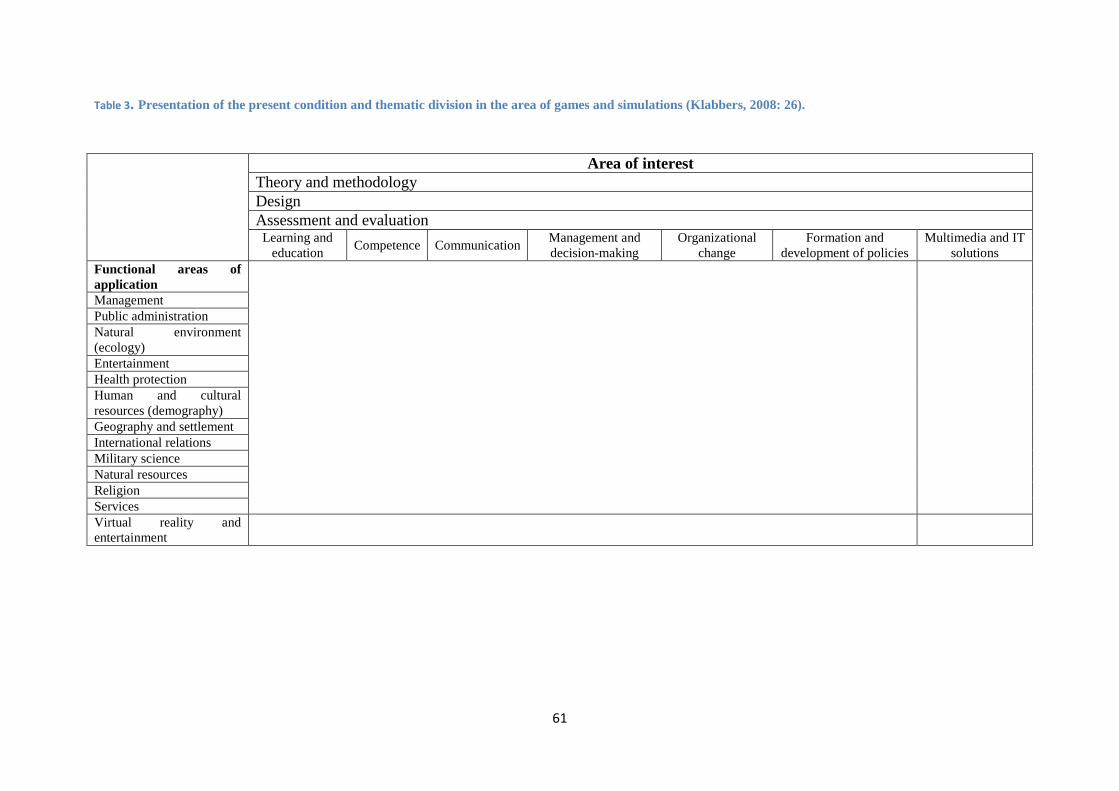
61
Table 3. Presentation of the present condition and thematic division in the area of games and simulations (Klabbers, 2008: 26).
Area of interest Theory and methodology Design Assessment and evaluation Learning and
education Competence Communication
Management and decision-making
Organizational change
Formation and development of policies
Multimedia and IT solutions
Functional areas of application
Management Public administration Natural environment (ecology) Entertainment Health protection Human and cultural resources (demography) Geography and settlement International relations Military science Natural resources Religion Services Virtual reality and entertainment
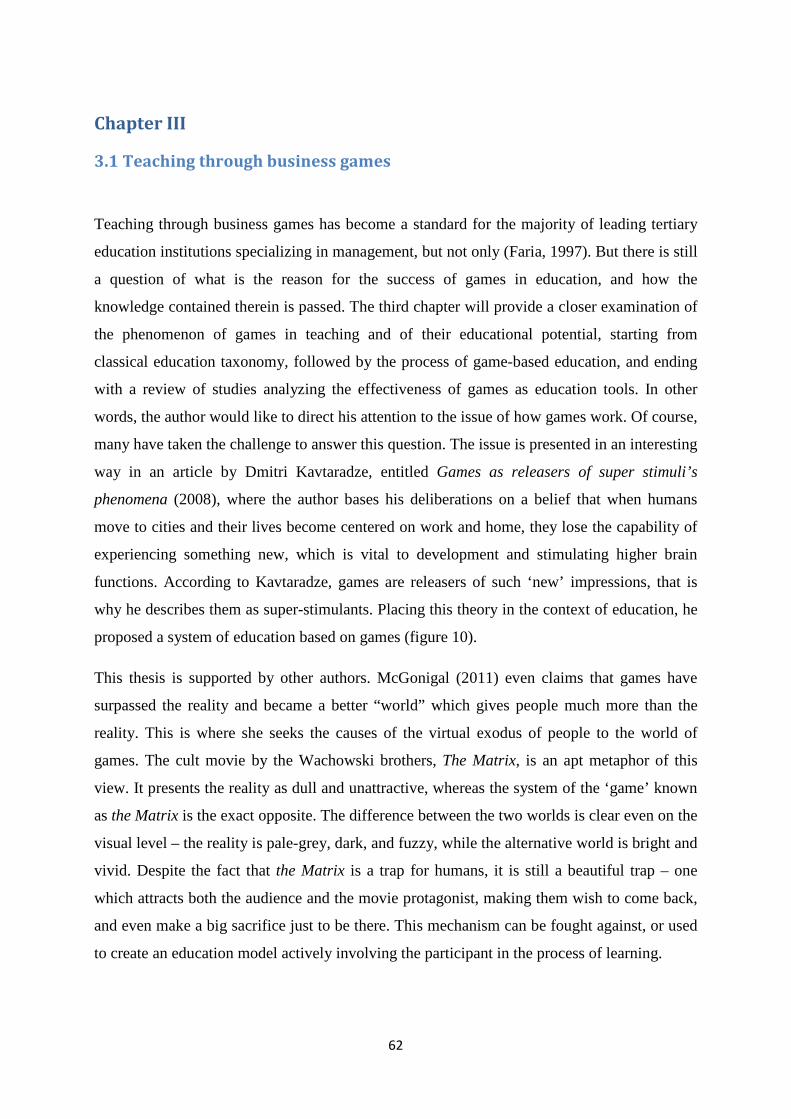
62
Chapter III
3.1 Teaching through business games
Teaching through business games has become a standard for the majority of leading tertiary
education institutions specializing in management, but not only (Faria, 1997). But there is still
a question of what is the reason for the success of games in education, and how the
knowledge contained therein is passed. The third chapter will provide a closer examination of
the phenomenon of games in teaching and of their educational potential, starting from
classical education taxonomy, followed by the process of game-based education, and ending
with a review of studies analyzing the effectiveness of games as education tools. In other
words, the author would like to direct his attention to the issue of how games work. Of course,
many have taken the challenge to answer this question. The issue is presented in an interesting
way in an article by Dmitri Kavtaradze, entitled Games as releasers of super stimuli’s
phenomena (2008), where the author bases his deliberations on a belief that when humans
move to cities and their lives become centered on work and home, they lose the capability of
experiencing something new, which is vital to development and stimulating higher brain
functions. According to Kavtaradze, games are releasers of such ‘new’ impressions, that is
why he describes them as super-stimulants. Placing this theory in the context of education, he
proposed a system of education based on games (figure 10).
This thesis is supported by other authors. McGonigal (2011) even claims that games have
surpassed the reality and became a better “world” which gives people much more than the
reality. This is where she seeks the causes of the virtual exodus of people to the world of
games. The cult movie by the Wachowski brothers, The Matrix, is an apt metaphor of this
view. It presents the reality as dull and unattractive, whereas the system of the ‘game’ known
as the Matrix is the exact opposite. The difference between the two worlds is clear even on the
visual level – the reality is pale-grey, dark, and fuzzy, while the alternative world is bright and
vivid. Despite the fact that the Matrix is a trap for humans, it is still a beautiful trap – one
which attracts both the audience and the movie protagonist, making them wish to come back,
and even make a big sacrifice just to be there. This mechanism can be fought against, or used
to create an education model actively involving the participant in the process of learning.
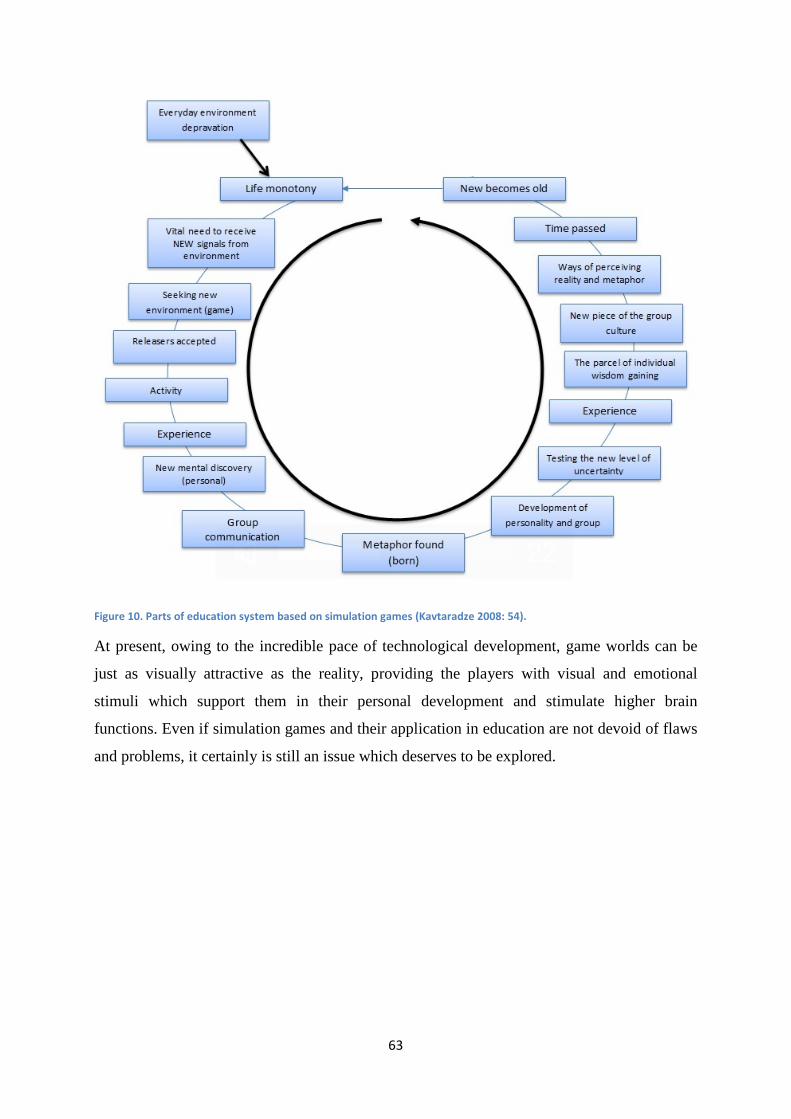
63
Figure 10. Parts of education system based on simulation games (Kavtaradze 2008: 54).
At present, owing to the incredible pace of technological development, game worlds can be
just as visually attractive as the reality, providing the players with visual and emotional
stimuli which support them in their personal development and stimulate higher brain
functions. Even if simulation games and their application in education are not devoid of flaws
and problems, it certainly is still an issue which deserves to be explored.
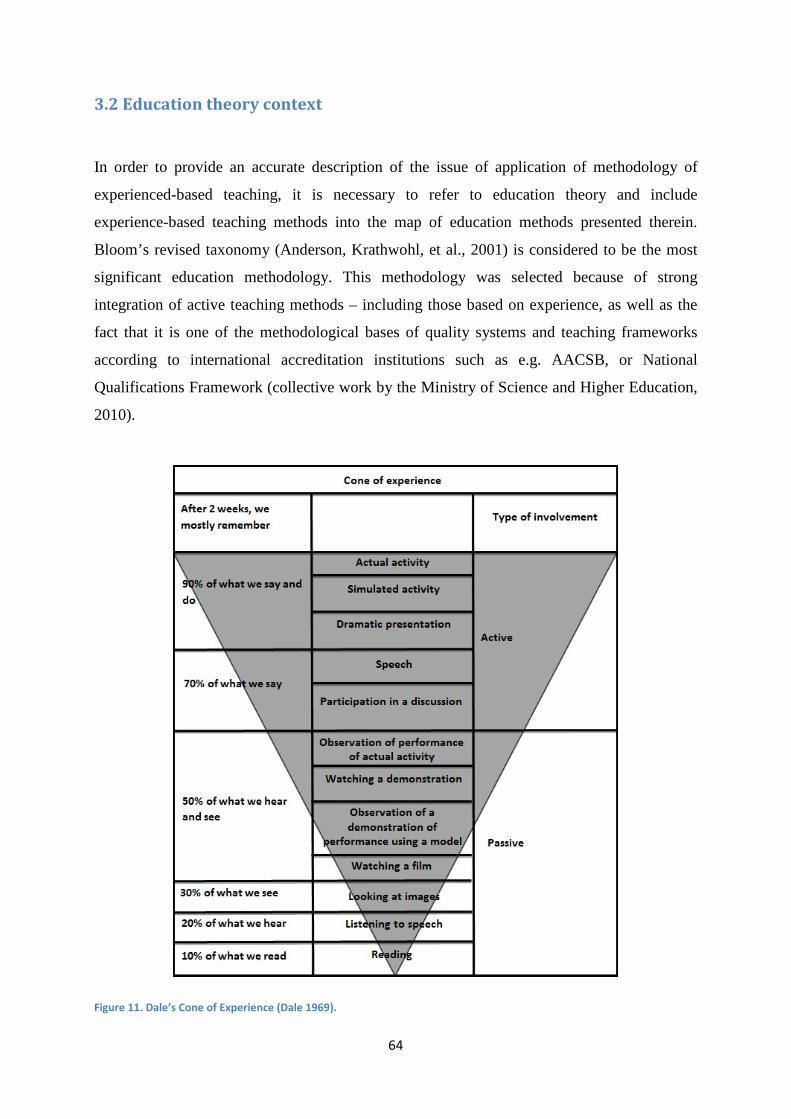
64
3.2 Education theory context
In order to provide an accurate description of the issue of application of methodology of
experienced-based teaching, it is necessary to refer to education theory and include
experience-based teaching methods into the map of education methods presented therein.
Bloom’s revised taxonomy (Anderson, Krathwohl, et al., 2001) is considered to be the most
significant education methodology. This methodology was selected because of strong
integration of active teaching methods – including those based on experience, as well as the
fact that it is one of the methodological bases of quality systems and teaching frameworks
according to international accreditation institutions such as e.g. AACSB, or National
Qualifications Framework (collective work by the Ministry of Science and Higher Education,
2010).
Figure 11. Dale’s Cone of Experience (Dale 1969).
65
Another methodology which will have an influence on the education model described by the
author of this paper is the typology of effectiveness of methods of learning, known as Dale’s
Cone of Experience (1969). The author’s aim is to combine these two theories and define the
education-related purposes of an experienced-based process, and then to link the outcome
with the methods of application of decision-making simulation games in practice.
One of the fundamental aspects of the description of education process is the use of different
education methods and cognitive techniques applied as part of the process of education itself.
National Research Council, USA’s leading scientific and accreditation institution, considered
this model reliable in their research and papers (2000 and 2001), and implemented it to their
works devoted to teaching in secondary and tertiary education institutions. The conclusion
from the research by NRC is that if we want to achieve as effective process of teaching as
possible – and better-educated managers, we need to stimulate them and involve them in the
process of education to the largest extent possible.
However, there is the question of what kind of knowledge we would like to pass to our
students – and in what way. Today we already know that knowledge is very multi-faceted,
and different areas thereof can be developed using different methods as part of learning
process. The process of learning is cognitive by nature and consists of different stages as well.
Bloom’s revised taxonomy proves to be very useful, as it names four categories (dimensions)
of knowledge:
1. Factual knowledge – the basic dimension of knowledge based on facts pertaining to a
given discipline. This kind of knowledge is exemplified by:
a. knowledge of definitions and terminology, e.g. technical, or economic
terminology,
b. knowledge of specific details and elements, such as e.g. reliable sources of
information, components of production process.
2. Conceptual knowledge – covers the knowledge of interrelationships among the basic
elements within larger structures which enables them to function together. Examples
of such knowledge include:
a. knowledge of classifications and categories, e.g. periods in the history of
economy, forms of business activity,
b. knowledge of principles and generalizations, e.g. accounting principles, the
law of supply and demand,
66
c. knowledge of theories, models, and structures, e.g. X and Y theories in
management, monopolistic competition models, separation of state powers.
3. Procedural knowledge – knowledge of how and when to perform certain activities,
conduct research, or apply specific criteria in order to employ particular skills,
algorithms, methods, and techniques. Examples of such knowledge are the following:
a. knowledge of subject-specific skills and algorithms, e.g. using particular tools
(e.g. IT tools), calculating percentage rates,
b. knowledge of subject-specific techniques and methods, e.g. conducting
structured interviews, delivering business presentations,
c. knowledge of criteria for determining when to use appropriate procedures, e.g.
criteria indicating when to use SWOT methodology to describe organizations,
criteria used for evaluating the suitability/usefulness of business projects.
4. (Meta-)cognitive knowledge – knowledge of cognition in general, as well as
awareness and knowledge of one’s own cognition. Examples include:
a. strategic knowledge, e.g. how to identify and indicate the structure of a
problem in texts, ability to apply heuristic methods,
b. knowledge about cognitive tasks, including appropriate contextual and
conditional knowledge, e.g. familiarity with tasks and tests we may be
confronted with, awareness of cognitive needs we are faced with in various
tasks,
c. self-knowledge – awareness of one’s own level and store of knowledge, ability
to identify and name one’s own strengths and weaknesses.
Another element of learning is the cognitive process itself. Bloom’s revised taxonomy lists six
elements, which can be also called dimensions:
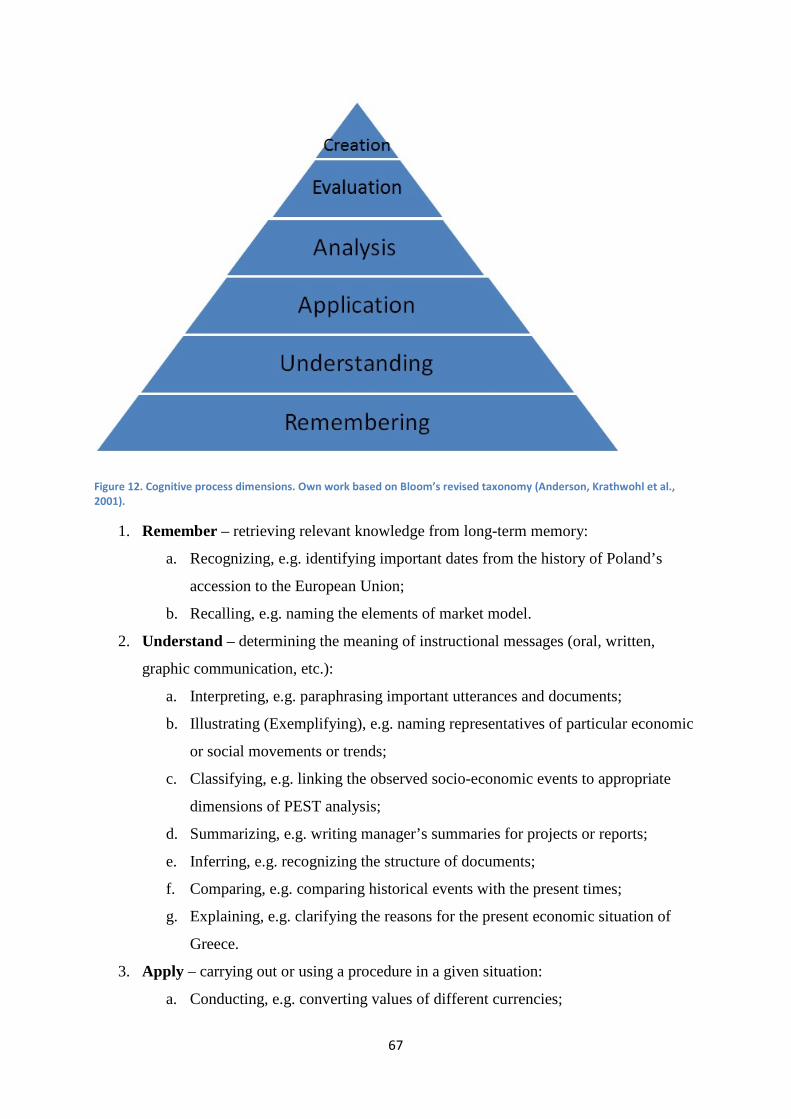
67
Figure 12. Cognitive process dimensions. Own work based on Bloom’s revised taxonomy (Anderson, Krathwohl et al.,
2001).
1. Remember – retrieving relevant knowledge from long-term memory:
a. Recognizing, e.g. identifying important dates from the history of Poland’s
accession to the European Union;
b. Recalling, e.g. naming the elements of market model.
2. Understand – determining the meaning of instructional messages (oral, written,
graphic communication, etc.):
a. Interpreting, e.g. paraphrasing important utterances and documents;
b. Illustrating (Exemplifying), e.g. naming representatives of particular economic
or social movements or trends;
c. Classifying, e.g. linking the observed socio-economic events to appropriate
dimensions of PEST analysis;
d. Summarizing, e.g. writing manager’s summaries for projects or reports;
e. Inferring, e.g. recognizing the structure of documents;
f. Comparing, e.g. comparing historical events with the present times;
g. Explaining, e.g. clarifying the reasons for the present economic situation of
Greece.
3. Apply – carrying out or using a procedure in a given situation:
a. Conducting, e.g. converting values of different currencies;
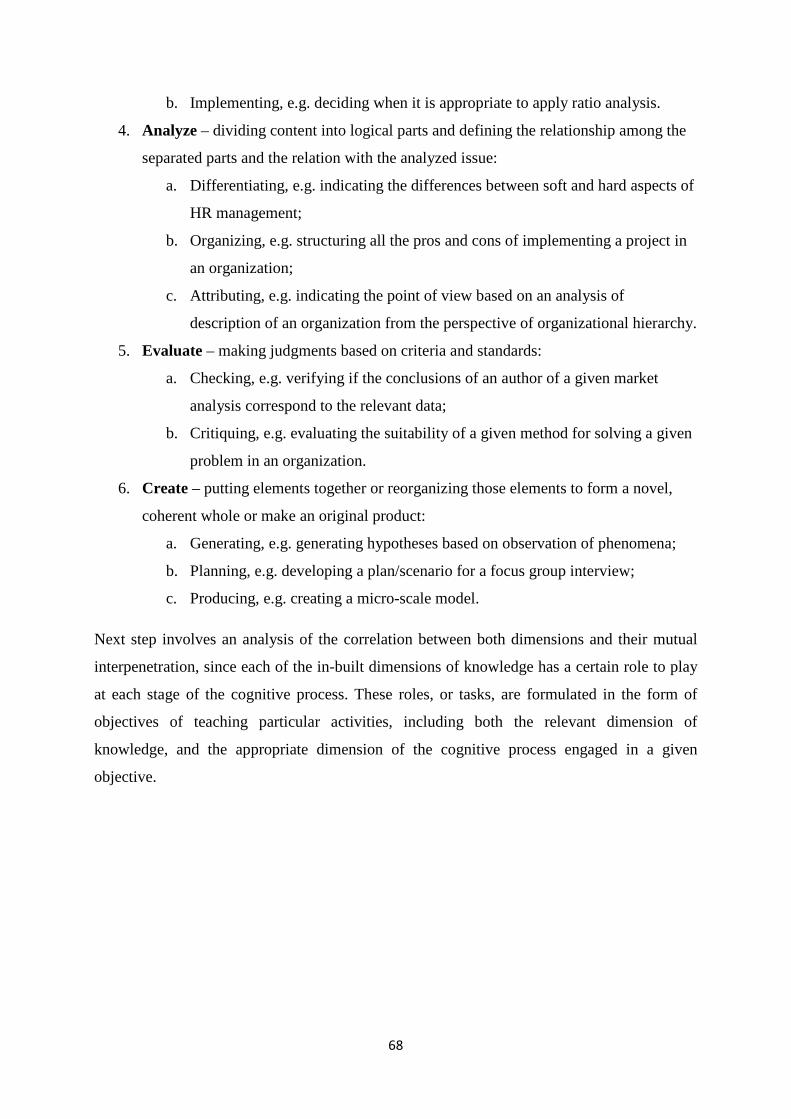
68
b. Implementing, e.g. deciding when it is appropriate to apply ratio analysis.
4. Analyze – dividing content into logical parts and defining the relationship among the
separated parts and the relation with the analyzed issue:
a. Differentiating, e.g. indicating the differences between soft and hard aspects of
HR management;
b. Organizing, e.g. structuring all the pros and cons of implementing a project in
an organization;
c. Attributing, e.g. indicating the point of view based on an analysis of
description of an organization from the perspective of organizational hierarchy.
5. Evaluate – making judgments based on criteria and standards:
a. Checking, e.g. verifying if the conclusions of an author of a given market
analysis correspond to the relevant data;
b. Critiquing, e.g. evaluating the suitability of a given method for solving a given
problem in an organization.
6. Create – putting elements together or reorganizing those elements to form a novel,
coherent whole or make an original product:
a. Generating, e.g. generating hypotheses based on observation of phenomena;
b. Planning, e.g. developing a plan/scenario for a focus group interview;
c. Producing, e.g. creating a micro-scale model.
Next step involves an analysis of the correlation between both dimensions and their mutual
interpenetration, since each of the in-built dimensions of knowledge has a certain role to play
at each stage of the cognitive process. These roles, or tasks, are formulated in the form of
objectives of teaching particular activities, including both the relevant dimension of
knowledge, and the appropriate dimension of the cognitive process engaged in a given
objective.
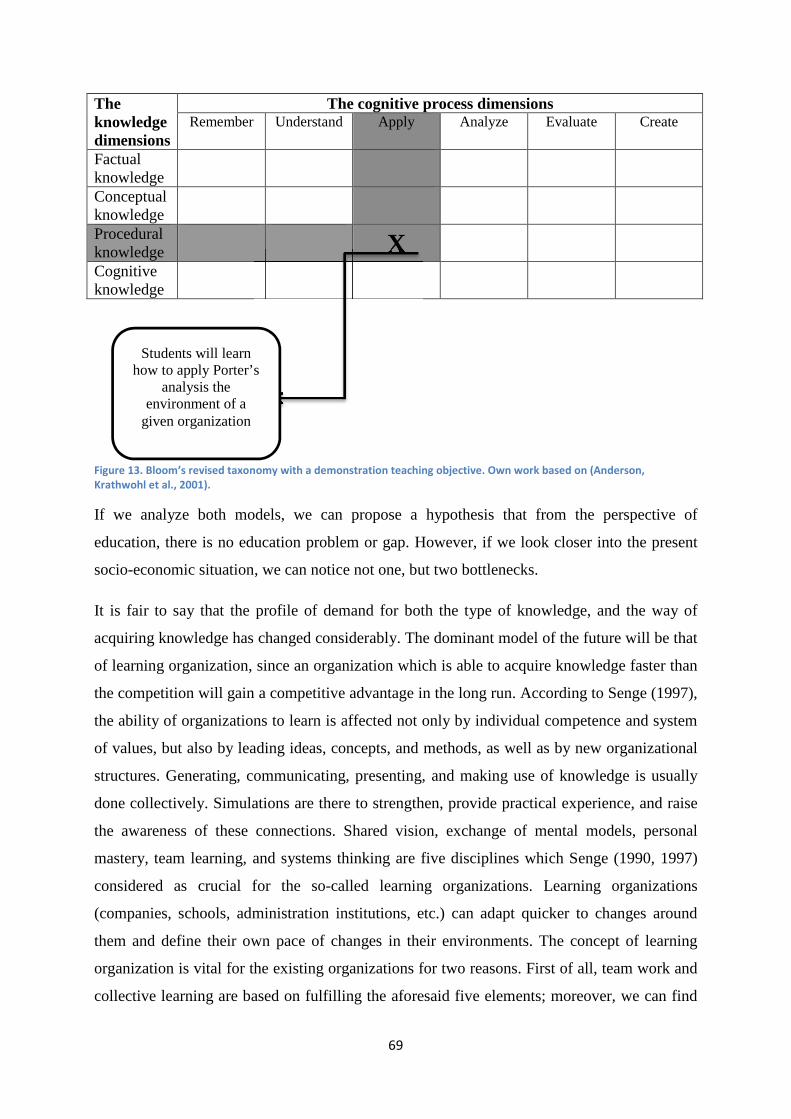
69
The knowledge dimensions
The cognitive process dimensions Remember Understand Apply Analyze Evaluate Create
Factual knowledge
Conceptual knowledge
Procedural knowledge
X
Cognitive knowledge
Figure 13. Bloom’s revised taxonomy with a demonstration teaching objective. Own work based on (Anderson,
Krathwohl et al., 2001).
If we analyze both models, we can propose a hypothesis that from the perspective of
education, there is no education problem or gap. However, if we look closer into the present
socio-economic situation, we can notice not one, but two bottlenecks.
It is fair to say that the profile of demand for both the type of knowledge, and the way of
acquiring knowledge has changed considerably. The dominant model of the future will be that
of learning organization, since an organization which is able to acquire knowledge faster than
the competition will gain a competitive advantage in the long run. According to Senge (1997),
the ability of organizations to learn is affected not only by individual competence and system
of values, but also by leading ideas, concepts, and methods, as well as by new organizational
structures. Generating, communicating, presenting, and making use of knowledge is usually
done collectively. Simulations are there to strengthen, provide practical experience, and raise
the awareness of these connections. Shared vision, exchange of mental models, personal
mastery, team learning, and systems thinking are five disciplines which Senge (1990, 1997)
considered as crucial for the so-called learning organizations. Learning organizations
(companies, schools, administration institutions, etc.) can adapt quicker to changes around
them and define their own pace of changes in their environments. The concept of learning
organization is vital for the existing organizations for two reasons. First of all, team work and
collective learning are based on fulfilling the aforesaid five elements; moreover, we can find
Students will learn how to apply Porter’s
analysis the environment of a
given organization
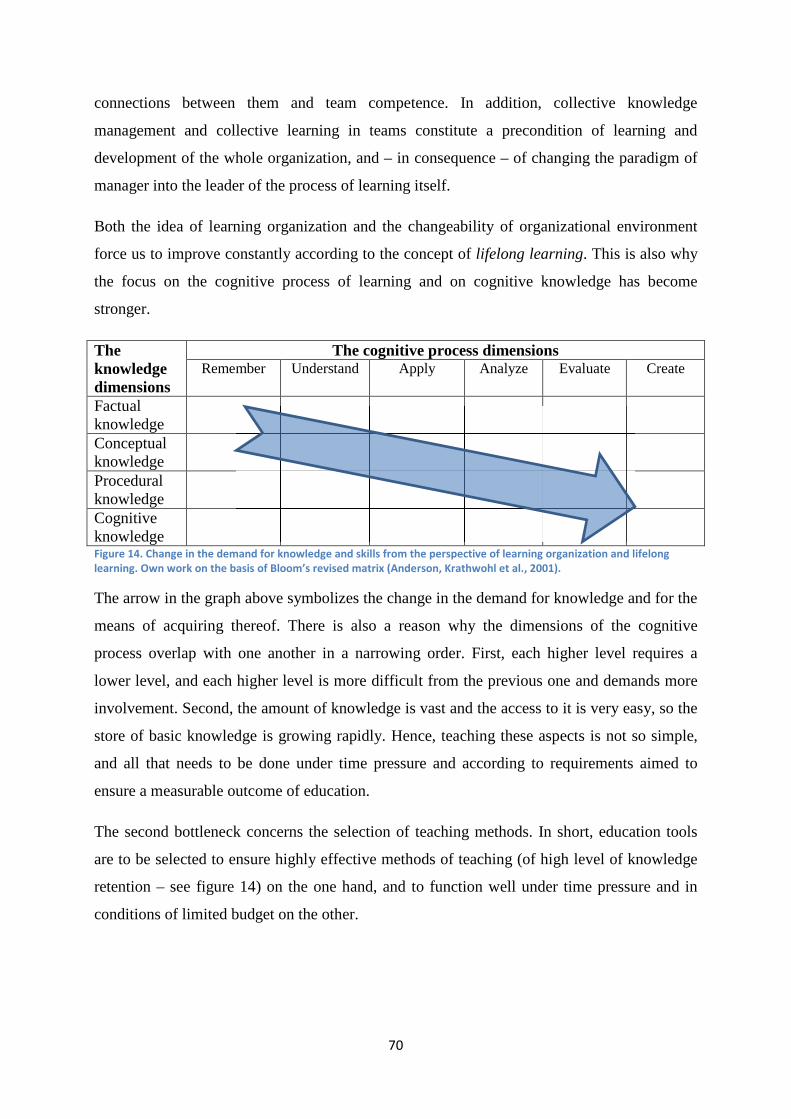
70
connections between them and team competence. In addition, collective knowledge
management and collective learning in teams constitute a precondition of learning and
development of the whole organization, and – in consequence – of changing the paradigm of
manager into the leader of the process of learning itself.
Both the idea of learning organization and the changeability of organizational environment
force us to improve constantly according to the concept of lifelong learning. This is also why
the focus on the cognitive process of learning and on cognitive knowledge has become
stronger.
The knowledge dimensions
The cognitive process dimensions Remember Understand Apply Analyze Evaluate Create
Factual knowledge
Conceptual knowledge
Procedural knowledge
Cognitive knowledge
Figure 14. Change in the demand for knowledge and skills from the perspective of learning organization and lifelong
learning. Own work on the basis of Bloom’s revised matrix (Anderson, Krathwohl et al., 2001).
The arrow in the graph above symbolizes the change in the demand for knowledge and for the
means of acquiring thereof. There is also a reason why the dimensions of the cognitive
process overlap with one another in a narrowing order. First, each higher level requires a
lower level, and each higher level is more difficult from the previous one and demands more
involvement. Second, the amount of knowledge is vast and the access to it is very easy, so the
store of basic knowledge is growing rapidly. Hence, teaching these aspects is not so simple,
and all that needs to be done under time pressure and according to requirements aimed to
ensure a measurable outcome of education.
The second bottleneck concerns the selection of teaching methods. In short, education tools
are to be selected to ensure highly effective methods of teaching (of high level of knowledge
retention – see figure 14) on the one hand, and to function well under time pressure and in
conditions of limited budget on the other.
71
Figure 15. Combination of Bloom’s and Dale’s models. Own work.
The attempt to combine these two models and to indicate the main bottlenecks in an effective
education model may look like trying to combine “chalk and cheese”. However, it is not quite
like that.
Earlier in the paper we focused on defining education-related needs and models which could
serve as a basis for a framework of an education system that would respond to those needs.
Still, the author is aware of certain bottlenecks in such system. The abovementioned issues
force us to look for a common platform that could serve as a means to combine the need of
quick access to knowledge (our “chalk”) with the effectiveness of methods of teaching (our
“cheese”). The so-called Experiential Learning Model developed and published by Kolb in
1984, and involving learning through experience may be exactly one such platform.
Experience-based learning is a change in the paradigm of teaching, where the word
“teaching” involves assuming the point of view of the teacher and the teacher’s perception a
priori . The model of teaching from a teacher perspective is group-centric. The person passing
the knowledge aims to give the facts in the most efficient way, and students try to assimilate
the information to as big extent as possible, hence so much focus on the process of transfer of
knowledge. Experience-based teaching centers on the perspective of students, who are to
shape their own opinions through involvement and gaining experience, and thus develop their
knowledge store. Experience-based teaching concentrates on the individual and on developing
the individual’s abilities, not on assimilating facts. The biggest emphasis is on the learner and
on the actions taken thereby.
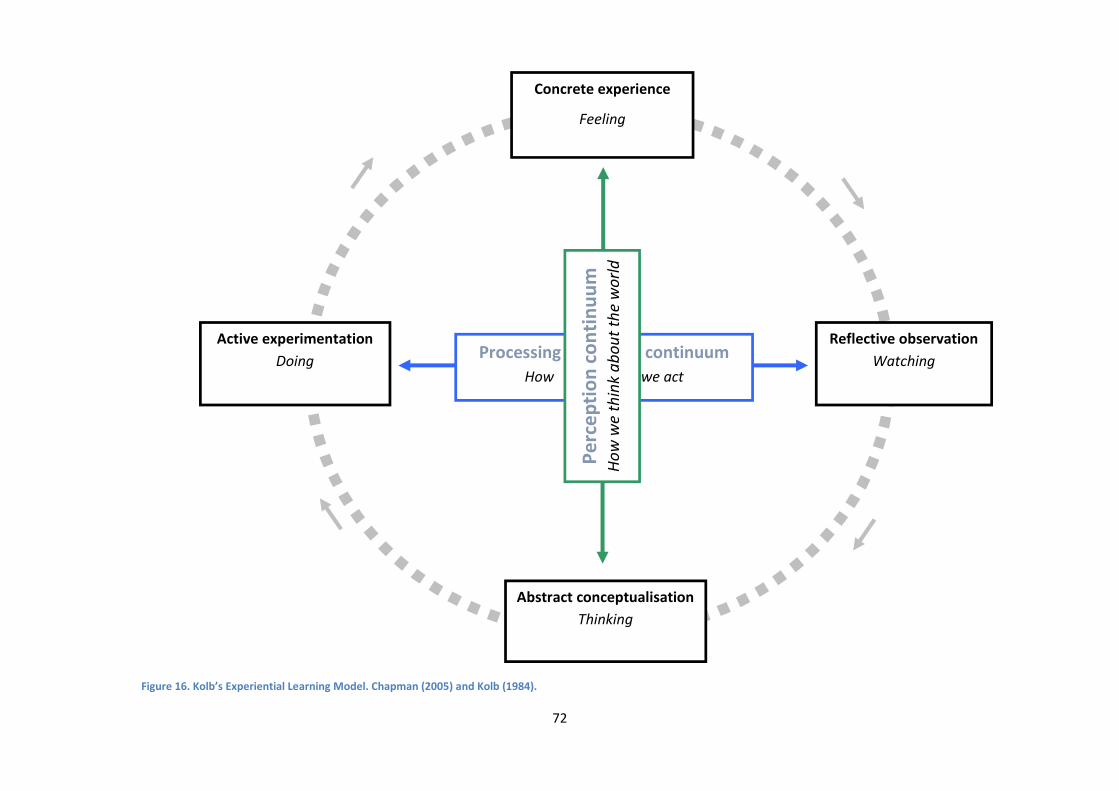
72
Figure 16. Kolb’s Experiential Learning Model. Chapman (2005) and Kolb (1984).
Reflective observation
Watching
Concrete experience
Feeling
Active experimentation
Doing
Abstract conceptualisation
Thinking
Processing continuum
How we act
Pe
rce
pti
on
co
nti
nu
um
Ho
w w
e t
hin
k a
bo
ut
the
wo
rld
73
Kolb’s Experiential Learning Model represents a system of teaching based on three simple
steps:
• do,
• rethink,
• develop and implement (experiment with) the ideas for improvements.
The author of this paper added two other dimensions represented by horizontal and vertical
axes, developed on the basis of Kolb’s model including styles of learning. These axes
represent two planes which are crucial to the correct understanding of this point of view:
• Processing continuum – how we approach tasks and how we proceed with handling
those tasks.
• Perception continuum – our emotional reaction to tasks and experiences, and what we
feel and think.
Learning is always a combination of two planes which Kolb defined as dialectically related
modes of action, perception, experience (Doing or Watching) and transforming experience
(Feeling or Thinking). Decision-making simulation games employ this model in full. Games
based on rounds or turns, and dividing courses into game-time and discussion-and-
experience-sharing-time sections are perfectly in line with the concept of Kolb’s model.
Hence, games and simulations are one of the fundamental and most significant items on the
map of experienced-based teaching methods.
74
3.3 Teaching through simulation games
All experience-based teaching methods share one common quality – active participation of
learners in classes and courses and, as a result, in the process of education itself. Klabbers
(2008: 53) defines it as gaming as an embodied experience and although it may seem
somewhat exaggerated, if we treat business games as isolated and risk-free experiment, then
from the learning perspective the end result for both game leader or investigator and game
participants will be pure experience. The most-cited foreign author specializing in in-depth
analyses of teaching through games and application of experience in teaching is Sternberg
(1998), who defines five interactive elements of teaching present in game- and simulation-
based teaching:
� Meta-cognitive skills – this category covers the cognitive skills related to the process
of cognition itself. The model of meta-cognitive skills is a syncretic concept of higher
tier and is self-referential. Sternberg (1998) distinguished seven modifiable meta-
cognitive skills:
o problem recognition,
o problem definition,
o problem representation,
o strategy formulation,
o resource allocation,
o monitoring and problem solving,
o evaluation of problem solving.
� Learning skills – gaming improves the skills of learning, since it is based on an
environment where actors (players) have to establish links and give meaning to what
happens in the game. Examples of such activities include:
o selective encoding,
o distinguishing relevant and irrelevant information,
o selective combination,
o selective comparison,
o relating new information to information stored in memory.
� thinking skills are related to:
o critical thinking, e.g. analysis, criticism, assessment, evaluation,
o creative thinking, e.g. discovering, creating, imagining, producing,
75
o practical thinking, e.g. applying, using, practicing.
� Knowledge and motivation – all of the abovementioned skills lead to the gain and
increase in the level of knowledge of game participants. Sternberg divides knowledge
into two main areas:
o Declarative knowledge, defined as “knowing that”, i.e. related to facts,
concepts, definitions, principles, rules, and laws. It is present in games in the
form of game rules and resources.
o Procedural knowledge, defined as “knowing how”, i.e. related to knowledge of
procedures and strategies. This type of knowledge is featured in games as the
sole act of playing a game and passed as the experience gained from it.
Sternberg’s model is compatible with both Bloom’s taxonomy and Dale’s model, as they
share many common elements. Nevertheless, Sternberg refers strictly to games and
simulations, and provides a deeper insight into the issues of cognition and creation of
knowledge using games.
Suitability of games for education purposes depends on four main indicators (Duke, 1974):
• effect – the main effect we want to achieve using a given game,
• content – the ‘main theme’ of a given game,
• context – using a given game in a particular context,
• audience – the environment or target group a given game is addressed to.
All games are specific with respect to these four indicators. Particular types of experience
generated by simulation games support game participants in acquiring knowledge in the scope
of a given theme included in a given game by means of learning-by-doing. The overriding
objective is to match all these indicators in a way which will make it possible for game
participants to immerse themselves in the interactive environment of games through their own
“gaming” experiences.
Experiencing games ‘in full’ is crucial to the achievement of education objectives such as
development of skills, broadening of horizons, or expanding the repertoire of reactions to
unexpected events (Klabbers, 2008). Motivation is the driving force behind the development
of skills. That is why a well-designed and well-localized game should motivate its
participants. A clear, transparent structure of the game and a visual representation of results
let participants evaluate their achievements and are one of the basic elements contributing to
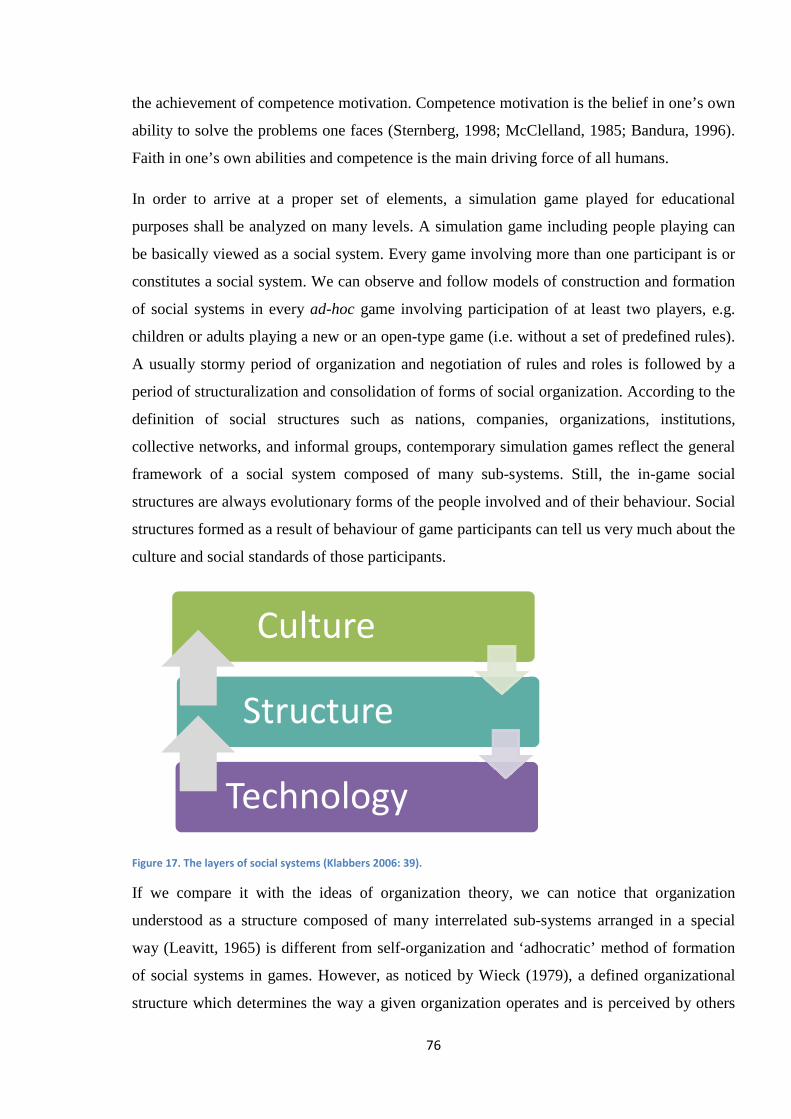
76
the achievement of competence motivation. Competence motivation is the belief in one’s own
ability to solve the problems one faces (Sternberg, 1998; McClelland, 1985; Bandura, 1996).
Faith in one’s own abilities and competence is the main driving force of all humans.
In order to arrive at a proper set of elements, a simulation game played for educational
purposes shall be analyzed on many levels. A simulation game including people playing can
be basically viewed as a social system. Every game involving more than one participant is or
constitutes a social system. We can observe and follow models of construction and formation
of social systems in every ad-hoc game involving participation of at least two players, e.g.
children or adults playing a new or an open-type game (i.e. without a set of predefined rules).
A usually stormy period of organization and negotiation of rules and roles is followed by a
period of structuralization and consolidation of forms of social organization. According to the
definition of social structures such as nations, companies, organizations, institutions,
collective networks, and informal groups, contemporary simulation games reflect the general
framework of a social system composed of many sub-systems. Still, the in-game social
structures are always evolutionary forms of the people involved and of their behaviour. Social
structures formed as a result of behaviour of game participants can tell us very much about the
culture and social standards of those participants.
Figure 17. The layers of social systems (Klabbers 2006: 39).
If we compare it with the ideas of organization theory, we can notice that organization
understood as a structure composed of many interrelated sub-systems arranged in a special
way (Leavitt, 1965) is different from self-organization and ‘adhocratic’ method of formation
of social systems in games. However, as noticed by Wieck (1979), a defined organizational
structure which determines the way a given organization operates and is perceived by others
Culture
Structure
Technology
77
is a reflection of the structure of patterns of behaviour of people who create such structure.
Reproduction of organizational structures in simulation games is a result of collective
behaviour patterns in the form of a system of interaction.
Studies of social systems examine many aspects and many disciplines of science. From the
perspective of simulation games, the most important element of theory – and one which needs
to be emphasized, is the formation of social systems in decision-making simulation games
(see: fig. 17). All games create their own social systems whose role is to separate a given
social system/organization from the environment. Every such social system features three
layers (Klabbers, 2008):
• culture – standards, values, beliefs, attitudes, etc. of actors participating in the game,
• structure – vertical and horizontal communication and coordination of actions,
• technology – understood as a complex of standard and non-standard procedures of
management of physical process managing.
Members of in-game social systems use these layers to create hypothetical borders separating
“us” from “them”. The creation of such frames and of the scope thereof forms a certain
interface with the environment, which makes it possible to materially isolate “own” social
system from the environment and from other systems, but on the other hand, it limits the
extent of possible interaction with the environment, which renders this “own” social system
controllable.
Identification with a social system and, consequently, becoming a part of a certain culture, is a
very important driving force. Making use of the mechanisms of role-playing and of formation
of social systems, followed by identification with social systems formed in such way is one of
the fundamental mechanisms of functioning and effectiveness of simulation games.
Woźniak (2010: 303) suggests a similar division. It includes a criterion of successful training
or successful education based on application of decision-making simulation games. He
proposes three groups, each with a different definition of success:
• A group of decision-makers with a common goal, whose aim is to eliminate an
undesirable situation manifesting itself by undesirable actions taken by their
employees. They see success as eradication of these actions by way of application
special trainings based on decision-making simulation games.
78
• A group of participants aiming to develop their own skills and abilities in order to
improve their performance both in the existing organization and in their future career
path. This group sees success as experiencing something exciting, which requires
good fun, talking about interesting matters, and a sense of conviction that the newly-
gained knowledge will help them deal better with their work and problems in the
future.
• A group of coaches who aim to achieve a balance between the needs of training
participants and decision-makers. The opinion about a given training usually depends
on the opinion of training participants, which is why their opinion is often crucial to
the selection of training priorities, even if it is against the interest of their organization.
The needs of decision-makers can be fulfilled to a larger extent if special tools
assessing the structural outcome of a given training are applied, and if decision-makers
are personally involved in the training process.
We can distinguish to types of simulations (Bielecki and Wardaszko, 2007):
1. Decision-making simulations – supporting the processes of training of management staff of
all ranks, focusing on perfecting selected skills and abilities.
2. Simulation models – supporting managers in making decisions bearing high risk, allowing
them to analyze various hypothetical simulation-generated solutions. They can be viewed
as decision support systems.
If they are viewed collectively, they display certain specific advantages for educating both
future and present managers (Bielecki, 1999: 127–128):
� They teach game participants certain principles regarding selection of principles of
conduct. The majority of managers choose to apply the so-called mini-max strategy in
decision-making situations. It is clear that this approach is not always rational or fully
justified. Games are perfect tools to teach to apply other strategies of decision-making;
they can e.g. take advantage of the prisoner’s dilemma to develop a penchant for
employing strategies of cooperation, loyalty, or antagonism – depending on the
situation;
� They teach skills of particular usefulness, such as e.g. negotiating, discussion, selling
methods;
79
� They teach changing attitudes and outlooks on life. For instance, an outbreak of a
conflict in a game makes the players genuinely stressed. In the USA, there are games
that let players become citizens of a small country involved in the politics of their
superpower neighbors;
� They make it possible to overcome mental barriers, which is especially valuable for
managers with certain habits;
� They can illustrate situations which decision-makers may face in their professional life
rather rarely and may then lack the knowledge of how to react properly;
� They allow their participants to master teamwork on the one hand, and explore ways
of solving problems that may occur in the process of decision-making on the other;
� They make it possible to extend the experience during the course of game, which
allows people of different levels of knowledge in a given area to practice, and to
achieve different levels of knowledge and skills depending on the needs and objectives
faced by the participants;
� They are tools integrating the previously-gained knowledge in different areas, granting
a possibility to experiment with the new knowledge or skills in risk-free conditions;
� The make one sensitive to particular issues, such as e.g. environmental protection;
� They make it possible to control the outcomes of teaching which are gained using
other tools and methods.
Apart from that, speaking more generally, decision-making simulation games:
� Make use of simulation models of reality, which leads to reduction of costs of
education and acceleration of simulated real processes. They also guarantee
repeatability of the practiced processes, which helps to include participants of lower
cognitive predisposition level;
� They require participants to possess a certain minimum level of experience in the area
to be improved. This experience – along with proper instruction – is necessary, but
also sufficient for participants with different levels of knowledge in a given area to
start the game unaided;
� They make it possible to achieve different levels of knowledge and skills, depending
on the needs and objectives faced by game participants.
Contemporary games – especially those computer-based – take full advantage of simulations
to create situations which are almost identical with those from real life. This makes it possible
80
to become familiar with such concepts as: costs, risk, market, production, finance, etc. These
situations occur as if in fast motion, which greatly shortens the time necessary to achieve
visible effects – both positive and negative – and affects the speed of recognition of feedback
and decision-making patterns. Today, simulation models are in vast majority based on
complex mathematical models whose effective application is possible thanks to computer
solutions. They are the basis for designing and developing modern simulation games. This
involves including human decision-makers in the process of simulation based on intricate
mathematical models (Bielecki et al., 1999).
81
3.4 Knowledge creation through experience
The subject matter of teaching and knowledge creation in simulation games and using
simulation games is very broad and fragmentary at the same time. It was explored by many
authors specializing and interested in different areas, hence it is impossible to cite them all,
that is why the author of this paper has based his deliberations on works by Bloom, Dale, and
Sternberg. Still, there are several other noteworthy groups of theories, as they present the
subject matter from a yet different perspective and contribute new elements to this paper.
The basic concept is one taken from Michael Polanyi (1964, 1966), proposing a division of
knowledge into explicit knowledge and tacit knowledge. The former covers conceptual
knowledge. It is widespread, commonly-known, and easy to communicate in the form of a
universal language; examples include e.g. the laws of nature, mathematical formulas,
algorithms, patterns, diagrams, and models. Yet, the latter type of knowledge is much more
interesting, as it summarized with the assertion that “we can know more than we can tell”; it
covers the area of knowledge manifesting itself through one’s ability to do something even on
a proficient level combined with one’s inability to explain neither how to perform a given
mastered activity, nor what makes this way of performance perfect. Furthermore, tacit
knowledge is individual, context-specific, and difficult to formalize and communicate, and
usually concerns physical activities. Polanyi claims that we acquire tacit knowledge through
active creation and gaining of experience. According to him, explicit knowledge only
represents a small tip of the iceberg of an entire body of possible – tacit – knowledge, which
is considerably larger than the visible part of knowledge.
Klabbers (2006) analyzed works by Polanyi and by his later followers (e.g. Gill, 2000), and
proposed a model of relationship between his work and games and simulations.
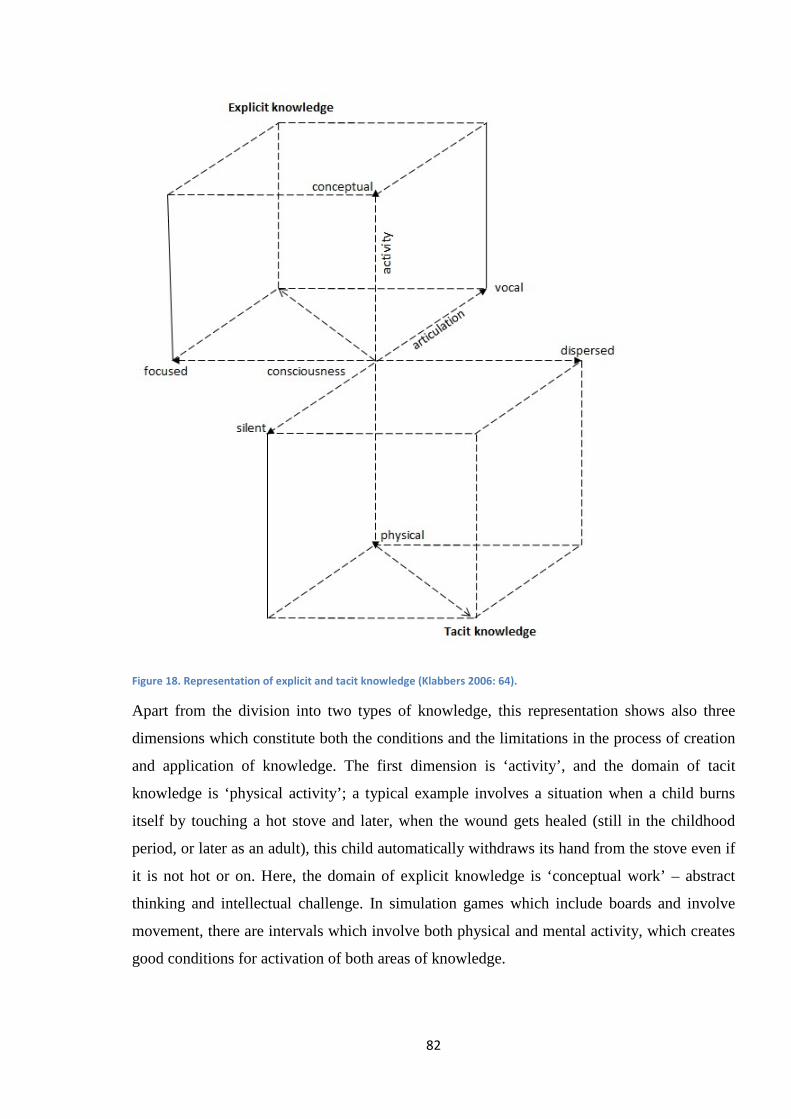
82
Figure 18. Representation of explicit and tacit knowledge (Klabbers 2006: 64).
Apart from the division into two types of knowledge, this representation shows also three
dimensions which constitute both the conditions and the limitations in the process of creation
and application of knowledge. The first dimension is ‘activity’, and the domain of tacit
knowledge is ‘physical activity’; a typical example involves a situation when a child burns
itself by touching a hot stove and later, when the wound gets healed (still in the childhood
period, or later as an adult), this child automatically withdraws its hand from the stove even if
it is not hot or on. Here, the domain of explicit knowledge is ‘conceptual work’ – abstract
thinking and intellectual challenge. In simulation games which include boards and involve
movement, there are intervals which involve both physical and mental activity, which creates
good conditions for activation of both areas of knowledge.
83
The dimension of awareness is associated with attention and focus. This dimension oscillates
between the focal and the subsidiary, which are mutually exclusive. If we are focused e.g. on
somebody or something in the foreground, then we may not notice some elements of the
background, but if we try to examine the ‘depth’ of the surroundings, we lose the focus on the
foreground. Simulation games make players constantly change their center of attention,
shifting their concentration from a big focus on one particular immediate decision to more
subsidiary, background elements, like identification of their place and position in a given
game.
Articulation is the third – and last – dimension. It can be silent or vocal, but according to
Klabbers (2006), it may be either full, exhaustive, or none. Klabbers questions his own model,
stating that articulation is actually not a dimension, but rather a connection, since even if we
have some opinion on or possess some knowledge about a person or topic, it is still up to us to
decide if we want to articulate this opinion or knowledge or not. On the other hand,
articulation and the ability to formulate a precise description of a concept or some part of
knowledge in a commonly-understood language is the basic tool and mechanism of transfer of
knowledge from the domain of ‘tacit’ to the domain of ‘explicit’. One of the fundamental
features of simulation games is “forcing” players to collective discussion and reflection. There
are frequent cases when one needs to formulate their opinions and views in a clear,
understandable, and acceptable way to prove their point or force a decision through. This
mechanism makes simulation games help players to understand their actions and to channel
knowledge from tacit to explicit domain – and the other way round.
Hersey and Blanchard (1988) propose a model which is similar theory-wise to that proposed
by Polanyi. They name two elements crucial to the way we learn: competence and
consciousness. They define competence as the scope of tasks that people are able to carry out
individually and feel confident doing them. Consciousness, in turn, is the scope of awareness
of one’s own skills and abilities. These two elements affect each other in many combinations
which influence the process of learning in four stages:
� unconscious incompetence,
� conscious incompetence,
� conscious competence,
� unconscious competence.
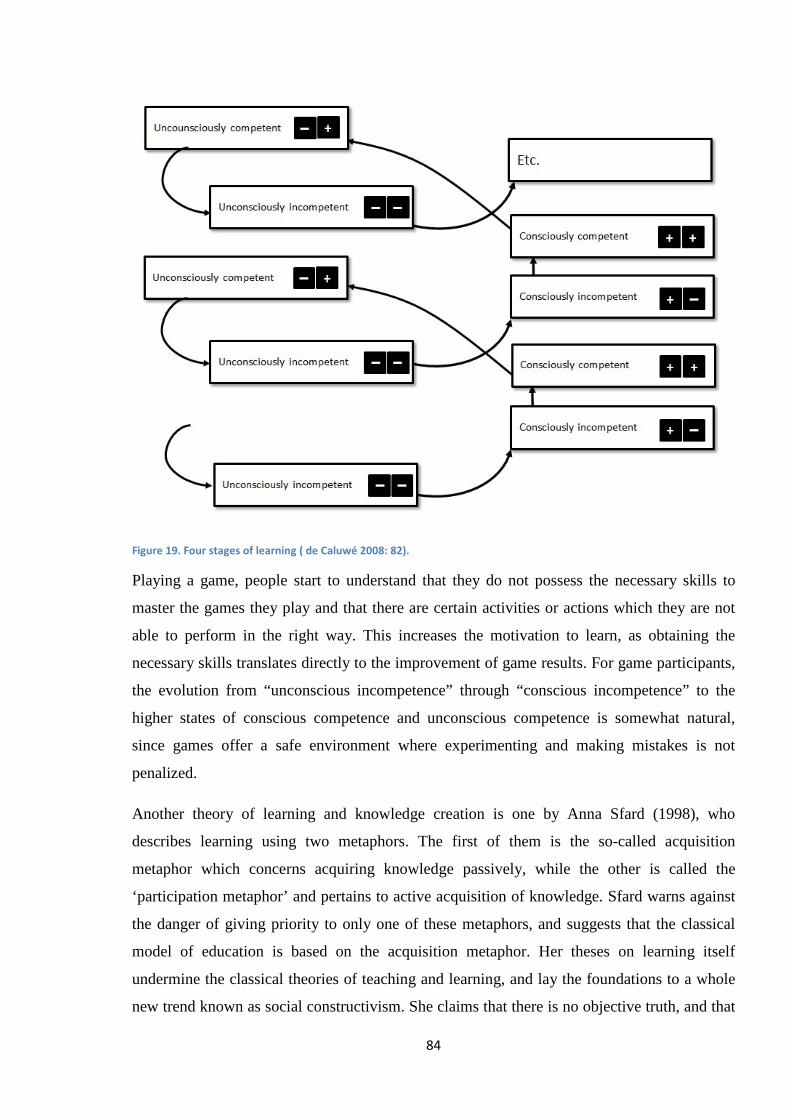
84
Figure 19. Four stages of learning ( de Caluwé 2008: 82).
Playing a game, people start to understand that they do not possess the necessary skills to
master the games they play and that there are certain activities or actions which they are not
able to perform in the right way. This increases the motivation to learn, as obtaining the
necessary skills translates directly to the improvement of game results. For game participants,
the evolution from “unconscious incompetence” through “conscious incompetence” to the
higher states of conscious competence and unconscious competence is somewhat natural,
since games offer a safe environment where experimenting and making mistakes is not
penalized.
Another theory of learning and knowledge creation is one by Anna Sfard (1998), who
describes learning using two metaphors. The first of them is the so-called acquisition
metaphor which concerns acquiring knowledge passively, while the other is called the
‘participation metaphor’ and pertains to active acquisition of knowledge. Sfard warns against
the danger of giving priority to only one of these metaphors, and suggests that the classical
model of education is based on the acquisition metaphor. Her theses on learning itself
undermine the classical theories of teaching and learning, and lay the foundations to a whole
new trend known as social constructivism. She claims that there is no objective truth, and that
85
knowledge is constructed by means of social interaction between people. Moreover, teaching
and learning shall also be activities performed by individuals, and teachers should act only as
supporters in those processes. According to her, learning is a process where one gradually
becomes a member of a certain society of practitioners, culture, profession, or another branch
of science. Social constructivism thus views learning as a process of participation in many
cultural practices and shared education-oriented activities. According to the creators of this
concept, Knowledge and possession of knowledge cannot be separated from each other, and
what is more, are inseparably associated with the cultural context and place of occurrence.
Paavola, Lipponen, and Hakkarainen (2002) argue convincingly that the metaphors of
acquisition and participation should be complemented by yet another metaphor – the
metaphor of knowledge creation. They base their views on the latest knowledge in the scope
of theory of knowledge creation and division, and claim that both teaching and learning
involve a progress of knowledge. Hence the driving force behind the process of knowledge
creation is curiosity and pursuit of the new. They conclude by highlighting the significance of
creation and discovery of knowledge, and defining them as means of deep understanding and
construction of meaning. Indeed, creation of meaning is the main mechanism of teaching
through games and play, so both of the abovementioned models become consistent parts of
the model of teaching through games and simulations.
Another group of theories refers to the social learning theory (Bandura, 1986), which
considers imitation and observation – both in tacit and explicit form – as the main
mechanisms of teaching. This model can be best described as a situation of dealing with a
complex issue, searching for effective mechanisms with the intention to analyze and copy
those mechanisms and solutions (Meggison, 1997). Simons (2008) provides us with two study
examples. The first example involves a report where managers use current challenges as
important tools of learning (emergent learning). The other example is a description of a study
where managers admit that they learn best from tasks which seem unfeasible, own failures,
role models, conflicts of standards and values, cooperation with their employees, personal
problems, and political games. These theories, supported by relevant studies, promote the idea
of application of business games in managerial education, as the sources of knowledge
indicated by managers are hard to utilize in the classical model of education.
Yet another extensive group of theories is the school of learning organization, with its origin
in the groundbreaking The fifth discipline by Senge (1990) (the author of this paper has
86
already referred to this school in the context of Bloom’s taxonomy). From the perspective of
knowledge creation, Senge’s most important ideas are those concerning learning in one’s
workplace and working environment, with a division into individual and team learning. This
lays the foundation for the concepts of individual and collective/social knowledge. The latter
type of knowledge is especially interesting; Senge elaborates on it by proposing notions of
shared vision and mental models, which make it possible to apply individual knowledge in the
right context. The metaphor of acquisition and possession of knowledge, rooted in the concept
of learning organization, focuses on active role of participants of such organization, who are
consciously involved in acquiring knowledge in cooperation with other participants, which
makes the organization develop and able to prosper in the long run. Unlike the previous
metaphors of knowledge acquisition, this particular metaphor does not emphasize individual
knowledge in the strict sense, but concentrates rather on skills, attitudes, and experience,
where a safe environment supervised by a mentor/expert is of essential importance. This
metaphor is yet another valuable component of the model of acquisition of knowledge
through business games; it also puts particular emphasis on the creation of collective and
metacognitive (contextual) knowledge, skills, approaches, and simulated experience. There
are many models of models of acquisition of knowledge, with a number of implications
stemming thereof, so it is impossible to analyze all of them – and which is actually not the
point of this paper, but it is still good to be aware of the relationship between the theories of
acquisition and application of knowledge and simulation games, which the author aims to
show using the examples featured in the paper. Literature research shows that there are five
dominant schools, which Ruijters (2006 after Simons, 2008) depicts as five metaphors of
acquisition of knowledge: acquisition, participation, discovery, apperception (observation),
and exercising. All five metaphors are applied in education through business games.
The author of this paper believes that a good summary of this part of the paper, devoted to
creation of knowledge through decision-making simulation games is the model proposed by
Klabbers (2006), summarizing the elements of gaining experience through actions,
construction of meaning, and typical human need of understanding the world we live in.
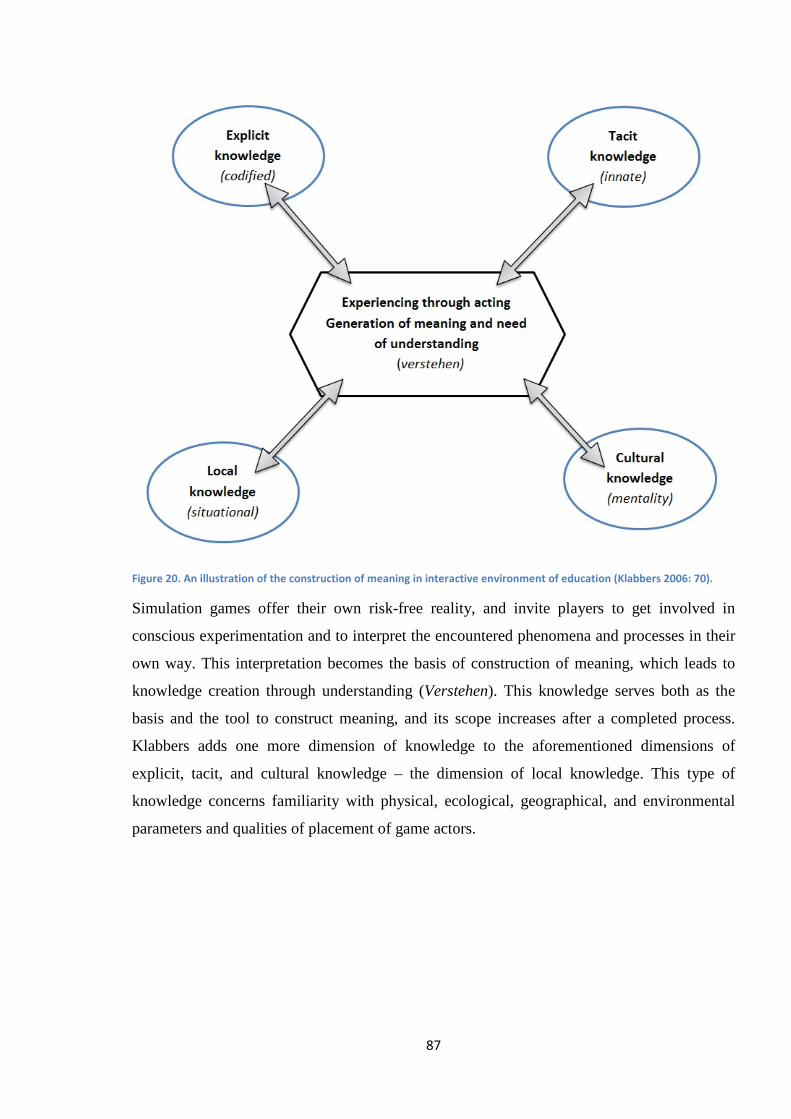
87
Figure 20. An illustration of the construction of meaning in interactive environment of education (Klabbers 2006: 70).
Simulation games offer their own risk-free reality, and invite players to get involved in
conscious experimentation and to interpret the encountered phenomena and processes in their
own way. This interpretation becomes the basis of construction of meaning, which leads to
knowledge creation through understanding (Verstehen). This knowledge serves both as the
basis and the tool to construct meaning, and its scope increases after a completed process.
Klabbers adds one more dimension of knowledge to the aforementioned dimensions of
explicit, tacit, and cultural knowledge – the dimension of local knowledge. This type of
knowledge concerns familiarity with physical, ecological, geographical, and environmental
parameters and qualities of placement of game actors.
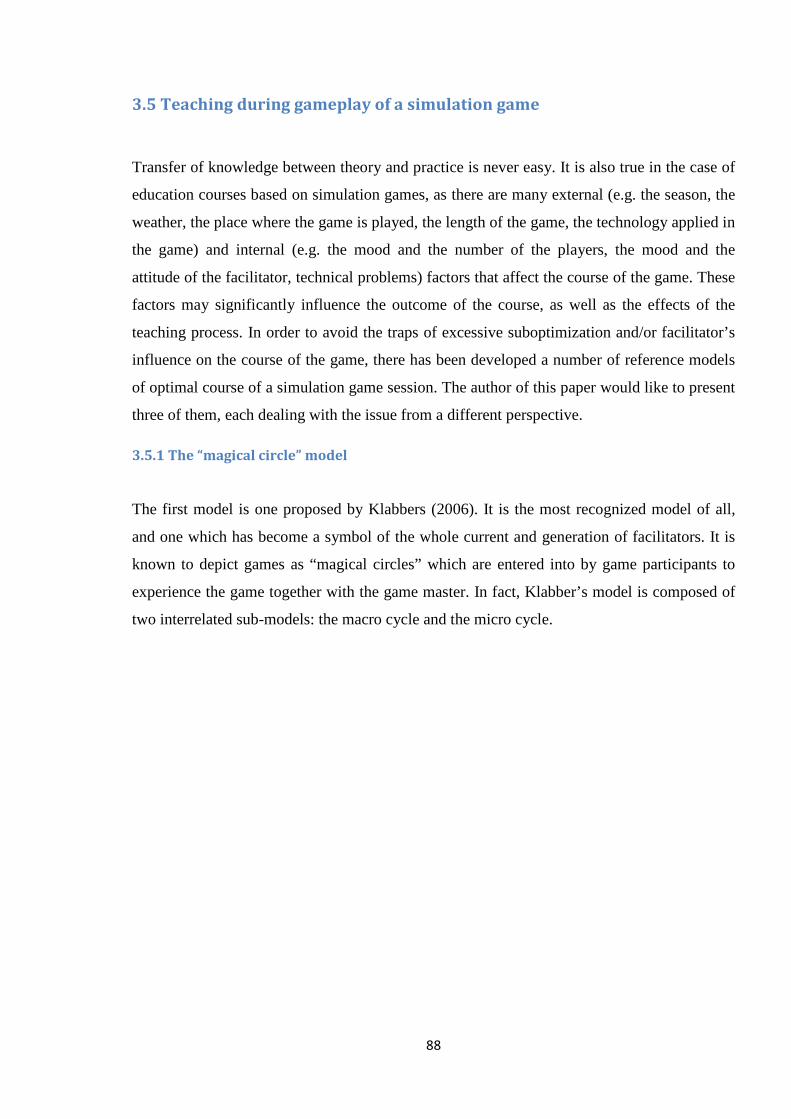
88
3.5 Teaching during gameplay of a simulation game
Transfer of knowledge between theory and practice is never easy. It is also true in the case of
education courses based on simulation games, as there are many external (e.g. the season, the
weather, the place where the game is played, the length of the game, the technology applied in
the game) and internal (e.g. the mood and the number of the players, the mood and the
attitude of the facilitator, technical problems) factors that affect the course of the game. These
factors may significantly influence the outcome of the course, as well as the effects of the
teaching process. In order to avoid the traps of excessive suboptimization and/or facilitator’s
influence on the course of the game, there has been developed a number of reference models
of optimal course of a simulation game session. The author of this paper would like to present
three of them, each dealing with the issue from a different perspective.
3.5.1 The “magical circle” model
The first model is one proposed by Klabbers (2006). It is the most recognized model of all,
and one which has become a symbol of the whole current and generation of facilitators. It is
known to depict games as “magical circles” which are entered into by game participants to
experience the game together with the game master. In fact, Klabber’s model is composed of
two interrelated sub-models: the macro cycle and the micro cycle.
89
Figure 21. Illustration of the macro cycle of game session (Klabbers 2006: 55).
The game begins with an introduction and briefing (there is no Polish equivalent for the latter
in this context, as it may include a typical ‘introduction’, discussions during the game, and an
oral summary; also, debriefing is a term commonly used in gaming jargon). Introduction to
the game usually starts several weeks before the game itself and involves a set of guidelines
and materials sent to the participants with the instruction to familiarize themselves with the
obtained aids. On the day of commencement of game, the game master initiates an
introductory course to the case of the game, accompanied often by distribution of additional
materials and information among game participants. This is followed by organization of teams
and preparation of the game system for the participants. If the participants meet for the first
time, a simple role-play game may be an effective means of support in team formation. The
aim of introductory activities is to ensure that all participants are mentally ready to enter the
“magic circle”.
Micro cycles -
playing the game
Debriefing 1 - a narrative analysis
of the course of the game
Debriefing 2 -conceptualization
Introduction, becoming familiar with the manual,
assuming the roles
Stepping into the
“magical circle”
Stepping out of the
“magical circle”
90
Next, the game is played in a sequence of rounds, cycles, or steps, during which the game
master focuses on monitoring the dynamic progress of the game. According to Klabbers
(2006), a game master should intervene only if the correct course of the game is at risk.
In rigid-rules games (games with strictly formalized rules which cannot be changed
throughout the gameplay), the game master makes sure that the game rules are strictly
adhered to. In free-form games, on the other hand, game participants create the rules by
themselves during the gameplay, as they are limited only by the rules of nature represented by
the game master, e.g. start-stop rule, principles of physical use of artifacts and space, intervals
for meals, etc. In free-form gams, the game master should intervene only if a player sustains
physical or mental damage. In both cases, what happens inside the gameplay is a process of
learning (this is elaborated on further in the second part of the model – the micro-cycle). After
the game master applies the stop rule, they proceed with the first debriefing. The aim of this
review is to analyze the course of the game and the process of the gameplay. It also to give
vent to emotions accumulated during the game. Participants analyze the course of the game
and recall their experiences and emotions to discuss and reflect on the game and construct the
narration of the game. The narration is composed both of the individual stories of the
participants, and of the common story of the course and events of the game. Based on that
common perspective, game participants move to the second debriefing which is to indicate
they key concepts of their correlation. The biggest value of the second debriefing is the
conceptualization and construction of meaning, i.e. placing new concepts and their
correlations in the structure of knowledge and practice of game participants.
The second element of the aforementioned model is the so-called micro-cycle of the game.
While the macro-cycle can be repeated only as a separate cycle on a different – higher – level,
the number of micro-cycles in one gameplay is virtually unlimited.
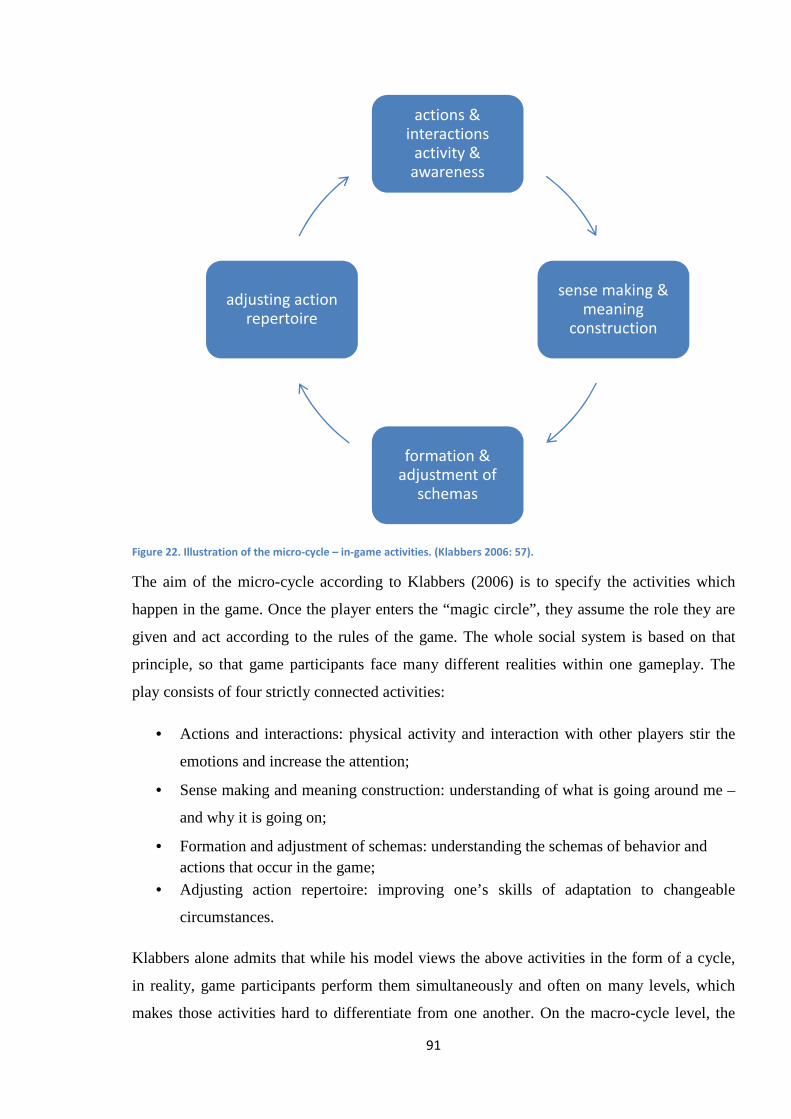
91
Figure 22. Illustration of the micro-cycle – in-game activities. (Klabbers 2006: 57).
The aim of the micro-cycle according to Klabbers (2006) is to specify the activities which
happen in the game. Once the player enters the “magic circle”, they assume the role they are
given and act according to the rules of the game. The whole social system is based on that
principle, so that game participants face many different realities within one gameplay. The
play consists of four strictly connected activities:
• Actions and interactions: physical activity and interaction with other players stir the
emotions and increase the attention;
• Sense making and meaning construction: understanding of what is going around me –
and why it is going on;
• Formation and adjustment of schemas: understanding the schemas of behavior and actions that occur in the game;
• Adjusting action repertoire: improving one’s skills of adaptation to changeable
circumstances.
Klabbers alone admits that while his model views the above activities in the form of a cycle,
in reality, game participants perform them simultaneously and often on many levels, which
makes those activities hard to differentiate from one another. On the macro-cycle level, the
actions & interactions
activity & awareness
sense making & meaning
construction
formation & adjustment of
schemas
adjusting action repertoire
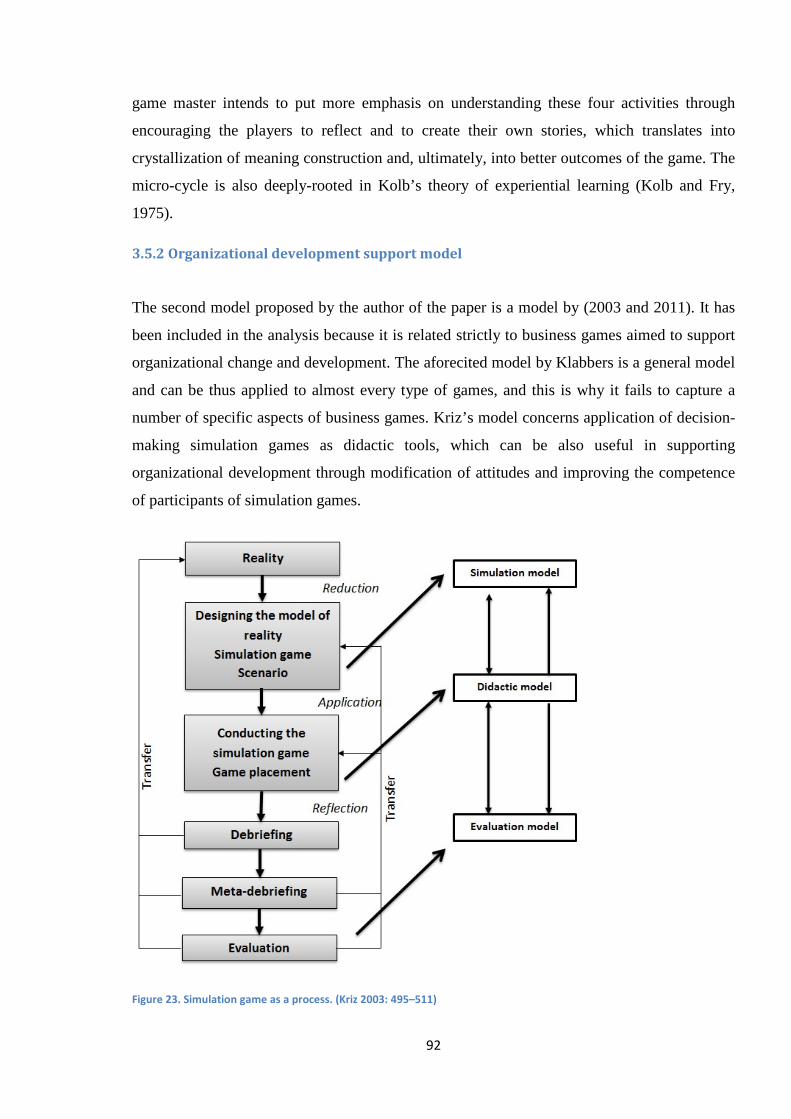
92
game master intends to put more emphasis on understanding these four activities through
encouraging the players to reflect and to create their own stories, which translates into
crystallization of meaning construction and, ultimately, into better outcomes of the game. The
micro-cycle is also deeply-rooted in Kolb’s theory of experiential learning (Kolb and Fry,
1975).
3.5.2 Organizational development support model
The second model proposed by the author of the paper is a model by (2003 and 2011). It has
been included in the analysis because it is related strictly to business games aimed to support
organizational change and development. The aforecited model by Klabbers is a general model
and can be thus applied to almost every type of games, and this is why it fails to capture a
number of specific aspects of business games. Kriz’s model concerns application of decision-
making simulation games as didactic tools, which can be also useful in supporting
organizational development through modification of attitudes and improving the competence
of participants of simulation games.
Figure 23. Simulation game as a process. (Kriz 2003: 495–511)
93
At the beginning, a fragment of reality is chosen for simulation purposes. The selection is
based on the purpose and the scope of the simulation, and should focus on the issue which is
to be represented in the simulation.
The process of design of the simulation game involves reduction of complexity of the reality
to a simplified reality model (the issue of reduction of reality is described in chapter II).
Furthermore, in terms of organizational change and development, the design should also take
the target group of the simulation game and the target length of training into consideration. A
decision-making simulation game is not only a model of reality, as it also includes a game
scenario and a manual together with game mechanics and player interfaces. The scenario
provides a description of the background story and a context for the model of reality. A
simulation game along with its mechanics and scenario form the so-called simulation model.
If a simulation game is designed correctly, it triggers the effect of creation of game reality
when applied to the previously-selected target user group. The type and impact of this new
reality depends on the game itself, on the game master, and on the players along with their
involvement and mutual interaction. The outcome, the course, and the processes resulting out
of the game are subject to reflective analysis at the stage of debriefing. According to Kriz and
Nöbauer (2008), the summary and overview of a simulation game is the most important
element related to achieving educational effects. The application and summary of simulation
games pertain to didactic model which is necessary to be applied correctly in order to achieve
the intended educational results, including the change of attitudes and the improvement of
competence of game participants.
A meta-debriefing is to let game creators and game facilitators overview and discuss a given
simulation game. Such summary serves as a tool to discuss the course of a given game, as
well as to summarize all elements of that game from the stage of design, such as the level of
reality, roles, interfaces, etc. The process ends with a formal evaluation of the whole process,
followed by an assessment of outcomes of each stage. This evaluation becomes also the basis
for potential corrections or – if necessary – for redesign of a given simulation game in order to
improve the way its content is delivered or the initially assumed effects are achieved. A
proper evaluation model is essential for evaluation and assessment to be performed as part of
the meta-debriefing.
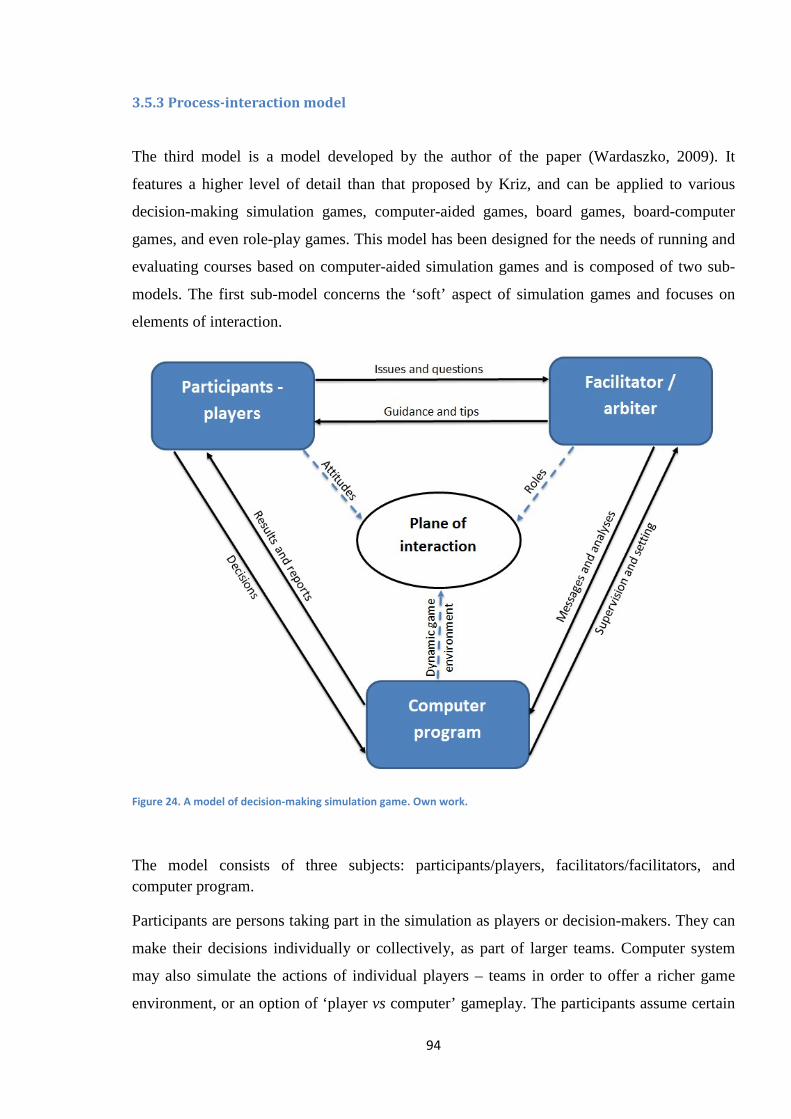
94
3.5.3 Process-interaction model
The third model is a model developed by the author of the paper (Wardaszko, 2009). It
features a higher level of detail than that proposed by Kriz, and can be applied to various
decision-making simulation games, computer-aided games, board games, board-computer
games, and even role-play games. This model has been designed for the needs of running and
evaluating courses based on computer-aided simulation games and is composed of two sub-
models. The first sub-model concerns the ‘soft’ aspect of simulation games and focuses on
elements of interaction.
Figure 24. A model of decision-making simulation game. Own work.
The model consists of three subjects: participants/players, facilitators/facilitators, and computer program.
Participants are persons taking part in the simulation as players or decision-makers. They can
make their decisions individually or collectively, as part of larger teams. Computer system
may also simulate the actions of individual players – teams in order to offer a richer game
environment, or an option of ‘player vs computer’ gameplay. The participants assume certain
95
attitudes towards the game; the most common behavior groups are (Lundy 1991; Cadotte,
1995): the opportunistic, the skill-oriented, the spiritually-absent, the analysts, and the lost.
The main element of study in this group is the issue of setting and achieving goals – on both
personal and group level.
Facilitators coordinate the course of the game and have certain roles to play (own work based
on Cadotte, 1995 et al.), which are as follows:
- administrator – supervising and administering the computer system to manage the
game in an efficient way,
- “game master” – creating the game environment and introducing the players into it,
- coach – training the participants and providing them with knowledge,
- “devil’s advocate” – mounting challenges and asking difficult questions,
- third party – assuming the role of institutions affecting the actions of the players and
settling any arising disputes, e.g. banks, trade unions, courts, or random incidents.
The elements of study for this group include construction of measurable criteria of assessment
of performance of facilitators/facilitators, and the extent of interference which does not
disturb the simulation, i.e. does not influence the outcome of the game beyond the decision-
makers’ control.
The third subject – and an element of simulation at the same time – is the computer program
which the simulation is based on. The author is aware that the sole fact of classifying a
computer program as a subject may seem a controversial idea, but there are some important
reasons behind it. Owing to the technological progress, programs which simulations are based
on have become highly-specialized applications featuring sophisticated mathematical models.
Today, the solutions currently in use are the effects of work of teams of human experts, and
game facilitators have a very limited and strictly defined scope of interference in the course of
the simulation on the software level. As a result, such programs are becoming increasingly
autonomous, and that is why the author of the paper believes that they are fully eligible to be
classified as subjects. Here, the elements of study include the stability and reliability of
software measured by the frequency of occurrence of critical errors or system/application
failures, as well as the user-friendliness.
Continuous arrows connecting the subjects in the model represent the flow of information and
feedback.
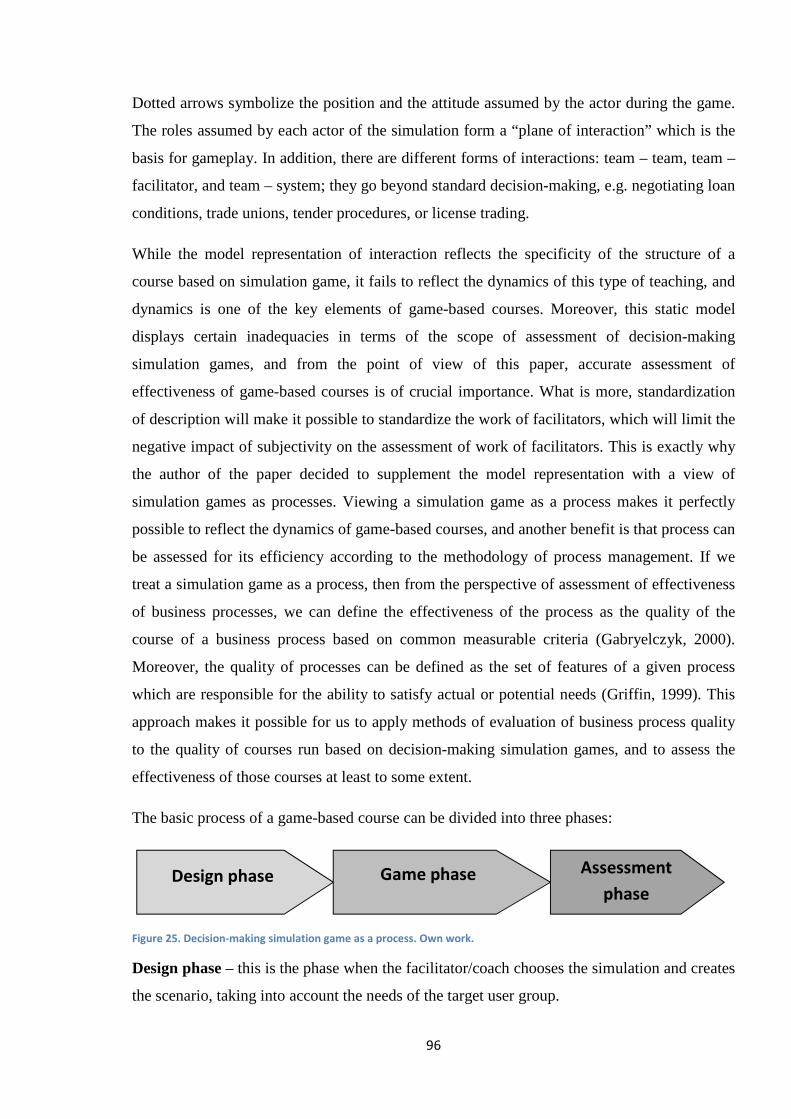
96
Dotted arrows symbolize the position and the attitude assumed by the actor during the game.
The roles assumed by each actor of the simulation form a “plane of interaction” which is the
basis for gameplay. In addition, there are different forms of interactions: team – team, team –
facilitator, and team – system; they go beyond standard decision-making, e.g. negotiating loan
conditions, trade unions, tender procedures, or license trading.
While the model representation of interaction reflects the specificity of the structure of a
course based on simulation game, it fails to reflect the dynamics of this type of teaching, and
dynamics is one of the key elements of game-based courses. Moreover, this static model
displays certain inadequacies in terms of the scope of assessment of decision-making
simulation games, and from the point of view of this paper, accurate assessment of
effectiveness of game-based courses is of crucial importance. What is more, standardization
of description will make it possible to standardize the work of facilitators, which will limit the
negative impact of subjectivity on the assessment of work of facilitators. This is exactly why
the author of the paper decided to supplement the model representation with a view of
simulation games as processes. Viewing a simulation game as a process makes it perfectly
possible to reflect the dynamics of game-based courses, and another benefit is that process can
be assessed for its efficiency according to the methodology of process management. If we
treat a simulation game as a process, then from the perspective of assessment of effectiveness
of business processes, we can define the effectiveness of the process as the quality of the
course of a business process based on common measurable criteria (Gabryelczyk, 2000).
Moreover, the quality of processes can be defined as the set of features of a given process
which are responsible for the ability to satisfy actual or potential needs (Griffin, 1999). This
approach makes it possible for us to apply methods of evaluation of business process quality
to the quality of courses run based on decision-making simulation games, and to assess the
effectiveness of those courses at least to some extent.
The basic process of a game-based course can be divided into three phases:
Figure 25. Decision-making simulation game as a process. Own work.
Design phase – this is the phase when the facilitator/coach chooses the simulation and creates
the scenario, taking into account the needs of the target user group.
Design phase Game phase Assessment
phase
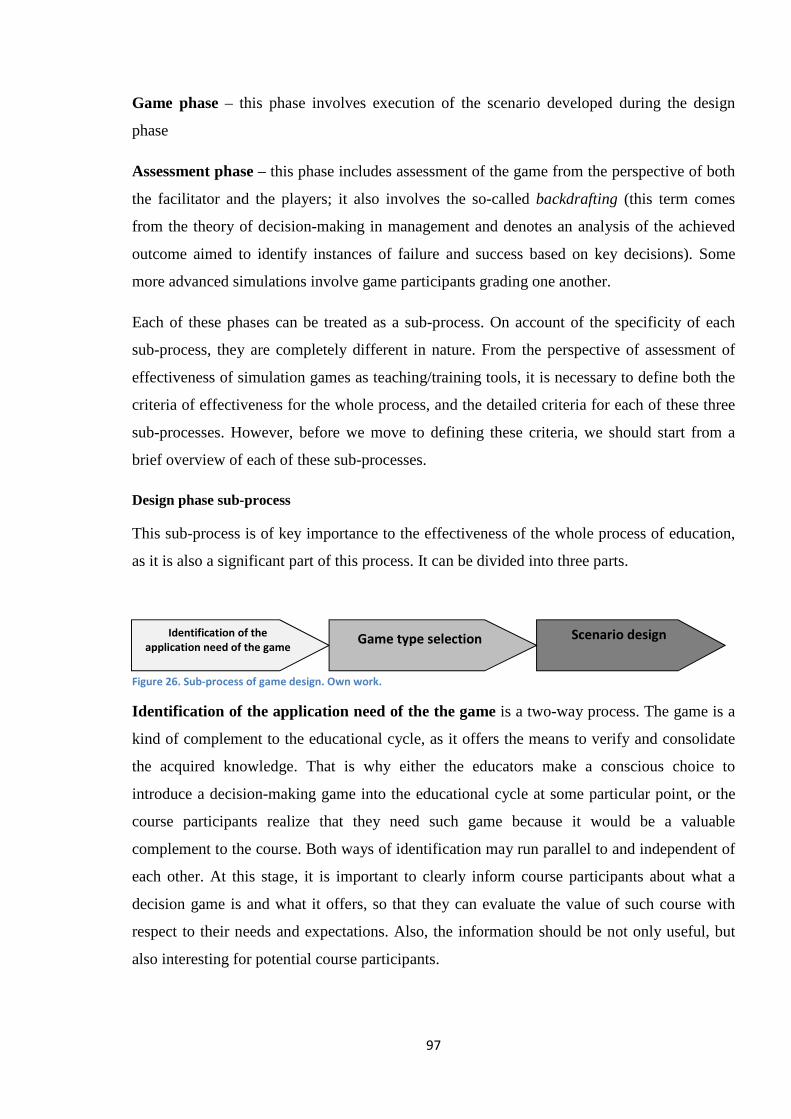
97
Game phase – this phase involves execution of the scenario developed during the design
phase
Assessment phase – this phase includes assessment of the game from the perspective of both
the facilitator and the players; it also involves the so-called backdrafting (this term comes
from the theory of decision-making in management and denotes an analysis of the achieved
outcome aimed to identify instances of failure and success based on key decisions). Some
more advanced simulations involve game participants grading one another.
Each of these phases can be treated as a sub-process. On account of the specificity of each
sub-process, they are completely different in nature. From the perspective of assessment of
effectiveness of simulation games as teaching/training tools, it is necessary to define both the
criteria of effectiveness for the whole process, and the detailed criteria for each of these three
sub-processes. However, before we move to defining these criteria, we should start from a
brief overview of each of these sub-processes.
Design phase sub-process
This sub-process is of key importance to the effectiveness of the whole process of education,
as it is also a significant part of this process. It can be divided into three parts.
Figure 26. Sub-process of game design. Own work.
Identification of the application need of the the game is a two-way process. The game is a
kind of complement to the educational cycle, as it offers the means to verify and consolidate
the acquired knowledge. That is why either the educators make a conscious choice to
introduce a decision-making game into the educational cycle at some particular point, or the
course participants realize that they need such game because it would be a valuable
complement to the course. Both ways of identification may run parallel to and independent of
each other. At this stage, it is important to clearly inform course participants about what a
decision game is and what it offers, so that they can evaluate the value of such course with
respect to their needs and expectations. Also, the information should be not only useful, but
also interesting for potential course participants.
Identification of the
application need of the game Scenario design Game type selection
98
Game type selection; the more information about the persons we are to work with we have,
the easier it is. The selection should be based on the following information:
• Participant type – e.g. pupils, students, managers, mixed groups, or specialist
groups, e.g. journalists, officials, scientists. Here, the more homogenous a given group
is, the easier it is to select the type and design the scenario of the game. Naturally, the
choice becomes more difficult if we have a group composed of persons with different
areas of specialization or at different stages of education; such circumstances requires
a compromise, or a very careful organization of groups. Selection of methodology
depends on the experience of the game facilitator(s), and on the structure of the game.
• Position of the game in the cycle of education, i.e. what kind of knowledge the
course participants have, and what they concentrate on in their further education. The
selection will be completely different for someone at the beginning of their
educational path than for someone halfway or about to finish their education. A game
offered at the initial stage of the cycle should arouse the participants’ interest and draw
their attention to the crucial areas of knowledge. A game to be played at the end of the
cycle should aim to support the participants in learning how to use and organize the
knowledge they acquired.
• Group size is very important, as the vast majority of games has a limit in terms
of the number of players. If our group is too small, we can introduce “virtual players”
to the simulation, but if the group is too large, then it may be reasonable to run more
than one game at the same time, or in a different term.
• Possibility to take advantage of technology in a given place and at a given
time. This is particularly significant if we run a game in an external environment, as
more and more games are based on advanced IT solutions which demand e.g.
uninterrupted access to the Internet and require game participants and facilitators to be
able to use certain IT systems. That is why it is important to ensure that all technical
conditions are met already at the stage of planning, and if the technological
background is insufficient – to consider changing the game or creating some back-up
in case of failure of the IT system in use.
• Course time span – time is of the essence, since courses usually have a limited
time horizon, which becomes a crucial element in the so-called compact trainings
involving playing the game in one session, one weekend, or in several consecutive
days. This aspect is to be planned really carefully, so that there is enough time for both
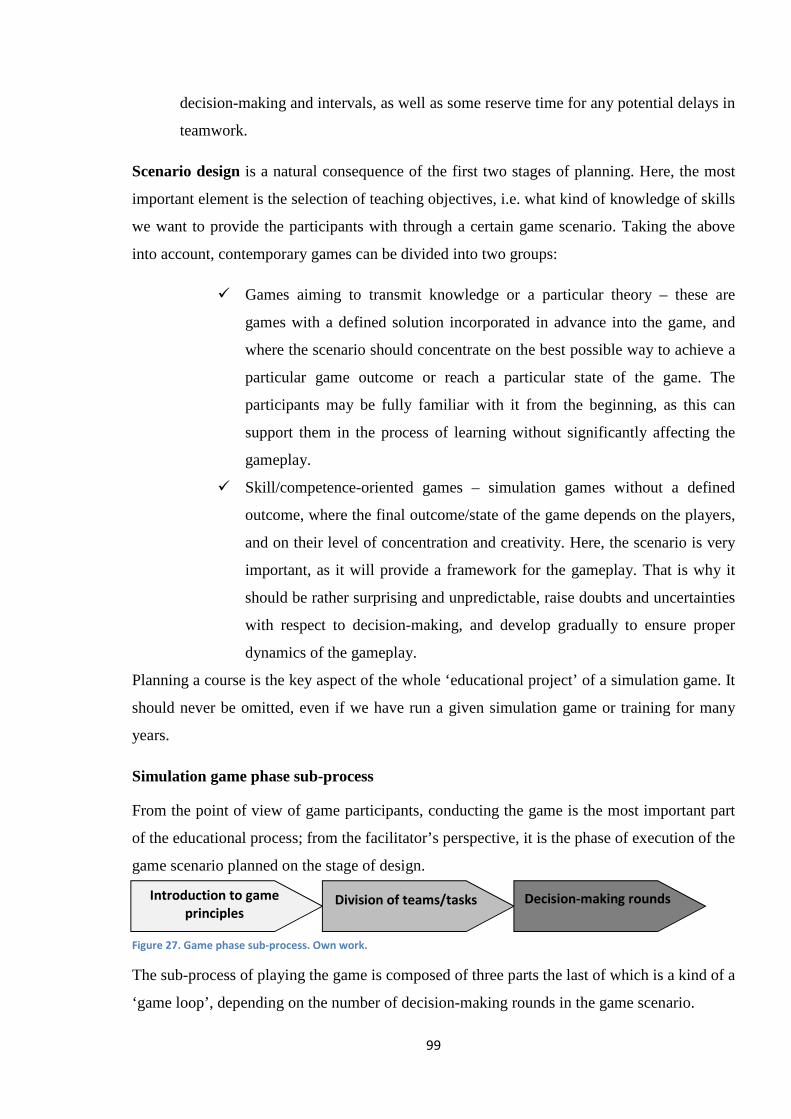
99
decision-making and intervals, as well as some reserve time for any potential delays in
teamwork.
Scenario design is a natural consequence of the first two stages of planning. Here, the most
important element is the selection of teaching objectives, i.e. what kind of knowledge of skills
we want to provide the participants with through a certain game scenario. Taking the above
into account, contemporary games can be divided into two groups:
� Games aiming to transmit knowledge or a particular theory – these are
games with a defined solution incorporated in advance into the game, and
where the scenario should concentrate on the best possible way to achieve a
particular game outcome or reach a particular state of the game. The
participants may be fully familiar with it from the beginning, as this can
support them in the process of learning without significantly affecting the
gameplay.
� Skill/competence-oriented games – simulation games without a defined
outcome, where the final outcome/state of the game depends on the players,
and on their level of concentration and creativity. Here, the scenario is very
important, as it will provide a framework for the gameplay. That is why it
should be rather surprising and unpredictable, raise doubts and uncertainties
with respect to decision-making, and develop gradually to ensure proper
dynamics of the gameplay.
Planning a course is the key aspect of the whole ‘educational project’ of a simulation game. It
should never be omitted, even if we have run a given simulation game or training for many
years.
Simulation game phase sub-process
From the point of view of game participants, conducting the game is the most important part
of the educational process; from the facilitator’s perspective, it is the phase of execution of the
game scenario planned on the stage of design.
Figure 27. Game phase sub-process. Own work.
The sub-process of playing the game is composed of three parts the last of which is a kind of a
‘game loop’, depending on the number of decision-making rounds in the game scenario.
Introduction to game
principles Division of teams/tasks Decision-making rounds
100
Introduction to game principles is the only “lecture-like” element of the game. It is the
stage where we indicate the most important elements of the game and the driving
mechanisms, and try to arouse the participants’ interest in the world of the game. It is by all
means desired for the facilitator/facilitator to assume the role of the “game master”. The
introduction should be also concise and provide the participants with the essential
information. In the case of knowledge-transmitting games, the introduction often covers the
theory we intend to provide the participants with. As for competitive games based on business
cases, it is good to run the introduction featuring a preliminary analysis of the condition of the
company in question. If the simulation game is based on a non-intuitive IT system, the
introduction should also include a practical presentation of the decision-making panel.
Division of teams and/or tasks depends on the game alone and on the size of the group.
According to research presented by the author (Wolfe and Chacko, 1983; Gentry, 1980;
Wardaszko, 2007), it appears that if skill-oriented competitive games are played in larger
teams (4-5 persons), the outcomes are better than if played in smaller teams (2-3 persons).
Single-player games are an exceptional case, as then the division is not significant, because
the competition between the players becomes of the essence.
There are two most commonly applied models of division:
• Random, where the facilitator/instructor assigns the participants to
teams/tasks at random.
• Free, where the participants organize themselves into groups or assign the
tasks among themselves.
Both of these methods have certain advantages and disadvantages described in detail in works
devoted to group psychology and in models of collective decision-making (Oyster, 2000).
Depending on the course of the process, we should select the method which will be efficient
and will not cause any conflicts among the players, for the sake of smooth progress of the
simulation game and due to time limitations.
Decision-making rounds are the essence of simulation games, because this is where the most
exciting part of the game happens. If we view the course of the game as a process, first, it is
the game which somewhat forces a working model based on a repeatable scheme of work,
which is rooted in Shewhart-Deming’s cycle of Plan-Do-Check-Act (Myszewski, 1998).
Second, the framework of gameplay is set by the previously-designed game scenario – even if
it includes some random elements. Third, computer-simulation-based games are limited by
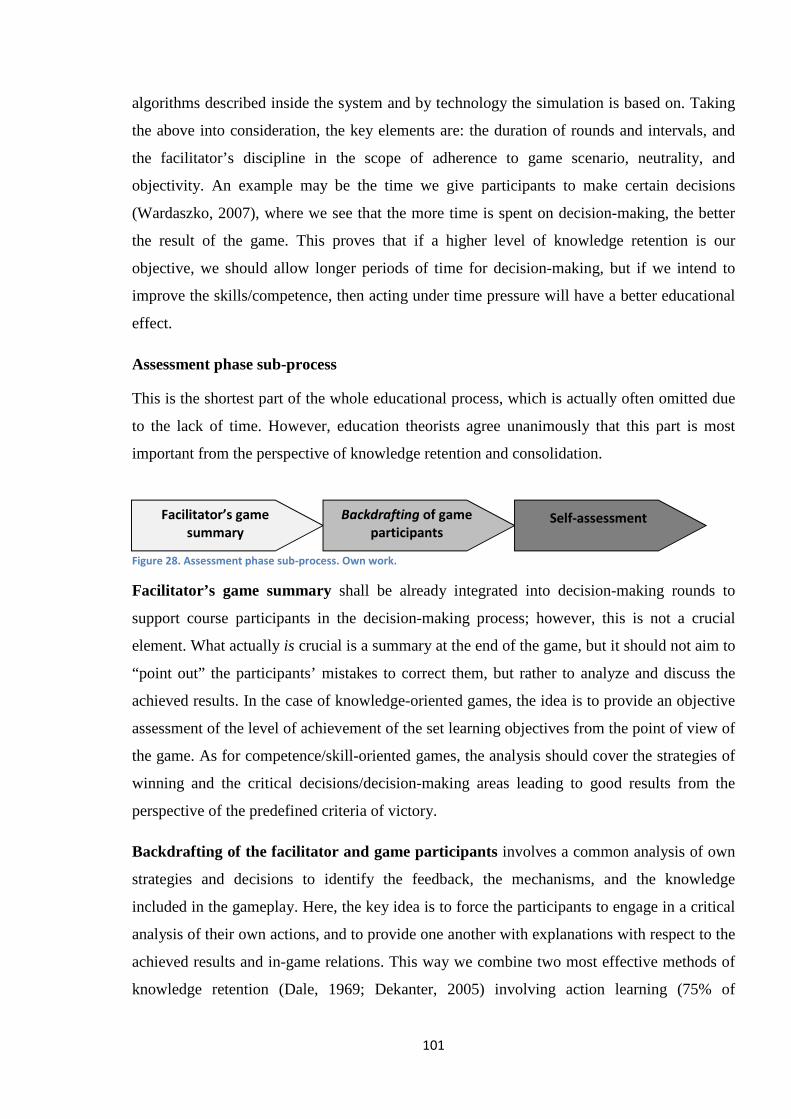
101
algorithms described inside the system and by technology the simulation is based on. Taking
the above into consideration, the key elements are: the duration of rounds and intervals, and
the facilitator’s discipline in the scope of adherence to game scenario, neutrality, and
objectivity. An example may be the time we give participants to make certain decisions
(Wardaszko, 2007), where we see that the more time is spent on decision-making, the better
the result of the game. This proves that if a higher level of knowledge retention is our
objective, we should allow longer periods of time for decision-making, but if we intend to
improve the skills/competence, then acting under time pressure will have a better educational
effect.
Assessment phase sub-process
This is the shortest part of the whole educational process, which is actually often omitted due
to the lack of time. However, education theorists agree unanimously that this part is most
important from the perspective of knowledge retention and consolidation.
Figure 28. Assessment phase sub-process. Own work.
Facilitator’s game summary shall be already integrated into decision-making rounds to
support course participants in the decision-making process; however, this is not a crucial
element. What actually is crucial is a summary at the end of the game, but it should not aim to
“point out” the participants’ mistakes to correct them, but rather to analyze and discuss the
achieved results. In the case of knowledge-oriented games, the idea is to provide an objective
assessment of the level of achievement of the set learning objectives from the point of view of
the game. As for competence/skill-oriented games, the analysis should cover the strategies of
winning and the critical decisions/decision-making areas leading to good results from the
perspective of the predefined criteria of victory.
Backdrafting of the facilitator and game participants involves a common analysis of own
strategies and decisions to identify the feedback, the mechanisms, and the knowledge
included in the gameplay. Here, the key idea is to force the participants to engage in a critical
analysis of their own actions, and to provide one another with explanations with respect to the
achieved results and in-game relations. This way we combine two most effective methods of
knowledge retention (Dale, 1969; Dekanter, 2005) involving action learning (75% of
Facilitator’s game
summary
Backdrafting of game
participants Self-assessment
102
retention) and learning through explaining (as much as 90% of retention). If this action is
performed correctly, then the teaching objectives will be achieved regardless of the result of
game participants/teams. In other words, it will be not significant if a team has won or lost
from the point of view of the criteria of victory.
Self-assessment, unlike the previous stage, is a form of individual evaluation of the results
achieved by a simulation game participant, and ideally, the facilitator/instructor should carry
out such assessment with every game participant. Simulation games, owing to their
complexity and interactive qualities, encompass many areas of knowledge and skills, which
makes it quite easy for game participants to accurately identify their strengths and
weaknesses. The phase of self-assessment should focus exactly on identification of one’s
strengths and weaknesses.
103
Chapter IV
Chapter four opens the empirical part of this paper and contains a description and an analysis
of simulation games in the context of application thereof in education. This is coupled with an
analysis of cases of placement of elements of knowledge from the area of management and
economics in simulation games.
This chapter has two purposes. First, the author of this paper wishes to present an overview of
simulation games, supplemented with a short description and a short analysis of each of them.
The analysis will focus on the specificity, advantages, and disadvantages of each of the
presented solutions. Next, the author would like to analyze two cases and use them to show
how management- and economy-related knowledge is used in decision-making simulation
games and delivered through courses based on the analyzed decision-making.
4.1 Overview of decision-making simulation games in teaching management
The presented overview of decision-making simulation games is to show the diversity of
simulation games and their usefulness in different areas and on different stages of education
in the field of management. The games have been selected based on the diversity of form, the
level of complexity, the diversity of target groups, and on the area of specialization in the
field of management. Today, of course, there are many simulation games on the market. Some
experts even claim that there are over 1,500 of them in the world, with new titles released
every year. This influx of new games is caused by the change in trends in the area of
management, as well as by the increase in popularity of this form of training on a global scale.
In the case of the first trend, large companies releasing business games develop their packs to
simulation games, supplementing them with items and solutions which are attractive in the
light of recent trends in management. At present, corporate social responsibility (CSR) and
sustainable growth are among such growing trends. Almost all leading global corporations,
such as, e.g. Innovative Learning Solutions, Capsim, Harvard Publishing House, Industry
Masters, have lately released a game themed with CSR, or expanded their existing
simulations by additional materials and scenarios strongly related to that theme. According to
the newest reports by The Entertainment Software Association (2011, 2012, 2013), the
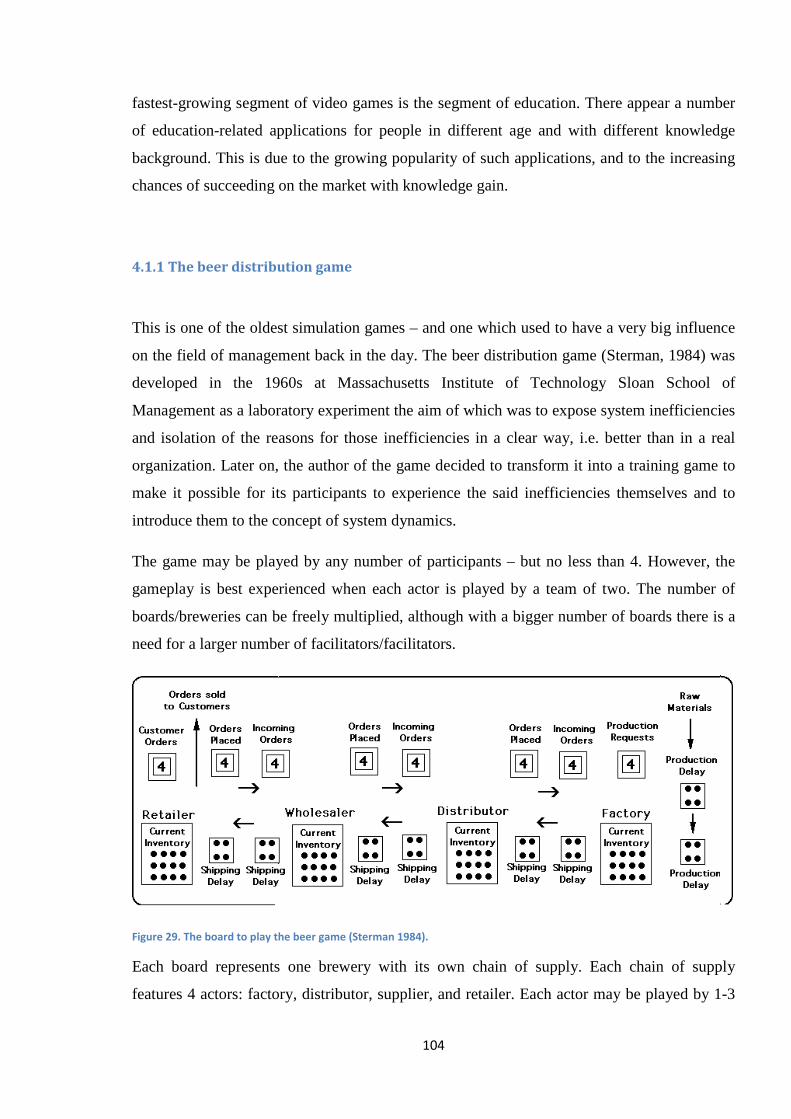
104
fastest-growing segment of video games is the segment of education. There appear a number
of education-related applications for people in different age and with different knowledge
background. This is due to the growing popularity of such applications, and to the increasing
chances of succeeding on the market with knowledge gain.
4.1.1 The beer distribution game
This is one of the oldest simulation games – and one which used to have a very big influence
on the field of management back in the day. The beer distribution game (Sterman, 1984) was
developed in the 1960s at Massachusetts Institute of Technology Sloan School of
Management as a laboratory experiment the aim of which was to expose system inefficiencies
and isolation of the reasons for those inefficiencies in a clear way, i.e. better than in a real
organization. Later on, the author of the game decided to transform it into a training game to
make it possible for its participants to experience the said inefficiencies themselves and to
introduce them to the concept of system dynamics.
The game may be played by any number of participants – but no less than 4. However, the
gameplay is best experienced when each actor is played by a team of two. The number of
boards/breweries can be freely multiplied, although with a bigger number of boards there is a
need for a larger number of facilitators/facilitators.
Figure 29. The board to play the beer game (Sterman 1984).
Each board represents one brewery with its own chain of supply. Each chain of supply
features 4 actors: factory, distributor, supplier, and retailer. Each actor may be played by 1-3
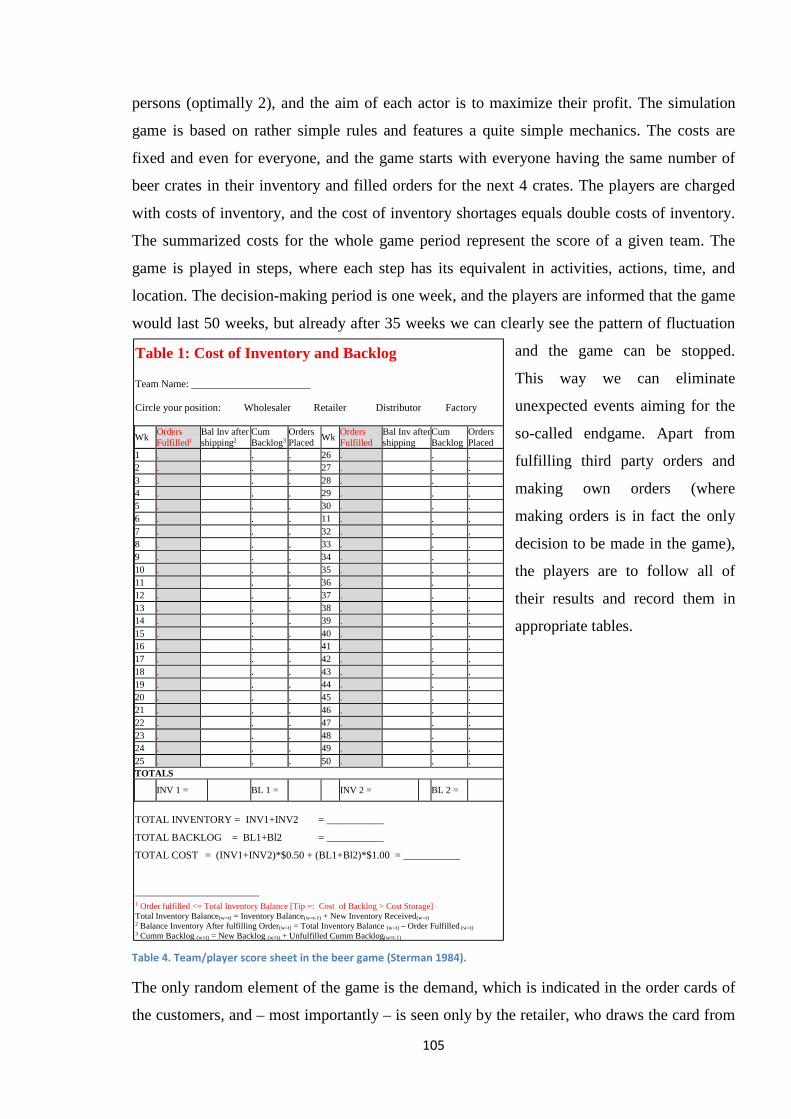
105
Table 1: Cost of Inventory and Backlog Team Name: _______________________ Circle your position: Wholesaler Retailer Distributor Factory
Wk Orders Fulfilled1
Bal Inv after shipping2
Cum Backlog3
Orders Placed
Wk Orders Fulfilled
Bal Inv after shipping
Cum Backlog
Orders Placed
1 . . . 26 . . . 2 . . . 27 . . . 3 . . . 28 . . . 4 . . . 29 . . . 5 . . . 30 . . . 6 . . . 11 . . . 7 . . . 32 . . . 8 . . . 33 . . . 9 . . . 34 . . . 10 . . . 35 . . . 11 . . . 36 . . . 12 . . . 37 . . . 13 . . . 38 . . . 14 . . . 39 . . . 15 . . . 40 . . . 16 . . . 41 . . . 17 . . . 42 . . . 18 . . . 43 . . . 19 . . . 44 . . . 20 . . . 45 . . . 21 . . . 46 . . . 22 . . . 47 . . . 23 . . . 48 . . . 24 . . . 49 . . . 25 . . . 50 . . . TOTALS
INV 1 = BL 1 = INV 2 = BL 2 =
TOTAL INVENTORY = INV1+INV2 = ___________
TOTAL BACKLOG = BL1+Bl2 = ___________
TOTAL COST = (INV1+INV2)*$0.50 + (BL1+Bl2)*$1.00 = ___________
1 Order fulfilled <= Total Inventory Balance [Tip =: Cost of Backlog > Cost Storage] Total Inventory Balance(w=t) = Inventory Balance(w=t-1) + New Inventory Received(w=t) 2 Balance Inventory After fulfilling Order(w=t) = Total Inventory Balance (w=t) – Order Fulfilled (w=t) 3 Cumm Backlog (w=t) = New Backlog (w=t) + Unfulfilled Cumm Backlog(w=t-1)
persons (optimally 2), and the aim of each actor is to maximize their profit. The simulation
game is based on rather simple rules and features a quite simple mechanics. The costs are
fixed and even for everyone, and the game starts with everyone having the same number of
beer crates in their inventory and filled orders for the next 4 crates. The players are charged
with costs of inventory, and the cost of inventory shortages equals double costs of inventory.
The summarized costs for the whole game period represent the score of a given team. The
game is played in steps, where each step has its equivalent in activities, actions, time, and
location. The decision-making period is one week, and the players are informed that the game
would last 50 weeks, but already after 35 weeks we can clearly see the pattern of fluctuation
and the game can be stopped.
This way we can eliminate
unexpected events aiming for the
so-called endgame. Apart from
fulfilling third party orders and
making own orders (where
making orders is in fact the only
decision to be made in the game),
the players are to follow all of
their results and record them in
appropriate tables.
Table 4. Team/player score sheet in the beer game (Sterman 1984).
The only random element of the game is the demand, which is indicated in the order cards of
the customers, and – most importantly – is seen only by the retailer, who draws the card from
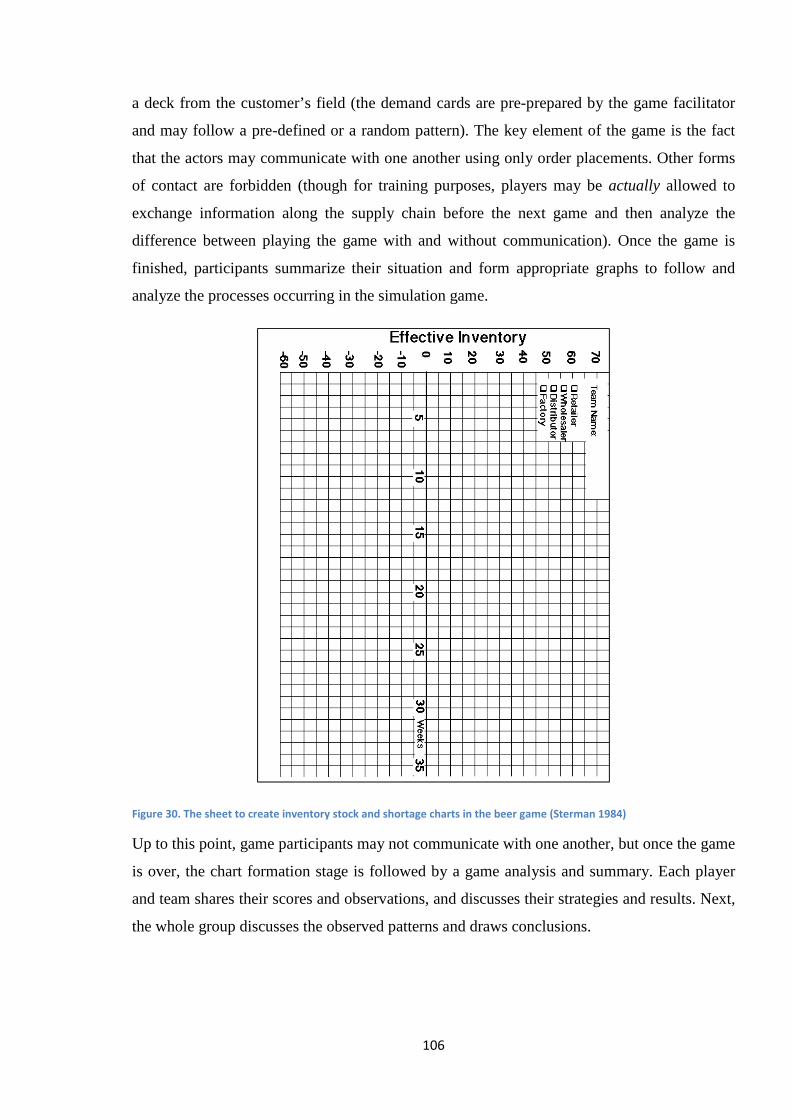
106
a deck from the customer’s field (the demand cards are pre-prepared by the game facilitator
and may follow a pre-defined or a random pattern). The key element of the game is the fact
that the actors may communicate with one another using only order placements. Other forms
of contact are forbidden (though for training purposes, players may be actually allowed to
exchange information along the supply chain before the next game and then analyze the
difference between playing the game with and without communication). Once the game is
finished, participants summarize their situation and form appropriate graphs to follow and
analyze the processes occurring in the simulation game.
Figure 30. The sheet to create inventory stock and shortage charts in the beer game (Sterman 1984)
Up to this point, game participants may not communicate with one another, but once the game
is over, the chart formation stage is followed by a game analysis and summary. Each player
and team shares their scores and observations, and discusses their strategies and results. Next,
the whole group discusses the observed patterns and draws conclusions.
107
Sterman’s original description of the game (1984), as well as further works based on that
model (Sterman 1989, 1994, 2000), point to the same educational objectives as the aforesaid
laboratory experiment:
• Awareness of the consequences of decisions and of their impact on the organization;
• Using the microworld of the game to teach how organizations operate;
• Change in the paradigm of viewing organization and all aspects required to be taken
into consideration to form other organizations; moving away from the perspective
assuming that “the system we try to change is out there, and we – agents – attempt to
fix it” to one assuming that “we and the system are inseparably connected”.
The beer game became a milestone in application of simulation games in studies and in
managerial education. Despite its age, it is still often used in courses teaching operations
management all around the world. The original game developed by Sterman was a board
(manual) game, but its open license made it possible to recreate it in the form of various
computer-aided versions. These include single-player games, where other actors are
computer-simulated, as well as multi-player games played on-line. The beer game is also a
flexible tool of education. It can be used at the beginning of a course as an exercise and an
‘ice-breaker’, since it does not require any knowledge of operations management, and the
collective gameplay and discussion encourage participants to open and take a stand. It can be
also applied during or at the end of a course as a course summary, where the discussion and
analysis which follow after the gameplay provide means of reflection on operations
management.
4.1.2 MANAGER
MANAGER is a decision-making simulation game developed by Oktawian Koczuba and
Witold T. Bielecki in the late 80s and early 90s of the past century. The game was first
created for education-training purposes of Międzynarodowa Szkoła Zarządzania
(International School of Management). It was compatible with DOS 6.0 operating system and
was based on BASIC language. It was updated and redeveloped in the years 2007-2008 by the
author of this paper, so that it could fit more with the market of today and be better-adapted to
current needs in the field of education. The case which the game is based on is a case of a
Polish company manufacturing TV sets. The company faces the challenges of free market, but
108
its internal structure is based on the principles of the central planned economy. Originally,
MANAGER was designed to be played in teams of 3-5, preferably 4-6 persons. At present,
the application makes it possible to create a virtually unlimited number of teams, and the
optimal number of members in a single team is 4-5.
Game participants assume the roles of members of the new board of management. The scope
of their decisions to be made covers the following sections (Bielecki, Koczuba, Wardaszko,
2009: 2):
• extensive development of the company, i.e. increasing the number of work places
and the number of employees,
• intensive development through deciding on modernization investments and on the
use of potential research and development resources,
• amounts to be spent on environmental protection,
• amount of salaries of the employees,
• production capacity,
• amount of the purchased materials,
• prices of products,
• market offer and marketing mix: domestic market or export,
• amounts to be spent on promotion and advertising on both markets,
• distribution of net profit.
The task of each team as the board of management is to manage the company in such way so
as to maximize the company’s results based on six equally weighted criteria of performance
assessment (Bielecki, Koczuba, Wardaszko, 2009: 3):
� company internal funds,
� average salary level in total: cost-based and profit-based,
� production capacity,
� labor intensity (labor productivity),
� material usage,
� production quality level.
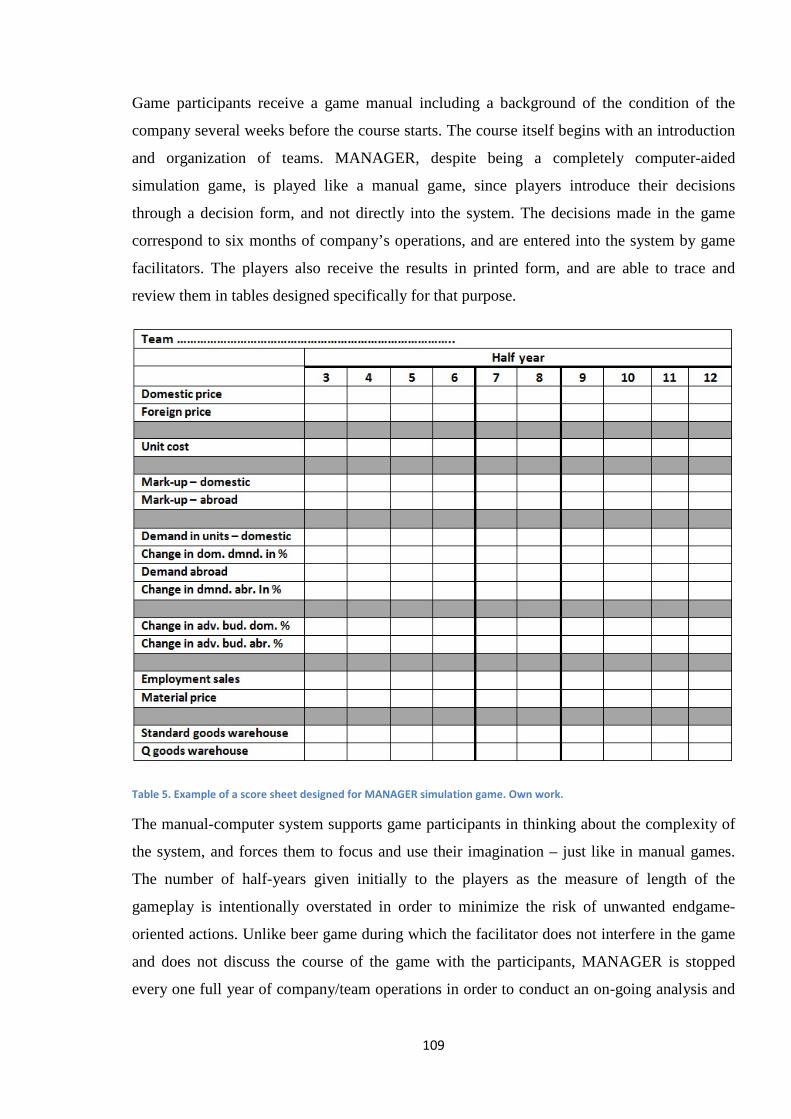
109
Game participants receive a game manual including a background of the condition of the
company several weeks before the course starts. The course itself begins with an introduction
and organization of teams. MANAGER, despite being a completely computer-aided
simulation game, is played like a manual game, since players introduce their decisions
through a decision form, and not directly into the system. The decisions made in the game
correspond to six months of company’s operations, and are entered into the system by game
facilitators. The players also receive the results in printed form, and are able to trace and
review them in tables designed specifically for that purpose.
Table 5. Example of a score sheet designed for MANAGER simulation game. Own work.
The manual-computer system supports game participants in thinking about the complexity of
the system, and forces them to focus and use their imagination – just like in manual games.
The number of half-years given initially to the players as the measure of length of the
gameplay is intentionally overstated in order to minimize the risk of unwanted endgame-
oriented actions. Unlike beer game during which the facilitator does not interfere in the game
and does not discuss the course of the game with the participants, MANAGER is stopped
every one full year of company/team operations in order to conduct an on-going analysis and
110
to discuss current results. After the simulation game comes to an end, an analysis of the whole
course of the game follows. The debriefing is divided due to the high level of complexity of
the simulation game and to the dynamically changing situation. Moreover, in MANAGER,
the players compete with one another both directly (through salaries and prices) and indirectly
(through score rankings). The aforecited list of criteria of performance assessment is
developed according to the logic of trade-off and strategy creation, and its aim is to force the
participants of the simulation game to think through their decisions and strategies in the
context of performance indicators and trade-offs that need to be improved to succeed.
Calculating the chances for victory and planning the strategy leading to this victory are among
the most important elements of teaching through this simulation game.
The author has designed a number of exercises and additional works based on MANAGER,
which can be assigned to game participants as necessary. These tasks may be performed as
part of classes alternating with game rounds, or after classes, as part of self-study. Such tasks
may include: strategy development and analysis, financial and market projections, financial
and strategic benchmarking, ex post strategy analysis in writing – along with variant analysis,
presentation of results, etc. These tasks are to be performed in order to improve a given
participant’s in-game skills and to increase the effectiveness of the process of education.
MANAGER is a simulation game dedicated to players with some background knowledge in
the scope of management, marketing, finance, and accounting, but this knowledge does not
have to be very advanced. On account of the above, it can be used successfully as an exercise
summarizing some stage of education, e.g. the end of undergraduate studies.
MANAGER is a good example of how the classical model of education works when
supported by a decision-making simulation game. Game participants make their decisions
throughout the game based on the same model and the same set of decisions. They carry out
the same analyses and calculations, and optimize exactly the same parameters round after
round, since both the model and the scenario of MANAGER are static. Players neither get
bored nor lose their motivation, even though the actions to be taken are repetitive and could
be considered boring and unnecessary in a different setting. Given the possibility to execute
own strategies, to compete, and to experience real emotions, the players perceive these
repetitive tasks as means to achieve own goals, and not as the purpose of exercise.
111
4.1.3 Marketplace©
Marketplace©, owned by Innovative Learning Solutions Ltd. from Knoxville, USA, is a
system offering several dozens of different simulation computer games of various types,
including: marketing, management, strategic management, operations management, supply
chain management, e-commerce. However, it should be stressed that the focus of the majority
of such games is on functional areas of sales and marketing, since the creator and inventor of
those simulation games, Ernest Cadotte, is a professor of marketing. The simulation games
from this family offer more than a dozen of levels of advancement and difficulty – from basic
level, which requires hardly any initial knowledge or expertise, to most advanced and
complex business simulations providing the players with a very realistic set of business
decisions, along with a real-time global dynamic economic environment. Moreover, ILS Ltd.
has recently expanded its portfolio by simulation games themed with large-format store
management – Retail Management Simulation, and with the concept of teaching the principles
of corporate social responsibility – Conscious Capitalism. At present, this system is used by
over 650 academic facilities in 55 countries, and the system of this game is considered a
benchmark for both the existing and the newly-developed solutions. All simulation games are
available in English; some of them offer other language versions, and 8 of them are available
in Polish. iSpace Simulation Sp. z o.o. – the Polish distributor of Marketplace© – is
responsible for translating new simulations to Polish. The licensing system is based on fees
for the level of activity of a team in a given simulation game and depends on the level of
advancement of a given game.
Along with the multitude of solutions, available scenarios, and various levels of difficulty
comes the issue of application of a particular simulation game at the right stage of education –
adapted to a particular user. If the game is too complex, it will only discourage the players,
fail to win their emotional involvement, and – as a result – fail to become a ‘ticket’ to the
“magic circle” (Klabbers, 2006). Another challenge is the organization and management of
courses and groups. Marketplace© simulation games are computer-only and browser-based
games, which makes it possible to organize courses based on such games in both classical and
e-learning form. The author of the paper has spent a lot of time on trials and tests to come to a
conclusion that the best solution is the hybrid version where classes serve as platforms for
discussion and analysis, and organization of different events like e.g. negotiation or
presentation, while the game is played as part of e-learning process, as a kind of homework.
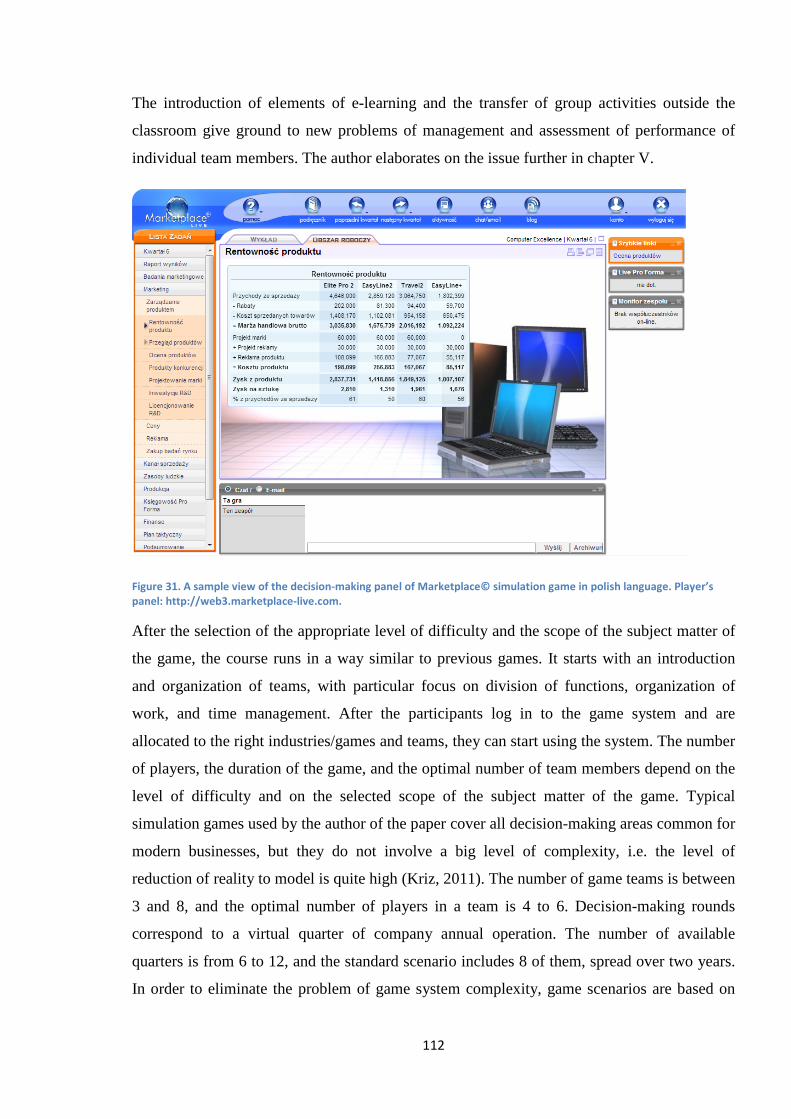
112
The introduction of elements of e-learning and the transfer of group activities outside the
classroom give ground to new problems of management and assessment of performance of
individual team members. The author elaborates on the issue further in chapter V.
Figure 31. A sample view of the decision-making panel of Marketplace© simulation game in polish language. Player’s
panel: http://web3.marketplace-live.com.
After the selection of the appropriate level of difficulty and the scope of the subject matter of
the game, the course runs in a way similar to previous games. It starts with an introduction
and organization of teams, with particular focus on division of functions, organization of
work, and time management. After the participants log in to the game system and are
allocated to the right industries/games and teams, they can start using the system. The number
of players, the duration of the game, and the optimal number of team members depend on the
level of difficulty and on the selected scope of the subject matter of the game. Typical
simulation games used by the author of the paper cover all decision-making areas common for
modern businesses, but they do not involve a big level of complexity, i.e. the level of
reduction of reality to model is quite high (Kriz, 2011). The number of game teams is between
3 and 8, and the optimal number of players in a team is 4 to 6. Decision-making rounds
correspond to a virtual quarter of company annual operation. The number of available
quarters is from 6 to 12, and the standard scenario includes 8 of them, spread over two years.
In order to eliminate the problem of game system complexity, game scenarios are based on
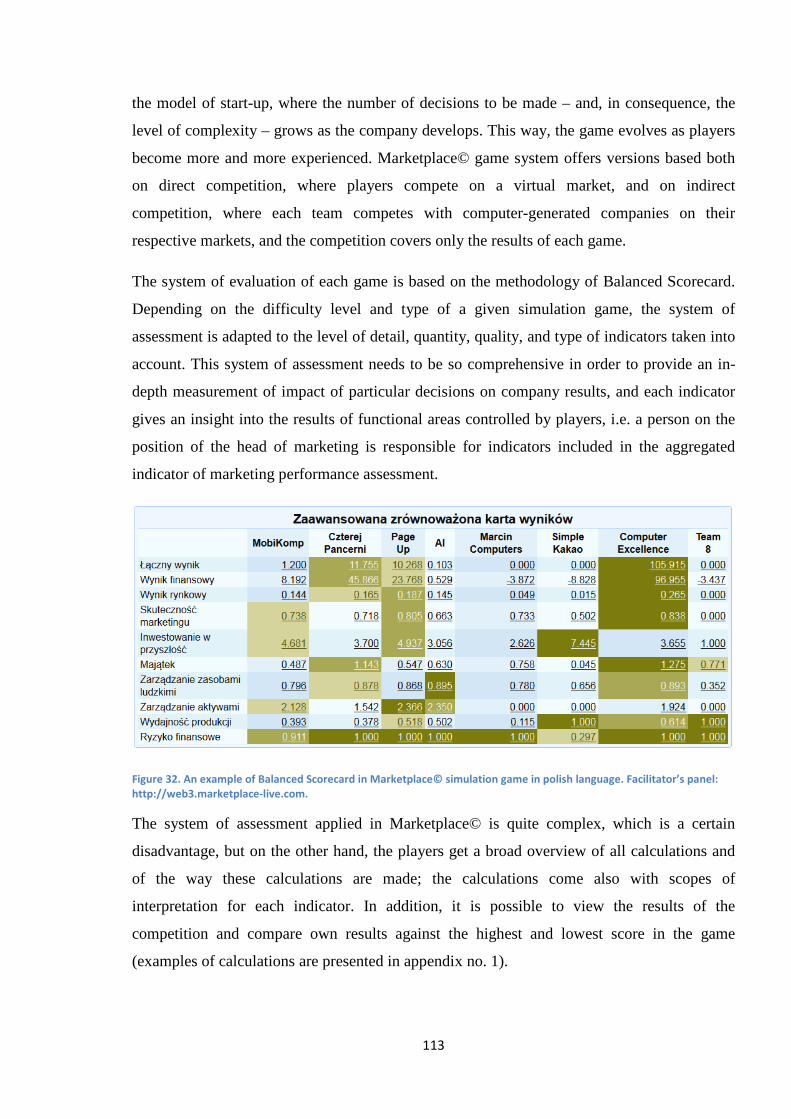
113
the model of start-up, where the number of decisions to be made – and, in consequence, the
level of complexity – grows as the company develops. This way, the game evolves as players
become more and more experienced. Marketplace© game system offers versions based both
on direct competition, where players compete on a virtual market, and on indirect
competition, where each team competes with computer-generated companies on their
respective markets, and the competition covers only the results of each game.
The system of evaluation of each game is based on the methodology of Balanced Scorecard.
Depending on the difficulty level and type of a given simulation game, the system of
assessment is adapted to the level of detail, quantity, quality, and type of indicators taken into
account. This system of assessment needs to be so comprehensive in order to provide an in-
depth measurement of impact of particular decisions on company results, and each indicator
gives an insight into the results of functional areas controlled by players, i.e. a person on the
position of the head of marketing is responsible for indicators included in the aggregated
indicator of marketing performance assessment.
Figure 32. An example of Balanced Scorecard in Marketplace© simulation game in polish language. Facilitator’s panel:
http://web3.marketplace-live.com.
The system of assessment applied in Marketplace© is quite complex, which is a certain
disadvantage, but on the other hand, the players get a broad overview of all calculations and
of the way these calculations are made; the calculations come also with scopes of
interpretation for each indicator. In addition, it is possible to view the results of the
competition and compare own results against the highest and lowest score in the game
(examples of calculations are presented in appendix no. 1).
114
Marketplace© simulation gaming system was designed to enable large-team gameplay, that is
why it offers “peer-to-peer” assessment as part of performance evaluation, and a system of
automatic tests. After the facilitator activates this function, the tests will appear at the
beginning of each round and assign questions to the players on a random basis – but taking
into consideration the scope of functional responsibilities of each of them. Team member
performance assessment is offered at the end of each round.
There can be also additional tasks integrated into a given simulation game; they may affect
the content and outcome of the game. Business plans, presentations, negotiation involving
venture capital, or situational analyses can be all incorporated into the simulation game
scenario. The aim of their presence is to ‘attach’ the players with the background story of the
game, as well as to increase their level of knowledge retention and to improve their skills.
Because of the emphasis on individual work with the game system and on teamwork, there is
much less time for discussion and debriefing, that is why the analysis of one’s actions is
partially transferred to the area of teamwork in the form of self-analysis, self-assessment, and
presentations. ILS has also introduced certain standards of assessment by the name of
AACSB (The Association to Advance Collegiate Schools of Business); hence, there are
special tables with evaluation matrices for each element (an example of a table with
evaluation matrix is provided in appendix 2).
The family of Marketplace© simulation games is an example of contemporary approach to
implementation of simulation games into effect-oriented tertiary education. The games
themselves may not be state-of-the-art, and their scenarios do have some flaws, but the series
is still one of the most popular in the world. This is because of two reasons. First, ILS puts the
emphasis on providing the best possible product from the point of view of obtaining and
delivering educational effects while offering a decently advanced technical solution – hence
the system features a whole section of resources supporting the facilitator. Second, the system
is very user-friendly from the facilitator’s perspective. The whole administration panel has
been designed to make running the classes easy and intuitive, which makes it possible for the
facilitator to manage and monitor several groups at the same time. The biggest drawback is a
very limited influence on the content of the game. It is also impossible to create own scenarios
or to edit the existing ones.
115
4.1.4 TOPSiM General Management II
TOPSiM system is a product by TERTIA Edusoft GmbH from Germany, which was bought
by TATA Interactive Solutions in 2005. The family of TOPSiM simulation games is
composed of several dozens of simulation games covering different functional areas of
businesses, as well as offering different levels of difficulty. Since all of those simulation
games are based on the same calculation engine, the ‘difficulty level’ is in fact the level of
reproduction of reality and of its detail. Unlike browser-based simulation games (e.g. the
abovementioned Marketplace©), most TOPSiM simulation games are stand-alone games, but
TATA Interactive Solutions has recently invested in browser-based solutions as well. The
commercial model of stand-alone games is much different from systems based on one-time
licenses. The cost of purchase of a TOPSiM simulation game – including facilitator training –
is close to several dozens of thousand euros. This might seem a very big amount, but we
should remember that this is a one-off expense which can be divided into an infinite number
of created and used games later on. There is, however, a big disadvantage in the form of
limited number of improvements and ‘patches’ for the game system, but the advantage is the
system’s mobility, which does not require our constant access to the Internet.
TOPSiM General Management II is a top management game (Bielecki, 1999), and a flagship
product of TATA Interactive Solutions. Here, game participants become the management
board and take over a big company with a long tradition. That is why the introductory
background material is really extensive and comprehensive. The biggest drawback of this
solution is the high level of uncertainty and complexity of simulation game, which the players
face from the very beginning. On the other hand, the solution provides the players with a very
realistic environment involving a high level of realism of the background story itself, and of
the presented data and relations.
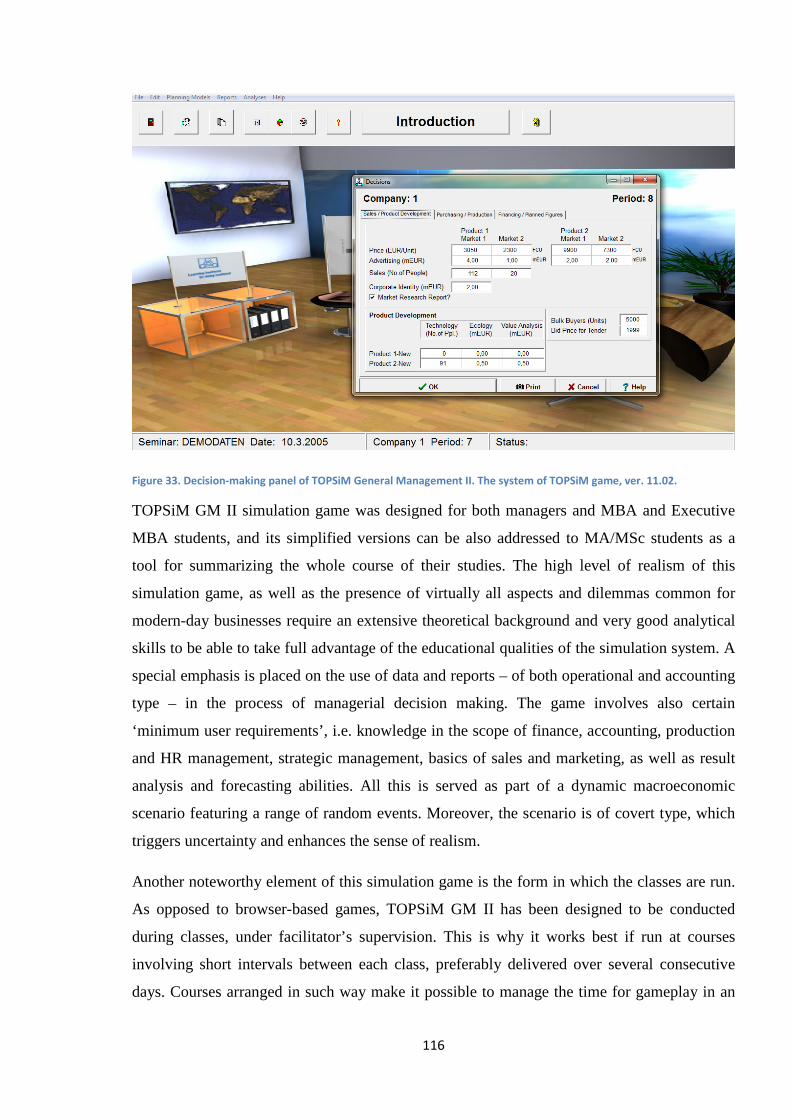
116
Figure 33. Decision-making panel of TOPSiM General Management II. The system of TOPSiM game, ver. 11.02.
TOPSiM GM II simulation game was designed for both managers and MBA and Executive
MBA students, and its simplified versions can be also addressed to MA/MSc students as a
tool for summarizing the whole course of their studies. The high level of realism of this
simulation game, as well as the presence of virtually all aspects and dilemmas common for
modern-day businesses require an extensive theoretical background and very good analytical
skills to be able to take full advantage of the educational qualities of the simulation system. A
special emphasis is placed on the use of data and reports – of both operational and accounting
type – in the process of managerial decision making. The game involves also certain
‘minimum user requirements’, i.e. knowledge in the scope of finance, accounting, production
and HR management, strategic management, basics of sales and marketing, as well as result
analysis and forecasting abilities. All this is served as part of a dynamic macroeconomic
scenario featuring a range of random events. Moreover, the scenario is of covert type, which
triggers uncertainty and enhances the sense of realism.
Another noteworthy element of this simulation game is the form in which the classes are run.
As opposed to browser-based games, TOPSiM GM II has been designed to be conducted
during classes, under facilitator’s supervision. This is why it works best if run at courses
involving short intervals between each class, preferably delivered over several consecutive
days. Courses arranged in such way make it possible to manage the time for gameplay in an
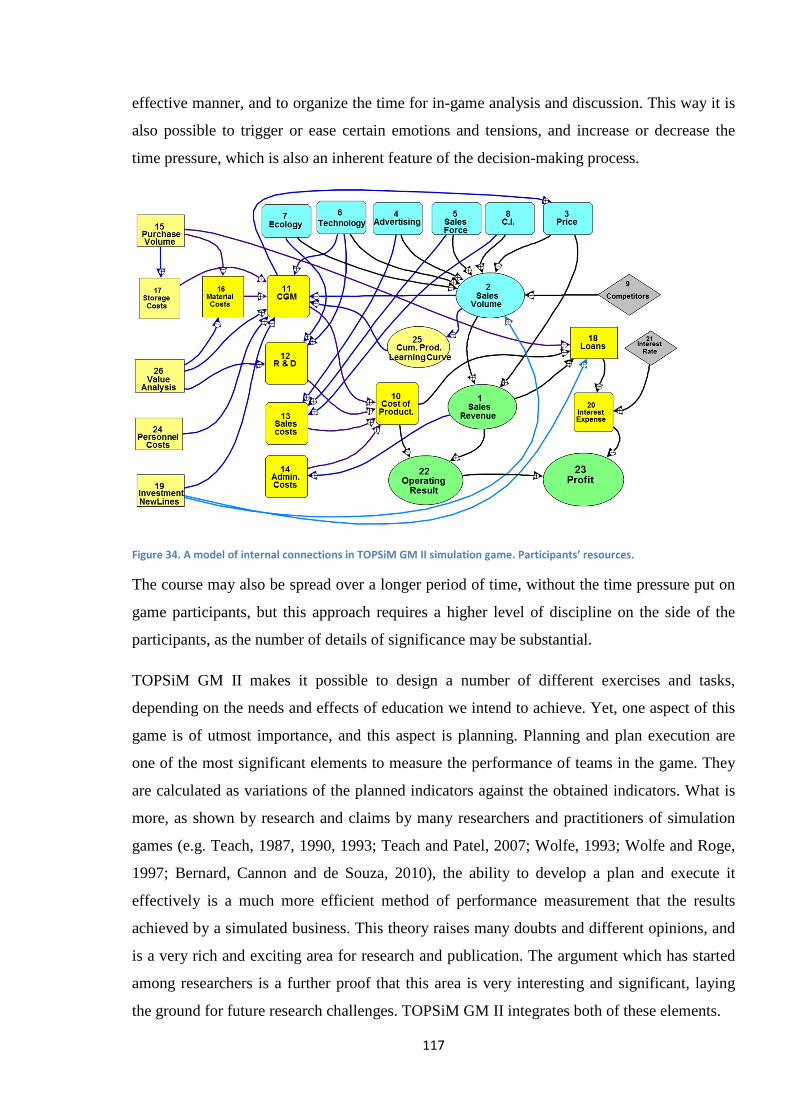
117
effective manner, and to organize the time for in-game analysis and discussion. This way it is
also possible to trigger or ease certain emotions and tensions, and increase or decrease the
time pressure, which is also an inherent feature of the decision-making process.
Figure 34. A model of internal connections in TOPSiM GM II simulation game. Participants’ resources.
The course may also be spread over a longer period of time, without the time pressure put on
game participants, but this approach requires a higher level of discipline on the side of the
participants, as the number of details of significance may be substantial.
TOPSiM GM II makes it possible to design a number of different exercises and tasks,
depending on the needs and effects of education we intend to achieve. Yet, one aspect of this
game is of utmost importance, and this aspect is planning. Planning and plan execution are
one of the most significant elements to measure the performance of teams in the game. They
are calculated as variations of the planned indicators against the obtained indicators. What is
more, as shown by research and claims by many researchers and practitioners of simulation
games (e.g. Teach, 1987, 1990, 1993; Teach and Patel, 2007; Wolfe, 1993; Wolfe and Roge,
1997; Bernard, Cannon and de Souza, 2010), the ability to develop a plan and execute it
effectively is a much more efficient method of performance measurement that the results
achieved by a simulated business. This theory raises many doubts and different opinions, and
is a very rich and exciting area for research and publication. The argument which has started
among researchers is a further proof that this area is very interesting and significant, laying
the ground for future research challenges. TOPSiM GM II integrates both of these elements.
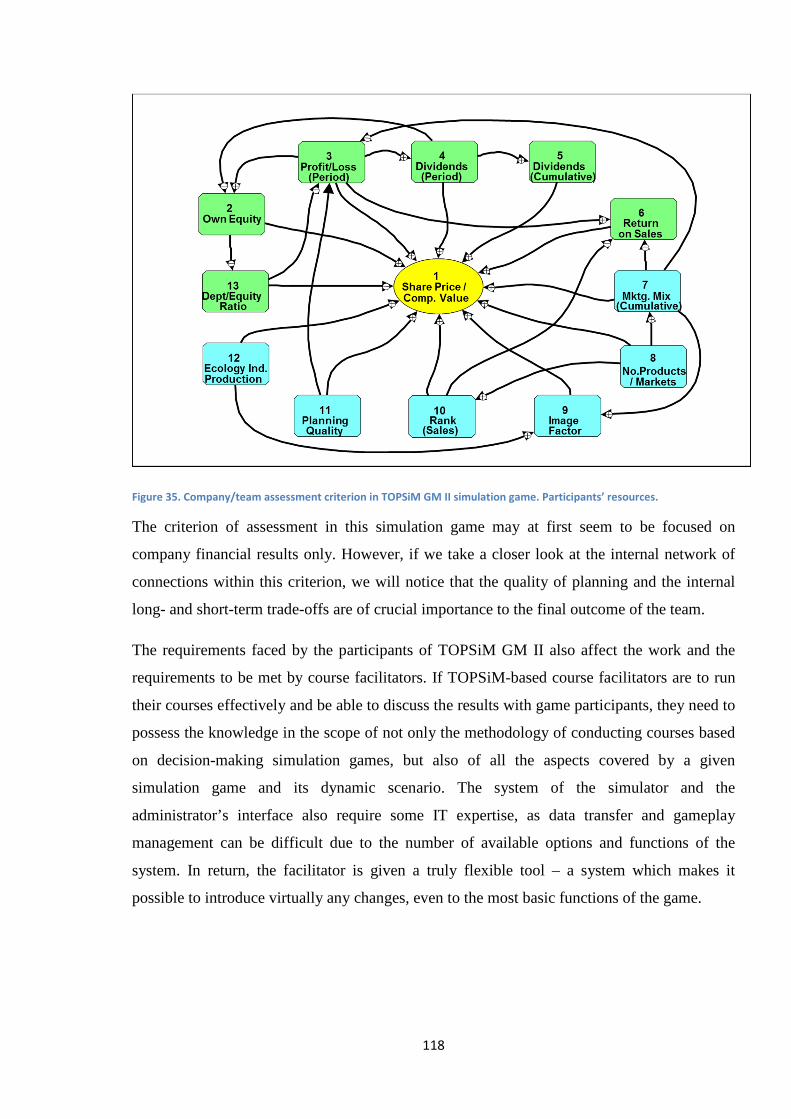
118
Figure 35. Company/team assessment criterion in TOPSiM GM II simulation game. Participants’ resources.
The criterion of assessment in this simulation game may at first seem to be focused on
company financial results only. However, if we take a closer look at the internal network of
connections within this criterion, we will notice that the quality of planning and the internal
long- and short-term trade-offs are of crucial importance to the final outcome of the team.
The requirements faced by the participants of TOPSiM GM II also affect the work and the
requirements to be met by course facilitators. If TOPSiM-based course facilitators are to run
their courses effectively and be able to discuss the results with game participants, they need to
possess the knowledge in the scope of not only the methodology of conducting courses based
on decision-making simulation games, but also of all the aspects covered by a given
simulation game and its dynamic scenario. The system of the simulator and the
administrator’s interface also require some IT expertise, as data transfer and gameplay
management can be difficult due to the number of available options and functions of the
system. In return, the facilitator is given a truly flexible tool – a system which makes it
possible to introduce virtually any changes, even to the most basic functions of the game.
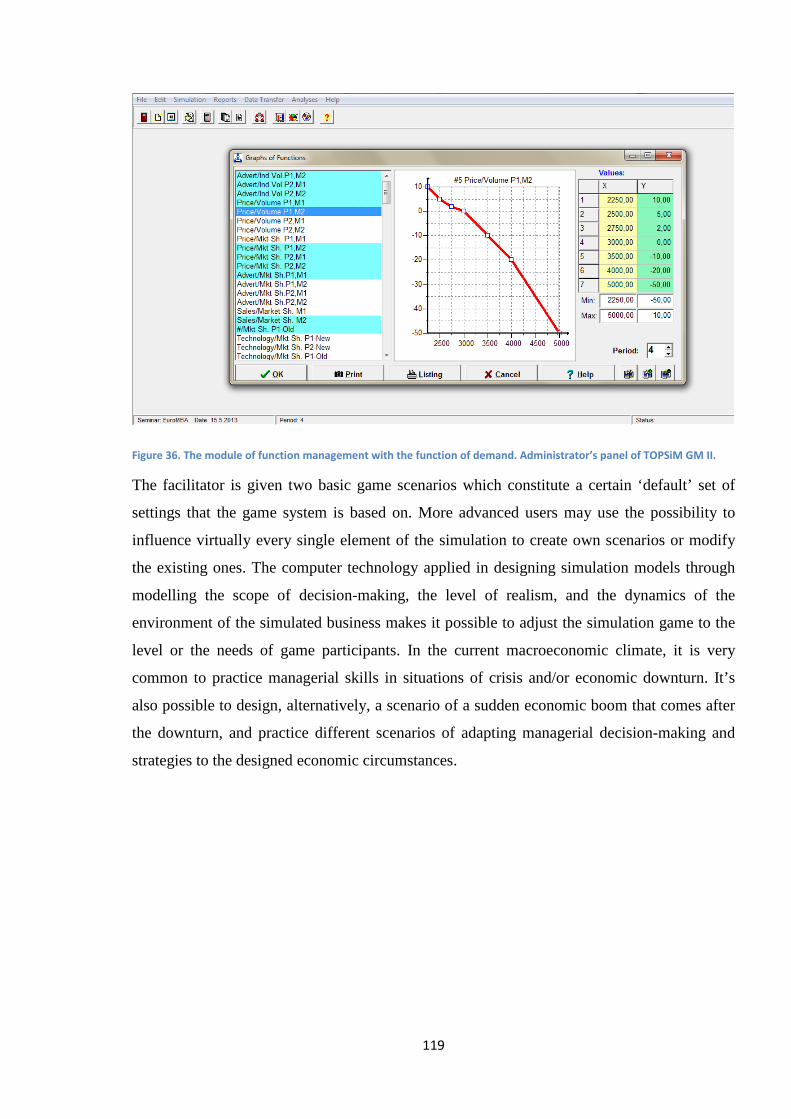
119
Figure 36. The module of function management with the function of demand. Administrator’s panel of TOPSiM GM II.
The facilitator is given two basic game scenarios which constitute a certain ‘default’ set of
settings that the game system is based on. More advanced users may use the possibility to
influence virtually every single element of the simulation to create own scenarios or modify
the existing ones. The computer technology applied in designing simulation models through
modelling the scope of decision-making, the level of realism, and the dynamics of the
environment of the simulated business makes it possible to adjust the simulation game to the
level or the needs of game participants. In the current macroeconomic climate, it is very
common to practice managerial skills in situations of crisis and/or economic downturn. It’s
also possible to design, alternatively, a scenario of a sudden economic boom that comes after
the downturn, and practice different scenarios of adapting managerial decision-making and
strategies to the designed economic circumstances.
120
4.1.4 Blue Ocean Strategy Simulation
Blue Ocean Strategy Simulation game was developed through cooperation between two
INSEAD professors – Chan Kim and Renee Mouborgne, the creators of Blue Ocean Strategy
(BOS), and the team of StratX – a partner offering coaching and educational trainings to the
majority of companies from the Fortune 500 list (Wardaszko and Wierciński, 2007). StratX
was established in the 1980s by three INSEAD professors, but after some time they went
separate ways to create different simulations and companies. The company’s flagship
products are Markstrat and Markops, which are considered as the European standard in
managerial education on the level of MBA studies. BOSS simulation game is the StratX’s
exclusive product as through cooperation with the authors of the Blue Ocean Strategy theory,
the company was granted exclusive rights to develop, create, and distribute their simulation
game based on the BOS concept. BOSS simulation game is available in two versions – one to
be installed locally on a PC (introduced in 2007), and the other offered as a browser-based
system (introduced in 2010); however, both of these versions require access to the Internet to
be played. The author of the paper has also contributed to the development of this game, as in
2007, he was involved in beta-testing of this product together with prof. Bielecki and students
from KU’s Academic Society for Decision Games ‘Decision-Makers’, and many of the
remarks and comments made during those tests were included in later versions of the game.
The reason to include BOSS into this paper is the unique character of the game. In the vast
majority of cases, the knowledge which simulation games are based on is a conglomerate of
knowledge from different areas of economics. Yet, BOSS is a representation of only one
theory, and the tools featured in the game are also unique and typical of only this single
theory. The simulation aims mainly to develop the ability to apply the principles of Blue
Ocean Strategy on the basis of information included in the game and based on own
knowledge, experience, and business intuition.
The simulation is based on a case-study scenario of the market of video game consoles.
Players become the board of management of companies which produce and sell game
consoles. They have three competitors who aggressively attempt to increase their market
share on a slowly decreasing (sales- and profitability-wise) market. The goal of the players is
to develop a unique strategy for their companies, one which would go beyond the framework
of standard rules of competition and industry structures. The simulation covers strategic
decisions to be made in the scope of product, service, and methods of delivery of the product
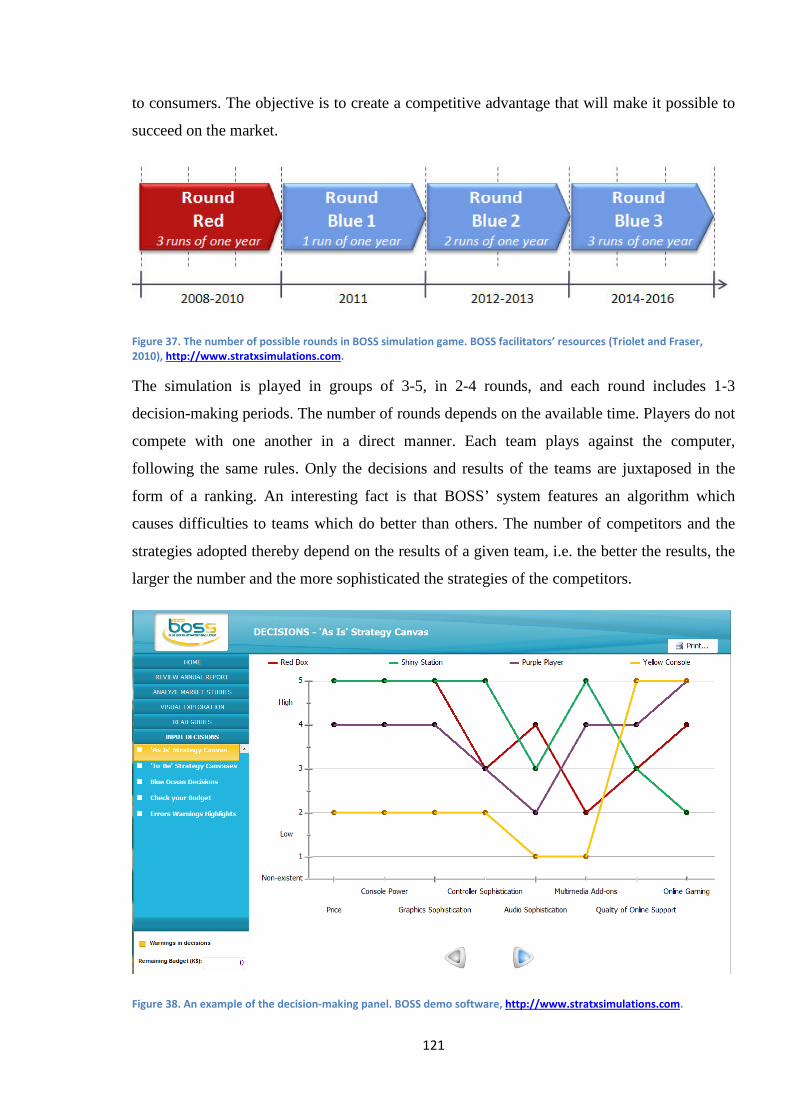
121
to consumers. The objective is to create a competitive advantage that will make it possible to
succeed on the market.
Figure 37. The number of possible rounds in BOSS simulation game. BOSS facilitators’ resources (Triolet and Fraser,
2010), http://www.stratxsimulations.com.
The simulation is played in groups of 3-5, in 2-4 rounds, and each round includes 1-3
decision-making periods. The number of rounds depends on the available time. Players do not
compete with one another in a direct manner. Each team plays against the computer,
following the same rules. Only the decisions and results of the teams are juxtaposed in the
form of a ranking. An interesting fact is that BOSS’ system features an algorithm which
causes difficulties to teams which do better than others. The number of competitors and the
strategies adopted thereby depend on the results of a given team, i.e. the better the results, the
larger the number and the more sophisticated the strategies of the competitors.
Figure 38. An example of the decision-making panel. BOSS demo software, http://www.stratxsimulations.com.
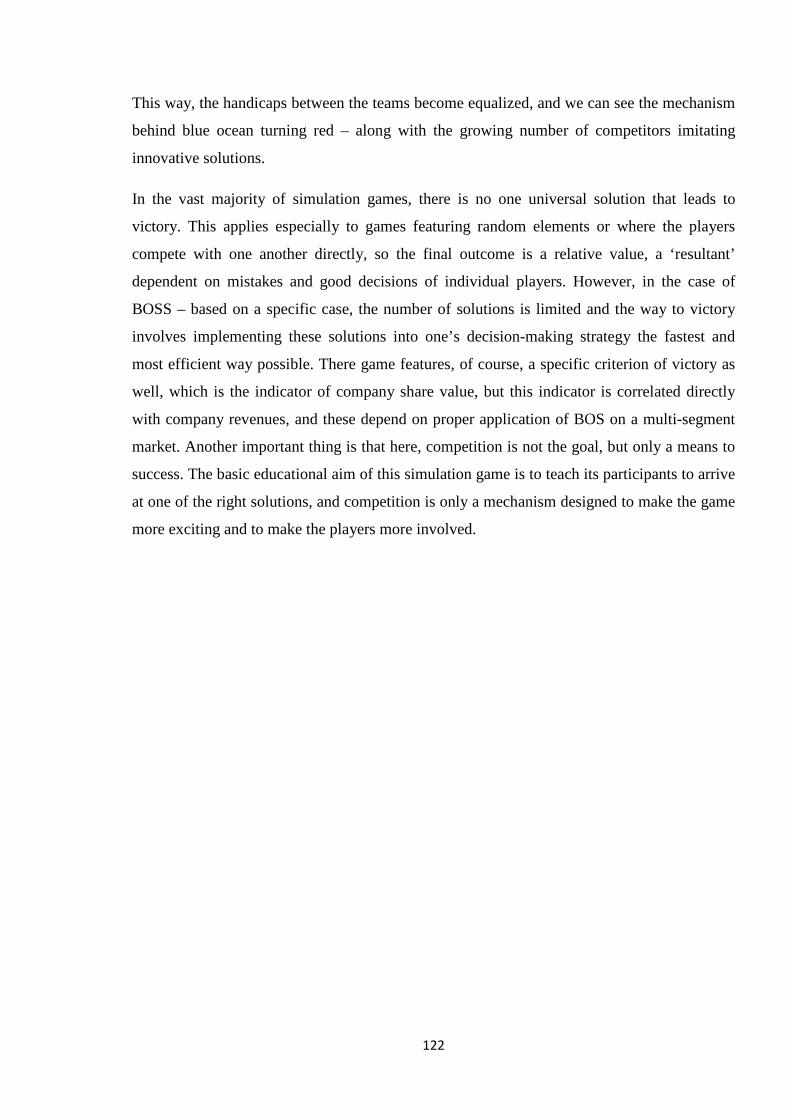
122
This way, the handicaps between the teams become equalized, and we can see the mechanism
behind blue ocean turning red – along with the growing number of competitors imitating
innovative solutions.
In the vast majority of simulation games, there is no one universal solution that leads to
victory. This applies especially to games featuring random elements or where the players
compete with one another directly, so the final outcome is a relative value, a ‘resultant’
dependent on mistakes and good decisions of individual players. However, in the case of
BOSS – based on a specific case, the number of solutions is limited and the way to victory
involves implementing these solutions into one’s decision-making strategy the fastest and
most efficient way possible. There game features, of course, a specific criterion of victory as
well, which is the indicator of company share value, but this indicator is correlated directly
with company revenues, and these depend on proper application of BOS on a multi-segment
market. Another important thing is that here, competition is not the goal, but only a means to
success. The basic educational aim of this simulation game is to teach its participants to arrive
at one of the right solutions, and competition is only a mechanism designed to make the game
more exciting and to make the players more involved.
123
4.2 Application of management theory in simulation games on selected
examples
In this sub-chapter, the author of the paper would like to show how the knowledge in the
scope of management is placed in simulation games and then transferred and passed on to
game participants in their process of education. To this end, the author analyzes a set of
chosen elements featured in selected simulation games.
4.2.1 SysTeamsChange
The first simulation game the author would like to analyze is SysTeamsChange by Kriz and
Hanse (2012). The author localized and translated the game into Polish, becoming the co-
author of its Polish version, which granted him the right and permission of the authors of the
original and of the game’s distributor – Riva-Training GmbH, based in Munich, to publish an
elements of this game in this paper. The game was selected also because of the fact that as a
functional simulation game, it is played as a management game (Bielecki, 1999). It is thus
able to provide its players with knowledge strictly in the scope of management, without
evoking a sense of limitation or artificiality.
The game was designed to teach change management in theory and in practice, for both
professional and academic needs. SysTeamsChange (STC) is the answer to the growing need
for quick and effective changes in organizations, and to the increasing significance of
management in today’s world. The macro scale of social, technological, demographic, and
political changes forces organizations to implement changes on the micro level. The growing
dynamics of the environment triggers quicker changes inside organizations (Kriz amd Hanse
2012 after Schuler, 1990). Combined with the increasing complexity of contemporary
business operations and the unpredictability of the direction and dynamics of changes, all this
makes organizations face bigger and bigger challenges. That is why the aim of change
management of today is to create ordered structures and stable processes for the environment
of constant organizational changes and adjustments (Kriz and Hanse 2012: 10 after Doppler
and Lauterburg, 2002). The whole idea of STC is, in fact, centered on this methodology. It is
also worth mentioning that the selection of theory for such complex simulation is not easy.
There have emerged a number of theories on change management since the 1940s, and the
authors of the game had to opt for a solution that would fit the European culture best.
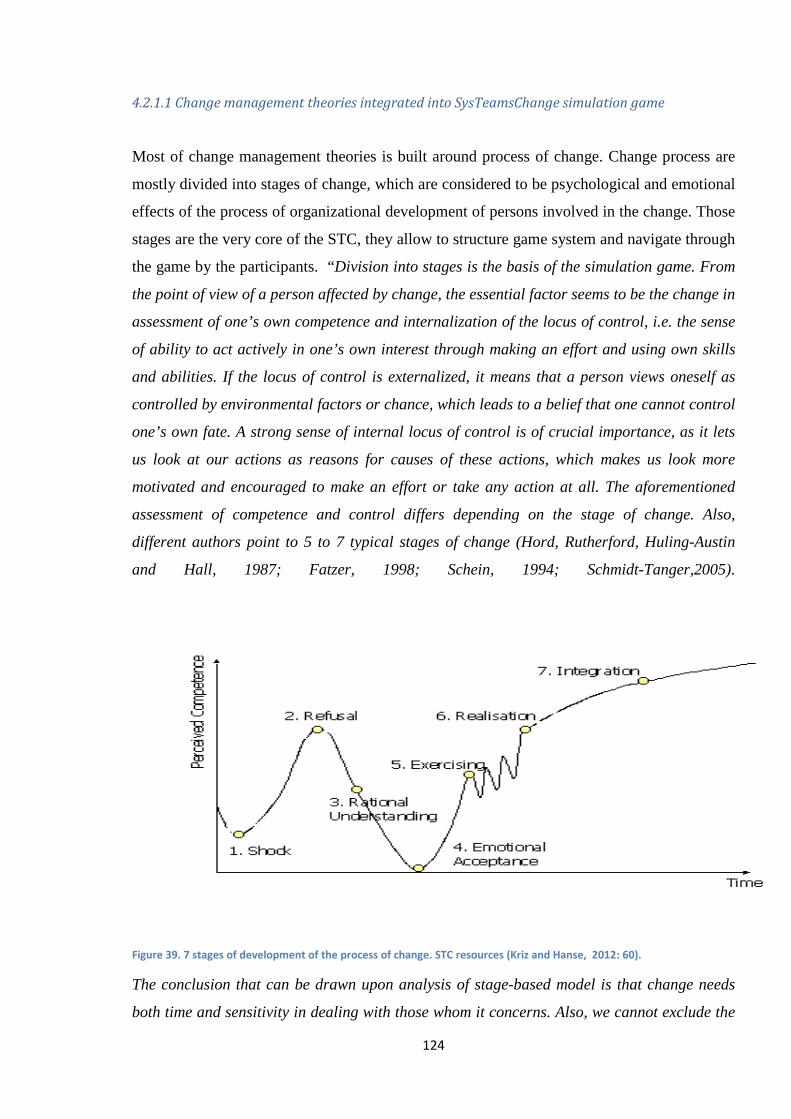
124
4.2.1.1 Change management theories integrated into SysTeamsChange simulation game
Most of change management theories is built around process of change. Change process are
mostly divided into stages of change, which are considered to be psychological and emotional
effects of the process of organizational development of persons involved in the change. Those
stages are the very core of the STC, they allow to structure game system and navigate through
the game by the participants. “Division into stages is the basis of the simulation game. From
the point of view of a person affected by change, the essential factor seems to be the change in
assessment of one’s own competence and internalization of the locus of control, i.e. the sense
of ability to act actively in one’s own interest through making an effort and using own skills
and abilities. If the locus of control is externalized, it means that a person views oneself as
controlled by environmental factors or chance, which leads to a belief that one cannot control
one’s own fate. A strong sense of internal locus of control is of crucial importance, as it lets
us look at our actions as reasons for causes of these actions, which makes us look more
motivated and encouraged to make an effort or take any action at all. The aforementioned
assessment of competence and control differs depending on the stage of change. Also,
different authors point to 5 to 7 typical stages of change (Hord, Rutherford, Huling-Austin
and Hall, 1987; Fatzer, 1998; Schein, 1994; Schmidt-Tanger,2005).
Figure 39. 7 stages of development of the process of change. STC resources (Kriz and Hanse, 2012: 60).
The conclusion that can be drawn upon analysis of stage-based model is that change needs
both time and sensitivity in dealing with those whom it concerns. Also, we cannot exclude the
125
possibility that every change differs in terms of energy and pace. The model should help
acknowledge that some level of defensiveness and resistance is natural and triggered by
psychological behavioral patterns developed over thousands of years, and cannot – or even
should not – be changed. A rational attitude to the regularly recurring, instinctive behavior –
even if such behavior appears to be negative and destructive – involves constructive approach
to all those responsible for change, regardless of whether we are to deal with a top manager,
an external consultant, or the agent of the change” Kriz and Hanse 2012: 14).
The aforesaid seven stages – shock, rejection, rational understanding, emotional acceptance,
practice, realization, and integration – are all integrated into the simulation.
Resistance to changes have been implanted in the 7 stages of the simulation model . Other
models of behavior have also been taken into consideration and implemented into the
simulation system, which makes able to see the cause-and-effect relationships in the behavior
of different actors (Doppler and Lauterburg, 2000; Doppler, Fuhrmann and Lebbe-Waschke,
2002; Graf-Götz and Glatz, 2001). Another element taken into account in modelling actors’
behavior in simulation is the model of diffusion by Rogers (1983). The diffusion theory is
associated with the (planned) popularization of innovative behavior. Given that knowledge,
we can differentiate several typical adopter types who differ in terms of their attitude to
change and their influence on the process of change. The most common types are (Kriz and
Hanse 2012: 66):
- innovators – they are very open to changes, willing to try new ideas and methods,
inventive, involved, motivated, and ready to take the risk;
- early adopters, or leaders – open to changes, though not as enthusiastic as innovators;
they are more careful and composed, because they think about the impact of changes
on the whole system, and want to implement changes in a more careful way;
- early majority – (non-engaged) sympathizers, rather passive at first, though not
against the changes – provided that they don’t require too much effort and a change of
behavior;
- late majority – skeptical and hesitant, reacting with resistance; they are prone to
external motivation (stimulation) or may ‘succumb’ later, influenced by peer pressure
to some extent. They give in to changes to as small extent as possible, in order to
remain unnoticed;
126
- latecomers – also defined as resistors. They defy changes in an overt or covert way,
expressing strong resistance. They are by default against any innovations, remain in
isolation and get to be accepted or treated seriously very rarely.
All of those basic types of behavior have been integrated into the model of the simulation
game. Virtual characters behave according to the above categories, and this is noticeable to
some extent in the simulation.
Another theory strongly integrated with the simulation game is learning organization (Senge
et al. 1997). The key are of this theory is the ability of organizational learning, which affects
both individual competence and systems of values, but also prominent ideas, concepts and
methods, as well as new organizational structures. Most of those activates is usually team-
based. The five disciplines brought by Senge (1990, 1997)v are: shared vision, exchange of
individual mental models, team learning, personal mastery, and systems thinking (Schley
1998, Argyris and Schön 1999). Such organizations (companies, schools, administrative units,
etc.) are able to adapt quicker to the on-going changes and help define their own pace of
changes taking place in their environment. The notion of learning organization is especially
important for the existing organizations for two reasons. The first of them is that teamwork
and collective learning are based on realization of the five aforementioned elements; there are
also certain connections between them and collective competence. The second is that
managing collective knowledge and common learning are prerequisite for the whole
organization to learn and grow. STC offers that on two levels. The first level is the sole form
of the simulation game involving teamwork activity and participation in active decision-
making, discussion, and negotiation. The second level is the simulation game itself,
simulating actors’ behavior; what is important is that not only individuals, but also formal and
informal social networks are simulated.
STC simulation game offers 42 actions which the participants may take according to game
principles. These activities have been constructed and implemented based on selected change
management theories, as well as on the game authors’ experience with research, case-studies,
and consulting. The models presented below form the basis for activity selection during
simulation; these are models by (Kriz and Hanse 2012: 16-18):
1. Lewin (1963)
- “Unfreezing”, disintegration, thaw
- “Moving”, change, movement

127
- “Refreezing”, stabilization, generalization
2. Lippitt et al. (1958)
- Diagnosis of the problem, generating the need for change
- Assessment of motivation to and capacity for change, creation of client-change agent
relation
- Assessment of change agent’s resources and motivation, including involvement,
capacity, resistance; identification of the aim
- Selection of progressive change objectives, preparation of the action plan and defining
the strategy, analyzing alternative ways, preparation of change implementation plan
- Defining the role of the change agent to avoid misunderstandings, testing changes
- Maintaining changes, communication, coordination, monitoring the design of changes
in terms of progress, consolidation and generalization of changes
- Gradual retreat from the help relationship, termination of the client-change agent
relations; changes become a part of organizational culture, and become long-lasting
and durable through creation of principles and guidelines to be applied and followed.
3. Sievers (1978)
- Contact
- Preliminary discussions
- Agreement
- Data gathering
- Feedback on data
- Diagnosis
- Action planning and implementation
- Success control
4. Kotter (1996)
- Creating a sense of urgency to introduce changes; describing the needs for changes
- Creating a guiding coalition; finding allies and sympathizers
- Developing a vision; defining clear objectives and a strategy to implement this vision
- Communicating the change vision
- Removing obstacles, empowering others to act and overcome resistance
- Creating short-term wins
- Utilization of the changes; consolidation and continuation
- Anchoring the changes in the corporate culture, institutionalizing new ways of
operation
128
5. Becker and Langosch (1995)
- Defining the problem, gathering data, describing the situation
- Analyzing and defining problems, specifying the goals
- Planning, looking for ways to solutions, action planning, developing the steps of
changes
- Acting, setting and executing actions, developing the plan of design, change testing,
introducing innovations step by step and consolidating them; institutionalization of
changes
- Evaluation, analysis of results and methodologies, result control, process analysis
6. Dalin, Rolff and Buchen (1996), “IDP”
- Initial move
- Accession
- Steering committee
- Contract
- Data collection
- Common analysis and feedback on the collected data
- Specifying the goal and reaching an agreement, setting priorities
- Design planning and steps
- Implementation
- Evaluation
7. Pieper and Schley (1983)
- Preparation and contact phase: taking care of transparency surrounding the
development of the school, discussing the needs, attitudes, and expectations of the
employees
- Decision and contract phase: employees’ agreement, defining the steps of the process
of development of the school
- Problem diagnosis phase: analysis of the current situation, and of strengths and
weaknesses of the school
- Change objective development phase: formulation of the feasible objectives for the
needs of further development
- Constitution phase: introduction of the most important objectives to operational level
(operationalization), looking for solutions, defining the final steps
- Action phase: gradual implementation and realization of the planned innovations and
changes
129
- Evaluation: monitoring the taken actions (with respect to the process and the results)
- Routine follow-up: finding new objectives for further development
8. Glazinski (2007)
- Analysis of the status quo
- Defining the objective
- Planning the steps
- Implementation of actions
- Monitoring
- Control
The abovementioned 42 actions have internal structures and logical systems, which can be
assigned to particular phases or logical consequences of events. However, there is no one
correct solution or one appropriate sequence of actions in the reality of the simulation game.
Of course, the game does feature certain basic activities that need to be performed in the right
order without which it is impossible to succeed. The teams participating in the game do not
know this order, but this is actually one of the primary aims of courses based on this game –
to teach how to discover the “right” sequence of activities and events. What is more, the
process of discovering is a strong driving force behind theory analysis and putting the gained
knowledge into practice through making decisions and monitoring the results.
4.2.1.2 Game principles and gameplay of STC simulation game
STC simulation game has been designed to be played over 1-5 training days. Optimally, it
should be played in 2.5-3 days. Any time shorter than that requires omission of certain tasks
and activities that might be performed during the course. A longer time of gameplay (5 days)
makes it possible not only to play the simulation itself and engage participants in
complementary exercises, but also to run a series of additional activities and mini-games
which aim to improve communication and teamwork of the participating groups. Such forms
of additional activities are especially valuable if this simulation game is addressed to a
professional environment or used in a situation when the participants do not know one
another, and one of the goals of the training is team building and integration (Kriz, 2003).
STC simulation game is very flexible when it comes to the number of participants. It has been
designed to be played in teams of 4-7. Owing to the fact that players do not compete with one
another in a direct way, the number of games may be cloned from 1 to a virtually infinite
130
quantity. In the case of a larger number of teams there is a need for a respectively larger
number of facilitators in order to ensure optimal workflow with teams. The optimal number of
teams to be assigned to one experienced facilitator is 4 to 5. The target groups of this game –
used in a professional setting – are management staff, teams responsible for changes within an
organization, and HR staff. What is more, knowledge in the scope of change management is
not prerequisite to participate effectively in this simulation game.
Game participants assume the role of a group of change agents advising the management
board of a company in the process of organizational change. Their goal is to lead the company
through the process of change and to increase the involvement of company employees in that
process. This goal becomes more attainable with the growth of the number of people on or
near the field of integration phase.
SysTeamsChange is a manual-computer game (Matera, Pańkow and Wacha, 1983); in other
words, it is a hybrid of board game and computer game. Game participants play on a board
with pawns symbolizing the actors.
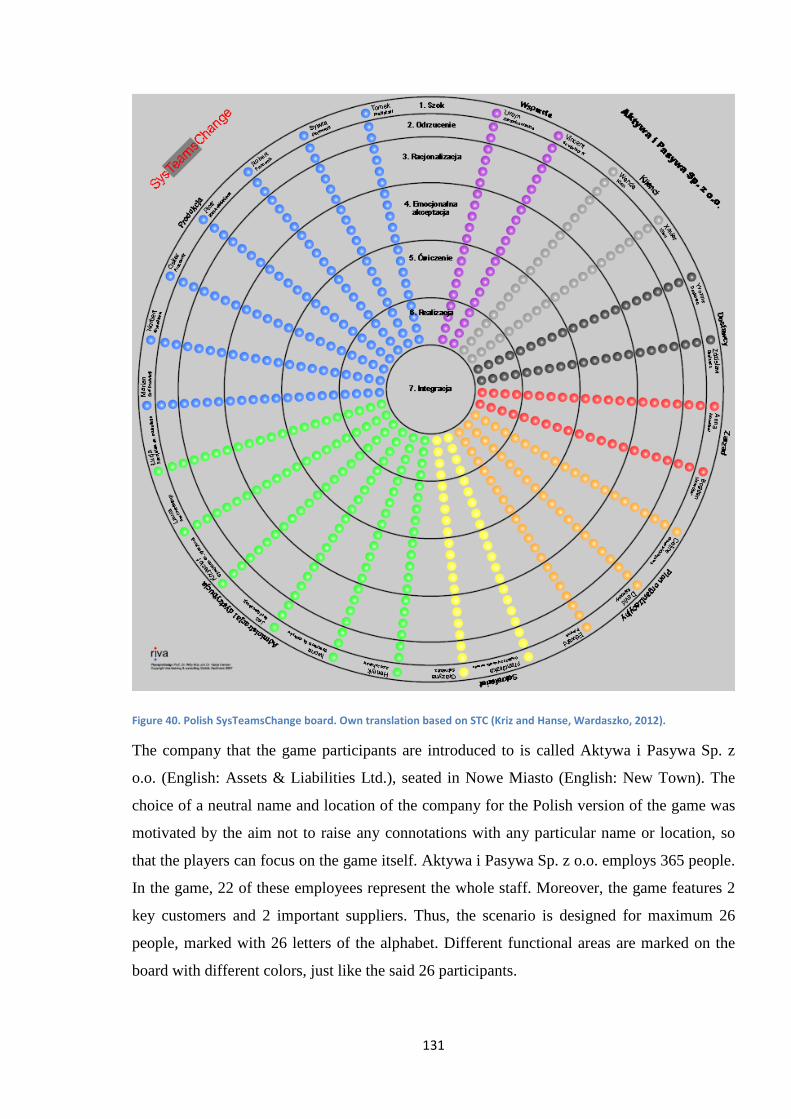
131
Figure 40. Polish SysTeamsChange board. Own translation based on STC (Kriz and Hanse, Wardaszko, 2012).
The company that the game participants are introduced to is called Aktywa i Pasywa Sp. z
o.o. (English: Assets & Liabilities Ltd.), seated in Nowe Miasto (English: New Town). The
choice of a neutral name and location of the company for the Polish version of the game was
motivated by the aim not to raise any connotations with any particular name or location, so
that the players can focus on the game itself. Aktywa i Pasywa Sp. z o.o. employs 365 people.
In the game, 22 of these employees represent the whole staff. Moreover, the game features 2
key customers and 2 important suppliers. Thus, the scenario is designed for maximum 26
people, marked with 26 letters of the alphabet. Different functional areas are marked on the
board with different colors, just like the said 26 participants.
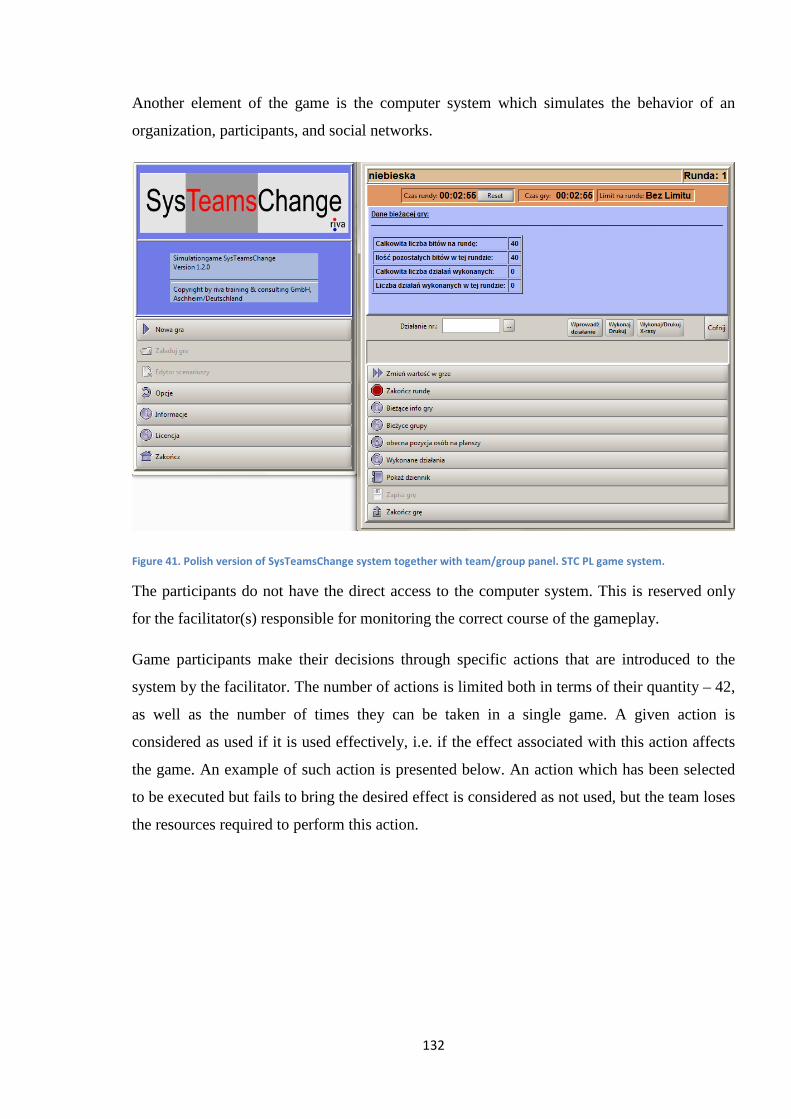
132
Another element of the game is the computer system which simulates the behavior of an
organization, participants, and social networks.
Figure 41. Polish version of SysTeamsChange system together with team/group panel. STC PL game system.
The participants do not have the direct access to the computer system. This is reserved only
for the facilitator(s) responsible for monitoring the correct course of the gameplay.
Game participants make their decisions through specific actions that are introduced to the
system by the facilitator. The number of actions is limited both in terms of their quantity – 42,
as well as the number of times they can be taken in a single game. A given action is
considered as used if it is used effectively, i.e. if the effect associated with this action affects
the game. An example of such action is presented below. An action which has been selected
to be executed but fails to bring the desired effect is considered as not used, but the team loses
the resources required to perform this action.
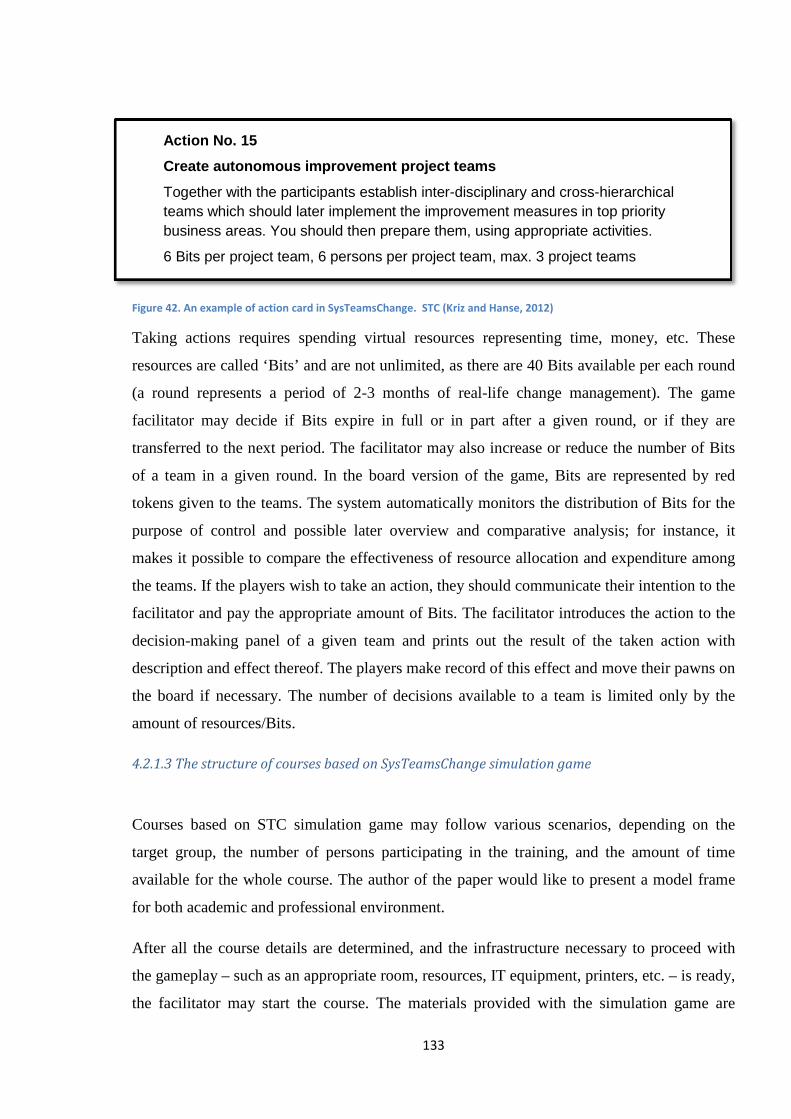
133
Figure 42. An example of action card in SysTeamsChange. STC (Kriz and Hanse, 2012)
Taking actions requires spending virtual resources representing time, money, etc. These
resources are called ‘Bits’ and are not unlimited, as there are 40 Bits available per each round
(a round represents a period of 2-3 months of real-life change management). The game
facilitator may decide if Bits expire in full or in part after a given round, or if they are
transferred to the next period. The facilitator may also increase or reduce the number of Bits
of a team in a given round. In the board version of the game, Bits are represented by red
tokens given to the teams. The system automatically monitors the distribution of Bits for the
purpose of control and possible later overview and comparative analysis; for instance, it
makes it possible to compare the effectiveness of resource allocation and expenditure among
the teams. If the players wish to take an action, they should communicate their intention to the
facilitator and pay the appropriate amount of Bits. The facilitator introduces the action to the
decision-making panel of a given team and prints out the result of the taken action with
description and effect thereof. The players make record of this effect and move their pawns on
the board if necessary. The number of decisions available to a team is limited only by the
amount of resources/Bits.
4.2.1.3 The structure of courses based on SysTeamsChange simulation game
Courses based on STC simulation game may follow various scenarios, depending on the
target group, the number of persons participating in the training, and the amount of time
available for the whole course. The author of the paper would like to present a model frame
for both academic and professional environment.
After all the course details are determined, and the infrastructure necessary to proceed with
the gameplay – such as an appropriate room, resources, IT equipment, printers, etc. – is ready,
the facilitator may start the course. The materials provided with the simulation game are
Action No. 15
Create autonomous improvement project teams
Together with the participants establish inter-disciplinary and cross-hierarchical teams which should later implement the improvement measures in top priority business areas. You should then prepare them, using appropriate activities.
6 Bits per project team, 6 persons per project team, max. 3 project teams
134
divided into elements describing both the practical and the theoretical aspects of change
management. Distributing them gradually and in small amounts reduces the problem of
knowledge complexity, and makes it possible to implement the course according to the
methodology of experiential learning (Kolb and Fry, 1975). This methodology is optional,
though.
3-4 weeks before the course starts, course participants should receive the overall scenario of
the simulation game and the set of game rules, and be asked to become familiar with the
received content. There are about 3 pages to read, so the volume of the content should be
acceptable. Next, 2 weeks before the start, the participants should receive materials with a
description of stages of organizational change, which constitute another several pages.
The day when the course begins, the participants arrive to the training room. It is advised to
start the course with introduction and greetings, and with a series of short ice-breaker games
and plays aimed to build team competencies. Team games and plays are short activities of
open or closed form, which are to help ‘break the ice’ and inspire team communication (Kriz
and Nöbauer, 2006). In an academic setting they are not indispensable, but they are still a
good additional ‘activator’ for course participants. In a professional setting, in turn, they are
of crucial importance, as the help ease the tension and break the stereotypical forms of
behavior and formal relations which may be present in the group.
The stage of team and group games is followed by an introduction to the concept of learning
organization, delivered in the form of a lecture supplemented by a multimedia presentation.
This introduction should not be longer than 60 minutes, and should be followed by a break.
After the break, the participants receive materials with a list of all available actions, and an
action sheet. Next, they are asked to become familiar with all the actions. This can be
followed by an exercise which would require the teams to collate all the actions e.g. according
to Lewin’s model (1963), and then summarize the task with a review of their division and
consequences thereof. Alternatively, it is possible to go straight to the first round of the
simulation game and discuss the model after the round is finished, or move to the issue of
resistance according to Doppler’s theory (2002).
Each round of the simulation game should end with a debriefing in order to make it possible
to share and transfer the simulated experiences and to add meaning to them (Klabbers, 2006).
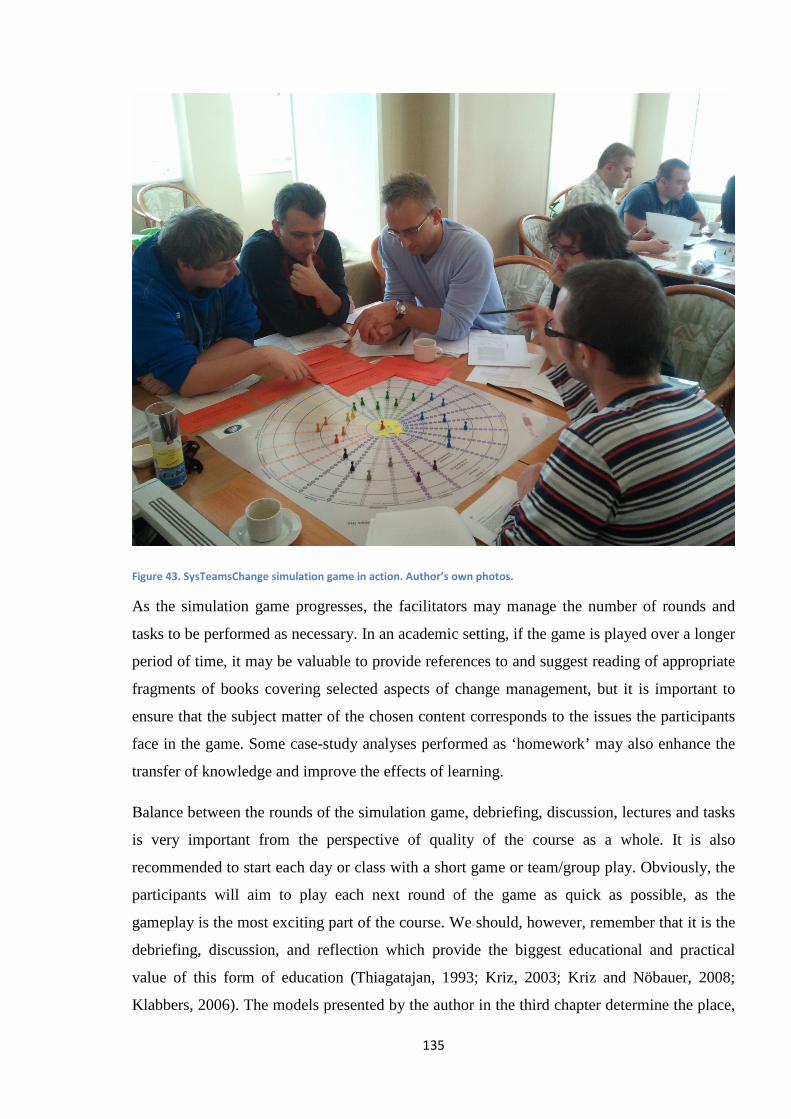
135
Figure 43. SysTeamsChange simulation game in action. Author’s own photos.
As the simulation game progresses, the facilitators may manage the number of rounds and
tasks to be performed as necessary. In an academic setting, if the game is played over a longer
period of time, it may be valuable to provide references to and suggest reading of appropriate
fragments of books covering selected aspects of change management, but it is important to
ensure that the subject matter of the chosen content corresponds to the issues the participants
face in the game. Some case-study analyses performed as ‘homework’ may also enhance the
transfer of knowledge and improve the effects of learning.
Balance between the rounds of the simulation game, debriefing, discussion, lectures and tasks
is very important from the perspective of quality of the course as a whole. It is also
recommended to start each day or class with a short game or team/group play. Obviously, the
participants will aim to play each next round of the game as quick as possible, as the
gameplay is the most exciting part of the course. We should, however, remember that it is the
debriefing, discussion, and reflection which provide the biggest educational and practical
value of this form of education (Thiagatajan, 1993; Kriz, 2003; Kriz and Nöbauer, 2008;
Klabbers, 2006). The models presented by the author in the third chapter determine the place,
136
the role, and the importance of debriefing in the process of experiential learning. From a
practical point of view, the game facilitator plays a crucial role exactly at the stage of
debriefing. Debriefing should be prepared in advance and feature a general structure and a set
of questions that the facilitator should ask to inspire reflection and discussion. According to
the theory on and practice of debriefing (Kriz and Hanse, 2012: 32) simulation game
facilitators should follow these four principles:
• Ask questions and listen to answers – following a debriefing structure, game
facilitators should ask important questions and motivate game participants to provide
answers to them. The facilitators should avoid answering their own questions, e.g.
they should not define what the participants should learn during the game, but rather
provide slight hints to guide them at the most important issues.
• Tolerance for ambiguity – as opposed to the more classical methods of teaching –
like lectures, the experience and education gained through simulation games is more
individualized and much more unpredictable. Game facilitators should abandon the
common need to control the experiences of the participants and accept their
spontaneous actions and statements.
• Monitoring of behavior – simulation game facilitators should be attentive in
monitoring the behavior of the participants of the game. At the same time, they should
avoid judging their behavior in order not to interfere in the interpretation.
• Time – there should always be enough time for debriefing, so that everyone has a
chance to share their thoughts and opinions. Facilitators should avoid imposing time
pressure or ending the debriefing prematurely.
According to researchers active in the field of learning organization (Senge, 1997; Kriz and
Hanse, 2012), team competencies and a common vision may come to existence only through
shared reflection and discussion.
The materials and the reading list available to the game facilitator center on the issues present
in the simulation game, and are already divided into smaller sections which the participants
can be instructed to read at one time. The standard framework of the simulation game-based
course is rather simple and features: team warm-up, introduction of new elements, simulation
game round, debriefing and discussion, summary. There can be 3 to 5 of such cycles in the
case of this simulation game, but if the game facilitator is more experienced, the game can be
enriched with additional elements like extra team games and plays, exercises, tasks, or
137
presentations by game participants, in order to achieve even better effects of education and
improve the transfer of knowledge.
4.2.1.4 Evaluation of a course based on SysTeamsChange simulation game
Before the author of the paper moves on to analysis of the methods of evaluation of the effects
of education through a simulation game-based course, it is important to highlight that this
evaluation will concern academic setting. The author has a rich experience with professional
setting as well, hence the observation that the evaluation of the effects of education in this
setting is very limited, as the needs of organizations ordering such courses are much different
from the needs of academic environment. The author would like to present as broad scope of
methods of evaluation of the effects of teaching as possible.
Evaluation of the effects of education through a STC-based course can be divided into two
areas. The first of them concerns evaluation of the effects of education generated through
activities and tasks performed in relation to the simulation game. The other pertains to
evaluation of the effects of education gained as part of the simulation game.
Evaluation of tasks and activities that may be required of the participants of the game focuses
on assessment of individual and team work performed as part of the assigned tasks. A STC-
based course offers a range of different activities that may be subject to different forms of
assessment. These activities include lectures, reading assignments, team work, team and
individual exercises, discussion, presentations, and writing assignments. There are many more
and less classical methods of assessment to be used for evaluation of the aforesaid activities
and tasks: multiple-choice tests, questionnaires, “peer-to-peer”, evaluation matrices,
presentations, etc. Assignments and exercises may – but do not have to – refer to the content
of the simulation game; for instance, during the gameplay, we may ask the players to group
the actors featured in the simulation game by change adopter types according to the theory of
diffusion of innovations by Rogers (1983) and evaluate the accuracy of their judgment. We
can also give an essay to write on that subject, or prepare a questionnaire.
Evaluation of the effects of education through a simulation game is much more complex than
evaluation of the more standard forms of education. On the one hand, we should evaluate the
progress of simulation game participants, and on the other, we should concentrate on
138
assessment of their ability to comprehend and understand the phenomena they encounter.
Among the theoreticians and practitioners involved actively in research and work in the scope
of studies of the effectiveness of simulation game-based teaching, there is no agreement in
terms of neither the form, nor the criteria of evaluation in decision-making simulation games.
According to the classical school represented by Wolfe (1993a, 1993b, 1993c; Wolfe and
Roge, 1997), the only just criteria of evaluation of team results in a simulation game are the
economic results of the simulated company, which helps retain the realism of the simulation
and the result thereof. On the other hand, supporters of the school emphasizing the quality of
education, represented by Teach (1987, 1989, 1990, 1993a, 1993b, 2007), claim that
evaluation of the effects of teaching through simulation games should focus on the assessment
of the ability and quality of planning measured against the results achieved by a given team,
which makes it possible to follow the progress of the learning curve.
In STC, the idea is to measure the results, the progress, and the decision-making efficiency of
individual teams. The basic method of measurement is the progress of teams in the process of
change implementation. To provide game participants with better visualizations of the
progress of this process, and to increase the excitement arising from direct competition among
teams aiming to succeed, STC authors have introduced visual awards for the reached
milestones. In the German and English version of the game, these are rings, and in the Polish
version – stars; in total, there are 7 stars to get for completing key stages of the process of
change. Of course, it is impossible to finish the process without involvement of simulated
actors, since even the right actions will fail if the actors are not “ready” for them. The effect
of visual representation of progress is a big increase in the level of competition between the
teams – and of the excitement the game provides. This is especially noticeable when one of
the teams gets a star when all teams start from the same level; this leads to a strong motivation
among other teams to decrease the advantage of the leading team.
The level of quality of planning and decision-making efficiency may be measured in STC
based on the expenditure of resources, and on the number of decisions leading to success, i.e.
ones that cause the desired effect as compared to those which do not end with such effect –
and can be thus regarded as failures. These elements can be measured round by round, or
from the perspective of the whole simulation game. Moreover, we can also measure the
positions of actors on the board and the number of those who’ve made it to the integration
stage at the end of the game. All these measures may be integrated into evaluation of
teamwork in STC.
139
Another element that may be used to evaluate the progress and the effects of education is the
evaluation of the debriefing itself. There are several types of debriefing (Kriz and Hanse
2012: 35-36 after Thiagarajan 1993; Kriz and Nöbauer 2002):
• Debriefing without moderation – in this form of debriefing, the facilitator is only a
passive participant. The disadvantage of such solution is high probability of
occurrence of off-topics and a risk of undesirable behaviors. On the other hand, if
game participants see themselves as experts on e.g. change process, then such form
may be much more effective than the moderated version;
• Debriefing with moderation – this is a form of debriefing where the facilitator
assumes the role of the moderator and leader of the course of discussion and
reflection. This form is particularly recommended for groups of lower level of
experience with the process of reflection. Here, the drawback is that there is a risk that
the moderator may dominate the discussion and the participants will not have the
chance to present their own thoughts and opinions. The advantage is that this form
imposes discipline, that all the necessary elements are overviewed, and that the risk of
unwanted behaviors is minimized;
• Video-aided debriefing – here, team actions, behaviors, and decisions are discussed
and analyzed based on video records made during the gameplay. Short fragments of
the recorded material are shown and then discussed, which grants instant and precise
information about the way the analyzed content is seen by others;
• Written debriefing with result recording – this form of debriefing requires every
participant to keep a log of events, where e.g. after each round they would write down
their impressions, thoughts, and observations. Next, at the stage of debriefing, the
facilitator is to discuss these notes with each participant;
• Written debriefing with a questionnaire – in this form of debriefing, after – or
instead of – discussion, every course participant receives a questionnaire with open-
ended and multiple-choice questions concerning the educational effects and
knowledge which is supposed to be gained through the course;
• Debriefing with exercise – here, discussion and reflection are followed by an
exercise, e.g. course participants are divided into sub-groups and have to face a list of
issues, or identify decision-making strategies, etc. The outcomes of the discussion are
to be delivered to the facilitator in a written form;
140
• Debriefing with discussion panel – this version of debriefing involves previously-
selected/appointed course participants (e.g. team leaders) participating in discussion
and reflection, and delivering a talk on each of the topics prepared in advance. Not all
course participants have the chance to have a say in this form of debriefing, but it still
works really well in larger groups;
• Debriefing through dialogue – course participants share their experiences and
thoughts in pairs, in the form of e.g. an interview, and then write down the outcomes
and observations from such interviews;
• Team debriefing – a form of debriefing where the facilitator debriefs each team
individually and has to address the asked questions and the raised matters.
The abovementioned list of forms of debriefing is not exhaustive (Kriz and Nöbauer, 2002),
but it does constitute a representative group of methods that can be applied in evaluation of
the effects of educating through STC. The methods which involve evaluation of the effects of
education through written assignments and records are especially interesting. Moreover, these
methods of debriefing are not exclusive and can be applied alternately as part of one course,
depending on the needs and observations of the facilitator.
The final combination of methods of evaluation of the effects of education through
SysTeamsChange simulation game should be a conglomerate of the results of the game itself
and of the activities surrounding the game, depending on the objectives and effects that are to
be achieved by the course and by the facilitators.
141
4.2.2 Hotel Stars
Hotel Stars is a computer aided simulation game created as part of Innovative Programme of
teaching “Economics in practice” implemented by Foundation of Development of Education
Initiatives as part of European Union Priority III High quality of education system, Measure
3.3 Increasing Quality of Education, Sub-measure 3.3.4 Modernization of education content
and methods – competition projects of Human Capital Operational Programme from
01.09.2012 to 31.07.2015. It is a simulation game addressed to secondary school students, for
the purpose of teaching them a completely new subject called “Economics in practice”. The
game is currently at the stage of development and shall be ready by the end of the current
year; its beta version is already available. The aim of this simulation game is to teach
fundamental knowledge in the scope of economics and business – both through the game
itself, as well as through an accompanying teaching program that would be offered with the
game. In this sub-chapter, the author of the paper shows how the knowledge in the scope of
economics is implemented from the model perspective, and how the effectiveness of decision-
making is measured later on.
Hotel Stars was designed based on studies carried out in 3 study groups (Wardaszko and
Jakubowski, 2013):
• Document studies and interviews with a representative of the Ministry of National
Education represented by Centre for Education Development – concerning program
framework and formal requirements.
• Focus group studies including a group of 10 teachers from secondary schools from
north-eastern Poland – focusing on barriers to entry and teachers’ requirements.
• Survey studies carried out in a group of 362 secondary school students – aimed to
learn of the gaming preferences among the target group of the simulation game.
The abovementioned studies are not presented in this paper, as they are excluded from the
main scope of the paper. However, including the representatives of all interest groups into this
project is in line with the latest trends in designing decision-making simulation games.
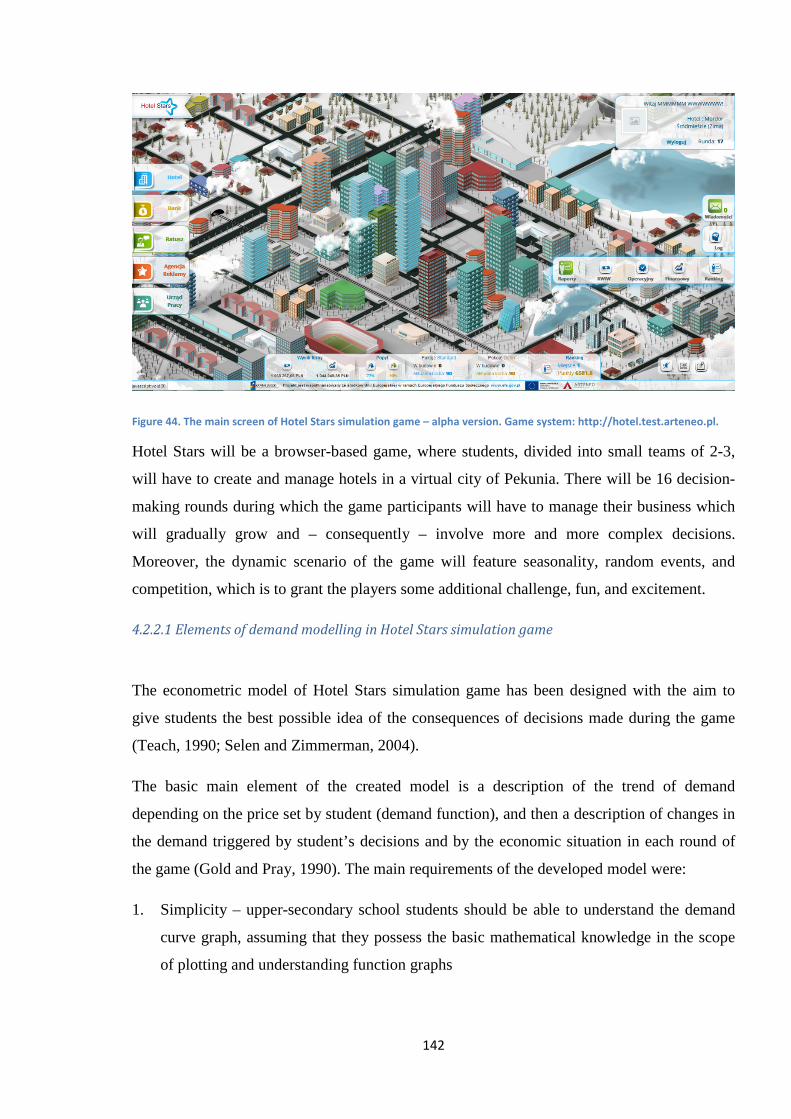
142
Figure 44. The main screen of Hotel Stars simulation game – alpha version. Game system: http://hotel.test.arteneo.pl.
Hotel Stars will be a browser-based game, where students, divided into small teams of 2-3,
will have to create and manage hotels in a virtual city of Pekunia. There will be 16 decision-
making rounds during which the game participants will have to manage their business which
will gradually grow and – consequently – involve more and more complex decisions.
Moreover, the dynamic scenario of the game will feature seasonality, random events, and
competition, which is to grant the players some additional challenge, fun, and excitement.
4.2.2.1 Elements of demand modelling in Hotel Stars simulation game
The econometric model of Hotel Stars simulation game has been designed with the aim to
give students the best possible idea of the consequences of decisions made during the game
(Teach, 1990; Selen and Zimmerman, 2004).
The basic main element of the created model is a description of the trend of demand
depending on the price set by student (demand function), and then a description of changes in
the demand triggered by student’s decisions and by the economic situation in each round of
the game (Gold and Pray, 1990). The main requirements of the developed model were:
1. Simplicity – upper-secondary school students should be able to understand the demand
curve graph, assuming that they possess the basic mathematical knowledge in the scope
of plotting and understanding function graphs
143
2. Complexity – the model shall be complex enough to prevent smarter students from
trivializing their decisions
3. Adequacy – the model should give an ‘as-real-as-possible’ idea of the mechanisms
affecting the shape of demand as influenced by the decisions made during the game and
the simulated conditions
4. Flexibility – the model should be flexible enough to be adapted to variable conditions in
each round, e.g. appearance of competition, changes of the level of operating costs,
seasonality.
Taking all of the above requirements into consideration, it has been decided to use the basic
model of demand function, with a constant price elasticity of demand:
���� = � ∙ ��
where is the price for a room, and, , �are the parameters.
The law of demand states that the function should be decreasing, i.e. t < 0. The values of the
model parameters are dependent on the expected operating costs and the requirements
included in the scenario – especially those concerning the location.
The obtained function is a power function known from mathematics classes, but more
complex than linear model referred to quite often in the literature on the subject (e.g.
Milewski, 2005; Begg, Dornbush and Fischer, 2007; Czarny, 2011). On the other hand, the
game is based on an open model, i.e. the so-called glass-box model (Metera, Pańków and
Wach, 1983). Hence, it is important to make this demand function predictable on the one
hand, and analytically challenging on the other.
The scenario of the game offers three locations: strict city center, downtown area, and
suburbs. The first location involves higher costs, but makes it possible to gain the biggest
profits related to the option of charging more for rooms. The second location grants medium
costs of operation, but also lower revenues than in the strict city center. Hotels in the suburbs
are the cheapest to maintain and manage, but the possibility of gaining bigger profits with
higher prices is obviously smaller. Thus, it has been decided to use three different demand
functions in the model – depending on the location. The obtained functions are to support the
following game strategies:
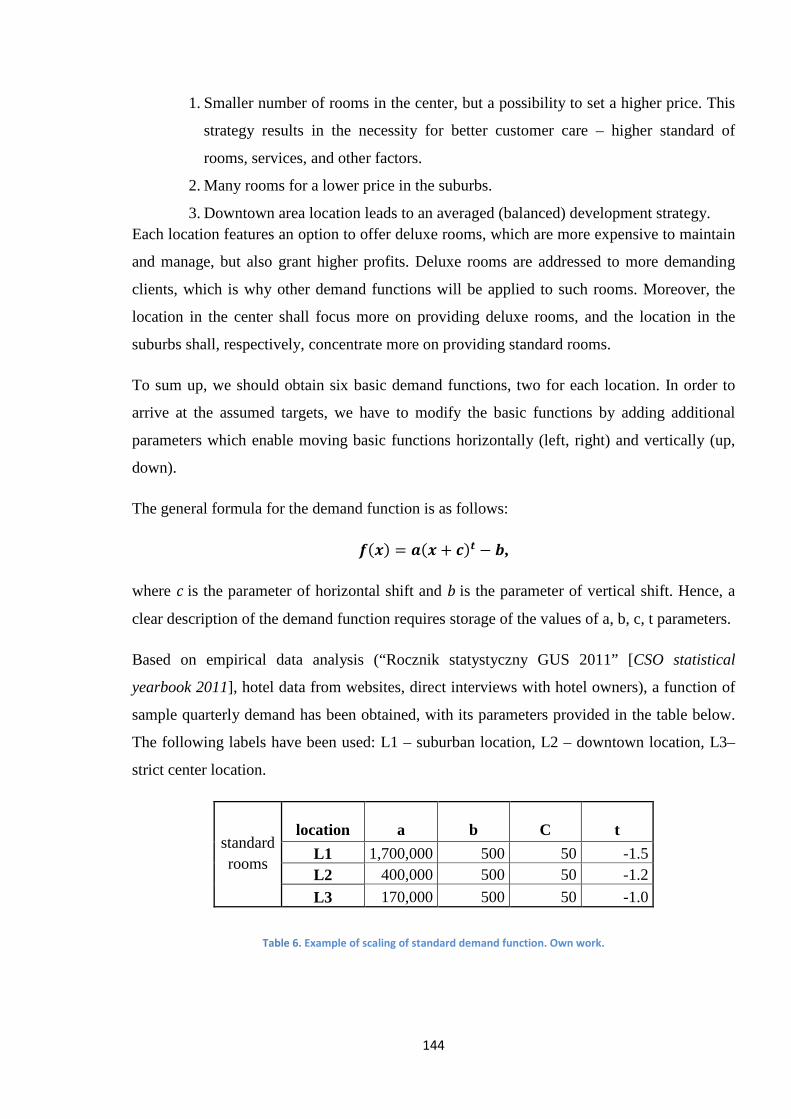
144
1. Smaller number of rooms in the center, but a possibility to set a higher price. This
strategy results in the necessity for better customer care – higher standard of
rooms, services, and other factors.
2. Many rooms for a lower price in the suburbs.
3. Downtown area location leads to an averaged (balanced) development strategy. Each location features an option to offer deluxe rooms, which are more expensive to maintain
and manage, but also grant higher profits. Deluxe rooms are addressed to more demanding
clients, which is why other demand functions will be applied to such rooms. Moreover, the
location in the center shall focus more on providing deluxe rooms, and the location in the
suburbs shall, respectively, concentrate more on providing standard rooms.
To sum up, we should obtain six basic demand functions, two for each location. In order to
arrive at the assumed targets, we have to modify the basic functions by adding additional
parameters which enable moving basic functions horizontally (left, right) and vertically (up,
down).
The general formula for the demand function is as follows:
���� = ��� + ��� − �,
where �is the parameter of horizontal shift and �is the parameter of vertical shift. Hence, a
clear description of the demand function requires storage of the values of a, b, c, t parameters.
Based on empirical data analysis (“Rocznik statystyczny GUS 2011” [CSO statistical
yearbook 2011], hotel data from websites, direct interviews with hotel owners), a function of
sample quarterly demand has been obtained, with its parameters provided in the table below.
The following labels have been used: L1 – suburban location, L2 – downtown location, L3–
strict center location.
standard rooms
location a b C t
L1 1,700,000 500 50 -1.5 L2 400,000 500 50 -1.2
L3 170,000 500 50 -1.0
Table 6. Example of scaling of standard demand function. Own work.
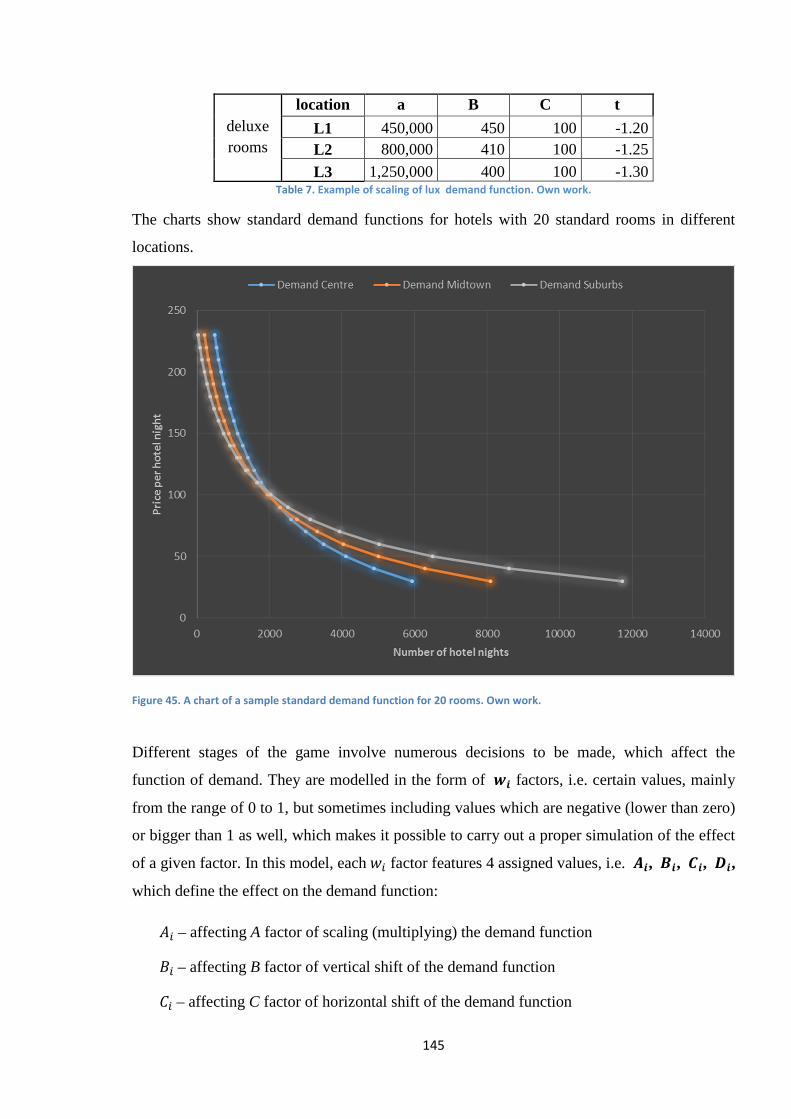
145
deluxe rooms
location a B C t
L1 450,000 450 100 -1.20 L2 800,000 410 100 -1.25
L3 1,250,000 400 100 -1.30 Table 7. Example of scaling of lux demand function. Own work.
The charts show standard demand functions for hotels with 20 standard rooms in different
locations.
Figure 45. A chart of a sample standard demand function for 20 rooms. Own work.
Different stages of the game involve numerous decisions to be made, which affect the
function of demand. They are modelled in the form of �� factors, i.e. certain values, mainly
from the range of 0 to 1, but sometimes including values which are negative (lower than zero)
or bigger than 1 as well, which makes it possible to carry out a proper simulation of the effect
of a given factor. In this model, each�� factor features 4 assigned values, i.e. ��, ��, ��, ��,
which define the effect on the demand function:
�� – affecting A factor of scaling (multiplying) the demand function
��– affecting B factor of vertical shift of the demand function
��– affecting C factor of horizontal shift of the demand function
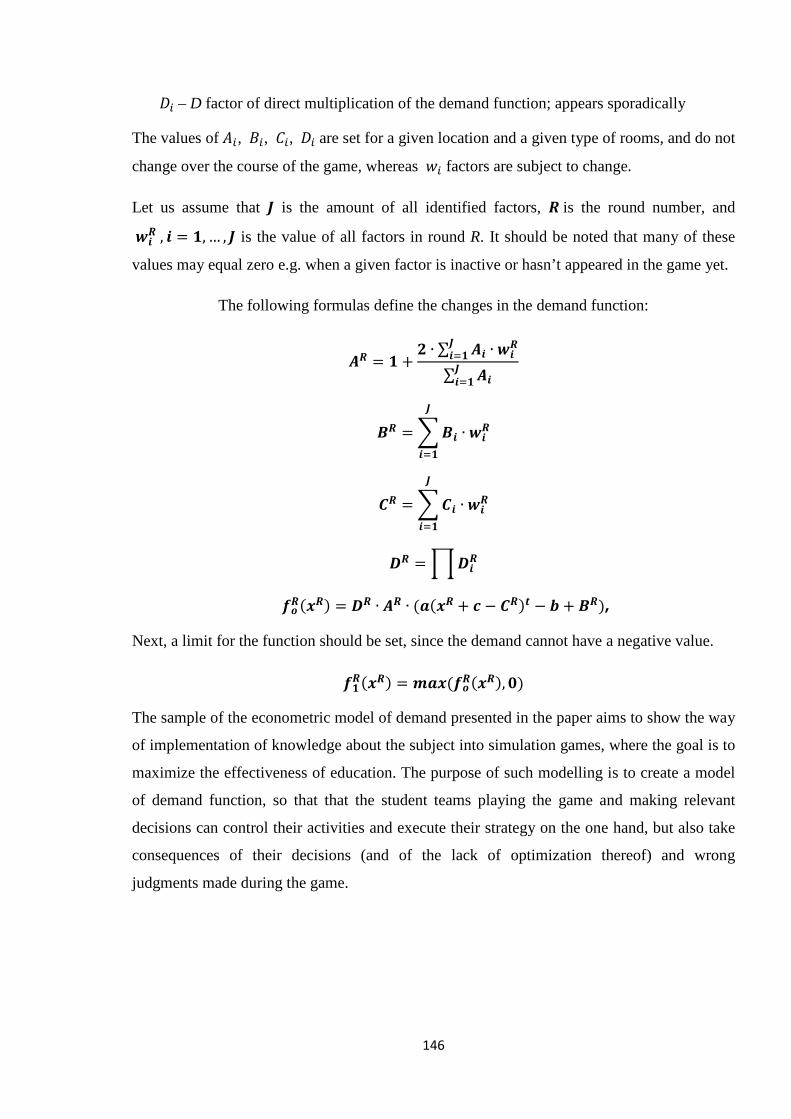
146
�� – D factor of direct multiplication of the demand function; appears sporadically
The values of��, ��, ��, �� are set for a given location and a given type of rooms, and do not
change over the course of the game, whereas �� factors are subject to change.
Let us assume that ! is the amount of all identified factors, "is the round number, and
��", � = #, … , ! is the value of all factors in round R. It should be noted that many of these
values may equal zero e.g. when a given factor is inactive or hasn’t appeared in the game yet.
The following formulas define the changes in the demand function:
�" = # + % ∙ ∑ ��!�'# ∙ ��"
∑ ��!�'#
�" = ( ��
!
�'#∙ ��"
�" = ( ��
!
�'#∙ ��"
�" = ) ��"
�*"��"� = �" ∙ �" ∙ ����" + � − �"�� − � + �"�, Next, a limit for the function should be set, since the demand cannot have a negative value.
�#"��"� = +����*"��"�, ,� The sample of the econometric model of demand presented in the paper aims to show the way
of implementation of knowledge about the subject into simulation games, where the goal is to
maximize the effectiveness of education. The purpose of such modelling is to create a model
of demand function, so that that the student teams playing the game and making relevant
decisions can control their activities and execute their strategy on the one hand, but also take
consequences of their decisions (and of the lack of optimization thereof) and wrong
judgments made during the game.
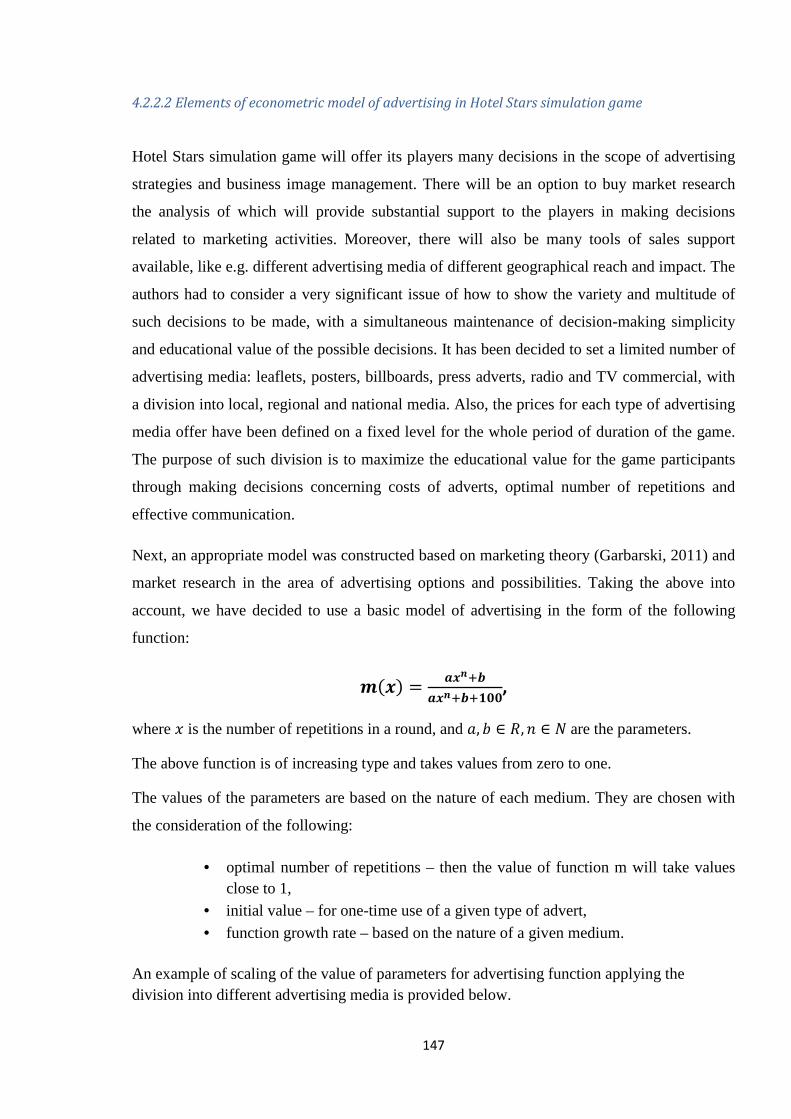
147
4.2.2.2 Elements of econometric model of advertising in Hotel Stars simulation game
Hotel Stars simulation game will offer its players many decisions in the scope of advertising
strategies and business image management. There will be an option to buy market research
the analysis of which will provide substantial support to the players in making decisions
related to marketing activities. Moreover, there will also be many tools of sales support
available, like e.g. different advertising media of different geographical reach and impact. The
authors had to consider a very significant issue of how to show the variety and multitude of
such decisions to be made, with a simultaneous maintenance of decision-making simplicity
and educational value of the possible decisions. It has been decided to set a limited number of
advertising media: leaflets, posters, billboards, press adverts, radio and TV commercial, with
a division into local, regional and national media. Also, the prices for each type of advertising
media offer have been defined on a fixed level for the whole period of duration of the game.
The purpose of such division is to maximize the educational value for the game participants
through making decisions concerning costs of adverts, optimal number of repetitions and
effective communication.
Next, an appropriate model was constructed based on marketing theory (Garbarski, 2011) and
market research in the area of advertising options and possibilities. Taking the above into
account, we have decided to use a basic model of advertising in the form of the following
function:
+��� = ��-.���-.�.#,,,
where is the number of repetitions in a round, and , � ∈ 0, 1 ∈ 2are the parameters.
The above function is of increasing type and takes values from zero to one.
The values of the parameters are based on the nature of each medium. They are chosen with
the consideration of the following:
• optimal number of repetitions – then the value of function m will take values close to 1,
• initial value – for one-time use of a given type of advert,
• function growth rate – based on the nature of a given medium.
An example of scaling of the value of parameters for advertising function applying the division into different advertising media is provided below.
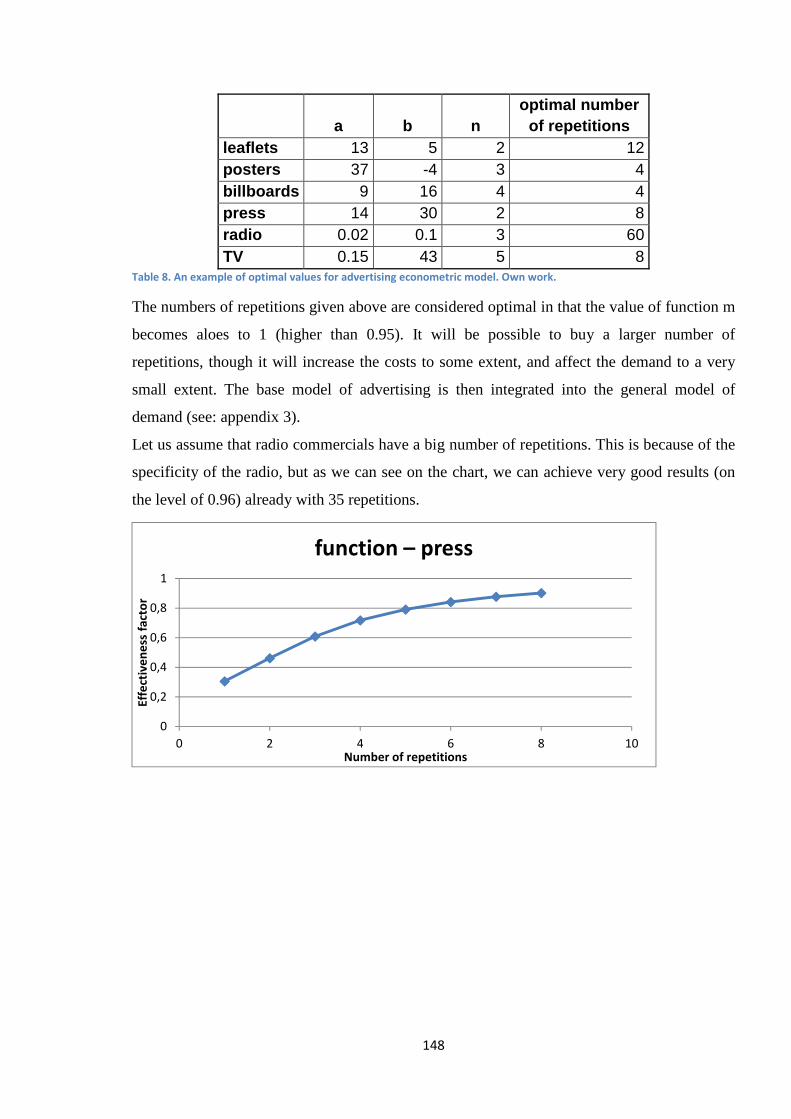
148
a b n optimal number
of repetitions leaflets 13 5 2 12 posters 37 -4 3 4 billboards 9 16 4 4 press 14 30 2 8 radio 0.02 0.1 3 60 TV 0.15 43 5 8
Table 8. An example of optimal values for advertising econometric model. Own work.
The numbers of repetitions given above are considered optimal in that the value of function m
becomes aloes to 1 (higher than 0.95). It will be possible to buy a larger number of
repetitions, though it will increase the costs to some extent, and affect the demand to a very
small extent. The base model of advertising is then integrated into the general model of
demand (see: appendix 3).
Let us assume that radio commercials have a big number of repetitions. This is because of the
specificity of the radio, but as we can see on the chart, we can achieve very good results (on
the level of 0.96) already with 35 repetitions.
0
0,2
0,4
0,6
0,8
1
0 2 4 6 8 10
Eff
ect
ive
ne
ss f
act
or
Number of repetitions
function – press
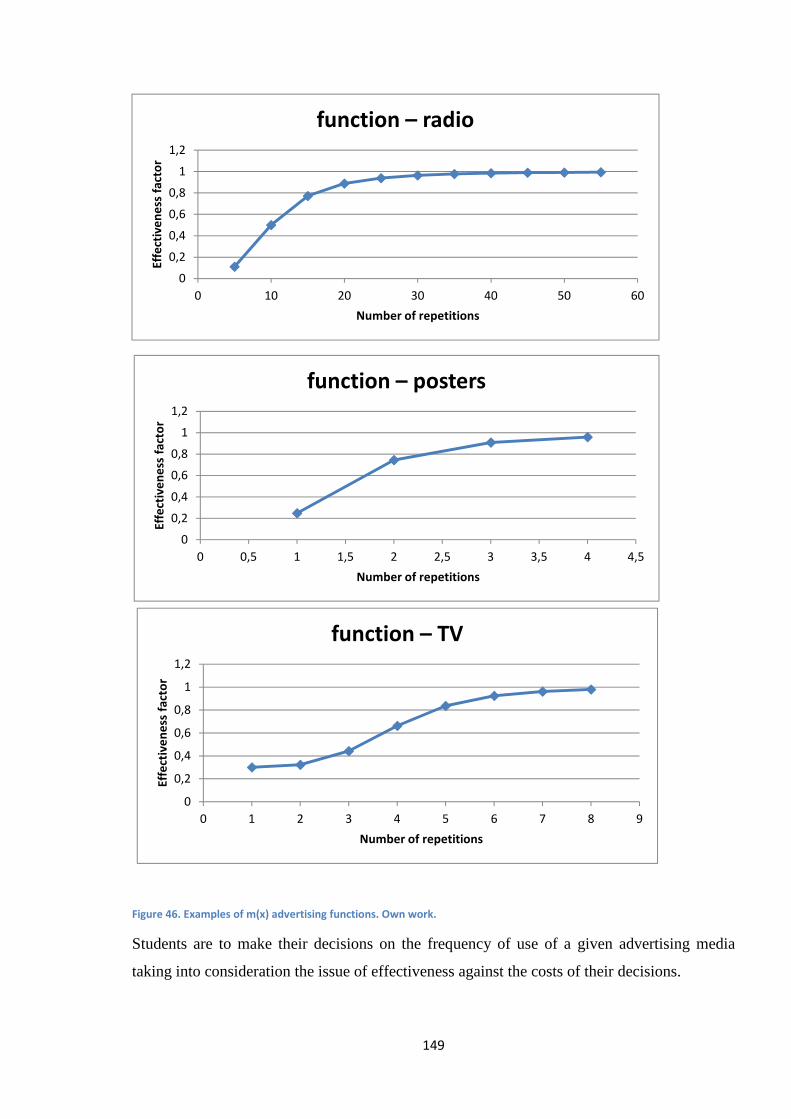
149
Figure 46. Examples of m(x) advertising functions. Own work.
Students are to make their decisions on the frequency of use of a given advertising media
taking into consideration the issue of effectiveness against the costs of their decisions.
0
0,2
0,4
0,6
0,8
1
1,2
0 10 20 30 40 50 60
Eff
ect
ive
ne
ss f
act
or
Number of repetitions
function – radio
0
0,2
0,4
0,6
0,8
1
1,2
0 0,5 1 1,5 2 2,5 3 3,5 4 4,5
Eff
ect
ive
ne
ss f
act
or
Number of repetitions
function – posters
0
0,2
0,4
0,6
0,8
1
1,2
0 1 2 3 4 5 6 7 8 9
Eff
ect
ive
ne
ss f
act
or
Number of repetitions
function – TV
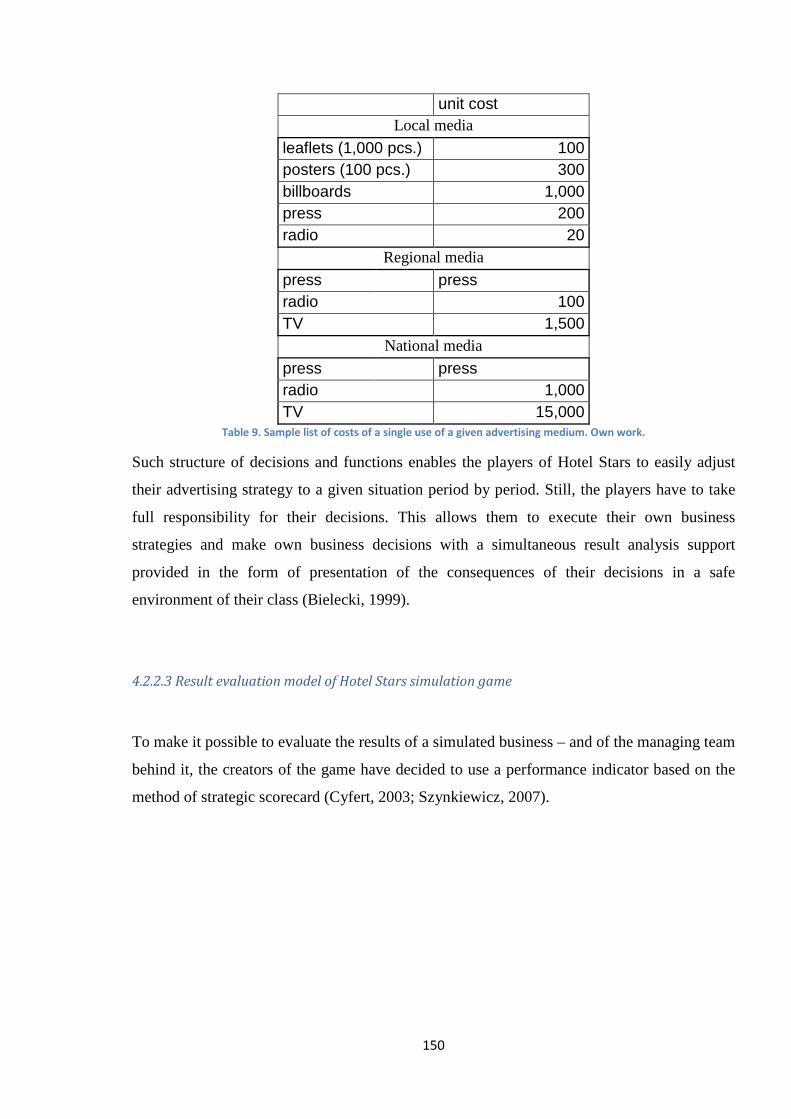
150
unit cost Local media
leaflets (1,000 pcs.) 100 posters (100 pcs.) 300 billboards 1,000 press 200 radio 20
Regional media
press press radio 100 TV 1,500
National media
press press radio 1,000 TV 15,000
Table 9. Sample list of costs of a single use of a given advertising medium. Own work.
Such structure of decisions and functions enables the players of Hotel Stars to easily adjust
their advertising strategy to a given situation period by period. Still, the players have to take
full responsibility for their decisions. This allows them to execute their own business
strategies and make own business decisions with a simultaneous result analysis support
provided in the form of presentation of the consequences of their decisions in a safe
environment of their class (Bielecki, 1999).
4.2.2.3 Result evaluation model of Hotel Stars simulation game
To make it possible to evaluate the results of a simulated business – and of the managing team
behind it, the creators of the game have decided to use a performance indicator based on the
method of strategic scorecard (Cyfert, 2003; Szynkiewicz, 2007).

151
Figure 47. A diagram of Strategic Scorecard model for Hotel Stars simulation game. Own work.
The score of simulated business will be calculated according to the following algorithm.
Company score = Economic results x Stakeholder satisfaction index x Sustainable business index
Company economic results = Company profitability x Company debt ratio x Share value
Company profitability = Net profit / number of shares (constant of e.g. 100 or 1,000 – to be scaled)
Company debt ratio = Total debt / Company value
Share value = Company value / number of shares (constant of e.g. 100 or 1,000 – to be scaled)
Company value = Initial capital + the amount of investments in equipment + the amount of
accumulated gain/loss for previous years
Employee satisfaction index = form of employment (constant) x (% of the deviation of salary with bonus from the average +1) x (% of the change of employment +1)
Customer satisfaction index = (% of the change of price -1) x standard of furnishings
(constant) x employee satisfaction index x services (constant)
152
Employee performance index = (% of the deviation of salary with bonus from the average +1) x (((Number of rooms/number of employees)/constant)x100) x employee events (constant)
CRS index = (% of the change of employment +1) + (% of the growth of company value +1) + expenses for CRS events (constant)
Green business index = (expense for green business events in the form of an index) the index
dwindles – the so-called soft reset by 5-10 points a year.
The logic behind formulation of this criterion conforms to standards applied at present in the
area of parametric assessment of team scores in simulation games (see e.g. Marketplace©)
with a simultaneous application of two new elements. The first of them is the introduction of
indexes of sustainable business and green business. The author of the paper mentioned at the
beginning of chapter IV that the fastest-developing areas of simulation games are those
related to sustainable growth and corporate social responsibility. That is why it has been
decided to feature these elements in Hotel Stars in a way that the players cannot ignore them.
The other element is the way of presentation and calculation of the score. According to
methodology of gamification (Cunningham and Zichermann, 2011), we have resolved to
present the score in the form of a scalable ranking. The scalability of ranking will include a
possibility to provide a comparison on any scale, i.e. class, school, regional, or even global.
Thus, the participants of the game will be able to compare their performance to others at any
stage, which will grant additional fun and inspire more motivation to work harder.
153
Chapter V
5.1 Simulation game as a research method
Looking at the use and application of simulation games in contemporary world, we can most
certainly claim that simulation games have earned a strong position among training- and
education-related tools. Yet, there are still many limitations and difficulties when it comes to
using simulation games as research methods. Simulation games are very interesting research
tools, as the people who make decisions as part of such games operate within a framework of
a strongly confined – and often very abstract – system. This makes it possible to omit the
psychological and sociological assumptions concerning their behavior (Duke and Geurts,
2004). Moreover, the decisions and all actions of the players are focused on reaching goals set
by the game, using the means permitted by the game’s mechanisms and principles.
Participants of simulation game-based courses contribute to the game with their systems of
values and beliefs, which leads to different outcomes in different cultures, even if the model
of a given simulation game does not feature any formal cultural differences integrated into its
algorithmic model.
In social science, research methods concentrate either on studying some phenomenon with its
context in order to generalize the mechanism of its occurrence, or on context-free studies of
the reality to create a universal law, with a risk of omission of the context of the law’s
occurrence. The dichotomy of such approach forms the basis for continuous discourse on
whether it is better to study and analyze some phenomenon in detail – including the largest
possible number of context-resultant variables, or to study and analyze a given phenomenon
on a certain level of generality, but using the biggest possible number of respondents or cases
set in different contexts, which leads to conclusions forming a basis to develop universalist
laws (Meijer, 2009).
Simulation games used as a research method may serve as a certain bridge between the
method of life case-study, set in the context of a given reality, and more universalist methods
like surveys or interviews. Simulation games make it possible to emulate freely-selected and
repeatable “microworlds”, which grants repeatability and controllability of experiments. We
can control the choice of participants of experiments, select specific groups of people, or
ensure the highest possible diversity of e.g. positions/functional areas or industries where the
154
participants of these experiments come from. The high extent of control over the course of the
simulation game – and over the game itself – and the possibility to select different participants
of simulation games and manipulate individual variables of the game make it possible
conduct laboratory-experiment-type research, though course participants will still consider it
more a life case-study than a typical laboratory experiment. Thus, the obtained results are
more “natural”, and the repeatability of simulation games makes it possible to collect a lot of
data concerning simulation game results achieved by participants of different background,
which then lets us draw more general conclusions.
5.2 Simulation games in research methodology
The content of reference books and literature devoted to research methods featured in
simulation games is very disjointed. One of the reasons for this lack of coherence, as
identified by the author, is the fact that many authors do not differentiate between conducting
research revolving around simulation games (e.g. studying the impressions or opinions of
players) and simulation games used as research methods, i.e. designed as sessions of
integrated research system. This differentiation is very important from methodological
perspective. Studies focused on simulation game participants and on their impressions or
decisions may be conducted applying classical methodology of context-free research in order
to arrive at some generalizations. However, situations involving simulation games used as
research methods are far more interesting and challenging. The literature on the subject does
not feature many complete descriptions of such research methods, and until the second half of
the last decade of the 21st century, there has been no such description at all. In earlier works,
authors (Wolfe et al., Keys et al.) called for returning to the classical canon of quantitative
theories. Yet, as the opinions for diversification of research methodology have gained
popularity over time, the author of the paper believes that the idea proposed by Wolfe, Keys,
and others would be a step back in the development of knowledge in the scope of simulation
games and progress in research methods. Still, there have been some more comprehensive
descriptions of simulation games as research methods in recent years (Hanse and Kriz, 2006;
Meijer, 2009).
Designing simulation game for research purposes requires proper configuration of the game
and of its course. The main element that needs to be defined and designed first is the
institutional environment of the simulation game. The components of such institutional
environment are:
155
• principles,
• roles,
• objectives,
• limitations.
These elements are necessary to create an internal structure of the game (Gibbs, 1974). In
addition to that, it is important to set the values of individual variables in the simulation game,
which is referred to as setting of “local parameters” which will affect the course of the
simulation. Lastly, we need to configure the “initial situation” of the simulation game, so that
it corresponds to the needs of our experiment.
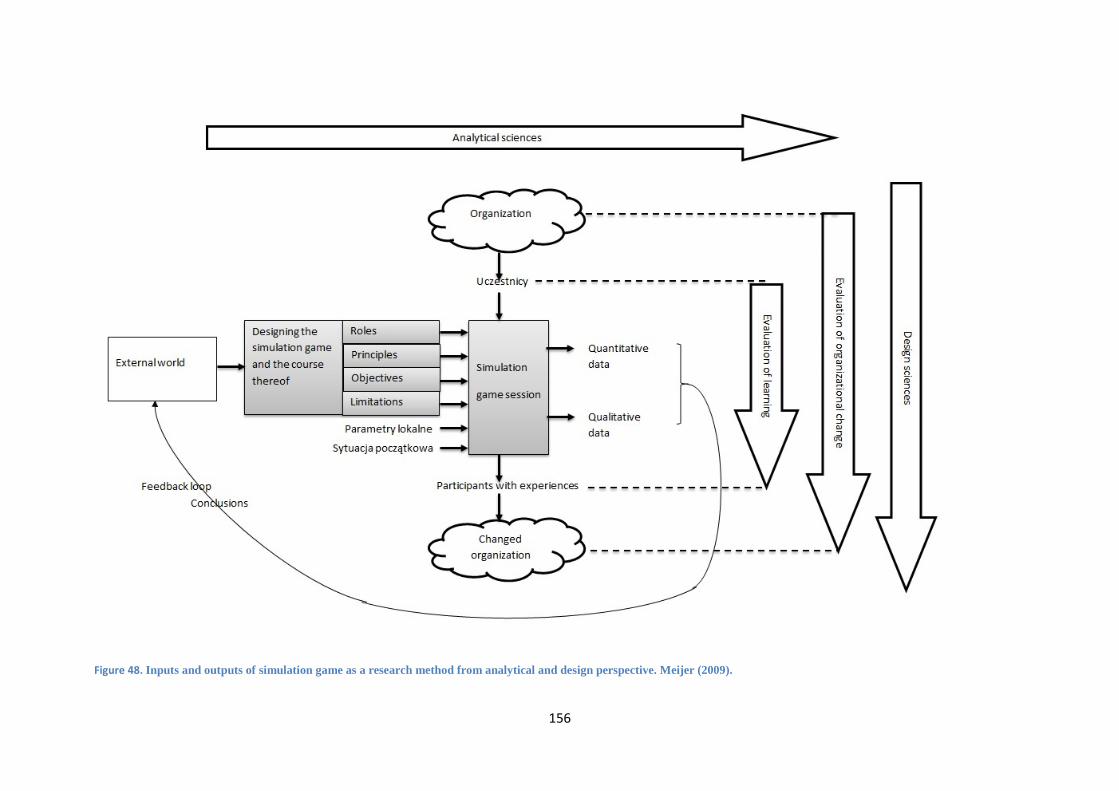
156
Figure 48. Inputs and outputs of simulation game as a research method from analytical and design perspective. Meijer (2009).
157
The fundamental division of roles in a simulation game involves a division into game
participant and game facilitator. The roles of the participants do not need to reflect their real-
life roles; likewise, the facilitator may assume different roles during the game, acting as an
agent or actor. Participant roles may be assigned by game facilitators, but the participants may
select them themselves. Both of these systems have their advantages and disadvantages (Faria
and Wellington, 1994).
The principles of simulation games are either role-specific or generic for participants of a
specific simulation game. The principles may imitate limitations from real life, or can be
created artificially in order to evoke a specific behavior or effect.
The objectives in simulation games usually involve maximization of value represented in
points or monetary units. Sometimes games feature complex algorithms and include whole
indicator pyramids featuring player positions and trade-off mechanisms forcing participants to
take optimizing measures. Different roles may have different objectives assigned, which may
be done to create a conflict or a multi-dimensional system of payments and incentives. The
objectives may be of individual-type, group-type, or set for the whole group participating in a
given simulation game. They are a crucial element of simulation games for two reasons. First,
they make it possible to manipulate the actions of players, and second, one of the main
motivators of players to act is the desire to win, to conquer others, a certain situation, or the
game.
Limitations restrict the number of possible actions to be taken in a simulation game. They are
different from principles in that they shape the borders of particular variables in the model of
a given game, they set the minima and maxima for each value in the game, including time,
money, and points. The possibilities of adjusting these limitations are virtually unlimited; they
can help reflect certain real-life local conditions, or create completely new or artificial
microworlds.
From the research perspective, simulation games may be used in both exploratory and
explanatory paradigm. In the first case, we use simulation games as generators of hypotheses.
In the second case, their application involves testing hypotheses by means of game and/or
game session. Both of these methodologies have their implications, as well as advantages and
disadvantages. The author applied both of these approaches in own research – for the purpose
of research and testing these methodologies.
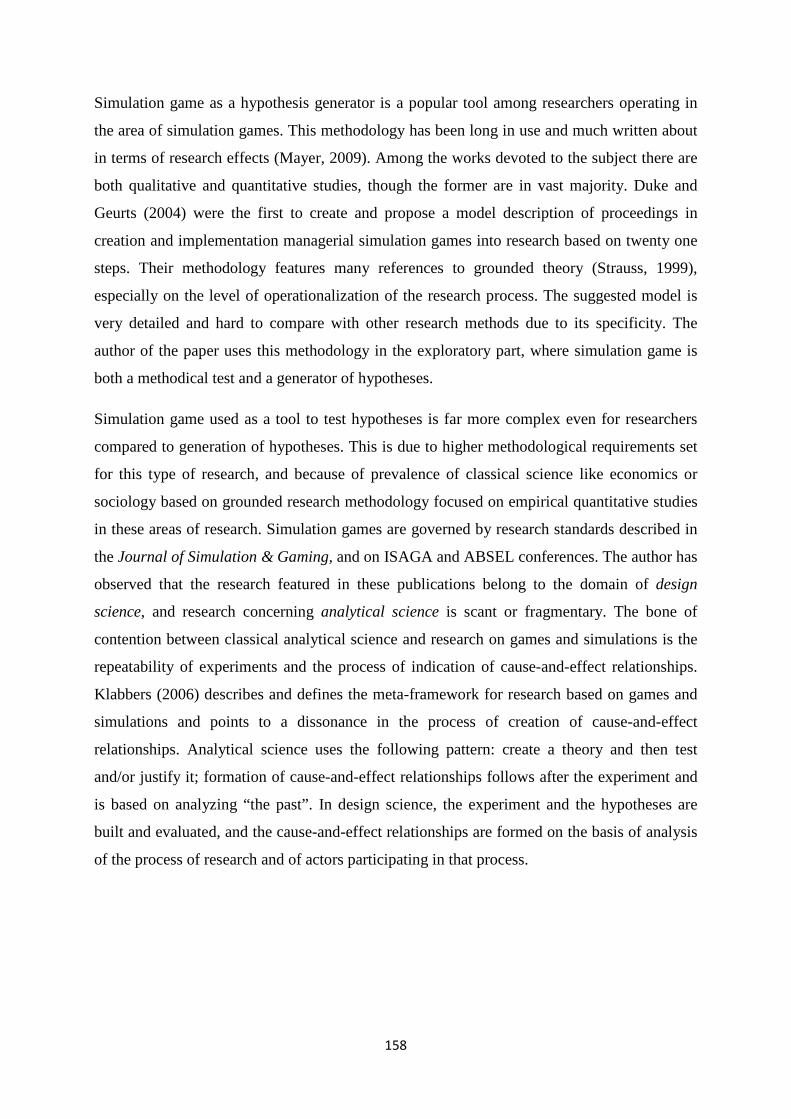
158
Simulation game as a hypothesis generator is a popular tool among researchers operating in
the area of simulation games. This methodology has been long in use and much written about
in terms of research effects (Mayer, 2009). Among the works devoted to the subject there are
both qualitative and quantitative studies, though the former are in vast majority. Duke and
Geurts (2004) were the first to create and propose a model description of proceedings in
creation and implementation managerial simulation games into research based on twenty one
steps. Their methodology features many references to grounded theory (Strauss, 1999),
especially on the level of operationalization of the research process. The suggested model is
very detailed and hard to compare with other research methods due to its specificity. The
author of the paper uses this methodology in the exploratory part, where simulation game is
both a methodical test and a generator of hypotheses.
Simulation game used as a tool to test hypotheses is far more complex even for researchers
compared to generation of hypotheses. This is due to higher methodological requirements set
for this type of research, and because of prevalence of classical science like economics or
sociology based on grounded research methodology focused on empirical quantitative studies
in these areas of research. Simulation games are governed by research standards described in
the Journal of Simulation & Gaming, and on ISAGA and ABSEL conferences. The author has
observed that the research featured in these publications belong to the domain of design
science, and research concerning analytical science is scant or fragmentary. The bone of
contention between classical analytical science and research on games and simulations is the
repeatability of experiments and the process of indication of cause-and-effect relationships.
Klabbers (2006) describes and defines the meta-framework for research based on games and
simulations and points to a dissonance in the process of creation of cause-and-effect
relationships. Analytical science uses the following pattern: create a theory and then test
and/or justify it; formation of cause-and-effect relationships follows after the experiment and
is based on analyzing “the past”. In design science, the experiment and the hypotheses are
built and evaluated, and the cause-and-effect relationships are formed on the basis of analysis
of the process of research and of actors participating in that process.
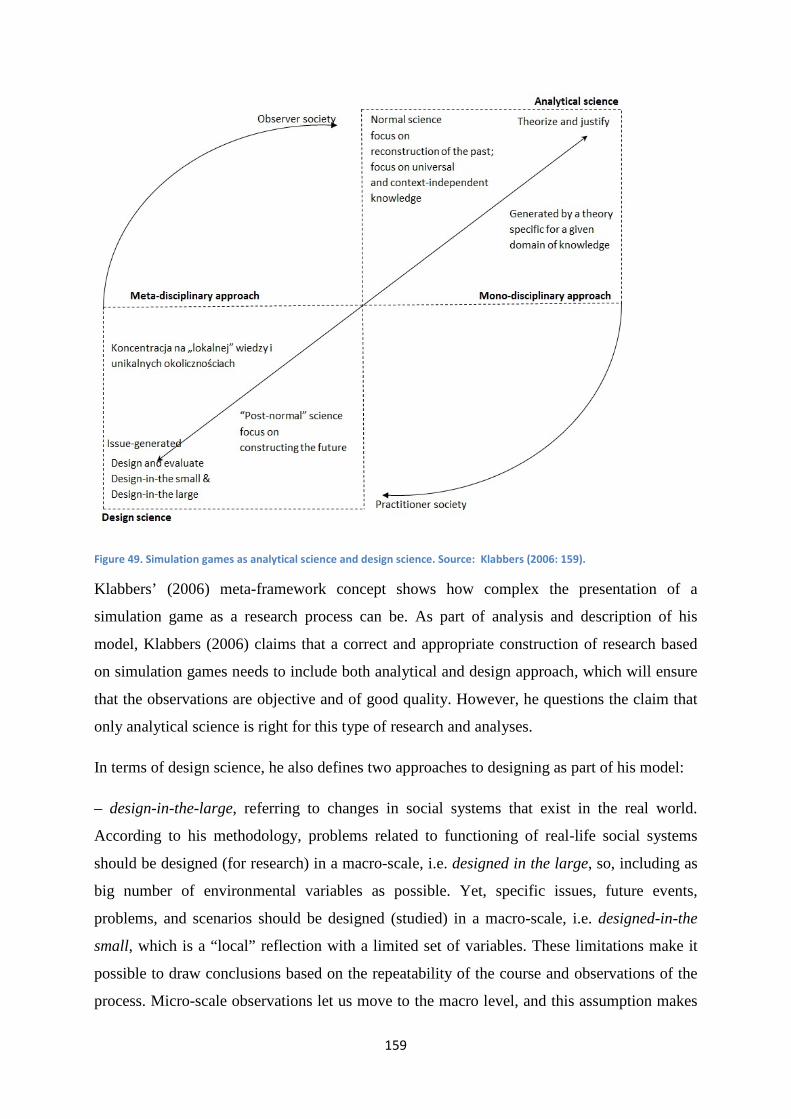
159
Figure 49. Simulation games as analytical science and design science. Source: Klabbers (2006: 159).
Klabbers’ (2006) meta-framework concept shows how complex the presentation of a
simulation game as a research process can be. As part of analysis and description of his
model, Klabbers (2006) claims that a correct and appropriate construction of research based
on simulation games needs to include both analytical and design approach, which will ensure
that the observations are objective and of good quality. However, he questions the claim that
only analytical science is right for this type of research and analyses.
In terms of design science, he also defines two approaches to designing as part of his model:
– design-in-the-large, referring to changes in social systems that exist in the real world.
According to his methodology, problems related to functioning of real-life social systems
should be designed (for research) in a macro-scale, i.e. designed in the large, so, including as
big number of environmental variables as possible. Yet, specific issues, future events,
problems, and scenarios should be designed (studied) in a macro-scale, i.e. designed-in-the
small, which is a “local” reflection with a limited set of variables. These limitations make it
possible to draw conclusions based on the repeatability of the course and observations of the
process. Micro-scale observations let us move to the macro level, and this assumption makes
160
it possible to form an analogy to the methodology proposed by Duke and Geurts (2004). The
conclusions drawn from these methodologies provide a strong support to the approach
endorsed by the author in the research frame of this paper. The author also believes that the
classical methods should be supplemented by methods he uses in his research, which aim to
test hypotheses using methods referring to research methodologies from the area of social and
economic psychology, system analysis, and human-computer interaction.
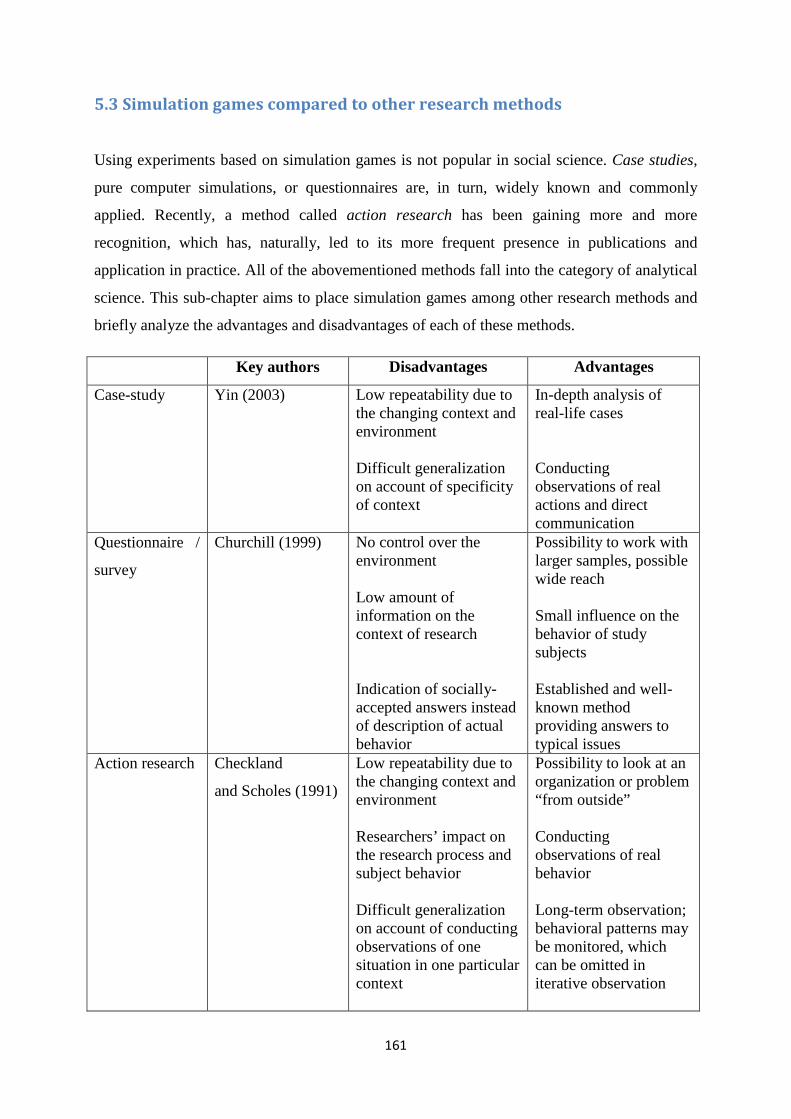
161
5.3 Simulation games compared to other research methods
Using experiments based on simulation games is not popular in social science. Case studies,
pure computer simulations, or questionnaires are, in turn, widely known and commonly
applied. Recently, a method called action research has been gaining more and more
recognition, which has, naturally, led to its more frequent presence in publications and
application in practice. All of the abovementioned methods fall into the category of analytical
science. This sub-chapter aims to place simulation games among other research methods and
briefly analyze the advantages and disadvantages of each of these methods.
Key authors Disadvantages Advantages
Case-study Yin (2003) Low repeatability due to the changing context and environment Difficult generalization on account of specificity of context
In-depth analysis of real-life cases Conducting observations of real actions and direct communication
Questionnaire /
survey
Churchill (1999) No control over the environment Low amount of information on the context of research Indication of socially-accepted answers instead of description of actual behavior
Possibility to work with larger samples, possible wide reach Small influence on the behavior of study subjects Established and well-known method providing answers to typical issues
Action research Checkland
and Scholes (1991)
Low repeatability due to the changing context and environment Researchers’ impact on the research process and subject behavior Difficult generalization on account of conducting observations of one situation in one particular context
Possibility to look at an organization or problem “from outside” Conducting observations of real behavior Long-term observation; behavioral patterns may be monitored, which can be omitted in iterative observation
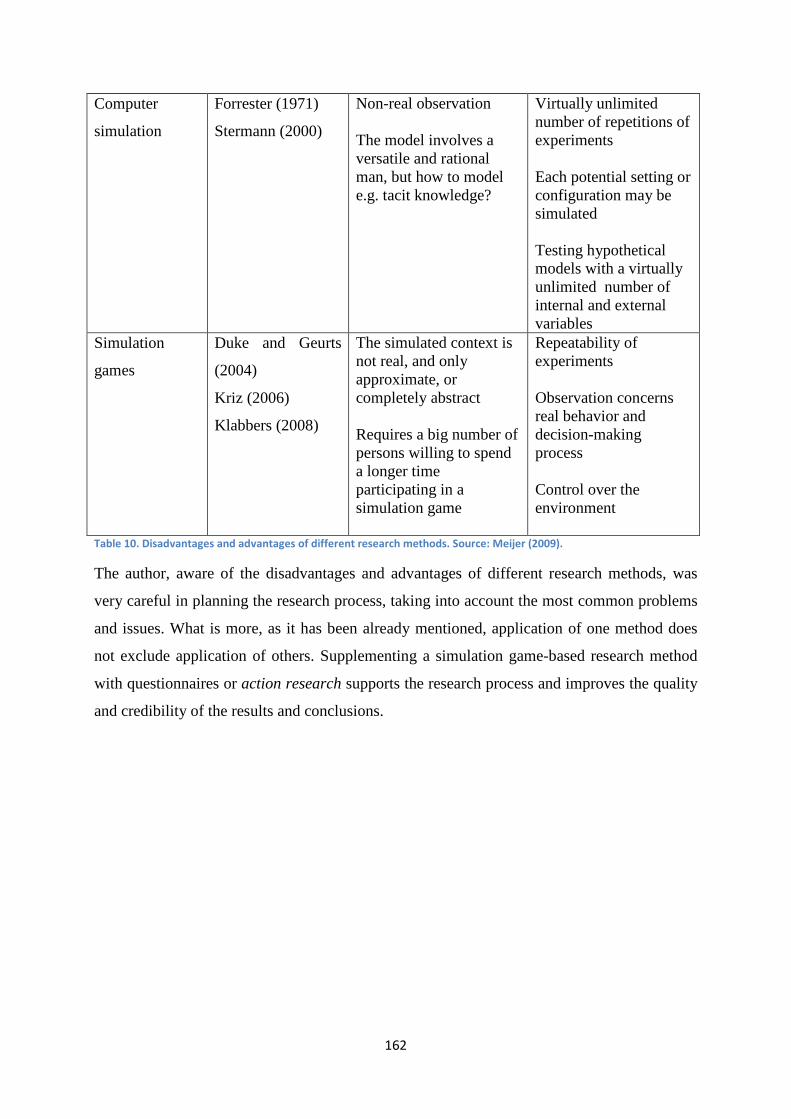
162
Computer
simulation
Forrester (1971)
Stermann (2000)
Non-real observation The model involves a versatile and rational man, but how to model e.g. tacit knowledge?
Virtually unlimited number of repetitions of experiments Each potential setting or configuration may be simulated Testing hypothetical models with a virtually unlimited number of internal and external variables
Simulation
games
Duke and Geurts
(2004)
Kriz (2006)
Klabbers (2008)
The simulated context is not real, and only approximate, or completely abstract Requires a big number of persons willing to spend a longer time participating in a simulation game
Repeatability of experiments Observation concerns real behavior and decision-making process Control over the environment
Table 10. Disadvantages and advantages of different research methods. Source: Meijer (2009).
The author, aware of the disadvantages and advantages of different research methods, was
very careful in planning the research process, taking into account the most common problems
and issues. What is more, as it has been already mentioned, application of one method does
not exclude application of others. Supplementing a simulation game-based research method
with questionnaires or action research supports the research process and improves the quality
and credibility of the results and conclusions.
163
5.4 Overview of research on the effectiveness of application of simulation
games in education
There is plenty of research on the effectiveness of application of games, simulations, and
simulation games in education – not only that addressed to managers. Since the 1950s, when
simulation games were used in managerial education for the first time, there have been many
questions concerning the role and effects of simulation games in teaching process. Since that
time, thousands (Kapp, 2012) of studies of that subject have been conducted, that is why this
overview is focused on studies which aggregate data from different sources and provide a
summary of results from many areas of research.
The first work that the author would like to present is Randel’s meta-analysis (Randel,
Morris, Wetzel and Whitehill, 1992). A team led by Randel analyzed 68 different studies from
the period of 1968–1991. The analysis covered studies comparing the effectiveness of games
and simulations with classical forms of teaching. Among those 68 studies, 38 (around 56%)
showed no difference, 22 of them (about 32%) found games and simulations more
advantageous, and in 5 of them (about 7%) it was argued that games and simulations were
better, but the methodology applied therein was questioned; 3 of these studies (about 5%)
were in favor of traditional forms of education.
The studies analyzed by Randel’s team did not cover application of business simulation
games in professional or academic environments. The data gathered in these studies had their
source in application of games and simulations in teaching social science, mathematics,
linguistics, logic, physics, or biology. Interestingly enough, the area with the largest number
of studies in favor of games and simulations as a form of teaching was mathematics. Randel’s
team considered the following elements to be of crucial importance (Randel et al., 1992):
• Games and simulations brought the best benefits if they were applied in areas where
games were used to teach specific areas of knowledge and where the objectives were
clearly defined.
• Learners consider games and simulations to be more interesting than classical forms of
education.
• Forms of measurement of the effectiveness of games and simulations need to be
always selected very carefully.
164
• Designing experiments aiming to evaluate and investigate games and simulations
should be subject to stricter methodological guidelines.
Despite the fact that Randel’s team’s meta-analysis does not cover business games or
simulations, it is still a very valuable study. Simulation games are not reserved exclusively for
economic science, or even for management. What is more, the results of this analysis provide
a strong support to the theses of this paper, which assume that we are able to effectively apply
games, simulations, and simulation games in teaching any subject, not only those associated
strictly with management.
Another study taken into consideration is Wolfe’s meta-analysis (1997), which covered 7
studies carried out in the years 1966-1988, all of which concerned the effectiveness of
teaching strategic management using simulation games. All studies featured at least one study
group and one control group. The control groups were taught by means of a traditional form
of teaching, supported by case-study method. Wolfe (1997) applied the following criteria to
the analyzed cases:
- simulation games have to compared with traditional teaching methods,
- courses must feature pre-defined teaching objectives,
- the effects of teaching need to be measured objectively.
The main conclusion of this analysis is that all seven cases showed a considerably larger
knowledge growth among the subjects that were taught through simulation games than among
those taught through a traditional form of teaching. Wolfe’s study is significant from the point
of view of this paper, since it concerns teaching strategic management and clearly proves the
value of teaching through simulation games. Unfortunately, Wolfe’s meta-analysis is not free
of criticism, as Wolfe made his pre-selection of studies to be analyzed very strict, and so, was
able to predefine the results.
The next study to be covered is Hays’ meta-analysis (2005). He analyzed 274 articles and
works devoted to the effectiveness of use of training games. His study concentrated on works
describing the design, use, and evaluation of games, without limitations in terms of areas of
science. From among those 247 works, 169 were eliminated because of structural and
methodological errors, and the remaining 105 documents were included into the meta-
analysis. These documents included 26 literature reviews, 31 theoretical articles, and 48
165
research articles containing empirical data on the effectiveness of application of simulation
games. Hays’ conclusions (2005) were the following:
� Empirical studies of the effectiveness of application of training games are very
fragmentary. The literature on the subject contains descriptions of studies of many
parameters, e.g. age, gender, group size, task type or game type, but they concern very
narrow fields. The literature devoted to research in that scope is full of inaccuracies
and methodological errors.
� Despite the fact that many studies show that games are effective tools of teaching for
different target groups, e.g. learners of mathematics, social science, electronics,
economics and management, they still do not answer the question of whether – and to
what extent – the method of games and simulations is appropriate for our teaching
objective. That is why we cannot generalize the results of studies of effectiveness of
one game for all learner groups and all areas of education.
� There is no empirical evidence that games are the preferable method of teaching in
every situation.
� Training games should be accompanied by teaching programs featuring debriefing and
feedback, so that the participants of the course see the full picture and have a clear
understanding of what happens in the game and why it happens.
� Supporting game participants in learning the sole use of games and operation thereof
substantially increases the effectiveness of application of games and the experience of
the game through a possibility to focus on the game alone.
Hays’ report (2005) included also other aspects of application of games in training, but he
does not consider them conclusions, but rather interesting observations:
• The studies clearly show that people learn through playing games.
• Training games are effective only when they are designed to achieve a specific
educational objective and are used in the right way.
• If a training game has not been designed to achieve a specific educational
objective, many effects of education become random and with no relationship with
the aims of the training.
• There is a strong dissonance between training game designers and experts of
design for education purposes. It is believed that playing games alone has an
166
educational effect; hence, the training game industry does not value the ability to
design games paying special attention to their educational quality.
• Games are not a panacea. Too broad and incautious application of training games
in teaching does not lead to a considerable increase in the effectiveness of
teaching, but substantially raises the costs thereof.
Hays’ study is a very significant contribution to our knowledge about application of games.
First, his conclusions are in line with the results of Randel’s team (1992). They also
correspond to the author’s observations concerning the fragmentariness of research in the area
of games and simulations, and the methodological chaos in the field of research. Second, the
critical remarks included in Hays’ report support the evolutionary model of managerial
education, where games and simulations become a tool of development and do not substitute
the whole process of education, which is in line with the model proposed by the author.
The next study is Vogel’s meta-analysis (Vogel, Vogel, Cannon‐Bowers, Bowers, Muse and
Wright, 2006). The study was conducted by a team from the University of Central Florida and
at first covered 248 documents on studies of the effects of application of computer games in
teaching, but the final analysis included 32 studies of appropriate research quality. The criteria
for inclusion into the analysis involved at least one main hypothesis concerning attitude
change and a statistical analysis evaluating a comparison of traditional methods of teaching
with computer games or interactive simulations. The team found and recorded strong positive
effects of the influence of games and interactive simulations compared to traditional methods
of teaching in two areas: the area of attitude change and the area of cognitive benefits.
Although the research team did not define the aforementioned effects, they drew and shared
the following conclusions:
• Bigger cognitive benefits were observed in those who were taught through computer
games and interactive simulations. However, it should be noted that computer games –
unlike simulations – gave less stable results.
• Games and simulations resulted in better attitude change than in the case of traditional
forms of teaching.
• The level of realism of graphics in the games and computer simulations did not
influence the effects.
167
• The effects were observed regardless of the age, gender, scope of control of
participants of games and simulations, the aforementioned realism of graphics, or the
type of gameplay – group or individual.
This study supports one of the most important propositions, according to which simulation
games have the biggest impact on motivation and attitude change of their participants
(Bielecki, 1999). This aspect is very important from the perspective of overall development of
education.
Ke’s meta-analysis (Ke, 2009). She is a researcher who focuses on studies from the area of
computer game-based teaching, computer-aided collaborative teaching, and computer
simulation-aided training. Her meta-analysis covers 89 research articles which contain
empirical data concerning the effectiveness of application of computer training games. The
aim of the analysis was to provide evidence – using qualitative and quantitative studies – of
the value of application of computer-aided tools in the process of teaching, including games
and simulations, and to demonstrate the effects influencing the effectiveness of application
thereof. Ke analyzed 256 research reports, rejected 167 of them – for various reasons, and
analyzed the remaining 89 in terms of qualitative and quantitative data. She drew the
following conclusions:
• The effects of influence of computer-aided teaching on the process of education are
positive. In 65 from among 89 studies, Ke found a considerable advantage of
computer-aided teaching over traditional teaching. In 52% of cases, she found a
positive impact in favor of computer-aided teaching, especially game- and simulation-
based teaching. 25% of cases featured mixed results, where better effects of teaching
for selected effects of teaching were reported. No differences in teaching methods and
no clear advantage of one method over the other were found in 18% of cases, and only
one study suggested that traditional teaching methods were more effective.
• An indispensable component of computer-aided teaching is training and support for
users of digital education systems. In all of the analyzed cases – provided that support
and training were ensured – the effects of teaching were better. In 17 studies on the
relationship between support and training and the effectiveness of teaching it was
shown that learners without support and training learn how to play a game rather than
what the game contains and offers.
168
• Computer training games support the development and practical use of higher-tier
reasoning functions like planning and comprehension to a larger extent, and gaining
factual and conceptual knowledge to a smaller extent.
• Computer training games support and generate motivation among different groups,
learning in different areas of education.
Ke’s meta-analysis (2006) is an important element of research, as it proves the effectiveness
of application of computer-aided simulation games. Some elements of her study, e.g. training
and support are mentioned repeatedly, which additionally highlights their significance.
The last study referred to in this part of the paper is Sitzmann’s meta-analysis (Sitzmann,
2011). In 1997, she was asked by United States Department of Defense to develop a strategy
to standardize and unify the system of computer-aided education for the needs of the whole
Department of Defense. The strategy, called Advanced Distributed Learning (ADL), was
implemented successfully in practice. Since that time, many universities and companies
working with DoD have appointed special working groups and launched a process of
formation of standards of computer-aided training involving standards of purchase of training
software including accompanying support and training sessions. A part of ADL’s mission is
to prove the effectiveness of teaching through computer-aided tools – and through simulation
games in particular. In order to emphasize the effectiveness of application of simulation
games and to show their advantage over traditional forms of training, ADL experts posed the
following questions:
� Are simulation games an effective method of delivering trainings?
� What conditions have to be met to make simulation games the most effective form of
education?
� How does the use of simulation game fit into the curriculum?
� Do simulation games need to be fun in order to transfer knowledge?
� What level of interactivity and involvement should a simulation game ensure in order
to be effective in terms of training?
To answer these questions, ADL researchers started looking for the right studies. They
conducted a detailed analysis of 65 independent sets of data obtained in a group of 6,476
persons taught through simulation games. In the study group, 77% of subjects were BA/BSc
students, 12% - MA/MSc students, 5% - corporate professionals, and 6% - military staff. The
average age in the group was 23, and 52% of the subjects were men. The subjects were of
169
different background: education studies, psychology, business, education technology,
medicine, IT, and scientific science. In addition to that, researchers analyzed 55 research
reports from different areas. In all 65 groups, participants were taught using simulation
games, and their results were compared to reference groups taught through traditional
teaching methods. The results were analyzed paying special attention to key cognitive and
affective effects of teaching. The analysis ended with the following conclusions:
• Those trained through simulation games are more self-confident in activities related to
their work and interaction with their environment. The results of the studies show that
this higher level of self-confidence stems from better abilities to apply new skills in
practice at work. The meta-analysis proved that the participants of simulation game-
based trainings displayed a 20% higher level of self-confidence in using the newly-
obtained knowledge and skills than persons taught by means of traditional methods.
• Participants of simulation game-based trainings displayed broader declarative and
procedural knowledge, and a higher level of retention of knowledge delivered through
training than members of control groups. The comparison of data included in the
meta-analysis showed that the subjects trained through simulation games displayed an
11% higher level of declarative knowledge and a 14% higher level of procedural
knowledge. The level of knowledge retention was also 9% higher than in the case of
control groups.
• Simulation games do not have to be fun or contain an element of fun in order to be
effective. Research showed that regardless of the fact if simulation games were fun or
not, they still provided the learners with the same amount of information and
knowledge. No statistically significant differences between the level of fun provided
by a simulation game and the educational effectiveness thereof were found.
• Learners gain much more from a simulation game that requires their active
involvement than from passive learning through participation in traditional teaching
processes. It was also discovered that if the form of transfer of knowledge featured in
a game was passive, the control group learned more than the study group. Yet, when
this form changed its character into more active and participatory, it was the study
group that benefited more. The relationships shown in the study suggest that
simulation games are a more effective means of teaching through active involvement
of participants.
170
• Those learners who can participate in one simulation game several times learn more
than those who play a given game only once. There was a very big difference in
results between the group which had an unlimited access to the simulation game and
the group with a limited access.
• Simulation games integrated into a teaching program are a better method of teaching
than stand-alone games. Integration of simulation game into the teaching program
gave much better results than using simulation game as the only teaching tool. The
study group gained much better results in terms of knowledge when simulation game
was one of many methods of teaching compared to poorer results of the control group
that was taught using simulation game only.
Stizmann’s meta-research is the coping stone of the present state of knowledge in the scope of
application of simulation games for education purposes. It also serves as the current standard
of good practice and provides us with arguments for the effectiveness and advantage of
simulation games in education.
171
5.5 Own studies in the scope of application of simulation games in
education
In the chapter devoted to the use of simulation games in managerial education, the author
would like to quote two examples.
1. The impact of cognitive assessment system of a team on the free rider problem – an
experiment conducted in a group of 167 BA/BSC students of Kozminski University in
2010.
2. Introduction of individual assessment system in the form of an investment game as an
additional element of assessment as part of decision-making courses, and the impact
thereof on the outcomes of simulation and course satisfaction – a pilot study
conducted as an experiment in a group of 28 MA/MSc students of KU in the academic
year 2011/2012.
Both of these studies are based on experimental methodology, but feature certain differences.
In the case of the first study, according to the methodology, it is a study falling into the
category of studies revolving around simulation games (Duke and Geurts, 2001). The
methodology of this approach to research revolving around simulation games is somewhat a
hybrid approach (Guerts and Vennix, 1989, after Geurts and Mayer, 1996) and may be
defined as participatory modeling approach). This perspective involves classical approach to
formation of the study framework, i.e. describing the object of research, setting research
questions and hypotheses, and the form of verification thereof. However, application of
simulation games in the process of research requires the researcher to implement participatory
planning and modeling approach that would answer the questions of how the study
participants should behave during the study, how the data is going to be collected, what is the
significance of place and time from the perspective of the study, etc. Moreover, the study was
carried out as a polemic against the research approach of Thavikulwata and Changa (2010),
who analyze the relationship between the required number of persons in the group running a
business in a simulation game, and the number of free riders and the effectiveness thereof as a
team. The author proposed an approach based on a combination of the classical game theory
and participatory modeling. The study was innovative in that it compared the results of the
study group with the optimal strategy of decision-making with Nash equilibrium (Harrington,
2009), which made it possible to exclude the presence of a typical control group (Gonzalez,
Vanyukov, Martin, 2004).
172
The second study involves research-based approach including the use of decision-making
games (Duke and Geurts, 2001) and was designed and carried out according to experimental
methodology. The scope of the study and the research questions were defined, and the stage
of data collection and processing was followed by formation of hypotheses and verification
thereof. The study featured also a control group which was used as a reference for the study
results. The aim of that experiment was to obtain the answer to the research questions, to
verify the applied method, and to test the selected tool. The key to conducting research
experiments featuring simulation games is careful and precise design of the course of the
experiment and the level of control over it (Meijer, 2009). The study was innovative in that
both quantitative and qualitative methods were used in the process of data collection and
processing.
173
5.5.1 The impact of cognitive assessment system of a team on the free rider problem in
decision-making game-based courses
5.5.1.1 Introduction
One of the increasingly visible problems observed during courses featuring business
simulation games is the so-called free rider problem. A free rider is a person who inhibits the
progress of their team and expects to receive a positive assessment because the system of
assessment is based on group performance.
5.5.1.2 Assessment system
Application of a system of assessment of class participants is not a new concept, but looking
at the free rider problem from the perspective of the game theory and setting it against the
applied system of assessment may result in new valuable observations. Students from the
study group were allowed to join and form teams by themselves, ensuring that each group was
composed of 4-6 persons. The facilitator could intervene only when a student could not find a
team, or in conflictual situations – in such cases, students were assigned to teams at random
(though such situation did not happen in the discussed experiment). Team performance is
measured by means of a system based on many criteria: 50% of the final result is the game
score measured using the method of balanced scorecard, 35% of the result is a written
assignment in the form of a business plan, and the remaining 15% is awarded for the final
report in the form of a presentation delivered in the class. Students gain points in each of the
three areas and the pool is relative to the size of their team. In the classical assessment system,
points would be divided equally between team members, but in the cognitive system, students
are free to divide the points from their pool as long as they are able to reach a majority
agreement. After the class, they have one week to find the solution and provide their
agreement in writing.
5.5.1.3 Logic
The standard system of equal distribution of points between team members works in favor of
free riders, since an even division constitutes an optimal strategy from a free rider’s
perspective. Thus, if other team members can affect the assessment of a free rider in their
team, it may discourage potential free riders from using such strategy. Moreover, even if one
of team members adopts a free rider attitude and is assessed lower because of uneven
distribution of points, the final assessment will be more adequate and should reduce the sense
of unfairness among the hard-working team members. The covert idea of this assessment
174
system is not to promote a free rider attitude, but to discourage free riders and to provide the
active team members with tools to influence their decision-making strategy.
Of course, there is always a risk that the majority of students will adopt a free rider attitude
and outvote the active team members, but it can be minimized if students are able to organize
themselves into groups of more than 3 members (Biggs, 1986; Brozik, Cassidy and Brozik,
2008; Cassidy and Brozik, 2009; Fritzsche and Cotter, 1990; Gentry, 1980; Wolfe and
Chacko, 1983; Wilson, 1974). Free riders prefer larger groups (Thavikulwat and Chang,
2010) with a smaller number of free riders inside, since they aim to receive as good
assessment as possible. Teams with several free riders have a lower potential of achieving a
good assessment; larger teams make it easier to “hide oneself” and avoid or minimize one’s
involvement in teamwork. That is why free riders are more likely to choose bigger groups.
5.5.1.4 Procedure
The conducted course in the scope of business simulation games involves a workshop based
on Marketplace© computer simulation, participated by students of the sixth semester of
management and finance. The course features a game with a standard scenario of a new
company, divided into 8 decision-making rounds (Cadotte, Bruce, 2008). During working
with simulation and tasks, more or less in the middle of the course, the students were asked to
fill a short survey concerning their impressions and preference regarding the system of
assessment. They were not familiarized with the objective of the research.
The survey contained 5 questions, and the students were to provide only the names of their
teams, which granted anonymity and made it possible to identify the size of the teams and the
results of the game (a specimen of the survey is provided in appendix no. 4). The questions
concerned:
• understanding of the assessment system,
• preferences in terms of the style of assessment –team versus individual achievements,
• impressions concerning the ability to influence the distribution of points,
• preferences in terms of the final distribution of points (even vs diversified share),
• opinions on the fairness of the given assessment system.
After the course ended, the data set was supplemented by the game results, the average
decision-making time per team member (measured by the system), and the final distribution
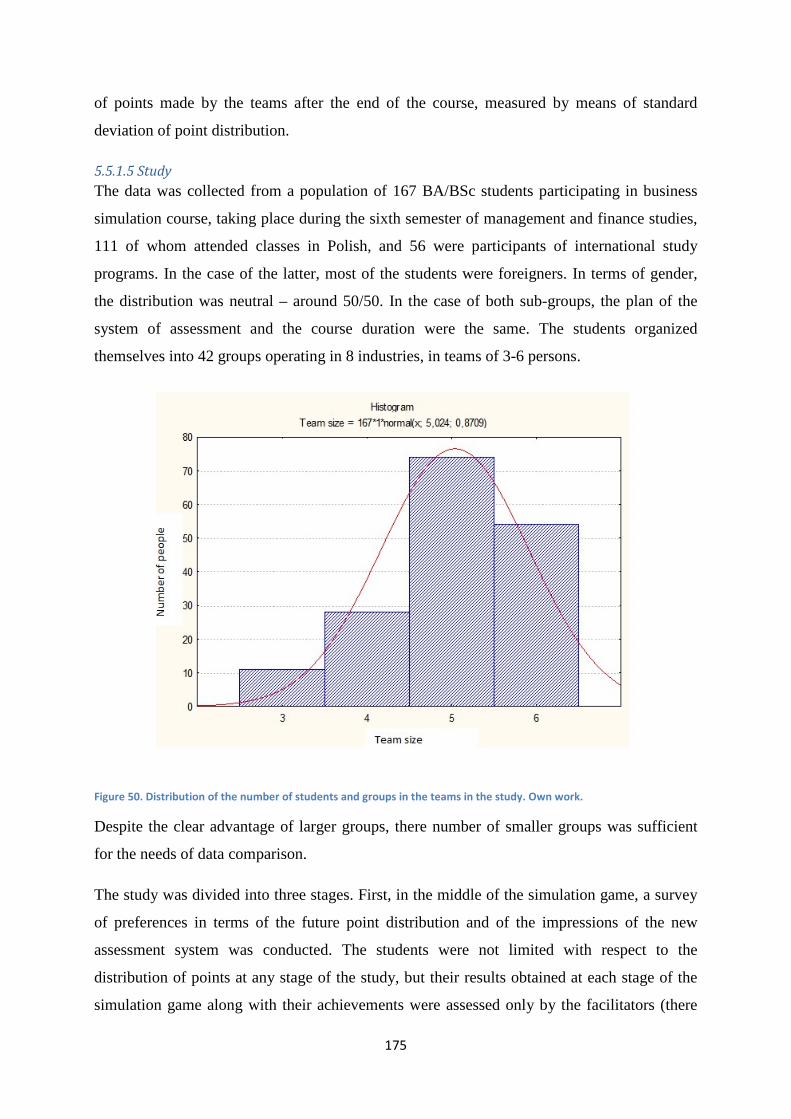
175
of points made by the teams after the end of the course, measured by means of standard
deviation of point distribution.
5.5.1.5 Study
The data was collected from a population of 167 BA/BSc students participating in business
simulation course, taking place during the sixth semester of management and finance studies,
111 of whom attended classes in Polish, and 56 were participants of international study
programs. In the case of the latter, most of the students were foreigners. In terms of gender,
the distribution was neutral – around 50/50. In the case of both sub-groups, the plan of the
system of assessment and the course duration were the same. The students organized
themselves into 42 groups operating in 8 industries, in teams of 3-6 persons.
Figure 50. Distribution of the number of students and groups in the teams in the study. Own work.
Despite the clear advantage of larger groups, there number of smaller groups was sufficient
for the needs of data comparison.
The study was divided into three stages. First, in the middle of the simulation game, a survey
of preferences in terms of the future point distribution and of the impressions of the new
assessment system was conducted. The students were not limited with respect to the
distribution of points at any stage of the study, but their results obtained at each stage of the
simulation game along with their achievements were assessed only by the facilitators (there
176
was no peer-to-peer assessment). Hence, before the research hypotheses were formulated, the
following questions were set (at the stage of study design):
a. Do students understand the new system of assessment?
b. How is the new system of assessment perceived?
c. What are the preferences of students in terms of the influence on the final distribution
of points?
d. How will they vote with respect to point distribution?
The second part of the study involved a comparison of the preferences of the students with the
actual distribution of points measured by means of standard deviation of point distribution and
of the relationship between the team size and the distribution of points. Moreover, this part of
the study involved also an in-depth investigation of the relationship between the distribution
of points and the game result, and measurement of the actual average time spent on making a
decision on-line per one student in a group. The following research questions were formulated
at this stage of the study:
a. Did the students manage to make the distribution of points in the preferred way?
b. Do bigger teams choose to divide the points unevenly more often than smaller teams?
c. Is there a relationship between the team game result and the distribution of points?
d. Is there a relationship between the average time spent on making a decision on-line
per one student in a group and the distribution of points?
The idea is to analyze the free rider problem from the perspective of student preferences, and
from the point of view of the process aimed to end with final assessment.
5.5.1.6 Hypotheses
The free rider problem is a significant issue occurring in education processes based on
cooperation (Markulis and Strang, 1995), and can be very harmful from the social and
functional point of view. The fact that the students were able to organize themselves into
groups and decide on the size of their teams was important, as they could know who was a
free rider, and who was not.
H1: Most students understand the system of assessment and have a certain opinion about it.
This hypothesis is quite obvious on the one hand, but indispensable on the other, as such
assessment system was introduced to students for the first time and was much more complex
than other system they had had to deal with before. What is more, this hypothesis includes
177
further hypotheses based on the claim that course participants have the awareness of
possibility to affect the final assessment (Hall and Ko, 2006; Malik and Strang, 1998; Morse,
2003; Payne and Whittaker, 2005; Poon, 2002).
H2: Most students will have a clear opinion about the system of assessment.
The opinions about the new system of assessment may be divided, and the population will
probably split into two sub-groups. The first sub-group will find the system attractive and
view it as a chance for a fairer assessment of their work. The other sub-group will find it
unattractive or will perceive it as a threat to adoption of the free rider attitude. This hypothesis
is to some extent a test of correctness of fundamental assumptions claiming that free riders
will not like this assessment system and will express their dissatisfaction (Krajbich, Camerer,
Ledyard and Rangel, 2009), partially betraying their preferences.
H3: Larger teams choose to divide the points unevenly more often than smaller teams.
This hypothesis is based on the assumption that free riders tend to choose larger groups
(Thavikulwat and Chang, 2010), so the probability of an uneven distribution of points
increases. Moreover, it confirms the claim that such system of assessment eliminates the
differences in assessment of groups potentially affected by the free rider problem.
H4: Teams which achieve higher results in the simulation make a more even point
distribution than teams with lower results.
The assumption that a team with no free rider problem achieves better results in simulation
than a team which faces such problem may be a bit exaggerated, but not groundless (Markulis
and Strang, 1995; Wardaszko, 2007). According to this assumption, teams that score higher
will have even fewer reasons to divide the points unevenly.
H5: Teams with a higher actual average time spent on making decisions on-line will make a
more even point distribution than teams with a lower average.
One of the elements of the free rider problem in the case of this particular simulation game is
the actual time spent on browsing through data and making the decision on-line (Wardaszko,
2007), since the system monitors all of the actions taken and stops counting if a given user is
inactive for more than 5 minutes. Potential free riders will reduce the average time of the
whole team. Thus, a team with a shorter average time will be at risk of experiencing the free
rider problem.
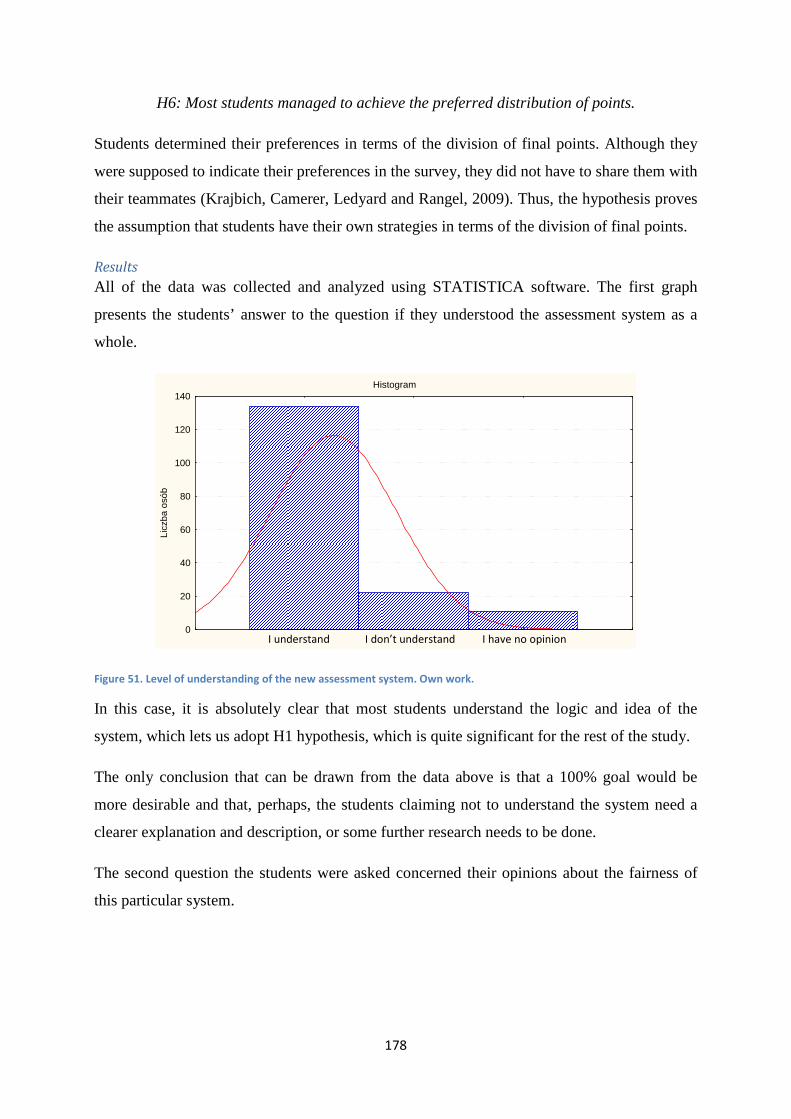
178
H6: Most students managed to achieve the preferred distribution of points.
Students determined their preferences in terms of the division of final points. Although they
were supposed to indicate their preferences in the survey, they did not have to share them with
their teammates (Krajbich, Camerer, Ledyard and Rangel, 2009). Thus, the hypothesis proves
the assumption that students have their own strategies in terms of the division of final points.
Results
All of the data was collected and analyzed using STATISTICA software. The first graph
presents the students’ answer to the question if they understood the assessment system as a
whole.
Histogram
0
20
40
60
80
100
120
140
Licz
ba o
sób
Figure 51. Level of understanding of the new assessment system. Own work.
In this case, it is absolutely clear that most students understand the logic and idea of the
system, which lets us adopt H1 hypothesis, which is quite significant for the rest of the study.
The only conclusion that can be drawn from the data above is that a 100% goal would be
more desirable and that, perhaps, the students claiming not to understand the system need a
clearer explanation and description, or some further research needs to be done.
The second question the students were asked concerned their opinions about the fairness of
this particular system.
I understand I don’t understand I have no opinion
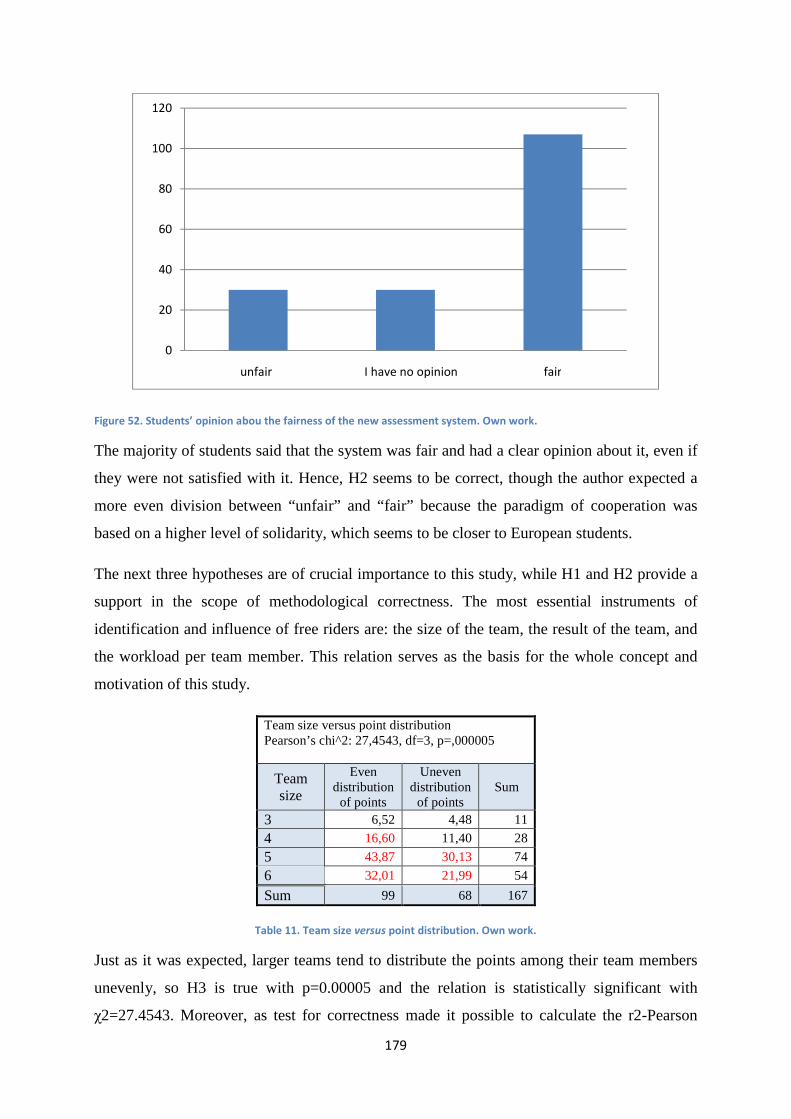
179
Figure 52. Students’ opinion abou the fairness of the new assessment system. Own work.
The majority of students said that the system was fair and had a clear opinion about it, even if
they were not satisfied with it. Hence, H2 seems to be correct, though the author expected a
more even division between “unfair” and “fair” because the paradigm of cooperation was
based on a higher level of solidarity, which seems to be closer to European students.
The next three hypotheses are of crucial importance to this study, while H1 and H2 provide a
support in the scope of methodological correctness. The most essential instruments of
identification and influence of free riders are: the size of the team, the result of the team, and
the workload per team member. This relation serves as the basis for the whole concept and
motivation of this study.
Team size versus point distribution Pearson’s chi^2: 27,4543, df=3, p=,000005
Team size
Even distribution of points
Uneven distribution of points
Sum
3 6,52 4,48 11
4 16,60 11,40 28
5 43,87 30,13 74
6 32,01 21,99 54
Sum 99 68 167
Table 11. Team size versus point distribution. Own work.
Just as it was expected, larger teams tend to distribute the points among their team members
unevenly, so H3 is true with p=0.00005 and the relation is statistically significant with
χ2=27.4543. Moreover, as test for correctness made it possible to calculate the r2-Pearson
0
20
40
60
80
100
120
unfair I have no opinion fair
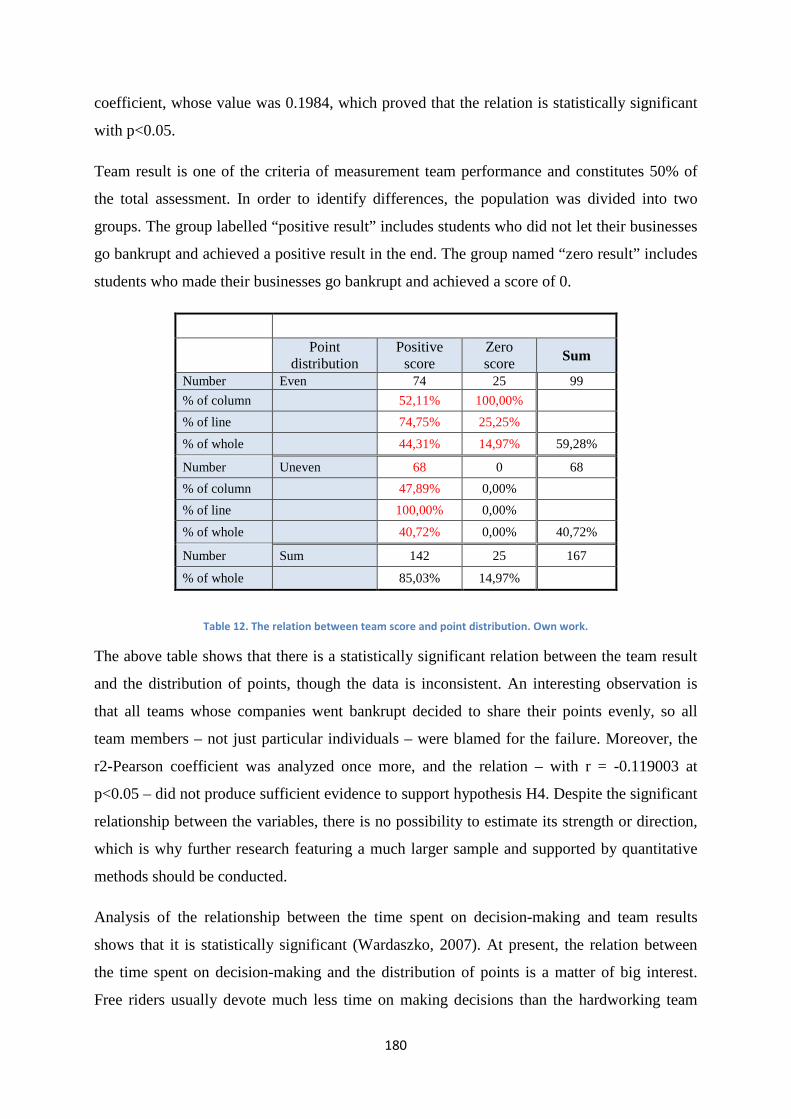
180
coefficient, whose value was 0.1984, which proved that the relation is statistically significant
with p<0.05.
Team result is one of the criteria of measurement team performance and constitutes 50% of
the total assessment. In order to identify differences, the population was divided into two
groups. The group labelled “positive result” includes students who did not let their businesses
go bankrupt and achieved a positive result in the end. The group named “zero result” includes
students who made their businesses go bankrupt and achieved a score of 0.
Point distribution
Positive score
Zero score Sum
Number Even 74 25 99
% of column 52,11% 100,00%
% of line 74,75% 25,25%
% of whole 44,31% 14,97% 59,28%
Number Uneven 68 0 68
% of column 47,89% 0,00%
% of line 100,00% 0,00%
% of whole 40,72% 0,00% 40,72%
Number Sum 142 25 167
% of whole 85,03% 14,97%
Table 12. The relation between team score and point distribution. Own work.
The above table shows that there is a statistically significant relation between the team result
and the distribution of points, though the data is inconsistent. An interesting observation is
that all teams whose companies went bankrupt decided to share their points evenly, so all
team members – not just particular individuals – were blamed for the failure. Moreover, the
r2-Pearson coefficient was analyzed once more, and the relation – with r = -0.119003 at
p<0.05 – did not produce sufficient evidence to support hypothesis H4. Despite the significant
relationship between the variables, there is no possibility to estimate its strength or direction,
which is why further research featuring a much larger sample and supported by quantitative
methods should be conducted.
Analysis of the relationship between the time spent on decision-making and team results
shows that it is statistically significant (Wardaszko, 2007). At present, the relation between
the time spent on decision-making and the distribution of points is a matter of big interest.
Free riders usually devote much less time on making decisions than the hardworking team
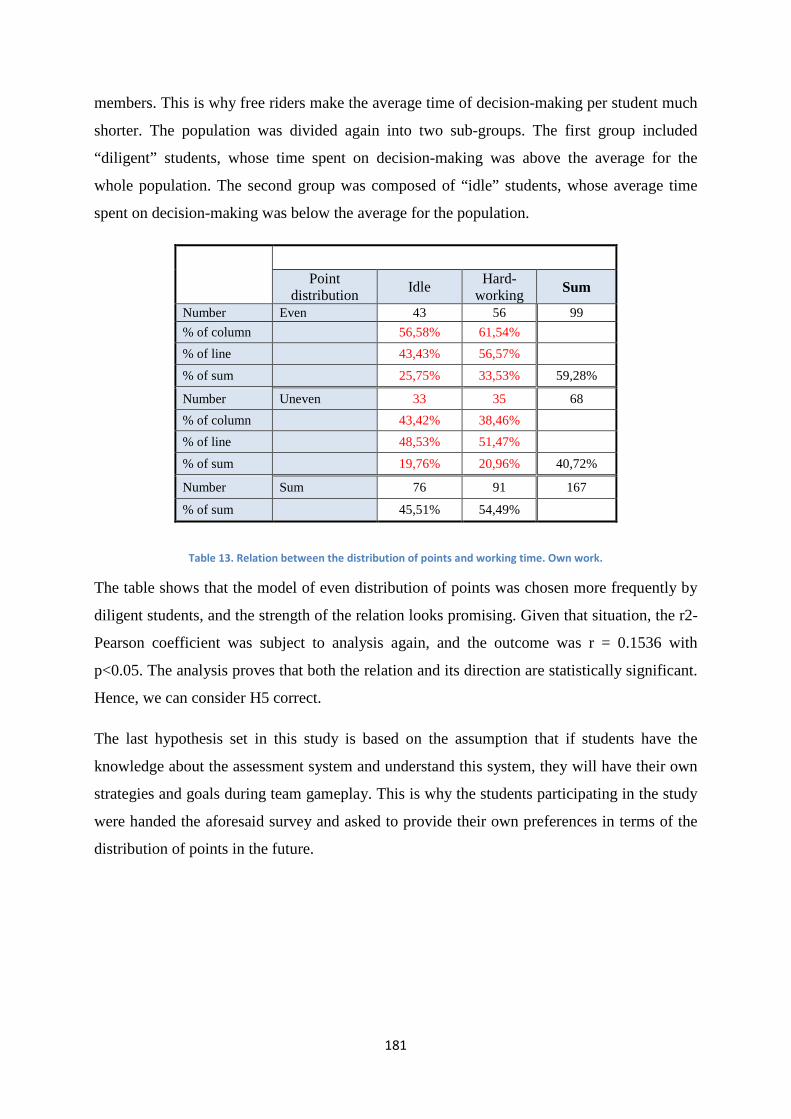
181
members. This is why free riders make the average time of decision-making per student much
shorter. The population was divided again into two sub-groups. The first group included
“diligent” students, whose time spent on decision-making was above the average for the
whole population. The second group was composed of “idle” students, whose average time
spent on decision-making was below the average for the population.
Point distribution
Idle Hard-
working Sum
Number Even 43 56 99
% of column 56,58% 61,54%
% of line 43,43% 56,57%
% of sum 25,75% 33,53% 59,28%
Number Uneven 33 35 68
% of column 43,42% 38,46%
% of line 48,53% 51,47%
% of sum 19,76% 20,96% 40,72%
Number Sum 76 91 167
% of sum 45,51% 54,49%
Table 13. Relation between the distribution of points and working time. Own work.
The table shows that the model of even distribution of points was chosen more frequently by
diligent students, and the strength of the relation looks promising. Given that situation, the r2-
Pearson coefficient was subject to analysis again, and the outcome was r = 0.1536 with
p<0.05. The analysis proves that both the relation and its direction are statistically significant.
Hence, we can consider H5 correct.
The last hypothesis set in this study is based on the assumption that if students have the
knowledge about the assessment system and understand this system, they will have their own
strategies and goals during team gameplay. This is why the students participating in the study
were handed the aforesaid survey and asked to provide their own preferences in terms of the
distribution of points in the future.
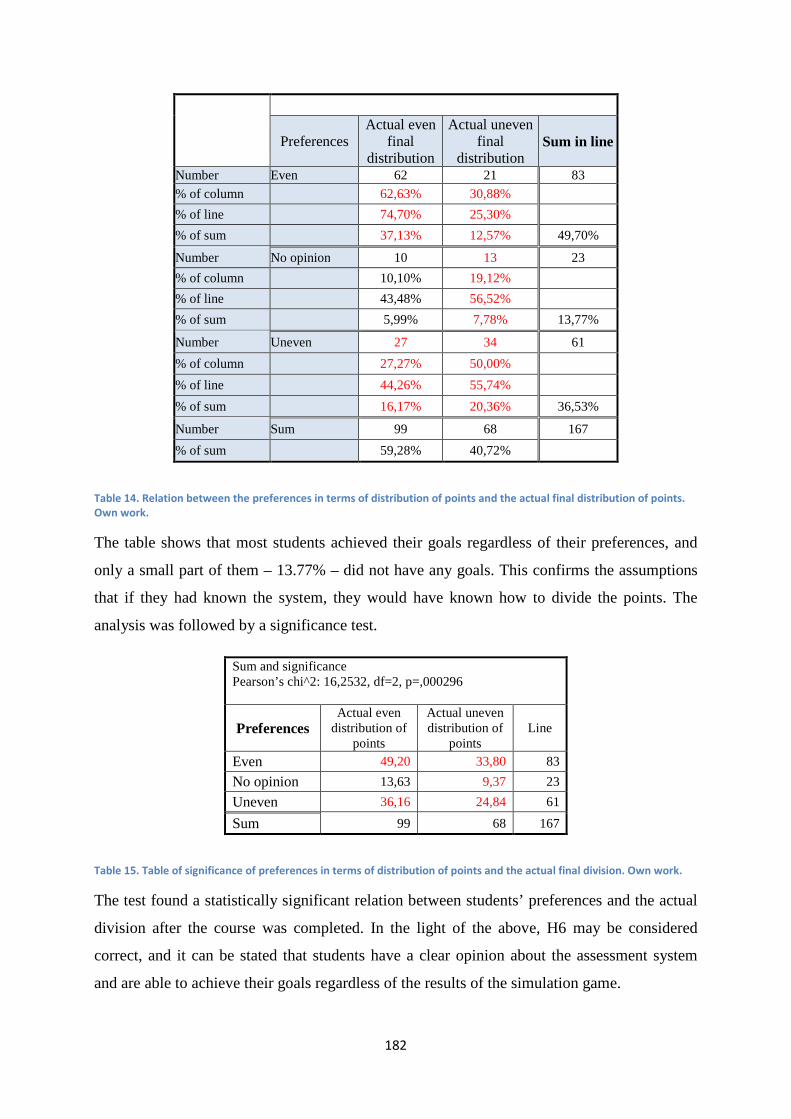
182
Preferences Actual even
final distribution
Actual uneven final
distribution Sum in line
Number Even 62 21 83
% of column 62,63% 30,88%
% of line 74,70% 25,30%
% of sum 37,13% 12,57% 49,70%
Number No opinion 10 13 23
% of column 10,10% 19,12%
% of line 43,48% 56,52%
% of sum 5,99% 7,78% 13,77%
Number Uneven 27 34 61
% of column 27,27% 50,00%
% of line 44,26% 55,74%
% of sum 16,17% 20,36% 36,53%
Number Sum 99 68 167
% of sum 59,28% 40,72%
Table 14. Relation between the preferences in terms of distribution of points and the actual final distribution of points.
Own work.
The table shows that most students achieved their goals regardless of their preferences, and
only a small part of them – 13.77% – did not have any goals. This confirms the assumptions
that if they had known the system, they would have known how to divide the points. The
analysis was followed by a significance test.
Sum and significance Pearson’s chi^2: 16,2532, df=2, p=,000296
Preferences Actual even
distribution of points
Actual uneven distribution of
points Line
Even 49,20 33,80 83
No opinion 13,63 9,37 23
Uneven 36,16 24,84 61
Sum 99 68 167
Table 15. Table of significance of preferences in terms of distribution of points and the actual final division. Own work.
The test found a statistically significant relation between students’ preferences and the actual
division after the course was completed. In the light of the above, H6 may be considered
correct, and it can be stated that students have a clear opinion about the assessment system
and are able to achieve their goals regardless of the results of the simulation game.
183
5.5.1.7 Summary
As it results from the data collected and analyzed as part of the discussed study, there is a
sufficiently strong relationship between the assessment system and the free rider problem.
Most of the formulated hypotheses appeared to be correct, except for the relation between the
time spent on decision-making and the division of final points.
The main objective of this study is to help develop a better system of assessment and
measurement of achievements – one that could help limit the free rider problem and would
not encourage learners to adopt such attitude. Just like Thavikulwat and Chang (2010), the
author supports Hornaday’s idea (2001) according to which the free rider problem is a serious
and increasingly common issue in the case of common implementation of mutual evaluation
systems. From among the studied population, 38.1% of teams decided to diversify the number
of points awarded to team members. Taking an ideal model into account, where Nash
equilibrium of optimal distribution of points means even share, we could claim that nearly
40% of the population opted for a solution against Nash equilibrium, and minimized the free
rider problem – or maybe just the sense of unfairness. Moreover, after the comparison of e.g.
the average time spent on decision-making with the average team result after introduction of
the new assessment system, both of these levels increased by 10%. It is still difficult to say
that such solution is more effective than a standard system of mutual evaluation, as we do not
know the number of potential free riders resigning from this strategy because they were
discouraged by the prospect of achieving a lower result.
There are, of course, many new issues and assumptions requiring further research, like e.g.
identification of free riders and discovering the motivation of free riders and of the
hardworking part of the population. Such data may be valuable for creation of even better
systems of assessment and achievement measurement, which would, in turn, make it possible
to develop and offer more effective courses.
The study discussed above provides a somewhat limited – though hopefully innovative – view
of the free rider problem, which is a phenomenon widespread over business simulation
courses.
184
5.5.2 A game inside a simulation game – the concept and design of research method
5.5.2.1 Introduction
Contemporary studies often raise the question of students’ motivation to participate in classes
in the scope of business simulation games (e.g. Yakonich, Cannon and Ternan, 1997; Burns
and Gentry, 1996, 1998). With respect to the author’s research interests concerning the
relation between systems of assessment and the free rider problem, one of the issues raised by
students participating in business simulation games was the desire to be evaluated for both
individual and group achievements. On the other hand, students of business studies encounter
many different games in the course of their education. When they play a game for the first
time, they are attracted by the sense of ‘newness’ and unfamiliarity with the theme, but with
the third of fourth attempt, they lose their concentration and motivation. After these two
problems were identified, the idea to extend classical business simulation game by integrating
another game into its structure was born.
5.5.2.2 Idea
The main question considered by the author was how to increase the motivation and
involvement of students and to implement a system of individual assessment into the structure
of courses in the scope of simulation games. First, the goal was to take a closer look at the
method of mutual evaluation which actually gave no clear evidence – both in theory
(Scherpereel, 2009 et al.; the issue was also broadly discussed in ABSEL articles) and in
practice – to be of benefit to the game; furthermore, it was considered by students to be yet
another test or task. The author’s intention was to motivate students, not burden them, hence
the concept of gamification was born (Selen and Zimmerman, 2004; Koster, 2005; Reeves
and Read, 2009; Cunnigham and Zichermann, 2011) and the idea of implementing game
mechanics into individual tasks was introduced for the first time.
The concept emerged based on earlier ideas, such as the possibility of free distribution of
points among the members of teams participating in courses in the scope of business
simulation games, which are actually a form of social games (Sutton–Smith, 2001). Another
key idea was the design of simulation of a stock exchange game, which never came to being
because of the high costs of designing the system and of the input data. Moreover, almost
every course featured a certain question by students, asked as a joke and a kind of challenge;
that question was: “Can we buy the competition?”
185
The concept which originated from the abovementioned smaller ideas and presentations was
to create another – investment-type – game that could be played simultaneously with the
business simulation game. In order to motivate students, the investment game should be
simple, interesting, and offer a reward for achievements and involvement. The business
simulation game is the source of input data and functions as the first stage of
interest/involvement. The design of the game assumes that any game which generates
stock/share prices and basic financial statements can be the “mother game”.
The first objective of teaching through such investment game is not to teach students the
theory and practice of investment (although after the game, students began to apply various
investment strategies), but to motivate them to analyze financial statements and the
competition, and to plan their strategies in a careful way. Another advantage of the game is
that it may encourage potential free riders to become active, since the game involves
individual assessment.
Another objective of this type of game is to create an investment game serving as a research
instrument, since it collects data on an individual level in a similar way to the dynamic
decision-making process and man-computer interactions (Sternberg and Gonzalez et al.). We
can support students in decision-making both individually and collectively. Also, adding or
removing certain elements of the structure of the game makes it possible to carry out cross-
sectional analyses, to draw conclusions, and to measure the impact on achievements of both
individual students and whole groups.
5.5.2.3 Game structure, design, and rules
The double-game structure was basically designed for post-graduate students, but it is also
possible to implement it into graduate studies. Grades for classes in the scope of business
simulation are awarded on the basis of group achievements, while the investment game
focuses on the achievements of individual players. In the case of a typical business
simulation, achievements are composed of: value of a company at the end of the game (40%),
analytical documents and a written assignment describing the strategy (40%), and a final
presentation of team achievements including a step-by-step analysis of team strategy (20%).
The duration of the whole course is 20-30 hours. After the initial enthusiasm among students
abates, the level of their motivation usually keeps decreasing as the game progresses. It is then
when they should be introduced to the second game, where the assessment of group results
186
will at first constitute 80% of the final result, and the remaining 20% will be based on
individual assessment as part of the investment game.
“Mother-game” is a highly complex interactive managerial simulation played on a highly
competitive market, and generates a big amount of data on account of the fact that the
simulated company features a full module of accounting/reporting based on American GAAP
accounting standards. Moreover, the “mother-game” is placed in a dynamic environment
created by means of introduction of a dynamic scenario (a standard scenario, no different
from other scenarios used for classes of this type, was applied during these classes).
The investment game described here was intended to be simple. At the beginning of the
course, each player receives a certain amount of virtual currency (e.g. PLN 100,000.00) which
can be used to buy shares in companies (including own company) taking part in the game.
Each decision-making round allows the players to make their decisions concerning
purchasing/selling/withholding, which need to be effected before the round ends. During the
game, students are able to allocate their share/cash portfolios at their discretion, and at the end
of each round, they receive a summary of values of individual accounts.
In the “mother-game”, the management board may pay dividends to the shareholders in the
amount of 10 to 30% of net profit; in such cases, the resources allocated for dividends are to
be transferred to personal accounts depending on the amount of shares in possession. The
investment-related decisions made by students do not affect the price of share in the “mother-
game”, as they are based on the ‘small investor’ principle (the initial capital of a single
company in the “mother-game” is 50 million). Moreover, the amount of shares in the whole
game is fixed, and students may not buy shares on the market (this option was removed from
the game for simplification reasons, but may be introduced in the future). The aim of the
investment game will be the maximization of the initial value of the capital, measured based
on the average profit of the simulated industry plus 1%. This aim is both dynamic and
feasible. On the one hand, it makes students take action, and on the other, is viewed as
achievable. The rules of assessment are simple – if the value of the portfolio exceeds a certain
threshold (the average profit of the simulated industry plus 1%), then the owner of the
portfolio obtains 100% of the achievable points. If this value is lower, 50% of points is
awarded. There is no penalty for cash loss or inactivity. The author is in favor of gamification
principles (Koster, 2005; Cunnigham and Zichermann, 2011) which state that the lack of
reward and the pressure of the society grant sufficient motivation and sustain the interest.
187
After the accounts are assigned, the names of the students are hidden. In order to make it
possible to students to compare their results with other players, each player will be able to
view the ranking with the statuses of accounts – with their numbers only, which will, of
course, be known to their owners. Account numbers will be generated at random and assigned
automatically to each student.
5.5.2.4 Experiment
The new game model and implementation thereof into the mechanism of the course, the social
structure, and the systems of assessment give grounds to many questions and unknowns,
which is why the author decided to conduct a test on a small group of students participating in
one such course. The main aim of this experiment was to test the mechanism of the game and
to monitor student behavior. The secondary aim was to collect and analyze data concerning
that mechanism.
According to the experimental paradigm, no hypotheses were formulated in the case of this
study. However, there were a couple of research questions raised at the beginning of the
project, including the following:
1. Is the investment game absorbing (interesting) enough?
2. Is the investment game intuitive (is it easy to play)?
3. Is the aim of the investment game feasible? How many players will achieve it?
4. Will the investment game motivate students to conduct a more in-depth data analysis?
5. Will the investment game improve the results in the simulation game?
After obtaining approval from the university authorities, the author created a non-obligatory
course in the scope of advanced strategic business games, which was offered to a group of
full-time and extramural MA/MSc students in the fall semester of the academic year
2011/2012. The course was open to all students except for those studying strategic
management, as in that case the course was obligatory. Within one month, 28 students
enrolled for the course, 26 of whom managed to complete it successfully (two persons had to
withdraw from the course for external reasons). The majority of the participants were students
of management and entrepreneurship (60%); the remaining 40% was composed of students of
other finance-related majors. Apart from several exceptions, the level of grades was rather
below the average.
The course included four meetings taking place on Sundays afternoons, every 2-3 weeks.
Both games were played as part of class activities (exercises). At the beginning of the course,
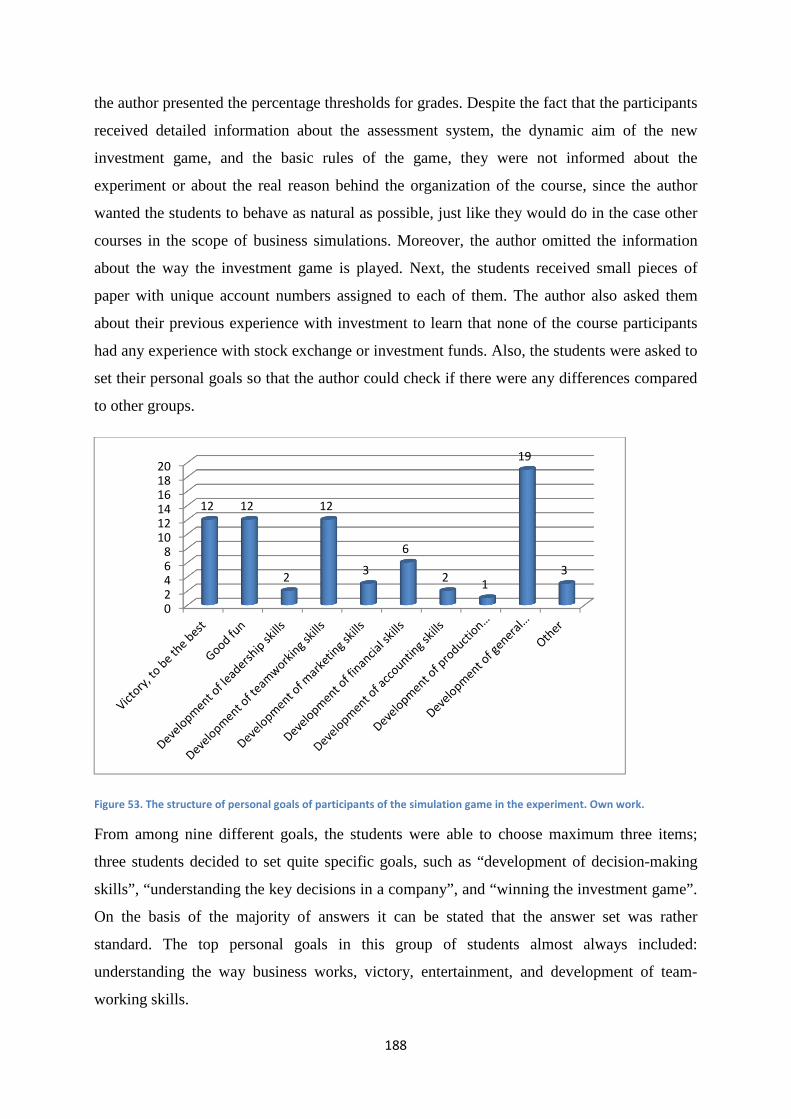
188
the author presented the percentage thresholds for grades. Despite the fact that the participants
received detailed information about the assessment system, the dynamic aim of the new
investment game, and the basic rules of the game, they were not informed about the
experiment or about the real reason behind the organization of the course, since the author
wanted the students to behave as natural as possible, just like they would do in the case other
courses in the scope of business simulations. Moreover, the author omitted the information
about the way the investment game is played. Next, the students received small pieces of
paper with unique account numbers assigned to each of them. The author also asked them
about their previous experience with investment to learn that none of the course participants
had any experience with stock exchange or investment funds. Also, the students were asked to
set their personal goals so that the author could check if there were any differences compared
to other groups.
Figure 53. The structure of personal goals of participants of the simulation game in the experiment. Own work.
From among nine different goals, the students were able to choose maximum three items;
three students decided to set quite specific goals, such as “development of decision-making
skills”, “understanding the key decisions in a company”, and “winning the investment game”.
On the basis of the majority of answers it can be stated that the answer set was rather
standard. The top personal goals in this group of students almost always included:
understanding the way business works, victory, entertainment, and development of team-
working skills.
02468
101214161820
12 12
2
12
3
6
21
19
3
189
The games were started after an introduction and a lecture introducing to the topic of the
mechanism of the “mother-game”. In the “mother-game”, the students organized themselves
into five teams composed of 4-6 persons, and at the beginning of each decision-making round
they were given decision cards along with other materials. The students were asked to return
them before the end of a given decision round. Nobody asked for any additional explanation
concerning making decisions in the investment game during the whole course.
The investment game was played using Excel files. This solution was also used to make
calculations for each account, and the files were stored on the server of the university. The
students made their investment decisions on paper, using a standard form. After each class,
the Excel files with the data and rankings of their company were made available to them
through a university system.
As soon as both of the games ended, the students were asked to fill a short survey
concentrating on their subjective impressions of and opinions about both of those games, the
applied strategies, the sources of information, and the system of assessment.
5.5.2.5 Results
The course ended with both games completed successfully; there were five decision-making
rounds played in both cases. The result analysis will consist of two stages. First, the author
will analyze the behavior and strategic decisions of the students, and then will conduct an
analysis of the data collected through both games.
Before moving to the analysis of student behavior, the author would like to quote a short
conversation between two participants of the course, overheard at the university canteen.
Student A was looking at the sheet with the ranking of investment accounts when Student B
started the conversation.
Student B: How are you doing in the investment game? Are your results okay?
Student A folded the sheet, put it away, and answered: It’s good as long as the value of my
portfolio is higher than yours.
The above anecdote illustrates an example of two significant behaviors typical of the
participants of the experiment. The first type of behavior is the unwillingness to discuss and
share thoughts about the investment game. While the strategic simulation game was a number
one topic for discussion during decision-making rounds and breaks, which is quite common
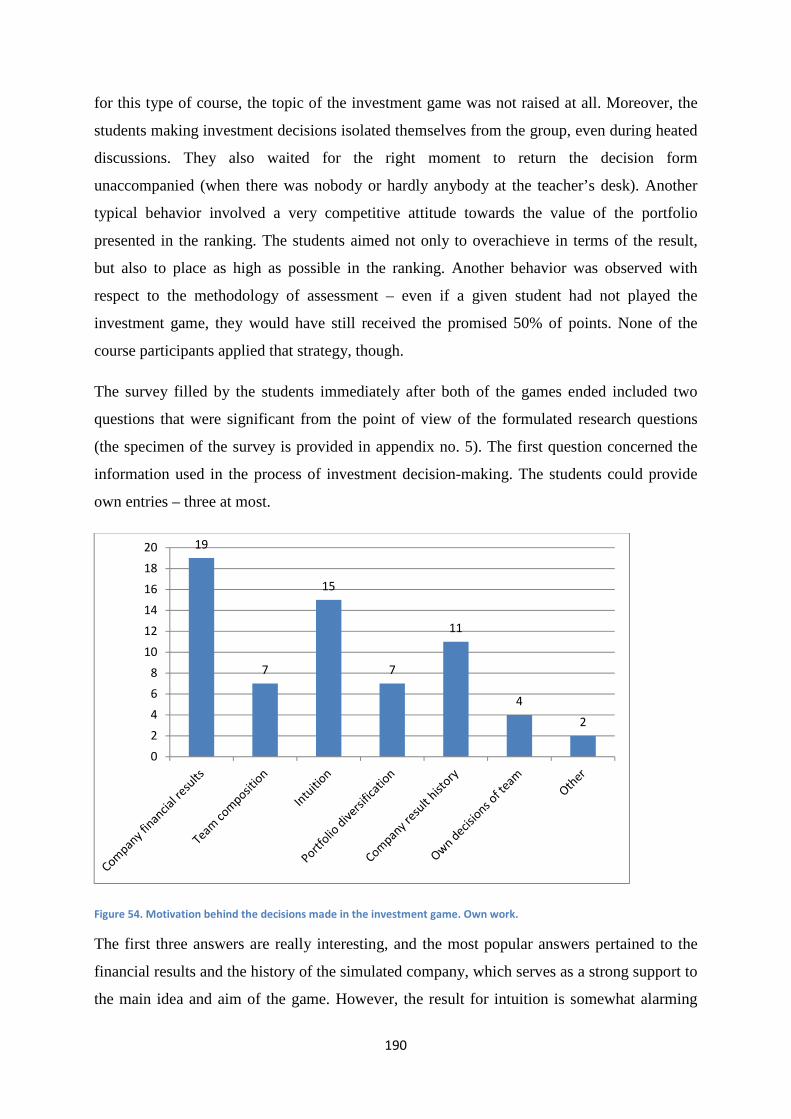
190
for this type of course, the topic of the investment game was not raised at all. Moreover, the
students making investment decisions isolated themselves from the group, even during heated
discussions. They also waited for the right moment to return the decision form
unaccompanied (when there was nobody or hardly anybody at the teacher’s desk). Another
typical behavior involved a very competitive attitude towards the value of the portfolio
presented in the ranking. The students aimed not only to overachieve in terms of the result,
but also to place as high as possible in the ranking. Another behavior was observed with
respect to the methodology of assessment – even if a given student had not played the
investment game, they would have still received the promised 50% of points. None of the
course participants applied that strategy, though.
The survey filled by the students immediately after both of the games ended included two
questions that were significant from the point of view of the formulated research questions
(the specimen of the survey is provided in appendix no. 5). The first question concerned the
information used in the process of investment decision-making. The students could provide
own entries – three at most.
Figure 54. Motivation behind the decisions made in the investment game. Own work.
The first three answers are really interesting, and the most popular answers pertained to the
financial results and the history of the simulated company, which serves as a strong support to
the main idea and aim of the game. However, the result for intuition is somewhat alarming
19
7
15
7
11
4
2
0
2
4
6
8
10
12
14
16
18
20
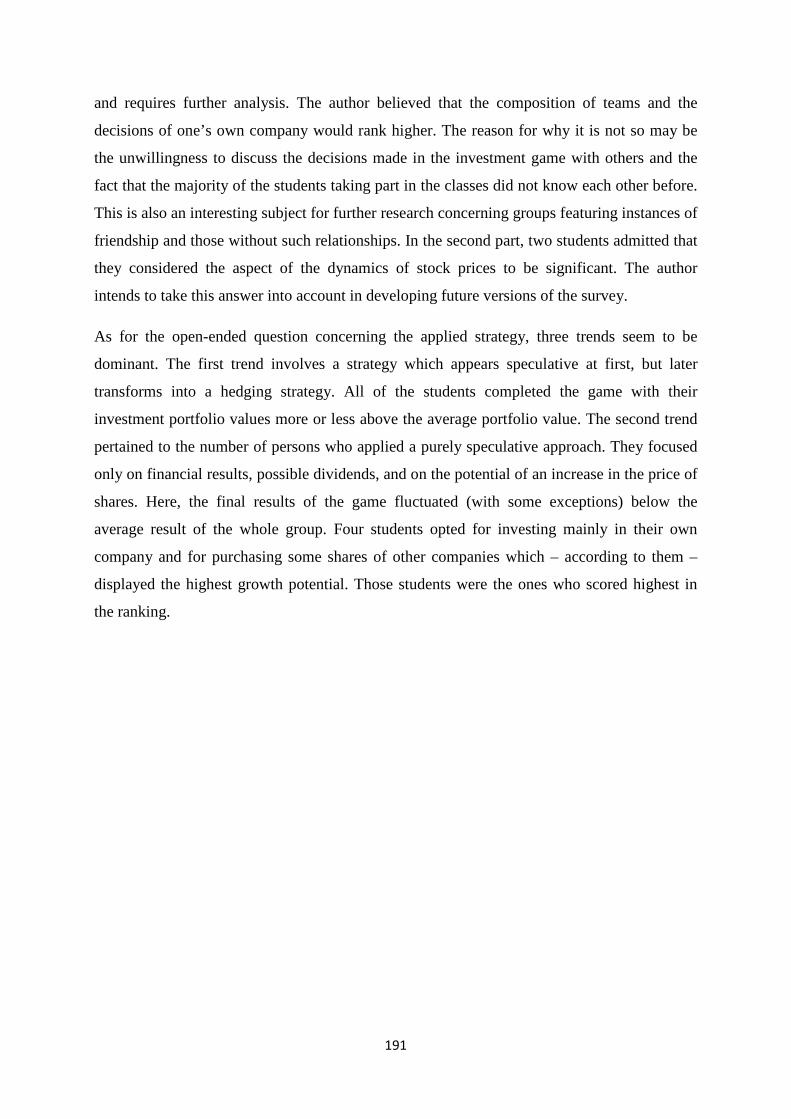
191
and requires further analysis. The author believed that the composition of teams and the
decisions of one’s own company would rank higher. The reason for why it is not so may be
the unwillingness to discuss the decisions made in the investment game with others and the
fact that the majority of the students taking part in the classes did not know each other before.
This is also an interesting subject for further research concerning groups featuring instances of
friendship and those without such relationships. In the second part, two students admitted that
they considered the aspect of the dynamics of stock prices to be significant. The author
intends to take this answer into account in developing future versions of the survey.
As for the open-ended question concerning the applied strategy, three trends seem to be
dominant. The first trend involves a strategy which appears speculative at first, but later
transforms into a hedging strategy. All of the students completed the game with their
investment portfolio values more or less above the average portfolio value. The second trend
pertained to the number of persons who applied a purely speculative approach. They focused
only on financial results, possible dividends, and on the potential of an increase in the price of
shares. Here, the final results of the game fluctuated (with some exceptions) below the
average result of the whole group. Four students opted for investing mainly in their own
company and for purchasing some shares of other companies which – according to them –
displayed the highest growth potential. Those students were the ones who scored highest in
the ranking.
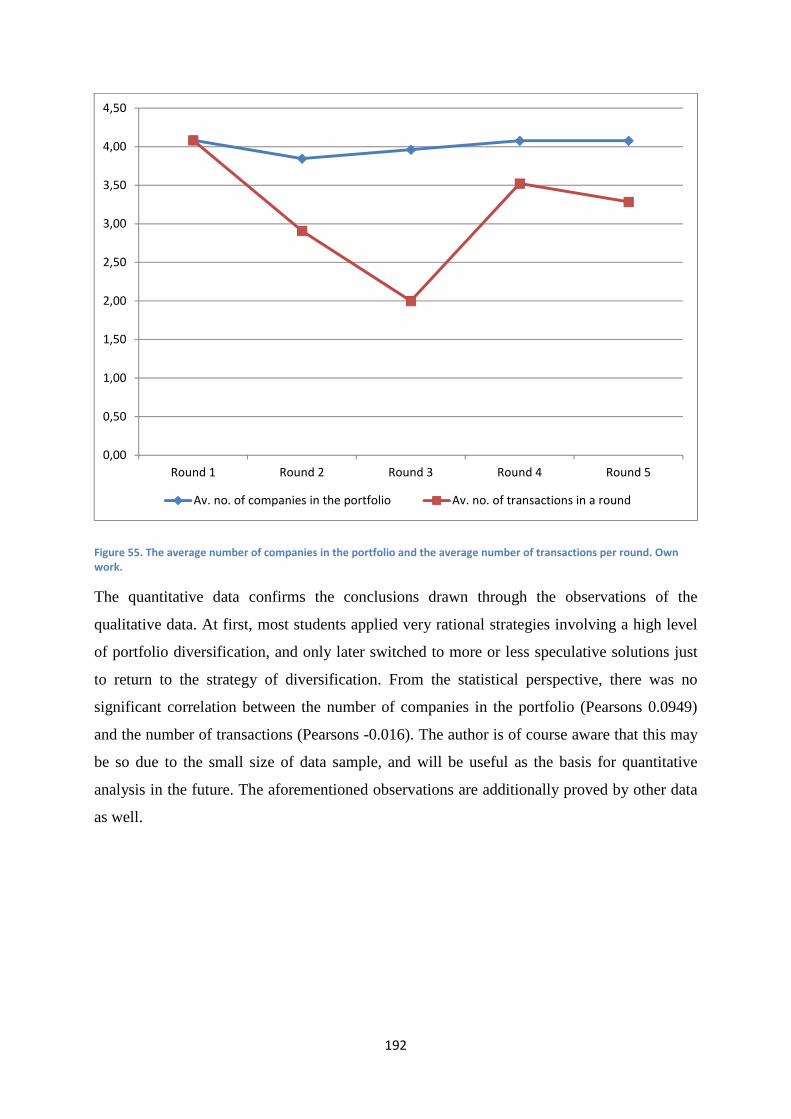
192
Figure 55. The average number of companies in the portfolio and the average number of transactions per round. Own
work.
The quantitative data confirms the conclusions drawn through the observations of the
qualitative data. At first, most students applied very rational strategies involving a high level
of portfolio diversification, and only later switched to more or less speculative solutions just
to return to the strategy of diversification. From the statistical perspective, there was no
significant correlation between the number of companies in the portfolio (Pearsons 0.0949)
and the number of transactions (Pearsons -0.016). The author is of course aware that this may
be so due to the small size of data sample, and will be useful as the basis for quantitative
analysis in the future. The aforementioned observations are additionally proved by other data
as well.
0,00
0,50
1,00
1,50
2,00
2,50
3,00
3,50
4,00
4,50
Round 1 Round 2 Round 3 Round 4 Round 5
Av. no. of companies in the portfolio Av. no. of transactions in a round
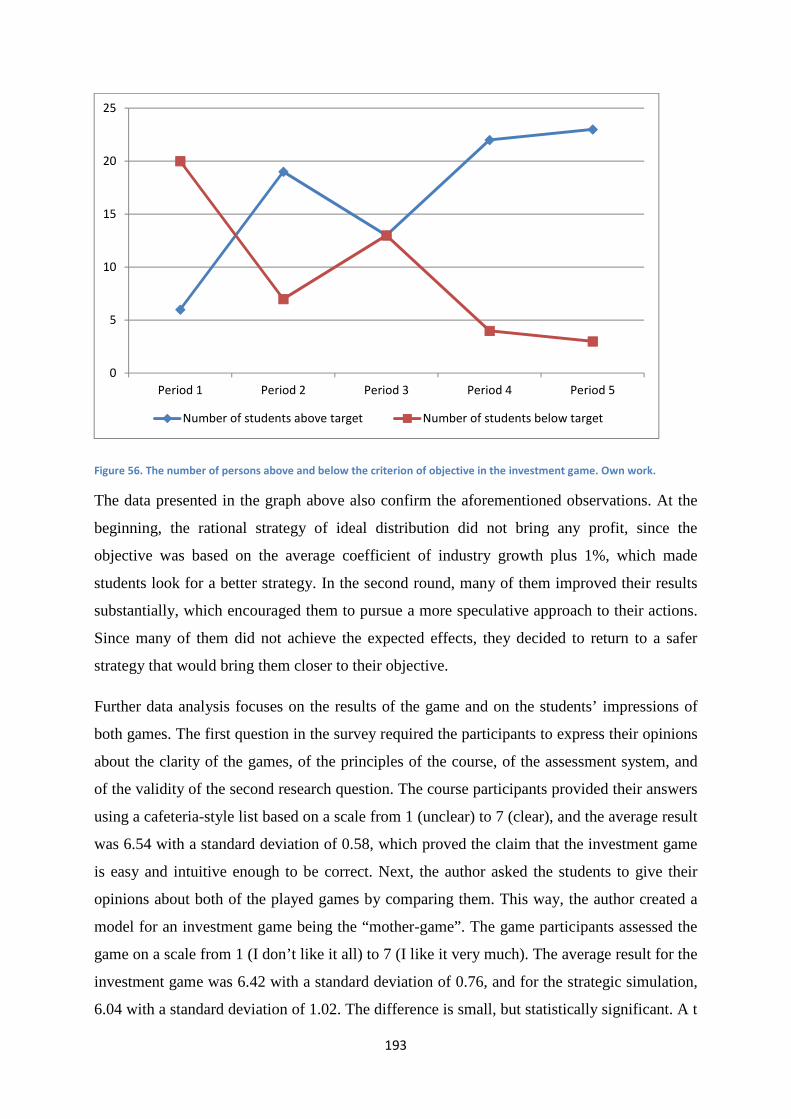
193
Figure 56. The number of persons above and below the criterion of objective in the investment game. Own work.
The data presented in the graph above also confirm the aforementioned observations. At the
beginning, the rational strategy of ideal distribution did not bring any profit, since the
objective was based on the average coefficient of industry growth plus 1%, which made
students look for a better strategy. In the second round, many of them improved their results
substantially, which encouraged them to pursue a more speculative approach to their actions.
Since many of them did not achieve the expected effects, they decided to return to a safer
strategy that would bring them closer to their objective.
Further data analysis focuses on the results of the game and on the students’ impressions of
both games. The first question in the survey required the participants to express their opinions
about the clarity of the games, of the principles of the course, of the assessment system, and
of the validity of the second research question. The course participants provided their answers
using a cafeteria-style list based on a scale from 1 (unclear) to 7 (clear), and the average result
was 6.54 with a standard deviation of 0.58, which proved the claim that the investment game
is easy and intuitive enough to be correct. Next, the author asked the students to give their
opinions about both of the played games by comparing them. This way, the author created a
model for an investment game being the “mother-game”. The game participants assessed the
game on a scale from 1 (I don’t like it all) to 7 (I like it very much). The average result for the
investment game was 6.42 with a standard deviation of 0.76, and for the strategic simulation,
6.04 with a standard deviation of 1.02. The difference is small, but statistically significant. A t
0
5
10
15
20
25
Period 1 Period 2 Period 3 Period 4 Period 5
Number of students above target Number of students below target
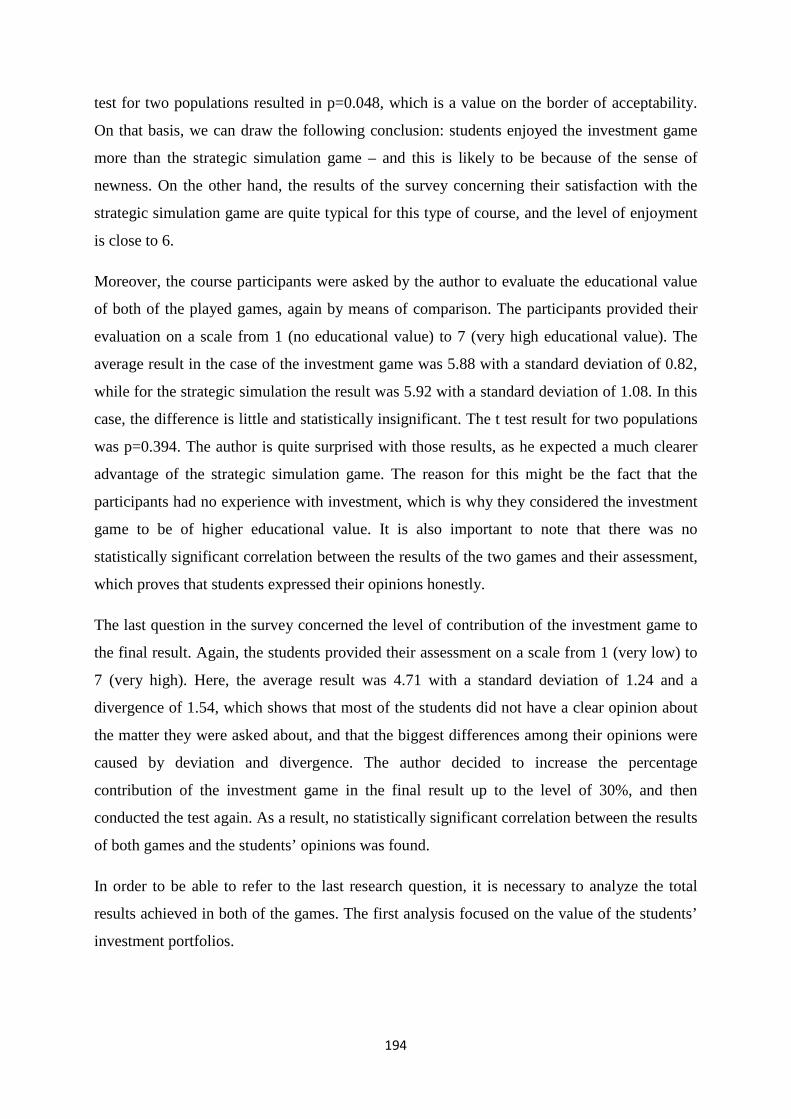
194
test for two populations resulted in p=0.048, which is a value on the border of acceptability.
On that basis, we can draw the following conclusion: students enjoyed the investment game
more than the strategic simulation game – and this is likely to be because of the sense of
newness. On the other hand, the results of the survey concerning their satisfaction with the
strategic simulation game are quite typical for this type of course, and the level of enjoyment
is close to 6.
Moreover, the course participants were asked by the author to evaluate the educational value
of both of the played games, again by means of comparison. The participants provided their
evaluation on a scale from 1 (no educational value) to 7 (very high educational value). The
average result in the case of the investment game was 5.88 with a standard deviation of 0.82,
while for the strategic simulation the result was 5.92 with a standard deviation of 1.08. In this
case, the difference is little and statistically insignificant. The t test result for two populations
was p=0.394. The author is quite surprised with those results, as he expected a much clearer
advantage of the strategic simulation game. The reason for this might be the fact that the
participants had no experience with investment, which is why they considered the investment
game to be of higher educational value. It is also important to note that there was no
statistically significant correlation between the results of the two games and their assessment,
which proves that students expressed their opinions honestly.
The last question in the survey concerned the level of contribution of the investment game to
the final result. Again, the students provided their assessment on a scale from 1 (very low) to
7 (very high). Here, the average result was 4.71 with a standard deviation of 1.24 and a
divergence of 1.54, which shows that most of the students did not have a clear opinion about
the matter they were asked about, and that the biggest differences among their opinions were
caused by deviation and divergence. The author decided to increase the percentage
contribution of the investment game in the final result up to the level of 30%, and then
conducted the test again. As a result, no statistically significant correlation between the results
of both games and the students’ opinions was found.
In order to be able to refer to the last research question, it is necessary to analyze the total
results achieved in both of the games. The first analysis focused on the value of the students’
investment portfolios.
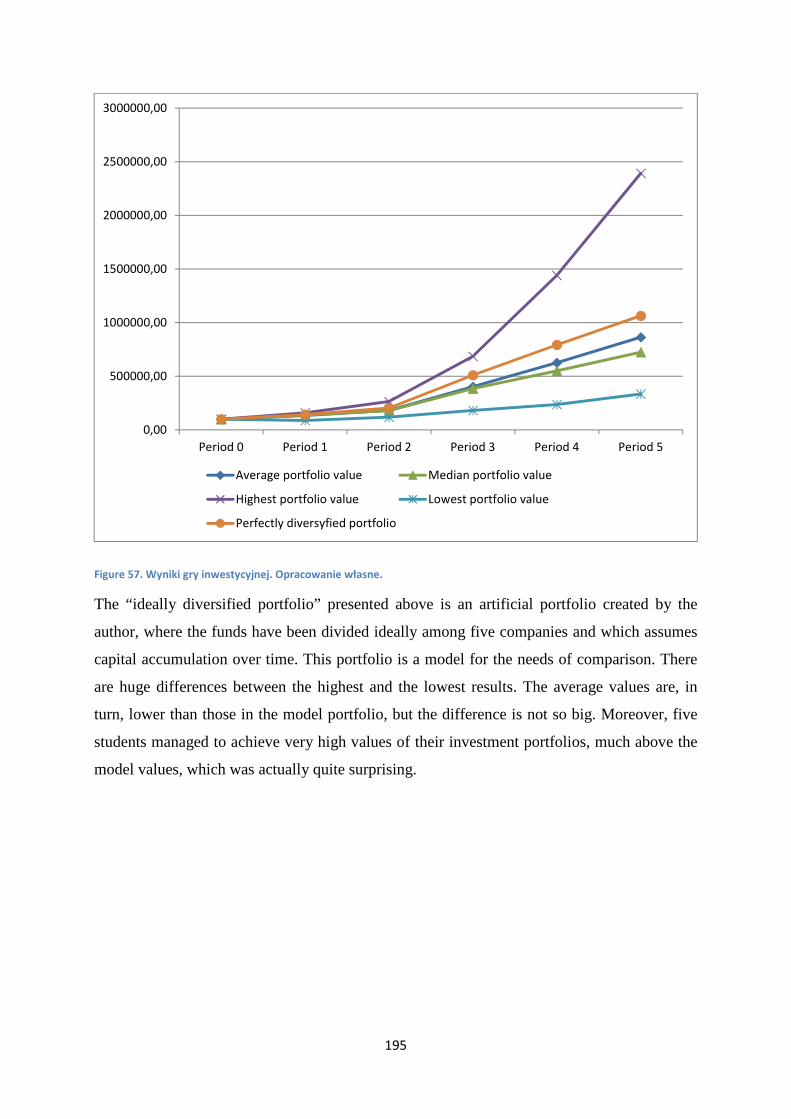
195
Figure 57. Wyniki gry inwestycyjnej. Opracowanie własne.
The “ideally diversified portfolio” presented above is an artificial portfolio created by the
author, where the funds have been divided ideally among five companies and which assumes
capital accumulation over time. This portfolio is a model for the needs of comparison. There
are huge differences between the highest and the lowest results. The average values are, in
turn, lower than those in the model portfolio, but the difference is not so big. Moreover, five
students managed to achieve very high values of their investment portfolios, much above the
model values, which was actually quite surprising.
0,00
500000,00
1000000,00
1500000,00
2000000,00
2500000,00
3000000,00
Period 0 Period 1 Period 2 Period 3 Period 4 Period 5
Average portfolio value Median portfolio value
Highest portfolio value Lowest portfolio value
Perfectly diversyfied portfolio
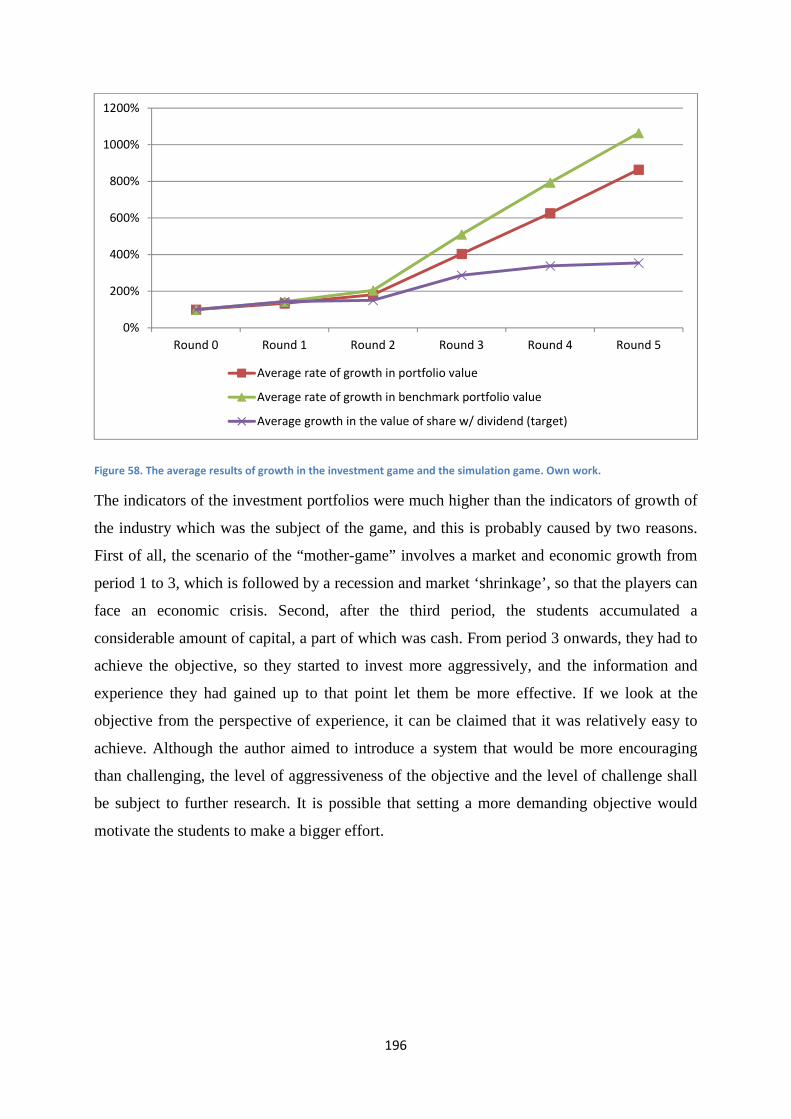
196
Figure 58. The average results of growth in the investment game and the simulation game. Own work.
The indicators of the investment portfolios were much higher than the indicators of growth of
the industry which was the subject of the game, and this is probably caused by two reasons.
First of all, the scenario of the “mother-game” involves a market and economic growth from
period 1 to 3, which is followed by a recession and market ‘shrinkage’, so that the players can
face an economic crisis. Second, after the third period, the students accumulated a
considerable amount of capital, a part of which was cash. From period 3 onwards, they had to
achieve the objective, so they started to invest more aggressively, and the information and
experience they had gained up to that point let them be more effective. If we look at the
objective from the perspective of experience, it can be claimed that it was relatively easy to
achieve. Although the author aimed to introduce a system that would be more encouraging
than challenging, the level of aggressiveness of the objective and the level of challenge shall
be subject to further research. It is possible that setting a more demanding objective would
motivate the students to make a bigger effort.
0%
200%
400%
600%
800%
1000%
1200%
Round 0 Round 1 Round 2 Round 3 Round 4 Round 5
Average rate of growth in portfolio value
Average rate of growth in benchmark portfolio value
Average growth in the value of share w/ dividend (target)
197
Figure 59. Comparison of results of simulation games in the study group and in the control group. Own work.
The results achieved in the business game were quite good as for this type of course. Looking
at the students’ behavior, the results of the game being the subject of the discussed experiment
were not much different from the results achieved in other games which MA/MSc students
played. The strategies they applied were consistent and coherent, which lets us claim that they
were rather conservative. In such groups, there was on average one company going bankrupt
because of the failure to understand/misunderstanding the mechanics of the game, or because
of occurrence of the free rider problem. In the case of the game played as part of the discussed
experiment, there was no company going bankrupt, and although one team struggled with
continuously low results, they still managed to stay above the line of bankruptcy. Graph 58
makes it possible to compare the results achieved in the game played as part of the experiment
with those achieved by a control group. The ‘control’ game was played by students majoring
in strategic management, a field of study considered by the majority of students of
management as the most prestigious, as the criteria of admission are the most demanding from
among all other specializations. Yet, there is not clear evidence between the average grades
and the results achieved in business simulation games (Pisarek and Pitura, 2009). Both
courses were run in the same semester, the gameplay scenario was also identical. The only
difference was that in the control group, students were assessed based only on team results,
and played in 7 teams composed of 4-5 members. According to the author, these differences
are insignificant, since the values and variables in the game depend on the number of teams
0
50
100
150
200
250
300
350
400
450
500
Period 0 Period 1 Period 2 Period 3 Period 4 Period 5
Sh
are
pri
ce
Average share price with 2nd game Highest with 2nd game
Lowest with 2nd game Average share price benchmark
Highest benchmark Lowest benchmark
198
participating in a given game. Also, earlier studies showed no statistically significant relation
between the number of participating teams and the final results of those teams in a given
game (Gentry, 1980; Wardaszko, 2007). Only one team went bankrupt in the model group,
and the results were not much different from the results achieved as part of the same course
run one year before. Comparing the presented data, we can conclude that the results achieved
in the game played as part of the discussed experiment were much better than the results
achieved in the model game. The author is aware that this may be a coincidence, and that
further research needs to be conducted to verify and confirm this result.
5.5.2.6 Study conclusions
The above considerations depict the whole process of development, implementation, and
testing the idea of introduction of a second game into a course in the scope of strategic
business simulations. The aim of the experiment discussed in this paper was fully met; the
experiment appeared to be a really good test of “playability” and possibility of collecting data
of game participants. The investment game was simple and intuitive, and on an entry level, it
seems to be attractive enough to involve the players into active gameplay. Despite the fact
that its influence on the “mother-game” is still a matter of discussion, the first presented set of
data is a good basis for continuation of the project with different setting introduced as
conclusions drawn from analysis of detailed data. Many questions still need to be answered,
though, but the game may contribute in the future in two ways. It may constitute an incentive
for students to play business simulation games, and it also may function as an interesting
research tool as a typical game combined with any game featuring production of share prices
and financial statements. This simple experiment, covering only 26 students, appeared to be a
source of a big amount of data. Creation of a larger number of such games with different
assessments/data/settings could make it possible to analyze the obtained data and to arrive at
more in-depth and statistically significant results/conclusions and evidence.
In the future, investment games will be played over the Internet, which will make the
demanding calculations in Excel obsolete. Moreover, all decisions, data, and actions of game
participants will be saved automatically. Once such games will be transferred the Internet,
they will be available not only to students attending business simulation courses, but virtually
to anyone, including competition participants or applicants for admission to studies. The main
advantage will be the option to play with other human players and a greater level of
unpredictability than in the case of a stock-based game based on a previously defined set of
algorithms. It may be also possible to introduce an option allowing students playing “mother-

199
games” express their opinions and a function of influence of reaction of the stock market on
the results they achieve. This will bring us one step closer towards more realistic simulations.
200
Chapter VI
6.1 Conclusion
The main objective of the paper was to show the diversity of the thematic area of games and
simulations in the context of education on the one hand, and the depth and complexity of the
discussed topic on the other. This is a very difficult task indeed, since, as argued by many
authors (Duke and Geurts, 2001; Klabbers, 2006), the field of games and simulations is a
dynamically-changing continuum of models. What is more, as proved by the presented meta-
analyses, the descriptive and research methodology, as well as the terms and notions
functioning in this field are very chaotic (Haysa, 2005; Sitzmann, 2011). This is because of
the multidisciplinarity of the area of games and simulations, as today, almost every branch of
science uses some kind or variation of games and/or simulations, and applies own names and
definitions, as well as own methodology of evaluation and research. One of the aims of the
paper was to attempt to establish some order in this chaos, and this seemed to have been
completed successfully to a large extent in the first sections of the paper. Chapters I and II
included a synthetic description of the definition of the area of games and simulations along
with their history and analysis of the present state-of-the-art. The aspiration to introduce order
often requires making difficult choices between different theories and areas of knowledge; the
selection was made based on the consideration of the most significant and renowned theories
and definitions on the one hand, and on the other, on the basis of the intention to present the
diversity of theories in the area of games and simulations.
The introduction to the paper included a range of thesis and research questions concerning the
suitability and effectiveness of decision-making simulation games as tools of education in the
area of management. At this stage, in the light of all quoted studies and analyses, we can
consider all of the abovementioned hypotheses to be correct. Currently, it is possible to create
an appropriate education model for virtually every area of management and almost at every
stage of managerial education, since solutions for teaching entrepreneurship and fundamentals
of economics in secondary schools are already under development, and further, there are also
arguments for introducing this knowledge even lower, at earlier stages of education. Chapter
III discusses different models of education and provision of knowledge by means of
experiential learning, and especially through simulation games. The chapter features also a
presentation of different models of provision and delivering educational courses based on
201
simulation games. Among these models, there is also the interactive-process-based model
proposed by the author. Models of delivering classes show us how we should place games in
teaching programs, create the form of our classes and the models of assessment, organize
courses, evaluate learners, and develop simulation games (Bielecki, 1999; Duke and Guerts,
2001; Klabbers, 2006; Kriz, 2003, 2007). There are still, of course, many open matters and
inaccuracies, but simulation games can already become a fully-fledged member of the family
of methods of education, and move from the area of “curiosity” to the canon of education.
The introduction to the paper featured a model of managerial education (figure 3) based on
the model which is an evolutionary form of the present system of education. It has been
proven beyond doubt that such model is feasible and possible to be implemented into the
contemporary system of managerial education. Development of experiential learning-based
models of education has a long tradition, and at present, we can ‘upgrade’ it with a new
dimension of realism and scale, which gives us the option to apply the latest IT solutions and
the newest knowledge in the scope of education in interaction with the area of IT. Diversity of
games, simulations, and simulation games makes it possible to apply them effectively in
virtually any educational setting – both inside and outside the classroom. Even if there is no
appropriate simulation for some highly specific discipline, we are still able to develop or order
a special scenario or a completely new simulation game covering the required scope of
knowledge or a particular thematic area – in a relatively short time and with calculable costs.
Today, the problem is not the lack of a simulation game for some particular area, but rather
the multitude of choice on offer.
Chapter IV presents an analysis of different models of simulation games. The described
games were selected based on the diversity of their form and content, in order to depict as
many different useful and important aspects of those games as possible. Two cases of those
games – SysTeamsChange and Hotel Stars – were subject to a more in-depth analysis to show
how the knowledge in the scope of management and economic science was placed into
simulation games and how it was transferred to course participants. This made it possible to
highlight the author’s contribution to the practice of development and delivering simulation
game-based courses. The case of Hotel Stars seem to be especially interesting, since despite
the fact that the sole concept of this simulation game is not novel, the idea to address such
advanced simulation game to a younger – secondary-school – learner is. The biggest
challenge in this project was not so much a matter of econometric modeling, as that of
accessible presentation of knowledge in the scope economics and management to someone
202
who had never had any experience with it. This goal was achieved through application of an
innovative interface based on the methodology of visual logic design (the logic of designing
IT systems governed by simplicity and intuitiveness of user interface) and through the game
scenario, which becomes more complex as the player gains more experience. Moreover, the
system of Hotel Stars is the first such system in Poland to feature a system of evaluation based
on balanced scorecard with elements of sustainable business – designed especially for this
simulation game.
Today we know that simulation games are an effective means of teaching (Wolfe, 1997;
Bielecki, 1999; Haysa, 2005; Vogel, Vogel, Cannon‐Bowers, Bowers, Muse and Wright,
2006; Ke, 2009; Sitzmann, 2011). This is evidenced by the last of the quoted studies, which
provides a clear proof for the high educational value of such games. For many years,
simulation games had functioned on a learning-by-doing basis, and all simulation game
practitioners and researchers “felt” that they were effective and valuable tools of teaching, but
the answer to the question of why those games worked that way was more than difficult to
give. Even the brightest minds found it hard to provide a clear answer to that question
(Caluwe, Hofstede, Peters, 2008). Today, however, we can ascertain without any doubts how
simulation games work and how they transfer knowledge and generate experience.
At the moment, there is no generally-accepted research methodology for the field of
simulation games. There are only certain groups of researchers united around particular
preferences of application of particular research methods in the process of research, vying for
the palm for their views (e.g. Wolfe, 1993b, 1993c; Teach, 1993, 1993a, 1993b). This posed a
big challenge for the author, who embarked on organizing the knowledge in the area of
simulation games, including the related research field, as part of this paper. The conducted
analysis of different methodological aspects and various points of view concerning the role of
simulation games as a research method makes it yet possible to assess the advantages and
disadvantages of simulation games as a research method, as well as to evaluate the potential
of application thereof.
The topic of effectiveness of simulation games is of particular importance for the author, as
this is his area of research and he intends to develop it in the future. The second part of the
fifth chapter describes two experiments conducted over the recent 3 years. Their aim was to
contribute to further development of practical and theoretical knowledge in the scope of
application of business simulation games for education-related purposes. The conclusions
203
drawn from the studies on the influence of cognitive systems of assessment of gaming teams
during decision-making game-based courses have made it possible to develop and implement
new methods of assessment of teamwork and of gaming team members. These methods take
into account the possibility of mutual influence of team members on the results of other team
members and provide a precise parameterization of the level of responsibility and of the
assessment of both individual and team work. Thus, they make the gameplay of a given
simulation game more realistic, as they introduce the element of responsibility for the
decisions of individuals and for team building, e.g. exactly like in the case of formation of a
real company (see: appendix no. 6). The effects of these changes are higher average results of
teams, smaller number of cases of bankruptcy, and longer time of students remaining in the
system to make their decisions and analyze data.
Introduction of the structure of two games in one course offered by the author was received
enthusiastically in the academic environment. Application of a simulation game played on an
individual level for the purpose of support, research, and assessment of a simulation game
played on a team and group level is an innovative and unique approach. By analogy, the
composite game may be considered a superposition of the function as a simulation game, with
this function expressed by the following formula:
���� = ��4�+5-�4�+5���
where the final result 6�� is the result of gamen team game, where the results form the basis
for gamei individual game. Participants of such game operate as if on two planes: the first
plane involves their participation – as team members – in a competitive gameplay, and the
second lets them make individual decisions in a game the basis of which are the results of the
said team game. Such gameplay structure requires players to formulate a dual strategy that
would affect the overall result of both gameplays. In an educational setting, such course
structure requires course participants to develop a better understanding of the mechanisms and
relations present in each of the games, as well as of other interrelations, which clearly
contributes to the increase in the level of effectiveness of learning.
The research idea of a game in a simulation game gives even better results than research on
cognitive assessment systems. The conclusions drawn from the experiment served as a basis
for developing and creating an investment game called Leo Investor, which is a
developmental version of the simulation game used in that experiment. The game was
developed to be used as a both research and educational tool. There are already two projects
204
conducted on the basis of this platform. The first of them is a research project in the scope of
analysis of perception of investment risk depending on the available information about the
risk (Klimczak, Pikos and Wardaszko, 2012). The other is an education-research project
(Wardaszko and Mulenga, 2014), as part of which its authors will attempt to integrate many
different courses using an investment game. Participants of these courses will play different
roles and this way, participate in simulation games and gain additional experience. For
example, participants of a course in the scope of managerial simulation games will play a
business game which will require them to look for investors for their companies on a virtual
stock exchange, which will be provided in the form of Leo Investor investment game. This
virtual stock exchange will feature active investor groups and investment funds, which will be
role-played by participants of courses in the scope of finance, e.g. themed with financial
statement analysis. The investor teams will be dealing with analyses of the results of virtual
companies and of the documents provided by the teams playing the simulation game, such as
business plans. Next, they will make investment decisions, and the funds from the investment
game will be transferred to the accounts in the business game. This way, participants of many
different courses will be able to get involved in developing their experience through games.
Also, the level of realism of the gameplay will most certainly increase at the same time too.
The abovementioned directions of development will also be further areas of research interest
of the author of the paper. Despite the rapid scientific progress in the area of games and
simulations, many fields are still to be explored. The dynamic development of IT, “invading”
virtually every sphere of our life – including education, keeps on breeding new and interesting
phenomena. One such recent trend is gamification (Cunningham, Zichermann, 2011).
Exploring this phenomenon and the areas of application of this methodology will surely make
it possible to bring systems of education to a higher level.
205
7. List of sources and references
1. Abt C.C. (1970) Serious Games. New York: Viking Press.
2. Anderson L.W., Krathwohl D.R., Airasian P.W., Cruikshank K.A., Mayer R.E.,
Pintrich P.R., Raths J., Wittrock M.C., (2001) A Taxonomy for Learning, Teaching
and Assessing. A revision of Bloom’s Taxonomy of Educational Objectives. New
York: Addison Wesley Longman.
3. Angell N. (1928) The Money Game, How to Play It: A New Instrument of Economic
Education. London: J.M. Dent & Co.
4. Argyris C. (2004) Double-loop learning and organizational change: facilitating
transformational change. In: J. Goonstra (eds.), Dynamics of organizational change
and learning. Chichester: Wiley, pp. 389–402.
5. Argyris C., Schön D.A. (1999) Die Lernende Organisation. Stuttgart: Klett-Cotta.
6. Avedom E., Sutton-Smith B. (1971) The Study of Games. New York: John Wiley &
Sons.
7. Balcerak A., Pełech A. (1999) Praprzodkowie symulacyjnych gier kierowniczych. In:
Symulacja Systemów Gospodarczych. Prace Szkoły Antałówka ’99. Warsaw: Wyższa
Szkoła Przedsiębiorczości i Zarządzania, Politechnika Wrocławska, pp. 29–53.
8. Balcerak A., Radosiński E. (1998) Zabawa, wojna, zarządzanie. Historia powstania i
rozwoju gier kierowniczych. In: E. Radosiński (red.(eds.)), Modelowanie
symulacyjne w dydaktyce ekonomii. Wrocław–Kraków–Gliwice: Polskie
Towarzystwo Symulogiczne, pp. 9–26.
9. Balcerak A., Pełech A. (2000) Pojęcia i definicje do nanomodelowania
symulacyjnego. In: Symulacja Systemów Gospodarczych. Prace Szkoły
Antałówka ’99 – suplement. Warsaw: Wyższa Szkoła Przedsiębiorczości i
Zarządzania, Politechnika Wrocławska, pp. 9–23.
10. Bandura A. (1986) Social foundations of thought and action: a social cognitive
theory. Engelwood Cliffs: Prentice-Hall.
11. Bandura A. (1996) Self-efficacy: The exercise of control. New York: Freeman.
12. Barczak A. (1996) Komputerowe gry wojenne. Warsaw: Wydawnictwo Bellona.
13. Becker H. and Langosch I. (1995) Produktivität und Menschlichkeit.
Organisationsentwicklung und ihre Anwendung in der Praxis. Stuttgart: Enke.
14. Begg D., Dornbusch R., Fischer S. (2007) Mikroekonomia T1. R. Rapacki [et al.]
(eds.). Warsaw: Polskie Wydawnictwo Ekonomiczne.
206
15. Bernard R.R., Cannon H., De Souza M.P. (2010) Another look at the use of
forecasting accuracy on the assessment of management performance in business
simulation games. Developments in Business Simulation and Experiential Exercises,
37, pp. 68–78.
16. Bielecki W. T. (2000) Simulation of the perfect simulation. Simulation & Gaming an
Interdisciplinary Journal of Theory, Practice and Research, 31.
17. Bielecki W. T. (2001) Entrepreneurs in the Face of E-Business. Opportunities and
Threats for the Polish Economy, EMERGO, 8, 1, 2001.
18. Bielecki W. T. (2008) Looking for Hidden Demand: Simulation-game – System of
Training Entrepreneurship (theoretical concept). Transformacje, pp. 360–368.
19. Bielecki W. T. (2009) Zarządzanie wiedzą a zarządzanie ryzykiem w firmie. In:
Komputerowe Systemy Zarządzania. Warsaw: Wydawnictwa Naukowe Wydziału
Zarządzania UW, pp. 329–338.
20. Bielecki W. T., Koczuba O. (1990) Komputerowa symulacyjna gra menedżerska –
MANAGER. Warsaw: School of Management of the University of Warsaw.
21. Bielecki W. T., Koczuba O., Wardaszko M. (2009) Komputerowa symulacyjna gra
menedżerska – MANAGER. Warsaw: Akademia Leona Koźmińskiego.
22. Bielecki W.T.(1999) Przedsiębiorczość w wirtualnym środowisku. Aspekt
dydaktyczny. Warsaw: Wydawnictwo Naukowe Wydziału Zarządzania UW.
23. Bielecki W.T., Wardaszko M. (2010) Mission Possible – Using Simulation Games
For Management Training in a Transition Economy. Developments in Business
Simulation and Experiential Exercises, 37, pp. 107–111.
24. Bielecki W.T., Wardaszko M. (2007) Games and Simulation in Business Learning
and Teaching. Warsaw: Academic and Professional Press.
25. Biggs W. D. (1986) Computerized business management simulations for tyros.
Developments in Business Simulation and Experiential Exercises, 13, pp. 187–194.
26. Brehmer, B., and Dörner, D. (1993) Experiments with computer-simulated
microworlds: Escaping both the narrow straits of the laboratory and the deep blue sea
of the field study. Computers in Human Behavior, 9(2–3), pp. 171–184.
27. Brozik D., Cassidy C., and Brozik D. (2008) Indoamerican Enterprises.
Developments in Business Simulation and Experiential Learning, 35, pp. 15–27.
28. Burns A. C., Gentry J. W. (1998) Motivating Students to Engage in Experiential
Learning: A Tension-to-Learn Theory. Simulation & Gaming, 29 (2), pp. 133–151.
207
29. Caddote E., Bruce H.J. (2008) The management of strategy in Marketplace. London:
Innovative Learning Solution.
30. Cadotte R.E. (1995) Business Simulations: The Next Step in Management Training,
Selections. Graduate Management Admission Council, Autumn, pp. 8–19.
31. Caillois R. (2001) Man, Play, and Games. Champaign: University of Illinois Press.
32. Caluve L., Vermaak H. (2003) Learning to change: a guide for organizational
change agents. Thousand Oaks: Sage Publications.
33. Caluwe L. (2008) The active substance from the perspective of change. In: L.
Caluwe, G.J. Hofstede, V. Peters (eds.), Why do games work? In search of the active
substance of gaming. Nejmehen: Wolters-Kluwer, pp. 79–89.
34. Caluwe L., Hofstede G.J., Peters V. (2008) Why do games work? In search of the
active substance of gaming. Nejmehen: Wolters-Kluwer.
35. Cassidy C.M., Brozik D. (2009) The Ginseng Game. Developments in Business
Simulation and Experiential Learning, 36, pp. 312–319.
36. Chapman A. (2008–2010) Experience-based learning – guide to facilitating effective
experiential learning activities, www.businessballs.com.
37. Checkland P.B., Scholes J. (1991) Soft Systems Methodology in Action. Chichester:
John Wiley.
38. Churchill G.A., (1999) Marketing Research Methodological Foundations. London:
Dryden.
39. Costikyan G. (1994) I have no word and I must design, Interactive Fantasy #2,
http://www.costik.com/nowords.html.
40. Crawford C. (1984) The Art of Computer Game Design. Osborne: McGraw-Hill.
41. Creswell J.W. (2002) Research Design: Qualitative and Quantitative Approaches,
London: Sage.
42. Crookall D., Arai K. (1994), Simulation and gaming across disciplines and cultures.
SAGE Publicatons.
43. Crozier M. (1976) Comparing Structures and Comparing Games. In: G. Hofstede, M.
Sami Kassem, European Contributions to Organization Theory. Amsterdam: Van
Goreum.
44. Crozier M., Fiedberg E. (1982) Człowiek i system. Ograniczenia działania
zespołowego. Warsaw: PWN.
45. Cunningham C., Zichermann G. (2011) Gamification by Design. Sebastopol,
California: O’Reilly Media Inc.
208
46. Cyfert S. (2003) Strategiczne doskonalenie architektury procesów w zarządzaniu
przedsiębiorstwem. Poznań: Akademia Ekonomiczna w Poznaniu.
47. Czarny B. (2011) Podstawy ekonomii. Warsaw: Polskie Wydawnictwo Ekonomiczne.
48. Dale E. (1969) Audiovisual methods in teaching. New York: Dryden Press Edition.
49. Dalin P., Rolff H.G. and Buchen H. (1996) Institutioneller Schulentwicklungs-
Prozess. Bönen: Verlag für Schule und Weiterbildung.
50. Dekanter N. (2005) Gaming redefines interactivity for learning. TechTrends, 49, 3.
51. Doppler K., Lauterburg Ch. (2002) Change Management. Den Unternehmenswandel
gestalten. Frankfurt/M.: Campus.
52. Duke R. D. (1974) Gaming: The future's language. London: Sage.
53. Duke R.D., Geurts J.L.A. (2004) Policy games for strategic management.
Amsterdam: Dutch University Press.
54. Elgood C. (1993) Handbook of Management Games. Brookfield: Gower Press.
55. Ellington H., Addinall E., Percival F. (1982) A handbook of game design. London:
Kogan Page.
56. Faria A.J., Wellington W. (1994) The effect of time pressure, team formation and
planning on simulation/game performance. In: D. Crookall, K. Arai (eds.),
Simulation and gaming across disciplines and cultures, SAGE Publicatons.
57. Faria A.J., Wellington W. (2004) A survey of simulation game users, former users,
and never-users. Simulation & Gaming, 53/2, pp.178–207.
58. Faria A. J. (1998) Business Simulation Games: Current Usage Levels, Simulation &
Gaming, 29 (3), pp. 295–308.
59. Faria A. J., Nulsen, R. O. (1979) Game Administration: A Life Cycle Analysis.
Association for Business Simulation & Experiential Learning, 6, pp.220–226.
60. Faria A. J., Nulsen, R. O. (1981) Extending the Simulation Product Life Cycle.
Association for Business Simulation & Experiential Learning, 8, pp. 37–42.
61. Faria A.J. (1989) Business Gaming: Current Usage Levels. Management
Development Review, 8, 2, pp. 58–66.
62. Fatzer G. (red) (1998) Supervision und Beratung. Köln: EHP.
63. Forrester J.(1971) Counterintuitive behavior of social systems. Technology Review
73(3), pp. 52–68.
64. Fraser G., Trioliet R. (2010) Blue Ocean Strategy Simulation – Facilitator Guide.
Paris: StratX.
209
65. Fritzsche D. J., Cotter R. V. (1990) Guidelines for administering business games. In:
J.W. Gentry (eds.), Guide to business gaming and experiential learning. New York:
Nichols/GP Publishing, pp.74–89.
66. Funke J. (1988) Using simulation to study complex problem solving. Simulation &
Games, 19(3), pp. 277–303.
67. Funke J. (1995) Experimental research on complex problem solving. In: P. Frensch
and J. Funke (eds.), Complex problem solving: The European perspective. Hillsdale.
New York: Lawrence Erlbaum Associates.
68. Gabryelczyk R. (2000) Reengineering. Restrukturyzacja procesowa
przedsiębiorstwa. Warsaw: Wydział Nauk Ekonomicznych, Uniwersytet Warszawski.
69. Garbarski L. (eds.), (2011) Marketing: koncepcje skutecznych działań. Praca
zbiorowa. Warsaw: Polskie Wydawnictwo Ekonomiczne.
70. Gentry J.W. (1980) Group size and attitudes toward the simulation experience.
Simulation & Gaming, 11, pp. 451–460.
71. Gentry J.W., Burns A.C., Putrevu S., Hongyan Yu, Williams L., Bare T., Gentry R.A.
(2001) Motivating students: An initial attempt to operationalize the curiosity gap
model. Developments in Business Simulation and Experiential Learning, 28, pp. 67–
75.
72. Gibbs G.I. (1974) The handbook of games and simulation exercises. London:
Routlege.
73. Gill J.H. (2000) The tacit mode: Michael Polanyi’s postmodern philosophy. Albany:
State University of New York.
74. Giżycki J. (1973) Z szachami przez wieki i kraje. Warsaw: Wydawnictwo Sport i
Turystyka.
75. Glazinski B. (2007) Innovatives Changemanagement. Strategie, Organisation und
Verhalten erfolgreich integrieren. Weinheim: WILEY–VCH Verlag.
76. Gold S.C., Wolfe J. (2011) The Validity and Effectiveness of a Business Game Beta
Test. Simulation & Gaming, 43(4), pp. 481–505.
77. Gold S.C., Pray T.F. (1990) Modeling Demand in Computerized Business
Simulation. In: F.W. Gentry, (eds.) Guide to Business Gaming and Experiential
Learning. London: ABSEL, Nichols/GP Publishing, East Brunswick/Kogan Page.
78. Gonzalez C. (2004) Learning to Make Decisions in Dynamic Environments: Effects
of Time Constraints and Cognitive Abilities. Human Factors, 46(3), pp. 449–460.
210
79. Gonzalez C., Vanyukov P., Martin M.K. (2005) The use of microworlds to study
dynamic decision making. Computers in Human Behavior, 21, pp. 273–286.
80. Graf-Götz G. (2001) Organisation gestalten. Weinheim: Beltz.
81. Greenblat C.S. (1988) Designing games and simulations. Beverly Hills: Sage
Publications.
82. Greenlaw P.S., Herron L.W., Rawdon R.H. (1962) Business Simulation in Industrial
and University Education. Prentice-Hall, Inc., New York: Englewood Cliffs.
83. Griffin R.W. (1996) Podstawy zarządzania organizacjami, Warsaw: PWN.
84. Guerts J.L.A, Mayer I.S. (1996) Methods for participatory policy analysis, towards a
conceptual model for research and development. Tilburg: Tilburg University.
85. Guerts J.L.A., Vannix J.A.M. (1989) The participative modelcyclus.
Zeist,Netherlands: Koerckebosch.
86. GUS (2013) Mały Rocznik Statystyczny Polski 2013, Warsaw.
87. Gust M., Kriz W.C. (2004) Führungsethik und Teamkompetenz entwickeln. In: U.
Seebacher, G. Klaus (eds.), Handbuch Führungskräfteentwicklung. München:
Theorie – Praxis – Fallstudien, pp. 307–324.
88. Owen O.P., Hall Jr., Ko K. (2006) Learning assurance using business simulations
applications to executive management education. Developments in Business
Simulation and Experiential Learning, 33, pp. 1–6.
89. Hanse H., Kriz W.C. (2012) SysTeamsChange – podręcznik instruktora. Monachium:
Riva–Training GmbH.
90. Harrington J.E. (2009) Games Strategies and Decision Making. New York: Worth.
91. Harrison J., Lin Z., Carroll G., Carley K. (2007) Simulation Modelling in
Organizational and Management Research. Academy of Management Review, 32, pp.
1229–1245.
92. Hays R.T. (2005) The effectiveness of instructional games: a literature review and
discussion. Technical Report 2005-004. Naval Air Warfare Center Training Systems
Division,
http://oai.dtic.mil/oai/oai?verb=getRecord&metadataPrefix=html&identifier=ADA44
1935.
93. Hersey P., Banchard K. (1988) Management of organizational behavior, England:
Engelwood-Cliffs.
211
94. Hofstede G. J., Meijer S. A., (2008) Collecting empirical data with games. In: I.S.
Mayer, H. Mastik (eds.) (2007), Organization and learning through gaming and
simulation: Proceedings of ISAGA. Delft: Eduron, pp. 111–121.
95. Hofstede G.J. (2008) The origins of Homo Ludens. In: L. Caluwé, G.J. de; Hofstede,
V. Peters (eds.), Why do games work? In search for the active substance. Deventer,
pp. 59–68.
96. Hord S.M., Rutherford W.L., Huling-Austin L., Hall G.E. (1987) Taking Charge of
Change. Baltimore: Association for Supervision and Curriculum Development.
97. Hornaday R.W. (2001) Sex composition, cohesion, consensus, potency and
performance of simulation teams. Developments in Business Simulation and
Experiential Learning, 28, pp. 102–105.
98. Huizinga J. (1985) Homo lundes. Zabawa jako źródło kultury. Warsaw: Czytelnik.
99. Jackson J.R. (1959) Learning from experience in business decision games. California
Management Review, 1(1), pp. 23–29.
100. Kavtaradze D. (2008) Games as releasers of super stimuli’s phenomena. In: L.
Caluwe, G.J. Hofstede, V. Peters (2008) Why do games work? In search of the active
substance of gaming. Nejmehen: Wolters Kluwer, pp. 51–55.
101. Kayes D.C., Kayes A., Kolb D. A. (2005) Experiential learning in teams. Simulation
and Gaming, 36(3), pp. 330–354.
102. Ke F. (2009) Chapter 1, A qualitative meta-analysis of computer games as learning
tools. In: R.E. Ferdig (eds.), Handbook of research on effective electronic gaming in
education. IGI Global, Kent State University USA (2009) pp. 1–31.
103. Keys B., Wolfe J. (1990) The Role of Management Games and Simulations in
Education and Research. Journal of Management, 16, 2, pp. 307–336.
104. Keys J.B., Biggs W.D. (1990) A Review of Business Games. In: J. Gentry (eds.), A
Guide to Business Gaming and Experiential Learning. East Brunswick: Nichols/ GP
Publishing.
105. Kim Chan W., Mauborgne R. (2005) Blue Ocean Strategy. How to Create
Uncontested Market space and make competition irrelevant. Boston: Harvard
Business School Publishing Corporation.
106. Klabbers J. (1989) On the improvement of competence. In: J. Klabbers (eds.),
Proceedings of the ISAGA 19th Conference. New York.
212
107. Klabbers J. (1999) Three easy pieces: a taxonomy on gaming. In: D. Sounders, J.
Severn (eds.), Simulation and Games for Strategy and Policy Planning. London:
Kogan Page, pp. 16–33.
108. Klabbers J. (2003) Gaming and Simulation: principles of a science of design.
Simulation & Gaming, 34, 4, pp. 569–591.
109. Klabbers J. (2006) A framework for artifact assessment and theory testing.
Simulation & Gaming, 37, pp. 155–173.
110. Klabbers J.(2006) The magic circle: Principles of gaming & simulation. Rotterdam:
Sense Publishers.
111. Klimczak K., Pikos A., Wardaszko M. (2012) The use of risk information by
investors – a simulation study. In: W.T. Bielecki, M. Wardaszko, A. Pikos, J.
Gandziarowska-Ziołecka, Bonds and Bridges: The Use of Simulation Games.
Warsaw: POLTEXT, pp. 235–241.
112. Kolb D.A., Fry R. (1975) Toward an applied theory of experiential learning. In: C.
Cooper (eds.), Theories of Group Processe. London: John Wiley.
113. Koster R. (2005) A theory of fun for game design. Scottsdale, Arizona: Paraglyph
Press Inc.
114. Kotter J. P. (1996) Leading Change. Harvard Business School Press.
115. Koźmiński A., Jemielniak D. (2008) Zarządzanie od podstaw. Podręcznik
akademicki. Warsaw: Wydawnictwa Akademickie i Profesjonalne.
116. Koźmiński A., Latusek-Jurczak D. (2011) Rozwój teorii organizacji. Warsaw:
Wolters Kluwers business.
117. Koźmiński A.K., Zawiślak A.M. (1982) Pewność i gra. Wstęp do teorii zachowań
organizacyjnych, Warsaw: 2nd edition, PWE.
118. Krajbich I., Camerer C., Ledyard J., Rangel, A. (2009) Using neural measures of
economic value to solve the public goods free-rider problem. Science, 326, pp. 596–
599.
119. Kriz W.C. (2000) Lernziel Systemkompetenz. Planspiele als Trainingsmethode.
Göttingen: Vandenhoeck & Ruprecht.
120. Kriz W.C. (2005) Planspiele als Methode der quantitativen Organisationsforschung.
In: S. Kühl, A. Taffertshofer, P. Strodtholz (eds.), Handbuch quantitative Methoden.
Hamburg: VS Verlag für Sozialwissenschaften , pp. 243–269.
213
121. Kriz W.C. (2006) Kompetenzentwicklung in Organisationen mit Planspielen. In:
Zeitschrift für Systemdenken und Entscheidungsfindung im Management. 5, 2, pp.
73–112.
122. Kriz W.C. (2007) Planspiele für die Organisationsentwicklung. Schriftenreihe:
Wandel und Kontinuität in Organisationen. Berlin: Wissenschaftlicher Verlag Berlin.
123. Kriz W.C. (2011) Qualitätskriterien von Planspielanwendungen. In: S. Hitzler, B.
Zürn, F. Trautwein (eds.), Planspiele – Qualität und Innovation. Neue Ansätze aus
Theorie und Praxis (ZMS Schriftenreihe Band 2). Norderstedt: Books on Demand,
pp. 11–37. Simon, H. (1969) The sciences of the artificial. Boston: MIT Press.
124. Kriz W.C., Hense J. (2006) Theory-oriented evaluation for the design of and research
in gaming and simulation. Journal of Simulation & Gaming, 37, 2, pp. 268–283.
125. Kriz W.C., Nöbauer B. (2008) Teamkompetenz. Konzepte – Trainingsmethoden –
Praxis, Göttingen: Vandenhoeck & Ruprecht. 4. Auflage.
126. Kriz W.C. (2000) Lernziel Systemkompetenz. Planspiele als Trainingsmethode.
Göttingen: Vandenhoeck & Ruprecht.
127. Kriz W.C. (2003) Creating Effective Interactive Learning Environments through
Gaming Simulation Design. Journal of Simulation & Gaming, 34 (4), pp. 495–511.
128. Kriz W.C. (2007) Planspiele für die Organisationsentwicklung. Schriftenreihe:
Wandel und Kontinuität in Organisationen (Bd. 8). Berlin: Wissenschaftlicher
Verlag.
129. Kruszewski K. (1982) Metoda kształcenia od zmiany do sposobu jej wywołania.
Kwartalnik Pedagogiczny 3–4/1982.
130. Leavitt H. J. (1965) Applied Organization Change in Industry: Structural, Technical
and Human Approaches. In: J.G. Marcha (eds.), Handbook of Organization. Chicago.
131. Lewin K. (1963) Feldtheorie in den Sozialwissenwschaften. Bern: Huber.
132. Lippitt R., Watson J., Wesley B. (1958) The dynamics of planned change. New York:
Holt, Rinehart & Winston.
133. Lundy J (1991) Cognitive learning from games: Student approaches to business
games. Studies in Higher Education, 16, 2, p179, 10p
134. Lundy J. (1985) The effects of competition in business games, In: M. van Ments and
K. Hearnden (eds.), Effective Use of Games and Simulation. Loughborough,
England: SAGSET/Loughborough University of Technology, pp. 25–34.
214
135. Malik S.D., Strang D.R. (1998) An exploration of the emergence of process
prototypes in a management course utilizing a total enterprise simulation.
Developments in Business Simulation and Experiential Learning, 25, pp. 92–98.
136. Malone T.W. (1981) Toward a theory of intrinsically motivating instruction.
Cognitive Science, 4, pp. 333–369.
137. Marketplace, Facilitator guide and coaching tips, Innovative Learning Solutions ltd,
Knoxville, USA, http://www3.marketplace.com.
138. Marketplace, Facilitator materials, Innovative Learning Solutions ltd, Knoxville, USA, http://www3.marketplace.com.
139. Marketplace© (2003), Facilitator materials, innovative Learning Solutions Ltd.
Knoxville: http://www.markeplace-simulations.com
140. Markulis P.M., Strang D.R. (1995) An ethnographic analysis of the pedagogical
impact of cooperative learning. Developments in Business Simulation and
Experiential Exercises, 22, pp. 179–186.
141. Mayer I.S. (2009) The gaming of policy and the politics of gaming: A review.
Simulation & Gaming, 40, 6, pp. 825–862.
142. McClelland D.C. (1985) Human motivation, New York: Scot Foresman.
143. McGonigal J. (2011) Reality is broken, New York: Penguin Books.
144. Meggison D. (1996) Planed and emergent learning: consequences for development.
Management learning, 27 (4), pp. 411–428.
145. Meijer S.A. (2009), The organization of transactions – studying supply networks
using gaming simulation. Doctoral dissertation. Delft: Delft University of
Technology.
146. Metera A., Pańków J., Wach T. (1983) Teoretyczne i metodyczne zagadnienia
symulacyjnych gier kierowniczych. Warsaw: IOZiDK.
147. Milewski R. (eds.), Eugeniusz Kwiatkowski (eds.) (2005) Podstawy ekonomii.
Warsaw: Wydawnictwo Naukowe PWN.
148. Morgan G. (1999) Obrazy organizacji. Warsaw: Wydawnictwo naukowe PWN.
149. Morse K. (2003) Knowledge, skills and sustainable values in learning organizations:
Some implications from the multicultural virtual classroom. Developments in
Business Simulation and Experiential Learning, 30, pp.194–198.
150. Myszewski J.M. (1998) Zarządzanie Zmiennością – systemowe spojrzenie na metody
statystyczne w zarządzaniu jakością. Warsaw: Instytut Organizacji i Zarządzania w
Przemyśle „ORGMASZ”.
215
151. National Research Council. (2000) How People Learn: Brain, Mind, Experience, and
School, Washington D.C.: National Academy Press.
152. National Research Council. (2001) Knowing What Students Know: The Science and
Design of Educational Assessment, Washington, DC: National Academy Press.
153. Noga A. (2011) Teorie przedsiębiorstw. Warsaw: Polskie Wydawnictwo
Ekonomiczne.
154. Nonaka I., Takeuchi H. (2000) Kreowanie wiedzy w organizacji. Warsaw: Poltext.
155. Oyster C.K. (2002) Grupy. Poznań: Wydawnictwo Zysk i S-ka.
156. Paavola S., Lipponen L., Hakkarainen K. (2002) Epistemological foundations for
CSCL: a comparison of three models for innovative knowledge communities. In: G.
Stahl (eds.) Proceedings of CSCL 2002, Hilsdale, New York: Erlbaum, pp. 24–32.
157. Parlett D. (1999) The Oxford History of Board Games. New York: Oxford University
Press.
158. Payne E., Whittaker L. (2005) Using experiential learning to integrate the business
curriculum. Developments in Business Simulation and Experiential Learning, 32, pp.
245–254.
159. Pełech A. (1991) Pierwszeństwo w dawności wśród gier symulacyjnych cywilnych.
Szkoła Symulacji Węgierska Górka ’91.
160. Pieper A., Schley W. (1993) (eds.). Systembezogene Beratung in der Schule, 6.
Hamburg: Materialien aus der Beratungsstelle für soziales Lernen am Fachbereich
Psychologie der Universität Hamburg.
161. Pisarek T., Pitura W. (2009) Knowledge of economics as the main success factor in
business simulation games. In: W. Bielecki, M. Wardaszko (eds.), Games and
Simulation in Business Learning and Teaching. Warsaw: Academic and Professional
Press.
162. Polanyi M. (1964) Personal knowledge. New York: Harper and Row.
163. Polanyi M. (1966) The tacit Dimension. Garden City, New York: Doubldeday.
164. Poon T.H.T. (2002) War and peace: managing students learning experience in a
competitive simulation game. Developments in Business Simulation and Experiential
Learning, 29, pp. 167–171.
165. Praca zbiorowa pod kierownictwem prof. Ewy Chmielnickiej, AUTONOMIA
PROGRAMOWA UCZELNI Ramy kwalifikacji dla szkolnictwa wyższego,
Ministerstwo Nauki i Szkolnictwa Wyższego, Projekt Ministerstwa Nauki i
Szkolnictwa Wyższego „Krajowe Ramy Kwalifikacji w szkolnictwie wyższym jako
216
narzędzie poprawy jakości kształcenia”, Priorytet IV PO KL, Działanie 4.1.
Poddziałanie 4.1.3. Warsaw 2010.
166. Prensky M. (2001) Digital Game-Based Learning. New York: McGraw-Hill.
167. Pszczołowski T. (1978) Mała encyklopedia prakseologii i teorii organizacji.
Wrocław: Zakład Narodowy im. Ossolińskich.
168. Radosiński E. (1988) Symulacja komputerowa jako metoda poznania systemów
ekonomicznych. Wrocław: Wydawnictwo Politechniki Wrocławskiej.
169. Randel J.M., Morris B. A., Wetzel C. D., Whitehill B. V. (1992) The effectiveness of
games for educational purposes: A review of recent research. Simulation & Gaming,
23(3), pp. 261–276.
170. Read J.L., Reeves B. (2009) Total engagement: Using games and virtual worlds to
change the way people work and business compete. Cambridge, Massachusetts: The
Harvard University Press.
171. Rogers E. (1983) The Diffusion of Innovations, New York: Free Press.
172. Rousseau J.J. (1918) Uwagi nad rządem polskim. Lwów: Wydawnictwo H.
Altenberg.
173. Schein E. (1994). Überleben im Wandel. Frankfurt a.M.: LaLoSta
174. Scherpereel C.M. (2010) Peer to peer: a new tool for student peer evaluation.
Developments in Business Simulations and Experiential Learning, 37, pp. 238–250.
175. Schley W. (1998) Change Management: Schule als lernende Organisation. In: H.
Altrichter, W. Schley, M. Schratz (eds.), Handbuch zur Schulentwicklung. Wien:
Studien Verlag, pp. 13–54.
176. Schmidt-Tanger M. (2005) Veränderungscoaching. Paderborn: Junfermann.
177. Scholz R., Vrohlings A. (1994) Prozeβ-Struktur-Transparenz. In: M. Gaitanides, R.
Scholz, A. Vrohlings, M. Raster, Prozeβmanagement. München, Wien: Carl Hanser
Verlag.
178. Selen K., Zimmerman E. (2004) Rules of Play. Game Design Fundamentals.
Cambridge, Massachusetts: The MIT Press.
179. Senge P.M. (1998) Piąta dyscyplina. Teoria i praktyka organizacji uczących się,
Warsaw: Dom Wydawniczy ABC.
180. Sfard A. (1998) On two metaphors for learning and the dangers of choosing just one.
Edcational Researcher, 27(2), pp. 4–13.
181. Sievers B. (1978) Organisationsentwicklung als Aktionsforschung. Zeitschrift für
Organisation, 47, pp. 209–218.
217
182. Simons P.R. (2008) Learning through computer gaming. In: L. Caluwe, G.J.
Hofstede, V. Peters (2008), Why do games work? In search of the active substance of
gaming. Nejmehen: Wolters Kluwer, pp. 91–103.
183. Sitzmann T. (2011) A meta-analytic examination of the instructional effectiveness of
computer-based simulation games. Personnel Psychology, 64, pp. 489–528.
184. Siuts B. (1990) Grasshopper: Games, Life, and Utopia. Boston: David R. Godine.
185. Sterman J.D. (1984) The Beer Game, MIT, http://www.sol-ne.org/pra/tool/beer.html
186. Sterman J.D. (1989) Modeling Managerial Behavior: Misperceptions of Feedback in
a Dynamic Decision Making Experiment. Management Science 35(3), pp. 321–339.
187. Sterman J.D. (1994) Learning in and about Complex Systems. Systems Dynamics
Review, 10, pp. 291–330.
188. Sterman J.D. (2000) Business Dynamics: Systems Thinking and Modeling for a
Complex World. New York: McGraw.
189. Sternberg R.J. (1998) Abilities are forms of developing expertise. Educational
Researcher, 27(3), pp. 4–13.
190. Sutton-Smith B. (2001) The ambiguity of play. Cambridge, Massachusetts: The
Harvard University Press.
191. Szynkiewicz P. (2007) Balanced Scorecard – pomiar, który motywuje: przewodnik
wdrożenia. Warsaw: PROED.
192. Taylor J., Walford R. (1978) Learning and the Simulation Game. Milton Keynes:
Open University Press.
193. Teach R.D. (1990) Profits: the false prophet in business gaming. Simulation &
Gaming, 21, 1, pp. 12–26.
194. Teach R.D. (1993a) Forecasting accuracy as a performance measure in business
simulations. Simulation & Gaming, 24, 4, pp. 476–490.
195. Teach R.D. (1993b) Forecasting and management ability: A response to Wolfe.
Simulation & Gaming, 24, 1, pp. 63–72.
196. Teach R.D. (2007) Forecasting accuracy and learning: The key to measuring
simulation performance. Developments in Business Simulation and Experiential
Exercises, 34, pp. 57–66.
197. Teach R.D., Patel V. (2007) Assessing participant learning in a business simulation.
Developments in Business Simulation and Experiential Learning, 34, pp. 76–84.
218
198. Teach R.D. (1990) Designing Business Simulations. In: F.W. Gentry (eds.) Guide to
Business Gaming and Experiential Learning, London: ABSEL, Nichols/GP
Publishing, East Brunswick/Kogan Page.
199. Teach. R.D. (1989) Using forecast accuracy as a measure of success in business
simulations. Developments in Business Simulation and Experiential Exercises, 16:
pp. 103–107.
200. Thavikulwat P., Chang J. (2010) Pick your group size: a better procedure to resolve
the free-raiding problem in a business simulation. Developments in Business
Simulation and Experiential Learning, 37, pp. 14–21.
201. Thavikulwat P. (1988) Emphasizing different modes of learning through a
configurable business simulation game. Simulation & Games, 19, pp. 408–414.
202. The Entertainment Software Association (2011)
http://www.theesa.com/facts/pdfs/ESA_EF_2011.pdf
203. The Entertainment Software Association (2012)
http://www.theesa.com/facts/pdfs/ESA_EF_2012.pdf
204. The Entertainment Software Association (2013)
http://www.theesa.com/facts/pdfs/ESA_EF_2013.pdf
205. Thiagarajan S. (1993) How to maximize transfer from simulation games through
systematic debriefing. In: F. Percival, Sh. Lodge, D. Saunders (eds.), The Simulation
and Gaming Yearbook 1993. London: Random House, pp. 45–52.
206. TOPSiM General Management II, Facilitator manual, TATA Innovative Solutions,
2007.
207. Tyszka T. (1999) Psychologiczne pułapki oceniania i podejmowania decyzji. Gdańsk:
Gdańskie Wydawnictwo Psychologiczne.
208. Van Ments M. (1978) Role playing a part or a mirror to meaning? Sagset, 8, pp. 83–
92.
209. Van Ments M., Hearnden K. (eds.) (1985) Perspectives on Academic Gaming and
Simulations. London: Kogan Page.
210. Vogel J.J., Vogel D.S., Cannon‐Bowers J., Bowers C.A., Muse K., Wright M. (2006)
Computer gaming and interactive simulations for learning: A meta‐analysis. Journal
of Educational Computing Research, 34(3), pp. 229‐243.
211. Von Neumann J., Morgenstern O. (1990) Theory of games and economic behavior.
Princeton: Princeton University Press.
219
212. Walkowiak M. (1981) Symulacyjne gry decyzyjne – porównanie wybranych
definicji. In: Symulacja Systemów Gospodarczych – Miłków ’83; Wrocław: TNOiK,
pp. 207–232.
213. Wardaszko M. (2009) Model evaluation of the effectiveness of decision making
simulation games as an education tool. In: W.T. Bielecki, M. Wardaszko, Games and
Simulation in Business Learning and Teaching. Warsaw: Wydawnictwa Akademickie
I Profesjonalne, pp. 27–40.
214. Wardaszko M., Mulenga J.(2014) Simulation game as a live case integrated into two
modules, In: S.A. Meijer, R.Smeds (eds), Frontiers in Gaming Simulation, Springer
Lecture Notes in Computer Science, Vol. 8264, pp. 102-109.
215. Wardaszko M., Wierciński Sz. (2007) The Blue Ocean Strategy Simulation. w W.T.
Bielecki, M. Wardaszko (eds.), Games and Simulation in Business Learning and
Teaching. Warsaw: Academic and Professional Press.
216. Wardaszko M. (2007) Selected problems of using business simulation games in
business education in the context of theory. In: Decision Games in Business
Education, Nowy Sącz: Graduate School of Business – National-Louis University,
pp. 11–17.
217. Warner M. and Witzel M. (2004) Managing in virtual organizations, London:
Thomson Learning.
218. Watson HJ (1981) Computer Simulation in Business. New York: John Wiley & Sons.
219. Wieck K.E. (1979) The social psychology of organizing. London: Addison Wesley.
220. Williams R.H. (1980) Attitude change and simulation games. Simulation and Games,
11, pp. 177–196.
221. Wolfe J. (1993) A History of Business Teaching Games in English-Speaking and
Post-Socialist Countries: The Organization and Diffusion of Management Education
and Development Technology. Simulation & Gaming, 29, 1, pp. 7–9.
222. Wolfe J. (1993a). An Exploration of Game-derived Learning in Total Enterprise
Simulations. Simulation & Gaming, 32, 3, pp. 281–296.
223. Wolfe J. (1993b) On the propriety of forecasting accuracy as a measure of team
management ability: A preliminary investigation. Simulation & Gaming, 24, 1, pp.
47–62.
224. Wolfe J. (1993c) Forecasting and management ability: Rebuttal to Teach’s response.
Simulation &Gaming, 24, 1, pp. 73–75.
220
225. Wolfe J. (1997) The effectiveness of business games in strategic management course
work. (Special Issue: Teaching Strategic Management). Simulation & Gaming, 28, 4,
pp. 360–376.
226. Wolfe J., Chacko T. I. (1983) Team size effects on business game performance and
decision making behaviors. Decision Sciences, 14, pp. 121–133.
227. Wolfe J., Crookall D. (1998) Developing a scientific knowledge of
simulation/gaming. Simulation & Gaming, 29, 1, pp. 7–19.
228. Wolfe J., Rogé J. N. (1997) Computerized general management games as strategic
management learning environments. Simulation & Gaming, 28:4, pp. 423–440.
229. Woźniak J. (2009) Model zarządzania efektywnością procesu szkoleniowego.
Olsztyn: Wydawnictwo Olsztyńskiej Wyższej Szkoły Informatyki i Zarządzania im.
prof. Tadeusza Kotarbińskiego.
230. Yakonich D.A., Cannon H.M., Ternan A. (1997) The energy factor: Building
motivation in the simulation gaming environment. Developments in Business
Simulations and Experiential Learning, 33, pp. 31–40.
231. Yin R.K. (2003) Case study research, design and methods. Newbury Park: Sage
Publications.
221
8. List of figures Figure 1. The paradigm of decision-making games. Source: Duke and Geurts (2004, p. 42). ................ 5
Figure 2. The cockpit of a passenger plane flight simulator. Source: TOPSiM facilitator materials. ...... 8
Figure 3. Evolution of the model of education, based on inclusion of experience-based teaching.
Source: own work. ................................................................................................................................. 11
Figure 4. Research model diagram. Own work. .................................................................................... 14
Figure 5. Games as an element of play (Salen and Zimmerman, 2004: 72). ......................................... 22
Figure 6: Play as an element of games (Salen and Zimmerman, 2004: 73). ......................................... 22
Figure 7. A 3D model of classification and structure of simulation games (Kriz, 2006, based on
Klabbers, 1999). ..................................................................................................................................... 35
Figure 8. Abstraction and reality in simulation games, Duke, 1974 and Kriz, 2011. ............................. 37
Figure 9. Work based on Ellington et al. (1982). ................................................................................... 51
Figure 10. Parts of education system based on simulation games. Kavtaradze (2008: 54). ................. 63
Figure 11. Dale’s Cone of Experience. Own work based on Dale (1969). ............................................. 64
Figure 12. Cognitive process dimensions. Own work based on Bloom’s revised taxonomy (Anderson,
Krathwohl et al., 2001). ......................................................................................................................... 67
Figure 13. Bloom’s revised taxonomy with a demonstration teaching objective. Own work based on
(Anderson, Krathwohl et al., 2001). ...................................................................................................... 69
Figure 14. Change in the demand for knowledge and skills from the perspective of learning
organization and lifelong learning. Own work on the basis of Bloom’s revised matrix (Anderson,
Krathwohl et al., 2001). ......................................................................................................................... 70
Figure 15. Combination of Bloom’s and Dale’s models. Own work. .................................................... 71
Figure 16. Kolb’s Experiential Learning Model. Work based on Chapman (2005) and Kolb (1984). .... 72
Figure 17. The layers of social systems. Source: Klabbers (2006: 39). .................................................. 76
Figure 18. Representation of explicit and tacit knowledge, Klabbers (2006: 64). ............................... 82
Figure 19. Four stages of learning, de Caluwé (2008: 82). ................................................................... 84
Figure 20. An illustration of the construction of meaning in interactive environment of education.
Klabbers (2006: 70). .............................................................................................................................. 87
Figure 21. Illustration of the macro cycle of game session. Source: Klabbers (2006: 55). .................... 89
Figure 22. Illustration of the micro-cycle – in-game activities. Source: Klabbers (2006: 57). ............... 91
Figure 23. Simulation game as a process. Kriz (2003: 495–511) ........................................................... 92
Figure 24. A model of decision-making simulation game. Own work. .................................................. 94
Figure 25. Decision-making simulation game as a process. Own work. ............................................... 96
Figure 26. Sub-process of game design. Own work. ............................................................................. 97
Figure 27. Game phase sub-process. Own work. .................................................................................. 99
Figure 28. Assessment phase sub-process. Own work. ...................................................................... 101
Figure 29. The board to play the beer game. Sterman (1984). ........................................................... 104
Figure 30. The sheet to create inventory stock and shortage charts in the beer game. Sterman (1984)
............................................................................................................................................................. 106
Figure 31. A sample view of the decision-making panel of Marketplace© simulation game in polish
language. Player’s panel: http://web3.marketplace-live.com. ........................................................... 112
Figure 32. An example of Balanced Scorecard in Marketplace© simulation game. Facilitator’s panel:
http://web3.marketplace-live.com. .................................................................................................... 113
Figure 33. Decision-making panel of TOPSiM General Management II. The system of TOPSiM game,
ver. 11.02. ............................................................................................................................................ 116
222
Figure 34. A model of internal connections in TOPSiM GM II simulation game. Participants’ resources.
............................................................................................................................................................. 117
Figure 35. Company/team assessment criterion in TOPSiM GM II simulation game. Participants’
resources. ............................................................................................................................................ 118
Figure 36. The module of function management with the function of demand. Administrator’s panel
of TOPSiM GM II. ................................................................................................................................. 119
Figure 37. The number of possible rounds in BOSS simulation game. BOSS facilitators’ resources
(Triolet and Fraser, 2010), http://www.stratxsimulations.com. ......................................................... 121
Figure 38. An example of the decision-making panel. BOSS demo software,
http://www.stratxsimulations.com. ................................................................................................... 121
Figure 39. 7 stages of development of the process of change. STC resources (Kriz & Hanse, 2012). 124
Figure 40. Polish SysTeamsChange board. Own translation based on STC (Kriz and Hanse, Wardaszko,
2012). ................................................................................................................................................... 131
Figure 41. Polish version of SysTeamsChange system together with team/group panel. STC PL game
system. ................................................................................................................................................ 132
Figure 42. An example of action card in SysTeamsChange. STC (Kriz and Hanse 2012) .................... 133
Figure 43. SysTeamsChange simulation game in action. Author’s own photos.................................. 135
Figure 44. The main screen of Hotel Stars simulation game – alpha version. Game system:
http://hotel.test.arteneo.pl. ............................................................................................................... 142
Figure 45. A chart of a sample standard demand function for 20 rooms. Own work. ....................... 145
Figure 46. Examples of m(x) advertising functions. Own work. .......................................................... 149
Figure 47. A diagram of Strategic Scorecard model for Hotel Stars simulation game. Own work. .... 151
Figure 48. Inputs and outputs of simulation game as a research method from analytical and design
perspective. Meijer (2009). ................................................................................................................. 156
Figure 49. Simulation games as analytical science and design science. Source: Klabbers (2006: 159).
............................................................................................................................................................. 159
Figure 50. Distribution of the number of students and groups in the teams in the study. Own work.
............................................................................................................................................................. 175
Figure 51. Level of understanding of the new assessment system. Own work. ................................. 178
Figure 52. Students’ opinion abou the fairness of the new assessment system. Own work. ............. 179
Figure 53. The structure of personal goals of participants of the simulation game in the experiment.
Own work. ........................................................................................................................................... 188
Figure 54. Motivation behind the decisions made in the investment game. Own work. ................... 190
Figure 55. The average number of companies in the portfolio and the average number of transactions
per round. Own work. ......................................................................................................................... 192
Figure 56. The number of persons above and below the criterion of objective in the investment
game. Own work. ................................................................................................................................ 193
Figure 57. Wyniki gry inwestycyjnej. Opracowanie własne. ............................................................... 195
Figure 58. The average results of growth in the investment game and the simulation game. Own
work. .................................................................................................................................................... 196
Figure 59. Comparison of results of simulation games in the study group and in the control group.
Own work. ........................................................................................................................................... 197
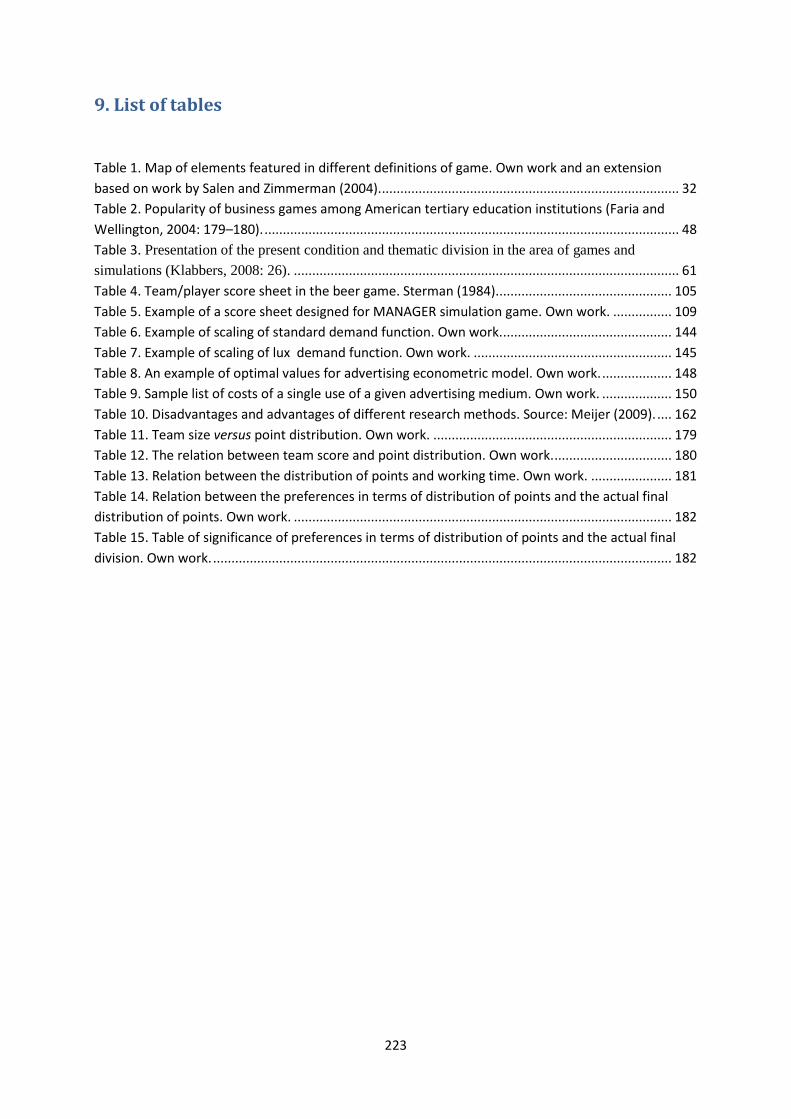
223
9. List of tables
Table 1. Map of elements featured in different definitions of game. Own work and an extension
based on work by Salen and Zimmerman (2004). ................................................................................. 32
Table 2. Popularity of business games among American tertiary education institutions (Faria and
Wellington, 2004: 179–180). ................................................................................................................. 48
Table 3. Presentation of the present condition and thematic division in the area of games and simulations (Klabbers, 2008: 26). ......................................................................................................... 61
Table 4. Team/player score sheet in the beer game. Sterman (1984). ............................................... 105
Table 5. Example of a score sheet designed for MANAGER simulation game. Own work. ................ 109
Table 6. Example of scaling of standard demand function. Own work. .............................................. 144
Table 7. Example of scaling of lux demand function. Own work. ...................................................... 145
Table 8. An example of optimal values for advertising econometric model. Own work. ................... 148
Table 9. Sample list of costs of a single use of a given advertising medium. Own work. ................... 150
Table 10. Disadvantages and advantages of different research methods. Source: Meijer (2009). .... 162
Table 11. Team size versus point distribution. Own work. ................................................................. 179
Table 12. The relation between team score and point distribution. Own work. ................................ 180
Table 13. Relation between the distribution of points and working time. Own work. ...................... 181
Table 14. Relation between the preferences in terms of distribution of points and the actual final
distribution of points. Own work. ....................................................................................................... 182
Table 15. Table of significance of preferences in terms of distribution of points and the actual final
division. Own work. ............................................................................................................................. 182
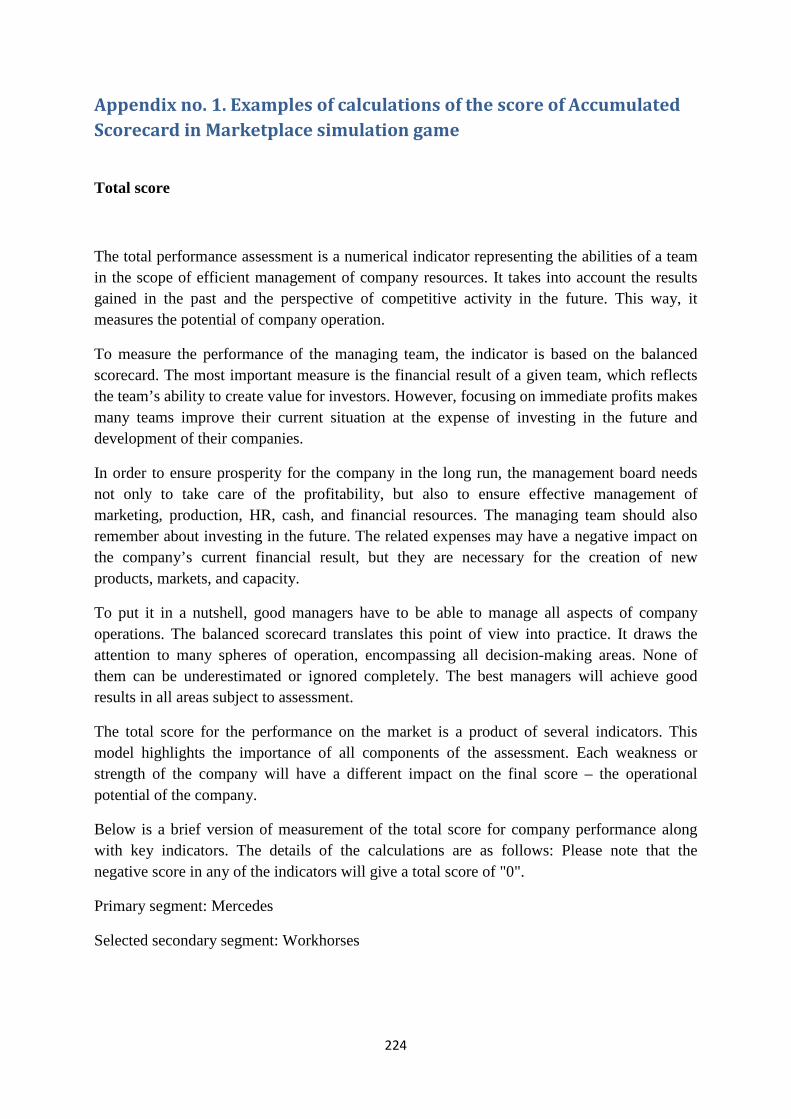
224
Appendix no. 1. Examples of calculations of the score of Accumulated
Scorecard in Marketplace simulation game
Total score
The total performance assessment is a numerical indicator representing the abilities of a team in the scope of efficient management of company resources. It takes into account the results gained in the past and the perspective of competitive activity in the future. This way, it measures the potential of company operation.
To measure the performance of the managing team, the indicator is based on the balanced scorecard. The most important measure is the financial result of a given team, which reflects the team’s ability to create value for investors. However, focusing on immediate profits makes many teams improve their current situation at the expense of investing in the future and development of their companies.
In order to ensure prosperity for the company in the long run, the management board needs not only to take care of the profitability, but also to ensure effective management of marketing, production, HR, cash, and financial resources. The managing team should also remember about investing in the future. The related expenses may have a negative impact on the company’s current financial result, but they are necessary for the creation of new products, markets, and capacity.
To put it in a nutshell, good managers have to be able to manage all aspects of company operations. The balanced scorecard translates this point of view into practice. It draws the attention to many spheres of operation, encompassing all decision-making areas. None of them can be underestimated or ignored completely. The best managers will achieve good results in all areas subject to assessment.
The total score for the performance on the market is a product of several indicators. This model highlights the importance of all components of the assessment. Each weakness or strength of the company will have a different impact on the final score – the operational potential of the company.
Below is a brief version of measurement of the total score for company performance along with key indicators. The details of the calculations are as follows: Please note that the negative score in any of the indicators will give a total score of "0".
Primary segment: Mercedes
Selected secondary segment: Workhorses
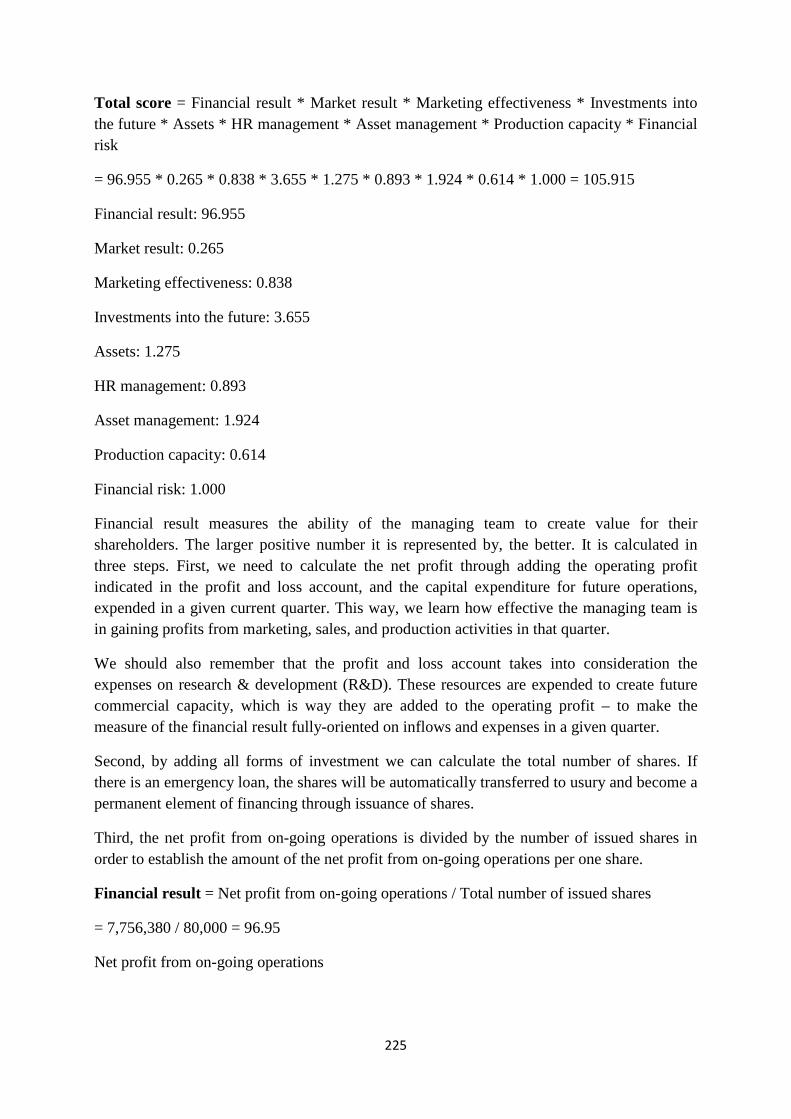
225
Total score = Financial result * Market result * Marketing effectiveness * Investments into the future * Assets * HR management * Asset management * Production capacity * Financial risk
= 96.955 * 0.265 * 0.838 * 3.655 * 1.275 * 0.893 * 1.924 * 0.614 * 1.000 = 105.915
Financial result: 96.955
Market result: 0.265
Marketing effectiveness: 0.838
Investments into the future: 3.655
Assets: 1.275
HR management: 0.893
Asset management: 1.924
Production capacity: 0.614
Financial risk: 1.000
Financial result measures the ability of the managing team to create value for their shareholders. The larger positive number it is represented by, the better. It is calculated in three steps. First, we need to calculate the net profit through adding the operating profit indicated in the profit and loss account, and the capital expenditure for future operations, expended in a given current quarter. This way, we learn how effective the managing team is in gaining profits from marketing, sales, and production activities in that quarter.
We should also remember that the profit and loss account takes into consideration the expenses on research & development (R&D). These resources are expended to create future commercial capacity, which is way they are added to the operating profit – to make the measure of the financial result fully-oriented on inflows and expenses in a given quarter.
Second, by adding all forms of investment we can calculate the total number of shares. If there is an emergency loan, the shares will be automatically transferred to usury and become a permanent element of financing through issuance of shares.
Third, the net profit from on-going operations is divided by the number of issued shares in order to establish the amount of the net profit from on-going operations per one share.
Financial result = Net profit from on-going operations / Total number of issued shares
= 7,756,380 / 80,000 = 96.95
Net profit from on-going operations
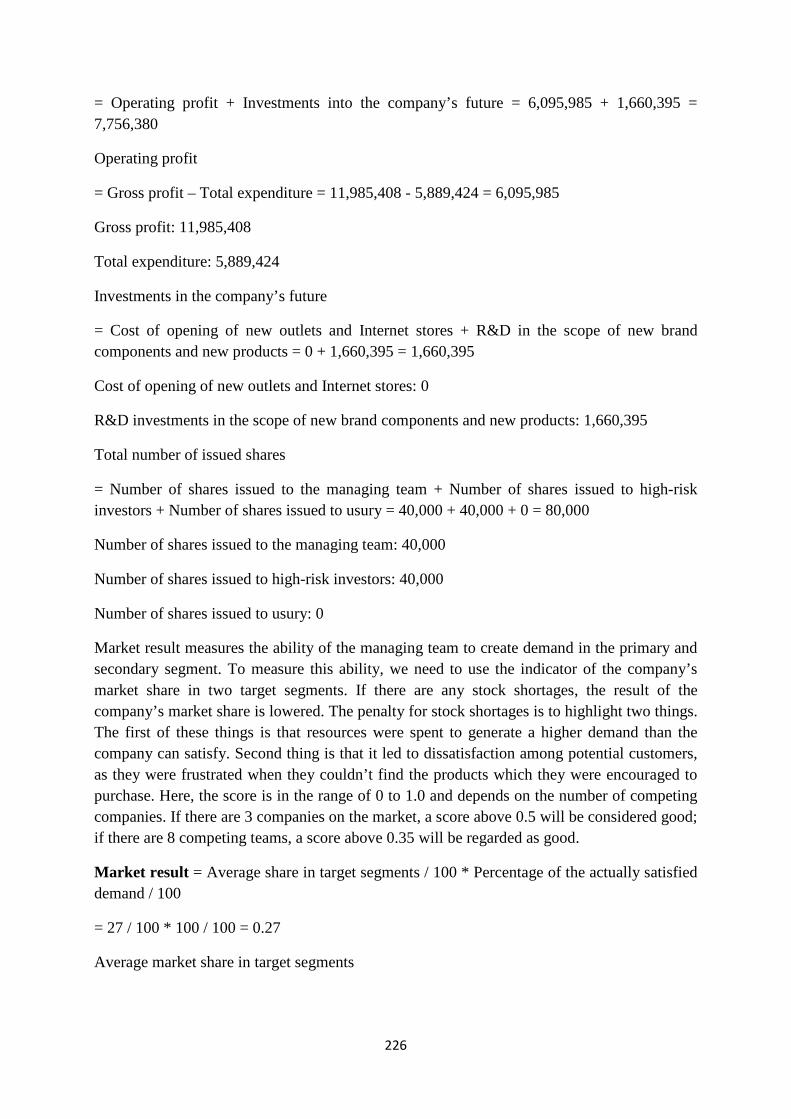
226
= Operating profit + Investments into the company’s future = 6,095,985 + 1,660,395 = 7,756,380
Operating profit
= Gross profit – Total expenditure = 11,985,408 - 5,889,424 = 6,095,985
Gross profit: 11,985,408
Total expenditure: 5,889,424
Investments in the company’s future
= Cost of opening of new outlets and Internet stores + R&D in the scope of new brand components and new products = 0 + 1,660,395 = 1,660,395
Cost of opening of new outlets and Internet stores: 0
R&D investments in the scope of new brand components and new products: 1,660,395
Total number of issued shares
= Number of shares issued to the managing team + Number of shares issued to high-risk investors + Number of shares issued to usury = 40,000 + 40,000 + 0 = 80,000
Number of shares issued to the managing team: 40,000
Number of shares issued to high-risk investors: 40,000
Number of shares issued to usury: 0
Market result measures the ability of the managing team to create demand in the primary and secondary segment. To measure this ability, we need to use the indicator of the company’s market share in two target segments. If there are any stock shortages, the result of the company’s market share is lowered. The penalty for stock shortages is to highlight two things. The first of these things is that resources were spent to generate a higher demand than the company can satisfy. Second thing is that it led to dissatisfaction among potential customers, as they were frustrated when they couldn’t find the products which they were encouraged to purchase. Here, the score is in the range of 0 to 1.0 and depends on the number of competing companies. If there are 3 companies on the market, a score above 0.5 will be considered good; if there are 8 competing teams, a score above 0.35 will be regarded as good.
Market result = Average share in target segments / 100 * Percentage of the actually satisfied demand / 100
= 27 / 100 * 100 / 100 = 0.27
Average market share in target segments
227
= ( Market share in the first segment + Market share in the second segment ) / 2 = ( 21 + 32 ) / 2 = 27
Market share in the first segment: 21
Market share in the second segment: 32
Percentage of the actually satisfied demand
= ( ( Total net demand – Amount of stock shortages ) / Total net demand ) * 100 = ( ( 5,751 - 0 ) / 5,751 ) * 100 = 100
Total net demand: 5,751
Amount of stock shortages: 0
Marketing effectiveness measures the ability of the managing team to satisfy the needs of the company’s clients and is defined by the quality of the company’s products and adverts. Customer satisfaction is measured through surveying customers’ perception of company products and adverts for significance. The indicator of marketing effectiveness is arrived at through averaging of both of these results. The score is within the range of 0 to 1.0. A good score is a score above 0.8
Marketing effectiveness = ( Average product score / 100 + Average advert score / 100 ) / 2
= ( 86 / 100 + 82 / 100 ) / 2 = 0.84
Average product score
= ( The highest score of a product in the first segment + The highest score of a product in the second segment ) / 2 = ( 92 + 80 ) / 2 = 86
The highest score of a product in the first segment: 92
The highest score of a product in the second segment: 80
Average advert score
= ( The highest score of an advert in the first segment + The highest score of an advert in the second segment ) / 2 = ( 79 + 84 ) / 2 = 82
The highest score of an advert in the first segment: 79
The highest score of an advert in the second segment: 84
Investing in the future reflects the managing team’s will to spend the current income for activities aiming to improve future business potential. It is necessary, but involves some risk. In a short-term perspective, such expenses may lead to substantial losses indicated in the profit and loss account. As a result, the retained earnings may be expressed in a negative number of high absolute value. This would mean that a big part of the shareholders’ capital is
228
consumed by company operations. Yet, in the long-run, such investments are necessary for the company to remain competitive. So, the point is to find a balance between the loss of shareholders’ assets, and the expenditures that would generate even more profit for shareholders in the future. The score is always equal or above 1.0, and when it is above 3.0, it is considered good.
Inwestowanie w przyszłość = ( Skumulowane koszty mające korzystny wpływ na przyszłość / Skumulowane przychody netto ) * 10 + 1
= ( 10,495,354 / 39,525,208 ) * 10 + 1 = 3.66
Accumulated costs with positive impact on the future
= Accumulated costs of opening of new outlets and Internet stores + Accumulated R&D investments in new brand components and new products + Accumulated R&D licenses + Accumulated depreciation = 1,340,000 + 7,938,687 + 900,000 + 316,667 = 10,495,354
Accumulated costs of opening of new outlets and Internet stores: 1,340,000
Accumulated R&D investments in new brand components and new products: 7,938,687
Accumulated R&D licenses: 900,000
Accumulated depreciation: 316,667
Accumulated net revenues
= Accumulated revenues from sales – Accumulated discounts = 40,832,410 - 1,307,202 = 39,525,208
Accumulated revenues from sales: 40,832,410
Accumulated discounts: 1,307,202
Assets measure the ability of the managing team to multiply the initial assets contributed by shareholders. At the initial stage of operation of the company, it is normal that the initial assets of shareholders is consumed to create new products and to conduct research and development in the scope of new components of products. The expenses are considerably larger than the inflow, which leads to big losses; hence, the value of the retained earnings will be expressed in a negative number.
In order to arrive at the indicator of asset generation, we need to first calculate the net assets of the company by adding the retained earnings to the total value of investments made by the shareholders. The value of the retained earnings is the sum of all earnings since the moment of establishment of the company. In the light of the above, the retained earnings will be negative in the first quarters, as the company will be investing in its development.
Next, we need to divide the net assets of the company by the total value of investments made by the shareholders. A value equal or below zero means bankruptcy. A result above zero and
229
below one means that the managing team operates on the initial capital of the shareholders to cover the on-going expenses and to invest in future operations. A score above one means that the company multiplies the assets of the shareholders.
Assets = Company net assets / Shareholders’ shares in total
= 10,198,336 / 8,000,000 = 1.27
Company net assets
= Retained earnings + Ordinary shares = 2,198,336 + 8,000,000 = 10,198,336
Retained earnings: 2,198,336
Ordinary shares: 8,000,000
Shareholders’ shares in total
= Ordinary shares = 8,000,000 = 8,000,000
Ordinary shares: 8,000,000
Human resources management measures the managing team’s ability to employ the best staff possible, to satisfy the needs of the employees, and to motivate them to work better. We can arrive at one common result by averaging the measure of the performance of production department staff and of the performance of sales department staff. Good results can be achieved if the remuneration system is competitive and adequate to changeable expectations of the employees. The score is in the range of 0 to 1.00, and a good result is a result above 0.80.
Human resources management = ( Sales force performance / 100 + Production staff performance / 100 ) / 2
= ( 83 / 100 + 96 / 100 ) / 2 = 0.89
Sales force performance: 83
Production staff performance: 96
Asset management measures the managing team’s ability to use company’s assets to gain revenues on sales. Asset management is measured through analyzing the trade of assets of the company. Effective managers can trade company’s assets to gain sales of two or even three times the value of the assets. Thus, a very good result will be a value of 3.0.
Asset management = Asset trading * Penalty for excess stock
= 1.95 * 0.99 = 1.92
Asset trading
= Net revenues / Assets in total = 19,902,567 / 10,198,336 = 1.95
230
Net revenues
= Revenues on sales - Discounts + Interest income = 20,483,959 - 581,392 + 0 = 19,902,567
Revenues on sales: 20,483,959
Discounts: 581,392
Interest income: 0
Assets in total: 10,198,336
Penalty for excess stock
= 1 – Final warehouse inventory count / Production = 1 - 80 / 5,751 = 0.99
Final warehouse inventory count: 80
Production: 5,751
Production capacity is the measure of how much of production capacities are actually used in production compared to excess manufacturing capacities. Excess manufacturing capacities generate costs if the production schedule involves production of a larger amount of goods than necessary to satisfy the demand or to replenish the stock in the warehouse. Good forecasting and effective planning of production will reduce the penalties for excess manufacturing capacities.
The score is within the range of 0.0 of 1.0, and 0.80 will be a very good result.
Production capacity = ( Percentage of production capacities used in production / 100 )
= ( 61 / 100 ) = 0.61
Percentage of production capacities used in production: 61
Financial risk measures the managing team’s ability to manage debt as a source of financing. Financial risk indicator is based on the extent to which the debt constitutes a part of the company’s capital. As the debt-to-total-capital ratio increases, the financial risk of the company grows as well. And vice versa – as the ratio of equity capital to total capital grows, the financial risk decreases.
To calculate the financial risk, we need arrive at the share of equity capital through calculating the value of equity capital in the company and dividing it by the value of the capital invested in the company from all sources. To be more precise, the amount of equity capital equals the sum of ordinary shares and retained earnings. The value of the capital equals the sum of debt plus ordinary shares plus retained earnings. As the ratio of equity capital to total capital decreases (i.e. as the debt increases), the financial risk grows.
231
A value equal 1.00 tells us that there is no debt, so there is no financial risk.
It is important to realize that financial managers are not completely against incurring debts. The optimal capital structure of different companies will depend on their tax situation, general risk, asset base, and financial freedom. Some level of debt may be, in fact, desired if it could help the company use more possibilities which would lean to gain in value (i.e. opportunities which could let the company earn more than its weighted average cost of capital).
In order to alleviate or reduce the effect of low value of debt in company capital structure, the share of equity capital in the company is increased to 0.5 power (square root). So, if the debt constitutes 20% of the capital structure, the indicator of the financial risk will be 0.89 (0.80 ^ 0.5). If the debt amounted to 50% of the capital structure, the financial risk indicator would be 0.71.
A financial risk indicator below 0.80 (more than 36% of debt) will be considered unfavorable.
Financial risk = ( Total shares / Total capital ) ^ 0.5
= ( 10,198,336 / 10,198,336 ) ^ 0.5 = 1.00
Total shares
= Ordinary shares + Retained earnings = 8,000,000 + 2,198,336 = 10,198,336
Ordinary shares: 8,000,000
Retained earnings: 2,198,336
Total capital
= Ordinary shares + Retained earnings + Debt = 8,000,000 + 2,198,336 + 0 = 10,198,336
Ordinary shares: 8,000,000
Retained earnings: 2,198,336
Debt: 0
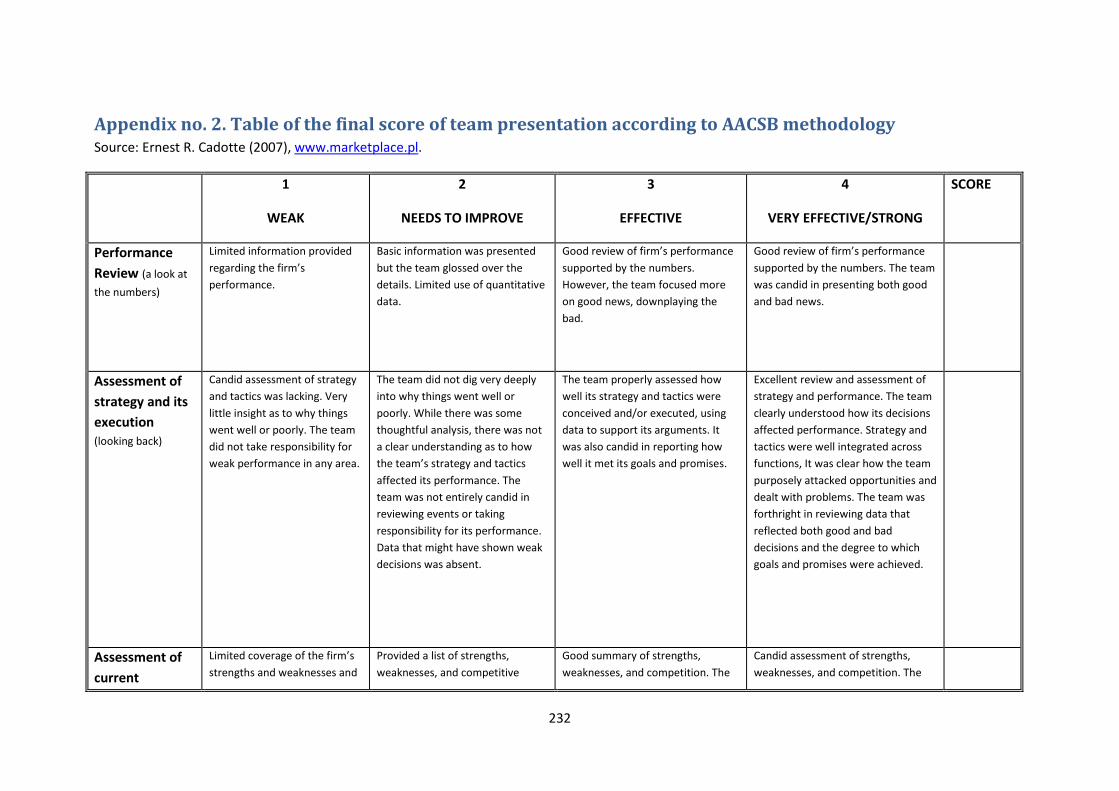
232
Appendix no. 2. Table of the final score of team presentation according to AACSB methodology Source: Ernest R. Cadotte (2007), www.marketplace.pl.
1
WEAK
2
NEEDS TO IMPROVE
3
EFFECTIVE
4
VERY EFFECTIVE/STRONG
SCORE
Performance
Review (a look at
the numbers)
Limited information provided
regarding the firm’s
performance.
Basic information was presented
but the team glossed over the
details. Limited use of quantitative
data.
Good review of firm’s performance
supported by the numbers.
However, the team focused more
on good news, downplaying the
bad.
Good review of firm’s performance
supported by the numbers. The team
was candid in presenting both good
and bad news.
Assessment of
strategy and its
execution
(looking back)
Candid assessment of strategy
and tactics was lacking. Very
little insight as to why things
went well or poorly. The team
did not take responsibility for
weak performance in any area.
The team did not dig very deeply
into why things went well or
poorly. While there was some
thoughtful analysis, there was not
a clear understanding as to how
the team’s strategy and tactics
affected its performance. The
team was not entirely candid in
reviewing events or taking
responsibility for its performance.
Data that might have shown weak
decisions was absent.
The team properly assessed how
well its strategy and tactics were
conceived and/or executed, using
data to support its arguments. It
was also candid in reporting how
well it met its goals and promises.
Excellent review and assessment of
strategy and performance. The team
clearly understood how its decisions
affected performance. Strategy and
tactics were well integrated across
functions, It was clear how the team
purposely attacked opportunities and
dealt with problems. The team was
forthright in reviewing data that
reflected both good and bad
decisions and the degree to which
goals and promises were achieved.
Assessment of
current
Limited coverage of the firm’s
strengths and weaknesses and
Provided a list of strengths,
weaknesses, and competitive
Good summary of strengths,
weaknesses, and competition. The
Candid assessment of strengths,
weaknesses, and competition. The
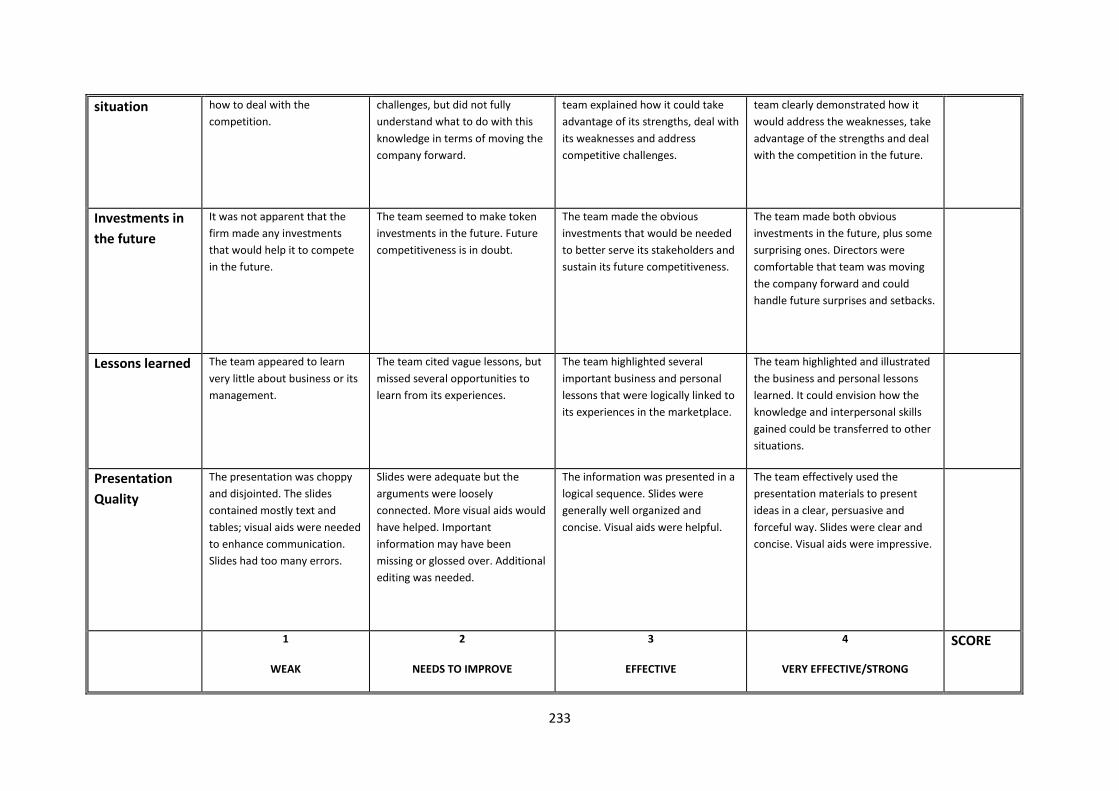
233
situation how to deal with the
competition.
challenges, but did not fully
understand what to do with this
knowledge in terms of moving the
company forward.
team explained how it could take
advantage of its strengths, deal with
its weaknesses and address
competitive challenges.
team clearly demonstrated how it
would address the weaknesses, take
advantage of the strengths and deal
with the competition in the future.
Investments in
the future
It was not apparent that the
firm made any investments
that would help it to compete
in the future.
The team seemed to make token
investments in the future. Future
competitiveness is in doubt.
The team made the obvious
investments that would be needed
to better serve its stakeholders and
sustain its future competitiveness.
The team made both obvious
investments in the future, plus some
surprising ones. Directors were
comfortable that team was moving
the company forward and could
handle future surprises and setbacks.
Lessons learned The team appeared to learn
very little about business or its
management.
The team cited vague lessons, but
missed several opportunities to
learn from its experiences.
The team highlighted several
important business and personal
lessons that were logically linked to
its experiences in the marketplace.
The team highlighted and illustrated
the business and personal lessons
learned. It could envision how the
knowledge and interpersonal skills
gained could be transferred to other
situations.
Presentation
Quality
The presentation was choppy
and disjointed. The slides
contained mostly text and
tables; visual aids were needed
to enhance communication.
Slides had too many errors.
Slides were adequate but the
arguments were loosely
connected. More visual aids would
have helped. Important
information may have been
missing or glossed over. Additional
editing was needed.
The information was presented in a
logical sequence. Slides were
generally well organized and
concise. Visual aids were helpful.
The team effectively used the
presentation materials to present
ideas in a clear, persuasive and
forceful way. Slides were clear and
concise. Visual aids were impressive.
1
WEAK
2
NEEDS TO IMPROVE
3
EFFECTIVE
4
VERY EFFECTIVE/STRONG
SCORE
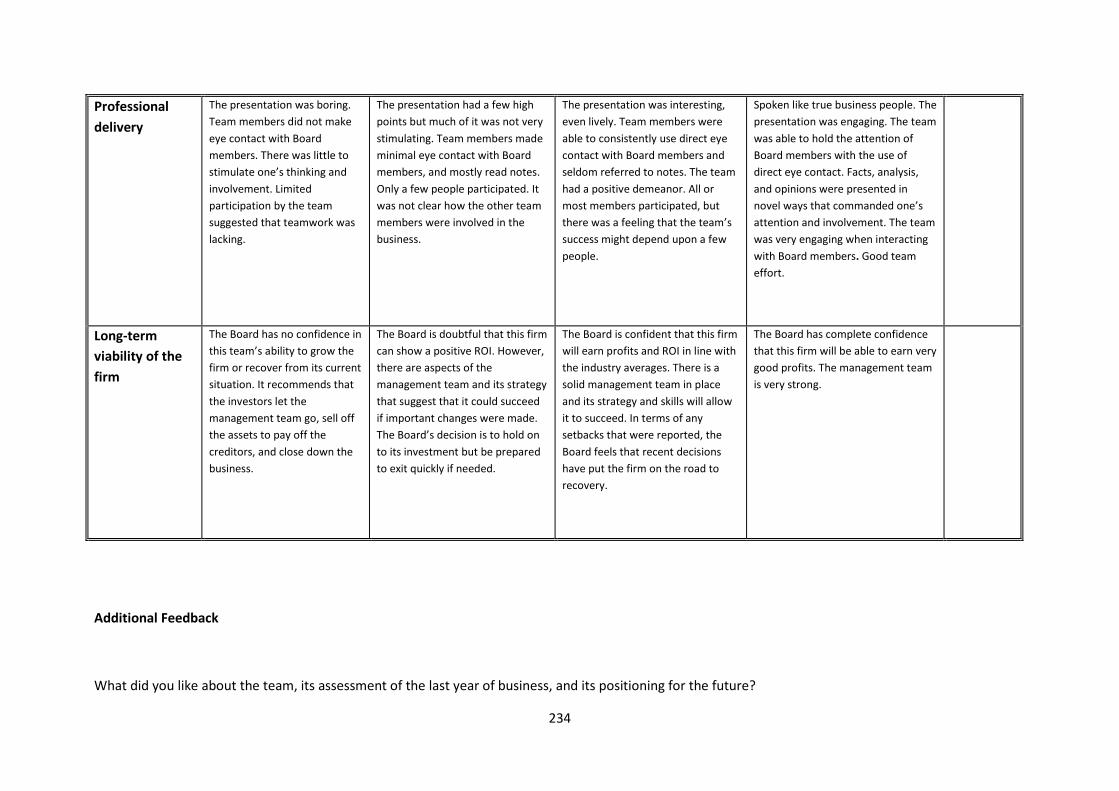
234
Professional
delivery
The presentation was boring.
Team members did not make
eye contact with Board
members. There was little to
stimulate one’s thinking and
involvement. Limited
participation by the team
suggested that teamwork was
lacking.
The presentation had a few high
points but much of it was not very
stimulating. Team members made
minimal eye contact with Board
members, and mostly read notes.
Only a few people participated. It
was not clear how the other team
members were involved in the
business.
The presentation was interesting,
even lively. Team members were
able to consistently use direct eye
contact with Board members and
seldom referred to notes. The team
had a positive demeanor. All or
most members participated, but
there was a feeling that the team’s
success might depend upon a few
people.
Spoken like true business people. The
presentation was engaging. The team
was able to hold the attention of
Board members with the use of
direct eye contact. Facts, analysis,
and opinions were presented in
novel ways that commanded one’s
attention and involvement. The team
was very engaging when interacting
with Board members. Good team
effort.
Long-term
viability of the
firm
The Board has no confidence in
this team’s ability to grow the
firm or recover from its current
situation. It recommends that
the investors let the
management team go, sell off
the assets to pay off the
creditors, and close down the
business.
The Board is doubtful that this firm
can show a positive ROI. However,
there are aspects of the
management team and its strategy
that suggest that it could succeed
if important changes were made.
The Board’s decision is to hold on
to its investment but be prepared
to exit quickly if needed.
The Board is confident that this firm
will earn profits and ROI in line with
the industry averages. There is a
solid management team in place
and its strategy and skills will allow
it to succeed. In terms of any
setbacks that were reported, the
Board feels that recent decisions
have put the firm on the road to
recovery.
The Board has complete confidence
that this firm will be able to earn very
good profits. The management team
is very strong.
Additional Feedback
What did you like about the team, its assessment of the last year of business, and its positioning for the future?
235
Where do you think the team could improve?
What do you think is a realistic price for the firm’s stock given how things went in the second year and how well the team has prepared itself for the future?
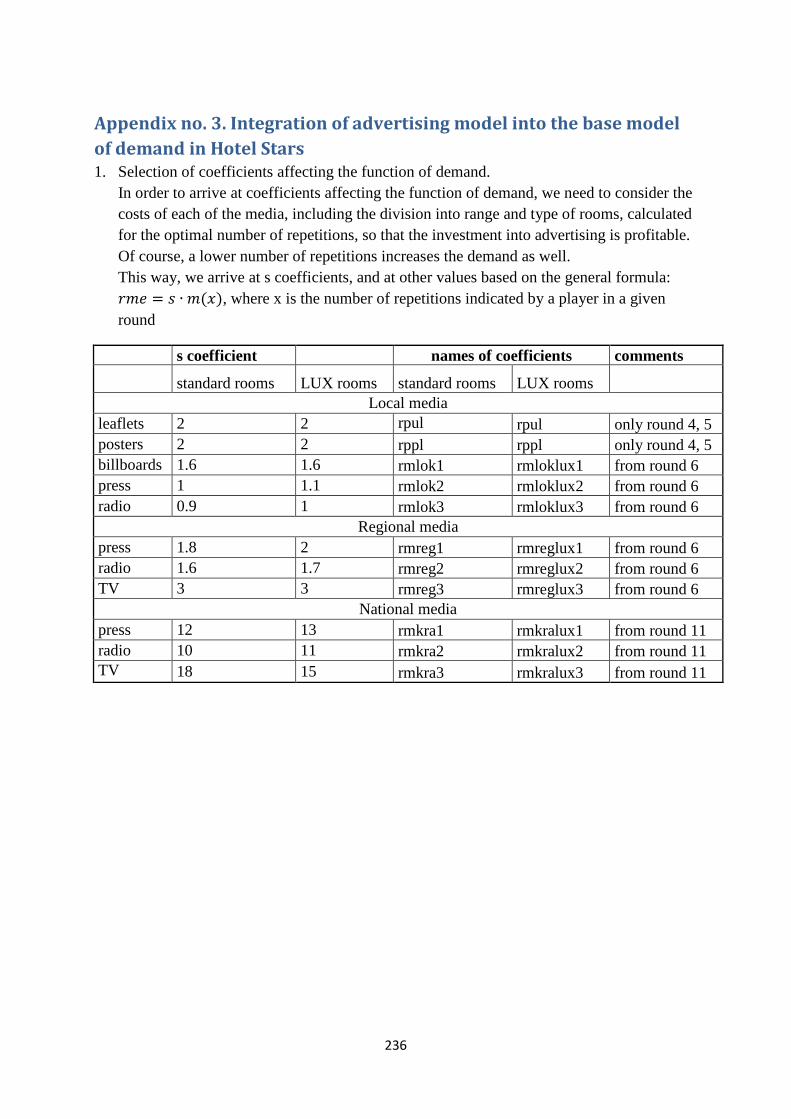
236
Appendix no. 3. Integration of advertising model into the base model
of demand in Hotel Stars
1. Selection of coefficients affecting the function of demand. In order to arrive at coefficients affecting the function of demand, we need to consider the costs of each of the media, including the division into range and type of rooms, calculated for the optimal number of repetitions, so that the investment into advertising is profitable. Of course, a lower number of repetitions increases the demand as well. This way, we arrive at s coefficients, and at other values based on the general formula: 789 = : ∙ 8��, where x is the number of repetitions indicated by a player in a given round
s coefficient names of coefficients comments standard rooms LUX rooms standard rooms LUX rooms
Local media leaflets 2 2 rpul rpul only round 4, 5 posters 2 2 rppl rppl only round 4, 5 billboards 1.6 1.6 rmlok1 rmloklux1 from round 6 press 1 1.1 rmlok2 rmloklux2 from round 6 radio 0.9 1 rmlok3 rmloklux3 from round 6
Regional media press 1.8 2 rmreg1 rmreglux1 from round 6 radio 1.6 1.7 rmreg2 rmreglux2 from round 6 TV 3 3 rmreg3 rmreglux3 from round 6
National media press 12 13 rmkra1 rmkralux1 from round 11 radio 10 11 rmkra2 rmkralux2 from round 11 TV 18 15 rmkra3 rmkralux3 from round 11
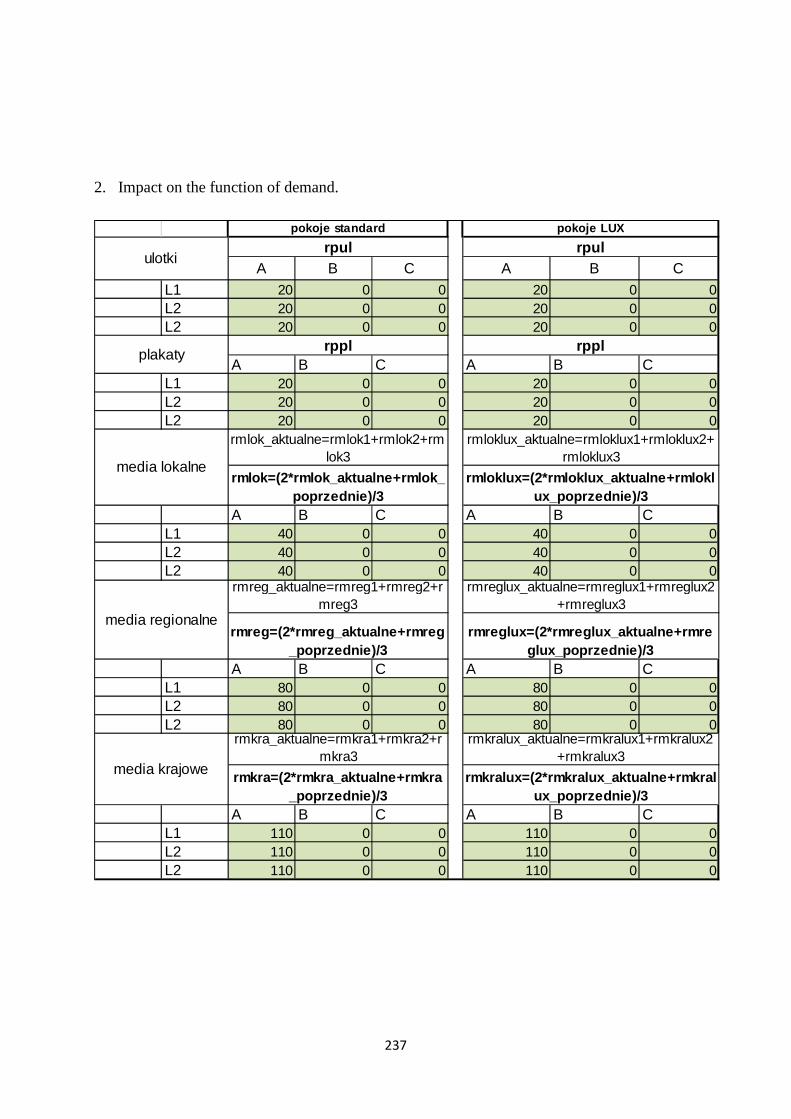
237
A B C A B CL1 20 0 0 20 0 0L2 20 0 0 20 0 0L2 20 0 0 20 0 0
A B C A B CL1 20 0 0 20 0 0L2 20 0 0 20 0 0L2 20 0 0 20 0 0
A B C A B CL1 40 0 0 40 0 0L2 40 0 0 40 0 0L2 40 0 0 40 0 0
A B C A B CL1 80 0 0 80 0 0L2 80 0 0 80 0 0L2 80 0 0 80 0 0
A B C A B CL1 110 0 0 110 0 0L2 110 0 0 110 0 0L2 110 0 0 110 0 0
rppl
rmreglux_aktualne=rmreglux1+rmreglux2+rmreglux3
rmreg=(2*rmreg_aktualne+rmreg
_poprzednie)/3
rmreglux=(2*rmreglux_aktualne+rmre
glux_poprzednie)/3
media krajowe
rmkra_aktualne=rmkra1+rmkra2+rmkra3
rmkralux_aktualne=rmkralux1+rmkralux2+rmkralux3
rmkra=(2*rmkra_aktualne+rmkra_poprzednie)/3
rmkralux=(2*rmkralux_aktualne+rmkral
ux_poprzednie)/3
rpulpokoje standard pokoje LUX
rmlok_aktualne=rmlok1+rmlok2+rmlok3
rmloklux_aktualne=rmloklux1+rmloklux2+rmloklux3
rmlok=(2*rmlok_aktualne+rmlok_poprzednie)/3
rmloklux=(2*rmloklux_aktualne+rmlokl
ux_poprzednie)/3
media lokalne
media regionalne
rmreg_aktualne=rmreg1+rmreg2+rmreg3
plakaty
ulotkirpul
rppl
2. Impact on the function of demand.
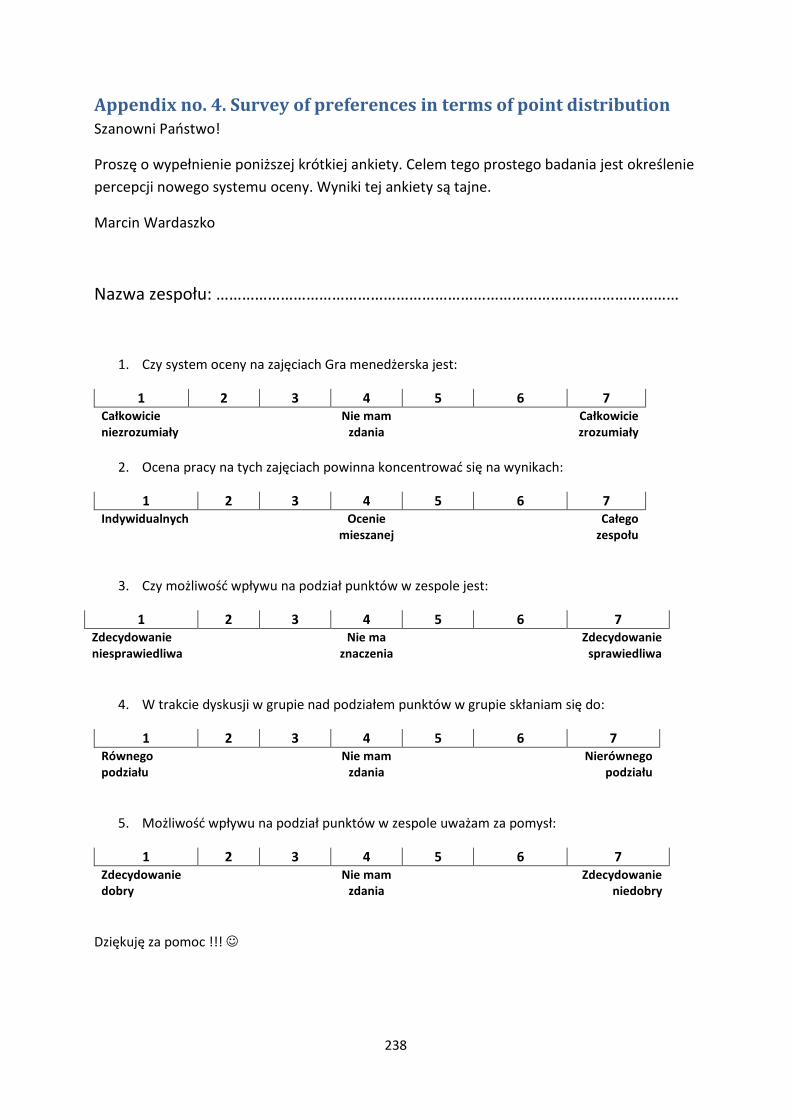
238
Appendix no. 4. Survey of preferences in terms of point distribution
Szanowni Państwo!
Proszę o wypełnienie poniższej krótkiej ankiety. Celem tego prostego badania jest określenie
percepcji nowego systemu oceny. Wyniki tej ankiety są tajne.
Marcin Wardaszko
Nazwa zespołu: ………………………………………………………………………………………………
1. Czy system oceny na zajęciach Gra menedżerska jest:
1 2 3 4 5 6 7
Całkowicie
niezrozumiały
Nie mam
zdania
Całkowicie
zrozumiały
2. Ocena pracy na tych zajęciach powinna koncentrować się na wynikach:
1 2 3 4 5 6 7
Indywidualnych Ocenie
mieszanej
Całego
zespołu
3. Czy możliwość wpływu na podział punktów w zespole jest:
1 2 3 4 5 6 7
Zdecydowanie
niesprawiedliwa
Nie ma
znaczenia
Zdecydowanie
sprawiedliwa
4. W trakcie dyskusji w grupie nad podziałem punktów w grupie skłaniam się do:
1 2 3 4 5 6 7
Równego
podziału
Nie mam
zdania
Nierównego
podziału
5. Możliwość wpływu na podział punktów w zespole uważam za pomysł:
1 2 3 4 5 6 7
Zdecydowanie
dobry
Nie mam
zdania
Zdecydowanie
niedobry
Dziękuję za pomoc !!! ☺
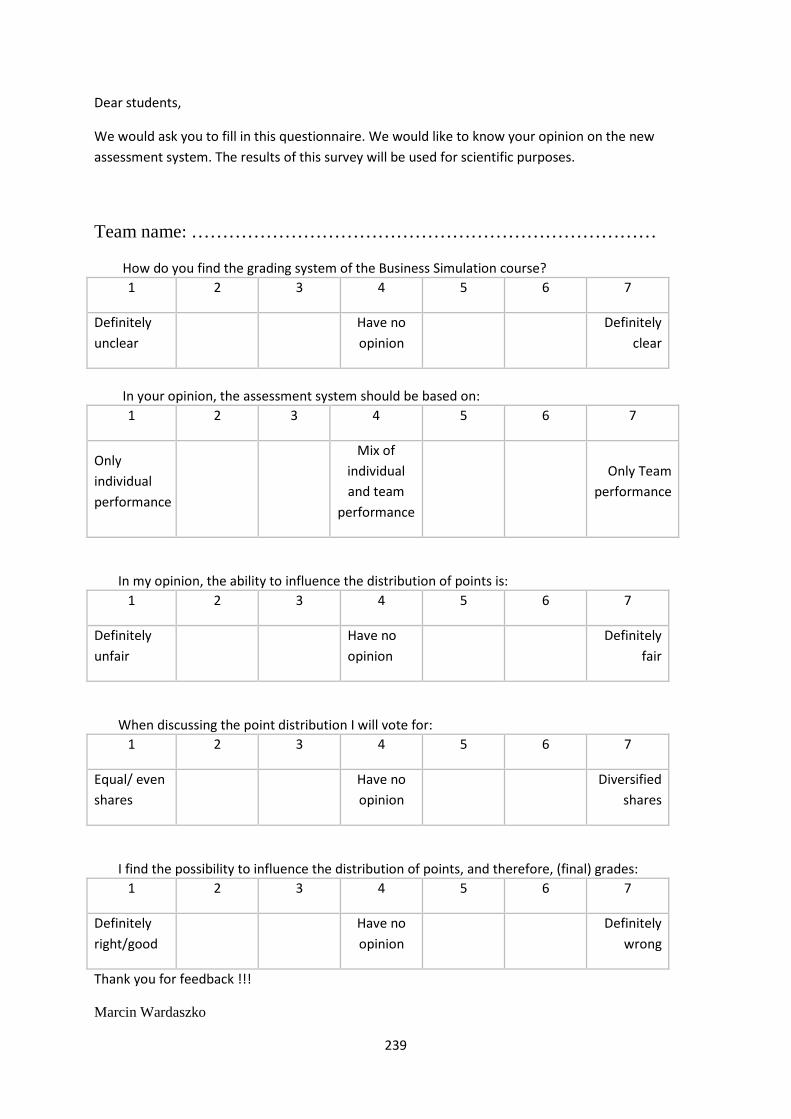
239
Dear students,
We would ask you to fill in this questionnaire. We would like to know your opinion on the new
assessment system. The results of this survey will be used for scientific purposes.
Team name: …………………………………………………………………
How do you find the grading system of the Business Simulation course?
1 2 3 4 5 6 7
Definitely
unclear
Have no
opinion
Definitely
clear
In your opinion, the assessment system should be based on:
1 2 3 4 5 6 7
Only
individual
performance
Mix of
individual
and team
performance
Only Team
performance
In my opinion, the ability to influence the distribution of points is:
1 2 3 4 5 6 7
Definitely
unfair
Have no
opinion
Definitely
fair
When discussing the point distribution I will vote for:
1 2 3 4 5 6 7
Equal/ even
shares
Have no
opinion
Diversified
shares
I find the possibility to influence the distribution of points, and therefore, (final) grades:
1 2 3 4 5 6 7
Definitely
right/good
Have no
opinion
Definitely
wrong
Thank you for feedback !!!
Marcin Wardaszko
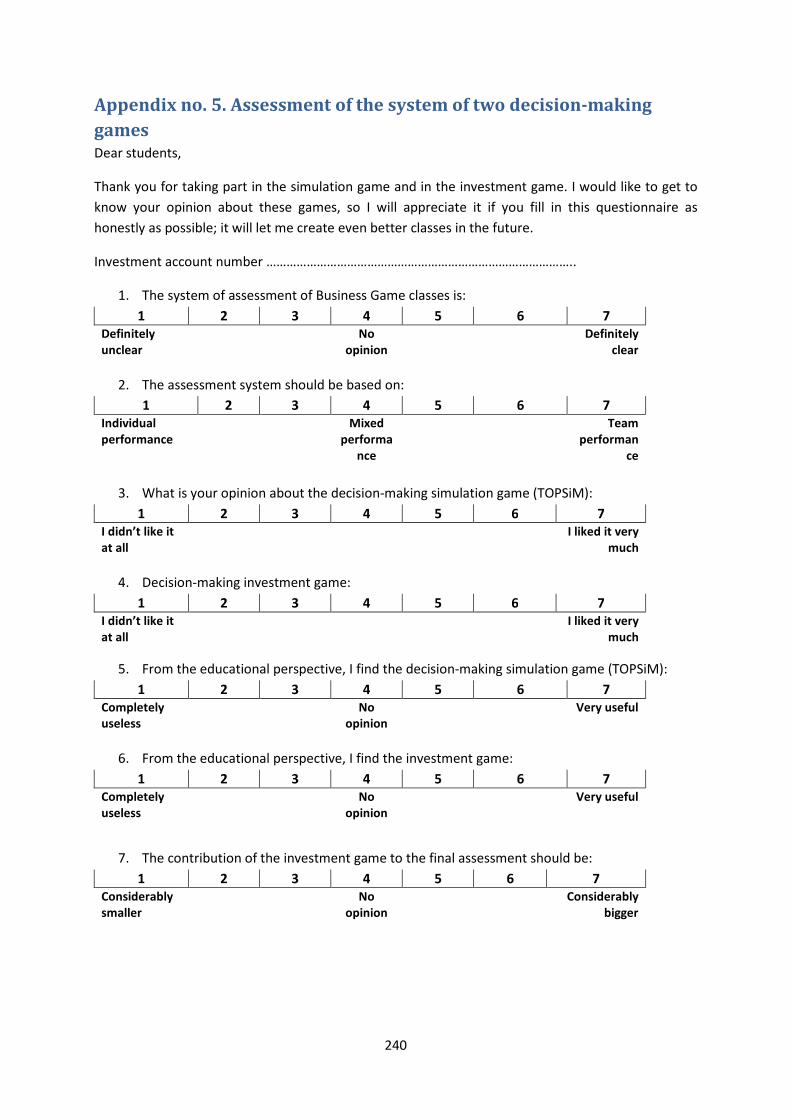
240
Appendix no. 5. Assessment of the system of two decision-making
games Dear students,
Thank you for taking part in the simulation game and in the investment game. I would like to get to
know your opinion about these games, so I will appreciate it if you fill in this questionnaire as
honestly as possible; it will let me create even better classes in the future.
Investment account number ………………………………………………………………………………..
1. The system of assessment of Business Game classes is:
1 2 3 4 5 6 7
Definitely
unclear
No
opinion
Definitely
clear
2. The assessment system should be based on:
1 2 3 4 5 6 7
Individual
performance
Mixed
performa
nce
Team
performan
ce
3. What is your opinion about the decision-making simulation game (TOPSiM):
1 2 3 4 5 6 7
I didn’t like it
at all
I liked it very
much
4. Decision-making investment game:
1 2 3 4 5 6 7
I didn’t like it
at all
I liked it very
much
5. From the educational perspective, I find the decision-making simulation game (TOPSiM):
1 2 3 4 5 6 7
Completely
useless
No
opinion
Very useful
6. From the educational perspective, I find the investment game:
1 2 3 4 5 6 7
Completely
useless
No
opinion
Very useful
7. The contribution of the investment game to the final assessment should be:
1 2 3 4 5 6 7
Considerably
smaller
No
opinion
Considerably
bigger
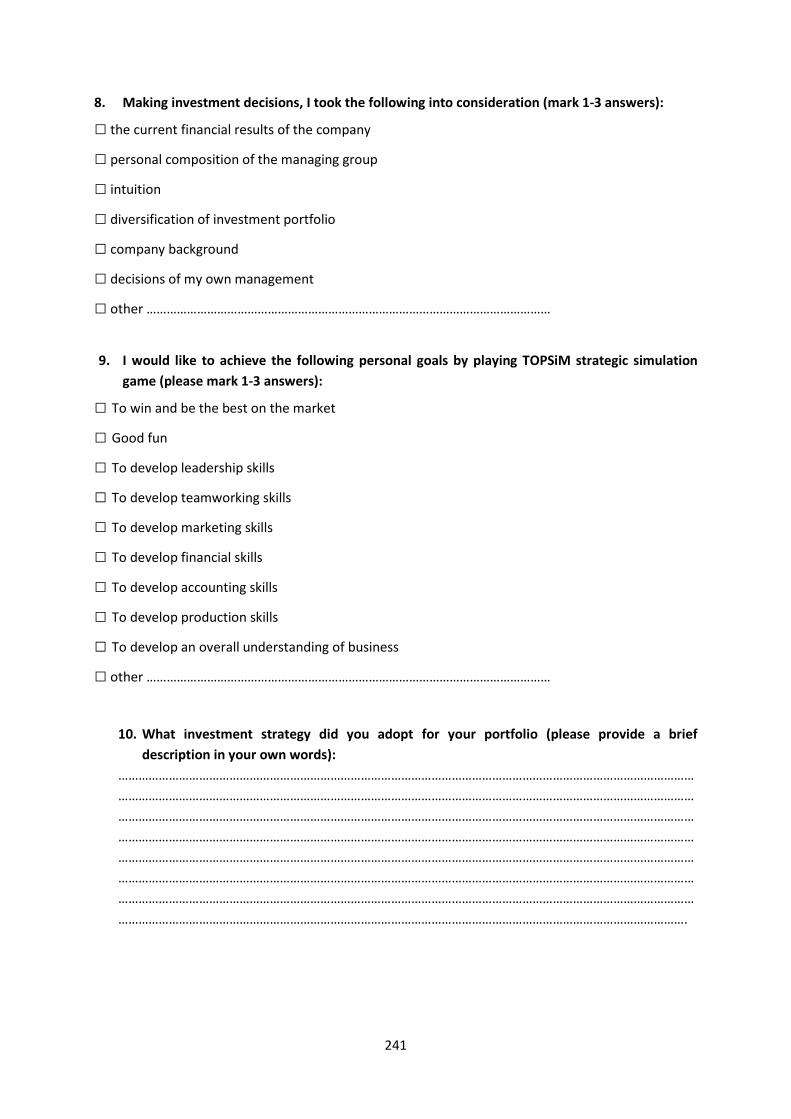
241
8. Making investment decisions, I took the following into consideration (mark 1-3 answers):
□ the current financial results of the company
□ personal composition of the managing group
□ intuition
□ diversification of investment portfolio
□ company background
□ decisions of my own management
□ other …………………………………………………………………………………………………………
9. I would like to achieve the following personal goals by playing TOPSiM strategic simulation
game (please mark 1-3 answers):
□ To win and be the best on the market
□ Good fun
□ To develop leadership skills
□ To develop teamworking skills
□ To develop marketing skills
□ To develop financial skills
□ To develop accounting skills
□ To develop production skills
□ To develop an overall understanding of business
□ other …………………………………………………………………………………………………………
10. What investment strategy did you adopt for your portfolio (please provide a brief
description in your own words):
………………………………………………………………………………………………………………………………………………………
………………………………………………………………………………………………………………………………………………………
………………………………………………………………………………………………………………………………………………………
………………………………………………………………………………………………………………………………………………………
………………………………………………………………………………………………………………………………………………………
………………………………………………………………………………………………………………………………………………………
………………………………………………………………………………………………………………………………………………………
…………………………………………………………………………………………………………………………………………………….
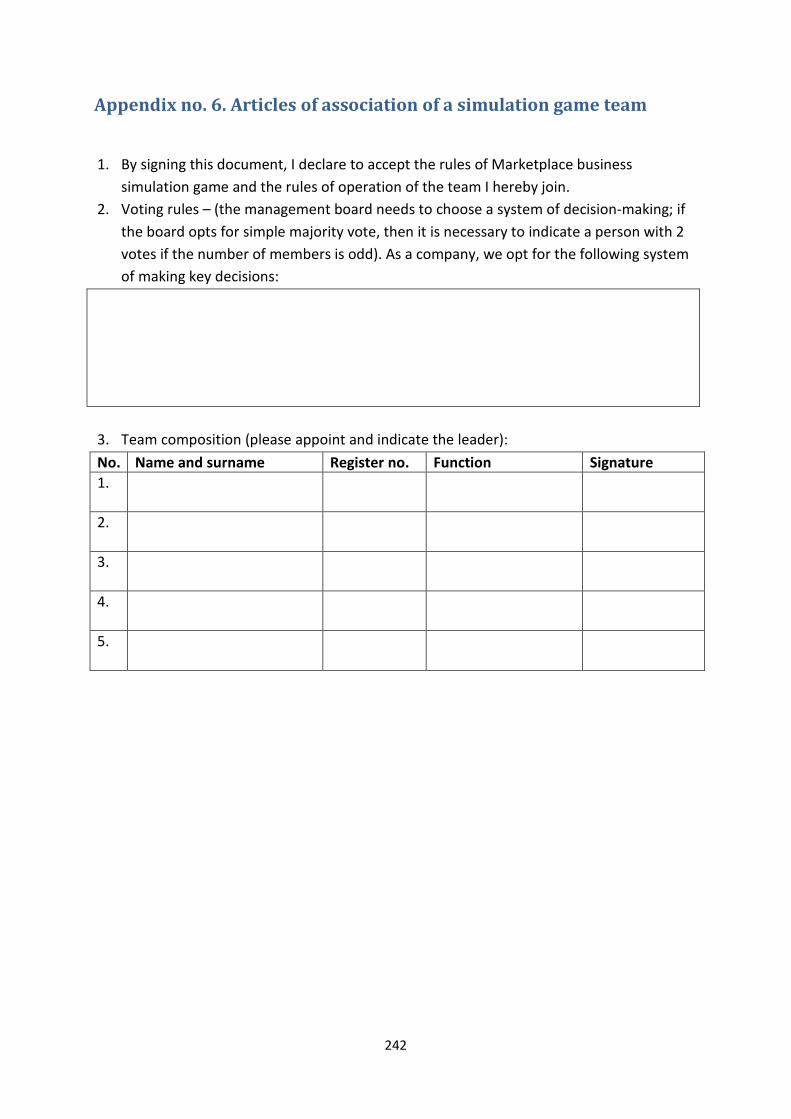
242
Appendix no. 6. Articles of association of a simulation game team
1. By signing this document, I declare to accept the rules of Marketplace business
simulation game and the rules of operation of the team I hereby join.
2. Voting rules – (the management board needs to choose a system of decision-making; if
the board opts for simple majority vote, then it is necessary to indicate a person with 2
votes if the number of members is odd). As a company, we opt for the following system
of making key decisions:
3. Team composition (please appoint and indicate the leader):
No. Name and surname Register no. Function Signature
1.
2.
3.
4.
5.
Related Documents