Shraddha B.Toney et al, International Journal of Computer Science and Mobile Computing, Vol.3 Issue.6, June- 2014, pg. 393-406 © 2014, IJCSMC All Rights Reserved 393 Available Online at www.ijcsmc.com International Journal of Computer Science and Mobile Computing A Monthly Journal of Computer Science and Information Technology ISSN 2320–088X IJCSMC, Vol. 3, Issue. 6, June 2014, pg.393 – 406 RESEARCH ARTICLE Application of Cloud Rank Framework to Achieve the Better Quality of Service (QoS) Ranking Prediction of Web Services Miss. Shraddha B.Toney 1 , Prof. N.D.Kale 2 ¹ME Student, Department of Computer Engineering, TSSM’S, PVPIT, Bavdhan, Pune University, Pune, Maharashtra, India, 411021 ²Assistant Professor, Department of Computer Engineering, TSSM’S, PVPIT, Bavdhan, Pune University, Pune, Maharashtra, India, 411021 1 [email protected]; 2 [email protected] Abstract— In Cloud computing the QoS rankings provides priceless information for making most favourable cloud service selection from a set of functionally comparable service candidates. To obtain QoS values, real- world invocations on the service candidates are usually required. To avoid the time-consuming and pricey real-world service invocation QoS ranking prediction framework is used. This framework requires no supplementary invocations of cloud services when making QoS ranking prediction. Two personalized QoS ranking prediction approaches such as cloud rank 1 ( CR1) and cloud rank 2 ( CR2) are used to envisage the QoS rankings unswervingly. Widespread experiments are conducted employing real-world QoS data, including 1000 distributed users and three real-world web services. The implemented framework uses modernized ranking approach which uses different QoS parameters to predict the ranking more accurately. Normalized Discounted Cumulative Gain (NDCG) has been used to analyze the accuracy of QoS ranking prediction for the implemented framework. Keywords— Cloud, Optimization, Quality of services, Ranking prediction, Similarity measure, Normalized Discounted Cumulative Gain I. INTRODUCTION The cloud is an appearance used to describe a diversity of different types of computing concepts that involve a huge number of computers connected through a real-time communiqué network such as the Internet. Cloud computing is a term without a commonly acknowledged unequivocal scientific or technical explanation. In science, cloud computing is a synonym for disseminated computing over a network and means the ability to run a program on many connected computers at the same time. The phrase is also, more commonly used to refer to network-based services which appear to be provided by real server hardware, which in fact are served up by virtual hardware, simulated by software running on one or more real machines. Such virtual servers do not actually exist and can therefore be encouraged around and scaled up (or down) on the fly without distressing the end user - arguably, rather like a cloud. Cloud Computing is the use of computing resources (hardware and software) that are delivered as a service over a network (typically the Internet).

Welcome message from author
This document is posted to help you gain knowledge. Please leave a comment to let me know what you think about it! Share it to your friends and learn new things together.
Transcript

Shraddha B.Toney et al, International Journal of Computer Science and Mobile Computing, Vol.3 Issue.6, June- 2014, pg. 393-406
© 2014, IJCSMC All Rights Reserved 393
Available Online at www.ijcsmc.com
International Journal of Computer Science and Mobile Computing
A Monthly Journal of Computer Science and Information Technology
ISSN 2320–088X
IJCSMC, Vol. 3, Issue. 6, June 2014, pg.393 – 406
RESEARCH ARTICLE
Application of Cloud Rank Framework to
Achieve the Better Quality of Service (QoS)
Ranking Prediction of Web Services
Miss. Shraddha B.Toney1, Prof. N.D.Kale
2
¹ME Student, Department of Computer Engineering, TSSM’S, PVPIT, Bavdhan, Pune University,
Pune, Maharashtra, India, 411021
²Assistant Professor, Department of Computer Engineering, TSSM’S, PVPIT, Bavdhan,
Pune University, Pune, Maharashtra, India, 411021
Abstract— In Cloud computing the QoS rankings provides priceless information for making most favourable
cloud service selection from a set of functionally comparable service candidates. To obtain QoS values, real-
world invocations on the service candidates are usually required. To avoid the time-consuming and pricey
real-world service invocation QoS ranking prediction framework is used. This framework requires no
supplementary invocations of cloud services when making QoS ranking prediction. Two personalized QoS
ranking prediction approaches such as cloud rank 1 ( CR1) and cloud rank 2 ( CR2) are used to envisage the
QoS rankings unswervingly. Widespread experiments are conducted employing real-world QoS data,
including 1000 distributed users and three real-world web services. The implemented framework uses
modernized ranking approach which uses different QoS parameters to predict the ranking more accurately.
Normalized Discounted Cumulative Gain (NDCG) has been used to analyze the accuracy of QoS ranking
prediction for the implemented framework.
Keywords— Cloud, Optimization, Quality of services, Ranking prediction, Similarity measure, Normalized
Discounted Cumulative Gain
I. INTRODUCTION
The cloud is an appearance used to describe a diversity of different types of computing concepts that involve
a huge number of computers connected through a real-time communiqué network such as the Internet. Cloud
computing is a term without a commonly acknowledged unequivocal scientific or technical explanation. In
science, cloud computing is a synonym for disseminated computing over a network and means the ability to run
a program on many connected computers at the same time. The phrase is also, more commonly used to refer to
network-based services which appear to be provided by real server hardware, which in fact are served up by
virtual hardware, simulated by software running on one or more real machines. Such virtual servers do not
actually exist and can therefore be encouraged around and scaled up (or down) on the fly without distressing the
end user - arguably, rather like a cloud. Cloud Computing is the use of computing resources (hardware and
software) that are delivered as a service over a network (typically the Internet).

Shraddha B.Toney et al, International Journal of Computer Science and Mobile Computing, Vol.3 Issue.6, June- 2014, pg. 393-406
© 2014, IJCSMC All Rights Reserved 394
Alexandru Iosup et.al [1] has analyzed the recital of cloud computing services for scientific computing
workloads. They have quantify the presence in real scientific computing workloads of Many-Task Computing
(MTC) users, who employ slackly coupled applications comprising many errands to achieve their scientific
goals. Then, they have performed an empirical valuation of the performance of four viable cloud computing
services including Amazon EC2, which was currently the largest commercial cloud. Finally, they have
compared through trace-based simulation the performance characteristics and cost models of clouds and other
scientific computing platforms, for general and MTC-based scientific computing workloads. Their results
indicated that the current clouds need an order of magnitude in performance enhancement to be useful to the
scientific community, and show which improvements should be considered first to address this discrepancy
between offer and demand. First they have investigated that the presence of an MTC component in offered
scientific computing workloads, and fond that this presence was noteworthy both in number of jobs and in
resources consumed. Then, they perform an empirical performance evaluation of four public computing clouds,
including Amazon EC2, one of the largest commercial clouds currently in production. Their main finding here
was the compute performance of the tested clouds was low. Last, they compare the performance and cost of
clouds with those of scientific computing alternatives such as grids and parallel production infrastructures. They
found that while current cloud computing services were insufficient for scientific computing at large, they may
still be a good solution for the scientists who need resources instantly and temporarily. Bin Xu et.al [2] has used
the many user-item subgroups each consisting of a subset of items and a group of like-minded users on these
items. It was more natural to make preference predictions for a user via the correlated subgroups than the entire
user-item matrix. In their work to find meaningful subgroups, they invent the Multiclass Co-Clustering (MCoC)
problem and propose an effective solution to it. Then they proposed a unified framework to extend the
traditional CF algorithms by utilizing the subgroups information for improving their top-N recommendation
performance. Their approach can be seen as an extension of traditional clustering CF models. Systematic
experiments on three real world data sets have demonstrated the effectiveness of the proposed approach. Their
experiments were performed on three real data sets: MovieLens-100K4, MovieLens-1M and Lastfm. They run
many state-of-the-art recommendation methods and check whether their top-N recommendation performance is
improved after using their framework. The experimental results showed that using subgroups was a promising
way to further improve the top-N suggestion performance for many popular CF methods. Gediminas
Adomavicius et. al [3] has introduced and explore a number of item ranking techniques that can generate
recommendations that have substantially higher aggregate diversity across all users while maintaining
comparable levels of suggestion accuracy. Comprehensive empirical evaluation consistently showed the
diversity gains of the proposed techniques using several real-world rating datasets and poles apart rating
prediction algorithms. They have conducted experiments on the three datasets including Movie Lens (data file
available at grouplens.org), Netflix (data file available at netflixprize.com), and Yahoo! Movies (individual
ratings collected from movie pages at movies.yahoo.com), using three widely popular advice techniques for
rating prediction, including two heuristic-based (user-based and item-based CF) and one model-based (matrix
factorization CF) techniques. In particular, They have showed that, while ranking recommendations according
to the predicted rating values has provides a good analytical accuracy, they have proposed a number of
recommendation ranking techniques that can provide significant improvements in recommendation miscellany
with only a small amount of accuracy loss. In addition, these ranking techniques offer flexibility to system
designers, since they were parameterize able and can be used in conjunction with different rating prediction
algorithms (i.e., they do not require the designer to use only some specific algorithm). They were also based on
scalable sorting based heuristics and, thus, were extremely efficient. They have provided a comprehensive
empirical evaluation of the proposed techniques and obtain consistent and robust diversity improvements across
multiple real-world datasets and using different rating prediction techniques.
Greg Linden et. al [4] has used the recommendation algorithms to personalize the online store for each
customer. There were three common approaches to solving the recommendation problem: traditional
collaborative filtering, cluster models, and search-based methods. Here, author’s compare these methods with
our algorithm, which they call item-to-item collaborative filtering. Unlike traditional collaborative filtering, their
algorithm’s online computation scales independently of the number of customers and number of items in the
product catalog. Their algorithm produces recommendations in real time, scales to massive data sets, and
generates high quality recommendations. The author’s observed that the recommendation algorithms provide an
effective form of targeted marketing by creating a personalized shopping experience for each customer. For
large retailers like Amazon.com, a good recommendation algorithm was scalable over very large customer bases
and product catalogs, requires only sub second processing time to generate online recommendations, was able to
react immediately to changes in a user’s data, and makes compelling recommendations for all users regardless
of the number of purchases and ratings. Unlike other algorithms, item-to-item collaborative filtering was able to
meet this challenge. John S Breese et. al [5] has described the various algorithm designed for collaborative
filtering, including techniques based on correlation coefficient, vector based similarity calculations and
statistical Bayesian method. They used the two basic classes of evaluation metrics. The first class characterizes
Shraddha B.Toney et al, International Journal of Computer Science and Mobile Computing, Vol.3 Issue.6, June- 2014, pg. 393-406
© 2014, IJCSMC All Rights Reserved 395
the accuracy over set of individual prediction in terms of average absolute deviation and second class estimate
the utility of ranked list of suggested items. This metrics uses an estimate of the probability that user will see a
recommendation in an ordered list. They have presented extensive set of experiments regarding the predictive
performance of statistical algorithms for collaborative filtering. They found that for wide range of conditions,
Bayesian network with decision trees at each node and correlation methods outperform Bayesian clustering and
vector similarity method are good. The preferred method depends on the nature of dataset, nature of the
application and the availability of votes with which to make predictions. They had observed that when there
were a few votes, correlation and Bayesian networks has less advantage over other techniques. Other
consideration has included the size of the database, speed of predictions and learning time. Bayesian networks
were typically having smaller memory requirement and allow for faster predictions than a memory based
techniques such as correlations. Michael Armbrust et. al [6] has provided a simple formulas to quantify the
comparability between of cloud and conventional Computing. It also identify the major technical and non-
technical difficulties such as availability of services, data lock in, data confidentiality and auditability etc. and
opportunity of cloud Computing. They observed that the long dreamed vision of computing as a utility is finally
emerging. The scope of a utility matches the need of businesses providing services directly to users over the
internet, as workloads can grow (and shrink) far faster than 20 years ago. It used to take years to develop a
business to several million customers – now it can happen in months.
II. SYSTEM ARCHITECTURE
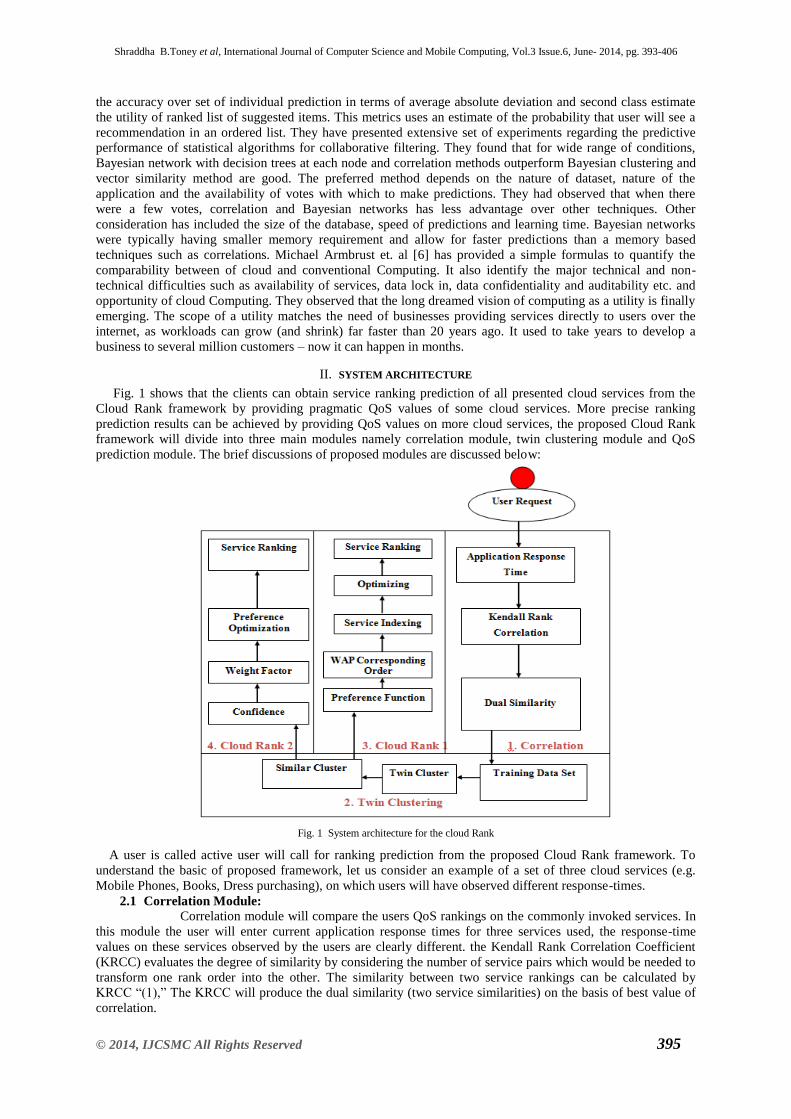
Fig. 1 shows that the clients can obtain service ranking prediction of all presented cloud services from the
Cloud Rank framework by providing pragmatic QoS values of some cloud services. More precise ranking
prediction results can be achieved by providing QoS values on more cloud services, the proposed Cloud Rank
framework will divide into three main modules namely correlation module, twin clustering module and QoS
prediction module. The brief discussions of proposed modules are discussed below:
Fig. 1 System architecture for the cloud Rank
A user is called active user will call for ranking prediction from the proposed Cloud Rank framework. To
understand the basic of proposed framework, let us consider an example of a set of three cloud services (e.g.
Mobile Phones, Books, Dress purchasing), on which users will have observed different response-times.
2.1 Correlation Module: Correlation module will compare the users QoS rankings on the commonly invoked services. In
this module the user will enter current application response times for three services used, the response-time
values on these services observed by the users are clearly different. the Kendall Rank Correlation Coefficient
(KRCC) evaluates the degree of similarity by considering the number of service pairs which would be needed to
transform one rank order into the other. The similarity between two service rankings can be calculated by
KRCC “(1),” The KRCC will produce the dual similarity (two service similarities) on the basis of best value of
correlation.

Shraddha B.Toney et al, International Journal of Computer Science and Mobile Computing, Vol.3 Issue.6, June- 2014, pg. 393-406
© 2014, IJCSMC All Rights Reserved 396
)1(
)))((( 4 -1 B)A, ( Sim
AA
A
II
,,,,I ji,
BIBI
jBiBjAiABI qqqqI (1)
here BIAI is the subset of cloud services commonly invoked by users A and B, q A,i is the QoS value
of service i observed by user u, and I (x) is an indicator function defined by “(2),”.
1 if x < 0 (2)
I ( x) = 0 otherwise
From above discussion, the ranking similarity between two rankings is in the interval of [ -1 , 1 ],
where -1 is obtained when the order of user A is the exact reverse of user B, and 1 is obtained when order of
user A is equal to the order of user B. Since KRCC compares service pairs, the intersection between two users
has to be at least 2
2( BA II
for making similarity computation.
2.2 Twin Clustering:
Twin clustering module will identify the cluster of similar user. In this module, the dual similarity will be
given to the training data set to check the similar users. The cluster of similar user will form on the basis of
similarity value. The users with negative similarity value will be debarred and only the top-K similar users will
be considered for the QoS ranking prediction. A set of similar user S(A) is identified for the active user A by the
following equation 3.
},0),(,/)( ABBASimTBBAS A
(3)
Where TA is a set of the Top-K similar users to the user A and Sim (A,B) > 0 excludes the dissimilar users
with negative similarity values. The value of Sim (A,B) in “(3),” is calculated by “(1),”.
III. QUALITY OF SERVICE (QOS) RANKING PREDICTION
To predict the quality of service (QoS) value, we will recommend two ranking- oriented approaches i)
Cloud Rank 1 ii) Cloud Rank 2.The target of Ranking prediction is to predict QoS values as accurate as possible.
The brief discussion is given below:
3.1 Cloud Rank 1:
Following fig. 2 illustrate functioning of Cloud Rank 1 algorithm.
Algorithm 1: Cloud Rank 1
Input: Set C = { C1, C2, C3}, where C is set of cloud
services
Set S = {S1, S2, S3, ……, Sn}, where S is the set
of similar users
Output: Set R = {R1, R2, R3}, where R is ranking
services set
Step 0: Start
Step 1: Get set C and S.
Step 2: For each user Ui in dataset compare
Step 3: if Ui € S
Step 4: P(x) = ∑ Ui , where P(x) is preference value
Step 5: Decide high order P(x)
Step 6: Tag WAP based on P(x)
Step 7: Getting current service value Sc
Step 8: if Sc < P(x) then
P(x) need to rank

Shraddha B.Toney et al, International Journal of Computer Science and Mobile Computing, Vol.3 Issue.6, June- 2014, pg. 393-406
© 2014, IJCSMC All Rights Reserved 397
Step 9: else
Sc need to rank
Step 10: Index WAP value and rank
Step 11: Stop
Fig. 2. Proposed cloud Rank 1 Algorithm.
Fig. 3. Execution of proposed cloud Rank1algorithm.
Algorithm 1 includes the following steps:
This algorithm uses the preference function to providing ranking
Step 0 : start the algorithm by assigning the two inputs first is the set of cloud services and second is
the set of similar users.
Step1: Takes the set of cloud services and set of similar users to calculate preference function.
Step 2 – 5: Identify for each user in data set we calculate the preferences by comparing if user Ui
belongs to similar user S then we calculate summation of Ui here whatever preference will come that
should be high. Here we will decide high order preference values, i.e. it will decide the top value and
this is we called as preference function P(x). After calculating the preference we will take web service
corresponding order. The preference function will be calculated by using (4).
iUP(x)
(4)
Step 6 : Arrange the web services in corresponding order i.e. indexing the web services and then tag
the each web services based on its preference function. Next step is optimizing preference.
Step 7 : Take the current service value Sc to optimize the preferences
Step 8-9 :Check whether the current service value Sc is less than preference function p(x), then p(x)
will be ranked otherwise Sc will be ranked
Step 10 : Provide index to web services according to values generated.
Step 11 : Stop the algorithm by providing the optimum solution i.e. Ranking of web services.

Shraddha B.Toney et al, International Journal of Computer Science and Mobile Computing, Vol.3 Issue.6, June- 2014, pg. 393-406
© 2014, IJCSMC All Rights Reserved 398
1. Cloud Rank 2:
Following fig.5 illustrate functioning of Cloud Rank 1 algorithm.
Fig. 4. Execution of proposed cloud Rank2 algorithm.
In the CloudRank1 algorithm, differences in preference values are treated equally, which may hurt the QoS
ranking prediction accuracy. By considering the confidence values of different preference values, we propose a
QoS ranking prediction algorithm, named CloudRank2, which uses the following rules to calculate the
confidence values:
If the user has QoS values of these two services i and j. The confidence of the preference value is 1.
When employing similar users for the preference value prediction, the confidence is determined by
similarities of similar users as follows:
ijASB
B BASimW)(
),( j)C(i,
(5)
Where B is a similar user of the current active user A, S (A)ij is a subset of similar users, who obtain QoS values
of both services i and j, and WB is a weighting factor of the similar user v, which can be calculated by
ijASB
BBASim
BASimW
)(
),(
),(
(6)
WB makes sure that a similar user with higher similarity value has greater impact on the confidence
calculation. Equation (5) Guarantees those similar users with higher similarities will generate higher confidence
values.
Algorithm 2: Cloud Rank 2
Input: Set C = { C1, C2, C3}, where C is set of cloud
services
Set S = {S1, S2, S3, ……, Sn}
Output: Set R = {R1, R2, R3}, where R is ranking
services set
Step 0: Start
Step 1: For each user Ui
Step 2: Match Ui with Si and count. where Si is similar
user
Step 3: Calculate highest count i.e. Wc where, Wc is
weight factor
Step 4: Request for Sc, where Sc is current service value
Step 5: if Sc > Wc then
Rank Sc
Step 6: else
Rank Wc
Step 7: Index WAP value and rank
Step 8: Stop
Fig. 5. Proposed cloud Rank2 algorithm.

Shraddha B.Toney et al, International Journal of Computer Science and Mobile Computing, Vol.3 Issue.6, June- 2014, pg. 393-406
© 2014, IJCSMC All Rights Reserved 399
Algorithm 2 includes the following steps:
This algorithm uses the confidence of similar user to providing ranking
Step 0: Start the algorithm by assigning the two inputs first is the set of cloud services and second is
the set of similar users.
Step 1-2 : Match Ui with Si where Si is similar user and then count. Here we will get three count as our
web services is three.
Step 3 : Calculate highest count. This is nothing but the weight factor Wc
Step 4 : Request for current service value Sc
Step 5-6:Calculate if Sc is greater than weight factor Wc then we will rank the current service value Sc
otherwise we will rank Wc
Step 7 :Give the index to web services
Step 8: Stop the algorithm by providing the optimum solution that means Ranking of web services
IV. EXPERIMENTATION
Data Set Description:
To estimate the QoS ranking prediction accuracy, we carry out a large-scale real-world web service
evaluation to collect QoS values on real-world web services. We have collected the response time of the all
three services. Then from the response time we calculate the QoS rank of all the active users. first, In our
experiment, each user invokes each web service for one time. Totally 1000 users are conducted the experiment
on all the three services. The response-time values of each invocation are recorded. Response-time refers to the
time duration between the user sending out a request for booking to a service and receiving a conformation. The
QoS values of the three web services observed by the 1000 service users can be presented as a 1000 X 3 user-
item matrix, where each entry in the matrix is the QoS value(e.g., response-time) of a web service observed by a
user. In the experiments, the QoS values of response-time are employed to rank the services independently.
Table 1 shows descriptions of the obtained real-world web service QoS values. As shown in Table 1, the
minimum and maximum values of response time for the bus booking service are 0.115s seconds and 1.799s
seconds, for train booking are 0.222s and 1.854 s and for the flight services are 0.219s and 1.541s. The mean
and standard deviation of all the 1000 response-time values in the user-item matrix are as shown in the table ,
indicating that the response-time values of different web services observed by different users exhibit a great
variation.
TABLE I WEB SERVICES QOS DATA SET DESCRIPTION
S.N Statistics Values
1 Number of Service Users 1000
2 Minimum response time for Bus service 0.115s
3 Maximum response time for the Bus service 1.799s
4 Mean response time for the Bus service 0.8133s
5 Standard deviation of response time for the Bus Service 0.292335s
6 Minimum response time for Train service 0.222s
7 Maximum response time for the Train service 1.854s
8 Mean response time for the Train service 1.02698s
9 Standard deviation of response time for the Train Service 0.306526s
10 Minimum response time for Flight service 0.219s
11 Maximum response time for the Flight service 1.541s
12 Mean response time for the Flight service 0.87195s
13 Standard deviation of response time for the Flight Service 0.724971s
Shraddha B.Toney et al, International Journal of Computer Science and Mobile Computing, Vol.3 Issue.6, June- 2014, pg. 393-406
© 2014, IJCSMC All Rights Reserved 400
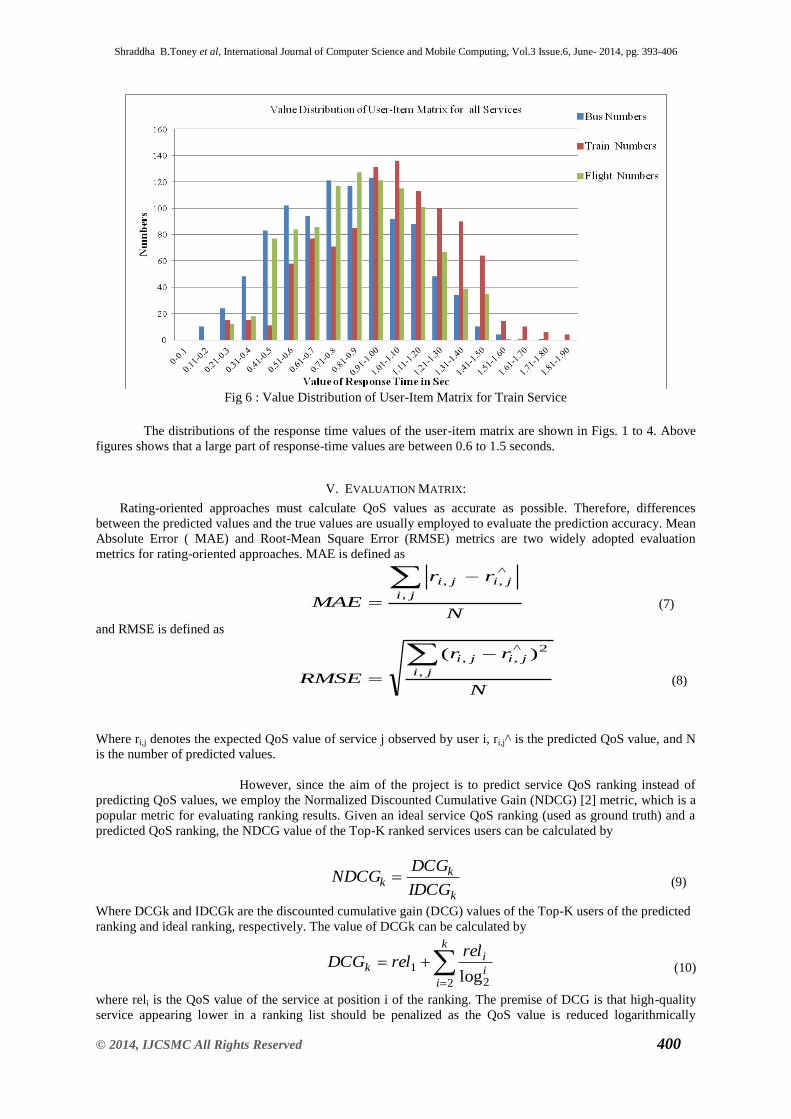
Fig 6 : Value Distribution of User-Item Matrix for Train Service
The distributions of the response time values of the user-item matrix are shown in Figs. 1 to 4. Above
figures shows that a large part of response-time values are between 0.6 to 1.5 seconds.
V. EVALUATION MATRIX:
Rating-oriented approaches must calculate QoS values as accurate as possible. Therefore, differences
between the predicted values and the true values are usually employed to evaluate the prediction accuracy. Mean
Absolute Error ( MAE) and Root-Mean Square Error (RMSE) metrics are two widely adopted evaluation
metrics for rating-oriented approaches. MAE is defined as
N
rr
MAEji
jiji
,
^,,
(7)
and RMSE is defined as
N
rr
RMSEji
jiji
,
2^,, )(
(8)
Where ri,j denotes the expected QoS value of service j observed by user i, ri,j^ is the predicted QoS value, and N
is the number of predicted values.
However, since the aim of the project is to predict service QoS ranking instead of
predicting QoS values, we employ the Normalized Discounted Cumulative Gain (NDCG) [2] metric, which is a
popular metric for evaluating ranking results. Given an ideal service QoS ranking (used as ground truth) and a
predicted QoS ranking, the NDCG value of the Top-K ranked services users can be calculated by
k
kk
IDCG
DCGNDCG (9)
Where DCGk and IDCGk are the discounted cumulative gain (DCG) values of the Top-K users of the predicted
ranking and ideal ranking, respectively. The value of DCGk can be calculated by
k
ii
ik
relrelDCG
2 2
1log
(10)
where reli is the QoS value of the service at position i of the ranking. The premise of DCG is that high-quality
service appearing lower in a ranking list should be penalized as the QoS value is reduced logarithmically

Shraddha B.Toney et al, International Journal of Computer Science and Mobile Computing, Vol.3 Issue.6, June- 2014, pg. 393-406
© 2014, IJCSMC All Rights Reserved 401
proportional to the position of the result via dividing by log2i. The DCG value is accumulated from the top of
the ranking to the bottom with the gain of each result discounted at lower ranks. The ideal rank achieves the
highest gain among different rankings. The NDCGk value is on the interval of 0 to 1, where larger value stands
for better ranking accuracy, indicating that the predicted ranking is closer to the ideal ranking. The value of k is
in the interval of 1 to n, where n is the total number of cloud services
Performance Comparison :
To study the personalized QoS ranking prediction performance, Different methods are used to predict the rank
of the service. Out of which some methods are rating-oriented methods, which rank the cloud services based on
the predicted QoS values, while the implemented two
methods are ranking-oriented approaches, which predict the QoS rankings directly. These are
CloudRank1. This method calculates reference values between items and employs these values for
making QoS ranking prediction.
CloudRank2. This method considers confidence levels of different preference values which help
achieve better ranking accuracy. Both CloudRank1 and CloudRank2 employ KRCC for the user
similarity computation.
Tables 2 show the NDCG performance of response-time when employing 10, 20,30,40 and 50
percent density user-item matrices. In the second row of the table, NDCG indicates that the ranking
accuracy of the top k items is investigated. The value of NDCG can be calculated by (3). For each
column in the Tables, we highlight the best performer among the ranking-oriented methods.
TABLE III : NDCG PERFORMANCE COMPARISON OF RESPONSE TIME ( LARGER VALUE INDICATES BETTER RANKING ACCURACY)
Methods
Matrix Density 10 %
NDCG1 NDCG5 NDCG10 NDCG20 NDCG30 NDCG40 NDCG50 NDCG60 NDCG70 NDCG80 NDCG90 NDCG100
Cloud
Rank 1 0.66667 0.68835 0.70294 0.73483 0.70667 0.72013 0.70612 0.72652 0.72684 0.73454 0.75610 0.75626
Cloud
Rank 2 0.66667 0.78744 0.88064 0.81408 0.81432 0.85103 0.83890 0.84347 0.81911 0.80960 0.80230 0.86047
Methods
Matrix Density 20 %
NDCG1 NDCG5 NDCG10 NDCG20 NDCG30 NDCG40 NDCG50 NDCG60 NDCG70 NDCG80 NDCG90 NDCG100
Cloud
Rank 1 0.66667 0.72262 0.78901 0.78894 0.83946 0.85753 0.85904 0.86008 0.87310 0.88212 0.89472 0.90027
Cloud
Rank 2 0.66667 0.76324 0.83576 0.84845 0.85512 0.86069 0.87883 0.88603 0.89399 0.91149 0.92845 0.93317
Methods
Matrix Density 30 %
NDCG1 NDCG5 NDCG10 NDCG20 NDCG30 NDCG40 NDCG50 NDCG60 NDCG70 NDCG80 NDCG90 NDCG100
Cloud
Rank 1 0.66667 0.82001 0.83609 0.84871 0.86673 0.87887 0.88549 0.88912 0.89043 0.90789 0.91416 0.92252
Cloud
Rank 2 0.66667 0.84838 0.85439 0.87966 0.88947 0.89709 0.89748 0.90403 0.91062 0.92107 0.93147 0.93364
Methods
Matrix Density 40 %
NDCG1 NDCG5 NDCG10 NDCG20 NDCG30 NDCG40 NDCG50 NDCG60 NDCG70 NDCG80 NDCG90 NDCG100
Cloud
Rank 1 0.66667 0.82001 0.84609 0.88871 0.89673 0.89887 0.90549 0.91912 0.92043 0.93789 0.94160 0.95520

Shraddha B.Toney et al, International Journal of Computer Science and Mobile Computing, Vol.3 Issue.6, June- 2014, pg. 393-406
© 2014, IJCSMC All Rights Reserved 402
Cloud
Rank 2 0.66667 0.84838 0.86439 0.91966 0.89947 0.90709 0.91748 0.92403 0.93062 0.94107 0.95147 0.96640
Methods
Matrix Density 50 %
NDCG1 NDCG5 NDCG10 NDCG20 NDCG30 NDCG40 NDCG50 NDCG60 NDCG70 NDCG80 NDCG90 NDCG100
Cloud
Rank 1 0.6667 0.86224 0.88576 0.89123 0.89586 0.90384 0.91152 0.92252 0.93413 0.93696 0.94749 0.96843
Cloud
Rank 2 0.6667 0.87024 0.90868 0.90986 0.91652 0.92427 0.92878 0.93984 0.84541 0.94843 0.95854 0.97911
Above table shows that
Among all QoS ranking prediction methods, the CloudRank2 approach obtains the best prediction
accuracy (largest NDCG values) for response time under all the experimental settings consistently,
since CloudRank2 predicts the ranking directly and considers confidence levels of different preference
values.
Compared with the other CloudRank1, CloudRank2 methods consistently achieve better ranking
accuracy. We note that our CloudRank1 and CloudRank2 algorithms ensure that the employed services
are correctly ranked.
When the density of the user-item matrix is increased from 10 to 50 percent, the ranking accuracy (in
terms of NDCG values) is also enhanced, since denser user item matrix provides more information for
the ranking prediction
This observation indicates that by systematically fusing the information from similar users and similar
items (cloud services), better QoS ranking prediction accuracy can be achieved.
VI. RESULTS AND DISCUSSIONS
Impact of Top-K
Fig 7a: Impact of Top- K for 10% Matrix Density

Shraddha B.Toney et al, International Journal of Computer Science and Mobile Computing, Vol.3 Issue.6, June- 2014, pg. 393-406
© 2014, IJCSMC All Rights Reserved 403
Fig 7b: Impact of Top- K for 30% Matrix Density
Fig 7c: Impact of Top- K for 50% Matrix Density
The Top-K value determines the number of analogous users employed in the ranking prediction
methods. To study the impact of Top-K on the ranking results, we vary the values of Top-K from 1 to 100 with
a step value of 10. We set matrix density to 10% to 20% in this experiment. We compare two ranking prediction
methods, i.e., CloudRank1, and CloudRank2 Figure 7(a) to Figure 7(c) shows the NDCG1 and NDCG100
results of response-time. From above figures it is observed that
: • NDCG values of all the two ranking methods increase with the increase of Top-K value, indicating
that a Larger number of similar users can provide good prediction accuracy for the current active user. Small
Top-K value will include dissimilar users, which will damage the ranking prediction accuracy.
• In all the Five figures from Figure 1(a) to Figure 1(e), it is observed that the CloudRank2 algorithm
obtains the best prediction accuracy consistently under different Top-K value settings.
Shraddha B.Toney et al, International Journal of Computer Science and Mobile Computing, Vol.3 Issue.6, June- 2014, pg. 393-406
© 2014, IJCSMC All Rights Reserved 404
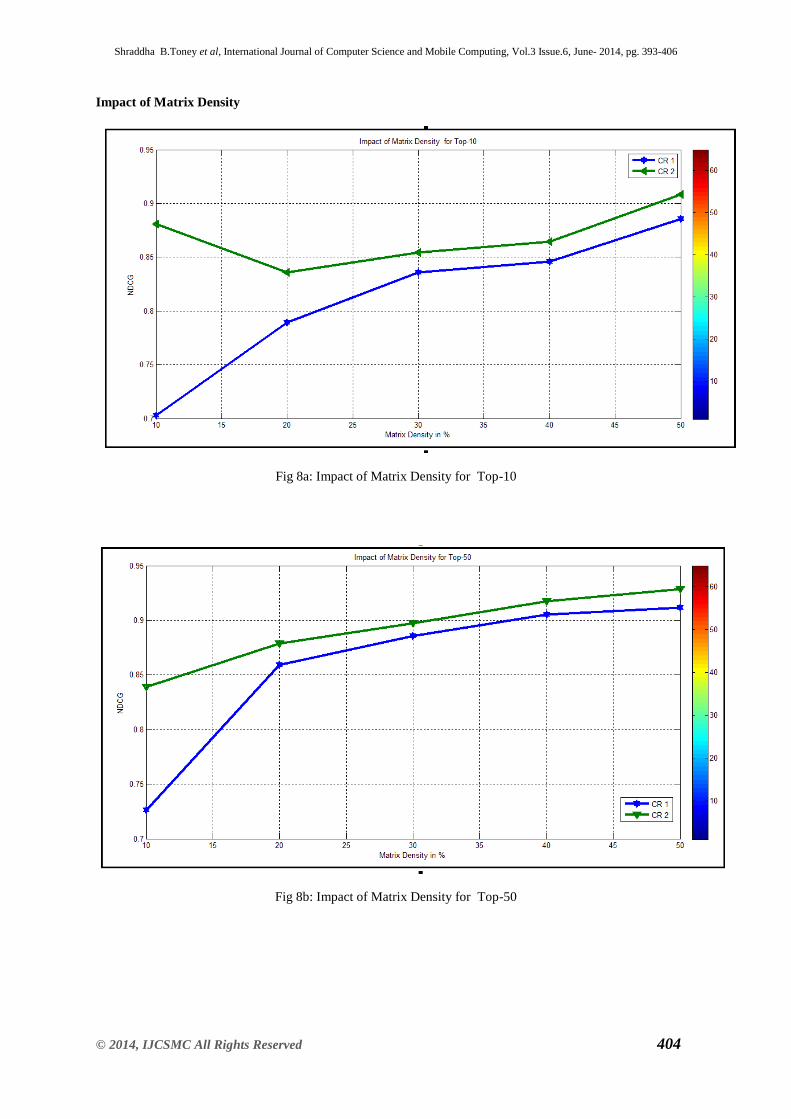
Impact of Matrix Density
Fig 8a: Impact of Matrix Density for Top-10
Fig 8b: Impact of Matrix Density for Top-50
Shraddha B.Toney et al, International Journal of Computer Science and Mobile Computing, Vol.3 Issue.6, June- 2014, pg. 393-406
© 2014, IJCSMC All Rights Reserved 405
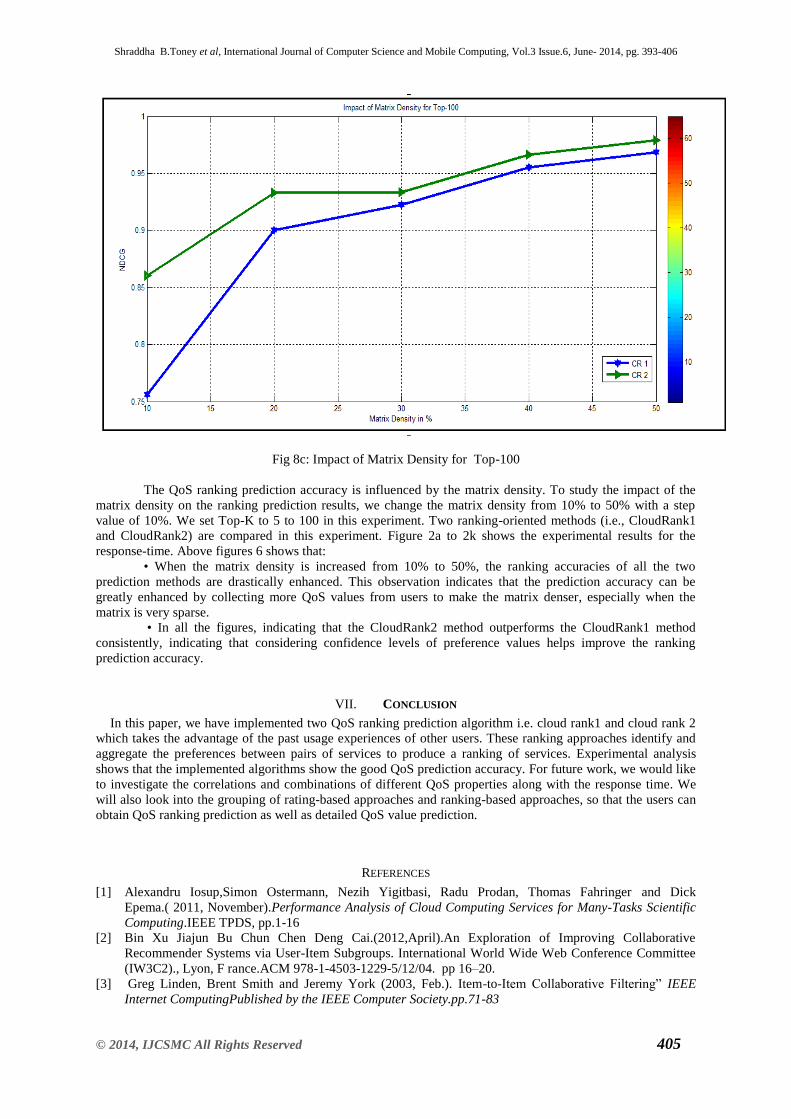
Fig 8c: Impact of Matrix Density for Top-100
The QoS ranking prediction accuracy is influenced by the matrix density. To study the impact of the
matrix density on the ranking prediction results, we change the matrix density from 10% to 50% with a step
value of 10%. We set Top-K to 5 to 100 in this experiment. Two ranking-oriented methods (i.e., CloudRank1
and CloudRank2) are compared in this experiment. Figure 2a to 2k shows the experimental results for the
response-time. Above figures 6 shows that:
• When the matrix density is increased from 10% to 50%, the ranking accuracies of all the two
prediction methods are drastically enhanced. This observation indicates that the prediction accuracy can be
greatly enhanced by collecting more QoS values from users to make the matrix denser, especially when the
matrix is very sparse.
• In all the figures, indicating that the CloudRank2 method outperforms the CloudRank1 method
consistently, indicating that considering confidence levels of preference values helps improve the ranking
prediction accuracy.
VII. CONCLUSION
In this paper, we have implemented two QoS ranking prediction algorithm i.e. cloud rank1 and cloud rank 2
which takes the advantage of the past usage experiences of other users. These ranking approaches identify and
aggregate the preferences between pairs of services to produce a ranking of services. Experimental analysis
shows that the implemented algorithms show the good QoS prediction accuracy. For future work, we would like
to investigate the correlations and combinations of different QoS properties along with the response time. We
will also look into the grouping of rating-based approaches and ranking-based approaches, so that the users can
obtain QoS ranking prediction as well as detailed QoS value prediction.
REFERENCES
[1] Alexandru Iosup,Simon Ostermann, Nezih Yigitbasi, Radu Prodan, Thomas Fahringer and Dick
Epema.( 2011, November).Performance Analysis of Cloud Computing Services for Many-Tasks Scientific
Computing.IEEE TPDS, pp.1-16
[2] Bin Xu Jiajun Bu Chun Chen Deng Cai.(2012,April).An Exploration of Improving Collaborative
Recommender Systems via User-Item Subgroups. International World Wide Web Conference Committee
(IW3C2)., Lyon, F rance.ACM 978-1-4503-1229-5/12/04. pp 16–20.
[3] Greg Linden, Brent Smith and Jeremy York (2003, Feb.). Item-to-Item Collaborative Filtering” IEEE
Internet ComputingPublished by the IEEE Computer Society.pp.71-83

Shraddha B.Toney et al, International Journal of Computer Science and Mobile Computing, Vol.3 Issue.6, June- 2014, pg. 393-406
© 2014, IJCSMC All Rights Reserved 406
[4] John S. Breese, David Heckerman, Carl Kadie.(1998 July).Empirical Analysis of Predictive Algorithm for
Collaborative Filtering. Conference on uncertainty in Artificial Intelligence, July 1998.pp.101-112
[5] Hyukho Kim, Hana Lee, Woongsup Kim, Yangwoo Kim,”A Trust Evaluation Model for QoS Guarantee in
Cloud Systems” nternational Journal of Grid and Distributed Computing Vol.3,No.1, March, 2010.pp:67-
81
[6] Shou-xin wang, li zhang , shuaiwang and xiang qiu,” a cloud-based trust model for evaluating quality of
web services”, Journal of Computer science and technology 25(6): 1130–1142 Nov. 2010. pp:37-48
[7] Django Armstrong, Karim Djemame,” Towards Quality of Service in the Cloud”, School of Computing,
University of Leeds, United Kingdom,vol2, pp:77-89
[8] QingtaoWu, Mingchuan Zhang, Ruijuan Zheng, Ying Lou, and Wangyang Wei,”A QoS-Satisfied
Prediction Model for Cloud-Service Composition Based on a Hidden Markov Model”, Hindawi Publishing
Corporation Mathematical Problems in Engineering Volume 2013, Article ID 387083. pp:27-29
[9] Paulrani.A, M.Gomathy Nayagam,” Multiobjective Qos optimazation Based on multiple workflow
Scheduling in cloud environment”, International Journal of Innovative Research in Computer and
Communication Engineering Vol. 1, issue 2, april 2013. pp:17-31
[10] Gediminas Adomavicius and YoungOk Kwon “Improving Aggregate Recommendation Diversity Using
Ranking-Based Techniques”, Page No 1-15, 2012. pp:12-21
[11] Debajyoti Mukhopadhyay, Falguni J. Chathly, Nagesh N. Jadhav “QoS Based Framework for Effective
Web Services in Cloud Computing”, Page No 1-9, 2012. pp:23-32.
[12] Armbrust, Armando Fox, Rean Griffith, Anthony D. Joseph, Randy Katz,Andy Konwinski, Gunho Lee,
David Patterson, Ariel Rabkin, Ion Stoica, and Matei Zaharia. (2009,Feb) . Above the Clouds: A Berkeley
View of Cloud Computing, Electrical Engineering and Computer Sciences University of California at
Berkeley Technical Report No. UCB/EECS-2009-28 February 10, 2009.
[13] Mukand Deshpande & Geoge Karypis.( 2004 January) .Item-Based Top-N Recommendation
Algorithms.ACM Transactions on Information Systems, Vol. 22(No. 1).
[14] Saurabh Kumar Garg, Steve Versteeg and Rajkumar Buyya,(2011).SMICloud: A Framework for
Comparing and Ranking Cloud Services. Fourth IEEE International Conference on Utility and Cloud
Computing
[15] Kalervo Ja Rvelin and Jannakeke la Inen. (2002. October.),Cumulated Gain-Based Evaluation of IR
Techniques”,ACM Transactions on Information Systems,Vol. 20( No. 4),Pages 422–446.
[16] Rong Jin, Joyce Y, Chai, Luo Si.(2004. July).An Automatic Weighting Scheme for Collaborative
Filtering.SIGIR’04.Sheffield, South Yorkshire, UK. Copyright 2004 ACM 1-58113-881-4/04/0007
[17] Nathan N. Liu, Qiang Yang.(2008, July)EigenRank: A Ranking-Oriented Approach to Collaborative
Filtering”, SIGIR’08, July 20–24, 2008, Singapore. Copyright 2008 ACM 978-1-60558-164-4/08/07.
Related Documents


