APPLICATION OF C 3 F 7 CN/CO 2 GAS MIXTURES FOR RETRO- FILLING SF 6 - DESIGNED GAS I NSULATED EQUIPMENT RATED AT TRANSMISSION VOLTAGES A thesis submitted to the University of Manchester for the degree of Doctor of Philosophy in the Faculty of Science and Engineering 2020 LOIZOS LOIZOU Department of Electrical and Electronic Engineering

Welcome message from author
This document is posted to help you gain knowledge. Please leave a comment to let me know what you think about it! Share it to your friends and learn new things together.
Transcript
APPLICATION OF C3F7CN/CO2 GAS MIXTURES FOR RETRO-
FILLING SF6-DESIGNED GAS INSULATED EQUIPMENT RATED
AT TRANSMISSION VOLTAGES
A thesis submitted to the University of Manchester for the degree of
Doctor of Philosophy
in the Faculty of Science and Engineering
2020
LOIZOS LOIZOU
Department of Electrical and Electronic Engineering

Blank Page
Contents
1
Contents
Contents ................................................................................................................................ 1
List of Figures ....................................................................................................................... 7
List of Tables ...................................................................................................................... 19
List of Abbreviations ......................................................................................................... 21
Abstract ............................................................................................................................... 23
Declaration .......................................................................................................................... 25
Copyright Statement .......................................................................................................... 27
Acknowledgment ................................................................................................................ 29
Chapter 1 Introduction .............................................................................................. 31
1.1 Background ........................................................................................................ 31
1.2 Research Objectives ........................................................................................... 33
1.3 Major Contributions ........................................................................................... 34
1.4 Thesis Outline .................................................................................................... 35
Chapter 2 Literature Review ..................................................................................... 39
2.1 Introduction ........................................................................................................ 39
2.2 Main Features and Benefits of Gas Insulated Substations ................................. 40
2.2.1 Gas Insulated Substations Technology ....................................................... 40
2.2.2 Advantages over AIS .................................................................................. 42
2.3 Main Features and Benefits of GIL ................................................................... 42
2.3.1 GIL Technology ......................................................................................... 42
2.3.2 Advantages of GIL ..................................................................................... 44
2.4 Insulation Gases for High Voltage Equipment .................................................. 46
2.4.1 Electrical Breakdown in Gases ................................................................... 46
2.4.2 SF6 Insulation ............................................................................................. 52
Contents
2
2.4.3 Environmental Concerns of SF6 ................................................................. 53
2.4.4 SF6 Alternatives for Insulation Applications ............................................. 55
2.4.5 C3F7CN as a Potential SF6-Alternative ...................................................... 59
2.4.6 Selection of a Technically Viable Gas Candidate for High Voltage
Insulation Applications ............................................................................................ 61
2.5 C3F7CN/CO2 as a Gas Mixture .......................................................................... 63
2.5.1 Environmental Impact and Toxicity .......................................................... 63
2.5.2 Dielectric Strength ..................................................................................... 65
2.5.3 Boiling Point .............................................................................................. 66
2.6 Experimental Investigations on C3F7CN Gas and its Mixtures ......................... 67
2.6.1 Effect of Buffer Gas, Mixing Ratio and Pressure on Breakdown Voltage 68
2.6.2 Effect of Field Uniformity and Gap Distance on Breakdown Voltage ...... 71
2.6.3 Influence of Polarity on LI and DC Breakdown Voltage .......................... 74
2.6.4 Effect of Surface Roughness on Breakdown Voltage ................................ 78
2.6.5 Effect of Epoxy Insulator on Breakdown Voltage ..................................... 79
2.6.6 Partial Discharge Characteristics ............................................................... 81
2.7 By-products Analysis of C3F7CN/CO2 Gas Mixtures ....................................... 84
2.8 Summary ........................................................................................................... 88
Chapter 3 Development of Experimental Setup and Gas Handling Procedures . 91
3.1 Introduction ....................................................................................................... 91
3.2 Pressure Vessel .................................................................................................. 91
3.2.1 Design Development .................................................................................. 91
3.2.2 Fabrication and Assembly of Pressure Vessel ........................................... 93
3.3 Electrode Development ..................................................................................... 95
3.3.1 Reduced-scale Coaxial Prototype – Quasi Uniform Fields ....................... 95
3.3.2 Hemispherical Rod-plane and Coaxial Configurations – Weakly-Quasi
Uniform Fields ....................................................................................................... 109
3.3.3 Needle Configurations – Divergent and Highly Divergent Fields ........... 113
Contents
3
3.3.4 Summary of Electrode Configurations Developed................................... 117
3.4 Gas Handling Setup and Procedures ................................................................ 119
3.4.1 SF6 and C3F7CN Gas Handling Setup ...................................................... 119
3.4.2 SF6 and C3F7CN/CO2 Mixtures Gas Handling Procedures ...................... 123
3.5 Summary .......................................................................................................... 127
Chapter 4 Breakdown Characteristics of SF6 Gas and C3F7CN/CO2 Gas Mixtures
.................................................................................................................. 129
4.1 Introduction ...................................................................................................... 129
4.2 Generation and Measurement of Lightning Impulses and AC Voltage
Waveforms ................................................................................................................. 129
4.2.1 Test Setup for Lightning Impulse Breakdown Experiments .................... 129
4.2.2 Standard Lightning Impulse Waveform ................................................... 131
4.2.3 Test Setup for AC Voltage Breakdown Experiments .............................. 131
4.3 Experimental Techniques and Statistical Analysis .......................................... 133
4.3.1 Up-and-down Procedure for Lightning Impulse Breakdown Tests ......... 133
4.3.2 Progressive Stress Procedure for AC Voltage Breakdown Tests ............. 135
4.3.3 Voltage-time Characteristics Analysis ..................................................... 136
4.4 Breakdown Characteristics of the 10/30 mm Coaxial Configuration .............. 138
4.4.1 Effect of C3F7CN Content and Pressure ................................................... 139
4.4.2 Effect of Voltage Waveform .................................................................... 141
4.4.3 V-t Characteristics .................................................................................... 143
4.4.4 Pressure-reduced Breakdown Field Strength ........................................... 149
4.5 Breakdown Characteristics of Weakly Quasi-uniform Field Configurations .. 150
4.5.1 8/60 mm Coaxial Configuration – Effect of Gas Pressure and Impulse
Polarity .................................................................................................................. 151
4.5.2 Hemispherical Rod-plane Configuration – Effect of Gas Pressure, Gap
Distance and Impulse Polarity ............................................................................... 153
Contents
4
4.5.3 Polarity Effect for 8/60 mm Coaxial and Hemispherical Rod-plane Electrode
Configurations ....................................................................................................... 156
4.5.4 Pressure-reduced Breakdown Field Strength ........................................... 158
4.6 Summary ......................................................................................................... 160
Chapter 5 Partial Discharge Characteristics of SF6 Gas and 20% C3F7CN / 80%
CO2 Gas Mixture ............................................................................................................. 163
5.1 Introduction ..................................................................................................... 163
5.2 Test Circuit and Test Procedure ...................................................................... 164
5.2.1 Ultra-High Frequency (UHF) Method ..................................................... 164
5.2.2 Test Circuit Diagram ................................................................................ 164
5.2.3 Position Orientation and Sensitivity Check of UHF Sensors .................. 165
5.2.4 PD Measuring Equipment and UHF Test Procedures ............................. 169
5.2.5 Full Bandwidth Scan of PD Activities ..................................................... 170
5.3 Results of Hemispherical Rod-plane Electrode Configuration ....................... 171
5.3.1 Effect of Pressure, Gas Type and Field Uniformity on the PDIV and PDEV
Characteristics ........................................................................................................ 171
5.3.2 PRPD Pattern Analysis ............................................................................ 175
5.4 Results of Plane-plane Electrode Configuration ............................................. 183
5.4.1 Effect of Pressure, Gas Type, Defect Location and Field Uniformity on the
PDIV and PDEV Characteristics ........................................................................... 183
5.4.2 PRPD Pattern Analysis ............................................................................ 187
5.5 Discussion ....................................................................................................... 193
5.6 Summary ......................................................................................................... 195
Chapter 6 Retro-fill Investigation of a GIB Demonstrator Rated for Transmission
Voltages .................................................................................................................. 197
6.1 Introduction ..................................................................................................... 197
6.2 Experimental Setup and Test Techniques ....................................................... 198
6.2.1 AC and Impulse Generators Test Setup ................................................... 198
Contents
5
6.2.2 Full-scale Demonstrator for Withstand Type Tests.................................. 199
6.2.3 BS EN/IEC Standards Type Tests Procedures ......................................... 202
6.3 420/550 kV Gas Insulated Busbar Demonstrator ............................................ 203
6.3.1 Type Test Results ..................................................................................... 204
6.3.2 Material Compatibility of Gaskets ........................................................... 207
6.4 Impact of Retro-fill Solution for UK Transmission Network.......................... 208
6.4.1 SF6 National Grid Inventory and Leakage Rates ..................................... 208
6.4.2 GWP Calculation and CO2 Equivalent Emissions ................................... 210
6.4.3 Potential Retro-fill Locations in the UK and Temperature Profiles ......... 212
6.5 Summary .......................................................................................................... 217
Chapter 7 Conclusions and Future Work .............................................................. 219
7.1 Research Aim and Objectives .......................................................................... 219
7.2 Summary of Results and Research Findings ................................................... 220
7.2.1 Breakdown Characteristics ....................................................................... 220
7.2.2 Partial Discharge Characteristics .............................................................. 221
7.2.3 Type Tests and Material Compatibility Analyses .................................... 222
7.2.4 Environmental Assessment ...................................................................... 222
7.3 Future Work ..................................................................................................... 223
References ......................................................................................................................... 227
List of Publications ........................................................................................................... 237
Word Count: 47,667

Contents
6
Blank Page
List of Figures
7
List of Figures
Figure 2-1. Structure of a substation mainly consisting of transformers, switchgear and
arresters [19]......................................................................................................................... 40
Figure 2-2. GIL internal structure [23]. ............................................................................... 44
Figure 2-3. Main processes that result to charged particles in a gas discharge development
[21]. ...................................................................................................................................... 47
Figure 2-4. Possible discharge processes in gaseous insulation [21]. .................................. 50
Figure 2-5. Breakdown strength of SF6, air and transformer oil as a function of pressure
using a sphere-plane electrode configuration with a gap distance of 12.5 mm [29]. ........... 53
Figure 2-6. Radiative forcing as a function of years after emission and the integrated curves
for CO2 (blue) and example gases with 1.5 (green) and 13 years (red) lifetimes [3]. ......... 54
Figure 2-7. Global mean SF6 concentration increase in the atmosphere from 2010 to 2015
[4]. ........................................................................................................................................ 55
Figure 2-8. AC breakdown voltage comparison between C3F7CN and SF6 for parallel disk
electrodes (relatively uniform field) with a gap distance of 2.5 mm [7], [9]. ...................... 60
Figure 2-9. Vapour pressure curve as a function of temperature comparing C3F7CN and SF6
[7], [9]. ................................................................................................................................. 61
Figure 2-10. Important SF6-replacement criteria for high voltage insulation applications. . 61
Figure 2-11. Elimination of SF6 alternatives for high voltage insulation applications based
on data from [16]–[18], [32], [41]. ....................................................................................... 62
Figure 2-12. Toxicity subdivisions of gas mixtures from non-toxic (subdivision 1) to very
toxic (subdivision 3) for 1-hour exposure LC50 values [44] . .............................................. 64
Figure 2-13. Toxicity inhalation categories from fatal (category 1) to harmful (category 4)
for 4-hour exposure LC50 values[44].................................................................................... 64
Figure 2-14. AC breakdown voltage comparison between 20% C3F7CN gas mixtures and
SF6 for parallel disk electrodes (relatively uniform field) with a gap distance of 2.5 mm [7],
[9]. ........................................................................................................................................ 66
Figure 2-15. Boiling point as a function of C3F7CN concentration for a C3F7CN/CO2 gas
mixture calculated using the Peng-Robinson Equation of State method. ............................ 67
List of Figures
8
Figure 2-16. AC breakdown field strength as a function of C3F7CN mixing ratio with CO2
as a buffer gas using a plane-plane electrode configuration with a gap distance of 2.5 mm
[49]. ...................................................................................................................................... 68
Figure 2-17. AC breakdown field strength as a function of C3F7CN mixing ratio with N2 as
a buffer gas using a plane-plane electrode configuration with a gap distance of 2.5 mm [49].
............................................................................................................................................. 69
Figure 2-18. AC breakdown voltage as a function of absolute pressure (bar) for C3F7CN/CO2
gas mixtures and SF6 using a sphere-sphere electrode configuration and a gap distance of 2
mm [50]. .............................................................................................................................. 70
Figure 2-19. (a) Plane-plane and (b) point-plane electrode configurations [54]. ................ 71
Figure 2-20. AC breakdown voltage comparison between SF6 and C3F7CN/CO2 mixtures as
a function of pressure for a plane-plane electrode configuration with a gap distance of 10
mm [54]. .............................................................................................................................. 72
Figure 2-21. AC breakdown voltage comparison between SF6 and C3F7CN/CO2 mixtures as
a function of pressure for a point-plane electrode configuration with a gap distance of 20 mm
[54]. ...................................................................................................................................... 73
Figure 2-22. AC breakdown voltage comparison between SF6 and C3F7CN/CO2 mixtures as
a function of gap distance for a sphere-sphere electrode configuration at atmospheric
pressure (1 bar absolute) [55]. ............................................................................................. 74
Figure 2-23. DC breakdown strength of C3F7CN/CO2 mixtures as a function of absolute
pressure for a plane-plane electrode configuration and a gap distance of 3 mm [56]. ........ 75
Figure 2-24. 50% LI breakdown voltage of C3F7CN/CO2 mixtures and SF6 as a function of
gap distance for a rod-plane electrode configuration [55]. .................................................. 76
Figure 2-25. (a) Space charge build-up in positive point-plane gap (b) field distortion by
space charge [27]. ................................................................................................................ 77
Figure 2-26. (a) Space charge build-up in negative point-plane gap (b) field distortion by
space charge [27]. ................................................................................................................ 77
Figure 2-27. Surface flashover voltage and gap breakdown voltage as a function of pressure
for 9% C3F7CN / 91% CO2 gas mixture and SF6 [66]. ........................................................ 80
Figure 2-28. Surface flashover voltage as a function of pressure for C3F7CN/CO2 gas
mixtures and SF6 [66]. ......................................................................................................... 80
Figure 2-29. PDIV as a function of pressure for C3F7CN/CO2 gas mixtures and SF6 for a
plane-plane electrode configuration with a needle protrusion on the ground plane with a
height of 2 mm and a tip radius of 20 μm [54], [68]. .......................................................... 83
List of Figures
9
Figure 2-30. PDIV as a function of pressure for g3 and SF6 for POC and POE electrode
configurations with a needle of a tip radius of 10 μm [70]. ................................................. 84
Figure 2-31. GC-MS analysis of C3F7CN/CO2 gas mixture before experiments [72]. ........ 85
Figure 2-32. GC-MS analysis of C3F7CN/CO2 gas mixture and its decomposition by-
products after 200 breakdowns [72]. .................................................................................... 86
Figure 2-33. GC-MS analysis of C3F7CN/CO2 gas mixture and its decomposition by-
products after a 72-hour partial discharge experiment [72]. ................................................ 86
Figure 3-1. Drawings of pressure vessel with dimensions (a) front view and (b) side view.
.............................................................................................................................................. 92
Figure 3-2. 170-kV rated SF6 bushing design [75]. ............................................................. 92
Figure 3-3. (a) Pressure vessel assembled with the 170-kV rated bushing (b) pressure vessel
main section. ........................................................................................................................ 93
Figure 3-4. Gas filling, recovery and evacuation of air couplings (a) DN20 CO2 coupling (b)
DN8 SF6 coupling (c) DN20 C3F7CN and C3F7CN/CO2 gas mixtures coupling. ................ 94
Figure 3-5. (a) Pressure relief valve set at 8 bar (abs) and (b) WIKA pressure gauge. ....... 95
Figure 3-6. Development of reduced-scale coaxial configuration based on a 420/550 kV GIB
demonstrator. ........................................................................................................................ 96
Figure 3-7. Electric field comparison of full-scale and reduced-scale prototype straight
sections (kV/mm). ................................................................................................................ 97
Figure 3-8. Reduced-scale prototype design, development and fabrication process. .......... 98
Figure 3-9. (a) Dimensions of the initial reduced-scale prototype (b) COMSOL model
geometry structure. ............................................................................................................. 100
Figure 3-10. Boundary conditions for (a) ground and (b) high voltage electrodes for the
reduced-scale prototype. .................................................................................................... 101
Figure 3-11. Finite element meshing for the reduced-scale prototype............................... 102
Figure 3-12. Emax as a function of number of elements used in the reduced-scale prototype
FEA modelling as part of the mesh refinement process. ................................................... 103
Figure 3-13. Reduced-scale prototype Emax (kV/mm) location for 1 kV applied voltage.. 104
Figure 3-14. Fabricated reduced-scale coaxial prototype (a) fully assembled and (b)
disassembled into individual components. ......................................................................... 105
Figure 3-15. Surface flashover on the polypropylene insulator. ........................................ 105
Figure 3-16. Breakdown voltage location for the initial reduced-scale prototype design on
the (a) enclosure and (b) conductor sphere termination. .................................................... 106
List of Figures
10
Figure 3-17. Reduced-scaled prototype final design (a) dimensions and materials and (b)
electric field distribution simulation and Emax location (kV/mm) for 1 kV applied voltage.
........................................................................................................................................... 107
Figure 3-18. Fabricated components of the reduced-scale prototype (a) individual parts and
(b) photography on the location of coaxial breakdowns. .................................................. 107
Figure 3-19. Raverage surface roughness calculation parameters obtained from [82]. ........ 108
Figure 3-20. Rz surface roughness calculation parameters [83]......................................... 109
Figure 3-21. Surface roughness measurements of reduced-scale prototype conductor using
laser confocal scanning microscopy over the sampling of 6000 μm (a) optical image
illustrating the machine turned surface finish (b) height image where red colour indicates the
highest peaks and blue the deepest valleys and (c) roughness profile. .............................. 110
Figure 3-22. (a) Dimensions of coaxial configuration and (b) electric field (kV/mm)
simulation result for 1 kV applied voltage. ....................................................................... 111
Figure 3-23. Hemispherical rod-plane and coaxial designs plotted against f. ................... 112
Figure 3-24. (a) Dimensions of the hemispherical rod-plane configuration and (b) electric
field (kV/mm) simulation result for 1 kV applied voltage. ............................................... 112
Figure 3-25. Typical insulation defects in practical GIL/GIB equipment that can cause PD
activities (1) protrusion on conductor (2) protrusion on enclosure (3) particle on the insulator
(4) floating particle and (5) void in the insulator. .............................................................. 114
Figure 3-26. Artificial defects on electrode configurations for modelling PD sources of
practical GIL/GIB equipment (a) rod-plane with a needle on the HV rod (b) plane-plane with
a needle on the HV plane (c) plane-plane with a needle on the grounded plane and (d) needle
used for protrusions. .......................................................................................................... 114
Figure 3-27. Rod-plane FEA simulation with a needle of 15 mm length attached to the HV
rod and a needle-to-plane gap distance of 10 mm (a) Geometry meshing and (b) Emax
(kV/mm) value for 1 kV voltage applied to the HV electrode. ......................................... 115
Figure 3-28. Electric field distribution (kV/mm) for 1 kV applied voltage in the needle-to-
plane gap spacing of both electrode configurations starting from the needle tip and moving
towards the plane. .............................................................................................................. 116
Figure 3-29. DILO SF6 mini-series gas cart with individual units. ................................... 119
Figure 3-30. DILO C3F7CN Piccolo-series bespoke gas cart. ........................................... 120
Figure 3-31. DILO SF6 volume percentage measuring device. ......................................... 121
Figure 3-32. WIKA GA11 alternative gases analysis instrument for C3F7CN/CO2 gas
mixtures. ............................................................................................................................ 122
List of Figures
11
Figure 3-33. Gas storage cylinders used for pure C3F7CN, CO2 and C3F7CN/CO2 gas
mixtures. ............................................................................................................................. 123
Figure 3-34. SF6 filling procedure. .................................................................................... 124
Figure 3-35. SF6 recovery procedure. ................................................................................ 124
Figure 3-36. C3F7CN/CO2 gas mixtures filling procedure. ................................................ 125
Figure 3-37. C3F7CN/CO2 gas mixtures mixing procedure. .............................................. 126
Figure 3-38. C3F7CN/CO2 gas mixtures recovery and refilling procedures. ..................... 127
Figure 4-1. LI breakdown tests circuit diagram including the pressure vessel, impulse
generator, voltage divider and the HiAS. ........................................................................... 131
Figure 4-2. Measurement of a 252.2 kV LI withstand waveform with voltage and time
parameters. ......................................................................................................................... 132
Figure 4-3. AC breakdown tests circuit diagram including the pressure vessel, voltage
divider, AC generator and the measurement and control unit. .......................................... 133
Figure 4-4. Example of an LI up-and-down procedure using 30 impulse shots. ............... 134
Figure 4-5. Example of an AC progressive stress test procedure using 30 breakdowns. .. 136
Figure 4-6. Example of a LI breakdown voltage where the chop occurred at the front of the
waveform............................................................................................................................ 137
Figure 4-7. Example of a LI breakdown voltage where the chop occurred at the tail of the
waveform............................................................................................................................ 138
Figure 4-8. U50 as a function of absolute pressure for the reduced-scale coaxial prototype of
10 mm conductor and 30 mm inner enclosure diameters using SF6 and C3F7CN/CO2 mixtures
with 20% and 16% C3F7CN concentration under positive lightning impulse (LI+). ......... 139
Figure 4-9. U50 as a function of absolute pressure for the reduced-scale coaxial prototype of
10 mm conductor and 30 mm inner enclosure diameters using SF6 and C3F7CN/CO2 mixtures
with 20% and 16% C3F7CN concentration under negative lightning impulse (LI-). ......... 140
Figure 4-10. U50 for 100% SF6, 20% C3F7CN / 80% CO2 and 16% C3F7CN / 84% CO2 for
the reduced-scale coaxial prototype of 10 mm conductor and 30 mm inner enclosure
diameters at 4.5 bar (abs). .................................................................................................. 141
Figure 4-11. U50 as a function of absolute pressure for the reduced-scale coaxial prototype
of 10 mm conductor and 30 mm inner enclosure diameters using SF6 and 20% C3F7CN /
80% CO2 gas mixture under lightning impulse of both polarities. .................................... 142
Figure 4-12. U50 as a function of absolute pressure for the reduced-scale coaxial prototype
of 10 mm conductor and 30 mm inner enclosure diameters using 20% C3F7CN / 80% CO2
and 16% C3F7CN / 84% CO2 gas mixtures under lightning impulse of both polarities. ... 142
List of Figures
12
Figure 4-13. Uavg as a function of absolute pressure for the reduced-scale coaxial prototype
of 10 mm conductor and 30 mm inner enclosure diameters using SF6 and 20% C3F7CN /
80% CO2 gas mixture under AC voltage. .......................................................................... 143
Figure 4-14. V-t characteristics for SF6 from 1 to 4.5 bar (abs) pressure, tested on the
reduced-scale coaxial prototype of 10 mm conductor and 30 mm inner enclosure diameters
under both lightning impulse polarities. ............................................................................ 144
Figure 4-15. V-t characteristics for the 20% C3F7CN / 80% CO2 gas mixture from 1 to 4.5
bar (abs) pressure, tested on the reduced-scale coaxial prototype of 10 mm conductor and 30
mm inner enclosure diameters under both lightning impulse polarities. ........................... 145
Figure 4-16. V-t characteristics for the 16% C3F7CN / 84% CO2 gas mixture from 1 to 4.5
bar (abs) pressure, tested on the reduced-scale coaxial prototype of 10 mm conductor and 30
mm inner enclosure diameters under both lightning impulse polarities. ........................... 145
Figure 4-17. Frequency of breakdown events as a function of time for SF6 gas tested in the
reduced-scale prototype coaxial prototype of 10 mm conductor and 30 mm inner enclosure
diameters under both lightning impulse polarities. ............................................................ 147
Figure 4-18. Frequency of breakdown events as a function of time for the 20% C3F7CN /
80% CO2 gas mixture tested in the reduced-scale coaxial prototype of 10 mm conductor and
30 mm inner enclosure diameters under both lightning impulse polarities. ...................... 147
Figure 4-19. Frequency of breakdown events as a function of time for the 16% C3F7CN /
84% CO2 gas mixture tested in the reduced-scale coaxial prototype of 10 mm conductor and
30 mm inner enclosure diameters under both lightning impulse polarities. ...................... 148
Figure 4-20. (Eb/p)max as a function of absolute pressure for the reduced-scale coaxial
prototype of 10 mm conductor and 30 mm inner enclosure diameters using SF6 and
C3F7CN/CO2 mixtures with 20% and 16% C3F7CN concentration under positive lightning
impulse (LI+). .................................................................................................................... 149
Figure 4-21. (Eb/p)max as a function of absolute pressure for the reduced-scale coaxial
prototype of 10 mm conductor and 30 mm inner enclosure diameters using SF6 and
C3F7CN/CO2 mixtures with 20% and 16% C3F7CN concentration under negative lightning
impulse (LI-). ..................................................................................................................... 150
Figure 4-22. U50 as a function of absolute pressure for the coaxial configuration of 8 mm
conductor and 60 mm inner enclosure diameters using SF6 and 20% C3F7CN / 80% CO2 gas
mixture under lightning impulse of both polarities. .......................................................... 151
List of Figures
13
Figure 4-23. U50 for SF6, CO2 and 20% C3F7CN / 80% CO2 gas mixture for the 8 mm
conductor and 60 mm inner enclosure diameter coaxial electrode configuration at 3 bar (abs).
............................................................................................................................................ 152
Figure 4-24. U50 as a function of gap distance for the hemispherical rod-plane configuration
using SF6 and 20% C3F7CN / 80% CO2 gas mixture under lightning impulse of both
polarities. ............................................................................................................................ 153
Figure 4-25. U50 as a function of absolute pressure for the hemispherical rod-plane
configuration using SF6 and 20% C3F7CN / 80% CO2 gas mixture under lightning impulse
of both polarities. ............................................................................................................... 155
Figure 4-26. U50 as a function of pressure spacing product comparing SF6 and 20% C3F7CN
/ 80% CO2 gases for the hemispherical rod-plane electrode configuration. ...................... 156
Figure 4-27. U50 as a function of absolute pressure comparing the 8/60 mm coaxial and
hemispherical rod-plane electrode configurations under positive and negative lightning
impulses tested using SF6. .................................................................................................. 157
Figure 4-28. U50 as a function of absolute pressure comparing the 8/60 mm coaxial and
hemispherical rod-plane electrode configurations under positive and negative lightning
impulses tested using 20% C3F7CN / 80% CO2 gas mixture. ............................................ 158
Figure 4-29. (Eb/p)max as a function of absolute pressure for the coaxial configuration of 8
mm conductor and 60 mm inner enclosure diameters using SF6 and 20% C3F7CN / 80% CO2
gas mixture under lightning impulse of both polarities. .................................................... 159
Figure 4-30. (Eb/p)max as a function of absolute pressure for the hemispherical rod-plane
configuration using SF6 and 20% C3F7CN / 80% CO2 gas mixture under lightning impulse
of both polarities ................................................................................................................ 160
Figure 5-1. UHF barrier sensor used for the PD experiments [96]. ................................... 164
Figure 5-2. PD experimental test circuit including the AC generator circuit and PD
measurement equipment..................................................................................................... 165
Figure 5-3. UHF barrier sensor orientation (a) Sensor 1 - perpendicular relative to the needle
(horizontal) and (b) Sensor 2 - parallel to the needle (vertical). ........................................ 166
Figure 5-4. Pulse sharpener output signal with a fast-rise time of less than 5 ns which was
used for the sensitivity check. ............................................................................................ 166
Figure 5-5. UHF sensors PD measurement responses to the fast-rise signal with their
orientation aligned (a) Sensor 1 used as a receiver (horizontal) and Sensor 2 used as a
transmitter (horizontal) and (b) Sensor 2 used as a receiver (horizontal) and Sensor 1 used
as a transmitter (horizontal). .............................................................................................. 167
List of Figures
14
Figure 5-6. UHF sensors PD measurement responses to the fast-rise signal with a 90°
orientation difference (a) Sensor 1 used as a receiver (horizontal) and Sensor 2 used as a
transmitter (vertical) and (b) Sensor 2 used as a receiver (vertical) and Sensor 1 used as a
transmitter (horizontal). ..................................................................................................... 168
Figure 5-7. PD signal example recorded from the UHF sensors with a 20.9 mVpk-pk value.
........................................................................................................................................... 169
Figure 5-8. Noise level example recorded from the UHF sensors with a maximum of 7.5
mVpk-pk. .............................................................................................................................. 170
Figure 5-9. Full bandwidth scan of PD activities for SF6. ................................................. 170
Figure 5-10. Full bandwidth scan of PD activities for 20% C3F7CN / 80% CO2. ............. 171
Figure 5-11. ACRMS PDIV and PDEV of SF6 and 20% C3F7CN / 80% CO2 as a function of
absolute pressure using the hemispherical rod-plane electrode configuration with a needle
attached on the HV electrode with a length of 15 mm and a needle-plane gap distance of 10
mm. .................................................................................................................................... 172
Figure 5-12. ACRMS PDIV and PDEV of SF6 and 20% C3F7CN / 80% CO2 as a function of
absolute pressure using the hemispherical rod-plane electrode configuration with a needle
attached on the HV electrode with a length of 5 mm and a needle-plane gap distance of 10
mm. .................................................................................................................................... 173
Figure 5-13. ACRMS PDIV and PDEV of SF6 as a function of absolute pressure using the
hemispherical rod-plane electrode configuration with a needle attached on the HV electrode
with 5- and 15-mm lengths. ............................................................................................... 174
Figure 5-14. ACRMS PDIV and PDEV of 20% C3F7CN / 80% CO2 as a function of absolute
pressure using the hemispherical rod-plane electrode configuration with a needle attached
on the HV electrode with 5- and 15-mm lengths. .............................................................. 174
Figure 5-15. PRPD patterns comparing (a) 20% C3F7CN / 80% CO2 and (b) SF6 at 20 kV
for pressure range from 2 to 5 bar (abs) using the hemispherical rod-plane configuration with
a 15 mm needle on the HV electrode. ................................................................................ 175
Figure 5-16. PRPD patterns comparing SF6 with (a) 15 mm and (b) 5 mm needle lengths on
the HV electrode at 5 bar (abs) for 100, 120, 150 and 200% of its PDIV values using the
hemispherical rod-plane configuration. ............................................................................. 176
Figure 5-17. Maximum UHF signal comparison for SF6 at 5 bar (abs) using 15- and 5-mm
needle lengths recorded directly from the UHF sensors at the PDIV value with the 4 GHz
oscilloscope. ....................................................................................................................... 177
List of Figures
15
Figure 5-18. PRPD patterns comparing 20% C3F7CN / 80% CO2 with (a) 15 mm and (b) 5
mm needle lengths on the HV electrode at 5 bar (abs) for 100, 120, 150 and 200% of its
PDIV values using the hemispherical rod-plane configuration. ........................................ 177
Figure 5-19. Maximum UHF signal comparison for 20% C3F7CN / 80% CO2 at 5 bar (abs)
using 15- and 5-mm needle lengths recorded directly from the UHF sensors at the PDIV
value with the 4 GHz oscilloscope. .................................................................................... 178
Figure 5-20. PRPD patterns comparing (a) 20% C3F7CN / 80% CO2 and (b) SF6 at 200% of
their PDIV values for the range of 1 to 5 bar (abs) pressure using the hemispherical rod-
plane configuration with a 5 mm needle on the HV electrode. .......................................... 180
Figure 5-21. PRPD patterns comparing CO2 for 3-6 bar (abs) at 200% PDIV to illustrate its
PRPD behaviour using the hemispherical rod-plane configuration with a 5 mm needle on the
HV electrode. ..................................................................................................................... 180
Figure 5-22. PRPD patterns comparing C3F7CN at 1 bar (abs) for different voltage levels to
illustrate its PRPD behaviour using the hemispherical rod-plane configuration with a 5 mm
needle on the HV electrode. ............................................................................................... 181
Figure 5-23. Used needles microscope images for (a) 20% C3F7CN / 80% CO2 and (b) SF6.
............................................................................................................................................ 182
Figure 5-24. ACRMS PDIV and PDEV of SF6 and 20% C3F7CN / 80% CO2 as a function of
absolute pressure using the plane-plane electrode configuration with a needle attached on
the HV electrode with a length of 15 mm and a needle-plane gap distance of 10 mm...... 183
Figure 5-25. ACRMS PDIV and PDEV of SF6 and 20% C3F7CN / 80% CO2 as a function of
absolute pressure using the plane-plane electrode configuration with a needle attached on
the ground electrode with a length of 15 mm and a needle-plane gap distance of 10 mm.
............................................................................................................................................ 184
Figure 5-26. ACRMS PDIV and PDEV of SF6 and 20% C3F7CN / 80% CO2 as a function of
absolute pressure using the plane-plane electrode configuration with a needle attached on
the HV electrode with a length of 5 mm and a needle-plane gap distance of 10 mm........ 185
Figure 5-27. ACRMS PDIV and PDEV of SF6 as a function of absolute pressure using the
plane-plane electrode configuration with a needle attached on the HV electrode with 5- and
15-mm lengths. ................................................................................................................... 186
Figure 5-28. ACRMS PDIV and PDEV of 20% C3F7CN / 80% CO2 as a function of absolute
pressure using the plane-plane electrode configuration with a needle attached on the HV
electrode with 5- and 15-mm lengths. ................................................................................ 186
List of Figures
16
Figure 5-29. PRPD patterns comparing (a) 20% C3F7CN / 80% CO2 and (b) SF6 at 20 kV
for the range of 2 to 5 bar (abs) pressure using the plane-plane configuration with a 15 mm
needle on the HV electrode. ............................................................................................... 187
Figure 5-30. PRPD patterns comparing SF6 with (a) 15 mm and (b) 5 mm needle lengths on
the HV electrode at 5 bar (abs) for 100, 120, 150 and 170/200% of its PDIV values using the
plane-plane configuration. ................................................................................................. 188
Figure 5-31. PRPD patterns comparing 20% C3F7CN / 80% CO2 with (a) 15 mm and (b) 5
mm needle lengths on the HV electrode at 5 bar (abs) for 100, 120, 150 and 170/200% of its
PDIV values using the plane-plane configuration. ............................................................ 189
Figure 5-32. PRPD patterns comparing (a) 20% C3F7CN / 80% CO2 and (b) SF6 at 5 bar
(abs) pressure at 100, 120, 150 and 200% of their PDIV values using the plane-plane
configuration with a 15 mm needle on the grounded electrode. ........................................ 190
Figure 5-33. PRPD patterns comparing SF6 at 100, 120, 150 and 170% of its PDIV values
at (a) 1 bar (b) 2 bar (c) 3 bar (d) 4 bar and (e) 5 bar (abs) pressure using the plane-plane
configuration with a 5 mm needle on the HV electrode. ................................................... 191
Figure 5-34. PRPD patterns comparing 20% C3F7CN / 80% CO2 gas mixture at 100, 120,
150 and 170% of its PDIV values at (a) 1 bar (b) 2 bar (c) 3 bar (d) 4 bar and (e) 5 bar (abs)
pressure using the plane-plane configuration with a 5 mm needle on the HV electrode. . 192
Figure 6-1. Type tests circuit diagram including the impulse and AC generator circuits. 199
Figure 6-2. GIB demonstrator setup (a) insulating spacer (b) straight conductor section (c)
HV bushing and (d) demonstrator assembly process. ....................................................... 199
Figure 6-3. 3D design of the 420/550 kV GIB demonstrator with location for the UHF
sensors. ............................................................................................................................... 200
Figure 6-4. 800 kV AC generator test setup connected to the 420/550 kV GIB demonstrator.
........................................................................................................................................... 201
Figure 6-5. 2 MV Impulse generator test setup connected to the 420/550 kV GIB
demonstrator. ..................................................................................................................... 202
Figure 6-6. EPDM elastomer sample tested for compatibility with C3F7CN gas. ............. 207
Figure 6-7. Total SF6 inventory in the UK transmission network divided in passive and active
components. ....................................................................................................................... 209
Figure 6-8. Total SF6 passive components inventory in the UK transmission network and the
volume of SF6 being used for the GIB demonstrator type tested in this chapter. .............. 209
Figure 6-9. Calculated GWP as a function of C3F7CN concentration in a mixture. .......... 211
List of Figures
17
Figure 6-10. Comparison of SF6 and 20% C3F7CN / 80% CO2 gases tCO2e using leakages
from 2014 to 2019 from Table 6-6. .................................................................................... 212
Figure 6-11. Geographical locations of National Grid substations and Met Office weather
stations reported in Table 6-10 and Table 6-11 [109]. ....................................................... 214
Figure 6-12. Mean daily minimum temperature for every month from 1990 to 2018 recorded
from Durham weather station............................................................................................. 215
Figure 6-13. Mean daily minimum temperature for every month from 1990 to 2018 recorded
from Sheffield weather station. .......................................................................................... 215
Figure 6-14. Mean daily minimum temperature for every month from 1990 to 2018 recorded
from Lowestoft weather station. ........................................................................................ 216
Figure 6-15. Mean daily minimum temperature for every month from 1990 to 2018 recorded
from Heathrow weather station. ......................................................................................... 216
Figure 6-16. Mean daily minimum temperature for every month from 1990 to 2018 recorded
from Manston weather station. ........................................................................................... 217

List of Figures
18
Blank Page
List of Tables
19
List of Tables
Table 2-1. GIS steps of development since the 1960s [2], [20]. .......................................... 41
Table 2-2. GIL historical development since the 1960s [22]. .............................................. 43
Table 2-3. Cumulative global GIL length installed until 2010 [12]. ................................... 43
Table 2-4. GWP and AGWP for 20 and 100-year horizons for CO2 and SF6 [3]. ............... 54
Table 2-5. PFCs dielectric strength, GWP and boiling point [16], [18], [31], [32]. ............ 56
Table 2-6. FKs dielectric strength, GWP and boiling point [18], [32]–[34]. ....................... 57
Table 2-7. HFOs dielectric strength, GWP and boiling point [18]. ..................................... 58
Table 2-8. Natural gases dielectric strength, GWP and boiling point [18], [28]. ................ 59
Table 2-9. Comparison of properties between C3F7CN and SF6 [7], [40]. .......................... 59
Table 2-10. LC50 4-hour exposure values for pure C3F7CN and C3F7CN/CO2 mixtures [6],
[43]. ...................................................................................................................................... 65
Table 2-11. By-products analysis of arced g3 [8]. ................................................................ 87
Table 3-1. 170-kV rated SF6 bushing technical data [75]. ................................................... 93
Table 3-2. Comparison of parameters for the full-scale GIB demonstrator and the reduced-
scale prototype. .................................................................................................................... 97
Table 3-3. Relative permittivity values for the components used in the FEA model [77].101
Table 3-4. Emax and field utilisation factor values for all electrode configurations used in PD
experiments for 1 kV applied voltage. ............................................................................... 117
Table 3-5. Classification of electric field categories for the electrode configurations
developed for the breakdown and the PD experiments in this thesis. ................................ 118
Table 4-1. Liquefaction point for 16% and 20% C3F7CN Gas Mixtures and SF6 for 1-4.5 bar
(abs). ................................................................................................................................... 139
Table 6-1. Type tests procedures for the full-scale GIB demonstrator. ............................. 203
Table 6-2. Switching impulse voltage and time values recorded with the HiAS for voltage
applications of (a) 1050 kV (420 kV rating) and (b) 1175 kV (550 kV) rating. ................ 204
Table 6-3. Lightning impulse voltage and time values recorded with the HiAS for voltage
applications of (a) 1425 kV (420 kV rating) and (b) 1550 kV (550 kV) rating. ................ 205
Table 6-4. Type test results for the full-scale GIB demonstrator at 420 kV rated voltage
tests. .................................................................................................................................... 205
List of Tables
20
Table 6-5. Type test results for the full-scale GIB demonstrator at 550 kV rated voltage
tests. ................................................................................................................................... 206
Table 6-6. Non-standard type test results for the full-scale GIB demonstrator at 420 kV rated
voltage tests. ...................................................................................................................... 206
Table 6-7. Material compatibility test conditions. ............................................................. 207
Table 6-8. C3F7CN purity when aged at 105°C in contact with the EPDM elastomer sample.
........................................................................................................................................... 208
Table 6-9. SF6 yearly losses as reported from National Grid. ........................................... 210
Table 6-10. National Grid substations in the UK with SF6 inventory that exceeds 20 t. .. 213
Table 6-11. Met Office weather stations located nearby the substations reported in Table 6-
10 [108]. ............................................................................................................................. 213
List of Abbreviations
21
List of Abbreviations
SF6 Sulphur hexafluoride
C3F7CN Heptafluoro-iso-butyronitrile
CO2 Carbon dioxide
N2 Nitrogen
GWP Global Warming Potential
GIL Gas Insulated Line
GIB Gas Insulated Busbar
GIS Gas Insulated Switchgear
AIS Air Insulated Substation
AC Alternative Current
DC Direct Current
SI Switching Impulse
LI Lightning Impulse
PD Partial Discharge
PDIV Partial Discharge Inception Voltage
PDEV Partial Discharge Extinction Voltage
PRPD Phase-Resolved Partial Discharge
POC Protrusion on Conductor
POE Protrusion on Enclosure
UHF Ultra-High Frequency
HV High Voltage
U50 50% breakdown voltage
f Field utilisation factor
α Ionisation coefficient
η Attachment coefficient
FEA Finite Element Analysis
V-t Voltage-time
Emax Maximum electric field
(E/p)crit Critical electric field
(Eb/p)max Pressure-reduced breakdown field strength

List of Abbreviations
22
Blank Page
Abstract
23
Abstract
The most significant drivers behind climate change are the greenhouse gases mainly caused
by human activities. Environmental agreements, such as the Kyoto Protocol and the F-gas
legislation, have been put in place to control the emission of greenhouse gases. Sulphur
hexafluoride (SF6), the most potent man-made greenhouse gas in existence, is widely used
in the power industry as a dielectric medium in gas insulated equipment. Hence, the power
industry has been looking for replacements to phase out the use of SF6 in the power
equipment. This thesis investigates the possibility of replacing SF6 in existing gas insulated
lines (GILs) and busbars (GIBs) within the power network with the more environmentally
friendly C3F7CN/CO2 gas mixtures.
Two types of electrical characterisations were carried out in this study, namely breakdown
voltage and partial discharge (PD) tests. Coaxial and hemispherical rod-plane electrode
configurations, with electric fields as found in practical GIL/GIB equipment, were used for
AC and lightning impulse (LI) breakdown tests. For the PD tests under AC voltage, needles
were attached to the high voltage and grounded electrode of plane-plane and hemispherical
rod-plane configurations to mimic protrusion defects that can occur in practical GIL/GIB
equipment. SF6 was tested as a benchmark and compared to the performance of C3F7CN/CO2
gas mixtures. Finally, a full-scale, 420/550 kV rated GIB demonstrator, filled with SF6 first
and then with the 20% C3F7CN / 80% CO2 gas mixture, was subjected to type tests of various
voltage waveforms in accordance to IEC standards.
The results showed that the 20% C3F7CN / 80% CO2 gas mixture has comparable LI and AC
breakdown performance to SF6 under quasi-uniform fields. However, as the fields become
more non-uniform, the 20% C3F7CN / 80% CO2 gas mixture has lower LI breakdown
voltages than SF6 especially under positive polarity. The PD tests showed that the 20%
C3F7CN / 80% CO2 gas mixture has a poorer performance than SF6 under highly divergent
fields but can exceed the inception and extinction values of SF6 when more uniform fields
are used. The type tests using the full scale GIB demonstrator showed that the 20% C3F7CN
/ 80% CO2 gas mixture has passed all the required voltage levels as SF6. This could lead to
at least 190 t of SF6 being replaced with the 20% C3F7CN / 80% CO2 gas mixture in the UK
power network, where a reduced GWP can result to the CO2 equivalent emissions being
decreased by 95% of the current annual leakages. The findings in this thesis are an
encouraging step towards a technically viable SF6-free retro-fill solution for existing
GIL/GIB installed for the 400 kV transmission network in the UK.

Abstract
24
Blank Page
Declaration
25
Declaration
No portion of the work referred to in the thesis has been submitted in support of an
application for another degree or qualification of this or any other university or other institute
of learning.

Declaration
26
Blank Page
Copyright Statement
27
Copyright Statement
(i) The author of this thesis (including any appendices and/or schedules to this thesis)
owns certain copyright or related rights in it (the “Copyright”) and s/he has given The
University of Manchester certain rights to use such Copyright, including for administrative
purposes.
(ii) Copies of this thesis, either in full or in extracts and whether in hard or electronic
copy, may be made only in accordance with the Copyright, Designs and Patents Act 1988
(as amended) and regulations issued under it or, where appropriate, in accordance with
licensing agreements which the University has from time to time. This page must form part
of any such copies made.
(iii) The ownership of certain Copyright, patents, designs, trademarks and other
intellectual property (the “Intellectual Property”) and any reproductions of copyright works
in the thesis, for example graphs and tables (“Reproductions”), which may be described in
this thesis, may not be owned by the author and may be owned by third parties. Such
Intellectual Property and Reproductions cannot and must not be made available for use
without the prior written permission of the owner(s) of the relevant Intellectual Property
and/or Reproductions.
(iv) Further information on the conditions under which disclosure, publication and
commercialisation of this thesis, the Copyright and any Intellectual Property and/or
Reproductions described in it may take place is available in the University IP Policy (see
http://documents.manchester.ac.uk/DocuInfo.aspx?DocID=24420), in any relevant Thesis
restriction declarations deposited in the University Library, The University Library’s
regulations (see http://www.library.manchester.ac.uk/about/regulations/) and in The
University’s policy on Presentation of Theses.

Copyright Statement
28
Blank Page
Acknowledgment
29
Acknowledgment
I would like to start one of the most important sections in my thesis by expressing my sincere
gratitude to my supervisors, Dr Tony Chen and Dr Qiang Liu, for all the support and
assistance given throughout the years. Both brilliant individuals who have accepted me as a
young engineer and with their guidance allowed me to develop into an experienced
researcher. Special thanks to Prof. Ian Cotton who has also provided valuable advices about
the project throughout the years.
I would also like to thank all the industrial partners who have supported this project over the
years, both financially and with their technical input, and more specifically: Mark Waldron
and Dr Gordon Wilson from National Grid and Mark Gledhill, Reyad Abdulqader, Rainer
Kurz and John Owens from 3M.
I am also grateful to Dr Richard Gardner, Dr Vidyadhar Peesapati and Dr Christos
Zachariades who helped me a lot during my experimental work and for having lots of fruitful
conversations with them that helped me throughout my testing period. I would also like to
take this opportunity to thank people from HVPD Ltd and more specifically Andreas
Kokkotis, Roberto Fernandez Bautista and Dr Malcom Seltzer-Grant for being very helpful
and providing the equipment used for all the Partial Discharge experiments in this thesis.
My PhD would not be as enjoyable as it was without the people that were around me all
these years. I would like to thank all my office and Ferranti Building friends at The
University of Manchester and more specifically Dr Shanika Matharage, Dr ShengJi Tee,
James Hill, Zong Wen Yan, Shen Shuhang and Dr Ibrahim Iddrissu for all the entertaining
talks we had whilst working late on our projects. Having people to discuss about your
problems and motivate each other can really keep you going! Last but not least, none of this
would have been possible without the amazing company I had when returning back to my
flat after the long and tiring days spent at the university. Shout out to the best flatmates and
friends one could have over the course of a very stressful and difficult PhD project. These
are Alexandros Mannari, Vasileios Tsormpatzoudis, Camran Ahmed and Antonis
Efthymiou. I appreciate all their help and support throughout the years.

Acknowledgment
30
I would also like to use a new page for the most important people in my life. These people
did not only support me throughout my PhD project but have always been there for me
providing infinite love and care.
Words are not enough to express my gratitude to my parents, Pantelis and Andri Loizou,
who have always been by my side and supported my education and choices in life. I would
also like to thank my sister, Angela Loizou, and her son who always supported me. All my
family members have taught me three very important things in life: be humble, appreciate
what you have and always ask for more but never be greedy.
Finally, I cannot begin to express my thanks to my partner, Malvina Nicolaou, for her selfless
love and understanding. She has been my rock, my greatest supporter and the person who
could always lift me up when I was down and motivate me to keep going through difficult
times.
Introduction
31
Chapter 1 Introduction
1.1 Background
Growing reliance on operating appliances, electronics as well as electric vehicles has rapidly
increased the demand for electrical energy in modern society over the past few years.
Electricity is delivered through transmission and distribution networks, which vary in
voltage levels, in order to minimise transmission losses and ensure safe supply to the
consumer. Transformers are used to provide an efficient, reliable and cost-effective method
of supplying electricity to industrial and residential consumers by changing these voltage
levels. However, transformers rely on other assets used in substations to protect the network
from overload and short circuit faults (such as lightning strikes and switching operations)
through current interruption processes. These assets, known as switchgear, are used to ensure
long term service reliability and operational safety of electricity networks [1]. In the early
20th century, switchgear predominantly used air and oil as their insulation and arc-quenching
mediums. Since 1960s, sulphur hexafluoride (SF6) was preferred to those media, especially
for high voltage applications [1], [2].
SF6 is a colourless, odourless, non-flammable and chemically inert gas which has been used
in gas insulated equipment for decades owing to its exceptional dielectric insulation and arc
quenching capabilities. Applications of SF6 include gas insulated switchgear (GIS), lines
(GILs) and busbars (GIBs). Despite the many benefits of SF6, it has one major drawback: a
global warming potential (GWP) of 23,500 times greater than CO2 [3]. The long atmospheric
lifetime of 3,200 years and the high radiative forcing efficiency are two crucial factors that
categorise SF6 as a significant contributor to greenhouse gas emissions. The power industry
is the main user of SF6 responsible for the annual use of approximately 10,000 tons,
accounting for 80% of the global SF6 inventory [4].
The SF6 concentration in the atmosphere has risen over 20% from 2010 to 2015 [4] and is
predicted to continue growing at a similar rate until 2025 [5], resulting in an increasing
awareness of the need to find an environmentally friendly replacement gas for SF6. An
Introduction
32
existing strategy proposed by the equipment manufacturers for the power industry is to
upgrade and replace SF6-filled equipment in the network with new state-of-the-art equipment
specifically designed for suitable SF6 alternatives [4], [6]. While this is intended to reduce
overall SF6 emissions, it is costly and replacing all existing SF6-filled assets worldwide with
new-builds is time consuming. An alternative approach is to investigate the feasibility of
retro-filling existing SF6-filled equipment with alternative gases, which is the aim of this
PhD study.
There is a general consensus that any alternative candidate should have a considerably lower
GWP than SF6. However, the gas should also satisfy a strict list of requirements such as high
dielectric strength, good arc-quenching capability (for GIS), low boiling point as well as
being chemically inert, non-toxic and non-flammable. (CF3)2-CF-CN or C3F7CN, also
commercially known as NovecTM 4710 Insulating Gas, is an emerging candidate which is
used in combination with a carrier gas (CO2, N2 or dry air) due to its relatively high boiling
point. A key advantage of C3F7CN is the shorter atmospheric lifetime of 30 years while SF6 can
remain in the atmosphere for nearly 3,200 years before decomposing, resulting in a
comparatively higher accumulative environmental impact. C3F7CN has a GWP of 2,090 which
is almost a tenth of the GWP of SF6 [7]. While the GWP of pure C3F7CN is still relatively high,
the GWP of 4% C3F7CN mixtures can achieve up to 98% reduction in comparison to SF6 [6],
[8].
Early dielectric studies on C3F7CN have shown encouraging results about its insulation
capabilities compared to SF6 [4], [9]. AC breakdown tests performed under relatively uniform
fields (parallel disk electrodes) have shown that by increasing the C3F7CN concentration in a gas
mixture with CO2, N2 or dry air the insulation performance can be improved significantly [9].
C3F7CN/CO2 mixtures were found to outperform the corresponding C3F7CN/N2 and
C3F7CN/dry air mixtures and a 20% C3F7CN mixture was found to achieve a slightly better
breakdown performance than SF6 [9]. However, it is important to fully characterise the dielectric
behaviour of C3F7CN/CO2 gas mixtures under different experimental conditions before it can be
proposed as a retro-fill solution for SF6-insulated high voltage equipment.
Introduction
33
1.2 Research Objectives
The aim of this PhD thesis is to investigate the possibility of using C3F7CN/CO2 gas
mixtures, and more specifically 20% C3F7CN / 80% CO2, as a potential retro-fill solution for
existing SF6-filled GILs and GIBs in the UK power network. Benchmark tests will be
conducted using SF6 for a comparative study to determine a suitable C3F7CN mixture.
Breakdown, partial discharge tests at reduced scale and BS EN/IEC type tests at full scale
will be conducted under different test conditions e.g. pressure, voltage waveform, impulse
polarity etc. This thesis will mainly cover the following research objectives:
(i) Comparison of the breakdown characteristics of SF6 and C3F7CN mixtures
under quasi-uniform and weakly quasi-uniform fields
GIL/GIB are mainly coaxial cylindrical shaped equipment which result in weakly non-
uniform electric fields. This specific type of geometry is used to characterise the
performance of the gas candidates under representative field uniformity as found in practical
equipment. Lightning impulse (LI) and AC breakdown tests with various experimental
conditions are conducted in this study.
(ii) Comparison of the partial discharge characteristics of SF6 and a pre-
determined C3F7CN mixture in divergent and highly divergent fields
Engineering imperfections in GILs and GIBs, such as small protrusions and floating
particles, can disrupt the field uniformity of the equipment and introduce regions with
extreme electric field enhancements. These electric field disruptions lead to partial
discharges (PDs). Therefore, it is important to understand the PD behaviour of C3F7CN gas
mixtures compared to SF6 in the presence of defects which can affect their performance in
full-scale GIL/GIB equipment. PD behaviour is characterised in terms of partial discharge
inception voltage (PDIV) and extinction voltage (PDEV). PDs can be initiated using needles
with varying lengths to change the field uniformity from divergent to highly divergent
electric fields. Phase resolved partial discharge (PRPD) patterns are also used to analyse the
difference in PD behaviour between SF6 and the pre-determined C3F7CN/CO2 mixture.
Introduction
34
(iii) Comparison of type test results for SF6 and a pre-determined C3F7CN gas
mixture using a full-scale 420/550 kV GIB demonstrator
A SF6-alternative insulation material, such as C3F7CN or its mixture, cannot be proposed as
a potential solution unless it is type tested on practical GIL/GIB equipment. The
investigation focuses on whether a pre-determined C3F7CN gas mixture can replace SF6 in
existing GIB assets in the UK network through type tests on a purposely build GIB
demonstrator. This can establish a level of confidence that the gas mixture could be retro-
filled in SF6-designed GIBs in UK substations in terms of insulation design.
1.3 Major Contributions
The major contributions of this thesis are given as follows:
(i) LI and AC breakdown characteristics of the 16/84% and 20/80% C3F7CN/CO2
concentration gas mixtures under weakly non-uniform electric fields were obtained. Using
quasi-uniform electric fields, the 20% C3F7CN / 80% CO2 gas mixture has comparable LI
and AC breakdown performance to SF6. As fields become more non-uniform than quasi-
uniform (described as weakly quasi-uniform in this thesis), SF6 has significantly higher
positive LI breakdown voltages than the 20% C3F7CN / 80% CO2 gas mixture, while the
negative LI breakdown voltages are comparable for both gases. Breakdown results have
essentially shown that the 20% C3F7CN / 80% CO2 gas mixture can have equivalent
performance to SF6 in GIL/GIB representative field uniformities.
(ii) PD characteristic comparisons of SF6 and the 20% C3F7CN / 80% CO2 gas mixture
under divergent and highly divergent electric fields were obtained using different needle
lengths and electrode configurations. Using a hemispherical rod-plane or plane-plane
electrode configuration and a needle-to-plane gap distance of 10 mm, SF6 demonstrates
higher PDIV/EV values than the 20% C3F7CN / 80% CO2 gas mixture for a needle length of
15 mm but with a shorter needle length of 5 mm both gases behave similarly. PRPD patterns
have shown a different behaviour for the two gases where the PD activities for the 20%
C3F7CN / 80% CO2 gas mixture go through a 3-stage transition phase on the AC waveform.
PD results have provided a level of confidence that the 20% C3F7CN / 80% CO2 gas mixture
Introduction
35
could suppress PD activity as successfully as SF6 when protrusions up to 5 mm exist within
the GIL/GIB equipment.
(iii) Type tests on a full-scale 420/550 kV GIB demonstrator used in the UK transmission
network were conducted according to the BS EN/IEC 62271-204 standard, using the 20%
C3F7CN / 80% CO2 mixture as a retro-fill solution. The results show that the gas mixture
passes all the required standard (using 15 switching and lightning impulse shots per polarity
according to the standard) and non-standard (30 switching and lightning impulse shots per
polarity) type tests at the specified voltage levels like SF6. Moreover, these outcomes have
shown that the 20% C3F7CN / 80% CO2 gas mixture could start to be used in pilot
applications within substations in England since the type tests have established a technical
confidence that this mixture can be used in full-scale equipment.
(iv) Study on the reduction of carbon emissions by retro-filling SF6-designed equipment
with the 20% C3F7CN / 80% CO2 gas mixture and the evaluation of the possibility of using
the specific solution due to its limitation of having a high boiling point of -10°C was carried
out. This study shows that using the C3F7CN/CO2 gas mixture as a retro-fill solution can
reduce the equivalent CO2 emissions by 95% and that this gas mixture can be effective in
several National Grid substations in England since the mean daily minimum temperature
recorded in the past 20 years was -3.4°C, which is higher than the boiling temperature of the
gas mixture.
1.4 Thesis Outline
The structure of the chapters presented in this thesis are as follows:
Chapter 1 Introduction
This chapter provides an overview on the background and motivation of the PhD study and
also presents an outline for the thesis content.
Introduction
36
Chapter 2 Literature Review
This chapter briefly introduces the use of SF6 in gas insulated equipment and the advantages
of using it over air insulated equipment. It also describes the environmental concerns of SF6
that resulted in SF6-alternatives being considered in the power industry. A review of
previously investigated SF6-alternatives is given, where C3F7CN/CO2 gas mixtures emerge
as the most technically viable candidate for retro-fill applications in high voltage equipment.
Finally, the chapter gives an overview of the already existing research on C3F7CN gas.
Chapter 3 Experimental Setup and Gas Handling Procedures
This chapter presents the experimental setups and gas handling procedures used for the tests
in this thesis. An overview of the pressure vessel and electrode configuration design and
development is given. The gas handling setup, such as gas carts and analysers, and gas
handling procedures, including vacuum, filling, mixing and recovery are illustrated in order
to demonstrate the gas treatment reliability for the electrical tests of this thesis.
Chapter 4 Breakdown Characteristics of SF6 Gas and C3F7CN/CO2 Gas Mixtures
This chapter reports the LI and AC breakdown strengths of C3F7CN/CO2 gas mixtures in
comparison to SF6 in weakly non-uniform fields. The up-and-down method is used to
determine the 50% LI breakdown voltage, U50, under different experimental conditions such
as pressure, field uniformity, impulse polarity, gap distance and C3F7CN concentration in
the gas mixture. The progressive stress procedure is used to acquire the average AC
breakdown voltage of SF6 and the 20% C3F7CN / 80% CO2 gas mixture in coaxial
configurations. Additional parameters such as the V-t characteristics and the pressure-
reduced breakdown field strength, (Eb/p)max, are analysed using data acquired from
experiments which allow further comparison between SF6 and the C3F7CN/CO2 mixtures.
Chapter 5 Partial Discharge Characteristics of SF6 Gas and 20% C3F7CN / 80% CO2
Gas Mixture
This chapter investigates the PD characteristics of SF6 and 20% C3F7CN / 80% CO2 gas
mixture using external Ultra-High Frequency (UHF) sensors. Hemispherical rod-plane and
Introduction
37
plane-plane electrode configurations with needle protrusion are used to model defects as
found in practical GIL/GIB equipment. Different field uniformities are achieved using a
variable needle length; specifically, 5 mm and 15 mm. PDIV and PDEV are determined for
both gases. PRPD patterns and UHF captured signals are used to compare the behaviour of
SF6 and 20% C3F7CN / 80% CO2 gas mixture in different PD fault configurations.
Chapter 6 Retro-fill Investigation of a GIB Demonstrator Rated for Transmission
Voltages
This chapter gives an overview on the performance of the 20% C3F7CN / 80% CO2 gas
mixture in a full-scale 420/550 kV GIB demonstrator. The SF6-designed GIB demonstrator
retro-filled with the 20% C3F7CN / 80% CO2 gas mixture is type tested for both 420 kV and
550 kV voltage ratings. Material compatibility tests are also performed on the O-ring
material by placing the EPDM elastomer used in existing GIL/GIB equipment in an oven
operating at 105°C for more than 3 months. Finally, the impact of a retro-fill solution for the
UK transmission network using the 20% C3F7CN / 80% CO2 mixture is given where the
equivalent CO2 emissions can reduce up to 95% compared to SF6.
Chapter 7 Conclusion and Future Work
This chapter provides the main conclusions drawn from the work in this thesis and suggests
possible future work that can be done in order to further investigate the possibility of
replacing SF6 in high voltage equipment with C3F7CN mixtures.

Introduction
38
Blank Page
Literature Review
39
Chapter 2 Literature Review
2.1 Introduction
The power industry mainly uses SF6 as an insulation and arc-quenching medium in high
voltage switchgear used in gas insulated substations. Insulation applications involve the use
of SF6 in busbars while for arc-quenching applications SF6 is used in circuit breakers (CB).
Less common applications of SF6 as an insulating medium is in GIL which provide an
alternative transmission method to overhead lines and underground cables [1]. SF6 gas
insulated substations offer numerous advantages over air insulated substations (AIS), the
most important one being the compactness and reduced footprint [10], [11]. Similarly, GIL
filled with SF6 offer several advantages for high power transmission capacity such as low
transmission losses [12], [13]. However, SF6 has a high environmental impact which is a
huge concern when it leaks into the atmosphere.
Environmental agreements, such as the Kyoto Protocol and the F-gas legislation, aim to
control the use and emissions of fluorinated gases (F-gases) such as hydrofluorocarbons
(HFCs), perfluorocarbons (PFCs) and SF6 [14], [15]. This has led to a growing urgency to
identify gas candidates with a significantly lower GWP than SF6. However, universally
replacing SF6 in power equipment is proven to be a challenging task as no alternative gas
can yet be adopted as a one-for-one replacement. Different families of gases have been
studied such as perfluorocarbons [16], fluoroketones [17] and natural occuring gases [18].
All of these were found to have drawbacks which do not allow a simple retro-fill replacement
in existing SF6-containing equipment. Out of the long list of proposed SF6 alternatives,
C3F7CN [7] used with a carrier gas appears to be the most technically viable alternative for
high voltage equipment.
This chapter provides a review of: (i) technology where SF6 is used as an insulation and arc-
quenching medium (ii) purpose of gas insulated equipment and the benefits of using SF6 as
insulation instead of other media (iii) properties of SF6 that have led to SF6-alternatives being
investigated as potential retro-fill solutions for high voltage equipment (iv) previously
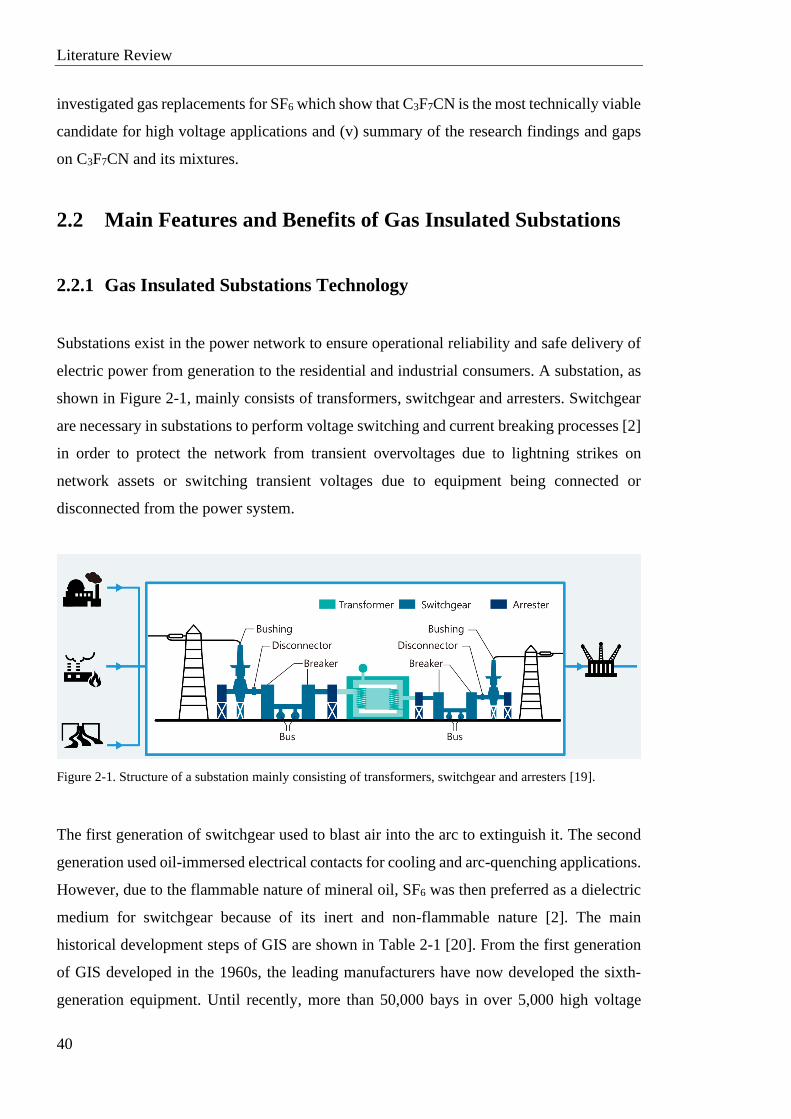
Literature Review
40
investigated gas replacements for SF6 which show that C3F7CN is the most technically viable
candidate for high voltage applications and (v) summary of the research findings and gaps
on C3F7CN and its mixtures.
2.2 Main Features and Benefits of Gas Insulated Substations
2.2.1 Gas Insulated Substations Technology
Substations exist in the power network to ensure operational reliability and safe delivery of
electric power from generation to the residential and industrial consumers. A substation, as
shown in Figure 2-1, mainly consists of transformers, switchgear and arresters. Switchgear
are necessary in substations to perform voltage switching and current breaking processes [2]
in order to protect the network from transient overvoltages due to lightning strikes on
network assets or switching transient voltages due to equipment being connected or
disconnected from the power system.
Figure 2-1. Structure of a substation mainly consisting of transformers, switchgear and arresters [19].
The first generation of switchgear used to blast air into the arc to extinguish it. The second
generation used oil-immersed electrical contacts for cooling and arc-quenching applications.
However, due to the flammable nature of mineral oil, SF6 was then preferred as a dielectric
medium for switchgear because of its inert and non-flammable nature [2]. The main
historical development steps of GIS are shown in Table 2-1 [20]. From the first generation
of GIS developed in the 1960s, the leading manufacturers have now developed the sixth-
generation equipment. Until recently, more than 50,000 bays in over 5,000 high voltage
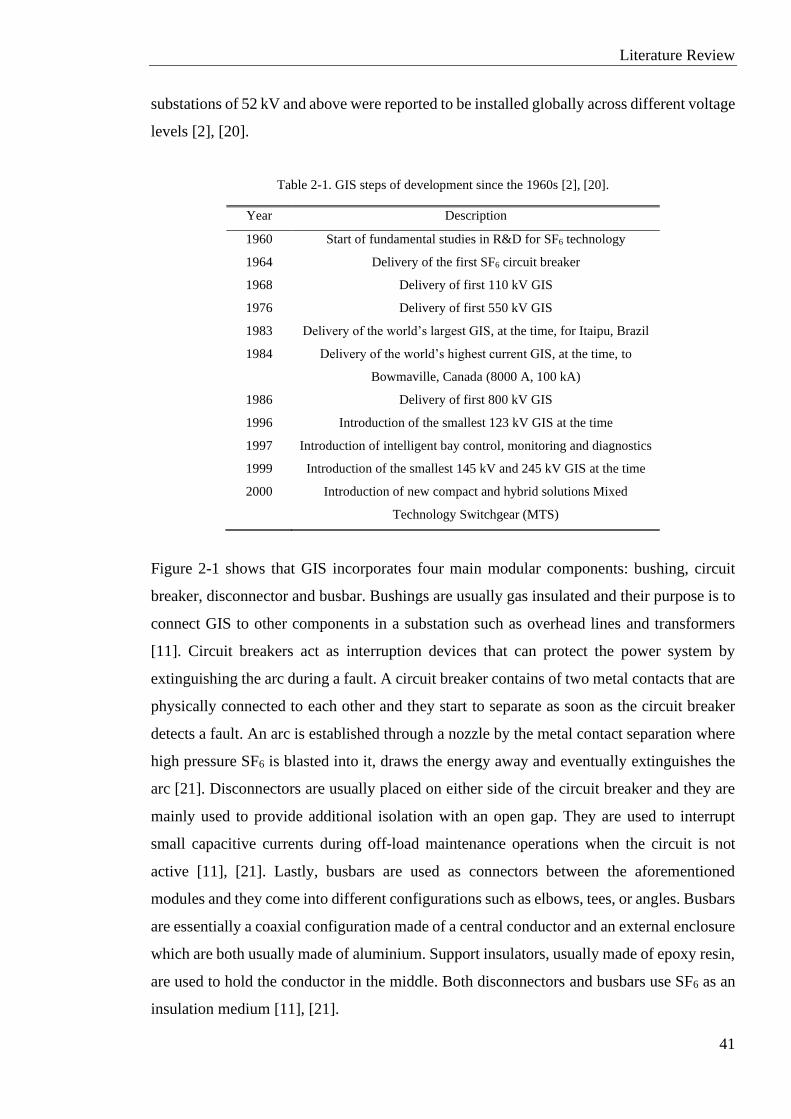
Literature Review
41
substations of 52 kV and above were reported to be installed globally across different voltage
levels [2], [20].
Table 2-1. GIS steps of development since the 1960s [2], [20].
Year Description
1960 Start of fundamental studies in R&D for SF6 technology
1964 Delivery of the first SF6 circuit breaker
1968 Delivery of first 110 kV GIS
1976 Delivery of first 550 kV GIS
1983 Delivery of the world’s largest GIS, at the time, for Itaipu, Brazil
1984 Delivery of the world’s highest current GIS, at the time, to
Bowmaville, Canada (8000 A, 100 kA)
1986 Delivery of first 800 kV GIS
1996 Introduction of the smallest 123 kV GIS at the time
1997 Introduction of intelligent bay control, monitoring and diagnostics
1999 Introduction of the smallest 145 kV and 245 kV GIS at the time
2000 Introduction of new compact and hybrid solutions Mixed
Technology Switchgear (MTS)
Figure 2-1 shows that GIS incorporates four main modular components: bushing, circuit
breaker, disconnector and busbar. Bushings are usually gas insulated and their purpose is to
connect GIS to other components in a substation such as overhead lines and transformers
[11]. Circuit breakers act as interruption devices that can protect the power system by
extinguishing the arc during a fault. A circuit breaker contains of two metal contacts that are
physically connected to each other and they start to separate as soon as the circuit breaker
detects a fault. An arc is established through a nozzle by the metal contact separation where
high pressure SF6 is blasted into it, draws the energy away and eventually extinguishes the
arc [21]. Disconnectors are usually placed on either side of the circuit breaker and they are
mainly used to provide additional isolation with an open gap. They are used to interrupt
small capacitive currents during off-load maintenance operations when the circuit is not
active [11], [21]. Lastly, busbars are used as connectors between the aforementioned
modules and they come into different configurations such as elbows, tees, or angles. Busbars
are essentially a coaxial configuration made of a central conductor and an external enclosure
which are both usually made of aluminium. Support insulators, usually made of epoxy resin,
are used to hold the conductor in the middle. Both disconnectors and busbars use SF6 as an
insulation medium [11], [21].
Literature Review
42
2.2.2 Advantages over AIS
GIS using SF6 as their insulating and arc-quenching medium are generally preferred over
AIS due to several advantages listed as follows:
• Reduced dimensional footprint compared to AIS. They are more compact due to the
superior dielectric strength of SF6 in relation to air. GIS only needs around 10-20% of
the footprint for an AIS at equivalent voltage level. This allows substations to be built
close to densely populated areas or in city centres [2], [11], [21].
• Protection from external environmental conditions such as salty and humid air as well as
atmospheric pollution and dust. High voltage components in AIS can be affected by these
environmental conditions as they are in open air, but GIS provides gas tightness with the
enclosure which protects the live parts. As they are protected from extreme
environmental conditions, GIS assets installed since 1968 are still operating with no
major issues which indicates high reliability and long-life expectancy of this equipment
[2], [11], [21].
• Safe working environment for personnel since the design of GIS ensures that the high
voltage components are secured by the grounded enclosure [2], [11], [21].
• Corrosion and earthquake protection since the external enclosure of the GIS uses
aluminium alloys to protect the high voltage parts. The metallic structure of the GIS also
provides a very good seismic withstand capability [2], [11].
• Factory pre-assembly and tests before being commissioned in substations. The compact
size of GIS allows the manufacturers to fabricate and ship the entire bay assembled prior
to commissioning, which allows easier installation, reduces the on-site works, associated
costs and increases equipment reliability [2], [11], [21].
2.3 Main Features and Benefits of GIL
2.3.1 GIL Technology
GIL is a less common but still an important application of using SF6 as an insulating medium.
GIL is defined as a transmission system without any switching devices, like circuit breakers
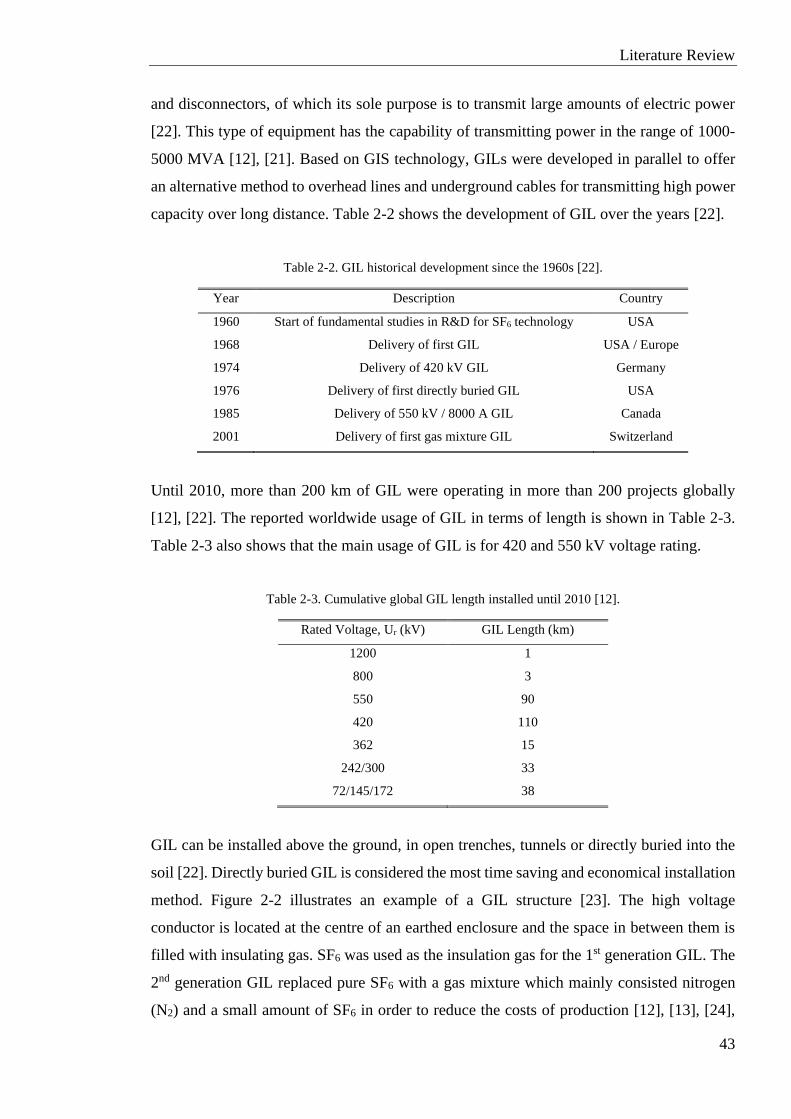
Literature Review
43
and disconnectors, of which its sole purpose is to transmit large amounts of electric power
[22]. This type of equipment has the capability of transmitting power in the range of 1000-
5000 MVA [12], [21]. Based on GIS technology, GILs were developed in parallel to offer
an alternative method to overhead lines and underground cables for transmitting high power
capacity over long distance. Table 2-2 shows the development of GIL over the years [22].
Table 2-2. GIL historical development since the 1960s [22].
Year Description Country
1960 Start of fundamental studies in R&D for SF6 technology USA
1968 Delivery of first GIL USA / Europe
1974 Delivery of 420 kV GIL Germany
1976 Delivery of first directly buried GIL USA
1985 Delivery of 550 kV / 8000 A GIL Canada
2001 Delivery of first gas mixture GIL Switzerland
Until 2010, more than 200 km of GIL were operating in more than 200 projects globally
[12], [22]. The reported worldwide usage of GIL in terms of length is shown in Table 2-3.
Table 2-3 also shows that the main usage of GIL is for 420 and 550 kV voltage rating.
Table 2-3. Cumulative global GIL length installed until 2010 [12].
Rated Voltage, Ur (kV) GIL Length (km)
1200 1
800 3
550 90
420 110
362 15
242/300 33
72/145/172 38
GIL can be installed above the ground, in open trenches, tunnels or directly buried into the
soil [22]. Directly buried GIL is considered the most time saving and economical installation
method. Figure 2-2 illustrates an example of a GIL structure [23]. The high voltage
conductor is located at the centre of an earthed enclosure and the space in between them is
filled with insulating gas. SF6 was used as the insulation gas for the 1st generation GIL. The
2nd generation GIL replaced pure SF6 with a gas mixture which mainly consisted nitrogen
(N2) and a small amount of SF6 in order to reduce the costs of production [12], [13], [24],
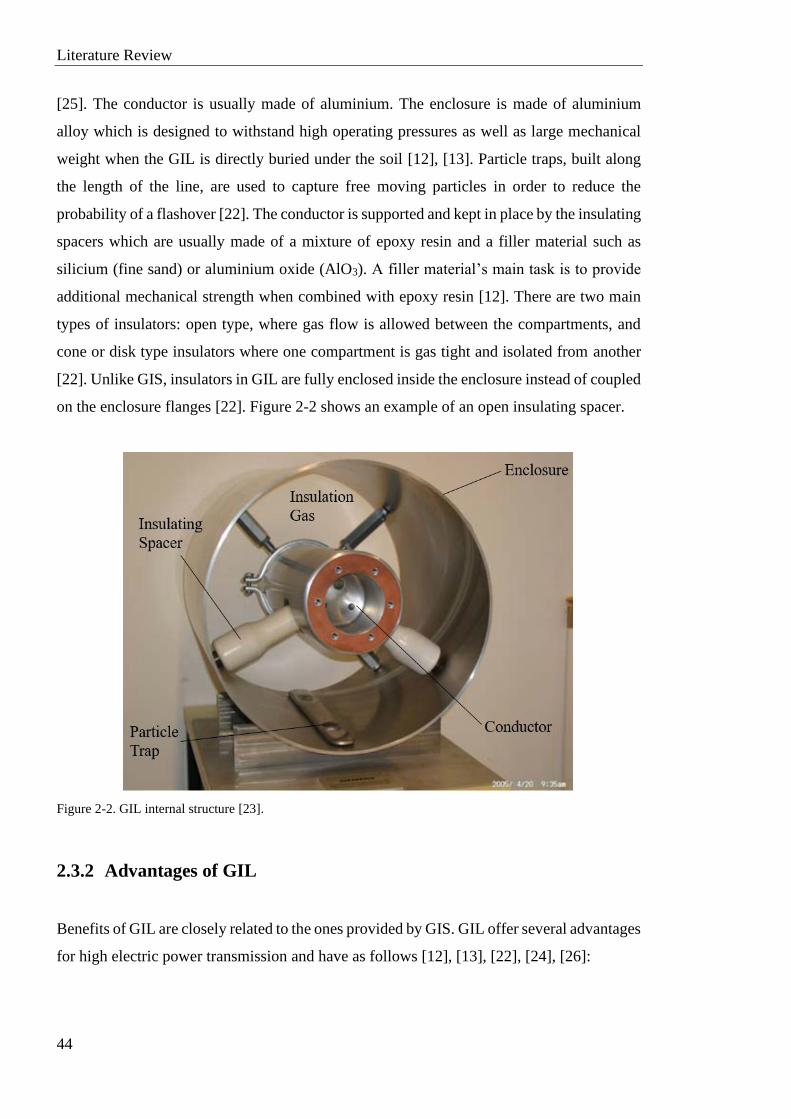
Literature Review
44
[25]. The conductor is usually made of aluminium. The enclosure is made of aluminium
alloy which is designed to withstand high operating pressures as well as large mechanical
weight when the GIL is directly buried under the soil [12], [13]. Particle traps, built along
the length of the line, are used to capture free moving particles in order to reduce the
probability of a flashover [22]. The conductor is supported and kept in place by the insulating
spacers which are usually made of a mixture of epoxy resin and a filler material such as
silicium (fine sand) or aluminium oxide (AlO3). A filler material’s main task is to provide
additional mechanical strength when combined with epoxy resin [12]. There are two main
types of insulators: open type, where gas flow is allowed between the compartments, and
cone or disk type insulators where one compartment is gas tight and isolated from another
[22]. Unlike GIS, insulators in GIL are fully enclosed inside the enclosure instead of coupled
on the enclosure flanges [22]. Figure 2-2 shows an example of an open insulating spacer.
Figure 2-2. GIL internal structure [23].
2.3.2 Advantages of GIL
Benefits of GIL are closely related to the ones provided by GIS. GIL offer several advantages
for high electric power transmission and have as follows [12], [13], [22], [24], [26]:
Literature Review
45
• High power carrying capability and low transmission losses: GIL provide an ideal
supplement or alternative transmission method to overhead lines due to their high-power
carrying capability. GIL can carry up to 3000 MVA per system at 550 kV rated voltage
which allows it to be connected directly to overhead lines without any power reductions.
They also have the benefit of being capable to use the same protection and control
systems to overhead lines [12]. The large cross-sectional area of their conductor provides
low resistive losses. This is important since, for high current transmission systems, the
resistive losses can be significantly large [12], [13].
• Increased safety levels for personnel: The high voltage part of the GIL is securely placed
within the grounded enclosure which minimizes the risk of external impact to the
personnel under internal failure or normal operation [12]. Additionally, GIL are built of
aluminium, epoxy resin and insulating gases which are incombustible materials that
minimize the probability of a fire hazard [13].
• High reliability and long-life expectancy: GIL do not consist of any active moving parts,
such as circuit breakers and switches, which means that there is no need for breaking
operations. As it is mainly a passive system, GIL world-wide have been operating for
more than 50 years now with no major failures [12]. Short repair times combined with
low need for maintenance also makes GIL very reliable transmission systems [26].
• Resistance to thermal and electric ageing: Dielectric gases are non-ageing which
contributes to the long operational lifetime of GIL. The maximum operational electric
field strength and temperature in GIL are much lower than the values required to start
the electric or thermal ageing of the gas [12].
• No external electromagnetic fields: Electromagnetic field regulations exist worldwide,
with the limitation values varying in different countries, to protect the public from being
exposed to harmful amounts of magnetic fields. The high voltage conductor combined
with the grounded enclosure of the GIL form an inductive loop. A reverse current of the
same size to the conductor but with 180° phase shift is induced in the grounded enclosure
which causes two magnetic fields to be superimposed and cancel each other out [13].
The coupling factor between the two magnetic fields is 95% which means that only 5%
can escape the enclosure of the GIL. This is almost negligible compared to other
transmission systems such as overhead lines and underground cables [12].
Literature Review
46
2.4 Insulation Gases for High Voltage Equipment
2.4.1 Electrical Breakdown in Gases
In the absence of electric or magnetic fields, gas molecules move randomly and acquire
velocities ranging from zero to infinity. Due to their random movement, molecules collide
with each other which can potentially generate charge carriers [21], [27]. The generation of
charge carriers from neutral molecules is known as the ionisation process [27]. Ionisation in
a gas, and thus generation of charge carriers, can be enhanced through various processes
such as ultra-violet radiation, cosmic rays, electric field application etc. However, with the
application of a voltage between electrodes, field-assisted ionisation processes prevail the
rest and form the deciding factors which lead to an electrical breakdown [27].
2.4.1.1 Generation of Charged Particles
When a voltage is applied on a pair of electrodes which are separated by an insulating gas,
conduction current will flow if there are charge carriers present in the gas [21]. Even though
a gas is an almost perfect insulator, some charged carriers are always present and can be in
the form of [21]:
1. Electrons (negative charge): e-
2. Positive ions (neutral atom missing an electron): A+ = A – e-
3. Negative ions (neutral atom with an excess electron): A- = A + e-
The above charged particles can be generated through various field assisted ionisation
procedures which are summarised in Figure 2-3. The charge carriers mainly responsible for
the development of an electrical breakdown in a gas are the light and fast-moving free
electrons which can cause significant ionisation. In contrast, heavy and slow-moving ions
are considered relatively stationary and unable to accumulate enough energy to cause
ionisation, thus having reduced effect on the breakdown development process [28].
When an electric field is generated, the main source of free electrons in the gas comes
through primary processes in the gas medium such as ionisation of neutral molecules by
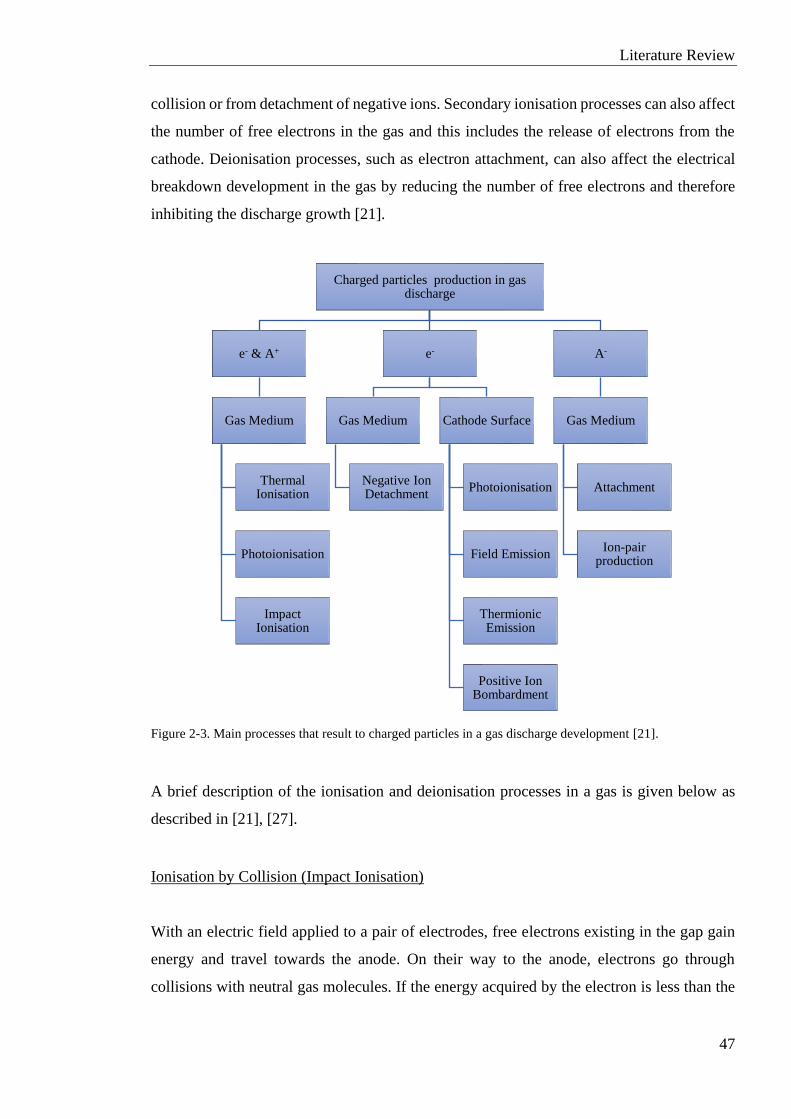
Literature Review
47
collision or from detachment of negative ions. Secondary ionisation processes can also affect
the number of free electrons in the gas and this includes the release of electrons from the
cathode. Deionisation processes, such as electron attachment, can also affect the electrical
breakdown development in the gas by reducing the number of free electrons and therefore
inhibiting the discharge growth [21].
Figure 2-3. Main processes that result to charged particles in a gas discharge development [21].
A brief description of the ionisation and deionisation processes in a gas is given below as
described in [21], [27].
Ionisation by Collision (Impact Ionisation)
With an electric field applied to a pair of electrodes, free electrons existing in the gap gain
energy and travel towards the anode. On their way to the anode, electrons go through
collisions with neutral gas molecules. If the energy acquired by the electron is less than the
Charged particles production in gas discharge
e- & A+
Gas Medium
Thermal Ionisation
Photoionisation
Impact Ionisation
e-
Gas Medium
Negative Ion Detachment
Cathode Surface
Photoionisation
Field Emission
Thermionic Emission
Positive Ion Bombardment
A-
Gas Medium
Attachment
Ion-pair production
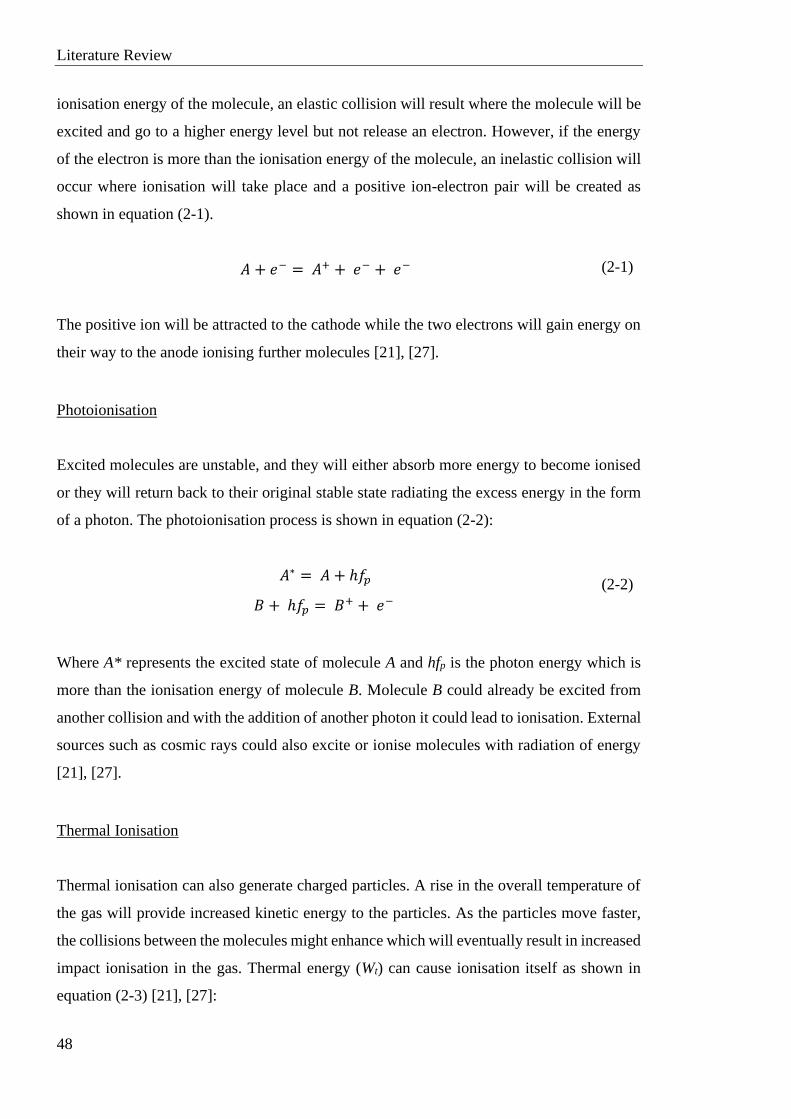
Literature Review
48
ionisation energy of the molecule, an elastic collision will result where the molecule will be
excited and go to a higher energy level but not release an electron. However, if the energy
of the electron is more than the ionisation energy of the molecule, an inelastic collision will
occur where ionisation will take place and a positive ion-electron pair will be created as
shown in equation (2-1).
𝐴 + 𝑒− = 𝐴+ + 𝑒− + 𝑒−
(2-1)
The positive ion will be attracted to the cathode while the two electrons will gain energy on
their way to the anode ionising further molecules [21], [27].
Photoionisation
Excited molecules are unstable, and they will either absorb more energy to become ionised
or they will return back to their original stable state radiating the excess energy in the form
of a photon. The photoionisation process is shown in equation (2-2):
𝐴∗ = 𝐴 + ℎ𝑓𝑝
𝐵 + ℎ𝑓𝑝 = 𝐵+ + 𝑒−
(2-2)
Where A* represents the excited state of molecule A and hfp is the photon energy which is
more than the ionisation energy of molecule B. Molecule B could already be excited from
another collision and with the addition of another photon it could lead to ionisation. External
sources such as cosmic rays could also excite or ionise molecules with radiation of energy
[21], [27].
Thermal Ionisation
Thermal ionisation can also generate charged particles. A rise in the overall temperature of
the gas will provide increased kinetic energy to the particles. As the particles move faster,
the collisions between the molecules might enhance which will eventually result in increased
impact ionisation in the gas. Thermal energy (Wt) can cause ionisation itself as shown in
equation (2-3) [21], [27]:
Literature Review
49
𝐴 + 𝑊𝑡 = 𝐴+ + + 𝑒−
(2-3)
Electron Detachment
Electron detachment is another source of electrons. This process is when an electron might
detach itself from a negative ion forming a neutral molecule and a free electron as shown in
equation (2-4).
𝐴− = 𝐴 + 𝑒−
(2-4)
Even though the number of electrons does not increase in this case, this process could still
be considered as ionisation. This is because when electrons are released free, they can move
much faster than the slow-moving negative ions. Therefore, light-mass electrons can have a
much higher ionisation impact than the heavy-mass negative ion because of their capability
of acquiring greater kinetic energy [21], [27].
Cathode Ionisation Processes
The cathode electrode can also provide a supply of charged particles. In the absence of an
electric field, charged particles are bound to the cathode through electrostatic forces in the
lattice. However, when a minimum specified energy is exceeded (known as work function),
electrons can break free and this value is heavily dependent on the material of the electrode
[21], [27]. The source of energy required to exceed the work function can come from the
following:
• Positive Ion or Excited Molecule Bombardment: If the energy from the impact of a
positive ion on the cathode is equal to or more than twice the cathode work function then
an electron is released. This will result to at least two electrons being released since one
will be used to neutralise the positive ion and the remaining one will be ejected into the
gas medium. Electrons can also be ejected into the gas medium when excited molecules
strike the cathode [21], [27].
• Photoemission: If the energy of a photon that comes in contact with the cathode is more
than the work function then an electron can be emitted from the cathode [21], [27].
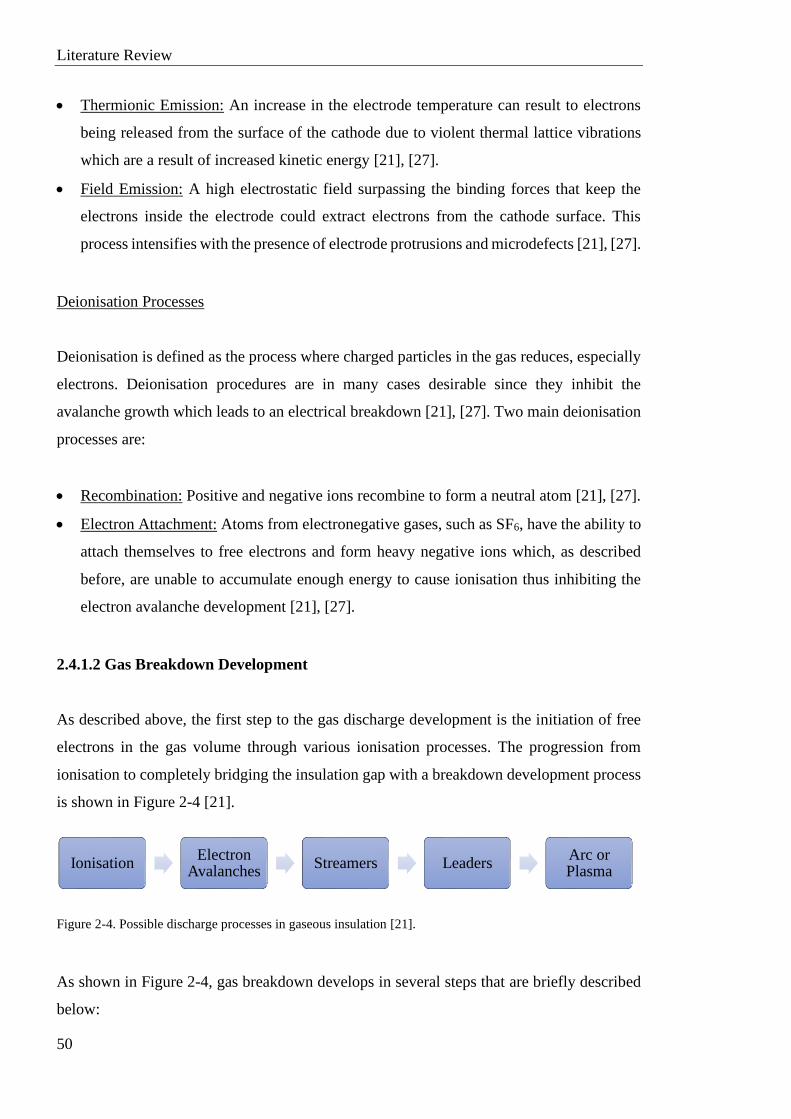
Literature Review
50
• Thermionic Emission: An increase in the electrode temperature can result to electrons
being released from the surface of the cathode due to violent thermal lattice vibrations
which are a result of increased kinetic energy [21], [27].
• Field Emission: A high electrostatic field surpassing the binding forces that keep the
electrons inside the electrode could extract electrons from the cathode surface. This
process intensifies with the presence of electrode protrusions and microdefects [21], [27].
Deionisation Processes
Deionisation is defined as the process where charged particles in the gas reduces, especially
electrons. Deionisation procedures are in many cases desirable since they inhibit the
avalanche growth which leads to an electrical breakdown [21], [27]. Two main deionisation
processes are:
• Recombination: Positive and negative ions recombine to form a neutral atom [21], [27].
• Electron Attachment: Atoms from electronegative gases, such as SF6, have the ability to
attach themselves to free electrons and form heavy negative ions which, as described
before, are unable to accumulate enough energy to cause ionisation thus inhibiting the
electron avalanche development [21], [27].
2.4.1.2 Gas Breakdown Development
As described above, the first step to the gas discharge development is the initiation of free
electrons in the gas volume through various ionisation processes. The progression from
ionisation to completely bridging the insulation gap with a breakdown development process
is shown in Figure 2-4 [21].
Figure 2-4. Possible discharge processes in gaseous insulation [21].
As shown in Figure 2-4, gas breakdown develops in several steps that are briefly described
below:
IonisationElectron
AvalanchesStreamers Leaders
Arc or Plasma
Literature Review
51
1. Ionisation: With the application of an electric field, several ionisation processes take
place in the gas medium to initiate free electrons which accelerate towards the anode
[21], [27], [28].
2. Electron Avalanches: The rate of ionisation is described by the ionisation coefficient (α)
which is defined as the number of ionising collisions made by an electron per unit
distance as it travels in the direction of the applied electric field. When an electronegative
gas is considered, the attachment process is also present in the breakdown development
mechanism. The rate of attachment is described by the attachment coefficient (η) which
is defined as the number of attachments per electron per unit distance. Both processes
depend on the applied electric field, E, and pressure, p. (E/p)crit of a gas represents its
critical electric field (which for SF6 is 89 kV/cm) where α and η are in equilibrium (α =
η). If the electric field applied to the gas is greater than (E/p)crit [E > (E/p)crit] then
ionisation will be higher than attachment (α > η) which will lead to the formation of
electron avalanches. In contrast, if the applied field is less than the critical field [E <
(E/p)crit] then attachment is greater than ionisation (α < η) which leads to the formation
of negative ions that inhibit the electron avalanche development [21], [27], [28].
3. Streamers: As ionisation intensifies and electron avalanches develop, a cloud of less
mobile positive ions is created in the insulating gap. Therefore, a space charge opposing
the applied field is developed between the negatively charged electrons and the
positively charged ions. With the progress of time, the electrons will be absorbed by the
anode leaving the accumulation of positive ions behind. As a side process, excitation of
molecules also occurs from elastic collisions which leads to the emission of photons.
Some of these photons are absorbed by the gas molecules leading to further electrons
being released in the gas at different distances from the main avalanche. At some point,
the space charge electric field will be in the same order of magnitude as the original
applied field, and the distortion of electric field will lead to additional, second-generation
avalanches to be developed. As auxiliary avalanches are formed and the process keeps
repeating, additional generation avalanches will be created which will cause the
branching of the main avalanche to several ones. These positive ion branches, or
channels, are called streamers and it describes the way an electron avalanche develops
from anode to cathode to eventually lead to a breakdown [21], [27], [28].
4. Leaders: Under some experimental conditions, such as high pressures, there is a high
probability of some streamer branches to develop into leaders. As the streamer branches
grow closer to the cathode, ionisation intensity in some of the branches is more than the
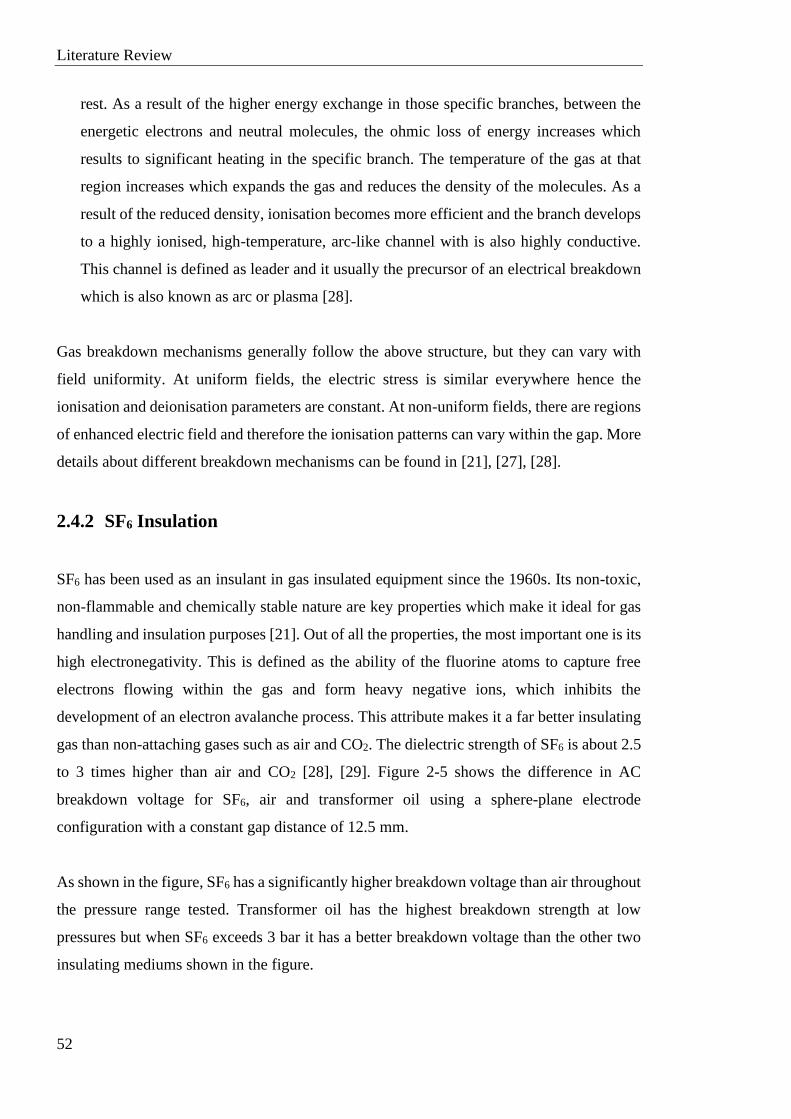
Literature Review
52
rest. As a result of the higher energy exchange in those specific branches, between the
energetic electrons and neutral molecules, the ohmic loss of energy increases which
results to significant heating in the specific branch. The temperature of the gas at that
region increases which expands the gas and reduces the density of the molecules. As a
result of the reduced density, ionisation becomes more efficient and the branch develops
to a highly ionised, high-temperature, arc-like channel with is also highly conductive.
This channel is defined as leader and it usually the precursor of an electrical breakdown
which is also known as arc or plasma [28].
Gas breakdown mechanisms generally follow the above structure, but they can vary with
field uniformity. At uniform fields, the electric stress is similar everywhere hence the
ionisation and deionisation parameters are constant. At non-uniform fields, there are regions
of enhanced electric field and therefore the ionisation patterns can vary within the gap. More
details about different breakdown mechanisms can be found in [21], [27], [28].
2.4.2 SF6 Insulation
SF6 has been used as an insulant in gas insulated equipment since the 1960s. Its non-toxic,
non-flammable and chemically stable nature are key properties which make it ideal for gas
handling and insulation purposes [21]. Out of all the properties, the most important one is its
high electronegativity. This is defined as the ability of the fluorine atoms to capture free
electrons flowing within the gas and form heavy negative ions, which inhibits the
development of an electron avalanche process. This attribute makes it a far better insulating
gas than non-attaching gases such as air and CO2. The dielectric strength of SF6 is about 2.5
to 3 times higher than air and CO2 [28], [29]. Figure 2-5 shows the difference in AC
breakdown voltage for SF6, air and transformer oil using a sphere-plane electrode
configuration with a constant gap distance of 12.5 mm.
As shown in the figure, SF6 has a significantly higher breakdown voltage than air throughout
the pressure range tested. Transformer oil has the highest breakdown strength at low
pressures but when SF6 exceeds 3 bar it has a better breakdown voltage than the other two
insulating mediums shown in the figure.
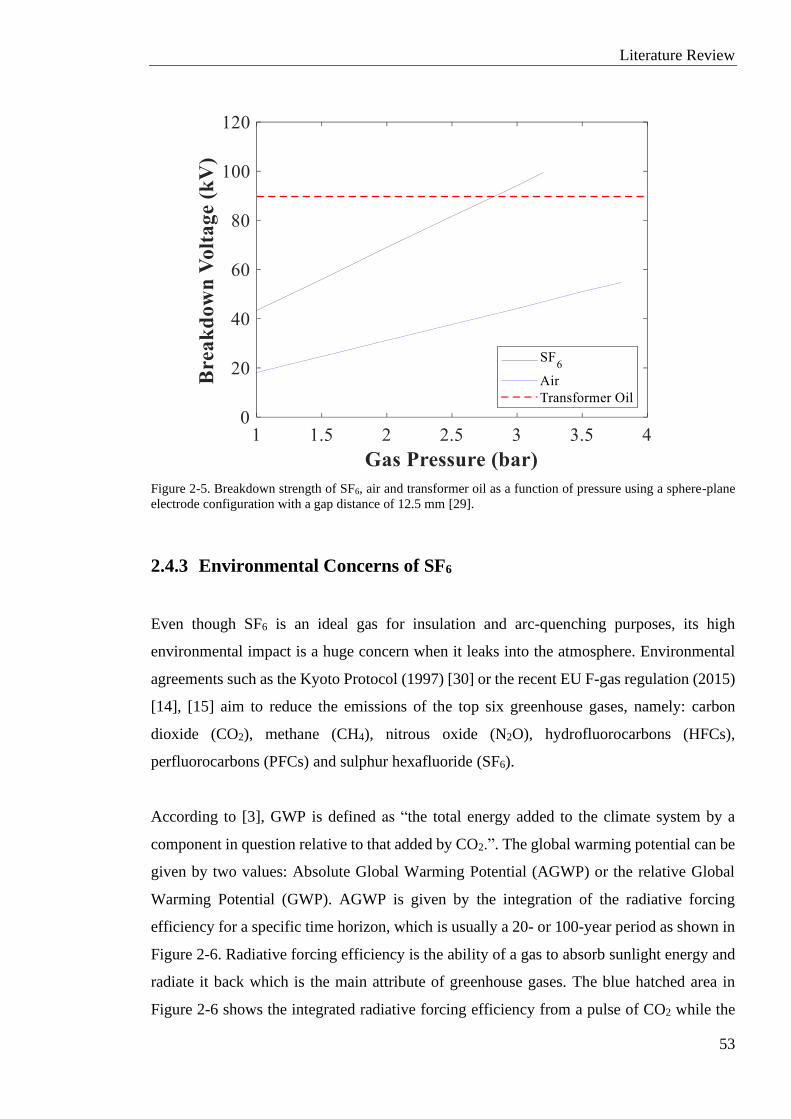
Literature Review
53
Figure 2-5. Breakdown strength of SF6, air and transformer oil as a function of pressure using a sphere-plane
electrode configuration with a gap distance of 12.5 mm [29].
2.4.3 Environmental Concerns of SF6
Even though SF6 is an ideal gas for insulation and arc-quenching purposes, its high
environmental impact is a huge concern when it leaks into the atmosphere. Environmental
agreements such as the Kyoto Protocol (1997) [30] or the recent EU F-gas regulation (2015)
[14], [15] aim to reduce the emissions of the top six greenhouse gases, namely: carbon
dioxide (CO2), methane (CH4), nitrous oxide (N2O), hydrofluorocarbons (HFCs),
perfluorocarbons (PFCs) and sulphur hexafluoride (SF6).
According to [3], GWP is defined as “the total energy added to the climate system by a
component in question relative to that added by CO2.”. The global warming potential can be
given by two values: Absolute Global Warming Potential (AGWP) or the relative Global
Warming Potential (GWP). AGWP is given by the integration of the radiative forcing
efficiency for a specific time horizon, which is usually a 20- or 100-year period as shown in
Figure 2-6. Radiative forcing efficiency is the ability of a gas to absorb sunlight energy and
radiate it back which is the main attribute of greenhouse gases. The blue hatched area in
Figure 2-6 shows the integrated radiative forcing efficiency from a pulse of CO2 while the
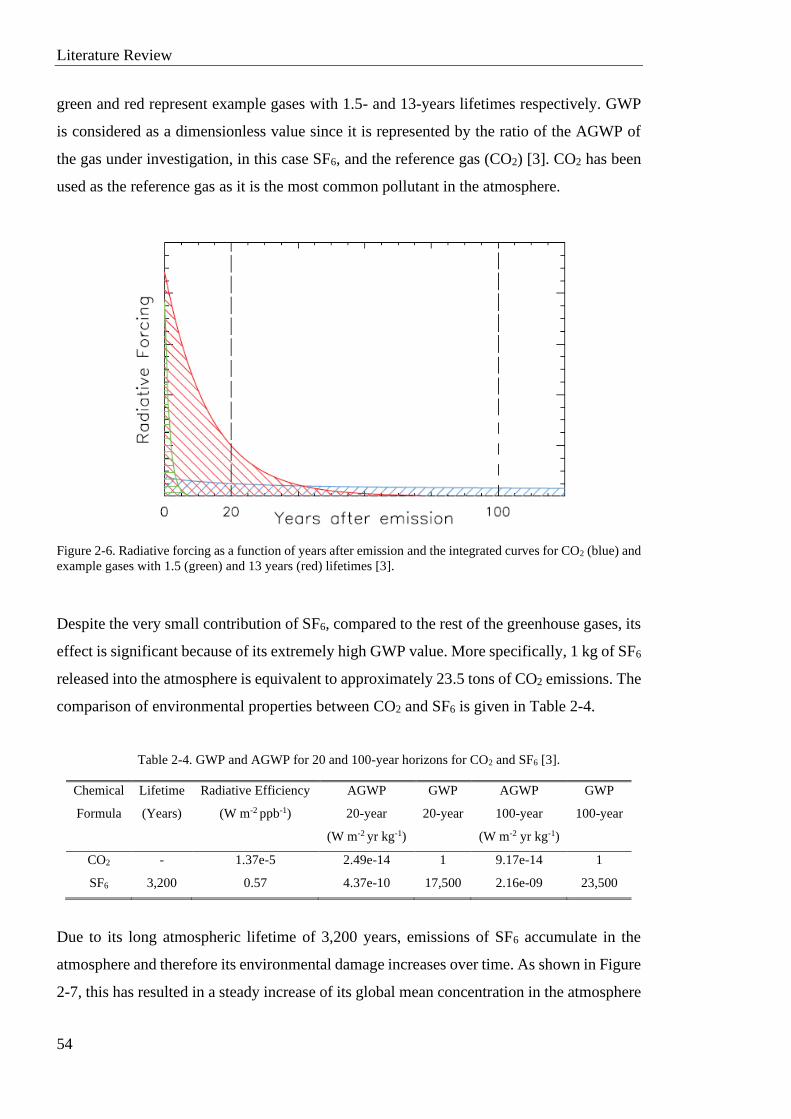
Literature Review
54
green and red represent example gases with 1.5- and 13-years lifetimes respectively. GWP
is considered as a dimensionless value since it is represented by the ratio of the AGWP of
the gas under investigation, in this case SF6, and the reference gas (CO2) [3]. CO2 has been
used as the reference gas as it is the most common pollutant in the atmosphere.
Figure 2-6. Radiative forcing as a function of years after emission and the integrated curves for CO2 (blue) and
example gases with 1.5 (green) and 13 years (red) lifetimes [3].
Despite the very small contribution of SF6, compared to the rest of the greenhouse gases, its
effect is significant because of its extremely high GWP value. More specifically, 1 kg of SF6
released into the atmosphere is equivalent to approximately 23.5 tons of CO2 emissions. The
comparison of environmental properties between CO2 and SF6 is given in Table 2-4.
Table 2-4. GWP and AGWP for 20 and 100-year horizons for CO2 and SF6 [3].
Chemical
Formula
Lifetime
(Years)
Radiative Efficiency
(W m-2 ppb-1)
AGWP
20-year
(W m-2 yr kg-1)
GWP
20-year
AGWP
100-year
(W m-2 yr kg-1)
GWP
100-year
CO2 - 1.37e-5 2.49e-14 1 9.17e-14 1
SF6 3,200 0.57 4.37e-10 17,500 2.16e-09 23,500
Due to its long atmospheric lifetime of 3,200 years, emissions of SF6 accumulate in the
atmosphere and therefore its environmental damage increases over time. As shown in Figure
2-7, this has resulted in a steady increase of its global mean concentration in the atmosphere
Literature Review
55
over the years [4]. Figure 2-7 also shows that from 2010-2015 only, the SF6 concentration
in the atmosphere has increased by more than 20%. In addition, actual SF6 emissions from
developed countries have been found to be at least twice than the reported values [3].
Figure 2-7. Global mean SF6 concentration increase in the atmosphere from 2010 to 2015 [4].
2.4.4 SF6 Alternatives for Insulation Applications
The concerns for the environmental impact of SF6 to the atmosphere have caused its
restriction in several applications. However, SF6 is still widely used in the power industry as
there is no readily available one-for-one replacement candidate. As the power industry is the
main user of SF6, responsible for 80% of the total usage worldwide [4], the initiative to
replace SF6 in high voltage equipment applications has been growing over the past few years.
An ideal SF6 replacement gas should satisfy a strict list of requirements, which include [4]:
• High dielectric strength
• Good arc-quenching capability
• Low boiling point
• High thermal and chemical stability
• Compatibility and no corrosion to the equipment materials
• Non-flammable and non-toxic
• Low environmental impact
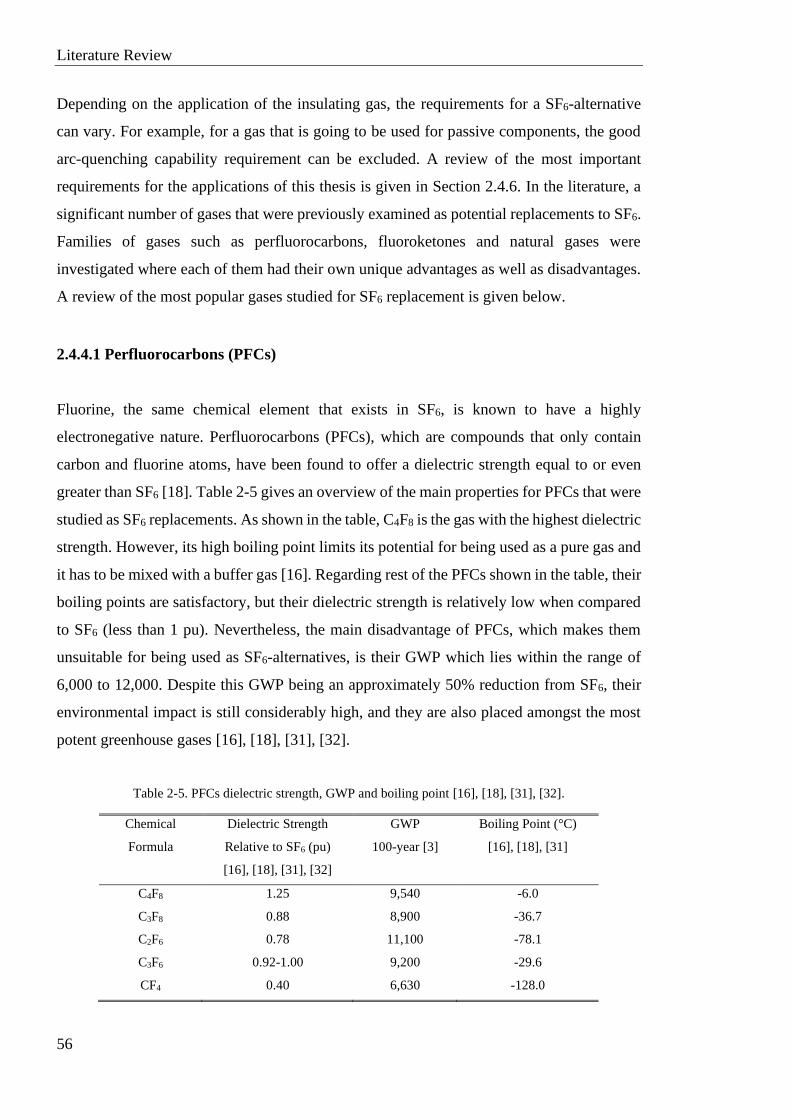
Literature Review
56
Depending on the application of the insulating gas, the requirements for a SF6-alternative
can vary. For example, for a gas that is going to be used for passive components, the good
arc-quenching capability requirement can be excluded. A review of the most important
requirements for the applications of this thesis is given in Section 2.4.6. In the literature, a
significant number of gases that were previously examined as potential replacements to SF6.
Families of gases such as perfluorocarbons, fluoroketones and natural gases were
investigated where each of them had their own unique advantages as well as disadvantages.
A review of the most popular gases studied for SF6 replacement is given below.
2.4.4.1 Perfluorocarbons (PFCs)
Fluorine, the same chemical element that exists in SF6, is known to have a highly
electronegative nature. Perfluorocarbons (PFCs), which are compounds that only contain
carbon and fluorine atoms, have been found to offer a dielectric strength equal to or even
greater than SF6 [18]. Table 2-5 gives an overview of the main properties for PFCs that were
studied as SF6 replacements. As shown in the table, C4F8 is the gas with the highest dielectric
strength. However, its high boiling point limits its potential for being used as a pure gas and
it has to be mixed with a buffer gas [16]. Regarding rest of the PFCs shown in the table, their
boiling points are satisfactory, but their dielectric strength is relatively low when compared
to SF6 (less than 1 pu). Nevertheless, the main disadvantage of PFCs, which makes them
unsuitable for being used as SF6-alternatives, is their GWP which lies within the range of
6,000 to 12,000. Despite this GWP being an approximately 50% reduction from SF6, their
environmental impact is still considerably high, and they are also placed amongst the most
potent greenhouse gases [16], [18], [31], [32].
Table 2-5. PFCs dielectric strength, GWP and boiling point [16], [18], [31], [32].
Chemical
Formula
Dielectric Strength
Relative to SF6 (pu)
[16], [18], [31], [32]
GWP
100-year [3]
Boiling Point (°C)
[16], [18], [31]
C4F8 1.25 9,540 -6.0
C3F8 0.88 8,900 -36.7
C2F6 0.78 11,100 -78.1
C3F6 0.92-1.00 9,200 -29.6
CF4 0.40 6,630 -128.0
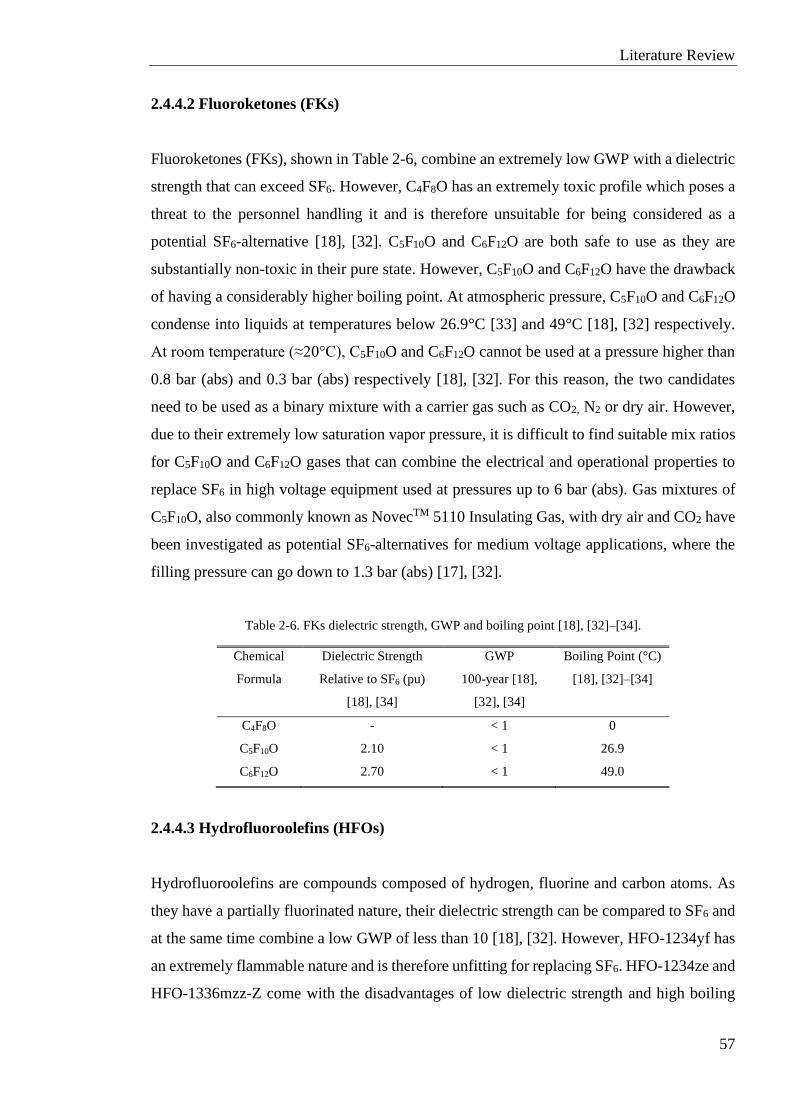
Literature Review
57
2.4.4.2 Fluoroketones (FKs)
Fluoroketones (FKs), shown in Table 2-6, combine an extremely low GWP with a dielectric
strength that can exceed SF6. However, C4F8O has an extremely toxic profile which poses a
threat to the personnel handling it and is therefore unsuitable for being considered as a
potential SF6-alternative [18], [32]. C5F10O and C6F12O are both safe to use as they are
substantially non-toxic in their pure state. However, C5F10O and C6F12O have the drawback
of having a considerably higher boiling point. At atmospheric pressure, C5F10O and C6F12O
condense into liquids at temperatures below 26.9°C [33] and 49°C [18], [32] respectively.
At room temperature (≈20°C), C5F10O and C6F12O cannot be used at a pressure higher than
0.8 bar (abs) and 0.3 bar (abs) respectively [18], [32]. For this reason, the two candidates
need to be used as a binary mixture with a carrier gas such as CO2, N2 or dry air. However,
due to their extremely low saturation vapor pressure, it is difficult to find suitable mix ratios
for C5F10O and C6F12O gases that can combine the electrical and operational properties to
replace SF6 in high voltage equipment used at pressures up to 6 bar (abs). Gas mixtures of
C5F10O, also commonly known as NovecTM 5110 Insulating Gas, with dry air and CO2 have
been investigated as potential SF6-alternatives for medium voltage applications, where the
filling pressure can go down to 1.3 bar (abs) [17], [32].
Table 2-6. FKs dielectric strength, GWP and boiling point [18], [32]–[34].
Chemical
Formula
Dielectric Strength
Relative to SF6 (pu)
[18], [34]
GWP
100-year [18],
[32], [34]
Boiling Point (°C)
[18], [32]–[34]
C4F8O - < 1 0
C5F10O 2.10 < 1 26.9
C6F12O 2.70 < 1 49.0
2.4.4.3 Hydrofluoroolefins (HFOs)
Hydrofluoroolefins are compounds composed of hydrogen, fluorine and carbon atoms. As
they have a partially fluorinated nature, their dielectric strength can be compared to SF6 and
at the same time combine a low GWP of less than 10 [18], [32]. However, HFO-1234yf has
an extremely flammable nature and is therefore unfitting for replacing SF6. HFO-1234ze and
HFO-1336mzz-Z come with the disadvantages of low dielectric strength and high boiling
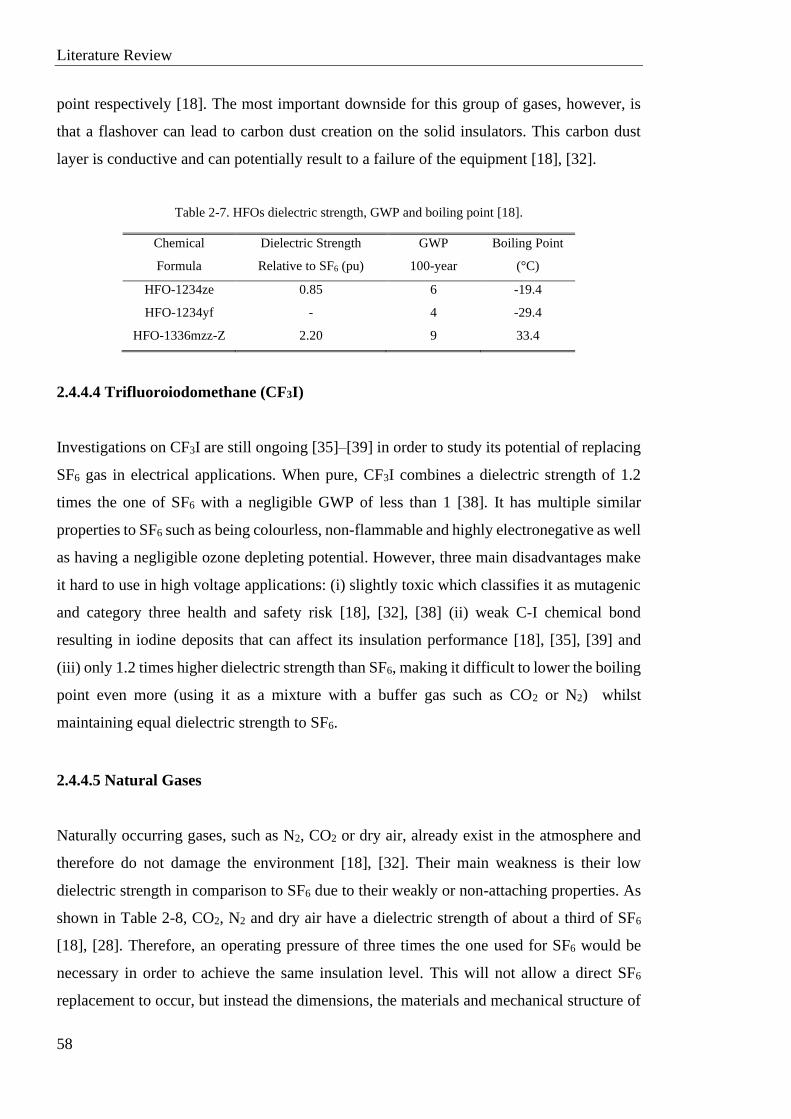
Literature Review
58
point respectively [18]. The most important downside for this group of gases, however, is
that a flashover can lead to carbon dust creation on the solid insulators. This carbon dust
layer is conductive and can potentially result to a failure of the equipment [18], [32].
Table 2-7. HFOs dielectric strength, GWP and boiling point [18].
Chemical
Formula
Dielectric Strength
Relative to SF6 (pu)
GWP
100-year
Boiling Point
(°C)
HFO-1234ze 0.85 6 -19.4
HFO-1234yf - 4 -29.4
HFO-1336mzz-Z 2.20 9 33.4
2.4.4.4 Trifluoroiodomethane (CF3I)
Investigations on CF3I are still ongoing [35]–[39] in order to study its potential of replacing
SF6 gas in electrical applications. When pure, CF3I combines a dielectric strength of 1.2
times the one of SF6 with a negligible GWP of less than 1 [38]. It has multiple similar
properties to SF6 such as being colourless, non-flammable and highly electronegative as well
as having a negligible ozone depleting potential. However, three main disadvantages make
it hard to use in high voltage applications: (i) slightly toxic which classifies it as mutagenic
and category three health and safety risk [18], [32], [38] (ii) weak C-I chemical bond
resulting in iodine deposits that can affect its insulation performance [18], [35], [39] and
(iii) only 1.2 times higher dielectric strength than SF6, making it difficult to lower the boiling
point even more (using it as a mixture with a buffer gas such as CO2 or N2) whilst
maintaining equal dielectric strength to SF6.
2.4.4.5 Natural Gases
Naturally occurring gases, such as N2, CO2 or dry air, already exist in the atmosphere and
therefore do not damage the environment [18], [32]. Their main weakness is their low
dielectric strength in comparison to SF6 due to their weakly or non-attaching properties. As
shown in Table 2-8, CO2, N2 and dry air have a dielectric strength of about a third of SF6
[18], [28]. Therefore, an operating pressure of three times the one used for SF6 would be
necessary in order to achieve the same insulation level. This will not allow a direct SF6
replacement to occur, but instead the dimensions, the materials and mechanical structure of
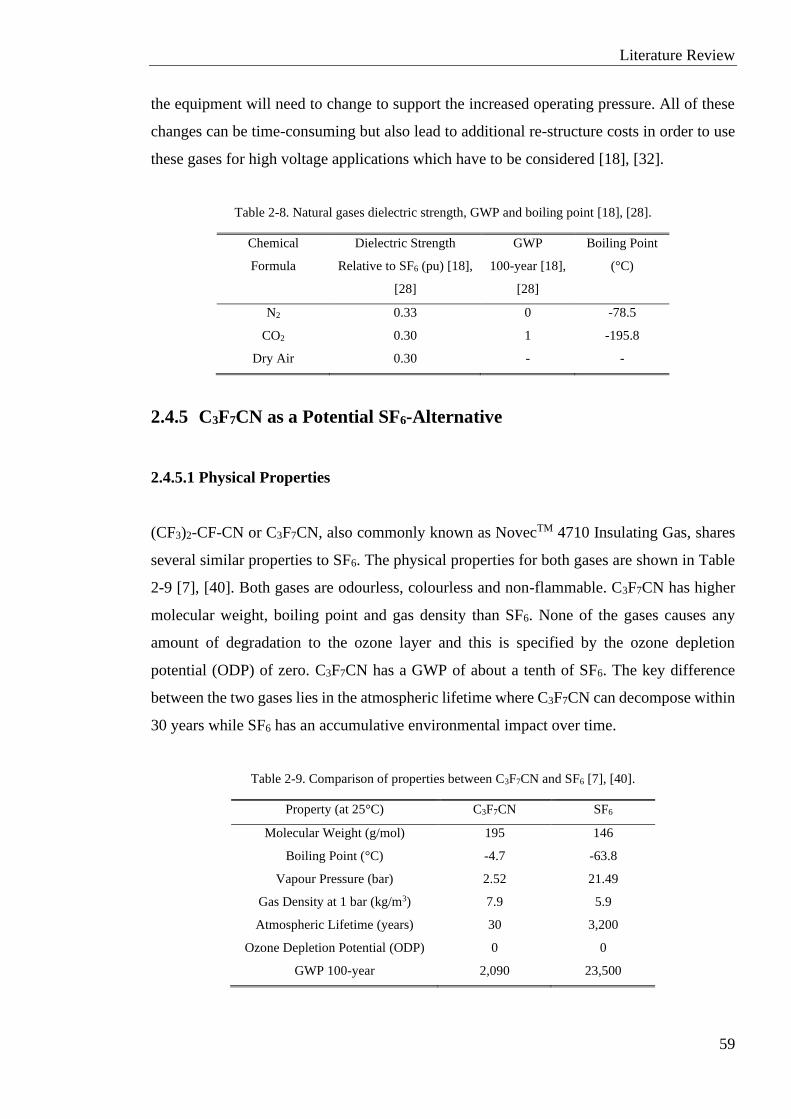
Literature Review
59
the equipment will need to change to support the increased operating pressure. All of these
changes can be time-consuming but also lead to additional re-structure costs in order to use
these gases for high voltage applications which have to be considered [18], [32].
Table 2-8. Natural gases dielectric strength, GWP and boiling point [18], [28].
Chemical
Formula
Dielectric Strength
Relative to SF6 (pu) [18],
[28]
GWP
100-year [18],
[28]
Boiling Point
(°C)
N2 0.33 0 -78.5
CO2 0.30 1 -195.8
Dry Air 0.30 - -
2.4.5 C3F7CN as a Potential SF6-Alternative
2.4.5.1 Physical Properties
(CF3)2-CF-CN or C3F7CN, also commonly known as NovecTM 4710 Insulating Gas, shares
several similar properties to SF6. The physical properties for both gases are shown in Table
2-9 [7], [40]. Both gases are odourless, colourless and non-flammable. C3F7CN has higher
molecular weight, boiling point and gas density than SF6. None of the gases causes any
amount of degradation to the ozone layer and this is specified by the ozone depletion
potential (ODP) of zero. C3F7CN has a GWP of about a tenth of SF6. The key difference
between the two gases lies in the atmospheric lifetime where C3F7CN can decompose within
30 years while SF6 has an accumulative environmental impact over time.
Table 2-9. Comparison of properties between C3F7CN and SF6 [7], [40].
Property (at 25°C) C3F7CN SF6
Molecular Weight (g/mol) 195 146
Boiling Point (°C) -4.7 -63.8
Vapour Pressure (bar) 2.52 21.49
Gas Density at 1 bar (kg/m3) 7.9 5.9
Atmospheric Lifetime (years) 30 3,200
Ozone Depletion Potential (ODP) 0 0
GWP 100-year 2,090 23,500
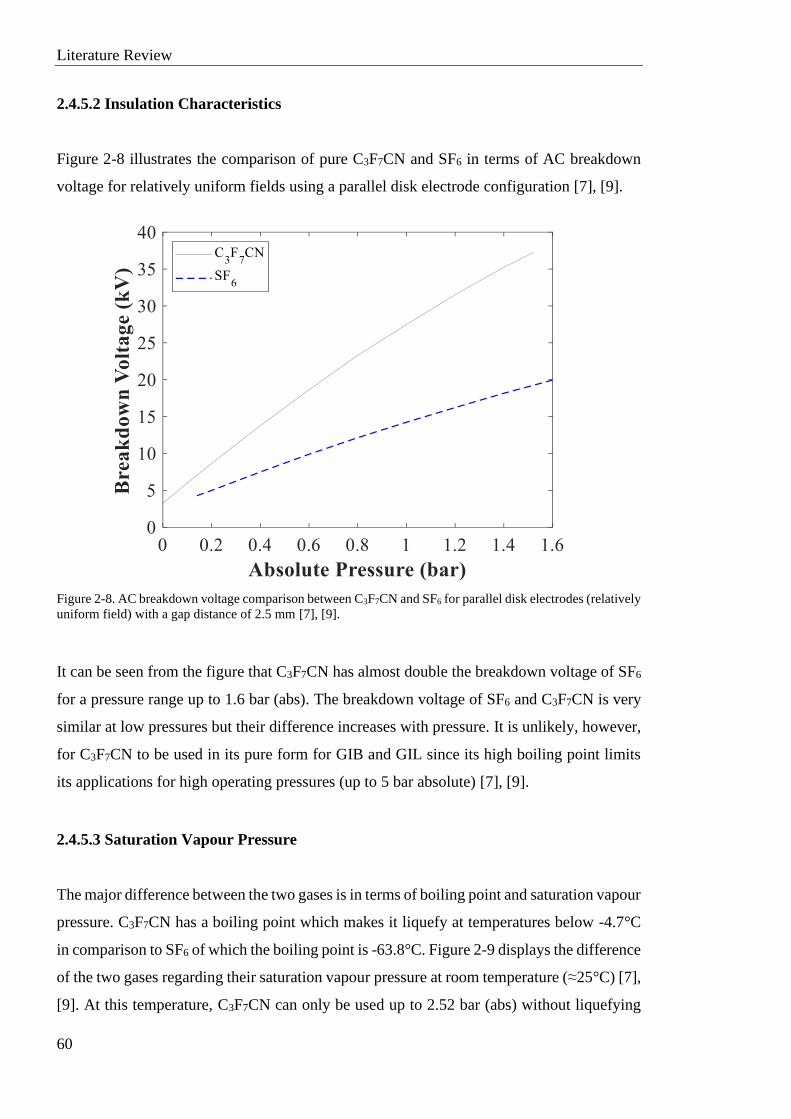
Literature Review
60
2.4.5.2 Insulation Characteristics
Figure 2-8 illustrates the comparison of pure C3F7CN and SF6 in terms of AC breakdown
voltage for relatively uniform fields using a parallel disk electrode configuration [7], [9].
Figure 2-8. AC breakdown voltage comparison between C3F7CN and SF6 for parallel disk electrodes (relatively
uniform field) with a gap distance of 2.5 mm [7], [9].
It can be seen from the figure that C3F7CN has almost double the breakdown voltage of SF6
for a pressure range up to 1.6 bar (abs). The breakdown voltage of SF6 and C3F7CN is very
similar at low pressures but their difference increases with pressure. It is unlikely, however,
for C3F7CN to be used in its pure form for GIB and GIL since its high boiling point limits
its applications for high operating pressures (up to 5 bar absolute) [7], [9].
2.4.5.3 Saturation Vapour Pressure
The major difference between the two gases is in terms of boiling point and saturation vapour
pressure. C3F7CN has a boiling point which makes it liquefy at temperatures below -4.7°C
in comparison to SF6 of which the boiling point is -63.8°C. Figure 2-9 displays the difference
of the two gases regarding their saturation vapour pressure at room temperature (≈25°C) [7],
[9]. At this temperature, C3F7CN can only be used up to 2.52 bar (abs) without liquefying
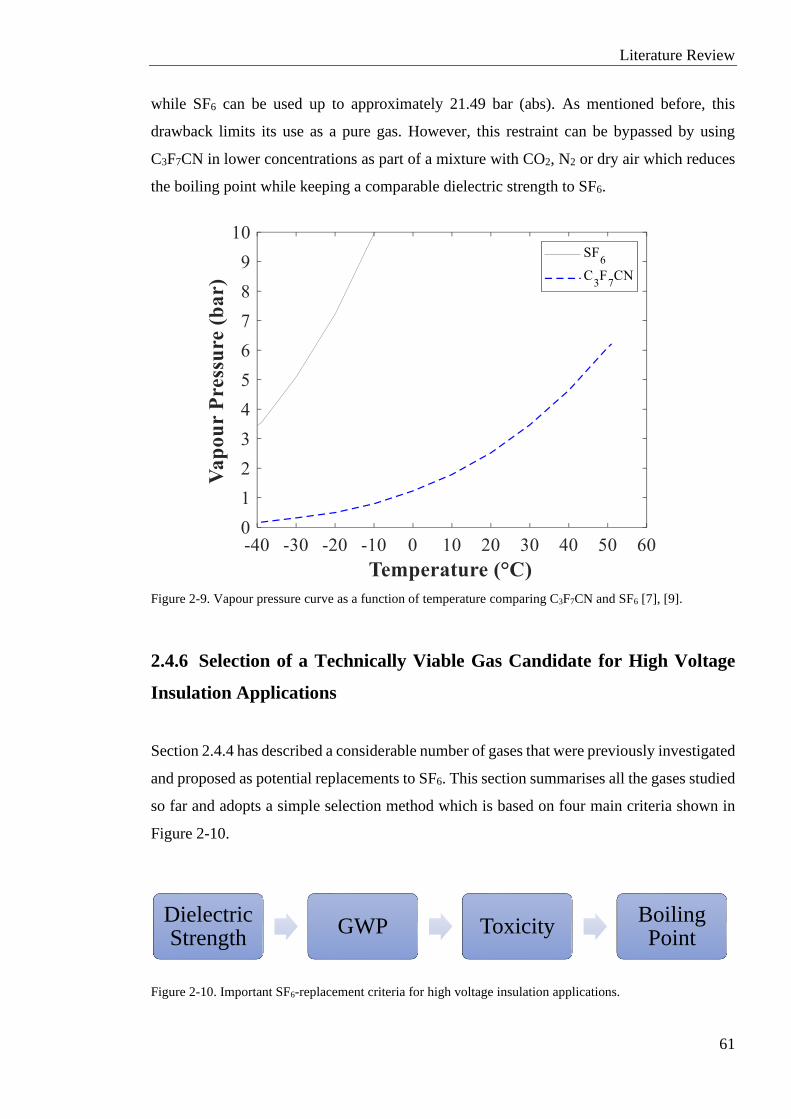
Literature Review
61
while SF6 can be used up to approximately 21.49 bar (abs). As mentioned before, this
drawback limits its use as a pure gas. However, this restraint can be bypassed by using
C3F7CN in lower concentrations as part of a mixture with CO2, N2 or dry air which reduces
the boiling point while keeping a comparable dielectric strength to SF6.
Figure 2-9. Vapour pressure curve as a function of temperature comparing C3F7CN and SF6 [7], [9].
2.4.6 Selection of a Technically Viable Gas Candidate for High Voltage
Insulation Applications
Section 2.4.4 has described a considerable number of gases that were previously investigated
and proposed as potential replacements to SF6. This section summarises all the gases studied
so far and adopts a simple selection method which is based on four main criteria shown in
Figure 2-10.
Figure 2-10. Important SF6-replacement criteria for high voltage insulation applications.
Dielectric Strength
GWP ToxicityBoiling Point
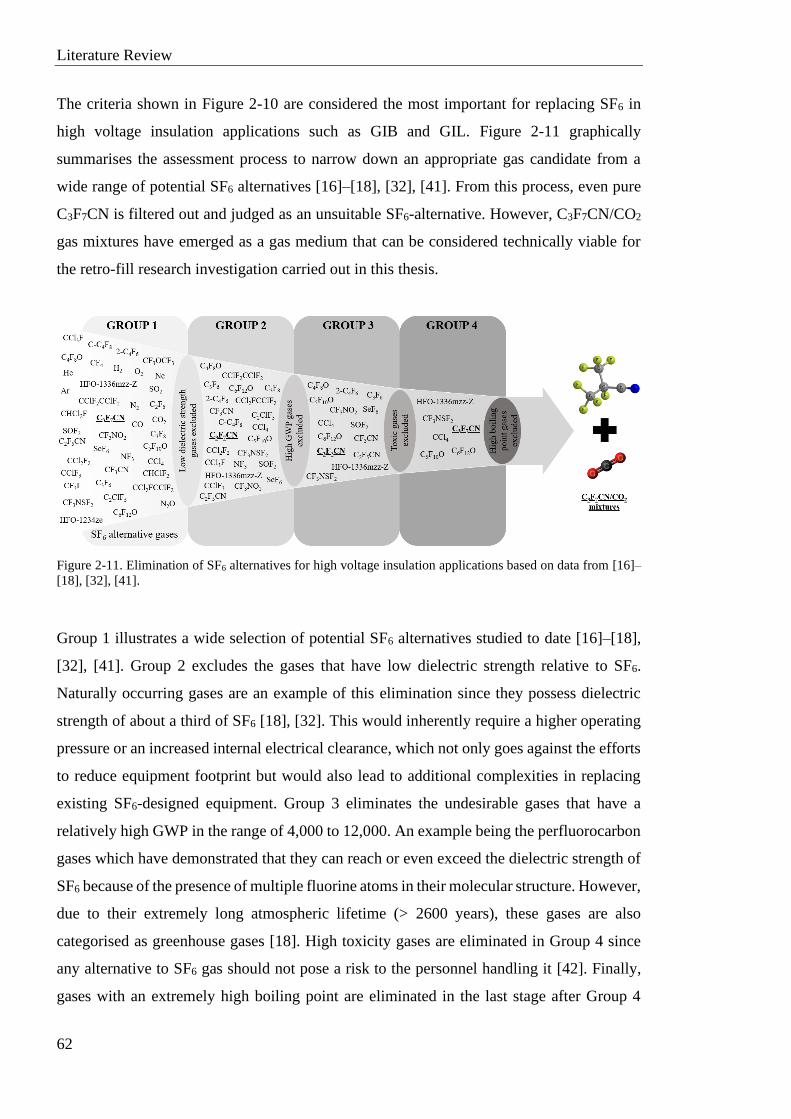
Literature Review
62
The criteria shown in Figure 2-10 are considered the most important for replacing SF6 in
high voltage insulation applications such as GIB and GIL. Figure 2-11 graphically
summarises the assessment process to narrow down an appropriate gas candidate from a
wide range of potential SF6 alternatives [16]–[18], [32], [41]. From this process, even pure
C3F7CN is filtered out and judged as an unsuitable SF6-alternative. However, C3F7CN/CO2
gas mixtures have emerged as a gas medium that can be considered technically viable for
the retro-fill research investigation carried out in this thesis.
Figure 2-11. Elimination of SF6 alternatives for high voltage insulation applications based on data from [16]–
[18], [32], [41].
Group 1 illustrates a wide selection of potential SF6 alternatives studied to date [16]–[18],
[32], [41]. Group 2 excludes the gases that have low dielectric strength relative to SF6.
Naturally occurring gases are an example of this elimination since they possess dielectric
strength of about a third of SF6 [18], [32]. This would inherently require a higher operating
pressure or an increased internal electrical clearance, which not only goes against the efforts
to reduce equipment footprint but would also lead to additional complexities in replacing
existing SF6-designed equipment. Group 3 eliminates the undesirable gases that have a
relatively high GWP in the range of 4,000 to 12,000. An example being the perfluorocarbon
gases which have demonstrated that they can reach or even exceed the dielectric strength of
SF6 because of the presence of multiple fluorine atoms in their molecular structure. However,
due to their extremely long atmospheric lifetime (> 2600 years), these gases are also
categorised as greenhouse gases [18]. High toxicity gases are eliminated in Group 4 since
any alternative to SF6 gas should not pose a risk to the personnel handling it [42]. Finally,
gases with an extremely high boiling point are eliminated in the last stage after Group 4
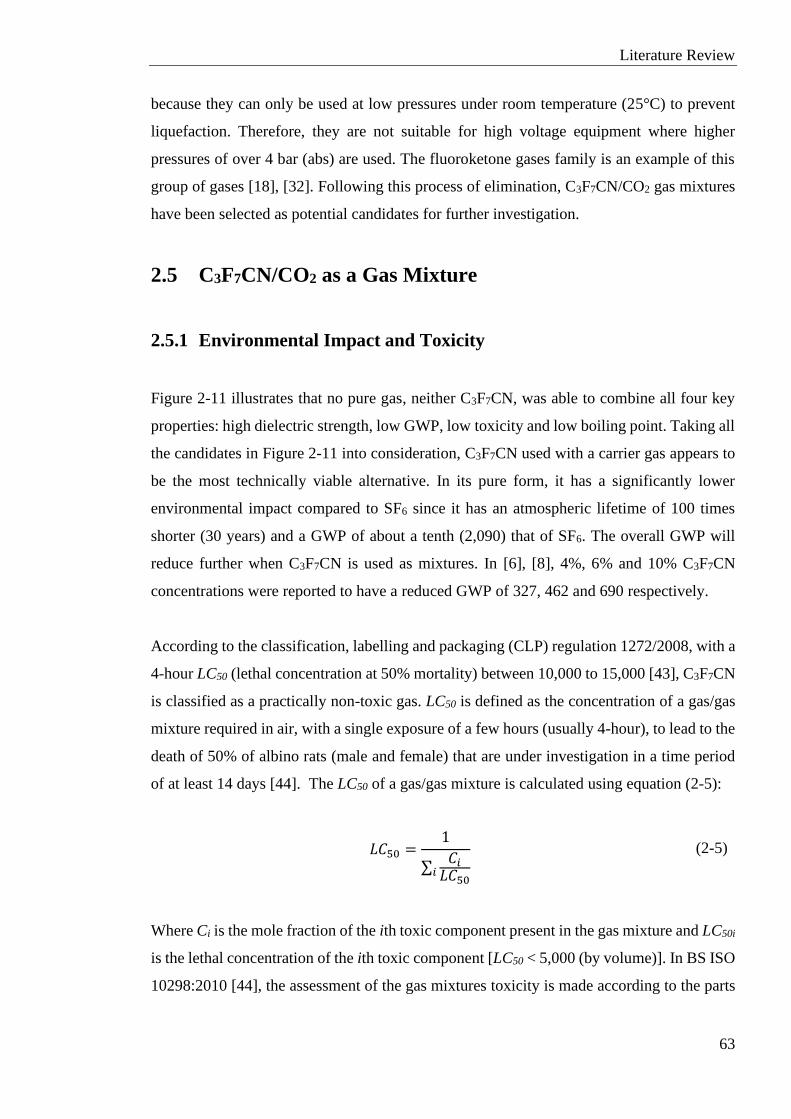
Literature Review
63
because they can only be used at low pressures under room temperature (25°C) to prevent
liquefaction. Therefore, they are not suitable for high voltage equipment where higher
pressures of over 4 bar (abs) are used. The fluoroketone gases family is an example of this
group of gases [18], [32]. Following this process of elimination, C3F7CN/CO2 gas mixtures
have been selected as potential candidates for further investigation.
2.5 C3F7CN/CO2 as a Gas Mixture
2.5.1 Environmental Impact and Toxicity
Figure 2-11 illustrates that no pure gas, neither C3F7CN, was able to combine all four key
properties: high dielectric strength, low GWP, low toxicity and low boiling point. Taking all
the candidates in Figure 2-11 into consideration, C3F7CN used with a carrier gas appears to
be the most technically viable alternative. In its pure form, it has a significantly lower
environmental impact compared to SF6 since it has an atmospheric lifetime of 100 times
shorter (30 years) and a GWP of about a tenth (2,090) that of SF6. The overall GWP will
reduce further when C3F7CN is used as mixtures. In [6], [8], 4%, 6% and 10% C3F7CN
concentrations were reported to have a reduced GWP of 327, 462 and 690 respectively.
According to the classification, labelling and packaging (CLP) regulation 1272/2008, with a
4-hour LC50 (lethal concentration at 50% mortality) between 10,000 to 15,000 [43], C3F7CN
is classified as a practically non-toxic gas. LC50 is defined as the concentration of a gas/gas
mixture required in air, with a single exposure of a few hours (usually 4-hour), to lead to the
death of 50% of albino rats (male and female) that are under investigation in a time period
of at least 14 days [44]. The LC50 of a gas/gas mixture is calculated using equation (2-5):
𝐿𝐶50 =1
∑𝐶𝑖
𝐿𝐶50𝑖
(2-5)
Where Ci is the mole fraction of the ith toxic component present in the gas mixture and LC50i
is the lethal concentration of the ith toxic component [LC50 < 5,000 (by volume)]. In BS ISO
10298:2010 [44], the assessment of the gas mixtures toxicity is made according to the parts

Literature Review
64
per million (ppm) by volume value of LC50. Figures 2-12 and 2-13 show the toxicity and
inhalation toxicity values respectively that assess how harmful a gas mixture is.
Figure 2-12. Toxicity subdivisions of gas mixtures from non-toxic (subdivision 1) to very toxic (subdivision
3) for 1-hour exposure LC50 values [44] .
Figure 2-13. Toxicity inhalation categories from fatal (category 1) to harmful (category 4) for 4-hour exposure
LC50 values[44].
Subdivision 1
• Non-toxic
• LC50 > 5,000 ppm (volume fraction)
Subdivision 2
• Toxic
• 200 ppm < LC50 ≤ 5,000 ppm (volume fraction)
Subdivision 3
• Very toxic
• LC50 ≤ 200 ppm (volume fraction)
Category 1
• Fatal if inhaled
• 0 ppm < LC50 ≤ 100 ppm (volume fraction)
Category 2
• Fatal if inhaled
• 100 ppm < LC50 ≤ 500 ppm (volume fraction)
Category 3
• Toxic if inhaled
• 500 ppm < LC50 ≤ 2,500 ppm (volume fraction)
Category 4
• Harfmul if inhaled
• 2,500 ppm < LC50 ≤ 20,000 ppm (volume fraction)
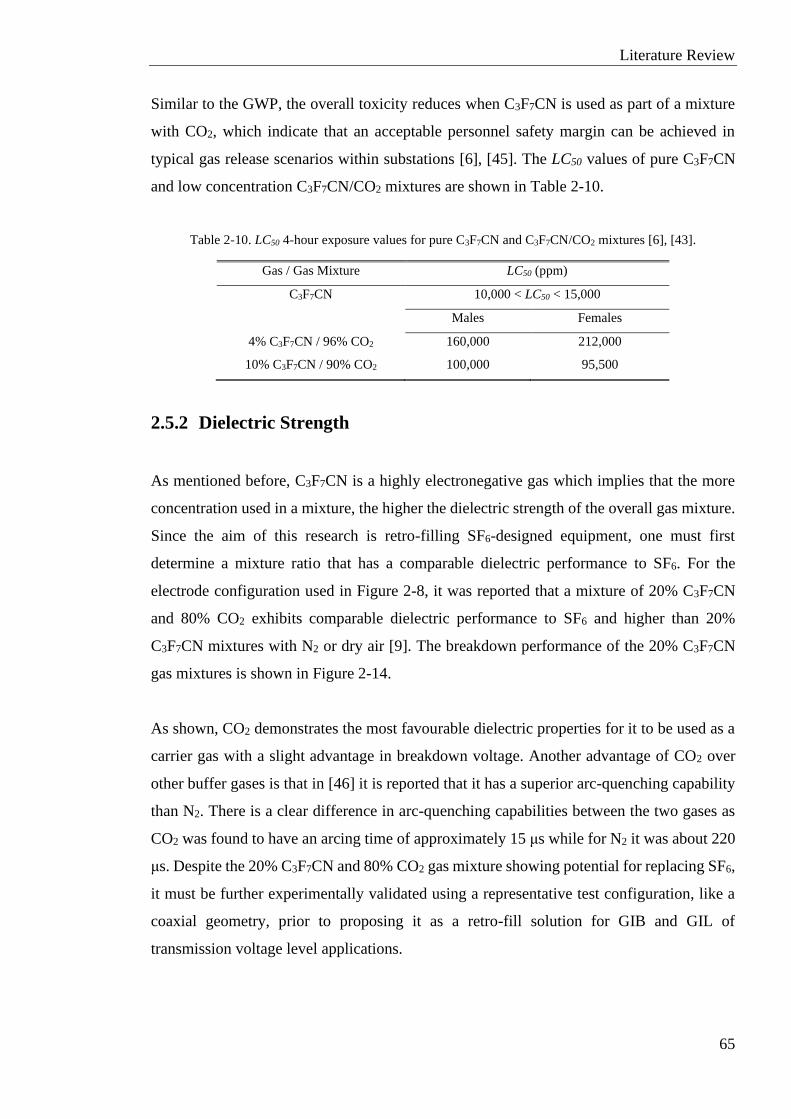
Literature Review
65
Similar to the GWP, the overall toxicity reduces when C3F7CN is used as part of a mixture
with CO2, which indicate that an acceptable personnel safety margin can be achieved in
typical gas release scenarios within substations [6], [45]. The LC50 values of pure C3F7CN
and low concentration C3F7CN/CO2 mixtures are shown in Table 2-10.
Table 2-10. LC50 4-hour exposure values for pure C3F7CN and C3F7CN/CO2 mixtures [6], [43].
Gas / Gas Mixture LC50 (ppm)
C3F7CN 10,000 < LC50 < 15,000
Males Females
4% C3F7CN / 96% CO2 160,000 212,000
10% C3F7CN / 90% CO2 100,000 95,500
2.5.2 Dielectric Strength
As mentioned before, C3F7CN is a highly electronegative gas which implies that the more
concentration used in a mixture, the higher the dielectric strength of the overall gas mixture.
Since the aim of this research is retro-filling SF6-designed equipment, one must first
determine a mixture ratio that has a comparable dielectric performance to SF6. For the
electrode configuration used in Figure 2-8, it was reported that a mixture of 20% C3F7CN
and 80% CO2 exhibits comparable dielectric performance to SF6 and higher than 20%
C3F7CN mixtures with N2 or dry air [9]. The breakdown performance of the 20% C3F7CN
gas mixtures is shown in Figure 2-14.
As shown, CO2 demonstrates the most favourable dielectric properties for it to be used as a
carrier gas with a slight advantage in breakdown voltage. Another advantage of CO2 over
other buffer gases is that in [46] it is reported that it has a superior arc-quenching capability
than N2. There is a clear difference in arc-quenching capabilities between the two gases as
CO2 was found to have an arcing time of approximately 15 μs while for N2 it was about 220
μs. Despite the 20% C3F7CN and 80% CO2 gas mixture showing potential for replacing SF6,
it must be further experimentally validated using a representative test configuration, like a
coaxial geometry, prior to proposing it as a retro-fill solution for GIB and GIL of
transmission voltage level applications.
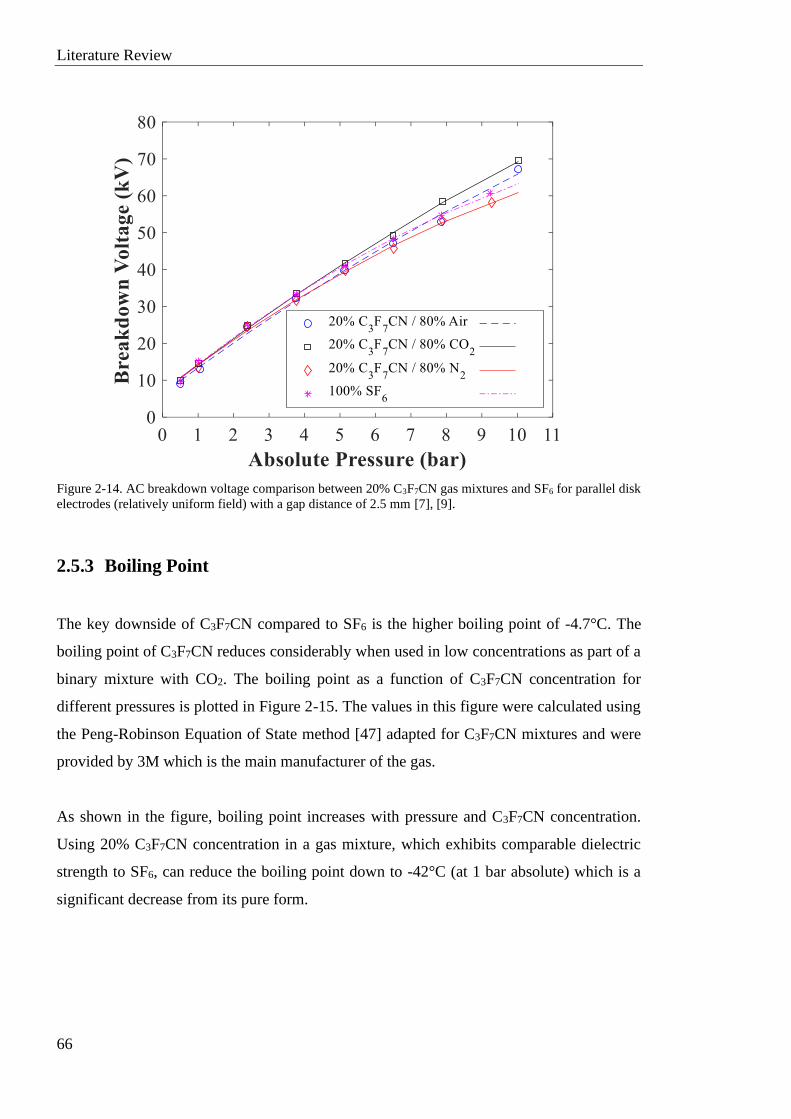
Literature Review
66
Figure 2-14. AC breakdown voltage comparison between 20% C3F7CN gas mixtures and SF6 for parallel disk
electrodes (relatively uniform field) with a gap distance of 2.5 mm [7], [9].
2.5.3 Boiling Point
The key downside of C3F7CN compared to SF6 is the higher boiling point of -4.7°C. The
boiling point of C3F7CN reduces considerably when used in low concentrations as part of a
binary mixture with CO2. The boiling point as a function of C3F7CN concentration for
different pressures is plotted in Figure 2-15. The values in this figure were calculated using
the Peng-Robinson Equation of State method [47] adapted for C3F7CN mixtures and were
provided by 3M which is the main manufacturer of the gas.
As shown in the figure, boiling point increases with pressure and C3F7CN concentration.
Using 20% C3F7CN concentration in a gas mixture, which exhibits comparable dielectric
strength to SF6, can reduce the boiling point down to -42°C (at 1 bar absolute) which is a
significant decrease from its pure form.
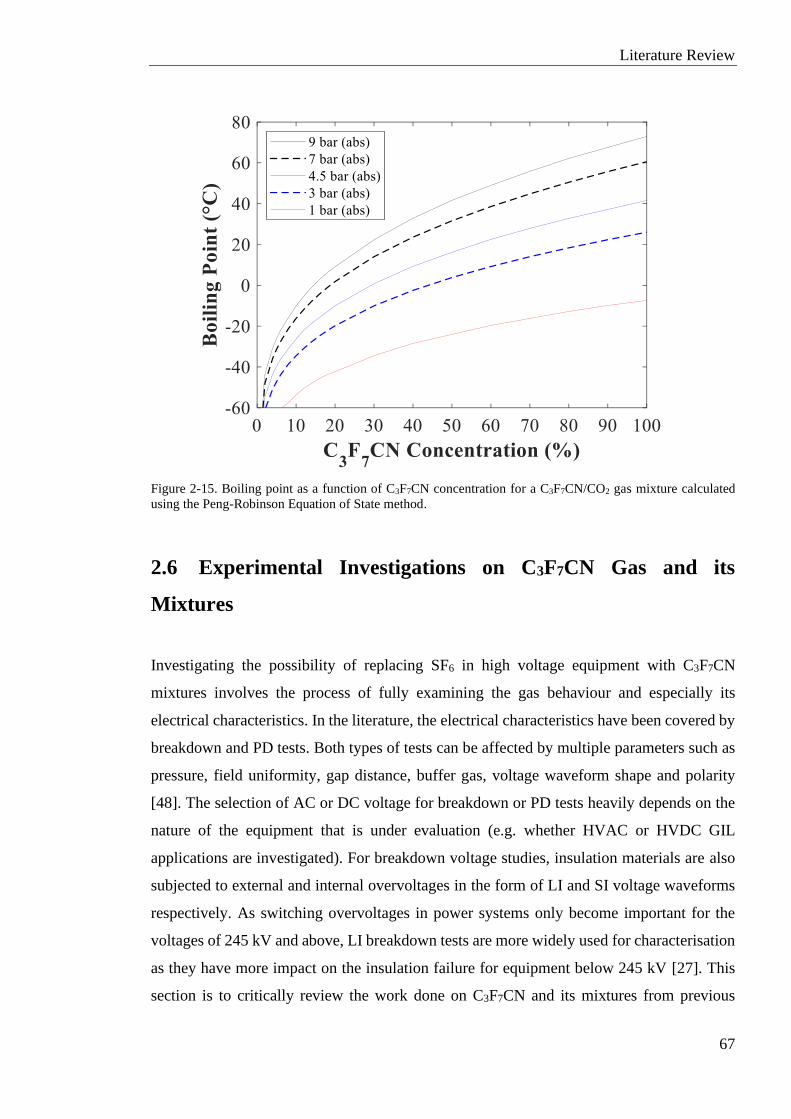
Literature Review
67
Figure 2-15. Boiling point as a function of C3F7CN concentration for a C3F7CN/CO2 gas mixture calculated
using the Peng-Robinson Equation of State method.
2.6 Experimental Investigations on C3F7CN Gas and its
Mixtures
Investigating the possibility of replacing SF6 in high voltage equipment with C3F7CN
mixtures involves the process of fully examining the gas behaviour and especially its
electrical characteristics. In the literature, the electrical characteristics have been covered by
breakdown and PD tests. Both types of tests can be affected by multiple parameters such as
pressure, field uniformity, gap distance, buffer gas, voltage waveform shape and polarity
[48]. The selection of AC or DC voltage for breakdown or PD tests heavily depends on the
nature of the equipment that is under evaluation (e.g. whether HVAC or HVDC GIL
applications are investigated). For breakdown voltage studies, insulation materials are also
subjected to external and internal overvoltages in the form of LI and SI voltage waveforms
respectively. As switching overvoltages in power systems only become important for the
voltages of 245 kV and above, LI breakdown tests are more widely used for characterisation
as they have more impact on the insulation failure for equipment below 245 kV [27]. This
section is to critically review the work done on C3F7CN and its mixtures from previous
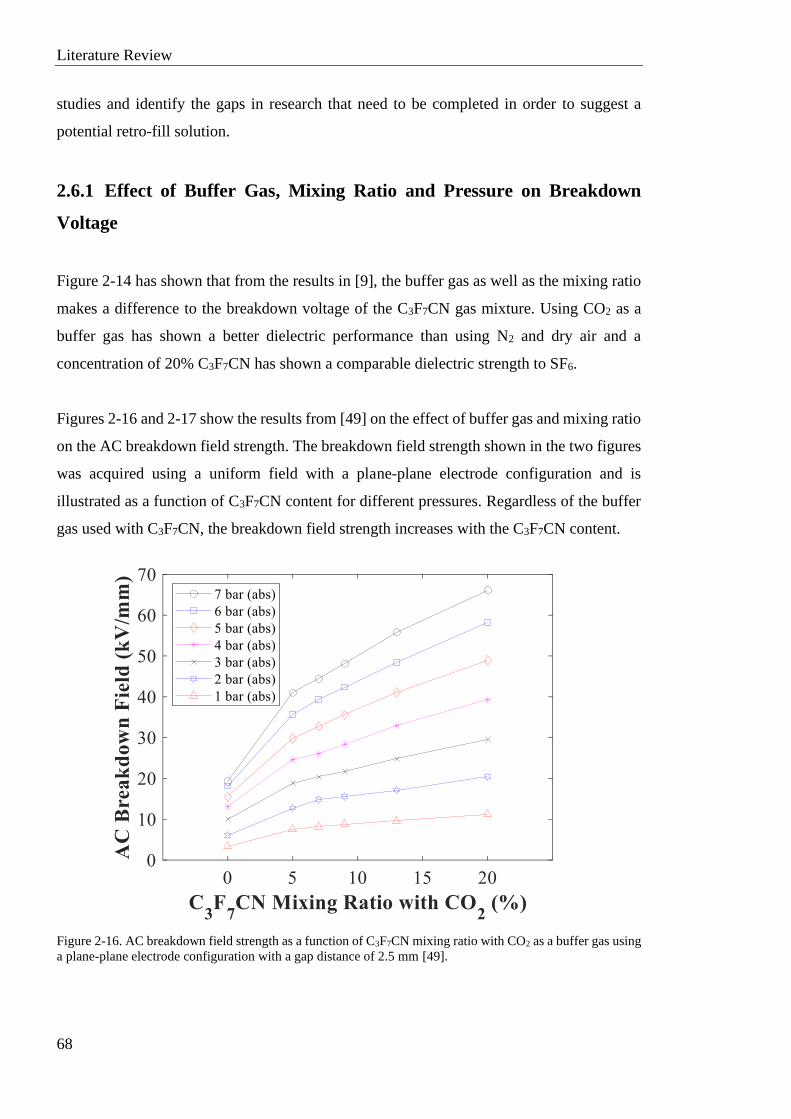
Literature Review
68
studies and identify the gaps in research that need to be completed in order to suggest a
potential retro-fill solution.
2.6.1 Effect of Buffer Gas, Mixing Ratio and Pressure on Breakdown
Voltage
Figure 2-14 has shown that from the results in [9], the buffer gas as well as the mixing ratio
makes a difference to the breakdown voltage of the C3F7CN gas mixture. Using CO2 as a
buffer gas has shown a better dielectric performance than using N2 and dry air and a
concentration of 20% C3F7CN has shown a comparable dielectric strength to SF6.
Figures 2-16 and 2-17 show the results from [49] on the effect of buffer gas and mixing ratio
on the AC breakdown field strength. The breakdown field strength shown in the two figures
was acquired using a uniform field with a plane-plane electrode configuration and is
illustrated as a function of C3F7CN content for different pressures. Regardless of the buffer
gas used with C3F7CN, the breakdown field strength increases with the C3F7CN content.
Figure 2-16. AC breakdown field strength as a function of C3F7CN mixing ratio with CO2 as a buffer gas using
a plane-plane electrode configuration with a gap distance of 2.5 mm [49].
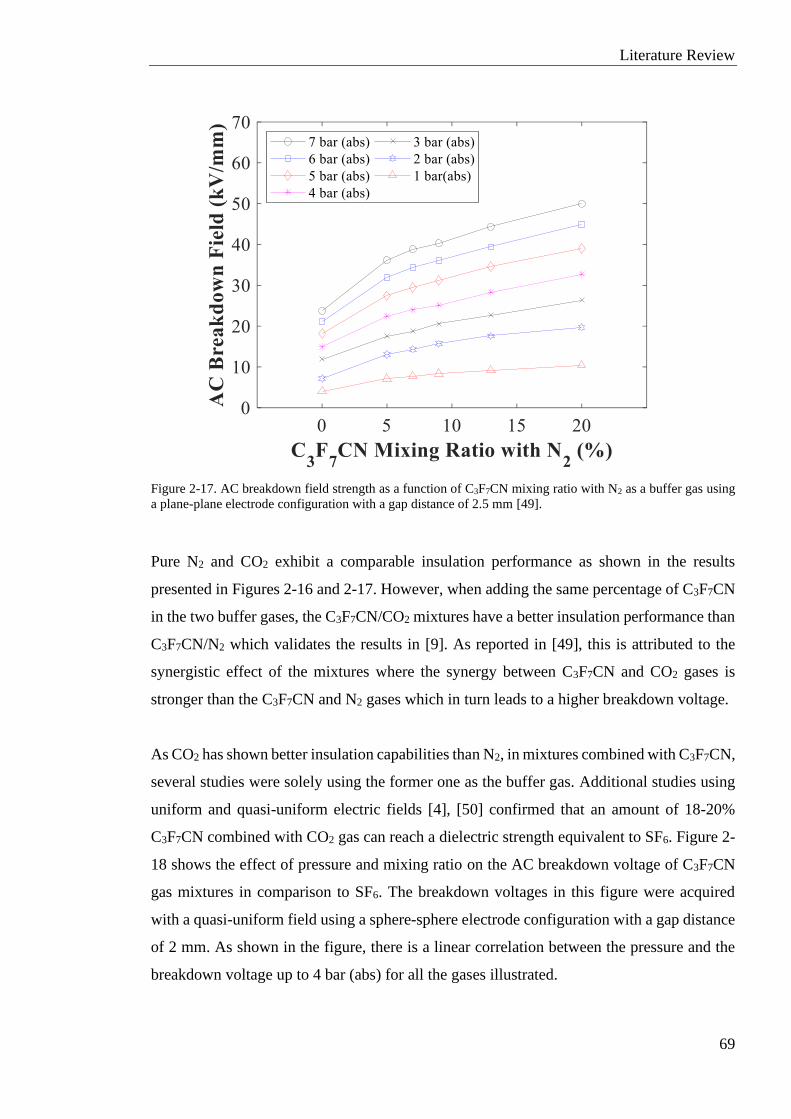
Literature Review
69
Figure 2-17. AC breakdown field strength as a function of C3F7CN mixing ratio with N2 as a buffer gas using
a plane-plane electrode configuration with a gap distance of 2.5 mm [49].
Pure N2 and CO2 exhibit a comparable insulation performance as shown in the results
presented in Figures 2-16 and 2-17. However, when adding the same percentage of C3F7CN
in the two buffer gases, the C3F7CN/CO2 mixtures have a better insulation performance than
C3F7CN/N2 which validates the results in [9]. As reported in [49], this is attributed to the
synergistic effect of the mixtures where the synergy between C3F7CN and CO2 gases is
stronger than the C3F7CN and N2 gases which in turn leads to a higher breakdown voltage.
As CO2 has shown better insulation capabilities than N2, in mixtures combined with C3F7CN,
several studies were solely using the former one as the buffer gas. Additional studies using
uniform and quasi-uniform electric fields [4], [50] confirmed that an amount of 18-20%
C3F7CN combined with CO2 gas can reach a dielectric strength equivalent to SF6. Figure 2-
18 shows the effect of pressure and mixing ratio on the AC breakdown voltage of C3F7CN
gas mixtures in comparison to SF6. The breakdown voltages in this figure were acquired
with a quasi-uniform field using a sphere-sphere electrode configuration with a gap distance
of 2 mm. As shown in the figure, there is a linear correlation between the pressure and the
breakdown voltage up to 4 bar (abs) for all the gases illustrated.
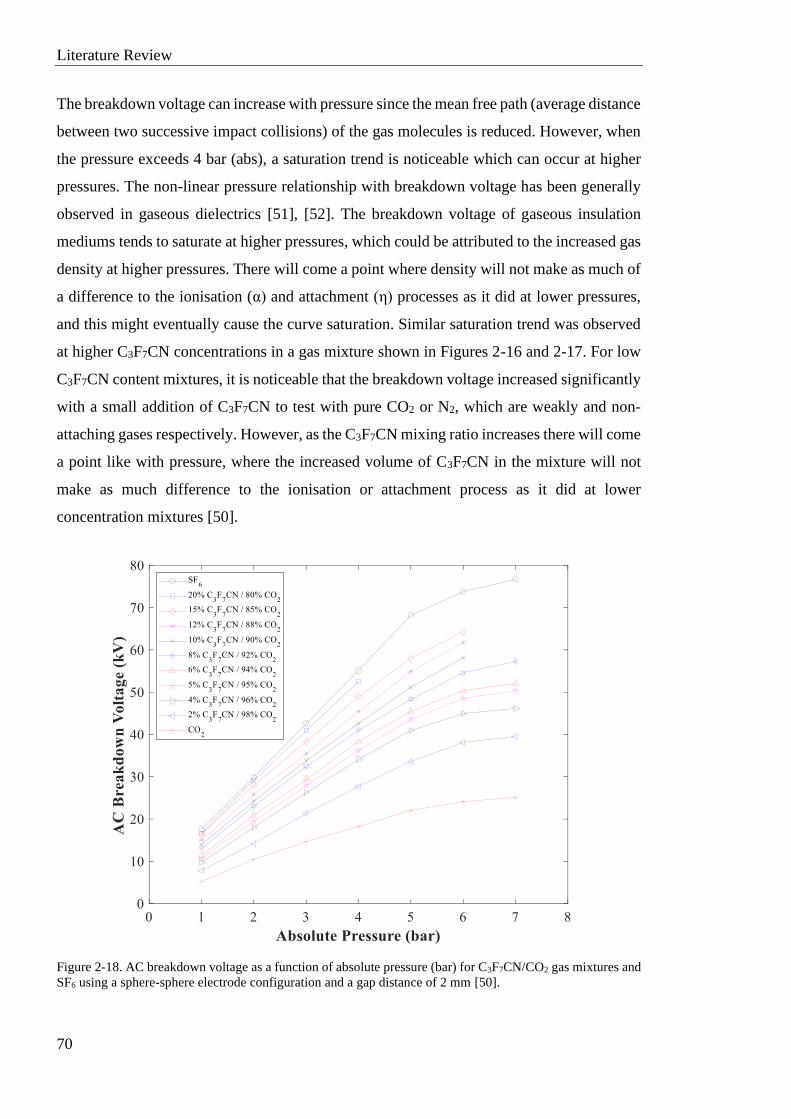
Literature Review
70
The breakdown voltage can increase with pressure since the mean free path (average distance
between two successive impact collisions) of the gas molecules is reduced. However, when
the pressure exceeds 4 bar (abs), a saturation trend is noticeable which can occur at higher
pressures. The non-linear pressure relationship with breakdown voltage has been generally
observed in gaseous dielectrics [51], [52]. The breakdown voltage of gaseous insulation
mediums tends to saturate at higher pressures, which could be attributed to the increased gas
density at higher pressures. There will come a point where density will not make as much of
a difference to the ionisation (α) and attachment (η) processes as it did at lower pressures,
and this might eventually cause the curve saturation. Similar saturation trend was observed
at higher C3F7CN concentrations in a gas mixture shown in Figures 2-16 and 2-17. For low
C3F7CN content mixtures, it is noticeable that the breakdown voltage increased significantly
with a small addition of C3F7CN to test with pure CO2 or N2, which are weakly and non-
attaching gases respectively. However, as the C3F7CN mixing ratio increases there will come
a point like with pressure, where the increased volume of C3F7CN in the mixture will not
make as much difference to the ionisation or attachment process as it did at lower
concentration mixtures [50].
Figure 2-18. AC breakdown voltage as a function of absolute pressure (bar) for C3F7CN/CO2 gas mixtures and
SF6 using a sphere-sphere electrode configuration and a gap distance of 2 mm [50].
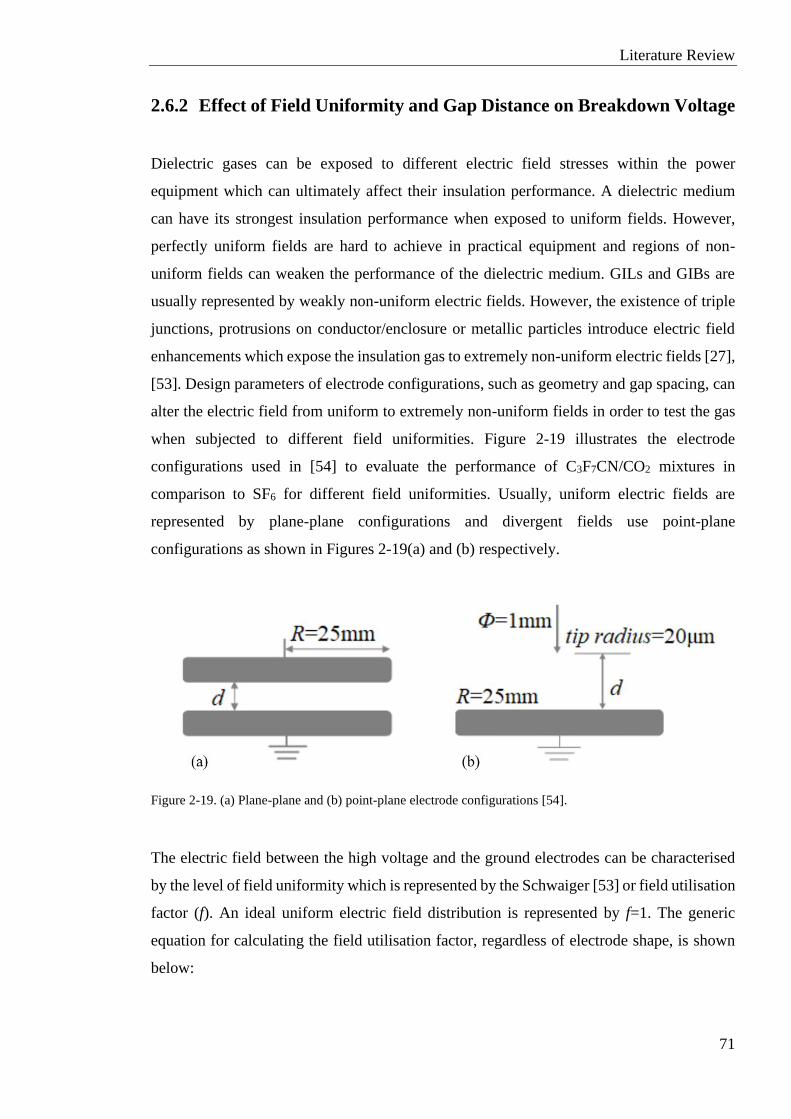
Literature Review
71
2.6.2 Effect of Field Uniformity and Gap Distance on Breakdown Voltage
Dielectric gases can be exposed to different electric field stresses within the power
equipment which can ultimately affect their insulation performance. A dielectric medium
can have its strongest insulation performance when exposed to uniform fields. However,
perfectly uniform fields are hard to achieve in practical equipment and regions of non-
uniform fields can weaken the performance of the dielectric medium. GILs and GIBs are
usually represented by weakly non-uniform electric fields. However, the existence of triple
junctions, protrusions on conductor/enclosure or metallic particles introduce electric field
enhancements which expose the insulation gas to extremely non-uniform electric fields [27],
[53]. Design parameters of electrode configurations, such as geometry and gap spacing, can
alter the electric field from uniform to extremely non-uniform fields in order to test the gas
when subjected to different field uniformities. Figure 2-19 illustrates the electrode
configurations used in [54] to evaluate the performance of C3F7CN/CO2 mixtures in
comparison to SF6 for different field uniformities. Usually, uniform electric fields are
represented by plane-plane configurations and divergent fields use point-plane
configurations as shown in Figures 2-19(a) and (b) respectively.
Figure 2-19. (a) Plane-plane and (b) point-plane electrode configurations [54].
The electric field between the high voltage and the ground electrodes can be characterised
by the level of field uniformity which is represented by the Schwaiger [53] or field utilisation
factor (f). An ideal uniform electric field distribution is represented by f=1. The generic
equation for calculating the field utilisation factor, regardless of electrode shape, is shown
below:
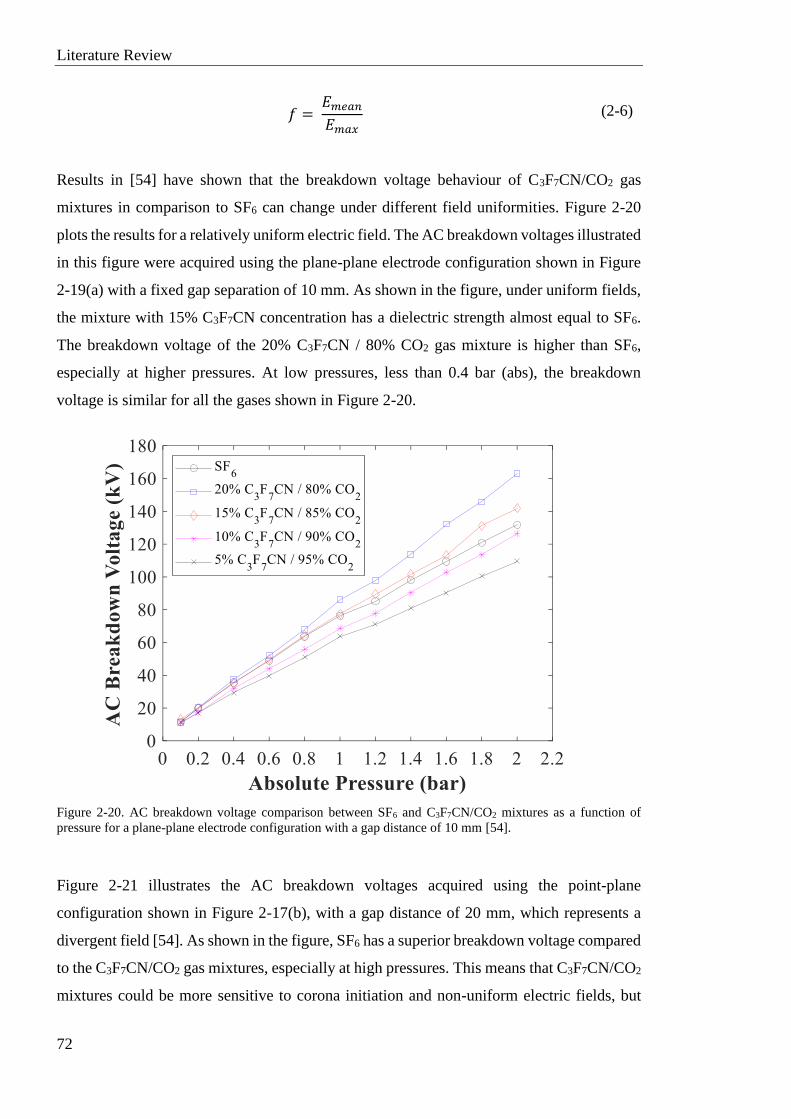
Literature Review
72
𝑓 = 𝐸𝑚𝑒𝑎𝑛
𝐸𝑚𝑎𝑥
(2-6)
Results in [54] have shown that the breakdown voltage behaviour of C3F7CN/CO2 gas
mixtures in comparison to SF6 can change under different field uniformities. Figure 2-20
plots the results for a relatively uniform electric field. The AC breakdown voltages illustrated
in this figure were acquired using the plane-plane electrode configuration shown in Figure
2-19(a) with a fixed gap separation of 10 mm. As shown in the figure, under uniform fields,
the mixture with 15% C3F7CN concentration has a dielectric strength almost equal to SF6.
The breakdown voltage of the 20% C3F7CN / 80% CO2 gas mixture is higher than SF6,
especially at higher pressures. At low pressures, less than 0.4 bar (abs), the breakdown
voltage is similar for all the gases shown in Figure 2-20.
Figure 2-20. AC breakdown voltage comparison between SF6 and C3F7CN/CO2 mixtures as a function of
pressure for a plane-plane electrode configuration with a gap distance of 10 mm [54].
Figure 2-21 illustrates the AC breakdown voltages acquired using the point-plane
configuration shown in Figure 2-17(b), with a gap distance of 20 mm, which represents a
divergent field [54]. As shown in the figure, SF6 has a superior breakdown voltage compared
to the C3F7CN/CO2 gas mixtures, especially at high pressures. This means that C3F7CN/CO2
mixtures could be more sensitive to corona initiation and non-uniform electric fields, but
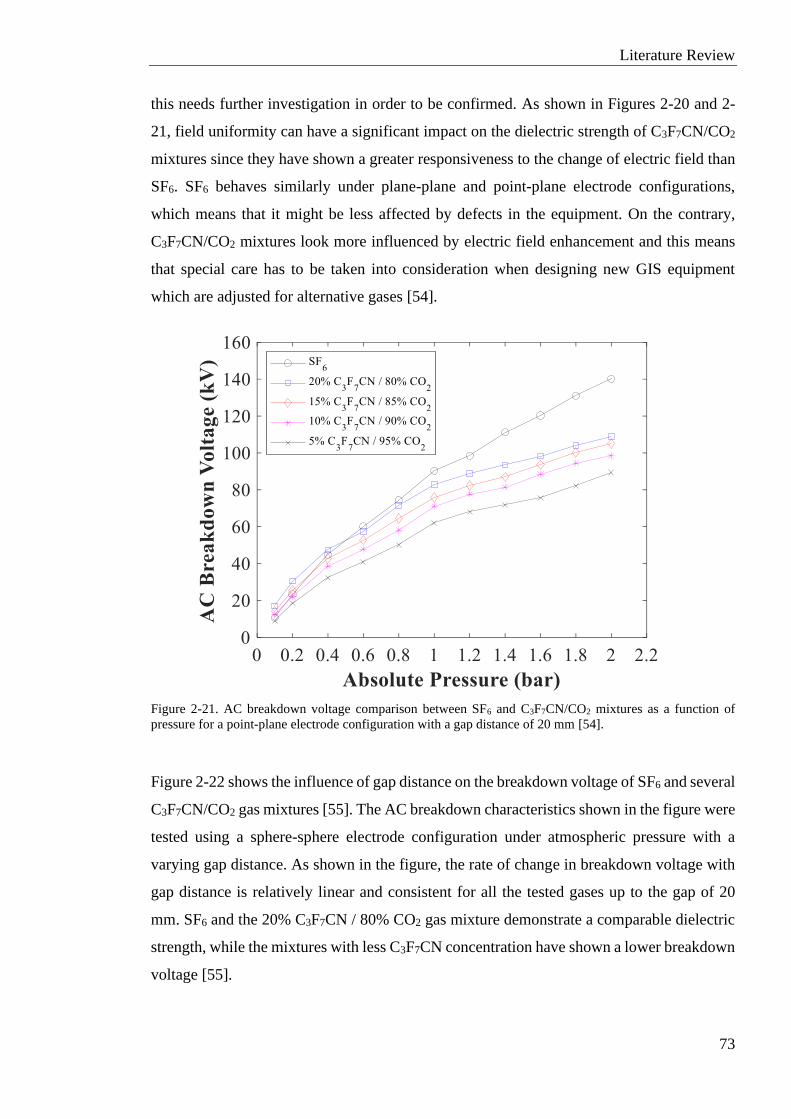
Literature Review
73
this needs further investigation in order to be confirmed. As shown in Figures 2-20 and 2-
21, field uniformity can have a significant impact on the dielectric strength of C3F7CN/CO2
mixtures since they have shown a greater responsiveness to the change of electric field than
SF6. SF6 behaves similarly under plane-plane and point-plane electrode configurations,
which means that it might be less affected by defects in the equipment. On the contrary,
C3F7CN/CO2 mixtures look more influenced by electric field enhancement and this means
that special care has to be taken into consideration when designing new GIS equipment
which are adjusted for alternative gases [54].
Figure 2-21. AC breakdown voltage comparison between SF6 and C3F7CN/CO2 mixtures as a function of
pressure for a point-plane electrode configuration with a gap distance of 20 mm [54].
Figure 2-22 shows the influence of gap distance on the breakdown voltage of SF6 and several
C3F7CN/CO2 gas mixtures [55]. The AC breakdown characteristics shown in the figure were
tested using a sphere-sphere electrode configuration under atmospheric pressure with a
varying gap distance. As shown in the figure, the rate of change in breakdown voltage with
gap distance is relatively linear and consistent for all the tested gases up to the gap of 20
mm. SF6 and the 20% C3F7CN / 80% CO2 gas mixture demonstrate a comparable dielectric
strength, while the mixtures with less C3F7CN concentration have shown a lower breakdown
voltage [55].
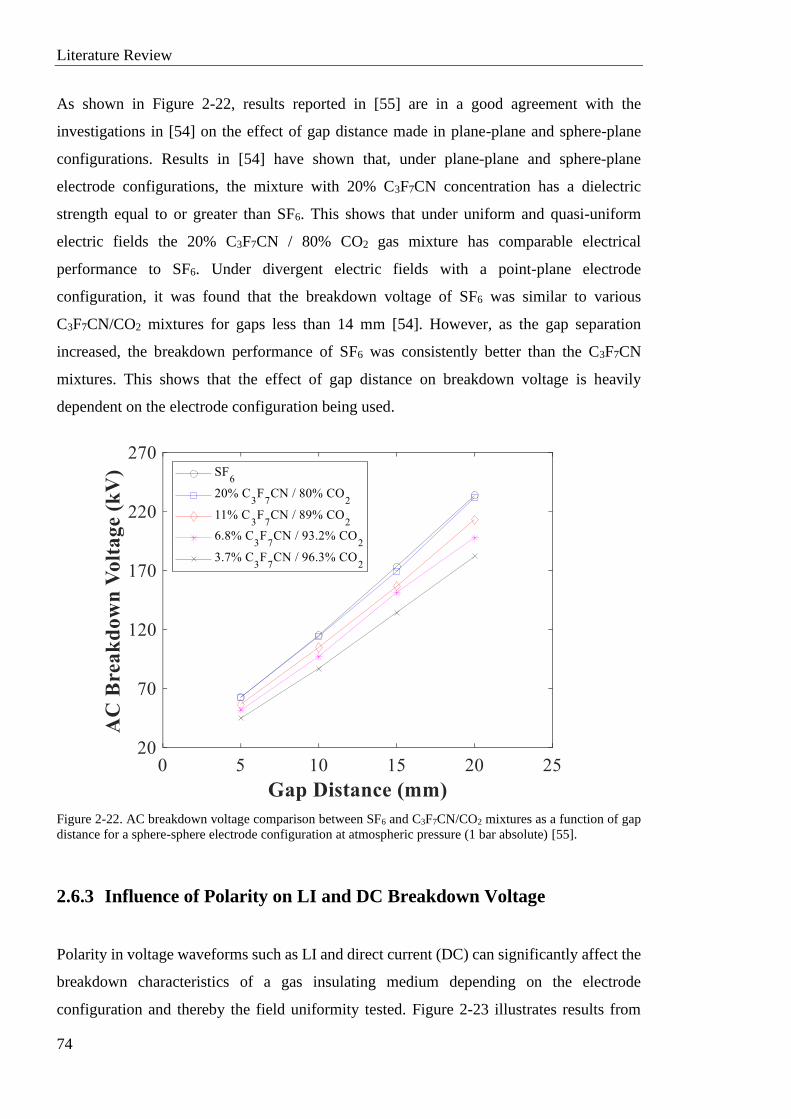
Literature Review
74
As shown in Figure 2-22, results reported in [55] are in a good agreement with the
investigations in [54] on the effect of gap distance made in plane-plane and sphere-plane
configurations. Results in [54] have shown that, under plane-plane and sphere-plane
electrode configurations, the mixture with 20% C3F7CN concentration has a dielectric
strength equal to or greater than SF6. This shows that under uniform and quasi-uniform
electric fields the 20% C3F7CN / 80% CO2 gas mixture has comparable electrical
performance to SF6. Under divergent electric fields with a point-plane electrode
configuration, it was found that the breakdown voltage of SF6 was similar to various
C3F7CN/CO2 mixtures for gaps less than 14 mm [54]. However, as the gap separation
increased, the breakdown performance of SF6 was consistently better than the C3F7CN
mixtures. This shows that the effect of gap distance on breakdown voltage is heavily
dependent on the electrode configuration being used.
Figure 2-22. AC breakdown voltage comparison between SF6 and C3F7CN/CO2 mixtures as a function of gap
distance for a sphere-sphere electrode configuration at atmospheric pressure (1 bar absolute) [55].
2.6.3 Influence of Polarity on LI and DC Breakdown Voltage
Polarity in voltage waveforms such as LI and direct current (DC) can significantly affect the
breakdown characteristics of a gas insulating medium depending on the electrode
configuration and thereby the field uniformity tested. Figure 2-23 illustrates results from
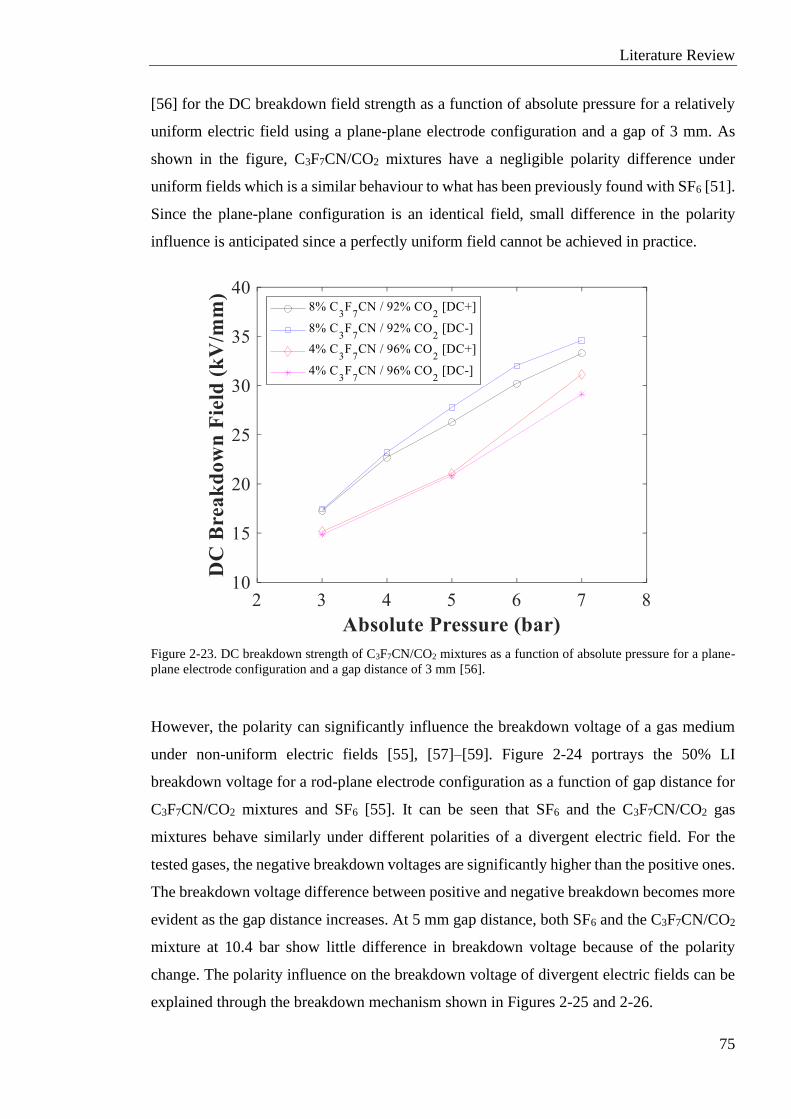
Literature Review
75
[56] for the DC breakdown field strength as a function of absolute pressure for a relatively
uniform electric field using a plane-plane electrode configuration and a gap of 3 mm. As
shown in the figure, C3F7CN/CO2 mixtures have a negligible polarity difference under
uniform fields which is a similar behaviour to what has been previously found with SF6 [51].
Since the plane-plane configuration is an identical field, small difference in the polarity
influence is anticipated since a perfectly uniform field cannot be achieved in practice.
Figure 2-23. DC breakdown strength of C3F7CN/CO2 mixtures as a function of absolute pressure for a plane-
plane electrode configuration and a gap distance of 3 mm [56].
However, the polarity can significantly influence the breakdown voltage of a gas medium
under non-uniform electric fields [55], [57]–[59]. Figure 2-24 portrays the 50% LI
breakdown voltage for a rod-plane electrode configuration as a function of gap distance for
C3F7CN/CO2 mixtures and SF6 [55]. It can be seen that SF6 and the C3F7CN/CO2 gas
mixtures behave similarly under different polarities of a divergent electric field. For the
tested gases, the negative breakdown voltages are significantly higher than the positive ones.
The breakdown voltage difference between positive and negative breakdown becomes more
evident as the gap distance increases. At 5 mm gap distance, both SF6 and the C3F7CN/CO2
mixture at 10.4 bar show little difference in breakdown voltage because of the polarity
change. The polarity influence on the breakdown voltage of divergent electric fields can be
explained through the breakdown mechanism shown in Figures 2-25 and 2-26.
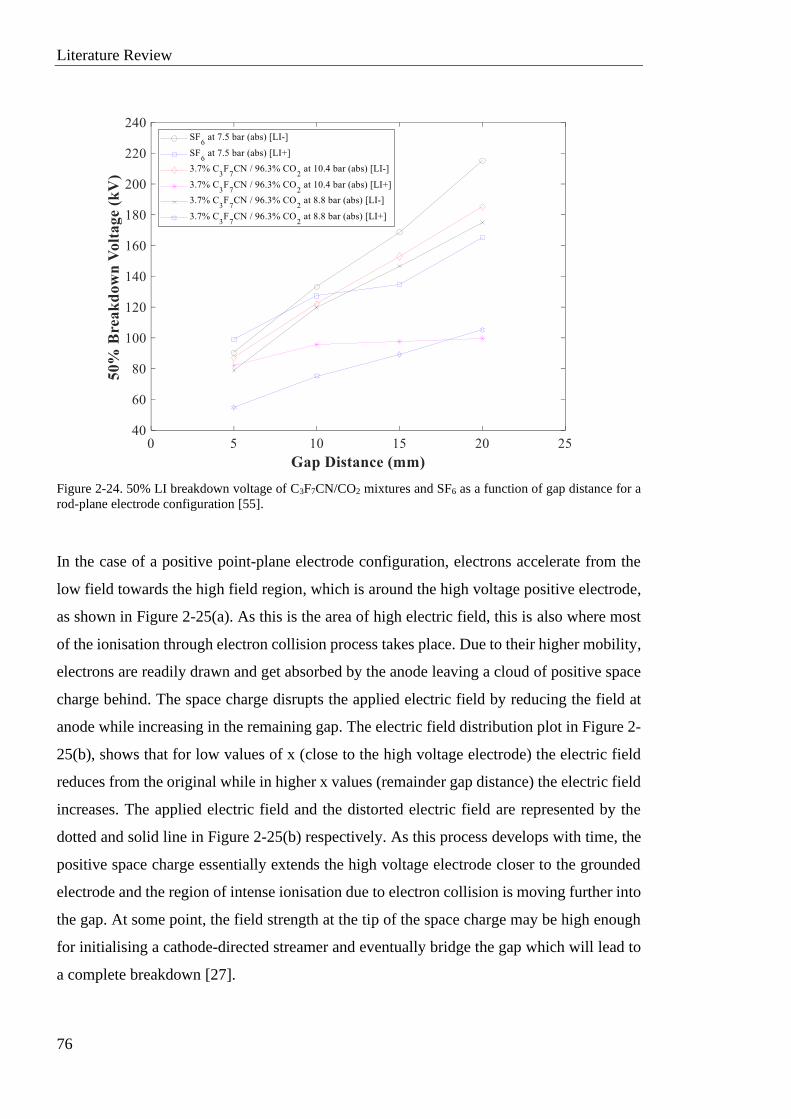
Literature Review
76
Figure 2-24. 50% LI breakdown voltage of C3F7CN/CO2 mixtures and SF6 as a function of gap distance for a
rod-plane electrode configuration [55].
In the case of a positive point-plane electrode configuration, electrons accelerate from the
low field towards the high field region, which is around the high voltage positive electrode,
as shown in Figure 2-25(a). As this is the area of high electric field, this is also where most
of the ionisation through electron collision process takes place. Due to their higher mobility,
electrons are readily drawn and get absorbed by the anode leaving a cloud of positive space
charge behind. The space charge disrupts the applied electric field by reducing the field at
anode while increasing in the remaining gap. The electric field distribution plot in Figure 2-
25(b), shows that for low values of x (close to the high voltage electrode) the electric field
reduces from the original while in higher x values (remainder gap distance) the electric field
increases. The applied electric field and the distorted electric field are represented by the
dotted and solid line in Figure 2-25(b) respectively. As this process develops with time, the
positive space charge essentially extends the high voltage electrode closer to the grounded
electrode and the region of intense ionisation due to electron collision is moving further into
the gap. At some point, the field strength at the tip of the space charge may be high enough
for initialising a cathode-directed streamer and eventually bridge the gap which will lead to
a complete breakdown [27].
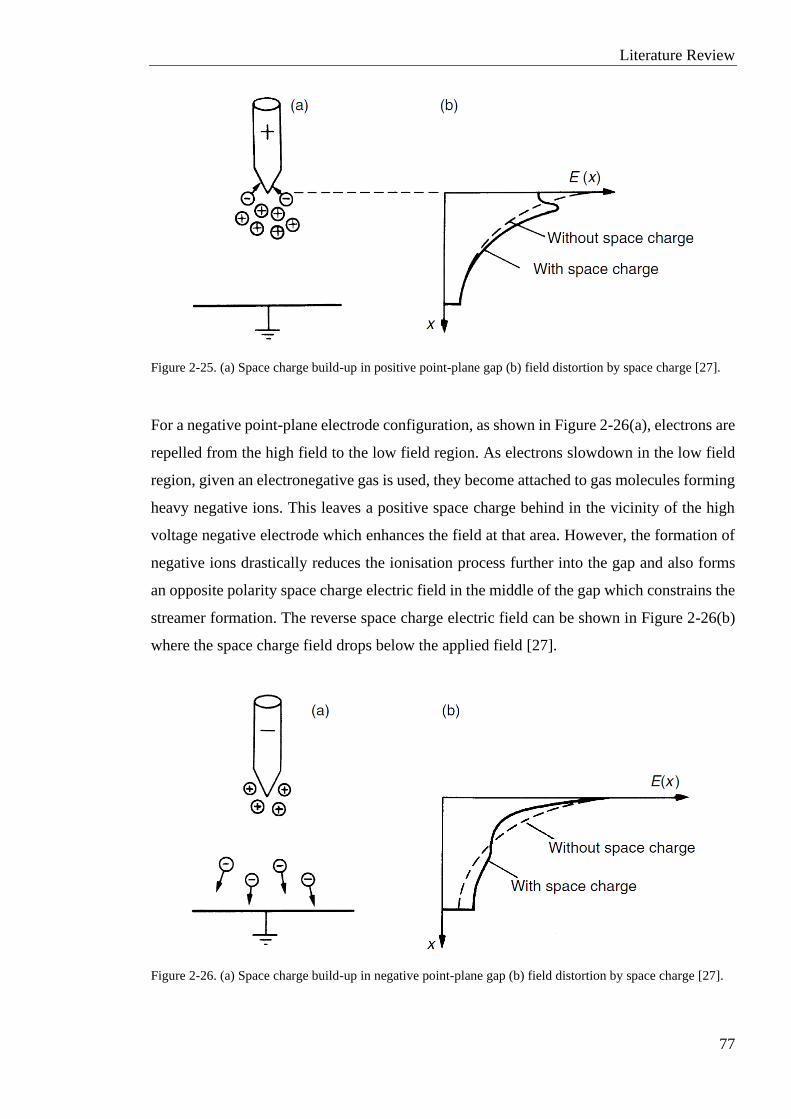
Literature Review
77
Figure 2-25. (a) Space charge build-up in positive point-plane gap (b) field distortion by space charge [27].
For a negative point-plane electrode configuration, as shown in Figure 2-26(a), electrons are
repelled from the high field to the low field region. As electrons slowdown in the low field
region, given an electronegative gas is used, they become attached to gas molecules forming
heavy negative ions. This leaves a positive space charge behind in the vicinity of the high
voltage negative electrode which enhances the field at that area. However, the formation of
negative ions drastically reduces the ionisation process further into the gap and also forms
an opposite polarity space charge electric field in the middle of the gap which constrains the
streamer formation. The reverse space charge electric field can be shown in Figure 2-26(b)
where the space charge field drops below the applied field [27].
Figure 2-26. (a) Space charge build-up in negative point-plane gap (b) field distortion by space charge [27].
Literature Review
78
The low electric field due to space charge distortion can slow down and terminate the
ionisation process, since eventually the original applied electric field will sweep any space
charge that has occurred from this progression. The opposing space electric field and
negative ion formation both delay the ionisation process. A higher voltage is required that
will exert a higher applied electric field and cause sufficient ionisation to completely bridge
the insulation gap and cause a breakdown. For this reason, the breakdown voltage under
negative polarity in divergent electric fields is usually higher than the positive [27]. This
section shows that polarity in voltage waveforms such as LI and DC can make a significant
difference to the breakdown voltage depending on the field uniformity being used [55]–[57],
[60].
2.6.4 Effect of Surface Roughness on Breakdown Voltage
The quality of electrode surface finish can significantly impact the breakdown strength of
gaseous dielectrics [28], [53], [61], [62]. This is due to the existence of microscopic surface
protrusions on rougher surfaces that can lead to a localised electric field enhancement which
will result to a stronger ionisation process. Therefore, increased surface roughness can
usually reduce the breakdown voltage of a gaseous dielectric. However, the reduction of the
breakdown voltage with surface roughness also depends on the sensitivity of different gas
mediums to the microscopic protrusions. Different gases react differently with surface
roughness variations and it is important to study these characteristics for SF6-alternatives.
In [63], [64], the effect of surface roughness on the breakdown field strength of C3F7CN/CO2
gas mixtures was investigated. In this study, they have found that the 10% C3F7CN / 90%
CO2 gas mixture is less sensitive to increased surface roughness than SF6. The same
conclusion was found for a mixture of 6% C3F7CN / 94% CO2 in [65]. Despite the gas
mixtures having lower breakdown field strength than SF6, it was shown that they have a
higher critical point where surface roughness heavily affects their breakdown voltage.
Through calculation, they have estimated that mixtures with less than 3% C3F7CN
concentration should be more sensitive to rougher surfaces than SF6. For gas mixtures with
3-20% C3F7CN concentrations, they have calculated that they will have a critical electrode
surface profile similar to SF6 and they should have comparable surface roughness
characteristics [64].
Literature Review
79
2.6.5 Effect of Epoxy Insulator on Breakdown Voltage
Gas insulation performance in GIBs and GILs can be affected by the presence of support
insulators made of epoxy materials. The point where the enclosure aluminium, insulation
gas and support insulator interact lead to the existence of triple junctions which form
inevitable microscopic irregularities. A poorly designed insulator can introduce the
possibility of a surface flashover and reduce the voltage withstand of a gas in GIB and GIL
equipment [53].
In [66], the effect of a solid epoxy insulator on the AC breakdown voltage was investigated
for SF6 and C3F7CN/CO2 gas mixtures of different concentrations and pressures. Two
Rogowski profiled plane electrodes and epoxy insulators of 15 mm diameter were fabricated
to different lengths for the investigation. The authors of this study studied the difference in
breakdown voltage with and without an insulating spacer, as well as the effect of an epoxy
insulator on the breakdown performance of C3F7CN/CO2 mixtures in comparison to SF6.
Figure 2-27 [66] illustrates the comparison of breakdown voltages with and without an
insulator in between the two plane electrodes. As shown in the figure, both gases react
similarly in the presence of an epoxy insulator between the high voltage and the grounded
electrode. The results demonstrate that the formation of triple junctions by using a cubic
block in-between two electrodes can considerably reduce the breakdown voltage.
Figure 2-28 [66] shows the comparison of insulator surface flashover characteristics for
different mixtures of C3F7CN/CO2 gas in comparison to SF6. The results showed similar
correlation of surface flashover voltage with pressure for SF6 and C3F7CN/CO2 mixtures:
relatively linear at lower pressures but saturate with increasing pressure. As shown in Figure
2-28, the flashover voltage of CO2 gas seems to be unaffected from pressure change with no
clear saturation trend observed. Figure 2-28 also shows that a C3F7CN concentration
saturation is noticeable. When the concentration was increased from 13 to 17% C3F7CN,
there was only a slight improvement in the surface flashover voltage of the gas mixture and
was significantly lower than SF6. This finding contradicts results reported in other studies
[9], [54] that for relatively uniform fields the dielectric strength of 15-20% C3F7CN content
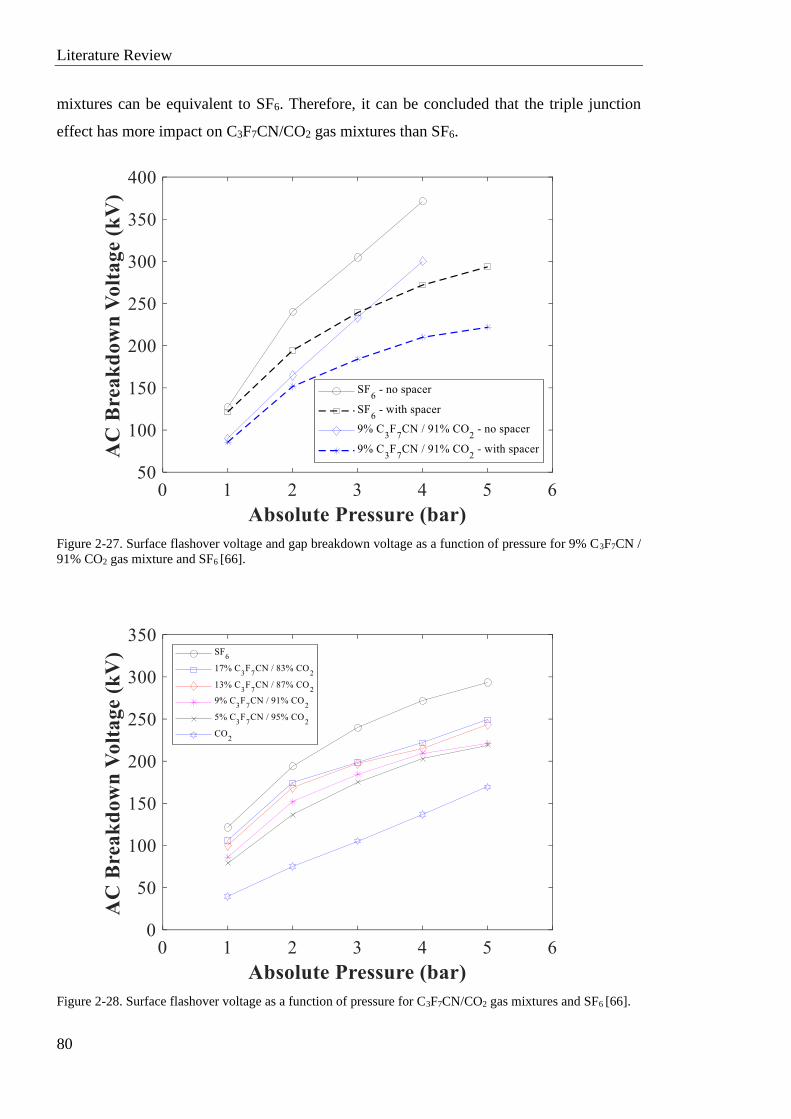
Literature Review
80
mixtures can be equivalent to SF6. Therefore, it can be concluded that the triple junction
effect has more impact on C3F7CN/CO2 gas mixtures than SF6.
Figure 2-27. Surface flashover voltage and gap breakdown voltage as a function of pressure for 9% C3F7CN /
91% CO2 gas mixture and SF6 [66].
Figure 2-28. Surface flashover voltage as a function of pressure for C3F7CN/CO2 gas mixtures and SF6 [66].
Literature Review
81
2.6.6 Partial Discharge Characteristics
2.6.6.1 Partial Discharge Fundamentals
PD is defined as a partial breakdown of insulation over a distance that is usually less than a
millimetre. PDs are a result of extreme electric field enhancements at locations where
engineering defects, such as conductor/enclosure protrusions, are present (a more detailed
description on the types of defects that can result to PDs in GIL/GIB will be given in Chapter
3). The existence of defects will create a local flow of charge carriers, namely ions and
electrons, which in turn will result to discharges at that region [27], [28].
The discharges result to physical, chemical and electrical effects which can be used to detect
the presence of PDs in an equipment. Acoustic methods can be used to spot PDs since
discharges can be followed by the rapid expansion of the ionised gas channel where an
acoustic pressure wave is produced. Light output and chemical by-products detection can be
used to reveal PDs since discharges will emit light due to the excitation of molecules and
also create dissociation of the gas leading to by-products. Lastly, two electrical approaches
can be used to detect PDs in gas insulated equipment [27], [28]:
1. Conventional method: Using a test circuit which follows the guidance of BS EN/IEC
60270:2001 [67], a coupling capacitor can be connected in parallel to the PD source and
the charge flowing though the capacitor is measured using a quadrupole and a detector.
The way the conventional method operates is that after the occurrence of PDs at the
defect, the resulting current pulses at some point die away, and the PD source appears as
a lumped capacitor with a depleted charge to the test circuit. From there, a replacement
charge flows from the coupling capacitor to the PD source which is measured by the
detector. Usually, a shielded room is necessary for the conventional method to reduce
the external noise which makes it inconvenient for on-site PD detection [28].
2. UHF Method: PD current pulses have a rise time of less than a nanosecond and therefore
can radiate electromagnetic waves with frequencies in the GHz region. UHF sensors can
be used to capture these waves and display them on a spectrum analyser. The UHF
method can offer some advantages over the conventional method for on-site PD
detection such as high sensitivity and the ability to locate the PD defects within the
Literature Review
82
equipment using time of flight measurements. The UHF method will be described in
Chapter 5 in more detail [28].
PD characteristics of a dielectric medium in a lab environment are usually defined by their
PDIV and PDEV values. According to BS EN/IEC 60270:2001 [67], PDIV is defined as the
voltage where repetitive PDs are measured in the test object. In contrast, PDEV is defined
as the voltage where repetitive PDs cease to occur in the test object. PDIV and PDEV
characteristics are usually used to compare the PD performance of different dielectric
materials. PRPD patterns are also used for PD experiments to visualise the repetition rate
and amplitude of PD pulses with respect to the phase of the applied voltage. PRPD patterns
are helpful for interpreting the PD data and are also being used for condition monitoring and
diagnostic techniques for identifying the nature of the PD fault within an equipment [27],
[28], [67].
2.6.6.2 C3F7CN Mixtures Partial Discharge Studies
Similar to breakdown voltage, PD characteristics can be influenced by different
experimental conditions such as pressure, C3F7CN mixing ratio and protrusion location (high
voltage or grounded electrodes). Currently, few studies have investigated the parameters that
can affect the PD characteristics of C3F7CN mixtures [54], [68]–[70].
In [54], [68], the effect of C3F7CN concentration on the PDIV was investigated for the
pressure range of 0.2-1.3 bar and compared to SF6. The protrusion used for the results in
Figure 2-29 was a needle on the ground electrode of a plane-plane configuration. The needle
has a height of 2 mm and a tip radius of 20 μm. As shown in Figure 2-29, the results in this
study have found that a mixture of 20% C3F7CN and 80% CO2 exhibits similar PD
characteristics to SF6.
All mixtures have comparable PDIV at low pressures, < 0.6 bar and the difference between
the 20% C3F7CN / 80% CO2 and SF6 widens at higher pressures. It was also observed that
at higher voltages SF6 had more discharge activities at a low magnitude (< 40 pC). In
contrast, the 20% C3F7CN / 80% CO2 had fewer discharges but at a higher magnitude (> 40
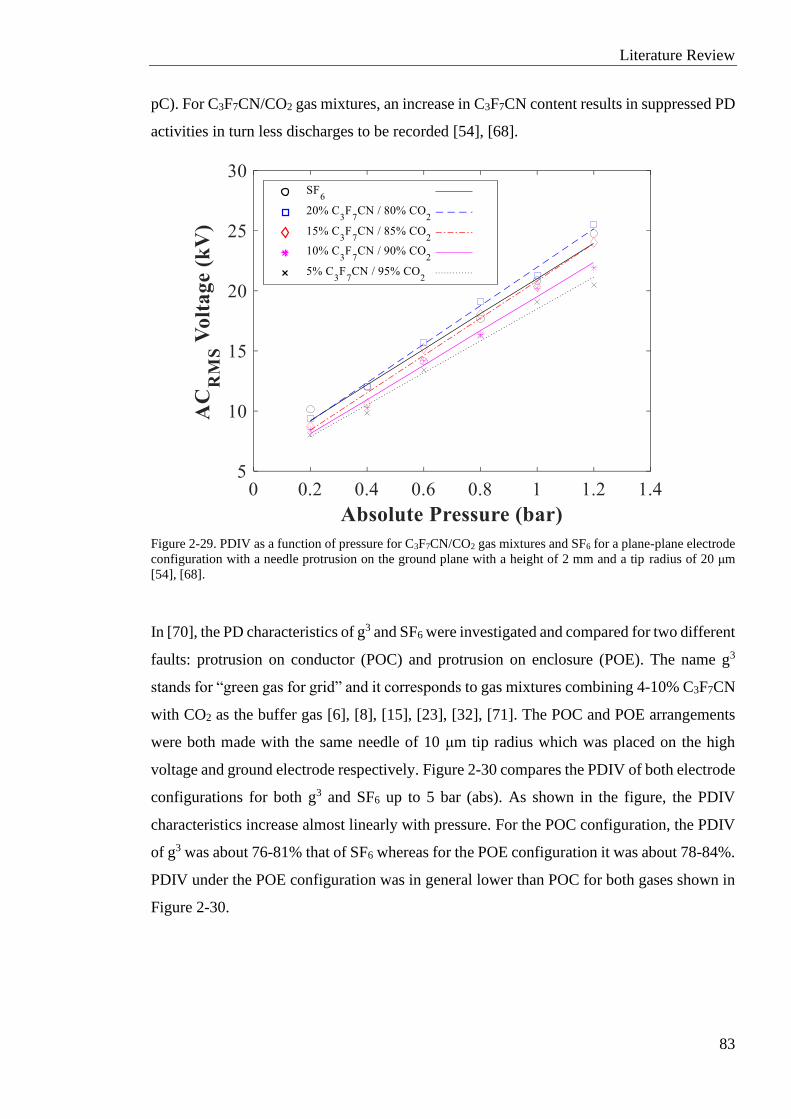
Literature Review
83
pC). For C3F7CN/CO2 gas mixtures, an increase in C3F7CN content results in suppressed PD
activities in turn less discharges to be recorded [54], [68].
Figure 2-29. PDIV as a function of pressure for C3F7CN/CO2 gas mixtures and SF6 for a plane-plane electrode
configuration with a needle protrusion on the ground plane with a height of 2 mm and a tip radius of 20 μm
[54], [68].
In [70], the PD characteristics of g3 and SF6 were investigated and compared for two different
faults: protrusion on conductor (POC) and protrusion on enclosure (POE). The name g3
stands for “green gas for grid” and it corresponds to gas mixtures combining 4-10% C3F7CN
with CO2 as the buffer gas [6], [8], [15], [23], [32], [71]. The POC and POE arrangements
were both made with the same needle of 10 μm tip radius which was placed on the high
voltage and ground electrode respectively. Figure 2-30 compares the PDIV of both electrode
configurations for both g3 and SF6 up to 5 bar (abs). As shown in the figure, the PDIV
characteristics increase almost linearly with pressure. For the POC configuration, the PDIV
of g3 was about 76-81% that of SF6 whereas for the POE configuration it was about 78-84%.
PDIV under the POE configuration was in general lower than POC for both gases shown in
Figure 2-30.

Literature Review
84
Figure 2-30. PDIV as a function of pressure for g3 and SF6 for POC and POE electrode configurations with a
needle of a tip radius of 10 μm [70].
The electrical performance of SF6 and C3F7CN mixtures for both breakdown and PD tests
can be influenced by numerous factors. However, as seen in the experimental investigations
carried out so far, C3F7CN mixtures do not always behave the same way as SF6 with the
change in experimental conditions. C3F7CN gas mixtures have an additional complexity
compared to SF6, which is the combination of two different gases without intermolecular
interference between them. This can lead to a different behaviour than SF6 which is a strong
electronegative gas used alone. It is, therefore, important to fully characterise the mixtures
and identify the differences in their performance compared to SF6. A comprehensive PD and
breakdown characterisation of a suitable C3F7CN mixture may eventually lead to a complete
replacement of SF6 in the power industry.
2.7 By-products Analysis of C3F7CN/CO2 Gas Mixtures
In [72], a study was carried out to examine the decomposition by-products of C3F7CN/CO2
gas mixtures under breakdown and PD experiments. The analysis of the gas mixtures was
conducted using the gas chromatography-mass spectrometry (GC-MS) technique. A brass
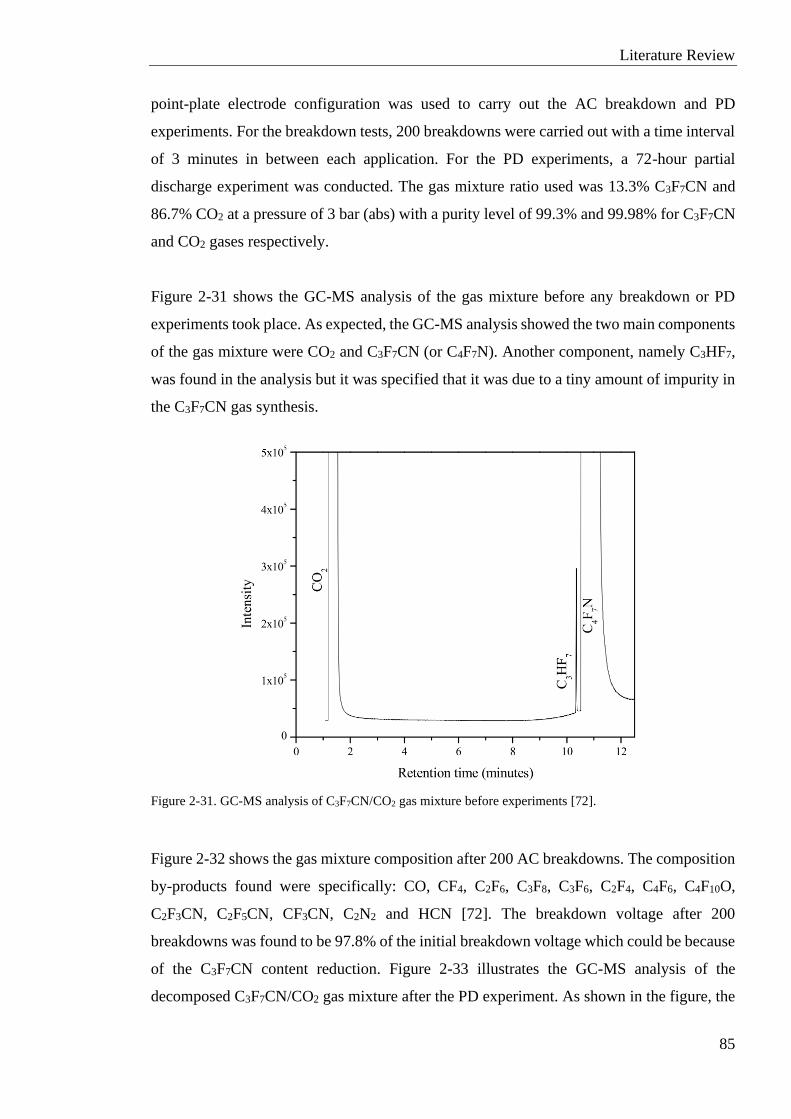
Literature Review
85
point-plate electrode configuration was used to carry out the AC breakdown and PD
experiments. For the breakdown tests, 200 breakdowns were carried out with a time interval
of 3 minutes in between each application. For the PD experiments, a 72-hour partial
discharge experiment was conducted. The gas mixture ratio used was 13.3% C3F7CN and
86.7% CO2 at a pressure of 3 bar (abs) with a purity level of 99.3% and 99.98% for C3F7CN
and CO2 gases respectively.
Figure 2-31 shows the GC-MS analysis of the gas mixture before any breakdown or PD
experiments took place. As expected, the GC-MS analysis showed the two main components
of the gas mixture were CO2 and C3F7CN (or C4F7N). Another component, namely C3HF7,
was found in the analysis but it was specified that it was due to a tiny amount of impurity in
the C3F7CN gas synthesis.
Figure 2-31. GC-MS analysis of C3F7CN/CO2 gas mixture before experiments [72].
Figure 2-32 shows the gas mixture composition after 200 AC breakdowns. The composition
by-products found were specifically: CO, CF4, C2F6, C3F8, C3F6, C2F4, C4F6, C4F10O,
C2F3CN, C2F5CN, CF3CN, C2N2 and HCN [72]. The breakdown voltage after 200
breakdowns was found to be 97.8% of the initial breakdown voltage which could be because
of the C3F7CN content reduction. Figure 2-33 illustrates the GC-MS analysis of the
decomposed C3F7CN/CO2 gas mixture after the PD experiment. As shown in the figure, the
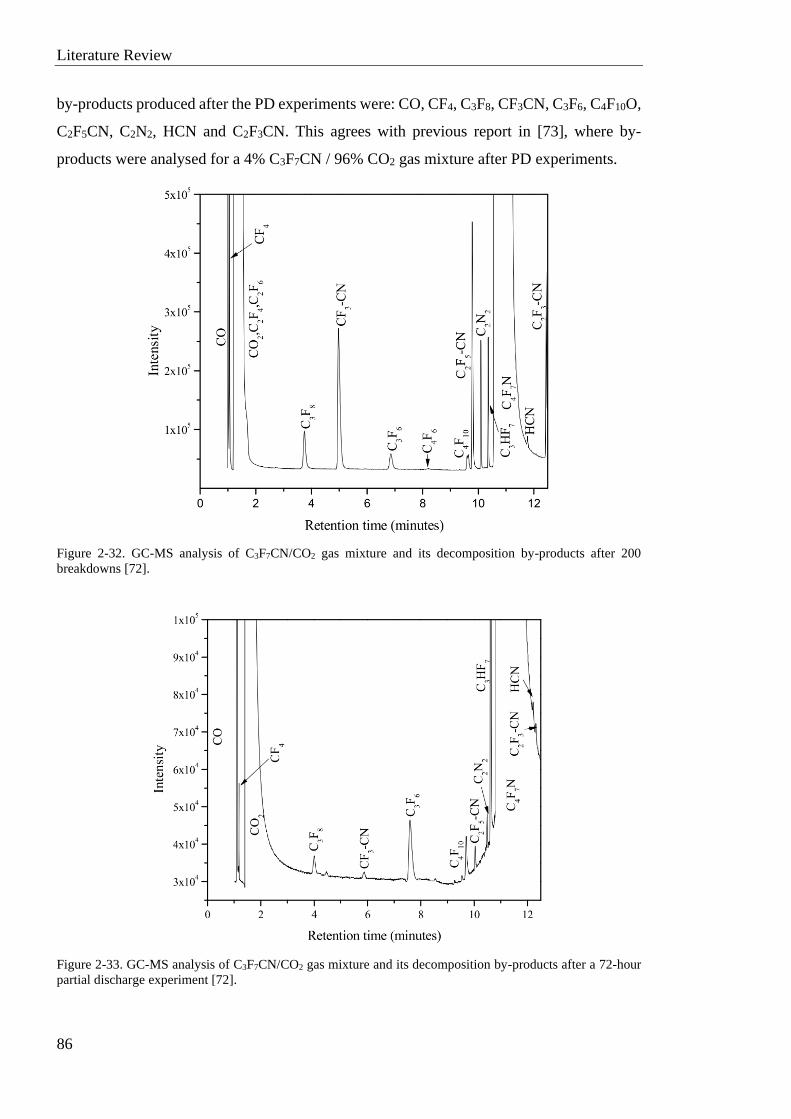
Literature Review
86
by-products produced after the PD experiments were: CO, CF4, C3F8, CF3CN, C3F6, C4F10O,
C2F5CN, C2N2, HCN and C2F3CN. This agrees with previous report in [73], where by-
products were analysed for a 4% C3F7CN / 96% CO2 gas mixture after PD experiments.
Figure 2-32. GC-MS analysis of C3F7CN/CO2 gas mixture and its decomposition by-products after 200
breakdowns [72].
Figure 2-33. GC-MS analysis of C3F7CN/CO2 gas mixture and its decomposition by-products after a 72-hour
partial discharge experiment [72].
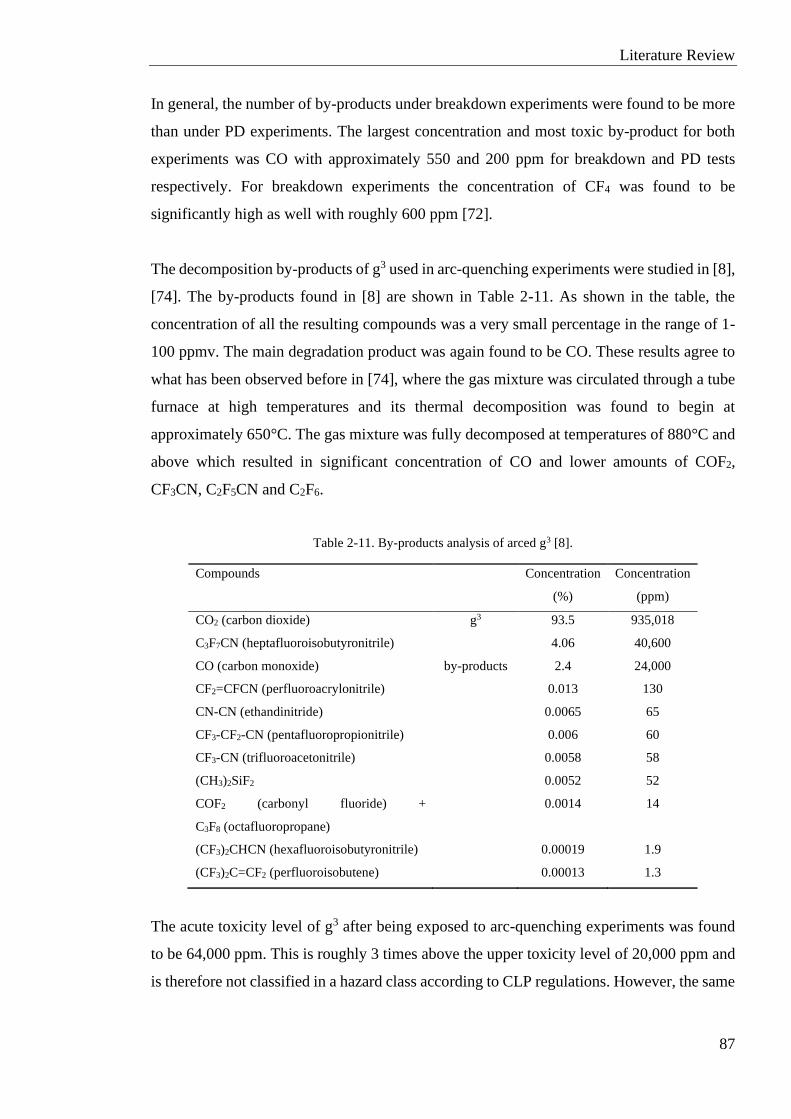
Literature Review
87
In general, the number of by-products under breakdown experiments were found to be more
than under PD experiments. The largest concentration and most toxic by-product for both
experiments was CO with approximately 550 and 200 ppm for breakdown and PD tests
respectively. For breakdown experiments the concentration of CF4 was found to be
significantly high as well with roughly 600 ppm [72].
The decomposition by-products of g3 used in arc-quenching experiments were studied in [8],
[74]. The by-products found in [8] are shown in Table 2-11. As shown in the table, the
concentration of all the resulting compounds was a very small percentage in the range of 1-
100 ppmv. The main degradation product was again found to be CO. These results agree to
what has been observed before in [74], where the gas mixture was circulated through a tube
furnace at high temperatures and its thermal decomposition was found to begin at
approximately 650°C. The gas mixture was fully decomposed at temperatures of 880°C and
above which resulted in significant concentration of CO and lower amounts of COF2,
CF3CN, C2F5CN and C2F6.
Table 2-11. By-products analysis of arced g3 [8].
Compounds Concentration
(%)
Concentration
(ppm)
CO2 (carbon dioxide) g3 93.5 935,018
C3F7CN (heptafluoroisobutyronitrile) 4.06 40,600
CO (carbon monoxide) by-products 2.4 24,000
CF2=CFCN (perfluoroacrylonitrile) 0.013 130
CN-CN (ethandinitride) 0.0065 65
CF3-CF2-CN (pentafluoropropionitrile) 0.006 60
CF3-CN (trifluoroacetonitrile) 0.0058 58
(CH3)2SiF2 0.0052 52
COF2 (carbonyl fluoride) +
C3F8 (octafluoropropane)
0.0014 14
(CF3)2CHCN (hexafluoroisobutyronitrile) 0.00019 1.9
(CF3)2C=CF2 (perfluoroisobutene) 0.00013 1.3
The acute toxicity level of g3 after being exposed to arc-quenching experiments was found
to be 64,000 ppm. This is roughly 3 times above the upper toxicity level of 20,000 ppm and
is therefore not classified in a hazard class according to CLP regulations. However, the same
Literature Review
88
precautions taken with arced SF6 is also recommended for C3F7CN/CO2 gas mixtures in
order to ensure safety during gas handling procedures [8].
2.8 Summary
This chapter has provided an overview of gas insulated equipment and applications of SF6.
The benefits and environmental concerns of SF6 as well as the motivation behind the
research of investigating for SF6-alternative gases has been described. A summary was
shown on the work done by previous studies on SF6-replacement candidates and the
characteristics of each gas category were analysed. From this summary, C3F7CN/CO2 gas
mixtures were judged to be the most technical viable candidate for replacing SF6. Finally, a
literature review was carried out on existing investigations that already exist on C3F7CN/CO2
gas mixtures, which identified important research gaps required for replacing SF6 in the
power industry. The research gaps are listed as follows:
• Experimental investigations to establish the breakdown characteristics performance of
C3F7CN/CO2 gas mixtures in comparison to SF6 using coaxial prototypes with similar
field uniformity as found in practical GIL/GIB equipment. These can take place under
LI and AC voltage waveforms.
• Detailed studies on the PD characteristics of C3F7CN/CO2 gas mixtures in comparison
to SF6 for different experimental conditions. Parameters such as needle length, pressure,
electrode configurations as well as location of defect can be varied in order to fully
understand how the alternative gas might react to equipment defects if it eventually
replaces SF6.
• Retro-fill investigation of C3F7CN/CO2 gas mixtures in full-scale GIL/GIB equipment.
Despite the breakdown and PD characteristics providing useful information on the
behaviour of alternative materials, new gas mixtures must be type tested in actual full-
scale GIL/GIB equipment before being proposed as feasible SF6-replacements. This can
essentially provide knowledge of how the new gas mixture will perform when subjected
to real life transient overvoltages occurring in the network.
Literature Review
89
Addressing the research gaps aforementioned would provide key knowledge required for
retro-filling SF6-designed GIL/GIB equipment with an environmentally friendly gas
candidate.

Literature Review
90
Blank Page
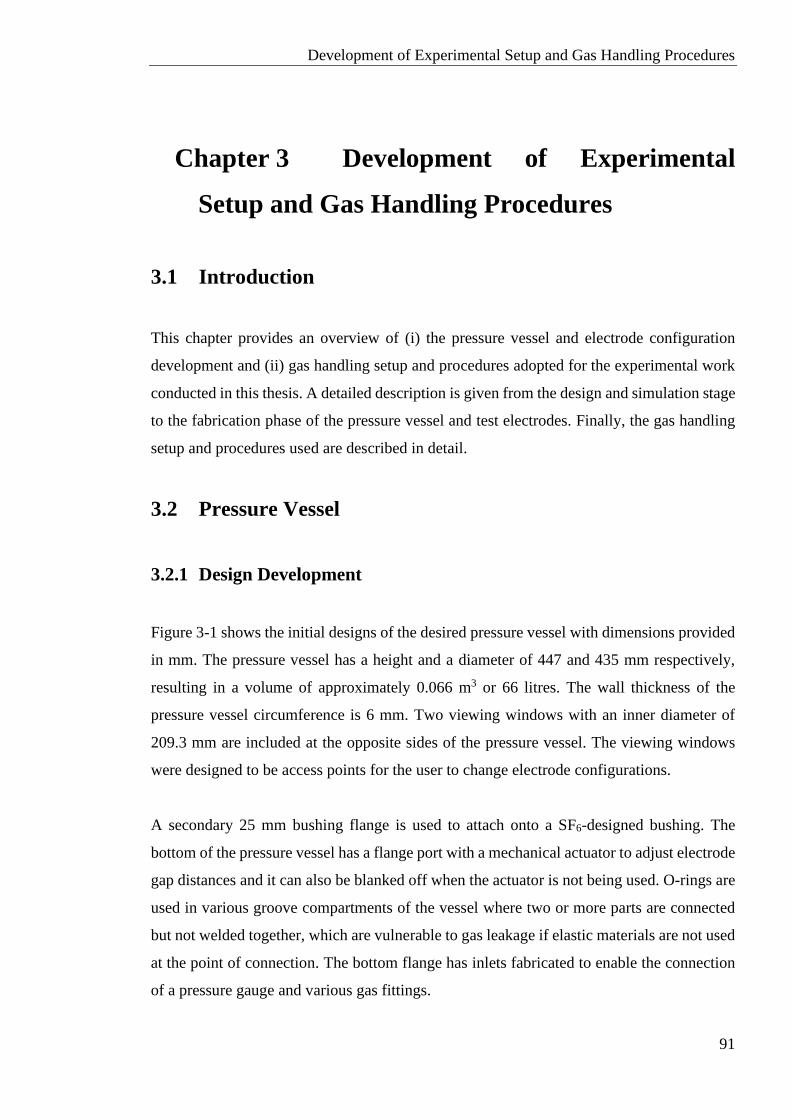
Development of Experimental Setup and Gas Handling Procedures
91
Chapter 3 Development of Experimental
Setup and Gas Handling Procedures
3.1 Introduction
This chapter provides an overview of (i) the pressure vessel and electrode configuration
development and (ii) gas handling setup and procedures adopted for the experimental work
conducted in this thesis. A detailed description is given from the design and simulation stage
to the fabrication phase of the pressure vessel and test electrodes. Finally, the gas handling
setup and procedures used are described in detail.
3.2 Pressure Vessel
3.2.1 Design Development
Figure 3-1 shows the initial designs of the desired pressure vessel with dimensions provided
in mm. The pressure vessel has a height and a diameter of 447 and 435 mm respectively,
resulting in a volume of approximately 0.066 m3 or 66 litres. The wall thickness of the
pressure vessel circumference is 6 mm. Two viewing windows with an inner diameter of
209.3 mm are included at the opposite sides of the pressure vessel. The viewing windows
were designed to be access points for the user to change electrode configurations.
A secondary 25 mm bushing flange is used to attach onto a SF6-designed bushing. The
bottom of the pressure vessel has a flange port with a mechanical actuator to adjust electrode
gap distances and it can also be blanked off when the actuator is not being used. O-rings are
used in various groove compartments of the vessel where two or more parts are connected
but not welded together, which are vulnerable to gas leakage if elastic materials are not used
at the point of connection. The bottom flange has inlets fabricated to enable the connection
of a pressure gauge and various gas fittings.
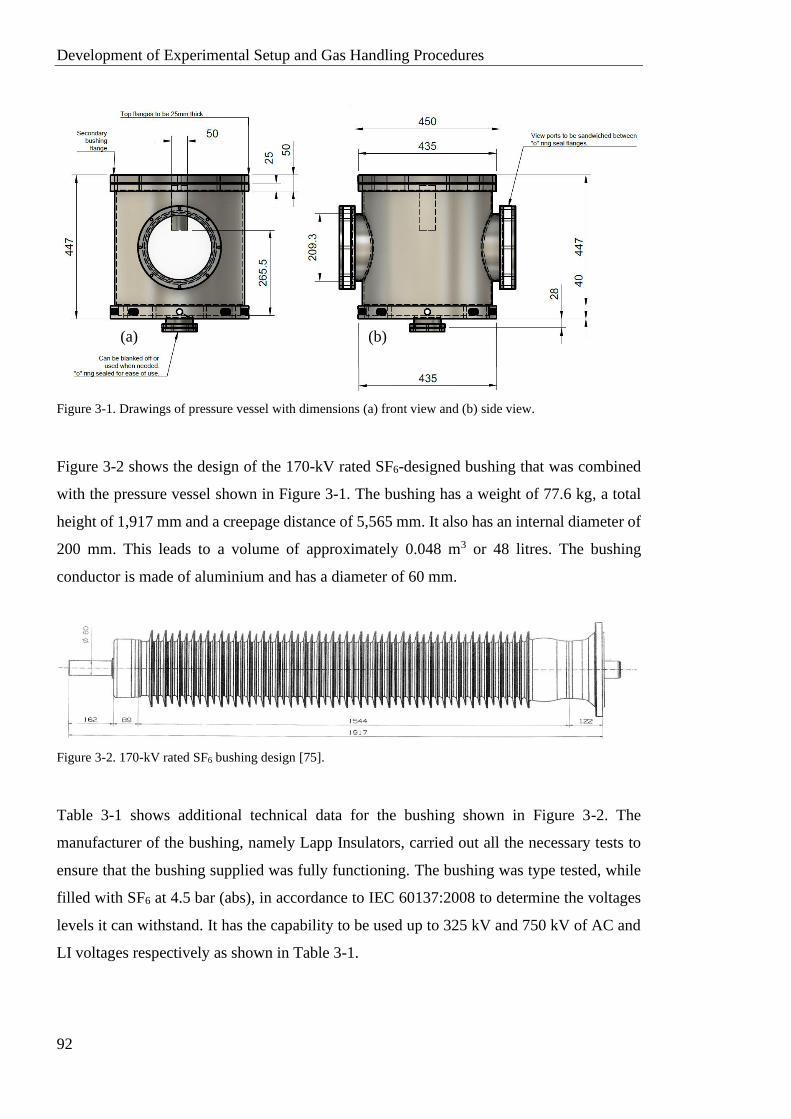
Development of Experimental Setup and Gas Handling Procedures
92
Figure 3-1. Drawings of pressure vessel with dimensions (a) front view and (b) side view.
Figure 3-2 shows the design of the 170-kV rated SF6-designed bushing that was combined
with the pressure vessel shown in Figure 3-1. The bushing has a weight of 77.6 kg, a total
height of 1,917 mm and a creepage distance of 5,565 mm. It also has an internal diameter of
200 mm. This leads to a volume of approximately 0.048 m3 or 48 litres. The bushing
conductor is made of aluminium and has a diameter of 60 mm.
Figure 3-2. 170-kV rated SF6 bushing design [75].
Table 3-1 shows additional technical data for the bushing shown in Figure 3-2. The
manufacturer of the bushing, namely Lapp Insulators, carried out all the necessary tests to
ensure that the bushing supplied was fully functioning. The bushing was type tested, while
filled with SF6 at 4.5 bar (abs), in accordance to IEC 60137:2008 to determine the voltages
levels it can withstand. It has the capability to be used up to 325 kV and 750 kV of AC and
LI voltages respectively as shown in Table 3-1.
(a) (b)
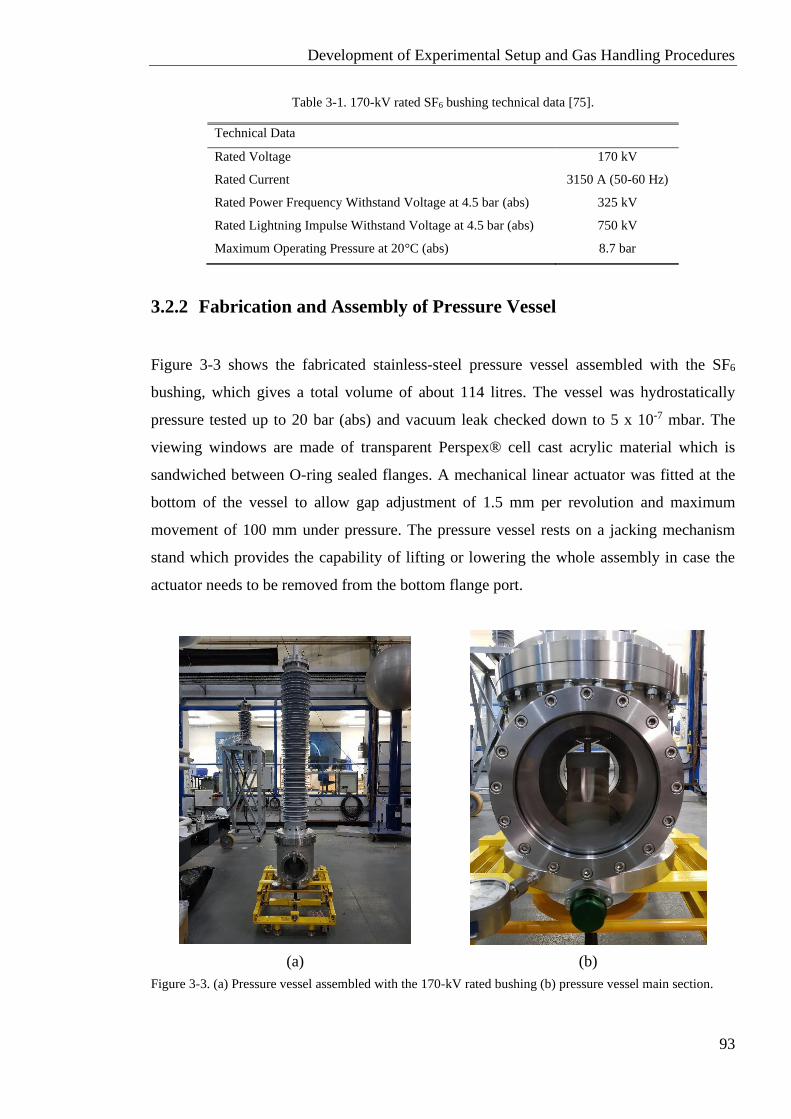
Development of Experimental Setup and Gas Handling Procedures
93
Table 3-1. 170-kV rated SF6 bushing technical data [75].
Technical Data
Rated Voltage 170 kV
Rated Current 3150 A (50-60 Hz)
Rated Power Frequency Withstand Voltage at 4.5 bar (abs) 325 kV
Rated Lightning Impulse Withstand Voltage at 4.5 bar (abs) 750 kV
Maximum Operating Pressure at 20°C (abs) 8.7 bar
3.2.2 Fabrication and Assembly of Pressure Vessel
Figure 3-3 shows the fabricated stainless-steel pressure vessel assembled with the SF6
bushing, which gives a total volume of about 114 litres. The vessel was hydrostatically
pressure tested up to 20 bar (abs) and vacuum leak checked down to 5 x 10⁻⁷ mbar. The
viewing windows are made of transparent Perspex® cell cast acrylic material which is
sandwiched between O-ring sealed flanges. A mechanical linear actuator was fitted at the
bottom of the vessel to allow gap adjustment of 1.5 mm per revolution and maximum
movement of 100 mm under pressure. The pressure vessel rests on a jacking mechanism
stand which provides the capability of lifting or lowering the whole assembly in case the
actuator needs to be removed from the bottom flange port.
Figure 3-3. (a) Pressure vessel assembled with the 170-kV rated bushing (b) pressure vessel main section.
(a) (b)
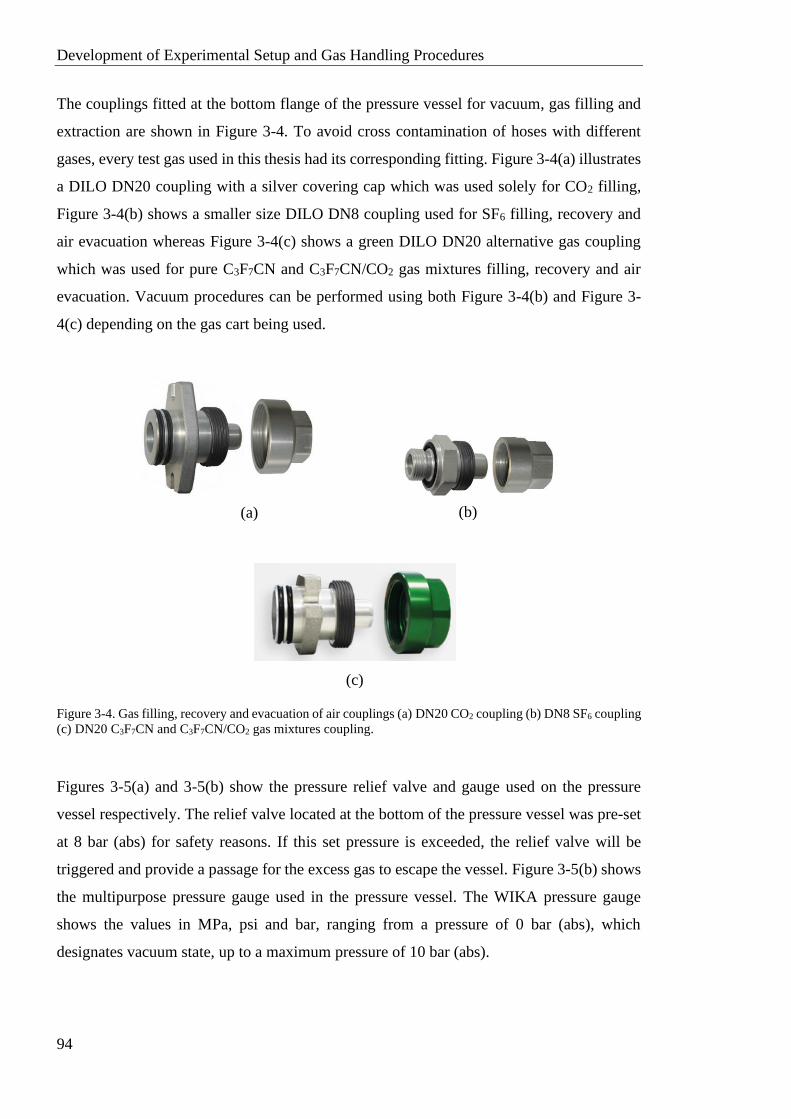
Development of Experimental Setup and Gas Handling Procedures
94
The couplings fitted at the bottom flange of the pressure vessel for vacuum, gas filling and
extraction are shown in Figure 3-4. To avoid cross contamination of hoses with different
gases, every test gas used in this thesis had its corresponding fitting. Figure 3-4(a) illustrates
a DILO DN20 coupling with a silver covering cap which was used solely for CO2 filling,
Figure 3-4(b) shows a smaller size DILO DN8 coupling used for SF6 filling, recovery and
air evacuation whereas Figure 3-4(c) shows a green DILO DN20 alternative gas coupling
which was used for pure C3F7CN and C3F7CN/CO2 gas mixtures filling, recovery and air
evacuation. Vacuum procedures can be performed using both Figure 3-4(b) and Figure 3-
4(c) depending on the gas cart being used.
Figure 3-4. Gas filling, recovery and evacuation of air couplings (a) DN20 CO2 coupling (b) DN8 SF6 coupling
(c) DN20 C3F7CN and C3F7CN/CO2 gas mixtures coupling.
Figures 3-5(a) and 3-5(b) show the pressure relief valve and gauge used on the pressure
vessel respectively. The relief valve located at the bottom of the pressure vessel was pre-set
at 8 bar (abs) for safety reasons. If this set pressure is exceeded, the relief valve will be
triggered and provide a passage for the excess gas to escape the vessel. Figure 3-5(b) shows
the multipurpose pressure gauge used in the pressure vessel. The WIKA pressure gauge
shows the values in MPa, psi and bar, ranging from a pressure of 0 bar (abs), which
designates vacuum state, up to a maximum pressure of 10 bar (abs).
(a) (b)
(c)
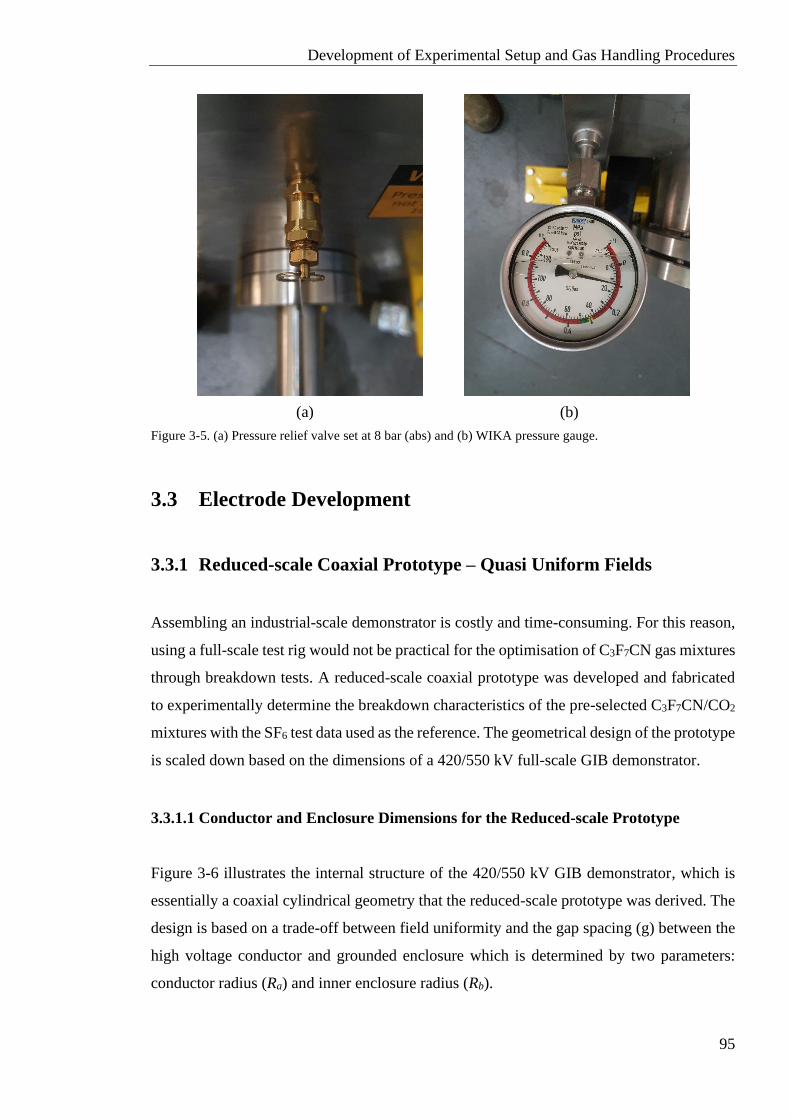
Development of Experimental Setup and Gas Handling Procedures
95
Figure 3-5. (a) Pressure relief valve set at 8 bar (abs) and (b) WIKA pressure gauge.
3.3 Electrode Development
3.3.1 Reduced-scale Coaxial Prototype – Quasi Uniform Fields
Assembling an industrial-scale demonstrator is costly and time-consuming. For this reason,
using a full-scale test rig would not be practical for the optimisation of C3F7CN gas mixtures
through breakdown tests. A reduced-scale coaxial prototype was developed and fabricated
to experimentally determine the breakdown characteristics of the pre-selected C3F7CN/CO2
mixtures with the SF6 test data used as the reference. The geometrical design of the prototype
is scaled down based on the dimensions of a 420/550 kV full-scale GIB demonstrator.
3.3.1.1 Conductor and Enclosure Dimensions for the Reduced-scale Prototype
Figure 3-6 illustrates the internal structure of the 420/550 kV GIB demonstrator, which is
essentially a coaxial cylindrical geometry that the reduced-scale prototype was derived. The
design is based on a trade-off between field uniformity and the gap spacing (g) between the
high voltage conductor and grounded enclosure which is determined by two parameters:
conductor radius (Ra) and inner enclosure radius (Rb).
(a) (b)
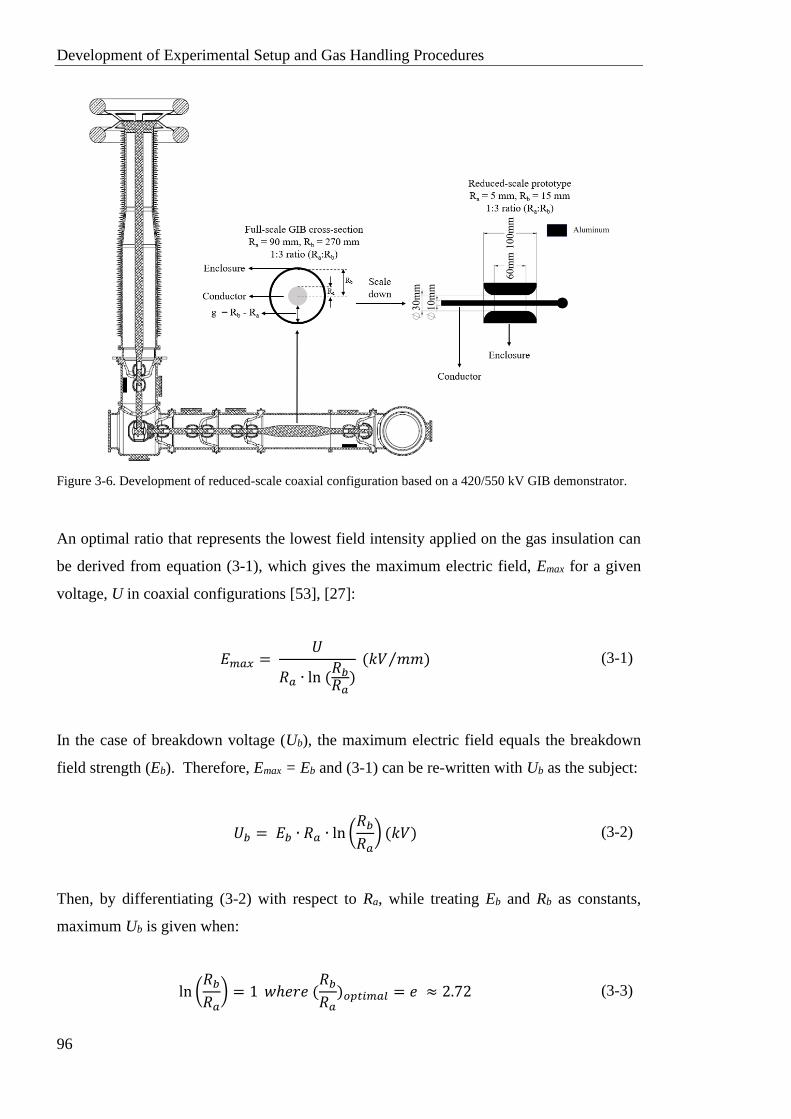
Development of Experimental Setup and Gas Handling Procedures
96
Figure 3-6. Development of reduced-scale coaxial configuration based on a 420/550 kV GIB demonstrator.
An optimal ratio that represents the lowest field intensity applied on the gas insulation can
be derived from equation (3-1), which gives the maximum electric field, Emax for a given
voltage, U in coaxial configurations [53], [27]:
𝐸𝑚𝑎𝑥 = 𝑈
𝑅𝑎 ∙ ln (𝑅𝑏
𝑅𝑎)
(𝑘𝑉 𝑚𝑚)⁄
(3-1)
In the case of breakdown voltage (Ub), the maximum electric field equals the breakdown
field strength (Eb). Therefore, Emax = Eb and (3-1) can be re-written with Ub as the subject:
𝑈𝑏 = 𝐸𝑏 ∙ 𝑅𝑎 ∙ ln (𝑅𝑏
𝑅𝑎) (𝑘𝑉)
(3-2)
Then, by differentiating (3-2) with respect to Ra, while treating Eb and Rb as constants,
maximum Ub is given when:
ln (𝑅𝑏
𝑅𝑎) = 1 𝑤ℎ𝑒𝑟𝑒 (
𝑅𝑏
𝑅𝑎)𝑜𝑝𝑡𝑖𝑚𝑎𝑙 = 𝑒 ≈ 2.72
(3-3)
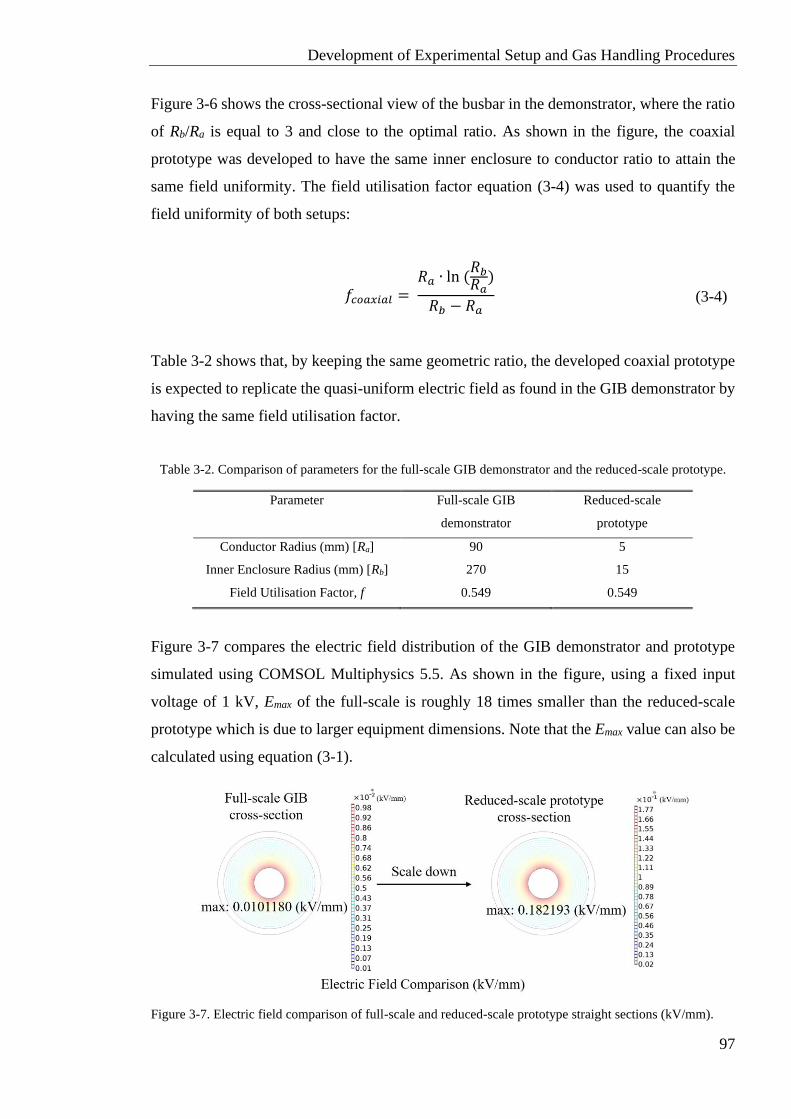
Development of Experimental Setup and Gas Handling Procedures
97
Figure 3-6 shows the cross-sectional view of the busbar in the demonstrator, where the ratio
of Rb/Ra is equal to 3 and close to the optimal ratio. As shown in the figure, the coaxial
prototype was developed to have the same inner enclosure to conductor ratio to attain the
same field uniformity. The field utilisation factor equation (3-4) was used to quantify the
field uniformity of both setups:
𝑓𝑐𝑜𝑎𝑥𝑖𝑎𝑙 = 𝑅𝑎 ∙ ln (
𝑅𝑏
𝑅𝑎)
𝑅𝑏 − 𝑅𝑎
(3-4)
Table 3-2 shows that, by keeping the same geometric ratio, the developed coaxial prototype
is expected to replicate the quasi-uniform electric field as found in the GIB demonstrator by
having the same field utilisation factor.
Table 3-2. Comparison of parameters for the full-scale GIB demonstrator and the reduced-scale prototype.
Parameter Full-scale GIB
demonstrator
Reduced-scale
prototype
Conductor Radius (mm) [Ra] 90 5
Inner Enclosure Radius (mm) [Rb] 270 15
Field Utilisation Factor, f 0.549 0.549
Figure 3-7 compares the electric field distribution of the GIB demonstrator and prototype
simulated using COMSOL Multiphysics 5.5. As shown in the figure, using a fixed input
voltage of 1 kV, Emax of the full-scale is roughly 18 times smaller than the reduced-scale
prototype which is due to larger equipment dimensions. Note that the Emax value can also be
calculated using equation (3-1).
Figure 3-7. Electric field comparison of full-scale and reduced-scale prototype straight sections (kV/mm).
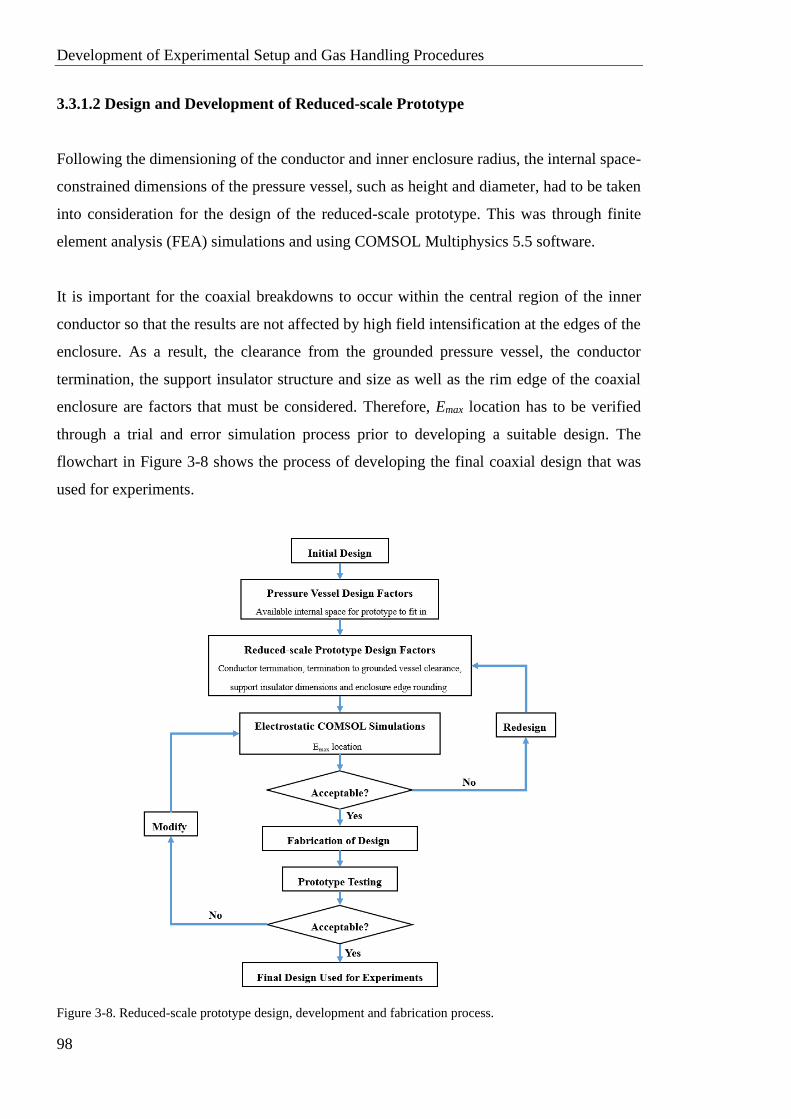
Development of Experimental Setup and Gas Handling Procedures
98
3.3.1.2 Design and Development of Reduced-scale Prototype
Following the dimensioning of the conductor and inner enclosure radius, the internal space-
constrained dimensions of the pressure vessel, such as height and diameter, had to be taken
into consideration for the design of the reduced-scale prototype. This was through finite
element analysis (FEA) simulations and using COMSOL Multiphysics 5.5 software.
It is important for the coaxial breakdowns to occur within the central region of the inner
conductor so that the results are not affected by high field intensification at the edges of the
enclosure. As a result, the clearance from the grounded pressure vessel, the conductor
termination, the support insulator structure and size as well as the rim edge of the coaxial
enclosure are factors that must be considered. Therefore, Emax location has to be verified
through a trial and error simulation process prior to developing a suitable design. The
flowchart in Figure 3-8 shows the process of developing the final coaxial design that was
used for experiments.
Figure 3-8. Reduced-scale prototype design, development and fabrication process.
Development of Experimental Setup and Gas Handling Procedures
99
The process of developing the reduced-scaled coaxial prototype started by introducing an
initial design based on the geometric ratio. After determining the conductor and enclosure
diameters, the prototype dimensions were adjusted to the available internal space of the
pressure vessel. The geometric design was adjusted to ensure that Emax was at the desired
location through FEA simulations. The prototype was fabricated and preliminary tested to
validate that the design is fully functioning prior to starting the breakdown experiments.
3.3.1.3 Prototype Design, Simulation, Development and Fabrication
Finite Element Analysis (FEA) Method
FEA is a numerical method for solving complex mathematical problems such as a continuous
object with infinite degrees of freedom. The purpose of FEA modelling is to subdivide the
model into a large number of discrete sized elements and limit the infinite degrees of freedom
to finite. The behaviour of these elements is defined by several parameters in the physics
study. An example being in electrostatics model, the voltage potential and dielectric
permittivity need to be defined. These elements are usually in triangular or quadrilateral
shape depending on the model design and number of dimensions. As the model is divided
into a large number of simple geometries, the solution to every single element can be
approximated by a linear or quadratic function. A Galerkin matrix is assembled for every
element and all the individual matrices are then added together into a single matrix, which
is used to solve the complex model [76]. COMSOL Multiphysics (Version 5.5) software was
used to perform FEA modelling in this thesis and the steps are listed as follows:
• Geometry Design – design or import a geometry into the software.
• Boundary Conditions – define the materials that are going to be used in the model and
their properties. The physics conditions also have to be specified.
• Meshing and Refinement – divide the model into a large number of discrete elements and
ensure that the final solution is independent of the meshing size.
• Solution and Visualisation – extract the data and present the results in tables and figures.
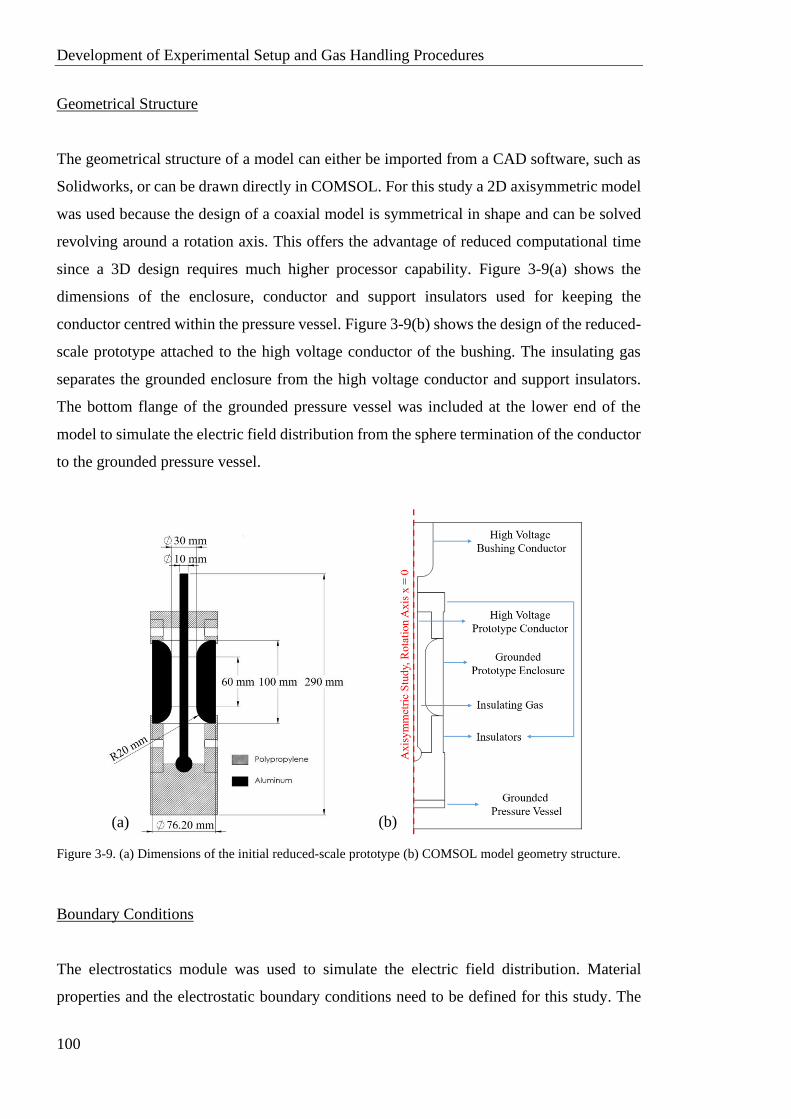
Development of Experimental Setup and Gas Handling Procedures
100
Geometrical Structure
The geometrical structure of a model can either be imported from a CAD software, such as
Solidworks, or can be drawn directly in COMSOL. For this study a 2D axisymmetric model
was used because the design of a coaxial model is symmetrical in shape and can be solved
revolving around a rotation axis. This offers the advantage of reduced computational time
since a 3D design requires much higher processor capability. Figure 3-9(a) shows the
dimensions of the enclosure, conductor and support insulators used for keeping the
conductor centred within the pressure vessel. Figure 3-9(b) shows the design of the reduced-
scale prototype attached to the high voltage conductor of the bushing. The insulating gas
separates the grounded enclosure from the high voltage conductor and support insulators.
The bottom flange of the grounded pressure vessel was included at the lower end of the
model to simulate the electric field distribution from the sphere termination of the conductor
to the grounded pressure vessel.
Figure 3-9. (a) Dimensions of the initial reduced-scale prototype (b) COMSOL model geometry structure.
Boundary Conditions
The electrostatics module was used to simulate the electric field distribution. Material
properties and the electrostatic boundary conditions need to be defined for this study. The
(a) (b)
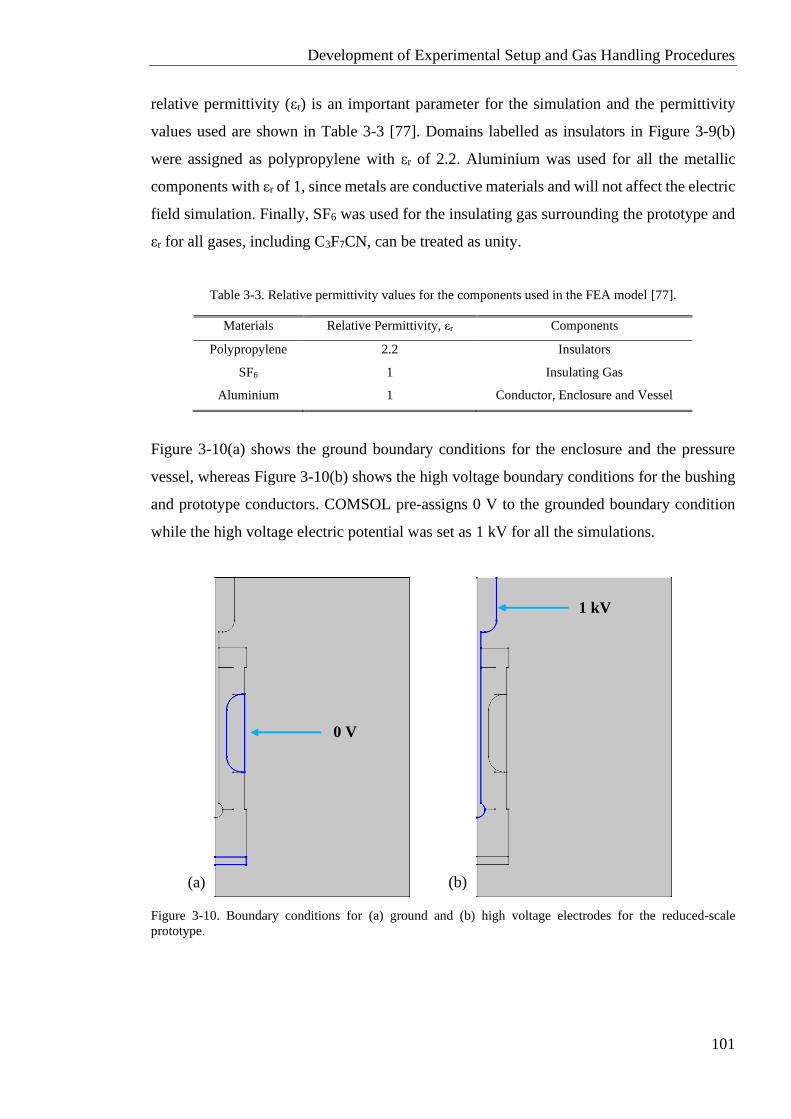
Development of Experimental Setup and Gas Handling Procedures
101
relative permittivity (εr) is an important parameter for the simulation and the permittivity
values used are shown in Table 3-3 [77]. Domains labelled as insulators in Figure 3-9(b)
were assigned as polypropylene with εr of 2.2. Aluminium was used for all the metallic
components with εr of 1, since metals are conductive materials and will not affect the electric
field simulation. Finally, SF6 was used for the insulating gas surrounding the prototype and
εr for all gases, including C3F7CN, can be treated as unity.
Table 3-3. Relative permittivity values for the components used in the FEA model [77].
Materials Relative Permittivity, εr Components
Polypropylene 2.2 Insulators
SF6 1 Insulating Gas
Aluminium 1 Conductor, Enclosure and Vessel
Figure 3-10(a) shows the ground boundary conditions for the enclosure and the pressure
vessel, whereas Figure 3-10(b) shows the high voltage boundary conditions for the bushing
and prototype conductors. COMSOL pre-assigns 0 V to the grounded boundary condition
while the high voltage electric potential was set as 1 kV for all the simulations.
Figure 3-10. Boundary conditions for (a) ground and (b) high voltage electrodes for the reduced-scale
prototype.
(a) (b)
0 V
1 kV
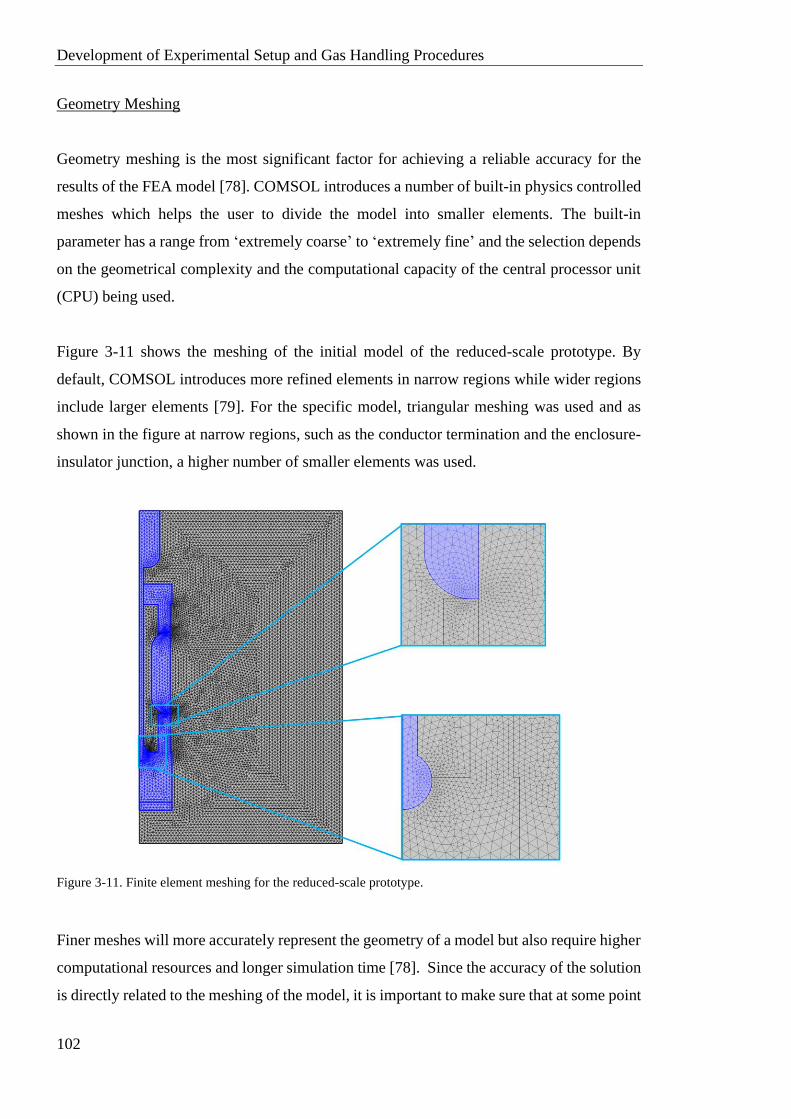
Development of Experimental Setup and Gas Handling Procedures
102
Geometry Meshing
Geometry meshing is the most significant factor for achieving a reliable accuracy for the
results of the FEA model [78]. COMSOL introduces a number of built-in physics controlled
meshes which helps the user to divide the model into smaller elements. The built-in
parameter has a range from ‘extremely coarse’ to ‘extremely fine’ and the selection depends
on the geometrical complexity and the computational capacity of the central processor unit
(CPU) being used.
Figure 3-11 shows the meshing of the initial model of the reduced-scale prototype. By
default, COMSOL introduces more refined elements in narrow regions while wider regions
include larger elements [79]. For the specific model, triangular meshing was used and as
shown in the figure at narrow regions, such as the conductor termination and the enclosure-
insulator junction, a higher number of smaller elements was used.
Figure 3-11. Finite element meshing for the reduced-scale prototype.
Finer meshes will more accurately represent the geometry of a model but also require higher
computational resources and longer simulation time [78]. Since the accuracy of the solution
is directly related to the meshing of the model, it is important to make sure that at some point
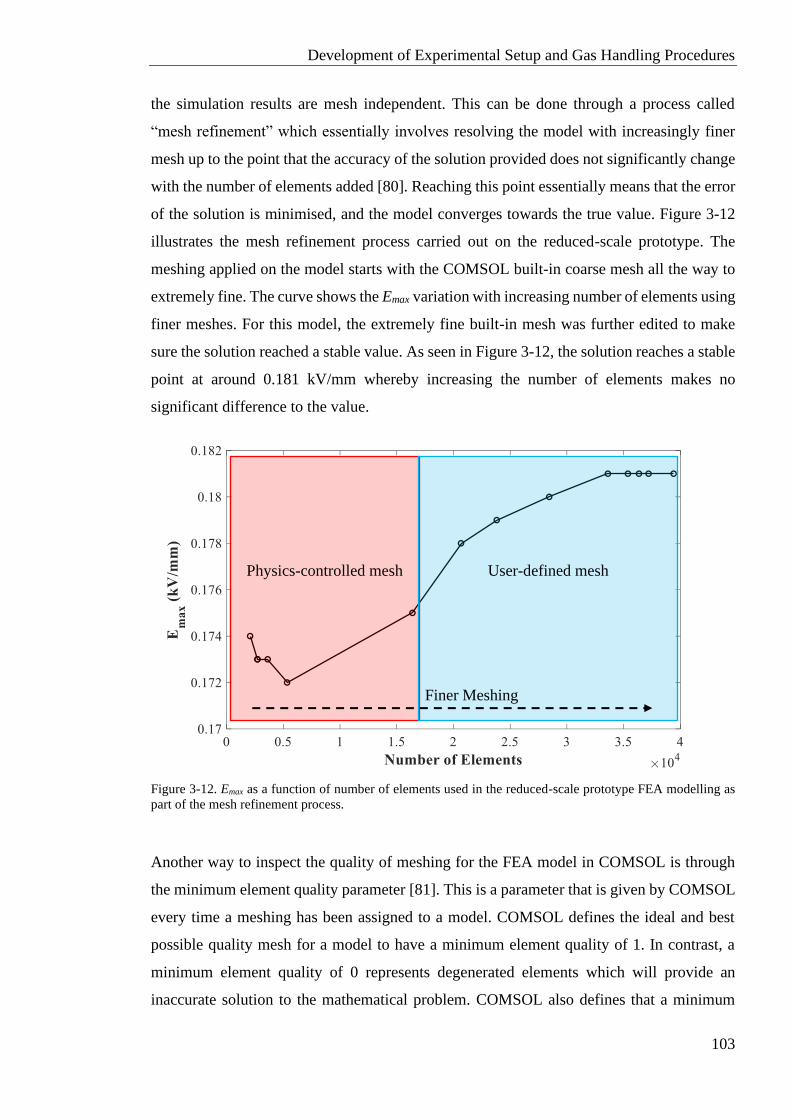
Development of Experimental Setup and Gas Handling Procedures
103
the simulation results are mesh independent. This can be done through a process called
“mesh refinement” which essentially involves resolving the model with increasingly finer
mesh up to the point that the accuracy of the solution provided does not significantly change
with the number of elements added [80]. Reaching this point essentially means that the error
of the solution is minimised, and the model converges towards the true value. Figure 3-12
illustrates the mesh refinement process carried out on the reduced-scale prototype. The
meshing applied on the model starts with the COMSOL built-in coarse mesh all the way to
extremely fine. The curve shows the Emax variation with increasing number of elements using
finer meshes. For this model, the extremely fine built-in mesh was further edited to make
sure the solution reached a stable value. As seen in Figure 3-12, the solution reaches a stable
point at around 0.181 kV/mm whereby increasing the number of elements makes no
significant difference to the value.
Figure 3-12. Emax as a function of number of elements used in the reduced-scale prototype FEA modelling as
part of the mesh refinement process.
Another way to inspect the quality of meshing for the FEA model in COMSOL is through
the minimum element quality parameter [81]. This is a parameter that is given by COMSOL
every time a meshing has been assigned to a model. COMSOL defines the ideal and best
possible quality mesh for a model to have a minimum element quality of 1. In contrast, a
minimum element quality of 0 represents degenerated elements which will provide an
inaccurate solution to the mathematical problem. COMSOL also defines that a minimum
Physics-controlled mesh
User-defined mesh
Finer Meshing
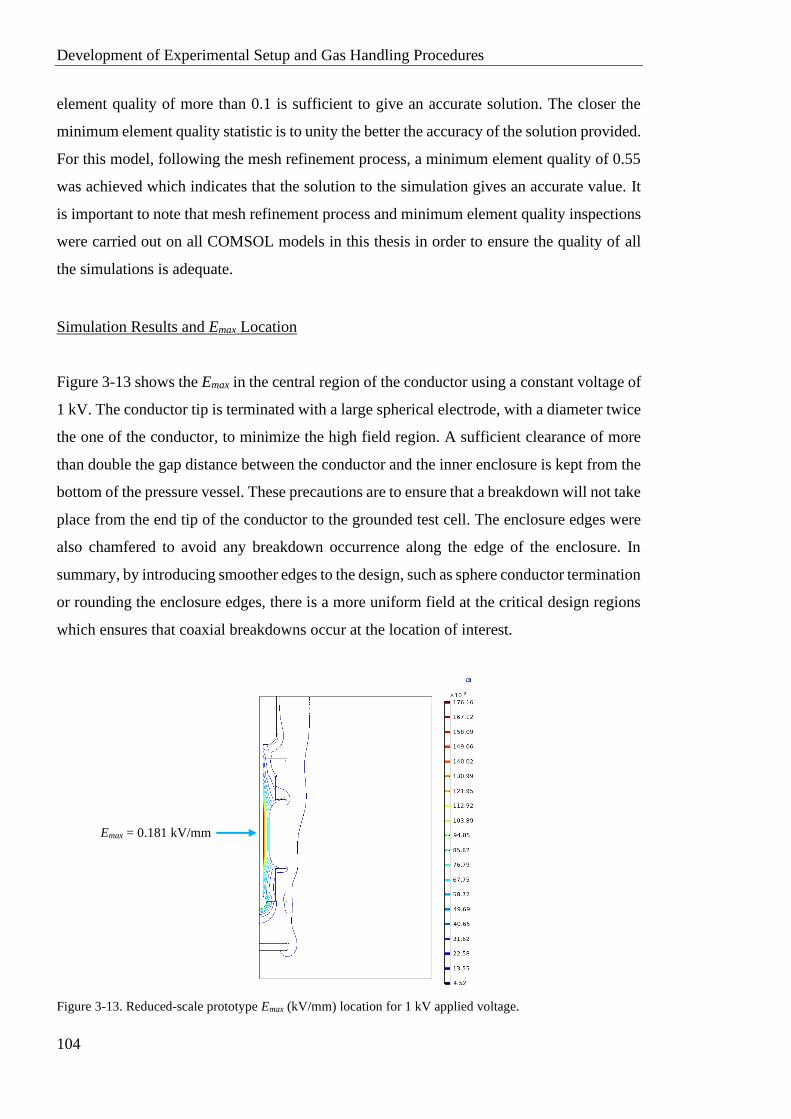
Development of Experimental Setup and Gas Handling Procedures
104
element quality of more than 0.1 is sufficient to give an accurate solution. The closer the
minimum element quality statistic is to unity the better the accuracy of the solution provided.
For this model, following the mesh refinement process, a minimum element quality of 0.55
was achieved which indicates that the solution to the simulation gives an accurate value. It
is important to note that mesh refinement process and minimum element quality inspections
were carried out on all COMSOL models in this thesis in order to ensure the quality of all
the simulations is adequate.
Simulation Results and Emax Location
Figure 3-13 shows the Emax in the central region of the conductor using a constant voltage of
1 kV. The conductor tip is terminated with a large spherical electrode, with a diameter twice
the one of the conductor, to minimize the high field region. A sufficient clearance of more
than double the gap distance between the conductor and the inner enclosure is kept from the
bottom of the pressure vessel. These precautions are to ensure that a breakdown will not take
place from the end tip of the conductor to the grounded test cell. The enclosure edges were
also chamfered to avoid any breakdown occurrence along the edge of the enclosure. In
summary, by introducing smoother edges to the design, such as sphere conductor termination
or rounding the enclosure edges, there is a more uniform field at the critical design regions
which ensures that coaxial breakdowns occur at the location of interest.
Figure 3-13. Reduced-scale prototype Emax (kV/mm) location for 1 kV applied voltage.
Emax = 0.181 kV/mm
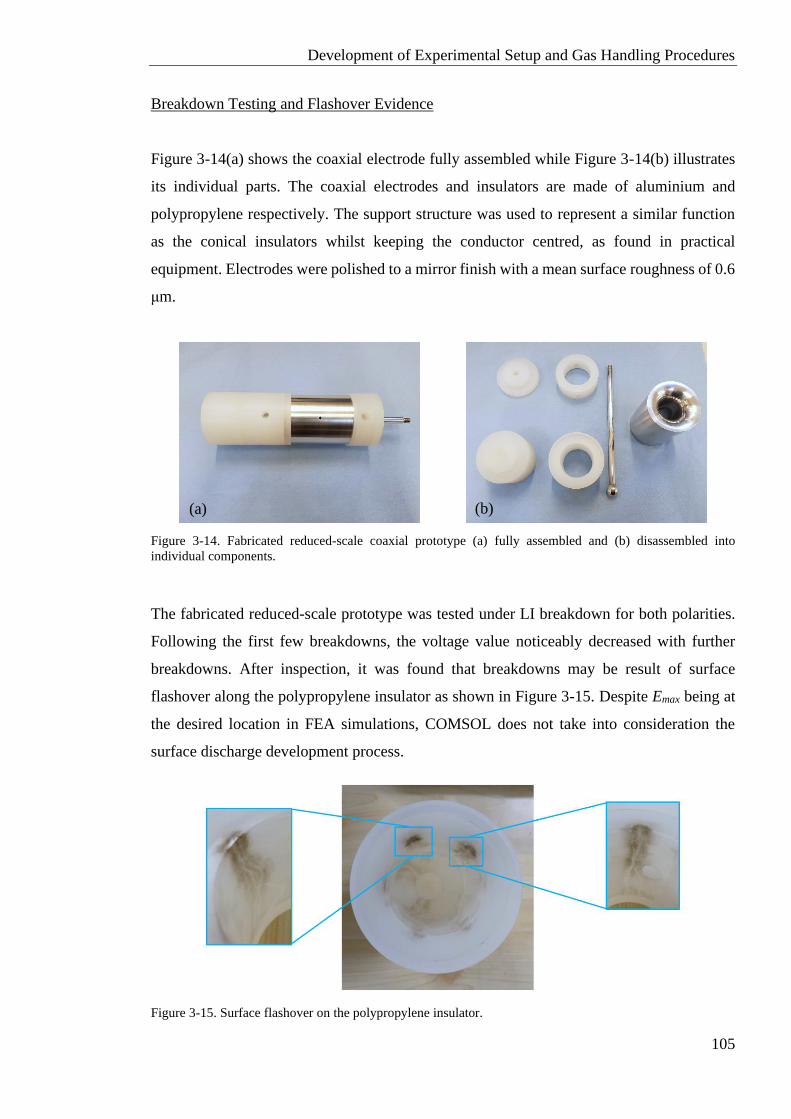
Development of Experimental Setup and Gas Handling Procedures
105
Breakdown Testing and Flashover Evidence
Figure 3-14(a) shows the coaxial electrode fully assembled while Figure 3-14(b) illustrates
its individual parts. The coaxial electrodes and insulators are made of aluminium and
polypropylene respectively. The support structure was used to represent a similar function
as the conical insulators whilst keeping the conductor centred, as found in practical
equipment. Electrodes were polished to a mirror finish with a mean surface roughness of 0.6
μm.
Figure 3-14. Fabricated reduced-scale coaxial prototype (a) fully assembled and (b) disassembled into
individual components.
The fabricated reduced-scale prototype was tested under LI breakdown for both polarities.
Following the first few breakdowns, the voltage value noticeably decreased with further
breakdowns. After inspection, it was found that breakdowns may be result of surface
flashover along the polypropylene insulator as shown in Figure 3-15. Despite Emax being at
the desired location in FEA simulations, COMSOL does not take into consideration the
surface discharge development process.
Figure 3-15. Surface flashover on the polypropylene insulator.
(a) (b)
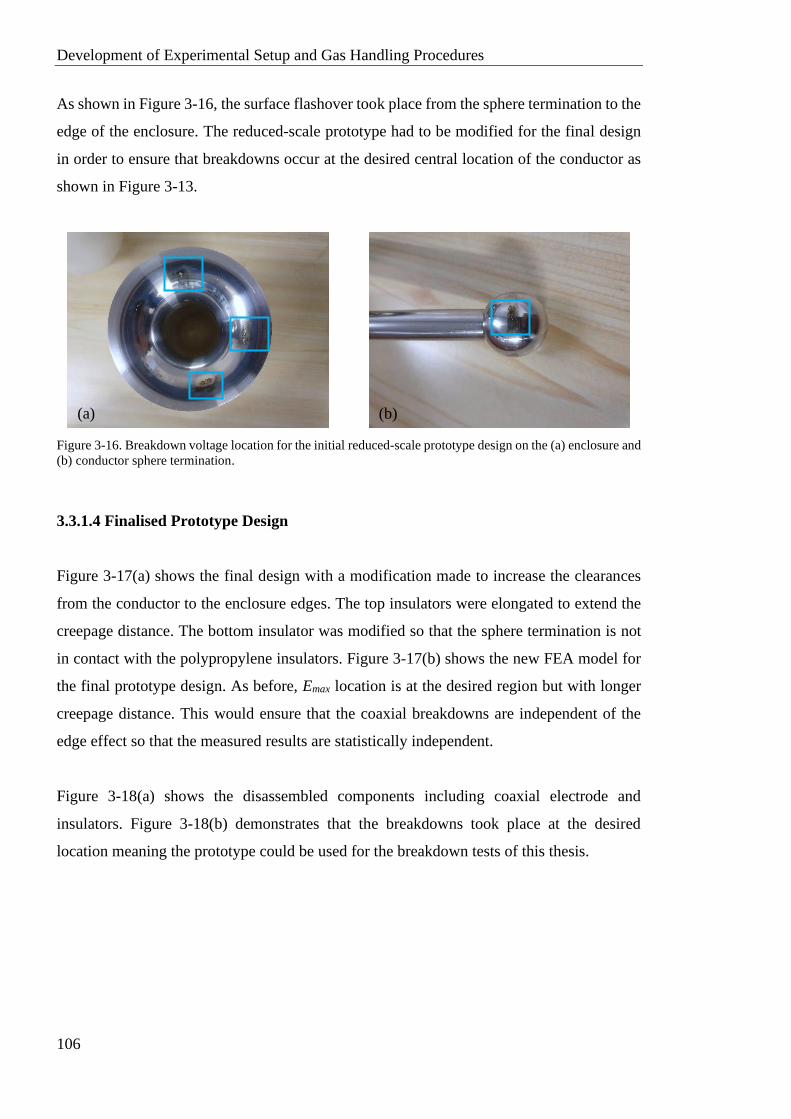
Development of Experimental Setup and Gas Handling Procedures
106
As shown in Figure 3-16, the surface flashover took place from the sphere termination to the
edge of the enclosure. The reduced-scale prototype had to be modified for the final design
in order to ensure that breakdowns occur at the desired central location of the conductor as
shown in Figure 3-13.
Figure 3-16. Breakdown voltage location for the initial reduced-scale prototype design on the (a) enclosure and
(b) conductor sphere termination.
3.3.1.4 Finalised Prototype Design
Figure 3-17(a) shows the final design with a modification made to increase the clearances
from the conductor to the enclosure edges. The top insulators were elongated to extend the
creepage distance. The bottom insulator was modified so that the sphere termination is not
in contact with the polypropylene insulators. Figure 3-17(b) shows the new FEA model for
the final prototype design. As before, Emax location is at the desired region but with longer
creepage distance. This would ensure that the coaxial breakdowns are independent of the
edge effect so that the measured results are statistically independent.
Figure 3-18(a) shows the disassembled components including coaxial electrode and
insulators. Figure 3-18(b) demonstrates that the breakdowns took place at the desired
location meaning the prototype could be used for the breakdown tests of this thesis.
(a) (b)
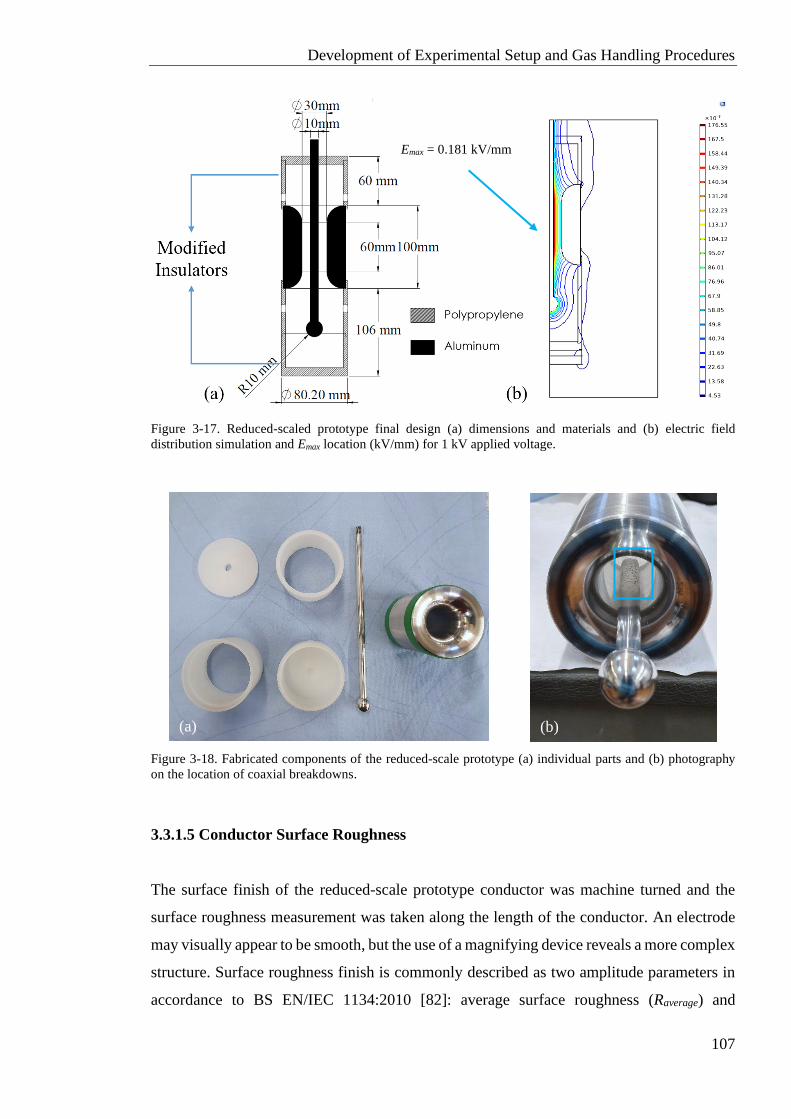
Development of Experimental Setup and Gas Handling Procedures
107
Figure 3-17. Reduced-scaled prototype final design (a) dimensions and materials and (b) electric field
distribution simulation and Emax location (kV/mm) for 1 kV applied voltage.
Figure 3-18. Fabricated components of the reduced-scale prototype (a) individual parts and (b) photography
on the location of coaxial breakdowns.
3.3.1.5 Conductor Surface Roughness
The surface finish of the reduced-scale prototype conductor was machine turned and the
surface roughness measurement was taken along the length of the conductor. An electrode
may visually appear to be smooth, but the use of a magnifying device reveals a more complex
structure. Surface roughness finish is commonly described as two amplitude parameters in
accordance to BS EN/IEC 1134:2010 [82]: average surface roughness (Raverage) and
(a) (b)
Emax = 0.181 kV/mm
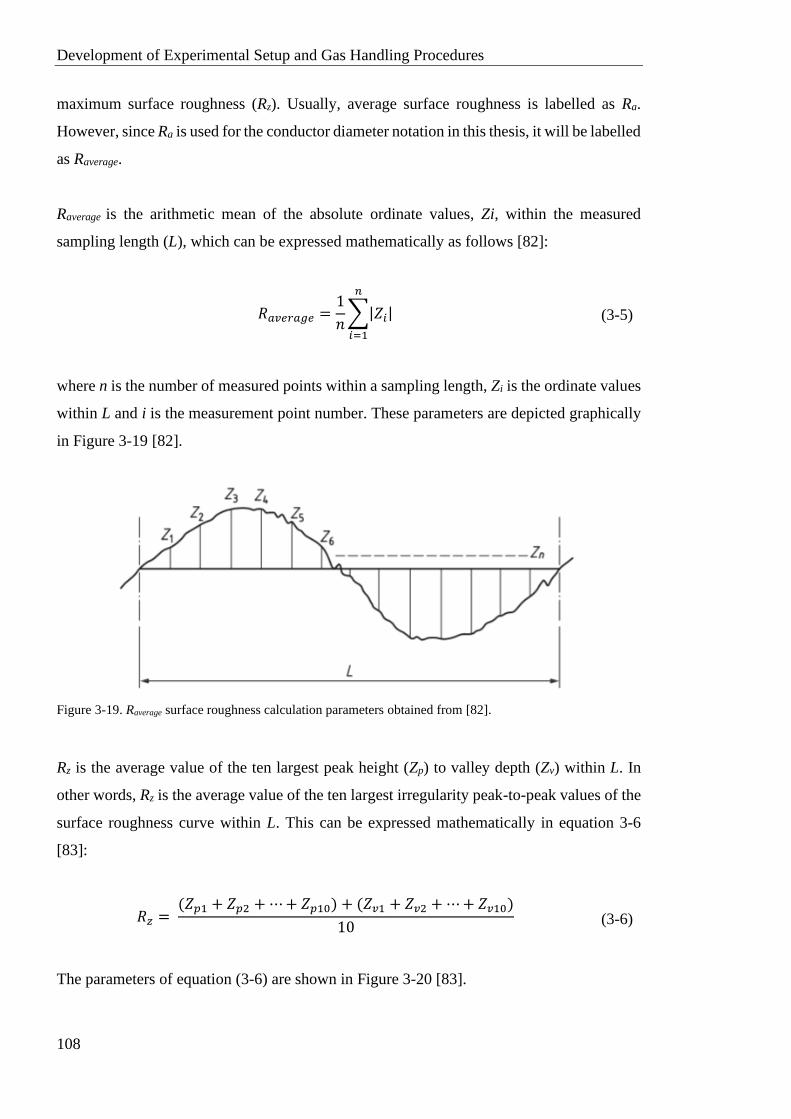
Development of Experimental Setup and Gas Handling Procedures
108
maximum surface roughness (Rz). Usually, average surface roughness is labelled as Ra.
However, since Ra is used for the conductor diameter notation in this thesis, it will be labelled
as Raverage.
Raverage is the arithmetic mean of the absolute ordinate values, Zi, within the measured
sampling length (L), which can be expressed mathematically as follows [82]:
𝑅𝑎𝑣𝑒𝑟𝑎𝑔𝑒 =1
𝑛∑|𝑍𝑖|
𝑛
𝑖=1
(3-5)
where n is the number of measured points within a sampling length, Zi is the ordinate values
within L and i is the measurement point number. These parameters are depicted graphically
in Figure 3-19 [82].
Figure 3-19. Raverage surface roughness calculation parameters obtained from [82].
Rz is the average value of the ten largest peak height (Zp) to valley depth (Zv) within L. In
other words, Rz is the average value of the ten largest irregularity peak-to-peak values of the
surface roughness curve within L. This can be expressed mathematically in equation 3-6
[83]:
𝑅𝑧 = (𝑍𝑝1 + 𝑍𝑝2 + ⋯ + 𝑍𝑝10) + (𝑍𝑣1 + 𝑍𝑣2 + ⋯ + 𝑍𝑣10)
10
(3-6)
The parameters of equation (3-6) are shown in Figure 3-20 [83].
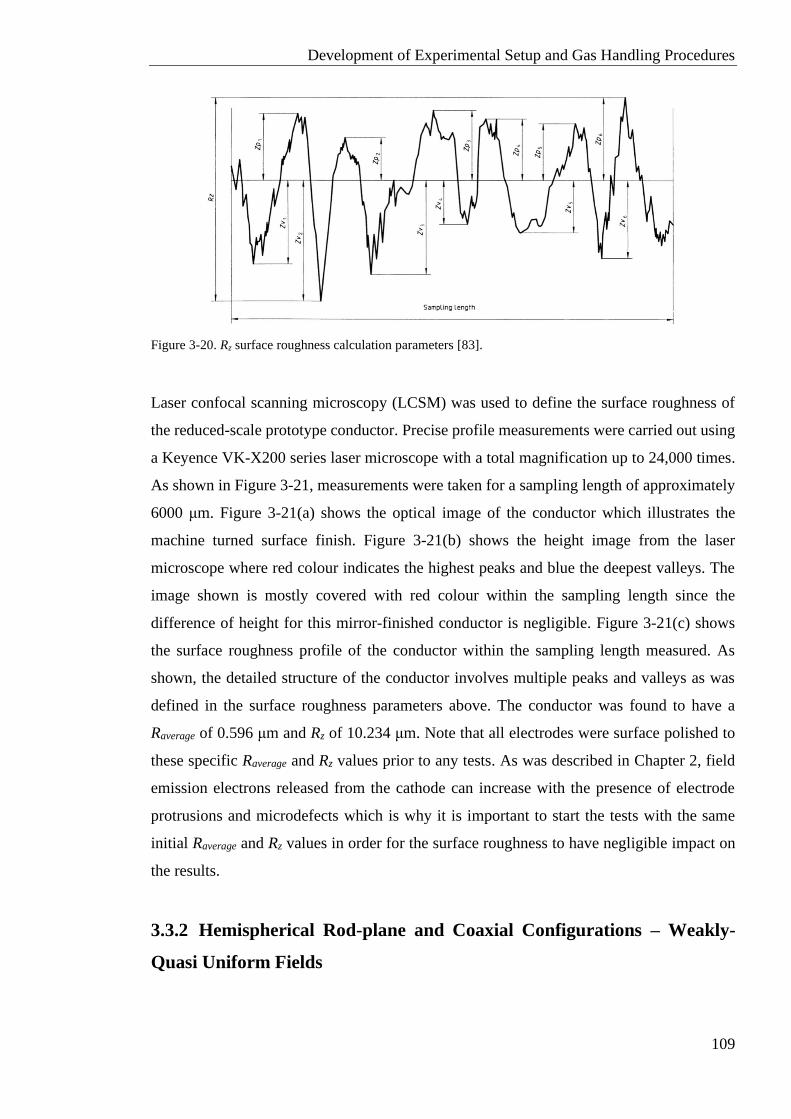
Development of Experimental Setup and Gas Handling Procedures
109
Figure 3-20. Rz surface roughness calculation parameters [83].
Laser confocal scanning microscopy (LCSM) was used to define the surface roughness of
the reduced-scale prototype conductor. Precise profile measurements were carried out using
a Keyence VK-X200 series laser microscope with a total magnification up to 24,000 times.
As shown in Figure 3-21, measurements were taken for a sampling length of approximately
6000 μm. Figure 3-21(a) shows the optical image of the conductor which illustrates the
machine turned surface finish. Figure 3-21(b) shows the height image from the laser
microscope where red colour indicates the highest peaks and blue the deepest valleys. The
image shown is mostly covered with red colour within the sampling length since the
difference of height for this mirror-finished conductor is negligible. Figure 3-21(c) shows
the surface roughness profile of the conductor within the sampling length measured. As
shown, the detailed structure of the conductor involves multiple peaks and valleys as was
defined in the surface roughness parameters above. The conductor was found to have a
Raverage of 0.596 μm and Rz of 10.234 μm. Note that all electrodes were surface polished to
these specific Raverage and Rz values prior to any tests. As was described in Chapter 2, field
emission electrons released from the cathode can increase with the presence of electrode
protrusions and microdefects which is why it is important to start the tests with the same
initial Raverage and Rz values in order for the surface roughness to have negligible impact on
the results.
3.3.2 Hemispherical Rod-plane and Coaxial Configurations – Weakly-
Quasi Uniform Fields
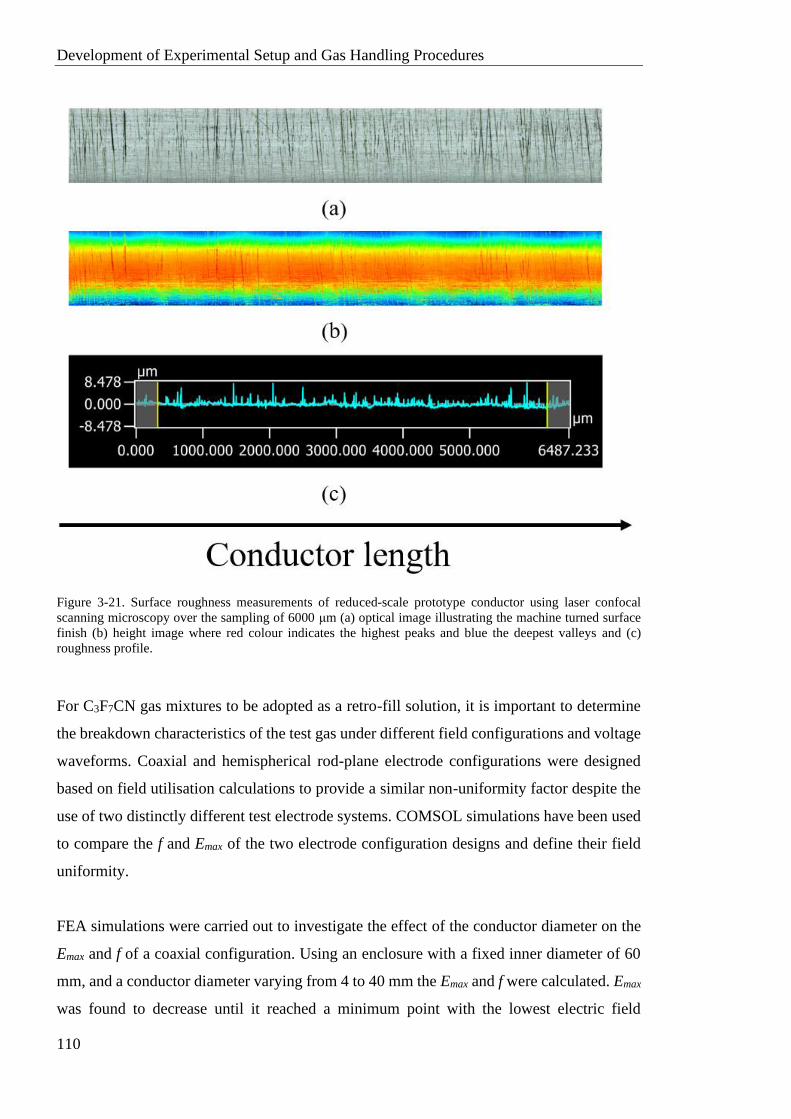
Development of Experimental Setup and Gas Handling Procedures
110
Figure 3-21. Surface roughness measurements of reduced-scale prototype conductor using laser confocal
scanning microscopy over the sampling of 6000 μm (a) optical image illustrating the machine turned surface
finish (b) height image where red colour indicates the highest peaks and blue the deepest valleys and (c)
roughness profile.
For C3F7CN gas mixtures to be adopted as a retro-fill solution, it is important to determine
the breakdown characteristics of the test gas under different field configurations and voltage
waveforms. Coaxial and hemispherical rod-plane electrode configurations were designed
based on field utilisation calculations to provide a similar non-uniformity factor despite the
use of two distinctly different test electrode systems. COMSOL simulations have been used
to compare the f and Emax of the two electrode configuration designs and define their field
uniformity.
FEA simulations were carried out to investigate the effect of the conductor diameter on the
Emax and f of a coaxial configuration. Using an enclosure with a fixed inner diameter of 60
mm, and a conductor diameter varying from 4 to 40 mm the Emax and f were calculated. Emax
was found to decrease until it reached a minimum point with the lowest electric field
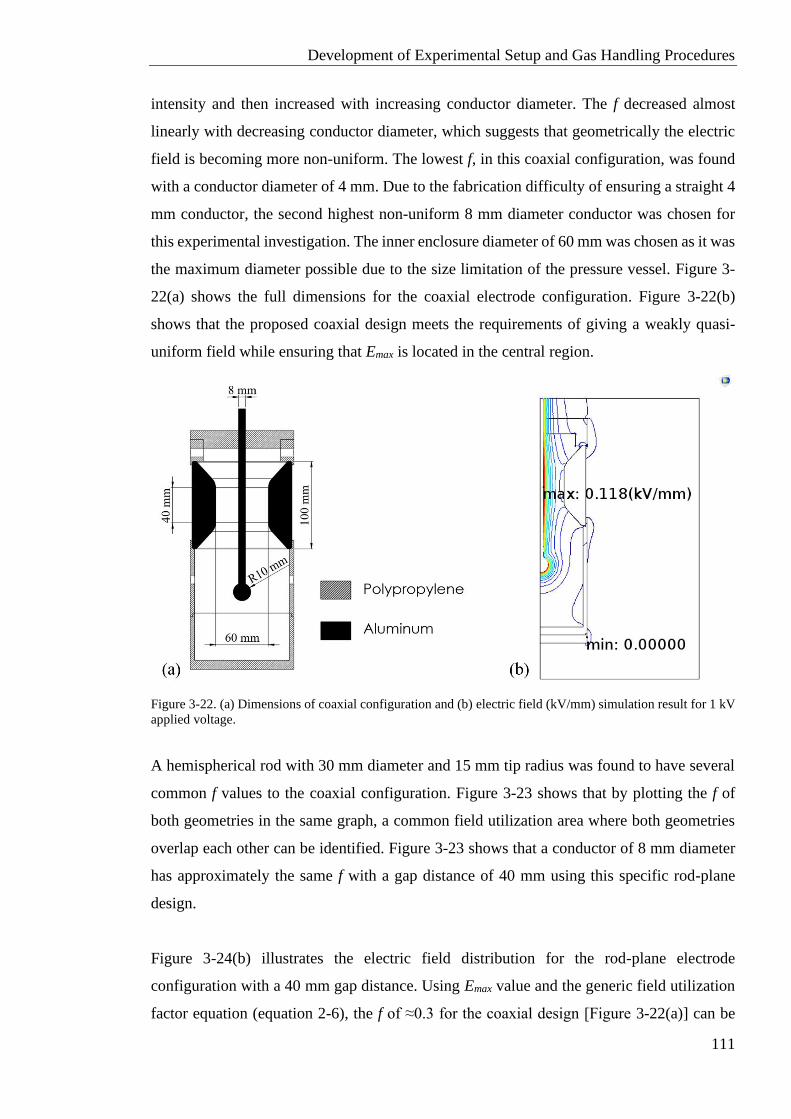
Development of Experimental Setup and Gas Handling Procedures
111
intensity and then increased with increasing conductor diameter. The f decreased almost
linearly with decreasing conductor diameter, which suggests that geometrically the electric
field is becoming more non-uniform. The lowest f, in this coaxial configuration, was found
with a conductor diameter of 4 mm. Due to the fabrication difficulty of ensuring a straight 4
mm conductor, the second highest non-uniform 8 mm diameter conductor was chosen for
this experimental investigation. The inner enclosure diameter of 60 mm was chosen as it was
the maximum diameter possible due to the size limitation of the pressure vessel. Figure 3-
22(a) shows the full dimensions for the coaxial electrode configuration. Figure 3-22(b)
shows that the proposed coaxial design meets the requirements of giving a weakly quasi-
uniform field while ensuring that Emax is located in the central region.
Figure 3-22. (a) Dimensions of coaxial configuration and (b) electric field (kV/mm) simulation result for 1 kV
applied voltage.
A hemispherical rod with 30 mm diameter and 15 mm tip radius was found to have several
common f values to the coaxial configuration. Figure 3-23 shows that by plotting the f of
both geometries in the same graph, a common field utilization area where both geometries
overlap each other can be identified. Figure 3-23 shows that a conductor of 8 mm diameter
has approximately the same f with a gap distance of 40 mm using this specific rod-plane
design.
Figure 3-24(b) illustrates the electric field distribution for the rod-plane electrode
configuration with a 40 mm gap distance. Using Emax value and the generic field utilization
factor equation (equation 2-6), the f of ≈0.3 for the coaxial design [Figure 3-22(a)] can be
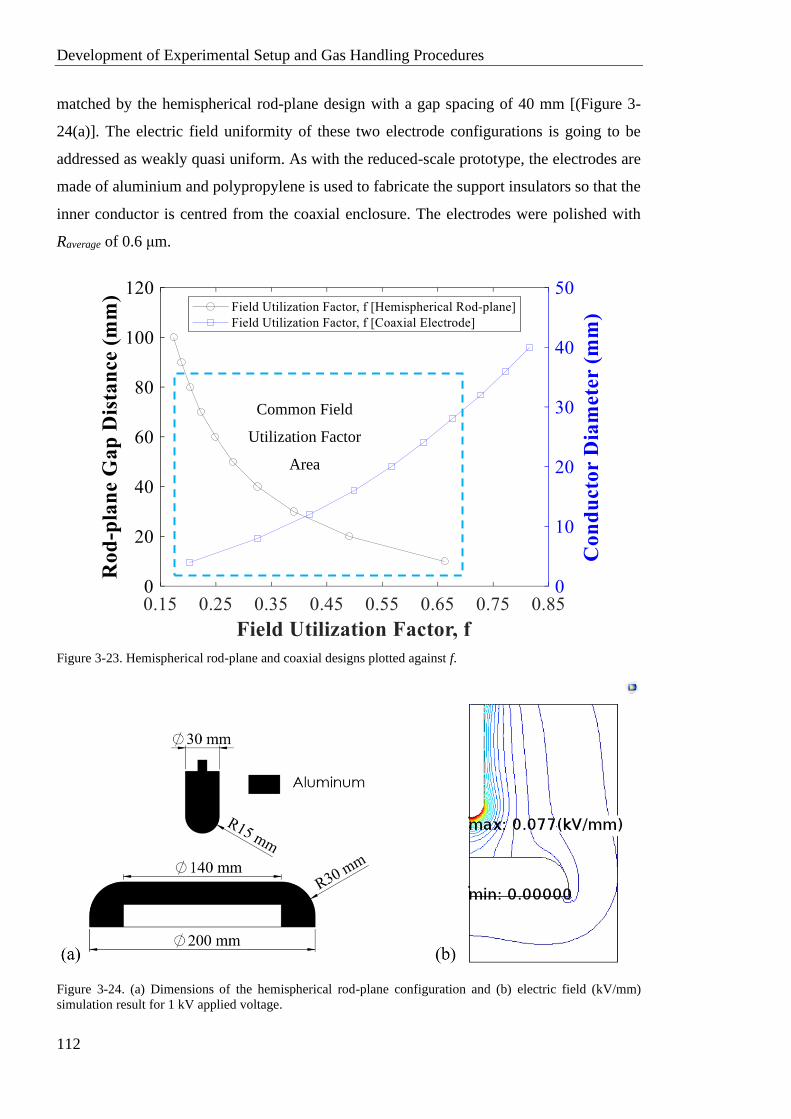
Development of Experimental Setup and Gas Handling Procedures
112
matched by the hemispherical rod-plane design with a gap spacing of 40 mm [(Figure 3-
24(a)]. The electric field uniformity of these two electrode configurations is going to be
addressed as weakly quasi uniform. As with the reduced-scale prototype, the electrodes are
made of aluminium and polypropylene is used to fabricate the support insulators so that the
inner conductor is centred from the coaxial enclosure. The electrodes were polished with
Raverage of 0.6 μm.
Figure 3-23. Hemispherical rod-plane and coaxial designs plotted against f.
Figure 3-24. (a) Dimensions of the hemispherical rod-plane configuration and (b) electric field (kV/mm)
simulation result for 1 kV applied voltage.
Common Field
Utilization Factor
Area
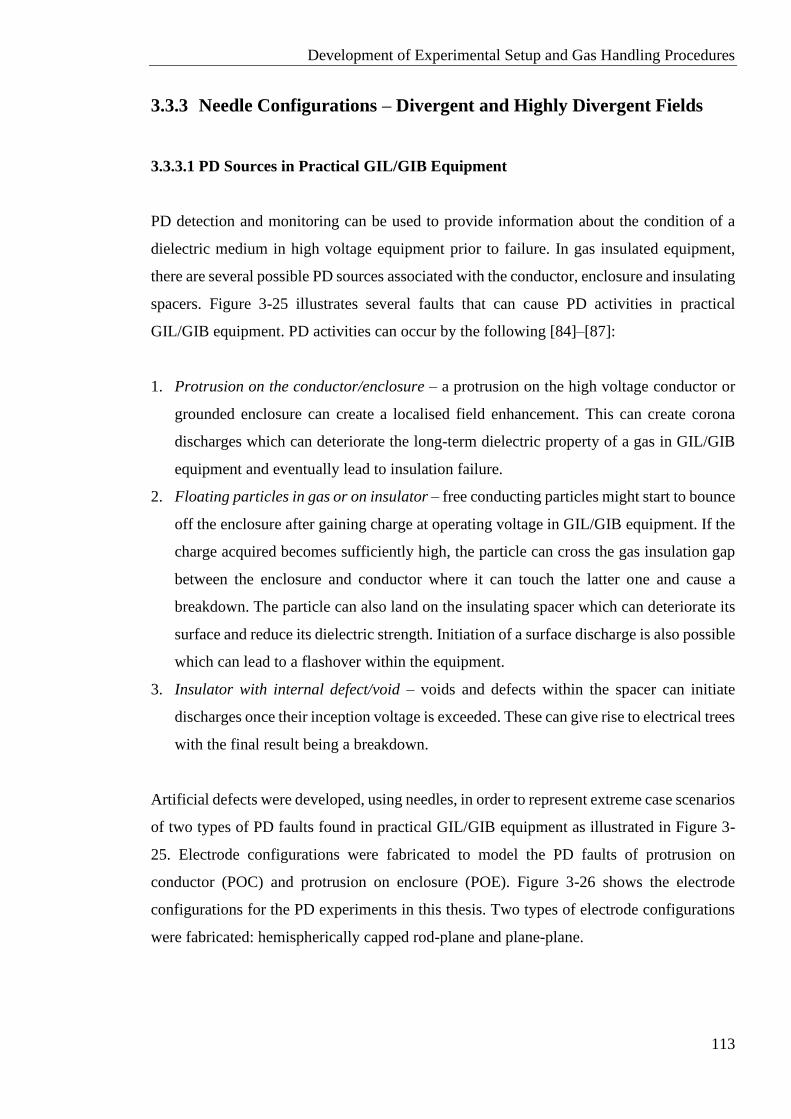
Development of Experimental Setup and Gas Handling Procedures
113
3.3.3 Needle Configurations – Divergent and Highly Divergent Fields
3.3.3.1 PD Sources in Practical GIL/GIB Equipment
PD detection and monitoring can be used to provide information about the condition of a
dielectric medium in high voltage equipment prior to failure. In gas insulated equipment,
there are several possible PD sources associated with the conductor, enclosure and insulating
spacers. Figure 3-25 illustrates several faults that can cause PD activities in practical
GIL/GIB equipment. PD activities can occur by the following [84]–[87]:
1. Protrusion on the conductor/enclosure – a protrusion on the high voltage conductor or
grounded enclosure can create a localised field enhancement. This can create corona
discharges which can deteriorate the long-term dielectric property of a gas in GIL/GIB
equipment and eventually lead to insulation failure.
2. Floating particles in gas or on insulator – free conducting particles might start to bounce
off the enclosure after gaining charge at operating voltage in GIL/GIB equipment. If the
charge acquired becomes sufficiently high, the particle can cross the gas insulation gap
between the enclosure and conductor where it can touch the latter one and cause a
breakdown. The particle can also land on the insulating spacer which can deteriorate its
surface and reduce its dielectric strength. Initiation of a surface discharge is also possible
which can lead to a flashover within the equipment.
3. Insulator with internal defect/void – voids and defects within the spacer can initiate
discharges once their inception voltage is exceeded. These can give rise to electrical trees
with the final result being a breakdown.
Artificial defects were developed, using needles, in order to represent extreme case scenarios
of two types of PD faults found in practical GIL/GIB equipment as illustrated in Figure 3-
25. Electrode configurations were fabricated to model the PD faults of protrusion on
conductor (POC) and protrusion on enclosure (POE). Figure 3-26 shows the electrode
configurations for the PD experiments in this thesis. Two types of electrode configurations
were fabricated: hemispherically capped rod-plane and plane-plane.
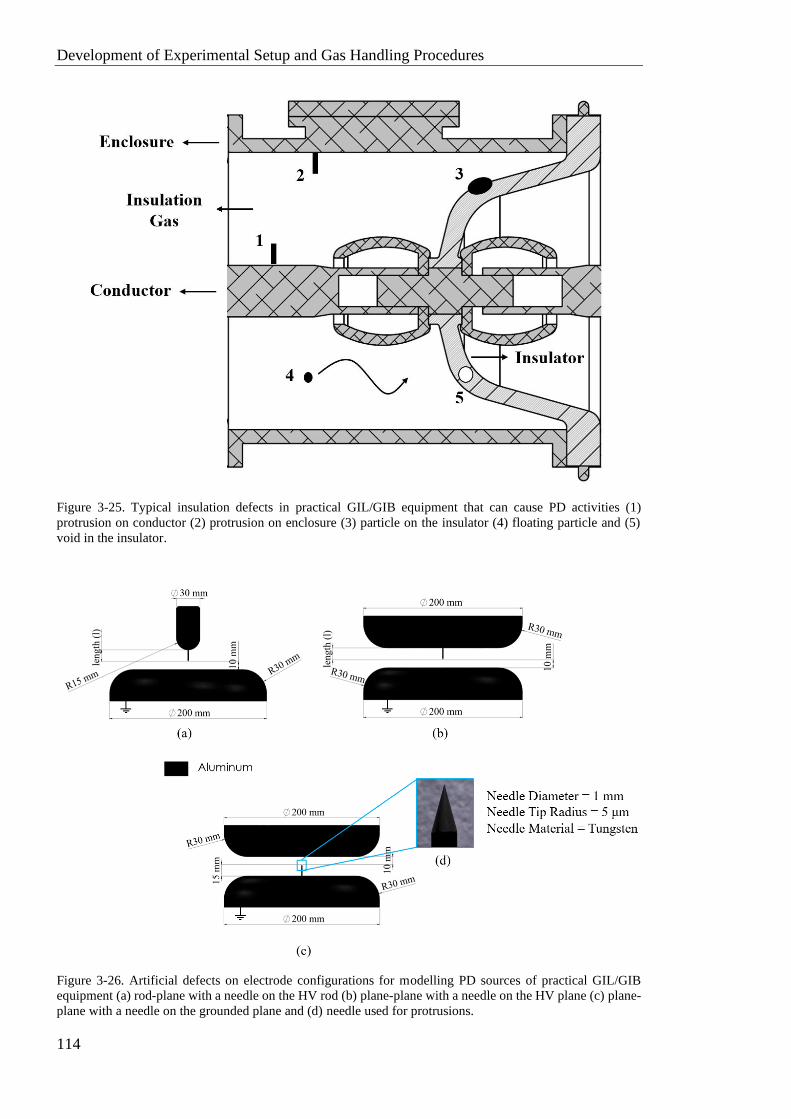
Development of Experimental Setup and Gas Handling Procedures
114
Figure 3-25. Typical insulation defects in practical GIL/GIB equipment that can cause PD activities (1)
protrusion on conductor (2) protrusion on enclosure (3) particle on the insulator (4) floating particle and (5)
void in the insulator.
Figure 3-26. Artificial defects on electrode configurations for modelling PD sources of practical GIL/GIB
equipment (a) rod-plane with a needle on the HV rod (b) plane-plane with a needle on the HV plane (c) plane-
plane with a needle on the grounded plane and (d) needle used for protrusions.
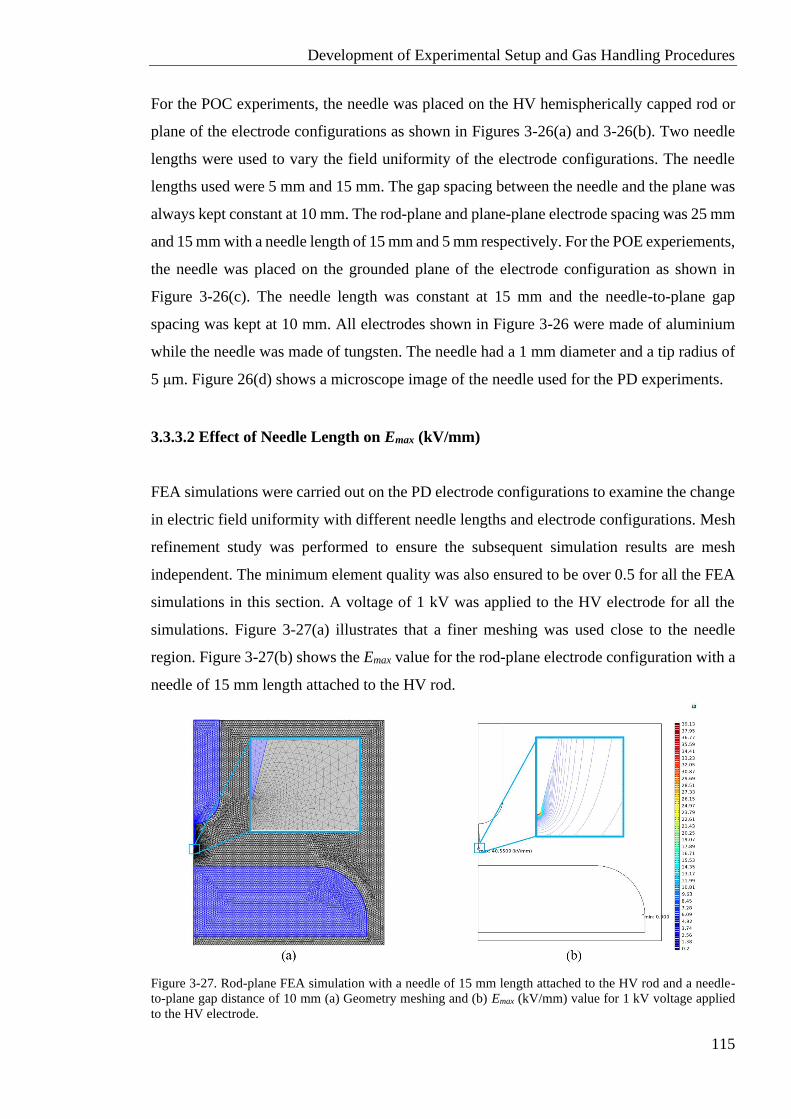
Development of Experimental Setup and Gas Handling Procedures
115
For the POC experiments, the needle was placed on the HV hemispherically capped rod or
plane of the electrode configurations as shown in Figures 3-26(a) and 3-26(b). Two needle
lengths were used to vary the field uniformity of the electrode configurations. The needle
lengths used were 5 mm and 15 mm. The gap spacing between the needle and the plane was
always kept constant at 10 mm. The rod-plane and plane-plane electrode spacing was 25 mm
and 15 mm with a needle length of 15 mm and 5 mm respectively. For the POE experiements,
the needle was placed on the grounded plane of the electrode configuration as shown in
Figure 3-26(c). The needle length was constant at 15 mm and the needle-to-plane gap
spacing was kept at 10 mm. All electrodes shown in Figure 3-26 were made of aluminium
while the needle was made of tungsten. The needle had a 1 mm diameter and a tip radius of
5 μm. Figure 26(d) shows a microscope image of the needle used for the PD experiments.
3.3.3.2 Effect of Needle Length on Emax (kV/mm)
FEA simulations were carried out on the PD electrode configurations to examine the change
in electric field uniformity with different needle lengths and electrode configurations. Mesh
refinement study was performed to ensure the subsequent simulation results are mesh
independent. The minimum element quality was also ensured to be over 0.5 for all the FEA
simulations in this section. A voltage of 1 kV was applied to the HV electrode for all the
simulations. Figure 3-27(a) illustrates that a finer meshing was used close to the needle
region. Figure 3-27(b) shows the Emax value for the rod-plane electrode configuration with a
needle of 15 mm length attached to the HV rod.
Figure 3-27. Rod-plane FEA simulation with a needle of 15 mm length attached to the HV rod and a needle-
to-plane gap distance of 10 mm (a) Geometry meshing and (b) Emax (kV/mm) value for 1 kV voltage applied
to the HV electrode.
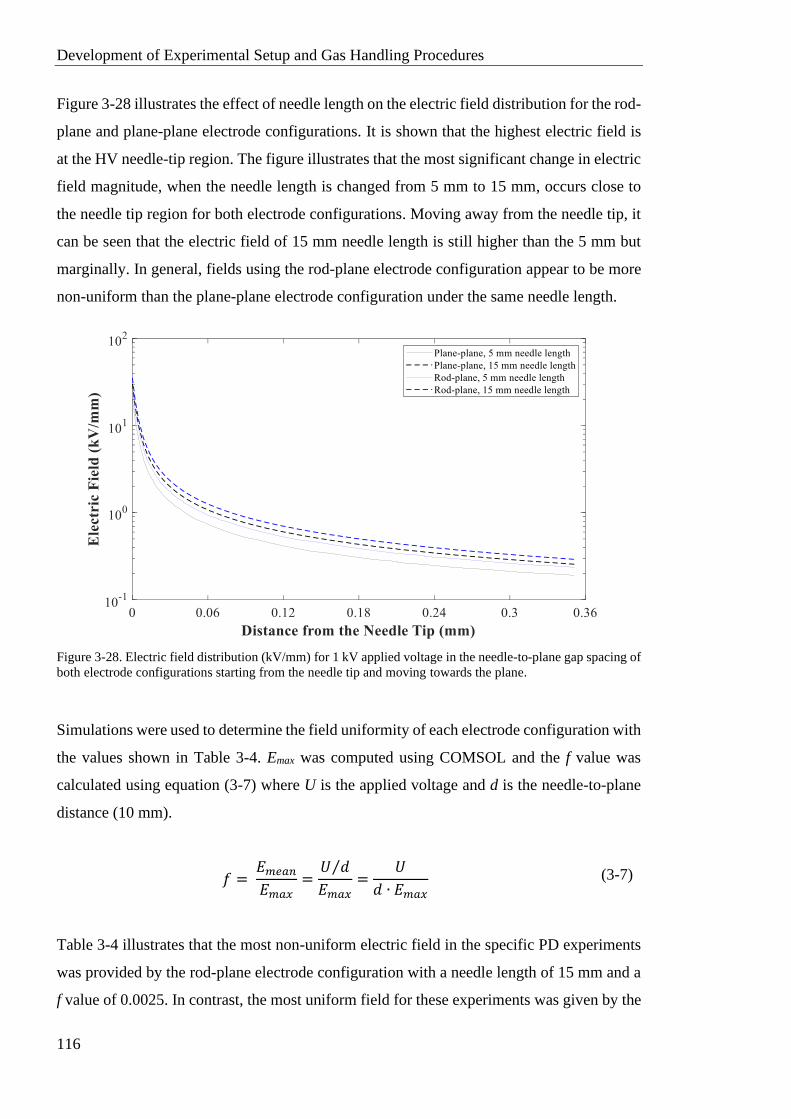
Development of Experimental Setup and Gas Handling Procedures
116
Figure 3-28 illustrates the effect of needle length on the electric field distribution for the rod-
plane and plane-plane electrode configurations. It is shown that the highest electric field is
at the HV needle-tip region. The figure illustrates that the most significant change in electric
field magnitude, when the needle length is changed from 5 mm to 15 mm, occurs close to
the needle tip region for both electrode configurations. Moving away from the needle tip, it
can be seen that the electric field of 15 mm needle length is still higher than the 5 mm but
marginally. In general, fields using the rod-plane electrode configuration appear to be more
non-uniform than the plane-plane electrode configuration under the same needle length.
Figure 3-28. Electric field distribution (kV/mm) for 1 kV applied voltage in the needle-to-plane gap spacing of
both electrode configurations starting from the needle tip and moving towards the plane.
Simulations were used to determine the field uniformity of each electrode configuration with
the values shown in Table 3-4. Emax was computed using COMSOL and the f value was
calculated using equation (3-7) where U is the applied voltage and d is the needle-to-plane
distance (10 mm).
𝑓 = 𝐸𝑚𝑒𝑎𝑛
𝐸𝑚𝑎𝑥=
𝑈 𝑑⁄
𝐸𝑚𝑎𝑥=
𝑈
𝑑 ∙ 𝐸𝑚𝑎𝑥
(3-7)
Table 3-4 illustrates that the most non-uniform electric field in the specific PD experiments
was provided by the rod-plane electrode configuration with a needle length of 15 mm and a
f value of 0.0025. In contrast, the most uniform field for these experiments was given by the
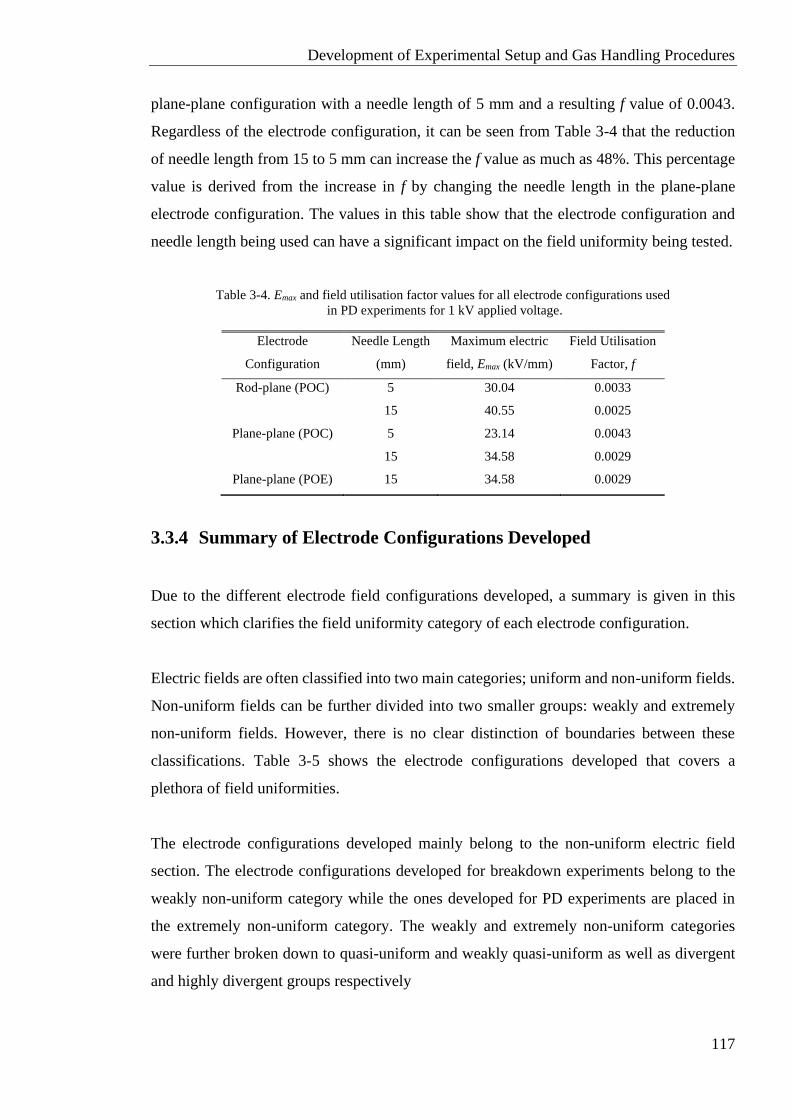
Development of Experimental Setup and Gas Handling Procedures
117
plane-plane configuration with a needle length of 5 mm and a resulting f value of 0.0043.
Regardless of the electrode configuration, it can be seen from Table 3-4 that the reduction
of needle length from 15 to 5 mm can increase the f value as much as 48%. This percentage
value is derived from the increase in f by changing the needle length in the plane-plane
electrode configuration. The values in this table show that the electrode configuration and
needle length being used can have a significant impact on the field uniformity being tested.
Table 3-4. Emax and field utilisation factor values for all electrode configurations used
in PD experiments for 1 kV applied voltage.
Electrode
Configuration
Needle Length
(mm)
Maximum electric
field, Emax (kV/mm)
Field Utilisation
Factor, f
Rod-plane (POC) 5 30.04 0.0033
15 40.55 0.0025
Plane-plane (POC) 5 23.14 0.0043
15 34.58 0.0029
Plane-plane (POE) 15 34.58 0.0029
3.3.4 Summary of Electrode Configurations Developed
Due to the different electrode field configurations developed, a summary is given in this
section which clarifies the field uniformity category of each electrode configuration.
Electric fields are often classified into two main categories; uniform and non-uniform fields.
Non-uniform fields can be further divided into two smaller groups: weakly and extremely
non-uniform fields. However, there is no clear distinction of boundaries between these
classifications. Table 3-5 shows the electrode configurations developed that covers a
plethora of field uniformities.
The electrode configurations developed mainly belong to the non-uniform electric field
section. The electrode configurations developed for breakdown experiments belong to the
weakly non-uniform category while the ones developed for PD experiments are placed in
the extremely non-uniform category. The weakly and extremely non-uniform categories
were further broken down to quasi-uniform and weakly quasi-uniform as well as divergent
and highly divergent groups respectively
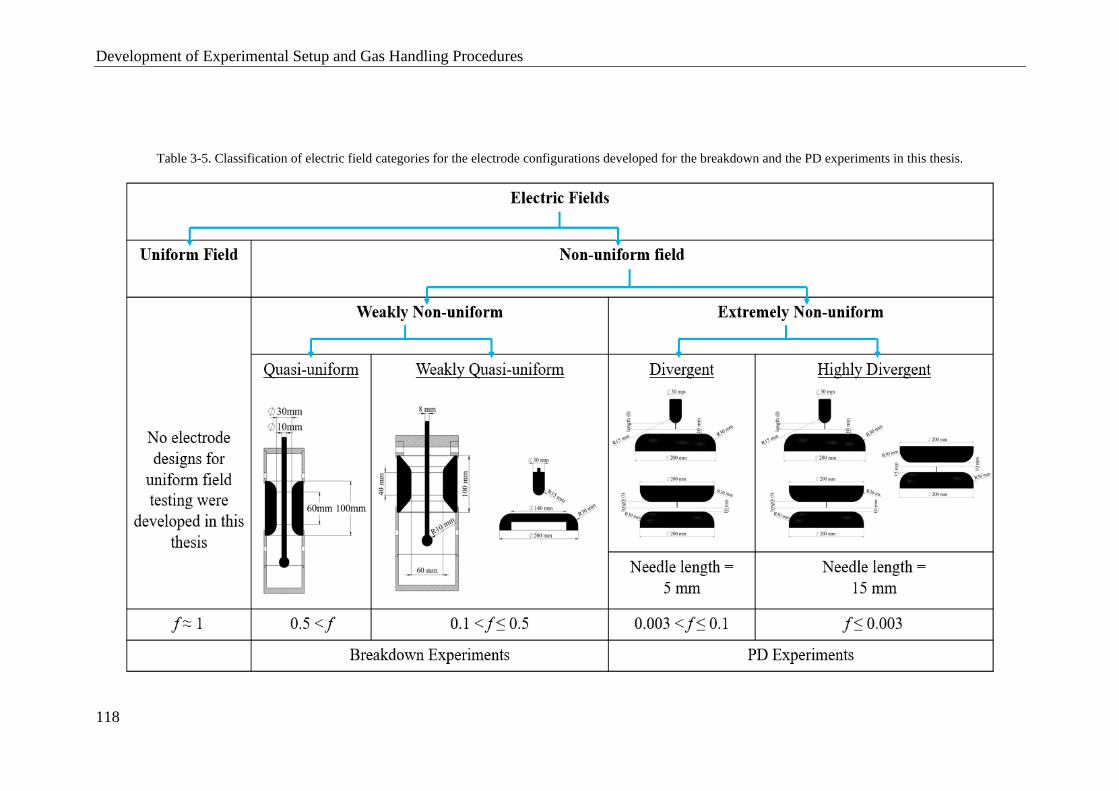
Development of Experimental Setup and Gas Handling Procedures
118
Table 3-5. Classification of electric field categories for the electrode configurations developed for the breakdown and the PD experiments in this thesis.
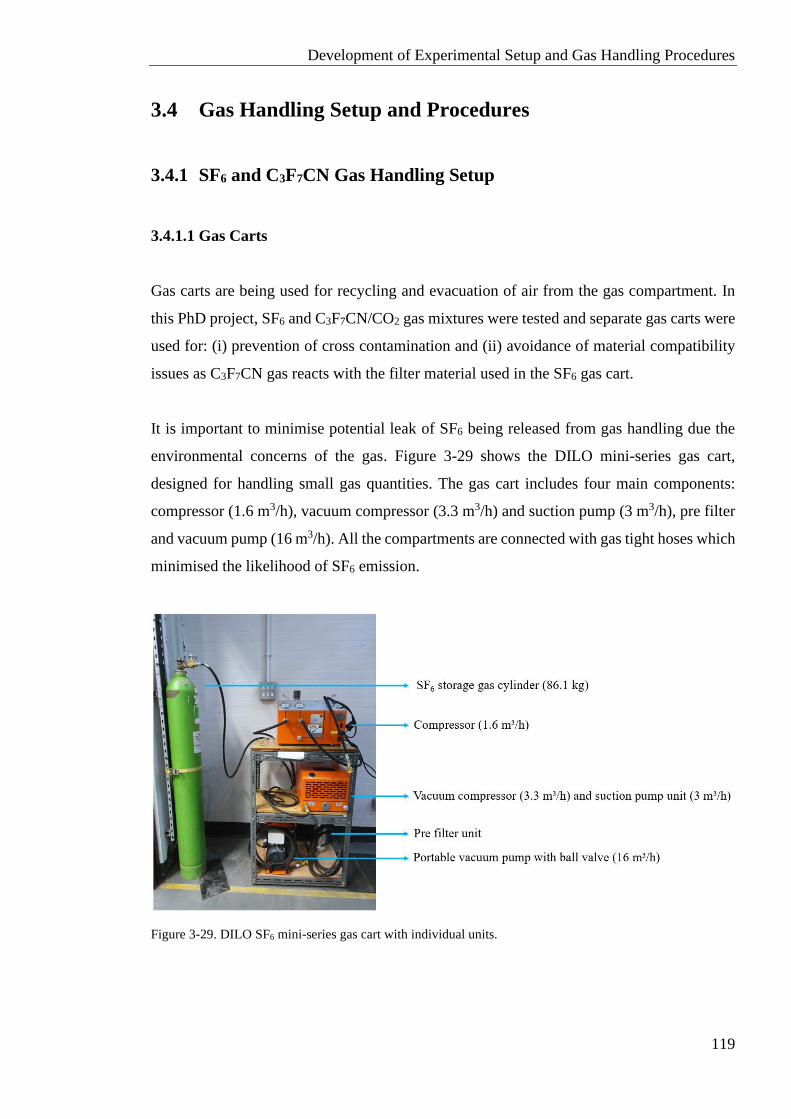
Development of Experimental Setup and Gas Handling Procedures
119
3.4 Gas Handling Setup and Procedures
3.4.1 SF6 and C3F7CN Gas Handling Setup
3.4.1.1 Gas Carts
Gas carts are being used for recycling and evacuation of air from the gas compartment. In
this PhD project, SF6 and C3F7CN/CO2 gas mixtures were tested and separate gas carts were
used for: (i) prevention of cross contamination and (ii) avoidance of material compatibility
issues as C3F7CN gas reacts with the filter material used in the SF6 gas cart.
It is important to minimise potential leak of SF6 being released from gas handling due the
environmental concerns of the gas. Figure 3-29 shows the DILO mini-series gas cart,
designed for handling small gas quantities. The gas cart includes four main components:
compressor (1.6 m3/h), vacuum compressor (3.3 m3/h) and suction pump (3 m3/h), pre filter
and vacuum pump (16 m3/h). All the compartments are connected with gas tight hoses which
minimised the likelihood of SF6 emission.
Figure 3-29. DILO SF6 mini-series gas cart with individual units.
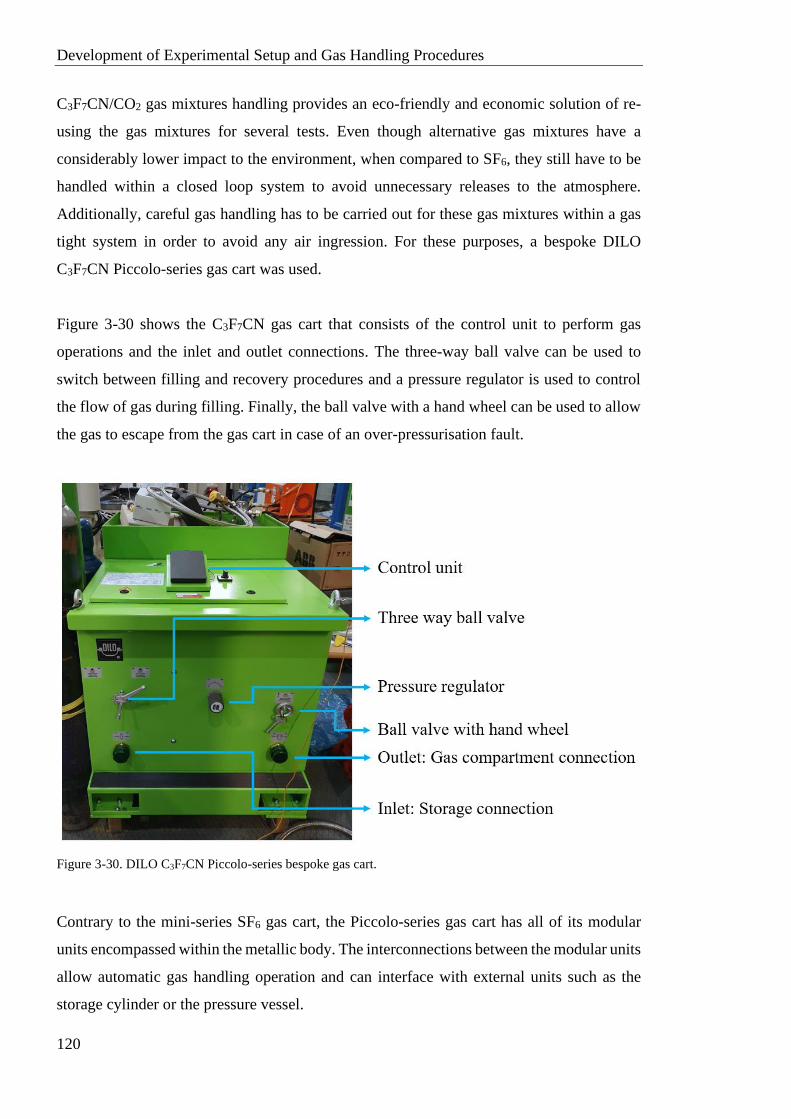
Development of Experimental Setup and Gas Handling Procedures
120
C3F7CN/CO2 gas mixtures handling provides an eco-friendly and economic solution of re-
using the gas mixtures for several tests. Even though alternative gas mixtures have a
considerably lower impact to the environment, when compared to SF6, they still have to be
handled within a closed loop system to avoid unnecessary releases to the atmosphere.
Additionally, careful gas handling has to be carried out for these gas mixtures within a gas
tight system in order to avoid any air ingression. For these purposes, a bespoke DILO
C3F7CN Piccolo-series gas cart was used.
Figure 3-30 shows the C3F7CN gas cart that consists of the control unit to perform gas
operations and the inlet and outlet connections. The three-way ball valve can be used to
switch between filling and recovery procedures and a pressure regulator is used to control
the flow of gas during filling. Finally, the ball valve with a hand wheel can be used to allow
the gas to escape from the gas cart in case of an over-pressurisation fault.
Figure 3-30. DILO C3F7CN Piccolo-series bespoke gas cart.
Contrary to the mini-series SF6 gas cart, the Piccolo-series gas cart has all of its modular
units encompassed within the metallic body. The interconnections between the modular units
allow automatic gas handling operation and can interface with external units such as the
storage cylinder or the pressure vessel.
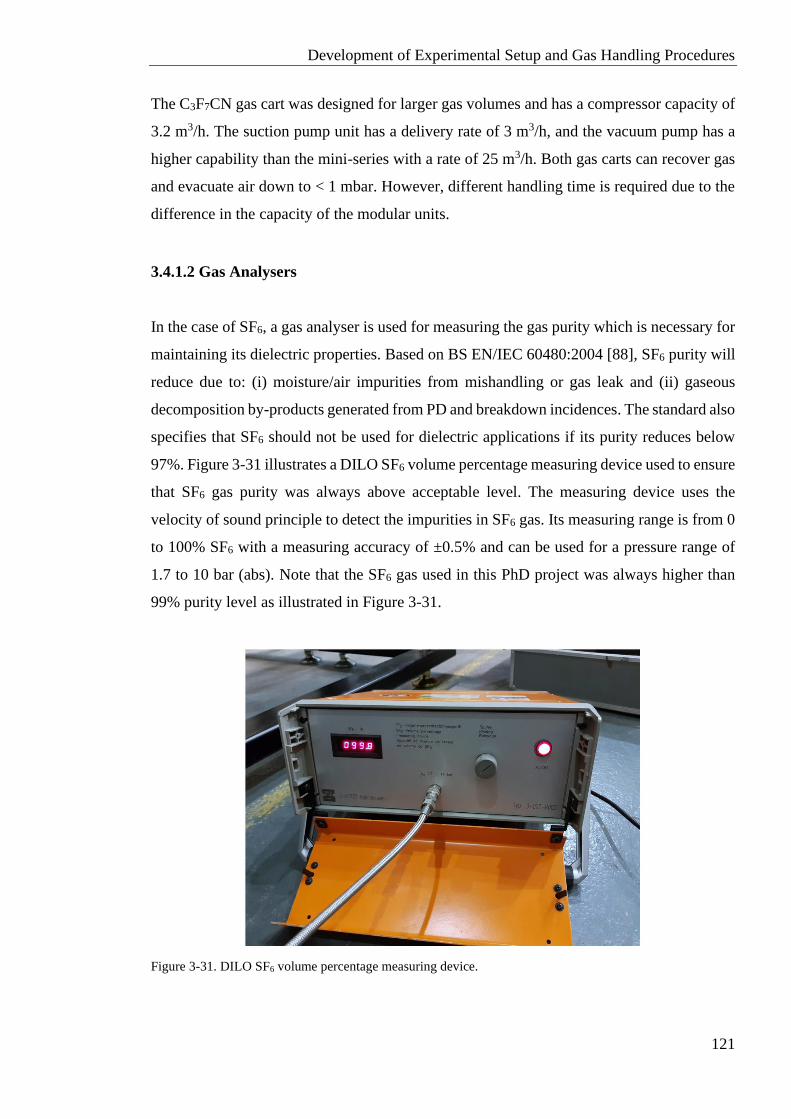
Development of Experimental Setup and Gas Handling Procedures
121
The C3F7CN gas cart was designed for larger gas volumes and has a compressor capacity of
3.2 m3/h. The suction pump unit has a delivery rate of 3 m3/h, and the vacuum pump has a
higher capability than the mini-series with a rate of 25 m3/h. Both gas carts can recover gas
and evacuate air down to < 1 mbar. However, different handling time is required due to the
difference in the capacity of the modular units.
3.4.1.2 Gas Analysers
In the case of SF6, a gas analyser is used for measuring the gas purity which is necessary for
maintaining its dielectric properties. Based on BS EN/IEC 60480:2004 [88], SF6 purity will
reduce due to: (i) moisture/air impurities from mishandling or gas leak and (ii) gaseous
decomposition by-products generated from PD and breakdown incidences. The standard also
specifies that SF6 should not be used for dielectric applications if its purity reduces below
97%. Figure 3-31 illustrates a DILO SF6 volume percentage measuring device used to ensure
that SF6 gas purity was always above acceptable level. The measuring device uses the
velocity of sound principle to detect the impurities in SF6 gas. Its measuring range is from 0
to 100% SF6 with a measuring accuracy of ±0.5% and can be used for a pressure range of
1.7 to 10 bar (abs). Note that the SF6 gas used in this PhD project was always higher than
99% purity level as illustrated in Figure 3-31.
Figure 3-31. DILO SF6 volume percentage measuring device.
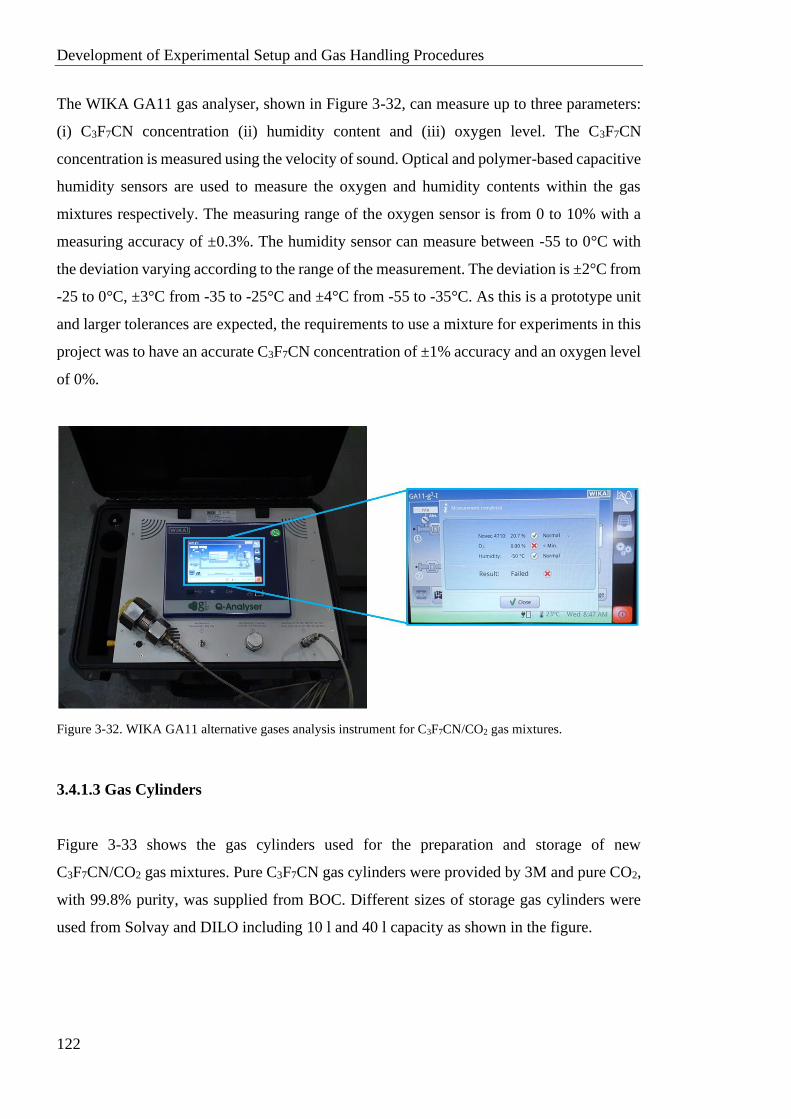
Development of Experimental Setup and Gas Handling Procedures
122
The WIKA GA11 gas analyser, shown in Figure 3-32, can measure up to three parameters:
(i) C3F7CN concentration (ii) humidity content and (iii) oxygen level. The C3F7CN
concentration is measured using the velocity of sound. Optical and polymer-based capacitive
humidity sensors are used to measure the oxygen and humidity contents within the gas
mixtures respectively. The measuring range of the oxygen sensor is from 0 to 10% with a
measuring accuracy of ±0.3%. The humidity sensor can measure between -55 to 0°C with
the deviation varying according to the range of the measurement. The deviation is ±2°C from
-25 to 0°C, ±3°C from -35 to -25°C and ±4°C from -55 to -35°C. As this is a prototype unit
and larger tolerances are expected, the requirements to use a mixture for experiments in this
project was to have an accurate C3F7CN concentration of ±1% accuracy and an oxygen level
of 0%.
Figure 3-32. WIKA GA11 alternative gases analysis instrument for C3F7CN/CO2 gas mixtures.
3.4.1.3 Gas Cylinders
Figure 3-33 shows the gas cylinders used for the preparation and storage of new
C3F7CN/CO2 gas mixtures. Pure C3F7CN gas cylinders were provided by 3M and pure CO2,
with 99.8% purity, was supplied from BOC. Different sizes of storage gas cylinders were
used from Solvay and DILO including 10 l and 40 l capacity as shown in the figure.
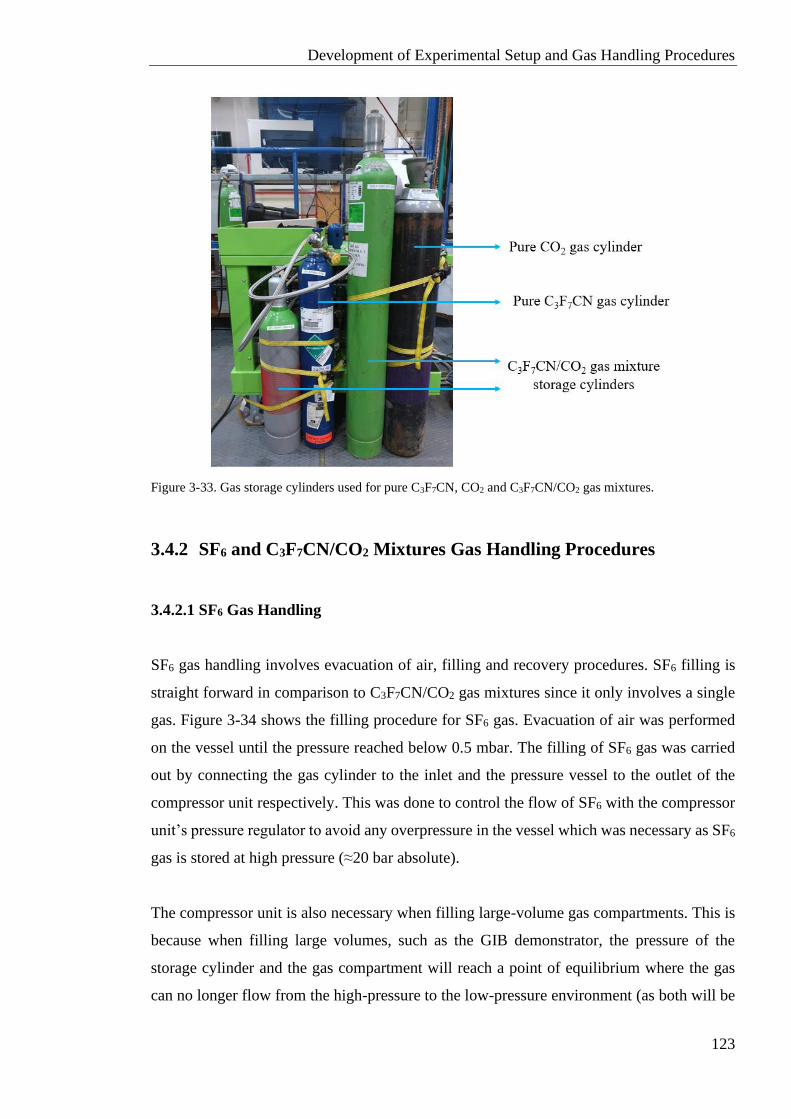
Development of Experimental Setup and Gas Handling Procedures
123
Figure 3-33. Gas storage cylinders used for pure C3F7CN, CO2 and C3F7CN/CO2 gas mixtures.
3.4.2 SF6 and C3F7CN/CO2 Mixtures Gas Handling Procedures
3.4.2.1 SF6 Gas Handling
SF6 gas handling involves evacuation of air, filling and recovery procedures. SF6 filling is
straight forward in comparison to C3F7CN/CO2 gas mixtures since it only involves a single
gas. Figure 3-34 shows the filling procedure for SF6 gas. Evacuation of air was performed
on the vessel until the pressure reached below 0.5 mbar. The filling of SF6 gas was carried
out by connecting the gas cylinder to the inlet and the pressure vessel to the outlet of the
compressor unit respectively. This was done to control the flow of SF6 with the compressor
unit’s pressure regulator to avoid any overpressure in the vessel which was necessary as SF6
gas is stored at high pressure (≈20 bar absolute).
The compressor unit is also necessary when filling large-volume gas compartments. This is
because when filling large volumes, such as the GIB demonstrator, the pressure of the
storage cylinder and the gas compartment will reach a point of equilibrium where the gas
can no longer flow from the high-pressure to the low-pressure environment (as both will be
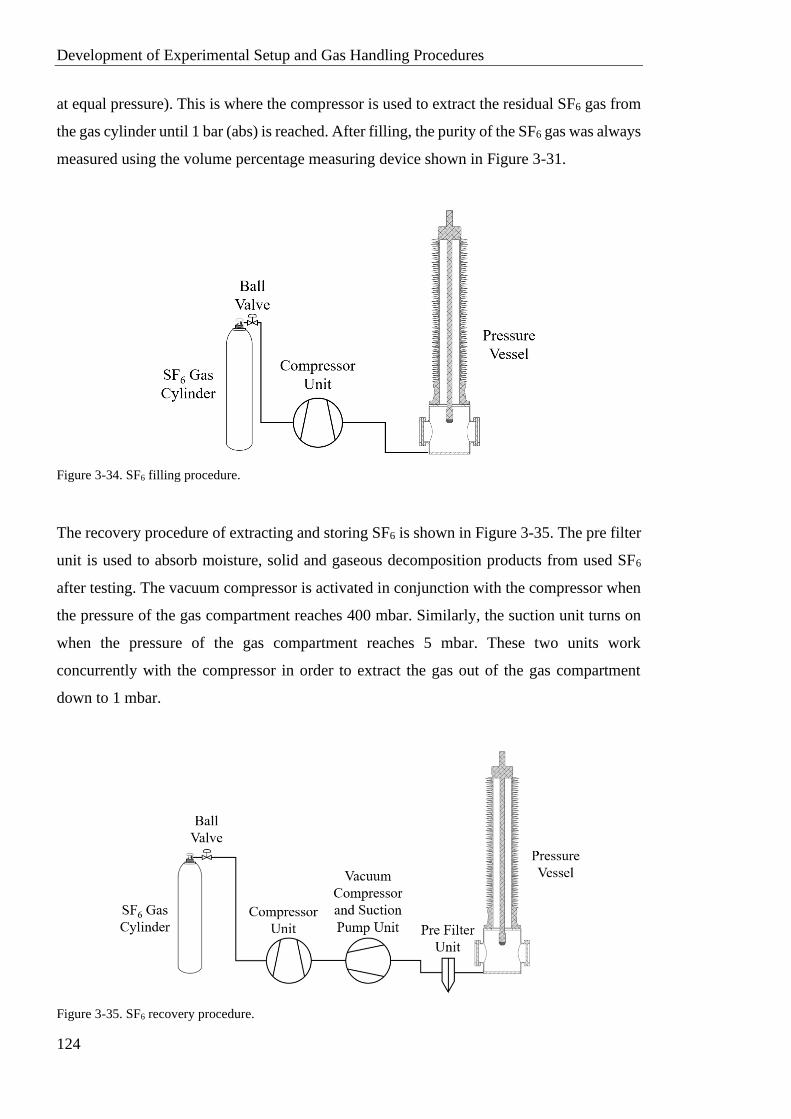
Development of Experimental Setup and Gas Handling Procedures
124
at equal pressure). This is where the compressor is used to extract the residual SF6 gas from
the gas cylinder until 1 bar (abs) is reached. After filling, the purity of the SF6 gas was always
measured using the volume percentage measuring device shown in Figure 3-31.
Figure 3-34. SF6 filling procedure.
The recovery procedure of extracting and storing SF6 is shown in Figure 3-35. The pre filter
unit is used to absorb moisture, solid and gaseous decomposition products from used SF6
after testing. The vacuum compressor is activated in conjunction with the compressor when
the pressure of the gas compartment reaches 400 mbar. Similarly, the suction unit turns on
when the pressure of the gas compartment reaches 5 mbar. These two units work
concurrently with the compressor in order to extract the gas out of the gas compartment
down to 1 mbar.
Figure 3-35. SF6 recovery procedure.
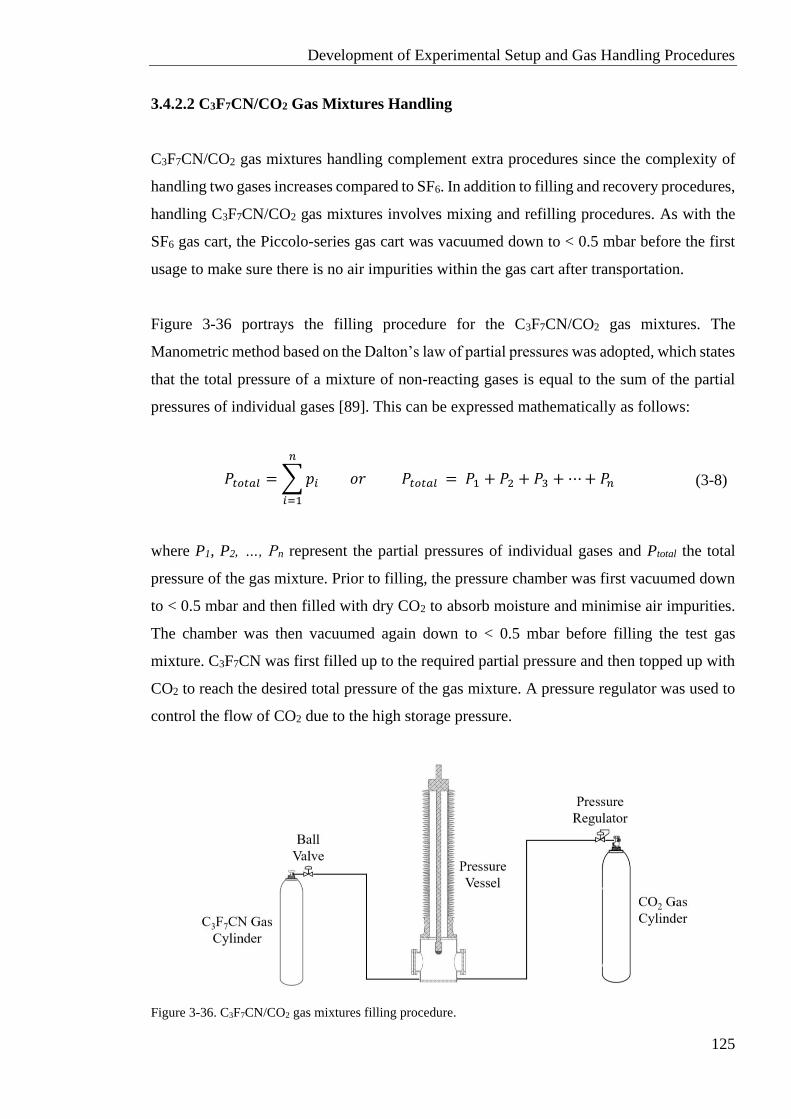
Development of Experimental Setup and Gas Handling Procedures
125
3.4.2.2 C3F7CN/CO2 Gas Mixtures Handling
C3F7CN/CO2 gas mixtures handling complement extra procedures since the complexity of
handling two gases increases compared to SF6. In addition to filling and recovery procedures,
handling C3F7CN/CO2 gas mixtures involves mixing and refilling procedures. As with the
SF6 gas cart, the Piccolo-series gas cart was vacuumed down to < 0.5 mbar before the first
usage to make sure there is no air impurities within the gas cart after transportation.
Figure 3-36 portrays the filling procedure for the C3F7CN/CO2 gas mixtures. The
Manometric method based on the Dalton’s law of partial pressures was adopted, which states
that the total pressure of a mixture of non-reacting gases is equal to the sum of the partial
pressures of individual gases [89]. This can be expressed mathematically as follows:
𝑃𝑡𝑜𝑡𝑎𝑙 = ∑ 𝑝𝑖
𝑛
𝑖=1
𝑜𝑟 𝑃𝑡𝑜𝑡𝑎𝑙 = 𝑃1 + 𝑃2 + 𝑃3 + ⋯ + 𝑃𝑛
(3-8)
where P1, P2, …, Pn represent the partial pressures of individual gases and Ptotal the total
pressure of the gas mixture. Prior to filling, the pressure chamber was first vacuumed down
to < 0.5 mbar and then filled with dry CO2 to absorb moisture and minimise air impurities.
The chamber was then vacuumed again down to < 0.5 mbar before filling the test gas
mixture. C3F7CN was first filled up to the required partial pressure and then topped up with
CO2 to reach the desired total pressure of the gas mixture. A pressure regulator was used to
control the flow of CO2 due to the high storage pressure.
Figure 3-36. C3F7CN/CO2 gas mixtures filling procedure.
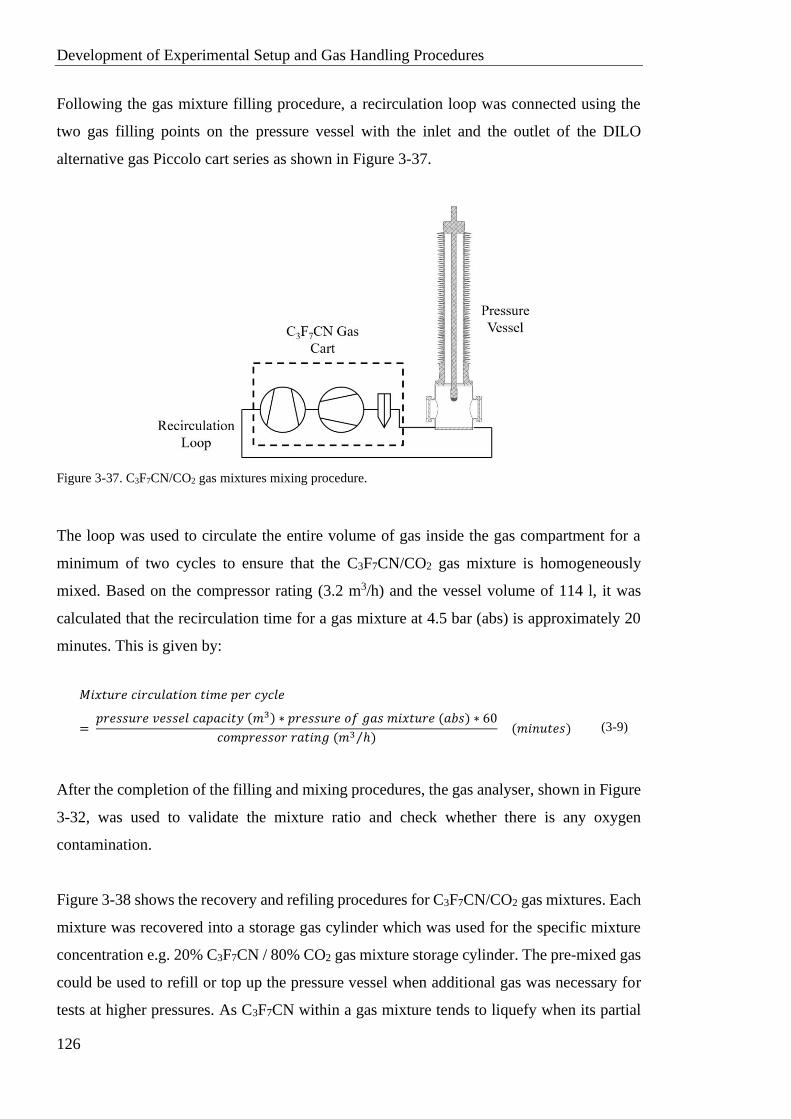
Development of Experimental Setup and Gas Handling Procedures
126
Following the gas mixture filling procedure, a recirculation loop was connected using the
two gas filling points on the pressure vessel with the inlet and the outlet of the DILO
alternative gas Piccolo cart series as shown in Figure 3-37.
Figure 3-37. C3F7CN/CO2 gas mixtures mixing procedure.
The loop was used to circulate the entire volume of gas inside the gas compartment for a
minimum of two cycles to ensure that the C3F7CN/CO2 gas mixture is homogeneously
mixed. Based on the compressor rating (3.2 m3/h) and the vessel volume of 114 l, it was
calculated that the recirculation time for a gas mixture at 4.5 bar (abs) is approximately 20
minutes. This is given by:
𝑀𝑖𝑥𝑡𝑢𝑟𝑒 𝑐𝑖𝑟𝑐𝑢𝑙𝑎𝑡𝑖𝑜𝑛 𝑡𝑖𝑚𝑒 𝑝𝑒𝑟 𝑐𝑦𝑐𝑙𝑒
= 𝑝𝑟𝑒𝑠𝑠𝑢𝑟𝑒 𝑣𝑒𝑠𝑠𝑒𝑙 𝑐𝑎𝑝𝑎𝑐𝑖𝑡𝑦 (𝑚3) ∗ 𝑝𝑟𝑒𝑠𝑠𝑢𝑟𝑒 𝑜𝑓 𝑔𝑎𝑠 𝑚𝑖𝑥𝑡𝑢𝑟𝑒 (𝑎𝑏𝑠) ∗ 60
𝑐𝑜𝑚𝑝𝑟𝑒𝑠𝑠𝑜𝑟 𝑟𝑎𝑡𝑖𝑛𝑔 (𝑚3 ℎ⁄ ) (𝑚𝑖𝑛𝑢𝑡𝑒𝑠)
(3-9)
After the completion of the filling and mixing procedures, the gas analyser, shown in Figure
3-32, was used to validate the mixture ratio and check whether there is any oxygen
contamination.
Figure 3-38 shows the recovery and refiling procedures for C3F7CN/CO2 gas mixtures. Each
mixture was recovered into a storage gas cylinder which was used for the specific mixture
concentration e.g. 20% C3F7CN / 80% CO2 gas mixture storage cylinder. The pre-mixed gas
could be used to refill or top up the pressure vessel when additional gas was necessary for
tests at higher pressures. As C3F7CN within a gas mixture tends to liquefy when its partial
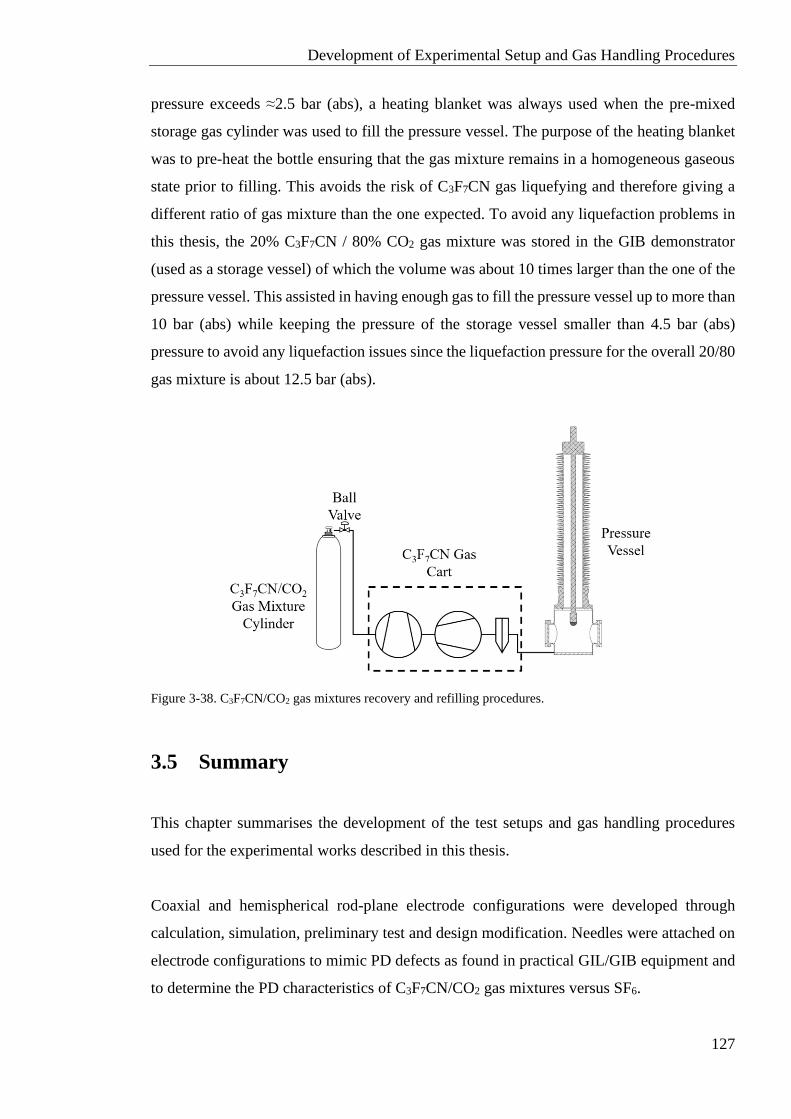
Development of Experimental Setup and Gas Handling Procedures
127
pressure exceeds ≈2.5 bar (abs), a heating blanket was always used when the pre-mixed
storage gas cylinder was used to fill the pressure vessel. The purpose of the heating blanket
was to pre-heat the bottle ensuring that the gas mixture remains in a homogeneous gaseous
state prior to filling. This avoids the risk of C3F7CN gas liquefying and therefore giving a
different ratio of gas mixture than the one expected. To avoid any liquefaction problems in
this thesis, the 20% C3F7CN / 80% CO2 gas mixture was stored in the GIB demonstrator
(used as a storage vessel) of which the volume was about 10 times larger than the one of the
pressure vessel. This assisted in having enough gas to fill the pressure vessel up to more than
10 bar (abs) while keeping the pressure of the storage vessel smaller than 4.5 bar (abs)
pressure to avoid any liquefaction issues since the liquefaction pressure for the overall 20/80
gas mixture is about 12.5 bar (abs).
Figure 3-38. C3F7CN/CO2 gas mixtures recovery and refilling procedures.
3.5 Summary
This chapter summarises the development of the test setups and gas handling procedures
used for the experimental works described in this thesis.
Coaxial and hemispherical rod-plane electrode configurations were developed through
calculation, simulation, preliminary test and design modification. Needles were attached on
electrode configurations to mimic PD defects as found in practical GIL/GIB equipment and
to determine the PD characteristics of C3F7CN/CO2 gas mixtures versus SF6.
Development of Experimental Setup and Gas Handling Procedures
128
A detailed description was given for the gas handling setups and procedures used for SF6
gas and C3F7CN/CO2 gas mixtures. The SF6 gas used is always above 99% purity level and
the C3F7CN/CO2 mixtures were homogeneously mixed with minimal oxygen content. All
gases are handled carefully to ensure a closed loop and avoid accidental leakage. Test gases
were measured using the SF6 and the alternative gas analysers to measure the gas purity
before an experiment.
Breakdown Characteristics of SF6 Gas and C3F7CN/CO2 Gas Mixtures
129
Chapter 4 Breakdown Characteristics of SF6
Gas and C3F7CN/CO2 Gas Mixtures
4.1 Introduction
Breakdown tests can be used to examine the difference in insulation performance between
dielectric mediums. In this chapter, the hemispherical rod-plane, the reduced-scale 10/30
mm and 8/60 mm coaxial electrode configurations were tested under different test conditions
to compare the breakdown characteristics of SF6 gas and C3F7CN/CO2 gas mixtures.
Lightning impulse and AC voltage waveforms were tested in this chapter.
The breakdown characteristics of two C3F7CN/CO2 gas mixtures were compared to SF6 to
identify the more suitable ratio for retro-fill applications. Tests were conducted on the
reduced-scale 10/30 mm coaxial prototype which replicates quasi-uniform electric fields as
found in practical GIL/GIB equipment. The 20% C3F7CN / 80% CO2 gas mixture was chosen
based on the trade-off of breakdown performance and liquefaction temperature. The same
mixture was further evaluated experimentally in weakly quasi-uniform electric fields using
the 8/60 mm coaxial and the hemispherical rod-plane electrodes.
4.2 Generation and Measurement of Lightning Impulses and
AC Voltage Waveforms
4.2.1 Test Setup for Lightning Impulse Breakdown Experiments
Two types of Marx impulse generators were used for standard LI voltage applications: (i)
BHT 8-stage and (ii) Haefely 10-stage impulse generators. The choice of impulse generator
was dependent on the voltage range required for the tests. For tests up to 400 kV, the BHT
impulse generator was used which has a capability to charge up to 100 kV per stage with a
maximum capability of 800 kV when all stages are connected. Every stage has a low, 0.5 kJ
Breakdown Characteristics of SF6 and C3F7CN/CO2 Gas Mixtures
130
rated, energy which minimises the surface damage on the electrodes post breakdown. For
tests where higher voltages were necessary, the Haefely impulse generator was used which
has a capability to charge up to 200 kV per stage with a maximum voltage capability of 2
MV. Each stage has a rated energy of 15 kJ which results to more damage on the electrodes.
As a result, the BHT impulse generator was preferred when the testing voltage range was ≤
400 kV. The BHT impulse generator voltage was limited to a four-stage configuration with
a maximum test voltage of 400 kV due to clearances in the lab.
Marx impulse generators are used when the voltage range required for testing is more than
what a single-stage impulse generator can supply. This kind of generators give the flexibility
of changing the voltage range supplied by varying the number of stages connected. These
impulse generators are charged by having multiple impulse capacitors, Cimp, connected in
parallel which are charged through the DC voltage source coming from a rectified unit. In
the case of the BHT generator, LIs can be produced by using eight 100 kV rated capacitors,
one per stage. The Haefely generator has two 100 kV capacitors in each stage, which allows
it to charge up to a maximum 200 kV per stage. The impulse capacitors are charged through
the charging resistors which are used to limit the charging current. As soon as all the
capacitors are charged, the spark gap (SG) of the first stage is externally triggered from the
impulse generator control unit causing an almost instantaneous in-series discharge for all
stages connected. This provides the impulse application applied onto the HV connection of
the pressure vessel. Front, RF and tail, RT resistors are used to alter the front and tail time of
the voltage waveform. Impulse applications of both positive and negative polarities can be
applied by changing the diode orientation. Figure 4-1 shows the circuit diagram for the LI
breakdown tests using the Haefely impulse generator. The pressure vessel is connected in
parallel to the impulse generator and a Haefely capacitive voltage divider (CVD). The voltage
measurement was taken through the capacitive voltage divider that has a conversion ratio of
1107/1 and is connected to the Highest Resolution Impulse Analysing System (HiAS) 744
system. HiAS is the control and measurement unit which can be used to trigger the impulse
generator but also record the voltage parameters of every impulse shot.
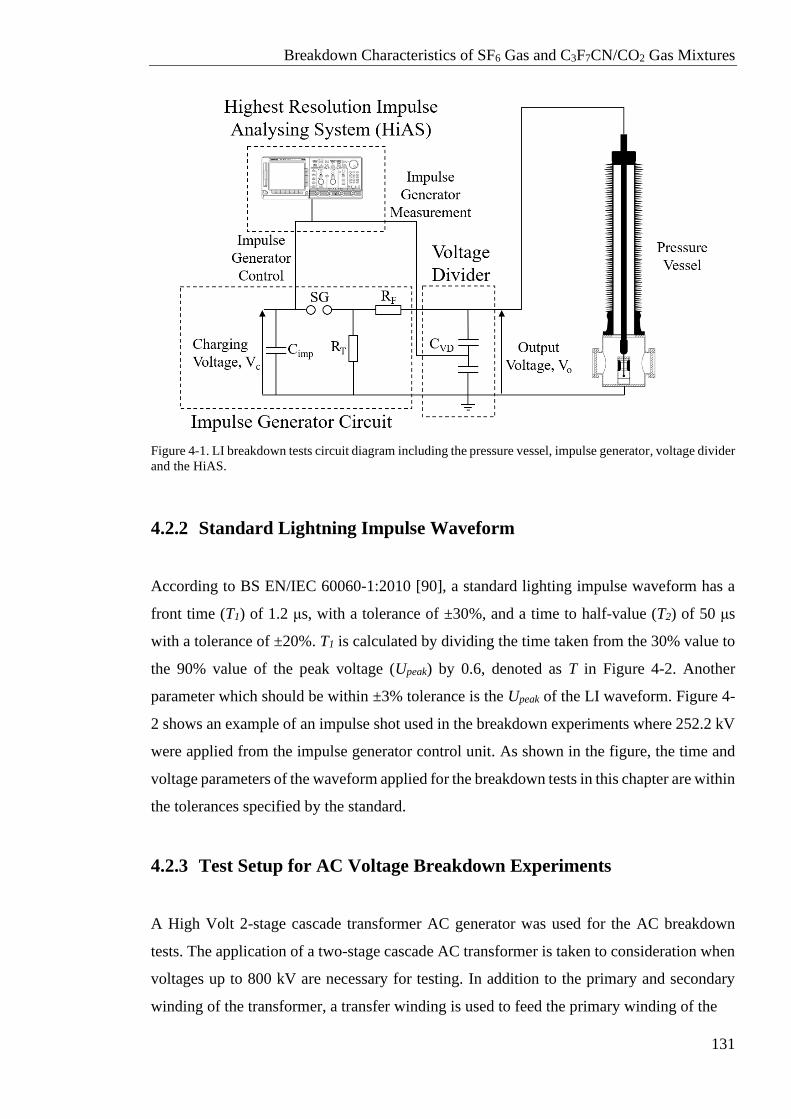
Breakdown Characteristics of SF6 Gas and C3F7CN/CO2 Gas Mixtures
131
Figure 4-1. LI breakdown tests circuit diagram including the pressure vessel, impulse generator, voltage divider
and the HiAS.
4.2.2 Standard Lightning Impulse Waveform
According to BS EN/IEC 60060-1:2010 [90], a standard lighting impulse waveform has a
front time (T1) of 1.2 μs, with a tolerance of ±30%, and a time to half-value (T2) of 50 μs
with a tolerance of ±20%. T1 is calculated by dividing the time taken from the 30% value to
the 90% value of the peak voltage (Upeak) by 0.6, denoted as T in Figure 4-2. Another
parameter which should be within ±3% tolerance is the Upeak of the LI waveform. Figure 4-
2 shows an example of an impulse shot used in the breakdown experiments where 252.2 kV
were applied from the impulse generator control unit. As shown in the figure, the time and
voltage parameters of the waveform applied for the breakdown tests in this chapter are within
the tolerances specified by the standard.
4.2.3 Test Setup for AC Voltage Breakdown Experiments
A High Volt 2-stage cascade transformer AC generator was used for the AC breakdown
tests. The application of a two-stage cascade AC transformer is taken to consideration when
voltages up to 800 kV are necessary for testing. In addition to the primary and secondary
winding of the transformer, a transfer winding is used to feed the primary winding of the
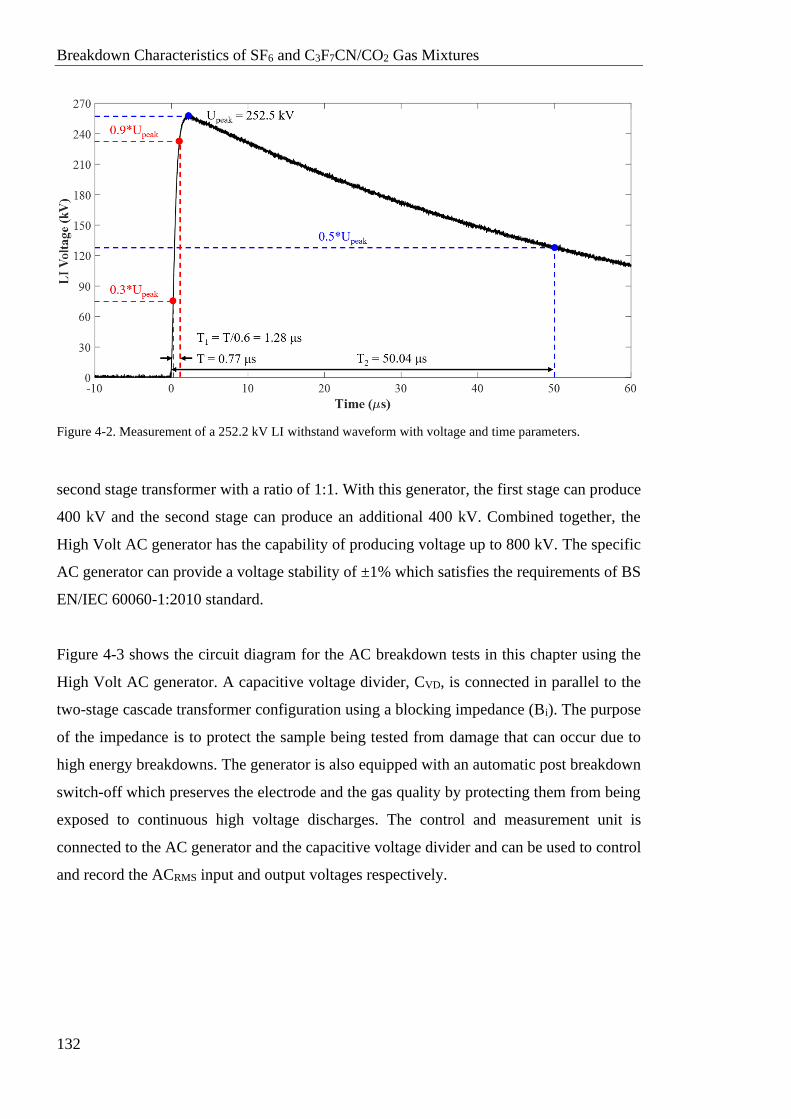
Breakdown Characteristics of SF6 and C3F7CN/CO2 Gas Mixtures
132
Figure 4-2. Measurement of a 252.2 kV LI withstand waveform with voltage and time parameters.
second stage transformer with a ratio of 1:1. With this generator, the first stage can produce
400 kV and the second stage can produce an additional 400 kV. Combined together, the
High Volt AC generator has the capability of producing voltage up to 800 kV. The specific
AC generator can provide a voltage stability of ±1% which satisfies the requirements of BS
EN/IEC 60060-1:2010 standard.
Figure 4-3 shows the circuit diagram for the AC breakdown tests in this chapter using the
High Volt AC generator. A capacitive voltage divider, CVD, is connected in parallel to the
two-stage cascade transformer configuration using a blocking impedance (Bi). The purpose
of the impedance is to protect the sample being tested from damage that can occur due to
high energy breakdowns. The generator is also equipped with an automatic post breakdown
switch-off which preserves the electrode and the gas quality by protecting them from being
exposed to continuous high voltage discharges. The control and measurement unit is
connected to the AC generator and the capacitive voltage divider and can be used to control
and record the ACRMS input and output voltages respectively.
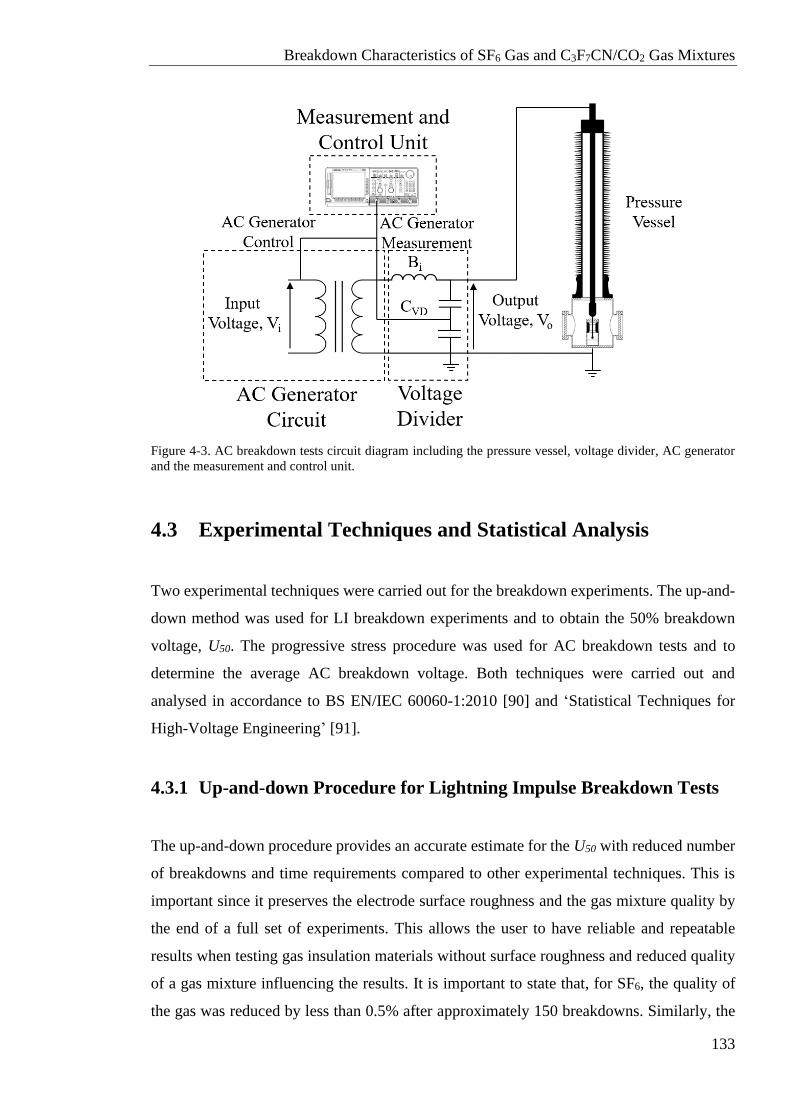
Breakdown Characteristics of SF6 Gas and C3F7CN/CO2 Gas Mixtures
133
Figure 4-3. AC breakdown tests circuit diagram including the pressure vessel, voltage divider, AC generator
and the measurement and control unit.
4.3 Experimental Techniques and Statistical Analysis
Two experimental techniques were carried out for the breakdown experiments. The up-and-
down method was used for LI breakdown experiments and to obtain the 50% breakdown
voltage, U50. The progressive stress procedure was used for AC breakdown tests and to
determine the average AC breakdown voltage. Both techniques were carried out and
analysed in accordance to BS EN/IEC 60060-1:2010 [90] and ‘Statistical Techniques for
High-Voltage Engineering’ [91].
4.3.1 Up-and-down Procedure for Lightning Impulse Breakdown Tests
The up-and-down procedure provides an accurate estimate for the U50 with reduced number
of breakdowns and time requirements compared to other experimental techniques. This is
important since it preserves the electrode surface roughness and the gas mixture quality by
the end of a full set of experiments. This allows the user to have reliable and repeatable
results when testing gas insulation materials without surface roughness and reduced quality
of a gas mixture influencing the results. It is important to state that, for SF6, the quality of
the gas was reduced by less than 0.5% after approximately 150 breakdowns. Similarly, the
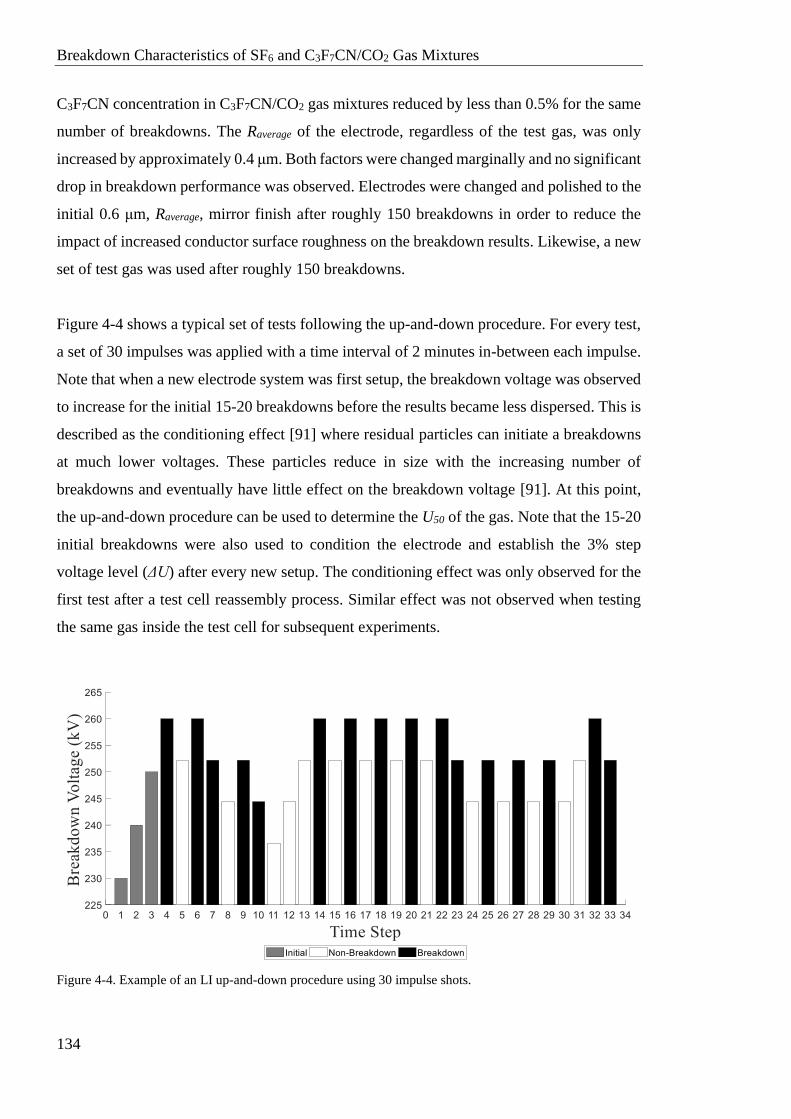
Breakdown Characteristics of SF6 and C3F7CN/CO2 Gas Mixtures
134
C3F7CN concentration in C3F7CN/CO2 gas mixtures reduced by less than 0.5% for the same
number of breakdowns. The Raverage of the electrode, regardless of the test gas, was only
increased by approximately 0.4 μm. Both factors were changed marginally and no significant
drop in breakdown performance was observed. Electrodes were changed and polished to the
initial 0.6 μm, Raverage, mirror finish after roughly 150 breakdowns in order to reduce the
impact of increased conductor surface roughness on the breakdown results. Likewise, a new
set of test gas was used after roughly 150 breakdowns.
Figure 4-4 shows a typical set of tests following the up-and-down procedure. For every test,
a set of 30 impulses was applied with a time interval of 2 minutes in-between each impulse.
Note that when a new electrode system was first setup, the breakdown voltage was observed
to increase for the initial 15-20 breakdowns before the results became less dispersed. This is
described as the conditioning effect [91] where residual particles can initiate a breakdowns
at much lower voltages. These particles reduce in size with the increasing number of
breakdowns and eventually have little effect on the breakdown voltage [91]. At this point,
the up-and-down procedure can be used to determine the U50 of the gas. Note that the 15-20
initial breakdowns were also used to condition the electrode and establish the 3% step
voltage level (ΔU) after every new setup. The conditioning effect was only observed for the
first test after a test cell reassembly process. Similar effect was not observed when testing
the same gas inside the test cell for subsequent experiments.
Figure 4-4. Example of an LI up-and-down procedure using 30 impulse shots.
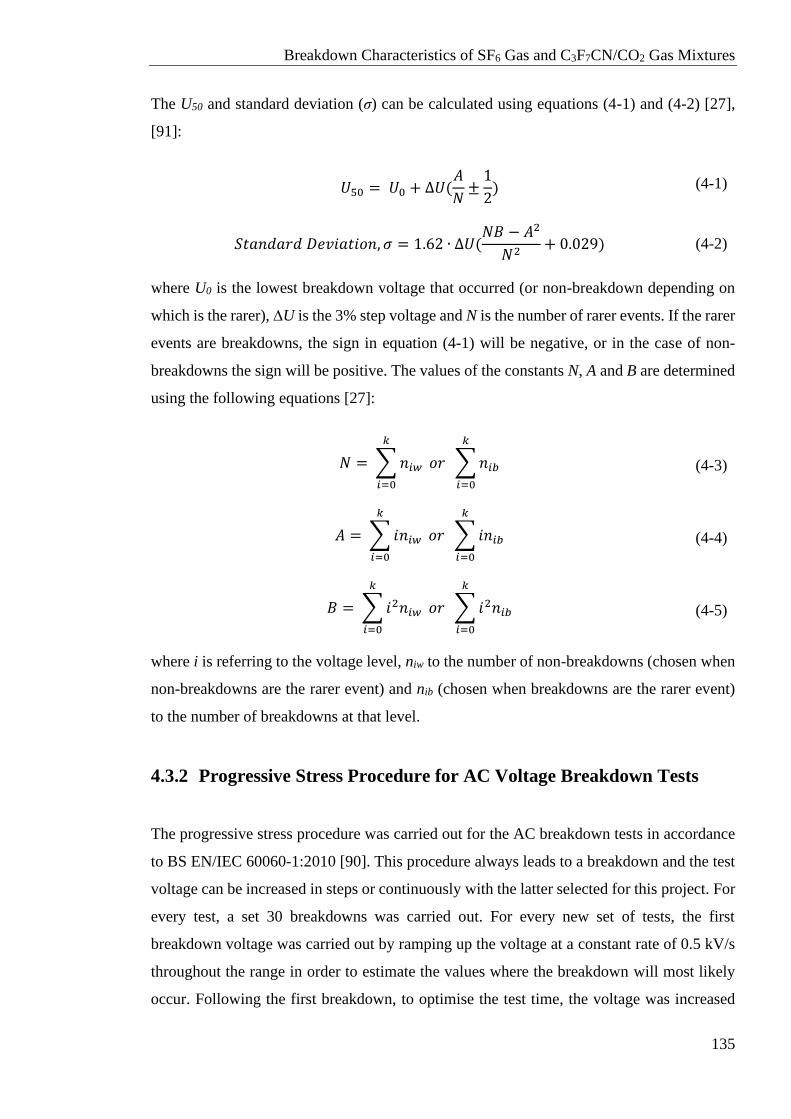
Breakdown Characteristics of SF6 Gas and C3F7CN/CO2 Gas Mixtures
135
The U50 and standard deviation (σ) can be calculated using equations (4-1) and (4-2) [27],
[91]:
𝑈50 = 𝑈0 + ∆𝑈(𝐴
𝑁±
1
2)
(4-1)
𝑆𝑡𝑎𝑛𝑑𝑎𝑟𝑑 𝐷𝑒𝑣𝑖𝑎𝑡𝑖𝑜𝑛, 𝜎 = 1.62 ∙ ∆𝑈(𝑁𝐵 − 𝐴2
𝑁2+ 0.029)
(4-2)
where U0 is the lowest breakdown voltage that occurred (or non-breakdown depending on
which is the rarer), ∆U is the 3% step voltage and N is the number of rarer events. If the rarer
events are breakdowns, the sign in equation (4-1) will be negative, or in the case of non-
breakdowns the sign will be positive. The values of the constants N, A and B are determined
using the following equations [27]:
𝑁 = ∑ 𝑛𝑖𝑤
𝑘
𝑖=0
𝑜𝑟 ∑ 𝑛𝑖𝑏
𝑘
𝑖=0
(4-3)
𝐴 = ∑ 𝑖𝑛𝑖𝑤
𝑘
𝑖=0
𝑜𝑟 ∑ 𝑖𝑛𝑖𝑏
𝑘
𝑖=0
(4-4)
𝐵 = ∑ 𝑖2𝑛𝑖𝑤
𝑘
𝑖=0
𝑜𝑟 ∑ 𝑖2𝑛𝑖𝑏
𝑘
𝑖=0
(4-5)
where i is referring to the voltage level, niw to the number of non-breakdowns (chosen when
non-breakdowns are the rarer event) and nib (chosen when breakdowns are the rarer event)
to the number of breakdowns at that level.
4.3.2 Progressive Stress Procedure for AC Voltage Breakdown Tests
The progressive stress procedure was carried out for the AC breakdown tests in accordance
to BS EN/IEC 60060-1:2010 [90]. This procedure always leads to a breakdown and the test
voltage can be increased in steps or continuously with the latter selected for this project. For
every test, a set 30 breakdowns was carried out. For every new set of tests, the first
breakdown voltage was carried out by ramping up the voltage at a constant rate of 0.5 kV/s
throughout the range in order to estimate the values where the breakdown will most likely
occur. Following the first breakdown, to optimise the test time, the voltage was increased
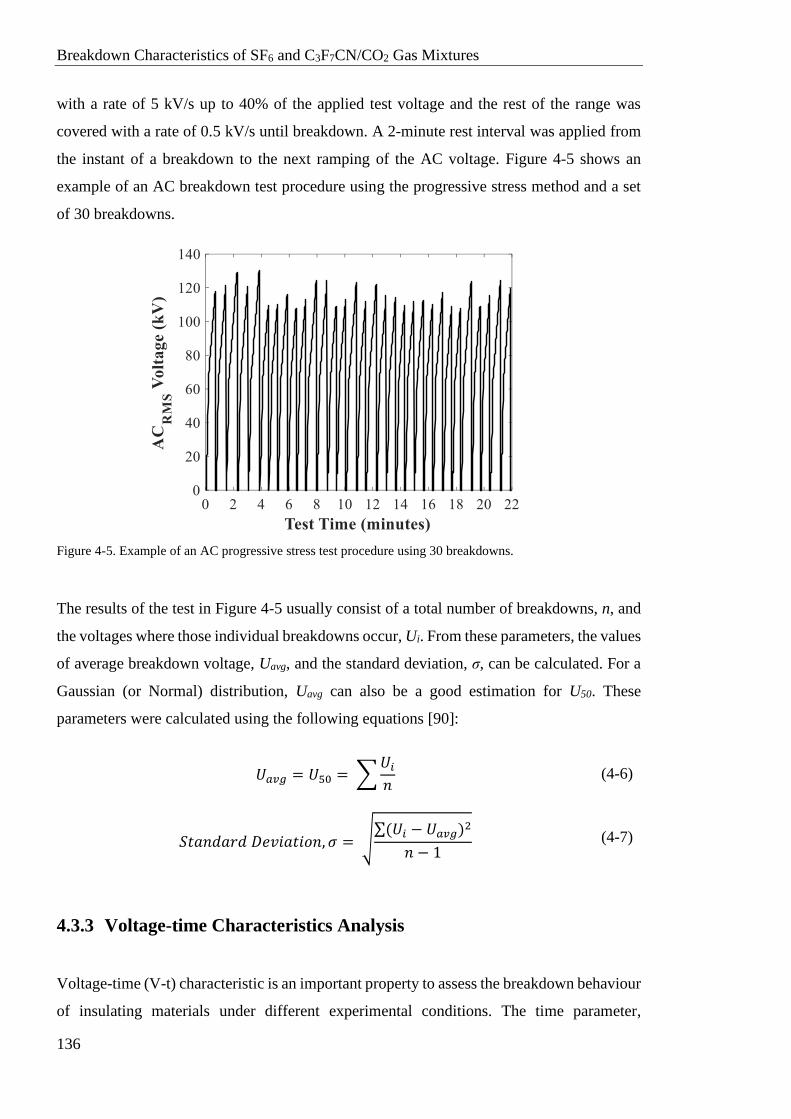
Breakdown Characteristics of SF6 and C3F7CN/CO2 Gas Mixtures
136
with a rate of 5 kV/s up to 40% of the applied test voltage and the rest of the range was
covered with a rate of 0.5 kV/s until breakdown. A 2-minute rest interval was applied from
the instant of a breakdown to the next ramping of the AC voltage. Figure 4-5 shows an
example of an AC breakdown test procedure using the progressive stress method and a set
of 30 breakdowns.
Figure 4-5. Example of an AC progressive stress test procedure using 30 breakdowns.
The results of the test in Figure 4-5 usually consist of a total number of breakdowns, n, and
the voltages where those individual breakdowns occur, Ui. From these parameters, the values
of average breakdown voltage, Uavg, and the standard deviation, σ, can be calculated. For a
Gaussian (or Normal) distribution, Uavg can also be a good estimation for U50. These
parameters were calculated using the following equations [90]:
𝑈𝑎𝑣𝑔 = 𝑈50 = ∑𝑈𝑖
𝑛
(4-6)
𝑆𝑡𝑎𝑛𝑑𝑎𝑟𝑑 𝐷𝑒𝑣𝑖𝑎𝑡𝑖𝑜𝑛, 𝜎 = √∑(𝑈𝑖 − 𝑈𝑎𝑣𝑔)2
𝑛 − 1
(4-7)
4.3.3 Voltage-time Characteristics Analysis
Voltage-time (V-t) characteristic is an important property to assess the breakdown behaviour
of insulating materials under different experimental conditions. The time parameter,
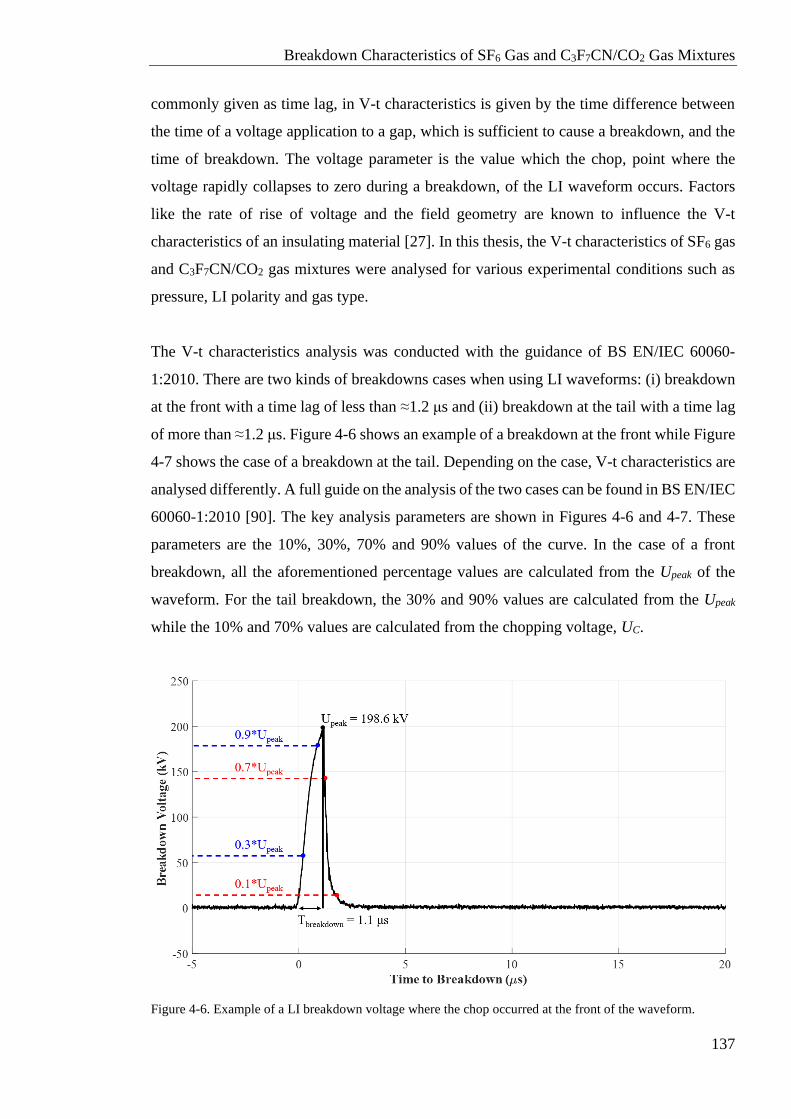
Breakdown Characteristics of SF6 Gas and C3F7CN/CO2 Gas Mixtures
137
commonly given as time lag, in V-t characteristics is given by the time difference between
the time of a voltage application to a gap, which is sufficient to cause a breakdown, and the
time of breakdown. The voltage parameter is the value which the chop, point where the
voltage rapidly collapses to zero during a breakdown, of the LI waveform occurs. Factors
like the rate of rise of voltage and the field geometry are known to influence the V-t
characteristics of an insulating material [27]. In this thesis, the V-t characteristics of SF6 gas
and C3F7CN/CO2 gas mixtures were analysed for various experimental conditions such as
pressure, LI polarity and gas type.
The V-t characteristics analysis was conducted with the guidance of BS EN/IEC 60060-
1:2010. There are two kinds of breakdowns cases when using LI waveforms: (i) breakdown
at the front with a time lag of less than ≈1.2 μs and (ii) breakdown at the tail with a time lag
of more than ≈1.2 μs. Figure 4-6 shows an example of a breakdown at the front while Figure
4-7 shows the case of a breakdown at the tail. Depending on the case, V-t characteristics are
analysed differently. A full guide on the analysis of the two cases can be found in BS EN/IEC
60060-1:2010 [90]. The key analysis parameters are shown in Figures 4-6 and 4-7. These
parameters are the 10%, 30%, 70% and 90% values of the curve. In the case of a front
breakdown, all the aforementioned percentage values are calculated from the Upeak of the
waveform. For the tail breakdown, the 30% and 90% values are calculated from the Upeak
while the 10% and 70% values are calculated from the chopping voltage, UC.
Figure 4-6. Example of a LI breakdown voltage where the chop occurred at the front of the waveform.
Breakdown Characteristics of SF6 and C3F7CN/CO2 Gas Mixtures
138
Figure 4-7. Example of a LI breakdown voltage where the chop occurred at the tail of the waveform.
A Matlab code was developed to acquire the V-t characteristics and plot them for SF6 and
the C3F7CN/CO2 gas mixtures.
4.4 Breakdown Characteristics of the 10/30 mm Coaxial
Configuration
This section describes the results acquired from the 10/30 mm coaxial configuration. The
relation of U50 and pressure was plotted for different voltage waveforms, LI polarities and
C3F7CN/CO2 mixtures. For these tests, the main focus is on two mixtures: 16% C3F7CN /
84% CO2 and 20% C3F7CN / 80% CO2. As mentioned earlier, a 20/80% mixture was chosen
because it was reported to have an equivalent dielectric strength to SF6. The 16/84% mixture
was chosen since the reduction in C3F7CN ratio can lower the liquefaction temperature by
approximately 5°C. The operating pressure of GIL/GIB practical equipment used in the UK
power network is 4.5 bar (abs) and the liquefaction temperatures for both C3F7CN mixtures
and SF6 at pressures of 1 to 4.5 bar (abs) are shown in Table 4-1.
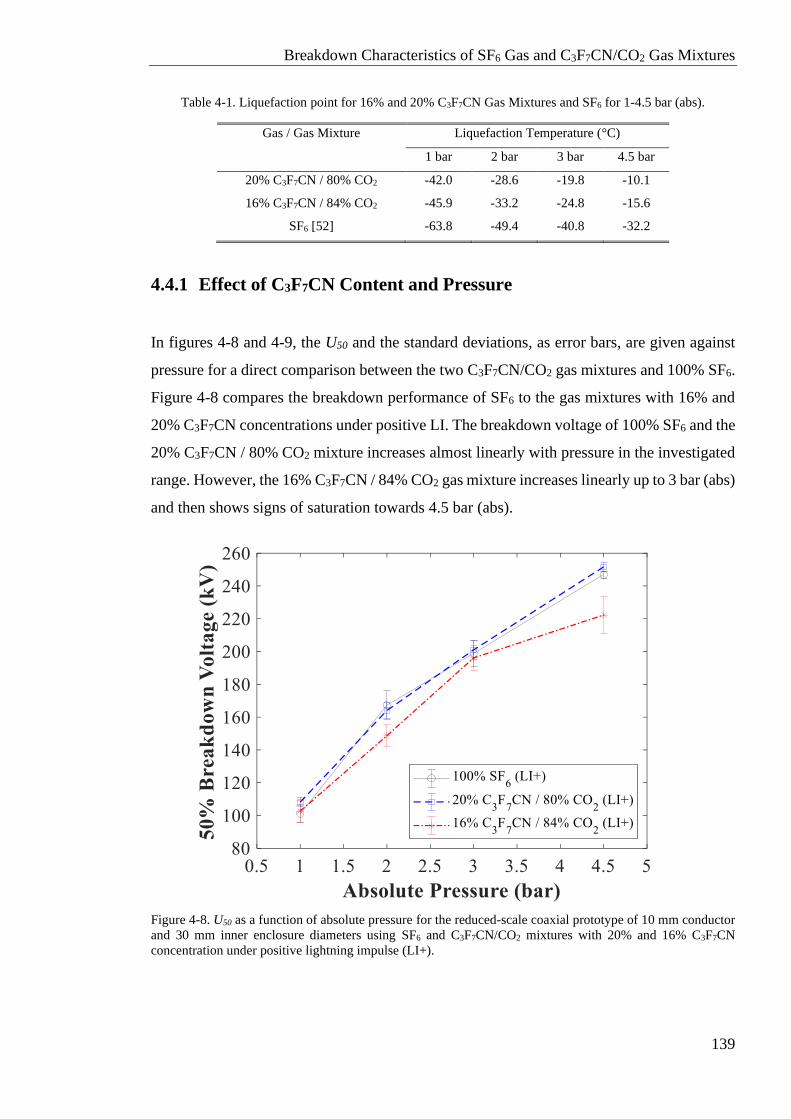
Breakdown Characteristics of SF6 Gas and C3F7CN/CO2 Gas Mixtures
139
Table 4-1. Liquefaction point for 16% and 20% C3F7CN Gas Mixtures and SF6 for 1-4.5 bar (abs).
Gas / Gas Mixture Liquefaction Temperature (°C)
1 bar 2 bar 3 bar 4.5 bar
20% C3F7CN / 80% CO2 -42.0 -28.6 -19.8 -10.1
16% C3F7CN / 84% CO2 -45.9 -33.2 -24.8 -15.6
SF6 [52] -63.8 -49.4 -40.8 -32.2
4.4.1 Effect of C3F7CN Content and Pressure
In figures 4-8 and 4-9, the U50 and the standard deviations, as error bars, are given against
pressure for a direct comparison between the two C3F7CN/CO2 gas mixtures and 100% SF6.
Figure 4-8 compares the breakdown performance of SF6 to the gas mixtures with 16% and
20% C3F7CN concentrations under positive LI. The breakdown voltage of 100% SF6 and the
20% C3F7CN / 80% CO2 mixture increases almost linearly with pressure in the investigated
range. However, the 16% C3F7CN / 84% CO2 gas mixture increases linearly up to 3 bar (abs)
and then shows signs of saturation towards 4.5 bar (abs).
Figure 4-8. U50 as a function of absolute pressure for the reduced-scale coaxial prototype of 10 mm conductor
and 30 mm inner enclosure diameters using SF6 and C3F7CN/CO2 mixtures with 20% and 16% C3F7CN
concentration under positive lightning impulse (LI+).
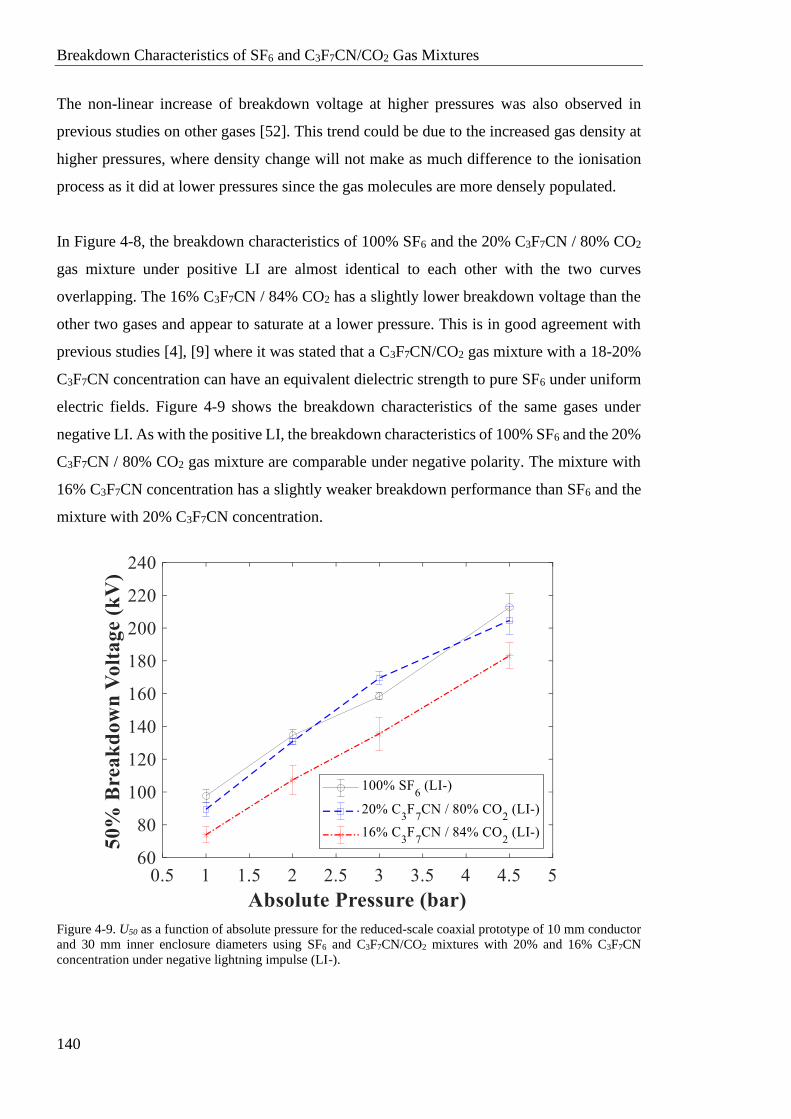
Breakdown Characteristics of SF6 and C3F7CN/CO2 Gas Mixtures
140
The non-linear increase of breakdown voltage at higher pressures was also observed in
previous studies on other gases [52]. This trend could be due to the increased gas density at
higher pressures, where density change will not make as much difference to the ionisation
process as it did at lower pressures since the gas molecules are more densely populated.
In Figure 4-8, the breakdown characteristics of 100% SF6 and the 20% C3F7CN / 80% CO2
gas mixture under positive LI are almost identical to each other with the two curves
overlapping. The 16% C3F7CN / 84% CO2 has a slightly lower breakdown voltage than the
other two gases and appear to saturate at a lower pressure. This is in good agreement with
previous studies [4], [9] where it was stated that a C3F7CN/CO2 gas mixture with a 18-20%
C3F7CN concentration can have an equivalent dielectric strength to pure SF6 under uniform
electric fields. Figure 4-9 shows the breakdown characteristics of the same gases under
negative LI. As with the positive LI, the breakdown characteristics of 100% SF6 and the 20%
C3F7CN / 80% CO2 gas mixture are comparable under negative polarity. The mixture with
16% C3F7CN concentration has a slightly weaker breakdown performance than SF6 and the
mixture with 20% C3F7CN concentration.
Figure 4-9. U50 as a function of absolute pressure for the reduced-scale coaxial prototype of 10 mm conductor
and 30 mm inner enclosure diameters using SF6 and C3F7CN/CO2 mixtures with 20% and 16% C3F7CN
concentration under negative lightning impulse (LI-).
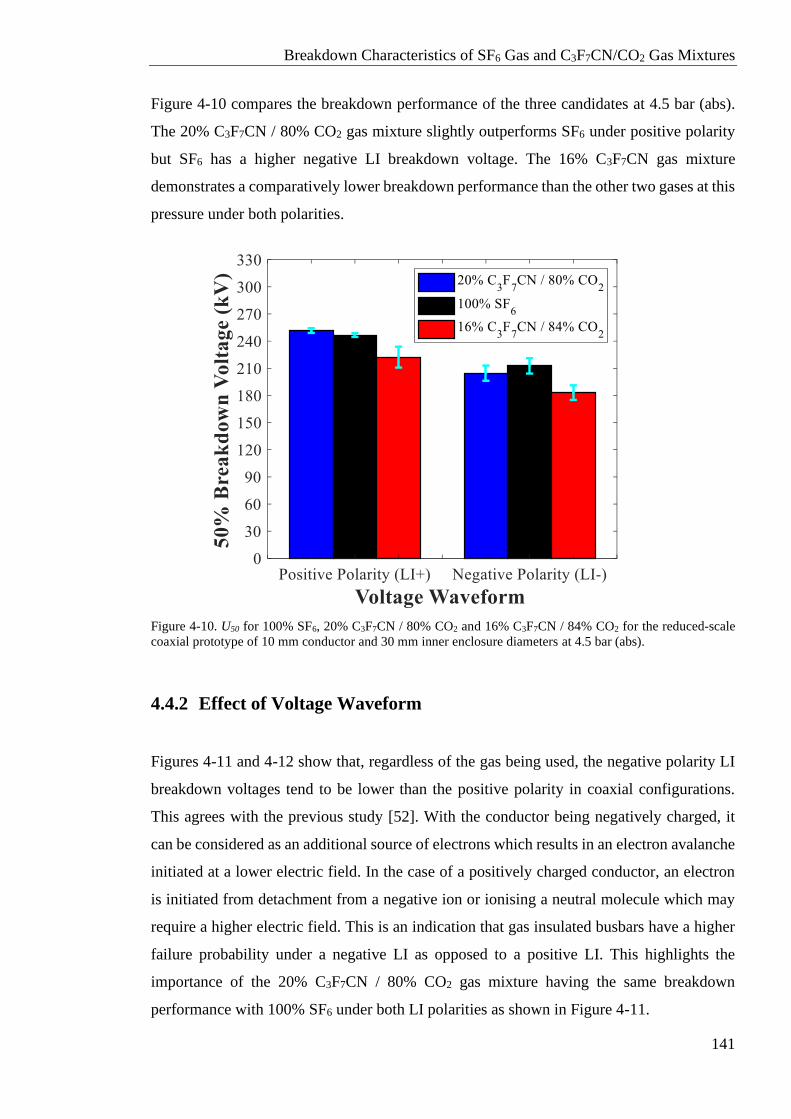
Breakdown Characteristics of SF6 Gas and C3F7CN/CO2 Gas Mixtures
141
Figure 4-10 compares the breakdown performance of the three candidates at 4.5 bar (abs).
The 20% C3F7CN / 80% CO2 gas mixture slightly outperforms SF6 under positive polarity
but SF6 has a higher negative LI breakdown voltage. The 16% C3F7CN gas mixture
demonstrates a comparatively lower breakdown performance than the other two gases at this
pressure under both polarities.
Figure 4-10. U50 for 100% SF6, 20% C3F7CN / 80% CO2 and 16% C3F7CN / 84% CO2 for the reduced-scale
coaxial prototype of 10 mm conductor and 30 mm inner enclosure diameters at 4.5 bar (abs).
4.4.2 Effect of Voltage Waveform
Figures 4-11 and 4-12 show that, regardless of the gas being used, the negative polarity LI
breakdown voltages tend to be lower than the positive polarity in coaxial configurations.
This agrees with the previous study [52]. With the conductor being negatively charged, it
can be considered as an additional source of electrons which results in an electron avalanche
initiated at a lower electric field. In the case of a positively charged conductor, an electron
is initiated from detachment from a negative ion or ionising a neutral molecule which may
require a higher electric field. This is an indication that gas insulated busbars have a higher
failure probability under a negative LI as opposed to a positive LI. This highlights the
importance of the 20% C3F7CN / 80% CO2 gas mixture having the same breakdown
performance with 100% SF6 under both LI polarities as shown in Figure 4-11.
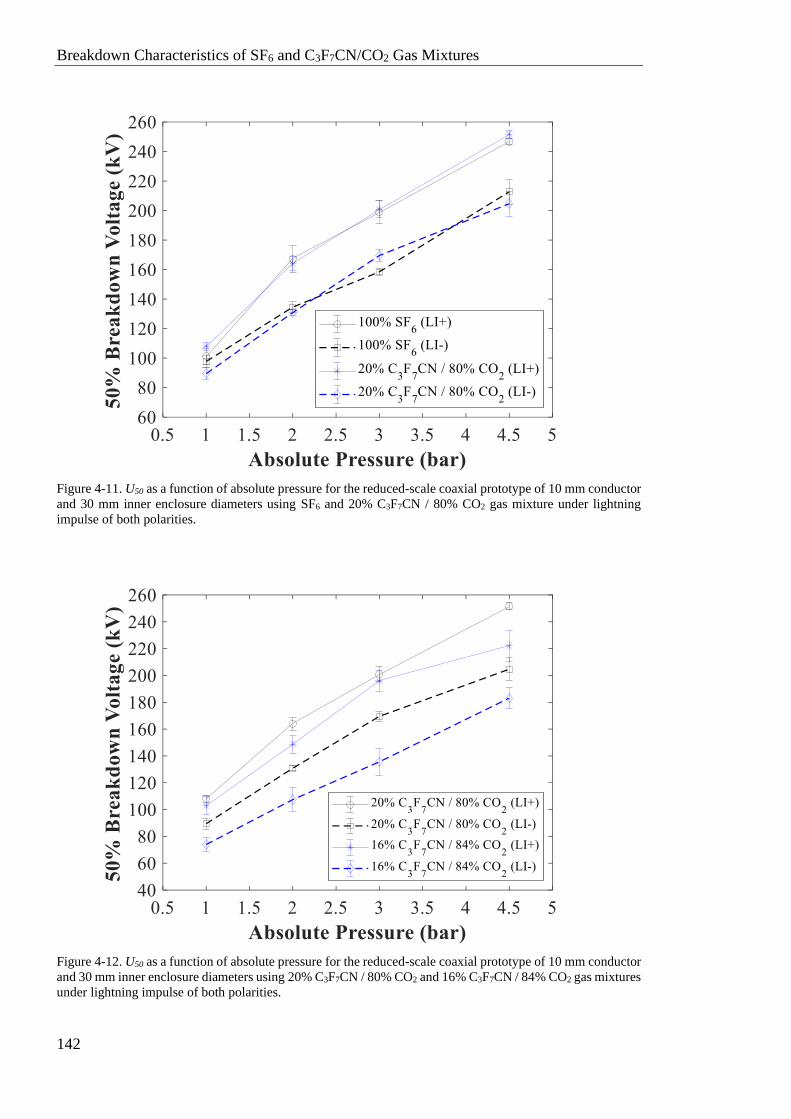
Breakdown Characteristics of SF6 and C3F7CN/CO2 Gas Mixtures
142
Figure 4-11. U50 as a function of absolute pressure for the reduced-scale coaxial prototype of 10 mm conductor
and 30 mm inner enclosure diameters using SF6 and 20% C3F7CN / 80% CO2 gas mixture under lightning
impulse of both polarities.
Figure 4-12. U50 as a function of absolute pressure for the reduced-scale coaxial prototype of 10 mm conductor
and 30 mm inner enclosure diameters using 20% C3F7CN / 80% CO2 and 16% C3F7CN / 84% CO2 gas mixtures
under lightning impulse of both polarities.
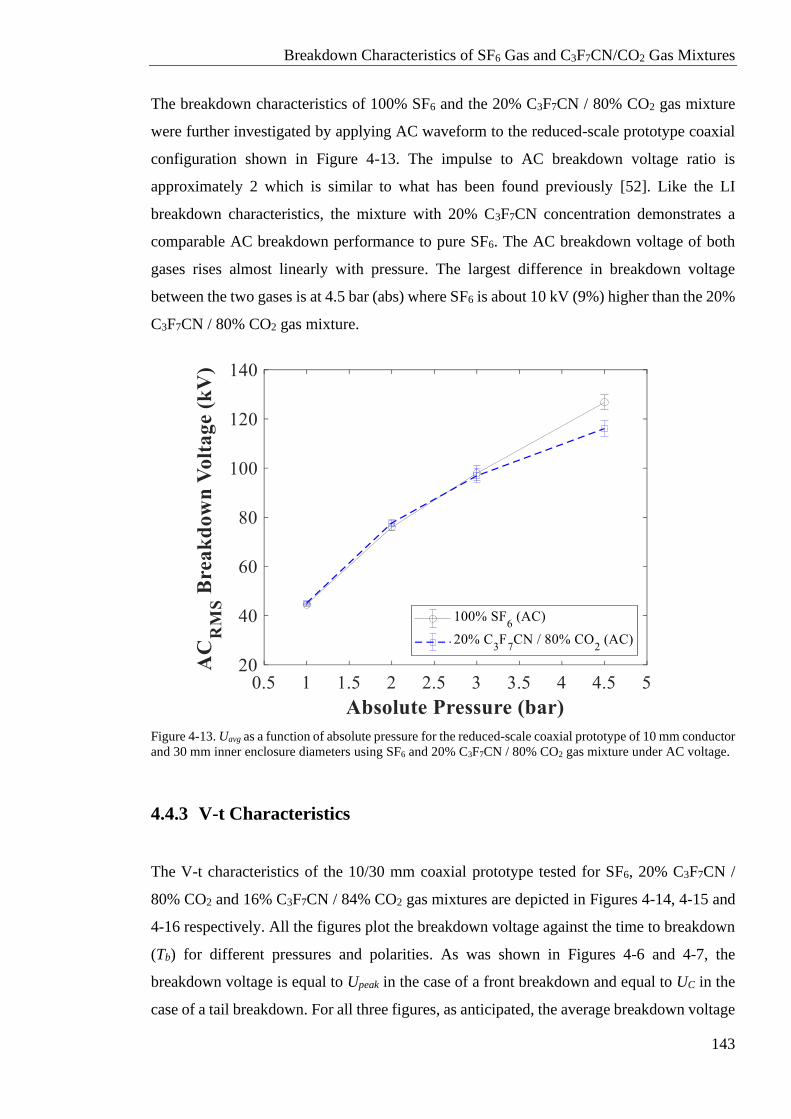
Breakdown Characteristics of SF6 Gas and C3F7CN/CO2 Gas Mixtures
143
The breakdown characteristics of 100% SF6 and the 20% C3F7CN / 80% CO2 gas mixture
were further investigated by applying AC waveform to the reduced-scale prototype coaxial
configuration shown in Figure 4-13. The impulse to AC breakdown voltage ratio is
approximately 2 which is similar to what has been found previously [52]. Like the LI
breakdown characteristics, the mixture with 20% C3F7CN concentration demonstrates a
comparable AC breakdown performance to pure SF6. The AC breakdown voltage of both
gases rises almost linearly with pressure. The largest difference in breakdown voltage
between the two gases is at 4.5 bar (abs) where SF6 is about 10 kV (9%) higher than the 20%
C3F7CN / 80% CO2 gas mixture.
Figure 4-13. Uavg as a function of absolute pressure for the reduced-scale coaxial prototype of 10 mm conductor
and 30 mm inner enclosure diameters using SF6 and 20% C3F7CN / 80% CO2 gas mixture under AC voltage.
4.4.3 V-t Characteristics
The V-t characteristics of the 10/30 mm coaxial prototype tested for SF6, 20% C3F7CN /
80% CO2 and 16% C3F7CN / 84% CO2 gas mixtures are depicted in Figures 4-14, 4-15 and
4-16 respectively. All the figures plot the breakdown voltage against the time to breakdown
(Tb) for different pressures and polarities. As was shown in Figures 4-6 and 4-7, the
breakdown voltage is equal to Upeak in the case of a front breakdown and equal to UC in the
case of a tail breakdown. For all three figures, as anticipated, the average breakdown voltage
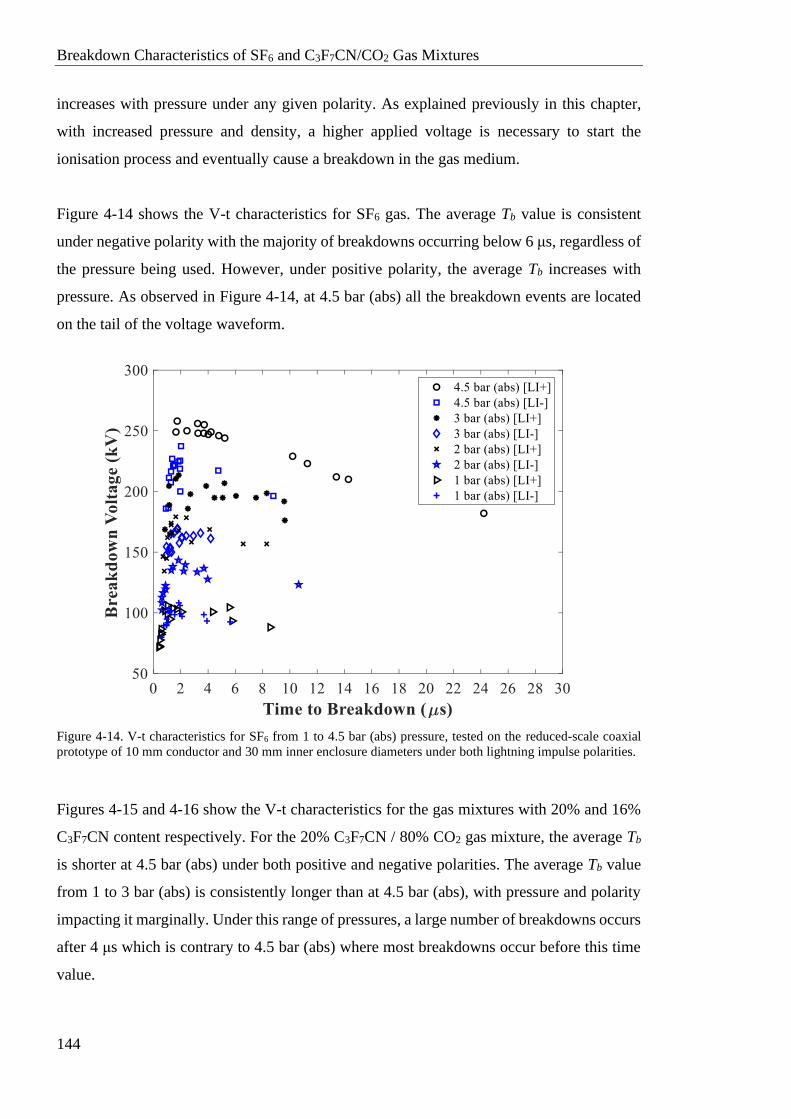
Breakdown Characteristics of SF6 and C3F7CN/CO2 Gas Mixtures
144
increases with pressure under any given polarity. As explained previously in this chapter,
with increased pressure and density, a higher applied voltage is necessary to start the
ionisation process and eventually cause a breakdown in the gas medium.
Figure 4-14 shows the V-t characteristics for SF6 gas. The average Tb value is consistent
under negative polarity with the majority of breakdowns occurring below 6 μs, regardless of
the pressure being used. However, under positive polarity, the average Tb increases with
pressure. As observed in Figure 4-14, at 4.5 bar (abs) all the breakdown events are located
on the tail of the voltage waveform.
Figure 4-14. V-t characteristics for SF6 from 1 to 4.5 bar (abs) pressure, tested on the reduced-scale coaxial
prototype of 10 mm conductor and 30 mm inner enclosure diameters under both lightning impulse polarities.
Figures 4-15 and 4-16 show the V-t characteristics for the gas mixtures with 20% and 16%
C3F7CN content respectively. For the 20% C3F7CN / 80% CO2 gas mixture, the average Tb
is shorter at 4.5 bar (abs) under both positive and negative polarities. The average Tb value
from 1 to 3 bar (abs) is consistently longer than at 4.5 bar (abs), with pressure and polarity
impacting it marginally. Under this range of pressures, a large number of breakdowns occurs
after 4 μs which is contrary to 4.5 bar (abs) where most breakdowns occur before this time
value.
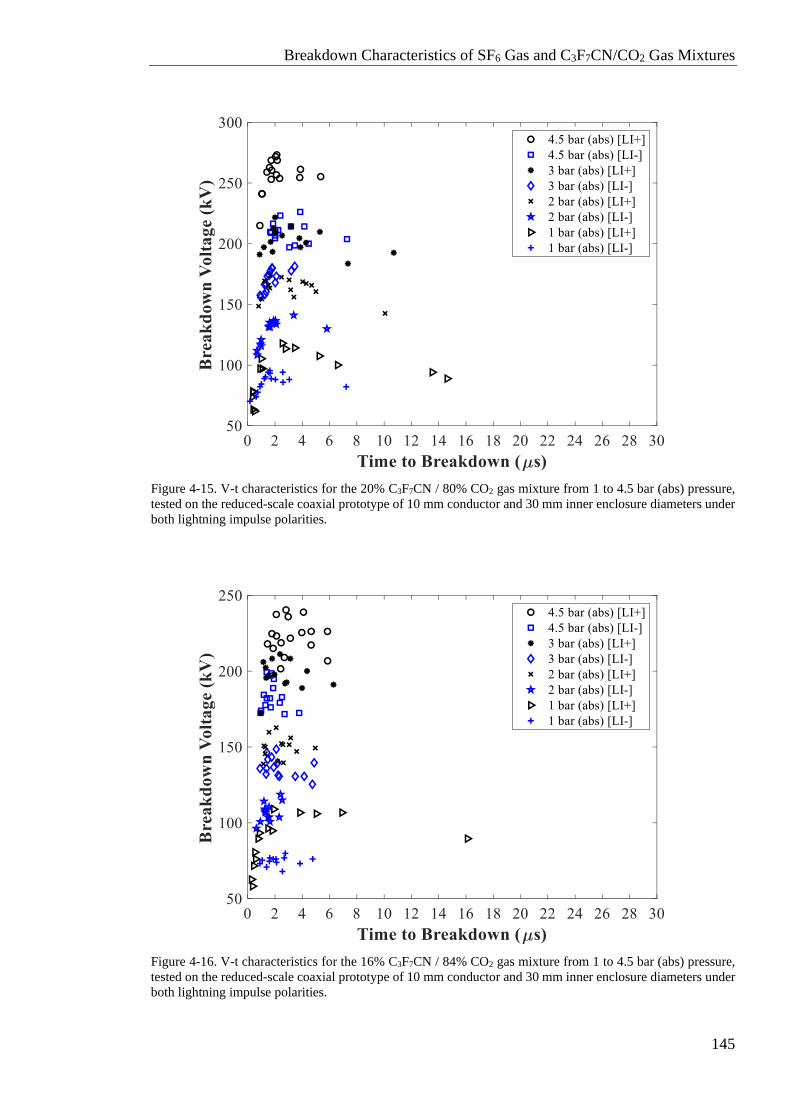
Breakdown Characteristics of SF6 Gas and C3F7CN/CO2 Gas Mixtures
145
Figure 4-15. V-t characteristics for the 20% C3F7CN / 80% CO2 gas mixture from 1 to 4.5 bar (abs) pressure,
tested on the reduced-scale coaxial prototype of 10 mm conductor and 30 mm inner enclosure diameters under
both lightning impulse polarities.
Figure 4-16. V-t characteristics for the 16% C3F7CN / 84% CO2 gas mixture from 1 to 4.5 bar (abs) pressure,
tested on the reduced-scale coaxial prototype of 10 mm conductor and 30 mm inner enclosure diameters under
both lightning impulse polarities.
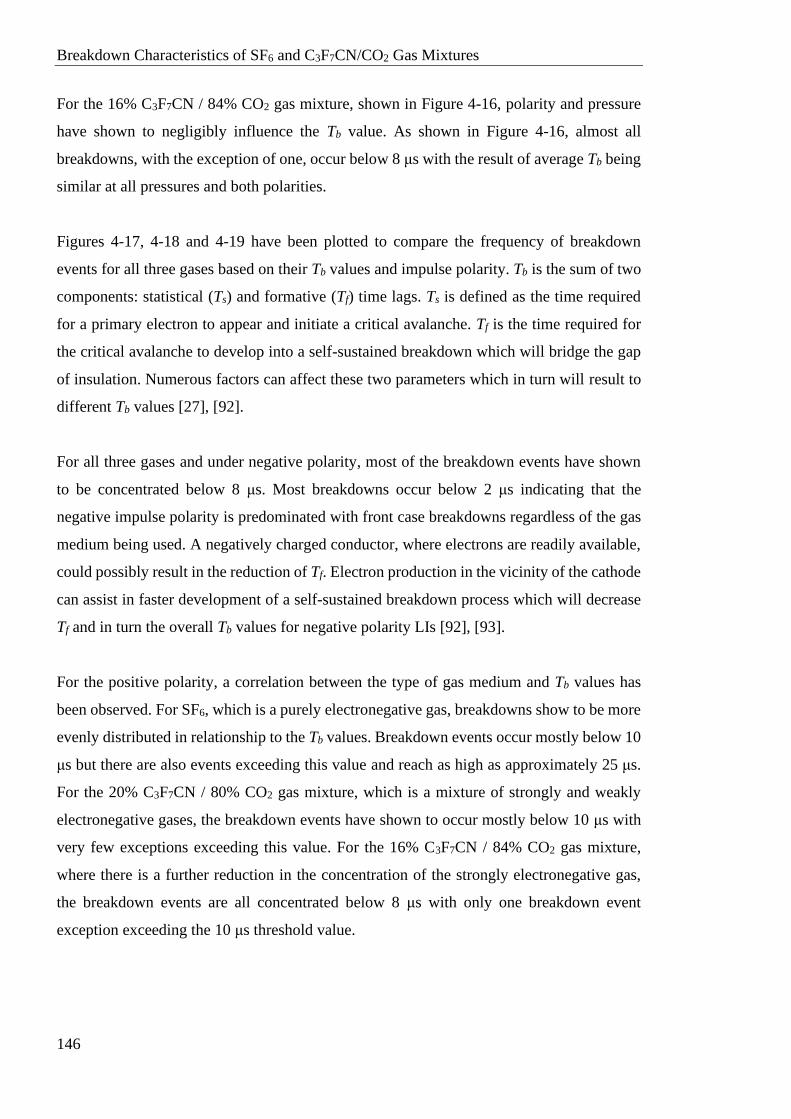
Breakdown Characteristics of SF6 and C3F7CN/CO2 Gas Mixtures
146
For the 16% C3F7CN / 84% CO2 gas mixture, shown in Figure 4-16, polarity and pressure
have shown to negligibly influence the Tb value. As shown in Figure 4-16, almost all
breakdowns, with the exception of one, occur below 8 μs with the result of average Tb being
similar at all pressures and both polarities.
Figures 4-17, 4-18 and 4-19 have been plotted to compare the frequency of breakdown
events for all three gases based on their Tb values and impulse polarity. Tb is the sum of two
components: statistical (Ts) and formative (Tf) time lags. Ts is defined as the time required
for a primary electron to appear and initiate a critical avalanche. Tf is the time required for
the critical avalanche to develop into a self-sustained breakdown which will bridge the gap
of insulation. Numerous factors can affect these two parameters which in turn will result to
different Tb values [27], [92].
For all three gases and under negative polarity, most of the breakdown events have shown
to be concentrated below 8 μs. Most breakdowns occur below 2 μs indicating that the
negative impulse polarity is predominated with front case breakdowns regardless of the gas
medium being used. A negatively charged conductor, where electrons are readily available,
could possibly result in the reduction of Tf. Electron production in the vicinity of the cathode
can assist in faster development of a self-sustained breakdown process which will decrease
Tf and in turn the overall Tb values for negative polarity LIs [92], [93].
For the positive polarity, a correlation between the type of gas medium and Tb values has
been observed. For SF6, which is a purely electronegative gas, breakdowns show to be more
evenly distributed in relationship to the Tb values. Breakdown events occur mostly below 10
μs but there are also events exceeding this value and reach as high as approximately 25 μs.
For the 20% C3F7CN / 80% CO2 gas mixture, which is a mixture of strongly and weakly
electronegative gases, the breakdown events have shown to occur mostly below 10 μs with
very few exceptions exceeding this value. For the 16% C3F7CN / 84% CO2 gas mixture,
where there is a further reduction in the concentration of the strongly electronegative gas,
the breakdown events are all concentrated below 8 μs with only one breakdown event
exception exceeding the 10 μs threshold value.
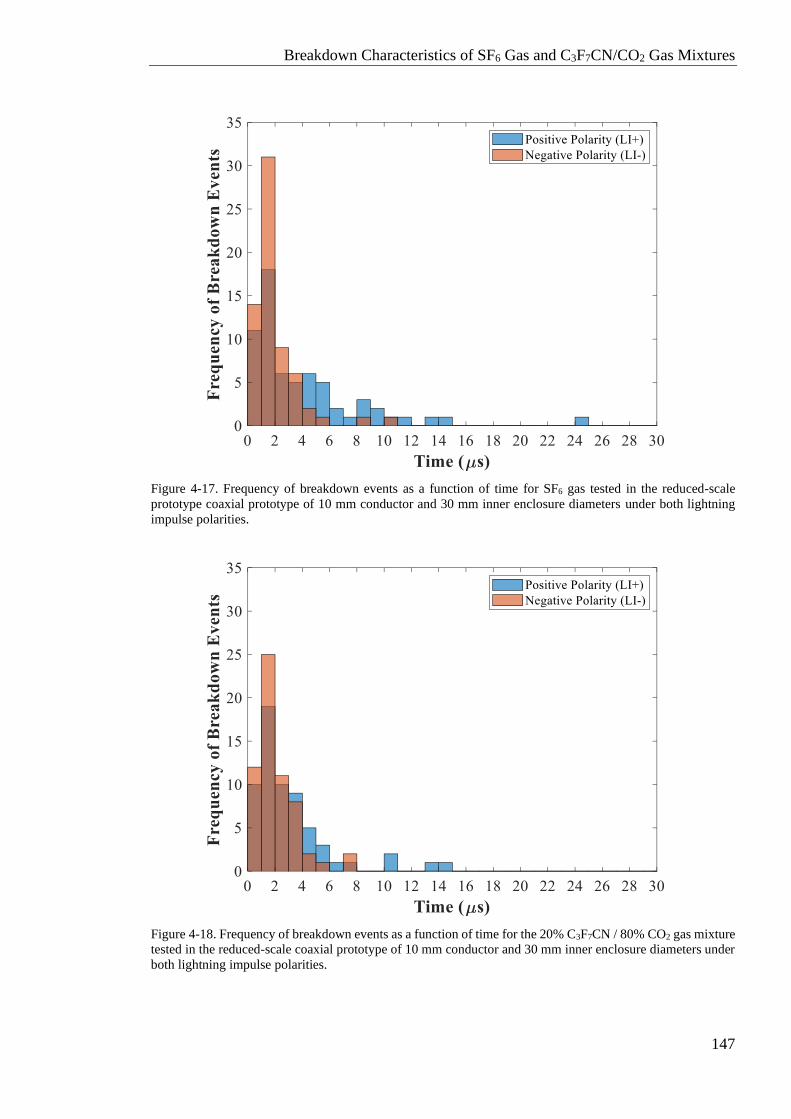
Breakdown Characteristics of SF6 Gas and C3F7CN/CO2 Gas Mixtures
147
Figure 4-17. Frequency of breakdown events as a function of time for SF6 gas tested in the reduced-scale
prototype coaxial prototype of 10 mm conductor and 30 mm inner enclosure diameters under both lightning
impulse polarities.
Figure 4-18. Frequency of breakdown events as a function of time for the 20% C3F7CN / 80% CO2 gas mixture
tested in the reduced-scale coaxial prototype of 10 mm conductor and 30 mm inner enclosure diameters under
both lightning impulse polarities.
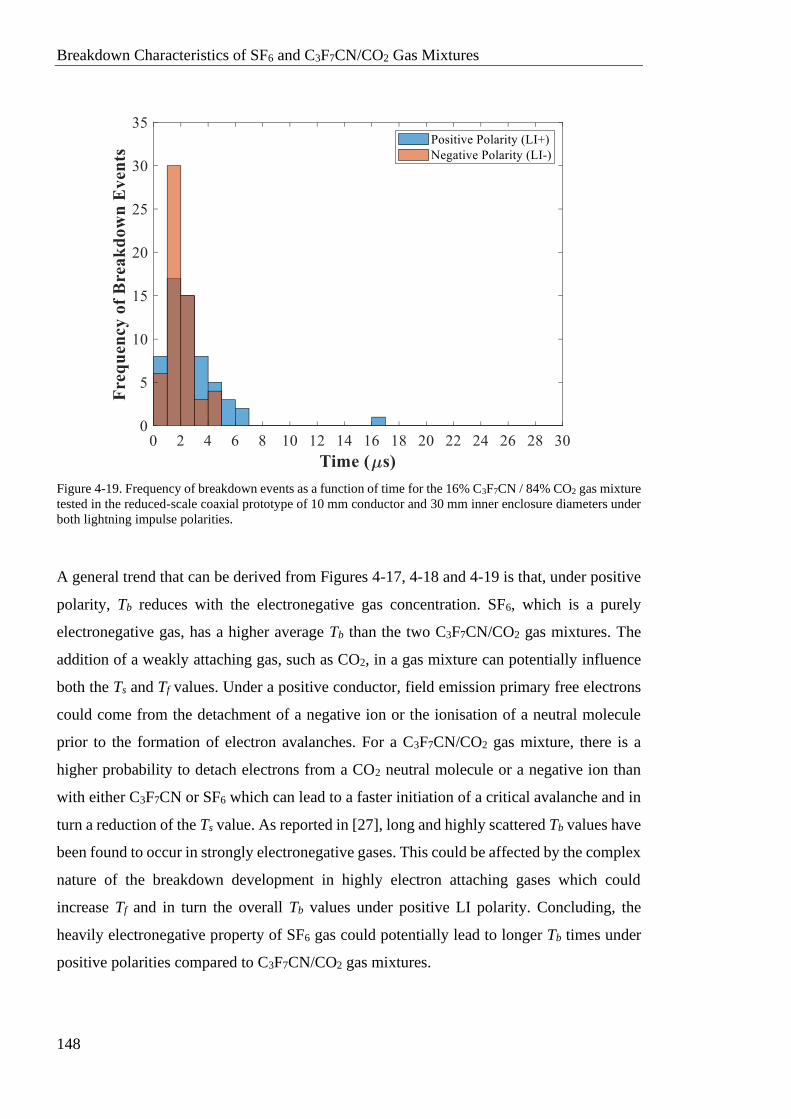
Breakdown Characteristics of SF6 and C3F7CN/CO2 Gas Mixtures
148
Figure 4-19. Frequency of breakdown events as a function of time for the 16% C3F7CN / 84% CO2 gas mixture
tested in the reduced-scale coaxial prototype of 10 mm conductor and 30 mm inner enclosure diameters under
both lightning impulse polarities.
A general trend that can be derived from Figures 4-17, 4-18 and 4-19 is that, under positive
polarity, Tb reduces with the electronegative gas concentration. SF6, which is a purely
electronegative gas, has a higher average Tb than the two C3F7CN/CO2 gas mixtures. The
addition of a weakly attaching gas, such as CO2, in a gas mixture can potentially influence
both the Ts and Tf values. Under a positive conductor, field emission primary free electrons
could come from the detachment of a negative ion or the ionisation of a neutral molecule
prior to the formation of electron avalanches. For a C3F7CN/CO2 gas mixture, there is a
higher probability to detach electrons from a CO2 neutral molecule or a negative ion than
with either C3F7CN or SF6 which can lead to a faster initiation of a critical avalanche and in
turn a reduction of the Ts value. As reported in [27], long and highly scattered Tb values have
been found to occur in strongly electronegative gases. This could be affected by the complex
nature of the breakdown development in highly electron attaching gases which could
increase Tf and in turn the overall Tb values under positive LI polarity. Concluding, the
heavily electronegative property of SF6 gas could potentially lead to longer Tb times under
positive polarities compared to C3F7CN/CO2 gas mixtures.
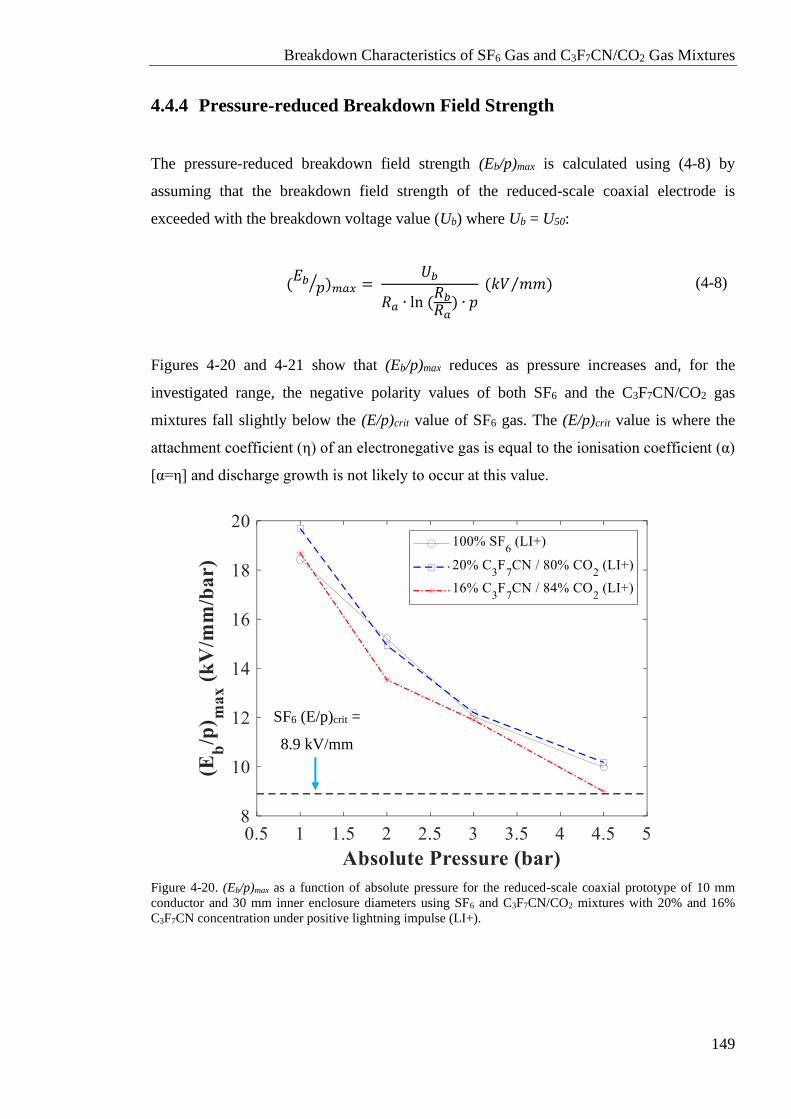
Breakdown Characteristics of SF6 Gas and C3F7CN/CO2 Gas Mixtures
149
4.4.4 Pressure-reduced Breakdown Field Strength
The pressure-reduced breakdown field strength (Eb/p)max is calculated using (4-8) by
assuming that the breakdown field strength of the reduced-scale coaxial electrode is
exceeded with the breakdown voltage value (Ub) where Ub = U50:
(𝐸𝑏
𝑝⁄ )𝑚𝑎𝑥 = 𝑈𝑏
𝑅𝑎 ∙ ln (𝑅𝑏
𝑅𝑎) ∙ 𝑝
(𝑘𝑉 𝑚𝑚)⁄
(4-8)
Figures 4-20 and 4-21 show that (Eb/p)max reduces as pressure increases and, for the
investigated range, the negative polarity values of both SF6 and the C3F7CN/CO2 gas
mixtures fall slightly below the (E/p)crit value of SF6 gas. The (E/p)crit value is where the
attachment coefficient (η) of an electronegative gas is equal to the ionisation coefficient (α)
[α=η] and discharge growth is not likely to occur at this value.
Figure 4-20. (Eb/p)max as a function of absolute pressure for the reduced-scale coaxial prototype of 10 mm
conductor and 30 mm inner enclosure diameters using SF6 and C3F7CN/CO2 mixtures with 20% and 16%
C3F7CN concentration under positive lightning impulse (LI+).
SF6 (E/p)crit =
8.9 kV/mm
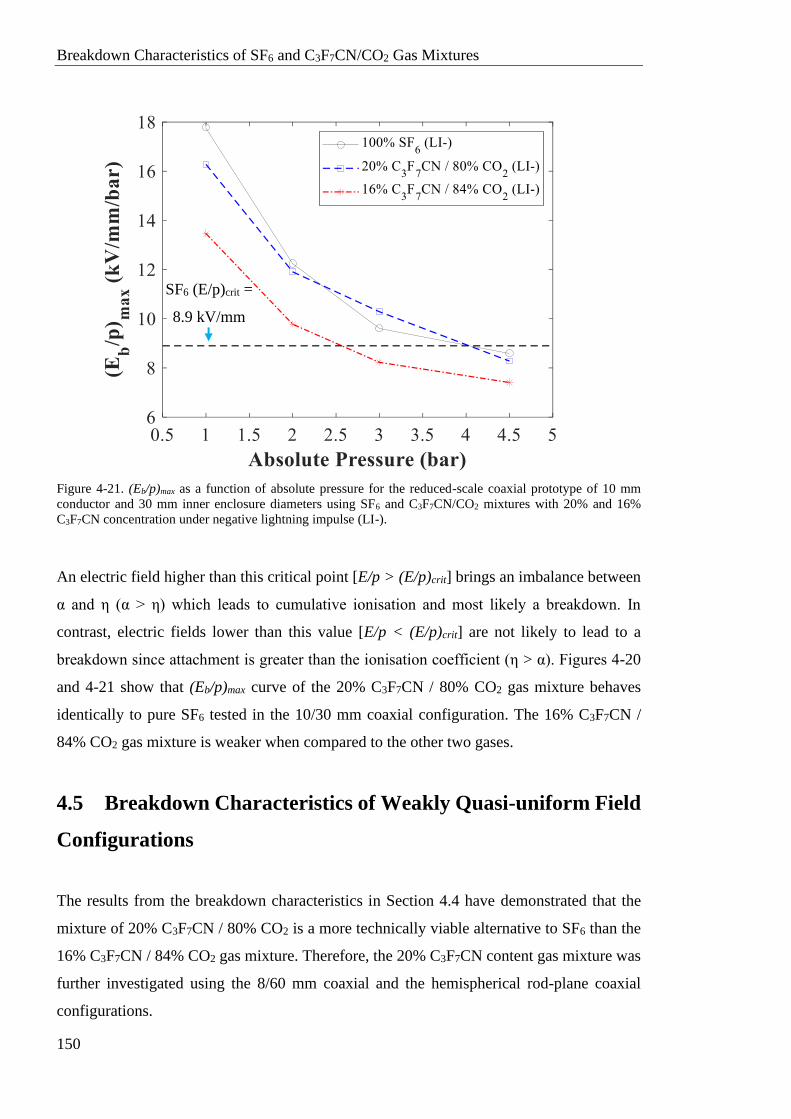
Breakdown Characteristics of SF6 and C3F7CN/CO2 Gas Mixtures
150
Figure 4-21. (Eb/p)max as a function of absolute pressure for the reduced-scale coaxial prototype of 10 mm
conductor and 30 mm inner enclosure diameters using SF6 and C3F7CN/CO2 mixtures with 20% and 16%
C3F7CN concentration under negative lightning impulse (LI-).
An electric field higher than this critical point [E/p > (E/p)crit] brings an imbalance between
α and η (α > η) which leads to cumulative ionisation and most likely a breakdown. In
contrast, electric fields lower than this value [E/p < (E/p)crit] are not likely to lead to a
breakdown since attachment is greater than the ionisation coefficient (η > α). Figures 4-20
and 4-21 show that (Eb/p)max curve of the 20% C3F7CN / 80% CO2 gas mixture behaves
identically to pure SF6 tested in the 10/30 mm coaxial configuration. The 16% C3F7CN /
84% CO2 gas mixture is weaker when compared to the other two gases.
4.5 Breakdown Characteristics of Weakly Quasi-uniform Field
Configurations
The results from the breakdown characteristics in Section 4.4 have demonstrated that the
mixture of 20% C3F7CN / 80% CO2 is a more technically viable alternative to SF6 than the
16% C3F7CN / 84% CO2 gas mixture. Therefore, the 20% C3F7CN content gas mixture was
further investigated using the 8/60 mm coaxial and the hemispherical rod-plane coaxial
configurations.
SF6 (E/p)crit =
8.9 kV/mm
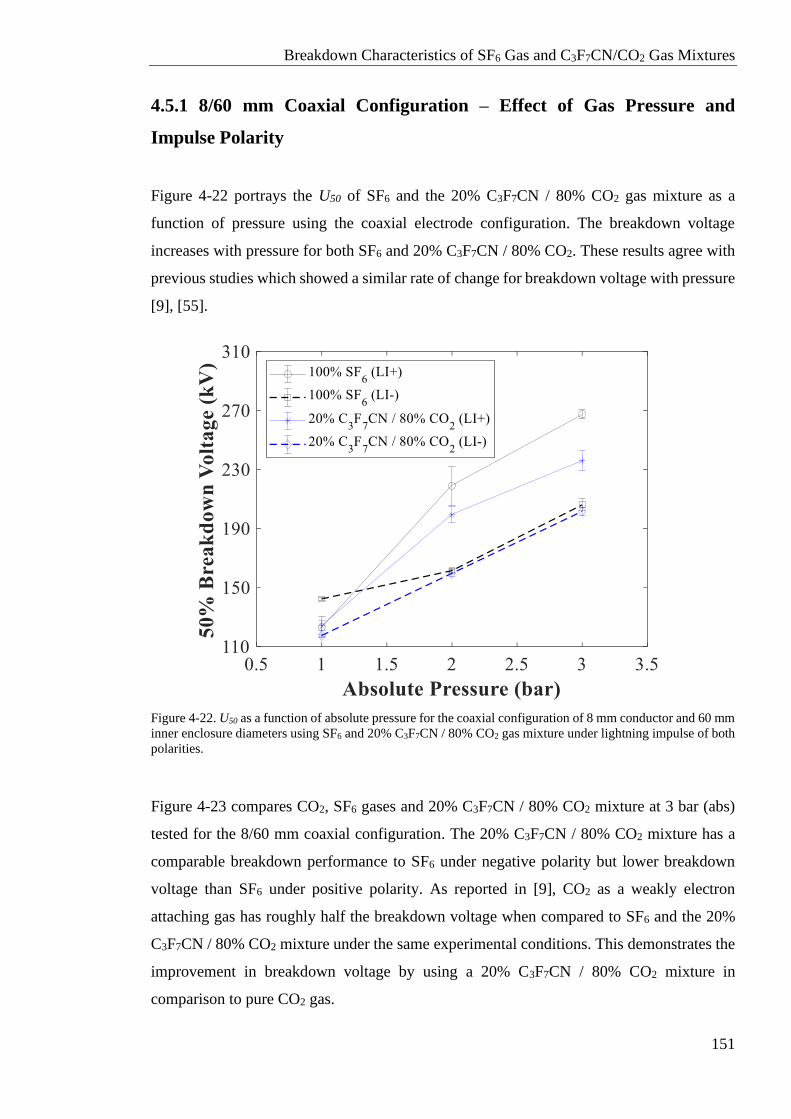
Breakdown Characteristics of SF6 Gas and C3F7CN/CO2 Gas Mixtures
151
4.5.1 8/60 mm Coaxial Configuration – Effect of Gas Pressure and
Impulse Polarity
Figure 4-22 portrays the U50 of SF6 and the 20% C3F7CN / 80% CO2 gas mixture as a
function of pressure using the coaxial electrode configuration. The breakdown voltage
increases with pressure for both SF6 and 20% C3F7CN / 80% CO2. These results agree with
previous studies which showed a similar rate of change for breakdown voltage with pressure
[9], [55].
Figure 4-22. U50 as a function of absolute pressure for the coaxial configuration of 8 mm conductor and 60 mm
inner enclosure diameters using SF6 and 20% C3F7CN / 80% CO2 gas mixture under lightning impulse of both
polarities.
Figure 4-23 compares CO2, SF6 gases and 20% C3F7CN / 80% CO2 mixture at 3 bar (abs)
tested for the 8/60 mm coaxial configuration. The 20% C3F7CN / 80% CO2 mixture has a
comparable breakdown performance to SF6 under negative polarity but lower breakdown
voltage than SF6 under positive polarity. As reported in [9], CO2 as a weakly electron
attaching gas has roughly half the breakdown voltage when compared to SF6 and the 20%
C3F7CN / 80% CO2 mixture under the same experimental conditions. This demonstrates the
improvement in breakdown voltage by using a 20% C3F7CN / 80% CO2 mixture in
comparison to pure CO2 gas.
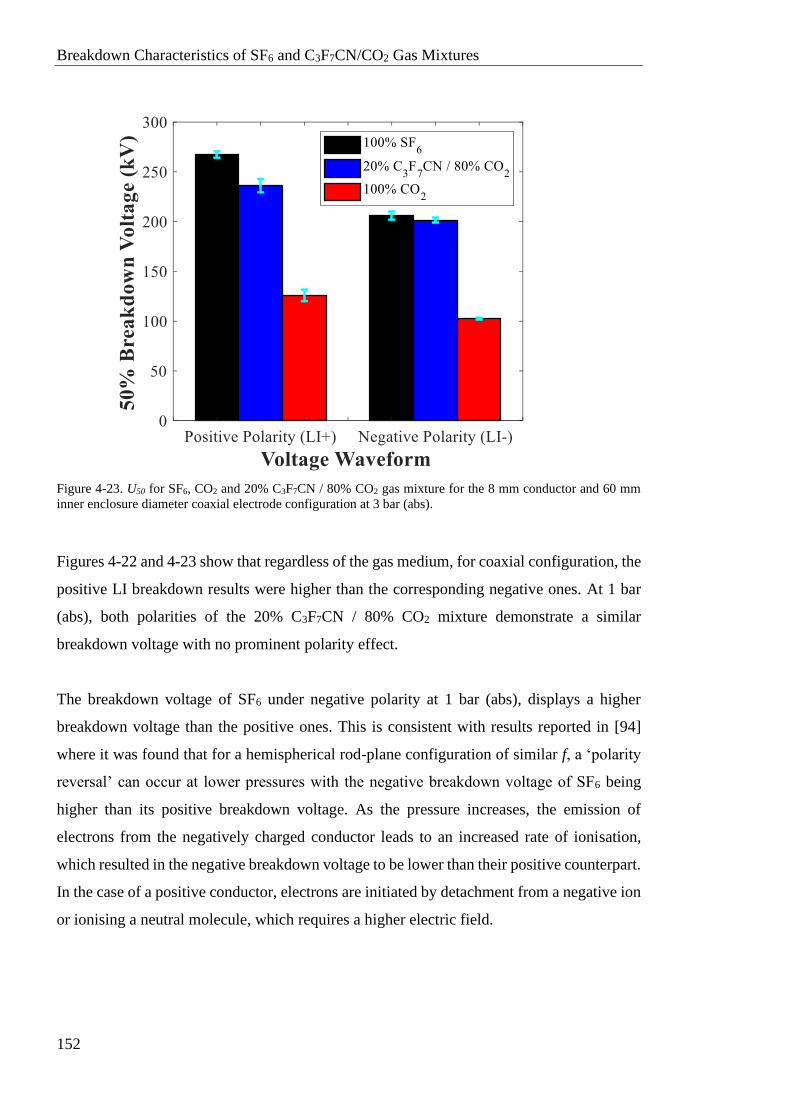
Breakdown Characteristics of SF6 and C3F7CN/CO2 Gas Mixtures
152
Figure 4-23. U50 for SF6, CO2 and 20% C3F7CN / 80% CO2 gas mixture for the 8 mm conductor and 60 mm
inner enclosure diameter coaxial electrode configuration at 3 bar (abs).
Figures 4-22 and 4-23 show that regardless of the gas medium, for coaxial configuration, the
positive LI breakdown results were higher than the corresponding negative ones. At 1 bar
(abs), both polarities of the 20% C3F7CN / 80% CO2 mixture demonstrate a similar
breakdown voltage with no prominent polarity effect.
The breakdown voltage of SF6 under negative polarity at 1 bar (abs), displays a higher
breakdown voltage than the positive ones. This is consistent with results reported in [94]
where it was found that for a hemispherical rod-plane configuration of similar f, a ‘polarity
reversal’ can occur at lower pressures with the negative breakdown voltage of SF6 being
higher than its positive breakdown voltage. As the pressure increases, the emission of
electrons from the negatively charged conductor leads to an increased rate of ionisation,
which resulted in the negative breakdown voltage to be lower than their positive counterpart.
In the case of a positive conductor, electrons are initiated by detachment from a negative ion
or ionising a neutral molecule, which requires a higher electric field.
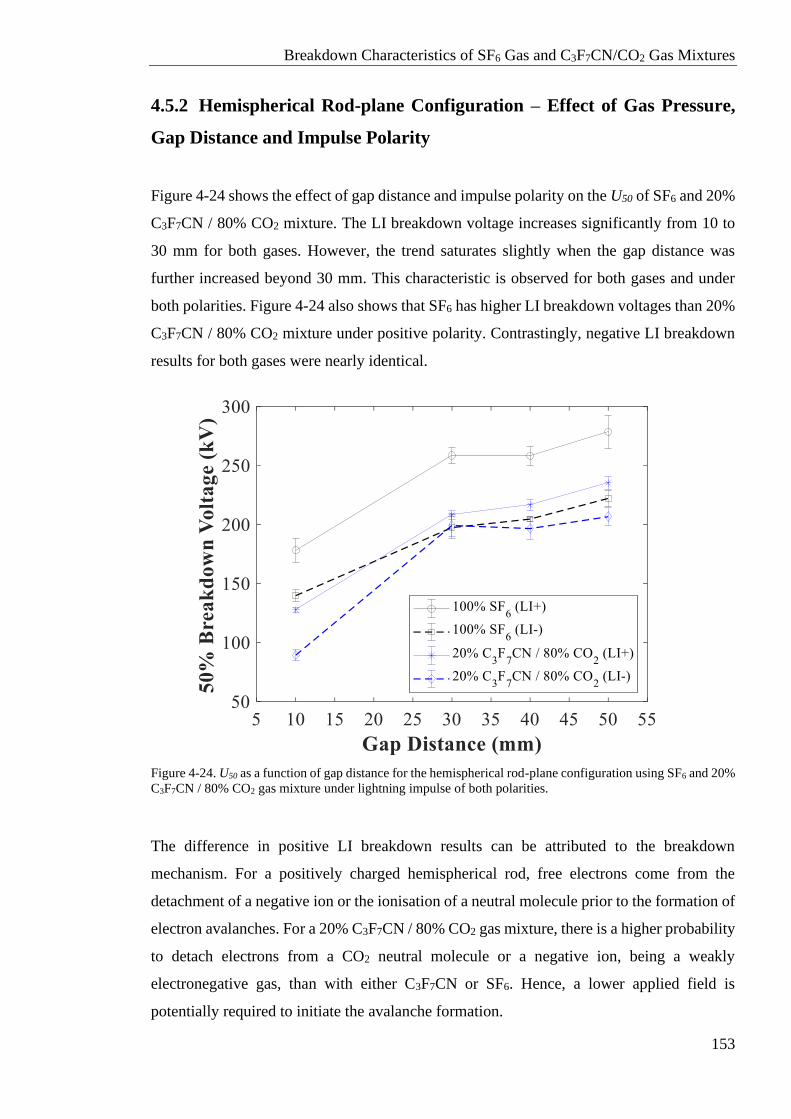
Breakdown Characteristics of SF6 Gas and C3F7CN/CO2 Gas Mixtures
153
4.5.2 Hemispherical Rod-plane Configuration – Effect of Gas Pressure,
Gap Distance and Impulse Polarity
Figure 4-24 shows the effect of gap distance and impulse polarity on the U50 of SF6 and 20%
C3F7CN / 80% CO2 mixture. The LI breakdown voltage increases significantly from 10 to
30 mm for both gases. However, the trend saturates slightly when the gap distance was
further increased beyond 30 mm. This characteristic is observed for both gases and under
both polarities. Figure 4-24 also shows that SF6 has higher LI breakdown voltages than 20%
C3F7CN / 80% CO2 mixture under positive polarity. Contrastingly, negative LI breakdown
results for both gases were nearly identical.
Figure 4-24. U50 as a function of gap distance for the hemispherical rod-plane configuration using SF6 and 20%
C3F7CN / 80% CO2 gas mixture under lightning impulse of both polarities.
The difference in positive LI breakdown results can be attributed to the breakdown
mechanism. For a positively charged hemispherical rod, free electrons come from the
detachment of a negative ion or the ionisation of a neutral molecule prior to the formation of
electron avalanches. For a 20% C3F7CN / 80% CO2 gas mixture, there is a higher probability
to detach electrons from a CO2 neutral molecule or a negative ion, being a weakly
electronegative gas, than with either C3F7CN or SF6. Hence, a lower applied field is
potentially required to initiate the avalanche formation.
Breakdown Characteristics of SF6 and C3F7CN/CO2 Gas Mixtures
154
In the case of a negative polarity, a large number of electrons can be emitted from the cathode
which can initiate an electron avalanche process more readily under a lower applied field.
Additionally, secondary processes such as photoemission or positive ion bombardment can
further assist in making the electron avalanche process self-sustained and in turn result to a
breakdown. These processes have led to the lower negative LI voltages than their positive
counterpart. This also results in SF6 and 20% C3F7CN / 80% CO2 mixture having similar
breakdown performance under negative LI.
Note that, even though the f factor decreases from 0.66 (10 mm gap) to 0.28 (50 mm gap)
which makes the field more non-uniform, there is no evident change in the difference
between positive and negative LI breakdown voltage for both SF6 and 20% C3F7CN / 80%
CO2. The positive breakdown results were consistently higher than the negative results
within the range of gap spacing tested. This can occur since the f range of 0.28-0.66 may be
considered within the same category of weakly quasi-uniform field. Results in [58] have
shown that for the same electrode configuration, but for hemispherically capped rods with
smaller diameters (3.16 mm and 6.3 mm), the negative breakdown results were higher than
the positive, which is different to the results shown in Figure 4-24. This indicates that with
increasing diameter of the high voltage rod, thereby increasing the f, a reversed polarity
effect on the breakdown voltage can be attained. The polarity effect on breakdown voltage
is heavily dependent on f, which can be varied by other design parameters such as the rod
diameter for the same electrode configuration.
Figure 4-24 also shows that SF6 demonstrates a significantly better breakdown performance
under positive polarity, whilst the 20% C3F7CN / 80% CO2 mixture shows that the difference
between positive and negative breakdown voltages is not as prominent as in SF6 under
weakly quasi-uniform fields. As shown in Figure 4-23, this could be attributed to the fact
that the 20% C3F7CN / 80% CO2 gas mixture behaves very similarly to CO2 gas under the
specific electric field uniformity range, with small difference in the positive and negative
breakdown voltages. Therefore, the difference of polarity behaviour between SF6 and the
20% C3F7CN / 80% CO2 gas mixture can occur due to the high concentration of CO2 (a
weakly attaching gas) used. Importantly, this establishes that the polarity effect does not only
depend on the field utilization factor but also on the insulating gas medium used.
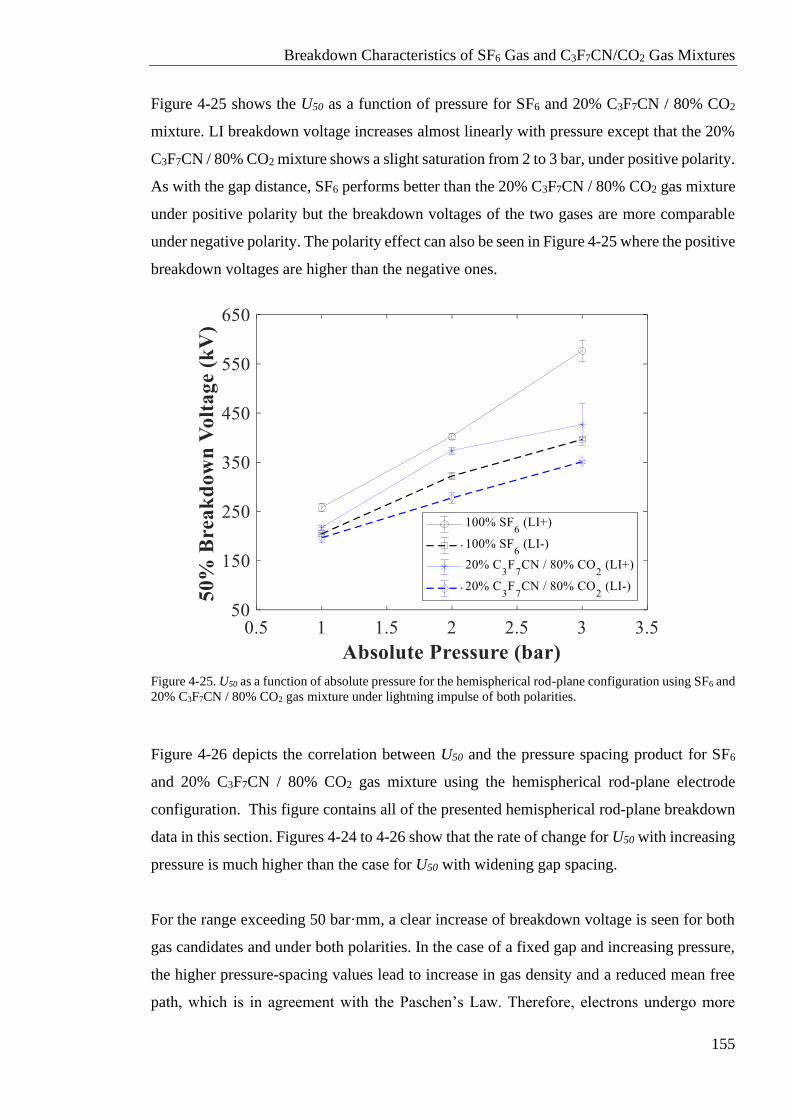
Breakdown Characteristics of SF6 Gas and C3F7CN/CO2 Gas Mixtures
155
Figure 4-25 shows the U50 as a function of pressure for SF6 and 20% C3F7CN / 80% CO2
mixture. LI breakdown voltage increases almost linearly with pressure except that the 20%
C3F7CN / 80% CO2 mixture shows a slight saturation from 2 to 3 bar, under positive polarity.
As with the gap distance, SF6 performs better than the 20% C3F7CN / 80% CO2 gas mixture
under positive polarity but the breakdown voltages of the two gases are more comparable
under negative polarity. The polarity effect can also be seen in Figure 4-25 where the positive
breakdown voltages are higher than the negative ones.
Figure 4-25. U50 as a function of absolute pressure for the hemispherical rod-plane configuration using SF6 and
20% C3F7CN / 80% CO2 gas mixture under lightning impulse of both polarities.
Figure 4-26 depicts the correlation between U50 and the pressure spacing product for SF6
and 20% C3F7CN / 80% CO2 gas mixture using the hemispherical rod-plane electrode
configuration. This figure contains all of the presented hemispherical rod-plane breakdown
data in this section. Figures 4-24 to 4-26 show that the rate of change for U50 with increasing
pressure is much higher than the case for U50 with widening gap spacing.
For the range exceeding 50 bar·mm, a clear increase of breakdown voltage is seen for both
gas candidates and under both polarities. In the case of a fixed gap and increasing pressure,
the higher pressure-spacing values lead to increase in gas density and a reduced mean free
path, which is in agreement with the Paschen’s Law. Therefore, electrons undergo more
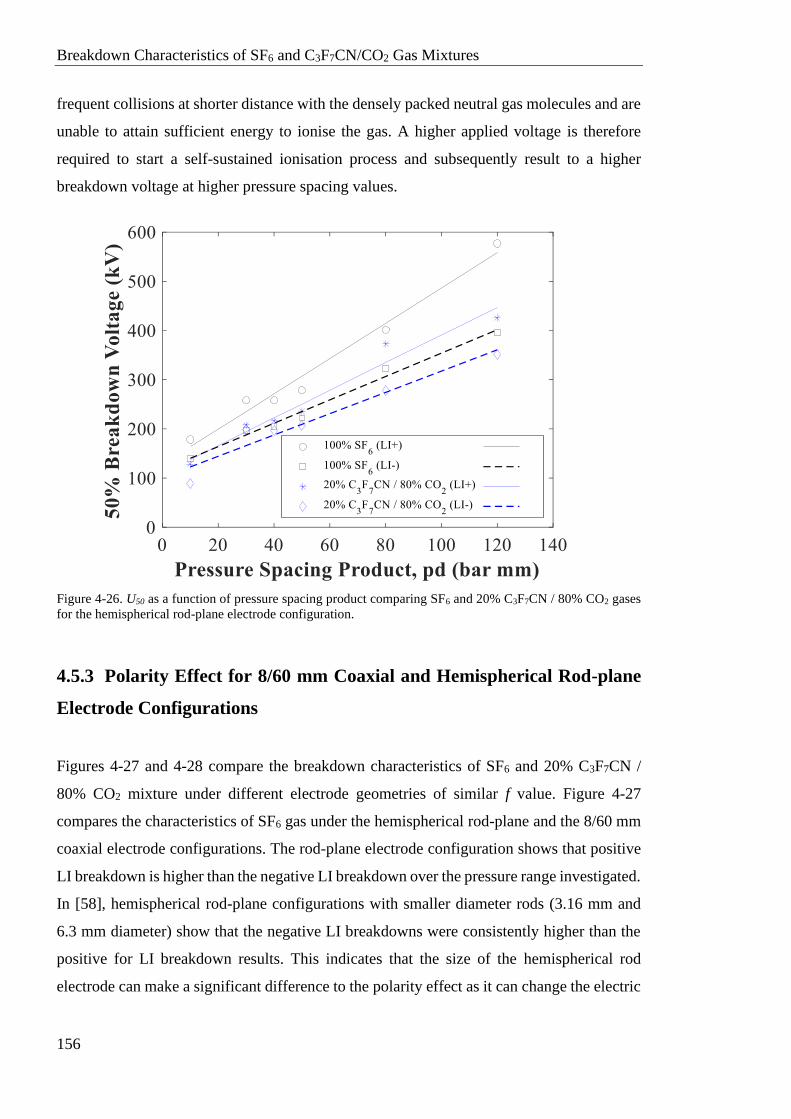
Breakdown Characteristics of SF6 and C3F7CN/CO2 Gas Mixtures
156
frequent collisions at shorter distance with the densely packed neutral gas molecules and are
unable to attain sufficient energy to ionise the gas. A higher applied voltage is therefore
required to start a self-sustained ionisation process and subsequently result to a higher
breakdown voltage at higher pressure spacing values.
Figure 4-26. U50 as a function of pressure spacing product comparing SF6 and 20% C3F7CN / 80% CO2 gases
for the hemispherical rod-plane electrode configuration.
4.5.3 Polarity Effect for 8/60 mm Coaxial and Hemispherical Rod-plane
Electrode Configurations
Figures 4-27 and 4-28 compare the breakdown characteristics of SF6 and 20% C3F7CN /
80% CO2 mixture under different electrode geometries of similar f value. Figure 4-27
compares the characteristics of SF6 gas under the hemispherical rod-plane and the 8/60 mm
coaxial electrode configurations. The rod-plane electrode configuration shows that positive
LI breakdown is higher than the negative LI breakdown over the pressure range investigated.
In [58], hemispherical rod-plane configurations with smaller diameter rods (3.16 mm and
6.3 mm diameter) show that the negative LI breakdowns were consistently higher than the
positive for LI breakdown results. This indicates that the size of the hemispherical rod
electrode can make a significant difference to the polarity effect as it can change the electric
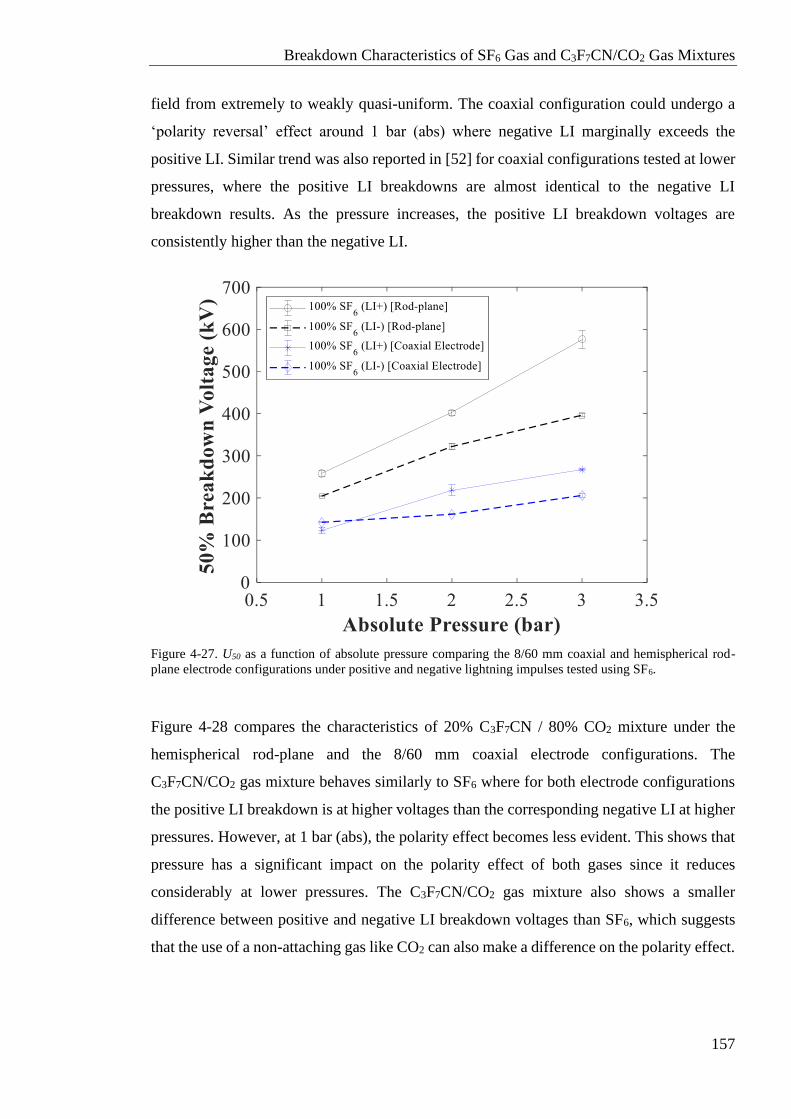
Breakdown Characteristics of SF6 Gas and C3F7CN/CO2 Gas Mixtures
157
field from extremely to weakly quasi-uniform. The coaxial configuration could undergo a
‘polarity reversal’ effect around 1 bar (abs) where negative LI marginally exceeds the
positive LI. Similar trend was also reported in [52] for coaxial configurations tested at lower
pressures, where the positive LI breakdowns are almost identical to the negative LI
breakdown results. As the pressure increases, the positive LI breakdown voltages are
consistently higher than the negative LI.
Figure 4-27. U50 as a function of absolute pressure comparing the 8/60 mm coaxial and hemispherical rod-
plane electrode configurations under positive and negative lightning impulses tested using SF6.
Figure 4-28 compares the characteristics of 20% C3F7CN / 80% CO2 mixture under the
hemispherical rod-plane and the 8/60 mm coaxial electrode configurations. The
C3F7CN/CO2 gas mixture behaves similarly to SF6 where for both electrode configurations
the positive LI breakdown is at higher voltages than the corresponding negative LI at higher
pressures. However, at 1 bar (abs), the polarity effect becomes less evident. This shows that
pressure has a significant impact on the polarity effect of both gases since it reduces
considerably at lower pressures. The C3F7CN/CO2 gas mixture also shows a smaller
difference between positive and negative LI breakdown voltages than SF6, which suggests
that the use of a non-attaching gas like CO2 can also make a difference on the polarity effect.
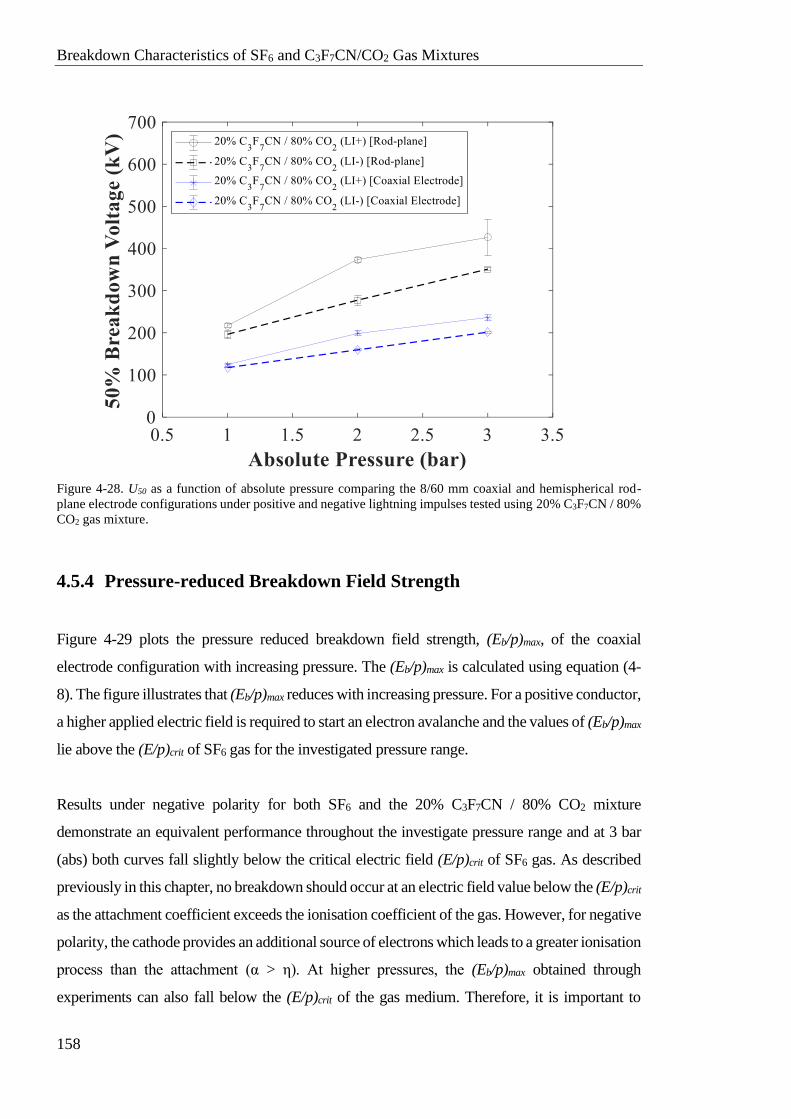
Breakdown Characteristics of SF6 and C3F7CN/CO2 Gas Mixtures
158
Figure 4-28. U50 as a function of absolute pressure comparing the 8/60 mm coaxial and hemispherical rod-
plane electrode configurations under positive and negative lightning impulses tested using 20% C3F7CN / 80%
CO2 gas mixture.
4.5.4 Pressure-reduced Breakdown Field Strength
Figure 4-29 plots the pressure reduced breakdown field strength, (Eb/p)max, of the coaxial
electrode configuration with increasing pressure. The (Eb/p)max is calculated using equation (4-
8). The figure illustrates that (Eb/p)max reduces with increasing pressure. For a positive conductor,
a higher applied electric field is required to start an electron avalanche and the values of (Eb/p)max
lie above the (E/p)crit of SF6 gas for the investigated pressure range.
Results under negative polarity for both SF6 and the 20% C3F7CN / 80% CO2 mixture
demonstrate an equivalent performance throughout the investigate pressure range and at 3 bar
(abs) both curves fall slightly below the critical electric field (E/p)crit of SF6 gas. As described
previously in this chapter, no breakdown should occur at an electric field value below the (E/p)crit
as the attachment coefficient exceeds the ionisation coefficient of the gas. However, for negative
polarity, the cathode provides an additional source of electrons which leads to a greater ionisation
process than the attachment (α > η). At higher pressures, the (Eb/p)max obtained through
experiments can also fall below the (E/p)crit of the gas medium. Therefore, it is important to
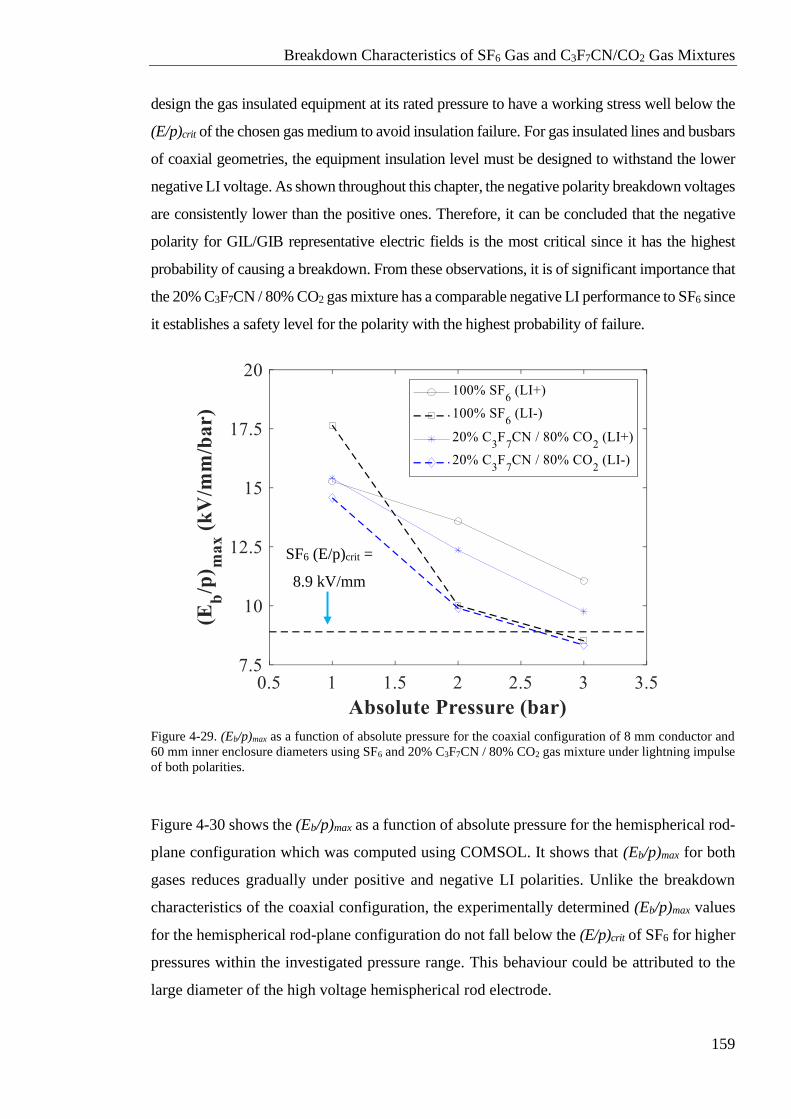
Breakdown Characteristics of SF6 Gas and C3F7CN/CO2 Gas Mixtures
159
design the gas insulated equipment at its rated pressure to have a working stress well below the
(E/p)crit of the chosen gas medium to avoid insulation failure. For gas insulated lines and busbars
of coaxial geometries, the equipment insulation level must be designed to withstand the lower
negative LI voltage. As shown throughout this chapter, the negative polarity breakdown voltages
are consistently lower than the positive ones. Therefore, it can be concluded that the negative
polarity for GIL/GIB representative electric fields is the most critical since it has the highest
probability of causing a breakdown. From these observations, it is of significant importance that
the 20% C3F7CN / 80% CO2 gas mixture has a comparable negative LI performance to SF6 since
it establishes a safety level for the polarity with the highest probability of failure.
Figure 4-29. (Eb/p)max as a function of absolute pressure for the coaxial configuration of 8 mm conductor and
60 mm inner enclosure diameters using SF6 and 20% C3F7CN / 80% CO2 gas mixture under lightning impulse
of both polarities.
Figure 4-30 shows the (Eb/p)max as a function of absolute pressure for the hemispherical rod-
plane configuration which was computed using COMSOL. It shows that (Eb/p)max for both
gases reduces gradually under positive and negative LI polarities. Unlike the breakdown
characteristics of the coaxial configuration, the experimentally determined (Eb/p)max values
for the hemispherical rod-plane configuration do not fall below the (E/p)crit of SF6 for higher
pressures within the investigated pressure range. This behaviour could be attributed to the
large diameter of the high voltage hemispherical rod electrode.
SF6 (E/p)crit =
8.9 kV/mm
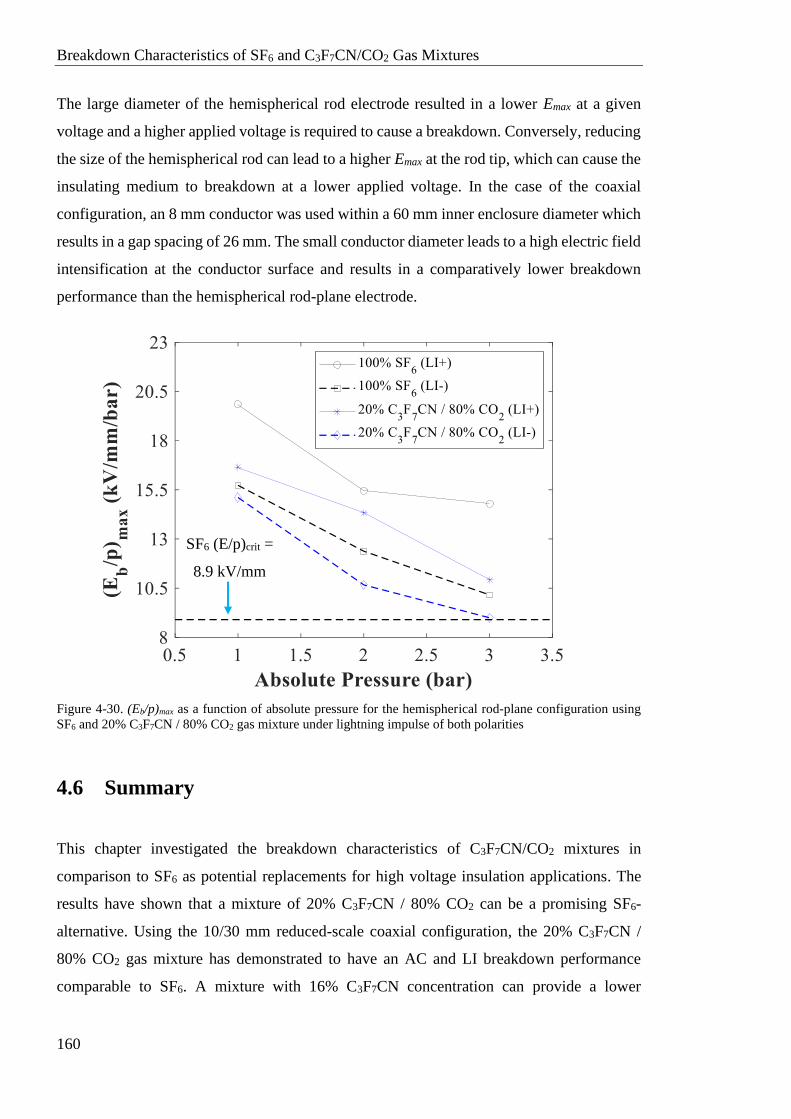
Breakdown Characteristics of SF6 and C3F7CN/CO2 Gas Mixtures
160
The large diameter of the hemispherical rod electrode resulted in a lower Emax at a given
voltage and a higher applied voltage is required to cause a breakdown. Conversely, reducing
the size of the hemispherical rod can lead to a higher Emax at the rod tip, which can cause the
insulating medium to breakdown at a lower applied voltage. In the case of the coaxial
configuration, an 8 mm conductor was used within a 60 mm inner enclosure diameter which
results in a gap spacing of 26 mm. The small conductor diameter leads to a high electric field
intensification at the conductor surface and results in a comparatively lower breakdown
performance than the hemispherical rod-plane electrode.
Figure 4-30. (Eb/p)max as a function of absolute pressure for the hemispherical rod-plane configuration using
SF6 and 20% C3F7CN / 80% CO2 gas mixture under lightning impulse of both polarities
4.6 Summary
This chapter investigated the breakdown characteristics of C3F7CN/CO2 mixtures in
comparison to SF6 as potential replacements for high voltage insulation applications. The
results have shown that a mixture of 20% C3F7CN / 80% CO2 can be a promising SF6-
alternative. Using the 10/30 mm reduced-scale coaxial configuration, the 20% C3F7CN /
80% CO2 gas mixture has demonstrated to have an AC and LI breakdown performance
comparable to SF6. A mixture with 16% C3F7CN concentration can provide a lower
SF6 (E/p)crit =
8.9 kV/mm
Breakdown Characteristics of SF6 Gas and C3F7CN/CO2 Gas Mixtures
161
liquefaction temperature of 5°C than the 20% C3F7CN gas mixture but with a noticeably
lower breakdown strength. This chapter has also shown that negative polarity LI breakdown
voltage tends to be lower than positive using this reduced-scale prototype coaxial
configuration. This indicates that for gas insulated equipment with a coaxial geometry, the
negative polarity is more critical in the design consideration.
This chapter further investigated the breakdown characteristics of SF6 and 20% C3F7CN /
80% CO2 gas mixture under weakly quasi-uniform field configurations. This was carried out
since these two gases were found to have a comparable electrical performance under quasi-
uniform electric fields. Two different electrode configurations, coaxial and hemispherical
rod-plane, with similar f values were developed to investigate the LI breakdown
characteristics of both gases. The results have shown that SF6 has higher breakdown voltages
than the 20% C3F7CN / 80% CO2 gas mixture for positive polarity under weakly quasi-
uniform fields. The negative breakdown voltages are comparable for both gases. Even
though the 20% C3F7CN / 80% CO2 gas mixture has a lower positive breakdown voltage
under weakly quasi-uniform field configurations, the equal behaviour under negative
polarity provides a safety margin that this mixture can be used in GIL/GIB applications. This
is because, as shown in this chapter, the negative polarity has a higher probability of failure
using coaxial configurations. Therefore, equal performance of the two mediums under the
weakest performing polarity shows that it can be tested in full-scale equipment with
confidence.
The polarity effect does not exclusively depend on the field uniformity but other parameters
such as pressure and gas medium (electronegativity) can significantly affect the polarity
effect. The 20% C3F7CN / 80% CO2 gas mixture has shown a smaller polarity difference in
breakdown voltage than SF6 between both LI polarities under weakly quasi-uniform electric
fields. At a low pressure (1 bar abs), the breakdown voltages of the C3F7CN/CO2 gas mixture
for both LI polarities were found to be almost identical. All these factors should be taken
into consideration to adopt a SF6-alternative for retro-fill applications.

Breakdown Characteristics of SF6 and C3F7CN/CO2 Gas Mixtures
162
Blank Page
Partial Discharge Characteristics of SF6 Gas and 20% C3F7CN / 80% CO2 Gas Mixture
163
Chapter 5 Partial Discharge Characteristics
of SF6 Gas and 20% C3F7CN / 80% CO2 Gas
Mixture
5.1 Introduction
Manufacturing defects such as small protrusions on conductor and enclosure as well as the
presence of floating metallic particles can lead to field enhancements within the GIL and
GIB equipment [28], [95]. These flaws and contaminations will stress the gas and slowly
deteriorate its insulation capability over time which could eventually lead to catastrophic
failure of equipment. This localised breakdown of insulation results in discharge activities
which are known as partial discharge (PD). These defects are better prevented in the modern
equipment since, with the advancement in technology, the technical finish in new assets can
be treated more cautiously. However, when dealing with a retro-fill investigation for
replacing SF6 in equipment operating since the 1960s, it is a vital performance parameter to
take into consideration. Therefore, it is important to experimentally compare the PD
behaviour of the 20% C3F7CN / 80% CO2 gas mixture against SF6.
Chapter 3 has described the development of PD test configurations using needles on
electrodes to represent defects on conductor and enclosure in practical equipment. In this
chapter, the PD behaviour of SF6 and 20% C3F7CN / 80% CO2 gas mixture were
characterised in terms of PDIV and PDEV values. Different needle lengths and electrode
configurations were used to vary the field uniformity from divergent to highly divergent
electric fields. Finally, the PD behaviour of SF6 and 20% C3F7CN / 80% CO2 gas mixture
under varying field uniformities were analysed through the usage of PRPD patterns.
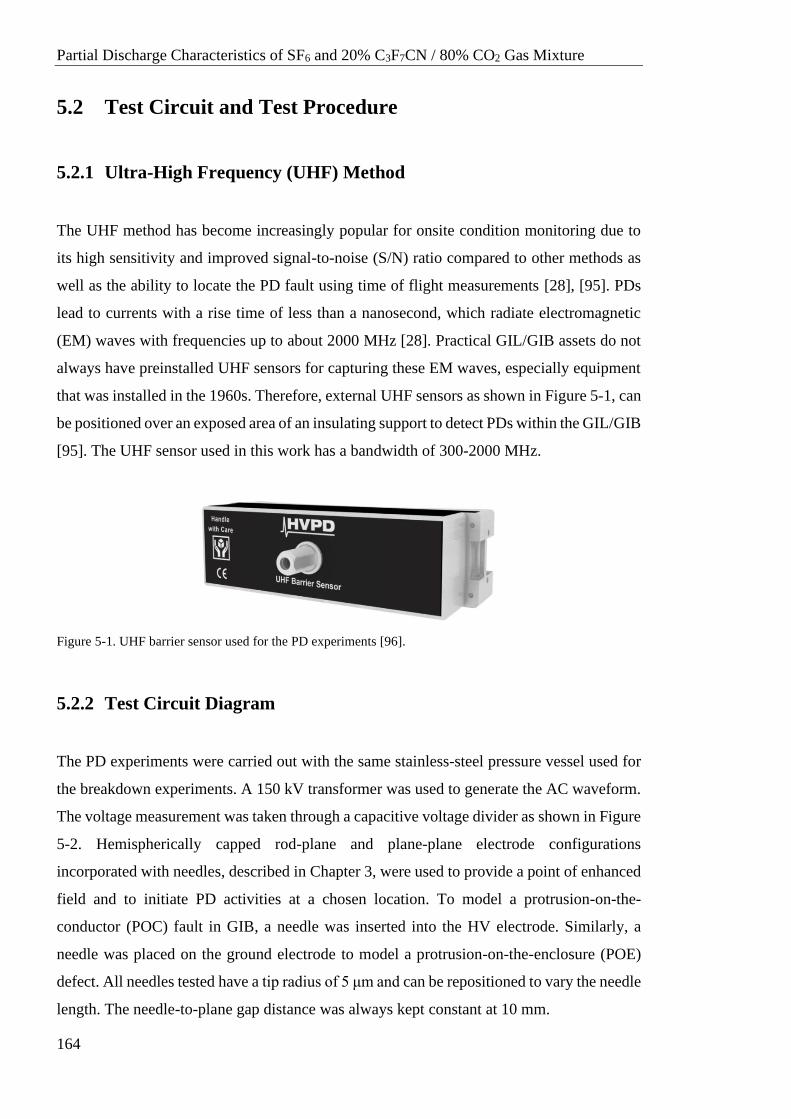
Partial Discharge Characteristics of SF6 and 20% C3F7CN / 80% CO2 Gas Mixture
164
5.2 Test Circuit and Test Procedure
5.2.1 Ultra-High Frequency (UHF) Method
The UHF method has become increasingly popular for onsite condition monitoring due to
its high sensitivity and improved signal-to-noise (S/N) ratio compared to other methods as
well as the ability to locate the PD fault using time of flight measurements [28], [95]. PDs
lead to currents with a rise time of less than a nanosecond, which radiate electromagnetic
(EM) waves with frequencies up to about 2000 MHz [28]. Practical GIL/GIB assets do not
always have preinstalled UHF sensors for capturing these EM waves, especially equipment
that was installed in the 1960s. Therefore, external UHF sensors as shown in Figure 5-1, can
be positioned over an exposed area of an insulating support to detect PDs within the GIL/GIB
[95]. The UHF sensor used in this work has a bandwidth of 300-2000 MHz.
Figure 5-1. UHF barrier sensor used for the PD experiments [96].
5.2.2 Test Circuit Diagram
The PD experiments were carried out with the same stainless-steel pressure vessel used for
the breakdown experiments. A 150 kV transformer was used to generate the AC waveform.
The voltage measurement was taken through a capacitive voltage divider as shown in Figure
5-2. Hemispherically capped rod-plane and plane-plane electrode configurations
incorporated with needles, described in Chapter 3, were used to provide a point of enhanced
field and to initiate PD activities at a chosen location. To model a protrusion-on-the-
conductor (POC) fault in GIB, a needle was inserted into the HV electrode. Similarly, a
needle was placed on the ground electrode to model a protrusion-on-the-enclosure (POE)
defect. All needles tested have a tip radius of 5 μm and can be repositioned to vary the needle
length. The needle-to-plane gap distance was always kept constant at 10 mm.
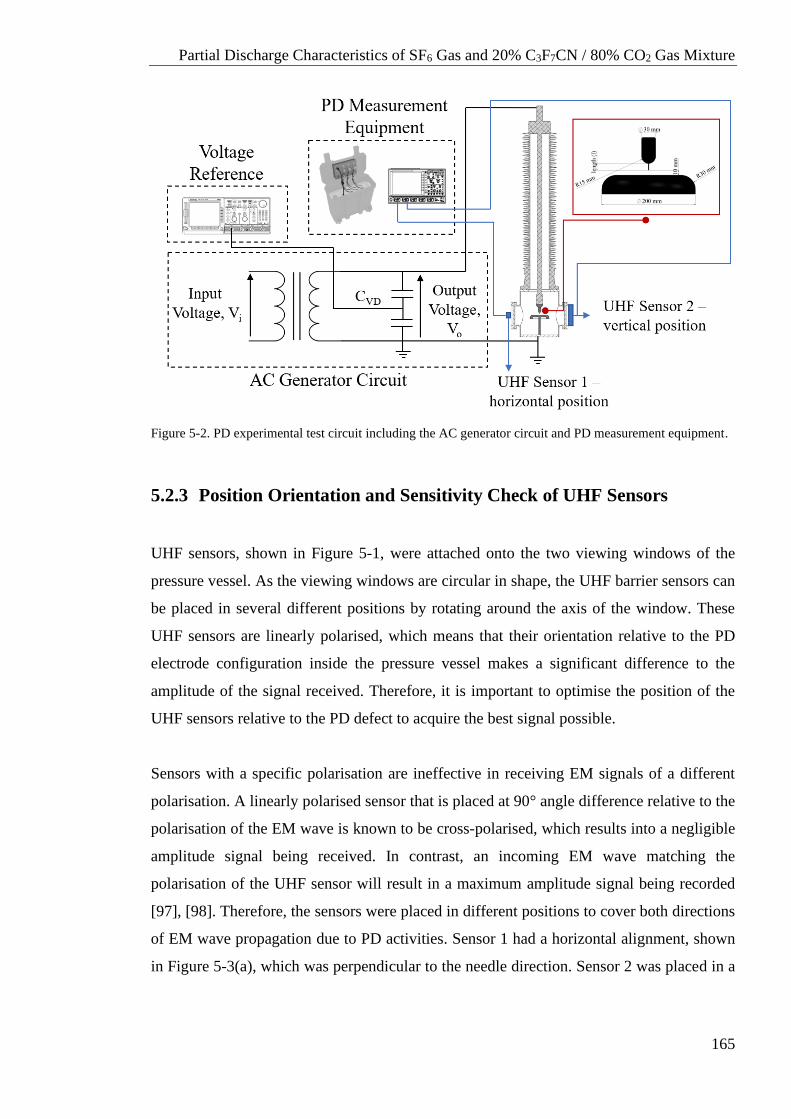
Partial Discharge Characteristics of SF6 Gas and 20% C3F7CN / 80% CO2 Gas Mixture
165
Figure 5-2. PD experimental test circuit including the AC generator circuit and PD measurement equipment.
5.2.3 Position Orientation and Sensitivity Check of UHF Sensors
UHF sensors, shown in Figure 5-1, were attached onto the two viewing windows of the
pressure vessel. As the viewing windows are circular in shape, the UHF barrier sensors can
be placed in several different positions by rotating around the axis of the window. These
UHF sensors are linearly polarised, which means that their orientation relative to the PD
electrode configuration inside the pressure vessel makes a significant difference to the
amplitude of the signal received. Therefore, it is important to optimise the position of the
UHF sensors relative to the PD defect to acquire the best signal possible.
Sensors with a specific polarisation are ineffective in receiving EM signals of a different
polarisation. A linearly polarised sensor that is placed at 90° angle difference relative to the
polarisation of the EM wave is known to be cross-polarised, which results into a negligible
amplitude signal being received. In contrast, an incoming EM wave matching the
polarisation of the UHF sensor will result in a maximum amplitude signal being recorded
[97], [98]. Therefore, the sensors were placed in different positions to cover both directions
of EM wave propagation due to PD activities. Sensor 1 had a horizontal alignment, shown
in Figure 5-3(a), which was perpendicular to the needle direction. Sensor 2 was placed in a
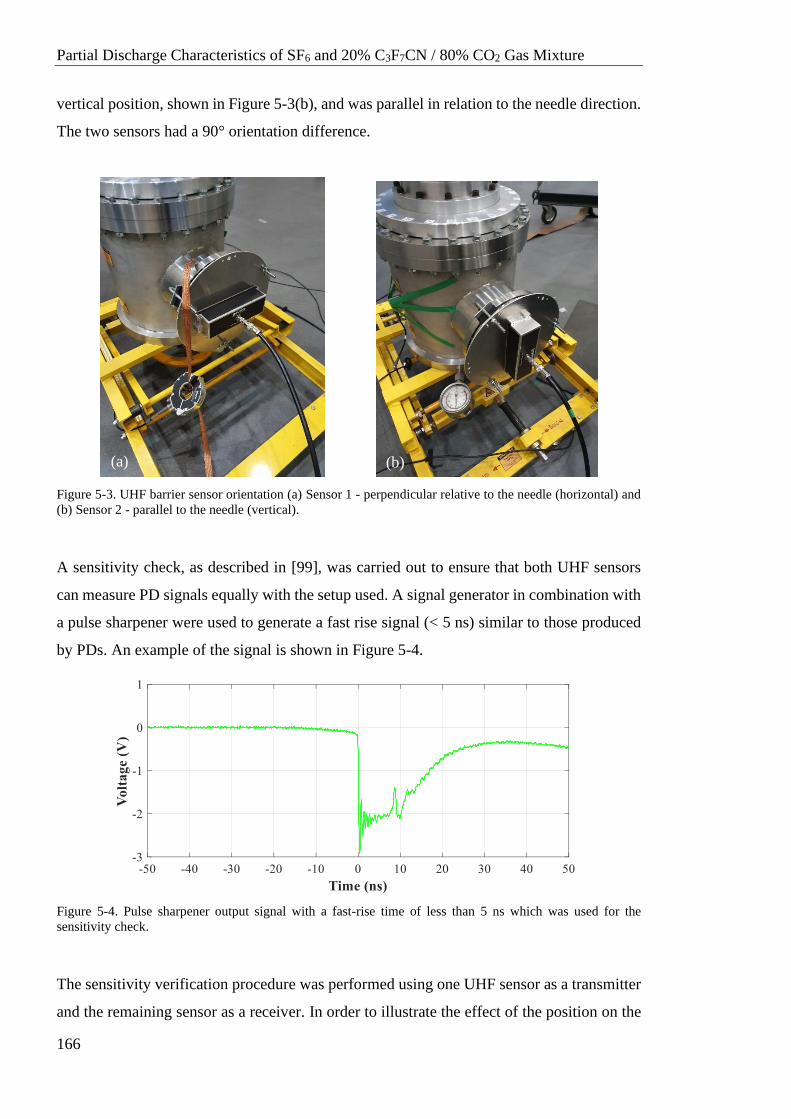
Partial Discharge Characteristics of SF6 and 20% C3F7CN / 80% CO2 Gas Mixture
166
vertical position, shown in Figure 5-3(b), and was parallel in relation to the needle direction.
The two sensors had a 90° orientation difference.
Figure 5-3. UHF barrier sensor orientation (a) Sensor 1 - perpendicular relative to the needle (horizontal) and
(b) Sensor 2 - parallel to the needle (vertical).
A sensitivity check, as described in [99], was carried out to ensure that both UHF sensors
can measure PD signals equally with the setup used. A signal generator in combination with
a pulse sharpener were used to generate a fast rise signal (< 5 ns) similar to those produced
by PDs. An example of the signal is shown in Figure 5-4.
Figure 5-4. Pulse sharpener output signal with a fast-rise time of less than 5 ns which was used for the
sensitivity check.
The sensitivity verification procedure was performed using one UHF sensor as a transmitter
and the remaining sensor as a receiver. In order to illustrate the effect of the position on the
(a) (b)
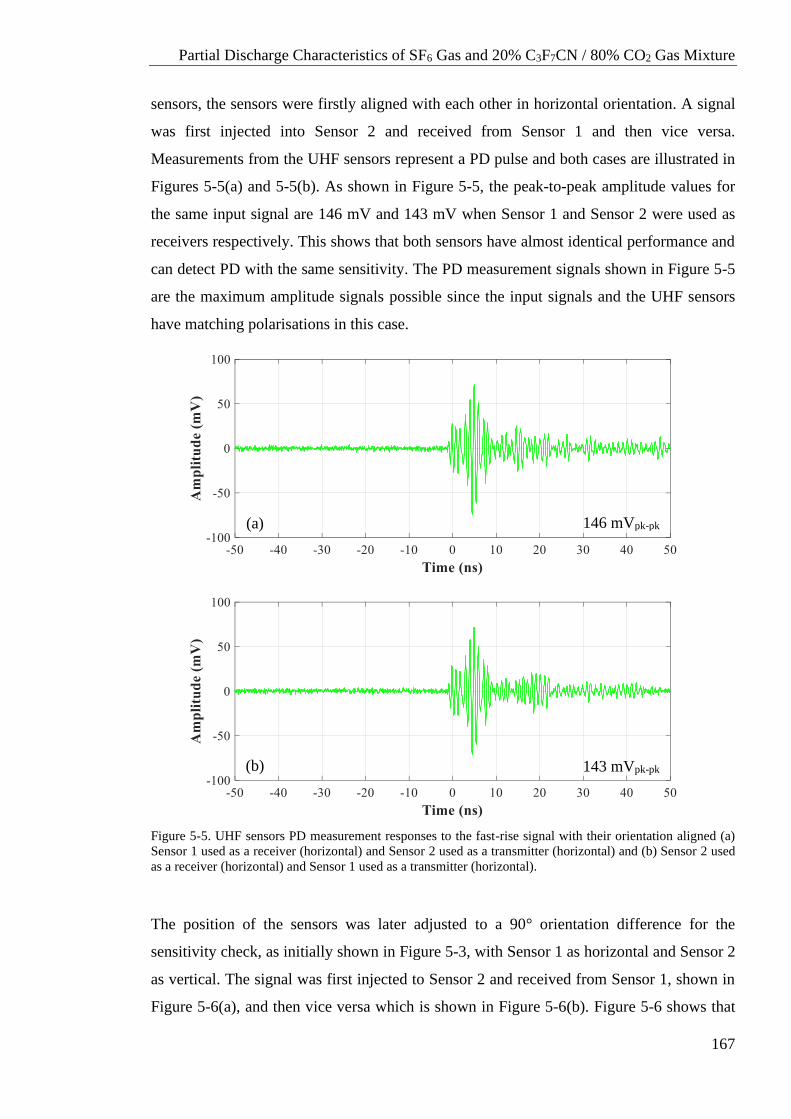
Partial Discharge Characteristics of SF6 Gas and 20% C3F7CN / 80% CO2 Gas Mixture
167
sensors, the sensors were firstly aligned with each other in horizontal orientation. A signal
was first injected into Sensor 2 and received from Sensor 1 and then vice versa.
Measurements from the UHF sensors represent a PD pulse and both cases are illustrated in
Figures 5-5(a) and 5-5(b). As shown in Figure 5-5, the peak-to-peak amplitude values for
the same input signal are 146 mV and 143 mV when Sensor 1 and Sensor 2 were used as
receivers respectively. This shows that both sensors have almost identical performance and
can detect PD with the same sensitivity. The PD measurement signals shown in Figure 5-5
are the maximum amplitude signals possible since the input signals and the UHF sensors
have matching polarisations in this case.
Figure 5-5. UHF sensors PD measurement responses to the fast-rise signal with their orientation aligned (a)
Sensor 1 used as a receiver (horizontal) and Sensor 2 used as a transmitter (horizontal) and (b) Sensor 2 used
as a receiver (horizontal) and Sensor 1 used as a transmitter (horizontal).
The position of the sensors was later adjusted to a 90° orientation difference for the
sensitivity check, as initially shown in Figure 5-3, with Sensor 1 as horizontal and Sensor 2
as vertical. The signal was first injected to Sensor 2 and received from Sensor 1, shown in
Figure 5-6(a), and then vice versa which is shown in Figure 5-6(b). Figure 5-6 shows that
(a)
(b)
146 mVpk-pk
143 mVpk-pk
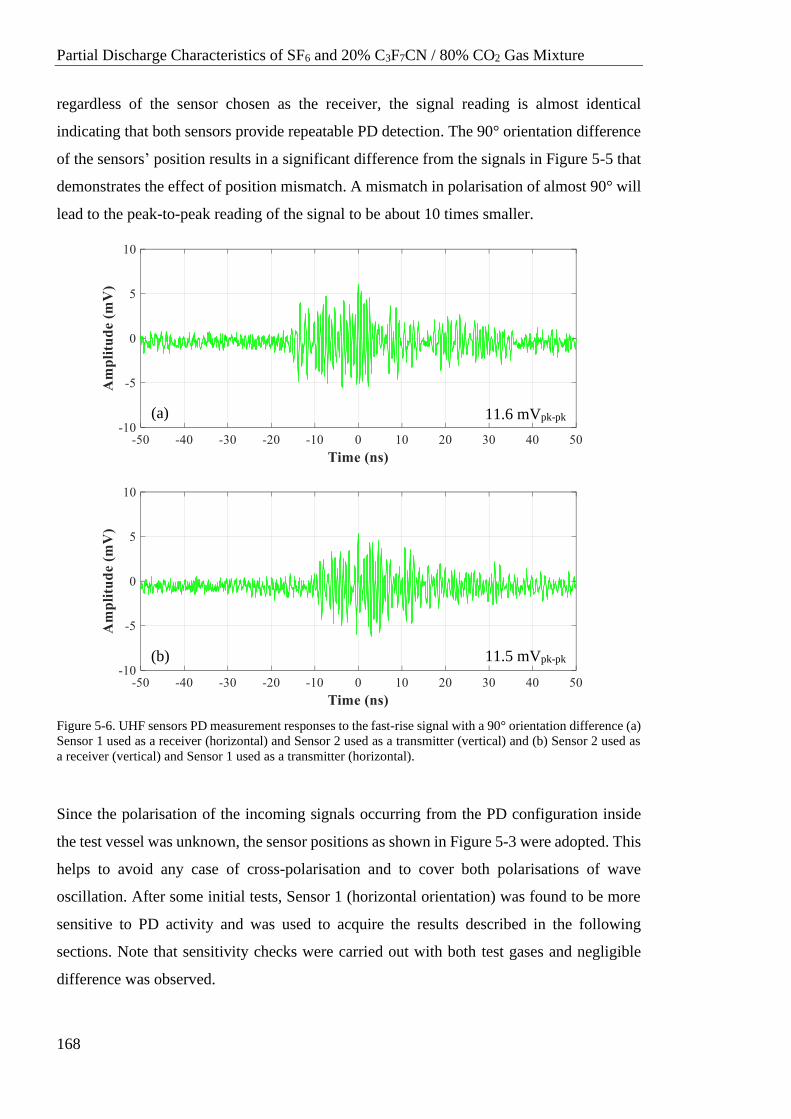
Partial Discharge Characteristics of SF6 and 20% C3F7CN / 80% CO2 Gas Mixture
168
regardless of the sensor chosen as the receiver, the signal reading is almost identical
indicating that both sensors provide repeatable PD detection. The 90° orientation difference
of the sensors’ position results in a significant difference from the signals in Figure 5-5 that
demonstrates the effect of position mismatch. A mismatch in polarisation of almost 90° will
lead to the peak-to-peak reading of the signal to be about 10 times smaller.
Figure 5-6. UHF sensors PD measurement responses to the fast-rise signal with a 90° orientation difference (a)
Sensor 1 used as a receiver (horizontal) and Sensor 2 used as a transmitter (vertical) and (b) Sensor 2 used as
a receiver (vertical) and Sensor 1 used as a transmitter (horizontal).
Since the polarisation of the incoming signals occurring from the PD configuration inside
the test vessel was unknown, the sensor positions as shown in Figure 5-3 were adopted. This
helps to avoid any case of cross-polarisation and to cover both polarisations of wave
oscillation. After some initial tests, Sensor 1 (horizontal orientation) was found to be more
sensitive to PD activity and was used to acquire the results described in the following
sections. Note that sensitivity checks were carried out with both test gases and negligible
difference was observed.
11.5 mVpk-pk (b)
(a) 11.6 mVpk-pk
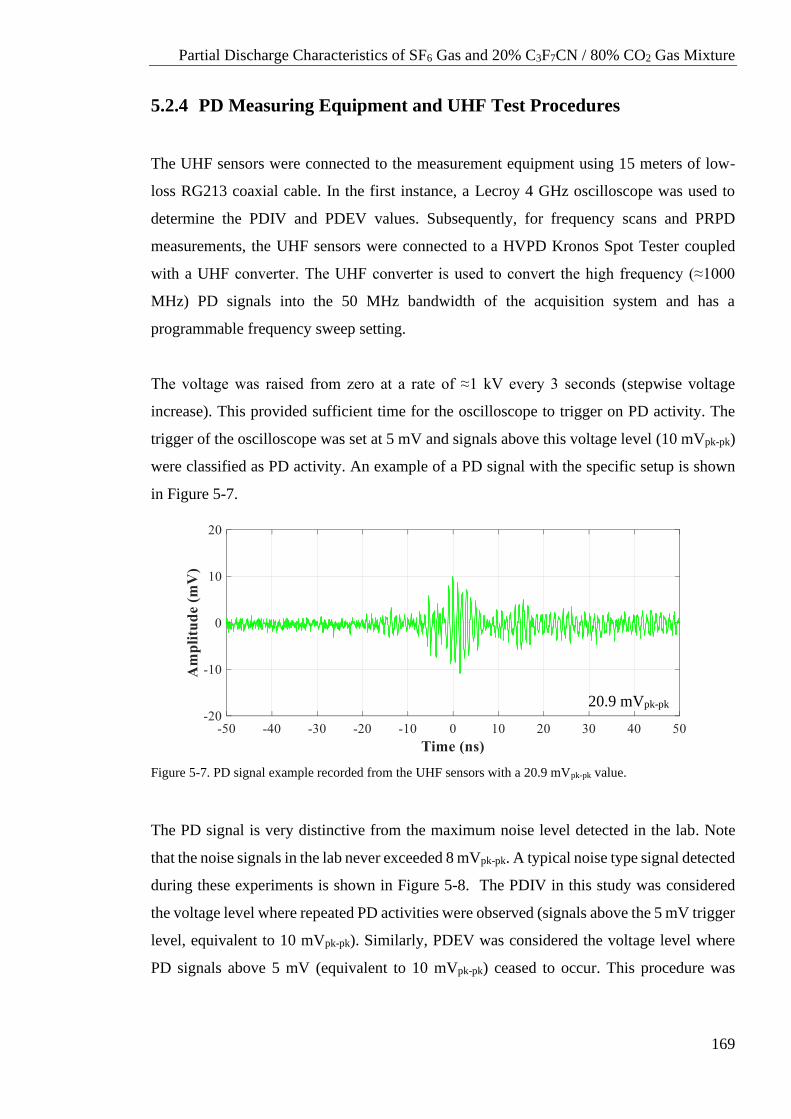
Partial Discharge Characteristics of SF6 Gas and 20% C3F7CN / 80% CO2 Gas Mixture
169
5.2.4 PD Measuring Equipment and UHF Test Procedures
The UHF sensors were connected to the measurement equipment using 15 meters of low-
loss RG213 coaxial cable. In the first instance, a Lecroy 4 GHz oscilloscope was used to
determine the PDIV and PDEV values. Subsequently, for frequency scans and PRPD
measurements, the UHF sensors were connected to a HVPD Kronos Spot Tester coupled
with a UHF converter. The UHF converter is used to convert the high frequency (≈1000
MHz) PD signals into the 50 MHz bandwidth of the acquisition system and has a
programmable frequency sweep setting.
The voltage was raised from zero at a rate of ≈1 kV every 3 seconds (stepwise voltage
increase). This provided sufficient time for the oscilloscope to trigger on PD activity. The
trigger of the oscilloscope was set at 5 mV and signals above this voltage level (10 mVpk-pk)
were classified as PD activity. An example of a PD signal with the specific setup is shown
in Figure 5-7.
Figure 5-7. PD signal example recorded from the UHF sensors with a 20.9 mVpk-pk value.
The PD signal is very distinctive from the maximum noise level detected in the lab. Note
that the noise signals in the lab never exceeded 8 mVpk-pk. A typical noise type signal detected
during these experiments is shown in Figure 5-8. The PDIV in this study was considered
the voltage level where repeated PD activities were observed (signals above the 5 mV trigger
level, equivalent to 10 mVpk-pk). Similarly, PDEV was considered the voltage level where
PD signals above 5 mV (equivalent to 10 mVpk-pk) ceased to occur. This procedure was
20.9 mVpk-pk
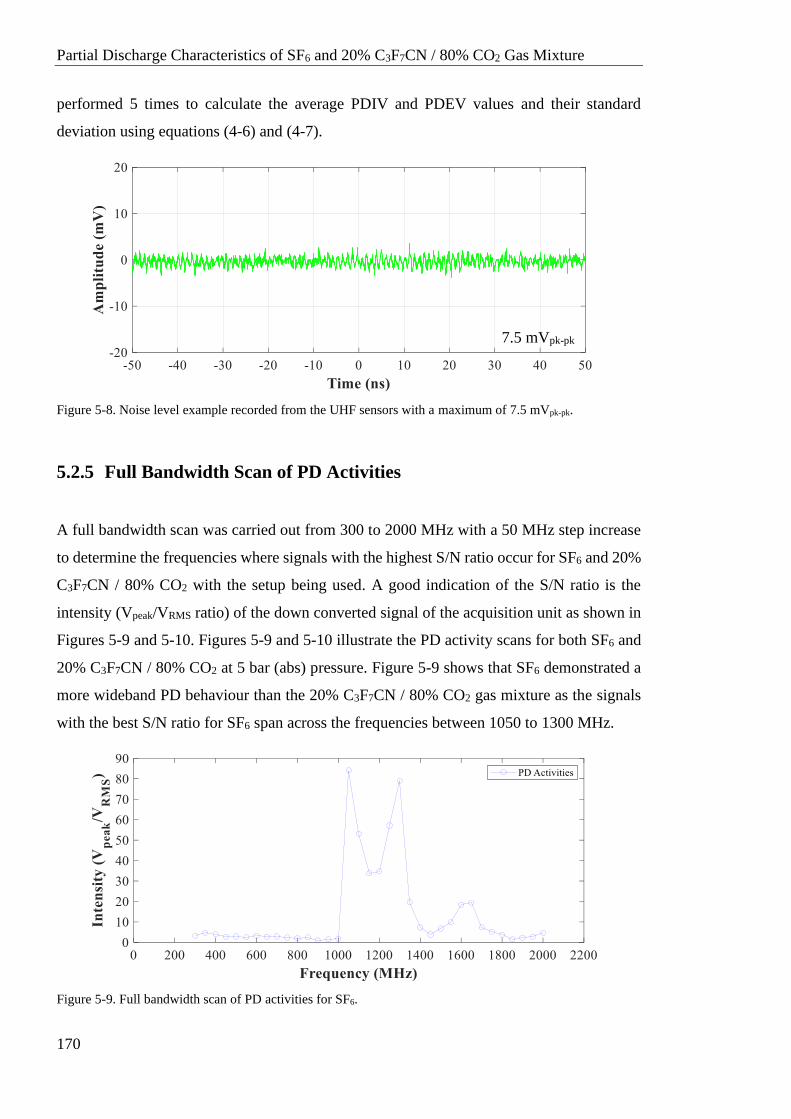
Partial Discharge Characteristics of SF6 and 20% C3F7CN / 80% CO2 Gas Mixture
170
performed 5 times to calculate the average PDIV and PDEV values and their standard
deviation using equations (4-6) and (4-7).
Figure 5-8. Noise level example recorded from the UHF sensors with a maximum of 7.5 mVpk-pk.
5.2.5 Full Bandwidth Scan of PD Activities
A full bandwidth scan was carried out from 300 to 2000 MHz with a 50 MHz step increase
to determine the frequencies where signals with the highest S/N ratio occur for SF6 and 20%
C3F7CN / 80% CO2 with the setup being used. A good indication of the S/N ratio is the
intensity (Vpeak/VRMS ratio) of the down converted signal of the acquisition unit as shown in
Figures 5-9 and 5-10. Figures 5-9 and 5-10 illustrate the PD activity scans for both SF6 and
20% C3F7CN / 80% CO2 at 5 bar (abs) pressure. Figure 5-9 shows that SF6 demonstrated a
more wideband PD behaviour than the 20% C3F7CN / 80% CO2 gas mixture as the signals
with the best S/N ratio for SF6 span across the frequencies between 1050 to 1300 MHz.
Figure 5-9. Full bandwidth scan of PD activities for SF6.
7.5 mVpk-pk
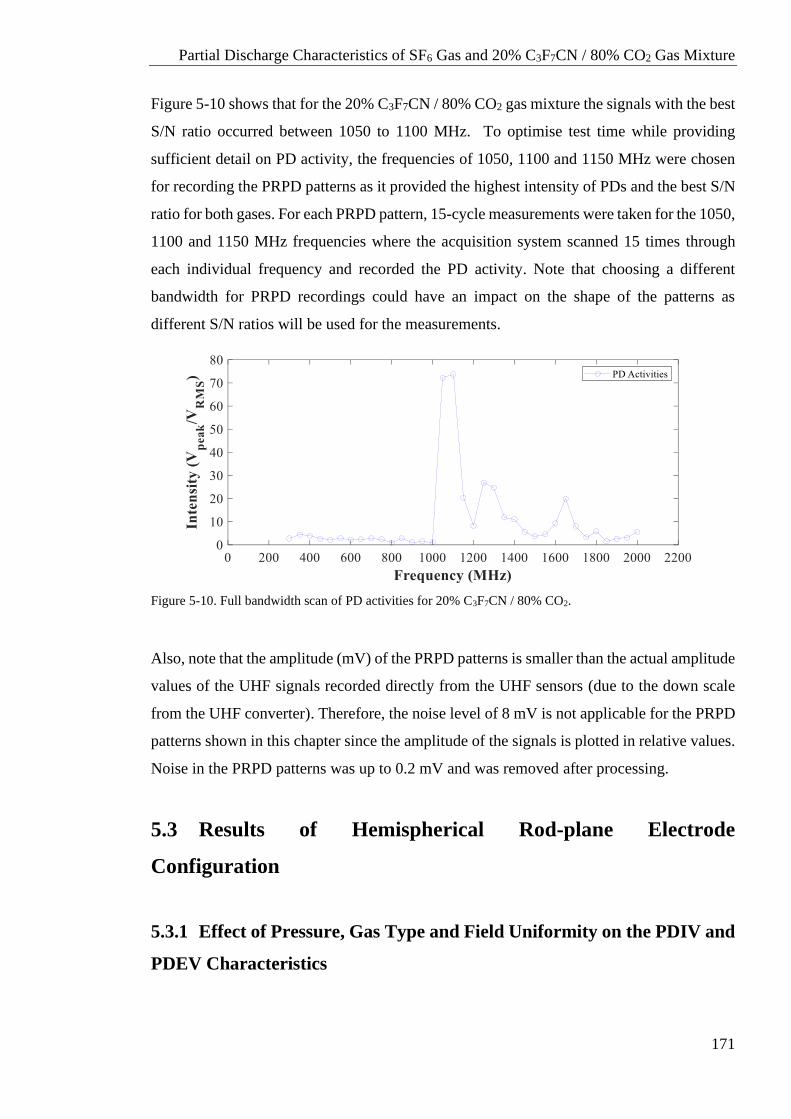
Partial Discharge Characteristics of SF6 Gas and 20% C3F7CN / 80% CO2 Gas Mixture
171
Figure 5-10 shows that for the 20% C3F7CN / 80% CO2 gas mixture the signals with the best
S/N ratio occurred between 1050 to 1100 MHz. To optimise test time while providing
sufficient detail on PD activity, the frequencies of 1050, 1100 and 1150 MHz were chosen
for recording the PRPD patterns as it provided the highest intensity of PDs and the best S/N
ratio for both gases. For each PRPD pattern, 15-cycle measurements were taken for the 1050,
1100 and 1150 MHz frequencies where the acquisition system scanned 15 times through
each individual frequency and recorded the PD activity. Note that choosing a different
bandwidth for PRPD recordings could have an impact on the shape of the patterns as
different S/N ratios will be used for the measurements.
Figure 5-10. Full bandwidth scan of PD activities for 20% C3F7CN / 80% CO2.
Also, note that the amplitude (mV) of the PRPD patterns is smaller than the actual amplitude
values of the UHF signals recorded directly from the UHF sensors (due to the down scale
from the UHF converter). Therefore, the noise level of 8 mV is not applicable for the PRPD
patterns shown in this chapter since the amplitude of the signals is plotted in relative values.
Noise in the PRPD patterns was up to 0.2 mV and was removed after processing.
5.3 Results of Hemispherical Rod-plane Electrode
Configuration
5.3.1 Effect of Pressure, Gas Type and Field Uniformity on the PDIV and
PDEV Characteristics
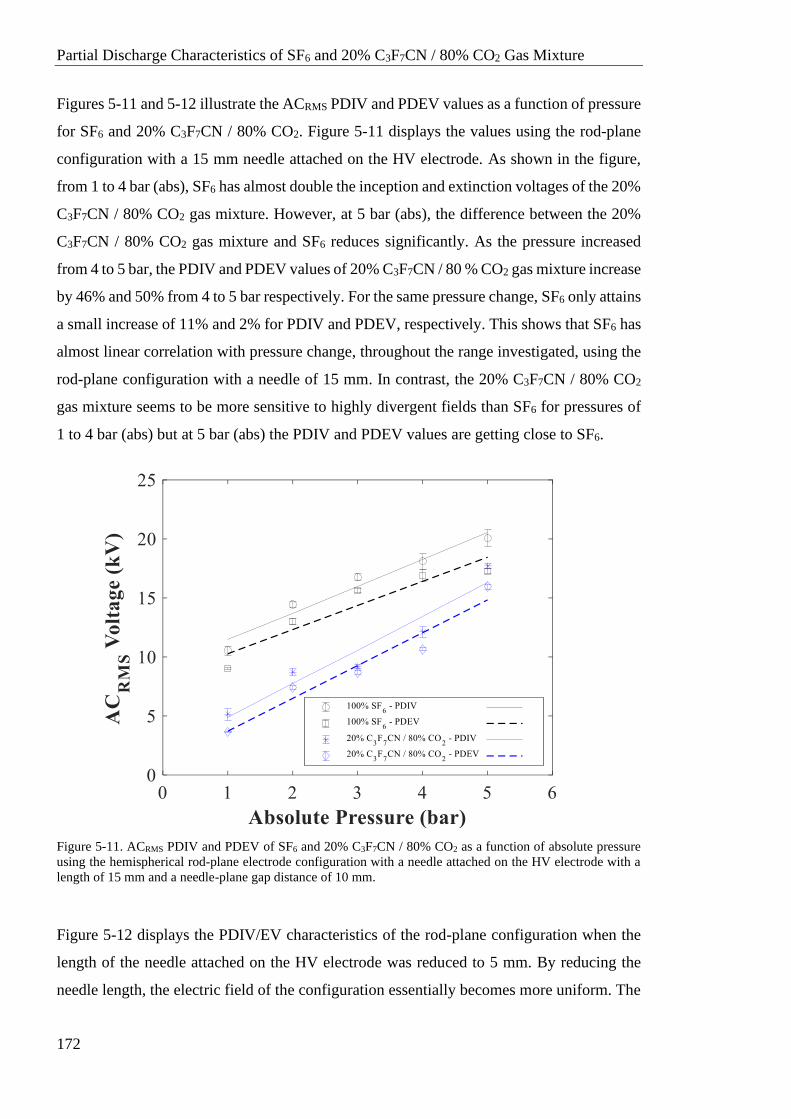
Partial Discharge Characteristics of SF6 and 20% C3F7CN / 80% CO2 Gas Mixture
172
Figures 5-11 and 5-12 illustrate the ACRMS PDIV and PDEV values as a function of pressure
for SF6 and 20% C3F7CN / 80% CO2. Figure 5-11 displays the values using the rod-plane
configuration with a 15 mm needle attached on the HV electrode. As shown in the figure,
from 1 to 4 bar (abs), SF6 has almost double the inception and extinction voltages of the 20%
C3F7CN / 80% CO2 gas mixture. However, at 5 bar (abs), the difference between the 20%
C3F7CN / 80% CO2 gas mixture and SF6 reduces significantly. As the pressure increased
from 4 to 5 bar, the PDIV and PDEV values of 20% C3F7CN / 80 % CO2 gas mixture increase
by 46% and 50% from 4 to 5 bar respectively. For the same pressure change, SF6 only attains
a small increase of 11% and 2% for PDIV and PDEV, respectively. This shows that SF6 has
almost linear correlation with pressure change, throughout the range investigated, using the
rod-plane configuration with a needle of 15 mm. In contrast, the 20% C3F7CN / 80% CO2
gas mixture seems to be more sensitive to highly divergent fields than SF6 for pressures of
1 to 4 bar (abs) but at 5 bar (abs) the PDIV and PDEV values are getting close to SF6.
Figure 5-11. ACRMS PDIV and PDEV of SF6 and 20% C3F7CN / 80% CO2 as a function of absolute pressure
using the hemispherical rod-plane electrode configuration with a needle attached on the HV electrode with a
length of 15 mm and a needle-plane gap distance of 10 mm.
Figure 5-12 displays the PDIV/EV characteristics of the rod-plane configuration when the
length of the needle attached on the HV electrode was reduced to 5 mm. By reducing the
needle length, the electric field of the configuration essentially becomes more uniform. The
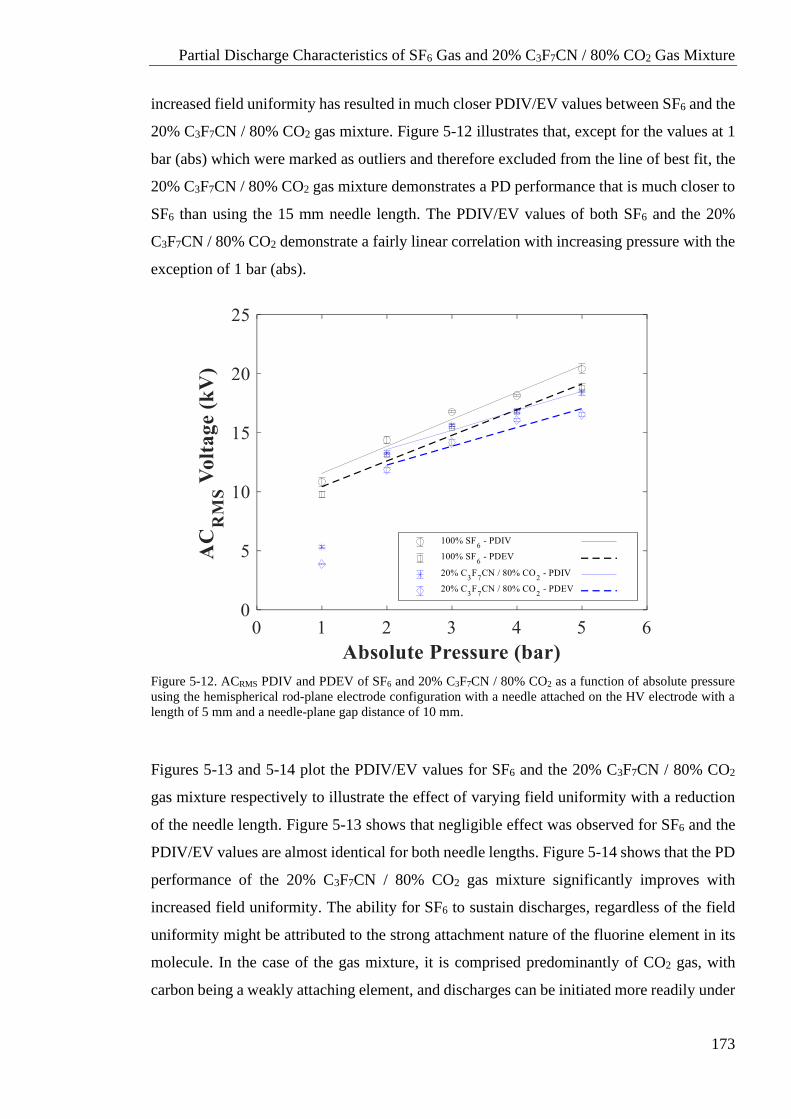
Partial Discharge Characteristics of SF6 Gas and 20% C3F7CN / 80% CO2 Gas Mixture
173
increased field uniformity has resulted in much closer PDIV/EV values between SF6 and the
20% C3F7CN / 80% CO2 gas mixture. Figure 5-12 illustrates that, except for the values at 1
bar (abs) which were marked as outliers and therefore excluded from the line of best fit, the
20% C3F7CN / 80% CO2 gas mixture demonstrates a PD performance that is much closer to
SF6 than using the 15 mm needle length. The PDIV/EV values of both SF6 and the 20%
C3F7CN / 80% CO2 demonstrate a fairly linear correlation with increasing pressure with the
exception of 1 bar (abs).
Figure 5-12. ACRMS PDIV and PDEV of SF6 and 20% C3F7CN / 80% CO2 as a function of absolute pressure
using the hemispherical rod-plane electrode configuration with a needle attached on the HV electrode with a
length of 5 mm and a needle-plane gap distance of 10 mm.
Figures 5-13 and 5-14 plot the PDIV/EV values for SF6 and the 20% C3F7CN / 80% CO2
gas mixture respectively to illustrate the effect of varying field uniformity with a reduction
of the needle length. Figure 5-13 shows that negligible effect was observed for SF6 and the
PDIV/EV values are almost identical for both needle lengths. Figure 5-14 shows that the PD
performance of the 20% C3F7CN / 80% CO2 gas mixture significantly improves with
increased field uniformity. The ability for SF6 to sustain discharges, regardless of the field
uniformity might be attributed to the strong attachment nature of the fluorine element in its
molecule. In the case of the gas mixture, it is comprised predominantly of CO2 gas, with
carbon being a weakly attaching element, and discharges can be initiated more readily under
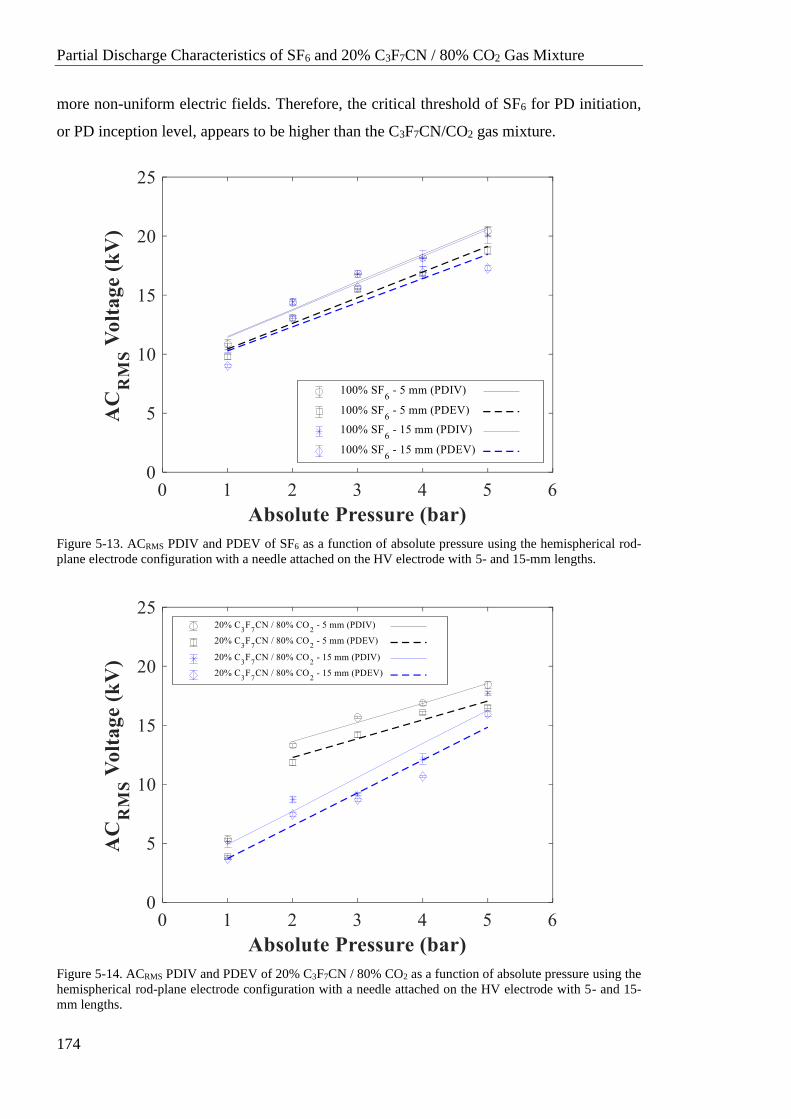
Partial Discharge Characteristics of SF6 and 20% C3F7CN / 80% CO2 Gas Mixture
174
more non-uniform electric fields. Therefore, the critical threshold of SF6 for PD initiation,
or PD inception level, appears to be higher than the C3F7CN/CO2 gas mixture.
Figure 5-13. ACRMS PDIV and PDEV of SF6 as a function of absolute pressure using the hemispherical rod-
plane electrode configuration with a needle attached on the HV electrode with 5- and 15-mm lengths.
Figure 5-14. ACRMS PDIV and PDEV of 20% C3F7CN / 80% CO2 as a function of absolute pressure using the
hemispherical rod-plane electrode configuration with a needle attached on the HV electrode with 5- and 15-
mm lengths.
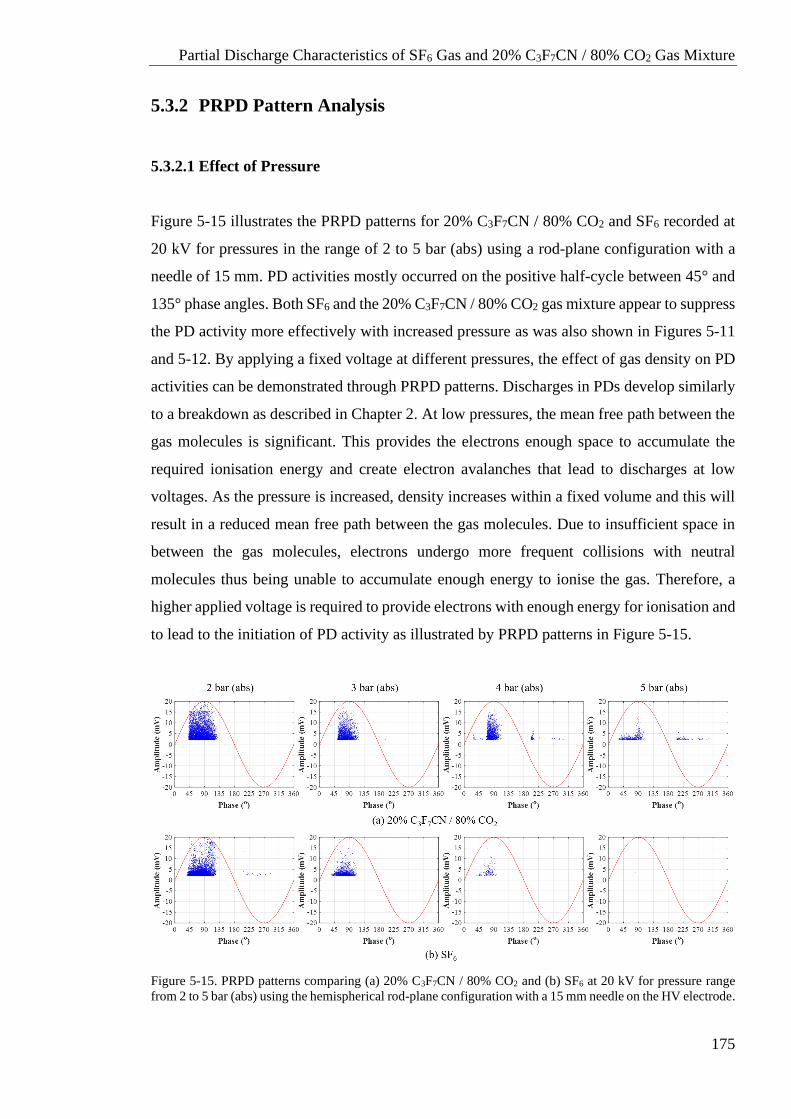
Partial Discharge Characteristics of SF6 Gas and 20% C3F7CN / 80% CO2 Gas Mixture
175
5.3.2 PRPD Pattern Analysis
5.3.2.1 Effect of Pressure
Figure 5-15 illustrates the PRPD patterns for 20% C3F7CN / 80% CO2 and SF6 recorded at
20 kV for pressures in the range of 2 to 5 bar (abs) using a rod-plane configuration with a
needle of 15 mm. PD activities mostly occurred on the positive half-cycle between 45° and
135° phase angles. Both SF6 and the 20% C3F7CN / 80% CO2 gas mixture appear to suppress
the PD activity more effectively with increased pressure as was also shown in Figures 5-11
and 5-12. By applying a fixed voltage at different pressures, the effect of gas density on PD
activities can be demonstrated through PRPD patterns. Discharges in PDs develop similarly
to a breakdown as described in Chapter 2. At low pressures, the mean free path between the
gas molecules is significant. This provides the electrons enough space to accumulate the
required ionisation energy and create electron avalanches that lead to discharges at low
voltages. As the pressure is increased, density increases within a fixed volume and this will
result in a reduced mean free path between the gas molecules. Due to insufficient space in
between the gas molecules, electrons undergo more frequent collisions with neutral
molecules thus being unable to accumulate enough energy to ionise the gas. Therefore, a
higher applied voltage is required to provide electrons with enough energy for ionisation and
to lead to the initiation of PD activity as illustrated by PRPD patterns in Figure 5-15.
Figure 5-15. PRPD patterns comparing (a) 20% C3F7CN / 80% CO2 and (b) SF6 at 20 kV for pressure range
from 2 to 5 bar (abs) using the hemispherical rod-plane configuration with a 15 mm needle on the HV electrode.
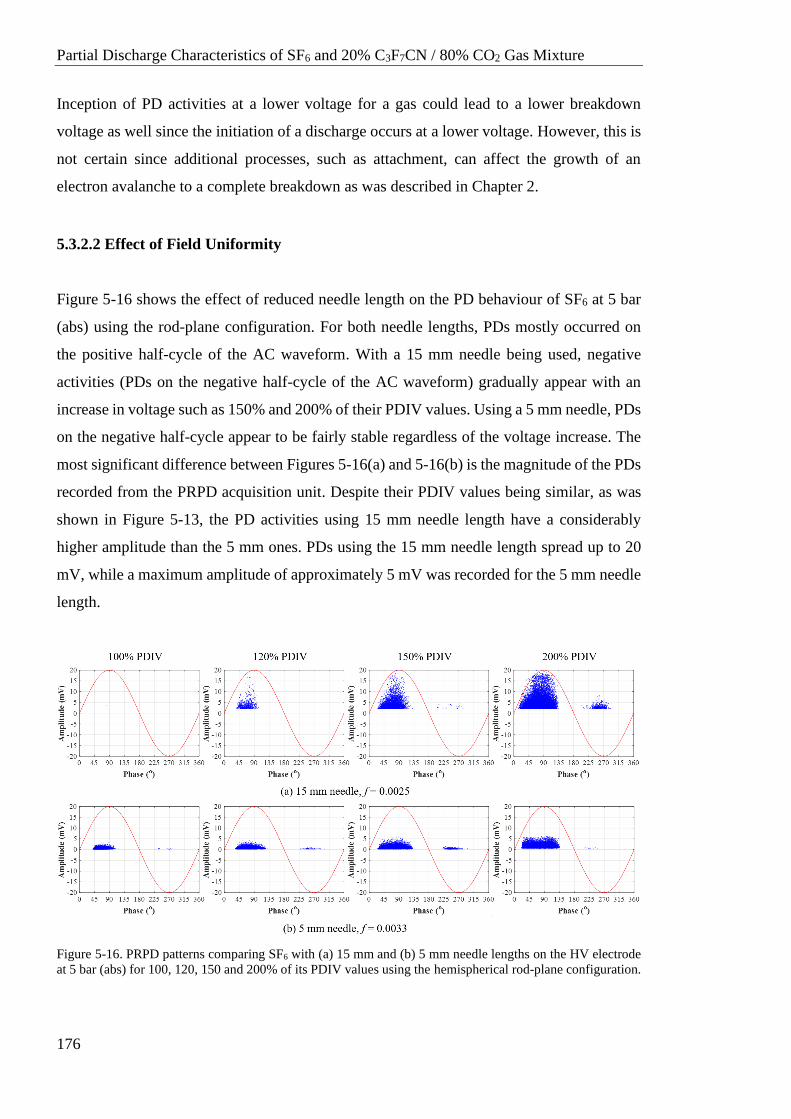
Partial Discharge Characteristics of SF6 and 20% C3F7CN / 80% CO2 Gas Mixture
176
Inception of PD activities at a lower voltage for a gas could lead to a lower breakdown
voltage as well since the initiation of a discharge occurs at a lower voltage. However, this is
not certain since additional processes, such as attachment, can affect the growth of an
electron avalanche to a complete breakdown as was described in Chapter 2.
5.3.2.2 Effect of Field Uniformity
Figure 5-16 shows the effect of reduced needle length on the PD behaviour of SF6 at 5 bar
(abs) using the rod-plane configuration. For both needle lengths, PDs mostly occurred on
the positive half-cycle of the AC waveform. With a 15 mm needle being used, negative
activities (PDs on the negative half-cycle of the AC waveform) gradually appear with an
increase in voltage such as 150% and 200% of their PDIV values. Using a 5 mm needle, PDs
on the negative half-cycle appear to be fairly stable regardless of the voltage increase. The
most significant difference between Figures 5-16(a) and 5-16(b) is the magnitude of the PDs
recorded from the PRPD acquisition unit. Despite their PDIV values being similar, as was
shown in Figure 5-13, the PD activities using 15 mm needle length have a considerably
higher amplitude than the 5 mm ones. PDs using the 15 mm needle length spread up to 20
mV, while a maximum amplitude of approximately 5 mV was recorded for the 5 mm needle
length.
Figure 5-16. PRPD patterns comparing SF6 with (a) 15 mm and (b) 5 mm needle lengths on the HV electrode
at 5 bar (abs) for 100, 120, 150 and 200% of its PDIV values using the hemispherical rod-plane configuration.
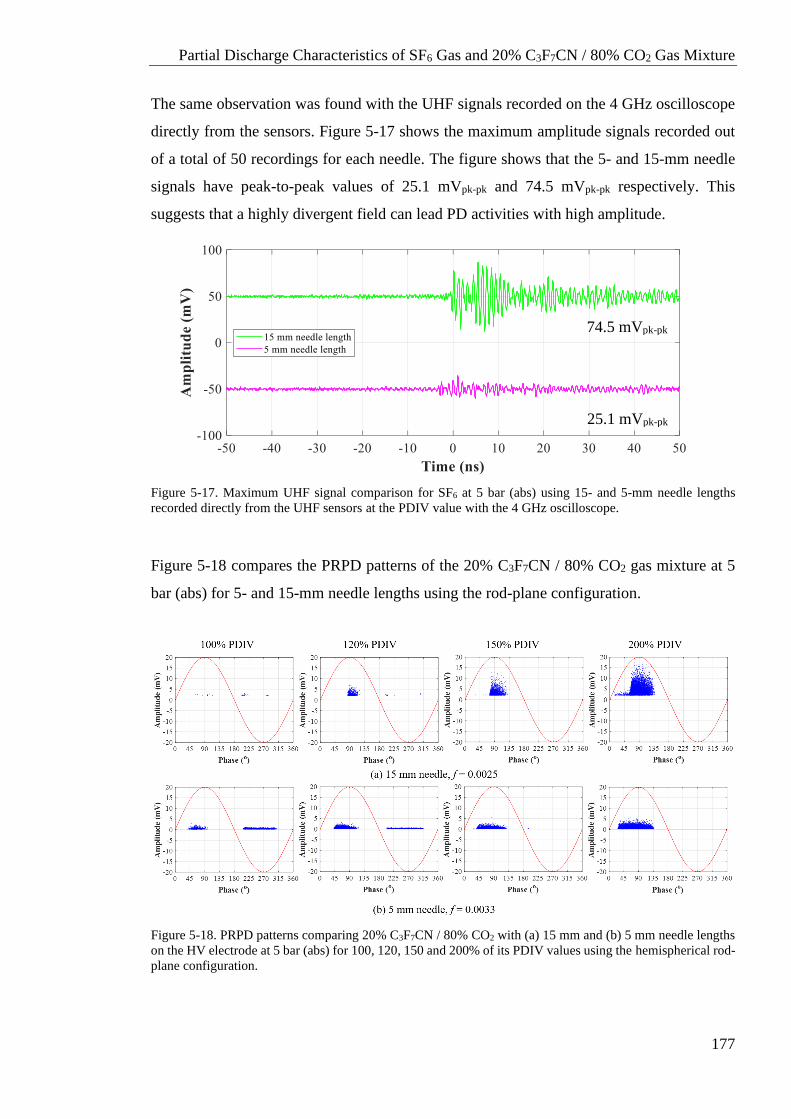
Partial Discharge Characteristics of SF6 Gas and 20% C3F7CN / 80% CO2 Gas Mixture
177
The same observation was found with the UHF signals recorded on the 4 GHz oscilloscope
directly from the sensors. Figure 5-17 shows the maximum amplitude signals recorded out
of a total of 50 recordings for each needle. The figure shows that the 5- and 15-mm needle
signals have peak-to-peak values of 25.1 mVpk-pk and 74.5 mVpk-pk respectively. This
suggests that a highly divergent field can lead PD activities with high amplitude.
Figure 5-17. Maximum UHF signal comparison for SF6 at 5 bar (abs) using 15- and 5-mm needle lengths
recorded directly from the UHF sensors at the PDIV value with the 4 GHz oscilloscope.
Figure 5-18 compares the PRPD patterns of the 20% C3F7CN / 80% CO2 gas mixture at 5
bar (abs) for 5- and 15-mm needle lengths using the rod-plane configuration.
Figure 5-18. PRPD patterns comparing 20% C3F7CN / 80% CO2 with (a) 15 mm and (b) 5 mm needle lengths
on the HV electrode at 5 bar (abs) for 100, 120, 150 and 200% of its PDIV values using the hemispherical rod-
plane configuration.
74.5 mVpk-pk
25.1 mVpk-pk
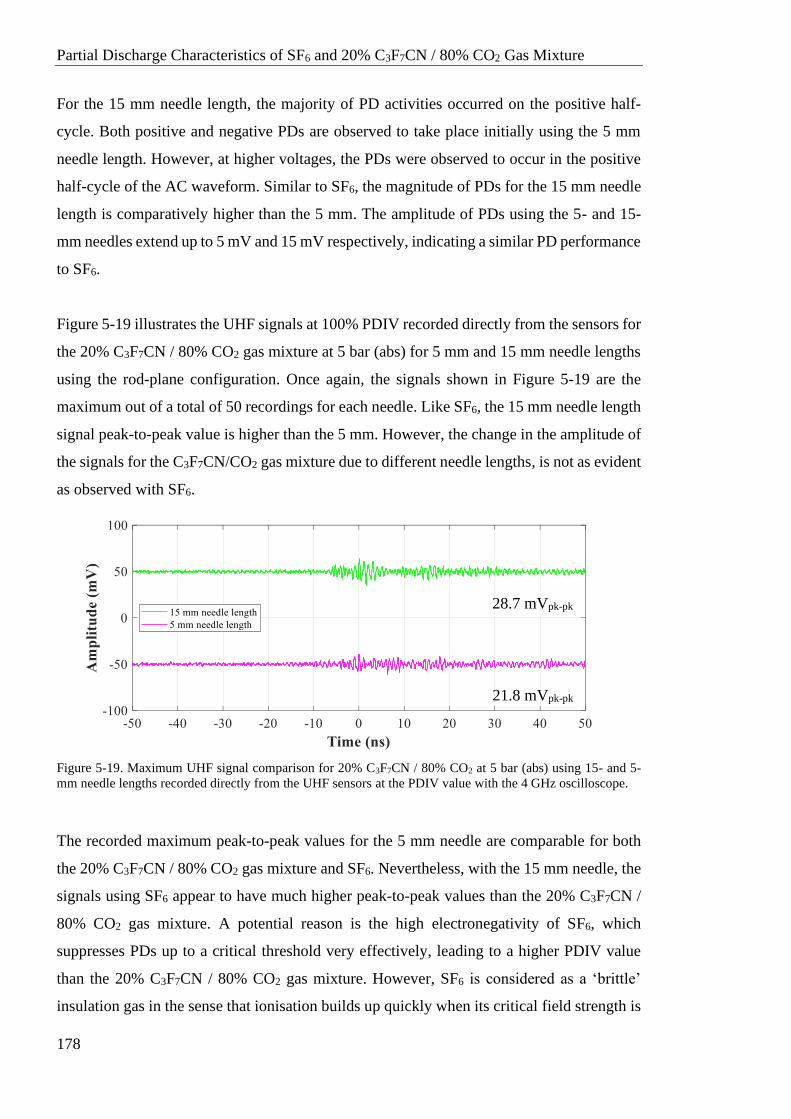
Partial Discharge Characteristics of SF6 and 20% C3F7CN / 80% CO2 Gas Mixture
178
For the 15 mm needle length, the majority of PD activities occurred on the positive half-
cycle. Both positive and negative PDs are observed to take place initially using the 5 mm
needle length. However, at higher voltages, the PDs were observed to occur in the positive
half-cycle of the AC waveform. Similar to SF6, the magnitude of PDs for the 15 mm needle
length is comparatively higher than the 5 mm. The amplitude of PDs using the 5- and 15-
mm needles extend up to 5 mV and 15 mV respectively, indicating a similar PD performance
to SF6.
Figure 5-19 illustrates the UHF signals at 100% PDIV recorded directly from the sensors for
the 20% C3F7CN / 80% CO2 gas mixture at 5 bar (abs) for 5 mm and 15 mm needle lengths
using the rod-plane configuration. Once again, the signals shown in Figure 5-19 are the
maximum out of a total of 50 recordings for each needle. Like SF6, the 15 mm needle length
signal peak-to-peak value is higher than the 5 mm. However, the change in the amplitude of
the signals for the C3F7CN/CO2 gas mixture due to different needle lengths, is not as evident
as observed with SF6.
Figure 5-19. Maximum UHF signal comparison for 20% C3F7CN / 80% CO2 at 5 bar (abs) using 15- and 5-
mm needle lengths recorded directly from the UHF sensors at the PDIV value with the 4 GHz oscilloscope.
The recorded maximum peak-to-peak values for the 5 mm needle are comparable for both
the 20% C3F7CN / 80% CO2 gas mixture and SF6. Nevertheless, with the 15 mm needle, the
signals using SF6 appear to have much higher peak-to-peak values than the 20% C3F7CN /
80% CO2 gas mixture. A potential reason is the high electronegativity of SF6, which
suppresses PDs up to a critical threshold very effectively, leading to a higher PDIV value
than the 20% C3F7CN / 80% CO2 gas mixture. However, SF6 is considered as a ‘brittle’
insulation gas in the sense that ionisation builds up quickly when its critical field strength is
28.7 mVpk-pk
21.8 mVpk-pk
Partial Discharge Characteristics of SF6 Gas and 20% C3F7CN / 80% CO2 Gas Mixture
179
exceeded. As the PDIV threshold is exceeded, ionisation activity of SF6 could rapidly
increase in the presence of a sharp protrusion such as the needle being used in this
configuration [28]. Therefore, this can be considered as an important factor influencing the
PD activity quantity as well as the amplitude for SF6 and the 20% C3F7CN / 80% CO2 gas
mixture.
5.3.2.3 Effect of Gas Medium
Figure 5-20 compares SF6 and the 20% C3F7CN / 80% CO2 gas mixture using their PRPD
patterns to illustrate the effect of different gas mediums on their PD behaviour. Both gases
were plotted at 200% of their PDIV values for the pressure range of 1 to 5 bar (abs) using
the rod-plane configuration with a needle length of 5 mm. This is to clearly show the PD
characteristics of both gases at a voltage value where sufficient number of PDs can occur.
Figure 5-20(a) shows that the PD activities for the 20% C3F7CN / 80% CO2 gas mixture
initially occur at the negative half-cycle of the AC waveform. As PDIV increases with
pressure, the PD activities start to appear on the positive half-cycle. The 20% C3F7CN / 80%
CO2 gas mixture has been observed to go through a 3-stage transitional PRPD behaviour: (i)
PDs appear on the negative cycle at relatively low pressures (ii) consistent PDs on both the
positive and negative cycles at higher pressures and (iii) majority of PDs shift onto the
positive half-cycle at very high pressures where it starts to behave like SF6. Figure 5-20(b)
illustrates that the PD activities for SF6 mostly occurred on the positive half-cycle with some
small activities on the negative half-cycle. As seen from the PRPD patterns, SF6 does not go
through a similar transitional phase to the 20% C3F7CN / 80% CO2 gas mixture. The SF6
results agree with findings reported in [70] where the majority of PDs are on the positive
half-cycle.
To further examine the effect of gas medium on the PD behaviour, pure CO2 and C3F7CN
gases were tested using the rod-plane configuration with a 5 mm needle. This is to identify
whether one of the two gases is the main contributing factor for the distinct PD behaviour of
the 20% C3F7CN / 80% CO2 gas mixture relative to SF6. Figure 5-21 shows the PDs of CO2
for 200% of its PDIV values at different pressures. As shown in the figure, PD activities in
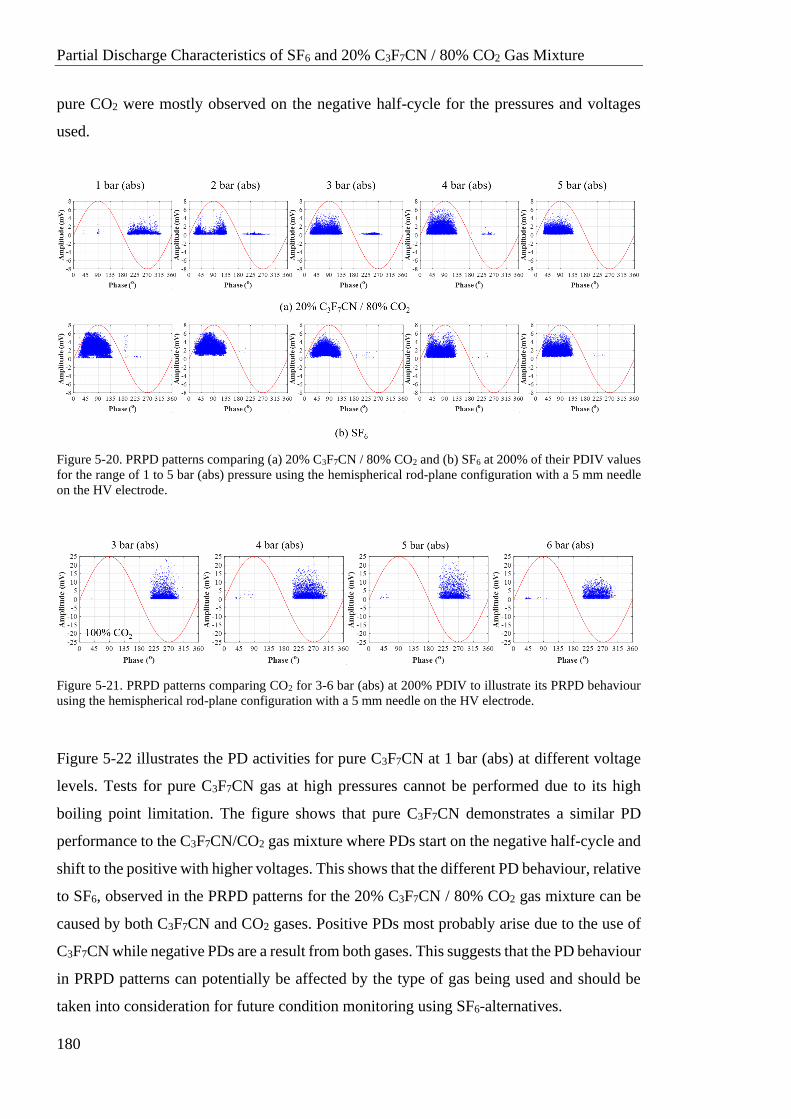
Partial Discharge Characteristics of SF6 and 20% C3F7CN / 80% CO2 Gas Mixture
180
pure CO2 were mostly observed on the negative half-cycle for the pressures and voltages
used.
Figure 5-20. PRPD patterns comparing (a) 20% C3F7CN / 80% CO2 and (b) SF6 at 200% of their PDIV values
for the range of 1 to 5 bar (abs) pressure using the hemispherical rod-plane configuration with a 5 mm needle
on the HV electrode.
Figure 5-21. PRPD patterns comparing CO2 for 3-6 bar (abs) at 200% PDIV to illustrate its PRPD behaviour
using the hemispherical rod-plane configuration with a 5 mm needle on the HV electrode.
Figure 5-22 illustrates the PD activities for pure C3F7CN at 1 bar (abs) at different voltage
levels. Tests for pure C3F7CN gas at high pressures cannot be performed due to its high
boiling point limitation. The figure shows that pure C3F7CN demonstrates a similar PD
performance to the C3F7CN/CO2 gas mixture where PDs start on the negative half-cycle and
shift to the positive with higher voltages. This shows that the different PD behaviour, relative
to SF6, observed in the PRPD patterns for the 20% C3F7CN / 80% CO2 gas mixture can be
caused by both C3F7CN and CO2 gases. Positive PDs most probably arise due to the use of
C3F7CN while negative PDs are a result from both gases. This suggests that the PD behaviour
in PRPD patterns can potentially be affected by the type of gas being used and should be
taken into consideration for future condition monitoring using SF6-alternatives.
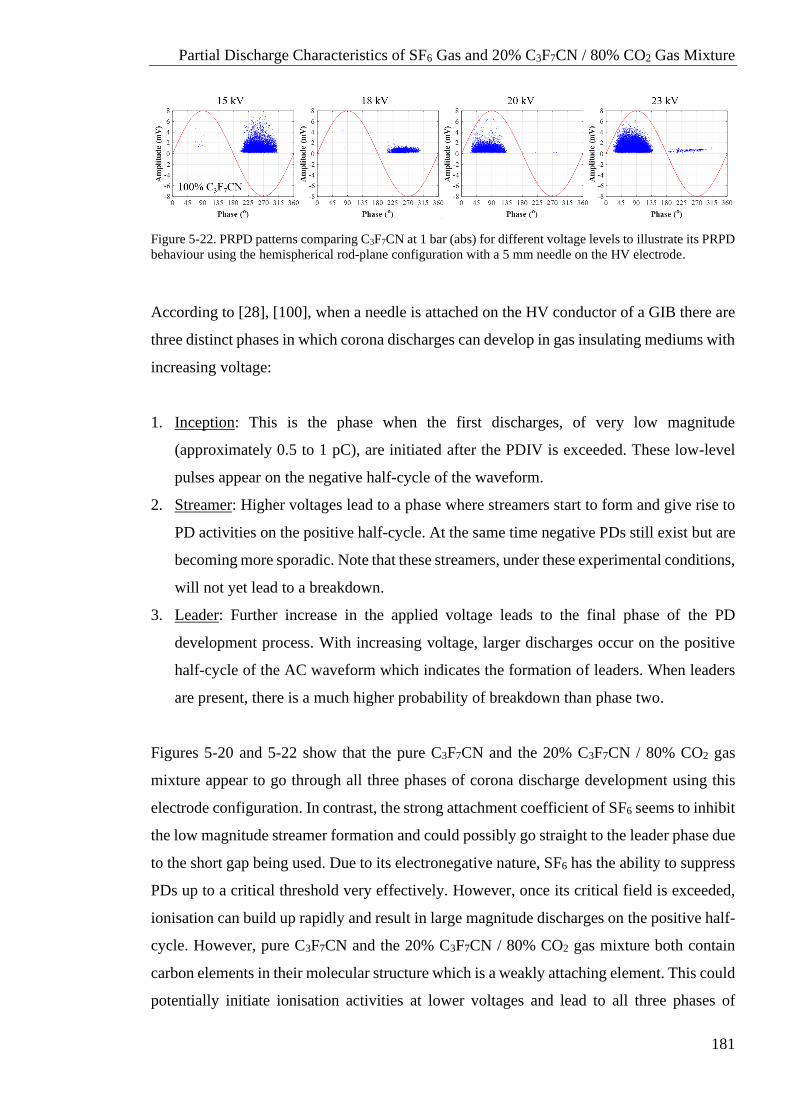
Partial Discharge Characteristics of SF6 Gas and 20% C3F7CN / 80% CO2 Gas Mixture
181
Figure 5-22. PRPD patterns comparing C3F7CN at 1 bar (abs) for different voltage levels to illustrate its PRPD
behaviour using the hemispherical rod-plane configuration with a 5 mm needle on the HV electrode.
According to [28], [100], when a needle is attached on the HV conductor of a GIB there are
three distinct phases in which corona discharges can develop in gas insulating mediums with
increasing voltage:
1. Inception: This is the phase when the first discharges, of very low magnitude
(approximately 0.5 to 1 pC), are initiated after the PDIV is exceeded. These low-level
pulses appear on the negative half-cycle of the waveform.
2. Streamer: Higher voltages lead to a phase where streamers start to form and give rise to
PD activities on the positive half-cycle. At the same time negative PDs still exist but are
becoming more sporadic. Note that these streamers, under these experimental conditions,
will not yet lead to a breakdown.
3. Leader: Further increase in the applied voltage leads to the final phase of the PD
development process. With increasing voltage, larger discharges occur on the positive
half-cycle of the AC waveform which indicates the formation of leaders. When leaders
are present, there is a much higher probability of breakdown than phase two.
Figures 5-20 and 5-22 show that the pure C3F7CN and the 20% C3F7CN / 80% CO2 gas
mixture appear to go through all three phases of corona discharge development using this
electrode configuration. In contrast, the strong attachment coefficient of SF6 seems to inhibit
the low magnitude streamer formation and could possibly go straight to the leader phase due
to the short gap being used. Due to its electronegative nature, SF6 has the ability to suppress
PDs up to a critical threshold very effectively. However, once its critical field is exceeded,
ionisation can build up rapidly and result in large magnitude discharges on the positive half-
cycle. However, pure C3F7CN and the 20% C3F7CN / 80% CO2 gas mixture both contain
carbon elements in their molecular structure which is a weakly attaching element. This could
potentially initiate ionisation activities at lower voltages and lead to all three phases of
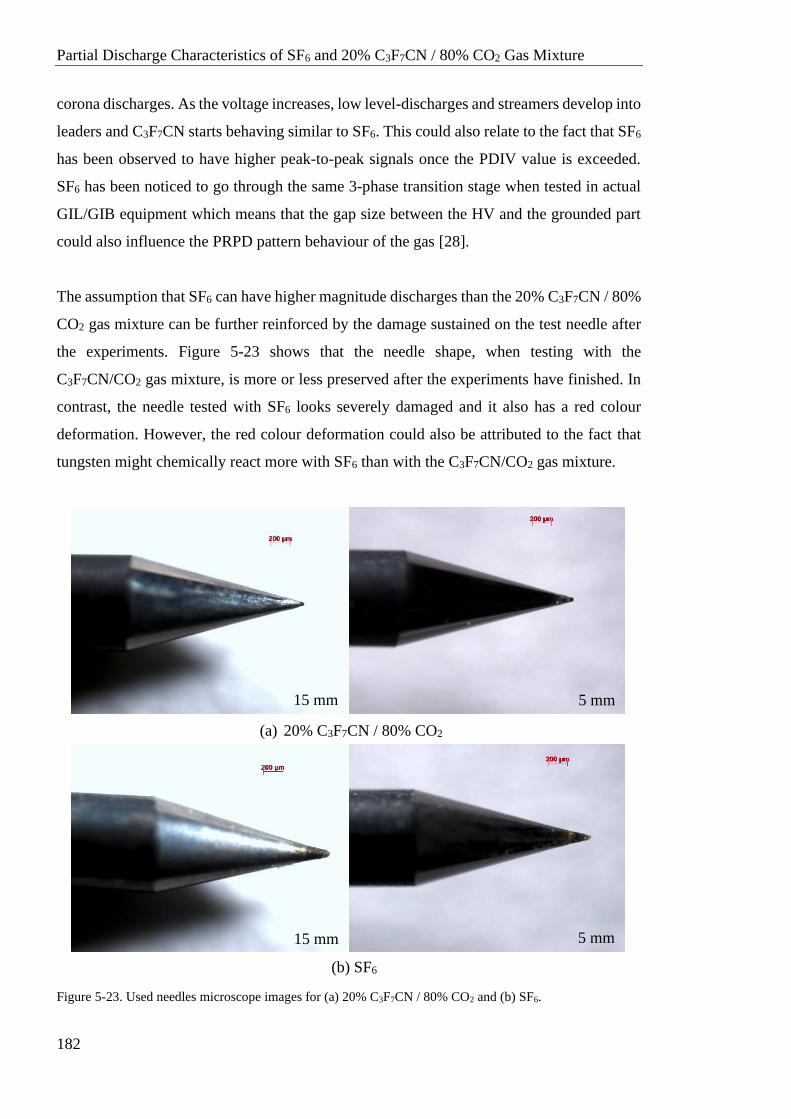
Partial Discharge Characteristics of SF6 and 20% C3F7CN / 80% CO2 Gas Mixture
182
corona discharges. As the voltage increases, low level-discharges and streamers develop into
leaders and C3F7CN starts behaving similar to SF6. This could also relate to the fact that SF6
has been observed to have higher peak-to-peak signals once the PDIV value is exceeded.
SF6 has been noticed to go through the same 3-phase transition stage when tested in actual
GIL/GIB equipment which means that the gap size between the HV and the grounded part
could also influence the PRPD pattern behaviour of the gas [28].
The assumption that SF6 can have higher magnitude discharges than the 20% C3F7CN / 80%
CO2 gas mixture can be further reinforced by the damage sustained on the test needle after
the experiments. Figure 5-23 shows that the needle shape, when testing with the
C3F7CN/CO2 gas mixture, is more or less preserved after the experiments have finished. In
contrast, the needle tested with SF6 looks severely damaged and it also has a red colour
deformation. However, the red colour deformation could also be attributed to the fact that
tungsten might chemically react more with SF6 than with the C3F7CN/CO2 gas mixture.
Figure 5-23. Used needles microscope images for (a) 20% C3F7CN / 80% CO2 and (b) SF6.
15 mm 5 mm
15 mm 5 mm
(a) 20% C3F7CN / 80% CO2
(b) SF6
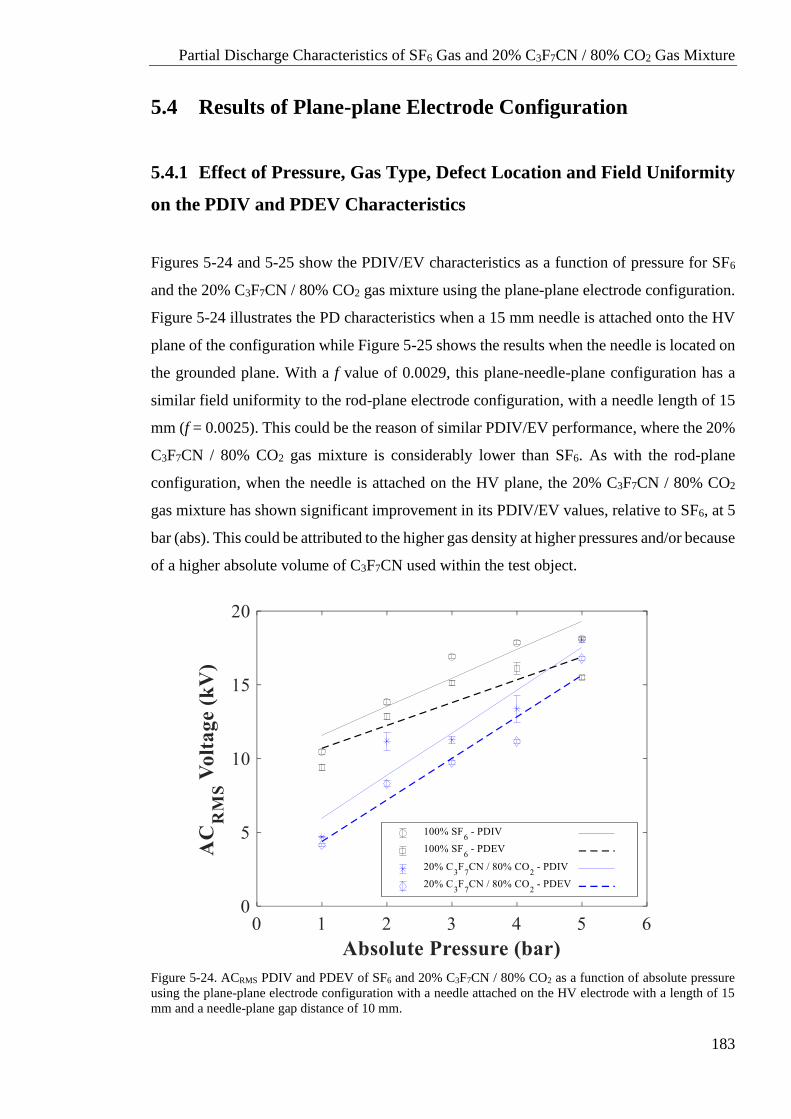
Partial Discharge Characteristics of SF6 Gas and 20% C3F7CN / 80% CO2 Gas Mixture
183
5.4 Results of Plane-plane Electrode Configuration
5.4.1 Effect of Pressure, Gas Type, Defect Location and Field Uniformity
on the PDIV and PDEV Characteristics
Figures 5-24 and 5-25 show the PDIV/EV characteristics as a function of pressure for SF6
and the 20% C3F7CN / 80% CO2 gas mixture using the plane-plane electrode configuration.
Figure 5-24 illustrates the PD characteristics when a 15 mm needle is attached onto the HV
plane of the configuration while Figure 5-25 shows the results when the needle is located on
the grounded plane. With a f value of 0.0029, this plane-needle-plane configuration has a
similar field uniformity to the rod-plane electrode configuration, with a needle length of 15
mm (f = 0.0025). This could be the reason of similar PDIV/EV performance, where the 20%
C3F7CN / 80% CO2 gas mixture is considerably lower than SF6. As with the rod-plane
configuration, when the needle is attached on the HV plane, the 20% C3F7CN / 80% CO2
gas mixture has shown significant improvement in its PDIV/EV values, relative to SF6, at 5
bar (abs). This could be attributed to the higher gas density at higher pressures and/or because
of a higher absolute volume of C3F7CN used within the test object.
Figure 5-24. ACRMS PDIV and PDEV of SF6 and 20% C3F7CN / 80% CO2 as a function of absolute pressure
using the plane-plane electrode configuration with a needle attached on the HV electrode with a length of 15
mm and a needle-plane gap distance of 10 mm.
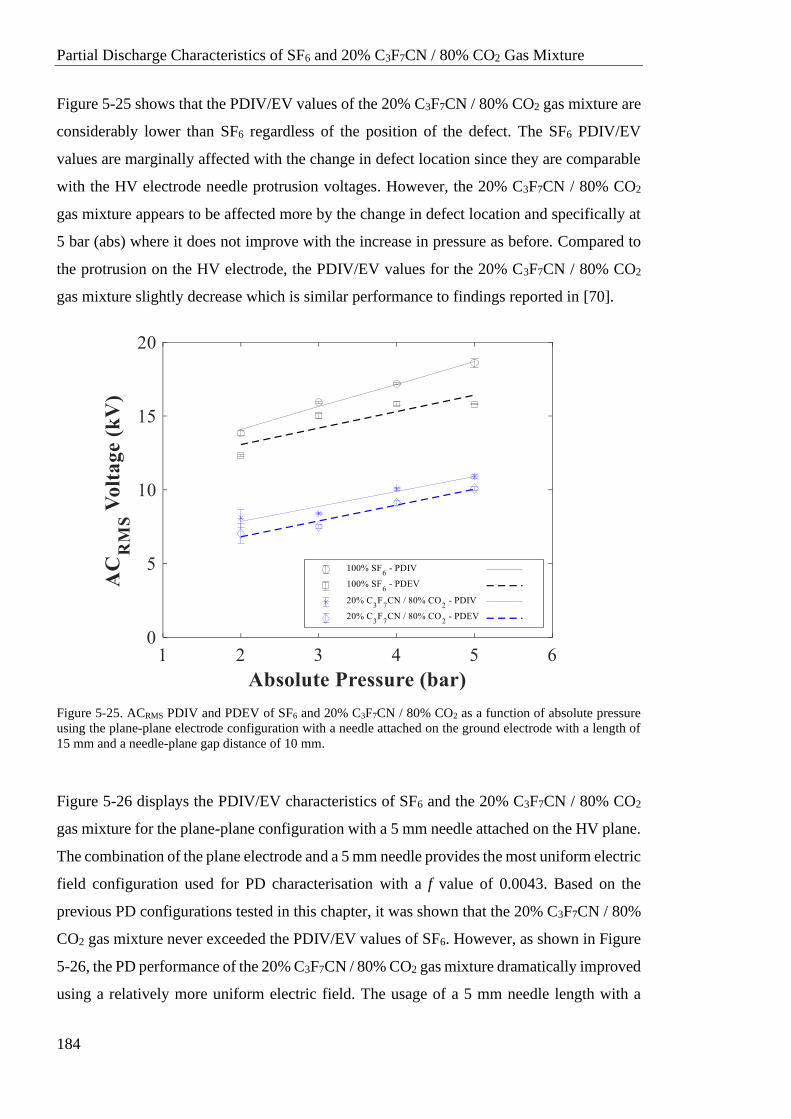
Partial Discharge Characteristics of SF6 and 20% C3F7CN / 80% CO2 Gas Mixture
184
Figure 5-25 shows that the PDIV/EV values of the 20% C3F7CN / 80% CO2 gas mixture are
considerably lower than SF6 regardless of the position of the defect. The SF6 PDIV/EV
values are marginally affected with the change in defect location since they are comparable
with the HV electrode needle protrusion voltages. However, the 20% C3F7CN / 80% CO2
gas mixture appears to be affected more by the change in defect location and specifically at
5 bar (abs) where it does not improve with the increase in pressure as before. Compared to
the protrusion on the HV electrode, the PDIV/EV values for the 20% C3F7CN / 80% CO2
gas mixture slightly decrease which is similar performance to findings reported in [70].
Figure 5-25. ACRMS PDIV and PDEV of SF6 and 20% C3F7CN / 80% CO2 as a function of absolute pressure
using the plane-plane electrode configuration with a needle attached on the ground electrode with a length of
15 mm and a needle-plane gap distance of 10 mm.
Figure 5-26 displays the PDIV/EV characteristics of SF6 and the 20% C3F7CN / 80% CO2
gas mixture for the plane-plane configuration with a 5 mm needle attached on the HV plane.
The combination of the plane electrode and a 5 mm needle provides the most uniform electric
field configuration used for PD characterisation with a f value of 0.0043. Based on the
previous PD configurations tested in this chapter, it was shown that the 20% C3F7CN / 80%
CO2 gas mixture never exceeded the PDIV/EV values of SF6. However, as shown in Figure
5-26, the PD performance of the 20% C3F7CN / 80% CO2 gas mixture dramatically improved
using a relatively more uniform electric field. The usage of a 5 mm needle length with a
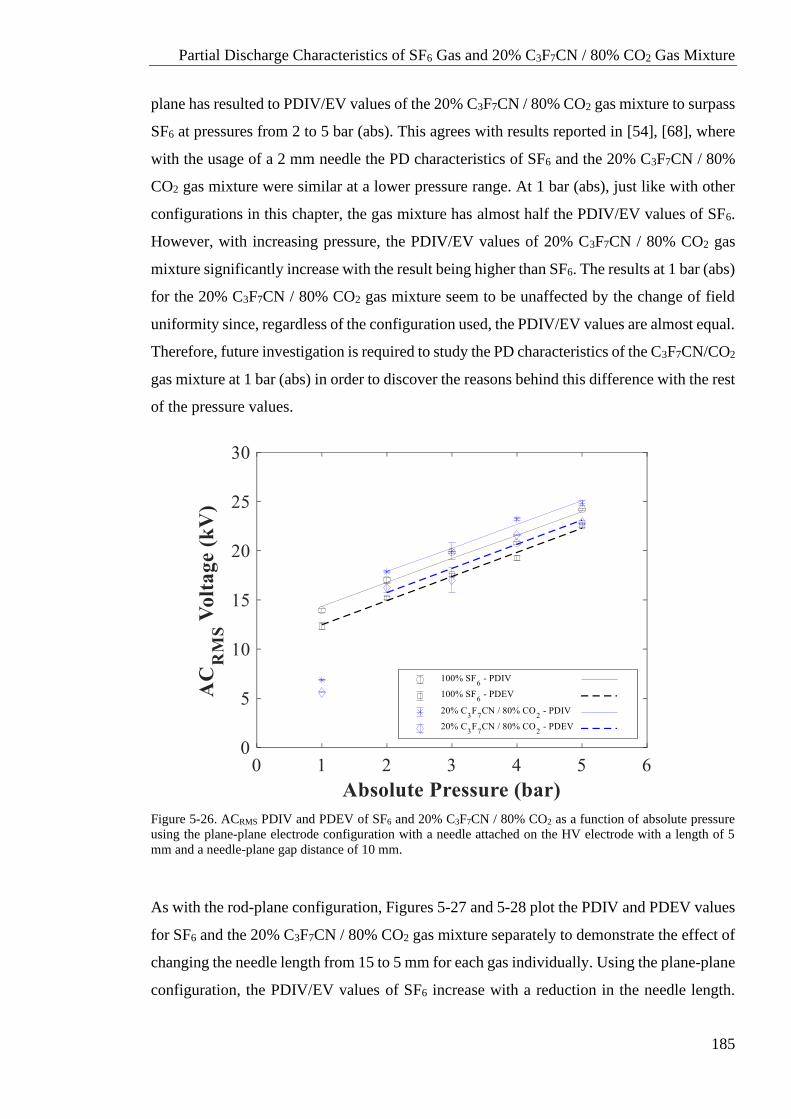
Partial Discharge Characteristics of SF6 Gas and 20% C3F7CN / 80% CO2 Gas Mixture
185
plane has resulted to PDIV/EV values of the 20% C3F7CN / 80% CO2 gas mixture to surpass
SF6 at pressures from 2 to 5 bar (abs). This agrees with results reported in [54], [68], where
with the usage of a 2 mm needle the PD characteristics of SF6 and the 20% C3F7CN / 80%
CO2 gas mixture were similar at a lower pressure range. At 1 bar (abs), just like with other
configurations in this chapter, the gas mixture has almost half the PDIV/EV values of SF6.
However, with increasing pressure, the PDIV/EV values of 20% C3F7CN / 80% CO2 gas
mixture significantly increase with the result being higher than SF6. The results at 1 bar (abs)
for the 20% C3F7CN / 80% CO2 gas mixture seem to be unaffected by the change of field
uniformity since, regardless of the configuration used, the PDIV/EV values are almost equal.
Therefore, future investigation is required to study the PD characteristics of the C3F7CN/CO2
gas mixture at 1 bar (abs) in order to discover the reasons behind this difference with the rest
of the pressure values.
Figure 5-26. ACRMS PDIV and PDEV of SF6 and 20% C3F7CN / 80% CO2 as a function of absolute pressure
using the plane-plane electrode configuration with a needle attached on the HV electrode with a length of 5
mm and a needle-plane gap distance of 10 mm.
As with the rod-plane configuration, Figures 5-27 and 5-28 plot the PDIV and PDEV values
for SF6 and the 20% C3F7CN / 80% CO2 gas mixture separately to demonstrate the effect of
changing the needle length from 15 to 5 mm for each gas individually. Using the plane-plane
configuration, the PDIV/EV values of SF6 increase with a reduction in the needle length.
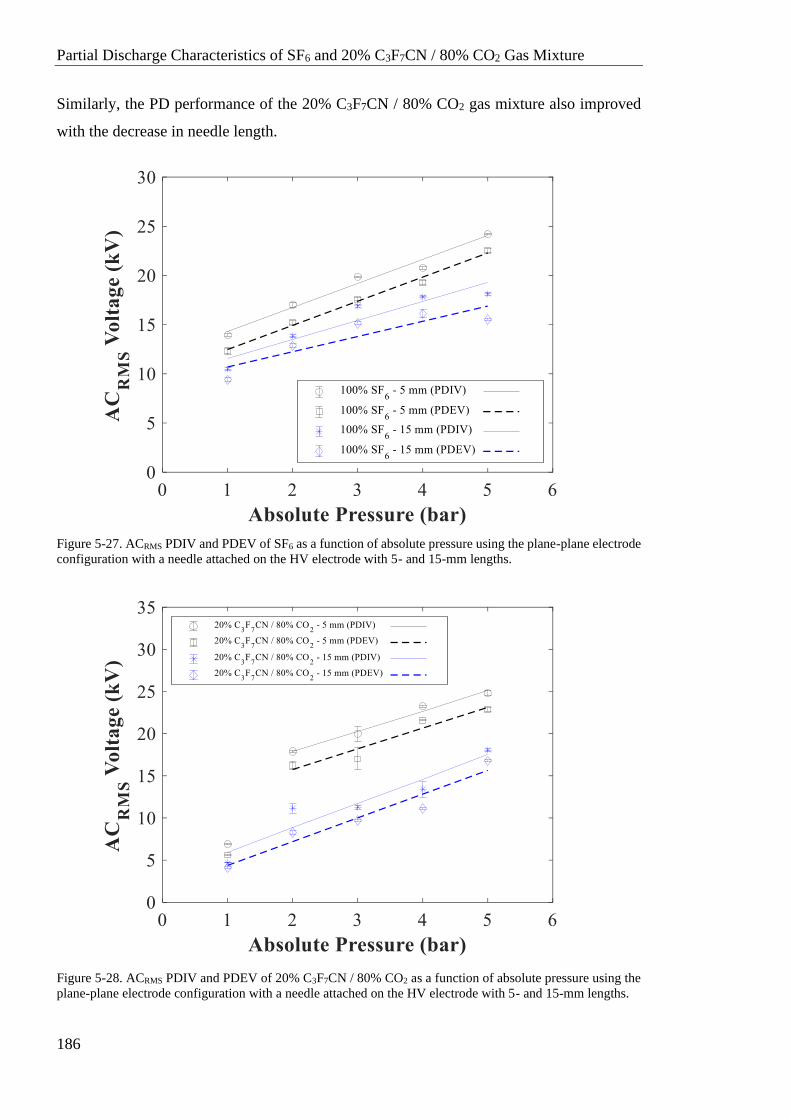
Partial Discharge Characteristics of SF6 and 20% C3F7CN / 80% CO2 Gas Mixture
186
Similarly, the PD performance of the 20% C3F7CN / 80% CO2 gas mixture also improved
with the decrease in needle length.
Figure 5-27. ACRMS PDIV and PDEV of SF6 as a function of absolute pressure using the plane-plane electrode
configuration with a needle attached on the HV electrode with 5- and 15-mm lengths.
Figure 5-28. ACRMS PDIV and PDEV of 20% C3F7CN / 80% CO2 as a function of absolute pressure using the
plane-plane electrode configuration with a needle attached on the HV electrode with 5- and 15-mm lengths.
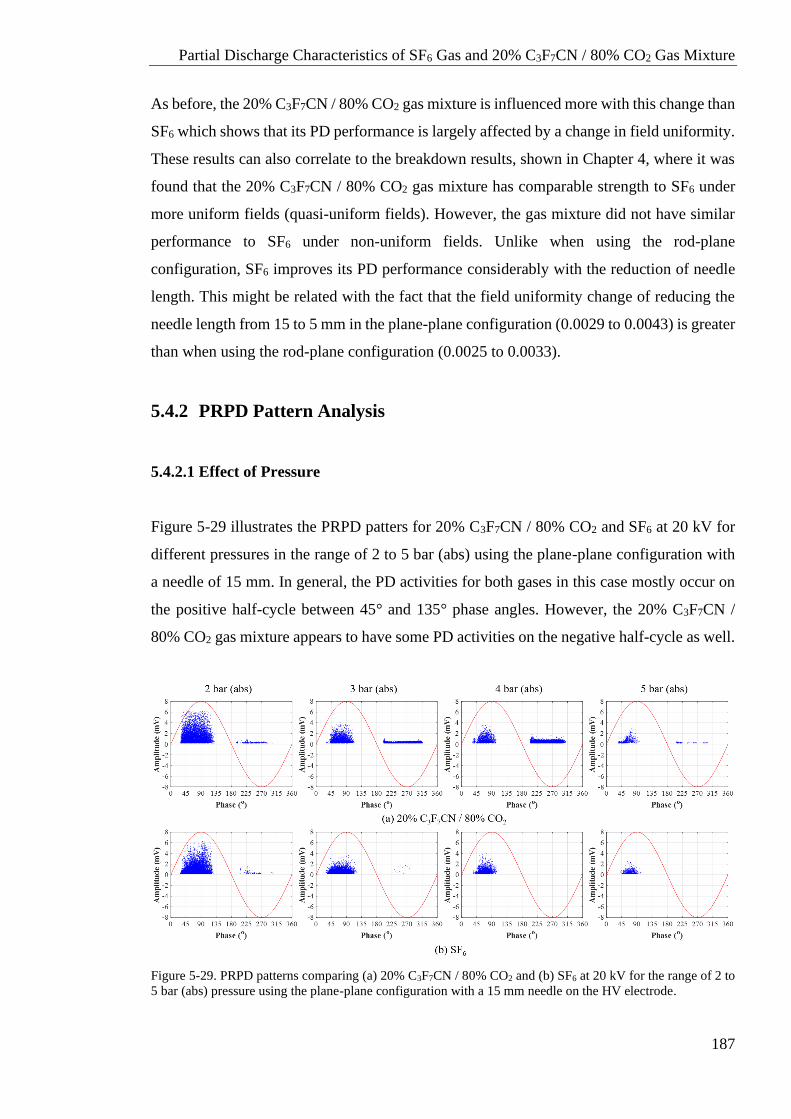
Partial Discharge Characteristics of SF6 Gas and 20% C3F7CN / 80% CO2 Gas Mixture
187
As before, the 20% C3F7CN / 80% CO2 gas mixture is influenced more with this change than
SF6 which shows that its PD performance is largely affected by a change in field uniformity.
These results can also correlate to the breakdown results, shown in Chapter 4, where it was
found that the 20% C3F7CN / 80% CO2 gas mixture has comparable strength to SF6 under
more uniform fields (quasi-uniform fields). However, the gas mixture did not have similar
performance to SF6 under non-uniform fields. Unlike when using the rod-plane
configuration, SF6 improves its PD performance considerably with the reduction of needle
length. This might be related with the fact that the field uniformity change of reducing the
needle length from 15 to 5 mm in the plane-plane configuration (0.0029 to 0.0043) is greater
than when using the rod-plane configuration (0.0025 to 0.0033).
5.4.2 PRPD Pattern Analysis
5.4.2.1 Effect of Pressure
Figure 5-29 illustrates the PRPD patters for 20% C3F7CN / 80% CO2 and SF6 at 20 kV for
different pressures in the range of 2 to 5 bar (abs) using the plane-plane configuration with
a needle of 15 mm. In general, the PD activities for both gases in this case mostly occur on
the positive half-cycle between 45° and 135° phase angles. However, the 20% C3F7CN /
80% CO2 gas mixture appears to have some PD activities on the negative half-cycle as well.
Figure 5-29. PRPD patterns comparing (a) 20% C3F7CN / 80% CO2 and (b) SF6 at 20 kV for the range of 2 to
5 bar (abs) pressure using the plane-plane configuration with a 15 mm needle on the HV electrode.
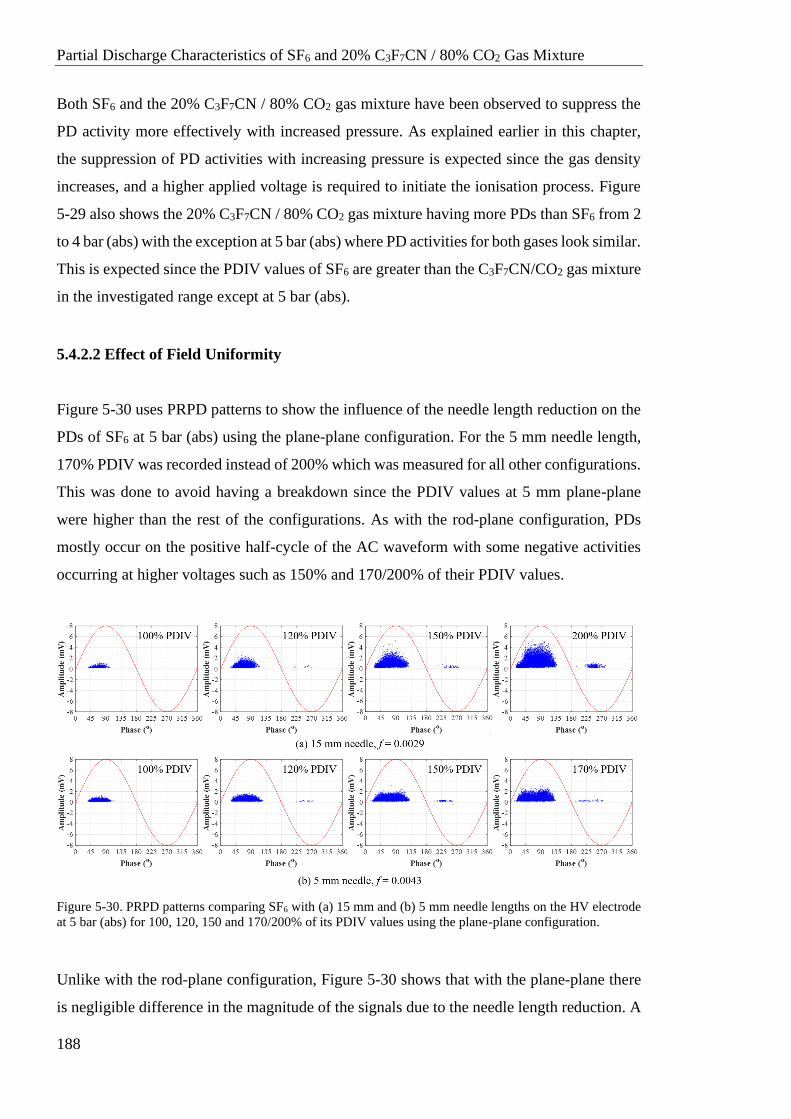
Partial Discharge Characteristics of SF6 and 20% C3F7CN / 80% CO2 Gas Mixture
188
Both SF6 and the 20% C3F7CN / 80% CO2 gas mixture have been observed to suppress the
PD activity more effectively with increased pressure. As explained earlier in this chapter,
the suppression of PD activities with increasing pressure is expected since the gas density
increases, and a higher applied voltage is required to initiate the ionisation process. Figure
5-29 also shows the 20% C3F7CN / 80% CO2 gas mixture having more PDs than SF6 from 2
to 4 bar (abs) with the exception at 5 bar (abs) where PD activities for both gases look similar.
This is expected since the PDIV values of SF6 are greater than the C3F7CN/CO2 gas mixture
in the investigated range except at 5 bar (abs).
5.4.2.2 Effect of Field Uniformity
Figure 5-30 uses PRPD patterns to show the influence of the needle length reduction on the
PDs of SF6 at 5 bar (abs) using the plane-plane configuration. For the 5 mm needle length,
170% PDIV was recorded instead of 200% which was measured for all other configurations.
This was done to avoid having a breakdown since the PDIV values at 5 mm plane-plane
were higher than the rest of the configurations. As with the rod-plane configuration, PDs
mostly occur on the positive half-cycle of the AC waveform with some negative activities
occurring at higher voltages such as 150% and 170/200% of their PDIV values.
Figure 5-30. PRPD patterns comparing SF6 with (a) 15 mm and (b) 5 mm needle lengths on the HV electrode
at 5 bar (abs) for 100, 120, 150 and 170/200% of its PDIV values using the plane-plane configuration.
Unlike with the rod-plane configuration, Figure 5-30 shows that with the plane-plane there
is negligible difference in the magnitude of the signals due to the needle length reduction. A
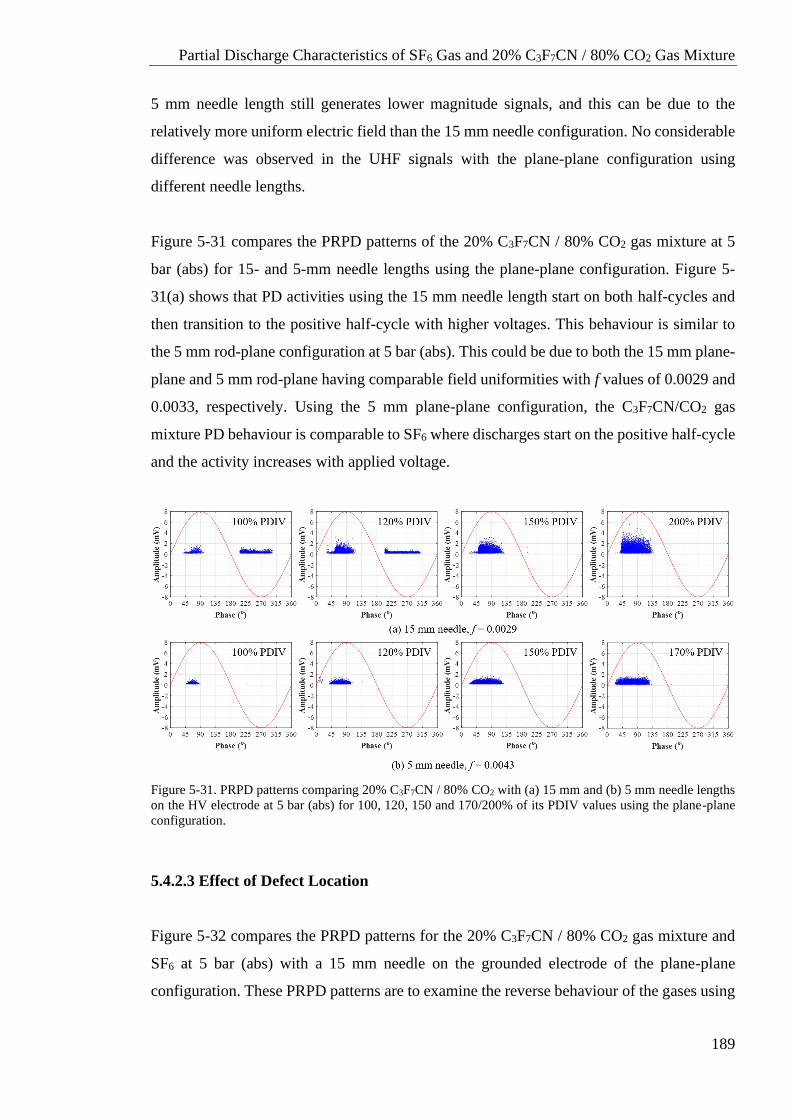
Partial Discharge Characteristics of SF6 Gas and 20% C3F7CN / 80% CO2 Gas Mixture
189
5 mm needle length still generates lower magnitude signals, and this can be due to the
relatively more uniform electric field than the 15 mm needle configuration. No considerable
difference was observed in the UHF signals with the plane-plane configuration using
different needle lengths.
Figure 5-31 compares the PRPD patterns of the 20% C3F7CN / 80% CO2 gas mixture at 5
bar (abs) for 15- and 5-mm needle lengths using the plane-plane configuration. Figure 5-
31(a) shows that PD activities using the 15 mm needle length start on both half-cycles and
then transition to the positive half-cycle with higher voltages. This behaviour is similar to
the 5 mm rod-plane configuration at 5 bar (abs). This could be due to both the 15 mm plane-
plane and 5 mm rod-plane having comparable field uniformities with f values of 0.0029 and
0.0033, respectively. Using the 5 mm plane-plane configuration, the C3F7CN/CO2 gas
mixture PD behaviour is comparable to SF6 where discharges start on the positive half-cycle
and the activity increases with applied voltage.
Figure 5-31. PRPD patterns comparing 20% C3F7CN / 80% CO2 with (a) 15 mm and (b) 5 mm needle lengths
on the HV electrode at 5 bar (abs) for 100, 120, 150 and 170/200% of its PDIV values using the plane-plane
configuration.
5.4.2.3 Effect of Defect Location
Figure 5-32 compares the PRPD patterns for the 20% C3F7CN / 80% CO2 gas mixture and
SF6 at 5 bar (abs) with a 15 mm needle on the grounded electrode of the plane-plane
configuration. These PRPD patterns are to examine the reverse behaviour of the gases using
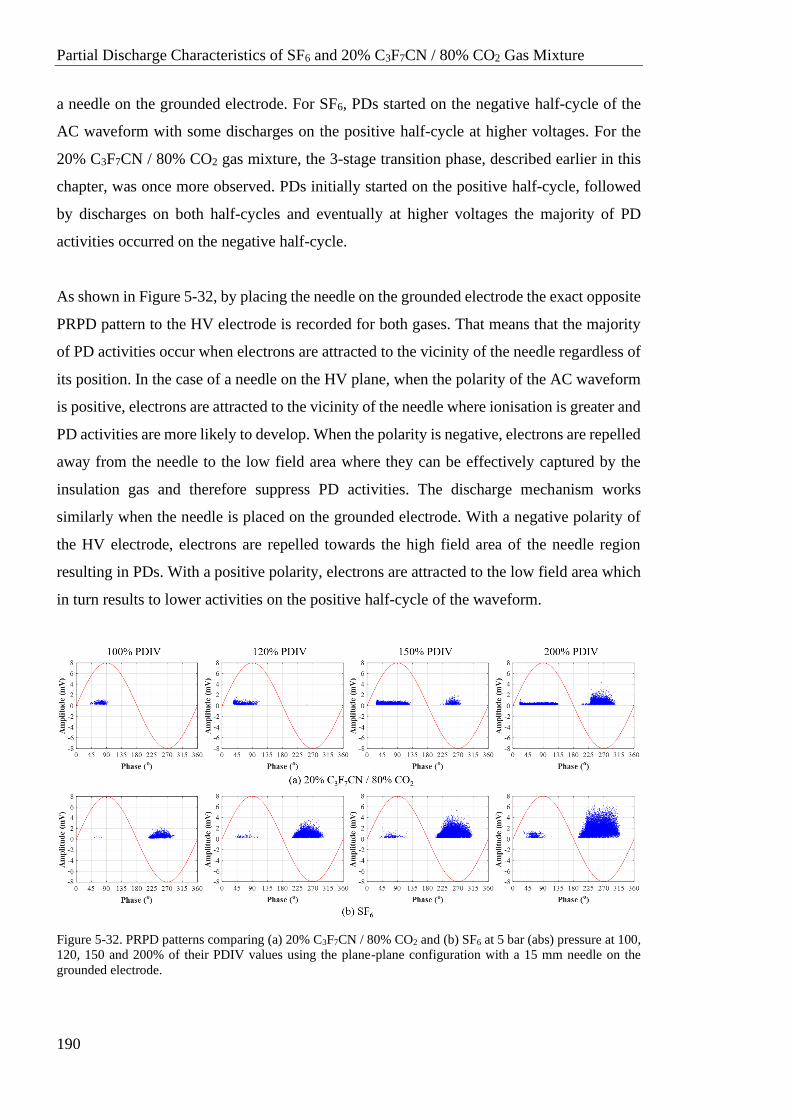
Partial Discharge Characteristics of SF6 and 20% C3F7CN / 80% CO2 Gas Mixture
190
a needle on the grounded electrode. For SF6, PDs started on the negative half-cycle of the
AC waveform with some discharges on the positive half-cycle at higher voltages. For the
20% C3F7CN / 80% CO2 gas mixture, the 3-stage transition phase, described earlier in this
chapter, was once more observed. PDs initially started on the positive half-cycle, followed
by discharges on both half-cycles and eventually at higher voltages the majority of PD
activities occurred on the negative half-cycle.
As shown in Figure 5-32, by placing the needle on the grounded electrode the exact opposite
PRPD pattern to the HV electrode is recorded for both gases. That means that the majority
of PD activities occur when electrons are attracted to the vicinity of the needle regardless of
its position. In the case of a needle on the HV plane, when the polarity of the AC waveform
is positive, electrons are attracted to the vicinity of the needle where ionisation is greater and
PD activities are more likely to develop. When the polarity is negative, electrons are repelled
away from the needle to the low field area where they can be effectively captured by the
insulation gas and therefore suppress PD activities. The discharge mechanism works
similarly when the needle is placed on the grounded electrode. With a negative polarity of
the HV electrode, electrons are repelled towards the high field area of the needle region
resulting in PDs. With a positive polarity, electrons are attracted to the low field area which
in turn results to lower activities on the positive half-cycle of the waveform.
Figure 5-32. PRPD patterns comparing (a) 20% C3F7CN / 80% CO2 and (b) SF6 at 5 bar (abs) pressure at 100,
120, 150 and 200% of their PDIV values using the plane-plane configuration with a 15 mm needle on the
grounded electrode.
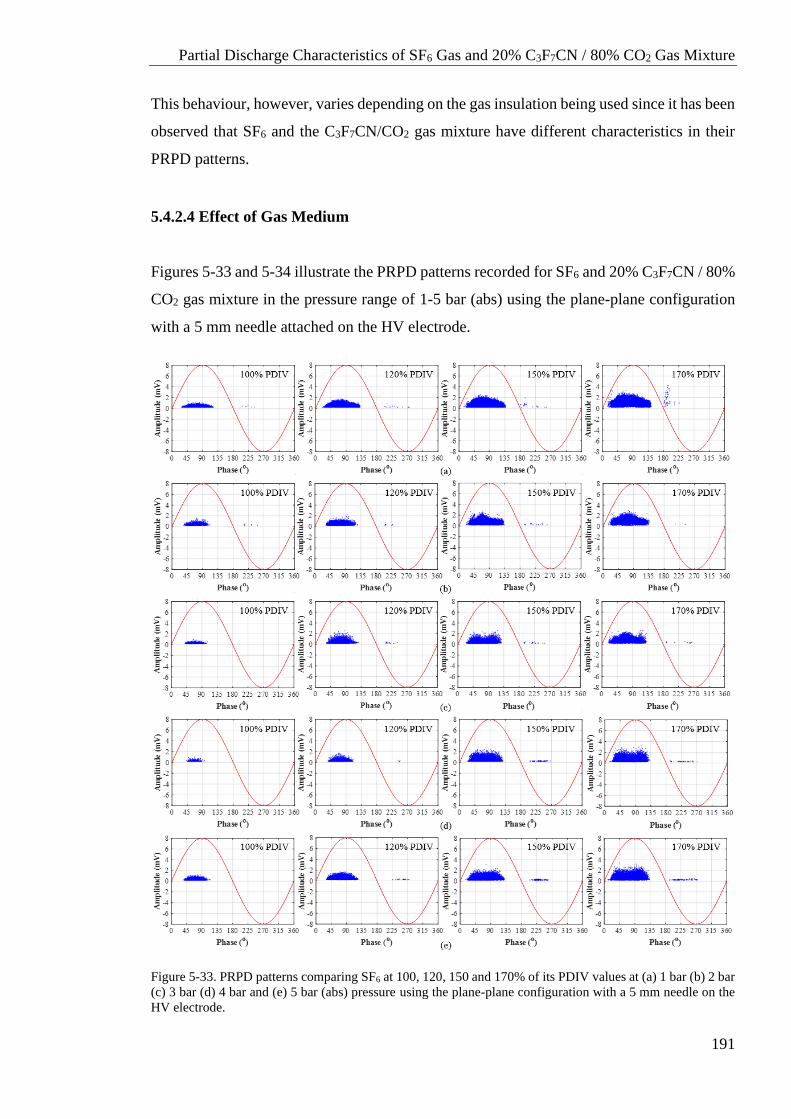
Partial Discharge Characteristics of SF6 Gas and 20% C3F7CN / 80% CO2 Gas Mixture
191
This behaviour, however, varies depending on the gas insulation being used since it has been
observed that SF6 and the C3F7CN/CO2 gas mixture have different characteristics in their
PRPD patterns.
5.4.2.4 Effect of Gas Medium
Figures 5-33 and 5-34 illustrate the PRPD patterns recorded for SF6 and 20% C3F7CN / 80%
CO2 gas mixture in the pressure range of 1-5 bar (abs) using the plane-plane configuration
with a 5 mm needle attached on the HV electrode.
Figure 5-33. PRPD patterns comparing SF6 at 100, 120, 150 and 170% of its PDIV values at (a) 1 bar (b) 2 bar
(c) 3 bar (d) 4 bar and (e) 5 bar (abs) pressure using the plane-plane configuration with a 5 mm needle on the
HV electrode.
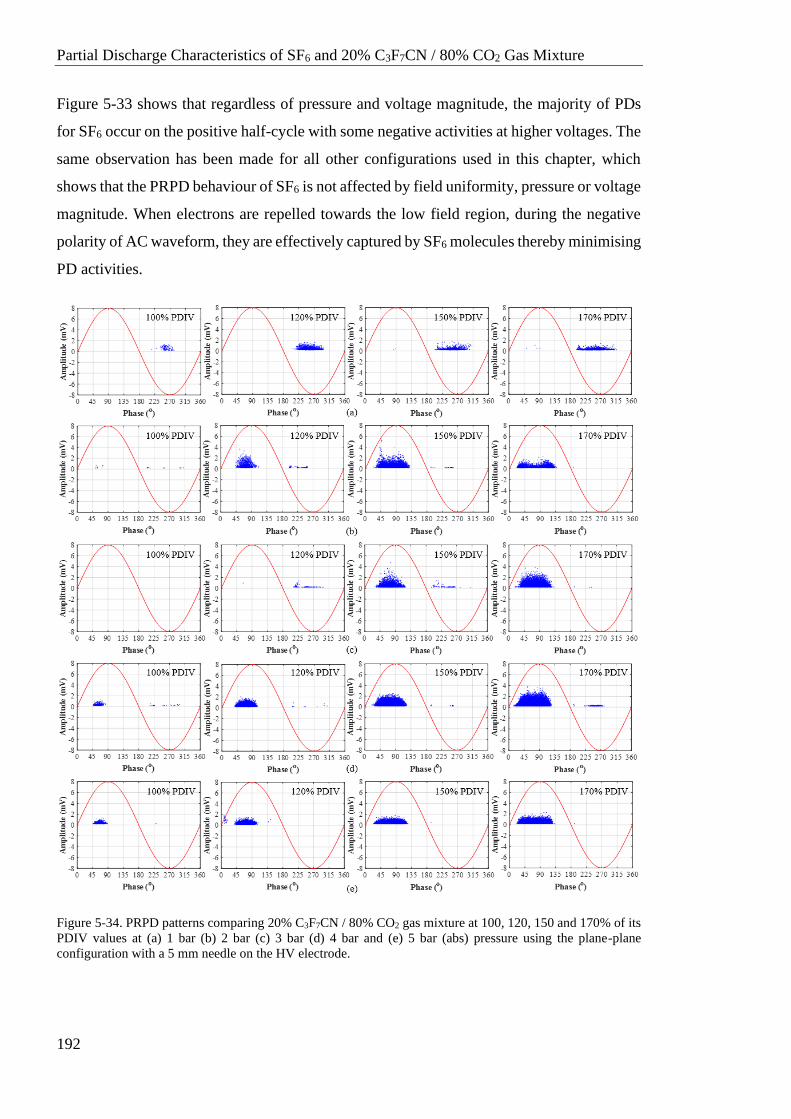
Partial Discharge Characteristics of SF6 and 20% C3F7CN / 80% CO2 Gas Mixture
192
Figure 5-33 shows that regardless of pressure and voltage magnitude, the majority of PDs
for SF6 occur on the positive half-cycle with some negative activities at higher voltages. The
same observation has been made for all other configurations used in this chapter, which
shows that the PRPD behaviour of SF6 is not affected by field uniformity, pressure or voltage
magnitude. When electrons are repelled towards the low field region, during the negative
polarity of AC waveform, they are effectively captured by SF6 molecules thereby minimising
PD activities.
Figure 5-34. PRPD patterns comparing 20% C3F7CN / 80% CO2 gas mixture at 100, 120, 150 and 170% of its
PDIV values at (a) 1 bar (b) 2 bar (c) 3 bar (d) 4 bar and (e) 5 bar (abs) pressure using the plane-plane
configuration with a 5 mm needle on the HV electrode.
Partial Discharge Characteristics of SF6 Gas and 20% C3F7CN / 80% CO2 Gas Mixture
193
Figure 5-34 shows that, with the exception of 1 bar (abs), the 20% C3F7CN / 80% CO2 gas
mixture behaves very similar to SF6 using the plane-plane configuration with a 5 mm needle
attached on the HV electrode. These PRPD patterns contradict the ones recorded from the
rest of the electrode configurations used in this chapter with the 20% C3F7CN / 80% CO2
gas mixture. For all cases, excluding the 15 mm rod-plane at 5 bar (abs), the PDs in the
PRPD patterns appear to start on the negative half-cycle and with an increasing voltage to
shift to the positive half-cycle via the 3-stage transition phase described earlier in this
chapter. This is an indication that voltage magnitude, field uniformity and pressure/density
can influence the PRPD pattern behaviour of the 20% C3F7CN / 80% CO2 gas mixture.
5.5 Discussion
The PD results from this chapter, using varying electric field uniformities, are significantly
important for the retro-fill of an alternative gas mixture in existing GIL/GIB equipment. The
probability of having a protrusion with a length of 5 and 15 mm in GIL/GIB is considered
extremely rare. Usually, imperfections in practical GIL/GIB are smaller than the tested
scenarios but these specific needle lengths were tested to assess the behaviour of the 20%
C3F7CN / 80% CO2 gas mixture in comparison to SF6 in the presence of extreme electric
field enhancements. As shown from the results, under highly divergent fields (15 mm needle)
the gas mixture behaves poorly in comparison to SF6 but when the needle length is reduced,
and the field uniformity is increased, its PD performance significantly improves. The PD
performance of the C3F7CN/CO2 gas mixture, however, needs to be validated in full-scale
GIL/GIB equipment which will be shown on a later stage in this thesis.
As described earlier in this chapter, the 3-stage transition phase of the PRPD pattern
behaviour, which was found for the C3F7CN/CO2 gas mixture, can be associated with voltage
magnitude and the development of streamers and leaders [28], [100]. However, as shown in
this chapter, this can be further influenced by field uniformity, pressure/density as well as
the gas medium since the 20% C3F7CN / 80% CO2 gas mixture has a different PRPD
behaviour to SF6.
As mentioned before, pressure/density, field uniformity as well as voltage magnitude have
no effect on SF6 gas using small gaps since the PDs predominantly occur on the positive
Partial Discharge Characteristics of SF6 and 20% C3F7CN / 80% CO2 Gas Mixture
194
half-cycle of the AC waveform. However, the 20% C3F7CN / 80% CO2 gas mixture was
found to behave differently to SF6 with field uniformity, pressure/density and voltage
magnitude having an effect on its PD behaviour. Taking all the PRPD patterns recorded into
consideration, several observations have been found to affect the PD behaviour of the
C3F7CN/CO2 gas mixture:
• Voltage magnitude appeared to make a difference as in many cases the negative activities
started at 100% PDIV values but they shift to the positive half-cycle with an increasing
voltage up to 200% PDIV. This, as explained earlier, could be occurring because of low
magnitude PDs at 100% PDIV but as voltage increases, and the development of
streamers and leaders progresses, the PDs shift to the positive half-cycle.
• Field uniformity has been observed to affect the 3-stage transition phase of the gas
mixture. With field uniformities of f values less than 0.0033, the transition phase
occurred for almost all investigated pressures. Once this critical f value was exceeded,
where only the 5 mm plane-plane configuration (f = 0.0043) does that, the C3F7CN/CO2
gas mixture was able to suppress PD activities more effectively and this was
demonstrated by the PDIV/EV values. Better PDIV/EV values for C3F7CN/CO2 gas
mixture were also associated with positive PD activities occurring within the range of 2-
5 bar (abs). This shows that with more uniform fields, where 20% C3F7CN / 80% CO2
has the ability to suppress PDs like SF6, the PRPD patterns for the gas mixture start to
appear SF6-alike.
• Pressure or gas density have shown to influence the PD performance and PRPD pattern
of the 20% C3F7CN / 80% CO2 gas mixture. The gas mixture has demonstrated
susceptibility to PDs at 1 bar (abs) where PDIV/EV values were consistently half of
corresponding SF6 values, regardless of field uniformity. This has also been associated
with the PRPD patterns at 1 bar (abs) to be dominated with PDs on the negative half-
cycle.
From the above observations, it can be derived that the PD behaviour of the 20% C3F7CN /
80% CO2 mixture, unlike SF6, can be influenced from factors such as field uniformity and
pressure/density which is also reflected in its PRPD patterns. Highly divergent fields at lower
pressures can initiate PD activities on the negative half-cycle of the AC waveform which
was not observed in SF6. The presence of negative PD activities could be correlated to lower
Partial Discharge Characteristics of SF6 Gas and 20% C3F7CN / 80% CO2 Gas Mixture
195
PDIV/EV values relative to SF6. This is because the only electrode configuration that the
20% C3F7CN / 80% CO2 gas mixture had comparable PD performance to SF6 was the 5 mm
plane-plane where PRPD patterns were dominated by positive PD activities. A reason for
the gas mixture to be affected more from pressure/density and field uniformity could be the
presence of weakly electronegative carbon molecules, as the C3F7CN/CO2 gas mixture is
predominantly filled with CO2, which can result to PDs initiated at lower voltages than SF6
which is a purely electronegative gas.
5.6 Summary
The PD characteristics of SF6 gas and the 20% C3F7CN / 80% CO2 gas mixture were
experimentally investigated in this chapter using two external UHF sensors attached onto
the viewing windows of the pressure vessel. Full bandwidth scans were carried out, over the
range of 300-2000 MHz, which have shown that the two gases display the best signal-to-
noise ratio PDs around 1050 to 1100 MHz. Therefore, PRPD measurements in this chapter
were focused for the frequency range of 1050-1150 MHz.
PD behaviour for SF6 and the 20% C3F7CN / 80% CO2 gas mixture were compared using
their PDIV and PDEV values. The characterisation was carried out using two different
electrode configurations, namely plane-plane and rod-plane and two needle lengths of 5 and
15 mm, to vary the field uniformity from divergent to highly divergent. In general, SF6 has
shown to have higher PDIV and PDEV values than the 20% C3F7CN / 80% CO2 gas mixture.
Results have shown that the 20% C3F7CN / 80% CO2 gas mixture can be more sensitive to
highly divergent fields than SF6 for the pressure range of 1-4 bar (abs). However, at 5 bar
(abs), the 20% C3F7CN / 80% CO2 gas mixture was found to reduce the difference in
PDIV/EV values to SF6 which indicates that it can perform better at higher pressures.
Additionally, using a 5 mm needle on the HV electrode of the plane-plane configuration,
which is the most uniform electrode arrangement in this chapter, has resulted in a significant
improvement in the PD characteristics of the 20% C3F7CN / 80% CO2 gas mixture relative
to SF6. The PDIV/EV values of the 20% C3F7CN / 80% CO2 gas mixture under more uniform
fields were found to exceed SF6 in the pressure range of 2-5 bar (abs). This shows that the
SF6-alternative can potentially suppress PD activities equally well to SF6 when having points
Partial Discharge Characteristics of SF6 and 20% C3F7CN / 80% CO2 Gas Mixture
196
of electric field enhancement on the HV conductor in a high-pressure environment as found
in practical GIL/GIB equipment.
Finally, SF6 and 20% C3F7CN / 80% CO2 were found to behave differently in their PRPD
patterns at more non-uniform fields and lower pressure/density values. Most of the PD
activity for SF6 occurred on the positive cycle with a few discharges on the negative cycle
at higher voltages, regardless of the field uniformity and pressure/density being used. On the
contrary, the PRPD patterns using the 20% C3F7CN / 80% CO2 gas mixture were
significantly influenced by voltage magnitude, field uniformity and gas pressure/density. For
more non-uniform fields and lower pressures, PD activities of the 20% C3F7CN / 80% CO2
gas mixture started on the negative cycle and switched to the positive cycle at higher voltages
when the needle was located on the HV electrode. A reverse behaviour was observed with a
needle on the grounded electrode. A 3-stage transition behaviour was generally noticed when
the applied voltage, pressure/density and field uniformity was changed for the 20% C3F7CN
/ 80% CO2 gas mixture. This shows that different gas types, and more specifically a mixture
of strong and weakly attaching gases such as C3F7CN and CO2, can react otherwise with
their PRPD patterns under varying conditions. This should be taken into consideration for
future condition monitoring diagnostics, in case SF6-alternatives are being used in high
voltage equipment.
Retro-fill Investigation of a GIB Demonstrator Rated for Transmission Voltages
197
Chapter 6 Retro-fill Investigation of a GIB
Demonstrator Rated for Transmission Voltages
6.1 Introduction
The purpose of this retro-fill investigation is to explore the feasibility of replacing SF6 in
existing GIL/GIB assets in the power network with a more environmentally friendly gas
medium. Retro-filling is a time-saving and cost-efficient solution as only two major
procedures have to be carried out on the equipment: (i) extraction of SF6 from GIL/GIB
assets and (ii) refill of equipment with the 20% C3F7CN / 80% CO2 gas mixture. For a retro-
fill investigation, two important studies have to be taken into consideration: (i) electrical
type tests according to the International Electrotechnical Commission (IEC) standards using
full-scale, SF6-designed GIL/GIB equipment filled with the 20% C3F7CN / 80% CO2 gas
mixture and (ii) material compatibility tests for the new gas mixture with materials
commonly found in full-scale GIL/GIB equipment, such as elastomer gaskets.
Type tests, or withstand voltage tests, on assets are usually performed to verify if the new
product meets the IEC standard requirements. Equipment undergoes lightning impulse (LI),
switching impulse (SI), power frequency (AC) and PD type tests prior to commissioning
them to the network. Although breakdown voltage and PD characteristics tests provide
useful information about an alternative insulation material, such as C3F7CN, it cannot be
proposed as a potential solution unless it has passed the required type tests on practical
equipment. National Grid plc, the transmission operator of Great Britain, uses 550 kV rated
GIB equipment for the 400 kV England and Wales transmission network. To investigate the
technical viability of the 20% C3F7CN / 80% CO2 gas mixture, the new gas mixture was
retro-filled in a full-scale GIB demonstrator and subjected to type tests. This can establish a
level of confidence that the new gas mixture can indeed be retro-filled in SF6-designed GIB
in UK substations. This chapter focuses on three main investigations: (i) conduct type tests
using a 420/550 kV, SF6-designed GIB demonstrator filled with SF6 and then 20% C3F7CN
/ 80% CO2 gas mixture (ii) perform a material compatibility study for C3F7CN with a
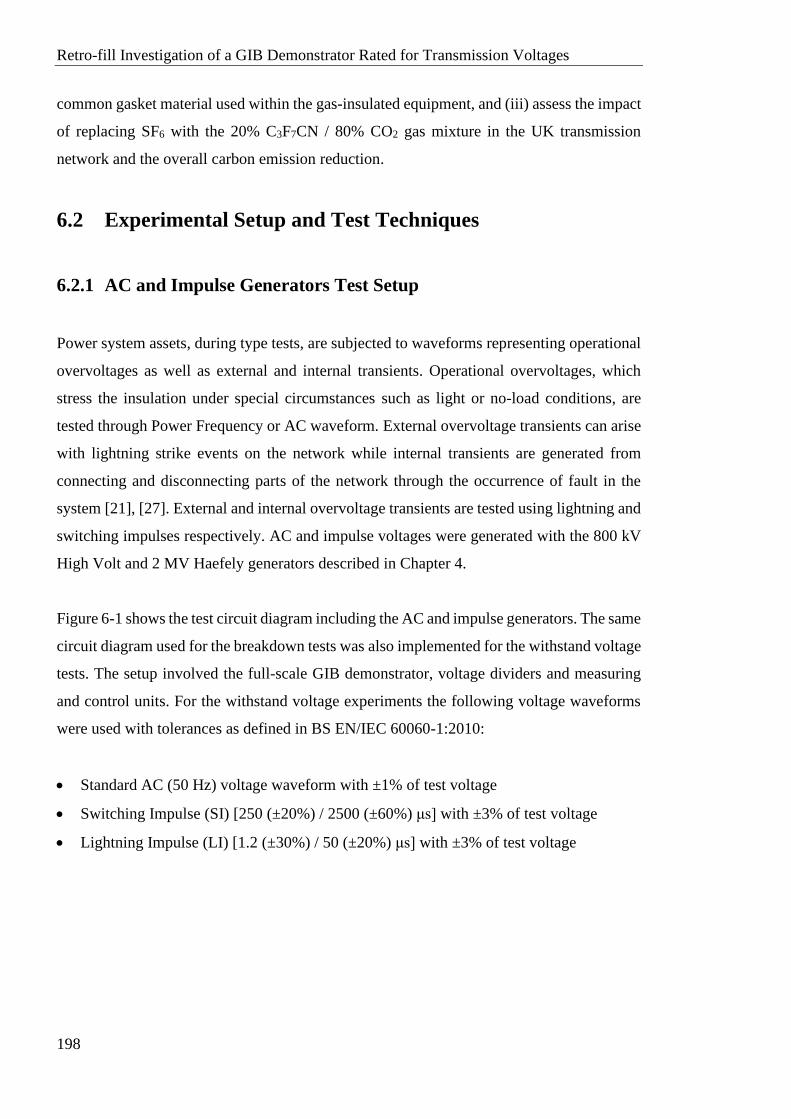
Retro-fill Investigation of a GIB Demonstrator Rated for Transmission Voltages
198
common gasket material used within the gas-insulated equipment, and (iii) assess the impact
of replacing SF6 with the 20% C3F7CN / 80% CO2 gas mixture in the UK transmission
network and the overall carbon emission reduction.
6.2 Experimental Setup and Test Techniques
6.2.1 AC and Impulse Generators Test Setup
Power system assets, during type tests, are subjected to waveforms representing operational
overvoltages as well as external and internal transients. Operational overvoltages, which
stress the insulation under special circumstances such as light or no-load conditions, are
tested through Power Frequency or AC waveform. External overvoltage transients can arise
with lightning strike events on the network while internal transients are generated from
connecting and disconnecting parts of the network through the occurrence of fault in the
system [21], [27]. External and internal overvoltage transients are tested using lightning and
switching impulses respectively. AC and impulse voltages were generated with the 800 kV
High Volt and 2 MV Haefely generators described in Chapter 4.
Figure 6-1 shows the test circuit diagram including the AC and impulse generators. The same
circuit diagram used for the breakdown tests was also implemented for the withstand voltage
tests. The setup involved the full-scale GIB demonstrator, voltage dividers and measuring
and control units. For the withstand voltage experiments the following voltage waveforms
were used with tolerances as defined in BS EN/IEC 60060-1:2010:
• Standard AC (50 Hz) voltage waveform with ±1% of test voltage
• Switching Impulse (SI) [250 (±20%) / 2500 (±60%) μs] with ±3% of test voltage
• Lightning Impulse (LI) [1.2 (±30%) / 50 (±20%) μs] with ±3% of test voltage
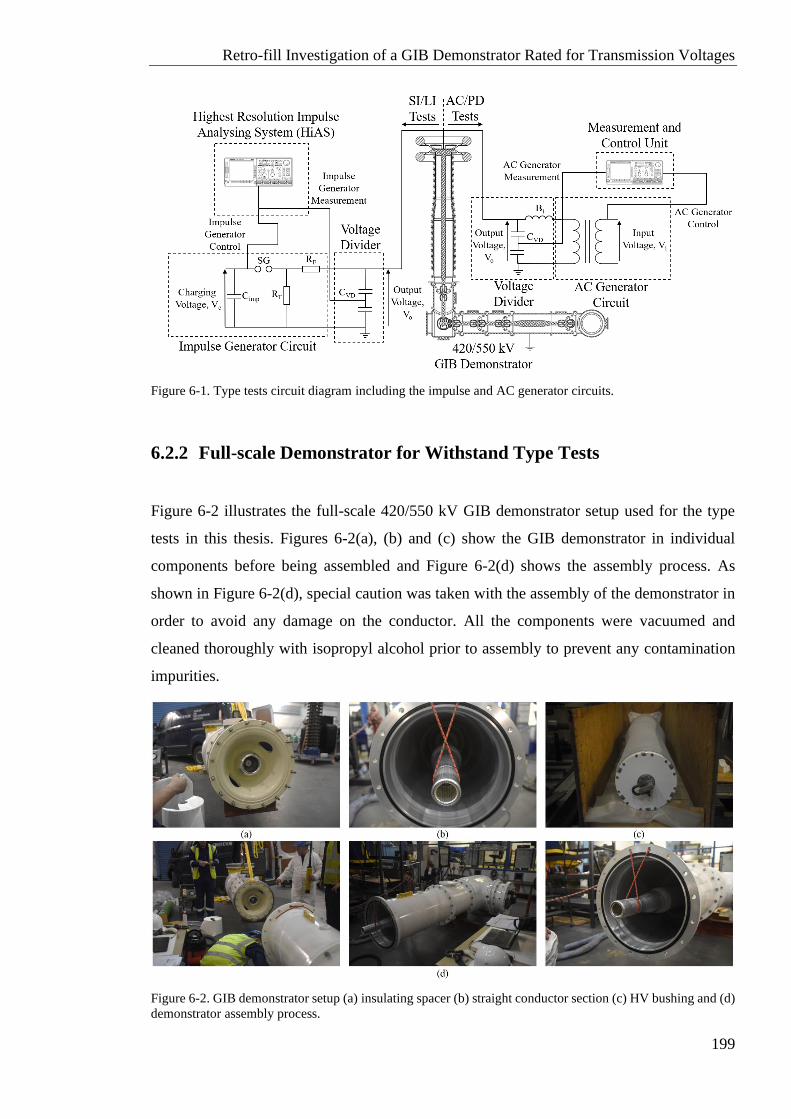
Retro-fill Investigation of a GIB Demonstrator Rated for Transmission Voltages
199
Figure 6-1. Type tests circuit diagram including the impulse and AC generator circuits.
6.2.2 Full-scale Demonstrator for Withstand Type Tests
Figure 6-2 illustrates the full-scale 420/550 kV GIB demonstrator setup used for the type
tests in this thesis. Figures 6-2(a), (b) and (c) show the GIB demonstrator in individual
components before being assembled and Figure 6-2(d) shows the assembly process. As
shown in Figure 6-2(d), special caution was taken with the assembly of the demonstrator in
order to avoid any damage on the conductor. All the components were vacuumed and
cleaned thoroughly with isopropyl alcohol prior to assembly to prevent any contamination
impurities.
Figure 6-2. GIB demonstrator setup (a) insulating spacer (b) straight conductor section (c) HV bushing and (d)
demonstrator assembly process.
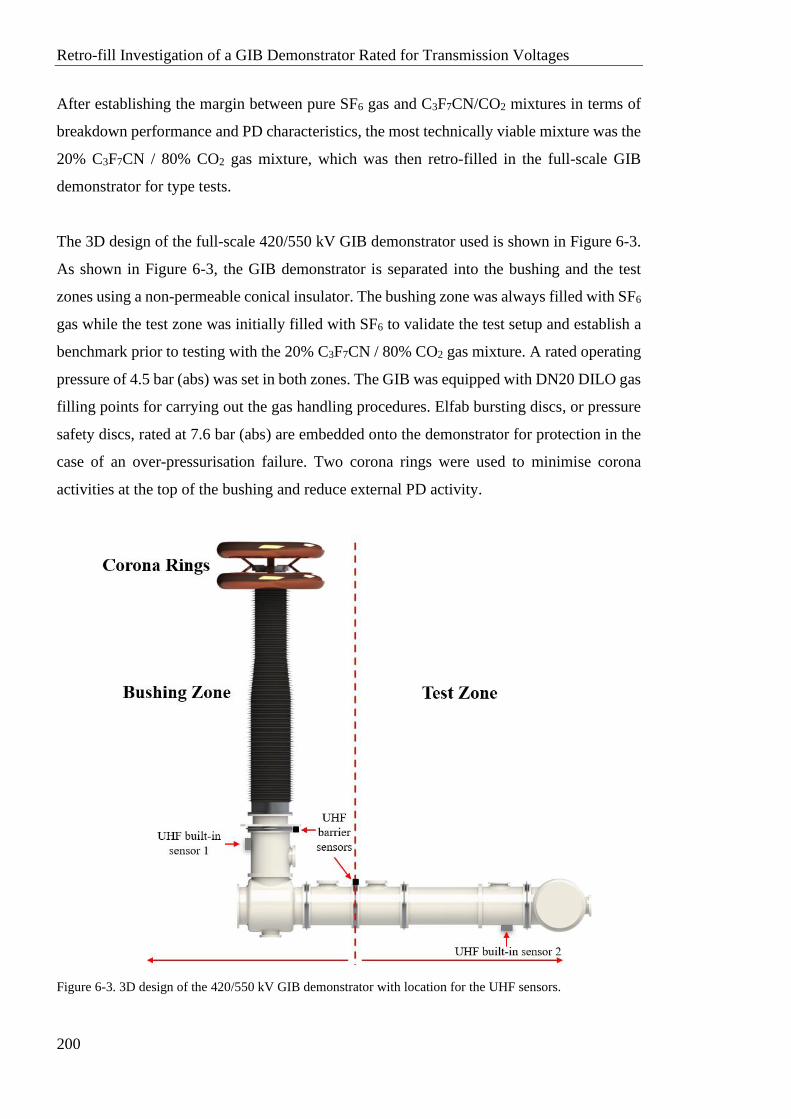
Retro-fill Investigation of a GIB Demonstrator Rated for Transmission Voltages
200
After establishing the margin between pure SF6 gas and C3F7CN/CO2 mixtures in terms of
breakdown performance and PD characteristics, the most technically viable mixture was the
20% C3F7CN / 80% CO2 gas mixture, which was then retro-filled in the full-scale GIB
demonstrator for type tests.
The 3D design of the full-scale 420/550 kV GIB demonstrator used is shown in Figure 6-3.
As shown in Figure 6-3, the GIB demonstrator is separated into the bushing and the test
zones using a non-permeable conical insulator. The bushing zone was always filled with SF6
gas while the test zone was initially filled with SF6 to validate the test setup and establish a
benchmark prior to testing with the 20% C3F7CN / 80% CO2 gas mixture. A rated operating
pressure of 4.5 bar (abs) was set in both zones. The GIB was equipped with DN20 DILO gas
filling points for carrying out the gas handling procedures. Elfab bursting discs, or pressure
safety discs, rated at 7.6 bar (abs) are embedded onto the demonstrator for protection in the
case of an over-pressurisation failure. Two corona rings were used to minimise corona
activities at the top of the bushing and reduce external PD activity.
Figure 6-3. 3D design of the 420/550 kV GIB demonstrator with location for the UHF sensors.
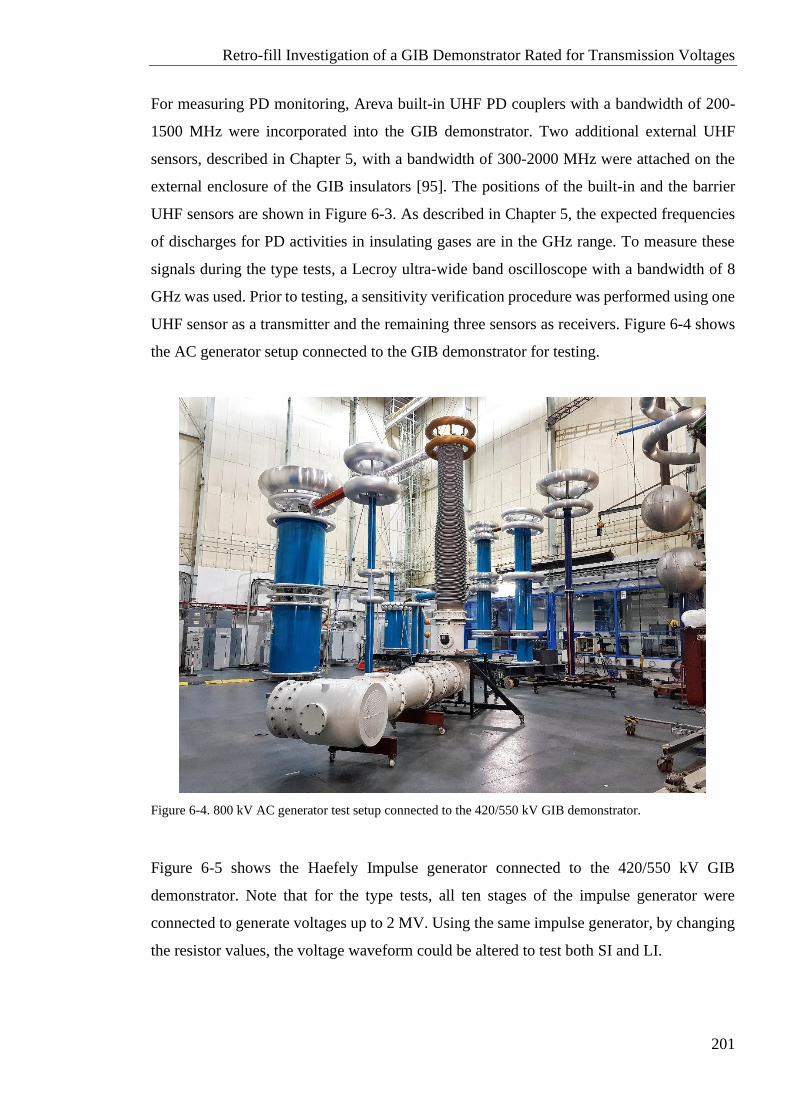
Retro-fill Investigation of a GIB Demonstrator Rated for Transmission Voltages
201
For measuring PD monitoring, Areva built-in UHF PD couplers with a bandwidth of 200-
1500 MHz were incorporated into the GIB demonstrator. Two additional external UHF
sensors, described in Chapter 5, with a bandwidth of 300-2000 MHz were attached on the
external enclosure of the GIB insulators [95]. The positions of the built-in and the barrier
UHF sensors are shown in Figure 6-3. As described in Chapter 5, the expected frequencies
of discharges for PD activities in insulating gases are in the GHz range. To measure these
signals during the type tests, a Lecroy ultra-wide band oscilloscope with a bandwidth of 8
GHz was used. Prior to testing, a sensitivity verification procedure was performed using one
UHF sensor as a transmitter and the remaining three sensors as receivers. Figure 6-4 shows
the AC generator setup connected to the GIB demonstrator for testing.
Figure 6-4. 800 kV AC generator test setup connected to the 420/550 kV GIB demonstrator.
Figure 6-5 shows the Haefely Impulse generator connected to the 420/550 kV GIB
demonstrator. Note that for the type tests, all ten stages of the impulse generator were
connected to generate voltages up to 2 MV. Using the same impulse generator, by changing
the resistor values, the voltage waveform could be altered to test both SI and LI.
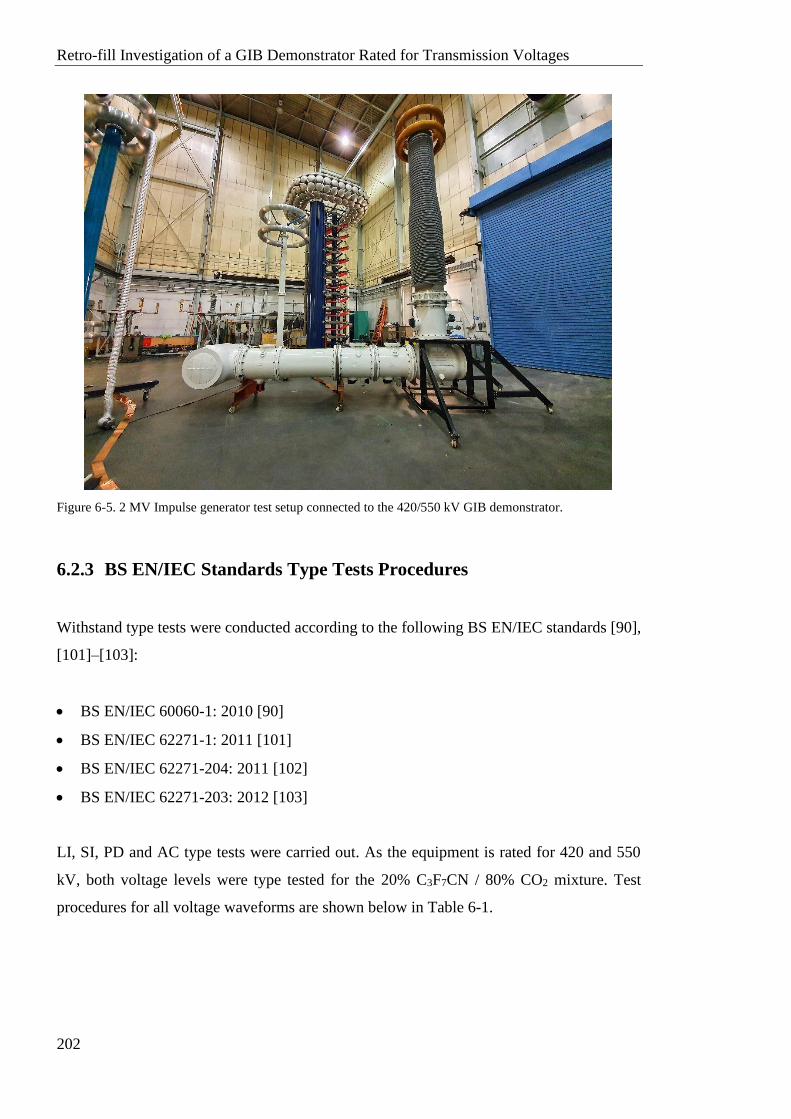
Retro-fill Investigation of a GIB Demonstrator Rated for Transmission Voltages
202
Figure 6-5. 2 MV Impulse generator test setup connected to the 420/550 kV GIB demonstrator.
6.2.3 BS EN/IEC Standards Type Tests Procedures
Withstand type tests were conducted according to the following BS EN/IEC standards [90],
[101]–[103]:
• BS EN/IEC 60060-1: 2010 [90]
• BS EN/IEC 62271-1: 2011 [101]
• BS EN/IEC 62271-204: 2011 [102]
• BS EN/IEC 62271-203: 2012 [103]
LI, SI, PD and AC type tests were carried out. As the equipment is rated for 420 and 550
kV, both voltage levels were type tested for the 20% C3F7CN / 80% CO2 mixture. Test
procedures for all voltage waveforms are shown below in Table 6-1.
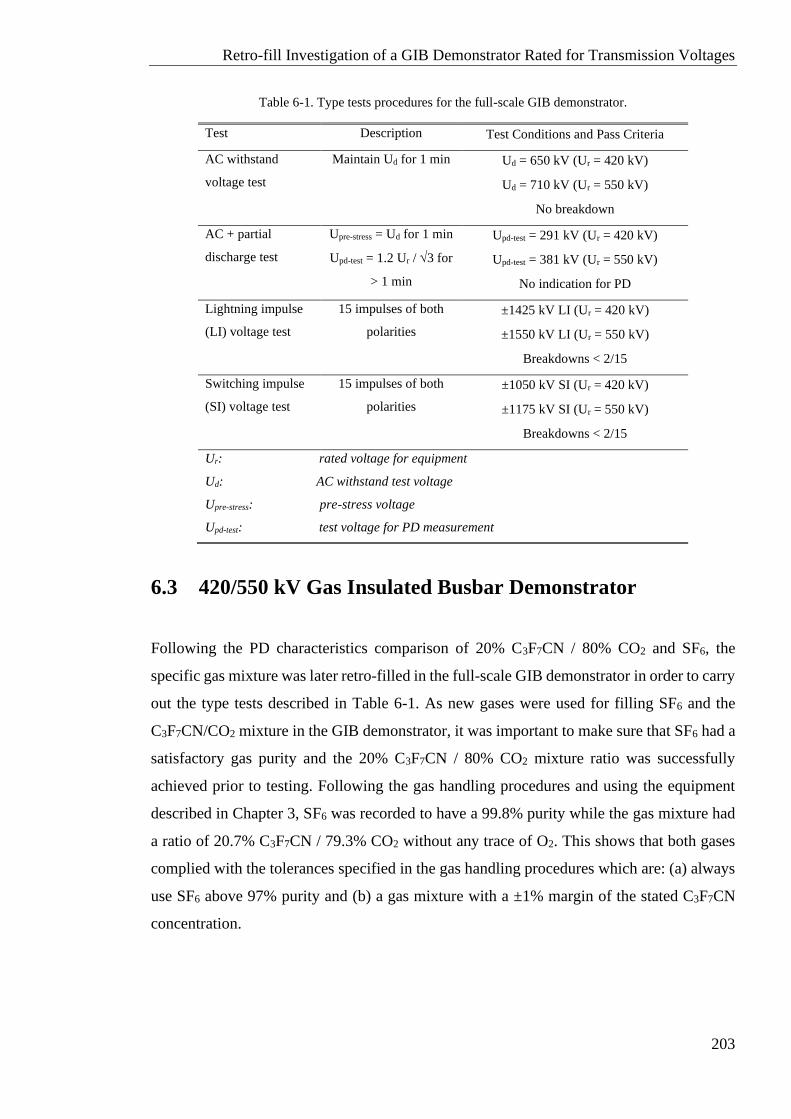
Retro-fill Investigation of a GIB Demonstrator Rated for Transmission Voltages
203
Table 6-1. Type tests procedures for the full-scale GIB demonstrator.
Test Description Test Conditions and Pass Criteria
AC withstand
voltage test
Maintain Ud for 1 min Ud = 650 kV (Ur = 420 kV)
Ud = 710 kV (Ur = 550 kV)
No breakdown
AC + partial
discharge test
Upre-stress = Ud for 1 min
Upd-test = 1.2 Ur / 3 for
> 1 min
Upd-test = 291 kV (Ur = 420 kV)
Upd-test = 381 kV (Ur = 550 kV)
No indication for PD
Lightning impulse
(LI) voltage test
15 impulses of both
polarities
±1425 kV LI (Ur = 420 kV)
±1550 kV LI (Ur = 550 kV)
Breakdowns < 2/15
Switching impulse
(SI) voltage test
15 impulses of both
polarities
±1050 kV SI (Ur = 420 kV)
±1175 kV SI (Ur = 550 kV)
Breakdowns < 2/15
Ur: rated voltage for equipment
Ud: AC withstand test voltage
Upre-stress: pre-stress voltage
Upd-test: test voltage for PD measurement
6.3 420/550 kV Gas Insulated Busbar Demonstrator
Following the PD characteristics comparison of 20% C3F7CN / 80% CO2 and SF6, the
specific gas mixture was later retro-filled in the full-scale GIB demonstrator in order to carry
out the type tests described in Table 6-1. As new gases were used for filling SF6 and the
C3F7CN/CO2 mixture in the GIB demonstrator, it was important to make sure that SF6 had a
satisfactory gas purity and the 20% C3F7CN / 80% CO2 mixture ratio was successfully
achieved prior to testing. Following the gas handling procedures and using the equipment
described in Chapter 3, SF6 was recorded to have a 99.8% purity while the gas mixture had
a ratio of 20.7% C3F7CN / 79.3% CO2 without any trace of O2. This shows that both gases
complied with the tolerances specified in the gas handling procedures which are: (a) always
use SF6 above 97% purity and (b) a gas mixture with a ±1% margin of the stated C3F7CN
concentration.
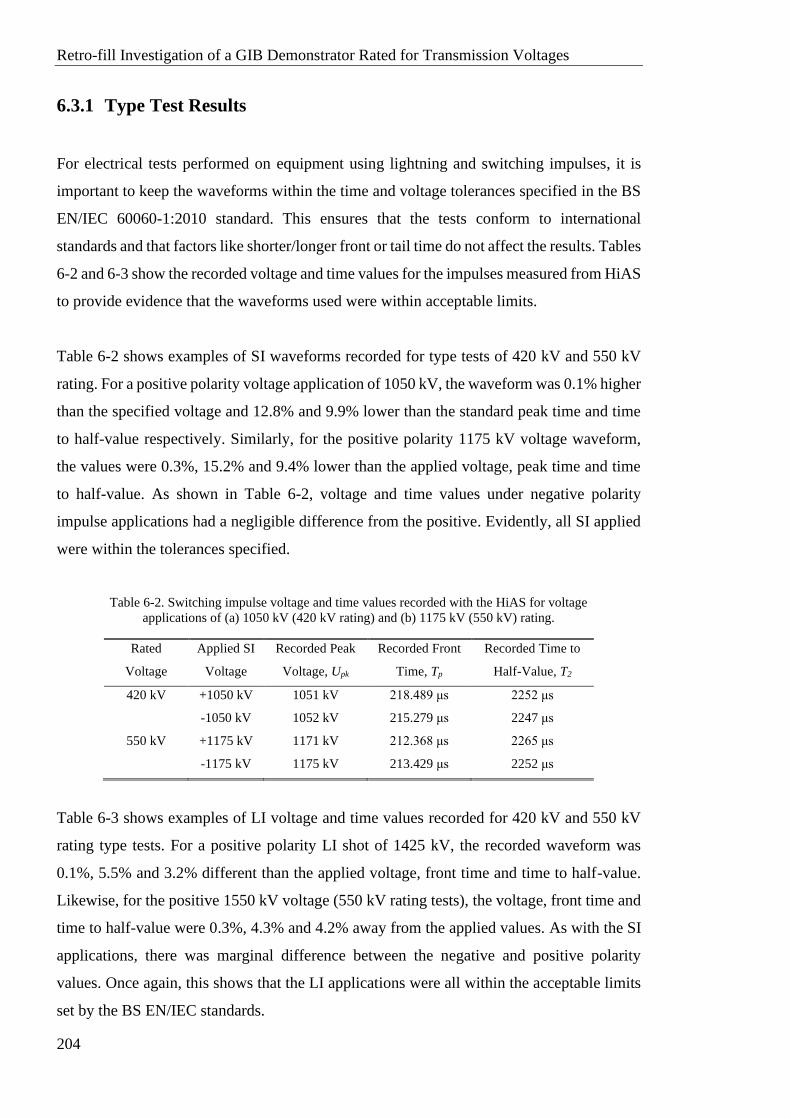
Retro-fill Investigation of a GIB Demonstrator Rated for Transmission Voltages
204
6.3.1 Type Test Results
For electrical tests performed on equipment using lightning and switching impulses, it is
important to keep the waveforms within the time and voltage tolerances specified in the BS
EN/IEC 60060-1:2010 standard. This ensures that the tests conform to international
standards and that factors like shorter/longer front or tail time do not affect the results. Tables
6-2 and 6-3 show the recorded voltage and time values for the impulses measured from HiAS
to provide evidence that the waveforms used were within acceptable limits.
Table 6-2 shows examples of SI waveforms recorded for type tests of 420 kV and 550 kV
rating. For a positive polarity voltage application of 1050 kV, the waveform was 0.1% higher
than the specified voltage and 12.8% and 9.9% lower than the standard peak time and time
to half-value respectively. Similarly, for the positive polarity 1175 kV voltage waveform,
the values were 0.3%, 15.2% and 9.4% lower than the applied voltage, peak time and time
to half-value. As shown in Table 6-2, voltage and time values under negative polarity
impulse applications had a negligible difference from the positive. Evidently, all SI applied
were within the tolerances specified.
Table 6-2. Switching impulse voltage and time values recorded with the HiAS for voltage
applications of (a) 1050 kV (420 kV rating) and (b) 1175 kV (550 kV) rating.
Rated
Voltage
Applied SI
Voltage
Recorded Peak
Voltage, Upk
Recorded Front
Time, Tp
Recorded Time to
Half-Value, T2
420 kV +1050 kV 1051 kV 218.489 μs 2252 μs
-1050 kV 1052 kV 215.279 μs 2247 μs
550 kV +1175 kV 1171 kV 212.368 μs 2265 μs
-1175 kV 1175 kV 213.429 μs 2252 μs
Table 6-3 shows examples of LI voltage and time values recorded for 420 kV and 550 kV
rating type tests. For a positive polarity LI shot of 1425 kV, the recorded waveform was
0.1%, 5.5% and 3.2% different than the applied voltage, front time and time to half-value.
Likewise, for the positive 1550 kV voltage (550 kV rating tests), the voltage, front time and
time to half-value were 0.3%, 4.3% and 4.2% away from the applied values. As with the SI
applications, there was marginal difference between the negative and positive polarity
values. Once again, this shows that the LI applications were all within the acceptable limits
set by the BS EN/IEC standards.
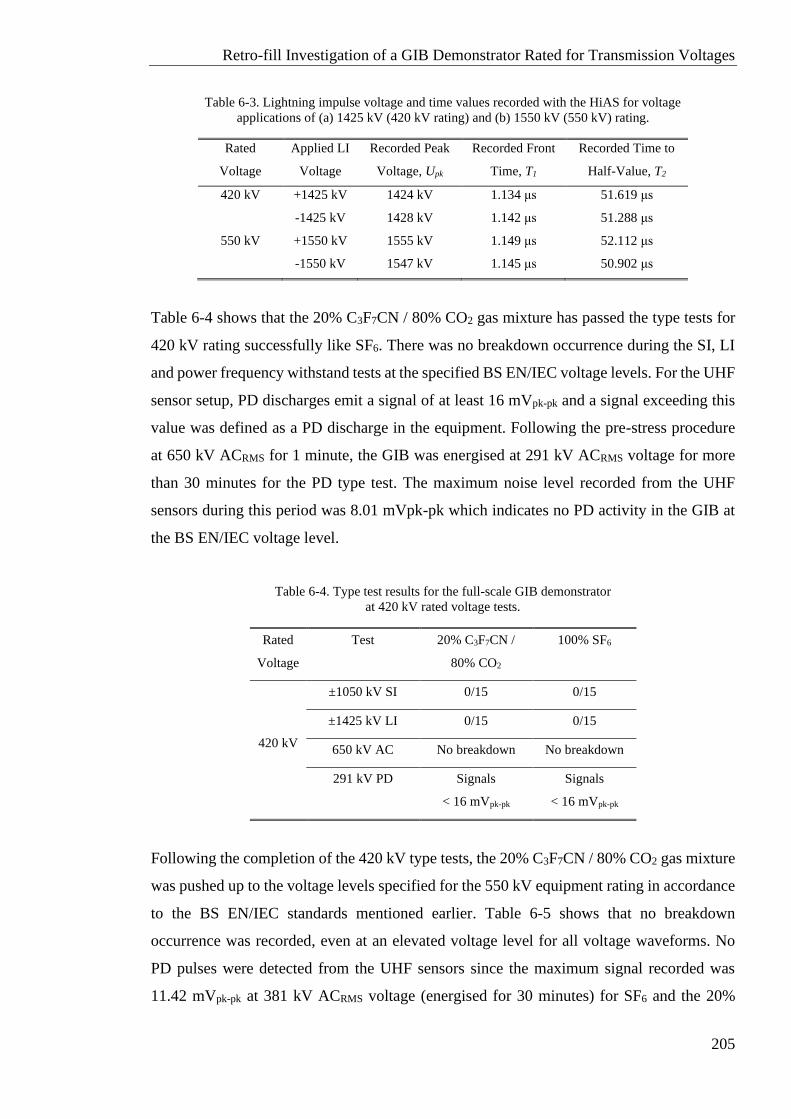
Retro-fill Investigation of a GIB Demonstrator Rated for Transmission Voltages
205
Table 6-3. Lightning impulse voltage and time values recorded with the HiAS for voltage
applications of (a) 1425 kV (420 kV rating) and (b) 1550 kV (550 kV) rating.
Rated
Voltage
Applied LI
Voltage
Recorded Peak
Voltage, Upk
Recorded Front
Time, T1
Recorded Time to
Half-Value, T2
420 kV +1425 kV 1424 kV 1.134 μs 51.619 μs
-1425 kV 1428 kV 1.142 μs 51.288 μs
550 kV +1550 kV 1555 kV 1.149 μs 52.112 μs
-1550 kV 1547 kV 1.145 μs 50.902 μs
Table 6-4 shows that the 20% C3F7CN / 80% CO2 gas mixture has passed the type tests for
420 kV rating successfully like SF6. There was no breakdown occurrence during the SI, LI
and power frequency withstand tests at the specified BS EN/IEC voltage levels. For the UHF
sensor setup, PD discharges emit a signal of at least 16 mVpk-pk and a signal exceeding this
value was defined as a PD discharge in the equipment. Following the pre-stress procedure
at 650 kV ACRMS for 1 minute, the GIB was energised at 291 kV ACRMS voltage for more
than 30 minutes for the PD type test. The maximum noise level recorded from the UHF
sensors during this period was 8.01 mVpk-pk which indicates no PD activity in the GIB at
the BS EN/IEC voltage level.
Table 6-4. Type test results for the full-scale GIB demonstrator
at 420 kV rated voltage tests.
Rated
Voltage
Test 20% C3F7CN /
80% CO2
100% SF6
420 kV
±1050 kV SI 0/15 0/15
±1425 kV LI 0/15 0/15
650 kV AC No breakdown No breakdown
291 kV PD Signals
< 16 mVpk-pk
Signals
< 16 mVpk-pk
Following the completion of the 420 kV type tests, the 20% C3F7CN / 80% CO2 gas mixture
was pushed up to the voltage levels specified for the 550 kV equipment rating in accordance
to the BS EN/IEC standards mentioned earlier. Table 6-5 shows that no breakdown
occurrence was recorded, even at an elevated voltage level for all voltage waveforms. No
PD pulses were detected from the UHF sensors since the maximum signal recorded was
11.42 mVpk-pk at 381 kV ACRMS voltage (energised for 30 minutes) for SF6 and the 20%
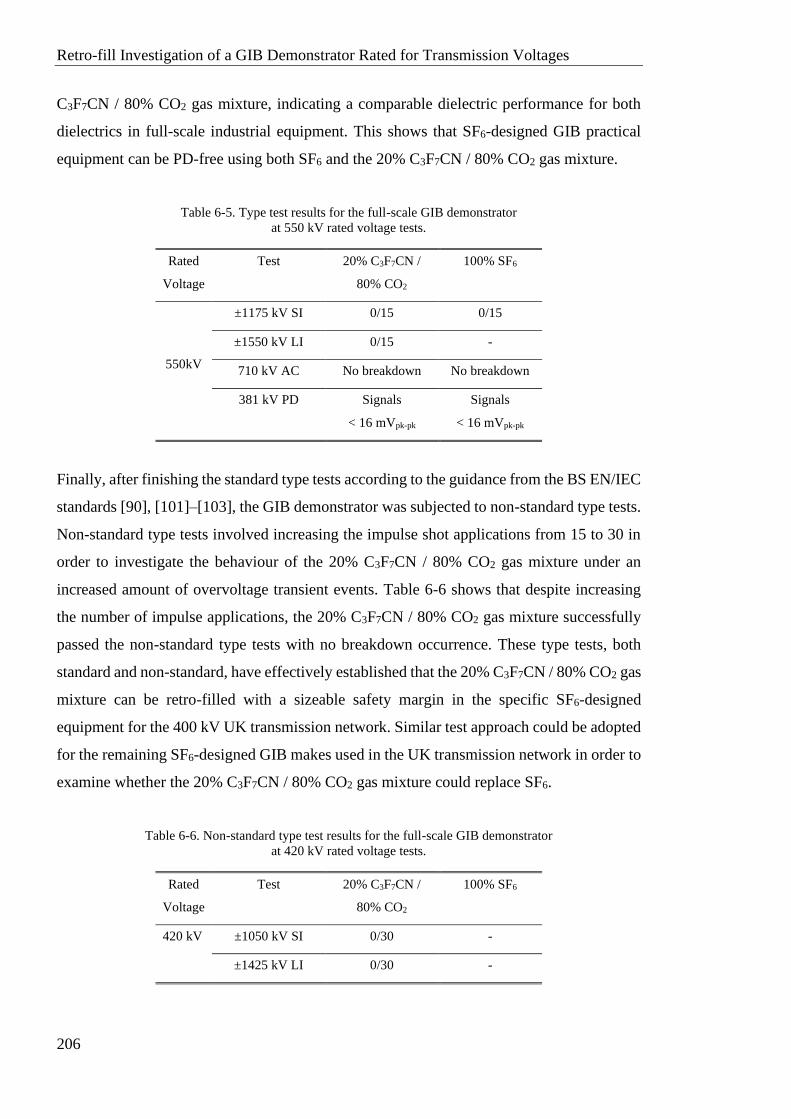
Retro-fill Investigation of a GIB Demonstrator Rated for Transmission Voltages
206
C3F7CN / 80% CO2 gas mixture, indicating a comparable dielectric performance for both
dielectrics in full-scale industrial equipment. This shows that SF6-designed GIB practical
equipment can be PD-free using both SF6 and the 20% C3F7CN / 80% CO2 gas mixture.
Table 6-5. Type test results for the full-scale GIB demonstrator
at 550 kV rated voltage tests.
Rated
Voltage
Test 20% C3F7CN /
80% CO2
100% SF6
550kV
±1175 kV SI 0/15 0/15
±1550 kV LI 0/15 -
710 kV AC No breakdown No breakdown
381 kV PD Signals
< 16 mVpk-pk
Signals
< 16 mVpk-pk
Finally, after finishing the standard type tests according to the guidance from the BS EN/IEC
standards [90], [101]–[103], the GIB demonstrator was subjected to non-standard type tests.
Non-standard type tests involved increasing the impulse shot applications from 15 to 30 in
order to investigate the behaviour of the 20% C3F7CN / 80% CO2 gas mixture under an
increased amount of overvoltage transient events. Table 6-6 shows that despite increasing
the number of impulse applications, the 20% C3F7CN / 80% CO2 gas mixture successfully
passed the non-standard type tests with no breakdown occurrence. These type tests, both
standard and non-standard, have effectively established that the 20% C3F7CN / 80% CO2 gas
mixture can be retro-filled with a sizeable safety margin in the specific SF6-designed
equipment for the 400 kV UK transmission network. Similar test approach could be adopted
for the remaining SF6-designed GIB makes used in the UK transmission network in order to
examine whether the 20% C3F7CN / 80% CO2 gas mixture could replace SF6.
Table 6-6. Non-standard type test results for the full-scale GIB demonstrator
at 420 kV rated voltage tests.
Rated
Voltage
Test 20% C3F7CN /
80% CO2
100% SF6
420 kV ±1050 kV SI 0/30 -
±1425 kV LI 0/30 -
Retro-fill Investigation of a GIB Demonstrator Rated for Transmission Voltages
207
6.3.2 Material Compatibility of Gaskets
C3F7CN gas compatibility with the O-ring material was evaluated by 3M using a sample of
an EPDM elastomer used in the existing GIL/GIB [104]. A small sample of the EPDM
elastomer was placed into a dried 50 mL glass vial and sealed with a PTFE-lined septum cap
as shown in Figure 6-6.
Figure 6-6. EPDM elastomer sample tested for compatibility with C3F7CN gas.
An approximate 27% C3F7CN mixture in air was created by adding 0.1122 g of C3F7CN to
this vial. The test sample was placed in an oven for more than 3 months. The oven was
operating at 105°C which according to [12], [101] is the maximum operating temperature
SF6 can be exposed to within a GIL/GIB configuration. The conditions for the material
compatibility test are shown in Table 6-7.
Table 6-7. Material compatibility test conditions.
O-ring Material EPDM
Gas Concentration 27% C3F7CN mixed in air
Operating Temperature 105°C
Duration 112 days
Analysis Method Gas Chromatography (GC)
The purity of C3F7CN was assessed by extracting 100 µL samples from the vial using a gas-
tight syringe. The samples were analysed using gas chromatography (GC). The purity results
of the gas corresponding to the time interval taken after the placement of the sample in the
oven are shown in Table 6-8. Table 6-8 illustrates that the purity of the gas is not affected
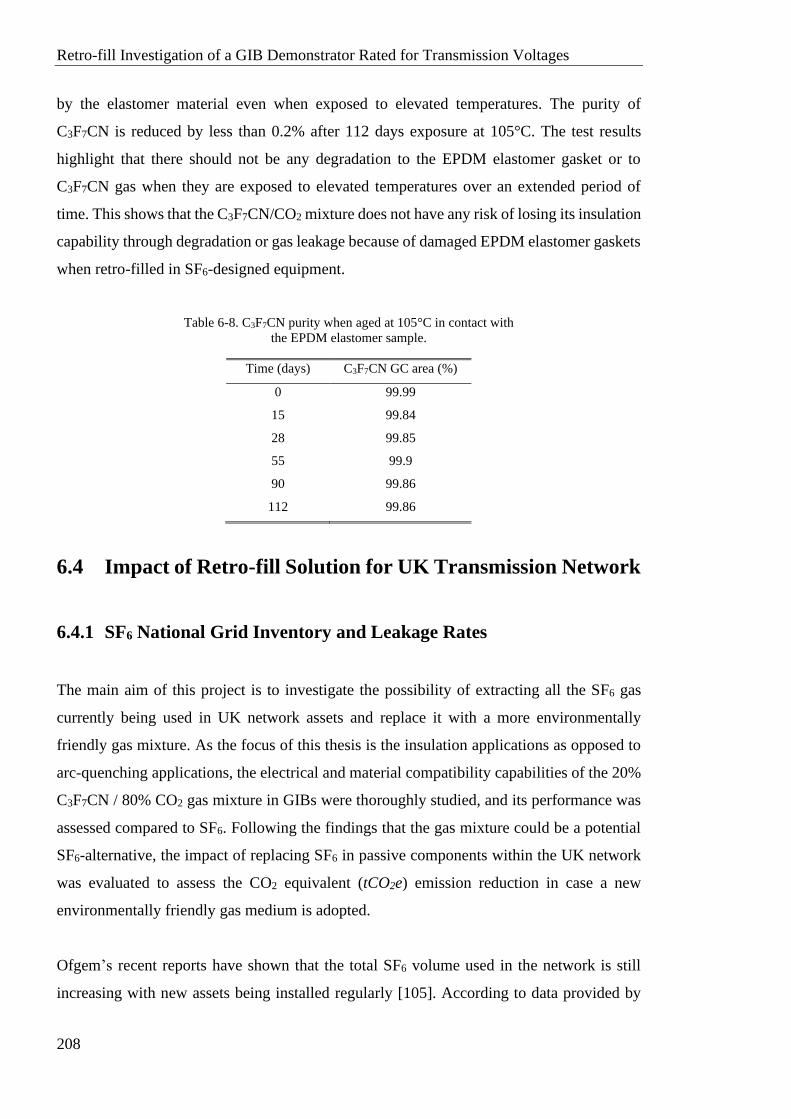
Retro-fill Investigation of a GIB Demonstrator Rated for Transmission Voltages
208
by the elastomer material even when exposed to elevated temperatures. The purity of
C3F7CN is reduced by less than 0.2% after 112 days exposure at 105°C. The test results
highlight that there should not be any degradation to the EPDM elastomer gasket or to
C3F7CN gas when they are exposed to elevated temperatures over an extended period of
time. This shows that the C3F7CN/CO2 mixture does not have any risk of losing its insulation
capability through degradation or gas leakage because of damaged EPDM elastomer gaskets
when retro-filled in SF6-designed equipment.
Table 6-8. C3F7CN purity when aged at 105°C in contact with
the EPDM elastomer sample.
Time (days) C3F7CN GC area (%)
0 99.99
15 99.84
28 99.85
55 99.9
90 99.86
112 99.86
6.4 Impact of Retro-fill Solution for UK Transmission Network
6.4.1 SF6 National Grid Inventory and Leakage Rates
The main aim of this project is to investigate the possibility of extracting all the SF6 gas
currently being used in UK network assets and replace it with a more environmentally
friendly gas mixture. As the focus of this thesis is the insulation applications as opposed to
arc-quenching applications, the electrical and material compatibility capabilities of the 20%
C3F7CN / 80% CO2 gas mixture in GIBs were thoroughly studied, and its performance was
assessed compared to SF6. Following the findings that the gas mixture could be a potential
SF6-alternative, the impact of replacing SF6 in passive components within the UK network
was evaluated to assess the CO2 equivalent (tCO2e) emission reduction in case a new
environmentally friendly gas medium is adopted.
Ofgem’s recent reports have shown that the total SF6 volume used in the network is still
increasing with new assets being installed regularly [105]. According to data provided by
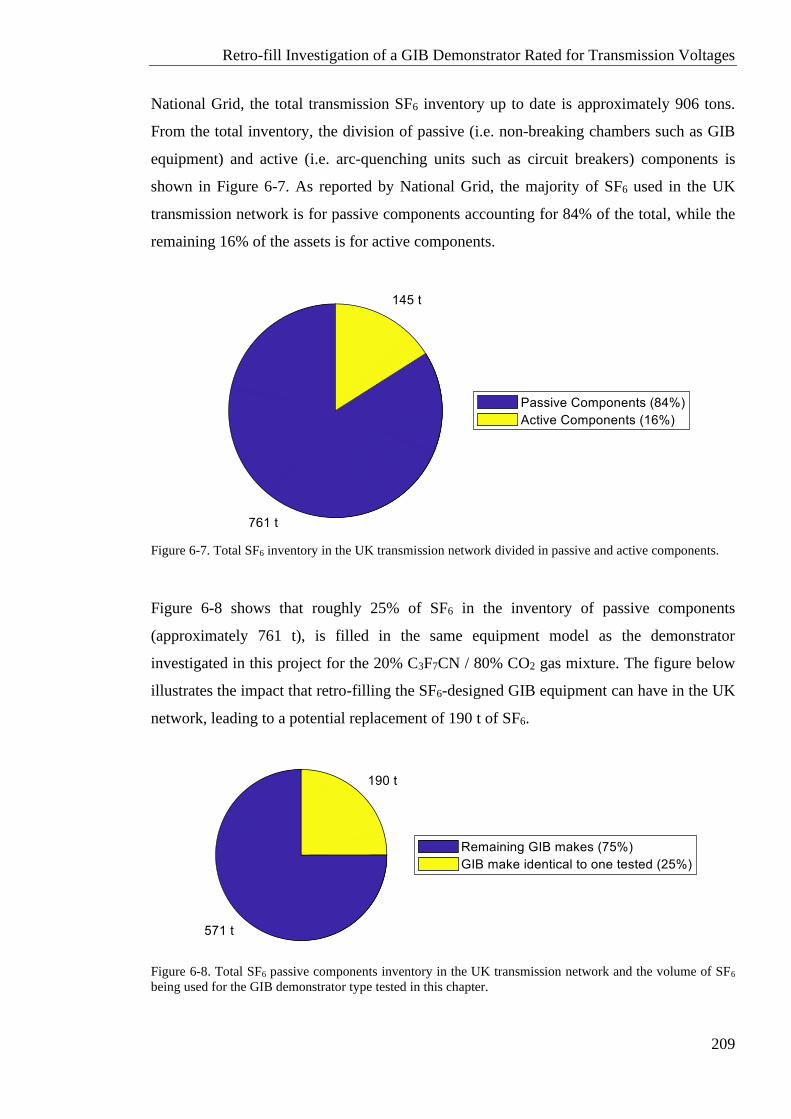
Retro-fill Investigation of a GIB Demonstrator Rated for Transmission Voltages
209
National Grid, the total transmission SF6 inventory up to date is approximately 906 tons.
From the total inventory, the division of passive (i.e. non-breaking chambers such as GIB
equipment) and active (i.e. arc-quenching units such as circuit breakers) components is
shown in Figure 6-7. As reported by National Grid, the majority of SF6 used in the UK
transmission network is for passive components accounting for 84% of the total, while the
remaining 16% of the assets is for active components.
Figure 6-7. Total SF6 inventory in the UK transmission network divided in passive and active components.
Figure 6-8 shows that roughly 25% of SF6 in the inventory of passive components
(approximately 761 t), is filled in the same equipment model as the demonstrator
investigated in this project for the 20% C3F7CN / 80% CO2 gas mixture. The figure below
illustrates the impact that retro-filling the SF6-designed GIB equipment can have in the UK
network, leading to a potential replacement of 190 t of SF6.
Figure 6-8. Total SF6 passive components inventory in the UK transmission network and the volume of SF6
being used for the GIB demonstrator type tested in this chapter.
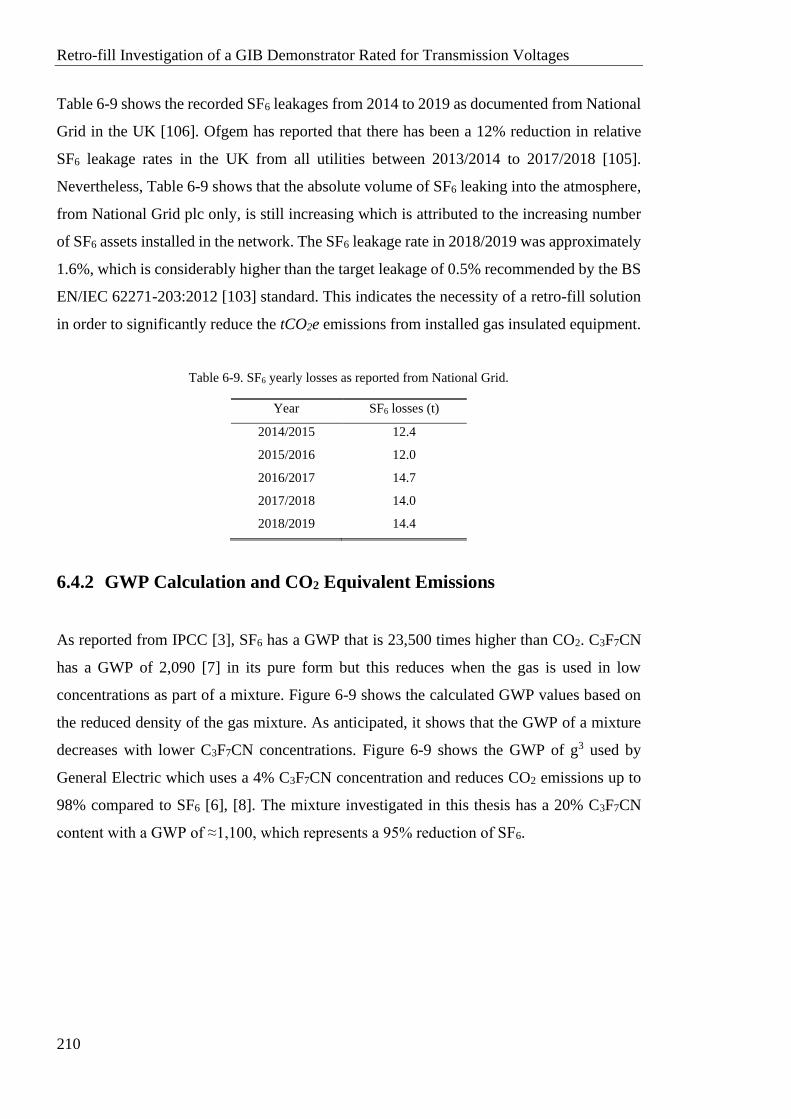
Retro-fill Investigation of a GIB Demonstrator Rated for Transmission Voltages
210
Table 6-9 shows the recorded SF6 leakages from 2014 to 2019 as documented from National
Grid in the UK [106]. Ofgem has reported that there has been a 12% reduction in relative
SF6 leakage rates in the UK from all utilities between 2013/2014 to 2017/2018 [105].
Nevertheless, Table 6-9 shows that the absolute volume of SF6 leaking into the atmosphere,
from National Grid plc only, is still increasing which is attributed to the increasing number
of SF6 assets installed in the network. The SF6 leakage rate in 2018/2019 was approximately
1.6%, which is considerably higher than the target leakage of 0.5% recommended by the BS
EN/IEC 62271-203:2012 [103] standard. This indicates the necessity of a retro-fill solution
in order to significantly reduce the tCO2e emissions from installed gas insulated equipment.
Table 6-9. SF6 yearly losses as reported from National Grid.
Year SF6 losses (t)
2014/2015 12.4
2015/2016 12.0
2016/2017 14.7
2017/2018 14.0
2018/2019 14.4
6.4.2 GWP Calculation and CO2 Equivalent Emissions
As reported from IPCC [3], SF6 has a GWP that is 23,500 times higher than CO2. C3F7CN
has a GWP of 2,090 [7] in its pure form but this reduces when the gas is used in low
concentrations as part of a mixture. Figure 6-9 shows the calculated GWP values based on
the reduced density of the gas mixture. As anticipated, it shows that the GWP of a mixture
decreases with lower C3F7CN concentrations. Figure 6-9 shows the GWP of g3 used by
General Electric which uses a 4% C3F7CN concentration and reduces CO2 emissions up to
98% compared to SF6 [6], [8]. The mixture investigated in this thesis has a 20% C3F7CN
content with a GWP of ≈1,100, which represents a 95% reduction of SF6.
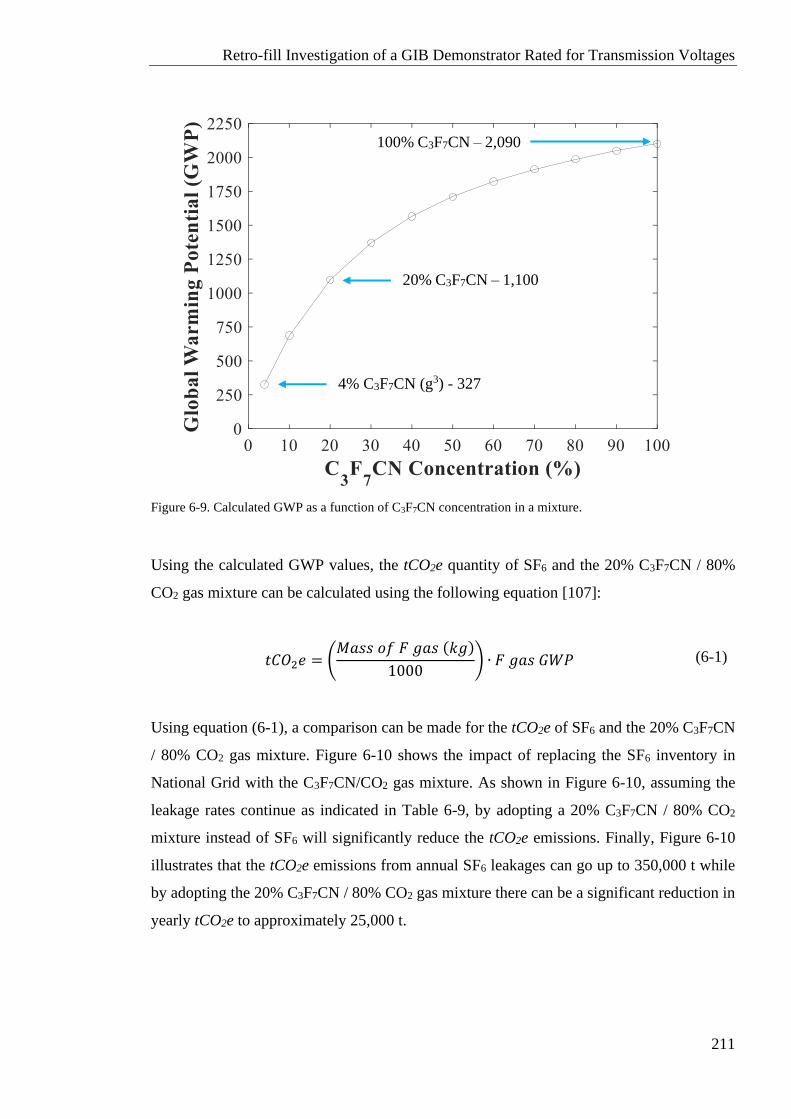
Retro-fill Investigation of a GIB Demonstrator Rated for Transmission Voltages
211
Figure 6-9. Calculated GWP as a function of C3F7CN concentration in a mixture.
Using the calculated GWP values, the tCO2e quantity of SF6 and the 20% C3F7CN / 80%
CO2 gas mixture can be calculated using the following equation [107]:
𝑡𝐶𝑂2𝑒 = (𝑀𝑎𝑠𝑠 𝑜𝑓 𝐹 𝑔𝑎𝑠 (𝑘𝑔)
1000) ∙ 𝐹 𝑔𝑎𝑠 𝐺𝑊𝑃
(6-1)
Using equation (6-1), a comparison can be made for the tCO2e of SF6 and the 20% C3F7CN
/ 80% CO2 gas mixture. Figure 6-10 shows the impact of replacing the SF6 inventory in
National Grid with the C3F7CN/CO2 gas mixture. As shown in Figure 6-10, assuming the
leakage rates continue as indicated in Table 6-9, by adopting a 20% C3F7CN / 80% CO2
mixture instead of SF6 will significantly reduce the tCO2e emissions. Finally, Figure 6-10
illustrates that the tCO2e emissions from annual SF6 leakages can go up to 350,000 t while
by adopting the 20% C3F7CN / 80% CO2 gas mixture there can be a significant reduction in
yearly tCO2e to approximately 25,000 t.
4% C3F7CN (g3) - 327
20% C3F7CN – 1,100
100% C3F7CN – 2,090
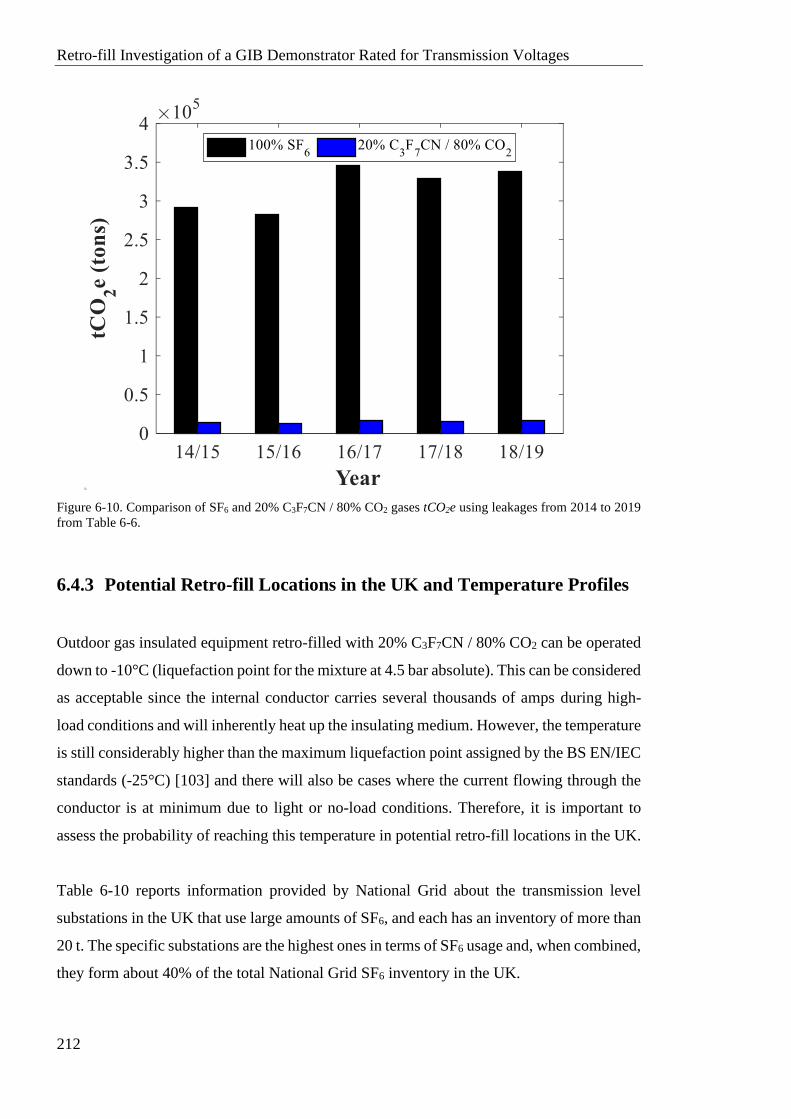
Retro-fill Investigation of a GIB Demonstrator Rated for Transmission Voltages
212
Figure 6-10. Comparison of SF6 and 20% C3F7CN / 80% CO2 gases tCO2e using leakages from 2014 to 2019
from Table 6-6.
6.4.3 Potential Retro-fill Locations in the UK and Temperature Profiles
Outdoor gas insulated equipment retro-filled with 20% C3F7CN / 80% CO2 can be operated
down to -10°C (liquefaction point for the mixture at 4.5 bar absolute). This can be considered
as acceptable since the internal conductor carries several thousands of amps during high-
load conditions and will inherently heat up the insulating medium. However, the temperature
is still considerably higher than the maximum liquefaction point assigned by the BS EN/IEC
standards (-25°C) [103] and there will also be cases where the current flowing through the
conductor is at minimum due to light or no-load conditions. Therefore, it is important to
assess the probability of reaching this temperature in potential retro-fill locations in the UK.
Table 6-10 reports information provided by National Grid about the transmission level
substations in the UK that use large amounts of SF6, and each has an inventory of more than
20 t. The specific substations are the highest ones in terms of SF6 usage and, when combined,
they form about 40% of the total National Grid SF6 inventory in the UK.
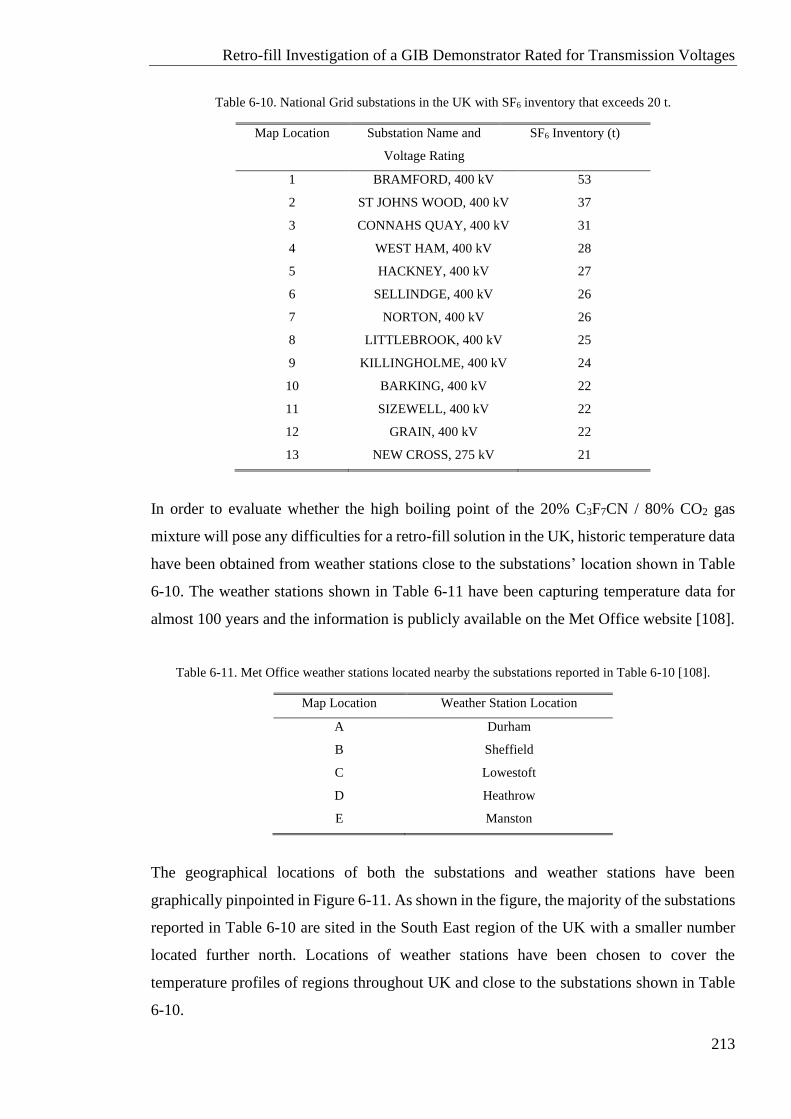
Retro-fill Investigation of a GIB Demonstrator Rated for Transmission Voltages
213
Table 6-10. National Grid substations in the UK with SF6 inventory that exceeds 20 t.
Map Location Substation Name and
Voltage Rating
SF6 Inventory (t)
1 BRAMFORD, 400 kV 53
2 ST JOHNS WOOD, 400 kV 37
3 CONNAHS QUAY, 400 kV 31
4 WEST HAM, 400 kV 28
5 HACKNEY, 400 kV 27
6 SELLINDGE, 400 kV 26
7 NORTON, 400 kV 26
8 LITTLEBROOK, 400 kV 25
9 KILLINGHOLME, 400 kV 24
10 BARKING, 400 kV 22
11 SIZEWELL, 400 kV 22
12 GRAIN, 400 kV 22
13 NEW CROSS, 275 kV 21
In order to evaluate whether the high boiling point of the 20% C3F7CN / 80% CO2 gas
mixture will pose any difficulties for a retro-fill solution in the UK, historic temperature data
have been obtained from weather stations close to the substations’ location shown in Table
6-10. The weather stations shown in Table 6-11 have been capturing temperature data for
almost 100 years and the information is publicly available on the Met Office website [108].
Table 6-11. Met Office weather stations located nearby the substations reported in Table 6-10 [108].
Map Location Weather Station Location
A Durham
B Sheffield
C Lowestoft
D Heathrow
E Manston
The geographical locations of both the substations and weather stations have been
graphically pinpointed in Figure 6-11. As shown in the figure, the majority of the substations
reported in Table 6-10 are sited in the South East region of the UK with a smaller number
located further north. Locations of weather stations have been chosen to cover the
temperature profiles of regions throughout UK and close to the substations shown in Table
6-10.
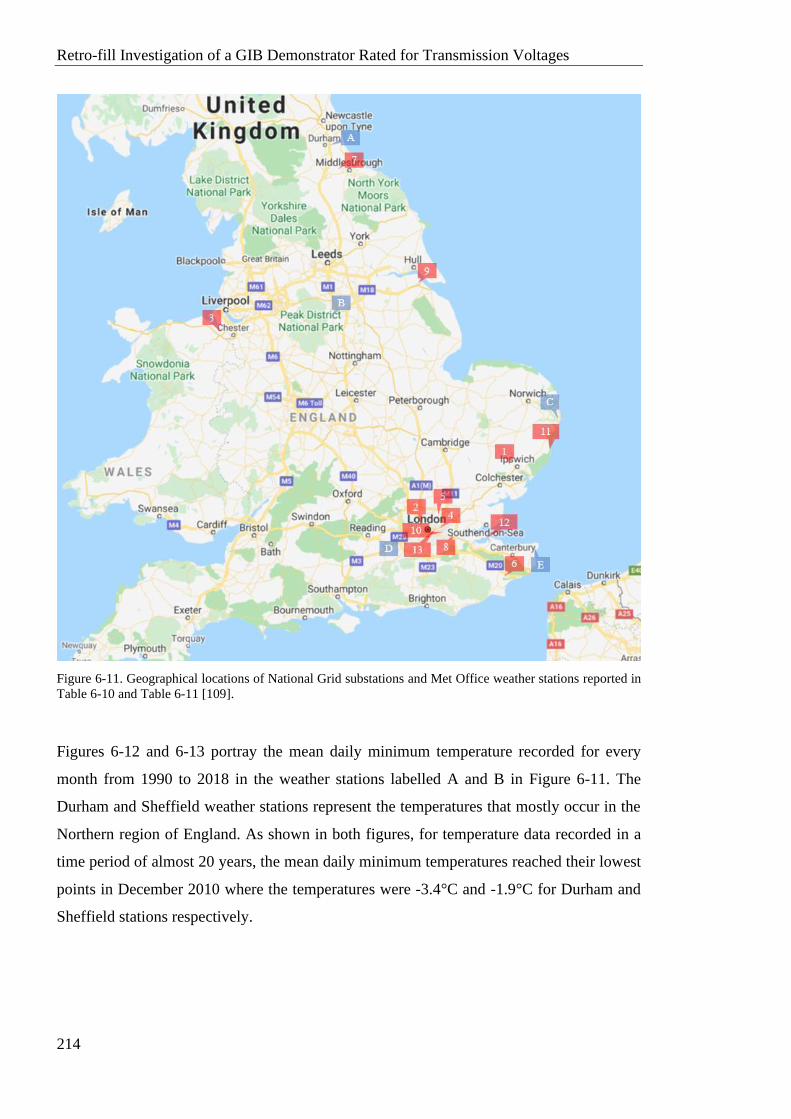
Retro-fill Investigation of a GIB Demonstrator Rated for Transmission Voltages
214
Figure 6-11. Geographical locations of National Grid substations and Met Office weather stations reported in
Table 6-10 and Table 6-11 [109].
Figures 6-12 and 6-13 portray the mean daily minimum temperature recorded for every
month from 1990 to 2018 in the weather stations labelled A and B in Figure 6-11. The
Durham and Sheffield weather stations represent the temperatures that mostly occur in the
Northern region of England. As shown in both figures, for temperature data recorded in a
time period of almost 20 years, the mean daily minimum temperatures reached their lowest
points in December 2010 where the temperatures were -3.4°C and -1.9°C for Durham and
Sheffield stations respectively.
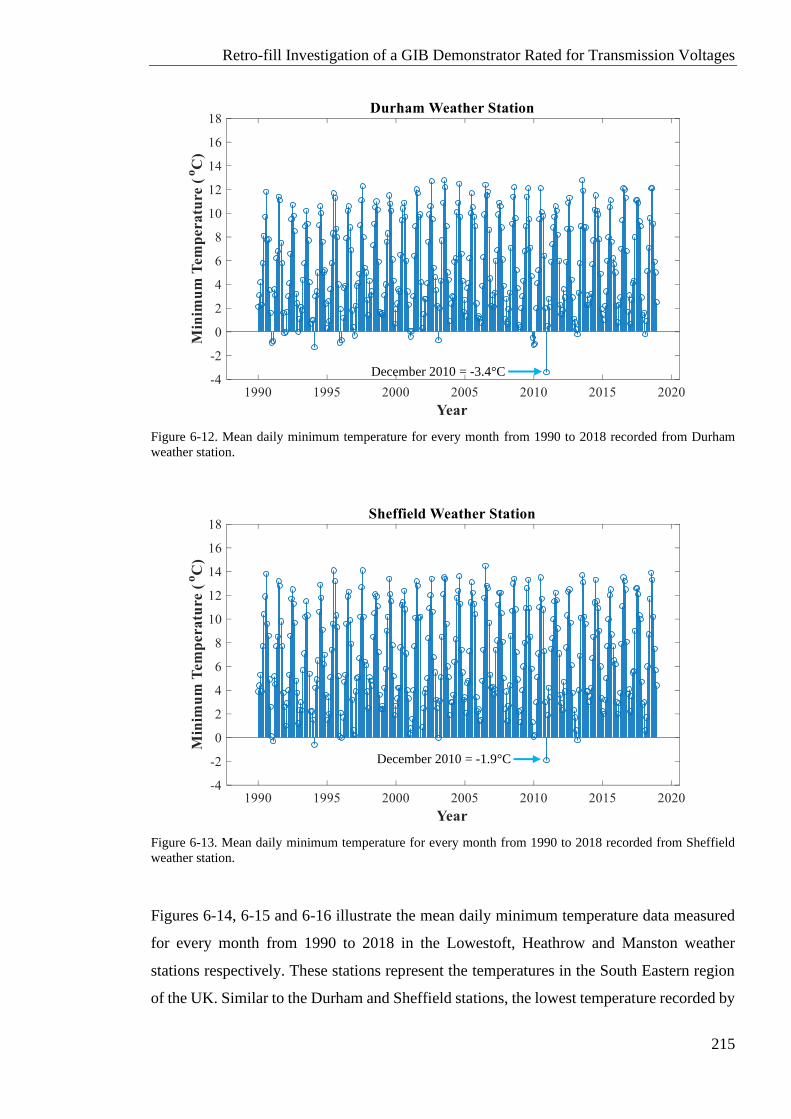
Retro-fill Investigation of a GIB Demonstrator Rated for Transmission Voltages
215
Figure 6-12. Mean daily minimum temperature for every month from 1990 to 2018 recorded from Durham
weather station.
Figure 6-13. Mean daily minimum temperature for every month from 1990 to 2018 recorded from Sheffield
weather station.
Figures 6-14, 6-15 and 6-16 illustrate the mean daily minimum temperature data measured
for every month from 1990 to 2018 in the Lowestoft, Heathrow and Manston weather
stations respectively. These stations represent the temperatures in the South Eastern region
of the UK. Similar to the Durham and Sheffield stations, the lowest temperature recorded by
December 2010 = -3.4°C
December 2010 = -1.9°C
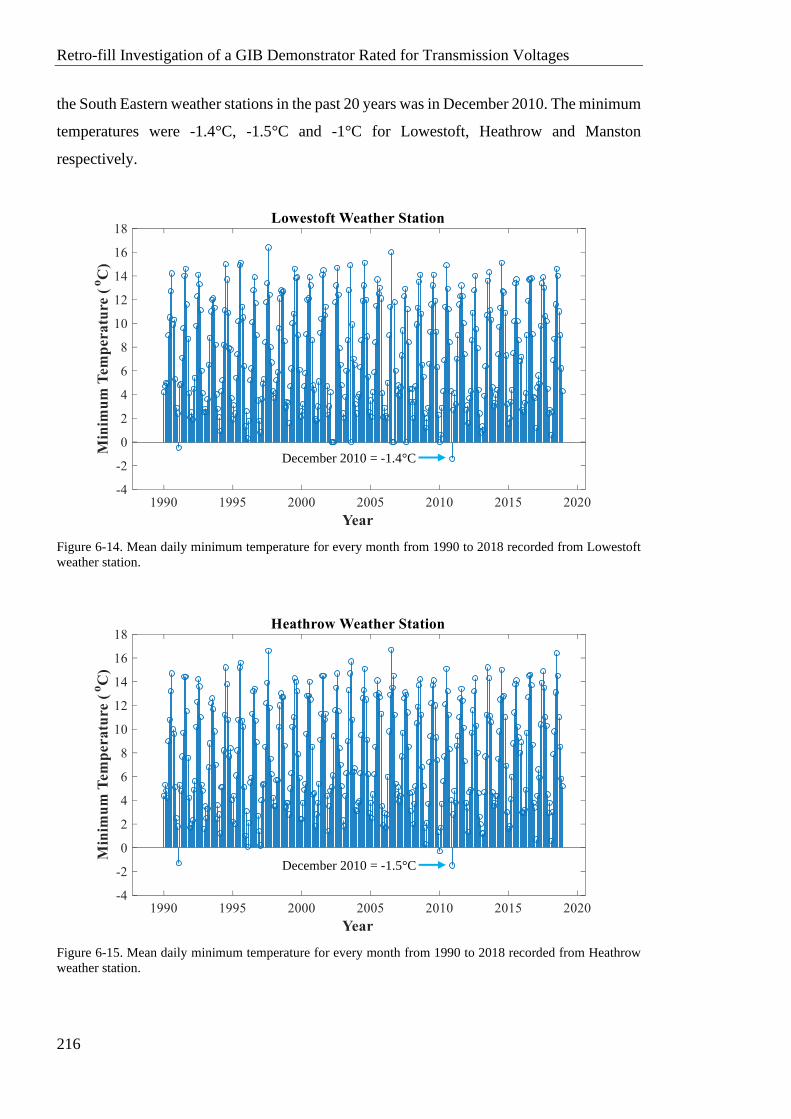
Retro-fill Investigation of a GIB Demonstrator Rated for Transmission Voltages
216
the South Eastern weather stations in the past 20 years was in December 2010. The minimum
temperatures were -1.4°C, -1.5°C and -1°C for Lowestoft, Heathrow and Manston
respectively.
Figure 6-14. Mean daily minimum temperature for every month from 1990 to 2018 recorded from Lowestoft
weather station.
Figure 6-15. Mean daily minimum temperature for every month from 1990 to 2018 recorded from Heathrow
weather station.
December 2010 = -1.4°C
December 2010 = -1.5°C
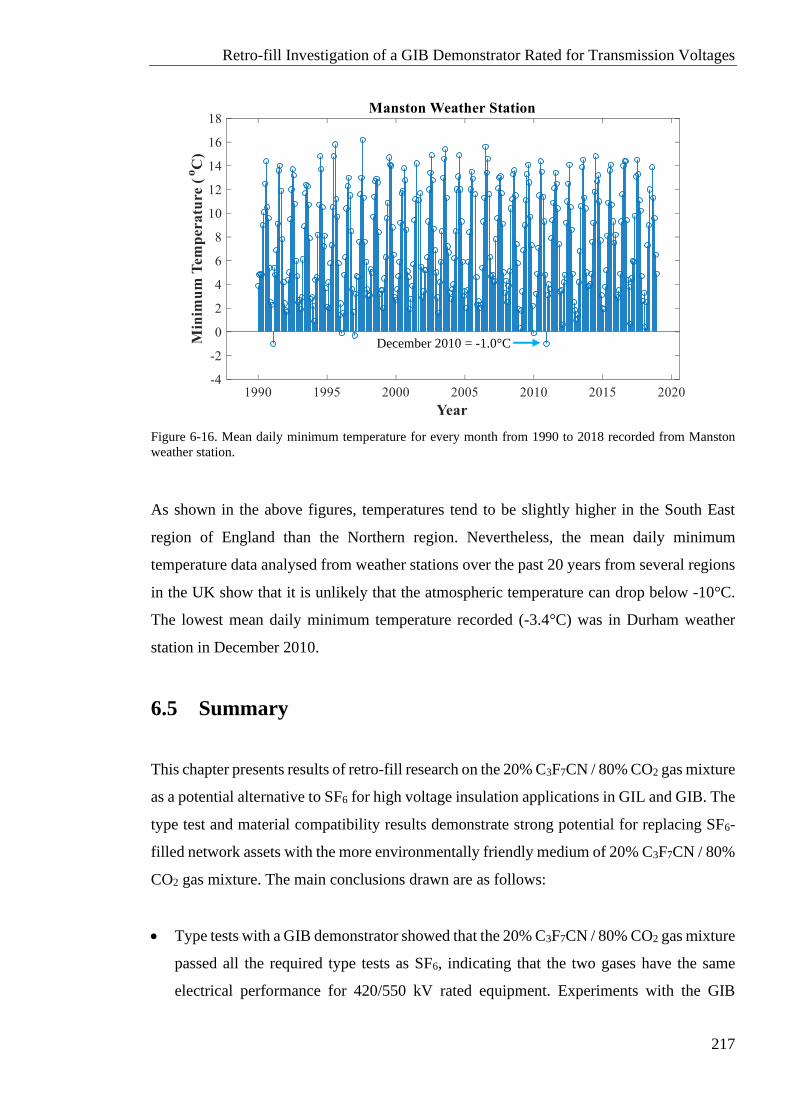
Retro-fill Investigation of a GIB Demonstrator Rated for Transmission Voltages
217
Figure 6-16. Mean daily minimum temperature for every month from 1990 to 2018 recorded from Manston
weather station.
As shown in the above figures, temperatures tend to be slightly higher in the South East
region of England than the Northern region. Nevertheless, the mean daily minimum
temperature data analysed from weather stations over the past 20 years from several regions
in the UK show that it is unlikely that the atmospheric temperature can drop below -10°C.
The lowest mean daily minimum temperature recorded (-3.4°C) was in Durham weather
station in December 2010.
6.5 Summary
This chapter presents results of retro-fill research on the 20% C3F7CN / 80% CO2 gas mixture
as a potential alternative to SF6 for high voltage insulation applications in GIL and GIB. The
type test and material compatibility results demonstrate strong potential for replacing SF6-
filled network assets with the more environmentally friendly medium of 20% C3F7CN / 80%
CO2 gas mixture. The main conclusions drawn are as follows:
• Type tests with a GIB demonstrator showed that the 20% C3F7CN / 80% CO2 gas mixture
passed all the required type tests as SF6, indicating that the two gases have the same
electrical performance for 420/550 kV rated equipment. Experiments with the GIB
December 2010 = -1.0°C
Retro-fill Investigation of a GIB Demonstrator Rated for Transmission Voltages
218
demonstrator were further extended with non-standard type tests which involved
increasing the SI and LI applications and in turn the failure probability. No breakdown
occurrence was recorded for the 20% C3F7CN / 80% CO2 gas mixture which establishes
a level of confidence for its dielectric performance when retro-filled in SF6-designed
equipment.
• A material compatibility test showed no clear sign of C3F7CN purity degradation when
in contact with a common gasket material EPDM elastomer and subjected to the
maximum operating temperature of GIL/GIB practical equipment. This shows that the
20% C3F7CN / 80% CO2 gas mixture could maintain its purity under extreme operating
conditions in the long term when retro-filled in SF6-designed GIL/GIB equipment.
• The use of a 20% C3F7CN / 80% CO2 gas mixture at 4.5 bar (abs) with a -10°C
liquefaction temperature can be considered as a potential retro-fill solution for SF6-
designed equipment installed in the UK network and can achieve a potential tCO2e
reduction of up to 95% when compared to SF6.
• The retro-fill of 20% C3F7CN / 80% CO2 gas mixture in SF6-designed GIB models
identical to the one tested in this chapter can lead to the replacement of 190 t of SF6 in
the UK transmission network. Similar research approach can be adopted to address the
remaining 571 t of passive components in the UK transmission inventory.
• The main limitation of the gas mixture is the liquefaction point of -10°C which is higher
than the BS EN/IEC defined level of -25°C. However, through investigation of the mean
daily minimum temperature profiles from relevant substation locations in the UK over
the past 20 years, it was found that it is very rare that the atmospheric temperature can
go down to -10°C. The lowest mean daily minimum temperature recorded in the past 20
years in the UK, from weather stations located close to National Grid substations with
the largest SF6 inventory (specified in Table 6-10), is -3.4°C in December 2010 at
Durham station.
Conclusions and Future Work
219
Chapter 7 Conclusions and Future Work
7.1 Research Aim and Objectives
Research about finding a viable SF6-alternative has intensified over the past few years with
several gas candidates being investigated. The main aim of this study was to investigate the
possibility of adopting a suitable C3F7CN/CO2 gas mixture as a retro-fill solution in existing
SF6-designed GIL/GIB assets at transmission voltage levels in the power network. The quest
of finding the ideal SF6 replacement focuses on reducing the overall carbon emissions arising
from using one of the most potent greenhouse gases as an insulation material in the power
industry. However, most SF6-alternative gases come with a major drawback, such as low
dielectric strength, high GWP, high toxicity or high boiling point which prevents a like-for-
like replacement for SF6 in high voltage equipment. This thesis evaluated the feasibility of
the 20% C3F7CN / 80% CO2 gas mixture being used as a SF6 replacement by addressing the
following key points:
1. Breakdown strength assessment of C3F7CN/CO2 gas mixtures compared to SF6 and
identification of the ideal C3F7CN/CO2 concentration ratio which has a comparable
electrical performance to SF6 gas under GIL/GIB representative electric fields.
2. PD characteristics evaluation for the 20% C3F7CN / 80% CO2 gas mixture and SF6
to examine how the gas mixture performs in suppressing PD activities with the
presence of protrusions causing microscopic electric field enhancements within the
equipment.
3. Type test performance investigation of the 20% C3F7CN / 80% CO2 gas mixture
compared to SF6 when retro-filled in full-scale 420/550 kV GIB equipment and
subjected to BS EN/IEC defined electrical type tests. Tests were also performed for
elastomers currently being used in GIL/GIB equipment in order to examine whether
the SF6-alternative gas is compatible and does not deteriorate when in contact with
the existing materials in assets.
4. Limitation analysis of the solution and the impact of a retro-fill adoption to the
carbon emissions reduction in the UK power network.
Conclusions and Future Work
220
7.2 Summary of Results and Research Findings
7.2.1 Breakdown Characteristics
The breakdown characteristics of CO2 gas and two C3F7CN/CO2 gas mixtures were
compared to SF6 gas under weakly non-uniform electric fields tested under LI and AC
voltages. The two C3F7CN/CO2 gas mixtures were compared to SF6 using a coaxial electrode
configuration which represents a quasi-uniform field as found in GIL/GIB equipment. Out
of the two gas mixtures, 20% C3F7CN / 80% CO2 was found to be a more technically viable
SF6-alternative with a comparable breakdown performance to SF6. The 16% C3F7CN / 84%
CO2 gas mixture was found to have a slightly lower breakdown performance but with the
benefit of an additional 5°C margin to the liquefaction point when compared to the 20%
C3F7CN / 80% CO2 gas mixture.
The 20% C3F7CN / 80% CO2 gas mixture and CO2 gas were then compared to pure SF6
using coaxial and hemispherical rod-plane electrode configurations with a more non-uniform
fields under LI voltages. The results demonstrated that CO2 has half the breakdown voltage
in comparison to 20% C3F7CN / 80% CO2 mixture and SF6 gas, which demonstrates the
significant insulation improvement by the addition of C3F7CN content in the gas mixture. It
was also found that, under positive LI polarity, the breakdown voltage of SF6 was
consistently higher than the 20% C3F7CN / 80% CO2 gas mixture. In the case of negative LI
polarity, the performance of the 20% C3F7CN / 80% CO2 mixture was more comparable to
SF6.
Finally, the LI polarity influence on the breakdown voltage of different gas mixtures was
evaluated using the coaxial and hemispherical rod-plane electrode configurations. Under the
category of weakly non-uniform electric fields, which is described by f values between 0.28
to 0.66 in this thesis, the negative LI breakdown voltages were consistently lower than their
positive counterparts. In addition to field uniformity, gas type and pressure were also found
to affect the breakdown voltage for different LI polarities. The difference of breakdown
voltages between positive and negative polarities was found to be larger in SF6 than in the
20% C3F7CN / 80% CO2 gas mixture and CO2. At 1 bar (abs), the polarity effect was not as
prominent as in higher pressures with the breakdown voltages being similar under both
Conclusions and Future Work
221
polarities. Nevertheless, the negative polarity was found to be more critical and have a higher
probability to cause a breakdown within this field uniformity category, which should be
taken into consideration for future design of gas insulated equipment.
7.2.2 Partial Discharge Characteristics
The PD characteristics of SF6 gas and the 20% C3F7CN / 80% CO2 gas mixture were
compared under divergent and highly divergent electric fields (defined in Chapter 3) using
UHF sensors. Two electrode configurations, namely hemispherical rod-plane and plane-
plane with different needle lengths were used to vary the electric field uniformity and initiate
PD activity. SF6 has shown to have comparatively higher PDIV/EV values than the 20%
C3F7CN / 80% CO2 gas mixture under highly divergent fields caused by using a 15 mm
needle. The difference in PDIV/EV values between the two gases reduced using a 5 mm
needle length. In fact, the PDIV/EV values of the 20% C3F7CN / 80% CO2 gas mixture
exceeded SF6 when a plane-plane configuration was used with a 5 mm needle attached on
the HV electrode. This indicates that with the presence of microscopic irregularities on the
HV conductor resulting in localised field enhancements in a high-pressure environment like
in GIL/GIB equipment, the 20% C3F7CN / 80% CO2 gas mixture has the potential to
suppress PD activities as effectively as SF6.
SF6 and the 20% C3F7CN / 80% CO2 gas mixture were also observed to behave differently
in their PRPD patterns. The 20% C3F7CN / 80% CO2 gas mixture has shown to be
significantly affected by different pressures/densities, voltage magnitude and field
uniformities which is the opposite to SF6. Using a needle on the HV electrode, SF6 appeared
to have most of its PD activity in the positive half-cycle of the AC waveform with some PD
activities in the negative half-cycle at higher voltages. In contrast, the 20% C3F7CN / 80%
CO2 gas mixture appeared to go through a 3-phase transition stage in its PRPD patterns
where the PD activity started on the negative half-cycle and shifted to the positive. As was
shown in Chapter 5, pressure/density, voltage magnitude and field uniformity can all affect
the transition phase in the PRPD pattern of the 20% C3F7CN / 80% CO2 gas mixture and this
could be due to the combination of a strongly and weakly attaching gas as opposed to SF6
which is a strongly attaching gas.
Conclusions and Future Work
222
7.2.3 Type Tests and Material Compatibility Analyses
The 20% C3F7CN / 80% CO2 gas mixture was retro-filled and type tested in a 420/550 kV,
SF6-designed GIB demonstrator following the voltage levels specified by the BS EN/IEC
standards. The C3F7CN/CO2 gas mixture passed the LI, SI, AC and PD type tests, which
indicate a comparable performance to SF6 in a full-scale SF6-designed GIL/GIB equipment.
The type tests for the GIB demonstrator involved subjecting it to standard and non-standard
type tests, for both 420 kV and 550 kV equipment ratings, where no breakdown event or PD
activity was observed for the 20% C3F7CN / 80% CO2 gas mixture.
A material compatibility test took place by exposing a sample of the EPDM elastomer
material as found in the GIB equipment to C3F7CN gas. The sample was placed in an oven
for more than 3 months at a temperature of 105°C, which is the maximum temperature in
practical GIL/GIB equipment in accordance to BS EN/IEC standards. The measured results
show that there is no noticeable sign of degradation for C3F7CN over a 3-month exposure at
elevated temperatures. This is a strong indication that the C3F7CN/CO2 gas mixture not only
can maintain its insulation capability, but also pose little risk of leakage due to damaged O-
rings when used as a retro-fill solution in SF6-degined equipment.
7.2.4 Environmental Assessment
The impact of a retro-fill solution with the 20% C3F7CN / 80% CO2 gas mixture in SF6-
designed equipment in the UK network was evaluated. As this thesis focuses more on passive
components, such as GIB and GIL, it was important to quantify the SF6-inventory used for
this purpose in the UK. Out of a total inventory of 906 t of SF6 installed by National Grid to
date, roughly 84% is used on passive units. A further 25% of the passive components
inventory, accounting for approximately 190 t of SF6, is used for insulation in the specific
GIB make that was type tested in this project. This means that this retro-fill solution could
potentially lead to at least 190 t of SF6 being replaced with the 20% C3F7CN / 80% CO2 gas
mixture which, with a GWP of 1,100, could lead to a 95% reduction in the tCO2e.
The retro-fill solution being recommended in this work is: the use of the 20% C3F7CN / 80%
CO2 gas mixture at an operating pressure of 4.5 bar (abs) with a -10°C liquefaction point,
Conclusions and Future Work
223
which could result in 95% reduction in tCO2e arising from SF6 usage in gas insulated
equipment. However, the big concern of this solution is the liquefaction temperature which
is considerably higher than the -25°C limit set in the BS EN/IEC standards. Despite that,
after a thorough analysis of the mean daily minimum temperature profiles of multiple
locations in the UK for the past 20 years, it was found that the temperature of -10°C can only
be reached in extreme weather scenarios. The lowest temperature recorded in potential retro-
fill substation locations in the UK over the past 20 years (with SF6 inventory greater than 20
t), according to historic data recorded, was -3.4°C which is considerably higher than the
liquefaction point of -10°C for the gas mixture.
7.3 Future Work
The research work conducted in this thesis has mainly investigated the potential of using the
20% C3F7CN / 80% CO2 gas mixture as a retro-fill solution in existing SF6-designed GIB
equipment. The work has compared the characteristics of the C3F7CN/CO2 gas mixture to
SF6 in terms of breakdown, PD and withstand type tests in practical equipment. However,
future work can further characterise the mixture and identify any problems that might arise
with its implementation in practical equipment.
➢ Effect of Surface Roughness on the Inception and Breakdown Voltage
of Coaxial Configurations
Several previous studies were carried out on the effect of the HV electrode surface roughness
and pressure on the breakdown voltage of SF6. The purpose of these investigations was to
identify the maximum threshold value that the product of surface roughness and pressure
does not impact the insulation capability of SF6, when used in practical equipment. It was
found that when the product of maximum surface roughness and pressure was below 40
bar·μm, the breakdown voltage of the gas was marginally affected. In contrast, any value
exceeding this could significantly reduce the breakdown performance of SF6.
To retro-fill C3F7CN/CO2 gas mixtures, it is important to establish the same threshold value
as SF6 since the existing GIB equipment has been in operation for more than 50 years.
Technical surface finish in equipment in the 1960s was not as smooth as modern installations
Conclusions and Future Work
224
and this could potentially influence the insulation capability of the mixture if it does not
behave as well as SF6. The surface roughness study can be done by modifying the reduced-
scale coaxial prototype used in the breakdown tests, where several conductors with different
surface roughness values can be experimentally examined. The external UHF sensors used
in the PD chapter can also be exploited to determine the corona inception voltage of the
coaxial configuration under different pressures and surface roughness values. This study
could result in three important analyses: (i) evaluate the effect of pressure and surface
roughness on C3F7CN/CO2 mixtures (ii) establish a threshold value for when the surface
roughness and pressure product does not influence the insulation capability of the chosen
C3F7CN/CO2 gas mixture and (iii) identify the margin between inception and breakdown
voltage for different surface roughness and pressures for the C3F7CN/CO2 gas mixture.
➢ Breakdown Tests for Needle Electrode Configurations
PD needle configurations in this thesis were used to compare the PDIV/EV characteristics
of the 20% C3F7CN / 80% CO2 gas mixture to SF6. These tests can be further extended by
pushing the voltage until a breakdown occurs in the needle configuration. Breakdown tests
using the PD electrode configurations can be useful in establishing the gap from inception
to breakdown voltage for these gases and investigate their behaviour with the existence of a
protrusion in the equipment. In general, the C3F7CN/CO2 gas mixture in the PD chapter was
found to have lower PDIV/EV values compared to SF6 with the presence of a protrusion.
However, this does not necessarily mean that the gas mixture can fail easier than SF6 when
used in practical equipment. By carrying out breakdown voltage tests using the same
electrode configurations can help determine if lower PDIV/EV values also lead to inferior
breakdown voltages for the C3F7CN/CO2 gas mixture compared to SF6. Otherwise, in the
case that the C3F7CN/CO2 gas mixture has lower PDIV/EV values but similar breakdown
performance, the lower PD inception level can be used to its advantage for future condition
monitoring of the gas insulated equipment. By having lower PDIV/EV values but similar
breakdown values means that a defect in equipment can be detected long before failure when
using C3F7CN/CO2 gas mixtures instead of SF6. This could potentially lead to earlier fault
detection and repair of the asset which would assist in the prevention of its total failure.
Conclusions and Future Work
225
➢ PD Characterisation of Artificial Defects in the GIB Demonstrator
Using several internal and external UHF sensors, a full-scale 420/550 kV GIB demonstrator
was found to be PD-free using either SF6 or the 20% C3F7CN / 80% CO2 gas mixture up to
the voltage levels specified by the BS EN/IEC standards. However, the full-scale GIB
demonstrator can be used more extensively to characterise and compare SF6 and the
C3F7CN/CO2 gas mixture in the presence of defects that can lead to PDs in the practical
equipment. Defects such as protrusion on conductor/enclosure, free metallic particles or a
fault on the epoxy insulator can be used to characterise the behaviour of the 20% C3F7CN /
80% CO2 gas mixture under live energisation. This study could lead to the following
important findings:
• PDIV/EV values comparison between SF6 and the 20% C3F7CN / 80% CO2 gas mixture
at operational pressure which will reveal more about the ability of the gas to suppress
PD activity with the presence of a defect in a full-scale equipment.
• Characterisation of UHF signals and PRPD patterns to show how the gases react to
different types of PD defects. This knowledge can be used for on-site condition
monitoring in order to identify the cause of PDs in gas insulated equipment.
• Comparison on the effectiveness of PD capturing between the internal UHF sensors and
the external ones placed on insulators. This will show the capability of the external
sensors to be used for on-site condition monitoring of gas insulated equipment that are
not equipped with internal UHF sensors.
• Time of flight measurements, by placing defects at different distances from the sensor in
the GIB equipment, can be used to establish a standardised procedure for identifying the
defect location within the equipment.

Conclusions and Future Work
226
Blank Page
References
227
References
[1] EPA, “Overview of SF6 Emissions Sources and Reduction Options in Electric Power
Systems,” 2018.
[2] H. Koch, Gas Insulated Substations. United Kingdom: John Wiley & Sons, 2014.
[3] IPCC, “Climate Change 2013: The Physical Science Basis. Working Group I
Contribution to the Fifth Assessment Report on Interngovernmental Panel on Climate
Change,” 2013.
[4] Y. Kieffel, T. Irwin, P. Ponchon, and J. Owens, “Green Gas to Replace SF6 in
Electrical Grids,” IEEE Power and Energy Magazine, vol. 14, no. 2, pp. 32–39, 2016.
[5] Earth System Research Laboratories. (2020). Sulfur hexafluoride (SF6) — Combined
Data Set [Online]. Available:
https://www.esrl.noaa.gov/gmd/hats/combined/SF6.html.
[6] Y. Kieffel, “Characteristics of g3 - An alternative to SF6,” in IEEE International
Conference on Dielectrics (ICD), Montpellier, France, 2016, pp. 880–884.
[7] 3M Electronics Materials Solutions Division, “3MTM NovecTM 4710 Insulating Gas.”
2017.
[8] Y. Kieffel, “Characteristics of g3 - an alternative to SF6,” CIRED, Open Access Proc.
J., vol. 2017, no. 1, pp. 54–57, 2017.
[9] J. G. Owens, “Greenhouse Gas Emission Reductions through use of a Sustainable
Alternative to SF6,” in IEEE Electrical Insulation Conference (EIC), Montreal, QC,
2016, pp. 535–538.
[10] Siemens, “Gas-Insulated Transmission Lines (GIL),” 2016.
[11] H. Meinecke, “High voltage gas insulated switchgear: an overview,” in IEE
Colloquium on GIS (Gas-Insulated Switchgear) at Transmission and Distribution
Voltages, Nottingham, UK, 1995, pp. 3/1–3/8.
[12] H. Koch, Gas-Insulated Transmission Lines (GIL). United Kingdom: John Wiley &
Sons, 2012.
[13] J. Riedl and T. Hillers, “Gas-Insulated Transmission Lines,” IEEE Power Eng. Rev.,
vol. 20, no. 9, pp. 15–16, 2000.
[14] EU. (2015). EU legislation to control F-gases [Online]. Available:
https://ec.europa.eu/clima/policies/f-gas/legislation_en#tab-0-0.
References
228
[15] UK Government. (2019). Fluorinated gases (F gases) [Online]. Available:
https://www.gov.uk/guidance/fluorinated-gases-f-gases.
[16] J. Wada, G. Ueta, S. Okabe, and M. Hikita, “Dielectric Properties of Gas Mixtures
with Per-Fluorocarbon Gas and Gas with Low Liquefaction Temperature,” IEEE
Trans. Dielectr. Electr. Insul., vol. 23, no. 2, pp. 838–847, 2016.
[17] M. Hyrenbach, T. Hintzen, P. Müller, and J. Owens, “Alternative Gas Insulation in
Medium-voltage switchgear,” in CIRED, 23rd International Conference on
Electricity Distribution, Lyon, France, 2015, pp. 1–5.
[18] A. Beroual and A. Haddad, “Recent advances in the quest for a new insulation gas
with a low impact on the environment to replace Sulfur Hexafluoride (SF6) gas in
high-voltage power network applications,” Energies, vol. 10, pp. 1–20, 2017.
[19] Toshiba. Substation Equipment that secures the quality of electric power [Online].
Available: https://www.toshiba-energy.com/en/transmission/product/.
[20] P. Bolin and H. Koch, “Gas Insulated Switchgear GIS - State of the Art,” in IEEE
Power Engineering Society General Meeting, Tampa, FL, 2007, pp. 1–3.
[21] N. H. Malik, A. A. Al-Arainy, and M. I. Qureshi, Electrical Insulation in Power
Systems. Taylor & Francis, 1998.
[22] H. Koch, “Gas Insulated Transmission Lines - GIL,” in IEEE Power Engineering
Society General Meeting, Tampa, FL, 2007, pp. 1–5.
[23] H. Koch, D. Kunze, S. Pohler, L. Hofmann, C. Rathke, and A. Mueller, “Gas Insulated
Lines - Reliable Power Transmission Toward New Wolrdwide Challenges in Hydro
and Wind Power Generation,” in Cigre, B3-210, Paris, France, 2008, pp. 1–6.
[24] H. Koch, “Basic information on gas insulated transmission lines (GIL),” in IEEE
Power and Energy Society General Meeting - Conversion and Delivery of Electrical
Energy in the 21st Century, Pittsburgh, PA, 2008, pp. 1–4.
[25] T. Hillers, “Second-generation gas-insulated line,” IET Power Eng. J., vol. 16, no. 3,
pp. 111–116, 2002.
[26] T. Hillers, “Gas insulated transmission lines (GIL): ready for the real world,” in IEEE
Power Engineering Society Winter Meeting, 2000, pp. 575–579.
[27] Solvay, “Sulphur Hexafluoride.”
[28] A. Haddad and D. Warne, Advances in High Voltage Engineering. The Institution of
Engineering and Technology (IET), 2007.
[29] UNFCCC. The Kyoto Protocol [Online]. Available:
https://unfccc.int/kyoto_protocol.
References
229
[30] S. Okabe, J. Wada, and G. Ueta, “Dielectric Properties of Gas Mixtures with
C3F8/C2F6 and N2/CO2,” IEEE Trans. Dielectr. Electr. Insul., vol. 22, no. 4, pp. 2108–
2116, 2015.
[31] Y. Kieffel et al., “SF6 Alternative Development for High Voltage Switchgears,” in
Cigre, D1-305, Paris, France, 2014.
[32] 3M Electronics Materials Solutions Division, “3MTM NovecTM 5110 Insulating Gas.”
2017.
[33] J. D. Mantilla, N. Gariboldi, S. Grob, and M. Claessens, “Investigation of the
Insulation Performance of a New Gas Mixture with Extremely Low GWP,” in IEEE
Electrical Insulation Conference (EIC), Philadelphia, Pennsylvania, 2014, pp. 469–
473.
[34] M. S. Kamarudin et al., “CF3I Gas and Its Mixtures : Potential for Electrical
Insulation,” in Cigre, D1-308, Paris, France, 2014, pp. 1–9.
[35] L. Chen et al., “Breakdown Characteristics of CF3I/CO2 Gas Mixtures Under Fast
Impulse In Rod-Plane And GIS Geometries,” in International Symposium on High
Voltage Engineering (ISH), Pilsen, Czech Republic, 2015, pp. 1–6.
[36] L. Chen, P. Widger, M. S. Kamarudin, H. Griffiths, and A. Haddad, “Potential of CF3I
Gas Mixture as an Insulation Medium in Gas-Insulated Equipment,” in IEEE
Conference on Electrical Insulation and Dielectric Phenomena (CEIDP), Ann Arbor,
MI, 2015, pp. 868–871.
[37] L. Chen, H. Griffiths, A. Haddad, and M. S. Kamarudin, “Breakdown of CF3I Gas
and its Mixtures under Lightning Impulse in Coaxial-GIL Geometry,” IEEE Trans.
Dielectr. Electr. Insul., vol. 23, no. 4, pp. 1959–1967, 2016.
[38] L. Chen, P. Widger, M. S. Kamarudin, H. Griffiths, and A. Haddad, “CF3I Gas
Mixtures : Breakdown Characteristics and Potential for Electrical Insulation,” IEEE
Trans. Power Deliv., vol. 32, no. 2, pp. 1089–1097, 2017.
[39] A. Xiao, J. Bonk, and J. G. Owens, “Emission Reductions Through Use of Sustainable
SF6 Alternatives,” in CIRED, 23rd International Conference on Electricity
Distribution, Madrid, Spain, 2019, pp. 1–5.
[40] T. Kawamura, S. Matumoto, M. Hanai, and Y. Murayama, “SF6/N2 Mixtures for HV
Equipment and Practical Problems,” in Gaseous Dielectrics VIII, 1998, pp. 333–342.
[41] H. Koch, F. Goll, T. Magier, and K. Juhre, “Technical Aspects of Gas Insulated
Transmission lines and Application of New Insulating Gases,” IEEE Trans. Dielectr.
Electr. Insul., vol. 25, no. 4, pp. 1448–1453, 2018.
References
230
[42] 3M, “3M Novec 4710 Insulating Gas Safety Datasheet,” 2020.
[43] The British Standards Institution, “Determination of toxicity of a gas or gas mixture,”
BS ISO 10298, 2010.
[44] Y. Li et al., “Assessment on the toxicity and application risk of C4F7N: A new SF6
alternative gas,” J. Hazard. Mater., vol. 368, pp. 653–660, 2019.
[45] T. Uchii, Y. Hoshina, H. Kawano, K. Suzuki, T. Nakamoto, and M. Toyoda,
“Fundamental Research on SF6-free Gas Insulated Switchgear Adopting CO2 Gas and
Its Mixtures,” in International Symposium on EcoTopia Scienece (ISET), Nagoya,
Japan, 2007, pp. 516–520.
[46] D. Y. Peng and D. B. Robinson, “A New Two-Constant Equation of State,” Ind. Eng.
Chem. Fundam., vol. 15, no. 1, pp. 59–64, 1976.
[47] N. H. Malik and A. H. Qureshi, “Breakdown Mechanisms in Sulphur Hexafluoride,”
IEEE Trans. Electr. Insul., vol. EI-13, no. 3, pp. 135–145, 1978.
[48] S. Hu, W. Zhou, J. Yu, R. Qiu, Y. Zheng, and H. Li, “Synergistic Effect of i-
C3F7CN/CO2 and i-C3F7CN/N2 Mixtures,” IEEE Access, vol. 7, pp. 50159–50167,
2019.
[49] X. Zhang et al., “Experimental Study on Power Frequency Breakdown Characteristics
of C4F7N/CO2 Gas Mixture Under Quasi-Homogeneous Electric Field,” IEEE Access,
vol. 7, pp. 19100–19108, 2019.
[50] Y. Kawaguchi, K. Sakata, and S. Menju, “Dielectric Breakdown of Sulphur
Hexafluoride in Nearly Uniform Fields,” IEEE Trans. Power Appar. Syst., vol. PAS-
90, no. 3, pp. 1072–1078, 1971.
[51] S. Menju, H. Aoyagi, K. Takahashi, and H. Qhno, “Dielectric Breakdown of High
Pressure SF6 in Sphere and Coaxial Cylinder Gaps,” IEEE Trans. Power Appar. Syst.,
vol. PAS-93, no. 5, pp. 1706–1712, 1974.
[52] B. Zhang, N. Uzelac, and Y. Cao, “Fluoronitrile/CO2 Mixture as an Eco-Friendly
Alternative to SF6 for Medium Voltage Switchgears,” IEEE Trans. Dielectr. Electr.
Insul., vol. 25, no. 4, pp. 1340–1350, 2018.
[53] R. Arora and M. Wolgang, High Voltage and Electrical Insulation Engineering.
Hoboken, New Jersey: John Wiley & Sons, 2011.
[54] H. E. Nechmi, A. Beroual, A. Girodet, and P. Vinson, “Fluoronitriles/CO2 Gas
Mixture as Promising Substitute to SF6 for Insulation in High Voltage Applications,”
IEEE Trans. Dielectr. Electr. Insul., vol. 23, no. 5, pp. 2587–2593, 2016.
[55] C. Wang et al., “Characteristics of C3F7CN/CO2 as an Alternative to SF6 in HVDC-
References
231
GIL Systems,” IEEE Trans. Dielectr. Electr. Insul., vol. 25, no. 4, pp. 1351–1356,
2018.
[56] Y. Tu, Y. Cheng, C. Wang, X. Ai, F. Zhou, and G. Chen, “Insulation Characteristics
of Fluoronitriles / CO2 Gas Mixture under DC Electric Field,” IEEE Trans. Dielectr.
Electr. Insul., vol. 25, no. 4, pp. 1324–1331, 2018.
[57] N. H. Malik and A. H. Qureshi, “The Influence of Voltage Polarity and Field Non-
Uniformity on The Breakdown Behavior of Rod-Plane Gaps Filled with SF6,” IEEE
Trans. Electr. Insul., vol. EI-14, no. 6, pp. 327–333, 1979.
[58] B. S. Manjunath, K. Dwarakanath, and M. . Naidu, “Influence of Polarity and Field
Non-Uniformity on the Breakdown Votlage Characteristics of SF6 Gas Under Impulse
Voltages,” in IEEE International Symposium on Electrical Insulation, Pittsburgh, PA,
1994, pp. 485–488.
[59] E. Kuffel, W. S. Zaengl, and J. Kuffel, High Voltage Engineering - Fundamentals,
2nd ed. Great Britain: Pergamon Press, 2000.
[60] T. Zhang, W. Zhou, and J. Yu, “Insulation Properties of C4F7N/CO2 Mixtures under
Lightning Impulse,” IEEE Trans. Dielectr. Electr. Insul., vol. 27, no. 1, pp. 181–188,
2020.
[61] A. Pedersen, “The Effect of Surface Roughness on Breakdown in SF6,” IEEE Trans.
Power Appar. Syst., vol. PAS-94, no. 5, pp. 1749–1754, 1975.
[62] A. Pedersen, “Limitations of Breakdown Voltages in SF6 caused by Electrode Surface
Roughness,” in IEEE Conference on Electrical Insulation and Dielectric Phenomena
(CEIDP), Downingtown, PA, 1974, pp. 457–464.
[63] X. Yan, Y. Zheng, K. Gao, X. Xu, W. Wang, and J. He, “The Criterion of Conductor
Surface Roughness in Environment-friendly C4F7N/CO2 Gas Mixture,” in IEEE
Sustainable Power and Energy Conference (iSPEC), Beijing, China, 2019, pp. 377–
381.
[64] Y. Zheng et al., “Influence of conductor surface roughness on insulation performance
of C4F7N/CO2 mixed gas,” IEEE Trans. Dielectr. Electr. Insul., vol. 26, no. 3, pp.
922–929, 2019.
[65] X. Ai et al., “The effect of electrode surface roughness on the breakdown
characteristics of C3F7CN/CO2 gas mixtures,” Elsevier, pp. 1–6, 2020.
[66] Z. Li et al., “Surface Flashover Characteristics of Epoxy Insulator in C4F7N/CO2
Mixtures in a Uniform Field under AC Voltage,” IEEE Trans. Dielectr. Electr. Insul.,
vol. 26, no. 4, pp. 1065–1072, 2019.
References
232
[67] The British Standards Institution, “High-voltage test techniques - Partial Discharge
measurements,” BS EN 60270, 2016.
[68] B. Zhang and Y. Cao, “Comparison of Partial Discharges in SF6 and Fluoronitrile/CO2
Gas Mixtures,” in Cigre, Paris, France, 2017, pp. 1–7.
[69] Y. I. Li et al., “Study on the Dielectric Properties of C4F7N/N2 Mixture Under Highly
Non-Uniform Electric Field,” IEEE Access, vol. 6, pp. 42868–42876, 2018.
[70] G. Wang, W.-H. Kim, G. Kil, S.-W. Kim, and J.-R. Jung, “Green Gas for a Grid as
An Eco-Friendly Alternative Insulation Gas to SF6 : From the Perspective of Partial
Discharge Under AC,” Appl. Sci., vol. 9, no. 651, pp. 1–10, 2019.
[71] Y. Kieffel, F. Biquez, and P. Ponchon, “Alternative Gas to SF6 for Use in High
Voltage Switchgears: g3,” in CIRED, 23rd International conference on electricity
distribution, Lyon, France, 2015, no. 0230, pp. 1–5.
[72] Y. Zhou et al., “Comparison of Decomposition By-products of C4F7N/CO2 Mixed
Gas under AC Discharge Breakdown and Partial Discharge,” in International
Conference on Electric Power Equipment - Switching Technology (ICEPE-ST),
Kitakyushu, Japan, 2019, pp. 82–85.
[73] P.Simka, C. B. Doiron, S.Scheel, and A. Di-Giann, “Decomposition of alternative
gaseous insulation under partial discharge,” in International Symposium on High
Voltage Engineering (ISH), Buenos Aires, Argentina, 2017, pp. 1–6.
[74] K. Pohlink et al., “Characteristics of a Fluoronitrile/CO2 Mixture - An Alternative to
SF6,” in Cigre, D1-204, Paris, France, 2016, pp. 1–11.
[75] Lapp Insulators GmbH, “High Voltage GIS Bushing with composite housing.” 2015.
[76] COMSOL. (2016). The Finite Element Method (FEM) [Online]. Available:
https://www.comsol.com/multiphysics/finite-element-method.
[77] L. Chen, “Investigation on the Feasibility of Trifluoroiodomethane (CF3I) for
Application in Gas-Insulated Lines,” Ph.D. dissertation, Cardiff Univ, Cardiff, UK,
2015.
[78] W. Frei. (2013). Meshing Considerations for Linear Static Problems [Online].
Available: https://www.comsol.com/blogs/meshing-considerations-linear-static-
problems/.
[79] A. Griesmer. (2014). Size Parameters for Free Tetrahedral Meshing in COMSOL
Multiphysics [Online]. Available: https://www.comsol.co.in/blogs/size-parameters-
free-tetrahedral-meshing-comsol-multiphysics/.
[80] COMSOL. (2016). Finite Element Mesh Refinement [Online]. Available:
References
233
https://www.comsol.com/multiphysics/mesh-refinement.
[81] H. Gothall. (2017). How to Inspect Your Mesh in COMSOL Multiphysics® [Online].
Available: https://uk.comsol.com/blogs/how-to-inspect-your-mesh-in-comsol-
multiphysics/.
[82] The British Standards Institution, “Assessment of Surface Texture - Guidance and
General Information,” BS 1134, 2010.
[83] The British Standards Institution, “Geometrical product specification ( GPS ) -
Surface texture : Profile method - Terms , definitions and surface texture parameters,”
BS EN ISO 4287, 2009.
[84] I. A. Metwally, “Status review on partial discharge measurement techniques in gas-
insulated switchgear/lines,” Elsevier, vol. 69, no. 1, pp. 25–36, 2004.
[85] N. De Kock, B. Coric, and R. Pietsch, “UHF PD detection in gas-insulated switchgear
- Suitability and sensitivity of the UHF method in comparison with the IEC 270
method,” IEEE Electr. Insul. Mag., vol. 12, no. 6, pp. 20–26, 1996.
[86] G. Wang and G. S. Kil, “Measurement and Analysis of Partial Discharge Using an
Ultra-high Frequency Sensor for Gas Insulated Structures,” Metrol. Meas. Syst., vol.
24, no. 3, pp. 515–524, 2017.
[87] T. Prabakaran, S. Usa, and A. Santosh Kumar, “Analysis of Partial Discharge Signals
in 420 kV Gas Insulated Substation,” in IEEE International Conference on Condition
Assessment Techniques in Electrical Systems (CATCON), Kolkata, India, 2013, pp.
249–254.
[88] The British Standards Institution, “Guidelines for the checking and treatment of
sulphur hexafluoride (SF6) taken from electrical equipment and specification for its
re-use,” BS EN 60480, 2004.
[89] M. S. Silberberg, Chemistry: The Molecular Nature of Matter and Change, 5th ed.
Boston: McGraw-Hill, 2009.
[90] The British Standards Institution, “High-Voltage test techniques, Part 1: General
Definitions and test requirements,” BS EN 60060-1, 2010.
[91] W. Hauschild and W. Mosch, Statistical Techniques for High-voltage Engineering.
Peter Peregrinus Ltd, 1992.
[92] F. Rizk and M. Eteiba, “Impulse Breakdown Voltage-Time Curves of SF6 and SF6-
N2 Coaxial-Cylinder Gaps,” IEEE Trans. Power Appar. Syst., vol. PAS-101, no. 12,
pp. 4460–4471, 1982.
[93] S. R. Naidu and P. D. T. Mederos, “Volt-Time Curves For A Coaxial Cylindrical Gap
References
234
In SF6-N2 Mixtures,” IEEE Trans. Electr. Insul., vol. EI-22, no. 6, pp. 755–762, 1987.
[94] T. Wen et al., “Discussion on lightning impulse test waveform according to
breakdown characteristics of SF6 gas gaps,” IEEE Trans. Dielectr. Electr. Insul., vol.
24, no. 4, pp. 2306–2313, 2017.
[95] C. Zachariades, R. Shuttleworth, and R. Giussani, “A Dual-Slot Barrier Sensor for
Partial Discharge Detection in Gas-Insulated Equipment,” IEEE Sens. J., vol. 20, no.
2, pp. 860–867, 2020.
[96] HVPD. Ultra High Frequency Detection for Partial Discharge [Online]. Available:
https://www.hvpd.co.uk/products/uhf-barrier-sensor/.
[97] J. Shipman, J. Wilson, C. Higgins, and O. Torres, An Introduction to Physical Science,
14th ed. Boston: Cengage Learning, 2016.
[98] P.-S. Kildal, Foundations of Antenna Engineering: A Unified Approach for Line-of-
sight and Multipath. Kildal Antenn AB, 2015.
[99] M. Albiez et al., “Partial Discharge Detection System for GIS: Sensitivity
Verification for the UHF Method and the Acoustic Method,” Cigre, Electra, vol. 183,
pp. 77–87, 1999.
[100] J. S. Pearson, O. Farish, B. F. Hampton, M. D. Judd, and D. Templeton, “Partial
Discharge Diagnostics for Gas Insulated Substations,” IEEE Trans. Dielectr. Electr.
Insul., vol. 2, no. 5, pp. 893–905, 1995.
[101] The British Standards Institution, “High-voltage switchgear and controlgear, Part 1:
Common specifications,” BS EN 62271-1, 2011.
[102] The British Standards Institution, “High-voltage switchgear, Part 204: Rigid gas-
insulated transmission lines for rated voltage above 52kV,” BS EN 62271-204, 2011.
[103] The British Standards Institution, “High-voltage switchgear and controlgear, Part
203: Gas-insulated metal-enclosed switchgear for rated voltages above 52kV,” BS EN
62271-203, 2012.
[104] L. Loizou, L. Chen, Q. Liu, I. Cotton, M. Waldron, and J. Owens, “Technical Viability
of Retro-filling C3F7CN/CO2 Gas Mixtures in SF6-designed Gas Insulated Lines and
Busbars at Transmission Voltages,” IEEE Trans. Power Deliv., pp. 1–9, 2020.
[105] Ofgem, “RIIP-ET1 Annual Report,” 2019.
[106] National Grid. Performance - environmental sustainability: Sulphur Hexafluoride
[Online]. Available: https://www.nationalgrid.com/group/responsibility-and-
sustainability/our-progress/our-performance/performance-environmental.
[107] UK Government. (2014). Calculate the carbon dioxide equivalent quantity of an F
References
235
gas [Online]. Available: https://www.gov.uk/guidance/calculate-the-carbon-dioxide-
equivalent-quantity-of-an-f-gas.
[108] UK Government. Met Office [Online]. Available: https://www.metoffice.gov.uk/.
[109] Google. Google Maps [Online]. Available: https://www.google.com/maps.

References
236
Blank Page
List of Publications
237
List of Publications
Peer-reviewed Journal Papers
1. L. Loizou, L. Chen, Q. Liu and M. Waldron, "Lightning impulse breakdown
characteristics of SF6 and 20% C3F7CN / 80% CO2 mixture under weakly non-uniform
electric fields," in IEEE Transactions on Dielectrics and Electrical Insulation, vol. 27, no. 3,
pp. 848-856, June 2020.
2. L. Loizou, L. Chen, Q. Liu, I. Cotton, M. Waldron and J. Owens, "Technical Viability
of Retro-filling C3F7CN/CO2 Gas Mixtures in SF6-designed Gas Insulated Lines and Busbars
at Transmission Voltages," in IEEE Transactions on Power Delivery.
International Conference Papers
3. L. Loizou, R. Fernandez Bautista, L. Chen, M. Seltzer-Grant and Q. Liu, "Evaluation
of UHF Partial Discharge Measurements for SF6 and 20% C3F7CN / 80% CO2 Gas Mixture,"
2020 IEEE International Conference on Dielectrics (ICD), Valencia, Spain.
4. L. Loizou, L. Chen and Q. Liu, "A Comparative Study on the Breakdown
Characteristics of SF6 and 20% C3F7CN / 80% CO2 Gas Mixture in a Coaxial Configuration,"
2019 IEEE Conference on Electrical Insulation and Dielectric Phenomena (CEIDP),
Richland, WA, USA, 2019, pp. 234-237.
5. L. Loizou, L. Chen and Q. Liu, "Breakdown Characteristics of C3F7CN/CO2 Gas
Mixtures in Rod-Plane Gaps," 2018 IEEE International Conference on High Voltage
Engineering and Application (ICHVE), ATHENS, Greece, 2018, pp. 1-4.
Related Documents