Application of Biomarkers in Cancer Epidemiology Edited by P. Toniolo, P. Boffetta, D.E.G. Shuker, N. Rothman, В . Hulka and N. Pearce 'ARC Scientific Publications No.142 International Agency for Research on Cancer, Lyon, 1997

Welcome message from author
This document is posted to help you gain knowledge. Please leave a comment to let me know what you think about it! Share it to your friends and learn new things together.
Transcript

Application of Biomarkers in Cancer
Epidemiology
Edited by P. Toniolo, P. Boffetta, D.E.G. Shuker, N. Rothman, В. Hulka and N. Pearce
'ARC Scientific Publications No.142
International Agency for Research on Cancer, Lyon, 1997


Foreword
Although biological markers have been used in epidemiology for decades, it is oniy in recent years, that advances in cellular and molecular biology have greatly expanded their potential. Biomarkers have possibilities in measuring whole-body or organ-specific exposures, as indicators of biological change or of early disease, and in assessing indi-vidual susceptibility to exposure, These developments foster the incorporation of a more biological thinking into studies of cancer epidemiology aid open up new perspectives for elucidating the mechanisms of pathogenesis in vivo at the cellular and molecular level. Although the promise that biological markers hold in expanding the boundaries of epi-demiological research is enormous, the criteria for their effective use in human observa-tional research are as yet poorly understood, as are their limitations.
Biomarkers have many useful future applications in cancer prevention and public health; particularly in the monitoring of exposure to hazardous substances, in identifying individuals at increased risk of disease, and in risk assessment at the population level.
This volume aims to provide a set of state-of-the-art reviews of methodological issues iп the use of biological markers in cancer epidemiology. In addition, it provides a brief expert statement of our present understanding of these issues under three broad headings: study design and analysis; development of biomarkers; and application of bio-markers.
The support of the United Kingdom Department of the Environment and the collabora-tion of the New York University are gratefully acknowledged. We thank Fred Garber for kindly designing the artwork for the cover of the book.
P. Kleihues Director, IAFIC

International Agency For Research On Cancer
The International Agency for Research on Cancer ('ARC) was established in 1965 by the World Health Assembly, as an independently financed organization within the framework of the World Health Organization. The headquarters of the Agency are in Lyon, France.
The Agency conducts a programme of research concentrating particularly on the epi-demiology of cancer and the study of potential carcinogens in the human environment. Its field studies are supplemented by biological and chemical research carried out in the Agency's laboratories in Lyon and, through collaborative research agreements, in national research institutions in many countries. The Agency also conducts a programme for the education and training of personnel for cancer research.
The publications of the Agency contribute to the dissemination of authoritative infor-mation on different aspects of cancer research. А complete list is printed at the back of this book. Information about 'ARC publications, and how to order them, is also available via the Internet at: http:llwww.iarc.frl

Workshop on the Application of Biomarkers to Cancer Epidemiology, Lyon, 20-23 February 1996
List of participants R.J. Albertini Genetics Laboratory, University of Vermont, 32 North Prospect St, Burlington, VT 05401-0508, USA
B.K. Armstrong Cancer Control Information Centre, NSW Cancer Council P.O. Box 572, Kings Cross, NSW 2011, Australia
Н. Bartsch German Cancer Research Centre, 1m Neuenheimer Feld 280 69120 Heidelberg, Germany
С.W. Boone Chemoprevention Branch Division of Cancer Prevention and Control, National Cancer Institute, Bldg 31, Am 10А52 31 Center Drive, Bethesda, MD 20892-2580, USA
F.X. Bosch Servei d'Epidemiologia Hospital Duran i Reynals Autovia de CastelldeteIs, Km 2.7 08907 Hospitalet de Llobregat Barcelona, Spain
N. Caporaso Genetic Epidemiology Branch National Cancer Institute, EPN 439, 6130 Executive Boulevard, Bethesda, MD 20892-7377, USA
D. Coggon MRC Environmental Epidemiology Unit University it Southampton Southampton General Hospital Southampton 5016 6YD, UK
R Farmer MRC Toxicology Unit. University of Leicester, Hodgkin Building, Lancaster Road, Р.O. Box 138, Leicester LE1 9HN, UK
S. Gaгte Program in Environmental Carcinogenesis, NY University Medical Center, MSB Room 209, 550 First Avenue New York, NY 10010, USA
D. Gompertz MRC Institute for Environment and Health, University of Leicester, 94 Regent Street Leicester LEI 91N, UK
K. Hemminki Center for Nutrition and Toxicology, Karolinka Institute, НdlSovagen 7, 14157 Huddinge, Sweden
B. Hulka Department of Epidemiology School of Public Health University of North Carolina СВ NO. 7400 McGavran» Greenberg Hall, Chapel Hill, NC 27599.7400, USA
D.J. Hunier Channing Laboratory, Harvard School of Public Health 677 Huntington Avenue Boston, MA 02115, USA
M.T. Landi Genetic Epidemiology Branch National Cancer Institute Executive Plaza North, Am 439, 6130 Executive Boulevard, Msc 7372, Bethesda, MD 20892-7372, USA
A.J. McMichael Department of Epidemiology London School of Hygiene and Tropical Medicine, Keppel Street, London WC1 E lIT, UK
N. Pearce Wellington Asthma Research Group, Department of Medicine, Wellington School of Medicine, P.O. Box 7343 Wellington South, New Zealand
F, Perera Division of Environmental Sciences, Columbia University Sсhool of Public Health Room 8109, 60 Haven Avenue New York, NY-10032, USA
J.D. Potter Head, Cancer Prevention Research Program Fred Hutchinson Cancer Research Center 1124 Columbia Street Seattle, WA 98104, USA
N. Rothman Environmental Epidemiology Branch, National Cancer Institute, EPN 418, 6130 Executive Boulevard, Bethesda, MD 20892-7364, USA
R. Saracci lstituto Fisiologia Clinica CNR Epidemiology Section Via Trieste, 41 56106 Pisa, Italy
A. Schatzkin Division of Cancer Prevention Studies Branch, National Cancer Institute, 6130 Executive Boulevard, Bethesda, MD 20852, USA
P.A. 5сhulte Screening and Notification Section National Institute for Occupational Safety and Health 4678 Columbia Parkway, Room 42, Cincinnati, OH 45226-1998, USA
D. 5huker Toxicology Unit University of Leicester Hodgkin Building, Lancaster Road, Р.O. Box 138 Leicester LEI 91N, UK
E.Taioli Department of Environmental Medicine, NYU School of Medicine, 341 East 25th Street, 2nd Floor, New York, NY 10010, USA
P Toniolo Head, Unit of Cancer Epidemiology, New York University School of Medicine, 341 East 25th St, New York, NY 10010-2598, USA
E. White Cancer Prevention Research Program, Fred Hutchinson Cancer Research Center 1124 Columbia Street, МP-702 Seattle, WA 98104, USA
T.F. Zhang Department of Epidemiology and Biostatistics, Memorial Sloan Kettering Cancer Center 1275 York Avenue, B ox 44 New York, NY 10021, USA
Observers H. Auirup Department of Environmental and Occupational Medicine Aarhus University, Universitetsparken bygriing 180, 8000 Aarhus C., Denmark
T. Ballard Venetian Tumour Registry Via Giustiniaiii, 2, 35100 Padua, Italy
'ARC participants R Boffetla M. Freisen P. Hainaut J. Hall R. Montesano N. Munoz P. Pisani E. Riboli C. Wild

Contents Application of biomarkers to cancer epidemiology 1 Workshop report
Transitional studies 19 P.A. Schulte and F.P. Perera
Logistics and design issues ïn the use of biological samples in 31 observational epidemiology J.D. Potter
Methodological issues in the use of biological markers in cancer 39 epidemiology: cohort studies D.J. Hunter
General issues of study design and analysis in the use of biomarkers in 47 cancer epidemiology N. Pearce and P Boffetta
Saurces of variation in biomarkers 59 R Vineis
Effects of biomarker measurement error on epidemiological studies 73 Е. White
Markers of internal dose: chemical agents 95 D. Coggon and M.D. Friesen
Biochemical markers of dietary intake 103 R. Kaaks, Е. Riboli and R. Sinha
Biomarkers for biological agents 127 N. Mилог and EX. Bosch
Carcinogen-DNA and carcinogen-protein adducts in molecular 143 epidemiology С.P. Wild and P Pisani
Somatïc cell mutations in cancer epidemiology 159 R.J. Albertini and R.B. Hayes
Cytogenetic end-points as biological dosimeters and predictors 185 of risk in epidemiological studies J.D. Tucker, D.A. Eastmorid and L.G. Littlefield
Methodological issues in the use of tumour markers in cancer epidemiology 201 Z-F, Zhang, C. Cordon-Cardo, N. Rothman, A.N. Freedman and J.A. Taylor
Quality control of biomarker measurement in epidemiology 215 D. Gompertz
vi

sample collection' processing and storage 223 M. T. Landi and N. Caporaso
issues involving biomarkers in the study of the genetics of human cancer 237 N. Caporaso and A. Goldstein
Gene-environment interactions iп the application of biomarkers of cancer 251 susceptibility in epidemiology S. Garte, C. Zocchetti and E. Taioli
Using and interpreting surrogate end-points иn cancer research 265 A. Schatzk;n, L.S. Freedman, J Dorgan, L. МсShапе, M.H. Sсhiffтаn and S.M. Dawsey
Biomarker end-points in cancer chemoprevention trials 273 C. W. Boone and G.J. Kelloff
The use of biological markers as predictive early-outcome measures 281 in epidemiological research A.J. Mclichael and A.J. Hall
The use of biomarkers to study pathogenesis and mechanisms of cancer; 291 oesphagus and skin cancer as models R. Montesano, R Hainaut and J. Hall
Comparing measurements of biomarkers with other measurements of 303 exposure R. Sаraссi
Ethical and social issues in the use of biomarkers in epidemiological studies 313 P.A. Schulte, D. Hunter and N. Rothman
vii

Application of Biomarkers in Cancer Epidemiology
(IARC Scientгfic Pubications No. 142)
Errata
• List of participants attending the Workshop on the Application of Biomarkers to Cancer Epidemiology, Lyon, 20-23 February 1996, page v, should include the following participants:
R. Sinha Nutritional Epidemiology Branch, National Cancer Institute, EPN 443, Bethesda, MD 20892, USA
J.D. Tucker
Biology and Biotechnology Research Program, Lawrence Livermore National Laboratory, P.O. Box 808, L-452, Livermore, CA 94551-9900, USA
. The Technical Editor for the Workshop, page y, was: S. Garber Epidemiology Program, New York Univ. School of Medicine, 341 East 25th St, New York, NY 10010-2598, USA
. The following persons contributed to the Workshop proceedings, page v, but were unable to attend:
P. Vineis Cancer Epidemiology Unit, University of Turin, Via Santena, 7, l-10126 Turin, Italy
R. Kaaks NTR/IARC
• In line 12 of the first paragraph of p. 309, replace 95.7% with 9.75%.

Applicaliоп or Biomarkers iп Career Epidemiology Тоыо lо, R , Botfetta, P., shuker, D.E.G., Rothman, N., HuIka, B. arid Pearce, N., ode
11~RC Ccieriidie Poblicalione No. 142 Иlсгпаtlопаl Agency or Research on Carnier, Lyori, 1997
Application of biomarkers in cancer epidemiology Workshop report*
In epidemiology, а biological marker (commonly abbreviated, for convenience, to biomarker) is any substance, structure or process that can be measured in the human body or its products and may influence or predict the incidence or outcome of disease. Biomarkers can be broadly classified into markers of exposure, effect and susceptibility. Biomarkers may include the following: xenobiotic agents and their metabolites in tissues or body products; normally occurring body constituents whether in physiological or pathological amounts; endogenous compounds that are not present under normal conditions; and inherited and acquired abnormalities of body chemistry, structure or function, including pathological manifestations of precursors to disease. Biomarkers should be distinguished from biomarker assays, specific laboratory tests aimed at measuring particular biomarkers, and biomarker measurements, the amounts of particular biomarkers present in specified units of tissues or body products as measured by biomarker assays.
Biomarkers have been used in epidemiological studies of cancer for many years. Early examples include the classic studies of B. Maclahon and coleagues on the geographical correlation of uri-nary estrogen concentrations with cancer of the breast (MacMahon et al., 1974; Dickinson et ai, 1974), subsequent studies of the relationship between urinary and blood estrogens and breast cancer in case—control studies (Cole & McMahon, 1969; Maclahon et aL, 1982, 1983) and analyses of the relationship of cancer mortality to serum choles-terol concentrations in the Framingham and other cohort studies (McMichaet et al., 1984). Two recent, та jот contributions of biomarkers to epi-demiological studies are the demonstration of the carcinogenicity of aflatoxine in combination with hepatitis B in humans through a cohort study of liver cancer, including measurements of urinary metabolites and nucleic acid adducts of aflatoxin (Ross et al., 1992; Qian et al., 1994), and the iden-tification of the major role of human papilo-maviruses (HPVs) in causing cancer of the cervix worldwide (Munoz etal., 1992; Bosch etal., 1995).
In spite of the quite extensive current use of biomarkers in cancer epidemiology, methodologi-cal aspects of their use have not been extensively elucidated or described. While there have been important contributions to this subject, including textbooks (Hulka et al., 1990; Schulte & Pererа,1993) and comprehensive meeting reports (Mendelsohn
et aL, 1995; Institute for Environment and Health, 1996) on the use of biomarkers in epidemiology, there remains a substantial need for relevant methodological research, wider discussion and understanding of the methodological issues, aid their incorporation into the formal and informal training of cancer epidemiologists and other scien-tists pursuing careers in biological research on cancer.
The general objective of the use of biomarkers in cancer epidemiology is the same as that of can-cer epidemiology itself: to gain knowledge about the distribution aid determinants of disease occur-rence and outcome that may be applied to reduce the frequency and impact of disease in human populations. There are, however, several specific objectives for the use of biornarkers in cancer epidemiology which should guide the evaluation of proposals to develop or apply biomarkers. Principally, they are to increase the accuracy of measurements of genetic or other acquired suscep-tibility to disease; of exposures that may cause or prevent disease; of exposures that confound or modify the associations between risk and other exposures; of disease itself; and of fаctoтs that may determine the outcome of disease, such as disease
*This paper is the consensus report of the workshop Application of Biomarkers in Cancer Epidemiology, which was held at the International Agency for Research on Cancer, Lyon, France, in February 1996.

Application of Biomarkers iп Cancer Epidemiology
Figure 1. Schematic representation showing how biomarkers may be used to measure phenomena that reflect the amount or effects of agents that influence or predict disease incidence or outcome.
precursors and stages. Biomarkers may also be used to reduce, in the proposed study, the time interval between the relevant exposure and measurement of the putative effect and to increase the yield of information on disease pathogenesis. Ultimately, they should serve to increase the cost-effectiveness of epidemiological studies, in the sense that, as a result of their use, more information is gained per unit cost.
Because of their origin in the structure and function of the human body, biomarkers may pro-vide more complex measures of the underlying exposure, process, etc. that they represent than other measures that are common in epidemiology. This complexity is illustrated in Fig. 1. The three outer circles, genetic factors, environment (broadly defined) and disease, represent the universe of phe-nomena that can be measured to reflect the amount or effects of exogenous or endogenous agents that may influence or predict the incidence or outcome of disease. The inner cirde, biomarkers, represents the subset of these phenomena that can be measured in the human body. That almost all of the intersections between the three outer circles fall within the inner circle illustrates pictorially that biomarkers, more than any other epidemio.. logical measure, may measure elements of any two, or all three, of genetic factors, environment
and disease. For example, the activity of an inducible, carcinogen-metabolizing enzyme is influenced by both exposure to inducing agents and the host genetic constitution; blood choles-terol concentration, an indirect indicator of fat nutrition, is almost certainly influenced by the presence of early cancer (International Collaborative Group, 1982; Sherwin et aL, 1987); presence of СС-ТТ mutations in the p53 gene in normal skin, a plausible marker of lifetime exposure to UV radiation (Nakazawa et a1., 1994), is also influenced by DNA repair enzymes (genetic susceptibility) arid may be influenced by the pathological conse-quences of p53 gene mutation (e.g. a proliferative advantage for the mutated cells). The practical consequences of this complexity have not yet been elucidated.
In many cases, as measurements get closer to the biologically effective dose of an external agent at its target tissue, the relationship between the biomarker and disease will be less likely to reflect the relationship between the amount of external exposure to the agent and disease. However, exposures from multiple sources, such as nitrate, which may include exogenous pathways, may be better evaluated using biomarkers.
Because of the complexity of the interrelation-ship between biomarkers, their potential for increasing knowledge about cancer epidemiology and pathogenesis is now emerging. Research is needed to explore the methodological characteris-tics and biological functions of specific biomarkers and how they relate to one another. Most particu-larly, their application in epidemiological studies should be undertaken after thorough preparation and interdisciplinary collaboration. Even then, interpretation of results must be undertaken with appropriate caution.
Epidemiological study design and analysis The use of biomarkers of exposure or dose, disease or individual susceptibility aims to contribute to the elucidation of the causal relationships in human populations between diseases and factors such as external exposures (via personal habits, occupation and the ambient environment), genetic traits and interventions.
The types of epidemiological studies used in biomarker research closely parallel the types used in other fields of epidemiology; biomarker studies,
2

Workshop report
however, raise specific methodological issues which are addressed in the following sections.
Transitional studies Tтaпsitional studies provide a bridge between the use of biomarkers in laboratory experiments and their use in cancer epidemiology studies (Schulte & Perera, this volume). They have as their outcome the characterization of biomarkers and of the problems in their use; thus, they yield preliminary results rather than end. results about cancer etiol-ogy and prevention. Their intent should be to lay the groundwork for the use of a marker in full-scale epidemiological studies by addressing the follow-ing aspects: intra- and intersubject variability; the feasibility of marker use in field conditions; potential confounding and effect-modifying fac-tors for the marker; and mechanisms reflected by the biomarker. Transitional studies can be divided into three functional categories: developmental, characterization and applied studies.
Developmental studies involve determining the biological relevance, pharmacokinetics, repro-ducibility of measurement of the marker and the optimal conditions for collecting, processing and storing biological specimens in which the marker is to be measured.
Characterization studies involve assessing inter-individual variation aid the genetic and acquired factors that influence the variation of biomarkers in populations. This includes assessing the fre-quency or level of a marker in populations, identi-fying factors that are potential confounders or effect modifiers, and establishing the components of variance in the biomarker measurement, la-boratory variability, intra-individual variation and interindividual variation. The ratio of intra-individual variation to interindividual variation has important implications for study size and power.
Applied transitional studies assess the relation-ship between a marker and the event that it marks, namely exposure, pre-clinical effects, disease or susceptibility. Applied studies are often of cross-sectional or short-term longitudinal design, and are not intended to establish or refute a causal rela-tionship between a given exposure and disease. Rather, they are intended to assess whether rele-vant correlations exist and if they are strong enough to be useful in full epidemiological studies.
Like other studies using biomarkers, transitional studies raise ethical issues when the meaning of the biomaikei results is not known. The objectives of the research generally are not to identify health risks but to identify characteristics of the bio-marker or distribution by population subtypes. There is a need to anticipate the impact of transi-tional studies on study participants and plan to address their concerns (Hunter, this volume). Cohort and case-control studies Cohort and case-control studies represent the two most widely used types of observational study (Potter, this volume). They can be population-based or based on patients at a hospital, clinic or practice. For simplicity, studies based on patients will be referred to throughout as clinic-based stud- ies.
In clinic-based cohort studies, of treated patients or screened populations, the inclusion of biologi-cal measures of exposure and susceptibility is both methodologically sound and logistically feasible. In population-based studies, collection of biologi-cal material for such markers is feasible but logisti-cally more complex. For early outcome markers, collection of material (e.g. precancerous lesions) is logistically feasible in a hospital setting, but becomes more difficult in the population setting. End-points assessed routinely at a variety of institutes may produce major problems of stan-dardization of methods (e.g. histological diagnosis). Except for some routinely registered biological characteristics (e.g. receptor status in breast сап cer), even greater problems attend the issue of identification of biologically or pathologically defined disease subsets.
Most of the considerations that make pros-pective cohort studies an attractive study design apply to all methods of exposure assessment, including biomarkers. The strengths of such stud-ies include the fact that exposure is measured before the outcome, that the source population that gave rise to the cases is explicitly defined, and that participation can be as high as 100% if speci-mens are available for all subjects and follow-up is complete. Weaknesses of prospective cohort stud-ies involving biornarkers include the usually small number of cases of each of many types of cancer, the lack of specimen if the biomarker requires large amounts of specimen or unusual specimens, degra-dation of the biomarkers during long-term storage,
s

Applicatioл of Biomarkers in Cancer Epidemiology
and the lack of detail on other potentially con-founding or interacting exposures. Cohort studies arе, in principle, the preferred method for studying the temporal sequence of intermediate end-points; however, the costs and complexity of repeated screening may often make this difficult.
Important issues in prospective cohort studies involving biomarkers, especially of exposure, involve the frequency and timing of specimen collections. А major concern in cohort studies of short duration (as in case—control studies) is the possibility that the disease process has influenced the biornarker level among cases diagnosed within 1-2 years of the specimen being collected. Iп stud-ies of longer duration, there may be considerable misclassification of the aetrologicallÿ relevant exposures if specimens have been collected only at baseline. This misclassification occurs not only because an individual's exposure level may change systematically over time, but also because there may be considerable intra-individual variation (from day to day or even hour to hour) in bio-marker levels. The effects of intra-individual varia-tion can be reduced by taking multiple samples, but this greatly increases the expense of sample collection and storage and the burden on study subjects; similar considerations apply to taking samples at several points in time in an attempt to estimate time-integrated exposures or exposure change. An alternative approach is to estimate the extent of intra-individual variation, and the mis-dassification involved in taking single specimens, by taking multiple specimens in a sample of the cohort. This information can be used to correct for bias to the null introduced if the misclassification is non-differential, and therefore de-attenuate observed relative risks.
Use of biomarkers of disease susceptibility in cohort studies raises significant ethical issues, par-ticularly if there is repeated contact with study sub-jects. In particular, informing the cohort members of their biomarker level is problematic if the bio-marker is not considered to be sufficiently predic-tive of disease, and if there are rio known preven-tive steps cohort members can take to reduce their risk of the disease.
A nested case—control study or a case—cohort design can be used to reduce the expenses of data collection and sample analysis. In a nested case—control study, biological samples may be col-
lected from all cohort members and stored at the beginning of the study; the controls are then selected throughout the course of the study, ideally at the time that each case is diagnosed. An advan-tage of the nested case—control approach is that biomarkers can be measured in specimens matched on storage duration and casecontrol sets can be analysed in the same laboratory batch, reducing the potential for bias introduced by sample degra-dation and laboratory drift. On the other hand, a case—cohort design may be used when sample col-lection from the entire cohort is not feasible, or when the cost of storage or analysis of each sample is prohibitive. This design involves collecting biological samples from the cohort at the begin-ning of follow-up and then collecting samples from cases as they occur. However, as samples are being taken at different times for cases and 'controls' (i.e. the reference sample from the entire cohort), bias will be introduced if sample degradation or laboratory drift occurs over time. Furthermore, the case—cohort approach may lead to laboratory personnel being unblinded to case and control status.
In case—control studies, biomarkers of internal dose or effective dose are appropriate when they are stable over a long period of time (e.g. carrier status for infectious agents, such as HBsAg) or when exposures have been constant over the rele-vant exposure period; however, it is essential that they are not affected by the disease process, diag-nosis or treatment (except in those circumstances when it is possible to collect specimens prior to the commencement of treatment). For genetic suscepti-bthty markers, case—control studies are highly appro-priate. Clinic-based case—control studies are partic-ularly suitable for studies of intermediate end-points, as these end-points can be systematically measured. Population surveys (or screening) are a prerequisite for the identification of cases in popu-lation-based case—control studies of intermediate end-points.
Clinic-based case—control studies are of particu-lar value for studying the etiology of precancerous lesions (e.g. early cervical intraepithelial neopla-sia). None the less, the relation between these intermediate disease markers and the cancers of which they are precursors is usually difficult to study for both ethical and logistical reasons. In case—control studies involving cancer as the end-
4

Wойuhop report
point, biomarkers of exposure (though not of any given genotype) are of limited value, as the disease itself, its therapy, or behaviour changes iii patients, may alter any exposure marker or biological process thought to be a precursor of disease.
Case–case comparisons can be useful in the study of biologically defined disease subsets when differences in the etiology of such subsets are being examined. However, if a control group is not in-cluded, any heterogeneity in the exposure associa-tions among disease subsets may be the result of increased risk in one subset as opposed to a decreased risk in another.
Intervention studies Intervention studies (trials) assess prospectively whether an intervention is efficacious in changing the frequency of a marker of exposure or dose (e.g. measures to encourage smoking cessation and either serum cotinine or protein or DNA adducts) or pre-clinical condition or disease (e.g. р53 mu-tation, dysplasia and cell proliferation in trials using antioxidants to prevent second tumours). Biomarkers can be particularly valuable in assess-ing compliance with the intervention (e.g. serum R-carotene in a randomized trial of (3-carotene). Markers of susceptibility (e.g. GSTM1 polymor-phism) could be used to determine whether groups in various intervention arms are comparable. Intervention studies may also be conducted as transitional studies when there aie stiff questions about the response of biomarkers following an intervention. Critical in all types of intervention studies is the need to address those same issues that are important in cohort studies, including lab-oratory drift, loss to follow-up, and intervening exposures that may affect the biomarker.
Ecological studies Ecological studies use groups rather than individuals as units of observation. They include studies of geographical differences and tinte trends in disease incidence and prevalence. While ecological studies provide useful information on exposure, disease and modifying factors, they are, in most cases, inadequate to establish causal relationships. Although, in general, ecological studies based on biourarkers have the same advantages and limita-tions as the other types of ecological studies, it is possible to conduct carefully planned ecological
studies, in particular in the control of confounding. Such studies often do not seek to make causal infer-ences about exposure– disease relationships; rather, they are aimed to elucidate plausible mech-anisms (Kuopio et al., 1995).
Cross-sectional studies Cross-sectional study designs, with single or repeated sampling, have been frequently used in the validation of markers of exposure and of dis-ease. They can provide a useful snapshot of the relationship between exposure and susceptibility factors, on the one hand, and the selected bio-marker, on the other, in populations whose expo-sure can be well characterized. Frequently, the studies have involved industrial populations, chemotherapy patients and smokers—all groups exposed tô 'model' carcinogens—and have com-pared them to appropriate non-exposed groups. Such studies can also be used in healthy individu-als to establish the possible range of measurements of protective factors, e.g. monitoring of vegetable intake by measurement of caroterloids or phenolic compounds in plasma and urine. This design can be used to establish an association between the biomarker and the exposure under study.
Family-based studies Family studies are intended to address scientific questions related to four general areas of research:
1. Does familial aggregation exist for a specific disease or characteristic? 2. Is the aggregation due to genetic factors or environmental factors, or both? 3. If a genetic component exists, how many genes are involved and what is their mode of inheritance? 4. What is the physical location of these genes and what is their function?
Using linkage methods, biomarkers that charac-terize known DNA haplotypes have been instru-mental in locating a number of cancer-related genes. These studies require relatively large amounts of germline DNA (usually represented by DNA ex-tracted from white blood cells). This is because there are multiple marker loci that require evalua-tion. Once a locus is identified, further DNA is necessary to identify the gene. Often, fibroblast or
5

Application of Biomarkers in Cancer Epidemiology
Epstein-Barr virus (EBV)-transformed cell lines are required to provide adequate DNA for these studies.
special concern must be paid to ethical and counselling issues in family studies in which bio-marker results for an individual may also have pre-dictive value for other members of the family.
General issues in study design and analysis As with other epidemiological studies the design and statistical analysis of a study involving bio-markers involves iп general: (1) relating a particular disease (or marker of early effect); (2) to а particular exposure; while (3) minimizing bias; (4) controlling confounding; (5) assessing and minimizing ran-dom error; and (6) assessing interactions (Pearce & Boffetta, this volume).
Many studies using biomarkers of disease are of cross-sectional design and measure the prevalence of the disease state, which is dependent on both its incidence and its duration. Thus, in a study exam-ining markers of cell damage as an effect of expo-sure to known or suspected carcinogens, the results would depend on factors such as the turnover of the cells in which the marker is measured and the capacity to repair the damage.
When deciding whether to measure exposure with biomarkers, it is important to consider how useful and informative the biomаrkers are in rela-tion to the study hypothesis. This is a particular issue for exposures that change over tinge; for example, a biomarker may be more valid than a questionnaire in assessing exposure to HPV, whereas a questionnaire will be more valid than a biomarker in assessing cigarette smoking 10 years previously. It should be stressed that the concept of useful and informative' depends on: (1) whether, in principle, it is most appropriate to study exter-nal exposure or internal dose (i.e. which hypothe-sis is being tested); (2) what information is avail-able for the etiologically relevant time period; (3) whether the exposure or dose measurement is sub-ject to intra-individual variation; and (4) whether it is desirable and possible to obtain (with a bio-marker) information on interindividual variation in exposure or biological response.
When exposure or disease is measured with bio-markers, it is important to ensure that any mis- classification is non-differential (i.e. it applies equally to the groups being compared) and is as small as possible. However, because the relation-
ships between exposure, marker and disease are, in most cases, obscure, the capacity to establish the presence or absence of misclassification in the interpretation of the findings of biomarker-based studies is limited.
The use of biomarkers of exposure does not reduce the need to control for confounding and, in some instances, the use of biomarkers may actually introduce confounding into a study (Pearce & Boffetta, this volume). Confounding can be con-trolled in the analysis by stratifying the data into subgroups according to the levels of the con-founder(s), or by the use of mathematical model-ling. However, problems of multicollinearity can occur when variables that are highly correlated (e.g. serum levels of various micronutrients) are entered simultaneously into a model; this will make the model unstable and can lead to invalid effect estimates.
Some biomarkers may be surrogates for inter-mediate stages in the disease process. For example, when the relationship between reproductive risk factors and cervical cancer is adjusted for HPV sta-tus, the relative risks for number of sexual partners are reduced. This suggests that HPV is a mediator of the relationship between the reproductive risk factor and cervical cancer, helping to substantiate the causal role for HPV. In cases such as this, the biomarkers should not be treated as potential con-founders, i.e. they should not be adjusted for in the analysis. None the less, analyses alternatively including and excluding the putative intermediate can be used to help determine causal pathways.
When choosing the method of exposure or dose assessment, it is important to consider their impli-cations on study size, particularly when an expen-sive or invasive method may be used. An additional consideration in study size estimation is the ratio of the number of assays per individual and the number of individuals in the study. lany biomarkers show marked variation from day to day within the same individual (in part from problems of repeatability of the laboratory tests, but also from genuine dif-ferences), and in some cases the intra-individual variation may be greater than the irnterindividual variation (e.g. 24-h urinary sodium measurements). Thus, it is important to take into account the trade- off between including more participants, on the one hand, aid gathering multiple samples from each participant, on the other. It is essential that

Workshop report
the relative magnitude of intra-individual varia-tion of a biomarker is adеquately characterized.
Biornarkers present better opportunities for assessing interactions between genetic and envi-ronmental factors. In particular, to infer interac-tion, biomarkers of genetic susceptibility should show a higher disease risk in exposed susceptible groups than in exposed non-susceptible and in non-exposed groups. None the less, such testing for interaction usually requires a substantial increase in study size.
As is the case for other aspects of epidemiological research, if the relative risk between a biomarker and exposure or outcome is not very strong (e.g. less than 10), then results from multiple studies will be required before agreement on the existence of an association can be reached. It is critical, therefore, that the results from all existing studies are available. Unfortunately, the tendency for investigators and journals to publish only 'positive' results may bias the literature in favor of positive studies, a phenomenon often called 'report bias' or 'puNicatiori bias'. Biomarker research may be even more prone to this bias than other fields of epidemiological research, as multiple biomarkers may be assessed, sometimes at relatively low cost. It is important that investigators publish, or make available in abstract form, all their results from studies in which the results are reliable, even if these results are 'null'. Publication bias can be particularly relevant when several analyses of the data are done on subgroups of the study population, defined according to сhaгaсtегistiсs such as tumour markers or susceptibility gene polymorphisms. Such multiple analyses increase the probability to obtain significant results by chance only. Although these analyses may provide useful information on effect modifiers, the selec-tive reporting of significant or 'positive' results should be discouraged.
Incorporation of biomarkers into epidemiological studies Biological markers undergo a process of discovery, characterization and refinement before use in epidemiological studies. Animal studies contribute to the development and validation of biomarkers and provide insights into the mechanisms of the multistage process of carcinogenesis. TraпsitioпaI studies assist in this process by optimizing sample
processing, evaluating intra-individual and inter-individual variation in the biomarker in target populations, determining laboratory assay varia-tion, and studying the impact of exogenous and endogenous influences on the biomarker.
Regardless of the specific protocol used for the collection, processing and analysis of a specific bio-marker, two important issues to consider are the storage of biological samples and the evaluation of sources of variation in biomarker measurement. This section will therefore review storage and vari-ation issues following the discussion of individual biomarkers.
The following biomarkers have been selected to demonstrate the wide range of assays available for incorporation into epidemiological studies, and to comment on their utility for various study designs relevant to the study of cancer. This is not meant to be a comprehensive list; other important cate-gories of biomarkers in blood (e.g. immunological markers) and in normal and preneoplastic tissue are not addressed here.
Biomarkers of biological agents Biological agents associated with chronic infection and subsequent development of cancer are mea-sured using serological or nucleic acid markers (Munoz & Bosch, this volume). An example of nucleic acid-based biomarker is HPV DNA detec-tion where the presence of type-specific DNA at a given time is measured by PCR-based assays. Cohort studies having high-grade squamous intraepithelial lesions as the end-point have shown that the infection preceded the disease. HPV DNA infections are often transient, especially in young women. Therefore, repeated sampling is required to assess persistent HPV infections. Accurate serologi-cal assays aimed at distinguishing transient from persistent infections need to be developed. Another example is the hepatitis B virus (HBV), for which there are serological markers that distin-guish between past and persistent infections. HBV DNA detection in sera further refines the assessment of exposure. These markers have been used in all types of epidemiological design (cross-sectional, case—control, cohort arid intervention studies).
Biomarkers of internal dose for chemical exposures Biomarkers of internal dose of external chemical exposures are measurements of a parent compound
7

Application of Biomarkers in Cancer Epidemiology
or its metabolite(s) in an accessible biological matrix, such as serum or urine (Institute for Environment and Health, 1996). They have poten-tial applications in several types of epidemiological studies (Coggon & Friesen, this volume). These include studies to establish the importance of dif-ferent sources of exposure as determinants of total dose; studies to validate other methods of expo-sure assessment such as the use of questionnaires; studies to establish that a chemical reaches a sus-pected target tissue; cross-sectional studies relating exposure/dose to biomarkers further downstream in the exposure—disease continuum; and case—control and cohort studies relating exposure/dose to disease.
The utility of an internal dose marker in case—control and prospective cohort studies depends, in part, upon the half-Iife of the external agent от its metabolites in the body; the pattern of the exposure it is measuring (e.g. regular, daily exposure versus infrequent, episodic exposure); whether secular trends have occurred in that expo-sure (e.g. smoking cessation); and direct or indirect influences of the disease process. The information that a biomarker of internal dose provides must be compared to the availability and quality of other sources of data (e.g. questionnaires, environmental measurements, medical records). Essentially, all exposure measures misclassify some subjects on their usual pattern of exposure; it is the relative ability of different sources of data to place individ-uals correctly into exposure categories that is important. In case—control studies, questionnaires remain the primary source of exposure data. There are, however, a few instances where a measure of internal dose may be a more suitable measure of cumulative exposure, particularly in the study of cases with preneoplastic lesions or early disease. The ideal biomarker should persist over time (e.g. fat-soluble substances such as DDT metabolites) and should not be affected by disease status. Markers of internal dose may be useful in prospec-tive cohort studies as long as components of vari-ance of the biomarker are well characterized, since the problem of reverse causality (i.e. disease status affects the level of the biomarker) is minimized.
Biomarkers of dietary intake and nutritional status Dietary intake is usually assessed by various types of questionnaire and other methods (e.g. diaries); however, there are many sources of error involved
in using this approach. Biomarkers can be useful in nutritional epidemiological studies at two different levels (Kaaks et al., this volume). First, biomarkers may be of interest as potentially more precise, more specific or more objective measurements (or correlates) of the intake levels of specific foods or food constituents, compared to measurements obtained with questionnaire and interview methods. Secondly, most biomarkers can also be seen as indi-cators of a nutritional/metabolic status, which may be intermediate between `exogenous' nutritional lifestyle factors (e.g. the composition of diet, phys-ical activity) and disease risk. When used as an indicator of intake, they are useful in four different types of study: validation (comparison of a mea-surement against a gold standard), calibration (comparison of two measurements), observational epidemiological and intervention studies. They are especially important in validation or calibration studies where biomarkers represent an additional category of measurement, the `random' errors (i.e. variations that are independent of individuals' true habitual intake levels) of which can be assumed to be statistically independent of those of the ques-tionnaire and other methods. The factors that are important in deciding whether to use a given bio-marker in a particular study include whether it is a good indicator of intake; whether it is a long- or short-term marker; whether there is need for multiple measurements; whether it is acceptable to the researcher and the subject; and whether it is compatible with the design of the study itself (case—control of early disease, case—control of late disease, or a cohort study). Biomarkers can also be informative if they provide an integrated biologi-cal measure of intake, lifestyle and metabolic processes. For example, measurements of red cell folate coupled with serum homocysteine would offer a picture of medium-term intake of folic acid, which is distinguishable from transient fluctua-tions in dietary intake (Green & Jacobsen, 1995).
Biomarkers for endogenous hormones Biomarkers are available to measure specific` endogenous hormones (Lemaster & Schulte, 1993; Hulka et al., 1994). Cross-sectional studies, where the biomarker is the outcome measure, are impor-tant for the assessment of differences in marker levels between subjects with different characteris-tics (e.g. sex, race, anthropometry, geographical

Workshop report
location). A case—control study is not an appropri-ate study design to asséss associations between metabolic and hormone markers and disease out-come, since marker sampling occurs after the clinical appearance of disease. This problem may be less significant от insignificant if the outcome is a pre-clinical condition or a very early lesion. Cohort studies including case—control studies nested within cohort studies, are ideally suited for evaluating thé association between hormone bio-markers and disease. sampling issues important in cohort studies are the frequency of sampling and the timing of collection in relation to events which may influence measurement (e.g. stage of men-strual cycle, menopause, oophorectomy, ageing, medications).
Macromolecular adducts as biomarkers of exposure to reactive chemicals Chemicals can bind covalently to cellular macro-molecules such as nucleic acids and proteins (Wild & Pisani, this volume). The product of this addi-tion of a chemical moiety to a macromolecule is termed an `adduct'. The adduct may be highly spe-cific for the carcinogen of interest, but not neces-sarily specific for a given exposure because of mul-tiple sources of the carcinogen within the envi-ronment. Adduct formation normally occurs after the metabolic activation of the carcinogen; DNA repair znлу follow adduct formation. As a result, measured adducts represent an integration over time of carcinogen exposure and interindividual variations in carcinogen metabolism, DNA repair and other host factors. The persistence of adducts is determined by the chemical stability of the adduct itself and the turnover of the macromole-cule to which the chemical is bound. In practice, this gives a half-life of adducts on proteins (haemo-globin and albumin) of a few weeks to months, while DNA adducts may have half-lives of a few hours to several years depending on the cell type concerned. Adducts of more remote exposure (such as modified amino acids in histone proteins from non-dividing cells) would represent a major advance in the utilization of these markers in epi-demiological studies. Adduct measurements can be made in blood and exfoliated cells, and metabo-Iites of adducts can be measured in urine. The quantity of material required is dependent on the assay sensitivity for a given adduct.
Cross-sectional studies evaluate exposure—adduct relationships in populations currently exposed to agents of concern. Elevated adduct levels in an 'exposed' versus 'unexposed' popula-tion may suggest that the exposure is associated with a higher cancer risk, given the increasing evi-dence that DNA damage represents a primary mechanism of carcinogenesls. In this instance, the adduct is not being used as a dosimeter, but rather as evidence of a potentially harmful response in vivo. Such studies should be regarded as providing supporting evidence only, until the association of adducts with subsequent development of cancer has been demonstrated. It is relevant to note, how-ever, that in the presence of limited epidemiological evidence of a chemical's carcinogenicity, the demonstration in humans that the chemical causes a dose-dependent increase in macromolecular adducts or in other biomarkers that reflect geno-toxic damage provides supporting evidence that the chemical is carcinogenic to humans. This type of evidence has been used, for example, in the recent IARC evaluation of carcinogenicity of ethylene oxide within the Monographs programme (IARC, 1994).
The utility of using adducts as markers of bio-logically effective dose is limited in case—control studies due to the relatively short half-life of most adducts evaluated to date. They may have utility in prospective cohort studies, again with the caveats previously described for all exposure markers.
Biomarkers of somatic сеll mutations Somatic mutations provide evidence of irreversible genetic damage (Albertini & Hayes, this volume). Furthermore, specific mutations (mutation spec-trа) may, in principle, identify exposures to specific agents or mechanisms; however, measurements of mutations are usually less sensitive in this regard than are other biomarkers of exposure (e.g. metabolites, adducts). 5отаtiс mutations should have their greatest utility in epidemiological stud-ies when it is possible to establish a qualitative association between exposure and specific muta-tions, thus identifying the agents of concern. They also have promise as surrogate markers of out-come. It must be emphasized, however, that for this last purpose, mutations must initially be assumed to be associated with increased risk of can-cer. In-vivo mutational response may also be used
9

Application ы Biomarkers in Cancer Epidemiology
to define interindividual differences iп sensitivity to mutagens or carcinogens.
Somatic mutations have potential application in case control studies when the exposures of con-cern are chronic and stable, and the disease does not alter mutagenic responses in the test cells. Their greatest utility, however, may be in studies that use mutations as an intermediate end-point to evaluate genetic responses under various expo-sure conditions and in studies concerned with pre-vention. There is a need in the future for rapid, iriex-pensive and sensitive molecular assays that may increase the range of genes and tissues amenable for study; this, in turn, should facilitate the evaluation and potential use of those biomarkers as surrogates of disease-relevant genotoxic responses.
Biornarkers of cytogenetic damage Chromosomal aberrations are commonly found in tumour cells and, in some cases, there is very good evidence that they play a causative role in carcino-genesis (Tucker et aL, this volume). Two prospec-tive cohort studies have shown that chromosomal aberrations measured in peripheral lymphocytes were associated with an increased risk of cancer (Hagmar et a1., 1994; Bonassi et aL, 1995). Non-target cells may be appropriate tissue for this marker. Translocations, in particular, are useful for quantifying certain types of acute and chronic exposure, as well as exposure that occurred many years previously. Translocations are therefore a rea-sonable and appropriate biomarker for use in cross-sectional studies because they provide a direct and quantifiable indication of DNA damage. In case—control studies, the analysis of stable transloca-tions in early, local disease may provide an insight into accumulated cytogenetic damage and its link with cancer. It is possible, however, that the fre-quency of translocations is affected by advanced disease, but this remains to be established. The use of translocations in prospective cohort studies could have substantial utility but is limited by the logistic constraints of culturing or cryopreserving lymphocytes from a large number of subjects.
The analysis of translocations by fluorescent in-situ hybridization (FISH) with probes that paint whole chromosomes represents an important advance in cytogenetics; FISН is a rapid, sensitive and highly reproducible technique which relies on the detection of colour `junctions' between
painted arid unpainted chromosomes. Improve-rпents in the techniques of molecular cytogenetics continue to be made, and new DNA probes are being developed iii a regular basis. Cytogenetic assays have been performed on metaphase cells, but the more recent applications of F151 to inter-phase cells means that cell culture is no longer required and that relevant target tissues can be examined directly for chromosome reanange-ments. The analysis of interphase cells appears to have significant promise for use in future epi-demiological studies and may make the banking of the relevant tissues from a large numbers of sub-jects feasible.
Biomarkers of genetic susceptibility Biomarkers have increasingly played a role in studies that evaluate the role of genes in cancer (Caporaso & Goldstein, this volume). Family-based studies have led to the mapping of several cancer-related genes characterized by high penetrance, high absolute and relative risk, but low attributable fraction for the most common cancers. The envi-ronment plays a variable but arguably small role in the manifestation of these genes. Other genes (e.g. metabolic polymorphism genes that lie in the metabolic pathways of carcinogens and therefore have a mechanistically plausible role) are charac-terized by modest relative risks, low absolute risks and high attributable risks. The environment is crucial in determining the effects of these genes. A major contrast between these two is the low preva-lence of the former and the high prevalence of the latter.
For a given genotype, the phenotype is deter-mined by the penetrance. The use of phenotype or genotype in a specific study depends on numerous factors. In general, the methodology of genotyping has increased because of rapidly improving tech-nology. Recent advances in the analysis of genetic polymorphisms using DNA present in serum, in formalin-fixed, paraffin-embedded pathology sam-ples and in material collected non-invasively by buccal swabs and oral rinses will provide new opportunities for incorporating biomarkers of genetic susceptibility into epidemiological studies.
Tumour biomarkers Tumour markers include characteristics of tumours at the anatomical, histological, serum, chromosomal
10

Workshop report
and molecular levels (Zhang et al., this volume). Using tumour markers in the assessment of etio-logicaI heterogeneity represents а progression from these previous studies and may have greater speci-ficity for particular patterns of exposure. Tumour markers can readily be incorporated into case series and case—control studies, as well as into prospec-tive studies that study the relationship between biomarkers in an initial tитоит and the risk of developing second primary tumours or the rela-tionship between precursor lesions and subsequent malignancies. There is a rapidly increasing ability to evaluate а range of tumour markers in formalin-fixed, paraffin-embedded tissue. Frozen tissues are easier to assay, but more difficult and costly to obtain and store for epidemiological purposes.
Evaluating sources of variation in biomarkers Before embarking on an epidemiological study that uses a biomarker, it is important to under-stand the potential measurement error in the bio-marker (Gompertz, this volume; Vineis, this vol-ume; White, this volume). The researcher's first concern should be to prevent or rule out, as far as is practicable, differential measurement error. Because differential measurement error can bias the odds ratio in either direction, its presence to any appreciable degree in a biomarker will invali-date its use in an epidemiological study. Differential measurement error is a particular con-cern in case—control studies and among the early cases in cohort studies when the marker may be influenced by pre-clinical disease, by the effects of the disease after diagnosis or by treatment.
When differential measurement error is not likely to be present, the researchers should focus on assessment of the non-differential error, or at least some of the major components of error in the biomarker. Error components include laboratory variation, variation from specimen collection and storage, and biological variation. The latter may be short-term (e.g. day to day), medium-term (e.g. seasonal), or long-term (e.g. variation over an etio-logically relevant period of years). Ideally, one would conduct a validity study in which the bio-marker to be used was compared to a perfect (true) measure. However, much of the total error can be measured in a well-designed reliability study which requires the collection and analysis of two (or more) specimens from a group of subjects in a
way that the error in one measure is not repeated in another, e.g. the two specimens are collected at different times over the relevant etiological time period, and handled, stored and analysed with the variation in specimen collectors, laboratory tech-nicians or batches that would occur in the parent epidemiological study.
Similarly, reliability studies could be designed to partition the specific components of error: the effects of handling and storage; laboratory varia-tion; and short-, medium- and long-term biologi-cal variation. In any case, researchers should not assume that small laboratory error implies that a measure is good, because these other sources of error introduced by the design and needs of the epidemiological study can be far greater than the laboratory measurement component of error.
storage of biological samples The use of biological markers in epidemiological studies often requires storage of the relevant bio-logical samples for a period of time, which may vary from a few weeks up to years or even decades, depending on the study design (i.e. cross-sectional, prospective) and the timing of the laboratory analysis (Landi & Caporaso, 1997, this volume). Factors that can be considered in the choice of storage method include the type of biological material; the type of laboratory analysis planned; the duration of storage and spread over time of laboratory analysis; and the logistical and practical conditions. For long-term storage of a large collec-tion of blood samples, the safest and, in most cases, the most efficient method of storage is at liquid nitrogen temperature.
storage temperature should be as low as possible, depending. on the biological material, and should ensure stability of all potential analyses over long periods of time. For very long-term storage, it is worthwhile to store pools of biological specimens containing known concentrations of the aпalytes of interest in order to be able to monitor possible degradation over time. A stable isotope standard may be useful in such cases.
Application of biomarkers Biomarkers may be used in epidemiological studies to increase the information obtained from classical study designs and to expand the areas of scientific inquiry to which epidemiology can contribute. Use of

Application of Biomarkers in Cancer Epidemiology
biomarkers in epidemiological research has grown significantly in recent years and can be expected to increase rapidly in the years ahead. The areas of application include research on etiology of disease; correlation between external exposure and internal dose; susceptibility and gene- nvironment inter-action; clinical trials; disease mechanisms and pathogenesis; and cancer prevention.
Etiological epidemiological research In etiological research, biomarkers of exposure rep-resent the independent variable and are used to predict disease occurrence. Research of this type has been limited in the past because of the need for transitional studies to develop, characterize and evaluate biomarkers in their application. When biomarkers are tested as outcome variables they are useful in often being much more prevalent in the population than cancer itself and they occur much closer in time to the exposure than does can-cer; exposure will therefore be measurable more accurately by whatever method is used. The major-ity of epidemiological biomarker research reported to date has been from transitional studies. As this body of literature has accumulated, it is now becoming possible to use selected biomarkers in the context of classical etiological research.
At current levels of development of biomarkers, there will still be many circumstances in which questionaire methods of assessing exposure are complementary or preferable to technically sophis-ticated biomarkers of the same exposure. Assays of urinary levels of metabolites of tobacco compo-nents such as nicotine, for example, reflect only short-term consumption. 5uсh assays tell us about smoking habits in the relatively short time before measurement; questionnaires are still preferable to determine long-term exposure.
Etiological studies using biomarkers generally employ case-control or cohort epidemiological designs. Modifications of these are the case-case design and the applied transitional study. The case-control study nested within a cohort offers distinctive opportunities by using blood or tissue collected in the past.
The use of biomarkers in case-control studies may necessitate greater use clinic-based (or hospital-based) studies (Potter, this volume), Clinic-based studies of biomarkers may be more feasible, practi-cal and economical. They also have a higher
response rate with respect to collection of biologi-cal samples than community-based studies, and differential participation by cases and controls is less of a problem. For casе-сontrol studies of pre-cursor lesions, no population-based registries exist from which to identify cases, whereas such cases can be identified in the health care setting and, given appropiate survey conditions, in random samples of the population. In cohort studies, where the biomarker is the exposure of interest, uriexposed subjects, defined as people not carry-ing the biomarker, may be identified through the health care setting. Tissue specimens may be avail-aЫe only through pathology departments associ-ated with hospitals. Opportunities to obtain speci-mens may be enhanced if health care providers are co-investigators in the research. The method for selecting study subjects is an important potential source of bias in clinic-based studies. In studies based on biomarkers, however, it may be less important than in other types of epidemiological studies, because the characteristics of the subject measured by the biomarker (e.g. genetic polymor-phism status) may not be linked to the probability of inclusion in the study. similarly, it is unlikely that markers of exposure and effect are affected by referral and detection, since the individual's bio-marker status prior to the study is not known. In most cases, however, it is unknown how subjects are selected with respect to the biomarker, and the passibility of selection bias should always be considered.
Exposure-internal dose and exposure-biological response correlations Transitional studies of exposure frequently corre-late external exposure measured in a traditional fashion (e.g. interview or ambient monitoring) with internal dose measured in body fluids or tissues. These studies are generally cross-sectional or short-duration longitudinal in design. The exogenous measure is considered the independent variable, and the internal dose the dependent vari-able. Rather than an internal dose measure, the dependent variable can be a biological response marker, e.g. a p53 signature mutation associated with aflatox1rn exposure (Links et al., 1995). Such transitional studies frequently focus on heavily exposed (and unexposed) persons in order to min-imize sample size aid maximize the opportunity
12

Workshop report
to identify arid characterize the biomarker. If the correlation between the two types of exposure measurements is high and can be quantified with good precision, future studies may be able to employ the more easily obtained and inexpensive exposure measurement.
susceptibility and gene—environment interaction Studies of susceptibility and gene environment interaction are emerging as an important compo-nent of epidemiological research (Garte et ai., this volume). This represents a significant development in epidemiology; it emphasizes the importance of individual differences and the combined influence of genes and environment in determining disease risk. Although relevant genes lie in a continuum with iespect to prevalence and expressivity, a dis-tinction should be made between single gene mutations of large effect and polymorphisms of small effect. BRCA1 exemplifies the former, and metabolizing enzymes for substrates that form carcinogenic metabolites illustrate the latter. Intermediate situations exist in individuals heterozygous for some genes, such as ataxia telang-iectasia, which may affect a large proportion of the population, aid for which there is some evidence of increased risk of various cancers, including breast cancer (Easton, 1994). Because estimates of cancer risk in relation to single gene mutations have been derived from high-risk families, it is not yet known what the cancer risk is for gene carriers within the general population. There is a need for epidemiological studies of cancer in the general population to study risk in single gene carriers who are not members of high-risk families.
Several methodological issues have arisen in the context of these studies. Lack of concordance between genotype and phenotype has been re-ported and it is not easy to discern which is more informative with respect to disease effects. However, some advantages of studies of susceptibility and gene—environment interactions are the potential for case—case studies (Begg & Zhang, 1994) and for studying 'exposed' subjects only.
Khoury etaI. (1988) has described six models for gene—environment interaction. These concepts may be simplified by considering the possibility of a main effect and effect modification for both the susceptibility marker and the exposure. For some genes, the susceptibility marker can behave as an
exposure', increasing risk of disease in the entire study population. Usually, however, susceptibility is manifested as an effect modifier of exposure. If the population is stratified into two groups, based on presence or absence of the susceptibility gene, the effect of the exposure variable may be more evident in the susceptible group. It may also be useful to stratify on levels of the exposure variable, e.g. smoking or age groups, to identify qualitative and quantitative aspects of the association between the susceptibility marker and disease across levels of the exposure.
Cancer prevention In cancer epidemiology, biomarkers can be used to offer quantitative insights about biological events occurring at different stages of the pathologic process (McMichael & Hal, this volume). The improved knowledge of the natural history of can-cer should have application to research aiming at cancer prevention and control. At least three aspects of cancer prevention or cancer prevention research may make use of biological maikers. They are screening, community-based intervention tri-als and the monitoring of biomarkers as risk factors for disease. Screening may concentrate on the identification of precursor lesions or early stage disease (e.g. cervical cytology), high-risk individu-als (e.g. prostate-specific antigen, PSA) or suscepti-bility markers (e.g. BRCA1). Cervical cytology is well established as an effective tool to reduce mortality from invasive cervical cancer. PSA is con-troversial because it is not specific to invasive pro-static cancer or its precursors. It cannot distinguish between precursor lesions that will invade and the majority that will not, resulting in a significant amount of over-treatment and morbidity. Further-more, and crucially, there is no evidence that screening reduces mortality from prostatic cancer. Screening for BRCA1 became possible only recently when the gene was cloned and sequenced (Futreal et aL, 1994; Miki еi аL, 1994). Currently, testing for BRCAI has been suggested only foi women in high-risk families in whom the gene is known to segregate, or for women with multiple first-degree relatives who have had an early age at diagnosis of breast cancer. Even in these situations, screening is not universally accepted because of the limited risk and disease management options, which markediy reduce the utility of the genetic information. Even
13

Application of Biomarkers io Cancer Epidemiology
in the cases of high penetrance cancer genes, how-ever, there is the possibility to contribute to cancer prevention by modifying the environmental fac-tors that interact in the carcinogenic process.
Community-based intervention trials for risk reduction may benefit from biological markers. For example, smoking cessation trials have found that urinary cotinine levels may be a better indicator of smoking status, when measuring the trial outcome, than reports on interview or question-naire.
Monitoring biomarkers of exposure to carcino-genic agents in populations may reveal trends and assist in risk assessment in high-risk groups.
Clinical prevention trials The use of biornarkers in chemopreventive trials raises important methodological issues. The test-ing of chemopreventive agents in clinical trials using the end-point of cancer incidence requires a study period of many years, very large sample sizes and great expense. Therefore, short-term, smaller clinical trials that use surrogate end-point bio-markers (5EB) have had to be developed. A SEB may be defined as an early change during the intraepithelial, pre-invasive phase of neoplastic progression, at the molecular, cellular or tissue level, whose response to a chemopreventive agent predicts the effectiveness that the agent would have in a large clinical trial using the end-point of cancer incidence reduction (Boone & Kelloff, this volume). Examples of SEBs include computer-assisted quantitative image analysis of pathological specimens, which measures nuclear features (altered size, shape, and chromatin texture), aid cytological features by binding to chromages—anti-body conjugates. Markers and indices of prolifera-tion (e.g. Ki-67, PCNA), oncogene mutation or amplification, and allelic loss and other alterations may also be useful SEBs.
Studies are needed, however, to evaluate the validity of SEBs. To be suitable for use as an SEB, there should be evidence that the marker is a nec-essary step on the pathway to cancer, or at least very highly correlated with cancer occurrence, i.e. the attributable fraction for the marker in relation to cancer must approach 1. This evidence may be obtained primarily from observational epidemio-logical studies and clinical trials that incorporate the marker and have explicit cancer end-points.
Certain laboratory and pathology studies may also yield pertinent evidence, as in the case of the colon adenoma to carcinoma sequence. With markers having attributable fractions substantially less than 1, there may exist alternative pathways to cancer that bypass the marker in question. An exposure or intervention may operate through the alternative pathway(s) in a way that offsets the cancer effect mediated by the original marker. For such markers, inferences to cancer are problematic (Schatzkin et al., 1990, and this volume).
Although there are well-recognized difficulties in extrapolation of carcinogenesis and chemopreven-hon data from animal experiments to humans, ani-mal models provide opportunities for biomarker research. Linkages between mechanistic pathways in different species may ultimately be useful in resolving problems in inter-species extrapolation.
Ethical aspects of biomarkers in cancer epidemiology The use of biological markers presents potential ethical issues because Ыошarkеrs are obtained from an individual's unique tissues and can be used to provide important data about exposures, biological effects and susceptibility to cancer (Schulte et al., this volume). The ethical issues arise from the possibility of abuse or misuse of bio-marker data and failure to respect the rights of per-sons participating in research. Biomarker data can be misused by failing to keep data confidential and by using it, or allowing it to be used, to stigmatize research subjects. Research subjects have a right to privacy as well as a right to be told of risks of par-ticipating in biomarker studies and of any clini-cally important findings. There remains a range of opinion whether banked specimens collected for one study or purpose may be used for another. Generally, the degree of risk in participation and the extent to which the results are cknicaiy impor-tant should be considered when using banked specimens and determining whether subэects need to be notified.
Recommendations for future studies of cancer epidemiology involving biomarkers The Workshop considered the main issues regard-ing the use of biomarkers in future studies in can-cer epidemiology, and agreed a set of recommen-dations. These are presented in Box 1.
14

Workshop report
2 в • в.
1. Biomarkers should be chosen because of their biologi-
cal relevance to the question and on the basis of the sci-ence, not the technology.
2. Biomarkers should be evaluated by transitional studies before use in full-scale studies. Regulatory and funding agencies should become aware of the importance of transi-tional studies for the conduct of epidemiological studies
based on biomarkers.
3. In addition to etiological research, appropriately validat-ed biomarkers should be used in prevention: in screening, as biomarkers of neoplasia or susceptibility, in clinical trials (e.g.. Ыоmarkетs of dietary modification and compliance, and biomarkers of surrogate end points) and in monitoring exposure to carcinogenic agents (e.g. trends in biomarker status fn general populations and subgroups, .exposure sta-
tus and risk assessment iп high-risk populations, and expo
sure/susceptibility interactions).
4. Epidemiological studies based oh biomarkers should satisfy. thé requirements of good epidemiological research design, including identification and minimization of potential sources of bias and confounding. Research should be con ducted on methodological aspects to clarify advantages and disadvantages of different options in the design of biomark-er based studies, in particular 10 determine wehfher, in the clinic based (or hospital based) setting, studies of biomark ers of exposure or susceptibility are less subject to selection biases than traditional studies of behavioural and enviroп-mentâl risk factors of disease.
5. Studies should be designed with appropriate statistical power to minimize the problem of random error and maxi-
mize the capacity to establish the presence and strength of interactions, particularly between markers of susceptibility
and exposure.
6. It is important to define the components of variance in order to establish the capacity of the biomarker to measure, as precisely. as possible, the relevant exposure, process and
outcome. For continuous measurements, it is highly desir able that tha amount of random error due to within personvariability in the measurement be estimated in a subset of the study population. If this cannot be estimated directly ih the
study population, a similar population should be used be-cause the ratio of within-person to between-person variance may vary substantially between populations due to differ-епсеs in the range of exposure, or fluctuations in exposure.
7.. There should be strong and open communication between laboratory scientists and epidemiologists with regard to identification, investigation and control of specific sources of measurement error in the biomarker assay. Such
issues. would include the need for replicate measurements and standardized non-variable experimental protocols dur-
. ing the study; internal controls; operator blindness; monitor-ing expérimental drift; sample handling; and development of study design by both epidemiologists and laboratory scien-tists to deal with these issues.
B: Epidemiologists .should work closely with laboratory investigators when developing protocols for the collection, processing and storage of biological samples to ensure that the samples can be analysed for the main biomarkers of interest and that the requisite quality control procedures are implemented.
9. standardized procedures should be developed for the collection, handling, processing and storage of biological samples. A biospecirimen documentation sheet should be
generated for each biological sample collected, document-ing critical variables that may affect biomarkers
10. storage of blood samples in multiple aliquots, and ide-ally in separate freezers, is advisable whenever long-term storage and multiple measurements spread over long time periods are planned The samples should be stored at the
lowest feasible temperature. Assessment of sample stability would be facilitated by storage of aliquots of a pool prepared specially for this purpose
11 samples should be collected not only for the main bio markers of interest in a particular study; rather, they should be processed and stored in a way that allows a wide range of biomarkers to be tested in the future. In particular; con- sideration should be given to collecting a source of genom is DNA in epidemiological studies to allow the evaluation of genetic markers.: While this is optimally obtained from peripheral blood samples, various non invasive methods for
15

Application of Biomarkers in Cancer Epidemiology
ь в ► 1 јйј
collecting genomic DNA are available and continue to be
logical interpretations of results obtained from epidemiolog- developed, including the use of buccal swabs or oral rinses
ical studies using blomarkers. An iterative process is envis-
to collect exfoliated epithelial cells. aged in which epidemiological and laboratory components collaborate in efforts to define pathogenesis.
12. Where feasible, tumour pathology samples should be collected for analysis of tumour characteristics in addition to
15. Care should be taken to consider the possible ethical
histological confirmation. This generally requires collecting issues when using biological markers. Biological marker more material than is usually obtained for histological eval- data should be kept confidential and not released uation alone. If tumour blocks are available, collection of
in ways that will allow for identification of participants in
multiple slides from formalin-fixed, paraffin-embedded
research.
blocks is desirable. Availability of frozen fresh tumour and
normal tissue should be encouraged when relevant and fea- 16. When using banked specimens, the need for informed sible. consent and reporting back results to sub(ects should be
based on the degree of clinical risk associated with the bio- 13. In studies of thé .natural history of malignant disease marker. and ils prevention, it is recommended that molecular and protein alterations be studied in normal tissues; benign
17. Investigators should be encouraged to publish, or make
lesions, premalignant precursor lésions and the surrounding publicly available data involving biomarkers even if no asse unaffected tissue. This evaluation should also be extended ciations are observed. This applies in parhcular to .transi to non target tissues and to the other organ, in the case of
tional studies.
paired organs. Assays that can be applied to paraffin embedded formalin=fixed tissues are of particular impor
18. More opportunities for Joint training in both laboratory
tance to epidemiological research. and epidemiological methods should be developed.. Encouraging effective collaboration . between. laboratory-
14. Special emphasis should be given to improving'correla
based scientists and epidemiologists and the creation of lion ` between animal studies and human in vitro studies interdisciplinary programmes would foster research in this designed to further develop refine and allow for better bio area
16

Workshop report
References Begg, C.B. & Zhang, Z.F. (1994) Statistical analysis of molecular epidemiology studies employing case-series. Cancer EpidemioL Biomarkers Prev., 3, 173-175
Bonassi, S., Bolognesi, C., Аыюпdadolo, A., Barale, R., Bigatti, P., Camurri, L., Dalpra, L., DePerrari, M., Fini, A., Lando, C., Padovani, P., Pasquini, R., Stella, М. & Puntorni, R. (1995) Influence of sex on cytogeniic end points: evi-dence from a large human sample and review of the lit-erature. Cancer Epidemiol. Biomarkers Prey., 4, 671-679
Bosch, F.X., Manos, М.М., Munoz, N., Sherman, M., Jansen, A.М., Peto, J., Schiffman, M.H., Moreno, V., Kurman, R., Shah, K.V. & the IBSCC Study Group (1995) Prevalence of human papillomavirus in cervical cancer: a worldwide perspective. J. Nat! Cancer Inst., 87, 796-802
Cole, P. & Maclahon, B. (1969) Oestrogen fractions dur-ing early reproductive life ш the aetiology of breast can-cer. Lancet, i, 604-606
Dickinson, L.E., MacMahon, B., Cole, P. & Brown, J.B.(1974) Estrogen profiles of Oriental and Caucasian women in Hawaii. N. Eng!. J. Med., 291, 1211-1213
Easton, D.F. (1994) Cancer risks in A-T heterozygotes.let. J. Rad. Bio!., 66, 5177-182
Futreal, P.A., Liu, Q., Shattuck-Eidens, D., Cochran, C., Harshman, K., Tavtigian, S., Bennett, L.М., Haugen-Strano, A., Swensen, J., Miki, Y., Eddington, K., McClure, M., Frye, C., Weaver-Feldhaus, J., Ding, W., Gholarni, Z., Soderkvist, P., Teary, L., Jhanwar, s., Berchuck, A., Iglehart, J.A., Marks, J., Ballinger, D.G., Barrett, J.С. Skolnick, M.H., Катb, A. & Wiseman, R. (1994) BRCA1 mutations in primary breast and ovarian carcinomas. Science, 266, 120-122
Green, R. & Jacobsen, D.W. (1995) Clinical implications of hyperhomocysteinemia. 1n: Bailey, L.B., ed., Folate in Health and Disease. New York, Marcel Dekker Inc. pp. 75-122
Hagmar, L., Bragger, A., Hantseen, I.L., Heim, S., Нёgstеdt, B., Knudsen, L., Lambert, B., Linnainmaa, K., Mitelman, F., Nirdenson, I., Reuterwall, C., Saliras, S., Skerfving, S. & Sorsа, M. (1994) Cancer risk in humans predicted by increased levels of chromosomal aberra-tions in lymphocytes: Nordic Ѕtцду Group on the Health Risk of Chromosome Damage. Cancer Res., 54, 2919-2922
Hulka, B.S., Wilcosky, T.C. & Griffith, J.A., eds (1990) Biological Markers in Epidemiology, New York, Oxford University Press
Huika, B.S., Liu, E.T. & Lininger, R.A. (1994) Steroid hor-mones and risk of breast cancer. Cancer, 74 (Suppl. 3), 1111-1124
Institute for Environment and Health (1996) IEH Report on the Use of Biomarkers in Environmental Exposure Assessment, (Report R5), Leicester, Institute for Environment and Health
IARC (1994) 'ARC Monographs on the EvaIuatioп o f Carcinogenic Risks to Humans, Vol. 60, Some Industrial Chemicals, Lyon, pp. 73-159
International Collaborative Group (1982) Circulating cholesterol levels and risk of death from cancer in men aged 40 to 69 years. J. Am. Med. Assoc., 248, 2853-2859
Khoury, M J., Adams, M.J., Jr & Flanders, W.D. (1988) An epidemiological approach to ecogenetics. Am. J. Hum. Genet., 42, 89-95
Kuopio, T., Ekfors, T.O., Nikkanen, V. & Nevlainen, T.J. (1995) Acinar cell carcinoma of the pancreas: report of three cases. APIs, 103, 69-78
Lemaster, G.К. & Schultе, P.A. (1993) Biologic markers in the epidemiology of reproduction. In: Schulte, ~.A. & Pегеra, F.P., eds, Мolecuiar Epidemiology: Princгples and Practice, San Diego, CA, Academic Press. pp. 385-406
Links, J.M., Kensler, T.W. & Groopman, J.D. (1995) Biomarkers and mechanistic approaches to environmen-tal epidemiology. Ann. Rev. Pub. Health, 16, 83-103
MacMahon, B., Cole, P., Brown, J.B., Aoki, K., Lin, T.М., Morgan, R.W. & Woo, NC. (1974) Urine oestrogen pro-files of Asian and North American women. Iпt. J. Cancer, 14, 161-167
MacMahon, B., Trichopoulos, D., Brown, J., Andersen, A.P., Cole, P. deWaard, F., Kauraniemi, T., Polychronopoulou, A., Ravnihar, B., stormby, N. & Westlund, K. (1982) Age at menarche, urine estrogens and breast cancer risk. let. J. Cancer, 30, 427-431
MacMahon, B., Cole, P., Brown, J.B., Paffenbarger, R., Trichopoulos, D. & Yen, Ѕ. (1983) Urine estrogens, fre-quency of ovulation and breast cancer risk: case-control study in premenopausal women. J. Nail Cancer lest, 70, 247-250
McMichael, А.J., Jensen, Q.М., Parkin, D.M. & Zaridze, D.G. (1984) Dietary aid endogenous cholesterol and human cancer. Epi. Reviews, 6, 192-216
Mendelsohn, M.L., Peeters, J.P. & Normandy, M.J., eds. (1995) Biomarkers and Occupational Health: Progress and Perspectives, Washington, DC, Joseph Henry Press
Miki, Y., Swenseri, J., Shattuck-Eidеns, D., Futreal, P.A., Harshman, K., Tavtigian, S., Liu, Q., Cochran, C., Bennett, L.М., Ding, W., Bell, R. Rosenthal, J., Hussey, C., Tran, T., McClure, M., Frye, C., Hattier, T., Phelps, R., Haugen-Strano, A., Katcher, H., Yakumo, K., Gholami, Z., Shaffer, D., Stone, S., Bayer, S., Wray, C., Bogden, R., Dayananth, P, Ward, J., Tenin, P., Narod, S., Bristow, P.K.,
17

Application of Btomarkers in Cancer Epidemiology
Norris, F.H., Helvering, L., Morrison, P., Rosteck, Р. Lai, M., Barrett, JC ., Lewis, C.; Neuhausen, S., Cannon-Аl гighi, L., Golcigar, D., Wiseman, R., Kamb, A. & Skolnick, M.H. (1994) A strong candidate for the breast and ovarian cancer susceptibility gene BRCA1. Sсгепсе, 266, 66-71
MuEoz, N., Bosch, F.X., de 5anjosé, 5., Tafur, L., Izarzugaza, I., Gili, M., Viladru, P., Navarro, C., Martos, C., Ascunce, N., Gonzalez, L.С., Kaldor, J.M., Guerrero, E., Lбrincz, A., Santamaria, M., Alonso de Ruiz, P, Aristizabal, N. & Shah, K. (1992) The causal link between human papillomavirus and invasive cervical cancer: a population-based case-control study in Colombia and Spain. Jot. J. Cancer, 52, 743-749
Nakazawa, H., English, D., Randell, EL,, Nakazawa, K., Martel, N., Armstrong, R.K. & Yamasaki, H. (1994) UV and skin сапсer: specific p53 gene mutation in normal skin as a biologically relevant exposure measurement. Proc. NatI Aсад. Sel., 91, 390--364
Qian, G.S., Ross, R.K., Yu, M.C., Yuan, J.М., Gao, Y.T., Henderson, B.E., Wogan, G.N. & Groopman, J.D. (1994) A follow-up study of urinary markers of aflatoxin expo-sure and liver cancer risk in Shanghai, People's Republic of China. Cancer Epidemiol. Biomarkers Prey., 3, 3-10
Ross, R.K., Yuan, J.М., Yu, M.C., Wogan, G.N., Qian, G.5., Tu, J.T., Groopman, J.D., Gao, Y.T. & Henderson, WE, (1992) Urinary aflatoxiis biomarkers and risk of hepato-cellular carcinoma. Lancet, 339, 943-946
Sсhаtzkiп, А., Freedman, L.S., Schiffman, M.H., & Dawsey, S.М. (1990) Validation of intermediate end points in cancer research. J. Nat' Cancer Inst., 82, 1746-1752
Schulte, P.A., & Perera, F.P., eds (1993) Molecular Epidemiology; Principles & Practices, San Diego, Academic Press
Sherwin, R.W., Wentworth, D.N., Cutler, J.A., Hulley, S.B., Koller, L. & Stamler, J. (1987) Serum cholesterol lev-els and cancer mortality among 361,662 men screened for the multiple intervention trial. J. Am. Med. Assoc., 257, 943-947
18

Applicансгг of Biomarkers in Cancer Epidemiology roniolo, P., Bоffеtlа, P., Shukeг, D.E.G., Rathman, N., Hujka, B. arid Pearce, N., ads
lARC Scientific PLiblicatiaus No. 142 Иlегпа tЁопаl Agency fer Research en Cancer, Lyon, 1997
Transitional studies P.А. Schulte and,F.P' Perera
Transitional studies are studies using biological markers that bridge the gap between laboratory experiments and population-based epidemlology.The goal of these studies is to characterize and validate biomarkers and to assess the following: intra- and Inter-subject variability; the feasibility of marker use in field conditions; confounding and effect-modifying factors for the marker; and mechanisms reflected 'by the biomarker. Another goal is to optimize the conditions for the use of biomarkers' Transitional studies involving biomarkers of exposure or effect are distinguished from etiological studies because the biomarker is generally the outcome or dependent variable. Despite this difference, transitional studies can be epidemiological studies, but they may also include laboratory studies to assess reliability (and accuracy) and to identify parameters for collecting, рro-cеssing and storing biological specimens prior to assay. Generally, transitional studies involve healthy people, patients or workers with specific exposures. At some point in the validation of a biomarker the line between transitional and etiological studies becomes blurred. None the less, it is useful to identify transitional studies as a distinct set of efforts to validate and characterize biomarkers. Transitional studies can be divided into three functional categories: developmental, characterization and applied studies.
Transitional studies have been described as studies using biological markers that bridge the gap between laboratory experiments and population-based epi-deniiology (Ilulka, 1991; Schulte, 1992; Schulte et Al., 1993; Rothman et al., 1995). The goal of these studies is to characterize and validate biomarkers and to assess the following: intra- and inter-sub-ject variability; the feasibility of marker use in field conditions; confounding and effect-modifying factors for the marker; and mechanisms reflected by the biomarker. Another goal is to optimize the conditions for use of biomarkers. Transitional stud-ies involving biomarkers of exposure or effect are distinguished from etiological studies because the biomarker is generally the outcome or dependent 'variable. Despite this difference, transitional studies can be epidemiological studies, but they may also include laboratory studies to assess reliability (and accuracy, if possible) and to identify parameters for collecting, processing and storing biological speci-mens prior to assay. Generally, transitional studies involve healthy people, patients or workers with specific exposures. At some point in the validation of a biomarker the line between transitional and etiological studies becomes blurred. None the less, it is useful to identify transitional studies as a distinct set of efforts to validate and characterize biornarkers.
Transitional studies can be divided into three func-tional categories (Table 1): developmental, charac-terization and applied studies (Schulte et aL, 1993; Rothman et al., 1995). There is sri clear deniarca-ion between the types of transitional study, but the categories are useful in identifying the cluster-ing of preparatory research that is needed before a biomarker is ready for population research. All three types of transitional study are efforts to deter-mine aspects of the validity of a biomarker.
Transitional studies use epidemiological methods in the development, testing and validation of bio-markers. These studies represent preparatory efforts to determine the parameters, limitations or characteristics of a biomarker prior to its use in еti ological, prevention or other kinds of intervention efforts. Transitional studies build on scientific knowledge from various types of laboratory studies, including tissue culture and animal studies. The conduct of transitional studies is not a one-time step in the development of biomarkers but can represent steps in an iterative process. Thus a bio-marker may be developed in the laboratory, vali-dated in a transitional study using epidemiological methods, and then applied in an etiological study that raises new questions that stimulate new labo-ratory and transitional studies.
19

Application of Biomarkers in Cancer Epidemiology
Туре Description
Developmental Builds on laboratory and in vitro animal studies and involves the test of assay in humans
Characterization Examines the variability of biomarkers in population subgroups and factors that could confound associations between markers and what they represent
Applied . Assesses Ike relationship between a marker and an underlying event such as an exposure, a biological effect or susceptibility
Overview of the validation process Validation of Ыomarkers involves the clarification of factors that influence the ability of the marker to predict exposure or outcome in a test population. The issues covered here are discussed by Schulte & Pererа (1993) and Perera & Mooney (1993). During the validation process, evidence is weighed to
determine whether a biomarker measures what it claims to measure, be it exposure, disease or sus-ceptibility. A more epidemiological definition is that a biomarker is valid to the extent that it measures the tue marker populations, that is, with no measure-ment error (see White, this volume).
As shown in Table 2, validation can be consid-ered to be a two-stage process, although many of the steps require iteration as new information becomes available. The ultimate goal of the valida-tion effort is to allow biomarkers to be used in appropriate epidemiological and clinical applica-tions, which will require a selection of the best bio-markers based on the criteria described below.
The first step is laboratory validation, in which the shape of the dose—response curve, low-dose sensitivity (the ability to detect the exposure at levels low enough to be of biological interest), exposure specificity and reproducibility of the assay are tested. In the second step, known as epidemiological vali-dation, the population sensitivity and specificity, intra-individual aid interindi'Tidual variation in response and persistence, predictive value, and bio-logical relevance and feasibility are evaluated.
In this validation process, pilot studies in high-dose groups are useful. Molecular epidemiological studies to monitor the carcinogenic potential of
Table 2. Criteria for molecular epidemiological validation of biomarkers
Dose—response curve
Detection limit or low-dose sensitivity
Exposure specificity .
Reliability of the assay:
a. from run to run
b. from day to day
c. from one laboratory to another
Optimal conditions for sample collection,
processing and storage
Source: Регега R Mooney, 1993
Population sensitivity and specificity
Intra-individual variation over time: a. without altering exposure b. when exposure is removed (persistence/half-life) or changed
Inter-individual variation: a. response to a given exposure
Ь. persistence of biomarker .
Half-life in surrogate tissues
Positive predictive value (yield of high-risk people)
Feasibility: a. amount and availability of tissue b. cost c. time required for each assay
Biological relevance to disease
20

Transitional studies
industrial chemicals in workers have been a useful approach to validation because occupational expo-sures tend to be higher and more controlled than ambient exposures (Perera & Weinstein, 1982; Pereyc & Sante1la, 1993). Initial research linked a number of occupational exposures to increases in adducts, mutation and other biomarkers in workers. State-of-the-art studies have broadened to include assessment of smoking and dietary factors (e.g. vit-amins, fat oxidative damage), inherent factors such as genetic predisposition to biotransforma-tion and repair capacity, and endogenous levels of enzymes and promoters.
Interdisciplinary collaboration Effective collaboration between laboratory scien-tists and epidemiologists is critical in conducting transitional studies. These studies involve the first field testing of the markers and they require both laboratory and epidemiological expertise. The interaction of different disciplines requires that attention be paid to the underlying assumptions, paradigms and language of the various disciplines. Epidemiologists generally speak in terms of groups and risk to groups. Laboratory scientists tend to focus on individuals or components of an individ-ual. Epidemiology is an observational science whereas laboratory disciplines use controlled experimental designs. Epidemiologists and labora-tory researchers use the same word to mean different things. For example, when laboratory researchers speak of a valid marker, they are referring to the characteristics of the assay for the marker, whereas when epidemiologists speak of a valid marker they are generally referring to one with а high predic-tive value or correlation with exposure or disease.
The scale of transitional studies may be a hin-drance to effective collaboration. Laboratory re-search generally takes place on a small scale, whereas epidemiological studies can produce vast quantities of specimens. Even in a study that is small by epidemiological standards, e.g. of 30 peo-ple, the volume of specimens is often more than the research laboratory is used to processing. The laboratory workers can easily feel that they are not engaged in true scientific research but are merely providing a service. Meanwhile, the epidemiolo-gist wonders why the laboratory is not able to han-dle the volume of specimens required for the study. (Wilcox, 1995).
Another hindrance to good interdisciplinary collaboration is the tension between assay consis-tency and assay improvement (Rothman, 1993; Wilcox, 1995). The relatively long term for epi-demiological studies may span a period when improvements are made in the assay. The labora-tory collaborators will naturally want to take ad-vantage of the improved assays and incorporate them in the study without consulting the epi-demiologist. This can be disastrous from the epi-demiological point of view. The use of two different assay methods can ruin an epidemiological study. As new and more reliable assays are developed, scientists will be persuaded to replace previous essays. When a marker assay is new, measurements may differ from those in previous assays for the same marker. Although it may be reasonable to wait until laboratory techniques and estimates of variability display consistency, it is not reasonable or feasible to wait until a technique is so standard that no refinement is likely to occur. However, before modifying a technique during the course of a study, the old versus new results must be care-fully evaluated for overall comparability.
Developmental studies Reliability When a candidate biomarker is identified in the laboratory, some very basic issues need to be solved before it can be considered for use in population studies. The first priority in evaluating a marker for use in population studies is to determine its relia-bility or reproducibility. As long as the assay is reli-able, the ordering of subjects by the measure is preserved (Rothman et al., 1995). Hence, there will be consistency within a study. Since this 1s al that is required for studying a marker—disease relation-ship, reliability aid not accuracy is of primary importance (Rothman et aL, 1995). Reliability can be assessed optimally through analyses of blind replicate human samples that are representative of a range of values likely to be found in human pop-ulations.
Reliability encompasses both unsystematic ran-dom laboratory variation observed in repeated measurements and bias caused by non-random variation (Vineis etaL, 1993). To assess random ezror, multiple measurements are needed. Obviously, the random error in the arithmetic mean of several measurements is smaller than the random error of
21

Application of Biomarkors in Cancer Epidemiology
an individual measurement, Quantitative indices of the extent of random variation of a biological marker can be used to determine whether the reliability of a given measure is sufficient for the purpose being considered. The two most common indices are the standard error of the measurement and the reliability coefficient (Massey, 1986).
Analysis of random laboratory variation involves several steps. First, multiple analytical measure-ments of the same biological specimen (or several biological specimens from the same individual at the same point in time) must be made to estimate the variability due to random analytical errors. This fraction of the total random variability of a biological marker is usually minor. Second, multiple measurements of a marker must be made for one individual over time to estimate the intra-individual temporal variability. Third, multiple measure-ments across different individuals must be made to estimate interindividual variability in the value of the marker. In the second and third cases, ran-dom error is a component of the variability but systematic errors may also contribute (e.g. circa-dian cycles in the value of a marker or differences among individuals due to genotype). Most mol-ecular epidemiological research using biological markers seldom requires large numbers of individ-ual measurements. Thus, a small number of indi-viduals can be used as a sample of the infinitely larger population to which the distribution refers. The standard error indicates how the mean of that sample is distributed around the mean of the larger population. Hence, the standard error of the mean reflects the reliability of the sample mean as an indicator of the population mean (Massey, 1986). This value may not be as informative as the rеliа-bшty coefficient for evaluating markers to be used in epidemiological studies.
The reliability coefficient is technically known as the intraclass coefficient of reliability (Shrout & Fleiss, 1979; Fleiss, 1986) and ranges from Ito 1. If each measurement is identical, the intraclass co-efficient is 1.0. The greater the variation among measurements, the lower is the reliability. Fleiss (1986) has evaluated the impact of unsystematic bias variation in measurement, described the prob-lematic consequences of unreliability, and recom-mended how unreliability can be controlled. The consequences described by Fleiss (1986) include the need to increase sample size to reduce unrelia-
bility; the high rates of misclassification in studies of the association between exposure and disease; and the consequent underestimation of the associ-ation between a health measure and the measured extent of exposure to an environmental risk factor. All these factors pertain to studies using biological markers of exposure or effect. Fleiss (1986) recom-mends that unreliability be controlled by conducting pilot studies and replicating measurement proce-dures on each study subject.
Another aspect of developmental transitional studies is to define the optimal conditions for col-lecting, processing and storing biological speci-mens. The issues mentioned here are discussed by Winn & Gunter (1993) and in other chapters in this volume. The major lessons are that, at all stages of specimen handling, variation and/or error can be introduced, and careful attention is required to prevent these untoward aspects. In addition to the reliability of biomarkers, it is important to understand the biokinetics and sta-bility aspects before application in population studies. These issues have been addressed in previous publications (Droz, 1993; Bernard, 1995). As dis-cussed, valid biomarkers, particularly of exposure, will be those that have biological relevance, defined pharmacokinetics and temporal relevance. For markers of exposure, the parameters that best summarize the behaviour of a chemical in biolog-ical systems is the elimination half-life, which reflects both the affinity of the chemical for the biological matrix and the efficiency of excretory or metabolic processes of elimination. Bernard (1995) has suggested four categories for biomarkers of exposure: half-life less than 12 hours; half-life between 12 and 100 hours; half-life between 100 hours and 6 months; and half-life greater than 6 months. Generally, for etiological epidemiological studies, biomarkers in the latter two categories will be most useful.
Biological relevance The biological relevance of a biomarker is of prime importance in the selection and validation of a marker. The validation of a specific biomarker must include consideration of its biological rele-vance to the disease or exposure under study and the position in the continuum between exposure and disease. Given the fact that many exposures cause multiple diseases, the validation of a biornarker's
22

Transitional studies
relationship to а disease first requires a clear defin-ition of the disease end-pdint. A well developed hypothesis of the relationship between the bio-marker and other events in the exposure—disease continuum is necessary.
While knowledge of the stability and natural history are important before population applica-tion of bioorarkers of effect, it is important to assess the attributable risk or proportion (Schatzkin et al., 1990; Benichou, 1991; Trick, 1995). The attributable proportion associated with a particular biomarker is an estimate of the proportion of can-cer cases that must progress through the bio-marker. This is not simply the proportion of all cases that are positive for the biomarker, because the biomarker will occur in some cases ('back-ground cases') even when the exposure of interest or the biological events associated with the bio-marker are not etiological events for those cases (Trick, 1995). This assessment will help to identify the possible mechanism by which the biomarker is related to the causal pathway for the cancer and to determine the extent to which the biomarker truly represents a biological event intermediate between exposure and cancer.
Shatzkiп et cd. (1990) have developed a frame-work for considering exposure—marker—disease relationships:
•A single marker is known to be linked causally and, hence, is necessary and sufficient for disease. 'Multiple pathways and multiple biomarkers are identified and any marker is sufficient but not necessary for disease. 'An exposure leading to disease operates through an unobservable event which in turn lends to an intermediate marker that is not directly biologically related to the disease but which may correlate with its occurrence.
It is the role of developmental and applied tran-sitional studies to refine the view of these various mechanisms and to attempt to confirm which mechanism describes the type of marker being considered. It is important to understand underly-ing mechanisms in order to distinguish measure-ment error problems from multiple pathways.
Determining the number of subjects The number of subjects needed in transitional
studies is a matter of judgment. If the objective is to determine simply whether an assay `works', it is appropriate to test the assay on a small number of available subi ects without regard for sample size or representativeness. However, in transitional stud-ies to determine the validity of a marker and its variability, it is important that subjects are selected through defensible sampling designs. Critical in this regard will be the need to minimize selection bias and to generate adequate statistical power when null hypotheses of no difference among groups or perhaps no association among biomarkers are to be tested.
For biomarkers of exposure, it has been shown to be useful to select subjects from groups known to have high exposures (such as chemotherapy patients or workers in specific occupational expo-sure groups) to maximize exposure differences between groups and to obtain an indication of whether an assay will identify a potentially large `signal', and ultimately a dose—response relation-ship. For biomarkers of effect, studies involving histologically defined subsets of patients are useful in determining the association of biomarkers and a particular cancer. The calculation of sample size for transitional studies is the same as for etiologi-cal studies. For a situation in which two groups (e.g. cases and controls) are compared on the basis of presence or absence of some biomarkers, the for-mulation for the calculation of sample size for a given combination of significance level, power and size of expected difference as measured in terms of relative risk is well known (Schesshnan, 1982; Hertzberg & Russek-Cohen, 1993).
When groups of subjects are being compared for shifts in central tendency (such as mean values), the sample size is calculated according to a well known formula described in elementary textbooks that gives the sample size as a function of alpha, power, the size difference to be detected and the variance of marker levels within groups. When the investigator is interested in inferring the relative risk of a disease as a function of incremental change in the level of a given biomarker, the sample size is determined by a formulation involving type 1 and II error rates, mean levels in cases and controls, and variance in cases and controls, respectively (Hertzberg & Russeck-Coheп, 1993).
The determination of sample size reflects a ten-sion between feasibility and cost issues on the one
23

Application of Biomarkers in Cancer Epidemiology
hand and confounding on the other. What are the best design and analysis strategies to address these problems? For biomarkers of exposure it is essential to have an unexposed comparison group от sub-groups with a range of exposures. Matching exposed and unexposed subjects on potential con-founding factors can increase the precision of the measure of association between exposures and out-come, but this may decrease the study's power while controlling for confounding on the match-ing variables (lulka, 1990). Alternatively, a study design could involve restriction of suspected con-founders, i.e. limiting the subjects eligible to those with or without a particular potentially confound-ing factor. This may minimize confounding but will not allow for analysis of effect modification by the restriction variables.
In pтаctice, the number of subjects will depend on both the statistical power and the cost of obtaining subjects, specimens and assays. Unlike more traditional epidemiological studies, in which unexposed persons may be more accessible and cheaper to recruit than exposed persons, the орро-site situation may occur in transitional studies where there is little incentive for non-exposed or non-diagnosed persons to provide biological sam-ples (Hulka, 1990).
Characterization studies Once a marker has been sufficiently developed in terms of the reliability of the assay and optimal conditions for handling, it is necessary to assess its characteristics in human populations (Schulte et 01., 1993; Rothman et al., 1995). The objective of these studies is to identify factors that are con-founders or effect modifiers which should be taken into account in etiological or public health studies.
One type of characterization study iпvolves the assessment of the frequency of a marker in various population subgroups, determined by characteris-tics such as age, race, sex, medical condition, behaviour, etc. These types of study should be con-ducted on a marker-by-marker basis depending on the underlying biology, mechanism and relation to various host factors.
The ultimate goal of characterization-type tran-sitional studies is to assess interindividual variation and the genetic and acquired factors that influence the variation. Large interindividual variation will make it more difficult to predict the risk of disease
if the responses of exposed and unexposed people overlap. Interindividual variation in response is thought to result from differences in a variety of factors, including personal exposure, ability to metabolize carcinogens, and differences in DNA repair, immune surveillance and nutritional status. Therefore, people with the same apparent expo-sure may vary widely in their response to carcino-gens. For example, interindividual variation in the level of xenobiotics adducted to DNA iesults from processes that vary between people, affecting the concentration at the target tissue after distribution in vivo, metabolic activation and detoxification, capacity of repair, and persistence of the xenobi-otic and cellular target in vivo.
A goal of molecular epidemiology is to elucidate the mechanisms that explain why people vary in their risk of disease. To do this, we must under-stand which part of the biological or biomarker measurement is due to laboratory variability or to intra-individual variation and which part reflects true interindividual variation. The mechanisms underlying interindividual differences in bio-marker response are important because they are the same mechanisms that the body uses to miti-gate a disease outcome. This means that biomark-ers have potential as targets of interventions (Реrеrа & Mooney, 1993).
Within-person biological variability may or may not be time-dependent (Hulka & Margolin, 1992). Biological specimens collected from the same person at different times might show changes because the person has aged, has been exposed to mutagenic substances or has been exposed to a medical procedure. The actual bio-logical matrix, e.g. white blood cells, will have changed in the intervening time. Some cells will have died, while others may have been generated.
Time-independent biological variability will also occur because the distribution of matter (e.g. xenbiotics) can vary across organs and cells. Each biological sample will not capture the same bio-logical material (Hulka & Margolin, 1992).
Intraperson variability has important iтnplica-tions for sample size and power in transitional studies (Hulka & Margolin, 1992). This has been demonstrated in cytogenetic studies, such as that by Hirsch et aI. (1984) who found that cell-to-cell variability in the frequency of sister chromatid exchanges from an individual person was greater
24

Transitional sk dies
than the variability in the mean frequency of sister chromatid exchanges from person to person. To compensate for this intra-individual variability, the number of cells scored per person was in-creased. interperson variability in biomarker mеа-sures is generally addressed in the same way as other types of variable measures in epidemiological studies. The exception may be that the variability of biomarkers between persons may reflect acquired or inherited susceptibility which can serve as an effect modifier in relation to exogenous exposures of interest (Hulka & Margolin, 1992). susceptibility to environmental agents is likely to arise from complex interaction between activating and inactivating chemical metabolizing enzymes. For example, Tang et al. (1995) have estimated that the combination of an inherited deletion of a gene for the detoxifying enzyme glutathioпe-S-trans-fегasе (GST11) and high PAH-DNA adduct levels confers a 12-fold risk of lung cancer.
The ability to measure biomarkers at the mole-cular and genetic levels has resulted in the identi-fication of a degree of interperson variability not previously imagined. The major sources of this variability need to be accounted for prior to the use of biomarkers in etiological or public health appli-cations. Characterization-type transitional studies may involve determining the prevalence of partic-ular alleles in specific racial subgroups, evaluating the correlation between genotypic and phenotypic assays, estimating the likelihood and impact of allele misclassification and evaluating potential induction effects. Additionally, transitional studies can evaluate the biological plausibility of gene--environment interactions observed in etiological studies (Rothman et al., 1995).
Applied transitional studies Applied transitional studies are those that assess the relationship between a marker and the event that it marks, namely exposure, disease or suscep-tibility. These studies are often conducted on healthy subjects, and generally, in most cases in-volving biomarkers of exposure or effect, the bio-marker is treated as the outcome variable. However, with susceptibility biomarkers andin certain study designs, a biornarker of exposure or effect may be used as an independent variable (e.g. serum organochlorines and breast cancer; carcinogen DNA adducts and lung cancer). Applied transi-
tional studies are generally cross-sectional or short-term longitudinal designs and are not capable, in and of themselves, of establishing or refuting a causal relationship between a given exposure and disease. They do, however provide mechanistic insight and may yield useful information on rela-tionships between biomarkers arid the events they represent (Rothman et ai., 1995). Where case—con-trol studies that link a biomarker with disease are conducted, inferences about causality can some-times be made. Another type of applied transi-tional study that has been reported involves the use of biomarkers in intervention studies. These include interventions with smokers, workers and the treatment of high-risk populations (e.g. in treatment with antioxidants, biomarkers are being used to monitor the efficacy of the intervention) (Регегa & Mooney, 1993). The studies are designed to test not only the presence of the biomarkers, but also the level of change with alteration of the risk factor. These studies are transitional in that they establish the ability of the marker to serve as an early or intermediate `end-point' with which to monitor efficacy or compliance.
The objective of the studies is to determine one of the following relationships:
• exposure/marker • marker/disease • exposure susceptibility marker (high disease risk or low disease risk).
Applied transitional studies can be used to assess the attributable proportion of a particular biomarker. Hence, they build on the mechanistic knowledge obtained in characterization-type tran-sitional studies.
Exposure/marker The assessment of the relationship between an expo-sure and a marker represents much of the previous effort termed molecular epidemiology. Exposures to carcinogens have been evaluated to determine changes in DNA (DNA adducts) or proteins (e.g. haemoglobin or albumin adducts), or in some cases cytogenetic changes (e.g. chromosornal aber-rations, micronuclei). These have generally been cross-sectional in nature. It is critical in such stud-ies to be rigorous not only in the assessment of the marker but also in the assessment of exposure and
25

Application ы Biomarkers in Cancer Epidemiology
control for confounding. This is illustrated in the work of Mayer et aL (1991) and Schulte et aL (1992), who demonstrated the value of putting appropriate resources into the exposure characterizations when validating the relationship between exposure to ethylene oxide and formation of haemoglobin adducts. Too often, emphasis is placed only Of the assay and not on the measure of exposure.
In characterizing the relationship between a marker and exposure, it is important that all sources and rates of exposure are considered, since a marker generally represents the integration of these. Attention should also be given to the toxi cokinetics and natural history of the marker in order to understand the appropriate sampling and specimen collection times. A marker with a short half-life will not be detectable in samples a long time after exposure has ended. Moreover there is a need to assess the relationship between the marker and different regimens of exposure (con-tinuous or intermittent).
Marker/disease The relationship between a marker and disease is often the most frequently considered issue in assessing whether a marker is ready for use in an epidemiological study. Of interest is how well the marker predicts or represents disease. These types of validation studies are difficult to accomplish because of the temporal factor. To identify an early change—i.e. a change in pathogenesis or a change predictive of disease—generally requires a prospec-tive study, although cross-sectional clinical studies of heavily exposed individuals and case-control studies can be used to great advantage. However, when not using a prospective design, care must be taken to avoid biased associations. This is often dif-ficult, and hence prospective studies are the best approach for validation. However, prospective studies are expensive and time-consuming, and few are conducted. For example, despite the large number of studies on cytogenetic markers, there is still little consensus on their predictive value, since most of the studies have been cross-sectional and suffer from temporal ambiguity. Specifically, in epi-demiological terry s, predictive value means the percentage of those who test positive for a marker who actually develop the disease. To perform the appropriate prospective studies of sister chromatid exchanges would take a large population and a rel-
atively long time. The best and possibly only example of such a study is the Nordic prospective study on the relationship between peripheral lym-phocyte chromosome damage and cancer morbid-ity in occupational groups (Bragger et aI., 1990). Ten laboratories in four Nordic countries partici-pated in a study of a combined cohort of persons (mostly from occupational groups) who had been cytogenetically tested. The cohort will be followed prospectively for cancer morbidity. The cohort comprises 3190 subjects, of whom 1986 (62%) have been scored for chromosome aberrations and 2024 (63%) have been scored for sister chro-matid exchanges. Preliminaтy analysis indicates that chromosomal aberrations are associated with cancer.
Exposure/susceptiЬнl tу to disease Validated biological markers of susceptibility can serve as effect modifiers in epidemiological studies. Effect modification is a term with statistical and biological aspects. Statistically, effect modification is analysed by examining the joint effects of two or more factors. The interpretation of effect modifi-cation depends on the statistical method (e.g. mul-tiplicative or additive) used to model interaction. From the biological perspective, effect modifica-tion can explain why two similarly exposed indi-viduals do not develop a disease. The answer, in dart, is individual variability in metabolic detoxi-fication and repair capabilities.
To validate a susceptibility marker, it is impor-tant to minimize misclassification, which can occur as a result of laboratory or epidemiological factors that affect phenotyping or genotyping (Rothman et al., 1993). Next, ills necessary to demonstrate that the susceptibility marker either increases the biologically effective dose or elevates the risk of disease.
Genetic susceptibility markers can be character-ized in terms of the six possible patterns of gene-environment interaction identified by Khoury et aL (1988). These are shown in Table 3. Khoury et al. (1988) recommend that an epidemi-ological approach be used to evaluate genetic marker-disease associations and their interaction with specific environmental risk factors. However, prior to conducting such studies, a major challenge is to determine which environmental factors might be involved in the etiology of a specific disease.
26

Transitional studies
EIlect of genotype. in the absence Specifieity of environmental Pattern of the environment effect vis-à-vis genotype. Notations
1 ' Innocuous Specific R9 -1, le =1 2 Innocuous Non-specific R9.= 1 1е > 1
З Risk factor Specific R9 > 1, Re = 1.
4 . Risk factor Non-specific Rg > 1 „Re > 1
5 Protective 5pecifiç Rg < 1', Re =1:
б Proteéfive Non-spécifie Rg <'1, Re з 1
Source: Khoury e.t aI., 1988.
In cancer epidemiology, interest has been focused on susceptibility genes that are common in the population and are generally considered to be polymorphisms (i.e. with a minor alele fre-quency of more than 1%), that are probably asso-ciated with relative risks under 10 (and as such do not exhibit familial patterns of inheritance) and that may interact with a particular exposure (Rothman et a2., 1995). The objective of applied transitional studies with regard to susceptibility markers is to determine whether the markers are effect modifiers. As mentioned earlier, the distinc-tion between a transitional study aid an etiologi-cal study becomes slightly bluned in this effort, so that such distinctions are arbitrary. The emphasis in a transitional study is to determine whether the marker can be used to investigate populations in terms of risk (i.e. serve as an outcome variable or as an independent variable).
Preparing for transitional studies $electing candidate markers Many more markers are identified in laboratories than could reasonably be tested and used in the field. For this reason, there is a need to select among candidates which markers are beneficial for field testing and use. To gauge utility, it is help-ful to envision a framework for candidate markers such as the continuum between exposure and disease. A potentially useful candidate marker will be one that can be related to some heuristic con-tinuum and for which successful field testing will add relevant information to various etiological or public health questions. Iп some cases a transi-tional study may only provide mechanistic infor-
ration. This can be very useful but should be ori-ented towards confirming a hypothesized link in a continuum.
It is of great importance in identifying a con-tinuum of events between exposures and disease that the marker represents a 'critical effect'. (Schulte, 1989; Borm, 1994). A critical effect is the biological marker that is deemed most representa-tive of a particular component in the continuum and is ultimately most pathognomonic. This requires a series of independent studies, primarily toxicological, but also clinical and epidemiologi-cal. It is necessary to develop a hypothesis con-cerning the role of the marker in the development of the disease. As more causal components are identified it becomes necessary to elucidate quan-titative relationships of the kinetics, natural his-tory and rates of transition along the continuum.
Determining level of effort After a candidate marker has been identified, it is useful to determine what field testing is required. This is a useful exercise because it allows for research planning and funding and assures that a comprehensive approach is considered. The alter-native is that a marker becomes labelled as vali-dated and ready for field use when ills not ready or eligible, and this can lead to flawed and costly studies. An example of a check list for what needs to be considered is shown in Table 2.
Selecting candidate populations A key factor in transitional studies is selecting and accessing populations with the kind of characteris-tics thought to be important to the testing of a
27

Application of Biomarkers in Cancer Epidemiology
marker. These may be populations with contrasting levels of exposure, demographic or behavioural factors, or ethnicity; or they may be populations homogeneous for such factors. The similarity between these populations and those in whom the marker will ultimately be used for etiological or applied purposes is important.
Reporting results of transitional studies Transitional studies can be highly informative regardless of their outcome. Those that show a pos-itive relationship between a marker and exposure, disease or susceptibility are obviously important. However, those that show negative relationships between a biomarker and a particular event, or have small biomarker frequencies in a population subgroup, provide useful information about the utility, generalizability or limitations of а marker. Such negative results in well conducted studies should be published in the peer-reviewed scientific literature. Clearly, statistical power considerations should be discussed in such studies.
There appears to be a wide variation in the approaches used in reporting test and study results to participants in the research. Some investigators and their supporting organizations require all test and subject results to be communicated to partici-pants regardless of clinical relevance and with the most truthful interpretation possible, while others limit reporting to those results that are clinically relevant. This difference hinges on the tension between beneficence and autonomy (see Schulte et al., this volume, for a discussion of the ethical issues). Should participants be told only when something can be done and not told when there might be anxiety without benefit, or should par-ticipants have a right to information that is held about them regardless of whether it is considered by the holder to be of benefit? These questions need further consideration.
Support for transitional research Transitional studies are important for the success-ful and effective use of biomarkers in cancer epi-demiology. However, they are perceived as having neither the excitement nor the appeal of basic lab-oratory or etiological research or public health application. Thus, they are not widely and inten-sively supported by funding agencies. Since their outcome is the characterization of biomarkers and
their limits, they are intermediate rather than end results about cancei causation or controls; yet without this effort, the end results may not be obtained. Currently, much of the work of transi-tional studies is subsumed in pilot or feasibility studies conducted prior to a larger study. This may not be the most effective way of conducting tran-sitional research because researchers may be forced to trade off those funds available for conducting an etiological study against those available for the assessment of the utility and limits of a marker. More funding agencies should designate and sup-port transitional biomarker studies if a wide range of useful tools are to become available.
References Benichou, J. (1991) Methods of adjustment for estimat-ing the attributable risk in case-control studies: a review. StaG Med., 10, 1753-1773
Bernard, AM, (1995) Biokinetics and stability aspects of biomarkers: recommendations For application in popu-lation studies. Toxicology, 101, 65-71
Borm Р,].A. (1994) Biological markers and occupational lung disease: mineral dust-induced respiratory disorders. Ехp. Lung Res., 20, 457-470
Brogger, A. Hagmar, L., Hansteen, I.L., Heim, S., Hogstedt, B., Knudsen, L., Lambert, Б., Linnainmaa, K., Mitelman, F., Nordenson, I., Reuterwall, C., Salomao, S., Skerfving, Ѕ. & Sorsa, M. (1990) An inter-Nordic prospec-tive study on cytogenetic endpoints and cancer risk. Cancer Gene Cyfogenet., 45, 85-92
Droz, P.O. (1993) Biological monitoring and pharmaco-kinetic modeling for the assessment of exposure. In: Schulte, P.A. & Perera, RE, eds, Molecular Epidemiology; Principies and Practices, San Diego, Academic Press, pp, 13 7-15 7
Fleiss, J.L. (1986) Statistical factors in early detection of health effects. In: Underhill, D.M. & Radford, E.D., eds, New and Sensitive Indгcators of Health Impacts of Environmental Agents, Pittsburgh, PA, University of Pittsburgh Press, pp. 9-16
Hertzberg, V.S. & Russek-Cohen, Е. (1993) 5tatisncа1 methods in molecular epidemiology. In: Schulte, P.A. & Peiera, F.P. eds, Molecular Epidemiology: Principles and Practices, San Diego, Academic Press, pp. 199-216
Hirsch, B., McCue, M. & Cervenka, J. (1984) Characterization of the distribution of sister chromatid exchange frequencies: implications for research design. hum. Genetics, 65, 280-286
Hulka, B.S. (1990) Methodo1og1c issues in molecular epi
28

Transitional studies
demiology. й: Ilulka, B.S. Wilcoskey, T.C. & Griffith, J.D., eds, Biological Markers in Epidemiology, New York, Oxford University Press, pp. 214-226
Huika, B.S. (1991) Epidemiologic studies using biological markers: issues for epidemiologists. Cancer Epidemiol. Biomarkers Prey., 1, 13-19
Hulka, B.S. S& Margolin, B.H. (1992) Methodological issues in epidemiologic studies using biologic markers. Am. J. EpгдетiпL, 135, 200-209
Khоurv, M.S., Adams, М.J., Jr & Flanders, W.D (1988) An epidemiologic approach to ecogenetics. Am. J. Hum. Genetics, 42, 89-95
Massey, B.S. (1986) Measures in Science and Engineering ,Chichester, Ellis Horwopd
Mayer,L, Warbiuton, D., Jeffrey, A., Pero, R., Andrews, L, Wales, B., Tom, M., Latriano, L., Tang, D., Tsai, W.Y., Kuroda, M. & Perera, F.P. (1991) Biologic markers in eth-ylene oxide-exposed workers and controls. Mutai. Res., 248, 163-176
Pеrerа, ЕР & Weinstein, I.S. (1982) Molecular epidemi-ology arid carcinogen-DNA adduct detection: new approaches to studies of human cancer causation. J. Chronic Dis., 35, 581-600
Perera, F.P. & Mooney, L.A. (1993) The role of molecular epidemiology in cancer prevention. In: DeVita, V.T., Hellinan, S. & Rosenberg, S.A., eds, Cancer Prevention, Philadelphia, J.B. Lippincott, pp 1-15
Perera, F. & Santella, R. (1993) Carcinogenesis. In: Schulte, Р.А. & Perera F., eds, Molecular Epidemiology: Principles and Practices, San Diego, Academic Press, pp. 277-300
Rothman, N. (1993) Epilogue. In: Schulte, P.А. & Pегera, F.P., eels, Molecular Epidemiology: Principles and Practices, San Diego, Academic Press, pp 199-2 16
Rothman, N., Stewart, W.F., Caporaso, N.E. & Hayes, R.B. (1993) Misclassification of genetic susceptibility bio-markers: implications for case—control studies and cross-population comparisons. Cancer Epidemiol. Biomarkers Prey., 2, 299-303
Rothman, N., Stewart, W.F. & Schulte, P.A. (1995) Incorporating biomarkers into cancer epidemiology: a matrix of biomarker and study design categories. Cancer EpidemioI. Biomarkers Prey., 4, 301-311
Schatzkin, A., Freedman, L.S., Schiffman, М.H. & Dawsey, S.М. (1990) Commentary: validation of inter-mediate end points in cancer research. J. Nat' Cancer Iпst., 82, 1746-1752
Schesselman, J.J. (1982) Case-control Studies, New York,
Oxford University Press
Schulte, P.A. (1989) A conceptual framework for the vali-dation and use of biological markers. Env. Res., 48, 129-144
Schulte, P.A. (1992) The use of biological markers in occupational health research and practice. J. ТохгсоI. Env. Health, 40, 359-366
Schulte, P.A., Boeniger, 1., Walker, J.T., Schober, S.E., Pereira, M.A., Gulati, D.K., Wojсieсhowski, J.P., Garza, A., Froelich, R., Stгauss, G. et al. (1992) Biologic markers ira hospital workers exposed to low levels of ethylene oxide. Mutat. Res. 278, 237-251
Schulte, P.A. & Perera, F.P. (1993) Validation. In: 5chultе, P.A. & Perera, F.P., eds, Molecular Epidemiology: Principles and Practices, San Diego, Academic Press, pp. 81-109
Schulte, P.А., Rothman, N. & Schottenfeld, D. (1993) Design consideration иn molecular epidemiology. In: Schulte, P.А. & Perera, F.P., eds, Molecular Epidemiology: Principles and Practices, San Diego, Academic Press, pp. 159-198
Sbiout, Р Е. & Fleiss, J.L. (1979) lпtradass correlations: uses in assessing rator reliability. Psycho. Ball., 86, 420-428
Tang, D.L., Chiamprasert, S., Sante1la, R.М. & Perera, F.P. (1995) Molecular epidemiology of lung cancer: carcinogen-DNA adducts, GST1Vf1 and risk. Proc. Am. Assoc. Cancer Res., 36, 284
Trick, B.J. (1995) Application of biological markers in cancer environmental epidemiology. Toxicology, 101, 93-98
Vineis, P., Schulte, P.A. & Vogt, R.F., Ji (1993) Technical variability in laboratory data. In: Schulte, P.A. & Perега, F.Р., eds, Molecular Epidemiology: Principles and Practices, пап Diego, Academic Press рр. 109-135
Wilcox, А.J. (1992) Molecular epidemiology: collision of two cultures. Epidemiology, 6, 561-562
Winn, D.M. & Gunter, E.W. (1993) Biologic specimen banks: a resource for molecular epidemiologic studies. In: Schulte, P.A. & Регега, F.P., eds, Molecular Epidemiology: Principles and Practices, San Diego, Academic Press, pp. 217-235
CorresporndnnQ author
P.A. Schulte National Inslitute for Occupational Safвtу and Health 4676 Columbia Parkway C 14; Cincinnati, 0145226; USA`
29

Appficativп ы Bioп1агkers in Carcer Epidemiology Toniolo, Р. Botfotta, P., Shuker, D.E.G., Rothman, N., Hulka, B. and Puarce, N., eds
ARC 5eiепtиuc PuЫkaliом No. 14 lntе rиliоnаl Agency or пuseaгch or' Cancer, Lyon, 1997
Logistics and design issues in the use of biological samples in observational epidemiology J.D. Potter
Standard epidemiological study designs are well suited to answering questions involving the collection of biological samples. However, different designs are better suited—both for design and logistic reasons—to different questions. The strengths and weaknesses of each design are discussed in relation to markers of exposure, susceptibility and early outcome, and to markers used to classify cancers into biologically defined subsets.
Epidemiology has, for over a century, encompassed observational and experimental modes. The earli-est modem epidemiological endeavour, which we all lеатп at our mentor's knee, is the story (usually, alas, oversimplified) of John Snow and the Broad Street pump. From very early on (but subsequent to the Snow experiment), epidemiologists have studied both reported and recorded data, on the one hand, and biological samples on the other. Infectious disease epidemiology, particularly acute outbreaks, requires both `shoe-leather' epidemiol-ogy and the collection of specimens. Chronic disease epidemiology is similar, particnlarly where there are established biological markers that are central to the disease process: cholesterol in coro-nary heart disease; glucose and insulin levels in diabetes mellitus; uric acid in gout. What is impor-tant about both infectious diseases and the above-mentioned chronic diseases is that the clinical, experimental and epidemiological models evolved largely in concert with each other; biology, under-stood in one area, rapidly became incorporated into research endeavours in a different discipline.
Cancer is markedly different from other diseases in two ways. The first is that, unlike the infectious diseases arid the above-mentioned chronic dis-eases, cancer is not regarded as a systemic disorder. Consequently, treatment is largely local (surgery, radiation), and there is little opportunity to under-stand the disease process when the treatment is successfuI; the later stages of disease and their systemic manifestations are regarded as signs of the failure of treatment. Secondly, in experimental models of cancer in animals, the cancer is induced
by carcinogens (both chemical and viral) and pro-moters that are intended to model but are essen-tially unrelated to, the human disease. Examples include the use of dimethylhydrazihe (DII) as a carcinogen in rat colon cancer, dimethylbenz-anthracine (DMBA) as a carcinogen in mouse breast cancer, and phorbol esters as promoters in mouse skin models. As an aside, it is worth noting that animal 'models' of cancer were originally intended to mimic the end-point in order to study it better. However, we appear to have lost this per-spective, and have made the error of assuming that because these models mimic the end-point, they also mimic the process.
Since the 1960s, as a result of studying human pathology of cancer, it has become dear that there are many early stages of cancer that are discernible and can be studied in their own right, e.g. cervical intra-epithelial neoplasia, adenomatous polyps of the colorecturn, proliferative dysplasia of the breast and Barrett's oesophagus. More recently, it has also become clear that, even at a molecular level, specific carcinogens do not always act in the manner that was previously hypothesized {Jin et al., 1996) and do not always act in humans in the same way as in animals (Kakiuchi et al., 1995).
What is now beginning to emerge in the study of human carcinogenesis is the kind of conver-gence of clinical, experimental and epidemiologi саl studies that has previously characterized the study of heart disease. Although, in the main, we lack the systemic markers and manifestations to be used as risk indicators of disease (such as lipopro-teins, cholesterol and its subtractions, and hyper-
31

Application of Biomarkers in Cancer Epidemiology
tension), there are, none the less, some рrоbаЫе systemic markers for certain cancers, and we do have an increasing understanding of the disease process at molecular level and of its manifestations at cell and tissue levels. Further, as a consequence of several decades of largely 'paper-and-pencil' occupational, environmental and dietary ерi demiology, we have some fairly robust ideas about which exposures increase or decrease risk. Additionally, with developments in epidemiology and biostatistics, we know to what extent misclas-sification and measurement error attenuate our findings. Finally, extensive development in mо1-ecular and biochemical methods over the last two decades have improved markedly our capacity to detect and quantify components of relevant bio-logical pathways in small samples collected on large numbers of people.
Against this background, it is appropriate to consider the methodological issues that arise regarding the incorporation of biological markers in epidemiological studies. This chapter covers the following: consideration of some of the logistics of sample collection in observational studies in the clinical setting and in population-based studies; the issues surrounding the use of markers of various stages in the cancer process—susceptibility, exposure, early biological effect, surrogate or intermediate end-points, and markers defining subsets of disease in each of these designs and settings; and the par-ticular issue of studies to develop screening markers.
In undertaking the collection of human sam-ples for epidemiological studies, the best design and the easiest logistics are sometimes in conflict. For most etiological questions, population-based case-control studies are preferable to those in which study subjects are recruited solely in the clinic/hospital population. For cohort studies, recruits front the general population wЊ are in gen-erally good health are preferable to patients (unless, of course, the cohort is focused on complications of the initial disease and its therapy).
By contrast, the recruitment of a hospital/clinic-based population makes the logistics of sample col-lection—susceptibility markers, exposure markers, early end-points or pathology samples--consider-ably easier. As with many epiderniological design and execution issues, it is sometimes necessary to establish some compromise between the method-ologically desirable and the logistically feasible.
A variety of strategies exist. Almost all require collaboration across disciplines and a supportive, understanding study population. Matches between design and the question asked are outlined in the following sections. An attempt is made to identify the best way of answering specific questions. A dif-ferent typology and approach have been proposed by Rothman et al. (1995).
Clinic-based cohort studies Two different kinds of cohort studies can be estab-lished in the clinical setting. The first is a screen-ing-based cohort where individuals aie enrolled specifically following a negative screen (e.g. mam-mography, colonoscopy or Pap smear), and where specific biological samples, such as blood and benign lesions, are stored to establish the relation-ships between exposure, susceptibility, metabolic markers such as hormones or disease intermediate markers (e.g. adenoma or cervix pathology) and subsequent risk of disease. Examples of such stud-ies include the New York Breast Cancer Study (Topiolo et al., 1991) and the US National Polyp Study (Winawer et aI., 1993).
The second kind of cohort study that is well established in the clinic or hospital setting is the study designed specifically to follow individuals treated for disease with known pathology (includ-ing first primary cancers) in order to establish the risk of further disease (including second primary neoplasms). Here, this is termed a 'pathology' cohort. The biological markers that can be used in such studies include markers of susceptibility including specific genetic syndromes such as Li-Fraumeni, ataxia telangiectasia, hereditary non-polyposis colon cancer (HNPCC), the characteris-tics of the original tumour itself, and possibly bio-logical measures of therapeutic exposures. One example of this design is the Children's Cancer Survivor Study (principal investigator Dr Leslie Robison) in the USA, which follows more than 20 000 survivors of childhood cancer who have lived at least 5 years after diagnosis and were disease-free at the time. Blood samples are being used to establish genetic susceptibility, and the cohort is to be followed to a variety of end-points so that the effects of genetic susceptibility, envi-ronmental risk factors and therapeutic exposures (radiation, chemotherapy) on subsequent disease can be ascertained.
32

Logistics and design issues
в • - • в в в
Markers : Design Logistics. Exposure (e.g. blood levels; 1-2a 1
adducts)
Susceptibility (e.g. genes) 1-2 1
Intermediate end-point .. . 2 2 .
Stгatifiçаtiôп of diseases into 1 2
biologically defined subtypes
Biology af. first tumour 1 1 (pathology cohort) or pre neoplashc pathology (screening cohort)
a1 = most optimal <design) or easiest (logistics
Table 1 shows a ranking, on a scale of 1-3, for both design (where 1 is optimal) and logistics (where 1 is easiest) for the collection of a variety of materials in a clinic-based cohort study. In this type of study, the collection of baseline biological materials is clearly facilitated only if the recruit-ment of the study subjects actually occurs in the clinic. In the casé of recruitment from a screening clinic, this is a relatively easy procedure: blood samples, etc., for markers of both exposure and susceptibility, can be collected, piepared and stored. This is also true for screening-associated pathological samples. Such material will usually be used in a nested case—control fashion as follow-up of the cohort reveals cases of the cancers of inter-est. For blood samples, where the focus is on, for example, specific exposure markers or high-preva-lence genes such as metabolic enzyme polymor-phisms, the follow-up of the cohort can investigate such markers in relation to a variety of cancer and pre-cancei outcomes. For low-prevalence inherited mutations and for specific intermediate patholog-ical markers сôllесtед at screening recruitment (e.g. histology of a benign lesion), the follow-up will perhaps be restricted to just one cancer. Of course, the cohort can be followed up, using non-biological data, for any end-point.
As with any cohort, while internal comparisons will be valid, and interpretation of the strength of
associаtàодs with biological markers will be clear, problems of generalizability may be more marked than is the case with a population-based cohort, given the selective nature of such clinic-based study populations (e.g. who comes for screening, or who gets the first primary cancer).
From a design standpoint the timing of the col-lection of biological measures of exposure in rela-tion to disease outcome is always problematic. If the period between collection and outcome is too long, there may be increasing misclassification of exposure levels; too short a period may result iп early disease influencing the relevant exposure marker. Family-based cohort studies have similar logistic issues to population-based studies (Sellеxs et al., 1995). The pathology cohort, in which the end-point may be a second primary cancer, in many cases will have biological material from the original diagnosis of cancer (or a benign lesion) and blood (though this is less likely) stored at the original institution. Retrieving this material and assembling such a cohort is a very time-intensive and labour-intensive procedure. The problem is exacerbated in the case of children where the orig-inal physician of record (probably a paediatric specialist) may no longer be in contact with the patient where many of the potential study subjects will have moved and, with early adulthood, where a substantial proportion of the female subjects will have changed their surnames. Such cohorts can be assembled, but the collection of additional data and biological material (e.g. blood for exposure measures or genotyping) requires individual contact in the same manner as in a population-based cohort.
In this design, establishment of intermediate end-points requires active follow-up, as, with one or two exceptions (e.g. Pap registries, mammogra-phy registries), non-tumour end-points are not routinely registered; further, there may still be dif-ferential detection rates of such end-points within the cohort, depending on both the access to medi-cal care and health behaviours of the study subjects. The etiology of intermediate end-points may be. better studied in a case—control fashion. Original biological material (in both screening and pathology cohorts) can be used both to characterize the ini-tial tumour and to establish (using normal tissue) the specific genotypes.
End-point pathological tissue can also be col-lected and cancer outcomes stratified into various
33

Application of Biomarkers in Cancer Epidemiology
Table 2' Optimality of design and relative ease of sample collection logistics in
clinic-based case-control studies
1. . ,.
Exposure (e.g. Ыюоd levels, 1--3a [11h
adducts)
susceptibility (e.g. genes) 1-2° 1
Intermediate end-point 1. ;
Stratification of diseases 1
into biologically defined . subtypes
a1 = most optimal (design) or easiest (logistics). bAppropriate for early diseaserпtвrmediate end points but not С пicaty detected cancer 'The pattern of susceptibility génotypes may be distorted by the tendency of those with a family history to seek asymptomalic screening rather.than presenting with early diaclase as a resitll of symptoms..
subtypes based on histopathology, gene expression, mutations, deletions, etc. No particular advantage is derived from the clinic-based cohort design for this purpose except the rather general one that this is likely to be a geographically restricted popula-tion; thus facilitating personal contact with patients and their physicians, which in turn allows active follow-up.
Clinic-based case-control studies Table 2 shows, similarly to Table 1, the ranking for optimality of design and logistics when colecting various biological markers in the setting of clinic-based case-control studies. These studies are of par-ticirlar value for investigating the etiology of pre-cancerous lesions. For these diseases [e.g. early cer-vical intra-epithelial neoplasia (Brock et al., 1988), colonic adenomatous or hyperplastic polyps, Barrett's oesophagus (Blount et al., 1991; Meltzer et aL, 1994)1, very few if any, population-based registries exist and the detection of the disease, and therefore the identification of disease-free individ-uals to be enrolled as controls, is invasive. Such studies are only possible in the clinical setting. Further, the early stage of the disease reduces, but does not eliminate, the problem of the disease
altering the biological markers processes (as well as, of course, specific behaviours) of interest in the etiology of the disease. Such a setting is therefore the best approach to establishing the relation between exposures, whether measured by self-report or by biological markers, and the early stages of the neoplastrc process. Similar benefit accrues to the study of specific genotypes (again both metabolic polymorphisms and specific germline mutations) and the known от suspected intermediate stages of the ceoplastic process.
It is worth noting that, with a few interesting exceptions, the relationship between these inter-mediate disease markers and the cancers of which they are precursors is usually difficult to study, for both ethical and logistic reasons. For instance, in the case of established colonic adenomatous polyps, CIN III and benign proliferative disease of breast, the precursor lesions are removed and the natural history of the disease is disrupted—a parti-cularly appropriate and satisfactory outcome for the patient but one which, none the less, removes the opportunity for studying a variety of patho-physiological and molecular processes.
One interesting exception is Barrett's oesophagus, where the progression of the dysplasia needs close monitoring but the malignant potential is not sufficient to justify the severe intervention of an oesophagectomy.
Clinic-based studies, where the etiology of can-cer itself is the focus of study, allow the collection of end-point cancer tissue as well as blood. However, etiological questions using this material are confined to questions of the role of genotypes and etiology. Exposure markers are not appropriate in this setting, since the disease itself, the symp-toms 0f the disease and its therapy may all alter any exposure marker or biological process thought to be a precursor 0f disease.
A particular additional use of this design is to establish screening markers. What is important in this variation 0f thé study design is that biological markers are sought which classify people with and without a specific cancer or its precursors. Here, unlike studies of etiology, the temporal sequence of the biological markers and the outcome of interest is irrelevant if the association is consistent and allows a ready distinction between those with and those without the disease. The issue of study power needs to be borne in mind, but there are two facets
34

Logistics and design issues
Table З. Optimality of design and relative ease of sample collection logistics in population-based cohort studies
..,
-' , t 1
Intermediate end-point :. 2 3
Stratification of diseases into 1 2~e
biologically defined subtypes . .
a1 = most optimal (design) or easiest (logistics> bDisease stratification markers will vary in the degree of logistic complexity depending on whether the marker is routinely measured and recorded in a registry (e.g. estrogen гесвplогs), wfеthér itis measured and recorded in â chait (e.g, cytogenetics FAB morphology; etc.), or whether it is measured for ihe study only
to be considered. Although underpowered studies are in some danger of rejecting, as statistically non-significant, a promising marker that could be used in screening, it is nevertheless the case that for a screening marker to be of major use, it should хеаd-лу (i.e. with small study size) distinguish between those with and those without the disease. The added complication is the possibility that two or more markers in combination may provide a use-ful screening battery. Input into the design of such studies should be obtained from biostatisticians, biology and clinical practice. Some further devel-opment of power calculations, methods and design for such studies seems warranted.
Population-based cohort studies The population-based cohort study (see Table 3) has a number of advantages over other epidemio-logical study designs. Its prospective nature reduces bias, both in the collection of histories of exposure and in the use of biological measures of exposure. There are no specific advantages over case-control studies in the use of gentypiog data nor in the capacity to stratify the outcomes of interest on biological subtypes.
A specific advantage does accrue, however, if, using regular re-contact of cohort members, it is possible to establish aspects of the natural history
of disease via exploration of specific intermediate markers and processes. However, unless the cohort is routinely screened, there may be misclassifica-tion in the determination of such intermediate end-points. One possibility of course, is to restrict comparisons to those who have been screened as a matter of routine care. The Harvard group have used such an approach to the study of adenoinatous polyps within their cohort studies (Giovanrnucci et a1., 1993).
Subsequent exposure-marker collection is also facilitated. This may be relevant when it is in-tended to show that cumulative exposure, changes in exposure level or changes in metabolic state are important in the progression to cancer. This has not been used much iп cohort studies of cancer, although it has been used, for example, in cohorts of lead-exposed children. Some further biastatistical methodological development to optimize the use of sequential exposure measures is warranted. As with the clinic-based cohort studies, the problem of the truncation of the disease process by the removal of early stages of the neoplastic process remains.
A possible disadvantage of the cohort design, as compared with the case-control design, is the fact that usually, cohorts are somewhat restricted in their age range and thus may not provide the full picture if cancers at specific ages are determined differently, i.e. if there is an interaction between exposure markers and age, or between metabolic markers and age.
The logistics of sample collection in a population-based cohort study are the most problematic, as most cohorts are not able to be recruited via a clinical facil-ity. Whether recruited by mail or by a specially estab-lished clinic, costs of biological collection are high. As with the clinic-based cohort study, blood samples or buccal cells can be used to establish a wide variety of genotypes from very little material using PCR, but studies of serum or red-cell markers of exposure (e.g. serum nutrient levels, haen oglobin adducts) will rapidly deplete the stored samples. Nested case-control analysis rerпafпs the design of choice—as is planned for the EPIC study (Riboli 1992).
Population-based case-control studies This design is inferior to the cohort design in the biological measurement of exposure and, of course, in the far more limited focus of the outcome
35

Application of Biomarkers in Cancer Epidemiology
Table 4.Optimality of design and relative ease of sample collection logistics in
population-based case-control studies
1-i гп г.
Exposure (ë.g. blood levels, No Ь 3 adducts)
Susceptibility (e.g. genes) 1 3
Intermediate end-point [1] Noc
Stratificalion of diseases into 1 2_зд biologically defined subtypes
e1 = most optimal. (design) or easiest (logistics). lt may be acceptable for studies of very early stage disease
(Т1; M; No), but the problem of disease affecting the biological marker of exposure precludes гnогé general use.. 'Nith a few excephons e . Pap .smear registries or accurately
self reported intermediate lesions such as pigmented nasal, . there will be few opportunities to conduct population-based
case-control studes on intermediate arid points °See.fDotnate'Ь' 1oTaЫe 3
measures (single rather than multiple diseases). Its major advantages (Table 4) are its lower cost (although the cohort design almost certainly involves a lower cost per cancer studied) and its broader age range. The best use of the population-based case-control study is in the exploration of the role of specific genotypes in etiology (Heckbert et аL, 1992; Kadlubar et al., 1992) (again, both the tarer genetic mutations and the more common metabolic polymorphisms may be studied) and in the end-point stratification by molecular, histo-logical or other means. The number of samples needed to answer either of these questions is markedly lower than in the cohort design, but the logistics of blood collection is likely to be just as complicated as in the cohort, since neither cases nor controls are being recruited via a clinical route. Exposure markers (for design reasons) and inter-mediate markers (for logistic reasons) frequently cannot be studied in a useful fashion in this design. The collection of exposure markers in a case-control fashion is not likely to be useful, as noted above in the discussion on clinic-based case-control studies. With a few exceptions (e.g. population-based Pap smear registries or well-
measured self-reported intermediate markers such as pigmented naevi), there are no opportunities to conduct population-based case-control studies of intermediate markers.
In summary, each of the standard studies used in observational epidemiology acquires specific advantages and disadvantages when biological material is used to measure exposure or suscepti-bility, or is obtained in order to define specific intermediate end-points or to establish subsets of cancer outcomes. The screening clinic-based cohort study is most valuable in the follow-up to a specific cancer end-point in individuals known to be free of the disease at baseline. The focus is on both exposure and susceptibility markers relevant to that end-point. The clinic-based case-control study is of particular value in establishing the etiology of pre-cancerous lesions and in developing promising screening markers. The population-based cohort study gives the best opportunity for a generalizable study of etiology with exposure markers analysed in nested case-control fashion. The population-based case-control study provides the most cost-effective way of studying genetic susceptibility in the etiology of specific cancers.
References Blount, P.L., Ramel, 5., Raskind, W.H., Haggitt, R.C., Sanchez, C.A., Dean, PJ., Rabinevitch, P.S. & Reid, BJ. (1991) 17р allelic deletions and p53 protein overexpres-sien in Barrett's adenocarcinoma. Cancer Rca., 51, 5482-5486
Brick, K.E., Berry, G., Mock, P.A., MacLennan) R., Truswell, A.S. & Brmton, L.А. (1988) Nutrients in diet and plasma and risk of in situ cervical cancer. J. Nat[ Cancer Iпst., 80, 580-585
Giovannucci, E., Stampfer, М.J., CoIditz, G.A., 0mm, E.S., Trichopou1os, D., Rosner, B.A., Speizer, F.Е. & Willett, W.C. (1993) Folate, methionine, and alcohol intake and risk of colorectal adenoma, J. Nat1 Cancer inst. 85, 875-884
Heckbert, S.R., Weiss, N.S., Hornung, S.K., Eaton, D.L. & Motulsky, A.G. (1992) Glutathione S-transferase and epoxide hydrolaae activity in human leukocytes in rela-tion to risk of lung cancer and other smoking-related cancers. J. Nat! Cancer Inst., 84, 414-422
Jin, Z., Houle) B., Mikeev, A.M., Cha, R.S. & Zarbl. H. (1996) . Alterations in Hras1 promoter conformation during NMU-induced mammary carcinogenesis and
36

Logisaics and design issues
pregnancy. Cancer Res., 56, 4927-4935
Кadlubar, F.F., Butler. M.A., Kaderlik, K., Chou, J. & Lang, N.P. (1992) Poiymorphisms for aromatic amine metabolism in humans: relevance for human carcinogenesis. Environ. Health Persil., 98, 69-74
Kakiuchi, H., Watanabe, M., Ushijima, T., Toyota, I., Imai, K., Weisburger, J.H., Sugimura, T. & Nagao, M. (1995) Specific 5'-GGGA-3' - 5'-GGA-3' mutation of the Арс gene in rat colon tumors induced by 2-amino-l-methуl-б-phenylirmdazo[4,5-h]pyridine. Proc. Nod Ac&l. Sci. USA, 92, 910-914
Meltzer, S.J., Yin, J., Mania, B., Rhyu M.-G, Cottreil, J., Hudson, E., Redd, J.L., Krasna, M.J., Abraham, J.М. & Reid, B.J. (1994) Microsatellite instability occurs fre-quently and in both diploid and anexploid cell popula-tion of Barrett's-associated esophageal adenocarcinomas. Cancer Res., 54, 3379-3382
Riboli, E. (1992) Nutrition and cancer: background and rationale of the European Prospective Investigaцoд into Cancer and Nutrition (EPIC). Ann. licol., 3,
783-791
Rothman, N., Stewart, W,F. & Schulte, P. (1995) Incorporating biomarker's into cancer epidemiology: a matrix 0f biomarker and study design categories. Cancer Epidemiol. Biornarkers Prey., 4, 301-311
Sellers, T.A., Anderson, V.E., Potter, J.D., Bartow, S.A., Chen, R-L, Everson, L., King, R.A., Kuni, С.C., Kushi, L.Н., McGovern, P.G., Rich, S.S., Whitbeck, J. & Wiesner, G. (1995) Epidemiologgic and genetic follow-up study of 544 breast cancer families: design and methods. Genetic Ергдеттiol., 12, 417-429
Toniolo, P.G., Pasternak, B.S., Shore, А.E., Sonnenschein, E,, Koenig, K.L., Rosenberg, C., Strax, P. &Strax, S. (1991) Endogenous hormones and breast cancer: a prospective cohort study. Breast Cancer Res. Treat., 18, X23-S26
Winawer, S.J., Zauber, A.G., Ho, M.H., O'Brien, M.J., Gottlieb, L.S., Sternberg, S.S., Wayne, J.D., Sckapiro, M., Bond, J.Н., Panish, J.F., Ackroyd, F., Shike, M., Kurtz, R.C., Hornsby-Lewis, L., Gerdes, H., Stewart, E.Т. & National Polyp Study Workgroup. (1993) Prevention of colorectal cancer by colonoscopic polypectomy. New Fig!. J. Med., 329, 1977-1981
J.D.• Potter Cancer Prevention Research Program, Fred Hutchinson Cancer Research Center, Seattle, WA,.USR
37

ApplicaUci of Biomerkera h Cancer Epidemiology Toпioio, Р., Billette, P, Shuker, [.E.G., Rolhman, N., lulka, B. and Penroe, N. eds
IARC Scieпlilic Publicalions Ni. 142 International Аgепсц for Research on Cancer. Lyon, 1997
Methodological issues in the use of biological markers in cancer epidemiology: cohort studies D.J. Hunter
In this chapter we summarize the major strengths and weaknesses of cohort studies; consider how these characteristics influence the use of biomarkers in cohort studies; briefly review considerations of statistical power, design and the influence of measurement error in cohort studies; and discuss some of the emerging ethical considerations that relate to the use of biomarkers in prospective studies.
Most of the considerations that make prospective studiés an attractive study design apply to expo-sures in general, not only to biomaikers.
strengths Exposure measured before outcome The major strength of cohort studies is that the temporal relationship between exposure and out-come reflects the sequence of the causal pathway, i.e. exposure is measured before disease rather than afterwards, as in case-control(retrospective) studies. Thus, we can be assured that the Ыоmarker level in cases preceded the outcome. This timing has three important implications:
1. Provided that undiagnosed or pre-clinical disease has not altered the biomarker level (see below) we can be sure that the biomarker has not been influenced by the disease or its treatment. 2. In a long-running cohort, a range of different times will exist between biomarker collection and diagnosis of the outcome. This can be used to investigate hypotheses relating to different latent periods between exposure and outcome, although the timing of first exposure (if it occurs prior to baseline) is usually uncertain. 3. Other exposures that are assessed prior to dis-ease, such as questionnaire measures of diet, exercise or other lifestyle characteristics, should also be free of the influence of diagnosis of dis-ease, and biomarker-environment interaction analyses should not be biased by the differential recall of cases and controls (recall bias) which may occur in case-control studies.
Selection of controls For results to be unbiased in a case-control study, the controls must be representative of the popula-tion that gave rise to the cases (Breslow & Day, 1980); deviations from this principle may lead to selection bias. The choice of a control series that meets this criterion is frequently difficult. Random sampling from the underlying population may be impractical, even if this population can be defined; the source population for cases presenting at a cancer referral hospital, for instance, may be very difficult to specify. In a cohort study, the source population that gave rise to the cases is explicitly defined (cohort members at risk of disease), and thus selection bias should be minimal as long as follow-up rates are high. As it is rarely feasible to measure biomarker levels of all cohort members at baseline, a sample of cohort members is usually tested, using either a nested case-control or case-cohort design (see below).
Participation Selection bias can also be introduced if less than 100% of cases and eligible controls choose to par-ticipate. Participation rates, already low in some settings, such as large cities in the USA, may be further adversely affected in studies incorporating biomarkers, as collecting blood, urine or other samples usually requires more effort from partici-pants than studies using questionnaire-based mea-sures alone. In a cohort study, participation theo-retically should be 100% if reserves of specimen are available for all subjects and follow-up is complete.
39

Application ы Biomarkers in Cancer Epidemiology
Weaknesses Statistiсаl power The major weakness of cohort studies is that the number of cases of even the more common dis-eases is limited unless follow-up time is very long. A large cohort may not produce enough cases of uncommon diseases even if follow-up is main-tained until the last cohort member dies. This may be particularly troublesome for studies using bio-markers, as only a subset of people willing to be in a questionnaire-based cohort study may be willing to undergo the additional inconvenience associ-ated with providing a specimen such as blood or urine for biomarker analysis. Solutions to this problem include pooling information from multi-ple cohorts [for example, Mueller et al. (1989) obtained sera from cases and controls in several longitudinal studies to study Epstein-Barr virus antibody profiles and risk of developing Hodgkin's lymphoma], conducting a study in a high-risk cohort (e.g. uranium mine workers for lung cancer) or conducting a case-control study, in which the population giving rise to the cases is much larger than is feasible for a typical cohort study.
Specimen size and appropriateness Some biomarkers require large amounts of speci-men (e.g. several hundred millilitres of blood for certain pesticide residues), от unusual specimens that it may be impossible to collect in a prospective manner from large numbers of subjects (e.g. adi-pose biopsies).
Level of detail of other exposures In general, the 1éve1 of detail for most question-naire-based exposures is lower in a prospective study than in a retrospective study for which the questions can be focused on the subset of expo-sures of direct interest with respect to the outcome under investigation. Furthermore, unless exposure history is updated frequently (many cohorts mea-sure exposures only once at baseline due to the cost of obtaining updated measurements) then the exposure history between the baseline question-naire or interview and disease occurrence will be missing in a cohort study. Obtaining follow-up measurements to supplément baseline measure-ments may be particularly problematic for bio-markers, because the expense of collecting and storing specimens is substantial.
In summary, for relatively conurion outcomes for which sufficient cases are available, then the prospective design of a cohort study utilizing bio-markers has substantial advantages over retrospec-tive designs, although detailed questionnaire-based or interview-based information on other exposures may be lacking.
Timing of specimen collection and disease Iп any cohort study there will be a range of times between the date of specimen collection and the date of disease, due to staggered dates of collection, as well as a variation in the onset of disease.
The influence of pre -clinical disease A major concern in cohort studies of short dura-tion is the possibility that the disease process has influenced the biomarker level, even if disease is undiagnosed at time of specimen collection. This problem is most likely to occur if the average follow-up time is months or 1-2 years, and can be mini-mized if procedures for disease screening at base-line are used—for instance, if the end-point is lung cancer, through the exclusion of persons with recent weight loss or lesions on chest X-ray. Alternatively, excluding cases occurring in the first 1-2 years of follow-up may eliminate this effect of pre-clinical disease. However, distinguishing between this source of bias and a genuine associa-tion of a biomarker with disease that is only man-ifested early in follow-up (e.g. a late promotion effect in cancer) can be difficult. The long-running controversy about whether low serum cholesterol levels are associated with increased risk of cancer is a good example. In several prospective studies, even those such as the Multiple Risk Factor Intervention Trial (MRFIT) in which a physical examination was conducted at baseline, persons with lower serum cholesterol levels were at higher risk of cancer diagnosis; this effect was limited to the first 2 years of follow-up (Sherwin et al., 1987). Although the consensus (Lewis & Tikkanen, 1994) is that this is an example of bias intro-duced by pre-clinical disease, there are still those who argue that it is a valid and potentially causal association.
Inference from a single biomarker level A major weakness of cohort studies in general is that exposure data may be sparse and only avail-
40

Methodological "гssues: cohort studies
Observed relative risk given specified true relative risk
Plasma hormone ICC I .5 2.0 2.5
s1ВG (nmoln) 0.92 l.5 1.9 23
Percentage of free estradiol 0.80 1.4 1.7 2.1
Estradiol (pg/m1) 0.68 1.3 1.6 1.9
Profactin (ng/ml) 0.53 1.2 1.4 1.6
aTrue relative risk. Юbsérцed relative risk. From нankinson et al. (1995).
able for a single point iп time (e.g. baseline in a prospective study which does not update expo-sure). This may have several consequences, as described below.
Misclassification due to random within-person variation. Within-person variation is a characteristic of most biоmarkess that are not fired characteiistics, such as genotype. Substantial variation may be minute-to-minute (e.g. blood noradrenaline), hour-to-hour (e.g. blood glucose), day-to-day (e.g. 24-hour urine sodium excretion), month-to-month (e.g. plasma p-carotene), or longer, and may have a diurnal rhythm (e.g. plasma cortisol), may be related to the menstrual cycle (e.g. plasma hor-mones), or may have a seasonal basis (e.g. plasma vitamin D levels). If this variability is random and non-differential between future cases and controls, then the consequence will be bias to the null in the relative risk calculated from the biomarker. This attenuation of relative risks is proportional to the amount of within-person variability, and can be substantial. For example, Hankinson et l. (1995) calculated the intradass correlations between three measurements of levels of four hor-mones among 79 postmenopausal women; these ranged from 0.53 (prolactin) to 0.92 (sexhormone binding globulin, SHBG). For a true relative risk of 2.5, the observed relative risk would be 2.3 for SHBG, but only 1.6 for prolactin, if the relative risk was based on a single measurement rather than the average of three (Table 1).
Time-integration. In most studies of the epidemiol-ogy of chronic diseases, the exposures of interest are long-term average exposures, because the induction periods for diseases such as cancer or cardiovascular disease are usually thought to be of the order of years or decades. Thus, it is usually desirable that a biomarker reflect cumulative expo-sure over at least months or years. Time-integra-tion is often a function of the nature of the bio-logical sample being assayed. For many nutrients, for instance, concentrations in erythrocytes are less susceptible to short-term fluctuations than in plasma or serum (Hunter, 1990). Concentrations in adipose tissue frequently represent a longer expo-sure history than those in erythrocytes. A 24-hour urine sample is more likely to be representative of long-term intake than is a random urine sample. Feasibility constraints are frequently paramount in determining the choice of biological specimen to be obtained in a cohort study; however, consideration should always be given to the implications for the time-integration of the biomarkers of interest.
Inference from multiple biomarker levels. An obvious méthod for increasing the time-integration of exposure is to obtain specimens at several points in time. These can be averaged, or persons with sus-tained high levels can be compared with those with sustained low levels. Methods have been given to calculate the number of replicate mea-surements required to estimate the 'true' underly-ing mean value of a biomarker within a specified
41

Application of Biomarkers in Cancer Epidemiology
range of error (Lui et al., 1979), if within-person variation is assumed to be random. If within-person variation is not random, but is due to changes in behaviour or secular trends in exposure, then mul-tiple measurements may be usefuI to account for this source of exposure misclassification.
The obvious problem in a large cohort study is that obtaining samples at more than one time greatly increases the expense of sample collection and storage, and the burden on study subjects.
Inference from biomarker/disease associations. The strength of the underlying association between a biomarker level and disease depends on whether the biomarker is measured at the point in the causal pathway when this assodation is maximal, or whether it is measured at some other point. Conventional theories of cancer causation distin-guish between early events in the causal pathway ('initiators') arid later events ('promoters'). It is increasingly clear that the latency period between exposure and cancer diagnosis can be very long, e.g. three decades or more for the deleterious effect of smoking on colorectal cancer (Giovanntrcci et al., 1994), compared with about one decade for the pro-tective effect of aspirin on this cancer (Giovannucci et al., 1995). measurement of a biomarker of a putative initiating exposure may thus need to be several decades prior to disease; measurement of more proximal exposures, such as a late promoter, could be several years prior to exposure. If the mea-surement is made at the wrong time, however, the association may be attenuated or missed altogether.
The within-person variability of the biomarker is also relevant to determining how close to the time of maximum effect the biomarker needs to be measured. At the extreme, if the within-person variability is nil, e.g. a genotype marker, then the time of measurement prior to disease is not critical. In contrast, if the correlation of levels of a contin-uous biomarker over time is low, then time of sam-pling will need to be close to the time of maximum effect, if this effect is to be estimated accurately.
Measurement of within-person variability If within-person variability in biomarker levels is random, then knowledge of the correlation in a population of a single measurement with the average of multiple measurements can be used to 'correct' for attenuation of relative risk estimates
introduced by the fact that a single measure non-differentially misclassifies subjects with respect to their true average exposure. Even a single repeti-tion of a measurement can be used to estimate the correction factor; in fact, it has been shown (Willett, 1990) that the correction factor is more precisely estimated in data with two measurements on a large number of people than with multiple measurements on a smaller number. To be gener-alizaЫe to the larger cohort, the sample asked to participate in a reproducibility study would ideally be a random sample of the cohort. This is rarely feasible, particularly in geographically dispersed cohorts, and is usually further limited by less than perfect participation. Care should therefore be taken in interpreting reproducibility study infor-mation from less representative populations.
Specimen collection issues Collection and storage of a large specimen bank is a complex operation with numerous pitfalls.
A consideration that is particularly important in prospective studies is how to minimize the loss of information due to exhaustion of the sample. In case—control studies this may be less problematic, as much more sample may be available than it is feasible to colect and store from the large num-bers of participants enrolled in a typical cohort study. The problem of sample exhaustion is obvi-ously most acute with respect to incident cases of disease; if every biomarker of potential interest is entertained, then a few millilitres of plasma can vanish very quickly. Due to the advantages of cohort data, interest from the scientific commu-nity may be great, and requests for samples fre-quent. Refusal to part with precious samples may be met with hostility from those who are refused. It may be wise for those in charge of specimen banks to consider a number of common-sense pro-cedures including:
• colIaborating with laboratory colleagues to minimize the amount of sample required to per-form an assay with acceptable precision; for example, Laden et al. (1997) collaborated with Dr Mary Wolff of Mt Sinai Medical Center on the development of methods to reduce the amount of plasma required to perform assays 0f DDE and PCBs from 1 ml to 0.5 ml with equiv-alent precision;
42

у1е1hodоЭоgiсal issues: соhоп studies
• seeking collaborators who can measure a range of biomarkers in simuItanеous multiplex fashion on one aliquot of sample; • organizing an advisory board that can review requests for samples, establish priorities and share responsibility for decisions on the pur-poses for which samples are to be used.
Although these concerns are particulaтly acute for case samples, it is also desirable not to exhaust samples from participants selected as controls, as controls may become future cases. For nested case-control analyses of multiple biomarkers, it is usually most efficient to choose a single set of con-trols, in order to ensure comparabdity of relative risks associated with each biomarker, as well as to minimize the demands of aliquoting and sample handling. This may rapidly exhaust the sample from these controls however, and thus many investigators establish rules that mandate that a new control is selected when the amount of sam-ple for a control falls below some minimum value, in order to preserve specimens for future analyses if the control becomes a case.
Matching controls to cases Matching of cases to controls on a variety of char-acteristics may be used by investigators to increase the efficiency of statistical analyses. In biomarker studies, an additional level of matching is usually required to ensure the comparability of biomarker information between cases and controls.
sample comparability Biornarker levels are not fixed attributes of specimens, but may be altered by a wide range of procedures inherent in sample collection and storage. Thus, the overriding requirement for validity in bio-marker studies is that case and control specimens are handled in the same way. In prospective stud-ies, an additional factor to consider is length of storage; levels of many biomarkers degrade over time, and even under ideal storage conditions this degradation may be substantial (Bole11i et al., 1995). Thus, it is usually necessary to match cases and controls on duration of storage, in addition to other factors such as season of specimen collection (for biomarkers with seasonal variation), number of freeze-thaw cycles to which the specimen has been exposed, whether the specimen was collected fast-
ing or non-fasting, etc. Finally, batch-to-batch vari-ability in laboratory assays can be substantial; thus, where possible, cases and controls should be run together in the same laboratory batches for maximum comparability, whatever the study design.
Selection of controls: nested case-control or case-cohort Iп a large cohort study it is rarely desirable to mea-sure levels of a biornarker on all cohort members at baseline, largely due to the expense this would entail. Some exceptions may exist—for example, assays that require fresh specimen or can be auto-mated, e.g. haemoglobin or white cell count. The usual approach, however, is to select all the inci-dent cases, and to sample the control information.
Nested case-control In a nested case-control study, the controls are selected from the population which gave rise to the cases. Ideally, controls are selected for each case from the risk set of participants eligible to become a case at the time the case was diagnosed. It may be computationally easier to select from the set of participants at baseline who did not become a case during follow-up. If the amount of specimen needed is large, this latter procedure may also be preferable as it means that all incident cases are analysed; in the former risk set sampling, some case specimens may be unavailable if the case had been chosen as a control for a case occurring earlier in follow-up. It has been shown that if the cumula-tive incidence of disease is low (e.g. less than 5%), sampling from the baseline cohort introduces neg-ligible bias (Langholz & Thomas, 1990).
Case cohort One of the inconveniences of nested case-control studies is that as the number of case-control sets increases, the laboratory work required to conduct analyses increases. A potential solution to this problem is the case-cohort design, in which the population distribution of the biomarker of inter-est is measured at baseline in a subcohort, and then information about cases is added subse-quently as they occur. The calculations necessary to compute the variance of relative risks in this study design are complex (Prentice, 1986), but are now available in statistical packages (1-lirosoft
43

Application of Biomarkers in Cancer Epidemiology
International Corporation, 1993) which make their calculation convenient.
The major problems with the case-cohort design in biomarker studies are as follows:
1. If sample degradation over time occurs, dif-ferential degradation will occur in case and sub-cohort specimens. 2. If laboratory drift in the biochemical analysis is a concern, then having all the subcohort samples analysed at a different point in time from the cases may introduce substantial bias. This problem tends to be less acute when the biomarker is a qualitative trait such as genotype. 3. Laboratory personnel are more easily unblinded to case and non-case specimens in this design.
These problems make the case—cohort design of limited utility in prospective biomarker studies.
Choosing the cohort The range of exposures in a cohort of members of the general population will reflect the exposures typical in the general population, and rare exposures or unusually low or high exposure levels may be rare or even absent. If the research depends on having large numbers of persons at the extremes of exposure, or persons with rare exposures, e.g. certain occupa-tional exposures, then oversampling these persons or restricting to certain groups may be desirable.
Ethical issues If a biomarker is known to be predictive of disease probability, or if our own research shows that this is the case, then the question of whether to inform the participants in the study of their biomarker result should be asked. This issue is particularly ger-mane in prospective studies in which repeated re-contact with cohort members may occur during follow-up. Iп general, communicating this m liг-mation to cohort members has not been the norm in epidemiological studies for a number of reasons, including the followiпg:
• relative risks of the order of 1.1-3.0 are con-sidered sufficiently low that the information is not sufficiently predictive to be clinically useful; • the biomarker level is not considered defi-nitely predictive of disease and more studies are needed;
• no interventions are established that could help a person at higher risk to avoid disease; • if a screening method is available (e.g. mam-mography, sigmoidoscopy), the recommenda-tions on frequency of screening are similar, whether or not the information on biomarker level is known; 'it would be logistically difficult or impossible to communicate the information to cohort members; • the biomarker is clinically available and rou-tinely performed (e.g. serum cholesterol); • the within-person variability of the biomarker is so high that a value from the past (e.g. cohort baseline) would be poorly correlated with the current value; • information (for cases) about pre-diagnostic levels has no prognostic significance, and thus is not useful for someone who has already been diagnosed with disease.
Another ethical norm in cohort studies is that explicit consent to the exact biomarker being mea-sured has not been mandatory, as this may vary depending what disease the case developed, and with the rapid developments in the field of poten-tial biomarkers, it was impossible to predict at the time of enrolment of subjects which biomarkers might be of scientific importance in the future. Thus, a global consent to research use of the bio-Iogical specimen has usually been assumed to be adequate for the conduct of biomarker studies.
These norms are challenged by the rapid growth of potential markers of genetic susceptibility. High penetrance susceptibility genes (relative risks may be 50 or higher) are usually identified through family studies, in which the occurrence of a parti-cular disease leaves no one in the family in doubt of what disease is being studied; in which a powerful incentive may exist for family members to partici-pate in the research; in which issues of clinical treatment, screening aid prophylactic procedures (e.g. prophylactic mastectomy in breast cancer kin-dreds) are substantial; and in which relatively few participants are involved and thus relatively inten-sive counselling is possible aid appropriate. In addition, because these studies involve family members, and frequently children, major issues of confidentiality and/or coercion may arise, and thus procedures for informed consent must be rig-
44

Methodological issues: cohort studies
onus. For these same reasons, counselling to warn participants of the potential psychological impact of knowledge of inherited susceptibility, and post-test counselling to mitigate potential harm, is fre-quently intensive.
Biornarkers of lower degrees of risk may be estab-lished through the `candidate gene' approach: the frequency of polymorphisms that are known to alter the function of genes which might plausibly be involved in cancer etiology may be compared in cases and controls. This may result in the identifi-cation of biomarkers which convey much lower degrees of risk (e.g. relative risks of 1.5-3.0) or which only convey risk in the presence of certain environmental exposures (if a gene- environment interaction exists).
For all of the reasons specified above, prospec-tive studies of both low and high penetrartce genes are preferable to retrospective studies, in order to provide the most unbiased information. This infor-ration may be important in advising persons with these genotypes on their age-specific probability of disease and on lifestyle modifications they could make to reduce this probability and may have a bearing on whether general population screening recommendations are adequate in their situation.
However, because genetic screening is involved, some experts hold that ethical norms previously thought to be adequate for the assumption of con-sent in prospective studies involving biomarkers are inadequate. A recent statement by members of the Ethical, Legal Scientific, Implications (ELSI) panel of the US National Institute of Human Genome Research (Clayton et al., 1995) points out the potential for hair to study participants if con-fidentiality is breached in genetic susceptibility research, and underlines the lack of consensus on appropriate standards of informed consent in this area. The extreme position is that any biomarker of genetic susceptibility requires the same explicit and detailed informed consent that is the norm in family studies no matter what the degree of risk associated with this biomarker, and no matter what the state of the science is about this risk. Adoption of this extreme would render many epi-demiological studies unfeasible, in particular most cohort studies, for the following reasons:
• It is difficult to predict who will be tested, and for what, at the start of a study which will be
analysed in a nested case-control design. Covering all possibilities would provide partici-pants with an overwhelming amount of infor-mation and potential choices, and would prob-ably corrupt rather than enhance the process of informed consent. • New bioniarkers are becoming available that may not have been imagined at the start of the study, and thus prospective consent is impossible. • Reconsenting participants for every new marker would involve multiple re-contacts, and partic-ipation rates would almost certainly fall, even in studies in which re-contact is possible. Many prospective studies, however, are designed to take advantage of passive follow-up through cancer registries, aid re-contact may not be feasible.
If epidemiology is to make its appropriate, and socially desirable, contribution to these studies of biomarkers of genetic susceptibility, then guidelines need to be established which are appropriately respectful of the rights and concerns of subjects, but which do not rule out prospective studies of this whole class of biomarker research. These guidelines should be drafted by epidemiologists, ethicists, lawyers, clinicians, activists and repre-sentatives of research subjects, working together to resolve these issues.
References Воlеш, F., Nuti, P., Michell, A., Sciajno, R., Franceschetti, F., Krogh, V., Pisani, E & Berrino, F. (1995) Validity for epidemiological studies of Iong-term cryoconservation of steroid and protein hormones in serum and plasma. Cancer Epidemiol. Biomarkers Ргo., 4, 509-513
Breslow, N.Е. & Day, N.E. (1980) 5tatistiсаI Methods in Cancer Research, Vol. 1, The Analysis of Case-Coпtгоi Studies (IARC Scientific Publications No. 32), Lyon, International Agency for Research on Cancer,
Clayton, R.W, Steinberg, KK., Khoury, M.J., Thomson, E., Andrews, L., Kahn, M.E., Kopelman, L.М. & Weiss, J.O. (1995) Informed consent for genetic research on stored tissue samples. J. Am. Med. Assoc., 274, 1786-1792
Giovanmicci, E.L., Colditz, G.A., Stampfer, M.J., Hunter, D.J., Rosner, B.A., Willett, W.C. & Speizer, F.E. (1994) A prospective study of cigarette smoking and risk of col-orectal adenoma and cancer in women. J. Nat! Cancer
Inst., 86, 192-199
Giovannucd, E., Egan, K.M., Hunter, D.J., Stampfer, M.J., Colditz, G.A., Willett, W.C. & speizer, F.E. (1995) Aspirin
45

Application of Biomarkers in Cancer Epidemiology
and the risk of colorectal cancer in women. N. EngL J. Med., 333, 609-614
Hankiпson, S.E., Manson, J.~., Spiegelman, D., Willett, W.C., Longcope, C. & Speizer, F.E. (1995) Reproducibility of plasma hormone levels in postmenopausal women over a 2-3 year period. Cancer Ерiдетiоl. Biornarkers Pieu, 4, 649-654
Hirosift International Corporation: EPICURE/PEANUTS Softwдre (1993) The PEANUTS Program. EPICURE User's Guide. Seattle, WA, Hirosoft
Hunter D.J. (1990) Biochemical markers of dietary intake. In: Willett, W., cd., NulTitiorod Epidemiology. New York, Oxford University Press, pp. 143-216
Laden, F., Wolff, М.S., Niguid la, N.J., Spiegelman, D., Hankinson, S.Е. & Hunter, D J. (1997) Reduced aliquot size tir a plasma organochlorine assay for use in epi-demiologic studies. Cancer EрidemioI. Biomarkers Prey. (in press)
Langhoiz, B. & Thomas, D.C. (1990) Nested case—control and case—cohort methods of sampling from a cohort: a critical comparison. Am. J. EpidemioL, 131, 169-176
Lewis, B. & Tikkanen, M.J. (1994) Low blood total cho-lesterol and mortality: causality, consequence and con-founders. Am. J. СагдiоIоgy, 73, 80-85
Liu, K., Cooper, R., McKeever, J., McKeever, P., Byington,
R., Soltero, I., Stamler, R., Gosch, E, Stevens, E. & Stamier, J. (1979) Assessment of the association between habitual salt intake and high blood pressure: methodological problems. Am. J. EpidernioL, 110, 219-226
Mueller, N., Evans, A., Harris, N.L., Comstock, G.W. Je11um, E. Magnus, K., Orentreich, N., Polk, B.F. & Vogehnan, J. (1989) Hodgkin's disease and Epstein—Barr virus. Altered antibody pattern before diagnosis. N. Engl. J. Med., 320, 689-695
Prentice, R.L. (1986) A case-cohort design for epidemio-logic cohort studies and disease prevention trials. Biometrika, 73, 1-12
Sherwin, R.W., Wentworth, D.N., Cutler, J.A., Huuiey, S.B., Kuller, LI-f. & Stamler, J. (1987) Sегum cholesterol Ievels and cancer mortality in, 361, 662 men screened for the Multiple Risk Factor Intervention Trail. J. Am. Med. Assoc., 257, 943-948
Willett, W.C, cd. (1990) Nutritional Epidemiology, New York, Oxford University Press
D.J. Hunter Harvard School of Public Health, Department of Epidemiology, 677 Huntington Avenue, Boston, MA 02115, USA
46

Арр]icatioп of Biomaгkегs in lancer Epidemiology Тег ioыo, Р , Bofletta, P., 5hukег, D.E.G., Rothman, N., HWka, В. arid Pearce, N., rids
IARC Scientilio PuЫicatioпs No. 142 1пlегпаliопаl Agеnoy for Research on Cancer, Lyon, 1997
General issues of study design and analysis in the use of biomarkers in cancer epidemiology N. Pearce and P. Boffetta
Other contributions to this volume have discussed sources of variation (see Vineis) and measurement error (see White). In this article, we focus on statistical issues involved in the design and analysis of epidemiological studies that use biomarkers. We do not consider statistical issues of laboratory analyses.
In general, epidemiological research involves study-ing the external, modifiable causes of diseases in populations (McMichael, 1994, 1995) with the ш-tention of developing preventive interventions. In some instances, this activity can be enhanced by using internal biomarkeтs to obtain better mea-surements of internal exposure (dose), disease от individual susceptibility. Statistical issues in studies using biomarkers of exposure are not markedly dif-ferent from those involved in other epidemiological studies based on measures of external exposure, while studies using biomarkers of disease pose spe-cific prоЫеms due to the lack of persistence of some of these markers, and the analysis of interac-tion is of particular interest in studies using mark-ers of susceptibility. As with other epidemiological studies, the statistical analysis of a study involving biomarkers involves in general: (1) relating a par-ticular disease (or health outcome, such as a marker of early effect) to (2) a particular exposure while (3) controlling for systematic error, (4) assessing inter-actions with other exposures and (5) assessing the possibility of random error. We will consider each of these five aspects of study design and analysis in turn. We will restrict our discussion to full-scale epidemiological studies, i.e. we assume that the use of biomarkers, be they of exposure, effect or suscep-tibшty, aims to contribute to the elucidation of the causal relationships in human populations between diseases and factors such as external exposures, per-sonal habits, genetic traits and interventions. Issues in the design and analysis of transitional studies, in which the main aim is the validation of the markers themselves, are outside the scope of this chapter.
Measuring disease with biomarkers ipidemiological studies are usually based on a par-ticular population followed over a particular period of time. Miettinen (1985) has termed this study population the `base population' and its experience over time the `study base'. The different epidemio-logical study designs differ only in the manner in which the study base is defined and the manner in which information is drawn from the study base (Checkoway et "L, 1989). Thus, epidemiological studies may involve measuring either incidence or prevalence of disease. This distinction is important when a biomarker is being used to measure either the disease under study or early biological effects that are considered to be valid predictors of disease risk (e.g. Rothman eta?., 1995). In particular, many studies measuring disease with biomarkers are of cross-sectional design and measure the prevalence of the disease, which is dependent on its incidence and its duration. Thus, in a study looking at markers of cell damage as an effect of exposure to known or suspected carcinogens, the results would depend on factors such as the turnover of the cells in which the marker is measured or the capacity to repair the damage. For example, there is evidence that chromosomal aberrations caused by some carcino-gens, such as arsenic and benzene, last for longer periods than aberrations caused by vinyl chloride, and the reason for this difference is not known (Schwartz, 1990).
incidence studies Three measures of disease incidence are commonly used in incidence studies. The (person-time) incidence rate (or incidence density; Miettinen,
47

Application of Biomarkers in Cancer Epidemiology
1985) is a measure of the disease occurrence per unit time. A second measure of disease occurrence is the cumulative incidence (incidence proportion; Miettinen,1985) or risk, which is the propoTtion of study subjects who experience the outcome of in-terest at any time during the follow-up period. A third possible measure of disease occurrence is the incidence odds (Greenland, 1987), which is the ratio of the number of subjects who experience the out-come to the number who do not experience the outcome. As for the cumulative incidence, the in-cidence odds is dimensionless, but it is necessary to specify the time period over which it is being mea-sured. In incidence studies involving biomarkers of disease, it is therefore important to consider whether a particular biotuarker measures incidence or cumulative incidence.
Corresponding to these three measures of dis-ease occurrence, there are three principal ratio measures of effect that can be used in cohort stud-ies. The measure of primary interest is often the rate ratio (incidence density ratio), which is the ratio of the incidence rate in the exposed group to that in the non-exposed group. A second com-monly used effect measure is the risk ratio (cumu-lative incidence ratio), which is the ratio of the cu-mulative incidence in the exposed group to that in the non-exposed group. When the outcome is rare over the follow-up period, the risk ratio is approx-imately equal to the rate ratio. A third possible effect measure is the incidence odds ratio, which is the ratio of the incidence odds in the exposed group to that in the non-exposed gюир. An anal-ogous approach can be used to calculate measures of effect based on the differences rather than the ratios, in particular the rate difference and the risk difference.
In incidence studies involving biomarkers of dis-ease, it is therefore important to consider whether a particular biomarker measures incidence or cu-mulative incidence. For example, if the 'disease' under study is hepatitis B virus (HBV) infection, then a survey of the prevalence of HBV markers, in a cohort that has been followed over time, will in-dicate the cumulative incidence of infection in the cohort (wit the exception of those who have died from any cause during follow-up or who no longer show evidence of infection). It will not directly in-dicate the incidence rate of infections; this would require repeated prevalence surveys over time.
Incidence case-control studies Incidence case-control studies involve studying all of the incident cases of disease generated by the study base and a control group sampled at random from the same study base. The relative risk measure is the incidence odds ratio; the effect measure that this estimates depends on the manner in which controls are selected. Once again, there are three main options (Pearce, 1993).
One option is to select controls from those who do not experience the outcome during the follow-up period, i.e. the survivors (those who did not develop the outcome at any time during the follow-up period). In this instance, a sample of controls chosen by cumulative incidence sampling will es-timate the exposure odds of the survivors, and the odds ratio obtained in the case-control study will therefore estimate the incidence odds ratio in the base population. Controls can also be sampled from the entire base population (those at risk at the beginning of follow-up), rather than just from the survivors (those at risk at the end of follow-up). In such case-base sampling, the controls will esti-mate the exposure odds in the base population of persons at risk at the start of follow-up, and the odds ratio obtained in the case-contrai study will therefore estimate the risk ratio in the base popu-lation. The third approach is to select controls longitudinally throughout the course of the study (Miettinen, 1976); this is sometimes described as 'risk-set sampling' (Robins et al., 1986), 'sampling from the study base' (the person-time experience; Miettinen,1985) or density sampling' (Kleinbaum et al., 1982). In this instance, the controls will esti-mate the exposure odds in the study base, and the odds ratio obtained in the case-control study will therefore estimate the rate ratio in the study base.
In incidence case-control studies involving bio-markers of disease, it is therefore important to con-sider whether a particular biomarker measures incidence or cumulative incidence. These issues determine not only which measure of effect is being estimated, but also which method of control selection is appropriate, and the resulting methods of data analysis.
Prevalence studies The term prevalence denotes the number of cases of disease existing in the population at the time the study was conducted. If we denote the prevalence
48

Geпera{ issues of study design and analysis
of a disease in the study population by P, and if we assume that the incidence rate is constant over time, the population has reached a `steady state' and there is no migration into or out of the preva-lence pool, then it can be shown (Rothman, 1986) that the prevalence odds is equal to the incidence rate (I) multiplied by the average disease duration (D):
P1(1 — P) = I x D
Thus, the prevalence odds is directly propor-tional to the disease incidence, and the prevalence odds ratio is estimated to be:
OR = I1D110Dп
An increased prevalence odds ratio may thus re-flect the influence of factors that increase the dis-ease incidence and/or factors that increase disease duration. The different mechanisms involved in Increasing disease incidence or disease duration are likely to involve different time patterns of expo-sure and disease (see below), which in turn are likely to require different biomarkers for measure-ment of the etiologically relevant exposures.
Prevalence case—control studies Just as an incidence case—control study can be used to obtain the same findings as a full cohort study, a prevalence case—control study can be used to ob-tain the same findings as a full prevalence study in a more efficient manner. In particular, if obtaining exposure information is difficult or costly (e.g. if it involves serum samples), then it may be more effi-cient to conduct a prevalence case—control study by obtaining exposure information on all of the prevalent cases of the disease under study and a sample of controls selected at random from the non-cases. In this instance, a sample of controls will estimate the exposure odds of the non-cases, and the odds ratio obtained in the prevalence case—control study will therefore estimate the pre-valence odds ratio in the base population, which in turn estimates the incidence rate ratio, provided that the average duration of disease is the same in the exposed and non-exposed groups. Once again, an increased prevalence odds ratio may reflect the influence of factors that increase disease incidence and/or factors that increase disease duration, and
the different mechanisms involved are likely to re-quire different biomarkers for measurement of the etiologically relevant exposures.
Measuring exposure wïth biomarkers Validly of biomarkers of exposure There are considerable shortcomings in many cur-rently available biornarkers of exposure, including problems of measuring historical exposures; un-certainties as to what a biomarker is measuring; greater susceptibility to confounding in some in-stances; problems of application to public health policy (Pearce et al., 1995); the disease process affecting the level of the biomarker; and problems of validity of laboratory measurements (Boffetta, 1995). These issues are covered elsewhere in this volume. In this section we concentrate on issues of study design and analysis when measuring expo-sure with biomarkers, particularly with regard to time-related exposures with a relatively long in-duction and latency period between exposure and the subsequent occurrence of disease (as is the sit-uation in most cancer epidemiology studies). The issues we discuss are not unique to a particular study design (cohort studies, case—control studies, cross-sectional studies) but rather apply to all stud-ies in which the etiologically relevant time period involves a relatively long induction and latency period, thereby posing problems with the mea-surement of exposure during this period.
Time-related exposures боте biomarkers measure factors that are fixed and do not change over time in an individual, e.g. genetic susceptibility genes that may interact with xeno-biotic factors in cancer causation (Rothman, 1995). Other biomarkers measure factors that change over time, e.g. micronutrient levels in serum may change from day-to-day (Willett, 1990).
In studies (both prospective and retrospective) of long-term health effects involving time-related exposures, it is important that the time patterns of the study exposure and of the relevant con-founders should be taken into account in the analysis (Pearce et cL, 1986). In particular, it is im-portant that the principal exposure under study should be analysed in a time-related manner, taking account of the likely induction and latency periods, and the relative etiological importance of exposure intensity, exposure duration and
49

Application of Biornarkers in Cancer Epidemiology
cumulative exposure. The simplest approach is to analyse the cumulative exposure in a time-related manner, and this may suffice when the aim is merely to consider whether or not there is an effect of exposure. However, once it has been provision-aIly assumed that an effect exists, attention then shifts to understanding the nature of the effect. In this context, the temporal pattern of exposure and outcome cari be considered by examining the effects of exposures in specific time windows while controlling for time-related confounders and for the effects of exposures in other time windows. A more sophisticated approach is direct fitting of a theoretical model of carcinogenesis (Pearce, 1992), which requires assumptions as to the relevance of the times in which the exposure occurred arid in which the marker was measured. This may be par-ticularly relevant in studies including the mea-surement of the exposure, the marker and the dis-ease, which are mainly aimed at elucidating the role of the marker in the exposure—disease rela-tionship (5chatzlon et al., 1993). An example of this type of study is the investigation of the role of human papillome virus (HPV) in the etiology of cervical cancer (the `exposure' in this case being factors such as number of sexual partners and age at first intercourse). In this case, the association with HPV infection, when properly measured with PCR-based assays, is of such a magnitude that there is little concern about the relevance of the time periods (Munoz et al., 1992). However, for cancers from other organs, the association with HSV infection is less clear-cut, and the relevance of the timing of the infection may be one of the unknown factors modifying the exposure—marker—disease relation-ship.
Thus, biological measures of time-related expo-sures must be able to measures changes in expo-sure levels over time. In particular, stored biologi-саl samples may not provide valid measurements of long-term patterns of exposure when there are significant variations in exposure over time, unless samples have been taken repeatedly over the course of the study (Armstrong et al., 1992). If it is not possible to take repeated biological samples over time, then it is essential that the samples that are taken relate to the etiologically relevant time period.
Many currently available Ыоmarkers only indi-cate relatively recent exposures. For example, it is well known that serum levels of micronutrients re-
flect recent rather than historical dietary intake (Willett, 1990); given the long induction time of most cancers it is usually exposures between 10 and 30 years previously that are etiologically rele-vant. While this may not be a limitation in cross-sectional studies, provided that the etiologically relevant time period is close to the time of data col-lection, it is an important limitation iп cohort and case—control studies aiming to assess the effects of historical exposures. Some biomarkers are better than others in this respect (particularly biomarkers for exposure to biological agents), but even the best markers of chemical exposures reflect only the last few weeks or months of exposure. On the other hand, with some biomarkers (e.g. serum levels of ICDD; Johnson et al., 1992) it may be possible to estimate historical levels if the exposure period is known, if the half-life is relatively long (and is known) arid if it is assumed that f0 significant exposure has occurred more recently, or if it is reasonable to assume that exposure levels have re-mained stable over time.
However, historical information on exposure surrogates will often be more valid than current direct measurements of exposure or dose. This situation has long been recognized in occupational epidemiology, where the use of work history records in combination with a job—exposure matrix (based on historical exposure measurements of work areas rather than individuals) is usually more valid than current exposure measurements (whether based on environmental measurements ou biomarkets) because of changes in exposure levels over time (Checkoway et al., 1989). Similar problems may occur in the measurement of other carcinogenic exposures. For example, even the best currently available measures of exposure to tobacco smoke, such as plasma or urinary cotinine, appear to have similar validity to questionnaires for the measure-ment of current exposures; their very short half-life makes them inferior to questionnaires in the estimation of historical exposures (Pearce et aI., 1995). On the other hand, some biomarkers would appear to have value in the validation of question-naires (Forastiere et al., 1993), which can then be used to estimate historical exposures.
Another example in which timing of sample collection is of great importance is in the case of DNA adducts (Wilcosky & Griffith, 1990). Since most adducts are readily repaired, any measure of
50

General issues of study design and analysis
exposure based on DNA adducts will depend on the time between the end of exposure and sample collection; this pattern can then be modified by factors such as the activity of repair enzymes, which in turn may also have an independent iд fluence on the outcome, i.e. may be associated with case—control status. DNA adduct formation and repair are particularly problematic, since:
• the extent to which the amount of adducts measured represents the amount of biologically active adducts formed (as discussed above) is usually not known; and • in the case of measurements taken during ex-posure (or immediately thereafter, such as at the end of a working day) it is not known how much of the adducts found would persist long enough to be biologically important.
Analysis based on pооlеd samples These issues of the timing of sample collection are of particular concern in analyses based on pooled samples. If the samples were not all taken at the same etiologically relevant time period, then the pooled sample will represent the average of sam-ples taken from a variety of time periods. Thus, there may be considerable misclassification with regard to the exposure levels at the etiologically relevant time period.
Systematic error The major possible types of systematic error (bias) are the same in traditional epidemiology and in studies involving biomarkers (Boffetta, 1995). The various types of bias can be grouped into three major classes: selection bias, information bias, and confounding (Rothman, 1986). This section is not intended to give a comprehensive review of these types of bias; rather, we will concentrate on issues involving data analysis. One solution is to pool small sets of samples stratified on the basis of time since collection; however, this procedure may sub-stantially reduce the advantages of pooling.
Selection bras 5election bias involves biases arising from the pro-cedures by which the study participants are chosen from the study base. Selection bias can be avoided by including all of the study base (i.e. a cohort study) and obtaining a response rate of 100%. This
is often not practicable, but selection bias can also be controlled in the analysis by identifying factors that are related to subject selection and controlling for them as confounders. The statistical issues in-volved in controlling for selection bias in the analysis are essentially the same as those involved in controlling for sources of confounding (see below).
Information bias Information bias involves misclassification of the study participants with respect to disease or expo- sure status. Thus, the concept of information bias refers to those people actually included in the study, whereas selection bias refers to the selection of the study participants from the study base, and confounding generally refers to non-comparabil-ity of subgroups within the study base. The various methodological issues of validity, reproducibility arid stability of markers are part of the more gen-eral problem of information bias.
Non-differential information bias occurs when the likelihood of misclassification of exposure is the same for both cases and non-cases of disease (or when the likelihood of misclassification of dis-ease is the same for exposed aid non-exposed per- sons). Non-differential misclassification of exposure generally biases the relative risk estimate towards the null value of 1.0 (Copeland etal.,1977). Hence, non-differential information bias tends to produce 'false negative' findings and is of particular con-cern in studies that find no association between exposure and disease.
Differential information bias occurs when the likelihood of misclassification of exposure is differ- ent between cases and non-cases (or the likelihood of misclassification of disease is different between exposed and non-exposed persons). This can bias the observed effect estimate in either direction, either towards or away from the null value.
Information bias can drastically affect the validity of a study. As a general principle, it is important to ensure that the misclassification is non-differential, by ensuring that exposure information is collected in an identical manner in cases and non-cases (or that disease information is collected in an identical manner in the exposed and non-exposed groups). In this situation, the bias is in a known direction (towards the null), and although there may be concern that not finding a significant association
51

Application of Biomarkers in Cancer Epidemiology
(between exposure and disease) may be due to non-differential information bias, at least one can be confident that any positive findings are not due to information bias. Thus, the aim of data collection is not to collect perfect information, but to collect comparable information in a similar manner from the groups being compared, even if this means ignoring more detailed exposure information if this is not available for both groups. However, it is clearly importait to collect information that is as detailed and accurate as possible, within the con-straits imposed by the need to ensure that infor-mation is collected in a similar manner in the groups being compared.
In general, cross-sectional and case—control studies based on biomarkers of exposure are more prone to differential misclassification than studies based on measurement of external exposure and disease, since the biomarkers may be influenced by the disease itself. This problem is less relevant in prospective studies (or nested case—control studies) in which the marker is measured on biological material collected before the onset of disease, pro-vided that cases diagnosed within a short interval after sample collection are excluded. The fact that the relationships between exposure, marker and disease are in most cases obscure limits the inter-pretation of the findings of biomarker-based studies with respect to the presence or absence of infor-mation bias.
Confounding Confounding occurs when the exposed and non-exposed groups (in the study base) are not compa-rable due to inherent differences in background disease risk (Greenland & Robins, 1986) caused by exposure to other risk factors. The concept of con-founding thus generally refers to the study base, although as noted above, confounding can also be introduced (or removed) by the manner in which study participants are selected from the study base.
If no other biases are present, three conditions are necessary for a factor to be a confounder (Rothman, 1986). First, a confounder is a factor that is predictive of disease (in the absence of the exposure under study); second, a confounder is associated with exposure in the study base; aid third, a variable that is intermediate in the causal pathway between exposure and disease is not a confounder. This latter issue is of particular con-
cern in studies using biomarkers, since the identi-fication 0f potential confounders depends on pre-vious knowledge of the relationship between these and the relevant variables of exposure and out-come, and such knowledge is, for most biomarkers, very poor.
The most straightforward method of control-ling confounding in the analysis involves stratify-ing the data into subgroups according to the levels of the confounder(s) and calculating a summary effect estimate that summarizes the information across strata. However, it is usually not possible to control simultaneously for more than two or three confounders when using stratified analysis. This problem can be mitigated to some extent by the use of mathematical modelling, but this may in turn produce problems of multicollinearity when variables which are highly correlated are entered simultaneously into the model. For example, serum levels of various micronutrients may be strongly correlated and multicollinearity may occur when they are included in the same model. This will lead to unstable effect estimates with large standard errors, and may in fact lead to the wrong' micronutrient showing the strongest asso-ciation (negative or positive) with disease. This may be one reason why numerous studies have shown that the consumption of green and yellow vegetables is protective against a range of cancers, but the identification of the specific dietary micro-nutrients involved has remained elusive (Steinmetz & Potter, 1991).
Iп general, controI of confounding requires careful use of а priori knowledge, together with assessment of the extent to which the effect esti-mate changes when the factor is controlled in the analysis. Most epidemiologists prefer to make a decision based on the latter criterion, although it can be misleading, particularly if misclassification is occurring (Greenland & Robins, 1985). The decision to control for a presumed confounder can certainly be made with more confidence if there is supporting prior knowledge that the factor is pre-dictive of disease.
Misclassification of a confounder leads to a loss of ability to control confounding, although con-trol may still be useful provided that misclassifica-tion of the confounder was unbiased (Greenland, 1980). Misclassification of exposure is more prob-lematic, since factors that influence misclassifica-
52

General issues of study design and analysis
tian may appear to be confounders, but control of these factors may increase the net bias (Greenland & Robins, 1985).
When appropriate information is not available to control confounding directly, it is still desirable to assess its potential strength and direction. For example, it may be possible to obtain information on a surrogate for the confounder of interest. Even though confounder control will be imperfect in this situation, it is stil possible to examine whether the main effect estimate changes when the surrogate is controlled in the analysis, and to assess the strength and direction of the change. Alternatively, it may be possible to obtain accurate confounder information for a subgroup of participants (cases and non-cases) in the study and to assess the effects of confounder control in this subgroup.
A related approach involves obtaining con-founder information for a sample of the study base (Or a sample of the controls in a case—control study). For example, in a study based on question-naires, biomarkers may be used to validate questionnaire information in a subgroup of study participants.
The potential for confounding is of major con-cern in all epidemiological studies, including those using biomarkers. The use of biomarkers of exposure does not reduce the need to control for confound-ing, and in some instances the use of biomarkers may actually introduce confounding into a study. For example, in a study of lung cancer and РАН ex-posure in a group of factory workers, if the workers are classified according to РАН exposure on the basis of industrial hygiene monitoring, then the percentage of smokers (and the mean number of cigarettes smoked per day) will usually be similar in the groups with low, medium and high levels of occupational exposure to РАН (since these groups are defined purely on environmental levels of РАН exposure in various job categories and depart-ments, and these exposures will usually be unrelated to cigarette smoking). In this situation, cigarette smoking will fat be a major confounder. However, if workers are classified according to PAН-DNA levels, these will indicate total exposure to PAf Is from all sources, including cigarette smoking. Thus, cigarette smokers will be more likely to be in the 'high РАн exposure' group, and this group will therefore contain a higher proportion of smokers (and a higher mean number of cigarettes smoked
per day) than the medium or low РАН exposure group (since some of the total РАН exposure comes from cigarette smoke). The dose—response will then be confounded by cigarette smoking, and the `high РАН exposure' group may show a higher lung cancer risk which is not due to РАН exposure, but which is actually due to the other carcinogenic constituents of cigarette smoke (Pearce et al., 1995). One solution is to stratify the analysis on cigarette smoking (as measured by questionnaire), but any confounding control is likely to be imper-fect. This is even more of a problem if biomarkers are used to measure tobacco smoking because of the problems of measuring the etiologically rele-vant constituents of tobacco smoke (as distinct from exposure to PAIs in tobacco smoke). Once again, confounding control is likely to be imper-fect and, therefore, to yield results that are still confounded and less valid than those obtained by only considering occupational exposures (using a job—exposure matrix). Furthermore, one can only control for known confounders (e.g. tobacco smoke) and cannot control for unknown confounders that may also be subject to the same types of biases described above. Therefore, it is usually preferable to avoid confounding rather than to attempt to control for it post hoc (which is why randomized trials are the preferred method when they are fea-sible). Thus, it is preferable to consider only occu-pational exposures to PAIs, using a job—exposure matrix, and not to attempt to measure non-occu-pational exposures to РАН using bionrarkers. Finally, it should be stressed that the above issues have been discussed in terms of studies in which exposure is measured prospectively; the problems are even more acute when historical exposures are being assessed.
Random error Random error will occur in any epidemiological study, just as it occurs in experimental studies. It is often referred to as 'chance', although it can per-haps more reasonably be regarded as 'ignorance' (Checkoway et "L, 1989). Even in an experimental study in which participants are randomized into 'exposed' and 'non-exposed' groups, there will be 'random' differences in background risk between the compared groups, but these will diminish in importance (i.e. the random differences will 'even out') as the study size grows. In epidemiological
53

Application of Biomarkers in Cancer Epidemiology
studies, there is no guarantee that differences in baseline (background) risk will even out between the exposure groups as the study size grows, but it is necessary to make this assumption in order to proceed with the study (Greenland & Robins, 1986). In practice, the study size depends on the number of available participants and the available resources. Within these limitations, it is desirable to make the study as large as possible, taking into account the trade-off between including more par-ticipants and gathering more detailed information about a smaller number of participants (Greenland, 1988).
A major problem with the use of biomarkers of exposure and outcome in cancer epidemiology studies (and particularly in cohort studies) is that of small numbers. Even large multicemtre cohort studies often struggle to obtain sufficient numbers to assess risks of rare cancers from occupational ex-posures (Fingerhut et at, 1991; Saracсi et at, 1991). The use of biomarkers may be a major problem in this regard, since the resulting expense and сот-рlеxity may drastically reduce the study size, even in community-based and nested case—control studies, and therefore greatly reduce the statistical power for detecting an association between exposure and disease. As in traditional epidemiology studies, in studies using biomarkers statistical power is a func-tion of the prevalence of exposure and the magni-tude of risk; a biomarker with low prevalence aid high relative risk can be evaluated in small popu-lations, whereas a biomarker with low prevalence and low relative risk requires a larger population. The optimal balance between precision and valid-ity depends on a number of considerations, in-cluding the relative costs of the various exposure measurement techniques (Greenland, 1988). Thus, for an expensive biomarker to be useful it must be substantially better than less expensive and less in-vasive approaches. However, it has been argued that the necessary study size in some molecular epidemiology studies may be smaller than in tra-ditional epidemiology (Hulka, 1990a,b; Hertzberg & Russek-Cohen, 1993) because of Iarger differ-ences in biomarker distribution, identification of subgroups at higher risk, and the use of continuous outcome variables (Boffetta, 1995). While this is true in many cases (e.g. the detection of mutations in critical genes as a marker of increased risk of cancer), in other cases the biomarkers may show a
very low (or very high) prevalence, thus requiring large samples to detect a difference between groups (Hulka & Margolirn, 1992; Rothman et al., 1995). Finally, it should be noted that some biomarkers are of interest in themselves, rather than function-ing as surrogates for other exposures; in particular, no alternative methods exist for measuring mark-ers of genetic susceptibility. Nevertheless, the ad-ditional information provided by the use of such markers should still be compared with that pro-vided by alternative, larger studies in which the marker is not used.
An additional consideration in study size esti-mation in studies using biomarkers is the ratio of the number of assays per individual and the num-ber of individuals in the study (Boffetta, 1995), such as the detection of chromosomal aberrations or sister chromatid exchanges. In this case, studies must be based on adequate numbers of individuals and observations per individual (Hirsch et al., 1984; Wharton, 1985). Many biomarkers show marked variation from day to day within the same individual, and the intra-individual variation may be greater than the interindividual variation (Armstrong et al., 1992). It may therefore be neces-sary to take a large number of measurements to accurately estimate the average exposure level for each individual; otherwise it may be impossible to detect differences between individuals. For exam-ple, for 24-hour urinary sodium, the within-person variation may be three times as high as the be-tween-person variation; it has been estimated that the misclassification resulting from taking only one sample per person would result in a true rela-tive risk of 2.0 being reduced to an observed rela-tive risk of 1.2 (Armstrong et at, 1992). Thus, it may be necessary to take 10-15 24-hour urine samples in order to achieve reasonable accuracy in estimat-ing average individual sodium intake levels.
interaction Interaction (effect modification) occurs when the estimate of effect of exposure depends on the level of another factor in the study base (Miettinen, 1974). The term statistical interaction denotes a similar phenomenon in the observed data. Thé for-mer term will generally be used here. Interaction is distinct from confounding (or selection or infor-mation bias) in that it does not represent a bias which should be removed or controlled, but rather
54

General issues of study design and analysis
a real difference in the effect of exposure in vaтious subgroups that may be of considerable interest. For example, in а cohort study of passive smoking and asthma in children, the effect estimate for passive smoking might be different in different age groups, or in males and females. The clearest example of interaction is when а factor is actually hazardous in one group and protective in another group. More generally, the risk might be elevated in both groups, but the strength of the effect may vary. A typical example of effect modification in studies using biomarkers is the estimate of the risk of disease due to an external agent in subgroups of the population with a different genetic suscepti-bility marker, such as the polymorphism for an en-zyme implicated in the activation or detoxification of the agent (see Landi & Caporasi, this volume)' In this situation, effect modification should be in-terpreted with considerable care, since the pres-ence of statistical interaction may depend on the. statistical methods used. In fact, all secondary risk factors modify either the rate ratio or the rate dif-ference, as uniformity over one measure implies non-uniformity over the other. If the assessment of the joint effects of two factors is a fundamental goal of the study, this can be done by саlculating stratum-specific effect estimates. It is less clear how to proceed if statistical interaction is occurring, but assessment of joint effects is not an analytical goal. Some authors (e.g. Klеinbaum et al., 1982) argue that it is not appropriate in this situation to calcu-late an overall estimate of effect summarized across levels of the effect modifier. However, it is com-mon to ignore this stipulation if the difference in effect estimates is not too great (Pearce, 1989). In fact, valid analytical methods (e,g, standardized rate ratios) have been specifically developed for this situation (Rothman, 1986).
Biomarkers may provide better opportunities for assessing interactions between two or more genetic and/or environmental factors. In particu-lar, genetic susceptibility genes should produce a higher disease risk for exposed susceptible groups than for non-susceptible and non-exposed groups (Boffetta, 1995).
However, a major problem of testing for inter-action, e.g. in studies involving markers of genetic susceptibility, is that it usually requires a substan-tial increase in study size. For example, in a case—control study, testing for interaction involves corn-
paring the sizes of the odds ratios (relating exposure and disease) in different strata of the effect modi-fier, rather than merely testing whether the overall odds ratio is different €тот the null value of 1.0. The power of the test for interaction therefore depends on the numbers of cases and controls in specific strata (of the effect modifier) rather than the overall numbers of cases and controls. For exam-ple, Smith and Day (1984) give an example of a case—control study that would have to be five times larger to detect a difference between odds ratios of 1.0 and 2.0 in the two different strata of an effect modifier than it would have to be to detect an overall odds ratio of 2.0 (ignoring the effect modi-fier). In general, when considering possible inter-actions, the size of the study needs to be at least four times larger than when interaction is not con-sidered (Smith & Day, 1984). Thus, in a study in-volving markers of genetic susceptibility, the gain in statistical power from considering such markers (thereby yielding higher relative risks in some strata) may be offset by the decrease in statistical power from the need to consider interactions. However, if the exposure of interest is independent from the genetic factor under study, case—case comparisons can be used to study interactions with greater statistical power (Piegorsch et al., 1984).
Conclusions In some instances, the increasing use of biomark-ers in epidemiological studies represents a major improvement in the discipline during the last years (Vineis, 1992). In many cases, biomarkers have helped to improve our knowledge of causes and mechanisms of both disease etiology and preven-tion. In other cases, however, it is unclear whether they represent an improvement on traditional epi-demiological methods. Epidemiological studies based on biomarkers are usually more complex than traditional epidemiological studies, because information is available on a larger number of vari-ables whose biological meaning is often poorly known. The methodological considerations in-volved in classical epidemiological studies on issues such as measurement of disease, measure-ment of exposure, selection bias, confounding, precision and interaction also apply to biomarker-based studies, and in most cases the methodologi-cal problems of this type of study do not require
55

Application of Biomarkers in Cancer Epidemiology
solutions different from those used in classical studies. In some cases, however, the use of bio-markers may pose specific problems, which have to be addressed within the general framework of modern epidemiological methods.
Acknowledgements N.P. is funded by a Professorial Research Fellowship and the Wellington Asthma Research Group is sup-ported by a Programme Grant from the HeaLth Research Coundl of New Zealand.
References Armstrong, B.K., White, E. & Saracci, R. (1992) Principles о f Exposure Measurement in Epidemiology. New York, Oxford University Press
Boffetta, P. (1995) Sources of bias, effect of confounding in the application of biomarkers to epidemiological stud-ies. Toxico!. Lett., 77, 235-238
Checkoway, H., Pearce, N. & Crawford-Brown, D. (1989) Research Methods in Occupational Epidemiology. New York, Oxford University Press
Copeland, К.T., Checkoway, H., McMichael, A.J. & Holbrook, R.H. (1977) Bias due to misclassification in the estimation of relative risk. Am. J. EpidemioL, 105, 488-495
Fingerhut, M.A., Halperin, W.E., Marlow, D.A., Piacitelli, L.A., Honchar, P.А., Sweeney, M.H., Greife, A.L., Dill, P.A., Steenland, K. & Suruda, А.J. (1991) Cancer mortality tri workers exposed to, 2,3, 7,8-tеtгасhlогоdibеnгор-dioхјn. New Rugi. J. Mcd., 324, 212-218
Fotastiere, F., Agabiti, N., Del1'orco, V., Pistelli, R., Corbo, G.M., Brancato, G., Pacifici, R., Zuccaro, E & Perucci, C.A. (1993) Questionnaire data as predictors of urinary cotinine levels among eosmoking adolescents. Arch. Environ. Health, 48, 230-23 4
Greenland, S. (1980) The effect of misclassification in the presence of covariates. Am. J. Epidemiol., 112, 564-569
Greenland, S. (1987) Interpretation and choice of effect measures in epidemiologlc analyses. Am. J. Epidemiol., 125, 761-768
Greenland, S. (1988) Statistical uncertainty due to mis-classification: implications for validation substudies. J. Clin. Epidemiol., 41, 1167-1174
Greenland, 5. & Robins, J.M. (1985) Confounding and misclassification. Am. J. Epidemiol., 122, 495-506
Greenland, S. & Robins, J.M. (1986) Ideпtifiability, ек changeability and epidemiological confounding. Int. J. EpidemioL, 15, 4128
Hertzberg, V.S. & Russek-Cohen, E. (1993) Statistical methods in molecular epidemiology. In: Schulte P. & Perera, F.P, eds, Molecular Eрidemiology: Principles and Practices. New York, Academic Press, pp 199-216
Hirsch, B., McCue, M. & Cervenka, J. (1984) Characterization of the distribution of sister chroinatid exchange frequencies: implications for research design. Hum. Genet., 65, 280-286
Hulka, B.S. (1990а) Overview of biological markers. In: luiRa, B.S., Wilcosky T.C. & Griffith, J.D., eds, Biological Markers in Epidemiology, New York, Oxford University Press, pp. 315
Hulka, B.S. (1990b) Methodologic issues irr molecular epidemiology. In: luIRa, S.S., Wilcosky, T.C. & Griffith, J.D., cdi, Biological Markers in Epidemiology, New York, Oxford University Press, pp. 214-226
Hulka, B.S. & Margolin, B.Н. (1992) Methodological is-sues in epidemiologic studies using biological markers. Am. J. EpidemioL, 135, 200-209
Johnson, E.s., Parson, W., Weinberg, C.R., Shore, D.L., Mathews, J., Patterson, D.G. & Needham, L.L. (1992) Current serum levels of 2,3, 7,8-Теtгасhloгodibепzо-р-dioxin in phenoxy herbicide applicators and characteri-zation of historical levels. J. Natl. Cancer inst., 84, 1648-1653
Kleinbaum, D.G., Kupper, L.L. & Morgenstern, H. (1982) Epidemiologic Research. Principles and Quantitative Methods, Belmont, CA, Lifetime Learning Publications
McMichael, A.J. (1994) Invited commentary-'Molecular epidemiology': new pathway or new travelling compan-ion? Am. J. EpidemioL, 140, 1-11
McMichael, A.J. (1995) Re: invited commentary Molecular epidemiology': new pathway or new travel-ling companion? Am. J. EpidemioL, 142, 225
Miettinen, O.S. (1974) Confounding and effect modifi-cation. Am. J. Epidemiol., 100, 350-353
Miettinen, 0.5. (1976) Estimability and estimation in case-referent studies. Am. J. Epidemiol., 103, 226-235
Miettlnen, O.S. (1985) Theoretical Epidemiology, New York, Wiley and Sons
Munoz, N., Bosch, F.X., Sari) ose, S., Izarzugaza, I., Gi1i, M., Vi ladin, P., Navarro, C., Martos, C., Ascunce, N., Gonzalez, L.C., Kaldor J.M., Guerrero, E., Lotiriez, A. Santamaria, M., Alsonso de Ruiz, P., Aristizabal, N. & Shah, K. (1992) The causal link between human papillomavirus and invasive cervical cancer: a population-based case-control study Iii Colombia and Spain. Ivt. J. Cancer, 52, 743-749
Pearce, N. (1992) Methodological problems of time-re-lated variables in occupational cohort studies. Rev. ЕрiдетгоI. 5апté ЛиЫ., 40, S4З-854
56

General issues of study design and analysis
Pearce, N. (1993) What does the odds ratio estimate in a case-control study. lut. J. EpidernioL, 22, 1, 1189-1192
pearce, N.E. (1989) Analytic imphcations of epidemio-logical concepts of interaction. lot. J. EpidemioL, 18, 976-980
Pearce, N.E. Checkoway, H. & Shy, C.M. (1986) Time-re-lated factors as potential confounders arid effect modi-fiers in studies based on an occupational cohort. Sсaпд. J. Work Environ. Health, 12, 97--107
Pearce, N., san)ose, S., Boffetta, P., Kogevinas, M., Saracci, R. & Savitz, D. (1995) Limitations of biomarkers of ex-posure in cancer epidemiology. Epidemiology, 6, 190-194
Piegorsch, W.W., Weinberg, C.R. &Taylor, J.A. (1994) Non-hierarchical designs for assessing susceptibility in popula-tion-based case-control studies, 5tat. Med., 13, 153-162
Robins, J.М., Gail, М.H. & Lubin, J.Н. (1986) More on bi-ased selection of controls for case-control analyses of co-hort studies. Biometrics, 42, 1293-1299
Rothman, K.J. (1986) Modern Epidemiology, Boston, Little, Brown
Rothman, N. (1995) Genetic susceptibility biomarkers in studies of occupational and environmental cancer: methodologic issues. Toxicol. Left., 77, 221-225
Rothman, N., Stewart, W.F., Rabkin, C.S. & Schulte, P.A. (1995) The development, validation, and application of biomarkers for early biologic effects. In: Mendelsohn, M.L., Peeters, J.P. & Normandy, M.J., eds, Biomarkers and Occupational Health: Progress and Perspectives, Washington, D.C., Joseph Henry Press, pp. 109-115
5aгaсci, R. (1984) Assessing exposure of individuals in the identification of disease determinants. in, Berlin, A., Draper, M., Hemminki, K. & Vainio, Н., eds, Monitoring Human Exposure to Сarciпogeпic and Mutagenic Agents, (IARC Scientific Publications No. 59), Lyon, Inter-national Agency for Research on Cancer
Saracci, R., Kogevinas, M., Bertazzi, P., et al. (1991) Cancer mortality in an international cohort of workers exposed to chiorophenoxy herbicides and chlorophe-
no1s. Lancet, 338,. 1027-1032
Schatzlo, A., Freedman, L. & Schi€famn, М. (1993) An epidemiologic perspective on biomarkers. J. lut. Med., 233, 75-79
Schwartz, G.G. (1990) Chromosome aberrations. In: Hulka, B.S., Wilcosky, T.C. & Griffith, J.D., eds, Biological Markers in Epidemiology, New York, Oxford University Press. pp. 146-172
Siemiatycki, J., Wacholder, Ѕ. Dewar, R., Wald, L., Bégin, D., Richardson, L., Rosenman, K. & Gérin, M. (1988) Smoking and degree of occupational exposure: are inter-nal analyses in cohort studies likely to be confounded by smoking status? Am. J. Ind. Med., 13, 59-69
Smith, P.G. & Day, N.E. (1984) The design of case control studies: the influence of confounding and interaction ef-fects. lit. J. Epidemiol., 13, 356-365
Steinmetz, K.A. & Potter, J.D. (1991) Vegetables, fruit and cancer: I. epidemiology. Cancer Causes Control, 2, 325-357
Vineis, P. (1992) Uses of biochemical and biological markers in occupational epidemiology. Rev. Epidem. Sante PuhL, 40, 563-569
Whorton, E.B. (1985) Some experimental design and analysis considerations for cytogenetics studies. Environ Mutagen; 4 (Suppl), 9-15
Wilcosky, T.C. & Griffith, J.D. (1990) Applications of bi-ological markers. In: Hulka, B.S., Wilcosky, T.C. & Griffith, J.D., eds, Biological Markers in Epidemiology, New York, Oxford University Press, pp. 16-27
Willett, W. (1990) Nutritional Epidemiology. New York, Oxford University Press
Correspon ling author N: Pearce Wellington Asthma Research Group, Wellington School of Medicine; PO Box 7343, . Wellington, New Zealand
57

Аpplicatioп of Biomarkars in Cancer Ёpkdеm иolоgy Toniolo, Р., Boffetta, h, 5hukeг, Q.E.G., RогКпеп , N. lLjlka B. апд Pearme, N,, ada
1АRC Scientific РuЫXahmns Ni. 142 Iniermtional Адепсц for Research cri Cancer, Lyon, 1997
Sources of variation in biomarkers P. Vïneis
Epidemiology is interested in variation. The goal of epidemiological research is to infer cause-effect relationships by observing whether the occurrence of disease varies according to relevant exposures. Epidemiology is usually interested in intergroup' variation (e.g. between those who are exposed and those who are unexposed to the factor of interest), while `intragroup' variation is a source of noise.Therefore, the study design aims to increase intergroup variability, to limit intragroup variability and to reduce error by ensuring validity and reliability of measurements. The goal of this chapter is to summarize simple ways to recognize the main sources of measurement error and to estimate the extent and the impact of such error,
In fact, the impact of error in the measurement of biomarkers within epidemiological research may be dramatic. For example, it has been claimed that in the measurement of oxidative damage to DNA, routine phenol-based DNA purification procedures can increase 8-hydroxydeoxyguanosine levels 20-fold in samples that are exposed to air following removal of the phenol. Exposure to air alone results in a fourfold increase compared with DNA samples that have been soiubilized in buffers purged with nitrogen (Wiseman et al., 1995). It is obvious that such gross contamination would seri-ously hamper an epidemiological study. The con-sequences would be even greater if subsets (batches) coming from different subgroups in the study population (e.g. exposed versus unexposed) under-go different technical procedures with different levels of error.
An example of 9nterlaboratory variability, con-cerning the measurement of DNA adducts in the same samples, is shown in Table 1.
To achieve an accurate estimate of the associa-tion between any marker and disease, in epidemi-ology we need reliable and valid measurements of exposure, covariates (potential confounders and effect modifiers), and outcomes. Causal inference is impossible in the absence of such requirements. I will distinguish, in the following, between marker (any variable that can be measured and is infor-mative for the purposes of the study), assay (a spe-cific laboratory test which aims at measuring that marker) and measurement (the concrete act of measuring the value of a marker in an individual using a specific assay). For example, PAH-DNA adducts are a type of marker, ЭгР-ilostlabelling is a
type of assay, and the data shown in Table 1 are measurements.
Validity and reliability Validity is defined as the (relative)lack of systematic measurement error when comparing the actual observation with a standard—a reference method that represents the 'truth'. Such 'truth' is in fact the abstract concept we are interested in, e.g. 'can-cer' as defined through an histological characteri-zation. While validity entails a 'standard', reliabil-ity concerns the extent to which an experiment or any measuring procedure yields the saine results on repeated trials (Carmins & Zeller, 1979). By 'the same results' we do not mean an absolute cor-respondence, but a relative concept, i.e. a tendency towards consistency found in repeated measure-ments of the same phenomenon. Reliability is rel-ative to the type and purpose of the measurement: for some purposes we may accept a level of unreli-
Table 1. 32Р-роstlabelling of aromatic DNA adducts (per 108 bases± 5i))
from foundry workers
ri Т1.ТЁ'
2 3 .
Control (n = 6.) 3.1 ± 1.7 — 1.7 ±0.7 .
Exposed workers 26 $ 43 12 t 10 9.2 + 23
(л = 35)
Dasa from 5avela of al., 1989.
59

Application ы Biomaгkвгs in Cancer Epidemiology
ability that is unacceptable for other purposes. In addition to being reliable, the marker must be valid, i.e. it must provide au accurate representa-till of some abstract concept.
Reliability focuses on a particular property of empirical markers—the extent to which they pro-vide consistent results аcrоss repeated measure-ments. Validity concerns the crucial relationship between concept and marker. Both are a matter of degree, riot an all or none' property. Validity and reliability are independent: a measurement may be perfectly reliable (reproducible in different labora-tories and repeatable at different times) but con-sistently wrong, i.e. far away from the true value. For example, a gun may be completely reliable if all the shots take place within a small area, but seri-ously biased if this area is far away from the target; conversely the gun is unbiased but unreliable if the shots have an average distribution around the centre of the target but are dispersed in a large area. We are interested in both validity and reliability; however, since validity is often not measurable, reliability is sometimes used (incorrectly) as a sur-rogate.
An aspect that is clearly relevant to the discus-sion of measurement error is timing. Any inference about the meaning of biomarker measures should be strictly time-specific, since time influences the results in several different ways.
The major components of biomarker variability that affect the design of epidemiological studies are variability between subjects (intersubject), vari-ability within subjects (intrasubject) and variability due to measurement errors. The impact of these three categories of variability on the biomarker response can be represented by a linear model of the foIlowing form (Taioli et a'., 1994):
Y~1k =u + а1 +Ы+ егlk
where Уй1k is the marker response for subject i at time j and replicate measurement k; u is the true population mean response; а! is the offset in mean response for subject i (assumed to be normally dis-tributed with mean = 0 and variance = s?; the vari-ance represents the extent of intersubject variabil-ity), b1 is the offset in response at Lime j (assumed to be normally distributed with mean = 0 and variance = s2;; this variance represents the extent of intrasubject variability), and е~1k is the assay
measurement error (normally distributed with mean = 0 and variance = 2lk) (Tatou et aL, 1994). The normality of distribution, assumed in the model, must be verified. In fact, many biomarkers have distributions that are faz from being normal. Normalization can be achieved through an appro-priate transformation, e.g. log transformation.
The model is based on a linear (additive) assump-tion, which implies that measurement errors are independent of average measurements. Such an assumption must be verified case by case, e.g. by checking whether errors are correlated with the mean.
Impact of measurement error: random aid systematic error Errors of marker measurement may have different impacts depending on the error distribution. If the epidemiological study has been conducted blindly, i.e. laboratory analyses have been done with no knowledge of the exposed/unexposed or diseased! healthy status of the subjects, we expect that the measurement error will be evenly distributed across strata of exposure or disease. Table 2 shows an examрlе. Suppose we recruit a cohort of smoking fathers, in order to investigate respiratory disease among their children. We determine urinary nico-tine and cotinine only at recruitment (Т0 ), and not at other time points during fo11ow-up. However, a number of fathers change their smoking habits in the course of time: at time Т1, 250 smokers have ceased, while 150 non-smokers have started smok-ing, so that at time ТZ, there are 1100 smokers and 850 non-smokers. Therefore, we have 'misclassifi-cation' of exposure, based on our spot measure-ment of urinary nicotine. Misclassification depends, in this case, on the study design and the characteristics of the population, not on technical limitations of the test (assay). The effect of mis-classification is such that a 'true' ratio of 2.0 between the prevalence of respiratory symptoms among children born from smokers and the preva-lence among children born from non-smokers becomes an 'observed' ratio of 1.48 (Table 2). This underestimation of the ratio is due to a 'blurring' of the relationship between exposure and disease, which occurs when misclassification of exposure, as in this case, is evenly distributed according to the diseased/healthy status (i.e. is not influenced by the outcome).
60

Sources of variation iп biomarkers
Both underestimation and overestimation of the association of interest may occur when nus-classification is not evenly distributed across the study variables. In the example, we may have a more general distortion of the etiological relation-ship, and not only a blurring of the association, if classification of exposure depends on the outcome (diseased/healthy status). Blurring is 'bias toward the null' while distortion as a consequence of uneven distribution of misclassification can be in either direction, both towards and away from the null hypothesis.
A model of study design used in large cohort studies is the nested case—control study, which consists of identifying, in the course of the follow-up period, all the subjects who develop the disease and drawing a sample of the healthy subjects (see Pearce & Boffetta, this volume). The advantage of such a design is that with less effort we may have estimates that are as stable as those that would be obtained by analysing the whole cohort. This is particularly useful when measuring biochemi-cal/molecular markers. In our example, suppose we collect urine samples from all 1950 fathers and store them in a refrigerator. When a case of respi-ratory disease is diagnosed in a child, we take the father's urine sample and, say, the urine samples of two fathers whose children are healthy at that time (cases and controls are usuallymatched for the time-lag between sample collection and sample analysis, to take analite degradation into account; see below). In such a situation, bias due to uneven distribution of error is a potential issue. For екат рlе, samples from fathers of diseased children might be analysed in a more accurate way than samples from fathers of healthy children. Scientific curiosity might lead one to measure additional bio-markers among the fathers of diseased children (including, for example, DNA adducts in exfoliated bladder cells or markers of oxidative damage to DNA), on the assumption that these subjects are scientifically more interesting. This is a rather com-mon attitude, which may, however, lead to serious bias. Bias can go both ways. In our example, if oxidative damage to DNA is measured more accu-rately among case subjects (i.e. if samples are solu-bilized in buffers purged with nitrogen) than among controls, we might find higher levels in the latter.
A more realistic example of bias dependent on
гa т1 T2 Smokers 1200 250 quit 1100 Non-smokers 750 150 start 850
The true prevalence of respiratory symptoms at rire Т2
among the children is 10% among children of smokers .
(22012200 children) and 5% ameng children of non-smokers
(8511700 children) (prevalence, ratio = 2.0}. EaCrnated prevalence of respiratory symptoms among' those
classified as smokers at To: 10% (bue prevalence in smokers) x 950 + 5% (prevalence in non.smokors) x 250 = 107.511200
= 8.9%. Estimated prevalence of respiratory symptoms amопg those
classified as non-smokers at 7: 10 % (true prevalence in smokers) x 150 + 5% (prevalence in non-smokers) х 600 =
451750-6%. Estimated prevalesce ratio = 8.9%16% = 1.48. '
knowledge of the disease status by the researcher is related to degradation of analites when biological samples are stored for a long time. If the samples front the cases affected by the disease of interest and those from controls (within a cohort design) are analysed at different times, bias can arise from differential degradation in the two series. For example, the researcher may decide (incorrectly) to analyse samples from the cases as soon as these arise in the cohort, while controls are analysed at the end of the study. Since the levels of, say, vita-min C decrease rapidly with time, serious bias may arise from the differential timing of measurement in the two series. For this reason, biochemical analyses should be made after matching of cases and controls for time since sample collection.
hources of variability: intersubject, intrasubject, laboratory Variation in biomarkers includes interindividual (intersubject) variation, intrasubject variation (i.e. variation in the marker over a particular time period), sampling variation (i.e. variation depending on the framework of biological sample collection) and laboratory variation. Sometimes intra-individ-ual and/or sampling variation are so large that the laboratory measurement variation makes a marginal
61

Application of Biornarkers in Cancer Epidemiology
Weight Age
Lutein -.0.06 (0.63) 008 (0.48) Criptoxanthine —0.22 (0.05) —0.04 (0.69) Lycopene —0.25 (0.03) 0.04 (0.73) wCarotene —0.12 (0.29) --4.03 (0.78) p-Carotene —0.27 (0.02) 0.11 (0.32) Tocopherol —0.12 (0.30) 0.08 (0.49)
Measurements were made by Giuseppe Maiani, 1stituto Nazionale dalla Nuuzione, Roma. Р values are гп brackets (n = 72).
contribution to overall variation. A particular exam-ple of intrasubject variation is associated with error due to handling, processing and storing of specimens; such variability can be measured only if repeated samples from the same individual are collected.
Intersubject variability in marker response may derive from factors such as ethnic group, gender, diet or other characteristics. For example, Table 3 shows interindividual variation concerning the levels of serum vitamins according to weight and age. We might have expected that vitamin levels varied according to diet-related characteristics such as weight (thinner subjects are expected to have healthier diets and higher vitamin consumption; P. Vineis, unpublished data). In this particular example, age is not associated with vitamin levels, although age always has to be considered as an important source of intersubject variation.
Similarly, the marker response may vary within the same subject over time due to changes in diet, health status, variation in exposure to the compound of interest (for dietary items, season is an impor-tant variable), and variation in exposure to other compounds that influence the marker response. Table 4 shows intra-individual seasonal variation in levels of micronutrients, indicating that temp-erature arid rainfall (as markers of season) had an important effect on most measurements.
Biological sampling variation is related to drcum-stances of biological sample collection. For ехаm-рlе, hyperproliferation of colonic cells is extremely
variable in different points of the colon mucosa. Therefore, not only is intrasubject variation over time important, due to variable exposure to agents that induce cell proliferation, but measurements are also are strongly influenced by how and where the mucosa is sampled. For example, a study (Lyles et al., 1994) estimated that 20% of the variability of the rectal mucosa proliferation index (measured by nuclear antigen immunohistochemistry) is due to subject, 30% is due to the biopsy within the sub-ject, and 50% is due to crypts within a biopsy, In other words, as much as 80% of variation is related to sampling.
Laboratory measurements can have many sources, in particular two general classes of labora-tory errors: those that occur between analytical batches and those that occur within batches. An example of a study that was designed in order to assess the different sources of laboratory variation is reported by Taioli et aL (1994), using the model described above. Iп one experiment, they drew blood from five subjects three times in three dif-ferent weeks (n = 5, k 3,] = 3) in order to measure DNA—protein cross-links. Table 5 shows the results, which indicate that variation between batches is quite important and greater than variation between subjects. An interaction between inter-subject variation and batch variation is suggested.
Methodological issues should be discussed as much as possible within biomarker categories, due to the specificities of each category. Table 6 shows how methodological data can be organized accord-ing to biomarker type. Intra-individual and sam-pling variations are considered, due to the extent of their influence on actual measurements for most markers.
Measurement of variation Reliability The extent of variability in measurements can itself be measured in several ways. Let us distinguish be-tween continuous measurements and categorical measurements. A general measure of the extent of variation for continuous measurements is the соеf-ficieпt of variation (CV = standard deviation! mean, expressed as a percentage). A more useful measure is the ratio between CV and CVw; CV,, measures the extent of laboratory variation within the same sample in the same assay, CVb measures
62

Sources of variation iп biomarkers
the between-subject variation, and the CVЪ/CV, ratio indicates the extent of the between-subject variation relative to the laboratory error. Large degrees of laboratory enor can be tolerated if between-person differences in the parameter to be measured are large.
A frequently used measure of reliability for continuous measurements is the intraclass correla-tion coefficient, i.e. the between-person variance di-vided by the total (between- plus within-subject) variance. The intraclass coefficient is equal to 1.0 if there 1s exact agreement between the two measures on each subject (thus differing from the Pearson correlation соеfficient which takes the value 1.0 when one measure is a linear combination of the other, not only when the two agree exactly). A coefficient of 1.0 occurs when within-subject vari-ation is null, i.e. laboratory measurements are totally reliable. The intraclass correlation coefficient can then be used to correct measures of association (e.g. relative risks, RRs) in order to allow for labo-ratory error. Table 7 shows an example where inti-aclass correlation coefficients were computed for different laboratories which measured estrone lev-els, and where these coefficients were used to esti-mate the effect of laboratory error on the observed relative risks (for true relative risks of 1.5, 2.0 aid 2.5). In fact, labora-tory error attenuates the causal relationship between the parameter of interest (estrone) and disease (breast cancer), as a conse-quence of random misclassification. De-attenuation of the relationship (i.e. a correction for measure-ment error) can be achieved by applying the intra-class correlation coefficient. In Table 7, a high intra-class correlation coefficient (Lab. 4, r = 0.90) corre-sponds to good agreement between true and observed relative risks, while low coefficients (Lab. 1,
Temperature Rainfall
Lutein —0.89 0.74' ,x-Carotene 0.54 —0.17. a-Carotene 0.56. . —0.29 . Retinol —0.69 a-Тocopherol —0.60 0.47
From Colley et at., 1995: changes in seasonal levels were compared for each 2-month period tar 21 individuals over a 1-year period: Pearson correlation cootticionis. aA 5 0.02.
ЬP Ç 0.05.
r = 0.12) have a dramatic effect on observed rela-tive risks, which are all around 1.1. The observed RR was obtained using the formula RR = exp (In RRt к r), where RR, is the true relative risk.
The intraclass correlation coefficient can be used to estimate the extent of between-subject variability in relation to total variability. The latter includes variation due to different sources (repro-ducibility, repeatability and sampling variation). To measure reproducibility, i.e. the ability of two laboratories to agree when measuring the same analite in the same sample, the mean difference between observers (and the corresponding confi-dence interval) has been proposed (Brennan & 5ilman, 1992). Let us consider the example in Table 8: two pathologists interpeted the slides of 40 subjects with bladder сапсеr, in order to quantify р53 overexpression as measured by immunohlsto-
Table 5. Analysis of variance in a reliability study: DNA--protein cross-link
• г.
Week 0.05 13.7 (27) <001 Between sub]act 0.02 3.4 (4, 7) . -0 05 Week - subject 0.01 2.3 (7, 40) 6.045 Error 0.03
From: Taioli etal., 1984. dl degrees of troodirn;
63

Application of Biomarkers in Cancer Epidemiology
ь ,ј ' 1F. г rnгТ1гј
Biomârker category
*1iЕ*t фW 1гт1 Х'рј
jntra-individual variation
в
Biological sampling variation
Internal dose (blood) Hormones .. Yes (diurnal variation) No Water-soluble nutrients Yes (short half-life) No 0rganochlorine No (long half-life) No
Biologically effective dose Peripheral white blood cells Yes (half-life: weeks to months) No Exfoliated urathelial cells DNA adducts Yes (half-life: months) Yes
Early biological effects Lymphocyte metaphase chromosome aberrations More or less stable ? Somatic cell mutations glycophorin A Probably low No (?)
Intermediate markers Cervical dysplasia Yes Yes Colonic hyperproliferation Yes Yes
Genetic susceptIbiIity Genotype assay ` No No Non inducible phenotype No No Inducible phenotype Yes No
Tumour markers Yes Yes
chemistry. Table 8 gives the percentage of positive-staining cells according to each pathologist and the difference between the two observers for each patient. The proposed measure of interobserver agreement is the mean difference (in this case 0.9) and the corresponding 95% confidence interval, which is between —20.9 and +22.7 (I have used 2 as the probability point of the t-distribution, although the number of observations is only 37; in theory this choice would be appropriate only with n > 50). What we can conclude is that there is good average agreement between the two pathologists (mean difference = 0.9), but a large confidence interval indicating large overall variability. Iii the case of immunohistochemistrу a very important source of variation is sampling, since pathologists usually do not read the saine fields, i.e. the same cells, at microscope.
Let us now consider categorical (binary) data. Four different pathologists have read specimens of bladder cancer, specially stained to reveal the con-centration of the p53 protein (an immunohisto-chemical technique). Accumulation of the p53 protein (i.e. overеxprеssioп of the p53 tumour sup-
pressor gene) is considered to be a feature of malig-nancy. Data are expressed as proportions of cells which stain positive, i.e. a continuous variable. Therefore, a simple measure of agreement between readers is the correlation coefficient (Table 8). All coefficients are strongly statistically significant (P. 0.0001) and range from 0.6 to 0.9. However, for clinical purposes p53 expression is generally used in a categorical (binary) way, as in Table 9. Some researchers use 20% as a cut-off point to suggest a more aggressive clinical strategy. If we compare the first and the second pathologist, we see that one counts 11137 positive cases, and the other 16137 (three have been considered as not interpretable for technical problems). The discrepancy between the two proportions is more informative than the simple correlation coefficient, since it suggests that at least five patients would receive different clinical suggestions on the basis of the two readings. However, if we look at the detail of the table, we see that the two pathologists agree about the posi-tivity (~20%) in only 10 cases; in the other 20 they agree on the lack of positivity (<20% of stained cells), while for seven patients there is disagreement.
64
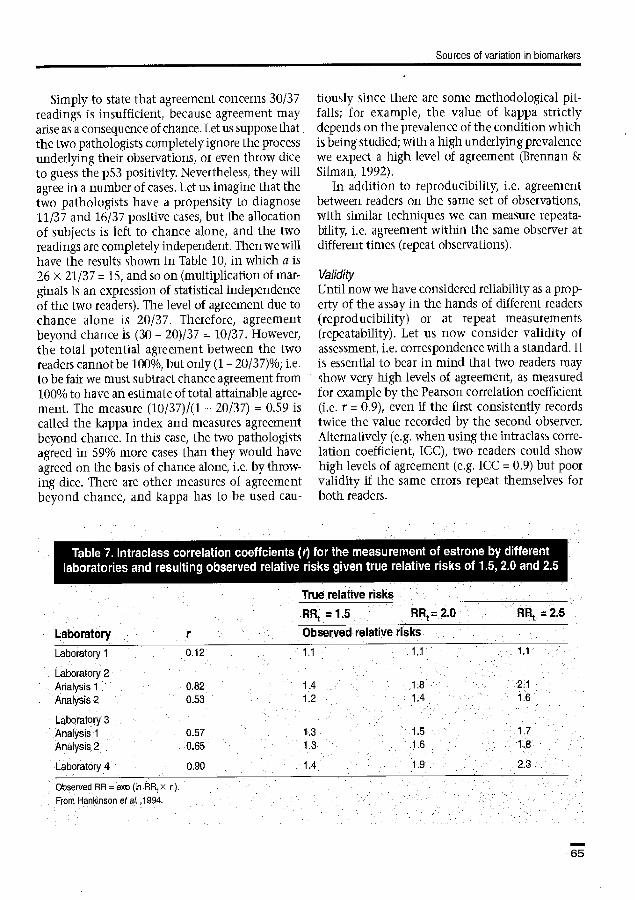
Sources of variation b biomarkers
Simply to state that agreement concerns 30/37 readings is insufficient, because agreement may arise as a consequence of chance. Let us suppose that the two pathologists completely ignare the process underlying their observations, or even throw dice to guess the p53 positivity. Nevertheless, they will agree in a number of cases. Let us imagine that the two pathologists have a propensity to diagnose 11/37 arid 16/37 positive cases, but the allocation of subjects is left to chance alone, and the two readings are completely independent. Then we will have the results shown in Table 10, in which a is 26 x 21/37 = 15, and so on (multiplication of mar-ginais is an expression of statistical independence of the two readers). The level of agreement due to chance alone is 20/37. Therefore, agreement beyond chance is (30 — 20)137 = 10/37. However, the total potential agreement between the two readers cannot be 100%, but only (1— 20/37)%; i.e. to be fair we must subtract chance agreement from 100% to have an estimate of total attainable agree-ment. The measure (10/37)1(1 — 20/37) = 0.59 is caled the kappa index and measures agreement beyond chance. In this case, the two pathologists agreed in 59% more cases than they would have agreed on the basis of chance alone, i.e. by throw-ing dice. There are other measures of agreement beyond chance, and kappa has to be used cau-
tioiisly since there are some methodological pit-falls; for example the value of kappa strictly depends on the prevalence of the condition which is being studied; with a high underlying prevalence we expect a high level of agreement (Brennan & Silman, 1992),
In addition to reproducibility, i.e. agreement between readers on the same set of observations, with similar techniques we can measure repeata-bility, i.e. agreement within the same observer at different times (repeat observations).
Validity Until now we have considered reliability as a prop-erty of the assay in the hands of different readers (reproducibility) or at repeat measurements (repeatability). Let us now consider validity of assessment, i.e. correspondence with a standard. It is essential to bear in mind that two readers may show very high levels of agreement, as measured for example by the Pearson correlation coefficient (i.e. r = 0.9), even if the first consistently records twice the value recorded by the second observer. Alternatively (e.g. when using the intraclass cone-lаtiоп coefficient, ICC), two readers could show high levels of agreement (e.g. ICC = 0.9) but poor validity if the same errors repeat themselves for both readers.
True relative risks .
RR= 15 ARt = 2.ü RRt = 25
Laboratory .. r Observed relative risks
Laboratory 1 0 12 1.1 1.1 1.1
Laboratory 2 Analysis 1 0.82 1.4 1.8 21
Analysis 2 0.53 1.2 1.4 1.6
Laboratory 3 Analysis 1 0.57 1 3 1.5 ... 1.7
Analysis 2 0.65 ` 1.3 1.6 1:,8
Laboratory 4 6.90 1.4 . f .9 . 2.3
Observed RR= exp (In ,RRr x r}.
From Hankinson etal. ,1994.
65

Application of Biomarkers in Cancer Epidemiology
In the case of immunohisto- chemistry we might decide that one pathologist is the standard, but this would not be an ideal
Specimen Pathologist choice unless we are organizing a training course in which younger
питber First Secoпd Difference pathologists аre instructed to rеад 1 16.00 21.00 -4.00 specimens. According to the del- 2 83.00 60.00 23.00 nition of validity, we are inter- a -9.so ested in the correspondence of 4 5
19.40 9640
19.4~ 72.80
0.00 23.60 the measurement with a concep-
6 4.90 4.50 0.40 tuai entity, i.e. accumulation of 7 . - 3.20 - the p53 protein as a consequence 8 21.00 16.20 4.80 of gene mutation (in fact, with- 9 11.40 5.40 6.00 out a mutation the protein has a ii 13.00 26.О0 -13.00 very short half-life and rapidly i 1 12
9.40 4.60
6.Dо 1.70
3.40 2.90 disappears from the cells). Tables
13 9.70. 1.80 7.90 11 and 12 show data on the cor- 14 20.80 32.10 -11.30 respondence between linmuno- 15 '43.50 49.00 -5.50 histochemistry and p53 muta- 16 5.60 12.50 -6.90 tuons. Sensitivity of immunohis- i7 40.tб X8.00 12-10 tochemistry is estimated as 85%, 1 В 19
11.50 14.60
7.00 13.50
4.5U 1.10 i.e. false negatives are 15% of all
20. - 27.00 - samples containing mutations; 21 7.50 2.80 4.70 specificity is estimated as 71% , 22 . 7.40 21.00 -13.60 i.e. 29% of samples not contain-
. . 16.зо 440 11.90 ing mutations are falsely positive 24 21.00 46:50 -25.50 at immunohustосhетisuу. A corn-
28 29.0 34.00 -4.20 bined estimate of sensitivity and
27 ' 82.00' 69.50 12.50 specificity is the area under the 2e 75.00. 75.20 -д.20 receiver-operating curve (ROC), 29 700 2400 -17.00 i.e. a curve which represents зо 7~2о 8.40 -1.20 graphically the relationship Эi 5.70 о.5о 5.2о between sensitivity and specificity. s2 зз
15.~а о.5о
6,1а 100
~.sa -о.5о In the example shown in Fig. 1,
34 1800: 7.50 10.50 the area under the ROC curve is 35 9.80 1100 -1.20 90.3% (Cordon-Carlo etal., 1994). 36 .4.20 10.50 -6.30 It is usually believed (Fletcher et 37 15,20 . 16.00 -2.80 al., 1988) that sensitivity and 38 . 9.30
_ 22.00 _
-12,70 _ specificity indicate properties of
Э9 40 - 52.60 29.30 23.30 a test irrespectively of the fre-
. quency of the condition to be Difference parameters detected (however, this is an ri Mean sD Minimum Maximum assumption that requires to be 37b 0.9 ' 10.907 -25.5 23 6 verified). In the example 01 95% range for agreement: mean ±2 х 5D(diff)=09±2 x 109= -2091022.7 Tables 11 and 12, the proportion
аAercentagе of pleuve cells as measured by two different palhologeffs in 1hе saте samples. of samples showing a mutation ' bThree missing чaiuвs: Data ktndly provided by Renato Coda n= 40). . 1s high (32/73 = 44%); it would
be much lower, for example, in patients with benign bladder
66

Sources of variaton in biomarkers
Pathologist 1
0 <20% г2О% Total Pathologist 2 0 O o 0 o <20% O 20 1 21 (3 NI) 20% 0 6 10 16
Total 0 26 11 37
Pathologist 3 o 0 a 0 <20% 1 15 3 (5N1) г2O% 2 6 8
Pathologist 4 0 0 0 0 <20% 0 18 0 (7N1)
20%% 1 7 7
Pathologist 2
0 <20% гΡ20%
Pathologist 3 0 0 2 1 <20% 0 20 .1 (5 NI) г20 % 0 3 8
Pathologist 4 . o O 1 0 H2O% 0 2 2 (7N1) J20% 0 0 7
Pathologist 3.
0 <20% 20%
Pathologist 4 0 0 1 0 <20% 1 21 3 (7 NI). г2О% O 3 6
NI, not interpretable
conditions or in healthy subjects. A measure that is useful in predicting how many subjects (among those testing positive) are really affected by the condition we aim to detect 1s the positive predic-tive value. In the example among 39 patients test-ing positive at immunohistochemistry, 27 actually have mutations, Le. irnmiinohistochemistry cor-
Table 10. Expected distribution of observations if Pathologist 2 of
chance
Pathologist 1 and Table 9 agree by alone
ь•
rectly predicts mutations in 69% of the positive cases. Let use suppose, however, that the pTeva-lence of mutations is not 44% , but 4.4% (32/730). With the same sensitivity and specificity values (85% and 71%, respectively), we would have a pos-itive predictive value of 11.8%, i.e. much lower. The predictive value is a very useful measure, because it indicates how many true positive cases we will obtain within a population of subi ects who test positive with the assay we are applying. However, we must bear in mind that the predictive value is strongly influenced by the prevalence of the condition: a very low predictive value may simply indicate that we are studying a population in which very few subjects actually have the con-dition we want to identify.
Tables 13 and 14 show another set of estimates of validity based on the clinical outcome. In this case, the aim is to understand how useful p53 immunohistochemistry may be in predicting the risk of metastases. While in the previous example the conceptual entity to be predicted by irnmuno-histochemistry was р53 gene mutation, here the conceptual entity is the aggressiveness of malig-nancy, as expressed by the occurrence of lymph node invasion in the follow-up of patients who were tested for p53 at diagnosis. In this case we are obviously interested in the positive predictive value which, for example, is 60% at stage 1. However, we also want to establish whether immunohistochemistry is worth measuring, i.e. whether it adds to what we already know from other clinical examinations. The best predictor of outcome is usually the clinical stage, based on the tumour size at diagnosis. We see that among stage 1 tumours, seven out of 25 (28%) manifest lymph node metastases in the follow-up. The ques-
67

Application of 8iomarkers in Cancer Epidemiology
p53 nuclear reactivity (immunohistochemistry)
p53 mutations by SSGP — + ++ Total
No mutation 29 7 5 41
All mutations 5 8 19 32 Total 34 15 24 73
Data from Esrig et al., 1993. sensitivity of immunohislochemistry (+ and ++) = 27132 = 85% Specificity = 29141 = 71%. Positive predictive value = (8+19)1(15+24) = 27!39 = 69%.
till is: does p53 immunohistochemistry add any information to simple knowledge of the stage at diagnosis? A way to answer this question is to estimate the a posteriori probability of metastases, after measurement of p53, and to compare it to the a priori probability (i.e. in the absence of p53 measurement), which in this case is 28%. The a posteriori probability is computed using the relationship:
a posteriori odds = a priori odds x likelihood ratio
Mutations lmmuvohistochemistry
— +1++ Total Yes 5 27 32 No 496 202 698 Total 501 229 730
Sensitivity = 27132 = 85%. Specificity = 4961698 71%. Positive predictve velue
Tables 13 and 14 show that in stage 1, the mea-surement of p53 allows the probability of metas-tases to increase from 28% (a priori) to 63% (а pos-teriori), while in stages 2 and 3 the contribution of p53 measurement is totally insignificant.
Laboratory drift, study design, quality controls When we organize and analyse an epidemiological study employing Ыоmarkers, we want to minimize total intragroup variability, in order to identify intergroup differences (e.g. between exposed and unexposed or between diseased and healthy sub-jects) if they exist. Total intragroup variation is the weighted sum of imtersubject, intrasubject, sampling and laboratory variations, with weights that are inversely correlated to the numbers of sub-jects, measurements per subject and analytical replicates used in the study design, respectively. Obviously, if we do not have detailed information we cannot adjust for intragroup variation. This is the reason why in epidemiological studies employing biomarkers it is important to collect, whenever possible, (1) repeat samples (day-to-day, month-to-month or year-to-year variation may be relevant depending on the marker); (2) poten-tially relevant information on subject characteris-tics that may influence intersubject variation; (3) conditions under which samples have been collected and under which laboratory analyses have been conducted (batch, assay, specific procedures).
Concerning item (3), measurement variation may occur as a consequence of many different aspects which are related not only to the choice of the assay but also to:
• collection of the sample (how and when a blood sample was drawn; the type of test tube utilized; the amount of biological material col-lected; for some measurements, whether the subject was fasting; avoidance of exposure to light if we are interested in vitamin C); • processing of the sample (e.g. speed of cen-trifuging to separate different blood compo-nents; use of a gradient to separate lymphocytes); • storage (in a simple refrigerator at —20°C; at —70°C; in liquid nitrogen at —196°C; for how long); • laboratory analyses (interlaboratory variation; assay; technician performing the assay; batch; accidental contamination of the sample).
68

Sources of variation in biomarkers
1.0
0.9
0.8
0.7
0.6
a,
7 0.5 ÿ
C Ф ° 0A
0.3
0.2
0.1
0.0
0.0 0.1 0.2 0.3 0.4 0.5 0.6 0.7 0.8 0.9 1.0
1-specificity
Area under the curve =50.3%
Figure 1. Receiver operating curve (ROC) statistical analysis of the sensitivity and specificity of immunohistochemistry as it relates to PCR-sSCP and sequencing results, represent-ing identification of p53 mutaiions. The area under the curve as a measure of diagnostic accuracy was estimated to be 90.3%. Redrawn from Cordon-Carlo et а1., 1994.
Therefore, in order to minimize intragroup varia-tion, technical details should be considered. As an example, for blood collection the following vari-ables need controlling (Young & Bermes, 1986; Pickard, 1989):
• Collection tubes contamination—e.g. in the case of trace metals, all materials (needles, tubes, pipettes, etc.) should be of a type that does not release metals. • Types of additive—e.g. collection of plasma entails the use of heparin. • Order of collection tubes—to avoid carry-over of trace additives, tubes without additives should be proceeded first. • Time of venipuncture—e.g. measurement of
stage j, lymph p53 immunohistachemistry node invasion
Negative Positive Total
No 14 4 18
Yes 1 6 7
Total 15 10 25
Data kindly provided by Professor A. Fontana. Predictive va!ue = 6110 = 60%. .
Likelihood raiid = (6/7)1(4/18) = 3.9
A prion probability = 7/25 28%, a priori odds = probablity/
(1 — probаЬildу) = 39%.
A gosteriâri odds = a priori odds X likelihood
ratio = 39%п х 3.8 = 1.5.
compounds that undergo substantial changes during the day, such as hormones, requires very accurate timing. • subject—physiological compounds such as proteins, iron and cholesterol can be increased by 5-15% in the standing position in comparison with supine position. • Haemolysis may occur as a consequence of tube transport and manipulation. • Storage conditions.
Laboratory drift is a special problem, but one that is not peculiar to laboratory analyses (e.g. a drift in the quality of interviews typically occurs during longitudinal epidemiological studies). Laboratory drift is a consequence of changes in procedures and accuracy over the course of time, so that the first samples that are analysed tend to differ from subsequent samples. The avoidance of laboratory drift requires a monitoring programme consisting of repeated quality controls. For exam-ple, measurements may be compared with a stan-dard at different points in time.
Another source of drift, which cannot be tech-nically avoided, is the degradation of analites when they are stored for a long time. A typical example is given In Table 15, which shows the results of a case- control study nested within a
69

Application of Biomarkers in Cancer Epidemiology
cohort. After blood collection, as soon as а case of cancer occurred, two suitable controls, matched to the case by time since blood collection, were sam-pled and their blood was analysed for retinal lev-els. ТаЫе-15 shows that among control subjects the concentration of retinol decreases with the time that has elapsed since blood collection. The impression one gets when looking at retinol levels after less than 1 year since blood collection is that cancer arose in those who had low vitamin levels compared with controls (the difference between cases and controls is statistically significant). However, after 3 years the difference has disappeared, indicating that the first measurement among the cases was likely to have been influenced by the metabolic impairment that occurs in cancer patients. In other words, two events occurred: degradation of retinal in stored samples, which is evident among control subjects; and an inversion of the cause— effect rela-tionship as a consequence of the metabolic impair-ment in cancer cases. Dealing with this source of drift requires a strict matching of cases and controls for time since blood collection when measurements are planned. In addition, measure-ments in cases should not be made shortly after blood collection, to avoid the effects of metabolic impairment.
Conclusions In the context of epidemiological studies using biomarkers, as well as in 'traditional' question-naire-based studies, we are interested in both validity and reliability. Validity refers to the truthfulness of estimates, and is therefore the key issue. However,
A posteriori A priori probability (when probability p53 is positive)
Stage 1 28% 63% Stage 2 73% 80% . 5tage 3 100% - a Calculated from the same data as. in Table 13 (as described in the footnotes of that table) for stages 1, 2 and 3
since validity is often not measurable, reliability is sometimes used (incorrectly) as a surrogate. One aspect that is highly relevant to the discussion of measurement error is timing: any inference about the meaning of biomarker measures should be strictly time-specific, since time influences the results in several different ways.
Generally speaking, a blurring of the relationship between marker and disease occurs when errors of measurement are evenly distributed according to the diseased healthy status (i.e. are not influenced by the outcome). Both underestimation and over-estimation of the association of interest may occur when measurement errors are not evenly distrib-uted across the study groups. Blurring is 'bias toward the null', while distortion as a consequence of uneven distribution of measurement errors can be in either direction, both towards and away from the null hypothesis. However, there are some exceptions to this simple rule.
Time between blood collection and cancer onset
Less than 1 year , 1-2 years >3 years
n Mean n Mean n Mean ( 911) (p9Il) (Чgј1)
Cases 66 641 45 650 116 694 Controls 132 722a 90 701k 232 633
From Wald et al., 1986. aР < 0.001. ЬР < 0.01.
70

Sources of variation in biomarkers
When we organize and analyse an epidemio-logical study employing biomarkers, we aim to minimize total intragroup variability and to iden-tify intergroup differences (e.g. between exposed aid unexposed or between diseased and healthy subjects. Total intragroup variation is the sum of intersubject, intrasubject, sampling and laboratory variations. Obviously, if we do not have detailed information we cannot adjust for intragroup variation. This is the reason why in epidemiolo-gical studies employing biomarkers it is im-portant, whenever possible, to collect repeat samples, potentially relevant information on subject characteristics that influence inter-subject variation, and conditions under which samples have been collected and laboratory analy-ses conducted.
Acknowledgements I am grateful to Professors Renato Coda, Benedetto Terracini, Enzo Bailatori and Roberto Pagni, and to Drs 5tefano Bonassi, Emily White and Nat Rothman for comments and suggestions. This work has been partially funded by the Associazione Italiana per le Ricerche m1 Cancro and the Italian National Research Council (Progetto Finalizzato ACRO, Grant No. 93.04716.СТ04).
References Brennan, P. & Silman, A. (1992) Statistical methods for assessing observer variability in clinical measures. Br. Med. J., 304, 1491-1494
Carmines, E.G. & Zeller, R.A. (1979) Reliability and цaIidity Assessment. London, Sage Publications
Cooney, R.V., Frankle, A.A., Hankin, J.Н., Custer, L.J., Wilkens, L.R., Haywood, Р.J. & Le Marchand, L. (1995) Seasonal variations in plasma micronutrients and antioxidants. Cancer EpidemioL BiomarkersPm '., 4, 207-215
Cordon-Carlo, C., Dalbagni, G., Saez, G.T., Oliva, M.R., Zhang, Z.F., Rosai, J., Reuter, V.E. & Pellicer, A. (1994) p53 mutations in human bladder cancer: genotypic vs. phenotypic patterns. lot. J. Cancer, 56, 347-353
Esrig, D., Spruck C.H., III, & Nichols, P.W. (1993) p53 nuclear protein accumulation correlates with mutations in the p53 gene, tumor grade and stage in bladder can-cer. Am. J. PathoL, 143, 1389-1397
Fletcher, R.H., Fletcher, S.W. & Wagner, E.H. (1988) Clinical ЕрјdепйоТo'lу—.Тhе Essentials, 2nd edn, Baltimore, Williams and Wilkins
Lyles, C.M., sandier, R.S., Keku, T.O., Kupper, L.L., Millikan, R.C., Murray, S.C., Bangdiwala, 5.I. & Ulshen, M.H. (1994) Reproducibility and variability of the rectal muicosal proliferaton index using proliferating cell nuctear antigen immunohistochemistry. Cancer EpidernioL Biomakers Pieu, 3, 597-605
Hankinson, S.E., Manson, J.E., London, 5.J., Willett, W.C. & Speizer, F.E. (1994) Laboratory reproducibility of endogenous hormone levels in postmenopausal women. Cancer Epidemiol. Biomarkers Prev., 3, 51-56
Pickard N.A. (1989) Collection and handling of patients specimens. Iп: Kaplan, L.A. & Pesce, A.J, eds, Clinical Chemistry: Theory, Analysis and Correlation, 2nd едп, CV Mosby, St Louis
5аvеlа, K., Hemminki, K., Phillips, D.Н., Hewer, A., Putman, K.L. & Randerath, K. (1989) Interlaboratoгy comparison of the 32P-postlabelliпg assay for aromatic DNA adducts in white blood cells of iron foundry work-ers. mut. Res., 224, 485-492
Taioli, F., Kinney, P., Zhitkovich, A., Fulton, H., Voitkun, V., Cura, G., Frenkel, K., Toniolo, P., Garte, Ѕ. & Costa, M. (1994) Application of reliability models to studies of biomarker validation. Environ. Health Perspect., 102, 306-309
Wald, N., Boreham, J. & Bailey, A. (1986) Serum retinol and subsequent risk of cancer. Br. J. Cancer, 54, 957-961
Wiseman, H., Kaur, H. & Hailiwell, B. (1995) DNA dam-age and cancer: measurement and mechanism. Cancer Lett., 93, 113-120
Young, D.S. & Bermes, E.W. (1986) specimen collection and processing: sources of biological variation. Iii: Tiertz, NW, ed., Textbook of Ctirdcal Chemistry, Philadelphia, WB Saunders
P. Vineis Unit of Cancer Epidemiology, Dipartimento di Scienze Biomediche e Onçologia Umana, Ospedale di Ѕ. Giovanni Battistâ. e Universitb di Torino, via Saoteua 7, Tonne, Italy
71

Rpр1iсat[on of Biomaгkeгs in Сапсег Epidemiology Toniolo, Р, Botfetta, P., 5huker, D.Е . Rothman, N., H,jlka, B. arid Pearce N., eds
'ARC Scientific Pubheatiorir' No. 142 l пternatioпal Agency cr Research vn Cancer Lyon, 1997
Effects of biomarker measurement error on epidemiological studies Е white
This chapter presents an overview of how measurement error in a biomarker affects epidemiological studies which use the biomarker. To estimate the effects of biomarker error, one must first measure the error using an appropriate validity or reliability study design and using appropriate parameters, i.e. parameters that are informative about the effects of measurement error on the parent' epidemiological studулhese measures of the biomarker measurement error from the validity or reliabiIity study can then be applied to what is known about the association under study in the parent study, in order to estimate the effects of the biomarker error on the results of the epidemiological study.
An epidemiological study that uses a biomarker can be of several types. For simplicity, we assume that the biomarker h an intermediate marker between an externat exposure and a disease, i.e.:
exposure - biomarker disease
and that the parent epidemiological study assesses the association between the biomаrker and the external exposure or between the biomarker and the disease (or between the biomarker and another intermediate marker). Two common study designs in epidemiology that include biomarkers are: (1) a study in which a biomarker is compared between those with a high level of exposure and those with low or no exposure; and (2) a case-control (or nested case-control study) in which the biomarker is compared between those with the disease of interest and controls. Because both types of study are essentially two-group comparisons (either exposure groups or disease groups) on the distrib-ution of the biomarker, these will be discussed together as 'two-gтопр studies'. Measurement error in the biomarker leads to bias in the measure of association (e.g. bias in the odds ratio for the asso-ciation of biomarker to disease) in the parent study; this bias is called information bias or mis-classification bias.
The measurement error for an individual can be defined as the difference between his/her 'mea-sured' (the biomarker 'test') and true' biomarkers. The true Ь опiагker can be conceptualized as the
underlying biomarker without laboratory or other sources of error, and if the measure can fluctuate over time, the true biomarker would be integrated over the time period of etiological interest (e.g. the mean value over a 10-year period).
There are numerous sources of measurement error in biomarkers. Examples are given in Box 1. Some have been discussed in the previous chapter (Vineis, this volume). Measurement error can be introduced by errors in the laboratory method selected to measure the exposure of interest; for example, if the true biomarker of etiological importance is (i-carotene, the choice of total carotenoids in the blood as the biomarker test will include other exposures not relevant to the epi-demiological true exposure. Further sources of error include failure to specify fully the protocol in terms of timing and method of specimen collec-tion, specimen handling and storage, and labora-tory technique. An additional source of error is the 'random' variation that occurs between batches and between laboratory technicians even when the protocol is well specified.
0f particular importance is the fact that mea-surement error can be due to short-term (e.g. week to week) biological variation and long-term change in the bioniarker within subjects. This type of error is often ignored when assessing laboratory mea-surement error, but it can have a large impact on an epidemiological study. This is because, unless the biomarker is a fixed characteristic within individuals, the underlying true biomarker
73

Application of Biomarkers in Cancer Epidemiology
that influences the disease of interest is rarely an individual's measured biomarker on a single day, but rather the average over time. Thus, even a perfect measure of the biomarker at a single point in time could be a poor measure of the 'true' biomarker.
Differential measurement error occurs when the biomaтkеr error differs between those with and those without the disease to be studied in the parent
в в в в r в
Errors in the laboratory method as a measure of thé exposure of interest Method may not measure all sources of the biological
true (etiological) exposure of interest Method may measure other exposures that are not the
true exposure of interest Method may be influenced by 'subject characteristics
(other than the true exposure) that thé researcher cannot manipulate, e.g. by the disease under study or by other diseases
Errors or omissions in the protocol Failure to specify the protocol in sufficient detail regard-
ing timing and method оf specimen collection, speci-men handling, storage and laboratory analytical pro- cedures .
Failure to include standardization of the instrument periodically throughout the data collection
Errors due to biological variability within subjects Short-term variability (hour-to-hour, day-to-day) in bio-
logical characteristics due to, for example, diurnal variation, time since last meal, posture (sitting versus lying down).
Medium-term variability (month-ta-month) due to, for example, seasonal changes in diet
Long-term change (year-to-year) due to, for example, deliberate dietary changes over time
Errors due to variations in execution of the protocol Variations in method of specimen collection Variations in specimen . handling or preparation Variations in length of specimen storage Variations in specimen analysis between batches
(different batches of chemicals, different calibration of instrument) .
Variation in technique between laboratory technicians Random error within batch
study. A primary concern in case-control studies of biomarker-disease associations is that the bio- logical effects of the disease or treatment may affect the biomarker so that it is no longer an equally good measure of the true (pre-disease) biomarker for both cases and controls. The term differential mea-surement error can be more generally defined as measurement error that differs between the com-parison groups (e.g. disease groups or exposure groups) to be used in the parent study.
Non-differential measurement enor occurs when the measurement error does not differ between the comparison groups in the parent epidemiological study. The effects of both differential and non-differential error will be discussed in this chapter.
`Validity' is the relationship between the bio-marker test (the mismeasured bior arker) and the true biomarker in a population of interest. Measures of validity are parameters that describe the measurement error in the population. A valid- ity study is defined here as one in which a sample of individuals is measured twice—ornce using the biornarker test of interest and once using a perfect measure of the true biornarker. To design a validity study that reflects the amount of measurement error that will occur in the parent epidemiological study, several design issues must be considered. First, the sample of individuals for the validity study should be a random sample from the parent study. If this is not possible, the subjects in the validity study should be comparable to the subjects in the parent study in terms of age, sex and other parameters that could influence the distribution (variance) of the biomarker and/or the error of the biomarker test. Second, the biomarker test should be collected, processed, stored and analysed in the validity study using the same procedures that will be used in the parent study. Third, a perfect measure of the true biomarker is needed for all individuals in the validity study. This true measure must reflect the underlying true biomarker without error, including error due to variation in laboratory pro-cedures and variations over time. The last issue is particularly problematic, because the true bio-marker of interest is often the average value over many years. In addition, one should consider con-ducting separate validity studies on those with the disease and those without the disease, to assess whether the measurement error differs between cases and controls. Finally, a validity study should
74

Effects of biomarker measurement error
be analysed using parameters that provide infor-ration about the effect of biomarker measurement error on the parent epidemiological study.
Often, a perfect measure of the biomarker does not exist iris not feasible to use in a validity study. Reliability studies, in which repeated measurements of the biomarker are taken on a group of subjects, usually only measure part of the measurement error. However, reliability studies can sometimes be used to measure the validity of a biomarker, without having a perfect measure of that bio-marker.
This chapter is divided into six sections. The first looks at quantifying the measurement error in binary biomarkers using a validity study. The sec-ond section is a discussion of the effects of the error in a binary biomarker on the odds ratio or other measures of association in the parent epi-demiological study. The third considers quantify-ing measurement error in continuous biomarkers using a validity study, and the fourth section covers the effects of the error in a continuous biomarker on the parent epidemiological study which uses the biomarker. Although one generally needs to conduct a validity study for binary biomarkers, in the case of continuous biomarkers, reliability stud-ies can be designed that yield information about the validity of the biomarker. Thus, information from a reliability study can answer questions about the effect of biomarker error on the parent study. This is covered in the fifth section.
The last section presents techniques to adjust the results of the parent study for the effects of measurement error. The researcher can then estimate the value of the true odds ratio (or other measure of association) that might have been observed in the absence of biomarker error.
Many related topics are beyond the scope of this chapter. A discussion of the effect of measurement error in a susceptibility biomarker (a factor that modifies the relationship between exposure and disease) on the results of the parent study using the susceptibility marker will not be discussed. The reader is referred to other sources for information on the effects of measurement error in a categorical measure (Walker and Blettner, 1985; de K1eтk еt а2., 1989; Armstrong et al., 1992), the effects of measure-rient error on sample size and power (Armstrong et al., 1992; McKeown-Eyssen, 1994; White et al., 1994), and the design and anaylsis of other types
of reliability studies (Dunn, 1989; Armstrong et cL, 1992). Techniques to reduce biornarker measure-ment error, and therefore to reduce the bias in the results of the parent study caused by measurement error, are covered throughout this book.
For the purposes of this chapter, sources of bias other than misclassification bias in epidemiological studies (i.e. bias due to the effects of confounding factors, unrepresentative selection of subjects, and sampling a finite number of subjects) are assumed to be absent. Furthermore, to make possible an explicit analysis of the effects of measurement error for continuous Ыоmarkers, certain simplifying assumptions are made about the form of the error. The purpose is to give the reader some insight into evaluating the effects of measurement errors.
Mearürиng the error in a ыnary biomarker Binary biomarkers are those that classify an analyte or characteristic as present (positive) or absent (negative) for each study subject. Measurement error in a binary (dichotomous) biomarker is usually referred to as misclassification. Binary bio-markers are subject to all of the sources of mea-surement error as described in the introduction and Box 1.
Measures of misclassification—sensiivity and specificity The degree of misclassification iii a binary biomarker is measured by its sensitivity and specificity. Sensitivity and specificity cari be measured in a validity study in which the biomarker under evalu-ation (the misaneasured biomarker) is compared with a perfect measure of the underlying bio-marker (true biomarker) in the population of inter-est. Individuals are then cross-classified by their results on each test:
True biomarker + -
Classified by + biomarker test -
The sensitivity (sens) of the biomarker under evaluation is the proportion of those who are true positives (positive on the criterion test) who are correctly classified as positive by the biomarker test:
sens = a/(a + c)
75

Application of 8iomarkers in Cancer Epidemiology
(Note that the definition given here of sensitivity is different from the meaning in some laboratory contexts, i.e. the lowest level detеctаЫe by a test.) The specificity (spec) is the proportion of those who are true negatives who are classified as nega-tive by the biornarker test:
spec= dI(b + d)
Even though both sensitivity and specificity can range from 0 to 1, it is assumed that sensitivity plus specificity is greater than or equal to 1. In other words, for the biomarker test to be considered a measure of the true biomarker, the probability that the biomarker test classifies a truly positive person as positive (sensitivity) should be greater than the prob-ability that it classifies a truly negative individual as positive (1 — specificity), i.e. sens> (1— spec), or (sens + spec) > 1. Thus the parameter (sens + spec— 1), called the Youden misclassification index (Kotz & Johnson, 1988), is a good measure of the total degree of misclassification. If the Youden index is 1, the biomarker testis perfect; if it is zero, the test has no association with the true biomarker; and if it is less than zero, the test is inversely related to the biomarker.
For a validity study to measure the sensitivity and specificity of a biomarker, the study sample can be made up of subjects not restricted by their biomarker status, or one can sample subjects who are true positives and those who are true negatives by the criterion test. However, one cannot sample subjects based on the results of the mismeasured biomarker test and correctly compute sensitivity and specificity.
As noted in the introduction, separate validity studies should be conducted on the comparison groups to be used in the parent study, particularly if one suspects that the sensitivity and/or speci-ficity may differ between groups. Specifically, if the parent epidemiological study is a case—control study in which the disease could influence the bio-marker test, then separate validity studies of the biomarker should be conducted on a group with the disease and on a control group. For example, suppose the parent study were a study to measure the pres-ence of a specific protein expression (present versus absent) in normal breast cells among women with concurrent breast cancer compared with those without cancer at the time of a breast biopsy. The
true biomarker of interest would be presence of the protein expression in the normal tissue 5-10 years before diagnosis, while the measured biomarker is expression in normal tissue at the time of diagno-sis, which could be influenced by the presence of disease. Assuming the protein expression could be measured in a stored tissue sample, the validity study could be conducted on two groups: the sub-set of cases and the subset of controls who had prior breast biopsies, say, 5-10 years before the index biopsy, with the true measure being expres-sion from the earlier biopsy. This would yield sep-arate measures of sensitivity and specificity for cases and controls.
Effects of the error in a binary biomarker on epidemiological studies Тhе effect of differential misclassification of a binary biornarker in a two-group study The effects of misclassification are straightforward for studies in which a binary variable is compared between two groups (Brass, 1954; Newell, 1962; Gullen et al., 1968; Goldberg, 1975; Barron, 1977; Copeland et al.,1977; Fleiss, 1981; Kleinbaum etaL, 1982).
In an unmatched two-group study of a binary biomarker, under the assumption that the group status is correctly classified, the effect of misclassi- fication of the biomarker is to rearrange individu-als in the true 2 x 2 table into an observable 2 x 2 table. individuals in the first group (diseased or exposed group) remain in the first group but may be misclassified as to biomaoker status, and the second group (non-diseased or unexposed) is also rearranged, as follows:
True classification
Disease or exposure group
Group 1 Group 2 + -
True biomarker + Рt РZ — 1 —Р1 1 —Р2
Measures of association Difference = Рt — РZ
Р1 (1— Л2) ОRT = pz (1— Р1)
76

Effects of biomarker measurement error
Observable classification
Observable difference - р1 —р2 (2) (misclassification)
Disease or exposure group
Group 1 Group 2
or
р1(1— рг) OR0 = рZ(1-p1) (3)
Biomarker test + p1 рг — 1 —рr 1— рг
Measures of association Difference = p1 — р2
ORo = pr
рг (1—рr)
Note that Р1 and Рz are the true proportions of biomarker-positives in groups 1 and 2 respectively, and similarly p1 and р2 refer to the proportions that would be 'observable' as positive by the biomarker test in the two groups. The term observable is used to mean that which would be expected on average when there is measurement error (the actual observed parameter in the parent study would be an estimate of the 'observable' parameter).
There is differential misclassification when the sensitivity of the biomarker test for group 1 (sensr) differs from that for group 2 (sense) arid/or the specificity of the biomarker test for group 1 (spec1) differs from that for group 2 (specZ). The misclassifi-cation leads to the observable p1 and рz being different from the true P1 and P2 (Goldberg, 1975):
р1 = sens1 к Р1 ±(1 — syеc1) x (1— Р1) р2 = sense к Рz ±(1 — specz) x (1— Рz) (1)
The first equation states that a proportion (sens1) of the true biomarker-positives (Р1) in the first group plus a proportion (1— specr) of the true biomarker-negatives (1 — Р1) in the first group will be classified by the biomarker test as positive (p1) in the first group. The second equation expresses the same concept for group 2.
The association between group and biomarker in the parent study would typically be measured by the difference in the proportion biomarker posi-tive if the two groups were exposure groups and by the odds ratio if the two groups were disease groups. When there is measurement error, these measures of association are biased because they are based on р1 and р2:
where р1 and рz are from equations (1). Differential misclassification can have any
effect on the difference: the observable difference,
р1 — рz could be closer to the null hypothesis or cross over the null hypothesis (i.e. have a different sign) compared with the true difference, Рr — РZ. Similarly, compared with the true odds ratio, the observable odds ratio can be closer to the null hypothesis of OR = 1, be further from the null or cross over the null.
Returning to an earlier example, let us suppose it is hypothesized that a certain protein expression in normal breast tissue is associated with increased risk of breast cancer. This could be tested in a case—control study, using normal tissue removed at the time of diagnosis from breast cancer cases and tissue from controls undergoing a breast biopsy. suppose that the test was insensitive among both cases and controls, such that only half of those with true protein expression were classified as positive (sens1 = sense = 0.5). Let us assume further that the specificity was perfect for controls (specZ = 1.0), but that, among cases, 10% of those without expression in normal tissue were classified as positive due to the influence of the breast tumour (specr = .90). If there were no true associa-tion between breast cancer and the protein expres-sion in normal tissue (e.g. suppose 10% of each group were protein-positive), then applying equa-tions (1) and (3) would yield the following:
True classification:
Breast cancer + -
True + 0.10 0.10 biomarker — 0.90 0.90
ORT = 1.0
Observable classification:
р1 = 0.5 x О.1 + 0.1 к 0.9 = 0.14 рZ = о.s хО.1+0=0.05 OR = 0.14 (0.95)
б 0.05 (0.86)
77

Application of Biomarkers in Cancer Epidemiology
Thus, a true odds ratio of 1.0, i.e. no association between the disease and Ыomarker, could appear as a strong association (OR0 = 3.1).
The effect of non-differential misclassification of a binary biomarker in a two-group study Non-differential misclassification in a two-group study would occur when the sensitivity of the biomarker test is the same for both groups (sens1 = sens2) and the specificity is the same for both groups (spec1 = spec2). Then the effect of mea-surement error in the biomarker on the difference between groups can be computed as in equations (1) and (2), which simplifies to:
р1- pZ = (Рr - Р2) (sens + spec -1) (4)
This states that the observable difference bet-ween the proportions that are positive in group 1 and group 2, p1 -р2, based on the biomarker test is equal to the true difference between groups, P1 - Р2, multiplied by a factor equal to sensitivity plus the specificity minus 1. If the biomarker test at a mimimum classifies a true positive person as positive on the test with greater or equal probability than it classifies a true negative person as positive (i.e. the Youden index (sens + spec - 1) is in the range 0-1), then the observable difference is always less than the true difference and does not change sign. For example, if the biornarker test had sens = 0.7 and spec = 0.8, which could be considered reason-able test accuracy, then (by equation 4) the observ-able difference between groups would only be half of the true difference (i.e. sens + spec -1 = 0.5).
The effect of non-differential misclassification of a biomarker on the odds ratio in a case-control study can be computed by calculating p1 and рZ as in equation (1) (except there would be a common sensitivity and a common specificity for the dis-eаsед and non-diseased groups) and then саlculаt-ing the odds ratio (equation 3). As an example, data are adapted from a report by 5chiffшan & Schatzkin (1994). They report on two case-control studies of human papillomavirus (HPV) infection and cervical intra-epithelial neoplasia (CIN). A major difference between the two studies was the accuracy of the test for HPV In the first study, a 3 ml cervicovaginal lavage was tested by Southern blot DNA hybridization techniques. In the second study, a 10 m1 cervicovaginal lavage was used to
collect more adequate DNA specimens, and the specimens were tested by an L1 consensus primer polyrnerase chain reaction (PCR) technique. The second study is considered here as an epidemlo-logical study without biomarker measurement error, and the fiist study as one with biomarker error. Had a perfect measure been available at the time of the earlier study, a validity study could have been conducted so that the sensitivity and specificity of the first test could be computed. Adapting data from this report (modified to serve as an example), such a validity study might have yielded the following:
True (2nd) test HPV+ HPV-
Misclassified (1st) HPV + 10 6 test HPV- 5 31
Total 15 37
and sensitivity and specificity could be computed as follows:
sens = 10115 = 0.67 spec 31/37 = 0.84
Here we assume that the mea ѕuтепјепt error is non-differential, i.e. that the sensitivity and speci-flcity are the same for cases and controls. The effect of this magnitude of biomarker error on the true relationship between HPV and CIN can be estimated by applying equations (1) and (3) to the true rela-tionship between HPV and CIN as seen in the sec-ond epidemiological study:
CIN Cases п (%) Controls n (%)
True (2nd) HPV + 381 (0.81) 80 (0.18) test HPV- 89 (0.19) 375 (0.82)
470 (1.0) 455 (1.0)
OR = 0.81 (0.82) = 20
T 0.18 (0.19)
р1 = о.67x0.в1+ о.1jx о.19= о.57 рZ =0.67x0.18+0.16x0.82=0.25
OR = 0.57 (0.75) =4.0
° 0.25 (0.43)
78

Effects of biomarker measurement error
This shows that a study using the misclassi6ed HPV test would find 57% of cases positive, 25% of controls positive (rather than 81% and 18% based on the accurate test) and an odds ratio of 4.0 rather than the true odds ratio of 20. In fact, the first study using the inaccurate HPV test observed an odds ratio of 3.7.
Non-differential misclassification leads to an attenuation of the odds ratio towards the null value of 1 (Gullen etaL, 1968). The degree of atten-uation iп the observable odds ratio depends not only on the true odds ratio and the sensitivity and specificity of the biomarker test, but also on the proportion of the non-diseased group who are true biomarker-positives (]?2). The observable odds ratio does not 'cross over' the null of 1.
Table 1 gives further examples of the effect of non-differential misclassification on the odds ratio for reasonable values of sensitivity (0.5-0.9), speci-ficity (0.8-0.99) and Р2 (0.1, 0.5) and for true odds ratios of 2 and 4. As can be seen from the table, the attenuation in the odds ratio can be considerable. When the proportion who are truly positive is low (e.g. РZ = 0.1 in upper half of the table), the atten-uation of the odds ratio is severe, except when the specificity is very high (e.g. spec = 0.99). When the proportion who are truly positive is high (e.g. РZ = 0.5 in lower half of the table), the observed OR is strongly attenuated from the true OR except when the sensitivity is very high (e.g. sens = 0.9). Even strong associations between the true biomarker and disease would be obscured by moderate values of sensitivity and specificity. For example, for sens = 0.7, spec = 0.8 and OR = 4.0, the observable odds ratio would be 1.64 for РZ = 0.01 and 1.83 for РZ = 0.5. These obsетvаые odds ratios would not be detectable as different from the null vaiue of 1 unless the epidemiological study sample size were large.
Measuring the error in a continuous biomarker using a validity study Often a biomarker assay yields quantitative infor-niation about the amount of an analyte in a bio-logical specimen; these measures can usually be considered to be continuous variables. This section covers the parameters of measurement error that can be derived from validity studies in which each subject in the validity study is measured twice—once using the mismeasured biomarker and once using a perfect (true) measure.
The theory of measurement error in continuous variables and its effects on studies of a continuous outcome were developed in the fields of psycho-metrics, survey research and statistics (Hansen et al., 1961; Cochran, 1968; Lord & Novick, 1968; Nunnaцy, 1978; Allen & Yen, 1979; Bohmsted, 1983; Fuller, 1987). The effects of measurement error have also been derived in the context of epidemio-logical studies of a continuous exposure variable and a dichotomous disease outcome (Prentice, 1982; Whittemore and Grosser, 1986; Armstrong et al., 1989).
A model of measurement error A simple model of measurement error in a contin-uous measure X is:
Х1 = Tг +b+Ei
where µ~ = 0 and рTЕ = 0. In this model, for a given individual i, the measured biomarker Х; differs from its true value Т by two types of measurement error. The first is the systematic error or bias, b, that would occur (on average) for all measured subjects. The second, E', is the additional error in Х~ for subject L E will be referred to as the subject error to indicate that it varies from subject to subject. It does not refer just to error due to subject characteristics; rather it includes all of the sources of error outlined in Box 1.
For the population of potential study subjects, X, T and E are variables with distributions, e.g. the distribution of E is the distribution of sub-ject measurement errors in the population of interest. X, T and E would have expectations (population means over an infinite population) denoted by i, µT and µE respectively, and variances denoted by , 6.1, and вE. Because the average measurement error in X in the pop-ulation is expressed as a constant, b, it follows that µr, the population mean of the subject error, is zero. The assumption of the model that the correlation coefficient of T with E, PTT' is 0 states that the true value of the biomarker is not correlated with the measurement error. In other words, individuals with high true values are assumed not to have systematically higher (or lower) errors than individuals with lower true values.
79

Application of Biomarkers in Cancer Eрidеmiolo9Y
.. - - в в l в в iI(•] в
•
True OR=2.0 True OR=4.0
Biorriarker test sensitivity Biomarker test specificity ORô ORob
Р2 = 0.5 0.80 1.14 1.38 0.7 0.80 1.23 1.64 0.9 0.80 1.32 1.92 0.5 0.90 1.28 1.76 0.7 0.90 1.39 2.09 0.9 0.90 1.48 2.41 0.5 0.99. 1.75 3.06 0.7 0.99 1.83 3.33 0.9 0.99 1.89 3.61
Рz = 0.5a 0.5 0.80 1.24 1.46 0.7 0.80 1.40 1.83 4.9 0.80 1.64 2.59 0.5 0.90 1.35 1.69 0.7 0.90 1.50 2.07 0.9 0.90 1.73 2.85 0.5 0.99 1.48 1.96 0.7 0.99 1.61 2.33 0.9 0.99 1.82 3.11
aР2 is the prevalence of true biomа kег-positives in the non-diseased group. Р1, the prevalence of true biomarker-positives in the diseased group, is, by detinitton, Р1 =. Р2 к ORT!(1 + Рz (ORS 1 j].
boRb from equatons (1) and (3).
Measures of measurement error-bias and validity coefficient Two measures of measurement error are used to describe the relationship between X and T in the population of interest, based on the above model and assumptions. One is the bias, i.e. the average measurement error in the population:
b = ~х -
The bias in X can be estimated from a validity study as:
b=X-T
The other is a measure of the prеcisian' of X, i.e. the variation of the measurement error in the popula-tion. One measure of precision is o, the variance
of E, which is often called the within-subject vari-ance. (Note that the model is formulated so that the two measures of measurement error have sep-arate parameters. The average error is given by b, and b does not contribute to the variance of the error. The error that varies from subject to subject is parametrized by E and measured by oE, and E does not contribute to the average error.) A more important measure of precision is the correlation of T with X, рTX, termed here as the validity coef-ficient of X. The measure ртX is important because it relates the within-subject variance б to the total variance бК, and it is this ratio, along with the bias, that measures the impact of biomarker error on the parent epidemiological study. Using the above model, it can be shown that ртх is the square root of 1 minus the variance of E relative to the variance of X (Allen & Yen, 1979), i.e.:
80

Eiiects of biomarker measurement error
Ртх = d1— (вÉ1 ) (5)
Using the above equation, it can be seen that the smaller the error variance, the greater is ртх.
Ртк would range between 0 and 1, with a value of 1 jndicating that X is a perfectly precise measure of T. PTX is assumed to be zero от greater, i.e. for X to be considered to be a measure of T, X must be at a minimum positively correlated to T.
Ртх can be estimated in a validity study by the Pearson correlation coefficient of X with T. Thus,
рTк
can be interpreted as the proportion of the vari-ance of X explained by T. Using the above model:
Ртк бт' Q"
For example, if ртх were 0.8, this would reflect that only 64% of the variance in X is explained by T, with the remainder of the variance being due to the error.
To further understand the concepts of bias and precision, consider a situation in which X only has a systematic bias, with E/ = 0 for all subjects. For example, suppose that the only source of error in a measure of serum cholesterol was that it quanti-tated each individual exactly 100 mgldl too high. Then, in a population, the variable X, even though it has systematic measurement error, could be used to order each person in the population perfectly by their value of T. X would be biased but have perfect precision. However, if Е~ varied from person to person (around the mean µE = 0), the ordering is lost. The greater the variance of Е, relative to the vari-ance of X, the less precise is X as a measure of T.
The degree of measurement error is not an inherent property of a biomarker test, but rather is a property of the test applied using a particular protocol to a specific population. Therefore, the error not ог lу will vary between two assays which measure the same biomarker, but also can vary for a single test when applied using a different pro-tocol or when applied to different population groups. Moreover, the validity coefficient is de-pendent on the variance of the true biomarker in the population (q), so that even if the error variance вΡÉ wer.e the same for two populations, ртх would differ if вT differed. Therefore, a validity study done on one population may not di-rectly apply to another study population. Finally, measurement error could differ between the study
groups in the parent study, e.g. there could be dif-ferential error between cases and controls in a case—control study.
The terminology surrounding measurement error varies between fields. In this chapter, the terms validity, accuracy and measurement error are used as general terms reflecting the relationship between X and T, including both the concepts of bias and precision. Iп laboratory quality control, the terms validity and accuracy are sometimes used to refer to unbiasedness only.
Effects of error in a continuous biomarker on epidemiologicai studies When the bias and validity coefficient of the bio-marker (X) are known, one can estimate the impact of the degree of measurement error in X on the parent epidemiological study.
Several types of epidemiological study designs are discussed, and both differential and non-differential measurement errors are considered. First, however, the effect of measurement error on a single study population is discussed.
The effect of measurement error on the observable mean and variance In a single study population, both the mean and variance of the measured biomarker X would differ from the true mean and variance due to measure-ment error. Using the above model, the population mean of X would differ from the trie mean (the population mean of [) by b:
µ =µT+b
The population variance of X, based on the model and assumptions, would be (Allen & Yen, 1979):
вΡX = вT+ бÉ вΡT1Ртх (6)
Thus, the variance of X in the population is greater than the variance of T, due to the addition of the variance of the measurement error. For example, if the validity coefficient (р TX) were 0.8, then the variance of measured X would be 56% greater than the variance of T ( = вΡT/0.82 = 1.56 вT by equation 6).
Figure 1 demonstrates the effect of measure-ment error on the distribution of X in a popula-

Application of Biomarkers jn Cancer Fрidemiology
T
'й -- о X
wr µх Biomarker (X or T)
Figure 1. Distribution of true (T) and measured (X) biomarkers.
tion, using a normally distributed biomarker aid normally distributed error as an example. The bias in the measure causes a shift in the distribution of X compared with T. The increased variance of X compared with T (measured by Pix) causes a flat-tening of the distribution of X. Even if a measure were correct on average (b = 0), there could still be substantial measurement error due to lack of pre-cision, which could lead to a greater dispersion in the measured exposures.
The effectif differential measurement error in a continuous biomarker in a two-group study While measurement errors have an effect on the observable mean and variance of an exposure variable within a single population, a greater concern would be the effect of measurement errors when comparing a biomarker between two groups. This section and the next section cover epidemiological study designs in which the biomarker is compared between two groups. When the two groups being compared are expo-sure groups, e.g. a highly exposed group and an unexposed group, the common measure of asso-ciation is the difference in the group means of the biomarker. When the groups being com-pared are a case group and a control group, the common measure of association between a bio-marker and disease is the odds ratio, which is often expressed as the odds ratio of disease for one level of the biomarker versus another (usually lower) level, or as the odds ratio of disease for a u unit increase in the level of the biomarker. (These results do not apply to odds ratios expressed as odds of disease for the upper quantile of the biomarker versus the lowest quantile—see Armstrong et al., 1992.)
For a two-group epidemiological study, the bio-marker measure Х11 for the ith person in the first group (exposed or diseased group) differs frот that person's true exposure Т11 by the systematic bias (b1) in X within that group and by error in subject i's measure:
Хrј =Т;+bi+Еr,
and, similarly, for the second group (unexposed or non-diseased group):
хZ,=тz,+ ьZ +ЕZ1
Differential measurement error occurs when b1, the bias in the first group, differs from b2, the bias in the second group, and/or thé variance of Е1 dif-fers from the variance of Еz.
Errors in the measurement of the biomarker X would affect the measure of the association in the epidemiological study. The effect of differential measurement error on the observable difference between groups in the biomarker means is:
~хi - цX Z = (µri - ~т2) + (bt - b2) (7)
This states that the observable difference between groups is equal to the true difference plus the difference in the biases of the biomarker test between groups. This equation holds even when the 'perfect' measure T is not perfectly precise, as long as T is unbiased (or at least not differentially biased between groups).
The effect of differential measurement error in X on the odds ratio can only be easily quan-tified when certain simplifying assumptions are made. Results can be derived for two-group studies under the following assumptions: (a) X1 and ХZ are modeled as above with рTЕ = 0 for each group, (b) Т1 and ТZ are normally distributed with means µr1 and µTZ respectively and the same variance, сT, and (c) Е1 and Е2 are normally dis-tributed with mean zero and common variance, бT. The later assumption means that X1 and X2 are equally precise, so only differential bias is considered.
The above assumptions imply a logistic regres-sion model for the probability of disease (pr(d)) as a function of true biomarker T, with a true logistic regression coefficient RT (Wu et aI., 1986):
82

Effects of biomarker measurement error
log 1—pr(d)
where Rr = FLт1 µт2
2 T
The true odds ratio for any u unit increase in T would be OR f = еРтu
With measurement error in the biomarker test X, the assumptions also lead to a logistic model:
p rd
log = аo + (30Х, 1--pr(д)
where
po = (µri тz)+(bi b2)
бт, ТХ
The observable logistic regression coefficient, R , differs from p~ due to the measurement error in X. po can be expressed in terms of RT (if R~~ 0) as fol-lows (Armstrong et al., 1989):
po= i 1+ b1 bг )
РтхRт (8) 1 Nтi µтz
Since (b1 — bZ) can be any magnitude and can be either positive or negative, the observable logistic regression coefficient, Ro, could be greater than, less than, or even have a different sign than the true coefficient fly. The observable odds ratio for any u unit increase in X, ORo =elou, could be towards the null value of 1, away from the null or cross over the null value compared with the true odds ratio.
Figure 2 gives a graphical presentation of differ-ential measurement error, in particular differential bias between cases and controls. In the figure, the true mean biomarker level in the diseased group, µgr, is greater than the true mean biornarker Level in the non-diseased group, µ~Z. This would lead to a positive slope in the true odds ratio curve. In this example, the bias for the non-diseased group is positive, so the distribution of X2 is shifted to the right relative to Т2, and the bias among those with disease is negative so that the distribution of X1 is shifted to the left relative to T1. This would lead the observable odds ratio curve to cross over
µх, гlтггLХ2 wr, Biomarker (X or 7)
Figure 2. Effect of differential measurement error (b ~ b2) on distribution of true (T) versus measured (X) biomarker in at two-group study.
the null value of 1(it would slope downwards from 1 as X gets larger, rather than upwards).
Differential measurement error should be a con-cern in a case—control study when the biomarker is measured within the pre-clinical disease phase before diagnosis, or any time after diagnosis, and the marker is not fixed. This concern is illustrated by several case—control studies that found low serum cholesterol at the time of diagnosis to be a risk fac-tor for colon cancer (Law & Thompson, 1991), which could be an artefact if increased catabolism or other effects of colon cancer reduce serum cholesterol. As an example of the interpretation of equation (8), if true mean serum cholesterol for cases 10 years before diagnosis (before the effects of disease) was 6.0 mnol/l µT1, while the true mean serum choles-terol among controls at a comparable time period was 5.8 µ. f , then the true odds ratio for colon can-cer wоulд2bе greater than 1, say ОАT = 1.05 for a 1 nmol/l increase (Q= li (1.05) = 0.05). However at the time of diagnosis (and a comparable time period for controls), there was substantial error in the measure of serum cholesterol (X) as a measure of T. suppose the effect of the disease were to cause serum cholesterol at the tinre of diagnosis for cases (X1) to be 0.5 nmol/l lower, on average, than 10 years earlier (b1 =
- = — 0.5), while among controls
the serum chorlesterol increased over the 10 years by 0.5 nmol/l (b2 =µX —µTZ = 0.5}. furthermore, suppose that ртx = 0.8. Then, by equation (8);
r -- ~.5 — 0.5 (30 =
L 1+ 0.82 x 0.05
6.0 — 5.8
=-0.13
83

Application of Biomarkers in Cancer Epidemiology
and ORo = еpо = 0.88
Under these assumptions, a true small increased risk (ORT =1.05) associated with serum cholesterol would appear as a decreased risk (OR0 0.88).
Differential bias is a greater concern than dif-ferential precision, because, as described above, differential bias can lead to a shift in the distribu-tion of the biomarker in one group relative to the other. Differential measurement error will also occur if differs between groups. If there were no differential bias but the 6E values differed (and бT values were equal for the two groups), the shape of the odds ratio function could change. For example, the observable odds ratio curve could be U-shaped when the true ехро-sure-disease relationship is increasing (Gregorio et aL, 1985).
The effect of non-differential mеа5игетвп t error in a continuous biomarker in a two-group study When the assumptions given in the above section hold, there is non-differential misclassification when there is equal bias (Ы = b2) and equal error variance (or equivalently equal ртx) in the bio-marker test when applied to the two groups in the parent epidemiological study. Figure 3 illustrates the effects of non-differential misclassification. Under non-differential misclassification, the two distrib-utions may shift, but they are not shifted with respect to each other, became there is equal bias for the two groups. Thus, based on the model pre-sented, the observable difference in the mean values of X between groups is equal to the true difference:
T2 т,
Ш
N'Хг i LТ2l.LХ W7i
Biomarker (X or T)
Figure 3. Effect of non-differential measurement error (equal bias and precision) on distribution of true (T) versus measured (X) biomarker in a two-group study.
(1.Lx1 - uх2) = (Irr1 - µтΡ2) (9)
However, the lack of precision flattens each dis-tribution and leads to more overlap and less distinction between the distributions of X1 and X2 compared with the true distributions. The variance of the observed difference between groups in the mean biomarker would be expected to increase by a factor 11ртк
Under non-differential misclassification, the odds ratio curve is flattened towards the horizon-tal line of odds ratio equal to 1 for all X. Equation (8) can be simplified to (Whittemore & Grosser, 1986; Wu et al., 1986):
Rо = р хРт (10)
If ORт = е1Tu is the true odds ratio for a u unit increase in T, aid ORo = еR0 is the observable odds ratio for a u unit increase in X, then:
ORo = рRpтx (11)
This states that the observable odds ratio for any fixed difference in units of the biomarker is equal to the true odds ratio for the same fixed difference to the power р7X Since 0 < Р X < 1, the observable odds ratio will be closer to the null value of 1 (no association) than the true odds ratio. The observ-able odds ratio does not cross over the null value if X and T are, at a minimum, positively correlated.
While the difference in the bias of X between groups (b1- b7) can play a major role in the bias in the odds ratio under differential measurement error (equation 8), equation (12) shows that the attenuation in the odds ratio under non-differen-tial misclassification is a function of the precision of X (measured by 2), but not of the bias in X.
Prentice (1982) has shown that, under similar assumptions, equation (10) also applies approxi-mately to estimates of R obtained from the pro-portional hazards model for data from cohort and matched case-control studies.
Examples of the effects of non-differential mea-surement error in a normally distributed biomarker on the odds ratio, based on the attenuation equa-tion (11), are given in Table 2. The table shows that biomarkers with a validity coefficient ртх of 0.5 would obscure all but the strongest associations.
84

Effects of biomarker measurement error
For example, if the true odds ratio for a u unit change in the biomarker were 4.0, this would be attenuated to an observed odds ratio of 1.41. Furthermore, measures as precise as р = 0.9 still lead to a modest attenuation-for example, a true odds ratio of 4.0 would be attenuated to 3.07.
The effect of independent measurement error in a study of the correlation between a continuous bio-marker and a continuous variable Often, the parent study which uses a biomarker will be one in which a continuous biomarker X will be compared with another continuous variable Y, e.g. a questionnaire measure of an exogenous ex-posure or another biomarker. Suppose both X and Y are measured with error, with the measurement error given by the model presented in `the model of measurement error' section, with the true value of X denoted by TX the true value of Y denoted by ТY, the subject error in X denoted by ЕX and the subject error in Y denoted by Е . There is indepen-dent nieasurenient error if Е is uncorrelated with Т1,, ЕY is uncorrelated with ТX, and ЕX is uncorre-lated with Е1,. Under these assumptions, the ob-servable correlation coefficient of X with Y is given by (Allen & Yen 1979):
РхY°РтХтУ X PTX Рт1Y (12)
This equation states that the observable correla-tion р Y in the parent study is equal to the true cor-relation рTXT times the validity coefficient of X (Рт~х) times Jte validity coefficient of У(рT~ Y). Note that the bias in X and the bias in Y do not enter the equation. This is because adding a constant to X and Y does not change the correlation between X and Y.
As an example, suppose one were conducting a study of serum R-carotene (X) in relation to dietary p-carotene as measured by a food frequency ques-tionnaire (Y). Assume that the true time period of interest is the prior year, but serum il-carotene has error primarily because it is only measured once during the year. The food frequency measure has error primarily because individuals cannot accu-rately recall diet over the past year. suppose that the true correlation of serum R-carotene over the prior year (ТX) and dietary intake of il-carotene over the past year (T1,) is 0.7. Assume that the cor-relation of a single measure of serum 3-carotene
True OR-2.ü
True OR=4.0
Ртх Px Oho OR0
0.50 0.25 t19 1.41
0.60 0.36 1.28 1.65
0.70 0.49 1.40 t97
0.75 0.56 1.48 2.18
0.80 0.64 1.56 2.42
0.85 0.72 1.65 2.72
0.90 0.81 1.75 3.07
0.95 0.90 1.87 3.49
р» is the validity coefficient of X.
рx is the reliability coefficient of X under the parallel test
model (see text): Px = Ртн The true OR is lite odds ratio tir a u unit difference in т. ORo is the observable odds ratio for a u unit difference in Х. Computed from equation (11). See text for model and
assumptions.
(X) with 1 year average serum il-carotene (ТX) is 0.8, and the correlation of the food frequency estimate of dietary 3-carotene (Y) with true dietary intake of (3-carotene (T1,) is 0.6. Also assume that the errors in X and Y are independent of true X and Y and of each other. Then the observable correlation coeffi-cient between X and Y (рXy) in the study would be (by equation 12) 0.7 x 0.8 x 0.6 = 0.34, a consider-able attenuation from the true association of 0.7.
Measuring the error in a continuous biomarker using a reliability study The term reliability is generally used to refer to the reproducibility of a measure, i.e. how consistently a measurement can be repeated on the same sub-jects. Reliability can be assessed in a number of ways, but only one type will be covered in this chapter. Intramethod reliability studies measure the reproducibility of an instrument on the same subjects repeated two or more times using the identical method or with some variation. For example, a comparison could be made of a bio-marker from a single specimen analysed in two
85

Application of Biomarkera in Cancer Epidemiology
batches or by two laboratory technicians оr from two specimens on each subject collected at two points in time. Reliability studies in which two dif-ferent analytic methods are compared, with one better than the other but neither perfect (inter-method reliability studies) are not covered here (see Armstrong et al., 1992). Measures of reliability are primarily important for what they reveal about the validity of a biomarker test, because the bias in the odds ratio in the parent epidemiological study is a function of the validity of the Ъiomатker measure.
This section covers the interpretation of measures of reliability in terms of measures of validity for con-tinuous biomarkers. The purpose is to provide some general concepts for the interpretation of reliability studies. Only continuous measures are covered be-cause the relationship between the reliability and validity of categorical measures is more complex.
A model of reliability and measures of reliability suppose each person in a population of interest is measured two or more times using the same bio-marker test to be used in the parent study. For a given subject i, two (or more) biomarker measure-ments, Х11 and Х~2, are obtained. (Note: in this sec-tion, X1 and X2 refer to the two measures per sub-ject, not to two groups of subjects as in the earlier sections.) The simple measurement error model described above applies to each measure:
Хi1=Т,+b1 +Егr X1 = + b2 -ј- Е2
Both Хг r and Х12 are measures of the subject's true biomarker Т1, but with different errors. In a reliability study, information is available on X1 and X2 for each subject, but not on Т. A reliability study can yield estimates of the mean of X1 and Хz(.tх1 and µX2) and of the correlation between the two measures, рTXТV termed the reliability coefficient.
The intradass correlation coefficient is generally used as the reliability coefficient [see Neiss (1986) or Armstrong et al. (1992) for formulas for its cor-putationj. The intraclass correlation differs from the Pearson correlation coefficient in that it includes any systematic difference between X1 and X2 (Le. any difference between b1 and b2) as part of the subject error Е (the enor that varies from sub-ject to subject). The assumption is that in the par-ent epidemiological study, each subject will be
measured once, by either X1 or X2 (e.g. either by laboratory technician 1 or 2). Therefore, any sys-tematic difference between X1 and X2 would not be a systematic bias affecting everyone in the parent study, but would vary between subjects because some are measured bу Х1 and some by X2. Because X1 and X2 will be used as interchangeable measures of X in the parent study, and because more than two replicates per subject can be used to compute the intraclass correlation coefficient, the reliability coefficient of X can also be written as Px-
Two measures of the validity of a continuous exposure measure were shown to be important iп assessing the impact of measurement error: the bias and the validity coefficient. Unfortunately, reliability studies generally cannot provide infor-mation on the bias in Х. The inability of many reli-ability study designs to yield information on bias, particularly on differential bias between study groups, is a major limitation. It should be recalled, however, that in the case of non-differential mea-surement error (and certain other assumptions), the attenuation equations depend only on the validity coefficient and not on the bias. The relia-bility coefficient does provide information about the validity coefficient, and thus can be used to estimate the effects of measurement error on the parent study under the assumption of non-differ-ential measurement error.
Relationship between reliability and validity under the parallel test model When certain assumptions are met, reliability stud-ies can yield information about the validity coeffi-cient. One such set of assumptions is the model of parallel tests (Lord & Novick, 1968; Nunnally, 1978; Allen & Yen, 1979; Bohrnstedt, 1983). The first assumption of the parallel test model is that the error variables, Е1 and ЕZ, are not correlated with the true value Т. It is further assumed that Еr and ЕZ have equal variance, бT. This also implies that X1 arid X2 have equal variance and that X1 and X2 are equally precise (р 1= р Z). This is usually a reasonable assumption in intramethod reliability studies, since X1 aid X2 are measurements from the same instrument. Finally, it is assumed that Е1 is not correlated with ЕZ. This important (aid restrictive) assumption implies, for example, that an individual who has a positive error, Е1, on the first measurement is equaly likely to have a positive
86

Effects of biomarker measurement error
or а negative error, Е2, on the second measurement. These assumptions are often summarized by saying that two measures aie parallel measures of Tif their errors are equal aid uncorrelated.
Under the assumption of parallel tests, it can be shown that (Allen & Yen, 1979):
бT= 1_бr - Ртх (13) Рx - z z бX 6X
or equivalently
Р тк = ~Рx (14)
These equations state that the reliability coeffi-cient, Px' is equal to the square of the validity coef-ficient of X, ртх' This result is important, because it shows that if the assumptions are correct, the relia-bility coefficient, which is a measure of the corre-lation between two imperfect measures, can be used to estimate the correlation between T and X, with-out having a perfect measure of T. The correlation of the replicates of X is less than the correlation of X with Tbecause each replicate has measurement error. А reliability study of a Ыоmaтker test can often
be assumed to have equal and uncorrelated errors if (1) the replicates are sampled over the entire time period to which the true biomarker is intended to relate; (2) the specimen handling, storage and ana-lytical techniques vary in the reliability study as they will in the parent study; and (3) the true expo-sure is defined as the mean measure over the rele-vant time period of repeated measures of the assay. А study by Toniolo et aL (1994), which exam-
ined the reliability of serum hormone levels in 77 postmenopausal women, provides a good example. Selected women in a prospective study of serum estrogens and breast cancer zisk who had blood drawn 2-3 times over a 1-2 year period were included in the reliability study. The blood was stored and analysed as in the parent study. The reli-ability coefficient (intraclass correlation coeffi-cient) was 0.51 for total estradiol and 0.77 for per-centage unbound estradiol. The repeated measures in this study are close to parallel test model: the errors on each of the repeated measures can be assumed to be equal because the same test proce-dure was repeated, and the errors are likely to be independent (i.e. a woman whose hormone mea-sure was higher than her 'true' average value on
one measure is not more likely to be higher than her true value on another measure). This study also measures most sources of error—blood processing, storage, random laboratory error (within-batch error) and variation due to changes in day-to-day and long-term variations of plasma hormones within women. Thus, the estimated validity coef-ficient (ртX) for a single measure of total estradiol (X) as a measure of average estradiol over 1-2 years (T), based on equation (14), is 0.71, and it is 0.88 for percentage unbound estradiol.
Based ors equation (13), the results in the last section on the effects of measurement error could have been (and often are) expressed in terms of рX rather than рTк. For example, equation (11) can be written:
ОRo = ORr (15)
Examples of the bias in the odds ratio from var-ious degrees of unreliability are given in Table 2. For example, a biomarker with a reliability coeffi-cient of 0.64 (under the parallel test model) would attenuate a true odds ratio of 4.0 to an observed odds ratio of 2.4. When Px is substituted for рTX in the attenuation equation, the equation applies only when the meaning of the reliability coeffi-cient is restricted to the correlation between paral-lei measures of T. However, the term 'reliability coefficient' is often used to refer to the correlation between repeated measures, рX, even when the assumptions of parallel tests do not hold.
Relationship between reliability and validity when the errors are correlated 1n real reliability studies, the assumptions of parallel tests are often incorrect. One assumption of the model of parallel tests that is often violated is the assumption of uncorrelated errors. Often, рЕIЕ2 > 0 In other words, the error in one measure is posi-tively correlated with the error in the other. Correlated errors occur when the sources of error in the first measurement on a subject tend to repeat themselves in the second. For example, if, in a reliability study, blood was drawn once on each subject and analysed twice in different batches, and the true marker of interest were mean R-carotene for the 2 years surrounding the time of measurement, there would be correlated error. This is because a person whose p-carotene level on the
87

Application of Biomarkers in Cancer Epidemiology
first measure was higher than their true mean level (perhaps due to a seasonal variation in intake of (3-carotene) would also be likely to have a J3-carotene level that was higher than their true value on the second measure, because the second measure used the same specimen. The errors are correlated because part of the error is repeated in both X1 and ХZ.
To interpret a reliability study, one should eval-uate whether there are potential sources of corre-lated errors between the two measures. As outlined in Box 1, there is a wide range of sources of mea-sureinent error, and most of these could be sources of correlated errors.
When the errors of the measures in a reliability study are positively correlated, then the reliability study can only yield an upper limit for the validity coefficient. Specifically, when X1 and X2 are equally precise and the assumptions of the above model hold (except рЕ1aZ> 0), then the validity coefficient is less than the square root of the reliability coeffii-
dent (Walker & Blettner, 1985):
рn <dрх (16)
Thus, a measure can be reliable (repeatable) even if it has poor validity. While a low reliability coefficient implies poor validity, a high reliability does not necessarily imply a high validity coefficient. The high reliability maybe due instead to repeated errors within subjects. The reliability coefficient is only diminished by part of the error in X (the part that is not repeated in X1 and X2), whereas the validity coefficient is a measure of all sources of error.
Reliability studies often need to be more complex than can be described here. For example, in the study by Toniolo et a1. (1 994) described above, the variability due to batch effects was removed from the reliability coefficient. This is because, in the parent study, each matched set of cases and controls were to be analysed within a batch so that batch differ-
Equation From equation Differential or non-differential
Binary biomarker, two-group comparison True difference = P, -. Р2
ORт= Рi (f - Р2)
Рг (1 - Р1) where P 1 + s ес 1 séns +:s eс 1) апд -
(1-3) Differential non differential
Р2 = (p2 -1 + sрecг)1(sen52 + spec2 -1)
P1 - Рг = (Р1 - F2)1(sens'+ spec -1) (4) Non-differential
Continuous biomarkerT two group comparison !rr - = (, - ~кZ} - (b1 - b2) (7) Differential
ОRr= е тwhere 3 = I(.1 b -
b2 lI Ro
1 l- ! Р (S) Differential
цт, - Њ, = , - µ ," (9) . Non differential
ОRT= (11) Non differential
ORT= ОR!°x (15) Non differential
Continuous biomarker; continuous outcome
ВтXтr РхуKPтКхX.Рr,(У) (12) Non differential
аSee text for the notation the assumptions used iп derivation of equations and the. interpretation of equations.: .
88

Effects of biomarker measurement error
ences would not contribute to measurement error. The coefficient of variation, С' provides only
limited information about measurement erroi because the CV is the ratio of вF to X, but it is the ratio of тE to в~ (as in equation 13 above) that is needed to understand the impact of measurement error.
Adjusting the results of epidemiologic studies for biomarker error
The emphasis of this chapter has been an expla-nation of how the observable odds ratio or other measure of association in the parent epidemiolog- ical study is a function of the measurement error in the biomarker and the true measure of association. However, the same models can be applied in the opposite direction. By use of estimates of the bio-marker measurement error from a validity or relia bility study, it is possible to adjust the observed measure of association from the parent epidemio- logical study to yiеlд an estimate of the true associa- tion. However, because the assumptions used in the models cannot be known to be correct (see below), the results of the adjustment equations should not be considered to be the `true association', but rather an indicator of the degree of bias in the observed odds ratio or other measure of association.
These `adjustment' equations and the equations from which they were derived are given in Table 3. Because under non-differential measurement error the observable association is attenuated from the true association, these adjustment equations are called `deattentuation' equations when non-differ-ential measurement error is assumed.
Data from a study by Winawer et al. (1990) are adapted as an example of adjusting for the effects of differential measurement error in a two-group study of a continuous biomarker. In this study, serum cholesterol at the time of diagnosis (X) was compared between 43 cases with colon cancer and 43 controls (see Table 4).
The observed case—control difference in serum cholesterol was:
i — 5.56 —6.47 =-0.91
Thirty-two subjects (16 cases and 16 controls) had serum cholesterol measures available from 10 years prior to diagnosis, which can serve as T because it is unlikely to be biased. (As noted earlier, the bias in X can be estimated by comparison with Tif T is
ТаЫе 4. Example of adjustment for effects of differential measurement error
Serum cholesterol ("mollI)
X T'
Case—control study (parent study) Cases (n = 43) 5.56
Controls (n = 43) 6.47
Validity study
Cases (n= 16) 5.75а .6.21.
Controls (n = 16) 6.30a 5.72
aData created to serve as an example.
unbiased, even if T is not perfectly precise.) A corn-panson of X with T for these 32 subjects could serve as a validity study to estimate bias. The bias in X among the cases could be estimated from the validity study (with X, T serving as estimates of µx, µT) as:
b=X1 — T7 =5.75-6.21=-0.46,
i.e. serum cholesterol at the time of diagnosis underestimates true serum cholesterol by 0.46 among cases. The bias in X among the controls could be estimated from the validity study as:
b2 = — = 6.30-5.72 = 0.58,
i.e. serum cholesterol (at time of diagnosis of cases) overestimates true serum cholesterol by .0.58. Clearly, there is differential bias.
To correct the observed difference in serum cho-lesterol in the parent study for the effects of this differential bias, the correction equation from Table 3 based on equation (7) is used, with X and T serving as estimates of µx and г :
(!.LT1 — г 2) = (-0.91) — (-0.46-0.58) = 0.13
This suggests that there is little difference between colon cancer cases in 'true' (before disease) serum cholesterol.
As an example of de attenuation under non-differential measurement error, suppose a cohort
89

Application of Biomarkers in Cancer Epidemiology
study of occupational exposure to chlorophenates, assessed by urinary chlorophenate concentration, in relation to soft tissue sarcoma yielded an odds ratio of 1.3 for each 100 µg/L increase in concen-tration. Suppose also that a validity study among a subset of the subjects yielded an estimate of 0.6 for the validity coefficient, ртx, between urinary cholorophenate concentration and industrial records of exposure (assumed here to be a near-per-fect measure). Then information from these two studies could be used to adjust the observed odds ratio to yield an estimate of the true odds ratio (based on the equation in Table 3 derived from equation (11), provided the assumptions hold):
ORS = (1.З)zlо.ь' = 2.1
This suggests that biomarker measurement error may have led to the weak observed association between the biomarker and the disease, because the observed odds ratio is consistent with a true odds ratio of 2.1 for each 100 цg/1 increase in chiorophenate concentration.
Information from reliability studies can also be used in adjustment procedures, to the extent that the reliability study provides information about the validity of the exposure variable. If the relia-bility study were of two parallel measures, рX could be substituted for р fx as in the equation in Table 3 derived from equation (15). As an example, the prospective study by Toniolo et al. (1995) of serum hormone levels and breast cancer risk among 7063 postmenopausal women (among whom 130 devel-oped breast cancer), observed an odds ratio of 1.8 for total estradiol >44 pg/ml (versus <20) and an odds ratio of 2.0 for percentage unbound estradiol >1.53% (versus <1.20%). These odds ratios can be corrected for the effect of measurement error, based on the reliability coefficients of 0.51 and 0.77 for total estradiol and percentage unbound estradiol, respectively, from the reliability study described in an earlier example. Using equation (15), the estimated 'true' odds ratio is 3.2 for total estradiol >44 pg/m1, and 2.5 foi percentage unbound >1.53%. This suggests that total estradiol might be strongly related to breast cancer risk, but its effect is obscured by the error in its measure-ment.
Reliability studies yield only an upper limit for the validity coefficient when there are correlated
errors in the repeated measures. Then, if equation (15) is applied, this leads to a conservative (closer to the null) estimate of the true odds ratio under non-differential measurement error. Iп other words, the estimate would only be 'deattevuated' for the random part of measurement error, and not for the part that was repeated across measures in the reliability study.
While adjustment procedures may aid in under-standing the results of a study, caution should be exercised in interpreting these results. First, the assumptions used in the derivation of the equations in Table 3 may not be appropriate. In particular, an assumption of non-differential measurement error could be incorrect, so it is preferable if the biomarker measurement error can be assessed separately for the two study groups to account for differential misclassification. For continuous exposures, the assumptions of the simple measurement error model, normality of the biomarker and its error, and the logistic model of disease—biomаrkеr relationship often also fail to hold. Second, both the observed measure of association between the biomarker and outcome and the estimated measurement error have sampling errors; this needs to be considered in esti- mating the true association. Third, the estimates of the measurement error should be estimates from the same population(s) as the parent study to be corrected, yet such estimates may not be available. Finally, the presence of covariates modifies the effect of biomarker measurement error. Information on the multivariate measurement error structure of the biomarker and covariates is required in order to correct fully for measurement error. Therefore, unless these issues have been accounted for, the emphasis of the adjustment procedure should be on interpretation of the observed estimate of effect, and not of the corrected estimates.
A great deal of work has been done on adjust-ruent procedures, or, more generally, procedures that incorporate information from a validity or reliability study into the statistical analysis of the disease—exposure relationship (Tenebein, 1970; Barron, 1977; Copeland etaL, 1977; Prentice, 1982; Greenland & Kleinbaum, 1983; Clayton, 1985; Stefandn & Carroll, 1985; Whittemoie & Grosser, 1986; Espeland & lui, 1987; Fuller, 1987; Armstrong etal., 1989; Rosier etal., 1989;Qizilbash et al., 1991; Pepe & Fleming, 1991; Carroll et ai., 1995). Many of these procedures take into consid-
90

Effects of biomarker measurement error
eration some of the issues discussed above; in par-ticular, some make less restrictive assumptions about the error model, yield confidence intervals that incorporate sampling error from the reliability study, and/or allow a multivariate measurement error structure. These methods may prove to be use-ful in accounting for measurement error.
Summary Before embarking on an epidemiological study which uses a biomarker, it is extremely important to understand the measurement error in the bio-marker. For a binary biomarker, the validity (the measurement error in а population) of the bio-marker is quantified by its sensitivity and speci-ficity. For a continuous biomarker, X, the validity can be estimated by the bias X— T and by the valid-ity coefficient, рхт (correlation coefficient if X with T), a measure of precision. These estimates of measurement error ideally utilize a true measure of the biomarker (T) which has no sources of error aid which integrates the biomarker over the time period of etiological interest (geпeraIly years). To assess whether the error is differential between cases and controls, separate studies on a group of cases and a group of controls are needed.
The researcher's first concern should be to rule out, as far as is practicable, the possibility of differ-ential measurement error. Because differential measurement error can bias the odds ratio in any direction, the presence of differential error in a bio-marker can invalidate the epidemiological study. Differential measurement error is a particular con-cern in case—control studies (and among the early cases in cohort studies) when the biomarker is not a fixed marker (e.g. genotype) and therefore could be influenced by pre-clinical disease, by the physical or emotional effects of the disease after diagnosis, and/or by treatment. Assessment of differential error requires pre-diagnostic specimens on a sample of cases and comparable early specimens on con-trols. These serve as the 'true' markers (without differential bias) for computation of sensitivity and specificity separately for cases and controls. For continuous variables, differential bias has the most untoward effects; this can be estimated by com-paring X — T for cases with X— T among controls. Whether the degree of differential error is acceptable can be determined by estimating the effects of the error on the odds ratio (see equations (1) and (2)
for binary markers and equation (8) for continuous biomarkers). Generally, very little differential error is acceptable.
When differential error is unlikely to be a prob-lem, the researchers should focus on assessment of the non-differential error, or at least some of the major components of error in the biomarker, To assess the total error (the laboratory variation, variation from specimen collection and storage, and variation from short-, medium- and long-term biological variability), one would ideally conduct a validity study in which the biomarker to be used is compared with a perfect (true) measure. Then, the effect of non-differential measurement error on the odds ratio can be estimated by equations (1) aid (3) for binary markers and equation (11) for continuous markers. For continuous markers (assuming a simple measurement error model), the effect of non-differential measurement error depends only on the validity coefficient and not on the bias (see equation 11).
Because validity studies are rarely possible, it is important to understand that one can measure much of the total error in a well-designed геliabil-ity study. Much of the error can be measured if one collects and analyses two (or more) specimens on a group of subjects in such a way that the error in one estimate is not repeated on another, e.g. the two specimens are collected at different times over the relevant etiological time period and are han-dled, stored and analysed with the same degree of variation (different specimen collectors/laboratory technicians/batches) as would occur in the parent epidemiological study. Reliability studies are gen-erally analysed by the kappa coefficient for binary variables and by the intraclass correlation coeffi-cient for continuous variables (see Fleiss, 1981, 1986; Armstrong et al., 1992). The intraclass coefficient provides information about the validity coefficient (see equations 14 and 16) and therefore provides information about the degree of attenuation of the odds ratio due to non-differential measurement error. The degree of acceptable measurement error would depend on the magnitude of the true odds ratio (see equation 15), but generally an intraclass correlation (including all sources of errors) of less than 0.5 would not be acceptable.
Whether or not the total error can be studied, one should attempt to estimate some or all of the components of error. The epidemiologist and
91

Application of Biomarkers in Cancer Epidemiology
laboratory scientists should develop studies of the laboratory error and other components of error. To assess the laboratory error, a binded test—retest reliability study on spIlt samples from a single specimen froze each of a group of subjects, analysed in separate batches and by different labo-ratory technicians (in a way that reflects the design of the parent epidemiological study), would yield an intraclass correlation coefficient that measures the laboratory component of error. Similarly, other reliability studies could. be designed to test the effect of handling, storage and short-, medium-and long-term biological variation. Epidemiologists should not assume that a small laboratory error implies that a measure is good, because these later sources of error introduced by the design and needs of the epidemiological study could be far greater than the laboratory component of the error. Often, multiple sources of error can be partitioned in a nested study design (see Dunn, 1989). When only some components of error are measured, the resulting intraclass correlation only provides an upper estimate of thé validity coefficient (see equa-tion 16). However, by estimating the components of error, the researcher can seek to improve those aspects having the most adverse effects. For example, enhanced laboratory quality control procedures would reduce laboratory error, or use of multiple specimens (over time) per subject would reduce the error due to shift- or medium-term biological vari-ation (see Armstrong etaL, 1992).
Finally, after the parent epidemiological study has been completed, estimates of biomarker mea-suierrient error can be used to adjust the results of the parent study for the effects of measurement error (or for those components of error that have been measured) (see Table 3). Cautious use of these methods can add insight into the bias caused by biornarker measurement error on the results of an epidemiological study.
References Armstrong В.G., Whittemore, A.S. & Howe, G.R. (1989) Analysis of case-control data with covariate measure-ment error: application to diet and colon cancer. Stat Med., 8, 1151-1163 .
Armstrong, B.К., White, E. & Saracci, R. (1992) Principles of Exposure Measurement in Epidemiology, Oxford, Oxford University Press, pp. 49-136
Banon, S.A. (1977) The effects of misclassification on the estimation of relative risk. Biometrics, 33, 414-418
Bohrnstedt, G.W. (1983) Measurement. In: Rossi, P.H., Wright, J.D. & Anderson, A.B., eds, Handbook of Survey Research, Orlando, FL, Academic Press, pp. 70-121.
Bross, 1. (1954) Misclassification ir► 2 x 2 tables. Biometrics, 10, 478-486
Carroll, R.J., Ruppert, D. 5tefanski, L.A. (1995) Measurement Error in NoпIinear Models, London, Chapman & Hall
Clayton, D. (1985) Using test-retest reliability data to improve estimates of relative risk: an application of latent class analysis. Stat. Med., 4, 445-455
Cochran, W.G. (1968) Errors of measurement in statis-tics. Tecpnometrics, 10, 637-666
Copeland, K.T., Checkoway, J., McMichael, A.J. & Holbrook, R.H. (1977) Bias due to misclassification in the estimation of relative risk. Am. J. EpidemioL, 105, 488-495
de K1erk, N.H., English, D.R. & Armstrong, B.K. (1989) A review of the effects of random measurement error on relative risk estimates in epidemiologic studies. fut. J. EpidemioL, 18, 705-712
Dunn, G. (1989) Design and Analysis of Reliabiliiy Studies, New York, Oxford University Press
Espeland, M.A. & lui, S.L. (1987) A general approach to analyzing epidemiologic data that contain misdassifica-tion errors. Biometrics, 43, 1001-1012
Fleiss, J.L. (1981). Statistical Methods for Rates end Proportions, 2nd edn, New York, Wiley, pp. 188-236
Fleiss, J.L. (1986) The Design and Analysis of CliпicaI Ехpеrimеpts, New York, Wiley
Fuller, W.A. (1987) Measurement error Models, New York, Wiley
Goldberg, J.D. (1975) The effects of misclassification on the bias in the difference between two proportions and the relative odds in the fourfold table. J. Am. Stat. Assoc., 70, 561-567
Greenland, S. & Kleinbaum, D.G. (1983) Correcting for misclassification in two way tables and matched-pair studies. lot. J. EpidemioL, 12, 93-97
Gregorio, D.I., Marshall, J.R. & Zielenzyny, M. (1985) Fluctuations in odds ratios due to variance differences ii-i case-control studies. Am. J. Epidemiol., 121, 767-774
Gu11en, W.H., Bearman, J.E. & Johnson, E.A. (1968) Effects of misclassification in epidemiologic studies. Public Health Reports, 83, 914-918
Hansen, 1.1., Gurwitz, W.N. & Bershad, M. (1961)
92

Hlects of biomarker measurement error
Measurement errors in censuses and surveys. Bull, fit. Stat.Inst., 38, 359-374
Юeiнbаum, D.G., Kupper, L.L. & Morgeristern, H. (1982) Ерiдетго Iоgгс Research, Belmont, CA, Lifetime Learning Publications, pp. 183-193, 220-241
Kotz, Ѕ. & Johnson, N.L. (1988) Encyclopedia of Statistical Sciences, vol. 9, New York, Wiley, pp. 662-663
Law, M.R. & Thompson, S.G. (1991) Low serum choles-terol and the risk of cancer: an analysis of the published prospective studies. Cancer Cases Control, 2, 253-261
Lord, P.M. & Novick, M.R. (1968) Statistical Theories of Mental Test Scores, Reading, MA, Addison-Wesley
McKeown-Eyssen, G.E. & Tibshirani, R. (1994) Implications of measurement error in exposure for the sample sizes of case-control studies. Am. J. Epidemiol., 139, 415-421
Newell, D.J. (1962) Errors in the interpretation of errors in epidemiology. Am. J. PиЫ. Health, 52, 1925-1928
Nunnaly, J.С. (1978) Psychometric theory (2nd edn). New York, McGraw-Hill, pp. 190-225
Prentice, R.L. ,(1982) Covariate measurement errors and parameter estimation in a failure time regression model. Biometrika, 69, 331-342
Qizilbash, N., Duffy, S.W. & Rohan, Т.E. (1991) Repeat measurement of case-control data: correcting risk esti-mates for misclassification due to regression dilution of lipids in transient ischemic attacks and minor ischemic strokes. Am. J. Epidemiol., 133, 832-838
Rosner, B., Willett, W.C. & Spiegelman, D. (1989) Correction of logistic regression relative risk estimates and confidence intervals for systematic within-person measurement error. Stat. Med., 8, 1051--1069
Schiffman, M.H. & Schatzkin, A. (1994) Test reliability is critically important to molecular epidemiology: Ass example from studies of human papillonra infection and cervical neoplasa. Cancer Res., 54, 1944s-1947s
Stefanski, L.A. & Carroll, R.J. (1985) Covariate measure-ment error in logistic regression. Ann. Stat., 13, 1335-1351
Tenenbein, A. (1970) A doubling sampling scheme for estimating from binomial data with misclassifiction. J. Am. Stat. Assoc., 65, 1350-1361
Toniolo, P., Koenig, K.L., Pasternack, B.S., Banerjee, S., Rosenberg, C., Shorе, C.E., Strax, P. & Levitz, M. (1994) Reliability of measurements of total, protein bound and unbound estradiol tri serum. Cancer Epidemiol. Biomarkers Prev., 3, 47-50
Toniolo, P.G., Levitz, M., Zelenluch-Jacquotte, A., Bаnerjее, S., Koenig, K.L., Shore, RE, Strax, P. & Pasternack, B.S. (1995) A prospective study of endo-genous estrogens and breast cancer in postmenopausal women. J. Nail Cancer Inst., 87, 190-197
Walter, A.M. & Blettner, M. (1985) Comparing imperfect measures of exposure. Am. J. Epidemiol., 121, 7 83-90
White, E., Kushi, L. &Pepe, M. (1994) The effect of expo-sure variance and exposure measurement error on study sample size: implications for the design of epidemiologic studies. J. СIгniсаl Epidemiol., 47, 873-880
Whittemore, A.S. & Grosser, S. (1986) Regression meth-ods for data with incomplete covariates. In: Moolgavkar, 5.1, & Prentice, R.L, eds, Modern statistical methods in chronic disease. New York, Wiley, pp. 19-34
Winawer, S.J., Fiehinger, B.J., Buchalter, J,, Herbert, E. & Shike, M. (1990) Declining serum cholesterol levels prior to diagnosis of colon cancer. J. Am. Med. Assoc., 263, 2083-2085
Wu, M.L., Whittemore, A.S. & Juпg, D.L. (1986) Errors in reported dietary intakes: I. Short-term recall. Am. J. Epidentiol., 124, 826-835
E. White Cancer Prevention Research Program, Fred Hutchirnson Cancer Research Center, 5eattle, WA 98109, USA
93

Application of Biomarkers in Cancer Epidemiology zonioln, P. ' Boffetta, P., shuknr, DEC., Rothman, N., Нц lkа, Band Pearce, N„ eds
lARC SnienUfic Pablicat]ona No. 142 International Agency for Research on Cancer, Lyon, i 997
Markers of internal dose: chemical agents D. Coggon and M.D. Friesen
Biomarkers of internal dose measure the level of a carcinogen or one of its metabolites in a tissue or a body fluid such as urine or blood. The choice of a biomarker of internal dose for a particular epidemiological study or type of study requires careful consideration of the period of exposure to which the biomarker relates, host factors related to carcinogen metabolism, in-vasiveпess of sampling, reliability and cost of the biomarker. Before a new biomarker is adopted, it is important to assess these characteristics in transitional studies to ensure that the biomarker will be applied appropriately, Biomarkers of internal dose have been applied most successfully in ecological studies and nested case—control studies, and are especially useful when they provide information about long-term carcinogen exposure.
Human exposure to carcinogens can be estimated by measuring available levels in food, water or air. Air levels, for example, have been widely used in industrial hygiene to asses industrial exposure to carcinogens. Measuring the external exposure, however, does not necessarily provide accurate information about the amount of carcinogen асtu-a11y absorbed by an individual, a parameter which is of great importance to epidemiologists. This para-meter, which has been called the `internal dose', reflects total exposure by all routes (inhalation, ingestion and dermal absorption) and is influenced not only by the level of carcinogen in external media (air, food, water, etc.) but also by factors such as the amount of air breathed or food consumed by the individual during the period of exposure and the efficiency of absorption from the lung or gut.
This chapter will examine the use of bioniarkers of internal dose to chemical agents. Other types of biomarkers, which measure the biologically effective dose or early biological effects of the carcinogen, are also currently available or under development. Several excellent books have reviewed the use of all these kinds of biomarkers of human carcinogen exposure (Hulka et aL, 1990; Groopman & Skipper., 1991; Armstrong etal., 1992; Schulte &Perera, 1993).
Biomarkers of internal dose Biomarkers of internal dose measure the level of the carcinogen or one of its metabolites in a tissue or body fluid such as urine or blood. Table 7 gives examples of how biomarkers of internal dose have
been applied in epideiniological studies. The appli-cability of a binmarkgiv of internal dose to cancer epidemiology depends on certain features which need to be characterized in transitional studies (Halka, 1991) before application in the field.
To what period of exposure does the biomarker relate? Although biomarkers of internal dose generally give information about recent exposure, the half-life of a carcinogen or its metabolite in human body fluids can vary from less than an hour to more than 10 years (Fig. 1). For example, the level of uri-nary methylhippuric acid, which has a half-life of only a few hours, is useful in occupational settings as a biomarker of recent exposure to xylene (Inoue et al., 1993; Huang etal., 1994), while urinary cad-mium, which is related to body burden with an excretion half-life of over 10 years, is a useful long-term biomarker of exposure to cadmium (Ghezzi et aL, 1985). Biomarkers of internal dose are being increasingly used in the field of industrial hygiene, where validated biomarkers for measuring occupa-tional exposures to a wide range of carcinogens in blood, urine or breath have been proposed by national industrial hygiene authorities (Table 2).
In general, it is past or long-term exposure that is of interest in cancer epidemiology; however, a Ыоmarker that reflects recent exposure may still be of importance and provide information superior to that obtainable with traditional methods of expo-sure assessment. For habitual or repeated exposures
95

Aflatoxin B, and metabolites Urine Aflatoxin in the diet
Dioxins and furans Blood fat Herbicide production
• Lead Blood Lead battery production
N-nitrosamino acids Urine Endogenous formation
Arsenic Urine Copper smelting
Cotinine Urine Tobacco smoking
DDE Serum DDT
Liver Ross et at, t992; Qian et a1., 1994
All organs Flesch Janys et at, 1995
Gastrointestinal tract Gerhardsson et at., 1995
Oesophagus Wu et at., 1993
Lung Entetline & Marsh, 1982
Lung Dе Wаагд et аt, 1995.
Breast Wolff et at, 1993; Krieger et at, 1994
Application of Biomarkers in Cancer Epidemiology
Table 1. Examples of bïomarkers
S
of internai
•
dose applied in еpidеmиobgЁcü1 studies
-
such as smoking or mycotoxins in the diet, for example, а small number of measurements with a biomarker of recent exposure may give а reason-able measure of longer-term exposure (Ross et al., 1992; Qian etaL, 1994; De Waard et aL, 1995). The use of such biornarkers of recent exposure to asses longer-term exposure requires transitional studies to determine the appropriate number of samples and frequency of sampling.
Now are bromarker levels affected by metabolic host factors? The level of biomarker measured in a tissue or body fluid depends on metabolic factors specific to the individual under examination. These include how the carcinogen and its metabolites are parti-tioned in elimination or storage compartments such as urine or adipose tissue, individual levels of phase I and phase II enzymes, and the influence on these enzyme levels of other substances to which the subject is exposed.
For carcinogens occurring in food, where the intake in a normal diet can be accurately determined, it is feasible to validate exposure biomarkers in studies with human volunteers. This approach is being used in transitional studies to characterize int.erindividual differences in the urinary excretion of 1-hydroxypyrene-glucuronide (Kang et аL, 1995), a metabolite of polycyclic aromatic hydrocarbons
(РАН), and the heterocyclic aromatic amines 2-amino- l-methyl-6-phenуlimidazo [4, 5-b]pyridine (PhIP) and 2-amino-3,4-dimethylimidazo[4,5-л-quinoxaline (MeIQx) (Sinha et al., 1994) after con-sumption of charbroiled or pan-fried beef by human volunteers.
The situation is more complex in the case of agents to which exposure occurs by multiple routes and at levels that are difficult to measure: One example of such a complex situation is expo-sure to РАН, for which uiinary excretion of 1-hydroxypyrene is a marker (Sherson et al., 1992; Santella et aI., 1993).
Is sampling invasive? Samples of urine and breath are fairly easy to obtain, and in adults, blood sampling does not usually pose ethical difficulties or cause major problems with compliance. On the other hand, some tissues may be more difficult to sample. For example, although the level of DDT accumulated in adipose tissue is an excellent measure of long-term exposure to the pesticide, it would be hard to obtain samples from large numbers of people who were not already undergoing surgery. However, blood levels of DDE, a metabolite of DDT, have been used to measure long-term expo-sure to DDT (Wolff et al., 1993; Krieger et al., 1994).
96

Markers ы internal dose: chemical agents
♦Dichloromethane ♦ Blood • Styrene • Urine • Trichloroethylene
♦Carbon disulphide • Trichlorotriiuoroethane •Benzene • Methylhippuric acid (xyiene) • Mandelic acid (styrene) • Toluene ♦Carbon monoxide
• Thiothiazоlidine-4-carboxylic acid (Cs2) ♦1,1,1-Trichloroethane
• Trichloroethanol (Trichloroethylene) ♦Perchloroethylene
• Chromium • Ethoxyacetic acid (ethoxyethanol) • Nickel
♦Mercury • Trichloroacetic acid (trichloroethylene) • Arsenic
♦Lirtdane • Cobalt
• Pentachlorophеnol • Mercury
• Dieldrin Polychlorinated • Biphenyls
• Cadium
O 1 hour 10 hours 1 week 1 year 10 years
Figure 1. Excretion half-life of various biomarkers ы internal dose in blood and urine (from data published by the UK Health and Sately Executive).
How much does the assay cost? Many assays for measurement of internal dose, such as radiоunmunаssay for the measurement of urinary eotivin as an index of exposure to envi-ronmental tobacco smoke (De Waard et al., 1995), can be carried out on a large scale at a relatively low cost. Other markers such as measurement of dioxins in blood fat (Flesch Janys et aI., 1995) are still very expensive and thus applicable only to small numbers of samples, perhaps in a subset of a cohort under study.
Use of biomarkers of internal dose in epidemiological studies Biomarkers of internal dose should be evaluated within the framework of epidemiological study design (Rothman et al., 1995).
Cohort studies relating exposure to cancer. Because cancers occur relatively infrequently, cohort studies require large numbers of subjects. For use in a standard cohort study, biomarkers of internal dose can be a good choice, if they are relatively cheap and non-invasive and if they reflect exposure over a relevant time period—usually months or years. An example is the use of bloo.d lead measurements in a cohort study of occupational exposure to lead among lead smelter workers (Gerhardsson et al., 1995).
For biomarkers that are more expensive to mea-sure, an alternative is to use a nested case-control design. Here, biological samples are collected from ai cohort members at baseline and stored. An important issue in investigations of this kind, therefore, is the stability of the markers during storage (Riboli et al., 1995). Collected samples are
97

Application of Biomarkers in Cancer Epidemiology
analysed only for those subjects who go on to develop a cancer of interest and for suitably chosen controls. This approach was used successfully in Shanghai iii China (Ross etaL, 1992; Qian etaL, 1994) where a nested case—control analysis showed highly signifïcant associations between the presence of urinary aflafoxins, serum hepatitis B surface antigen positivity and risk for hepatocellular carcinoma (НСC). A cohort analysis including the same cases of ICC revealed no strong or statistically significant association between 1-ICC and dietary aflatoxin consumption, as determined using food frequency questionnaires and aflatoxin levels in local foods.
Case—control studies relating exposure to cancer In this case the biomarker should reflect exposure over many years and must not be altered as a con-sequence of the disease process or its therapy, Опе such example is the measurement in serum of DDE
as a marker for DDT exposure in a case—control study of breast cancer in the United States of America (USA) (Wolff etal., 1993). This approach is feasible because organoeh1orine compounds such as DDT or PCBs accumulate in adipose tissue with an elimination half-life of several decades.
However, a biomarker with a shorter half-life may still be applicable in case—control studies, pro-vided patterns of exposure remain fairly constant over time and are not modified by the develop-ment of disease. The potential for such use would be greatest in studies involving early, asympto-matic cases of cancer (Rothman et a1., 1995).
Ecological studies relating exposure to cancer In ecological studies, exposures and disease оиt comes are compared in populations or groups of people. Por example, levels of N-nitrosaniino acids in the overnight urine of men living in 69 counties
'ARC carcinogenicity ACGII,1992 DFG,1992 Fill 1993 evaluation
Group 1 Benzene. U-phenol U pheпof,B boizene B-benzene Ethylene oxide B-ethylene oxide Vinyl chloride U-thiodiglycolic acid Arsenic U-volatile As compounds U-Asэ+ ASS+
U-Cd, B-Cd
U-Cr
U-Ni
U-MICA
B-tetrachloroothylene . U-TCA, U-TCA U-trichloroethanot
Group 2b Cobalt _ U Co U Co U Co Lead B-Pb, U Pb, B ZPP B-Pb,'U-ALA B Pb, B ZPP B-Pb, U ALA, B ZPP
Abbreviations: АСGIН, American Conference it Governmental Industrial Hygienists; DFG, Deutsche Foгsçhungsgémeinschaft; пОН Fпnish institute of Occupational Health; UK HSE, United Kingdom Health and Safety Executive; U, urine; B, blood lIA monomethylarsinFc acid; DMA, diniethylarsinic acid; MICA rtiethyEene bis(2-chloroaniline); TCA, trichioroacetic acid; ALA; $ aminole vulinic acid; ZPP, erythrocyte zinc protoporphyrin
Cadmium U-Cd B-Cd U-Cd, B-Cd Chromium U-Cr U-Cr
. Nickel _ ..
.0-Ni
Group 2a MICA ,
Tetratrachforoethylene B tetrachloroethylene B-tetrachloroethylene Tnbhloroethylene U TCA U-TCA,
B-tпchloгoethaпol B-tгichloгoethaпol
UK HSE, 1991 .
B-benzene
U-As3+, As5+, MMA+ DMA
U-Cd, B-Cd
B-Cr, U-Cr U-Ni
98

Markers of internal dose: chemical agents
in China have been geographically associated with oesophageal cancer mortality (Wu et al., 1993). For this type of study, some imprecision in the mea-surement of biomarkers can be tolerated, provided that a relatively large number of samples are mea-sued in each geographical unit, since analysis is based on estimates of population means.
Cross-sectional studies linking exposure with early markers of carcino,genesis Cross-sectional studies can be used to examine whether suspected carcinogenic exposures are associated with early markers of carcinogenesis, such as chromosomal aberrations. Biomarkers of internal dose sometimes provide a convenient measure of exposure for such investigations. For example, a number of studies looking at the asso-ciation of styrene with cytogenetic damage in lym-phocytes have used urinary mandelic acid as a marker for exposure (IARC, 1994). For a study designed in this way, the bioznarker of exposure should also cover a period relevant to the early marker of cardnogenesis (months or years).
Studies to assess the contribution of different sources of exposure to total dose Epidemiology may be used to investigate not only the risk of cancer from different levels of exposure to a carcinogen, but also the importance of differ-ent sources of exposure in determining total dose. In this type of study, biomarkers of internal dose which relate only to recent exposure are often the most useful. For example, concerns have been expressed that clusters of leukaemia in the vicinity of petrochemical works might be attributable to releases of benzene into ambient air. However, studies by Wallace et ai. (1987) in the USA indicate that residence near petrochemical works has negli-gible impact on personal doses of benzene (assessed by measurement in exhaled breath). Far more important is whether the individual smokes or is exposed to environmental tobacco smoke and how he/she makes use of motor vehicles.
Studies to evaluate other methods of exposure measurement Even where a biomarker cannot be used on a large scale (e.g. because of expense or ethical con-
straints), it may still be useful in the evaluation or refinement of other methods of exposure assessment.
For example, in a retrospective study of people manufacturing phenoxy herbicides and chloro phenols (Manz et al., 1991; Flesch Janys et al., 1995), exposure to dioxins was assessed from job histories and information about processes and operating methods at the plant where they worked. Blood and adipose tissue levels of dioxins, measured in a subset of the cohort, confirmed the departments with the highest exposure and allowed quantitative estimates of personal expo-sure for all members of the cohort.
Studies have also been carried out to compare exposure levels measured by different analytical approaches. For example, urinary Ievels of 1-hydroxypyrene, a biomarker for exposure to РАН, were shown to correlate well with levels of PAH-DNA adducts in the white blood cells of alu-minium workers (van Schooten et aI., 1995), but not in foundry workers exposed to lower levels of РАН (Santella et al. 1993) .
Conclusion In summary, biomarkers of internal dose have found successful application in cancer epidemiol-ogy. The choice of a biomarker of internal dose for a particular epidemiological study or type of study requires careful consideration of the period of expo-sure to which the biomarker relates, host factors related to carcinogen metabolism, invasiveness of sampling, reliability and the cost of the assay. Before a new biomarker is adopted, these charac-teristics must be assessed in transitional studies to ensure that it will be applied appropriately.
References Armstrong, В.K., White, E. & Saracci, R. (1992) Principles of Exposure Measurement in Epidemiology, Oxford, Oxford University Press
De Waard, F., Kemmeren, J.M., van Ginkel, L.A. & Stolkег, A.A. (1995) Urinary cotinine and lung cancer risk in a female cohort. Br. J. Cancer, 72, 784-787
Enterline, P.E. & Marsh, G.М. (1982) Cancei among workers exposed to arsenic and other substances in a copper smelter. Am. J. EpidemioL, 116, 895-911
Flesch Janys, D., Berger, J., Gum, P., Manz, A., Nagel, 5., Waltsgott, H. & Dwyer, J,H. (1995) Exposure to роlу-сЫоrйated dioxins and forais (PCDD/F) and mortality in a cohort of workers from a herbicide-producing plant in Hamburg, Federal Republic of Germany. Am. J. Epidemial., 142, 1165-1175
99

Application of Biorriarkers in Cancer Epidemiology
Gerhardsson, L., Hagmar, L., Rylander, L. & Skerfving, S. (1995) Mortality and cancer incidence among secondary lead smelter workers. Occup. Environ. Med., 52, 667-672
Ghezzi, L, Toffoletto, F., 5esana, G., FagioIi, M.G., Micheli, A., Di Silvestro, P., Zocchetti, C. & Alessio, L. (1985) Behaviour of biological indicators of cadmium in relation to occupational exposure. Int. Arch. Occup. Environ. Health, 55, 133-140
Groopman, J.D. & Skipper, P.L. (1991) Molecular Dosimetry and Human Cancer: Analytical, Epidemiologi са', and Sociаl Considerations, Boca Raton, CRC Press
Huang, М.Y., Jin, C., Liu, Y.T., Li, B.H., Qu, Q.S., Uchida, Y., Inoue, O., Nakatsuka, H., Watanabe, T. & Ikeda, M. (1994) Exposure of workers to a mixture of toluene and xylenes. I. Metabolism. Occup. Environ. Mcd., 51, 42-46
Hulka, B.S. (1991) Epidemiological studies using biolog-ical markers: issues for epidemiologists. Cancer Epidemiol. Biomarkers. Prev., 1, 13-19
Hu1ka, B.S., WiIcosky, T.C. &c Griffith, J.D. (1990) Biological Markers in Epidemiology, Oxford, Oxford University Press
ТАКС (1994)'ARC Monographs on the Evaluation of Carcinogenic Risk to Humans, Some Industrial Chemicals, Vol. 60, pp. 233-320
lieue, O., Seiji, K., Kawai, T., Watanabe, T., Jin, C., Cat, S.X,, Chen, Z., Qu, Q.S., Zhang, T. & Ikeda, M. (1993) Excretion of methylhippuric acids in urine of workers exposed to a xylene mixture: comparison among three xylene isomers and toluene. Int. Arch. Occup. Environ. Health, 64, 533-539
IPCS, (1993) Biomarkers and Risk Assessment: Concepts and Principles. (Environmental Health Criteria 155), Geneva, World Health Organization
Kang, DI., Rothman, N., Cho, S.H., Poirier, M.C., Greenberg, A., Hsu, CI., Schwartz, B.S., Baser, M.E., Weston, A„ Groopman, J.D. & Strickland, P.T. (1995) Interindividual differences in the concentration of 1-hydroxypyrene-glucuronide in urine and polycyclic аrо-таtiс hydrocarbon-DNA adducts in peripheral white blood cells after charbroiled beef consumption. Camnogencsis, 16, 1079-1085
Krieger, N., Wolff, M.S., Hiatt, R.A., Rivera, M,, Vogelman, J. & Orentreich, N. (1994) Breast cancer aid serum organochlorines: a prospective study among white, black, and Asian women. J. Nat' Cancer Inst., 86, 589-599
Manz, A., Berger, J., Dwyer, J.H., Flesch Janys, D., Nagel, 5. & Waltsgott, H. (199 I) Cancer mortality among work-ers in chemical plant contaminated with dioxin. Lacet, 338, 959-964
Qian, G.S., Ross, А.K., Yu, M.C., Yuan, J.M., Gao, У.T.,
100
Henderson, BE., Wogan, G,N. & Groopman, J.D. (1994) A follow-up study of urinary markers of alatoxin exposure and liver cancer risk in Shanghai, People's Republic of China. Cancer Epidemiol. Biomarkers Prev., 3, 3-10
Riboli, E., Haley, N.J., De Waard, F. & Saracci, R. (1995) Validity of urinary biomarkers of exposure to tobacco smoke following prolonged storage. mt. J. Epidemiol., 24, 354-358
Ross, R.K., Yuan, J.М., Yu, M.C., Wogan, G.N., Qian, G.S., Tu, J,T., Groopmari, J.D., Gao, Y.T. & Henderson, В.E. (1992) Urinary afiatoxin biomarkers and risk of hepato-cellular carcinoma. Lancet, 339, 943-946
Rothman, N., Stewart, W.F. & Schulte, P.A. (1995) Incorporating biomarkers into cancer epidemiology: a matrix of biomarker and study design categories. Cancer Epidemiol. Biomarkers Prey., 4, 301-311
Santella, R.M., Hemminki, K., Tang, D.L., Paik, M., Ottman, R., Young, T.L., Savela, K., Vodickova, L., Dickey, C., Whyatt, R., et al. (1993) Polycyclic aromatic hydro-carbon-DNA adducts in white blood cells and urinary I -hydroxypyrene in foundry workers. Cancer Epiderniol. Biomarkers Лгс"., 2, 59-62
Schulte, P.A. & Perera, F.P. (1993) Molecular Epidemiology: Principles and Practices, San Diego, Academic Press
Sherson, D., Sigsgaard, T., Overgaard, E., Loft, S., Poulsen, H.E. & Jongeneelen, F.J. (1992) Interaction of smoking, uptake of polycyclic aromatic hydrocarbons, and cytochrome P450IA2 activity among foundry workers. Br. J, m d. Med., 49, 197-202
Sinha, R., Rothman, N., Brown, E.D., Mark, S.D., Hoover, R.N., Caporaso, N.E., Levander, O.A., Knize, M.G., Lang, N.P. & Kadlubar, F.F. (1994) Pan-fried meat containing high levels of heterocyclic aromatic amines but low lev-els of polycyclic aromatic hydrocarbons induces cytochrome P4501A2 activity in humans. Cancer Res., 54, 6154-6159
van Schooten, F.J., Jongeneelen, F.J., Hi11ebrand, M.J., van Leeuwen, F.E., de Looff, AJ., Dijkmans, А.P., van Rooij, J.G., Den Engelse, L. & Kriek, E. (1995) Рolycyclic aromatic hydrocarbon-DNA adducts in white blood cell DNA aid 1-hydroxypyrene in the urine from aluminum workers: relation with job category and syn-ergistic effect of smoking. Cancer ЕргdеmгоI. Biomarkers Prey., 4, 69-77
Wallace, L.A., Pellizzari, E.D., Hartwell, T.D., Sparacino, C., Whitmore, R., Sheldon, L., Zelon, Н. & Perritt, R. (1987) The TEAM (Total Exposure Assessment Methodology) Study: personal exposures to toxic sub-stances in air, drinking water, and breath of 400 residents of New Jersey, North Carolina, and North Dakota. Environ. Res., 43, 290-307

Markers of internal dose: chemical agents
Wolff, M.S., Toniolo, P.G., Lee, E.W., Rivera, M. & Dubiri, N. (1993) Blood levels of оrgaпoсh1orine residues and risk of breast cancer. J. Nat[ Cancer Inst., 85, 648-652
Wu, Y , Chef, J., Ohshima, H., Pigatelli, B. Boreham, J., Li, J., Campbell, T.C., Peto, R. & Bartsch, H. (1993) Geographic association between urinary excretion of N-nitroso compounds and oesophageal cancer mortality in China. mL J. Caecer, 54, 713-719
Corresponding author Q. Coggon MRC Environmental Epidemiology Unit, University. of Sоuthaтqtоn, Southampton, UK
101

Applicalioп of Biomorkirn in Canner Epidemiology Tnniolo, P., Bottetta, P., Shaker, D.E.G., Rghman, N., Hu1ka, Band Pearce, N. eds
lARC Scientific Pabkcatiorna No, 142 lnlerпational Agency for Research оп Cancer, Lyon, 1997
Biochemical markers of dietary intake R. Kaaks, E. Riboli and R. Sinha
The primary objective of nutritional epidemiology is to identify, in combination with other forms of research, which aspects of diet and nutritional factors are causally related to cancer development. However, traditional epidemiology can evaluate with onIy a limited degree of specificity to which individual dietary factors an increased occurrence of cancer can be auгibuted.he two main reasons for this are: (1) dietary intake levels of specific foods or food constituents can be strongly intercorrelated; (2) dietary intake levels of specific food constituents are generally measured with rather large errors. Biochemical markers are increasingly seen as measurements that may help to overcome some of the above-mentioned methodological problems in nutritional epidemiology.
The most promising application of biomarkers of diet is in prospective cohort studies, where the marker is unlikely to have been influenced by the disease, as biological specimens can be collected and stored well before cancer develops and becomes clinically manifest.
Two main types of markers of diet should be dis-tinguished: 1. Markers of absolute quantitative intake levels such as urinary nitrogen for protein. These mark-ers are based on a time-related balance between intake and output. 2. Markers based on the concentration of a specific substance in biological fluids, or tissues (e.g. the concentration of vitamins in blood plasma). Such markers have no time dimension, and provide only a correlate of dietary intake level. This class repre-sents the vast majority of Biomarkers of diet.
The main advantages of biomarkers of diet are as follows: • Biomarkers may provide more accurate тeаsите-ments—or at least а correlate of intake levels of specific chemical constituents—than the tradi-tional dietary assessment methods. • Biomarkers are objective measurements, the validity and precision of which are independent of the subjects memory or capacity to describe foods consumed. In statistical terms, this means that the measurement errors of biomarkers can be assumed to be uncorrelated with those of the questionnaire measurements. It is this statistical independence of these errors that makes biomarkers of diet such an
attractive class of measurement in epidemiological studies.
In prospective cohort studies, biomarkers of diet can be used as an independent measurement of dietary intakes iп order to evaluate the association between these intakes and disease risk, or as an additional measurement of diet to be combined statistically (e.g. in latent variable models) with measurements obtained by questionnaire. This latter application is especially useful in validity studies to estimate the magnitude of systematic and random errors of dietary exposure measurements obtained from questionnaires.
The primary objective of nutritional epidemiol-ogy is to identify, in interaction with other forms of research, to which specific aspects of diet or other nutritional lifestyle factors (e.g. physical activity) observed variations in incidence of dis-ease can be attributed. In theory by identifying causal factors with a highest possible specificity, accurate recommendations can be given about nutrition-related lifestyle factors, with the aim of reducing the overall incidence of disease. Besides providing insight into how to optimize nutritional lifestyle patterns, it is hoped that epidemiological research may also help to identify individual chemical agents that, even when administered as isolated compounds, may reduce cancer risk. Examples of agents for which such potentially `chemopreventive' action has been postulated include vitamins C, Е and A, carotenoids, flavonoids, indoles or phytoestrogens (Steinmetz
103

Application of Biomarkers in Cancer f pidemiology
& Potter, 1991; Wattenberg, 1992). 1n practice, however, epidemiological studies can evaluate with only a limited degree of specificity to which individual dietary risk factors (foods, nutrients or other chemical food constituents) an increased occurrence of disease can be attributed. The two major reasons for this are: (1) intake levels of spe-cific foods, food groups or chemical food con-stituents (nutrients or non-nutrient substances) can be strongly intercorrelated; and (2) the intake levels of specific foods or food constituents are generally measured with rather large errors.
In nutritional epidemiology, biochemical mark-ers are increasingly seen as measurements that may help to overcome some of the above-mentioned methodological problems in nutritional,epidemi-ology. In this chapter, we discuss the potential uses and limitations of biochemical markers of dietary intake levels in studies of the relationships between diet and the risk of chronic diseases such as cancer. Although much of this discussion will apply to the use of bîomarkers in practically any type of epidemiological design, including ecologi-cal correlation studies and case-control studies, we shall focus mainly on their use in prospective cohort studies. Prospective cohort studies have the advantage that the level of the marker is unlikely to have been influenced by the presence or absence of disease, as biological specimens can be collected well before disease develops or becomes clinically manifest. А new generation of prospec-tive cohort studies on diet and cancer, including large banks of biological specimens (blood, urine, toenails), is currently being conducted in different parts of the world (Toasiolo et cd., 1995; Berrino et cd., 1996; Riboli & Kaaks, 1997).
Types of biomarker of diet Most markers currently in use are related to the intake of a specific chemical compound ingested together with a food (Riboli et aI., 1987). These compounds may be natural food constituents (e.g. the traditional nutrients); they may be formed dur-ing processing or treatment (e.g. heterocyclic amines formed in foods: Phi?, McIQ trarssfatty acids); or they may be contaminants from either a natural origin (e.g, aflatoxin) or a xenobiotic origin (e.g. DDT, PCBs). Prom a methodological point of view, it is useful to distinguish two major classes of bhmarkers of diet.
The first class are markers based ôп knowledge about the metabolic balance between the intake and excretion of specific chemical components; that is, the per cent recovery of the compound or its metabolites in excretion products (mainly urine and breath) is known. All markers belonging to this first category are time-related; that is, the markers are based on a balance between intake and output over a representative time period, usually of 24 h, and thus can be translated into estimates of absolute intake level over 24 h as well. Probably the best known example is the 24-h urinary excre-tion of nitrogen as a marker of average 24-h ргo- tein intake (Bingham & Cummings, 1985). This marker is based on the knowledge that, in individ-uals who are in nitrogen balance (i.e., in practical terms, individuals who have a stable body mass aid composition), the 24-h urinary nitrogen excre-tion represents a practically constant proportion of nitrogen ingested (mostly in the form of protein). Likewise, the urinary excretion of potassium can be used as an indicator of potassium intake, even though the percentage recovery in urine of ingested potassium is more variable between indi-viduals than the recovery of nitrogen (Bingham et al., 1992, 1995). A high intake of potassium can be taken as an indicator of a diet rich in vegetables and fruits (Williams & Bingham, 1986). A third, well-known example of a biomarker based on a metabolic balance between ingestion and excre- tion is the 'doubly labelled water' method to esti-mate average daily energy expenditure (Schoel1er, 1988). If, on average, a group of individuals is in energy balance (i.e. there are no gains or losses in body weight or composition), on average the daily energy expenditure is equal to daily energy intake; thus, the doubly labelled water method can be used to estimate dietary energy intake.
The second class of markers of dietary intake are measured as concentrations of specific substances in: biological fluids (plasma, urine, saliva), specific tissues or cells (e.g. adipose tissue, white blood cells), lipoproteins, cellular membranes, DNA and specific proteins. Here, the word `concentration' must be taken in a broad sense, in that the denoni-inator determining the concentration does not need to be measured in units of volume. Examples of different types of 'concentration' are the frac-tion (ppm) of DNA bases with specific adducts (e.g. of PhIP), the fraction of amino acids in a given
104

8iochemicn1 markers of dietary intake
type of protein (albumin, haemoglobin) that car-ries a specific type of adduct (PhIP, afutoxin), the concentration of vitamin E in lipoproteins or in the lipid phase 0f cell membranes, and the fatty acid composition of an adipose tissue biopsy. This second class of marker represents the vast majority of markers of dietary intake and, contrary to the markers based on a balance over time between intake and excretion, are without a time dimen-sion. Also in contrast with the first class of mark-ers, the quantitative relationship between this sec-ond class of markers and dietary intake level can-not be as clearly defined from knowledge about its physiology, and this quantitative relationship may vary between populations or even between popu-lation subgroups, depending on the presence and relative impact of determinants other than diet. The markers belonging to this second category can therefore only provide a correlate of dietary intake level; that is, they can provide a more or less accu-rate relative ranking of individuals by intake level and/or disease risk, but cannot be translated directly into absolute (recommended) intake lev-els. A list of examples of nutritional markers belonging to this second category that are often used in epidemiology is given in Table 1.
Advantages of biomarkers as measurements of dietary intake
To appreciate the potential advantages of bio-chemical markers as measurements of diet, it is useful to review briefly the characteristics and im-itations of the more traditional measurements of dietary intake level. The lattez can be divided into assessments of an individual's habituai, long-term intake of foods, by means of a structured ques-tionnaire or interview (Cameron & van Staveren, 1988; Willett, 1990a), and measurements of the actual consumption of foods on one or more spe-cific days by means of written food consumption records (Cameron & van Staveren, 1988 ) or by means of short-term (usually 24-h) recalls (Witschi, 1990).
Food composition tables are used to translate either type of measurement of food consumption into estimates of nutrient intake. In casе-сontrol or cohort studies on the relationship between diet and the risk of developing chronic disease, mea-surements of habitual exposure levels can usually be obtained only by the first type of measurement
(i.e. using a questionnaire); nevertheless, replicate measurements of the second type (written records or short-term recalls) can be used in smaller sub-studies for the `validation' and/or 'calibration' of the questionnaire measurements. Either type of measurement—whether based on a questionnaire about habitual food consumption or on the recording or recall of the actual consumption on given days--can be biased as a result of unknown, or unquantifiable, subject-associated factors such as a lack of memory, an incapacity to identify or describe accurately types of food consumed, or a tendency to deviate from the habitual diet on days that written records of food consumption are being kept. When measurements are repeated by the same method, individuals may tend to make errors of a similar size and magnitude on two or more occasions. Therefore, errors may be correlated pos-itively, i.e. the measurements may have less than perfect validity (see below). Between different types of dietary assessment method—e.g. between questionnaires of habitual dietary intake and records or short-term recalls of actual dietary
intake levels on specific days—errors are often assumed to be practically independent. This assumption will be questionable, however, when-ever some of the potential sources of error are the same. For example, subjects may vary in their motivation to provide complete answers to each type of method, aid may thus underestimate dietary intake levels to a similar degree by both approaches (i.e. again resulting in a positive corre-lation of errors between the two types of measure-ment).
An initial reason for using biochemical markers of dietary intake level is that they may provide a more accurate measurement (or at least a correlate) of intake levels of specific chemical constituents than can be obtained by the traditional methods. The inaccuracy of the traditional methods may be due, for instance, to the lack of reliable food com-position data. Food composition tables generally contain figures only of those chemical food con-stituents ('essential nutrients') that provide energy or that must be consumed regularly to prevent spe-cific, known deficiency diseases that would other-wise develop relatively quickly. Although in many countries databases on food composition are cur-rently being extended so as to include a wider range of chemical compounds (i.e. extending
105

Application of Biomarkers in Cancer Epidemюlogy
Nutrients or food No. of Category of Biochemical Correlation Author groups subjects subjects index coefficient Vitamin A and carotenoids Roidt et al., 1988 Total preformed 302 men and All serum retinol 0.08
retinol women Serum a-carotene 0.00 Serum p-сагоtепе 0.03
Total vitamin A. 302 men and All Serum retinol 0.08 women
Total dietary 302 men and 5егит retinol 0.02 carotenoids women Serum a-carotene 0.26
Serum p-carotene 0.21
Romieu etaL, Carotenoids 370 men and Non-smokers plasma R-carotene 0.37 1990 women
van't Veer et al, Fruits and vegetаыеs 140 women All (dietary history) Plasma carotenoids 0.22 1990, 1993
Coates et a!„ 1991 Total carotenoids
Total carotenoids Provitamin A
carotenoids a-Carotene p-Carotene Cryptoxanthine Lycopene
Lutein
Total carotenoids
Total carotenoids Provitamin A carotenoids
a-Carotene ДΡ-Carotene Cryptoxanthine Lycopene
Lutein
50 women Non-smokers
41 women Smokers
Serum provitamin A 0.45 carotenoids
Serum ДΡ-сатоtепе 0.43 Serum provitamin A 0.38
carotenoids serum a-carotene 0.38 Serum u-carotene 0.32 Serum cryptoxafrthine 0.36 Serum lycopene —0.06 Serum 0.00
luteimzeaxanthin Serum Arvitormn A 0.17
carotenoids Serum 1-carotene 0.23 Serum provitamin A carotenoids 0.17
Serum a-carotene 0.21 Serum h-carotene 0.23 Serum cryptoxanthine 0.18 '
Serum !ycopene 0.00 Serum 0.08
lutein/zeaxanthiп
106

Biochemical markers of dietary intake
Nutrients or food No. of Category of Biochemical Correlation Author groups subjects subjects index coefficient
Ascherio et a1., Carotenojfls 110 men Non-smokers Plasma a-carotene 0.52 1992 Plasma гсагоtепс 0.34
Plasma a plus 0.34 p-carotene
Plasma lycopene 0.13 Plasma tutein 0.36 Plasma zeaxanthin 0,11 Plasma retinol 0.11
162 women Non-smokers Plasma a-carotene 0.37 . Plasma R-carotene 0.30
. Plasma a plus 0.30 p carotene
Plasma lycopené 0.01 Plasma lutein 0.19 Plasma zeaxanthin 0.02 Plasma retinol 0.13
Jacques et a1., Vitamin A 42 men and 71 Non supplement Plasma retinol 0:02 . 1993 women users
55 men and 82 Supplement and Plasma retlnol 0.07
women non supplement users
Jacques et at, Carotanoids 53 men and 81 Non-supplement Plasma carotenoids 0.29 1993 women. users
supplement and . Plasma carotenoids 0.37 non-supplement .
users
Campbell et a1., . , Total fruits and 50 men and 49 All (FF0). Plasma lutein 0.39
1994 vegetables women Plasma p-carotene 0.44 Plasma lycopene —0.04 .
Plasma cc-carotene 0.54
Plasma (3 carotene 0.43 Plasma sum of 0.54 carotenoids .
Hebert etal., 1994 Retinol 167 men and All Plasma retinol 0.14
women Plasma R-carotene —0.02
Total (i-carotвne Plasma u-carotene —0.17 Plasma retinol 0.29
107

Aрp1iсauoп of Biomarkers in Cancer Epidemiology
Nutrients or food No. of Author groups subjects Yong etal., 1994 tx-Carotene 98 women
p-Carotene j3-Cryptoxanthin
Lutein Lycopene
Total a-Carotene
. R-Carotene R-Cryptoхanthm
Lutein Lycopene
T0ki1
Category of subjects
Biochemical index
Correlation coefficient
All (7-day records) Plasma a-carotene 0.59 Plasma R-carotene 115 Plasma 0.49 p-cryрtoхапthin
Plasma lutein 029 Plasma lucopene 0.41 Plasma total 0.51
All (FF0) Plasma a-carotene 0.52 Plasma ji-саrotепе 0.44 Plasma 0.30
(3-cryptoxanthin Plasma lutoin 0.29 Plasma lutein 0.28 Plasma total 0.43
Porrini et a!, 1995 p-Carotene 11 men and All (FF0) Plasma (3-carotene –0.07
33 women All {7-day records} Plasma p-carotene 0.44
Enger eta!,, 1995 Carotenoids 215 men and All Plasma a-carotene 027 women
Plasma ji-carotene 0.22 Plasma 0.35 p-cryрtoxanthin
Plasma lutein + 0.33 zeaxarthin
Lycopene 0.36
82 men and All (FF0) Plasma retinal 0.06 women Plasma (3-carotene 0.15
50 women Non-smokers— Serum a-tacopherol 0.36 food source only
Non-smoker—total Serum a-tocopherol 6.38 41 women Smokвrs—food Serum a-tocopherol 0.02
source only Smokers—total 5егum a-tocophera1 0.32
339 men and Non-supplement Plasma a-tocopherol 0.16 women users
Kardinaal etal., Retinol 1995 R-Carotene
Vitamin E Roidt вt а1., 1988 Vitamin E
Romieu etal., Vitamin E 1990
108

Biochemical markers of dietary intake
Nutrients or food No. of Category of Biochemical Correlation Author groups subjects subjects index coefficient
Sinha of al., 1993 Vitamin E 65 men All Plasma a-tocapherol 0.32
46 men Nan-supplement Plasma a-tocopherol 0.17 user
19 men supplement user Plasma a-tocopherol 0.37 65 men All Plasma y-tocopheroI —0.33
46 men Non-supplement Plasma y.tocopherol —0.08 user
19 men Supplement user Plasma y-tocopherol —0.25
Jacques of a1., Vitamin E 41 men and 70 Non-supplement Plasma a-1oсaphetu1 0.35
1993 women users 55 men and 70 supplement and Plasma r-tocophérol 0.53
women non-supplement . users
Porrini etal., 1995 Total a-tocophérol 11 men and 33 All (measured by Plasma a-tocophérol —0.22
women FFQ)
All (measured by Plasma a-tocopheroI 0.10 7-day record)
Kardinaal etal., roTocopherol 82 men and All (FFQ) Plasma a-totopherol 0.11
1995 a-Tvtaphero1: women Plasma a-tocophero1: 0.22
cholesterol ratio cholesterol ratio
Other vitamins Jacques of ai., Vitamin D 42 men and 66 Non-supplement Plasma 25-0Н 0.25
1993 women users vitamin D
55 men and 80 Supplement and Plasma 25-OH 0.35
women non-supplement vitamin D users
Thiamin 42 men and 67 Non-supp[ement Red blood cell 0.01
women users thiamin 56 men and 82 Supplement and Red blood cell 0.02 .
women non-supplement thiamin
users Vitamin B2 42 men and 66 Non-supplement Red blood cell —0.21
women users riboflavin Supplement and Red blood cell —0.13
non-supplement riboflavin users
Vitamin ВБ 42 men and 66 Non-supplement Red blood celI. ВБ 0.05 .
(pyridoxine) women users
109

Application of Biomarkers in Cancer Epidemiology
Nutrients or food No. of Category of Biochemical Correlation Author groups subjects subjects index coefficient Jacques et al. Vitamin 8 56 men and 82 Supplement and Red blood cell 8в —0.15
1993 (Contd) (pyridoxine) women non-supplement
users
Vitamin 612 40 men and 65 Non-supplement Piasma В12 0.19
(cyanocobalamine) women users
54 men and 7B Supplement and Plasma Вi2 0.35 women non-supplement
users
Plasma folate 40 men and 65 Non-supplement Plasma folate 0.61 women users
Supplement and Plasma folate 0.63
non-supplement
users
Wild et L, 1994 Folate 16 women Control subjects Serum folate 0.81 16 women Women with infants Serum folate —0.29
with neural
tubé defect .
16 women Control subjects Red blood cell folate 0.72 .
Women with infants Red blood cell folate —0.08
. with neural
tube defect
Sinha et a1., 1994 Vitamin C 493 women From food Serum ascorbic acid 0.19 From food + Serum ascorbic acid 0.32
suppiement
From food (one 5erum ascorbic acid 0.36
24-h recall)
From food + Уегит ascorbic acid 0.56
supplément
Sinha et al., 1992 Vitamin C 68 men All Plasma ascoгЬc acid 0.43
Jacques of al., Vitamin C 39 men and 60 Non-supplement Plasma total 0.38 1993 women users : vitamin C
55 men and 80 Supplément and Plasma total 0.43 women non-supplement vitamin C .
users
Porrini et a1., 1995 Ascorbic acid 11 men and 33 From food (FF0) Whole blood —4.22 .
women ascorbic acid
From food Whole blood 0.44
(7-day records) ascorbic acid ь
S
110

Biochemical markers of dietary intake
Author Nutrients or food No. of groups subjects
Protein
O'Donnell et a1, Protein 24 mon
1991 i
28 women
Selenium
Snook eta! 1983 Selenium 155 men and
Category of Biochemical Correlation subjects index coefficient
All (16-day Serum urea 0.21
weighed records) Serum creatinine 0.12
Unne nitrogen (24-h) 018
All (FF0) Serum urea -0.004
Serum creatinine —0.07
Urine nitrogen (24-h) 0.36
Ail (16-day Serum urea 0.07
weighed records) 5еruт creatinine 0.39
Urine nitrogen (24-h) 0.19 All (FF0) Serum urea 0.09
5егит creatinine 0.12
Urine nitrogen (24-h) 0.28
All (three 24-hr Plasma selenium : 0л2
. women recalls)
Yang etal., 1989 Selenium Аpprox. 150 3-day duplicate Whole blood 0.88
. families plate measured selenium for selenium Breast milk 0.90
24-hr urine 0.86
5waпson etaL, Selenium 24 men and Minimum of six Serum selenium 0.51
1990 20 women duplicate plates Whole blood selenium 0.55
for selenium Toenail selenium 0.53
measurement Urine Selenium 0.87
van 't Veer etal.,' Selenium 243 women All (dietary history) Plasma selenium 0.15
1990, 1993 239 women Erythrocyte selenium-0O5
360 women Toenail selenium —0.01
Other minerals O'Donnell eta! Sodium 24 men All (16 day Urine sodium 0.008
1991 Potassium weighed records) Urine potassium 0.19 .
Zinc Serum ziпс . 0.08
Sodium All (FF0) Urine sodium 0.25
Potassium: Urine. potassium 0.08.
Zinc Serum zinc 0 16

Applicatюn of 8iomarkers in Cancer Epidemiology
Author Nutrients or food groups
No. of subjects
Category of subjects
Biochemical index
Correlation coefficient
O'Donnell etal. Sodium 28 women All (16-day п Urine sodium 0.09 1991 (Contd) Potassium weighed records) Urine potassium 0.44
Zinc Serum zinc —0.02 Sodium All (FFQ) Urine sodium 0.24 Potassium Urine potassium 0.04 Zinc Serum zinc 4132
Jacques et al., Magnesium 39 men and 70 Non-supplement Sérum magnesium 0.15 1993 women users
56 men and 82 Supplement arid Serum magnesium 0.27 women non-supplement
users Zinc 44 men and 76 Non supplement Serum zinc 0.10
women users 56 men and 82 Supplement and Serum zinc 0.11 "
women non-supplement users
Matkiovic etal., Calcium 381 pre teen All (3 day diary) Urine calcium 021 1995 Sodium girls Urine sodium 0.21
Donavan & Gibson, Tгоп 124 women All (3 dayweighed Sérum iron 0.26 1995 Zinc records) Serum zinc 0.16
Shaw: eta! 1995 : Iron 43 men and 71 All (6 day weighed Plasma haemoglobin 0.26 women food records)
Fatty acids van 5tavereп etal., Р:5 rat'ioa . 162 men and All subjects (2 day : Adipose PS ratio 0.38 1986 M:P ratio. women records) Adipose M ratio 0.36
P Adipose P 040 P:$ ratio 59 women Average 19 Adipose Р:$ .ratio 057 M.P ratio 24 h recalls Adipose M Р ratio 0.63 P , Adipose P 0.68 Linoleic:S ratio Adipose linoleic 0.62
S ratio M: linoleic ratio Adipose м linoleic 0.63
ratio lanoleic acid Adipose linoleic 0.70
112

Biochemical markers of dietary intake
Author Nutrients or food No. of Category of Biochemical Correlation groups subjects subjects index coefficient
London et aL, 1991 5 115 FFQ Adipose 5 0.02
M postmenopausal Adipose М 0.08
Oleic acid women Adipose oleic acid 0.06
Trans fatty acids Adipose trans 0.41 fatty acids
Р Adipose Р 0.15
Linoleic acid Adipose linoleic acid 0.13
Linolenic acid Adipose linoleiiic acid 0.07
n-3 fatty acids of Adipose n-3 fatty 0.43
manne origin acids of marine origin
P1s ratio Adipose Р15 ratio 0.28
Hunter et ai 1992 5 118 men FFO Adipose S 0.14
M Adipose М 0.21 p Adipose Р 0.10
Р:S ratio Adipose P:S ratio 0.43..
Paimitic Adipose palimitiç 021
Oleic. Adipose oleic 0.28
Linoleic Adipose lirioleic 0.10
Eicosapentaenoic Adipose 0.43
ekosâpentaënoic
Trans-isomers Adipose trans-isomers 0.21
S 118 men 2 weeks of diet Adipose 5 : 0.25
М records Adipose М 4.16.
p. >
Adipose P 0.09 Р:S ratio, Adipose Р:5 ratio 0:40
Feunekss et ai P:S rafioa 55 men and FFO. Adipose Р:S ratio 0.32
1993 М:Р ratio women Adipose М:Р ratio 0.24
р ..
Adipose Р 0.24
Luoleic:S ratio Adipose lirioleic 0:33 5 ratio,
М:linoleic ratio Adipose м:linolею 0.25
ratio Linoleic acid Adipose linoleiç 0.28
Р:S ratioa Dietary history Adipose Р:Ѕ ratio. . 0.28
M:Р ratio Adipose M:Р ratio 0.34
p Adipose Р 0.29
Liпolsiс/S ratio Adipose linoleic: 0.30.
S ratio
113

Application of Biomarkers in Cancer Epidemiology
Author Nutrients or food No. of Category of Biochemical Correlation groups subjects subjects index coefficient
Feu nekes et al. M:linoleic ratio Adipose M:linoleic 0.44 1993 (Contd) ratio
Linoleic acid Adipose linoleic 0.34 Р:5 rаtioa 99 men and FF0 Erythrocyte 0.22
women membrane P:5 ratio M:P ratio . Erythrocyte 0.37
membrane M:P ratio
P Eгy4hrocytе 0.33
membrane Р Linoleic:S ratio Eтythгocyte 0.40
membrane linoleic: .
5 ratio М linoleic ratio Erythrocyte 0.41
membrane M:linoleic
ratio Linolsic acid Erythrocyte 0.44
. membrane linoleic
T]onneland et al., S 67 men and 121 FFQ Adipose S 0.24 1993 М women Adipose М 0.05
P Adipose P 0.44 18:2 h-6 Adipose 18:2 n-6 0.44 19:3 n-3 Adipose 18:2 л-Э. 0.12 i 20:5 n-3 Adipose 20:5 n-3 0.47 22:6 n-3 Adipose 22:6 л-Э 0.41 S . 67 men and 121 Two 7-day diaries Adipose S 0.46 М . women . Adipose ЛA 0.19 P Adipose P 0.57 192 n-6 Adipose 182 n- 0.51 19:Э п-3 Adipôse.18:2 л-3 0.36 205 n-3 Adipose 20:5 n-3 0.44 226 n-3 . Adipose 22 6 п-3 0.55
Hebert et a?. 1994 Fat 167 men and Plasma cholesterol 0.02 women Plasma -0.12
KIL cholesterol Cholesterol Plasma cholestérol 0.02
Plasma HDL cholesterol X1.05
S Plasma cholesterol . ¢0.01 Plasma HDL-cholésterol -0.12
114

Biochemical markers of dietary intake
Author Nutrients or food No. of Category of Biochemical Correlation groups subjects subjects index coefficient
Hebert et a1. M Plasma cholesterol 0.02
1994 (ctontd) Plasma HDL-cholesterol -0.12
P Plasma cholesterol 0.01
Plasma
HDL-cholesterol -'109
Ma eta]., 1995 3570 men and FF0 Plasma cholesterol women esters:
S S 0.23 M M 0.01
P P 0.31
P:S ratio P:S ratio 0.30
16:0 16:0 0.19
• 18:1 n-9 16:1 n-9 0.03
182 n-6 182 n3 0.28
18;3 n3 16:31-3 (.21
20:5 n-3 20:5 e3 0.23
22:6 n-3 22:6 n3 0.42
ь Plasma phospholipids:
g S 0.15 M M 0.05
P P 0.25
P:5 ratio P:S ratio 0.24
16:0 16:0 0.16
18:1 n-9 18:1 n-9 0.08
18:2 n-6 18:2 n-6 0.22
18:3 n-3 18:3 n-3 0.15
20:5 n-3 20:5 n-3 0.20
22:6 n-3 22:6 n-3 0.42
aР, polyunsaturated fatty acids; i', monounsaturated fatty acids; S, saturated fatty acids.
115

Application of Biomarkers in Cancer Epidemiology
beyond the traditional nutrients), an important problem is that chemical constituents may have rather variable concentrations within given types of food, due to natural variations between cultivars (e.g. indues in cabbage; Preobrazhenskaya et al., 1993; Guengerich, 1995), due to variations in the soil content of specific minerals and trace elements (e.g. selenium; U11rey, 1981), or due to effects of storage, processing and cooking methods (e.g. for-mation of aromatic amines such as PhIP, McIQ Siпha et al., 1995; Skog et al., 1995). Information on these sources of variation (type of cultivar, soil, cooking methods) often cannot be assessed reliably using questionnaire methods, and it will therefore be impossible to apply correct food composition values by which the intake of these specific food constituents can be computed from the estimated food consumption Ievels.
A second possible advantage of biomarkers often mentioned is their objectiveness; that is, the validity and precision of the markers can reason-ably be assumed to be independent of the subjects' memory or capacity to describe foods consumed. Only markers based on 24-h urinary excretion of a given compound may be influenced directly by factors related to subjects' motivation, as urine col-lections may be incomplete. However, the соm-pleteness of urine collections can be checked by measuring the recovery of a small amount of РABА (para-arnino benzoic acid), ingested in the form of small tablets at regular intervals during the 24-h collection period (Bingham & Cummings, 1986). It must be noted that the term 'objectiveness' does not necessarily mean that the validity and preci-sion are the same for cases with a given disease and for disease-free controls; this may be true only if biological specimens are collected well before any metabolic changes occur that may be a conse-quence rather than a cause of disease and that may have influenced the level of the marker (i.e. using a prospective study design). The more relevant interpretation of the word objectiveness is that random errors in the marker—i.e. any variations that are not correlated with the individuals' trie, habitual dietary intake levels—can be assumed to be statisticaIly independent of subjects' capacity or motivation to give an accurate response to tradi-tional methods of measurement. Thus, the errors of biomarkers can be assumed to be uncorrelated with those of questionnaire measurements, short-
term recalls or food consumption records. It is this statistical independence of the errors which in the-ory makes biomarkers of diet a very attractive addi-tional class of dietary intake measurement for use in epidemiological studies.
The use of biomarkers of diet in prospective cohort studies
A first type of application of biomarkers in nutritional epidemiology is their use as an inde-pendent measurement of dietary intake levels, to evaluate the association between these intake lev-els and disease risk. There are numerous examples of this type of application, for instance in studying the relationships between cancer risk and plasma levels of carotenoids, vitamin C, selenium or the fatty acid composition of blood lipids (e.g. 5thelin et al., 1991; London et ai', 1992; Garland et aL, 1993; van den Brandt et al., 1993; Zheng et al., 1993; Berg et al., 1994; Gann et al., 1994; Kabuto et al., 1994). As mentioned above, an initial argument for this type of application is that the marker may classify individuals more accurately than traditional dietary assessment methods by habitual intake level of some food constituents. For instance, dietary intake levels of selenium may not be calculated very reliably from individuals' estimated levels of food consumption, because selenium concentrations can vary widely irn individual foods. Likewise, intake lev-els of specific types of carotenoids (e.g. lycopene, zeoxanthine) or specific types of fatty acid may not be estimable because of a lack of food composition data. A further argument for using a biomarker as a measurement of dietary intake level is that a rela-tionship between a marker and disease risk maybe interpreted as independent confirmation of a rela-tionship found between disease risk and dietary intake measurements obtained by more traditional techniques (e.g. dietary questionnaires) that have different sources of error (although some caution should be made against oversimplistic interpreta-tions of biomarkers as a measurement uniquely of dietary intake level; see the section on 'Validity and confounding' below).
A second type of application of biomarkers of diet is to combine it, as an additional measurement of diet, with measurements obtained by question-naires, recalls or food consumption records. None of the existing methods of measuring individuals' true, habitual (long-term) intake levels of specific

Biochemical markers of dietary intake
foods or nutrients provides error-free measure-ments. Food frequency questionnaires are the method used most often to measure individuals' dietary intake levels at baseline in prospective cohort studies. systematic and random errors in the questionnaire measurements lead to bias in estimates of relative risk or other measures of diet—disease association. By estimating the average magnitudes of these errors corrections may be made for the bias in relative risk estimates. For instance, assume that questionnaire measurements are related linearly to a true intake level T, i.e.
Q = с + jIQT +
Unknown parameters in this model are the con-stant and proportional scaling factors, аQ and p , the mean (µ.1) and variance ( of the population distribution of true intake values T, and the popu-lation variance б Q of random measurement errors EQ. From estimates of the parameters pQ, б Qandб4, the coefficient of correlation рQT between ques-tionnaire measureriients and true intake levels can be computed. When relative risks are calculated for quantile levels (e.g. quintiles) of the population distribution of intake levels, this correlation coef-ficient determines the degree of underestimation ('attenuation bias') due to random errors in the questionnaire measurements, aid the loss in sta-tistical power that such underestimation entails (de K1erk et al., 1989).
By making comparisons between questionnaire measurements and other types of dietary intake assessment in valгдity subsfudies, it may be possible to estimate key parameters аQ, ¢a, µ~ бi, and 5 in the measurement model above. Estimation of these parameters then relies on statistical models in which true intake levels, T, are considered to be values of a latent variable. A crucial assumption for the parameters to be estimated is that any associa-tion between complementary measurements of diet must be due only to the relationship between each of these variables and the same latent vari-able (true dietary intake level); that is, variations that are uncorrelated with true intake level ('ran-dom errors') should also be uncorrelated between the different types of measurement. Generally, such independence of errors cannot be proven in prac-tice, but only assumed (although, in more complex analyses of reliability studies with replicate measure-
rents of different types, assuming independence of errors between some, minimum, number of variables may sometimes allow the estimation of correlations of some other errors). To increase the likelihood that the assumption of statistical inde-pendence of errors is actually valid, measurements should preferably be taken by different methods, with very different potential sources of error.
Traditionally, the validity of dietary question-naire measurements is evaluated by comparison with repeated measurements of actual food con-sumption on a given day, obtained by food con-sumption records or 24-h diet recalls (both of these will also be referred to as 'reference' measurements (R), as, at a group level, they are often assumed to provide approximately unbiased measurements of intake, conditional on true intake level, i.e. R = T + н~ Using this traditional design, the correlation coef-ficient рQT is estimated by:
1. calculating the crude coefficient of conela-tion between questionnaire measurements and the individuals' averages of their replicate refer-ence measurements (food consumption records or 24-h diet recalls); and 2. correcting this crude coefficient for attenua-tion due to residual, within-subject variation in the individuals' average reference measure-ments, using a urцvariate analysis of variance to estimate within- and between-subject com-ponents of variance in the average reference measurements (Rosier & Willett, 1988).
As mentioned above, however, for the estimated correlation coefficient PQT to be valid, crucial assumptions to be made are as follows:
• Random measurement errors are statistically independent between the questionnaire aid the replicate reference measurements. • Random measurement errors are statistically independent between the replicate reference measurements themselves.
Violation of the first assumption in the form of a positive correlation between errors of question-naire and reference measurements will lead to an overestimation of the validity coefficient рQT; on the other hand, a positive correlation between the errors of replicate reference measurements will lead
117

Application of Biomarkers in Cancer Epidemiology
to an insufficient correction for attenuation effects, and thus to an underestimation of the correlation coefficient РQT. If neither type of violation can be ruled out, it is difficult to predict whether the correlation coefficient рQ~. will be overestimated or underestimated.
As mentioned above, biomarkers have the advantage that random errors can be assumed to be independent of those of more traditional types of dietary intake assessment. Thus, any correlation between marker and questionnaire or reference measurements is assumed to be due entirely to the fact that these measurements are associated with the same latent variable (true intake level of a given dietary constituent). Nevertheless, it is important to note that generally biomarkers will not have a perfect correlation with true intake level, even when the mean of many replicate mea-surements of the marker over time is taken (i.e. most markers have less than perfect validity as a measure for classifying individuals by habitual, true intake levels; see below). Therefore, the corre-lation between questionnaire measurements and markers, even though adjusted for attenuation effects due to random variation in the marker mea-surements themselves, can only be taken as an esti-mated lower limit for the correlation coefficient р . A somewhat different use of biomarkers in dietary validity studies proposed more recently involves inferences based on simultaneous comparisons between questionnaire measurements (Q) 24-h food consumption records or 24-h recalls (R) and marker (M) (Plummer & Clayton, 1993a,b; Kaaks et al., 1994a). For instance, from the a simple trian-gular comparison between single measures of Q R and М, estimates of the correlations between each of the three types of measurements and individu-als' true habitual intake levels (рqт, PRT' РMт) can be obtained using a structural equations model (Kaaks of al., 1 994a) or, more directly, an elementary fac-tor analysis model (Kaaks, 1997). The advantage of such a triangular comparison is that independence between random errors may need to be assumed only between the three diffèrent types of measure-ment (which indeed may have relatively indepen-dent sources of error iii practice), and that no such assumption is needed between replicate measure-ments obtained by the same method (replicate weighed food records or replicate 24-h diet recalls). If it is felt that some level of positive correlation
between random errors of questionnaire measure-ments (Q) and food consumption records or recalls (R) cannot be excluded (but that the random errors of markers would be independent of those of mea-surements Q and R), then the correlation coeffi-cient р, T estimated from the triangular compari-son between measurements Q R and М can at least be interpreted as an estimated upper limit of the true value of PQT (Kaaks, 1997).
$o far, substudies to evaluate the validity of dietary questionnaire measurements have usually been conducted either on an external study group of subjects not involved in the main epidemiolog-ical (cohort) study, or on a relatively small sub-sample of main study participants (nested within a cohort). Thus, since only a negligible number of cases with a specific disease would occur in the subsample; additional reference measurements (food consumption records, 24-h recalls) or addi-tional measurements based on a biomarker could not be used as additional predictors of disease rel-ative risk. However, when biological specimens are collected from all members of a cohort study, and are available for later biochemical analyses, mark-ers can be measured in the specimens of subjects who subsequently develop disease and in individ-uals who have remained disease-free (e.g. using a nested case—control or a case—cohort design). In such situations, a triangular comparison between questionnaire measurements (Q), marker (М) and disease status (D) may in principle allow the esti-mation of relative risks unbiased by the random errors in either type of exposure measurement. However, the statistical methods for the analysis of studies on the association between diet and disease risk, using biomarkers as an additional measure-ment of dietary exposure, still require further investigation.
Sources of variation, reproducibility and validity Intervening factors The interpretation of a biomarker as a measure of an individual's (relative) intake level of a given food component obviously relies on the assump-tion that within- or between-subject variations in true intake levels of a given compound of interest are a primary determinant of within- and between-subject variations in the marker. Variations in the measured level of a marker of diet may, however, have many other exogenous or endogenous deter-
118

Biochemical markers of dietary intake
minants which may affect the absorption, distrib-ution over body compaitments or tissues, metabolism or excretion of a given compound. For example, active smoking, as well as exposure to environ-mental smoke, have been reported to be associated with decreases in plasma levels of vitamin C (Schectпnад et aL, 1989; Tribble etaL, 1993; Tappia et al., 1995) or p-carotene (Stryker et al., 1988; Saintоt et al., 1994) that could not be explained (only) by differences in diet, and which may be due to increased oxidation of these antioxidant vit-amins. Another example, concerning the validity of biomarkers of fat-soluble compounds such as carotenotds, retinol от vitamin E, is the simultane-ous intake of dietary fats, which enhance their intestinal absorption. Endoger►ous metabolic fac-tors include mechanisms of homeostatic regula-lion of specific nutrient levels in blood plasma (e.g. homeostatic mechanisms controlling the intesti-na1 absorption and circulating plasma levels of iron; homeostatic mecbaniszns controlling plasma levels of retinol, by secretion of retinol—bound to retinol-binding protein--from the liver), or factors that affect the distribution of a compound over body compartments and different tissues (e.g. vit-amin C in plasma andin white blood cells). Other factors may be related to the metabolism and/or elimination of compounds. For instance, the levels of adducts to lymphocyte DNA of many poten-tially toxic substances, such as N-nitroso-com-pounds formed in the stomach from dietary pre-cursors, or heterocyclic amines formed in meat during cooking, can be co-determined by genetic or phenotypic polymorphisms in the activity of enzymes that play a role in the detoxification and elimination of such compounds, or in the forma-tion of reactive intermediates that can form cova-lent bonds with DNA. These intervening factors may cause considerable variation in the marker that is unrelated to a dietary factor of interest. This additional random variation ('random' in the sense that it is not predictable from the variations in diet that the marker is supposed to reflect) will attenuate the association between markers and true dietary intake levels.
Within a restricted range of intake levels, the dose-response relationship between intake levels of a given dietary constituent and a biochemical marker is often approximately linear, and inter-vening factors may cause mainly 'random' variations
in the marker that are unrelated to true intake level. Over wider ranges of intake, however, home-ostatic mechanisms may cause significant devia-tions from linearity. For example, for plasma retinol (vitamin A) concentrations, dose-response curves may be quasi-linear at habitual intake levels that are so low as to induce a retinol-deficient (or borderline deficient) state. At higher habitual intake levels, however, similar to those in most well-nourished populations, the dose-response curve flattens off to a practically constant level that is under homeostatic control by the liver. Clearly, in the flatter parts of this type of dose-response curve, the association between marker and intake level will be weaker, or the asso-ciation may even be practically absent (see exam-ple of retinol in Table 1).
Repгaducibиltц validity and reliability Two useful notions in describing the quality and usefulness of a bionrarker of diet are its repro- ducihility (also called precision) and its validity. High reproducibility implies that a measure of a bio-marker leads to very similar results for biological specimens collected on two independent occasions from the same individuals. A practical measure of the reproducibility is the correlation between the replicate measurements.
Validity means that a marker actually measures what it is intended to. As mentioned earlier, most markers cannot be translated into a measure of daily intake on an absolute scale, but at the very best are only correlated with intake level; that is, the marker can oniy be used to provide a relative classification of individuals by high or low dietary intake levels. Therefore, we shall use the term validity here in a somewhat restricted sense, to in-dicate that the average of an infinite (or very large) number of replicate measurements of the marker (on independent occasions) has a correlation of (close to) 1.0 with the individuals' true intake lev-els. Furthermore, we shall call a measurement of a marker of diet 'reliable' when it combines a high validity with a high reproducibility.
Perfect validity of a marker of diet implies that variations that are uncorrelated with true intake level ('random errors') are also statistically inde-pendent between replicate measurements taken on the same individual (after a sufficiently long time interval). When the validity is less than perfect,
119

Application of Biomarkers in Cancer Epidemiology
part of the between-subject variation in the marker must reflect determinants (known от unknown) other than the dietary factor of interest. Foi example, plasma levels of a fat-soluble compound such as vitamin E may be influenced, not only by vitamin E intake, but also by plasma concentrations of low density lipoproteins, which, in turn, may depend on the type and amounts of fat consumed, on the degree of obesity, or on genetic factors causing between-subject variations in lipid metabolism.
Reproducibility is generally seen as an initial practical criterion for the selection of a marker of diet as a potential measure of exposure—by defin-ition a poorly reproducible marker also has low reliability, irrespective of what the marker was sup-posed to measure. Nevertheless, if random varia-tions in the marker are only weakly correlated between replicate measurements, the overall relia-bility may be increased substantially by taking the average of replicate measurements of the marker on the same individual. Inversely, when the ran-dom errors of replicate measurements are highly correlated (i.e. the validity is low), the reliability of a marker may not be improved much by taking the average of multiple measurements per individual.
In practice, the reproducibility of a biomarker will be a function of the stability of individuals' dietary intake level of a given compound (i.e. the ratio of within-subject to between-subject varia-tions in intake level), as well as of its metabolic turnover rate. The turnover rate may depend largely on whether the compound is mainly fat-soluble or water-soluble, as well as on the type of medium (e.g. plasma, urine, saliva, blood cells or other tissue) chosen for the measurement. For example, after intake of a high dose of vitamin C, a water-soluble compound, a relatively large pro-portion will be excreted in the urine within a very short time. Fat-soluble compounds, on the other hand, can accumulate more in the body. The day-to-day variation of vitamin C concentrations iп lymphocytes is lower than that of vitamin C levels in blood plasma. Thus, if the vitamin C concen-trations in lymphocytes can be taken as a weighted average of varying plasma levels in the days or weeks before a blood sample is taken, the vitamin C concentrations in lymphocytes may be a more reliable marker of average intake levels over a longer time period. (Note, however, that results from several studies have shown that the reproducibility
of measurements of plasma vitamin C levels, and the correlation of plasma Ievels with dietary intake measurements, can also be quite high (Bingham et a2., 1995); these high correlations suggest that indi-viduals' dietary intake Ievels of vitamin C may be relatively stable and, hence, that a fast metabolic turnover may have a relatively minor impact on the reliability of this marker). Similarly, the day-to-day variability of fatty acid composition is higher for plasma triglycerides (especially in non-fasting plasma) than for plasma phopholipids, cholesteryl esters and erythrocyte membranes, and is almost null in subcutaneous adipose tissue biop-sies, where the half-life of fatty acid turnover is estimated at 18-24 months.
A question of practical interest is whether a more reproducible marker—e.g. the fatty acid com-position of an adipose tissue biopsy, rather than that of plasma triglycerides may generally also be expected to be moie valid. This would be true if the metabolic factors that cause the increased sta-bility over time primarily smoothen the effects of day-to-day variations in true intake level, but do not induce new between-individual variations that are independent of the individuals' habitual intake levels. In reality, this may not always be the case. For example, from a physiological point of view, the fatty acid composition of (non-fasting) plasma triglycerides, which consist mainly of fats absorbed immediately after a meal, should reflect very well the composition of the fats just ingested. As a mea-sure of the average composition of fats consumed in the long term, however, this marker may be rel-atively unreliable, as there can be substantial day-to-day variation in the fatty acid composition of foods consumed. Inversely, turnover rates of fats are low in adipose tissue, and the fatty acid com-position of such adipose tissue biopsies is a highly reproducible measurement, at least over intervals of less than 1 year. Nevertheless, whereas some types of fatty acid from diet will be absorbed and finally stored in adipose tissue without modifica-tion and in proportion to their presence in plasma triglycerides, much of other fatty acids may be modified before or upon storage, and part of the fatty acids found in adipose tissue may actually have been synthesized endogenously from carbo-hydrates. Therefore, although more stable over time, the fatty acid composition of adipose tissue may only be a reliable marker of some (not all)
120

Biochemical markers of dietary intake
types of fatty acid in the diet (e.g. the linoleic acid content of adipose tissue shows moderately high correlations with lirnoleic acid intake from diet, whereas for palmitic acid or stearic acid this corre-lation tends to be lower: van Staveren et al., 1986; London etaL, 1991).
Studies to evaluate the reliability (ranking capacity) of markers as a measurement of diet have generally been based on a simple comparison (cor-relation) with traditional dietary intake assess-ments (see Table 1 for examples). For some markers, e.g. caxotenoids and vitamin li, correlations with questionnaire measurements have been reported to be rather low (rable 1; see also reviews by Willett, 1990b and van't Veer et al., 1993), whereas the cor-relation can be as high as 0.6 or 0.8 for vitamin C or finoleic acid (van Staveren et al., 1986; Bingham et aI., 1995; Riboli et al., 1997). Adjustments for attenuation bias due to time-related, intra-individ-nal variations in markers—especially those based on a concentration of a given compound in tissues or body fluids, rather than on a balance between intake and excretion—often do not lead to great improvements in the correlation with the dietary intake assessments, which suggests that the valid-ity of these markers may be limited. Obviously, however, a less than perfect correlation between markers and other measurements of dietary intake (e.g. from a questionnaire) may also be due to errors in the latter type of measurement. The use of latent variable methods for the analysis of validity studies based on comparisons between replicate measurements of a biomarker, questionnaire mea-surements of habitual diet and/or replicate mea-surements of actual food consumption on given days may help to obtain more accurate estimates of the validity and precision of markers.
Validity and confounding Besides being additional sources of variation in the levels of markers, exogenous and endogenous intervening factors may also be independent pre-dictors of the risk of developing a given disease under study. For example, high plasma levels of fat-soluble compounds—such as (3-carotene, vita-min E or DDT metabolites—may reflect high dietary intake levels of these compounds, but they may also reflect high concentrations of low-density aid very low-density lipoproteins (LDLs,
VLDLs) (Hunter, 1990, 1993). High plasma levels of LDLs and VLDLs are associated with a nutri-tional/metabolic profile (e.g. marked by insulin resistance) that is often found in obese individuals and which may be a risk factor of disease indepen-dently of, and possibly in an opposite direction to, vitamin E. It has been stated that, iп this type of situation, the intervening factors may be seen as (positive or negative) confounders of the observed marker-disease relationship. In many of these situations, however, this view may be overly sim-plistic or even incorrect.
If the intervening factors mainly cause random variation in the marker, unrelated to the level of intake of a given dietary component of interest, while at the same time affecting disease risk, then the marker may not only reflect differences in intake levéls of the dietary component, but partly will also be a reflection of the effects of the inter-vening factors; in this situation, the interpretation of the marker-disease relationship as reflecting uniquely a relationship between intake level and disease would be simply invalid. In a slightly more complicated case, intervening factors causing vari-ation in both the markers and disease risk may also have some correlation with the dietary variable that a marker was actually supposed to measure. For instance, smokers may consume less fruit and vegetables and have a lower vitamin C intake (Schectmaп et al., 1989; 5ubar et aI., 1990; Ross et al., 1995), while, independently, inhalation of tobacco smoke may also lower plasma vitamin C levels by increasing its oxidation (Schectman, 1989; Tribble et al., 1993; Tappia et a2., 1995). Furthermore, smoking augments the risk of devel-oping many chronic diseases, including cancer. In this case, the relationship between disease nsk and intake of vitamin C is indeed confounded by smok-ing, in the sense that intake levels of vitamin C could be found to be inversely associated with dis-ease risk even when vitamin C intake was un-related to the etiology of disease. To the extent that the marker is interpreted purely as a measurement of vitamin C intake level, the estimated relation-ship between marker and disease risk must then also be considered to be confounded by smoking. Again, however, as part of the variation in the marker may actually reflect the vitamin C-lower-ing effects of smoking rather than vitamin C
121

Appücation of Biomarkera in Cancer Epidemiology
intake, one can argue that the interpretation of the marker purely as a measurement of vitamin C intake level is simply invalid. To avoid such ambi-guities in interpretation, it seems conceptually more appropriate to consider the marker as an intermediate variable that is determined by dietary variables of interest together with various inter-vening factors, and at the same time as a de-terminant of disease risk. Under this alternative view the relationship between vitamin C intake and the plasma concentration of vitamin C as an intermediate (outcome) variable is confounded by smoking, but not necessarily the relation-ship between disease risk and plasma vitamin C as an indicator of vitamin C status, which could actually be a valid reflection of the relationship between the biological availability of vitamin C and disease risk.
summary and concluding remarks Biomarkers as a measurement of dietary intake level can be useful when estimated intake levels of foods obtained from questionnaires or from records or short-term recalls of food consumption cannot be translated reliably into intake levels of specific compounds, for instance because of a lack of accurate food composition tables. In addition, even when dietary intake levels can be assessed with reasonable accuracy by means of a question-naire, or by keeping records of actual food con-sumption, a marker can be a useful complemen-tary measurement given that its random errors are likely to be truly independent of those of the first two categories of measurement. Thus, markers can be useful, especially in dietary validity studies, to estimate the average magnitude of systematic and random errors of dietary exposure measurements, as obtained in an epidemiological study. Knowledge of the average magnitude of such errors allows cor-rection for bias in relative risk estimates. А limitation of most markers as indicators of
diet is that, at the very best, they can only provide an estimate of relative ranking of individuals by intake level, but cannot be translated into absolute intakes on a valid scale. This limitation is generally present when the marker is based on measurement of a concentration of a compound, rather than on the recovery over time of a compound in excretion products, and will be shared by many biomarkers
that are currently being developed (e.g. biomarkers for intake of bioflavonoids, induIes or phytoestro-gens from certain plant foods, or for intake of aro-matic amines formed during cooking of meat or fish). In validity sub-studies, as well as in full-scale epidemiological studies of diet—disease relation-ships, this limitation can be overcome if another type of measurement is available (e.g. weighed food consumption records) which does provide estimates of intake level on an approximately valid scale. In theory, a few markers that can be translated into correctly scaled, absolute daily intake levels (e.g. 24-h urinary nitrogen excretion to estimate daily protein intake) could also be used as a refer-ence measurement for caIibrаtion substudies. The latter can be used to adjust for bias in relative risks estimated for absolute, quantitative differences in dietary intake level (rather than between different quantile levels of the intake distribution) (Kaaks et al., 1995), and can improve the comparability of dietary intake measurements between different study cohorts (Kaaks et al., 1994b; Plummer et al., 1994).
As described in this chapter, there can be many applications of biomarkers as indicators of diet in epidemiological studies. Nevertheless, some words of caution may be needed against overenthusiasm in favour of markers as the solution to the prob-lems of mismeasurement of dietary intake levels by moie traditional methods (questionnaires, food consumption records, short-term recalls). Results from many studies suggest that correlations be-tween biomarkers and true intake levels of specific dietary constituents are generally not substantially higher (in fact, they are often lower) than those for the more traditional types of measurement, and even the reproducibility of markers can be relatively low. The rather low reliability of many markers may be due partly to a comparatively large intra-individual variation in true intake level ovei time and relatively fast metabolic turnover rates of given dietary compound, or may partly be explained by the effects of intervening variables that affect the validity of the marker as a measure of diet. Another aspect that may explain the low reproducibility of a marker are errors in measure-ments due to inaccuracy of laboratory techniques. Because of random measurement errors, and irre-spective of the type of application of markers in
122

Biochemical markers of dietary intake
nutritional epidemiology—as an independent pre-dictor of disease risk, or as an additional measure-ment of intake level in combination with more tra-ditional measurements of diet—the statistical power of studies using markers will be low unless they include very large numbers of subjects.
Strong caution must also be exercised against overinterpтetatioп (unjustified extrapolation) of the results of epidemiological studies based on markers, in that it may not be entirely clear which type of intake variable is specifically represented by a marker. For example, in several observational (epidemiological) studies, lung cancer risk was found to be associated inversely with plasma levels of ft-carotene (ATBG, 1994; Omenn et aI., 1994) and this seemed to confirm results showing simi-lar inverse associations with intake levels of 3-carotene as measured by dietary questionnaires. Nevertheless, in the Finnish ATBC trial and in the CARET trial, supplementation with ft-carotene (at supraphysiological doses) led to a significant increase, instead of the expected decrease, in lung cancer risk. These conflicting results suggest that the decrease in lung cancer risk observed in epi-demiological studies may have been attributed wrongly to 3-carotene per se, and that high esti-mated intake levels of p-carotene or high measured plasma concentrations were actually indicators of other protective factors, e.g. associated with a high intake of vegetables and fruits (although an alter-native interpretation of these studies may be that ft-carotene at physiological doses does actually confer some protection against lung cancer but that supraphysiological doses are harmful).
This example shows that, in spite of a greater apparent specificity as a measurement of the rela-tive intake level of a given dietary constituent, bio-markers in many (if not most) cases may only be interpreted as indicators of more complex dietary risk factors. Indeed, there is increasing awareness that it may be more appropriate to search for patterns of dietary risk factors associated with increased risk. In future studies, different markers combined may be used as indicators (`markers' in the true sense) of such more complex patterns.
Acknowledgements We thank Dr David Hunter, Harvard Sсhool of Public Health, for reviewing this manuscript and for his helpful comments.
References Alpha-Tocopherol, Beta-Carotene Cancer Prevention Study Group (ATBC) (1994) The effect of vitamin E and beta-carotene on the incidence of lung cancer and other cancers in male smokers. N. Engl. J. Mcd., 330, 1029-1035
Ascherio, A., Stamрfеr, M.J., Colditz, G.A., Rimm, E.B., Litin, L, & Willel, W.C. (1992) Correlations of vitamin A and E intakes with the plasma concentrations of carotenoids and tocopherols among American men and women. J. Nutr., 122, 1792-1801
Berg, J.P., Glattre, E., Haldorsen, T., Hostmark, A.T, Bay, LG., Johansen, A.F. & Je11um, E. (1994) Longchain serum fatty acids and risk of thyroid cancer: a population-based case-control study in Norway. Cancer Causes Control, 5, 433-439
Beixjno, F., loti, P., Micheli, A., Bolelli, G., Krogh, V., Sciajrio, R., Pisani, P, Panico, S. & Secreto, G. (1996) Serum sep hormone levels after menopause and subse-quent breast cancer. J. Nat! Cancer Inst , 88, 291--296
Bingham, S.A. & Cummings, J.H. (1985) Urine nitrogen as an independent validatory measure of dietary intake: a study of nitrogen balance in individuals consuming their normal diet. Am. J. Clin. Nufr., 42, 1276-1289
Bingham, S.A. & Cummings, J.H. (1986) Creatinine and РАBА as markers for completeness of collection of 24-hour urine samples. Horn. Noir. Clin. Nutr., 40, 473-476
Biugham, S.A., Cassidy, A., Cole, T.J., Welch, A., Runswick, S.A., Black, А.E., Thurnham, D., Bates, C., Khaw, K.T., Key, Т.J. & Day, N.E. (1995) Validation of weighed records and other methods of dietary assess-ment using the 24-hour urine nitrogen technique and other biological markers. Br. J. Nutr., 73, 531-550
Bingham, S.A., Murphy, J., Waller, E., Runswick, S.A., Neale, G., Evans, D. & Cummings, J.Н. (1992) Para-amino benzoic acid in the assessment of completeness of 24-hour urine. Collections from hospital outpatients and the effect of impaired renal function. Eur. J. Clin. Nutr. 1992, 46, 131-135
Cameron, M.E. & van Staveren, W.A. (1988) Manual on Methodology for Food Consumption Studies, Oxford, Oxford University Press
Campbell, Л.R., Gross, M.D., Martini, M.F.C. Grandits, G.А., Slavin, J,L & Potter, J.D. (1994) Plasma carotenoids as biomarkers of vegetable and fruit intake. Cancer Epidemiol. Biomarkers Prey., 3, 493-500
Coates, R.J., Eley, J.W., Block, G., Gunter, E.W., Sowell, A.L., Grossman, C. & Greenberg, Es. (1991) An evaluation of a food frequency questionnaire for assessing dietary intake of specific carotenoids and vitamin E among low-income black women. Am. J. Epiderniol. 134, 658-671
123

Application of Biomarkors in Cancer Epidemiology
de Kierk, N.H., English, D.R. & Armstrong, B.K. (1989) A review of the effects of random measurement error on relative risk estimates in epidemiological studies. Jot. J. EpidemioL, 18, 705-712
Donovan, U.M. &c Gibson ~.S. (1995) Iron and zinc sta-tus of young women aged 14 to 19 years consuming veg-etarian and omnivorous diets. J. Am. Coil. Nutr., 14, 463-472
Enger, S.M., Longnecker, M.R, Shikany, J.M., Swenseid, M.E., Chef, M., Harper, J.M. & Haile, R.W. (1995) Questionnaire assessement of intake of specific сатоtе-noids. Cancer EpidemioL Biomarkers Prev., 4, 201-205
Feunekes, G.I.J., Van Staveren, W.A., De Vnies J.H.M. Burema, J. & Hautvast J.G.A.J.(1993) Relative and bio-marker-based validity of a food-frequency questionnaire estimating intake of fats and cholesterol 1-3. Am. J. Clin. Nutr., 58, 489-496
Gann, P.H., lennekens, C.Н., Sacks, F.M., Grodstein, F., Giovannucci, E.L. & Stampfer, M.J. (1994) Prospective study of plasma fatty acids and risk of prostate cancer. J. Natl Cancerinst., 86, 281-286
Garland, M., Willett, W.C., Manson, J.Е. & Hunter D.J. (1993) Antioxidant micronutrients and breast cancer. J. Am. СаII. Nutr., 12, 400-411
Guengeiich, EP, (1995) Influence of nutrients and other dietary materials on cytochrome P-450 enzymes. Am. J. Clin. Nutr 61, 651S-65В$
Hebert, J.R., Hигlеy, T.G., Hsieh, J., Rogers, E., Stoddard, A.М., Sorensen, G. & Nicolosr, R.J. (1994) Determinants of plasma vitamins and lipids: the working well study. Am. J. Eрideтiol. 140, 132-147
Hunter, D. (1990) Biochemical indicators of dietary intake. In: Willett, W., cd., Nиtnhоnц Epidemiology, New York, Oxford University Press, pp. 375-418
Hunter, D.J. & Kelsey, К.T (1993) Pesticide residues and breast cancer: the harvest of a silent spring? J. Nat! Cancer Inst., 85, 598-599
Hunter, D.]., Rimm, E.В., Sacks, F.M., Stampfer, M.J., Colditz, G.A., Litin, L.В. & Willett, W.C. (1992) Comparison of measures of fatty acid intake by subcuta-neous fat aspirate, food frequency questionnaire, and diet records in a free-living population of Us men. Am, J. EpidemioL, 135, 418-427
Jacques, EF,, Sulsky, S.I., Sadowski, J.А., Phillips, C.C., Rush, D. & Willett, W.C. (1993) Comparison of micronu-trient intake measured by a dietary questionnaire and biochemical indicators of micronutrient status. Am. J. CIin. Nutr., 57, 182-189
Kaaks, R. (1997) Bionnarkers as an additional measure-ment in studies on the accuracy of dietary questionnaire
measurements. Am. J. Clin. Nutr. (in press)
Kaaks, R. Plummer, M., Riboli, E., Estève, J, & van 5taveren, W. (1994b) Adjustment for bias due to errors in exposure assessments in multicenter cohort studies on diet and cancer: a calibration approach. Am. J. Clin. Nutr., 59,2455-2505
Kaaks, R., Riboli, E., Estève, J., van Kappel, A.L. & van Staveren W.A. (1994а) Estimating the accuracy of dietary questionnaire assessments: validation in terms of struc-tural equation models. Stat. Med., 13, 127-142
Kaaks, R., Riboli, E. & van Stаveren, W. (1995) Calibration of dietary intake measurements in prospec-tive cohort studies. Am. J. EpidemioL, 142, 548-556
Kabuto, M., Imai, H., Yonezawa, C., Neriishi, K., Akiba, S., Kato, H., Suzuki, T., Land, С.E. & Blot, W.J. (1994) Prediagnostic serum selenium and zinc levels and subse-quent risk of lung and stomach cancer in Japan. Cancer Epidemiol. Biomarkers Prey., 3, 465-469
Kardinaal, A.F.M., van't Veer, P., Brants 13.4.1., van den Berg,H., van Schoorihoven, J. & Hermus R.J.J. (1995) Relations between antioxidant vitamins in adipose tis-sue, plasma, and diet. Am. J. ЕрiдетиоL,141, 440-450
London, 5.J., Sacks, EM., Caesar, J., Stampfer, M.J., Siguel, E. & Willett, W.C. (1991) Fatty acid composition of sub-cutaneous adipose tissue and diet in postmenopausal Us women. Am. J. СIiп. Nutr., 54, 340-345
London, S.J., Stein, Е.А., Henderson, I.C., Stampfer, М.J., Wood, W.C., Remisse, S., Dmochowski, J.R., Robert, N.J. & Willett, W.C. (1992) Carotenoids, retinol, and vitamin E and risk of proliferative benign breast disease and breast cancer. Cancer Causes Control, 3, 503-512
Ma, J., Folsom, A.R., Shahar, E. & Eckfeldt, J.H., for the Atherosclerosis Risk in Communities (ARIL) Study Investigators (1995) Plasma fatty acid composition as an indicator of habitual dietary fat intake in middle-aged adults. Am. J. Clin. Nutr., 62, 564-571
Matkovic, V., I1ich, J.Z., Andin, M.B., Hsieh, L.C., Tzagournis, M.А., Lagger, B.J. & Goe1, P.K. (1995) Urinary caldum, sodium, and bone mass of young females. Am. J. Clin. Nutr., 62, 417-425
O'Donnell, M.G., Nelson, M., Wise, P.H. & Walker, D.M. (1991) A computerized diet questionnaire for use in diet health education 1. Development aid validation. Br. J. Nutr., 66, 3-15
Omenn, G.5., Goodman, G.E., Thornquist, M.D., Balmes J., Cullen, M.R., Glass, A., Keogh, J.P., Keyskens, F.L., Valanis, B., Williams, J.Н., Barnhart, 5. & lammar, S. (1996) Effects of a combination of beta carotene and vit-amin A on lung cancer and cardiovascular disease. New Engl. J. Med., 334, 1150-1155
124

Biochemical markers of dietary intake
Рlиттеr, M. & Clayton, D. (1993а) Meаsшement error Schoeller, D.А. (1988) Measurement of energy expendi-in dietary assessment: an investigation using covariance tore in free-living humans by using doubly labeled watec structure models. Part I. Stаt. Med., 12, 925-935 J. Nutr., 118, 1278-1289
Plummer, M. & Clayton, D. (1993Ь) Measurement error Shaw, N.S., Chin, C". Fr Pan, W.H. (1995) A vegetarian in dietary assessment: an investigation using covariance diet rich in soybean products compromises iron status in structure models. Part I. Stat. Med., 12, 937-948 young students. J. Nutr., 125, 212-219
Рlиттег, M., Clayton, D. & Kaaks, R. (1994) Calibration in multi-centre cohort studies. Int. J. EpidemioL, 23, 419-426
Porrini, M., Gentile, M.G. & Fidanza, F. (1995) Biochemical validation of a self-administered semi-quantitative food-frequency questionnaire. Br. J. Nutr. 74, 323-333
Preobrazhenskaya, M.N., Bukhman, V.M., Korolev, А.1. & Efimov, S.A. (1993) Ascorbigen and other indole-derived compounds from Brassica vegetables and their analogs as anticarcfnogenic and immunomodulating agents. PhannacoI. Ther., 60, 301-313
Riboli, E. & Kaaks, R. (1996) The EPIC project: rationale and study design. Iot. J. Epidemiol. (in press)
Riboli, E., Rdnпholm, H., Saracci, R. (1987) Biological markers of diet. Cancer Surv., 6, 685-7 18
Riboli, E., Еlmstâhl, S., Saracci, R., Gullberg, B. & Lindgârde, R (1997) The Malmd food study: validity of two dietary assessment methods for measuring nutrient intake. Int. J. Eрidеmiol. (in press)
Roidt, L., White, E., Goodman, GE, Wahl, P.W., Omenn, G.S., Rollins, B. & Karkeck, J.M. (1988) Association of food fre-quency questionnaire estimates of vitamin A intake with serum vitamin A levels. Am. J. E idemioL, 128, 645-654
Romieu, I., Stamfer, M.J., Stryker, W.S., Hernandez, M., Kaplan, L., Sober, A., Rosner, B. & Willett, W.C. (1990) Food predictors of beta-carotene and alpha-tocopherol: validation of a food frequency questionnaire. Am. J. E iдетioL, 131, 864-876
Rosner, B. & Willett, W.C. (1988) Interval estimates for correlation coefficients corrected for within-person vari-ation: implications for study design and hypothesis test-ing. Am. J. Eрidemiol., 127, 377-386
Ross, M.A., Crosley, L.К., Brown, K.M., Duthie, 5.3., Collins, A.C., Arethur, J.R. & Duthie, G.G. (1995) Plasma concentrations of carotenoids and antioxidant vitamins in Scottish males: influences of smoking. Era. J. Clin. Nutr, 49, 861-865
Saiдtot, M., Astre, C., 5cali, J. & Gerber, M. (1995) Within-subjects seasonal variation and determinants of inter-individual variations of plasma beta-carotene. Int. J. Vitam. Nutr. Res., 65, 169-174
Schectman, G., Byrd, J.D. & Gris chow, 11.W. (1989) The influence of smoking on vitamin C status in adults. Ans. J. Public Health, 79, 158-162
Sinha, R., Block, G. & Taylor, P.R. (1992) Determinants of plasma ascorbic acid in a healthy male population. Cancer Epidemiol. Biomarkers Prey., 1, 297-302
Sinha, R., Frey, C.M., Kammerer, W.G., IcAdams, M.J., Norkus, E.P. & Zeigler, R.G. (1994) lmportancе of sup-plemental vitamin C in determining serum ascorbic acid in controls from a cervical cancer case-control study: Implications for epidemiological studies. Nutr. Cancer, 22, 207-217
Sinha, R., Patterson, B., Mange's, A.R., Levander, O.A., Gibson, T., Taylor, P.R. & Block, G. (1993) Determinants of plasma vitamin E in healthy males. Cancer Epidemiol. Biomarkers Prev., 2, 473-479
Sinha, R., Rothman, N., Brown, E.D., Salmon, C.P., Knize, M.G., Swanson., С.А., Rossi, S.С., Mark, S.D., Levander, O.A. & Felton, J.S. (1995) High concentrations of the car-cinogen 2-amino-1-methyl-6-phenylimidazo-[4,5-b]pyri-dine (PhIP) occur in chicken but are dependent on the cooking method. Cancer Res., 55, 4516-4519
Skog, K., Steineck, G., Augustsson, K. & Jagerstad, M. (1995) Effect of cooking temperature on the formation of heterocyclic amines in fried meat products and pan residues. Carsrinogenesls, 16, 861-867
Snook, J.T., Palmquist, D.L., Moxon, A.L., Cantor, A.H. & Vivian, V.M. (1983) Selenium status of a rural (predomi-nantly Amish) community living in a low-selenium area. Am. J. Clin. Nutr., 38, 620-630
Stielin, H.S., Gey, K.F., Eichholzer, M., Ludin, E., Bernasconi, F., Thurneysen, J. & Brubacher, G. (1991) Plasma antioxidant vitamins and subsequent cancer mortality in the 12-year follow-up of the prospective Basel Study. Ans. J. Epidemiol., 133, 766-775
5teirnmetz, K.A. & Potter, J.D. (1991) Vegetables, fruit, and cancer. II. Mechanisms. Cancer Causes Coпtroi, 2, 427-442
Stryker, W.S., Kaplan, L.A., Stein, Е.~., Stampfer, M.J., Sober, A. & Willett, W.C. (1988) The relation of diet, cig-arette smoking, and alcohol consumption to plasma beta-carotene and alpha-tocopherol levels. Am. J. Epidemiol., 127, 283-296
Subar, А.F., Harlan, L.C. & Mattson, M.E. (1990) Food and nutrient intake differences between smokers and non-smokers in the US. Am. J. Public Health, 80, 1323-1329
125

Application of Biomarkers in Cancer Epidemiology
Swanson, C.A. Longnecker, M.P., Veillon, C., Howe, S.M., Levander, O.А., Taylor, P.R., IcAdam, P.A., Brown, C.C., Stampfer & 1J., Willett, W.C. (1990) Selenium intake, age, gender, and smoking in relation to indices of sele-nium status of adults residing in a selenifezous area. Am. J. Clin. Noir., 52, 858-862
Tappia, P.S., Troughton, K.L., Langley-Evans, S.C. & Grjmble, R.F. (1995) Cigarette smoking influences cytokine production and antioxidant defences. Clin. Sci. Coach., 88, 485-489
Tjenneland, A., Overad, K., Thorling, E. & Ewertz, M. (1993) Adipose tissue fatty acids as biomarkers of dietary exposure in Danish men and women. J. CIiп. Nutr., 57, 629-633
Toniolo, P.G., Levitz, M., Selеniuch Jaсquotte, A., Bаnerjее, S., Koenig, K.L., Shore, R.E., Strax, P. & Pasternack, B.S. (1995) A prospective study of endogenous estrogens and breast cancer in postmenopausal women. J. Natl Cancer Inst., 87, 190--197
U1trеy, D.E. (1981) Selenium in the soil-plant-food chain. In: Spa11holtz, J.E. et al., eds., Selenium in Biology and Medicine, Westport, CT, AVI Publishing, pp. 176-191
Tribble, D.L., Guiliana, L.J. & Fortmann, S.P. (1993) Reduced plasma ascorbic acid concentrations in non-smokers regularly exposed to environmental tobacco smoke. Am. J. Clin. Nulr., 58, 886-890
van den Brandt, P.А., GoIdbohm, R.A., van't Veer, P., Bode, P., Dorant, E., Hermus, R.J. & Sturman, F. (1993) A prospective cohort study on selenium status and the risk of lung cancer. Cancer Res., 53: 4860-4665
van Staveren, W.A., Deurenberg, P., Katan, М.B., Burema, J., de Groot, L.C. & Hoffmans, M.D. (1986) Validity of the fatty acid composition of subcutaneous fat tissue microbiopsies as an estimate of the long-term average fatty add composition of the diet of separate individuals. Am. J. Epiдemio1,,123, 455-463
van't Veer, P., Widen, V.D., Kok, F.J., Hermus, R.J,J. & Sturmans, F. (1990) Selenium in diet, blood, and toenails in relation to breast cancer: А case-control study. Am. J. Epidemiol., 131, 987-994
van't Veer, P., Eardtnaal, A.F., Bausch-Goldbohm, R.A. & Kok, F.J. (1993) Biomarkers for validation. Eur. J. Clin. Nutr., 47 (Suppl. 2), 558-563
Wattenberg, L, W. (1992) IпЫbitioп of carcinogenesis by minor dietary constituents. Cancer Res., 52, 20855-20915
Wild, J., Seller, M.J., Schoгah, С.J. & Smithells, R.W. (1994) Investigation of folate intake and metabolism in women who have had two pregnancies complicated by neural tube defects. Br. J. Obstet. Gynaccol., 101, 197-202
Willett, W.C. (1990a) Food frequency methods. Iп: Willett, W., cd., Nutritional Epidemiology, New York, Oxford University Press, pp. 69-91
Willett, W.C. (1990b) Reproducibility and validity of food frequency questionnaires. In: Willett, W., cd., Nutritional Epidemiology, New York, Oxford University Press, pp. 92-126
Williams, D.R. & Bingham, S.A. (1986) Sodium and potas-sium intakes in a representative population sample: esti-mation from 24 h urine coilections known to be com-plete in a Cambridgeshire village. Br. J. Nutr., 55, 13-22
Witschi, J.C. (1990) Short-term dietary recall and record-ing methods. In: Willett, W. ed., Nutritional Epidemiology, New York, Oxford University Press, pp, 52-68
Yang, G., Zhou, R., Yin, S., Gu, L., Yan, B., Liu, Y., Liu, Y. & Li, X. (1989) Stцdies of safe maximal daily dietary sele-nium intake in a seleniferous area in China. L Selenium intake and tissue selenium levels of the inhabitants. J. Trace EIem. Electrolytes Health Dis., 3, 77-87
Yong, L.C., Forman, M.R., Beecher, G.A., Graubard, B.I., Campbell, W.S., Reichman, M.E., Taylor, P.R., Lanza, E., Holden, J.М. & Judd, J.T. (1994) Relationship between dietary intake and plasma concentrations of carotenoids in premenopausal women: application of the USDA-NC' carotenoid food-composition database. Am. J. Clin. NuIr., 60, 223-230
Zheng,W., Blot, W.J., Diamond, E.L., Norkus, E.P,, Spate, V., Minis, J.5. & Comstock, G.W. (1993) Serum micronu-trients and the subsequent risk of oral arid pharyngeal cancer. Cancer Res. 53, 795-798
Corresponding author R. Kaaks Unit of Nutrition and Cancer, International Agency for Research on Cancer, 150 cours Albert Thomas, 69372 Lyon Cedex 8, France
126

Application o1 Biomorkera iп Cancer Epidemiology Toninl , P., Boffotla, P., 5huker, D.E.G., Ro mаn, N., Ни1Ка, 6, arid Pearce, N., eds
1ARC Scientific Pubications No. 142 Iriternalionol Agency for Research on Cancer, Lyon, 1997
Biomarkers for biological agents N. Mur"toz and F.X. Bosch
Biomarkers of exposure to biological agents have proved to be extremely useful in establishing causal associations between infections and human cancer, as well as in tracing the natural history of the relevant agents.This chapter will focus on biomarkers for biological agents currently recognized as causally associated with various human cancers after evaluation at the IARC.These are human papillomavirus (HPV), hepatitis B (IBV) and C virus (1CV) and Helicobacterpylori.
A prototype of nucleic-acid-based biomarkers is detection of HPV DNA. It measures the presence of type-specific DNA at a given point in time. PCR-based assays are considered the method of choice for epidemiological investigations. The test requires collection of exfoliated cells or biopsies. 5pеcimens can be kept stored at -20°C for long periods of time. DNA degradation is low. Some of the limitations of the marker for cancer epidemiology lie in the fact that IPV DNA infections are often transient, especially in young women. In repeated measurements, HPV DNA may fluctuate, but the reasons for this are unknown.
Antigens and antibodies from the IBV and HCV can be viewed as prototypes for serological biomarkers. Fог IBV, there are markers able to distinguish between past and persistent infections. IBV DNA detection in sera further refines the assessment of exposure. 5tапdaгdizеd serological assays are available and widely used in developing countries, For HCV antibodies, serological assays are standardized and widely available. RNA detection in sera by PCR is under development. A limitation of the currently available assays is the type and subtype variation of HCV by geography, which requires further research and standardization. In low-risk populations, numerous false-positive results arise and confirmatory tests are required.
Biomarkers of exposure to biological agents have proven to be extremely useful in establishing causal associations between infectious agents and human cancer, as well as in tracing the natuial his-tory of the relevant agents. This chapter will focus in biomarkers for biological agents currently rec-ognized as causally associated with various human cancers after evaluation at the International Agency for Research on Cancer (IАRС). These are human papillomavirus (HPV) (IARC, 1995), hepatitis B (HBV) and C virus (HCV) ('ARC, I 994а) and Helicobacter pylori (‚ARC, 1994b).
HPV and cervical cancer Over 75 types of I-{PV have so far been identified. One of the most common methods of virus detec-tion, namely the isolation of virus in tissue culture, is not available for HPVs because HPVs cannot be propagated in culture. The presence of the virus can be inferred from clinical, cytological, histolog-ical or serological findings, but the most accurate methods are based on the demonstration of HPV DNA in cells and, to a lesser extent, on the identi-
fication of viral proteins in the cells. Serological assays, currently under development, could be of great help in epidemiological studies as they might be able to assess cumulative lifetime exposure or at least recent, as opposed to just current, infecLion. The colposcopic, cytological and histological diagnoses of HPV are not very reflable as they lack sensitivity and specificity (Barrasse, 1992; Sherman et aL, 1994) and as such have very limited use in epidemiolog ical studies. Likewise, the identification of viral proteins such as HPV capsid antigens in infected cells is also of limited epidemiological value as they can only be detected in the case of productive HPV infection. These methods will not be discussed here. We will concentrate on methods for HPV DNA detection and on serological markers of HPV.
Methods for HPV DNA detection HPV DNA detection methods have been developed most extensively for genital tract HPVs, because these infections have been linked to cervical can-cer. Of the 30-40 HPVs that infect the genital tract, some types (e.g. HPV types 16, 18, 45, 31 and 33)
127

Application of Biomaгkетs in Cancer Epidemiology
are closely associated with cervical cancers, whereas others (e.g. HPV types 6, 11, 42, 43, 44) are rarely found in cancers. Therefore, in clinical and epidemiological investigations, HPV diagnosis aims at identification of specific types of HPVs and at separating cancer-associated HPVs from low-risk HPVs.
Two types of 11W DNA hybridization methods are currently used with aid without amplifica-tion. In the former, targeted viral sequences are first amplified by polymerase chain reaction (PCR) and then identified by hybridization assays. Most authors would consider PCR methods as the cur-rent standard for epidemiological studies. These methods have been reviewed recently (Gravitt & Manos, 1992; Walboomers et al., 1994) and sum-marized in IARC (1995).
Serological assays are still under development. Currently, ELISA (enzyme-linked immunoab-sorbent assay) antibody assays using virus-like par-ticles as the antigen appear to be the most promising and have raised high expectations. However, the antibody response is low-titred and not detectable in all patients with documented infections. Likewise, at present, antibodies to E6 and Е7 proteins are the most promising markers of HPV-associated invasive cancer.
Logistics of sample collection, processing and storage Exfoliated cells can be collected from easily acces-sible sites such as uterine cervix, penis, bladder or oral саvity but collection from other organs such as oesophagus, stomach or lung requires invasive pro-cedures, i.e. endoscopy. Various methods are used to collect exfoliated cells: swabs, scrapes, brushings, lavages and urinary sediments. Tissue specimens are obtained from biopsies or surgical specimens and therefore only from subjects with disease. Ethical restriction on taking biopsies from healthy individuals precludes the use of tissue specimens in control subjects.
Whatever the specimen, the major drawback of PCR-based methods is the risk of contamination as a result of the high sensitivity of these methods. The entire process (from sample collection to the PCR assay) is susceptible to contamination. Thus, it is recommended that strict negative controls be strategically interspersed during every step of the assay (Gravitt & Manos, 1992).
Sources of variability High interlaboratory variability has been reported for FISH, Southern blot and the Hybrid CaptureT1 assay. There is a significant interlaboratory varia-tion in detection and typing of HPVs by Southern hybridization. In a study of 40 clinical samples, pairwise agreement between four laboratories ranged from 66 to 97% for HPV detection, and from 77 to 96% for typing of positive specimens (Brandsma et aI., 1989).
Iп a study of interlaboratory variation in Hybrid Capture results in three laboratories, specimens were tested with probe pools A and B. Kappa values in interlaboratory pairwise comparisons for posi-tivity to either group A or group B ranged from 0.61 to 0.83. 0f specimens that were positive for group B by the reference standard, 74% were posi-tive for group B in all three laboratories. The inter-laboratory correlations of HPV quantitative data for probe B types ranged from 0.60 to 0.90. Probable false-positive results were occasionally encountered, in less than 3% of the tests (Schiffman et al., 1995).
Interlaboratory variation for two PCR-based methods using L1 consensus primers has been shown to be small ('sing et al., 1996).
HPV DNA detection in a single specimen mea-sures the presence of the virus at a given point in time, which is clearly different from assessing life-time exposure to HPV At present, there are rio reli-аЫе methods (hybridization or serological) to mea-sure 1-IPV lifetime exposure or to distinguish tran-sient from persistent HPV infections other than repeated HPV DNA detection.
HPV types are defined by genomic analysis and therefore represent genotypes. At present, an 11W genome is described as a new HPV type if the nucleotide sequences of its Еб, Е7 and L1 genes (about one-third of the genome) differ by more than 10% from those of any previously described HPV type. Although this definition was established arbitrarily, it appears to be sufficient to define the five natural taxonomic units. HPV types differing by 2-10% are called subtypes and those differing by less than 2% are called variants. Short-terпt longitu-dinal studies, such as those aimed at determining the natural history of HPV infections, ideally should rely on the identification of variants, but genome sequencing is too time-consuming and costly to be applied to large-scale epidemiological studies.
128

8iomarkers for biolog"scal agents
Applications of the biomarker in eрidеэluо1ogiсal studies Biornarker as the end-point Natural history of HPV infections. Prevalence surveys of HPV DNA in various populations have shown that most HPV infections are latent or subclinical, as most individuals in whom HPV DNA is detected do not develop signs or symptoms. Short-term longitu-dinal studies have shown that most HPV infections are transient, especially at younger ages, and that per-sistent infections, although less common, pose a higher risk of pre-neoplastic lesions.
Transmission studies. Results from various longitu-dinal studies indicate that genital HPVs are trans-mitted primarily through contact with infected tis-sues during sexual intercourse. Infections of the oropharynx and larynx may be related to orogenital contact, and mother to infant transmission has been proposed to explain recunent respiratory papillomatosis in infants and children.
Use of biomarker in case—control/prospective cohort studies of cervical cancer The epidentiological evidence indicating that some HPV types are human carcinogens at least for the uterine cervix is compelling and it is based on an impressive and largely consistent set 0f case series and case—control studies and some cohort studies ('ARC, 1995).
Case series from many populations around the world have shown the presence of HPV DNA in the majority of high-grade CIN lesions (CIN II—III) and cervical carcinomas. In the largest study, in which about 1000 invasive cancer specimens were analysed in a single laboratory using a reliable PCR-based assay, a prevalence of 93% was found, with no significant geographical variation in over-аll positivity. HPV 16 was present in 50% of the specimens, HPV 18 in 14%, HPV 45 in 8% and HPV 31 in 5% (Bosch et aI., 1995).
Case—control studies. Although a large number of studies have been published, only 10 fulfil the epi-demiological requirements of a case—control study and have used accurate HPV DNA assays. Six were on high-grade CIN lesions and four were on inva-sive cervical cancer, In all of them, a strong associ-ation with certain HPV types (16, 18, 31, 33, 35) was detected, with odds ratios (ORs) ranging from
15 to 73 foi high-grade CIN, and 15 to 46 for inva-sive cervical cancer (Munoz & Bosch, 1996).
Serological assays using various early or late HPV antigens have shown that, in general, anti-body responses are higher in women with cervical neoplasia than among control women, but the magnitudes of the ORs are lower than those based on HPV DNA detection (Dinner, 1994).
Cohort studies. Several cohort studies have been reported, but only three have used high-grade CIN as the end-point and accurate methods of HPV DNA detection. All of them suggest that persistent infection with high-risk HPV types precedes the development of high-grade CIN (Munoz & Bosch, 1996). Recent observations suggest that persistent HPV infection, particularly with a high viral load, is a predictor of progression to advanced CIN, although the truly prospective estimates were low (Ho eta!,, 1995).
An association between HPV and other anogen-ital cancers (cancers of the anus, penis and vulva) has been reported in a few case—control studies and has been suggested for cancers of the upper aerodi-gestive tract (IARC, 1995).
Limitations of the evidence. Case—control studies suf-fer from inherent temporal ambiguity concerning exposure and disease outcome. Thus, the higher prevalence of HPV DNA among cases than among controls could be interpreted in two ways. If we assume that a single measurement of HPV DNA is a good marker of cbronic persistent infection, HPV DNA detected at recruitment of cases and controls could be regarded as a marker of an HPV infection that preceded the cancer development. Alternatively, HPV DNA could be more readily detected in tumoral cells than in normal cells or could be a marker of an opportunistic infection with HPV.
Direct evidence in support of the first possibil-ity can only be derived from long-term follow-up studies, and few such studies are now available. In addition, indirect evidence may be obtained from the trend of HPV DNA prevalence by time since last sexual intercourse, because the major route of transmission is sexual. Data from studies in Spain and Colombia show a stable high rate of 12V DNA positivity both in women with cervical cancer who reported being sexually active at the time of the interview and in women who had their last sexual
129

Application of Biomarkers in Cancer Epidemiology
intercourse many years before entry into the study (Munoz et al., 1992; Bosch et al., 1993).
The possibility of enhanced detectability in tumoral cells is unlikely, because the HPV DNA prevalence in precursor lesions (CIN II—III) is as high as in invasive cervical cancer. Running con-trary to the argument that 12V is an opportunistic infection is a great deal of laboratory data indicat-ing that DNA and transcripts of specific HPV types are usually detected in tissue specimens from cer-vical cancer and its precursor lesions, and that high-risk HPVs are able to immortalize human cells arid their oncoproteins are able to interfere with the functions of negative cellular regulators.
Results from case—control studies and our inter-national prevalence survey of HPV DNA in inva-sive cervical cancer indicate that over 95% of these tumours can be attributed to certain HPV types. The fact that only a small minority of the persis-tent HPV infections progress eventually to cancer indicates that there must be othei factors or cofactors that increase the progression rate to malignancy.
Two types of cofactors may be of importance:
• Host factors that modulate the effect of HPV, such as genetic factors [HLA or major histo-compatibility complex (МНС) haplotypes], genetic or induced immunosuppression, endogenous hormonal factors, reflected in the associations with high parity detected in our studies, as well as early age at first sexual inter-course, which could be regarded as a surrogate of early age at first I-IPV infection. • Exogenous factors. In the studies in Spain, Colombia and Brazil, only long-term use of oral contraceptives emerged as a cofactor among HPV-positive women. However, our observa-tions need to be confirmed in other populations and in larger studies.
Future directions Epidemiological studies aimed at investigating the natural history of HPV infections (prevalence, inci-dence, persistence) and their role in various dis-eases rely on PCR-based assays. The two most widely used methods, which amplify a region of the L1 gene of genital HPVs (МУб9—МУ11 and GP5+/GP6+), need to be formally compared with each other and also with the recently described PCR-based assay that amplified Eб sequences of
genital HPVs (Lungu et cl., 1995). Standardized reagents for these three methods are needed. Although the two methods that amplify a region of the L2 gene are able to detect HPV DNA in over 90% of invasive cervical cancers, recent studies indicate the possibility that neither of these systems will readily detect some of the HPV intratypical variants of 12 genital HPVs (Stewart et al. 1996).
PCR-based assays in an ELISA format to distin-guish high-risk HPVs (16, 18, 31, 33, 35, 39, 45 51, 52, 54, 56 and 58) from low-risk HPVs (6, 11, 34, 40, 42, 43 and 44) have been developed (Tacobs et al., 1995) and are being commercialized. These methods will be of great help in screening programmes and clinical management of HPV-associated lesions and as a first step in epidemiological investigations.
The ELISA assay to detect antibodies to virus-like particles was, until recently, considered the most promising serological assay for the detection of HPV-specific antibodies. However, this assay appears to have low sensitivity and specificity, as antibodies are not detected in 25-50% of women with HPV I6-positive cervical cancers, and cross-reactivity with other HPV types has not yet been excluded. In addi-tion, the antibody response is low-titred and it declines with time. Accurate serological assays which aie able to distinguish past transient infections from persistent infections need to be developed.
Biomarkers for Helfcohacter pylori I-Ielicobacter pylori is a spiral or slightly curved Gram-negative bacterium that is uniquely adapted to survive the acidic environment of the stomach of humans and non-human primates. H. pylon strains are genetically heterogeneous, can be cultured in a microaerophilic environment, are sensitive to most antibiotics in vitro and are characterized by very strong crease activity. H. pylon is recognized as the main cause of gastritis and peptic ulcer, and has also been associated with stomach cancer and gastric lymphoma. Colonization of the gastric mucosa and subsequent development of gastritis are dependent on bacterial factors such as motility, strong unease activity aid specific adherence to gastric epithelium.
Methods for detection of H. pylori and some sources of variability Methods for detection of H. pylon infection have been summarized in 'ARC (1994b). In brief, these
130

Biomarkers for Ьiological agents
use as biological specimens gastric biopsies, smears on gastric material, gastric juice, breath tests and serology.
Gastric biopsies are collected before treatment from both the antrum and the corpus with stan- dard forceps and can be cultured after (1) placing them in saline (analysis within 4 h); (2) placing them iп transport medium (analysis after upto 24h); or (3) freezing them at —70°C or in liquid nitrogen (delayed analysis).
Methods based on biopsies include: (1) a rapid urease test; (2) histological examination stained with the standard haematoxylin-eosin or the mod- ified Giemsa stain; (3) bacteriological tests includ-ing Grain staining or culture; (4) PCR with primers that encode urease, 1БS ribosomal RNA or specific genes of pathogenic relevance, such as the cagA gene.
The techniques used for gastric biopsy speci-mens can also be used with gastric juice samples. Techniques based on faecal spedmens and cultures from dental plaque and saliva are still in an еаrlу stage of development.
Urea breath tests were developed taking advan-tage of the ability to hydrolyse urea by the strong urease of H. pylorL In the urea breath test, urea labeled with z3С02 is fed and subsequently elimi-nated in the breath. Breath samples are collected before and 30 min after absorption of labelled urea and analysed for 13С02 by mass spectrometry. High levels indicate infection. Similar tests involve the use of 14С-иxеа, as 14С02 can be measured easily with a scintillation counter, but some concern has been expressed over the use of a radioactive iso-tope. Low-dose tests are being developed to over-come this problem.
A variety of serological assays have been used, including complement fixation, haemagglutina- tion, bacterial agglutination, immunofluorescence and ELISA, which is currently the technique of choice.
Various ELISÂ commercial kits have been com-pared and large variations have been observed, especially when the assay was repeated on different days (Feldman & Evans 1995).
Currently, the most accurate 'gold standard' for a positive is probably culture supplemented with a histology or biopsy urease test. Iii epidemiological studies involving children, the breath test is usu-ally used as gold standard.
Applications of the biomarker in epidemiological studies Bromarker as the end-point Seroprevalence surveys have shown that H. pylon prevalence is highest in developing countries, where 80-90% of the population may be infected by early adulthood, whereas in developed сип tries, in the age group 25-34 years, the proportion of antibody-positives ranges from 10-60%. The prevalence increases gradually with age; it is higher in lower socio-economic groups and when crowd-ing in childhood is reported. Transmission occurs from person to person, but the exact mode has not been elucidated.
Use of biomakers in case—coлtrol/prospective cohort studies of gastric cancer The epidemiological evidence linking H. pylon to stomach cancer aid gastric lymphoma was sum-marized in IARC (1994b) as follows:
• Ecological studies. Six out of eight studies j1 which the prevalence of H. pylori was correlated with concurrent or earlier incidence or mortality from cancer of the stomach show no correlation between the two variables, and in the other two studies a weak correlation was observed. • Case series. In 10 case series of stomach cancer in which H. pylon was detected by histology, the proportion of positives ranged from 43 to 83%, and it was over 90% in two case series of gastric Iymphomas. • Case—control studies. At least 10 case—control studies have addressed the association between prevalence of H. pylon antibodies arid gastric cancer with inconsistent results. In low-risk countries for gastric cancer three out of four studies reported significantly increased risk with ORs around 2-3. In high-risk countries, four out of six studies have been negative (Mufioz & Pisani, 1994). •Cohort studies. Five case—control studies nested within cohorts have been reported, and in three of them an increased risk of gastric can-cer was observed, with prospective RRs ranging from 2.8 to 6.0, while the other two failed to show an association (Munoz & Pisani, 1994).
Although the working group at the LARC judged the available evidence as sufficient to classify
131

Application of Biomarkers in Cancer Epidemiology
H. руIoтi as carcinogenic to humans, it seems to us that the quality of most of the epidemiological studies evaluated is such that biases and confound-ing cannot be ruled out (Munoz & Pisani, 1994).
A recognized limitation of current serological methods of 1. pylori detection for epidemiological studies is that the amount of H. pylon antibodies may be affected by the presence of stomach cancer. It has been observed that H. pyioni does not colo-nize gastric mucosa that has undergone intestinal metaplasia. Thus, patients with gastric cancer showing extensive areas of intestinal metaplasia in the non-cancerous mucosa might have a low bac-terial load and, consequently, low titres of anti-bodies which may be difficult to detect.
Future directions It is possible that H. pylon strains prevalent in high-risk populations for stomach cancer differ anti-genically from those prevalent in low-risk areas. Thus, development of serological assays using anti-gens derived from local H. pylori strains and vali-dated in the populations under study should be encouraged.
In addition, two types of H. pylon strains are now recognized. Type 1 strains possess cagA (cytotoxin-associated gene A), a gene encoding a high-molecular-weight immunodominant antigen and vac A (vacuolating cytotoxia gene). Type II strains do not have cog A or vac A genes. Type I strains of H. pylon have been associated with an increased risk of gas-tric cancer, but also of duodenal ulcer and atrophic gastritis (Figura et at, 19$9; Fox et al., 1992; Blaser et al., 1995; Kuipers et al., 1995). ELISA serological assays to detect antibodies to cag A and vac A рrо-tein have been developed (Fox et at, 1992; Blazer et at, 1995), but have not yet been validated. These assays, once validated, may be of value in epi-demiological studies addressing the association between H. pylori and stomach cancer.
Hepatitis B viral markers Methods for HBV detection and гnterprelation of results HBV infections--acute, persistent or resolved—are detected on the basis of serological assays for viral antigens and antibodies, as well as detection of nucleic acids. In serum specimens, the most com-monly used markers in epidemiological studies related to liver cancer are the hepatitis B surface
antigen (HBsAg), the hepatitis B surface antibody (HBsAb), the hepatitis B core antibody (IBcAb), the hepatitis B e antigen (HBeAg) and the hepatitis B e antibody (iBeAb).
PCR technology is rapidly evolving and several methods and variants aie being proposed to increase the accuracy of detecting HBV markers and to introduce quantitative measurements of viral DNA (see recent examples in Gunther et al., 1995; Maia et al., 1995; Ranki et al., 1995). Other methods are being developed to amplify sequences of HBV and HCV simultaneously(Nedjar et al., 1994; Hu et al., 1995). If validated, these methods will make a remarkable contribution to field epidemiol-ogy. PCR also facilitates analysis of the sequence of the amplified genomes. PCR followed by sequenc-ing has also been used for subtyping HBV and for characterizing and identifying HSV mutants.
HBV is almost unique for cancer epidemiology in that typical patterns of serological markers in HBV infection have been described and are useful in interpreting HBV exposure (see Table 1).
Logistics of sample collection Blood samples are among the easiest specimens to collect in field studies. Preprocessing and long-term storage for HBц markers detection requires little more than standard laboratory equipment and –20°C freezers. Several of the assays described above are standardized, commercially available and rou-tinely used in blood banks and hospital laborato-ries. Technology transfer to developing countries ii Africa and Asia has been successfully achieved.
Sources of variation across studies Sources of variation between studies include the following:
1. The laboratory assays used. 2. The lack of detail on the histological classifi-cation of cases. 3. The use of hospital controls with different stringency criteria for inclusion and exclusion. This is particularly relevant with respect to the inclusion of patients with other liver diseases as controls. 4. In several instances, the HBsAg prevalence among hospital controls is used to estimate the population attributable fraction (AF). It has been reported that hospital patients have higher HBsAg prevalence rates than the general
132

Biomarkers for biological agents
Anti-HBc
Infection status HBsAg 1gM Total HBeAg Anti-H Ве Anti-HBs
Acute infeetiona + + + + - — .
Chronic infection with high levels of viral replication + — + + — -
Chronic infection with low levels of viral гeplXаlionЬ + — + — + -
Recovery from acute infection before development of anti-HBs — + + — + —
Low titre; possible false-positive — — + — — —
High titre; possiЫe'low-level carrier . — — t- — + -
Recovery from acute infection, indicating immunity —. — + — + +
Vaccine response° — — — — +
SusceptiЫe to HBV infection — — — — —
aReactivaled chronic disease may have this pattern with sensitive anti-HBc 1gM assays. b5оте patients may be seronegative for HBeAg
end aпli-НВС. °in unvaccinated individuals, a high titre may represent immunity or be ncn-spocilic; low titres are often non-specific.
(From 1ARC, 1994а.)
population (Maynard et al., 1989; Val Mayans et al., 1990), thus underestimating the OR and perhaps overestimating or underestimating the АР.
Evidence is now accumulating that HBV carriers might not have HBsAg ni their sera. These are usu-ally IBcAb-positives without HBsAg who are shown to harbour HBV DNA in the sera and in the liver by the recently applied DNA amplification techniques (PCR), monoclonal antibodies and Southern blot assays (Nakajima et al., 1989). The use of these methods in epidemiological studies might increase the accuracy of our estimates of the relative risk for hepatocellulaI carcinoma (ICC) among HBV carriers arid the fraction of the disease that is attributable to HBV.
Contamination remains a ma] от difficulty of studies based on PCR methods. Negative and posi-tive control samples, including reaction mixtures without DNA, should be analysed in each test (Dusheiko et aI., 1992; Seelig et al., 1992). One large validation study using a panel of serum specimens was organized in 39 laboratories to evaluate varia-tion in the detection of HBV DNA using non-standardized PCBs- Of 43 sets of results, 10 (23.3%) correctly identified the entire panel of specimens (seven HBV-DNA-positive specimens, five HPV-DNA-negatives and two dilution series). Nineteen (44.2%) had some false-positive or false-negative results with
the undiluted specimens, and 40% had errors with the diluted specimens (Quint et al., 1995).
Although the biological matrix of interpretation of the HBV profile is fairly consistent, in some sit-uations the wtu1agica1 results are affected by the coexistence of additional factors.
Among subjects with inflammatory hepatopathies, patients on haemodialysis, intravenous drug addicts, homosexuals and also in a fraction of spontaneous blood donors, anti-HBc may appear as the sole marker of HBV exposure (reviewed by Levine etal.,
1994). Studies have shown that, in these patients, HBsAg is often immunocomplexed (80% in in-flammatory hepatopathies, 40% in patients on haemodialysis, 63% in intravenous drug addicts), escaping detection by standard tests. Moreover, among patients with complexed HBsAg, 48% were HBV-DNA-positive by nested PCR, compared with 19% among patients without complexed HBsAg. These results suggest that some of the patients with anti-Ilk may only develop an active HBV infec-tion Uоller- еmelka et al., 1994).
Epidemiological studies using HBV biomarkers Biomarkers as the end-point The majority of the epidemiological studies on HBV and ICC have been based on the one-time detection of HBsAg, HBsAb and IBcAb. Some stud-ies have also evaluated iBeAg and HBeAb. The

Application of Biornarkers in Cancer Epidemiology
persistence of HBsAg in the serum following inf ес-tim can be viewed as а surrogate marker of the risk of developing ICC and an intermediate end-point for natural history studies.
Likewise, the persistence of detectable levels of HBsAb can be interpreted as а measure of protection conferred by natural infection or following vacci-nation. Some examples and principal results of studies conducted using these HB markers include HBV transmission studies and studies to evaluate HBV vaccine efficacy.
The five basic IBV markers have been extensively used to investigate HB transmission from HBsAg-car rier mothers to newborns, between sexual couples or between siblings. The detection of HBeAg/Ab has been useful in ascertaining the increased risk of transmission from mothers to newborns if the mother is a carrier of the IBeAg. Furthermore, recent work from the Gambia has shown that it is unlikely that bed-bug bites are responsible for НB transmission (Vail Mayans et al., 1990).
Vaccine efficacy has been assessed using short-term follow-up studies in which the development of HBsAb in vaccinated children is used as one of the end-points. Prevention of the development of the IBsAg-carrier state (i.e. by comparing with a control group) provides surrogate estimates of the prevention of ICC to be expected irr the future. These follow-up studies are also useful in estimat-ing the duration of the protection afforded by 113 vaccination
Newly developed biomarkers may modify our current estimates of the risk related to lEV. One relates to the existence of 113V mutants that may escape detection using conventional methods; the other source of HBV exposure misclassification relates to the HBV infections with low replication level in which PCR techniques are required to detect minute quantities of HBsAg or HBV DNA.
Use of biomarkers in case—control/prospective cohort studies of NCC Hepatitis B is remarkable in that several antibody profiles can be described and attributed with some exceptions to specific stages of the host/viral inter-actions (Table 1). These markers were sufficient to establish a strong link between the persistence of IBsAg in serum and the risk of HCC. In brief, epidemiological studies have been able to demon-strate:
1. The geographical variation in the prevalence of HBsAg carriers and its correlation with the incidence of ICC (Szmunеss, 1978). 2. The intrafamilial and intravillage clustering of IBV infections (Barrett et al., 1977; Whittle etal., 1991). 3. The strong association of HBV and ICC in more than 40 case—control studies. HBsAg car- riage is the strongest determinant of ICC. In some studies, the presence of IBcAb is also associated with the risk. Iп low-risk countries in Europe and the USA, the OR estimates range from 5 to 40 and the population AF ranges from 1 to 50%, with a median value around 20%. In high-risk areas in China and South-East Asia, ORs (10-30) and AFs (range 40-90%) tend to be higher. 4. The independence of HBV from other risk factors and the specificity of the association with liver cancer (Iargely ICC) as opposed to other cancers metastatic to the liver. 5. The risk of ICC among IBsAg carriers in sev-eral prospective cohort studies (Beasley et al., 1981; Iclahon et aI., 1990; Hall et al., 1985). In some cohort studies, the risk of HCC was highest for HBsAg carriers who were also HBeAg carriers (Sakuma et al., 1988). As in case—control studies, risk estimates for IBsAg and attribut-able fractions are high in high-risk countries such as Taiwan (Beasley et al., 1981) and in Asian migrant populations in low-risk countries such as the USA (Sherman et al., 1995). The risk of progression is low or very low in the native populations of low/intermediate-risk countries such as Canada (Villenueve et al., 1994) and Italy (De Francis et al., 1993) 6. The efficacy of lEV vaccines in preventing the IBsAg-carrier state in all settings (McMahon et aL, 1987; Hsu et al., 1988; Tsen et al., 1991; Whittle et al., 1991). 7. Interactions of HBV and aflatoxin (AF) in the causation of liver cancer. Epidemiological studies are increasingly using biomarkers of exposure to AF. Two of the most promising are urinary metabolites and adducts of AF and the mutation patterns of the p53 tumour suppressor gene. In addition, HBV markers have been used to
identify high-risk groups and in the evaluation of treatment modalities:
134

Biomarkers for ыоlogiса agents
1. Regular screening of HBsAg carriers for early liver cancers has been attempted in high-risk populations. The results in terms of improving survival of the cases identified are not consis-tent (McMahon et al., 1991; De Francis et al., 1993; Villenueve et aI., 1994; Colombo 1995). 2. HBV vaccines are also under trial as a treatment for IBsAg carriers. In these studies, measure-ments of HBV load are used as biomarkers in the evaluation of therapy (Poll et aL, 1993).
The AFB,-N-Guа adducts and other AF metabo-lites have been used in an ongoing cohort study in Shanghai, Chia (Ross et aI., 1992; Qian et aL, 1994). This study showed that seropositivity to IBsAg and the presence of one to four AF exposure markers in urine (AFB , АFР„ AFМ1 and AFВ1 N-Gua) were strongly related to ICC (OR = 59.4; 16.6-212.0). There was also a moderate increase in risk for subjects exposed to AF who were HBsAg-negative (OR = 3.4; 1.1-10.0) (Qian et al., 1994). Subsequently, it was indicated that the anti-HCV prevalence in the ICC cases found in the cohort was about 1%, aid in the control group was about 0.2% (OR = 5.0; 0.3-79.9) (Yuan et al., 1995). This study is so far the best evidence of an interaction between HBV and AF in the causation of human ICC. However, the number of ICC cases in which the interaction was explored is small (13 cases AF-positive and HBsAg-negative) and there is room for misclassification of cases in relation to their viral exposure (thus risk estimates become unstable). Better measurements of HBV exposure (i.e. detec-hon of HBV DNA in serum by PCR) have shown that in areas where HBV is prevalent in South-East Asia, HSV DNA can be identified in up to 20% of the HBsAg-negative ICC cases (reviewed by Paterlini & Brechot, 1994) and in 30-32% of patients with chronic liver disease (Zhang et al., 1993). The follow-up of this cohort is awaited with great interest.
The presence of AF-specific mutations in the genome of HCG cells was suggested by an ecologi-cal study iп which ICC biopsies from patients in 14 countries were investigated. Among 72 ICC specimens from South Africa and the south-east coast of Asia (assumed to have been exposed to AF), 12 (17%) showed a specific G to T mutation at codon 249 of the р53 gene. The mutation was not found in any of 95 1CC specimens from a miscel-
[any of countries where AF exposure is rare (Ozturk, 1991). Other reports with limited num-bers of cases indicated high rates (i.e. >50% of the p53 codon 249 mutations) in ICC specimens from Quidong (Hsu et al., 1991), Senegal (Coursaget et aL, 1993) and South Africa (Bressac et aI., 1991). Lower frequencies were reported from ICC in Thailand, where AF contamination of foods has been documented in the past (Hollstein et ai,, 1993), and among Eskimos (De Benedetti et ы., 1995). The genetic changes associated with ICC are just beginning to be understood (Tabor, 1994).
These new biological markers may represent a real breakthrough in the field of ICC epideniiol-ogy. In particular, the new genetic markers can be determinant in quantifying the responsibility of AF as an independent cause of ICC and in evalu-ating the likely interactions with the hepatitis viruses in humans.
However, a word of cation should be raised concerning these pioneer studies in relation to: (1) their small sample size and limited methodol-ogy with respect to criteria for specimen inclusion; (2) inadequate adjustment of the correlations for exposures to other (viral and non-viral) risk factors at the individual level; (3) limited information on the sensitivity and specificity of the assays to assess proposed genetic markers; and (4) insufficient knowledge on the additional genetic changes asso-ciated with ICC development.
Future directions In spite of the large number of studies addressing natural history issues, we still lack an explanation for the occurrence of a substantial fraction of HBV infections in most settings. Natural history studies should be pursued based upon the newer methods of НВV detection currently available.
PCR methods and new assays based on different regions of the viral genome (i.e. HBxAg and anti-HBx; Horiike et al., 1991), pre-5 antigens and anti-bodies (Itoh et al., 1986; Coursaget et ai., 1990) may be useful in the future to increase precision in the quantification of the HBV involvement in the incidence of 1CC. Studies on virai integration may contribute to the description of the mechanisms of carcinogenesis.
The coexistence of HBV and HCV, with or with-out 'DV, may be greater than 10%. The mecan-isms by which HCV seems to suppress HBV and
135

Application of Biomarkers in Cancer Epidemiology
HDV replication remain unknown. The impact of multiple hepatitis infections on 1CC incidence requires further research. Follow-up studies of haemophiliacs and drug addicts may provide unique opportunities for research.
Molecular techniques are identifying genetic changes related to exposure to liver carcinogens, such as aflatoxins (Ozturk, 1991), or to cell foci believed to be ICC precursors (for a review see Tabor, 1994; Hsia et al., 1994).
Polymorphism of the МНС has been suggested as playing an important part in the establishment of the HBV persistent infection (Thursz et al., 1995). Other work suggests that non-response to HBV vaccines may be related to 'LA groups (A. Zuckerman, personal communication, 1996). More studies using these susceptibility markers are needed.
The investigation of HBV mutants is in constant progress. The clinical significance of some of these mutant viruses in the induction of ICC is unknown.
Increasing the precision of the estimates con-cerning HBV (and 1CV) will allow better estimates of the role of other putative factors such as tobacco, alcohol and oral contraceptives. It should also help in understanding the role of liver cirrho-sis and other chronic liver conditions as interme-diate pre-neoplastic stages.
Hepatitis C viral infections Methods for the detection of HCV infection and sources of variability The detection of infection by HCV is based upon assays for viral antibodies and viral nucleic acids. Tests to detect exposure to HCV have been in constant development since first reported in 1989 (Kuo et al., 1989). Second- and third-generation FUSA assays, confirmatory assays with recombi-nant imniunoblot assays (RIBА 1-4) and quantita-tive tests based on PCR are now available.
TICV infection can also be assessed by detecting HCV RNA by reverse transcription (RT) and PCR, which is highly sensitive and has been used for early diagnosis. Quantitative PCR can be used to detect 5-30 molecules of synthetic HCV RNA (Hagiwara et al., 1993).
Testing by PCR has become the standard for some workers. The results of these tests correlate well with the risk for transmitting post-transfusion
hepatitis, with the results of second-generation anti-HCV assays and with Liver histology, and are useful in monitoring the response of patients to interferon therapy. Nevertheless, reproducibility between laboratories, each using their own proto-cols, for detection of anti-HCV has been poor (Zaaijier et al., 1993).
Well-controlled procedures for handling sam-ples, extraction and purification of nucleic acids, avoidance of laboratory contamination and use of appropriate negative and positive controls are essential prerequisites for the PCR assay. Selection of primers from the highly conserved 5' non-coding region is also important for sensitivity and has allowed identification of a broad range of genotypes (Okamoto et яL, 1990);
5equence variation analysis allowed the descrip-tion of distinct types of HCV with some geograph-ical variation in the type-specific prevalence (Dusheiko et al., 1994). Six major types were rec-ognized in 1994 (Simmonds et al., 1994). However, these classifications are contingent on completing sequencing and it is expected that a recognized sys-tem of HCV classification will be available in 1996. Some commercial kits are available for HCV detec-tion and typing (Bréchot & Thiers, 1996).
HCV RNA testing in mononuclear peripheral blood cells offers the possibility to detect HCV replication in patients who are HCV-RNA-negative iп serum (Muratori et al., 1994). The clinical value of these tests is uncertain, but it has been suggested that HCV replication iп mononuclear cells can be responsible for the reactivation and acute episodes of HCV hepatitis during chronic infection and after transplantation (Qian et al., 1992). These markers have not been used in epidemiological studies.
Logistics of sample collection Epidemiological studies have been based on sero-logical assays. The logistics required for blood col-lection in the field are similar to the description pertaining to HBV.
Applications of biomarker in epidemiological studies Biomarkers as the end-point The presence of HCV markers in serum can be interpreted as a surrogate measure of the risk of developing liver cirhosis and ICC. Most of the
136

Biomarkers for biological agents
available evidence refers to natural history studies and therapeutic intervention studies.
More than half of the cases of HCV exposure remain of obscure origin, in spite of intensive ques-tioning. Person to person exposure is the most likely source, but the mechanism is poorly defined. Among haemodialysis patients, HCV contamination has been documented in wards with strict control of blood products with second-generation assays. DNA sequencing of the hypervariable region of the E2 gene in PCR products identified clusters of closely related viruses, suggesting common sources other than blood (Allender et cL, 1995). Other studies based on PCR have shown the presence of HCV RNA in tears and other body fluids, suggest- ing a possible alternative source of exposure (Feutch et al., 1994; Su et al., 1994). 1CV RNA titre in the serum correlates with the presence of the viral RNA in seminal fluid or saliva of infected males (Liou et L, 1992) and with the rate of trans- mission from mothers to infants (Ohto et a?., 1994). These results suggest that serum HCV RNA titre is a marker of HCV infectivity.
The mode of acquisition of HCV is of relevance to progression to chronic hepatitis and liver drrho- sis. Several studies have shown that transfusion- acquired HCV conveys a poorer prognosis than both sporadic hepatitis C Uovë etaL, 1988; Mattson et aL, 1989) and hepatitis C following Lv. drug use (IDU) (Gordon et aI., 1993). Studies of viral load using serum titre of HCV RNA have shown that transfused patients had a higher viral load than both patients infected through 'DU and health workers (Lau et cL, 1993). Other studies suggest that long-term outcomes of HCV infection may be pre- dicted by the severity of the initial hepatic lesion postinfection (Schmid eta?., 1982; Titi et al., 1990).
Although there are few long-term follow-up studies of HCV-infected individuals, current evi-dence suggests that few people resolve 1CV infec-tons spontaneously, and HCV RNA can be found by PCR in most instances (Alter et al., 1992).
There is also evidence of familial clustering of HCV. Mother to child transmission has been doc- umented. Sеxuаl contacts of anti-HCV carriers are at a moderately high risk of HCV. Patients attend-ing STD (sexually transmitted diseases) clinics show higher HCV prevalence than the general population, although sexual transmission seems to occur at a lower rate than for НIV or IBV.
Use of biomarker in case—control/prospective cohort studies of NCC Epidemiological studies are largely consistent in showing a strong association between anti-HCV and ICC. The specific potential of each of the ACV types and their variants to induce ICC, as well as the potential for other factors from the host and the environment to inteiact with HCV in the origin of ICC, still requires further research.
More than 30 case series on anti-HCV preva-lence in ICC, liver cirrhosis and chronic hepatitis have been reported. The range of HCV seropositivity in ICC cases from developed countries is 20-76%, with most studies in the 50-70% range. Apart from exceptions, the prevalence rates from studies that used early assays are not significantly distinct from those that used second-generation assays.
The coexistence of IBV and HCV markers is rel-atively rare among ICC patients. Studies based on second-generation anti-1CV assays are consistent in showing prevalence rates of dual infection among cases below 10%. Relatively high rates (7.7%) have been found in Italy (Stroffolini et cL, 1992) and 5enegal(4.1%) (Couгsagеt et aI., 1992). These results are consistent with the hypothesis that a substantial fraction of the anti-HCV-positive subjects observed in the developed countries result from transfusions with IBsAg-screened blood products.
Cohort studies have shown an increased risk for ICC among anti-HCV carriers. It is estimated that about 50% of the HCV infections will lead to chronic liver disease, of which 20% will develop liver cirrhosis and perhaps 10% of these with cir- rhosis will progress to ICC ('ARC, 1994a). Some studies estimate the average time interval from post-transfusion HCV hepatitis to chronic liver dis-ease, liver drrhosis and 1CC at around 10, 20 and 30 years, respectively (Кiуоsаwа et ai', 1984).
Case—control studies on ICC using first- and second-generation assays are numerous and larger consistent in showing elevated risk estimates among anti-HCV carriers. In Japan, a study of 91 1CC cases and 410 controls from the general population reported an OR of 52 (24-111) with an 1CV AF of 60.5% (Tanaka et al., 1991). In Italy, a study of 65 cases and 99 controls reported an OR of 27 with an AF of 77% (Stroffolini et al., 1992). Increased risk estimates have occasionally been obtained even in areas where 11W is the
137

Application of 8iomarkers in Cancer Epidemiology
predominant etiological factor of HCG, e.g. in Guanxi, southern china (Okun et aI., 1994) and in Korea (Lee et al., 1993). In these two areas, the prevalence rates of anti-HCV in all ICC cases (pos-itive and negative for HBsAg) were 5 and 17%, respectively, and in HBsAg-negative ICC cases they were 1.8 and 43%. In a series of 23 studies from different countries published in 1991-1993, the range of the reported ORs is 1.1-134. These estimates were statistically significant in 18 of the 23 studies (for a review see also IARC, 1994a). Other risk factors such as smoking and alcohol do not modify the strength of the association between 1CV and ICC.
From case—control studies, risk estimates are consistently higher for individuals who are anti-HCV-positive and HBsAg-positive (e.g. see Chuang еt яl., 1993). It has recently been estimated that the attributable fraction for both HBV and HCV is about 50% in developed countries. and 90% in the developing world (Pisani et al., 1996).
Future directions Genome sequencing, completion of the phyloge-netic tree and agreement on a standard typification of HCV would help in evaluating international variation in HCV types. Follow-up studies of 1CV-infected individuals should provide information on the risk factors for progression to advanced liver disease. Natural history studies and population prevalence surveys will be useful in identifying background prevalence, routes of transmission and preventive strategies. More sensitive methods of HCV detection aid, in particular, quantitative PCR systems should be used in natural history studies.
References Allender, T., Gruber, A. Mojgan, N. Beyene, A., SSderstгбш, T., BjOrkholm, I., Grillner, L. & Persson, М.А.А. (1995) Frequent patient-to-patient transmission of hepatitis C virus in a haematology ward. Lancet, 345, 603-607
Alter, М.J., Margolis, H.S., Krawczynski, K., Judson, F.N., Mares, A., Alexander, W.J., lu, P.Y., Mi11еr, J.K., Gerber, M.A., Sampliner, R.E., leeks, E.L. & Beach M.J. (1992) The natural history of community-acquired hepatitis C in the United States. New Eng1. J. Mcd. 327, 1899-1905
Barrasso, R. (1992) Colposcopie diagnosis of HPV cervi-cal lesions. Iп: Mufioz, N., Bosch, F.X., Shah, K.V. & Meheus, A., eds, The Epidemiology of Human Pap illomavirus and Cervical Cancer (IARC Scientific
Publications No. 119). Lyon, International Agency for Research on Cancer, pp. 67-74
Barrett, D.H., Burks, J1,, McMahon, B., Elliott, S., Berquist, K.R., Bender, Т.R. & Maynard, J.E. (1977) Epidemiology of hepatitis B in two Alaskan communi-ties. Am. J. Ерidеmiol., 105, 118-122
Beasley, Rb, Hwang, L.Y., Lin, C.C. & Chien, S.C. (1981) Hepatocellular carcinoma and hepatitis B virus: a pгоsреc-tive study of 22707 men in Taiwan. Lancet; ü, 1129-1133
Blaser, M'I., Pérez-Pérez, G.I., Kieanthous, H., Cover, T,L., Peek, R.M., Chyou, P.H., Stemmermann, G.N. & Nomura, A. (1995) Infection with Helicobacter pylori strains possessing cagA is associated with an increased risk of developing adenocarcinoma of the stomach. Cancer Rn., 55, 2111-2115
Bosch, F.X., Munoz, N., de Sanjosé, S., Navarro, C., ivloreo, P., Ascunce, N., Gonzalez, L.C., Tafur, L., Gill, M., Larrafiaga, I., Viladiu, P., Daniel, R.W., Alonso de Ruiz, P. Anistizabal, N., Santamaria, M,, Guerrero, E. & Shah, K.V. (1993) Human papillomavirus and cervical intraepithe-lia1 neoplasia grade III!carcinoma in situ: a case-control study in Spain and Colombia. Cancer EpidemioL Biomarkers Prev., 2, 415--422
Bosch, F.X., Manos, M.M., Mufioz N., Sherman, M., Jansen, A.M., Peto, J„ Schiffmarl, M.H., Moreno, V., Kunman, R., Shah, K.V. & The IBSCC Study Group (1995) Prevalence of human papillomavirus in cervical cancer: a worldwide perspective. J. Natl Cancer Inst., 87, 796-802
Brandsma, J.L., Burk, R.D., Lancaster, W.D., Pfister, H. & schiffman, M.H. (1989) Inter-laboratory variation as an explanation for varying prevalence estimates of human papillomavirus infection. ut. J. Cancer, 43, 260-262
Brëchot, C. & Thiers, V. (1996) Evaluation du kit de sérotу-page du VIC (Murex technical report), lurex
Bressac, B., Kew, M., Wands, J. & Ozturk, M. (1991) Selective G to T mutations of p53 gene in hepatocellular carcinoma from southern Africa. Nature, 350, 429-430
Chuang, W.L., Chang, WY., Lu, S.N., Lin, Z.Y., Chen, S.C., Hsieh, М.Y., Wang, L,У., You, S.L. & Chen, C.J. (1993) The role of hepatitis C virus in chronic hepatitis B virus infection. Gastroenterol. Jpn, 28 (suppi. 5), 23-27
СоlотЬо, M. (1995) Should patients with chronic viral hepatitis be screened for hepatoceIular carcinoma? Viral Hepatitis Rev., 1, 67-75
Coursaget, P., Buisson, Y., Bourdil, C., Yvonnet, B., Infinie, C., Diop, M.T., Chiron, J.P., Bao, 0. & Diop-Mar, I. (1990) Antibody response to preS1 in hepatitis-B-virus-induced liver disease and after immunization. Rn. ViroL, 141, 563-570
Coursaget, P., Leboulleux, D., Le Carin P., Bai, O. & Coil-Seck, А.~. (1992) Hepatitis C virus infection in cirrhosis
138

Biomarkers for biological agonts
and primary hepatoce11ular carcinoma in Senegal. Trans. R. Soc. Trop. Med. Hyg., 86, 552-553
Coursaget, P., Depril, N., Chabaud, M., Nandi, R., Mayelo, V., Le Cann, P. & Yvonnet, B. (1993) High preva-lence of mutations at codon 249 of the p53 gene in hepa-tocellular carcinomas from Senegal. Br. J. Cancer, 67, 1395-1397
De Benedetti, V., Welsh, J., Trivers, G., Harpster, A., Parkinson, A., Lanier, A., McMahon, B. & Bennett, W. (1995) P53 is not mutated in hepatoce11ular carcinomas from Alaska Natives. Cancer EpidemioL Biomarkers Prey., 4, 79-82
De Francis, R., Meucci, G., Vecchi, M., Tatare'la, M., Colombo, M., del Ninno, E., Rami, М.~., Donato, M.F. & Ronchi, G. (1993) The natural history of asymptomatic hepatitis B surface antigen carriers. Ann. Intern. Mcd., 118, 191-194
Dinner, J. (1994) Antibody responses to defined HPV epi-topes in cervical neoplasia. Papillomavirus Report, 5, 35-41
Dusheiko, G., Xu, J. & Zuckermann, A.j. (1992) Clinical diagnosis of hepatitis B infection: applications of the polymerase chain reaction. In: Becker, Y. & Darai, G., eds, Frontiers of virology. Berlin, Springer Verlag. pp. 67-85
Dusheiko, G., Schmilovitz-Weiss, H., Brown, D., Mcimish, F., Yap, P.L., Sherlock, S., McIntyre, N. & Siшшопds, P. (1994) Hepatitis C virus genotypes: an investigation of type-specific differences in geographic origin and disease. HepatoIogy, 19, 13-18
Feldman, R.A. & Evans, S.J.W. (1995) Accuracy of diag-nostic methods used for epidemiological studies of Helicobacter pylori. Alime . Pharmacol. Therap., 9 (suppl. 2), 21-31
Feutch, H.H., Polywka, S., Zollner, B. & Laufs, R. (1994) Greater amount of HCV-RNA in tears compared to blood. MiaoЫоl. Immunol., 38, 157-158
Figura, N., Guglielmetti, P., Rossolino, A., Barberi, A., Cusi, G., Musmanno, R.А., Russi, М. & Quaranta, S. (1989) Cytotoxin production by Campylobacter pylori strains isolated from patients with peptic ulcers and trous patients with chronic gastitis only. J. Clin. Microbiol., 27, 225-226
Fox, J.G., Correa, P., Taylor N.S. Thompson, N., Fontham, E., Janney, F., Sobhan, M., Ruiz, B. & Hunter, F. (1992) High prevalence and persistence of cytоtoxin-positive Helicobacter pylori strains irs a population with high prevalence of atrophic gastritis. Am. J. GastroenteroL, 87, 1554-1560
Gordon, S.C., E1loway, R.S., Long, J.C. & Dmuchowski, C.F. (1993) The pathology of hepatitis C as a function of mode of transmission: blood transfusion vs. intravenous
drug use. Hepatology, 18, 1338-1343
Gravitt, P.E. & Manos, M.M. (1992) Polymerase chain reaction-based methods for the detection of human papillomavirus DNA. In: Mufioz, N., Bosch, F.S., Shah, K.V. & Meheus, A., eds, The Epidemiology of lamai Papillomavirus and Cervical Cancer (‚ARC Scientific Publications No. 119). Lyon, International Agency for Researcho on Cancer, pp. 121-133
Gunther, S., Li, B.С., Miska, 5., Kruger, D.H., Meisel, H. & Will, H. (1995) A novel method for efficient amplifica-tion of whole hepatitis B virus genome permits rapid functional analysis and reveals deletion mutants in immunosuppressed patients. J. Viril., 69, 5437-5444
Hagiwara, H., Hayashi, N., Mita, E., Naito, M., Kasahara, A., Fusamoto, H. & Kamada, T. (1993) Quantitation of hepatitis C virus RNA in serum of asymptomatic blood donors and patients with type C chronic liver disease. lepatology, 17, 545-550
Наl1, A.J., Winter, Р.D. & Wright, R. (1985) Mortality of hepatitis B positive blood donors in England aid Wales. Lancet, 1, 91-93
Ho, G.Y., Burk, R.D., Klein, S., Kadish, А.S., Chang, C.J., Palan, P., Basu, J., Tachezy, R., Lewis, R. & Romney, S. (1995) Persistent genital human papillomavirus infec-tion as a risk factor for persistent cervical dysplasia. J. Nail Cancer lnst., 87, 1365-1371
Holistein, M.С., Wild, C.P., Bleicher, F., Chutimataewin, S., Harris, C.C., Srivаtaпakul, P. & Montesano, R. (1993) P53 mutations and aflatoxin B, exposure in hepatocellu-lar carcinoma patients from Thailand. ut. J. Cancer, 53, 51-55
Horiike, N., Blumberg, B.S. & Feitelson, M.A. (1991) Characteristics of hepatitis BX antigen, antibodies to Xantigen, and antibodies to the viral polymerase during hepatitis B virus infection. J. In fect. Dis., 164, 1104-1112
Hsia, C.C., Di Bisceglie, A.М., Kleiner, D.E. & Tabor, E. (1994) Expression of hepatitis B surface and core anti-gens aid transforming growth factor-a in "Oval Cells" of the liver in patients with hepatocellular carcinoma. J. Viril., 43, 216-221
'su, A.W., Burk, R.D., Liaw, K.-L., Chen, C.-J., Zhang, T., Schiffman, M., Greer, C.E., You, S.-L., Hsieh, C.-Y., Huang, T.W., Wu, T.-C., O'Leary, T.J., Seidman, J.D. & Manos, M.M. (1996) Iпterlaboratoтy agreement in a polymerase chain reaction-based human papillomavirus DNA assay. CancerEpidemioi. BiomarkersPrev., 5, 483-484
Hsu, H.М., Chen, A.S., Chuang, С.H., Lu, J.C.F., Two, ~.М., Lee, C.C., Lu, H.C., Cheng, S.H., Wang, Y.F., Wang Chen, C., et aI. (1988) Efficacy of a mass hepatitis B vac-cination program in Taiwan. JAMA, 260, 2231-2235
Hsu, I.C., Metcalf, R.А., Sun, T., Welsh, J.A., Wang, N.J. &

Application of Biomarkers in Cancer Epidemiology
Harris, C.C. (1991) Mutational hotspot in the p53 gene in human hepatoce11ular carcinomas. Nature, 350, 429-430
Hu, K.-Q., Vu, C-H., Lee, S., Villаmil, F.G. & Vierling, J. (1995) Simultaneous detection of both hepatitis B virus DNA and hepatitis C virus RNA using a combined one-step роlуmетаsе chain reaction technique. Hep atology, 21, 901-907
'ARC (1994a) L4RC Monographs on the Evaluation of the Carcinogenic Risks to Humans. Vii. 59, Hepatitis viruses, Lyon, International Agency for Research on Cancer
IARC (1994Ъ)'ARC Monographs on the Evaluation of the Carcinogenic Risks to Humans. ‚ToI. 61, Schistosomes, liver flukes and Helicobacter pylori, Lyon International Agency for Research on Cancer
IARC (1995)'ARC Monographs on the Evaluation of the Carcinogenic Risks to Humans. Vol. 64, Human papillo-mavirus, Lyon, International Agency for Research on Cancer
Itoh, Y., Takal, E., Ohnuma, H., Kitajima, K., Tsuda, F., Machida, A,, Mishiro, S., Nakamura, T., Miyakawa, Y. & Mayumi, M. (1986) A synthetic peptide vaccine involv-ing the productif the pee-S (2) region of hepatitis В virus DNA: protective efficacy in chimpanzees. Proc. NatlAcad. Sci. USA, 83, 9174-9178
Jacobs, M.V., de Roda Husman, A.M., van den Bruie, A.J.C., Snijders, Р.J.F., Meijer C.J.L.M & Walboomers, J.M.M. (1995) Group specific differentiation between high- and low-risk human papillomavims genotypes by general primers-mediated polymerase chain reaction and two cocktails of oigonucleotide-probes. J. Clin. Microbiol., 33, 901-905
Jo11еr-Jemelka, H.1., Wicki, A.N., Grob, P.J. (1994) Detection of lBs antigen iii 'anti-Hic alone" positive sera. J Hepatology, 21, 269-272
Jové, J., Shnchez-Tapias, M., Bruguera, M., Mas, A., Costa, J., Barrera, J.M. & Rodes, J. (1988) Posttransfusional vs. sporadic non-A, non-В chronic hepatitis: a clinicopatho-logical and evolutive study. Liver, 8, 42-47
Kiyosawa, K., Akahane, Y., Nagata, A. & Furuta, S. (1984) IepatoceIular carcinoma after non A non B posttrans.. fusion hepatitis. Am. J. Gastroenteral., 79, 777-781
Kuiрers, E.J., Përez-Pérez, G.I., Meuwissen, S.G. & Blaser, М.J. (1995) Heiicobacter pylori and atrophic gastritis: importance of the cagA status. J. Nat! Cancer Inst., 87, 1777-1780
Kuo, G., Ohio, Q.-L., Alter, 11.3., Gitnick, G.L,, Redeker, A.G., Purcell, R.H., Miyamura, T., Dienstag, J.L., Alter, M.J., Stevens, C.E., Tegtmeier, G.E., Bonino, F., Colombo, M., Lee, W.S., Kuo, L., Berger, K., Shuster, B.R., Overby, L.R., Bradley, D.W. & Houghton, M. (1989) An assay for
circulating antibodies to a major etiologic virus of human non-A, non-B hepatitis. Sсiепсе, 244, 362-364
Lau, J.Y.N., Davis, G.L., Kniffen, J., Qian, K.P, Urdea, M.S., Chan, C.S., Nfizokami, M., Neuwald, PD. & Wilber, J.С. (1993) Significancer of serum hepatitis C virus RNA levels in chronic hepatitis C. Lancet, 341, 1501-1504
Lee, H.S., Han, C.J. & Kim, C.Y. (1993) Predominant etiologic association of hepatitis C Virus with hepatocellulаr car-cinoma compared with hepatitis B virus in elderly patients in a hepatitis B-endemic area. Cancer, 72,2564-2567
Levine, 0.5,, Vlahov, D. & Nelson, K.E. (1994) Epidemiology of hepatitis B virus infections among injecting drug users: seroprevalence, risk factors, and viral interactions. EpidemioL Rev., 16, 418-436
Hou, I-C., Chang, T,-T., Young, K.-C., Lin, X.-Z., Liii, C.-Y, & Wu,H.-L. (1992) Detection of HCV P'NA in saliva, urine, seminal fluid, and ascites. J. Med. Virol., 37, 197-202
Lungu, 0., Sun, X.W., Wright Т.C., J.R., Ferenczy, A., Richart, R.M. & Silverstein, S. (1995) A polymerase chain reaction-enzyme-linked immunosorbent assay method for detecting human papillomavirus in cervical carcino-mas and high-grade cervical cancer precursors. Obstet. Gynecol., 8, 337-341
Maia, M., Takahashi, H., Adler, K., Garlick, R.K. & Wands, J.R. (1995) Development of a two-site immuno-PCR assay for hepatitis B surface antigen. J. Viril. methods, 52, 273-286
McMahon, B.J., Rhoades, E.R., Heyward, W.L., Tower, E., Ritter, D., Lanier, A.P., Wainwright, R.B. & Helminiak, C. (1987) A comprehensive programme to reduce the inci-dence of hepatitis B virus infections and its sequelae in Alaskan natives. Lancet, 2, 1134-1136
Iclahon, B.J., Alberts, S.R., Wainwright, R.B., Вulkow, L. & Lanier, A.P. (1990) Prospective study in 1400 hepati-tis B surface antigen-positive Alaska Native carriers. Arch. Intern. Med., 150, 1051-1054
McMahon, B.J., Wainwright, R.W. & Lanier, A.P. (1991) The Alaska native ICC screening program: a population-based screening program for hepatocellular carcinoma. In: Tabor, E., Di Bisceglie, A.M. & Purcell, R.H., eds, Etiology, Pathology, and Treatment of Hepatocellular Carcinoma in North America (Advances in Applied Biotechnology Series, Vol. 13). Houston, PPC-Gulf Publishing Company, pp. 231-241
Mattson, L., Weiland, O. & Glaumann, H. (1989) Chronic non-A, non-B hepatitis developed after transfusion, illicit self-injections or sporadically: outcome during long-term follow-up—a comparison. Liver, 9, 110-127
Maynard, J.Е., Kane, M.A. & Radler, S.C. (1989) Global control of hepatitis B through vaccination: role of hepatitis B vaccine in the expanded programme on
140

Blomarkers for biologhal agents
inimunizatiori. Rev. Infect. Dis., 11 (suppl. 3), s574-s578 Аеtiоlоgiсаi and Progression Factors. CRC Press, pp 167-190
Mufioz, N. Bosch, F.X., de Saп)osé, S., Tafur, L., lzarzugaza L Gill, M., Viladiu, P., Navarro, C., Martos, C,, Ascunce, N., Gonzalez, L.C., Kaldor, J.M., Guerrero, E., Ldrincz, A., Santamаria, M., Alonso de Ruiz, P, Aristizabal, N. & 5hah, K. (1992) The causal link between human papillomavirus and invasive cervical cancer; a population-based case-control study in Colombia and Spain. Int. J. Cancer, 52, 743-749
Mufioz, N. & Pisani, P. (1994) He1icobactex pylori and gastric cancer. Eur. J. Gаstroenterol. Hep atot , 6, 1097-1103
Mufioz, N. & Bosch, F.X. (1996) Current views on the epidemiology of HPV and cervical cancer. Papillomavirus report. In; Lacey, C., ed., Papкllomavirus Reviews: Current Research on Papillotnaviruses. Leeds, Leeds University Press. pp. 227-237
Muratori, L., Giostra, F., Cataleta, Ni., trancesconi, R., Ballardini, G., Cassani, F., Lenzi, M. & Bianchi, P.B. (1994) Testing for hepatitis C virus sequences in periph-eral blood mononuclear cells of patients with chronic hepatitis C in the absence of serum hepatitis C virus RNA. Liver, 14, 124-128
Nakajlma, E., Thiers, V., Larzul, D., Thiollais, P. & Brechot, C.H. (1989) Hepatitis B virus (18V) DNA as a markers of HBV infection. In: Bannasch, P., Keppler, D, & Weber, G., eds, Liver CeP Carcinoma. Falk Sympоsium No. Si. Dordrecht, Kluwer Academic Publishers. pp. 107-111
Nedjar, S., Mitchell, F. & Biswas, R. (1994) Simultaneous amplification and detection of specific hepatitis B virus and hepatitis C virus genomic sequences in serum sam-ples. J. Med. Viral., 42, 212-216
Ohto, H., Terazawa, 5., Sasaki, N., lino, K., Ishiwata, C., Kaki, M., цjiie, N., Endo, C., Matsui, A., Okamoto, H., & Mishiro, S. (1994) Transmission of hepatitis C virus from the mothers to infants. New Engl. J. Med., 330, 744-756
Okamoto, H., Okada, 5., Sugiyama, Y., Tanaka, T., Sugai, Y., Akahane, Y., Machida, A., Mishiro, 5., Yoshizawa, H., Miyakawa У. & Mayumi, M. (1990) Detection of hepati-tis C virus RNA by a two-stage polymerase chain reaction with two pairs of primers deduced from the 5'-nonсоd-ing region. Jpn J. Exp. Med., 60, 215-222
Okuno, H., Xie, Z., Lu, B., Qin, X., Takasu, M., Kano, H., 5hiozaki, У. & moue, К. (1994) A low prevalence of anti-hepatitis C viгus antibody in patients with hepatocellu-1ar carcinoma in Guangxi Province, southern China. Cancer, 73, 5 8-62
Ozturk, M. (1991) р53 mutation in hepatocellular carci-noma after aflatoxin exposure. Lancet, 338, 1356-1359
Paterlini, P. & Brechot, C. (1994) Hepatitis B virus and primary liver cancer in hepatitis B surface antigen positive and negative patients. In: Brechot, C., cd., Primary Liver Cancer
Pisani, P., Parkin, D.M., Munoz, N. & Ferlay, J. (1997) Cancer and infection: estimates of the attributable frac-tion in 1990. Cancer Epidemiol. Biornarkers Prey. (in press)
Poll, 5., Driss, F., Carnot, F., Michel, M.-L., Berthelot, P. & Brechot, C. (1993) Vaccination against hepatitis B virus; an efficient immunotherapy against hepatitis B multi-plication. C.R. Acad Sri. Paris, Life/sciences, 316, 688-691
Qian, C., Camps, J., Maluenda, M.D., Civeira, M.P. & Prieto, ], (1992) Replication of hepatitis C virus in peripheral blood mononuclear cells. Effect of alpha-interferon therapy. J. Hepatology, 16, 380-383
Qian, G.-S., Ross, R.K., Yu, M.C., Yuan, J.-M., Gao, Y.-T., Henderson, B.E., Wogan, G.N. & Groopman, J.D. (1994) A fallow-up study of urinary markers of aflatoxin expo-sure and liver cancer risk in Shanghai, People's Republic 0f China. Cancer Epidemiol. Biomarkers Prey., 3, 3-10
Quint, W.G. Ieijtink, R.A., Schirm, J., Gerlich, W.H. & Niesters, Н.G. (1995) Reliability of methods for hepatitis B virus DNA detection. J. Clin. Мicrobiы., 33, 225-228
Ranki, M., Schatzl, H.M., Zachoval, R., Uusi-Oukari, M. & Lehtovaara, P. (1995) Quantification of hepatitis B virus DNA over a wide range from serum for studying viral replicative activity in response to treatment and in rесиr rent infection. Hepatology, 21, 1492-1499
Ross, R.K., Yuan, J.-M, Yu, M.C., Wogan, G.N., Qian, G.-S., Tu, J.-Т., Groopman, J.D., Gao, Y.-T. & Henderson, B.E. (1992) Urinary aflatoxin biomarkers and risk of hepato-cellular carcinoma. Lancet, 339, 943-946
Sakuma, K., Saitoh, N., Kasai, M., Jitsukawa, H., Yoshino, I., Yamaguchi, M., Nobutomo, K., Yamumi, M., Tsuda, F., Komazawa, T.,Nakamura, T., Yoshida, Y. & 0kud, K. (1988) Relative risks of death due to liver disease among Japanese male adults having various statuses for hepati-tis Bs and e antigen/antibody in serum: a prospective study. Hepatolо у, 8, 1642-1646
Schiffman, M.H., Kiviat, N.B., Burk, R.D., Shah, K.V., Daniel, R.W.; Lewis, R., Kupers, J., Manos, М.M., Scott, D,R., Sherman, М.E., Kurman, R.J., Stoler, 1.1., Glass, A.G., Rush, B.B., Mielzynska, I. & Lbrincz, A.T. (1995) Accuracy aid interlaboratory reliability of human papil-lomavirus DNA testing using Hybrid Capture. J. CIiп. Microbiol., 33, 545-550
Schmid, M., Pirovirig, M., Altorfer, J., et al (1982) Acute hepatitis non-A, non-B: are there any specific light microscopic features? Liver, 2, 61-67
Seelig, R., Renz, M. & Seelig, H.Р. (1992) PCR (polymerase chain reaction) in the diagnosis of viral hepatitis. Ann. Med., 24, 225-230
Sherman, М.E., Schiffman, M.H., Lorincz, A.T., Manos, M.M., Scott, D.R., Kurman, RJ., Kiviat, N.B., Stolen, M.,
141

Appicalion of Biomarkers in Cancer Epidemiology
Glass, A.G. & Rush, В.B. (1994) Toward objective quality assurance in cervical cytopathology. Corrrelation of cyto-pathologic diagnoses with detection of high-risk human papillomavirus types. Am. J. Clin. PatiwL, 102, 182-187
Sherman, M., Peitekian, K.M. & Lee, C. (1995) Screening for hepatocellular carcinoma in chronic carriers of hepatitis В virus: incidence and prevalence of hepatocel-luiar carcinoma in a North American urban population. Hep atology, 22, 432-438
Simmonds, P., Alberti, A., Alter, H.J., Bonino, R, Bradley, O.W. & Brechot, C. (1994) A proposed system for the nomenclature of hepatitis C virus genotypes. Hep atology, 19, 1321-1324
Stewart, A'-C., Eriksson, A.M., Manos, M.M., Munoz, N. & Wheeler, C.М. (1996) Intratype variation in 12 human papillomavirus types: a worldwide perspective. J. Viril., 70, 3127-3136
Stroffolini, T., Chiaramonte, M., Tiribelli, C., Villa, Е., Simonetti, R.G. Rapicetta, M., Stazi, М.A., Bertin, T., Croce, S.L., Trande, P., Magliocco, A. & Chimie, P. (1992) Hepatitis C virus infection, HBsAg carrier state and hepatocellular carcinoma: relative risk and popula-tion attributable risk from a case-control study in Italy. J. Hepatology, 16, 360-363
Su, Q., Liu, Y., Zhang, Ѕ. L1, D. & Уang, J, (1994) Expression of insulin-like growth factor II in hepatitis B, cirrhosis and hepatocellular carcinoma: its relationship with hepatitis B virus antigen expression. Hepatology, 19, 788-799
Szmuness, W. (1978) I-iepatoce11ular carcinoma arid the hepatitis B virus: evidence for a causal association. Frog. Med. Viril., 24, 40-69
Tabor, Е. (1994) Tumor suppressor geler, growth factor genes, and ondogenes in hepatitis B virus-associated hepatocellular carcinoma. J. Viril., 42, 357-365
Tanaka, K., Hirohata, T., Kopa, s., Sugimachi, K., Kanematsu, T., Ohryohji, F., Nawata, H., Ishibashi, H., Maeda, Y., Kiyokawa, H., Tokunaga, K., luta, Y., Takeshita, S., Arase, Y. & Nishino, N. (1991) Hepatitis C and hepatitis B in the etiology of hepatocellular carci-noma in the Japanese population. Cancer Res., 51, 2842-2847
Thursz, M.R., Kwiatkowski, D., Aisopp, С.Е.М., Greenwood, B.M., Thomas, H.C. & Ill, A.V.S. (1995) Association between an МНС class II allele and clearance of hepatitis B virus in the Gambia. New Rugi. J. Med., 332, 1065-1069
Tito, L., Sinchez, J.M., Costa, J., Jove, J., Vilella, A., Bruguera, M. & Rodes, J. (1990) Long-term follow-up of chronic NANB (C) hepatitis C [abstractJ. Ј. Hepatoligy (suppl. 2), S61
Tsen, Y.J., Chang, M.H., Hsu, H.Y., Lee, C.Y., Sung, J.L. & Chen, D.S. (1991) Seroprevalence of hepatitis B virus infection in children in Taipei, 1989: five years after a mass hepatitis B. vaccination program. J. Med. Viril., 34, 96-99
Vail Mayans, M., Calvet, X., Bruix, J., Bruguera, M., Costa, J., Estève, J., Bosch, F.X., Bm, C. & Rodés, J. (1990) Risk factors for hepatocellular carcinoma in Catalonia, Spain. Iпt. J. Cancer, 46, 378-381
Villenueve, J.P., Desrochers, M., Infante-Rivard, C., Willems, B., Raymond, G., Boursier, M., Сôté, J. & Richer, G. (1994) A long-term follow-up study of asymptomatic hepatitis B surface antigen-positive carriers in Montreal. GastraenteroIogy, 106, 1000-1005
Walboomers, J.M.M., de Roda Husman, A,-M., van den Bruie, A.J.C., Snijders, P.J.F. & Meije, C.J.L.M. (1994) Detection of genital human papillomavirus infections: critial review of methods and prevalence studies in rela-tioп to cervical cancer. In: Stern, P.L. & Stanley, M.A., eds, Human Pариllamavгrus arid Cervical Cancer: Biology and immunology. Oxford, Oxford University Press, pp. 41-71
Whittle, H.G., Inskip, H., Hall, A.J., Mendy, M., Downes, R. & bare, Ѕ. (1991) Vaccination against hepatitis B and protection against chronic viral carriage in The Gambia. Lancet, 337, 747-750
Yuan, J.M., Ross, R.K, Staпczуk, F.Z., Govindarajan, S. & Gao, Y.T. (1995) A cohort study of serum testosterone and hepatocellular carcinoma in Shanghai, Chaina. lot. J. Cancer, 63, 419-493
Zaaijier, H.L., Cuypers, H.T.M., Reesink, H.W., Winkel, IN., Gerken, G. & Lette, P.N. (1993) Reliability of poly-merase chain reaction for detection of hepatitis C virus. Lancet, 341, 722-724
Zhang, У.Y., Hansson, B.C., Kuo, L.S., Wide11, A. & Nordenfelt, E. (1993) Hepatitis B vims DNA in serum and liver is common!y found in Chinese patients with chronic liver disease despite the presence of antibodies to HBsAg. Hepafology, 17, 538-544
Corresponding author N. Munoz . Unit of Field and Intervention Studies, International Agency for Research on Cancer,` 150 cours Albert Thomas, F-б9Э72, Lyon Cedex 08, France
142

AppliсаУlon at Biomarkers iii Cancer Epidemiology Toпiolo, R, Bouette, P., Shuker, B.E.G., flouinrrian, N., HuIka, B. arid Pearce, N., ads
'ARC ttdentjtic Fublicaticrie No. 142 International Аgепсу for Research on Cancer, Lyon, 1997
Carcinogen-DNA and carcinogen-protein adducts in molecular epidemiology C.P. Wild and Р. Pisani
Carcinogen-DNA and carcinogen-protein adducts provide an integrated measure of carcinogen exposure, uptake and âbsorption, metabolism, DNA repair and cell turnover. As such they promise to provide a more objective and relevant measure of exposure than that which can be derived from questionnaires and measures of ambient levels of carcinogen. Nevertheless, the interpretation of adduct measurements made in human tissues and body fluids requires an understanding of a number of factors. These include the sensitivity and specificity of the measurement, the temporal relationship between exposure and adduct level and the mechanistic role of the adduct in the process of carcinogenesis.The application of such biomarkers in epidemiological studies therefore necessitates careful consideration of optimal study design. The above issues are illustrated in this chapter with examples from studies in both animal models and human populations.
Chemicals can covalently bind to cellular macro-molecules including DNA, RNA and proteins. The product of this addition.' of a chemical moiety to a macromolecule is termed an adduct. These adducts may be measured in tissues, exfoliated cells, peripheral blood or urine. Other types of DNA damage result from exposure to chemicals or through biological processes such as inflammation, e.g. 8-oxo-deoxyguanosine (8-oxo-dG), although these are not strictly adducts by the above definition. However, for simplicity these types of DNA dam-age are also referred to as 'adducts' in this paper. The measurement of carcinogen-nucleic acid or carcinogen-protein adducts is a promising ap-proach to determining exposure to DNA-damaging carcinogens in humans. The degree to which such measurements can be quantitatively associated with cancer risk at the individual level is not understood.
The measurement of adducts is of potential value in exposure assessment for a number of reasons. First, it may provide a more objective and relevant measure of individual exposure than can be ob-tained by a questionnaire approach. Second, it is potentially highly specific for the exposure of interest. The specificity of adducts makes them particularly suitable when defined compounds' carcinogens are investigated. Third, the measure-ments are often of a high sensitivity. There are, however, numerous issues that can impinge on the
validity of this type of measurement. These issues are of both a conceptual and a practical nature. This paper therefore aims to evaluate current knowledge regarding the validity of adducts as measures of carcinogen exposure and cancer risk in different epidemiological study designs. .
Rationale for use of adducts in exposure assessment The rationale for using measurements of carcinogen-DNA and carcinogen-protein adducts in human exposure assessment is based on the assumption that DNA adducts formed in vivo are responsible for genetic alterations in genes critical for carcino-genesis and that the protein adducts formed through the same processes reflect the formation of DNA adducts. From this basic assumption, a number of extrapolations are made to allow the measurements to be carried out with the available methodologies in available human samples, e.g. in surrogate tissues as opposed to the target tissue. As presented in Fig. 1, these extrapolations include that from the specific DNA sequence level within specific genes to the level of genomic DNA, that from the single cell to the target tissue or organ, and that from the target organ to peripheral blood. In addition, as mentioned above, extrapolations are also made from DNA to protein adducts. This illustrates that, in the majority of instances, what
143

Application of 8iomarkers in Cancer Epidemiology
Decreasing proximity to critical lesions
DNA Cell Organ Peripheral sequence blood/urine
Gene Tissue Exfoliated cells
Figure 1. Measurement of carcinogen—DNA and DNA—protein adducts: proximity to critical lesion.
is actually measured is far removed from what one would ideally measure. 5uсh 'surrogate' measures require validation for their relationship to the 'ideal measure.
An example of the above issue is the case of afla-toxiпs where a specific mutation at the third nucleotide of codon 249 of the p53 tumour sup-pressor gene in human hepatoce11ular carcinomas (HCCs) has been suggested to result from aflatoxin exposure (Ozturk, 1991). Assuming, for argument's sake, that this is the case, the 'ideal' measure would be aflatoxin-DNA adducts in codon 249 of the р53 gene in human hepatocytes. In reality a few mea-surements have been performed on total genomic DNA from liver (Zhang et al., 1991) but most epi-demiological studies have been performed using aflatoxin-nucleic acid adducts excreted in the urine (Autrup et al., 1987; Groopman et al., 1993) or aflatoxin-albumin adducts in serum (Wild et aL, 1993). Nevertheless, the presence of urinary AFB1-N7-guanine adduct was associated with an increased risk of ICC in a prospective cohort study in the People's Republic of China (Qian et al., 1994). It is noteworthy that, prior to its successful application in this study, this biomarker had undergone extensive validation (Gioopman, 1994) to establish the dose-response relationships between exposure and adduct levels in liver, urine and albumin, both in animal models and in human populations exposed to dietary aflatoxins.
Determinants of adduct levels in vivo Once a chemical carcinogen enters the body, the level of adduct formation will depend upon a number of factors, including the absorption and distribution of the chemical around the body and the organ-specific and cell-specific metabolism (activation and detoxification), The measured adduct level at any one point in time will further depend on the chemical stability of the adduct, any repair processes (for DNA adducts) and cell turnover. Thus, the carcinogen-DNA adduct repre-sents an integration of these different parameters at the individual level, and measures the dose of carcinogen reaching the target molecule for саr-cinogenesis; this has been termed the `biologically effective dose'. It is therefore an integration of both exposure and interindividual variations in metabolism and DNA repair, each of which may be determined genetically and/or be influenced by other environmental exposures. Some DNA adducts are removed by excision repair processes, e.g. N-methylpurine glycosylases (Bessho et al., 1993), or are lost spontaneously, as for example in depuriria-tim, and these addicts can be detected in the urine as free bases or deoxynucleosides (Shukеr & Farmer, 1992). The carcinogen-protein adducts, while not representing events thought to be critical in car-cinogeriesis, are of interest because they may reflect the level of DNA adducts in internal organs (Skipper & Tannenbaum, 1990; Skipper et al., 1994).
Dose-response studies: adducts, mutations and cancer The above rationale for adduct measurement de-pends on the proposed causal link between DNA adducts, mutations and tumour induction. DNA adducts induced by specific carcinogens have been linked to mutations in a number of different types of study, including shuttle vectors containing adducts of specific carcinogens (e.g. Maher et al., 1989; Kat & Thilly, 1994). Mutation spectra in animal tumours in genes involved in the carcinogenic pro-cess are generally consistent with those expected from a knowledge of the types of DNA adduct induced by specific chemicals (GreenЫatt, 1994).
Poirier and Beland (1992) reviewed data in experimental animals where steady-state DNA adduct levels after 1-2 months' chronic exposure have been compared with tumour induction fol-lowing lifetime exposure to the carcinogen, e.g.
144

Carcinogen adducls in cancer epidemiology
aflatoxin B1 (AFB1) for rat and trout liver; diethyl-nitrosamirie for rat liver; 2-acetylaminofluorene (2-AAP) for mouse liver and bladder; ethylene oxide for rat spleen mononuclear ccli leukemia; 4-methyl-nitrosamino)-1-(3-рyridyl)-1-butanone (NNK) for rat lung tumours; and 4-aminobiphеnyl(4-ABP) for mouse liver and bladder tumours. For some of these chemicals, a linear dose-response for both DNA adducts in the target organ and tumour induction were observed (e.g. rat and trout liver with AFB1). However, in other situations, including bladder of female mice with 2-AАF and male mice with 4-ABP, adduct levels increased at all doses but tumours were only induced at the highest doses (Poirier & Beland, 1992; Poirier et al., 1995). Iп the case of the 2-AAF experiments, the tumour induction was seen at dose levels associated with increased cell prolif-eration in the bladder (Cohen & E1lwein, 1990).
There are examples of differences in response to carcinogens between males and females apparently as a result of differences in cell proliferative response rather than DNA adduct formation. One example is that of rats treated with 2-amino-l-methyl-6-phеnylimidazo[4,5-b]pyridinе (PhIP) (Ochiai et al., 1996). In this experiment rats were given PhIP in the diet for up to 12 weeks, and DNA adducts, cell proliferation and aberrant crypt foci were measured in the colon. PhIP-DNA adduct levels were the same in male and female rats, but the incidence of aberrant crypt foci was threefold higher in male than in female rats. This increase was associated with a 42% increase in labelling index in the male colon compared with the female colon after 8 weeks treatment.
In the studies of rat lung with NNK, the deter-mination of DNA adducts in specific cell popula-tions within the lung was important if the dosе-response curve for tumour induction in that organ was to be understood (Belinsky et aL, 1987, 1990). This study illustrated that adduct measurements iп DNA extracted from total tissue are not necessarily related to tumour induction, but rather that the target cell population needs to be identified.
The studies cited above compared the DNA adduct levels in one set of animals with the tumour incidence in a parallel set of animals. The former were treated with carcinogens under the same regimen but for a shorter duration, sufficient to allow steady-state adduct levels to be reached. There are few studies which have related DNA
adducts and tumour incidence at the level of the individual animal. One attempt to perform such an experiment was reported by Fischer and Lutz (1995) who examined the induction of papillomas on skin after exposure of outbred mice to 7,12-dimethyibenz[aj-anthracene (DMBA). These authors used the latency period to appearance of the first papilloma as an indicator of individual risk. DMBA-DNA adducts, 8-OHdG adducts and cell division were determined in the dermis of the treated skin area 2 weeks after the appearance of the first papilloma. The data indicated a positive correlation between shorter latency period of papilloma induction and both 8-OHdG levels and cell proliferation. However, DMBА DNА adducts were significantly higher in the animals with longer latency period. This was explained by the lower rate of cell division in these animals compared with those with short latency, resulting iп a slower `dilution' of the DNA adduct concentration after the end of treatment. This again indicates that measurement of carcinogen-DNA adducts does not always reflect individual risk of tumour induc-tion. The data on 8-ОHdG ате of particular interest given the growing body of evidence showing that secondary reactions resulting from carcinogen exposure could be of importance in addition to the primary formation of DNA adducts (see below).
These above data suggest that DNA adducts are necessary but not sufficient to result in turnours with these chemical carcinogens. Consequently, while measurements of DNA adducts in a given tissue are certainly evidence of exposure of the target organ to the carcinogen, they are unlikely to be sufficiently informative alone to predict tumour incidence in that organ at the individual level. The important role of cell proliferation both in car-cinogenesis and in determining adduct levels is supported by the above observations. The degree to which the above mechanisms interfere with the association between exposure and DNA adduct lev-els in human populations needs to be taken into account when incorporating these markers into epidemiological studies.
Methods for measuring carcinogen adducts Many sophisticated techniques have been developed to measure adducts in human tissues and cells. These generally include a clean-up step(s) followed by an analytical step. Clean-up steps comprise solvent
145

Application of Biomarkers in Cancer Epidemiology
Dietary affatoxins Diet Tobacco
BaP-DNA adducts
Aflatoxin-albumin Occupation Air pollution adducts
Specific Non-specific
Figure 2. Is the adduct specific for the exposure under study? BaP, benzo[a]pyrene.
extractions, solid-phase extraction, immunoaffinity, liquid and gas chromatography, etc. Analytical tech-niques comprise mass spectrometry, immunoassays, fluorescence, UV or electrochemical detection, etc. These approaches all have inherent strengths arid weaknesses which have been reviewed in depth in a number of comprehensive reviews and are not repeated here (Wogan, 1988, 1992; Shuker & Farmer, 1992). In general, the above methods are of a high sensitivity, i.e. they can measure the adduct at low levels in the biological sample. For example, the 32Р-postlabelhng technique has permitted detection of adducts at the level of one adduct per mammalian genome (Chacko & Gupta, 1988). The value of such sensitivity is illustrated by the ability to identify 4-arninobiphenyl—Hb adducts in the blood of non-smokers exposed to environmental tobacco smoke (Hammond et a1., 1993). The presence of carcinogen adducts in human cells and body fIuids following environmental, occupational and therapeutic expo-sures has been documented and reviewed (Wogan, 1992).
Interlaboratory comparisons of methods have been relatively few and appear to have been organized mainly on an ad hoc basis between research groups. An exception to this is an interna-tional coltaborative study organized by the US Environmental Protection Agency and supported by the European Union, in collaboration with the NCI and NCTR, USA, coordinated by the 'ARC, France (Dr M. Castegnaro), and the CRC, UK (Dr D. Phillips). This collaboration aims to develop stan-dard protocols for the analysis of specific adducts by the ЗгР-postlabel1ing approach. In addition, DNA adduct standards for different chemical car-dnogens are being prepared. This type of method
standardization is clearly an important process if large-scale, multicentre studies are to be performed with sample analysis being conducted in different laboratories.
Multiple adducts from individual carcinogens As mentioned above, the specificity of adduct mea-surements for exposure to a particular carcinogen is one of the potential benefits of this approach. Measurement of specific adducts is based on the elu-cidation of the chemical structure of the adduct. With this information, adduct standards can be pre-pared, antibodies raised to the adduct, the fluores-cent, UV and electrocheinical properties etc. investi-gated, aid appropriate analytical techniques devel-oped. It is this basis that permits the measures to be specific for the agent of interest. Other methodolo-gies to measure DNA adducts, notably the zР-post-labe11ing technique, as originally developed, or immunoassays analysing intact DNA, forfeit a degree of specificity but are appropriate as an approach to measuring exposure to a defined class of carcino-gens. This is valuable in situations of exposure to complex mixtures of chemicals (Perera et "L, 1990).
To date, several hundred carcinogen—DNA adducts have been identified (Hemminki et "L, 1994). In the majority of cases even a specific car-cinogen forms adducts at different sites on the same molecule. For example, a simple environmental methylating agent such as dimethyl-nitrosamine results in at least 12 different DNA adducts (Margison & O'Conner, 1979). hn this case the most abundant adduct, 7-mеthylguапiпe, does not appear to be the most relevant for induction of mutations but rather the minor O-methylated bases, 0-methylguanine (O6-mеG) and 04-methуlthуmidiпe, are the promutagenic adducts (Pegg, 1984; Richardson et"L, 1987).
A compound may also form chemically distinct types of adduct, which differ in their degree of speci-ficity for a given exposure. For example, the tobacco-specific nitrosamine (TSNA) NNK can induce both methylation adducts aid pyridyl-oxobutylation adducts. While the O-methylation adducts (e.g. Об meG) may be the source of mutations induced by this compound, the adduct is not specific to TSNfl but is also formed as a result of exposure to other environmental niethylating agents as well as to endogenously formed methylating agents (Bartsch & Montesano, 1984). In this case, the pyridy-
146

Carcinogen adducts in cancer epidemiology
Absorption bioactivation
Chemical exposure DNA adduct
detoxification
e.g. AFBi e.g. AFBi—Ni—G \ - -
secondary DNA damage - - - - Y
e.g. apurinic site AFB1 —Fгpy -~
Biological process Oxidative DNA damage
e.g. inflammation e.g. 8—oxo—G lipid peroxidation
Figure 3. Formation of DNA damage via different pathways.
loxobutyl adducts would be а more specific marker for exposure to TSNA.
A highly specific measure of a given adduct is therefore not equivalent to having а highly specific marker for a given exposure. For example, while afla-toxin—albumin adducts are specific for dietary expo-sure to aflatoxins, benzo[а]pyrene—DNA adducts can result from tobacco smoke, air pollution, diet and/or occupation (Fig. 2). In this case, use of this latter marker as a measure of exposure to air pollutants would need to be complemented by measures of the possible confounding exposures mentioned.
It is necessary to ensure that adducts do not result from sources other than from the covalent binding of a chemical to a macromolecule in the body. specific examples are the difficulties of discriminat-ing the naturally occurring ribonucleoside 7-methyl-guanosine from the DNA adduct 7 methyl-deoxyguanosine (Bianchini et al., 1993) and the presence of 3-mеthylаdeniпe as a natural compi-lent of the diet (Shuker & Farmer, 1992).
A further complication regarding specificity and relevance of adduct measurements is that the ini-tial adduct formed in DNA may not be the critical lesion involved in mutagenesis. This is illustrated by the example of AFB1 presented in Fig. 3. This
carcinogen is activated to an AFBI 8,9-epoxide which binds predominantly, although perhaps not exclusively, to the N7 position of guanine (Martin & Garner, 1977; Essigmann et al., 1977). However, this adduct is highly unstable and through either active DNA repair or spontaneous depurinatioin results in formation of an apurinic site in DNA. The mutation spectra observed in bacterial sys-tems, in mammalian cells hi vitro and in rodent and human tumours are consistent with a miscod-ing event resulting from this apurinic site (Trottier et aL, 1992). The free AFB1-N7-guanine base is excreted in the urine and can be detected by immunoaffinity/HPLC as a marker of human exposure (Groopman et aI. 1993); this is a good marker of initial hepatic DNA adduct levels (Groopman et iL, 1992). However, the AFB1-N7-guanine in DNA can also undergo a chemically induced imidazole-ring cleavage such that the major DNA adduct in rat liver 48 h post-treatment is the imidazole ring-open AFB1-N7-guanine, known as AFB1-Papy (Hertzog et al., 1982). There-fore, the adducts measured in human liver tissue are most probably the AFB1-Papy rather than the presumed mutagenic lesion. The situation is fur-ther complicated by the fact that, at least in rat
147

Application of Biomarkers in Cancer Epidemiology
liver, treatment with AFB1 results not oniy in direct binding of AFB1 to DNA but also in an oxidative stress with a consequent increase in oxidative DNA damage (5hen etaL, 1994, 1995). In this type of exposure situation, the choice of the most informative biomarker would be facilitated by an understanding of which adduct is involved in the generation of mutations in critical genes for carcinogenesis. The AFВ1-N7-guanine adduct and the AFB1 albumin adduct are the most specific markers of exposure to AFBI, but the complemen-tary information from measurements of oxidative damage in the same subjects would be valuable. It is interesting in the above example that both AFB 1 and oxidative stress appear to preferentially target mutations to the third nucleotide of codon 249 of the p53 gene (Aguilar et al., 1993; Hussain et aL, 1994), a mutation in human hepatoceIlular carci-nomas that has been suggested to be induced by aflatoxin exposure (GrеeпЫatt et al., 1994).
The need to understand the adducts involved in mutageaesis is further illustrated by a study of mutational spectra in the c-Ha-ras gene in mouse skin papillomas induced by several aromatic hydrocarbons (Chakravarai et al., 1995). In this study the authors argued that the mutations (G to T or A to T transversions) were consistent with apurinic sites resulting from depurination at gua-nines and adenines rather than being the result of stable DNA adducts, the latter being what would normally be measured in molecular epidemiology studies. For example, this observation was sug-gested to be the case with benzo[a]pyrene which forms a significant proportion of stable C-8 gua-nine adducts, which have been the basis of many measurements of carcinogen exposure in human tissues. The above data at least suggest that assays of apurinic sites would be a valuable addition to methods for monitoring DNA damage in humans.
Overall, these examples illustrate the need for detailed information on adduct formation and the mutageuic potential of those adducts in choosing an appropriate end-point for exposure assessment. In addition, the need to understand the different exposures that can yield a specific chemical саr-cinogen adduct is indicated.
Protein adducts as alternatives to DNA adducts Although proteins are not the target for muta-tional events, they are nevertheless an attractive
alternative to DNA as target molecules (Skipper & Tannenbaum, 1990; skipper et al., 1994). This is because proteins are often available in larger amounts than DNA and also because the lack of repair of protein adducts results in a greater persis-tence (see below), and therefore the measured level is more closely correlated with past exposure. In practice, in epidemiological studies the measure-ment of protein adducts has been restricted to albumin (Aib) and haemoglobin (lb) because of the ready availability of these proteins in periph-eral blood. The identification of adducts on his-tones has been reported for some carcinogens (Ozba1 et al., 1994). The longer half-life of histones compared with Alb and lb is one advantage of their use as dosimeters, as is the proximity of his-tones to DNA. In addition, histones may also play a role in gene regulation, and, consequently, the modification of histones by carcinogens may have a functional role iп carcinogenesis. The use of other long-lived proteins, including collagen, has also been discussed aid could be applicable to molecular epidemiological studies in the future (skipper et aL, 1994).
Target organs and surrogate tissues As mentioned above, one of the potential advan-tages of examining DNA adducts is that they can be measured in the target cells for carcinogenesis. However, in many cases these cells are not avail-able and alternative sources of DNA or proteins are used. Many studies have utilized DNA from periph-eral blood cells (PBC), bronchiolar lavages or oral cavity as well as adducts excreted in the urine. In only a few cases has the association between adduct levels in the target organ and those in the surrogate tissue or body fluid been examined in humans.
In animal studies, the ratio between DNA adducts in liver and PBC has been examined for a number of carcinogens aid these data were recently reviewed (Bianchini & Wild, 1994а, 1994b). The ratios varied from 0.1 to 100 with even the small number of carcinogens studied. In a series of four methylating agents having different target organs for carcinogenesis, the ratio between liver and PBC for 7-mеG levels was relatively con-stant, but the ratio between the target organ (lung, colon, oesophagus and liver) and PBC ranged from 3.6 to 200. These data suggest that the methylation of PBC DNA is occurring in the liver by transfer of
148

Carcinogen adducts iп cancer epidemiology
active methylating species from the hepatocyte to the PBC.
In humans, aromatic DNA adducts in buccal mucosal cells were highly correlated with levefs of the same adducts in oral biopsies from the same individuals (Stone et aI., 1995). This type of corre-lation might be expected in cells coming from the same tissue, especially where cell turnover is rapid and therefore adduct levels reflect mainly recent exposure. There was also a good correlation be-tween 7-теG levels in bronchial tissue and PBC in one study based on only five subjects. A low but significant correlation of 0.34 between po1ycyclic aromatic hydтocarbon (PAH)—DNA adducts in PBC and lung cancer tissue was reported in the study by Tang et a2. (1995). In the same study, the DNA adduct levels in PBC did not correlate with levels in non-tumour lung tissue. Another study reported no correlation between the total PAl—DNA adduct levels in lung and PBC, but a significant correla-tion in the case of the major DNA adduct (van Schooten et aL, 1992). Aromatic DNA adducts mea-sured by 32Р-labelling assay were highly correlated in non-tumour lung tissue of lung cancer patients and peripheral blood mononuclear cells (r = 0.74) (Wiencke et al., 1995); moreover, adduct levels in both tissues correlated negatively with years since quitting smoking. The study suggested that aro-matic DNA adducts in peripheral blood mononu-clear cells could be an indicator of the DNA dam-age caused by smoking in lung tissue. Phillips et al. (1990) carried out a similar study, looking at aro-matic DNA adducts in non-affected lung tissue and SBC. They found that adducts in the lung corre-lated with smoking habits, but that the marker assessed in PBC did not. In around 10 larynx can-cer patients the levels of aromatic DNA adducts as determined by 32Р-postlabelling in larynx tumour tissue and surrounding non-tumorous tissue corre-lated well with adducts in PBC (Szyfter et al., 1994). Thus, to date, there are some published data to support a correlation between DNA adducts in PBC and those in internal organs, although the limited number of studies should be noted and further similar studies conducted where possible.
Persistence of adducts Once an adduct has been formed, its persistence will depend on a number of factors, namely its inherent chemical stability, whether any active
repair processes are present, and the turnover of the macromolecule to which the chemical is bound. This parameter of persistence is particularly critical in determining the appropriate epidemiological study design in which to apply adduct measurements.
In the case of DNA adducts, the chemical stability is highly variable. For example, the AFB1- N7-G adduct is lost by depurination with a half-life of around 8 h in rat liver (Groopman et al., 1992). A proportion of the initial adducts are, however, susceptible to imidazole ring-opening to form a more stable AFB1-Fapy adduct which has been reported to persist in rat liver DNA as long as 19 weeks after the last treatment.
In addition to the inherent chemical stability of the DNA adduct, there are also active repair enzymes. For example, in human cells, the methy- lated DNA bases N7-methу1dеoxyguaпasiпе and N3-methуldeoхyadeпasiпе, as well as 8-oxo-guanine, are repaired by the N-methylpurine glycosylase enzyme, although at markedly different rates (Male etaL, 1987; Bessho et аL, 1993). The ОЬ-теG adduct is repaired efficiently in most human tis- sues by the ОЬ-alkylguanine DNA alkyltransferase. The situation is rendered more complexby the fact that DNA repair activity is not uniform throughout the genome, with moie rapid repair of some types of DNA adduct occurring in transcribed as opposed to non-transcribed genes and with а strand bias for the transcribed strand (Bohr, 1991; May et al., 1993). This appears to be of importance in the process of carcinogenesis as there is a predomi-nance of mutations in the non-transcribed strand of the p53 tumour suppressor gene (Greenblatt et аI., 1994).
Persistence of adducts is also dependent on the stability of the molecule to which the chemical is bound. Iп the case of DNA this is essentially trans-lated as the rate of cell turnover. Thus adducts in epithelial cells lining the large bowel or in neutrophils in peripheral blood (half-life = 8 h) will be far less persistent than adducts in non-pro-liferating tissues such as brain or liver or in long- lived T-lymphocytes. In fact, one would predict that DNA adduct levels in the same individual should be higher in lymphocytes than totalleuko- cytes. This has been rarely studied, but in those cases where it has been examined the levels were higher in the longer-lived cells (Mustorien & Hemminki, 1992). It is interesting that the differ-
149

Application of Biomarkers in Cancer Epidemiology
еncеs in adduct levels between smokers and non-smokers in this study were observed in totalleuko- cytes, granulocytes and lymphocytes, suggesting that recent exposure over the past 1 or 2 days was correlated with past exposure of a few months. The differences may not be so consistent in exposures of more intermittent pattern.
One consequence of the above complexity of DNA adduct formation and persistence is that half-lives of different DNA adducts need to be empirically determined.. A second consequence is that most measurements of DNA adducts in human organs will be an average measure of events at the sequence, gene, cell and tissue lev-els.
The situation for carcinogen-protein adducts is somewhat simpler than for the DNA adducts. In general it has been assumed that in the absence of active repair the adducted protein would have the same half-life as the unadducted тоleсиle- i.e. in the case of haemoglobin, a half-life of around 120 days, and for albumin adducts around 20 days. Surprisingly, this has not been confirmed for many adducts by longitudinal studies either in animals or humans. Carmella and Hecht (1987) examined the half-life of a tobacco-specific nitrosamine-Hb adduct in rats and reported that, with a half-life of 9.1 days, this was significantly shorter than expected. Given the first-order kinetics of adduct loss, this was most probably the result of instability of the adduct rather than a preferential clearance of the chemi-cally modified haeunog1obiri.
Iп humans, only a few studies have been reported, for the most part relating to subjects who stopped smoking for an agreed period of time. For example, in a study of 4-аminobipheпуl-Hb (4-ABP-Hb) adducts, smokers stopped smoking for a period of up to 80 days and the observed rate of decline of the adducts was significantly in excess of that expected (Maclure et al., 1990). In the study by Mooney et aI. (1995) both 4-ABP-Hb and PAH-DNA adduct levels were monitored in volunteers for up to 14 months after they stopped smoking. Both markers were significantly de-creased 10 weeks after smoking cessation and the half-lives were estimated to be 23 weeks (95% CI, 10.5-36.3) and 12 weeks (95% CI, 9.9-14.0) for PAH-DNA adducts and 4-ABP-Hb adducts respec-tively.
Adduct stability during storage and analysis The attraction of applying measures of adducts in prospective studies is easy to appreciate. However, a particular issue of concern in the context of long-term storage of biological samples is the stability of adducts. This is of concern both in the initial phases of sample collection and processing and in the storage of biological samples in freezers over many years. Unfortunately there are few data on this topic. It is generally accepted that rapid pro-cessing of biological samples to storage at low tem-peratures is desirable to avoid continued enzyme activity, which would degrade DNA and proteins or repair adducts after isolation. Postmortem sta-bility of DNA has been examined (Bar et al., 1988). However, there is little information on the impact on adduct levels in, for example, peripheral blood cells that have been isolated and frozen im-mediately after isolation or several hours later. Similarly, there are few data on the levels of adducts in the same samples after storage under different temperatures for different lengths of time. The stability of benzo[ajpyrene diolepoxide adducts in rat liver, lung and heart has been tested under various conditions (Izzotti et aI., 1993). These authors reported that adducts were stable in tissues up to 72 h at 4°C, but significant decreases were observed at 20°C or 37°C even after periods as short as 24 h. Under conditions that mimicked autopsy conditions, i.e. 16 h at 20°C or 16 h at 20°C followed by 24 h at 4°C, no significant varia-tion in adducts was observed. Similar studies for other adducts, in different tissues and under dif-ferent conditions of storage, would be of value.
Another issue is the artefactual formation of adducts during sample processing, where the reac-tion that leads to adduct formation in vivo can occur during sample storage or analysis. This is possibly best illustrated by the situation with oxi-dized bases where oxidation reactions must be avoided during sample preparation and analysis. This can occur during DNA preparation (Claycamp, 1992) or during analytical procedures, e.g. the for-mation of 8-oxo-dG and other bases during the silylation process prior to GC-EI1S analysis (Doukl et aL, 1996). The appearance of hydroxyethylvaine in haemoglobin during storage of glоЫп under dif-ferent conditions has also been noted (Torngvist, 1990). While the artefactual formation of adducts is not likely to be a problem with chemical car-
150

Carcinogen adducis in cancer epidemiology
cinogens, it is worth noting that it is not only lim-ited to oxidized bases. Scates et al. (1995) recently illustrated the artefactual formation of DNA adducts by bile acids in vitro, and the danger of induction of W photoadducts during DNA purifi-cation has been noted (Widlak et aL, 1995).
The possible artefactual formation of DNA adducts therefore merits attention during method development.
Epidemiological study design and adduct measurements A number of the above aspects of carcinogen—DNA and carcinogen—protein adducts have implications for the appropriate use of adducts in epidemiolog-ical studies. These are now discussed in relation to specific study designs. A comprehensive review on this topic has been published by Rothman et aL (1995).
Application of adducts in case—control studies is limited when current and past exposures do not correlate within individuals; this may happen as a direct consequence of the disease, e.g. dietary habits, or because the exposure is not related to personal habits and, therefore, is more likely to change over time, e.g. occupational activities. 1n the case of diet and occupation, objective markers of exposure to specific chemicals would greatly increase the informativeness of the studies. How-ever, to date, adduct measurements have not gen-erally offered arr improvement over questionnaire data on exposure in case—control studies. In a case—control study of aflatoxin exposure and liver cancer the aflatoxin—albumin adduct level was cor-related with measurements of aflatoxins in house-hold foods in the controls but not in the cases (Hall & Wild, 1994). This suggests that either the dietary intake of aflatoxins was affected by the dis-ease or the disease itself modified the metabolism of the carcinogen (Hall & Wild, 1992). In a study of lung cancer, PAH—DNA adducts in PBC of cases were significantly higher than in controls, with an odds ratio of 7.7 (95% CI 1.7-34, P<0.01) (Tang et аI., 1995). In this study, adduct levels were signifi-cantly associated with questionnaire-derived indices of smoking among the cases but not among the controls, suggesting a difference in biological response to smoking between these two groups.
In case—control studies of occupational cancer, retrospective assessment of exposure to specific
chemicals in the workplace can be performed by linking job descriptions obtained normally by interview with documented usage and presence of the chemicals in the occupational activity от industrial process described. This linkage can be systematized in the so-called job-exposure matri-ces OEMs) (Coggon etal., 1984). The JEM approach represented a substantial improvement on the clas-sical analysis of cancer risks by job title, because JEMs provide a reference category of non-exposed individuals and increase the study power by pool-ing all the individuals exposed to the same agent from different jobs into one `exposed' group. However, there are limitations in that categories of exposure are only probabilistic; intensity of expo-suie cannot be assessed on a common scale for the majority of job titles in the population; high mis-classification rates across exposure categories have been documented; and, finally, transferability of JEMs developed for one specific study to a new investigation is limited (Goldberg et al., 1993).
In spite of these limitations of JEMs, cross-sectional individual assessment of internal dose or biologically effective dose (adducts) cannot replace questionnaire information, because current expo-sure is a bad indicator of past exposure in this instance. Most occupation-related cancer cases occur in retirement age, and even in the active age groups the proportion of those who move from one economic activity to another, changing envi-ronment, work tasks and consequently exposures, tends to be rather high. A better application of adduct measurements in this context is the valida-tion of associations between jobs and cancer risk detected by case—control JEM-based studies, by determining average biological effective dose in workers classified as 'exposed' and `non-exposed' by the matrix. This type of transitional study can substantially improve the evidence provided by a classical case—control study, and can also add specific knowledge to help in understanding the carcinogenic process.
Adducts as markers of exposure and effective dose have a good application in ecological studies, which relate exposure to a chemical experienced by different populations to their risk of the disease at the group level. In this case the disease does not affect the exposure level assessed in spite of the cross-sectional nature of the observation. Adduct markers have an ideal application when investi-
151

Application of Biomarkers in Cancer Epidemiology
gating the effects of food-borne chemicals and air pollutants that cannot be measured at the individ-uaI level through interview. One example is the study of the relation between aflatoxin intake and the risk of hepatoce11ular carcinoma. Many eco-logical studies have been conducted on this subject, with aflatoxin intake indirectly estimated by the level of contamination of food samples. The results of these studies are heterogeneous and sometimes inconsistent. In one study of this type, conducted in Thailand, aflatoxin—albumin adducts were determined in population samples (Srivatanakul et Ri. , 1991). Another much large study in the Реорlе.'s Republic of China used urinary aflatoxirn metabolites as a measure of exposure and found no correlation with liver cancer rates (Campbell et al., 1990). In this case some of the urinary alatoxin metabolites, in contrast to the AFB1-N7-G adduct, were later shown to be unrelated to dose and thus may have led to misclassification of exposure (Groopman, 1994). Ecological studies of the effect of air pollution in the general population could benefit from the assessment of adduct levels to a chemical commonly contaminating the atmos-phere of urban areas. Many specific and non-specific chemicals aid agents contaminate the air of urban areas, and this multiplicity of exposures may be seen as a serious limitation to the use of markers of specific exposures. However, it has been documented that urban air pollutants follow the same circadian, weekly and seasonal variations, which are mainly determined by atmospheric conditions and cyclic intensity of vehicle traffic. Therefore, a few sentinel markers may be good indicators of a general non-specific exposure to polluted urban air in addition to being markers of internal biologically effective dose to defined car-cinogens. It should be mentioned, however, that ecological studies of air pollution should not rely only on markers such as adducts, which are the result of exposure to specific chemicals irrespective of the external source of that exposure. Con-sequently, while adducts can be incorporated into descriptive studies of this type to improve under-standing and interpretation, it is necessary to carefully consider possible independent sources of exposure to the same chemicals as potential confounders. For example, a study comparing PAH DNA adducts in a highly industrialized area of Poland with those in rural areas showed an
increased PAH—DNA adduct level in peripheral blood cells of subjects from the former population (Perera etal., 1992). The authors showed that after adjusting for current smoking, another potential source of PAH—DNA adducts, adduct levels were still positively associatéd with air pollution.
Among ail observational studies, the prospec-tive study is the design in which the potential for comparison biases is the least serious: the adduct is detected in material collected when the disease was not clinically manifest and, although the presence of latent disease cannot be excluded, analysis by time since exposure assessment can help in inter-preting the results.
The most cost-effective way to analyse cohort studies, particularly when assessment of biological material is involved, is the nested case—control design, which consists of the analysis of the cases detected during the follow-up of the cohort, and of only an appropriate sample of those who do not develop the disease; this sample is in general a very small fraction of the entire cohort. The first exam-ple of a measure of a DNA adduct being associated with an excess cancer risk was provided using this type of study design (Ross et al., 1992; Qian et al., 1994). In this instance, AFB1-N7-G adducts in a single urine sample collected from a cohort in Shanghai, People's Republic of China, was associ-ated with an increased risk of hepatoce11ular carci-noma. This type of study is needed to strengthen the rationale for using adducts as measures of out-come in epidemiological studies.
Besides potential confounders, which depend on the disease investigated, some additional match-ing of variables in nested case—control studies needs to be considered; these are the determinants of the accuracy of the adduct measurements previ-ously described. Samples of cases and matched controls should be analysed in the same batches in order to distribute equally the effects of sample processing; in addition, controls should be selected so that their samples have been stored as long as those of their matched cases. This design avoids the introduction of comparison biases if preservation of the biological material affects the stability of adducts with time (see above). Long-term effects of preservation can be monitored within the study bank by storing control material, which is assayed at the time of storage to deter-mine the baseline level and then re-assayed,
152

Carcinogen adducts in cancer epidemiology
together with the material of cases and controls, each time that analysis is performed. However, it is difficult to ensure that assays performed years apart will be characterized by the same measure-ment error, and therefore long-term monitoring should aim at detecting only substantial effects of preservation.
One major advantage of prospective observa-tions in the assessment of biological markers is that the collection of the biological material that will eventually be used to measure exposure can be scheduled in order to reduce the effect of intra-individual variation, particularly if it is of a cyclical nature. Examples of this are seasonal variation of grain contamination with aflatoxins and circadian variation of exposure to air pollu-tants in urban areas. These sources of random error can be controlled tri a prospective design In two ways:
• by imposing restrictions on the scheduled time of collection at the enrolment stage of the cohort (more appropriate for the air pollution example); • by matching nested controls to the cases for similar conditions at the time of enrolment, provided that the relevant information was recorded and is available.
Intra-individual variability that cannot be attributed to known and controllable external fac-tors can instead be reduced with repeated samples from each individual. The timing and frequency of repeated measures are often governed by financial constraints rather than scientific considerations. However, the optimal use of available resources should be driven by some knowledge of the extent of the variation and its possible cyclic nature. Intra-individual variation must be separated from systematic time trends, e.g. hormonal levels in women vary in a regular fashion over days and months; at the same time, important trends are documented with age. As already mentioned, cyclic variations within relatively short time peri-ods can be controlled by fixing constraints on the schedule of collection if external causes of vari-ability are known. Alternatively, repeated samples from the same subject can be obtained in a short time period and pooled in an 'average' sample. To assess the optimal number of repeats per subject,
within the time unit it is necessary to have some quantitative knowledge of both intra-individual and interindividual variance (Armstrong et al., 1992). Transitional studies to describe these aspects of the marker in the population studied are there-fore necessary when planning a prospective inves-tigation. On the other hand, systematic trends over time are Iikely to be relevant to the carcino-genic process, and therefore variations over long time periods should be studied as independent fac-tors and not as sources of random misclassification error.
In studies where external exposures have been determined at the individual level and correlated with specific adducts in the same individuals, e.g. number of cigarettes smoked versus aromatic DNA adducts in lung tissue (Phillips et al., 1988), there is still a high degree of interindividual variation in the amount of adduct formed for a given exposure. This interindividual variation can result, for example, from differences iп carcinogen metabo-lism, and some studies have identified an impact of these effect modifiers on the dose-response relationship between exposure and adducts. For example, Vineis et aI. (1994) reported that, among cigarette smokers, those with a slow acetylator phenotype have higher average 4-ABР-НЬ adduct levels than rapid acetylators aid that this effect was particularly evident at low exposure levels. Adduct assessment can therefore find a major application in applied (transitional) studies trying to elucidate proposed mechanisms of action for a defined carcinogen. Lang et al. (1994), for example, studied the interaction between Р4501А2 and NAT-2 polymorphism and a preference for well-cooked meat, as assessed by questionnaire in a case-control study of colon cancer. A pathway to link the intake of heterocyclic amines from cooked meat to the endogenous formation of carcinogenic N-acetoxyarylamine was proposed, and indeed the results conoborate the proposed metabolic path-way. High and low intakes of heterocyclic amines were indirectly estimated by a preference for well-cooked or lightly cooked meat. Increased excretion of heterocyclic amine has been shown in the urine of consumers of pan-fried meat, but DNA adduct levels, which should be the final products of the proposed mechanism, in consumers and non-consumers of well-done meat have not been described.
153

Application of Biomarkers in Cancer Epidemiology
The above examples illustrate the use of adducts to test the impact of polymorphisms in the metab-olism of carcinogens on one step of the carcino-genic pathway. As a consequence of such work, the rationale for the integration of genetic polymor-phic markers for such genes into case-control stud-ies can be strengthened.
The fact that adducts represent an integration of external exposure and interindividual vari-ability in carcinogen metabolism, DNA repair, etc. makes them attractive because they may provide a more relevant measure of exposure, i.e, the biologically effective dose. However, it also means that the relationship between exposure and adduct level is not simple. As public health deci-sions are normally based on ambient exposure lev-els, more understanding of the relationship between these levels and adducts needs to be developed if the latter are to be used in making such decisions.
To complete this review, the possible applica-tions of adducts in intervention studies to modify the risk of cancer or premalignant conditions are worth mentioning. In the context of the appLica-tion of adducts, these can be divided into inter-ventions that prevent exposure to genotoxic agents and those which tend to modify the metab-olism of pro-carcinogens once exposure has occurred. In these cases, adducts would provide an early marker of the intervention efficacy and could be used in ad interim analyses for the purpose of monitoring of compliance. An example of this type of study is an ongoing short-term interven-tion to reduce aflatoxin-alburnin adducts using the drug of tipraz (Bolton et al., 1993). A different type of study is illustrated by Verhageri et ai. (1995) who attempted to modulate the urinary levels of 8-oxodeoxyguanosine by increasing the dietary intake of fresh vegetables. Тhi approach is an interesting one for testing hypotheses of mecha-nisms of carcinogenesis in humans. If adducts are to be used as surrogate end-points for disease out-come in intervention studies then considerably more understanding of the relationship between these events is required.
Tt should be also be noted that because of the ethical implications of any intervention, it is mandatory that the metabolic pathway leading to the production of adducts, together with its possi-ble confounders and effect modifiers, is carefully
described if adducts are to be used as outcome vari-ables in intervention studies.
AcknowEedgements C.P.W. was partially supported by a grant from the NIEHS, USA, no. 2-P01 ES06052.
References Aguilar, F., Hussain, 5.P. & Cerutti, P. (1993) Aflatoxin B., induces the transversion of G- Т in codon 249 of the p53 tumor suppressor gene in human hepatocytes. Proc. Nat? Acad. sri. USA, 90, 8586-8590
Armstrong, B.K., White, E. & 5aracсi, R., eds (1992) Principles of Exposure Measurement in Epidemiology, Monographs in Epidemiology and Biostatistics, Vol. 21, Oxford, Oxford Medical Publications
Autrup, H., 5eremet, T, Wakhisi, J. & Wasunna, A. (1987) Aflatoxin exposure measured by urinary excretion of aflatoxin B 1-guanine adduct and hepatitis B virus infec-tion in areas with different liver cancer incidence in Kenya. Cancer Bes., 47, 3430-3433
В r, W., Kratzer, A., Machler, M. & Schmid, W. (1988) Postmortem stability of DNA. Forensic Sci. fit., 39, 59-70
Bartsch, H. & Montesano, R. (1984) Relevance of пitro-samines to human cancer. Carcinogenesis, 5, 1381-1393
Belinsky, S.A., White, CM,, Devereux, T.R., Swenberg, J,А. & Anderson, M.W. (1987) Сен selective alkylation of DNA in rat lung following low dose exposure to the tobacco specific carcinogen 4-(N-methyl-N-nitтosаm пo) -1-(3-pyridуl)-1-butanone. Caflcer Res., 47, 1143-1148
3e1lnsky, S.A., Foley, J.F., White, C.M., Anderson, M.W. & Maronpot, R.R. (1990) Dose-response relationship between 06-mеthylguaпine formation in Clara cells and induction of pulmonary eeoplasia in the rat by 4- (methyluitгоwminо)-1-(3-pуridyl)-1-ъutaпone. Cancer Res., 50, 3772-3780
Bessho, T., Roy, R., Yamamoto, K., Kasai, H., Nishimura, 5., Tano, K. & Mitra, S. (1993) Repair of 8-hydroxygua-nine in DNA by mammalian N-methylpurine-DNA gly-cosylase. Proc. Nat! Acad. ici. USA, 90, 8901-8904
Bianchhsi, E & Wild, С.P. (1994а) 7-Methyldеохуguanosine as a marker of exposure to environmental methylating agents. Toxico?. Left., 72, 175-184
Bianchini, F. & Wild, C.P. (1994b) Comparison of 7-medG formation in white blood cells, liver and target organs in rats treated with methylating carcinogens. Carrinogenesis, 15, 1137-1141
Bianchini, E, Montesano, R., Shuker, DE., Cuzick, J. & Wild, C.I? (1993) Quantification of 7-methyldeoxyguanosroe using unmunoaffinity purification and HPLC with elec-
154
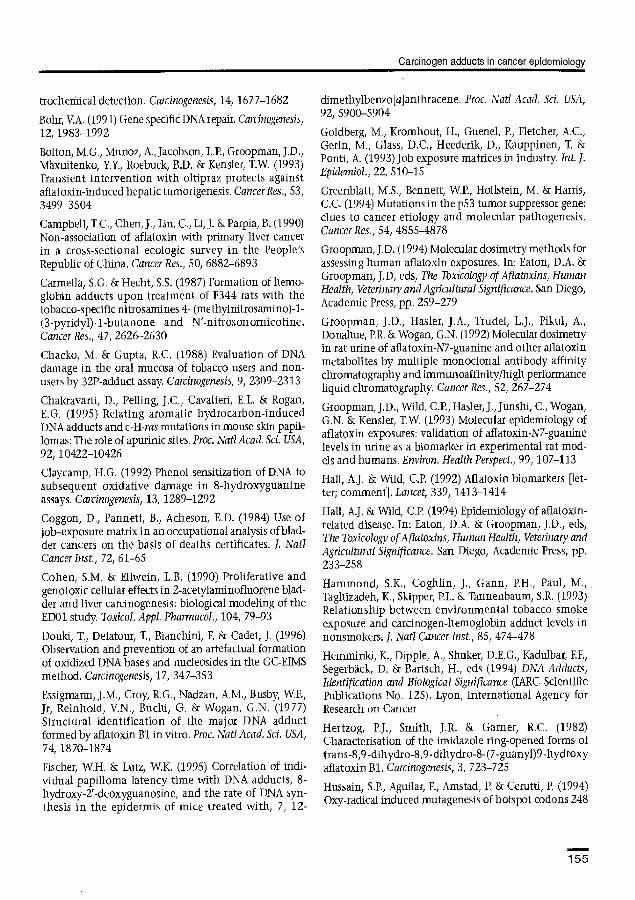
Carcinogen adducts in cancer epidemiology
trochemica1 detection. Carcinogenesis, 14, 1677-1682
Bibi, V.A. (1991) Gene specific DNA repair. Carcinogenesis, 12, 1983-1992
Butor', M.G., Munoz, A., lасоbsоп, L.P., Groopman, J.D., Mâxuitenko, У.Y., Roebuck, B.D. & Kensler, T.W. (1993) Transient intervention with oltipraz protects against aflatoxin-induced hepatic turnorigenesis. Cancer Res., 53, 3499-3504
Campbell, T.G., Chen, I., Liu, C., Li, J. & Parpia, B. (1990) Non-association of aflatoxin with primary liver cancer in a cross-sectional ecologic survey in the People's Republic of China, Cancer Res., 50, 6882-6893
Carmella, S.G. & Hecht, Ѕ.Ѕ. (1987) Formation of hemo-globin adducts upon treatment of F344 rats with the tobacco-specific nitrosamines 4- (methylnitrosamino)-1-(3-рyridyl)-1-butanоnе arid N'-nitrosonornicotine. Cancer Res., 47, 2626-2630
Chacko, M. & Gupta, R.C. (1988) Evaluation of DNA damage in the oral mucosa of tobacco users and non-users by 32Р-адбиct assay. Carcinogenesis, 9, 2309-2313
Chakravarti, D., Решпg, J.C., Cavaiieri, E.L. & Rogan, E.G. (1995) Relating aromatic hydrocarbon-induced DNA adducts and c-H-ras mutations in mouse skin papil-bras; The role of apurinlc sites. Proc. Nat! Acad. Sci. USA, 92, 10422-10426
Claycamp, H.G. (1992) Phenol sensitization of DNA to subsequent oxidative damage in 8-hydroxyguanine assays. Carcinogenesis, 13, 1289-1292
Coggon, D., Pannett, B., Acheson, E.D. (1984) Use of job-exposure matrix in an occupational analysis of blad-der cancers on the basis of deaths certificates. J. Nat' Cancer Inst., 72, 61-65
Cohen, S.M. & Eliwein L.B. (1990) Proliferative and genotoxic cellular effects in 2-acetylaminotluorene blad-der and liver carcinogenesis: biological modeling of the EDO1 study. Toxico!. App!, Phar гегсо!., 104, 79-93
Douki, T., Delatour, T., Bianchini, F. & Cadet, J. (1996) Observation and prevention of an artefactual formation of oxidized DNA bases and nucleosides tri the GC-EIMS method. Carcinogenesis, 17, 347-353
Essigmann, J.M., Croy, R.G., Nadzan, A.M., Busby, W.F., Jr, Reinhold, V.N., Buchi, G. & Wogan, G.N. (1977) Structural identification of the major DNA adduct formed by aflatoxin B1 in vitro. Proc. Nat[ Acad. SсL USA, 74, 1870-1874
Fischer, W.H. & Lutz, W.K. (1995) Correlation of indi-vidual papilloma latency time with DNA adducts, 8-hydroxy-2'-deoxyguanosine, and the rate of DNA syn-thesis iп the epidermis of mice treated with, 7, 12-
dimethylbenzo[а]antliracene. Proc. Nat! Acad. Sci. USA,
92, 5900-5904
Goldberg, M., Kromhout, H., Guenel, P., Fletcher, А.С., Germ, M., Glass, D.С., Heederik, D., Kauppioen, Т. & Ponti, A. (1993) Job exposure matrices in industry. lit. J. Epidemiol., 22, 510-15
Greenblatt, M.S., Bennett, W.P., Hollstein, M. & Harris, C.C. (1994) Mutations in the p53 tumor suppressor gene: clues to cancer etiology and molecular pathogenesis. Cancer Res., 54, 4855-4878
Groopman, J.D. (1994) Molecular dosimetry methods for assessing human aflatoxin exposures. In: Eaton, D.A. & Groopman, J.D, eds, The Toxicology o f A flatoxiпs, Human Health, Veterinary and Agricultiva! significance. San Diego, Academic Press, pp. 259-279
Groopman, J.D., Hasler, J.A., Trudel, L.J., Piku1, A., Donahue, P.R. & Wogan, G.N. (1992) Molecular dosimetry in rat urine of аflatoxfn-N7-guanine and other aflatoxin metabolites by multiple monoclonal antibody affinity chromatography aid immunoa(finity/high performance liquid chromatography. Cancer Res., 52, 267-274
Groopman, J.D., Wild, C.P., Hasler, J., Junshi, C., Wogan, G.N. & Kensler, T.W. (1993) Molecular epidemiology of aflatoxin exposures: validation of aflatoxin-N7-guanine levels in urine as a biomarker in experimental rat mod-els and humans. Environ, Health Perspect., 99, 107-113
Hall, А.J. & Wild, C.P. (1992) Aflatoxin biomarkers [let-ter; comment]. Lancet, 339, 1413-1414
Hall, A.J. & Wild, C_P. (1994) Epidemiology of aflatoxin-related disease. In: Eaton, D.A. & Grooprnari, J.D., eds, The Toxicology o fAflatoxins, Human Health, Veterinary and AgticultnrrI significance. San Diego, Academic Press, pp. 233-258
Hammond, S.K., Coghlin, J., Gann, P.H., Paul, M.,. Taghizadeh, K., Skipper, P.L. & Tannenbaum, S.R. (1993) Relationship between environmental tobacco smoke exposure and carcinogen-hemoglobin adduct levels in nonsmokers. J. Natl Cancerinst., 85, 474-478
Hemminki, K., Dipple, A., shuker, D.E.G., Kadulbar, F.F., SegerbSck, D. & Bartsch, H., eds (1994) DNA Adducts, identification and Biological significance (IARC Scientific Publications No. 125). Lyon, International Agency for Research on Cancer
Hertzog, P.J., Smith, J.R. & Garner, R.C. (1982) Characterisation of the imidazole ring-opened forms of trans-8, 9 -dihydro-8, 9 -dihydтo-8-(7-guanyl) 9 -hydroxy aflatoxin B1. Carcinogenesis, 3, 723-725
Hussain, S.P., Aguilar, F., Amstad, P. & Cerutti, P. (1994) Oxy-radical induced mutagenesis of hotspot codons 248
155

Application of Biomarkers in Cancer Epidemiology
and 249 of the hитал р53 gene. Oncogene, 9, 2277-2281 Epidentiol. Biomarkers Prey., 4, 627-634
Izzotti, A., Bagnasco, M., Scafolini, L., Rovida, A. & De Flora, S. (1993) Post-mortem stability of benzo[alpyrene diolepoxide-DNA addicts in rat organs. Carcinogenesis, 14, 2185-2187
Kat, A.G. & Thi11y, W.G. (1994) Mutational spectra of endogenous genes in mammalian cells. In: Hemminki, K., Shuker, D.E.G., Kadlubar, F.F., Segerb~ck, D. & Bartsch, H., eds, DNA Adducts, Identi fгcatioп andBiological signifIcance (‚ARC Scientific Publications No. 125). Lyon, Inteгnational Agency for Research on Cancer. pp. 371-383
Lang, N.P., Butler, M.A., Massengill, J., Lawson, M., Stotts, R.C., Hauer Jensen, M. & Kadlubar, F.F. (1994) Rapid metabolic phenotypes for acetyltransferase and cytochrome Р4501А2 and putative exposure to food-borne heterocyclic amines increase the risk for colorectal cancer or polyps. Cancer Epidemiol. Biomarkers. Prey., 3, 675-682
Maclurе, M., Bryant, M.S. & Skipper, P.L.А. (1990) Decline of the hemoglobin adduct of 4-amйobipheпyl during withdrawal from smoking. Cancer Res., 50, 181-184
Maher, V.M., Yang, J-L., Mah, C-M. & McCormick, J.J. (1989) Comparing the frequency and spectra of mu-tations induced when and 5V-40 based shuttle vector containing covalently bound residues of structurally-related carcinogens replicates in human cells. Mutat. Res., 220, 83-92
Male, R., Haukanes, B.I., Helland, D.E. & Кlерре, K. (1987) Substrate specificity of 3-methyladenine-DNA g1y-cosylase from calf thymus. Eur. J. Biochem., 165, 13-19
Margison, G.P. & O'Connor, Р.J. (1979) Nucleic acid modifications by N-nitriso compounds. In: Grover, P.L., ed., Chemical Carcinogens and DNA, Vol. 1, Boca Raton, FL, CRC Press, pp. 111-159
Martin, C.N. & Garner, R.C. (1977) Aflatoxin B-oxide generated by chemical or enzymic oxidation of aflatoxin ВI causes guanine substitution in nucleic acids. Nature, 267, 863-865
May, A., Nairn, R.S., Okumoto, D.S., Wassermann, K., Stevnsner, T., Jones, J.C. & Bohr, V.A. (1993) Repaii of individual DNA strands in the hamster dihydrofolate reductase gene after treatment with ultraviolet light, alky-lating agents, arid cisplatin. J. Biol. Chem., 268, 1650-1657
Mooney, L.A., Santella, R.M., Covey, L., Jeffrey, A.M., Bigbee, W., Randall, M.C., Cooper, T.B., Olirnan, R., Tsai, W-Y., Wazneh, L., Glassman, АН., Young, T-L. & Рerera, F.P. (1995) Decline of DNA damage and other biomarkers in peripheral blood following smoking cessation. Cancer
Mustonen, R. & Hemminki, K. (1992) 7-Methylguaпinе levels in DNA of smokers' and non-smokers' total white blood cells, granulocytes and lymphocytes. Carcinogenesis, 13, 1951-1955
Ochiai, M., Watanabe, M., Kushida, H., Wakabayashi, K., Sugiinura, T. & Nagao, M. (1996) DNA adduct formation, cell proliferation and aberrant crypt focus formation induced by PhIP in male and female rat colon with rele-vance to carcinogeriesis. Carcinogeuesis, 17, 95-98
OzbaI, C.C., Velic, L, Soohoo, С.K., Skipper, P.L. & Tannenbaum, S.R. (1994) Conservation of histone carcinogen adducts during replication: implications for long-term molecular dosimetry. Cancer Res., 54, 5599-5601
Ozturk, M. (1991) р53 mutation iii hepatocellular carci-noma after aflatoxiri exposure. Lancet, 338, 1356-1359
Pegg, А.E. (1984) Methylation of the 06 position of guanine in DNA is the most likely initiating event in carcinogenesis by methylating agents. Cancer Invest., 2, 223-231
Рeгеrа, E, Jeffrey, A., Santella, R.M., Brenner, D., Mayer,]., Latniano, L., Smith, S., Young, T.L., Tsai, WY., Hemniluki, K. & Brandt-Rauf, P. (1990) Macromolecular adducts and related biomarkers in biomonitoring and epidemiology of complex exposures. Iп: Vainio, H., Sorsa, M. & Iclichael, A.J., eds, Complex Mixtures and Cancer Risk (1ARC Scientific Publication No. 104). Lyon, International Agency for Research on Cancer, pp. 164-180
Perera, EP., Hemminki, K., Gryzbowska, E., Motykiewicz, G., Michalska, J., Santella, R.M., Young, T.L., Dickey, C., Brandt-Rauf, P. & DeVivo, I. (1992) Molecular and genetic damage in humans from environmental poIlu-till in Poland. Nature, 360, 256-258
Phillips, D.H., Hewer, A., Martin, С.N., Garner, R.C. & King, M.M. (1988) Correlation of DNA adduct levels in human lung with cigarette smoking. Nature, 336, 790-792
Phillips, D.H., Schoket, B., Hewer, A., Bailey, E., Kostic, S. & Vincze, I. (1990) Influence of cigarette sXoking on the levels of DNA adducts in human bronchial epithelium and white blood cells. mt. J. Cancer, 46, 569-575
Poirier, М.C. & Beland, F.А. (1992) DNA adduct mea-surements and mmli incidence during chronic carcino-gen exposure in animal models: implications for DNA adduct-based human cancer risk assessment. Chem, Res. ТохгсоL, 5, 749-755
Poirier, M.C., Fullerton, N.F., Smith, В А. & Beland, RA. (1 995) DNA adduct formation aid tumonigenesis in mice dining the chronic administration 0f 4-aminobiphenyl
156

Carcinogen adducts in cancer epidemiology
at multiple dose levels. Carciaogenesis, 16, 2917-2921
Qian, G.S., Ross, R.K., Yu, М.C., Yuan, J.M., Gao, Y.T., Henderson, B.E., Wogan, G.N. & Groopman, J.D. (1994) A follow-up study of urinary markers of aflatoxin expo-sure and liver cancer risk iii Shanghai, People's Republic of China [see comments]. Cancer Еpkdermo2 Biornarkers. Prev., 3, 3-10
Richardson, F.C., Beauchamp, R.O., Jr & Swеnberg, J.A. (1987) Properties and biological consequences of olkylpynniidirae deoxyribonhcleosides. Pharmacol. Ther., 34, 181-213
Ross, R.K., Yuan,).M., Yu, M.C., Wogan, G.N., Qian, G.5., Tu, J.Т., Groopman, J.D., Gao, Y.T. & Henderson, B.E. (1992) Urinary aflatoxin biomarkers and risk of bepato-cellular carcinoma, Lancet, 339, 943-946
Rotthman, N., Stewart, W.F. & Schulte, P.A. (1995) Incorporating biomarkers into cancer epidemiology: a matrix of biomarker and study design categories. Cancer Epidemiol. Biomarkers. Prey., 4, 301-311
Scates, D.К., Spigelman, А.D. & Verritt, Ѕ. (1995) Appearance of artefacts when using 32P рostlаёеllјг1g to investigate DNA ackluct formation by bile acids in vitro: lack of evi-dence for covalent binding. Carcinogenesis, 16, 1489-1491
Shen, H.M., Shi, C.Y., Lee, H.P. & Ong, C.N. (1994) Aflatoxin B1-induced lipid peroxidation in rat liver. Toxicol. AppL Pharmacol., 127, 145-150
Shen, 1,1., Ong, C.N., Lee, B.L. & Shi, C.Y. (1995) Aflatoxin B1-induced 8-hydroхydеoxyguanоsine forma-tion in rat hepatic DNA. Carcinogenesis, 16, 419-422
Shuker, D.E.G. & Farmer, Р.B. (1992) Relevance of urinary DNA adducts as markers of carcinogen exposure. Chem. Res. Toxico!., 5, 450-460
Skipper, P.L. & Tannenbaum, S.R. (1990) Protein adducts in the molecular dosimetry of chemical carcinogens. Carcinogenesis, 11, 507-518
Skipper, P.L., Peng, X., Soohoo, C.K. & Tannenbaum, S.R. (1994) Protein adducts as biomarkers of human carcino-gen exposure. Drug Metab. Rev., 26, 111-124
Srlvatanakul, P., Parkin, D.M., Jiang, Y.Z., Khlat, M., Kао-Ian, U.T., Sontipong, Ѕ. & Wild, C.P. (1991) The role of infection of Opisthorchis viverrini, hepatitis B virus and aflatoxin exposure ш the aetiology of liver cancer in Thailand. Cancer, 68, 2411-2417
Stone, J.G., Jones, N.J., McGregor, A.D. & Waters, R. (1995) Development of a human biomonitoring assay using buccal mucosa: comparison of smoking-related DNA addicts in mucosa versus biopsies. CnncerRes., 55,1267-1270
Szyftеr, K., Hemminki, K., Szyfter, W., Szmeja, Z.,
Banaszewski, J. & Yang, K. (1994) Aromatic DNA adducts in larynx biopsies and leukocytes. Carcinogenesis, 15, 2195-2199
Tang, D., Santella, R.M., Blackwood, A.M., Young, T.-L» Mayer, J., Jaretzki, A., Grantham, 5., Tsai, W.-Y. & Perеra, F.P. (1995) A case-control molecular epidemiological study of lung cancer. Cancer Ерыепsиd. Biomarkers Prey., 4, 341-346
Tomgvist, M. (1990) Formation of reactive species that lead to hemoglobin adducts during storage of blood sam-ples. Carcinogenesis, 11, 51-54
Trotuer, Y., Waithe, W.I. & Anderson, A. (1992) Kinds of mutations induced by aflatoxin B1 in a shuttle vector replicating in human cells transiently expressing cytochrome Р4501А2 cDNA. MoL Carcinog., 6, 140-147
van Schооtеn, F.J., Hillebrand, M J., van Leeuwen, F.E., van Zandwijk, N., Jansen, H.M., Den Engelse, L. & Kriek, E. (1992) Polycyclic aromatic hydrocarbon-DNA adducts in white blood cells from lung cancer patients: no corre-lation with adduct levels in lung. Carcinogenesis, 13, 987--993
Verhagen, H., Poulsen, H.E., Loft, S., van-Poppel, G., Wi[1ems, M.I. & van Bladeren, P.J. (1995) Reduction of oxidative DNA-damage in humans by brussels sprouts. Carcinogenesis, 16, 969-970
Vineis, P, Bartsch, H., Caporaso, N., Harrington, A.M., Kadlubar, F.F., Landi, M.T., Malavei11e, C., Shields, P.G., Skipper, P., Talaska, G. & Tannenbaum, S.R. (1994) Genetically based N-acetyltransferase metabolic poly-morphism and low-level environmental exposure to car-cinogens. Nature, 369, 154-156
Widlak, P., Bykov, V.1. & Hemmiпki, K. (1995) Formation of UV-photoadducts durings DNA purification. Mutat. Res., 347, 117-119
Wiencke, J.К., Kеlsey, KT., Varkonyl, A., Semey, K., Wain, J.С., Mark, E. & Claristiani, D.С. (1995) Correlation of DNA adducts in Ыоод mononuclear cells with tobacco carcinogen-induced damage in human lung. Cancer Res., 55, 4910-4914
Wild, C.P., Fortuin, M., Dornato, F., Whittle, H.С., Hall, A.J., Wolf, С.R. & Montesano, R. (1993) Aflatoxin, liver enzymes, and hepatitis B virus infection in Gambian children. Cancer Epidemiol. Biomarkers. Prev., 2, 555-561
Wogari, G.N. (1988) Detection of DNA damage in stud-ies on cancer etiology and prevention. In: Bartsch, H., Hernminki, K. & O'Neill, LK., eds, Methods for Detecting DNA Damaging Agents in Humans: Applications in Cancer Epidemiology and Prevention (IARC Scientific Publications Ni. 89). Lyon, International Agency for Research on Cancer, pp. 32-51
157

Application 01 Biomarkers in Cancer Epidemiology
Wogan, G.N. (1992) Molecular epidemiology in cancer risk assessment and prevention: recent progress and avenues for future research. Erlüiroi. Health Perspect., 98, 1б7-178
Zhang, У.J., Chen, C.J., Lee, C.S., Haghighl, B., Yang, Г.Y., Wang, L.W., Feitelson, M. & Santella, R. (1991) A#latoxin B1-DNA adducts and hepatitis B virus antigens in hepatoce]lu1ar carcinoma and non-tumorous liver tis-sue. Carcinogen cris, 12, 2247-2252
Corresponding author С.P. Wild Molecular Epidemiology Unit, Research 5droo1 of Medicine, Algernon Firth Building, University of Leeds, Leeds LS2 9JТ, UK
158

'ARC Scientific PuЫcatioпs No 14 lnternalioпal Agency for Research on Cancer, Lyon, 1997
Somatic cell mutations in cancer epidemiology
R.J. Albertïni and R.B. Hayes
Somatic cell mutations arising in vivo in reporter genes and in cancer-associated genes may now be measured in humans. Background mutation levels and mutational responses following various mutagen exposures are reviewed ïn this chapter. The detection methods are compared for similarities and differences based on the underlying biology of the systems. Currently available data on molecular mutational spectra are reviewed and the utility of such information is discussed in terms of mutagen exposure characterization and for defining the mutagenic basis of carcinogenesis. In addition to the reporter gene assays, recently developed assays for mutation in cancer-associated genes are considered. The strengths and limitations of using somatic cell mutations for cancer epidemiology and areas for future research are discussed
Somatic cell mutations occur regularly and univer-sally in all humans. Sоmе are 'naturally occurring', arising continuously as spontaneous replication errors or in response to endogenous mutagens or DNA metabolism, while others are induced by external mutagens which are ubiquitous in the environment. Mutations are central to human car-cinogenesis, and, consequently, exposures that cause mutations are also suspect of causing cancer. Iп prindple, subjects who have experienced greater exposure to genotoxic agents will accumulate greater numbers of mutations, so that quantitation of the frequency of mutational events serves to identify heavily exposed individuals. In addition, specific genotoxic agents may produce specific types of mutations, implying that characterization of mutational errors (mutational spectrum) will be useful for identifying exposure to specific agents.
Modern in-vivo somatic mutation studies may employ any of seven assays for measuring in-vivo mutations in five different reporter genes, i.e. not functionally related to carclnogenesis. There are also methods for detecting mutations in cancer genes (oncogenes and tumour suppressor genes). Extensive databases are available for two of the reporter gene assays (GPA and hprt), while limited information is available for all others. Here we describe the genetic bases and methods for the major assays, summarize the results of applications in humans, and discuss the uses and limitations of the methods for future epidemiological studies.
Reporter gene somatic cell mutation assays: genetic basis and methods The haernoglobin (Nb) genes Genetic basis (Table 1). lb is a tetrameric protein that constitutes >99% of the protein in non-nucle-ated mature red blood cells (RBCs) (reviewed in Stamatoyannapoulos et al., 1984). Several роlypер-tiде chains, encoded by genes at several linked loci, constitute the intact lb molecule, depending on the stage of development of the individual. Following birth, adult IbA (аZ 32) constitutes >95% of the lb in mature RBCs, with a small amount of HbA2 (a2Б2) also present. The c y (two loci) S and (3 lb genes are on chromosome lip; the t and a (two loci) lb genes are on chromosome 1бр (Deisseroth et al., 1977, 1978).
Three classes of mutations affect the lb genes. Two, the thalassaemias and hereditary persistence of fetal Hb (HPFH), produce abnormal levels of lb polypeptides. These are not useful for mutational studies however, as non-genetic influences can reduce lb levels in RBCs (Stamatoyannapoulos et ai., 1984). The third class of lb mutations pro-duces structural alterations in lb. Over 500 such changes have been described, most being single amino acid changes in the а or the p chain. Of these, the best known is an A to T transversion in the gene that gives 'sickle cell' haemoglobin, or lbs. Although the gene is autosorna1 and contains three exons spanning 2 kb, the effective mutational target size for single base changes is a
159

Application of Biomarkers in Cancer Epidemiology
. в
Cells
в - в
Gene(s)
t' - в
Chromosome
~• - в '
Gene size Target size RBC lb gene Autosome, lip Э exons, 2 kb bp (small)
lb gene Autosome, 16р Э exons, 2 kb bp (small)
RBC GPA Autosome, 4q 7 exoпs, 44 kb >44 kb (large)
T-lymphocytes HPRT X-linked, Xq 9 exils, 44 kb >44 kb (large)
T-lymphocytes HLA-A Autosome, бp 7 exils, 5 kb >5 kb (large)
Т lymphocytes TCR Autosome 1 4q Large 'multi -gene Probably large
TIR Autosome, 7q Large multi gene' Probably large
single base pair. The assay is thus hnhted to the detection of point mutations, which limits its prac-tical sensitivity and restricts to а narrow range the spectrum of mutational mechanisms detected.
lb variant frequency (VF) assays (Table 2). G.P. Stamatoyaranopoulos and co-workers originally developed an assay based on highly specific antibod-ies that discriminate the different mutaпf haemoglo-bins from each other and from normal haemoglobin, requiring samples of 1 ml blood (reviewed in Stamatoyannopoulos et al., 1984). Scoring tech-niques for rare variant cells with a mutated lb are based on fluorescence labelling of fixed RBCs on slides. As haemoglobin is an intracellular protein, fix-ation and permeabilization are required for antibody entrance. Recent refinements have included newer methods for permeabilizing and Iabelling RBCs in suspension for automated cell sorting and counting (Bigbee et al., 1981). More recently, automated microscopy has been used to screen large numbers of cells on slides (Tates et al., 1989). One or more struc-tural lb mutations may be scored in an assay.
Although there have been no systematic des-criptions of aI1 technical sources of error in this assay, quality of RBCs and extent of permeabни atiоn could be major sources, as could the quality of the iinmuno-logical reagents and ion-specific staining. Poisson counting of rare events produces relatively large errors.
The GPA gene Genetic basis (Table 1) Glycophortn-A (GPA) is a polymorphic glycoprotein on RBC surfaces present
at approximately 5 x 10⁵ molecules/cell (Furthmayer, 1977; Gahmberg et cL, 1979). The GPA gene on chromosome 4q spans 44 kb and contains seven exons (Kudo & Fukuda, 1989). In principle, it is a large target for mutation. It has two codiminantly expressed (M and N) alleles (Furthmayer, 1978) (except for rare nulls) which have approximately equal frequencies in all populations (Cartron et al., 1990). Thus, approximately 50% of humans are I/N heterozygotes with both forms of the glyco-protein on h IC surfaces. The Maid the N molecules differ by two non-adjacent amino acids and can-not be interconverted by simple point mutations.
GPA VF assays (Table 2). The currently used GPA assay measures the frequency of variant cells that have lost expression of the M form in blood samples from heterozygous individuals (M/N) (Langlois et аl., 1990; Jensen & Bigbee, 1996). A small (<1 ml) sample of blood is treated soon after blood draw to fix spherical erythrocytes which are then kept at 4°С until analysis. Variant cells are detected by flow cytonietry with distinguishable fluorescent-labelled monoclonal antibodies specific for the N and M forms and counting variant cells that bind the anti-N but not the anti-M antibody. Simple loss mutations, many representing 'point mutations', are expressed as rare 0/N cells (Grant & Bigbee, 1993). These are referred to as'hemizygous variants'. More complex mutations are expressed as rare N/N cells on the I/N background, i.e. a loss of func-tion of one allele with double expression of the other. These are thought to arise from mutational events that lead to cellular homozygosity (or loss or
160

Somatic cell mutations in cancer epidemiology
Gene and cell Bample size Method(s) Time for assay Potential for error
lb in RBC 1 ml Immunological staining Month RBC quality
—Manual slides Days Permeabilization
—Automated slides Fours–days Immunological reagents --Cytometry Non-specific staining .
Poisson counting
GPA in RBC 1 ml Immunological staining Hours–days RBC quality
—Cytometry Immunological reagents Non-specific staining Poisson counting
NPAT in T-cells 10-50 ml Short-term Cycling cells give phenocopies
Autoradiography Observer error Manual slides Days–week Cell culture factors Automated slides (potential)
BrdU incorporation with differential fluorescence Non-specific staining changes
Manual slides Days–week Poisson counting
Automated slides Days Instrumentation for
Cytometry (potential) (Short) ` automaled assays Poisson counting
Cloning Weeks Inversé corrélations
Selection in tissue culture between CE and MF Observer error Reagents and culture conditions Poisson counting
1-iLA in T-cells ° 10-50 ml Cloning Weeks Non-specific lack of
I mmunoselection (cytotoxicity) imrnunocytotoxicity
in vitro with cell culture Observer error
outgrowth Reagents and culture conditions Immunological reagents and complement
Poisson counting
5-10 ml Immunological staining Non-specific failure to label
Cytometry immunological reagents Instrumentation Poisson counting
7CR in T-oeils Few ml Immunological staining Non-specific failure to label Cytometry . immunological reagents
instrumentation
161

Application of Biomarkers in Cancer Epidemiology
heterozygosity), such as chromosome missegrega-tion, somatic recombination or gene conversion (Grant & Bigbee, 1993). These variants are termed 'homozygous variants'. The rare 0/N and N/N cells that have lost expression of the M allele fall within prescribed areas of the cytogram. The variant fre-quency (VF) is defined as:
number of 0/N or N/N variant erythrocytes
VF total number of red blood cells analysed
The quality and age of the ABCs in the blood sample can affect results, necessitating the rapid fixation of collected samples. Antibody lot, quality and preparation are potential sources of technical variability, as are changes in cytometer perfor-mance. Poisson counting of small numbers pro-duces relatively large errors. A gold standard has recently been developed for the GPA assay {Jensen & Bigbee, 1996). Cryopreservation of formalin-fixed spherical RBCs in medium and DMSO, and storage. at —80°C or —150°C maintain samples with stable VFs for up to б months. Reference standards are available for interlaboratory quality control and standardization.
The NPRTgene Genetic basis (Table 1). The HPRT gene encodes the HPRT enzyme which is constitutively expressed but dispensable in virtually all mammalian cells. HPRT phosphoribosylates its normal substrates hypoxanthine and guanine for conversion to inosinic acid (Stout & Caskey, 1985) and is re-quired to phosphoribosylate purine analogues such as б-thioguanine (TG) to their cytotoxic forms (Albertini, 1985а ; Stout & Caskey, 1985). Cells with normal IPRT activity are susceptible to the cytotoxicity of TG and related agents; mutants are resistant, thus providing a basis for selection.
The BPRT gene is X-linked and expressed as a single copy in all cells. The gene spans 44 kb and contains nine exons (Patel et al., 1984). A total of 55 kb of DNA including and surrounding this gene has been sequenced, making the region one of the best characterized for mutational studies. In prin-ciple, НРјТ is a large target for mutation.
'PAT VF and mutant frequency (MF) assays (Table 2). There are two assays for assessing in vivo ITIPRT mutations in human T-lymphocytes. Both are based on the resistance of mutant cells to HPRT-
dependent cytotoxicity of the purine analogue TG (Albertini et aI., 1990). Both assays require similar collection and fractionation protocols. Although the assays can be performed on 5-10 ml of blood, it is preferable to obtain 30 ml or more.
The VF assay (Table 2). The first assay to be devel-oped was a short-term phenotypic assay which has the advantage of speed and potential for automa-tion but the disadvantage of consuming the TGI T-cells which are then not available for study (Strauss & Albertini, 1977, 1979; Staтk et aL, 1984). As there is no way to unequivocally demonstrate the mutational basis of the TG` cells, they are termed variants and their frequencies in blood are termed VFs. For assay, cryopreserved MNCs are thawed and stimulated with PHA in replicate short-term cultures, with or without TG, and incu-bated until culture termination at 24-30 h (cryo-preservation is required to avoid labelling of nor-maI T-cells that are in 'in cycle' in vivo; AIbertiпi et аI., 1981). At termination, fixed cells are added in measured volumes to microscope slides, and then stained, autoradiographed and scored. Recent pro-tocol modifications use BrdU staining and scoring by differential fluorescence (Ostrosky-Wegman et al., 1988), approaches suitable for automation using either cell cytometry or image analysers.
There are several technical sources of variability in the short-term autoradiographie assay. Only rare labelled cells are counted, so Poisson errors inherent in counting small numbers can be large. The slide-based method is laborious and susceptible to ob-server error. Automated assays will have concerns with instrumentation. T-cells that are cycling in vivo may become labelled and be scored as mutants, unless measures such as cryopreservation are em-ployed to remove this effect (Albertini et al., 1981).
The MF assay (Table 2). The second HPRT assay де-pends on direct in vitro cloning in TG and, although laborious, allows for mutant isolation, in-vitro propagation and molecular analyses (Albertini et aI., 1982; Morley et al., 1985; Henderson et aI., 1986; O'Neill, et al., 1987). Fresh or thawed, cryopreserved MNCs are washed and plated in culture medium for direct cloning in the presence or absence of TG. (Cryopreservation is not required here to remove 'phenocopies' as it is in the autoradiographie assay, but it is convenient.)
162

Somatic cell mutatгons in cancer epidemiology
A mutant frequency (MF) (and its confidence inter-val) is calculated from the ratio of the cloning effi-ciency of T-cells in the presence of TG to the cloning efficiency in its absence. There are large methodological differences between the two kinds of HPRT assays, which may give somewhat differ-ent results.
There are several sources of technical variability in the cloning assay (Robinson et aL, 1993). All investigators have reported a strong inverse corre-lation between control or non-selected cloning efficiencies and calculated mutant frequencies; observer error with failure to recognize slow-grow-ing mutant colonies may result in variability. Attention to reagents and conditions is critical. Fortunately, the ability to cryopreserve MNCs for subsequent testing provides a protocol standard to control for intralaboratory drift.
The 'LA gene Genetic basis (Table 1). The several linked HLA loci include two classes of genes that encode cell sur-face recognition or restriction molecules of impor-tance for antigen presentation in immune responses (Bodmer, 1984; Janeway & Travers, 1994). These genes constitute the major histocompatibility complex (МНС) in humans. Although the loci are extremely polymorphic, some alleles are present in a high proportion of individuals, i.e. approxi-mately 50% of the population is heterozygous for either the НLА A2 or the НLA-A3 allele.
The HLA complex is on chromosome bp. In practice, mutation studies have been confined to the HLA-A gene for primary detection, although mol-ecular studies have defined loss of other linked genes. The HLA-A gene is autosomal, spans 5 kb and con-tains seven exons; it is a large target for mutation.
FILA mutant frequency and variant frequency assays (Table 2). There are also two assays for assessingНLA mutations in human T-cells. The constitutional HLA genetic background of an individual must be known to measure somatic mutations at this locus, i.e. an individual must normally express one of the test HLA antigens in heterozygous form. The assays measure cellular loss of one codominantly expressed antigen.
Cloning (MF) assay (ТаЬе 2). In the cloning assay, Uanatipour et a2., 1988; McCarron et a1., 1989), peripheral blood is obtained and the INC fraction
is separated. As for HPRT, this assay involves inoc-ulation of MNCs into the wells of microtitre plates in limiting dilutions. Selection is due to cytotoxic-ity by a relevant antibody in the presence of com-plement. Following selection, cells aie directly inoculated into microtitre plates essentially as in the HPRT cloning assay. Colonies are scored at 16-20 days by inverted phase microscopy.
One major source of technical variability irn the HLA assay is lack of killing by specific antibody. However, these 'phenocopies' can be recognized by testing growing colonies for resistance to the specific selecting antibody. The other sources of technical variability are inherent in cell culturing. The sources of immunological reagents and complement and the conditions of immunoselection can also produce technical variation. It should be possible to produce a cryopreserved cell standard as described for In PR Т.
VF assay (Table 2). A short-term flow cytometry assay has also been described as measuring HLA loss mutations in T-cells (Kushiro et al., 1992). The method uses specific biotin-labelled anti-HLA anti-bodies to label HLA gene products on T-cells, FITC-conjugated monoclonal anti-CD3 antibody to label all T cells, and two-colour cytometric analysis to score CD3+ T-cells lacking the target HLA antigens.
The rare cells that have lost the target HLA anti-gen, i.e. less than 1/25 x that 0f normal HLA+ cells, fall within a prescribed area of the cytogram. The variant frequency is defined as:
number of CD3f target HLA antigen-lacking
VF = - lymphocytes total of CD3+ lymphocytes
Sources of error in the assay are non-specific failure to label cells, immunological reagents, instrumentation and Poisson sampling. When used only in the cytometry mode, the assay may be subject to serious pheraocopy errors. However, cell sorting can and has been employed to clone and propagate single variant cells in vitro for molecular analyses. In principle, the genetic basis of all vari-ants detected in this assay could be verified by mol-ecular analyses.
The TCR gene Genetic basis (Table 1). There are at least four T-cell receptor (TCR) genes, i.e. the a, the R, the yard the
163

Application of Biomarkers in Cancer Epidemiology
S genes, located on chromosomes 14q (u and, within it, 8), 7q ((i) arid 7p (y). Germ-line TCR genetic seg-ments consist of vахiаЫе (V) joining (J), diversity (D) (j and y TCR genes only) and constant (C) regions Qaneway & Travers, 1994). Rearrange-ments occur during the differentiation of T-cells and are mediated by a recomЫnasе system, termed V(D)J recombinase, through which the different V, D and J regions of any TCR germ-line gene are joined in all possible combinations. This confers the TCR gene uniqueness found in mature T-cells. The rearranged genes characterize and identify a specif-ically reactive T-cell and its clonai descendants.
The complete TCR on the T-cell surface consists of a constant molecule, termed CD3, and the TCR heterodimeric molecule consisting of either an u and fi or a y and l polypeptide chain, encoded by the respective TCR genes (Clevers et ai., 1988; Kyoizumi et aL, 1990). A given T-cell expresses either the u/a heterodimeric TCR or the у/Б het-erodimeric TCR—never both. More than 90% of the peripheral blood T-cells express the u/ TCR. The TCR gene mutational assay currently in use focuses only on. CD4+/TCRu/jЭT-ce11s.
If one of the molecules of the TCR heterodimer is defective for any reason, the СD3TCRu/RТСR complex fails to form on the T-cell surface, and the CD3 molecule accumulates in the cytoplasm. Allelic exclusion operates for the TCR genes, ren-dering any cell functionally hemizygous for gene expression. Therefore, mutational 1oss of gene function is not masked by a second allele.
TCR variant T-cells are recognized by the absence of the CD3 molecule from the surface of a CD4+ T-cell. The presumed mutation arises in one of the TCR genes (u or 1). (As alleLic exclusion is not operative for the СD3 gene, mutational loss of function would require somatic mutation of both alleles at this locus.)
The TCR genes are large genetic segments when in the germline configuration. However, somatic mutations may arise iп rearranged genes, which are much smaller. It is not possible at this time to define a target size for the TCR gene mutations.
The TCR VF assay (Table 2). The TCR gene muta-tion assay is also based on analysis by flow cytome-ter (Kyoizumi et al., 1992). Commercially available anti-СD3 is phycoerythrin-labelled and anti-CD4 is FITC-labelled, allowing for double labelling of
normal T-cells. Variant cells are CD4+ cells that have lost expression of CD3. VFs are calculated as the number of CD3- cells, i.e. ceI1s with CD3 expression level less than 1/25 x that of normal CD4 cells, divided by the total number of CD4+ T-cells.
Sources of technical variability for the TCR gene mutation assay are variabilities in immunological reagents aid in flow cytometer performance. Furthermore, as detection of the cell surface mol-ecules are the scored phenotype, the condition of the cells, surface perturbations, etc. could be potent-ial sources of technical variability. Large numbers of variant cells are scored in this assay, and so errors inherent in counting small numbers should not be a problem. As it is not possible to clone most of the TCR gene variants in vitro for further analyses, the mutational basis of the measured phenotype is usually not demonstrable.
Reporter gene somatic mutations General population studies There is an extensive literature on in-vivo somatic mutations in humans, with extensive databases for GPA and HPRT mutations (reviewed in Albertini et a1., 1990; Cole & Skopek, 1994). This section pre-sents representative results for in-vivo variant and mutant frequencies and molecular mutational spectra.
lb variant frequency. The lb mutation assay has been used in demonstration studies of very few subjects, showing in the original report a mean background VF of 11.0 x 10-g (range 4-30 x 10- ) for the single base changes producing the gene HbS and HbC mutations and, in a more recent report on five subjects, a lower mean background VF value of 3.7 x 10-g (stamatoyannopoulos & Nute, 1981; Bernini et aL, 1990). Intra-individual VF val-ues have remained stable over relatively long time intervals, i.e. at least months, and smoking report-edly elevates the haemoglobin V1 values approxi-mately twofold.
GPA variant frequency. Hundreds to thousands of individuals have been studied for in-vivo GPA mu-tations using different versions of the assay (reviewed in Cole & Skоpek, 1994). 1n general, mean hemizygous arid homozygous VF values for adults have each averaged 10 x 10-, with the for-
164

Somatic cell mutations in cancer epidemiology
mer somewhat lower and the latter somewhat higher. There is wide interindividual variability iп VF. Values f от newborns and children have been 1ow.er than in adults, indicating a clear age effect, with about a twofold increase by age 70. smoking shows a weak association with increased VF, but systematic differences are not found by gender or ethnicity.
HPRT variant frequency. For the short-term tests, most f-WRT T-cell VFs have been determined using the autoradiograpliic version of the assay. Mean values in normal populations range from 10-6 to 10-5 (reviewed in Albertini et al., 1990; Cole & skopek, 1994). VFs aie increased in adults com-pared with newborns, and in adults they generally show an increase in frequency with age. Interindividual variability ranges from 10-fold to 30-fold and smoking has generally been associated with an increase in variants. Repeat sampling from individual donors has shown differences of twofold to fourfold in most instances, although differences as great as ninefold have been reported.
HPRT mutant frequency. The Iargest in-vivo somatic mutation database is for НРRТ in T-cells, as deter-mined by cloning assay (reviewed in Albertini et al., 1990; Cole & Skipek, 1994). As these muta-tions are being confirmed by molecular studies, frequencies of TG` cells are termed IF. A recent sta-tistical analysis of four large data sets (Sussex, UK; Vermont, USA; Paris France; and Leiden, the Netherlands), including 72 newborns, 70 children and 418 adults, showed ranges of IF values of 0.1-14.7 x 10 for newborns, 0.5-39.5 x 10 for children, and 0.8-81.7 x 10- for adults, with a con-sistent trend from birth to old age (Robinson et al., 1994). smoking was clearly associated with increased MFs in the Sussex and Leiden data sets only, although a recent analysis in Vermont also showed a smoking effect. Neither sex nor ethnicity has been found to influence HPRT MFs.
'LA mutant frequency. As ‚LA mutations determined by cloning can be confirmed by molecular studies, frequencies of antigen loss cells are also termed mutant frequencies. Mean HLA MF values are 2-3 к 10-5. 'LA MFs increase with age, but the effects of tobacco use have not been investigated (reviewed in Albertini et al., 1990; Kyoizumi et al., 1992).
HLA variant frequency. HLA VFs determined by cyto-metric assay are at least five times higher than the clonally determined HLA MFs reported earlier, i.e. 1.5 x 10- and 0.7 x 10 for HLА A2 and HLA-А24 loss variants, respectively (Kushiro et al., 1992). (It is noteworthy that the anti-HLA-A2 antibody was the same for the dining and cytometric assays.) The reasons for this and for the difference between VFs determined for the two HLA-A alleles are unknown.
TCR variant frequency. There are relatively few pub-lished reports of background TCR gene VFs. As this is a phenotypic assay, the CD3 loss T-cells are referred to as variants. The background VFs are remarkably high compared with other reporter genes (except HLA loss determined by cytometry), i.e. 2.5 x 10⁻⁴ (Kyoizumi etaL, 1990, 1992). The rea-sons for this are unknown, although speculation has centred on the role of this genetic region in immune diversification, which may require hyper-mutability (HLA also is involved in immune diver-sification, but only shows high frequencies of variants in the cytometric assay). Mean TCR VFs increase with age and are reported to be one- to fourfold higher in males. No published reports of studies on newborns or young children, or of smoking effects are available.
Studies in the inherited genetic instability Marked increases of several VFs and 1v1Fs have been observed in patients who are homozygous for certain rare genetic instability syndromes due to defects in DNA repair (reviewed in Albertini et al., 1990; Cole & skopek, 1994). For example, ataxia telangiectasia (AT) homozygotes have shown increases in GPA hemizygous (0/N) and homozy-gous (N/N) VFs, HPRT MFs and TCR VFs, although no effect was seen for lb VFs. Marked excesses in somatic cell mutations have generally also been found in Bloom's syndrome and Fanconi's anaemia (FA) patients. However, a recent study did not detect increases in HPRT MFs but did find GPA VF increases in FA (sala-Trepat etaL, 1993). (An earlier study did show HPRT IF increases in FA; Vijayalaxmi et al., 1985). For xeroderma pigmen-tosum (XP), increases were found for HPRТ T-lym-phocyte MFs, but not for GPA or lb VFs. As the cause of genetic instability in Х1' is hypersensitiv-ity to UV, this finding supports the occurrence of somatic mutations in T-cells as they circulate
165

Application of 8iomarkers in Cancer Epidemiology
throughout the body—in this case in skin, where they are subject to UV irradiation. By contrast, the RBC precursor cells, in which GPA and lb muta-tioпs must occur, do not receive similar UV expo-sures. Therefore, somatic mutation appears linked to a single body compartment for the RBC precur-sors, but not for the T-cells.
Studies of environmental exposures to genotoxic agents (reviewed in Cole & 5kдpеk, 1994) lb variant frequency. Increased HbS and HbC VFs were found among subjects exposed to X-rays, and HЬLе,de1 VFs were increased after accidental expo-sure to 1i7Cs (stamatoyannopoulos & Nute, 1981; Berniui et al., 1990). Another study found HbS VFs of 8, 18, 27 and 43 x 10-d in four individuals fol-lowing their exposure to ethylene oxide, compared with a background range in unexposed individuals of 0-8 x 10 (Tates etal., 1989). However, the three exposed individuals with the most elevated values were also smokers. There have been too few stud-ies of lb mutations following mutagen exposures to evaluate its performance.
GPA variant frequency (cytometric assay). By con-trast to the lb system, there is a wealth of data on GPA mutations following human mutagen expo-sures.
Radiation. Among the earliest population studies with the GPA system were those of atomic bomb survivors. Significant GPA mutation inductions with radiation exposures were reported in two studies, with the latter showing 63.0 x 10-/Gy, 32.0 x 10⁻⁶/Gу and 0.14 x Ы-61Gу for 0/N, 0/M and М/М variants, respectively (Lang1ois et al., 1987; Kyoizumi et aI., 1989). (These were per-formed with an earlier version of the GPA assay that could also measure loss of the N form of GPA.) Similar but somewhat lower values for hemizygous variant increases have been reported more recently (Langlois et al., 1993). All results are population means; in the absence of pre-exposure reference values, individual VFs could not be used to deter-mine individual radiation exposures, as greatly ele-vated VFs were widely variable in high-dose sub-jects. These values were obtained more than 40 years after the mutagen exposure, indicating that the GPA marker can be Iong lived. This long mem-ory and the wide interindividual variabilities in
response are both consistent with the multipotent bone marrow stem cells being the mutational tar-gets at the time of the bomb blasts. As this stem cell pool contains a limited number of cells, high-dose irradiation reaching it leaves few survivors and wide fluctuations of induced mutants among individuals. Although the numbers of variants among individuals will have an enormous range, the mean VFs in the population at the different radiation exposure levels will reflect the dose. Other studies, in Goiana, Brazil, and among vic-tims of the Chernobyl accident, have reported sim-ilar results (Straume et al., 1991; Jensen et ai., 199$).
By contrast to the atomic bomb results, patients receiving local irradiation to solid tumours (Hodgkin's disease, prostate) have shown no ele-vations of GPA VFs (Mendelsohn, 1990; Grant & Bigbee, 1994). The geometry of radiation expo-sures, as well as intensity and duration, appear to be important in determining the GPA mutational response. This result is consistent with the lack of VF elevations in XP patients noted above, in that both point to the bone marrow as the sole site of in vivo mutations. However, the results of a study in Japanese patients who had received the emitter Thorotrast (12Тh) in the 193оs and 1940s for radi-ographic visualization are somewhat at variance with this (Umeld et ai., 1991; Kyoizumi et a]., 1992). ARhough this agent accumulates in body tissues, there were no significant elevations of GPA VFs in 10 patients who, as a group, did show ele-vations of TCR gene T cell VFs (see below). It is pos-sible that the bone marrow received significantly lower doses than did other tissues.
Chemotherapy-related exposures. Earlier studies of a heterogeneous group of 30 cancer patients treated with a variety of cytotoxic agents and a more recent study of breast cancer patients receiving the combination CAF (cyclophosphamide, adriamycin, 5-fluorouracil) showed consistent elevations of 0/N VFs, while patients receiving CMF (methotrexate substituted for adrlamycin) showed lower and more variable elevations (Bigbee et al., 1990). The VF elevations in chemotherapy patients treated with these S-phase specific agents were transient with values returning to normal in several months, consistent with the half-life of RBCs (Bigbee et al., 1990; Grant & Bigbee, 1994).
166
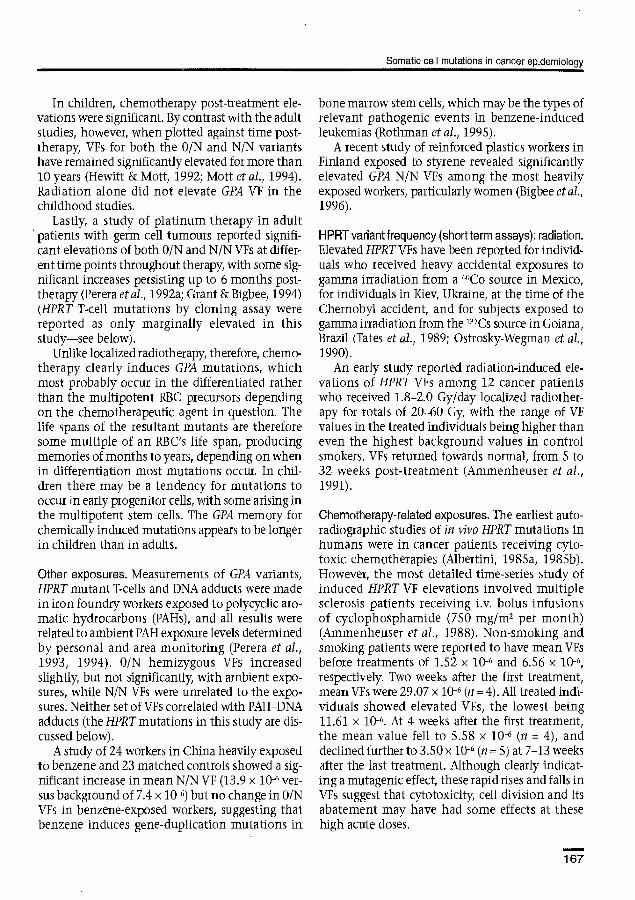
Somatic cell mutations jn cancer epidemiology
In children, chemotherapy post-treatment ele-vations were significant. By contrast with the adult studies, however, when plotted against time post-therapy, VFs for both the 0/N and N/N variants have remained significantly elevated for more than 10 years (Hewitt & Mott, 1992; Mott et al., 1994). Radiation alone did not elevate GPA VF in the childhood studies.
Lastly, a study of platinum therapy in adult patients with germ cell tumours reported signifi-cant elevations of both 0/N and N/N VFs at differ-ent time points throughout therapy, with some sig-nificant increases persisting up to 6 months post-therapy (Perera et aI., 1992a; Grant & Bigbee, 1994) (HPRT T-cell mutations by cloning assay were reported as only marginally elevated in this study—see below).
Unlike localized radiotherapy, therefore, chemo-therapy clearly induces GPA mutations, which most probably occur in the differentiated rather than the multipotent RBC precursors depending on the chemotherapeutic agent in question. The life spans of the resultant mutants are therefore some multiple of an RB C's life span, producing memories of months to years, depending on when in differentiation most mutations occui. In chil-dren there may be a tendency for mutations to occur in early progenitor cells, with some arising in the multipotent stem cells. The GPA memory for chemically induced mutations appears to be longer in children than in adults.
Other exposures. Measurements of GPA variants, IPRT mutant T cells and DNA adducts were made in iron foundry workers exposed to po1ycycflt aro-matic hydrocarbons (PAHs), and all results were related to ambient PAl exposure levels determined by personal and area monitoring (ferera et al., 1993, 1994). 0/N hemizygous VFs increased slightly, but not significantly, with ambient expo-sures, while N/N VFs were unrelated to the expo-sines. Neither set of VFs correlated with PAl-DNA adducts (the HPRT mutations in this study are dis-cussed below).
A study of 24 workers in China heavily exposed to beizene and 23 matched controls showed a sig-nificant increase in mean N/N VF (13.9 x 10 6 ver-sus background of 7.4 x 10⁻⁶) but no change in 0/N VFs in benzene-exposed workers, suggesting that benzene induces gene-duplication mutations in
bone marrow stem cells, which may be the types of relevant pathogenic events in benzene-induced leukemias (Rothman et аI., 1995).
A recent study of reinforced plastics workers in Finland exposed to styrene revealed significantly elevated GPA N/N VFs among the most heavily exposed workers, particularly women (Bigbee et al., 1996).
HPRT variant frequency (short term assays): radiation. Elevated HPRT VFs have been reported for individ-uals who received heavy accidental exposures to garmria irradiation from a Б6Со source in Mexico, for individuals in Kiev, Ukraine, at the time of the Chernobyl accident, and for subjects exposed to gamma irradiation from the Сs source in Goiana, Brazil (Tates et aL, 1989; Ostrosky-Wegman et al., 1990).
An early study reported radiation-induced ele-vations of HPRT VFs among 12 cancer patients who received 1.8-2.0 Gy/day localized radiother-apy for totals of 20-60 Gy, with the range of VF values in the treated individuals being higher than even the highest background values in control smokers. VFs returned towards normal, from $ to 32 weeks post-treatment (Ammenheuser et al., 1991).
Chemotherapy-related exposures. The earliest auto-radiographic studies of in vivo HPRT mutations in humans were in cancer patients receiving cyto-toxic chemotherapies (Albertini, 1985a, 1985b). However, the most detailed time-series study of induced I-IPRT VF elevations involved multiple sclerosis patients receiving iv. holus infusions of cyclophosphamide (750 mg/mг per month) (Ammenheuser et al., 1988). Non-smoking and smoking patients were reported to have mean VFs before treatments of 1.52 x 10⁻⁶ and 6.56 x 10⁻⁶, respectively. Two weeks after the first treatment, mean VFs were 29.07 x 10 6 (п = 4). All treated indi-viduals showed elevated VFs, the lowest being 11.61 x Lo-6. At 4 weeks after the first treatment, the mean value fell to 5.58 x 10⁻⁶ (n = 4), aid declined further to 3.50 x 10⁻⁶ (n = 5) at 7-13 weeks after the last treatment. Although clearly indicat-ing a mutagenic effect, these rapid rises and falls in VFs suggest that cytotoxicity, cell division and its abatement may have had some effects at these high acute doses.
167

Application of 82omarkers гп Cancer Epidemiology
Other exposures. An early study of nurses who dis-pense chemotherapy showed no VF elevations over background (Albertini et al., 1988). However, all safety practices had been observed. By contrast, another early study (using a version of the autora-diograpahic assay that did not take steps to elimi-nate phenocopies) did show a statistically signifi-cant (five- to sixfold) increase in VFs in cyclophos-phamide workers (Hitter et aL, 1990).
Several recent occupational studies using the autoradiographic HPRT assay have shown increases in VFs at exposure levels considered to be in the acceptable range. Three have involved expo-sures to butadiene. Thirteen non-smoking workers in a monomer production plant showed mean HPRT VFs of 1,0 z 10-6 for the six non-exposed con-trols, 1.2 x 10⁻⁶ for the five low-level exposed work-ers (0.03 ppm butadiene) and 4.0 x 10⁻⁶ for the eight high-level exposed workers (3.5 ppm butadi-ene). The mean VF of the highly exposed group was significantly elevated compared with the other groups. Furthermore, urinary levels of 1,2-dihy-droку-4- (N-acetylcysteinyl)butane, a marker of in-vivo butadiene dose, were significantly elevated in the highly exposed group and correlated signil-cantlywithlPRTVFs (Ward etal., 1994). А second study of the same worker population and an ongo-ing study of workers in styrene-butadiene produc-tion tend to confirm these results (Ward et al., 1996). Thus, these studies suggest that butadiene exposures at this level have genotoxic effects. (These results using the autoradiographic assay are remarkable because two studies with the cloning assay (in China and the Czech RериЫic; see below) have failed to show increases in HPRT MFs in pop-ulations with comparable butadiene exposures.)
The BrdU staining method of short-term assay has been used for only a single study of chemical exposure, i.e. to arsenic in Mexico (Ostrosky-Wegman et al., 1991). Although the HPRT VFs in a high-level exposure group were reportedly twice the levels in a low-level exposure group (mean 5.0 vs mean 2.4 x 10⁻⁶), this difference was not sta-tistically significant.
HPRT mutant frequency (cloning assay): radiation. Cloning assays have been used to study HPRT mu-tations in Japanese atomic bomb survivors. All studies have shown low-level MF elevations in exposed individuals, with a 'shallow' dose-
response curve (Hakoda et aL, 1988; Akiyama et aI., 1990; Hirai et al., 1995). This was initially inter-preted to indicate that HART is relatively insensi-tive to ionizing radiation. It is now realized, how-ever, that the mutational signal has decayed in the 40+ years between the exposure and testing, as a consequence of mutations arising in peripheral T-lymphocytes without renewal from the bone marrow stem cell compartment in adults. In survivors who were young at the time of the exposures, the HPRT mutations also arose in precursor bone тах row stem cells—even in rnultipotent stem cells. This is probably the reason for any elevation at all in mean HPRT MF in the exposed populations. Indeed, a molecular study in one survivor showed that at least one mutational event arose in a stem cell before differentiation into the B-, NK and T cell Lineages had occurred (Hakoda et al., 1989).
Several groups have found increased HPRT mutational responses to radiotherapy in cancer patients. From an early study of 12 breast cancer patients receiving 2 Gy/day local irradiation sam-pled shortly after treatment, it was estimated that T-cells circulating through the radiation field would have received 4 Gy irradiation, giving a radi-ation-induced increase of 6.9 x 10⁻⁶ niutants/Gy (Messing & Bradley, 1985). Others have found excesses for patients with breast cancer and Hodgkin's disease, although some investigators report only weak associations (Nicklas et al., 1990, 1991; Sala-Trepat et al., 1990; Branda et al., 1991).
There have also been measurements of HPRT T-cell mutations in patients receiving extremely low irradiations (10-15 mGy) during nuclear med-icine scans. Initial studies reported significantly increased mean MFs following these low exposure procedures (Seifert et al., 1987), while later investi-gations did not find such an effect (Bachand et al., 1991; Kelsey etal., 1991; Van Dam etal., 1991). It seems fair to conclude that the extremely low irra-diations encountered in nuclear medicine scans are not measurable as mutagenic to HPRT and that the differences among studies were due to techni-cal variables.
In contrast to patients, two early studies of radi-ation therapy and nuclear medicine technicians showed them to have elevated MFs relative to hos-pital controls based on doses received (2 mSv) in the previous 6 months (Messing etal., 1986, 1989). This same investigative group has recently studied
168

Somatic cell mutations in cancer epidemiology
workers exposed to low-level chronic irradiation (mean 1.34 гi v) tri a Quebec factory (Seifert et iL, 1993). Although no group differences were found between exposed and non-exposed workers, radia-tion doses received 48--68 weeks before sampling were significantly positively correlated with IFs. The authors calculated a rate for induction of mutants of 0.7-3.4 x 10~/sv, a rate which is simi-lar to, but somewhat less than, that determined earlier for the radiation therapy and nuclear med-icine technicians.
Of note, however, is а study of 36 workers at the Sellafield nuclear reprocessing installation, 18 of whom had cumulative recorded radiation doses of <50 mSv and 18 had cumulative doses of 500 mSv accumulated over many years, but which was clearly negative for HPRT mutations (Cole et iL, 1995).
Chemotherapy-related exposures. Many groups have used the cloning assay to measure HPRT IFs in adult patients receiving chemotherapy (Dempsey et al., 1985; Palmer et iL, 1988; Sala-Trepat et al., 1990; Branda et ai., 1991; Caggana et al., 1991). Increased IFs were found among a group of patients with solid tumours and lym-phomas, among breast cancer patients, other malignancies, and among patients treated with low doses of cyclophosphamide for connective tis-sue disease.
A recent study examined HPRT IFs in 15 can-cer patients (10 with testicular cancer) and found that cyclophosphamide and ifosfamide were the most mutagenic agents, while adriamycin, 4-epi-adriamycin and bleomycin produced equivocal responses (Tates et ai., 1994a). Cisplatin and the etoposide VP16 (a topoisomerase inhibitor) did not increase HPRT mutations. These results are in accord with another study of multiple biomarker responses in germ cell tumour patients treated with platinum-based chemotherapeutic regimens, which showed marginal elevation in HPRT IFs (but increased GPA VF5) (Perera et iL, 1992а).
The mutagenicity of chemotherapy in children has been evaluated by the HPRT doling assay. A study of 45 children with acute lymphoblastic leukaemia (ALL), 13 children with acute myeloge-nous leukaemia (AIL) aid 28 age-matched healthy controls showed a significantly higher mean IF (7.8 x 10⁻⁶) in the treated ALL patients
than in the treated AIL patients (1.7 x 10⁻⁶) and in healthy controls (1.1 x 10⁻⁶) (Нirota et iL, 1993). Fifteen of the ALL patients had IFs >10 к 10-6 and elevations persisted for years. A potentially signifi-cant difference between the HPRT mutagenic responses induced by chemotherapy in adults and in children is the usually transient nature of the former and the persistence of the latter. This may indicate that, in children, a relatively larger pro-portion of the mutations are induced in bone mar-row stem cells.
Other exposures. Oncology workers, nurses and pharmacists have all shown elevated HPRT IFs in different studies, although cloning efficiencies and lуmphoсÿte subpopulations have also occasionally been affected by the exposures, which may have axtefactually elevated values (Chrysostomou et iL, 1984; Dubeau et al., 1994). Factory workers exposed to nor-nitrogen mustard clearly showed increased HPRTIFs compared with controls (Cole & Skopek, 1994).
Two, groups of workers chronically exposed to ethylene oxide, i.e. nine hospital workers and 15 factory workers (40 h time-weighted average expo-sures of 0.25 ppm for the hospital workers and 5 ppm for the factory workers) showed mean IFs for the hospital workers of 12.4 x 10 6 and for the factory workers of 13.8 x 10⁻⁶ (Tates et iL, 1991). The latter elevation was significant compared with controls. The sensitivities of the various biomarkers employed in this study for detecting ethylene oxide exposure were haemoglobin adducts > sister chiomatid exchanges > chromosome aberrations> micronuclei > HPRT mutations. By contrast, acute high-level exposures to ethylene oxide in seven workers had no effect on HPRT, 5СЕ or any other biomarker evaluated, leading the authors to con-clude that transient exposures to this agent, even at high doses, produce no genotoxic consequences (Tates et al., 1995). In styrene workers, two HPRT studies have been negative and one suggestive of an effect in five subjects (Cole et aL, 1989; Tates et al., 1994b; Vodicka et al., 1995). In iron foundry factory workers exposed to PAHs at low levels, i.e. from <50 to 200 ng/m, HPRT mutations did cor-relate with borderline significance with estimated РАН exposure, but much more significantly with РАН adduct levels (Perera et al., 1993, 1994). (By contrast, GPA mutations in this study were not sig-
-169

Application of Biomarkers in Cancer Epidemiology
ntiicantly elevated and did not correlate with DNA adducts.) In a study of bus maintenance workers, both the HPRT MFs and the РАН adduct levels were highest in the most heavily exposed workers, with a highly significant increase in individual MFs observed with increasing adduct levels (Hou et al., 1995b). Two recent studies that used the cloning assay to measure HPRT MFs in butadiene-exposed workers have been negative (Hayes et al., 1996; Tates et al., 1996). These butadiene studies contrast with those mentioned above which used the autoradiographrc assay.
In summary, ionizing radiation and chemicals at exposure levels found in accidental, household and occupational settings do induce HPRT muta-tional responses. The autoradiographic form of the assay may detect exposures with greater sensitivity than the cloning assay, but this must be demon strated for the same populations receiving the same exposures for any valid conclusion.
HLA mutant frequency. The cloning assay for HLA mutations has not been used, thus far, to study humans exposed to mutagens.
HLA variant frequency (cytometric assay). The cyto-metric assay for 'LA mutations was used to study 69 atomic bomb survivors, chosen as low-dose exposed (DS 86 doses = 0 Gy; 1986 estimates) or high-dose exposed (DS 86 doses >1 Gy) (Kushiro et cL, 1992). There were no significant increases in VFs with radiation. It was concluded from this study that 'LA mutations cannot be detected in T-lymphocytes after the 40-50 years' lag between exposure and assay.
TCR variant frequency (cytometric assay). This assay has been used only to study radiation exposures. No significant dose effects were found in a large study of atomic bomb survivors, indicating again that mutational signals in T-cells have decayed in the 40+ years between exposure and test (Kyoizumi et cL, 1992). A single individual exposed to 3-1 Gy in Chernobyl was found to have an elevated VF of 21.1 x 10-d 3.5 years later.
Eighteen thyroid cancer patients treated with 1311 from 2 months to 5 years earlier showed a sig-nificant linear relationship between the amount of radioactivity administered and the TCR gene VFs (Kyoizumi eta?., 1992). The induced mutations per
administered dose were calculated as 0.30 x 10-d TCR variantslGBq. Similarly, TCR VFs in six of 10 patients who received z3zTh for radiographic visu-alizations were elevated compared with concurrent controls (Umeki eta?., 1991; Kyoizumi et cL, 1992). Z3ZТh remains in the body and produces constant irradiation. By contrast, GPA VFs also measured in these patients showed no significant elevations.
Mutation spectra in reporter genes The T-сеll cloning assays allow for molecular analy-ses of mutations. By far the largest database is for HPRT, where mutation events ranging from single base changes to deletions, translocations and recombinations have been identified, and muta-tional spectra under a variety of circumstances have been described. 'LA molecular analyses have been limited to Southern blots which have revealed a high frequency of events such as somatic recombi-nation that involve the homologous chromosome. In contrast to autosomal genes, the X-chromosomal HPRT gene cannot undergo homologous recornbi-nation. However, the mutation spectra defined to date have been for HPRT mutations.
HPRT mutational spectra Thousands of `spontaneous' IPRT mutations aris-ing lu vivo in human T-cells have now been analysed at the molecular level. There have been several recent reviews of molecular studies, and a computerized database of published results is avail-able (Albertini et cl., 1990; Cariello et aL, 1992; Cariello & Skopek, 1993; Cole & Skоpek, 1994; Cariello, 1994).
The adult background HPRT mutational spec-trum differs from that in the fetus and in young children. In adults, <15% of mutations arising in vivo show gross structural alterations such as dele-tions, insertions or other rearrangements on Southern blots (Nicklas et al., 1989) (these 5outhem blot alterations involve >300 base pairs). The remaining 85% of adult HPRT mutations have been classified as `point mutations' and include base substitutions, frame-shifts, smaller deletions and insertions, соmрlек alterations and uncharac-terized splice site changes. By contrast, the back-ground HPRT mutations in placental cord blood show 75-85% to have gross structural alterations and the remainder to be `point mutations' (Finette
170
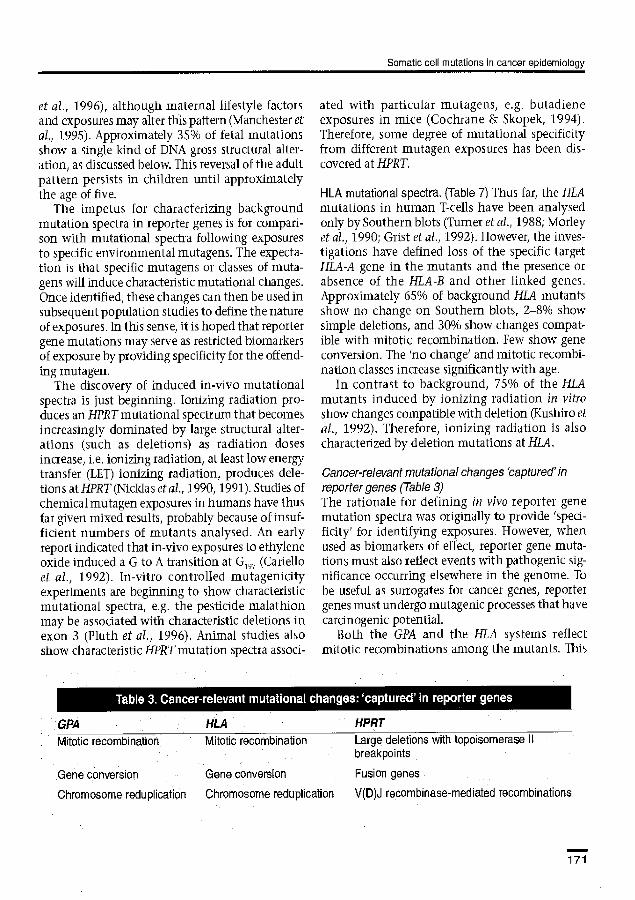
Somatic cell mutations in cancer epidemiology
et aL, 1996), although maternal lifestyle factors and exposures may alter this pattern (Manchester et at, 1995). Approximately 35% of fetal mutations show a single kind of DNA gross structural alter-ation, as discussed below. This reversal of the adult patters persists in children until approximately the age of five.
The impetus for characterizing background mutation spectra in reporter genes is for compari-son with mutational spectra following exposures to specific environmental mutagens. The expecta-tion is that specific znutagепs or classes of muta-gens will induce characteristic mutational changes. Once identified, these changes can then be used in subsequent population studies to define the nature of exposures. In this sense, it is hoped that reporter gene mutations may serve as restricted biomarkers of exposure by providing specificity for the offend-ing mutagen.
The discovery of induced in-vivo mutational spectra is just beginning. Ionizing radiation pro-duces an HPRT mutational spectrum that becomes increasingly dominated by large structural alter-ations (such as deletions) as radiation doses increase, i.e. ionizing radiation, at least low energy transfer (LET) ionizing radiation, produces dele-tions at HPRT (Nicklas etal., 1990, 1991). Studies of chemical mutagen exposures in humans have thus far given mixed results, probably because of msuf-ficient numbers of mutants analysed. An early report indicated that in-vivo exposures to ethylene oxide induced a G to A transition at G197 (Cariello et al., 1992). In-vitro controlled mutagenicity experiments are beginning to show characteristic mutational spectra, e.g. the pesticide malathion may be associated with characteristic deletions in exon 3 (P1uth et aI., 1996). Animal studies also show characteristic HPRT mutation spectra associ-
ated with particular mutagens, e.g. butadiene exposures in mice (Cochrane & 5koрek, 1994). Therefore, some degree of mutational specificity from different mutagen exposures has been dis-covered at HART.
HLA mutational spectra. (Table 7) Thus far, the HLA mutations in human T cells have been analysed only by Southern blots (Turner et al., 1988; Morley et al., 1990; Grist et at, 1992). However, the inves-tigations have defined loss of the specific target HLA-A gene in the mutants and the presence or absence of the HLA-B and other linked genes. Approximately 65% of background HLA mutants show no change on 5outhern blots, 2-8% show simple deletions, and 34% show changes compat-ible with mitotic recombination. Few show gene conversion. The 'no change' and mitotic recombi-nation classes increase significantly with age.
In contrast to background, 75% of the HLA mutants induced by ionizing radiation in vitro show changes compatible with deletion (Kushiro et al., 1992). Therefore, ionizing radiation is also characterized by deletion mutations at HLA.
Cancer-relevant mutational changes `captured' in reporter genes (Table 3) The rationale for defining in vivo reporter gene mutation spectra was originally to provide `speci-ficity' for identifying exposures. However, when used as biomarkers of effect, reporter gene muta-tions must also reflect events with pathogenic sig-nificance occurring elsewhere in the genome. To be useful as surrogates for cancer genes, reporter genes must undergo mutagenic processes that have carcinogenic potential.
Both the GPA and the HLA systems reflect mitotic recombinations among the mutants. This
GPA HLA HPRT
Mitotic recombination: Mitotic recombination Large deletions with topoisomerase Il breakpoints
Gene conversion Gene conversion Fusion gens
Chromosome reduplication Chromosome reduplication V(D) J recombinase-mediated recombinations.
171

Application of Biomarkers in Cancer Epidemiology
mutational mechanism is known to underlie loss of heterozygosity (LOI) in several tumour sup- pressor genes, and, therefore, is an important mutational step in carcinogenesis. Agents that cause such changes in reporter genes, e.g. benzene- induced `homozygous' GPA mutations as noted above, may be human carcinogens (Rothman et al., 1995). Monitoring for such specific mutational changes may be important for predicting individ-ual cancer outcomes.
Although the HPRT gene cannot undergo homologous somatic recombination, it does cap- ture a variety of other carcinogenic mutagenic mechanisms. Large deletions and translocations, common in human tumours, are frequent changes in HPRT mutations (Nicklas et al., 1989), particu- larly those following ionizing radiation (Nicklas et а1.,1990, 1991). The breakpoints of deletions often occur in DNA sequences with high homology to topoisomerase II consensus cleavage sequences where similar breakpoint sites are seen in the leukemias (Rainville et al., 1995). HPRT mutations also may produce fusion genes, another change frequently observed in cancer.
One specific mutational change in HPRT is par-ticularly striking because it mimics so weI1 an event seen tri virtually all lymphoid malignancies (Finger et aI., 1986; Boehm & Rabbitts, 1989; Tycko & Sklar, 1990; Breit et al., 1993). This is the specific intra- genic deletion that occurs in vivo during fetal life and early childhood, which is the most frequent sin-gle class of background HPRT mutations during this period of life (Fuscoe et a1., 1991; Manchester et al., 1995; Finette et aL, 1996). These mutations show all of the characteristics of the ц(D)1-mediated recom- bination that characterizes the TCR gene rearrange- ments, and they are virtually identical, at the sequence level, to the known cancer-related V(D)J recombinase-mediated mutations in lymphoid malignancies. This mutagenic mechanism with car-cinogenic potential is precisely captured in HPRT.
As specific mutational mechanisms of carcino-gerdc significance are recognized, it becomes feasi-ble to develop PCR and other molecular tech-niques for their rapid identification. Monitoring for these precise events, rather than reporter gene mutations in general, may be the relevant mea-sures in reporter genes when they are used as bio-markers of effect in cancer epidemiology.
5omatic mutations in cancer genes Several assays have been developed to detect gene mutations in cancer genes or their products.
Cancer-associated 'mutation'assays (Box 1) Phenotypic `mutation' assays. Malignant transfor-mations are associated with mutations of onco-genes and tumour suppressor genes. In the case of the former, mutations result iп overexpression of a normal protein (or expression of an aberrant pro-tein) essential for cell proliferation. Many inca-proteins and tumoui suppressor gene proteins are detectable by immunological techniques, e.g. nnmunoblot, ELISA, in body fluids such as serum from cancer patients (Brandt-Rauf, 1991, 1992). Studies of banked sera have revealed that, in many patients, the increased oncoprotein levels were present months to years before diagnosis. For envi-ronmentally related malignancies, it has been pos-tulated that the causative carcinogen mutated the relevant gene(s) before the onset of clinical cancer. Measurements of these proteins might therefore be used as biomarkers of effect in epidemiological studies to detect cancer-relevant somatic muta-tions. Although many oncoproteins and tumour suppressor proteins have been studied, attention has focused on the ras p21 protein, the extracelIu-lar domain (ECD) of the c-еrbВ-2 (HER-2, feu) p185 protein, the R-transforming growth factor ((3-TGF) protein and the p53 protein. Genotypic `mutation' assays. Two polymerase chain reaction (PCR)-based molecular assays have been
в
Phenotypic assays • Oncogene protein in serum
ras р21 ECD of aerb 8-2 pi В (i-TG F
• Tumour suppressor proteins in serum Р53
lenotypic assays Hybrid TIR genes
ВСL-2 rearrangements
172

Bomalic call mutations in cancer ерVdemiology
introduced to detect 'mutations' associated with сапсeт. Strictly speaking, both measure forms of chromosome aberrations mediated by aberrant V(D)J recombinase activity, as described above. These two assays are described here because they measure directly either a cancer-relevant mutation mechanism or a known cancer-related chromo-some translocation.
The first of these assays detects hybrid TCR genes, i.e. VR -Jy or Vy JR, formed by inversions of chromosome 7 (iпv7[р13.; g321) (Lipkowitz et al., 1992). This inversion joins the ТСRу gene on chro-mosome 7р13-15 to the ТСАR gene an 7g32-35. (This molecular assay may measure events similar to the cytometric TCR gene somatic mutation assay described above, but direct comparisons have not been made.) By chosing primers for PCR from appropriate 3 and yTCR gene regions, products are formed only when the inversion has occurred. The assay is performed on peripheral blood lympho-cytes, presumably the T-cells.
The second molecular method (BCL-2 translo-cation assay) measures an aberrant V(D)J recombi-nase-mediated event of direct relevance to cancer (Liu et al., 1994). The chromosome translocation t(14:18) (g32:q21), which occurs at high frequency in non-Hodgkin's lymphomas, brings together the B-cell leukеmiа!lymphопtа-2 (BCL-2) locus on chromosome 18 aлд the 1g heavy chain joining U) region on chromosome 14, dysregulating the for-mеr and resulting in delayed programmed cell death. Again, by choosing appropriate primers for PCR, products are formed only when the translo-cation has occurred. The assay is performed оп normal peripheral blood lymphocytes, presumably the B-cells.
Cancer-associated gene mutations in humans The phenotypic assays. Immunological detection of oncogene and tumour suppressor gene products in sera was initially carried outil cancer patients to define the percentage of positives for the diffeтent cancers for the different products. As testing mоvед to serum banks, it became possible to assess sera retrospectively to determine if significant ele-vations of the serum markers could be found before the onset of cancer. Thus, the utility of these assays was originaly for early diagnosis.
Oncogene and tumour suppressor gene proteins have now Ьееn used as biomarkers of effect in
several human studies. Depending on the methods used and the products studied, these molecules may be found at low levels in healthy control indi-viduals. Therefore, different studies have used different definitions of `positive'. Furthermore, although some studies measured truly mutant pro-teins, most have simply measured increased levels of the marker protein, using methods that сoulд not distinguish between mutant and normal mol-ecules. The assumption is that elevated levels of even normal proteins are probably due to somatic mutations and correlate with cancer.
An early study of the ras p21 protein in healthy Finnish foundry workers exposed to PAHs in the workplace showed that one of the eight exposed and none of 10 unexposed individuals had de-tectable serum levels (Brandt-Rauf, 1992). 1n another study, three of 16 hazardous waste workers ех-posed to a wide variety of mutagens showed detectable serum ras p21 proteins, as did two of 17 unexposed workers (Brandt-Rauf, 1992). Both of the latter, however, were heavy smokers and were only 'trace' positive. One of the exposed workers developed a premalignant colon lésion 1.5 years after testing. Removal of this lesion normalized the serum ras p21 protein level.
Serum ras p21 proteins were determined in a Polish population study where a doubling in the frequency of high ras oncogene expression (>2SD control serum levels) was found in individuals exposed to environmental pollutants (Perera et al., 1992b). A more recent study measured the ras р21 serum proteins in butadiexie-exposed workers and found ria elevations (Anderson et aL, 1996).
A study in vinyl chloride (VC) workers moni-tored the specific mutant Asp13c-Ki-rяs p21 protein (DeVivo et aL, 1994). Four of five exposed workers with liver angiosarcoma and eight of nine with liver auguras had detectable mutant proteins (by immunoblotting) in their sera. Importantly, 22 of 45(49%) of the VC-exposed workers with no evi-dence of liver neoplasia also showed detectable lev-els. A significant linear trend was found for mutant p21 protein in serum and increasing duration of VC exposure. None of 28 non-exposed individuals had detectable serum mutant p21 protein.
Other oncoproteins have also been studied in mutagenlcarcinogen-exposed individuals. Forty-six pneumoconiosis patients (32 asbestos, 10 sili-cosis) were studied for a variety of oncoproteins
173

Application of Biomarkers in Cancer Epidemiology
(Brandt-Rauf et al., 1992). Five of 18 with cancer had elevated serum ras p21 proteins (total) defined as a fivefold elevation over normal by dilu-tion, compared with only two of the 28 without cancer. There were many pre-diagnosis positive serum values in this study. Pneurnoconiosis patients also had significant elevations of platelet-derived growth factor (PDGF) serum proteins.
Another study of multiple serum oncoproteins showed that the (3-TGF proteins were elevated in 14 of 33 fire-fighters exposed to a variety of pulmonary mutagens/carcinogens (Ford et aL, 1992). No eleva-tions were found in unexposed controls.
studies are being reported of serum levels of the extrace11ular domain (ECD) of the c-еrbB-2 protein p185 and the epidermal growth factor receptor (EGF) protein (Brandt-Rauf et al., 1994; Partanen et яl., 1994). These are elevated in certain premalig-nant conditions, in early cancers, and in some exposure situations with a high risk of cancer. Studies of p53 serum protein in early cancers are ongoing. AI are being pursued with the goal of developing biomarkers of effect for human muta-genicity monitoring.
The history of the of cancer gene biomarkers is that the original study populations were individu-als with cancers. Studies then progressed to indi-viduals with early cancers then to individuals with premalignant conditions, and finally to individu-ais exposed to mutagenslcarcinogerrs with a high risk of cancer. This contrasts with the history of the reporter gene mutation assays. In this case, devel-opment progressed from studies of healthy indi-viduals exposed to mutagenic agents and were designed to detect exposures. Only recently has attention focused on cancer-relevant mutagenic mechanisms. Thus, development of these two kinds of assays have progressed from opposite directions towards each other, i.e. reporter genes moving from exposure to disease, with the cancer gene mutations moving from disease to exposures.
The genotypic assays. The PCR-based method for detecting the inv7 (р13 X32) chromosome aberra-tion has been used to study normal individuals, patients with AT, and individuals exposed to pesti-cides (Lipkowitz et a1., 1992). Normal background frequencies are 10, as determined by limiting di u-tions. AT homozygotes have a 100-fold increase in frequency, while heterozygous carriers have nor-
mal values. Importantly, individuals heavily ех-posed to pesticides have had inversion frequencies intёrmediatе between normal control and AT patients.
Standardization of the PCR method for detecting BCL-2 translocation frequencies is just beginning (Liu et al., 1994). Quantification is achieved by a multiple tube method based on Poisson distribu-tions. Individuals with no detectable transloca-tions (dl-6) are considered as `negative.' Twenty-four of 53 blood samples from normal individuals were negative for this translocation. 0f the posi-tives, translocation frequencies varied from 0.8 to 32,0 x 10⁻⁶, a 40-fold difference between the lowest and the highest (values d0-6 can be detected when frequencies are based on several analyses). When stratified into age groupings of 0--20 years, 21-40 years, 41-60 years and >60 years, these frequencies were 0.29, 0.77, 1.43 and 3.39 x 10-', respectively. Variability also increased with age. (It should be noted that, although termed `translocation fre-quencies', many of the translocations from specific individuals represent large clones, some of which have persisted for long intervals. Therefore, in these cases the measured frequencies greatly over-estimate the translocation events.)
Issues in the application of somatic mutations in epidemiological studies strengths and limitations of the methods At present, seven assays are available for assessing mutations of five reporter genes using two cell types. Mutations scored in RBCs occur in nucleated precursor cells, thus limiting the in-vivo site of mutation to the bone marrow. Moreover, the RBC assays, i.e. lb and GPA, do not allow for molecular analyses of the mutations or the development of direct molecular detection methods. The advan-tages of the RBC assays is that they require very small blood samples and are rapid, inexpensive and simple. Furthermore, the GPA assay, although phenotypic, allows for assessment of mitotic recombination, an important mechanism in LOH. Finally, when mutations arise in the multipotent bone marrow stem cells, they are potentially long-lived and may be used for remote dose reconstruc- tions or nested case—control studies. (However, chemically induced mutations in RBC precursors appear to arise, in part, in more differentiated cells with much shorter persistence, i.e. onlymonths.)
174

Somatic cell mutations in cancer epidemiology
The greatest strength of the lymphocyte assays is that they provide nucleated cells for molecular analyses. Mutation spectra can be determined and direct molecular assay methods developed. Further-more, as mutations occur in peripheral T-cells, mutations can arise in all body sites. А limitation of T-cells, however, is that tissue culture methods must be used for molecular analyses to be possible. These are usually slow, costly and labour-intensive. In addition, relatively large blood samples must be obtained. The short-term lymphocyte assays cir-cumvent this, using inexpensive and rapid meth-ods, but do not allow for molecular analyses. The mutational memory in the peripheral T-cells is probably a matter of months, at least in adults. Therefore, these mutations will not be of value for remote past exposures.
The time of appearance of mutants in peripheral cells has not been precisely defined for all of the mutation assays. Mutants appear as early as 2 weeks after mutagen exposures, as shown for the НPВТ autoradiographic assay (Ammenheuser et a?., 1988). Usually, however, the time for optimal occurrence will be a period of months, Additional longitudinal studies are needed to establish the time of optimum mutant appearance for various exposures. In any case, mutant cells will usually appear long after the metabolites, SCEs and chu-mosomal aberrations when these biomarkers are used with somatic mutations in epidemiological studies. The use of multiple biomarkers, however, is usually advantageous in epidemiological studies as some, i.e. DNA adducts, are the best estimators of in-vivo mutagen doses. Several studies have shown correlations of HPRT mutations to these biomarkers of exposure but not to ambient exposures.
Assay variability All of the currently used reporter gene assays show large interindividual variation. Much of this is bio-logical, and epidemiological studies will help to establish the precise causes. It has been shown that the rare genetic instability syndromes are associ-ated with large increases in VFs and MFs. It is not known however, if lesser deficiencies of DNA repair will also be reflected in detectable increases in mutations. This will require methods to assess more accurately the repair capabilities themselves. An important emerging area of research is the cor-relation between the various metabolic genotypes
and the interindividual differences in somatic mutations. Since these genotypes are associated with different responses for the biomarkers of exposure, i.e. DNA adducts, there is every reason to expect that somatic mutations will also be increased in susceptible individuals. A suggested association between increased HPRT MF in indi-viduals of GST11 null genotype has recently been reported (Hou eta?., 1995a). Eventually, epideniio-logical studies will have to take all of these into account in assessing somatic mutations.
Physiological, nutritional and pathological changes can also influence interindividual and even intra-individual replicate sample variations in somatic mutations. For example, recent studies have shown that HPRT mutations are inversely asso-ciated with serum folate levels (Branda et al., 1991). Viral infections may increase the mutability of some somatic cells (Havre et al., 1995). Autoimmune dis-eases raise in-vivo T-cell IPKT MFs, probably as a consequence of increased cell proliferation
(Theocharis eta?., 1995). Haematopoietic stress may also affect RBC assays. Further studies will also have to relate VFs and MFs to these factors.
This variability obviously affects the ability to detect differences in VFs or MFs between groups in epidemiological studies. A systematic analysis of required sample sizes, given various coefficients of variation, has been accomplished for the HPRT cloning assay (Robinson et al., 1994). Similar analyses must be undertaken for all of the systems.
Superimposed on the biological variability is the technical variability. Cryo- or other standards must be developed and validated over time for all of the assays used in epidemiological studies.
Somatrc mыations as biomarkers of exposure Exposure/dose assessment. Somatic mutations in reporter genes are used to assess mutagen/carcinogen exposures. A major determinant of their utility in this regard is their sensitivity relative to other bio-logical end-points. Although mutations do detect exposures, it has been shown that, compared to other measures, e.g. metabolites or protein or DNA adducts, they are among the least sensitive for chemical mutagens/carcinogens (Tates et al., 1991). This might have been expected as the metabolites and adducts are more proximal to the exposures. However, even for acute ionizing irradiation, the most sensitive of the somatic mutation assays is no
175

Application of Biomarkors in Cancer Epidemiology
better and probably less sensitive than are chro-mosome aberrations. The reason is that the latter, although clearly reflecting a genotoxic effect, is a very large target, i.e. the entire genome.
Although lacking in sensitivity, there aie occa-sions when reporter gene mutations may be used as exposure dosimeters. First, those assays that are simple and require only small blood samples may be easier and less expensive to use than other biomarkers. Moreover, mutations may be used for exposure assessment for unknown mutagens/ carcinogens when no other biological end-points are available. Another use for certain somatic mutations for exposure/dose assessment may be for dose reconstructions of remote exposures, as in nested case-control studies. However, only muta-tion assays that detect events in stem cells, i.e. the RBC assays, will be useful in this regard. Finally, somatic mutations in the fetus, i.e. as HPRT in T-ce11s, may be useful for population exposure assess-ments because the newly induced mutations arise on a low and characteristic background.
Exposure characterization. Somatic mutations as biomarkers of exposure may have their greatest utility in terms of exposure characterizations. Mutation spectra are being defined with the expec-tation that the naturally occurring background spectrum will differ from those рrодисед by dif-ferent mutagens or classes of mutagens. If so, char-acterizing the mutations will allow a diagnosis of a specific exposure, i.e. will provide specificity. This will be possible only for those mutations that are recovered for molecular analyses—currently re-quiring the T-cell assays and laborious tissue cul-ture methods.
It has been shown that ionizing radiation pro-duces a characteristic spectrum of deletions for both HPRT and BLA mutations. A good deal of effort is now being expended in defining chemical molecu-lar mutational spectra using both in-vivo and in-vitro systems. The identification of such spectra for exposure characterizations may become an impor-tant reason for mutagehicity monitoring in humans.
Somatic mutations for detecting genotoxic effects Somatic mutations unequivocally reveal genotoxic effects. Although such effects in reporter genes do not necessarily indicate genotoxic effects in cancer genes, the most important potential application
of reporter gene mutations for human bioinoni-toting may eventually be as surrogates for cancer mutations. For this to become a reality, it must be demonstrated that mutations in reporter genes, measured in tissues of convenience, are valid surrogates for mutations in cancer genes occurring in target tissues.
Current evidence that reporter gene mutations are valid surrogates in this regard is indirect but positive. First, there is the analogy to another bio-marker of effect, namely non-specific chromosome aberrations. Two recent retrospective follow-up studies have shown that individuals with high frequencies of non-specific chromosome changes have relative risks of developing cancer in the next decade of greater than 2.0 (Hagmar et al., 1994; Bonassi et aI., 1995). Regression analyses indicated that the aberrations conferred risk beyond that associated with exposure per se (Bonassi et al., 1995). It is noteworthy that SCE frequencies, which often detect exposures more sensitively, were riot associated with increases in cancer risk.
Animal studies have shown that agents that produce cancers in various tissues also produce HPRT T-cell mutations in vivo (idoo et al., 1991). Thus, HPRT is a functional surrogate for cancer in these species. Finally, the administration of radio-protective agents in mice receiving ionizing radia-tion reduced both the induced malignancies and HPRT T-cell mutations, again relating the reporter events to disease-causing events (Grdina et al., 1991, 1992).
The best evidence that reporter mutations reflect the occurrence of cancer gene mutations in humans is the discovery that mutagenic mecha-nisms with carcinogenic potential are captured in these reporter genes. The occurrences of the somatic recombinations, the deletions with char-acteristic breakpoints, the fusion genes and the V(D)J rеcoшЫnase-mediated mutations in the var-ious reporter genes have been described.
The use of the various assays detecting events in cancer genes for epidemiological studies remains to be defined.
Future directions Next-generation assay development The next generation of assay development will probably involve both reporter and cancer genes. Reporter genes are useful for defining the molecular
176

Somatic cell mutations in cancer epidemiology
bases of in-vivo genetic damage. However, the assays that allow this are costly and difficult to per-form. New developments will therefore be in methods to identify and quantify mutations that do not require tissue culture.
The five current reporter gene mutation assays use only blood cells. The development of molecular-based assays will also allow the sampling of other non-selectable genes and will include examination of other tissues. Eventually, a large armamentar-ium can be developed, using the tissue culture method to design and characterize systems and the molecular technologies for application to large- scale human studies. ,
The development of mutation assays for changes in cancer genes is just now beginning. Future assay development will likely focus on exposure-specific mutations or mutated protein products. Specific and sensitive immunological and molecular assays require further methodological development.
Increased understanding of the biological process of somatic mutation The interpretation of somatic mutations in human populations will be enhanced by increased uлдех-standing of the biological basis of their occurrence and of how this relates to human carcinogenesis. Advances in our understanding of the biological basis for seveial of the major gene instability syn-dromes have led to an appreciation of the undez-lуiпg mechanisms for the frequent occurrence of somatic mutations in these syndromes. Other mechanistic links may be expected, as indicated above for V(D)) recombinase. It has recently been demonstrated that transfection of human cells in vitro with HPV proteins may inactivate p53 and increase mutagenesis of the HPRT reporter gene (Havre et cL, 1995). Thus, somatic mutations in human populations may be determined by infec-tions as well as by chemical' physical mutageп exposures and underlying genetic susceptibilities. Studies in human populations exploring the mech-anisms for somatic cell mutation will contribute to an understanding of these interrelated factors, and consequently of a possible relation to cancer.
Although the 'memory' of somatic mutations appears to diminish with time, the temporal se-quence of development, appearance in the periph-eral blood (or other potentially assessed tissues), and eventual disappearance of somatic mutations
are poorly understood. As our understanding of cell replication and death increases, it may be pos-sible to distinguish more clearly long-term muta-tional events. This would clearly be advantageous for the purposes of dosimetry. This insight, how-ever, may also be relevant for understanding the time-dependent relationship between exposure and the development of cancer. For example, radi-ation-induced leukemia is detectable after just a few years, reaches a peak at about 5 years after exposure, and decreases thereafter (Committee on the Biological Effects of Ionizing Radiation, 1990). A similar pattern, but with a substantially longer wave period, has been described for radon-induced lung cancer (Lubin et al., 1994). Studies to evaluate the time-dependent occurrence of somatic muta-tions in cell populations may provide insight into this process.
With the further development of mole culai approaches to somatic mutation assessment, it will increasingly be possible to investigate multiple markers in human studies. This approach can pro-vide internal consistency checks and may broaden mechanistic understanding.
Validation of somatic mutations as predictors of disease outcome A limitation for the interpretation of the reporter gene somatic cell mutation assays is uncertainty about the significance of these events as surrogates for mutations leading to cancer in humans. For mutations in cancer genes, problems in interpreta-tion also arise because the mutations observed may not lead to functional alterations or may be 'after the fact', i.e. may indicate existing but subclinical cancer, and therefore not be useful for the purposes of prevention.
With improvements in assay methodology, it will increasingly be possible in large-scale epidemiological studies to determine if specific somatic cell mutations are statistically associated with increased risks for cancer. Case—control stud-ies can be used for this purpose, but will probably be of limited value for the 'short memory' markers and because of the possibility that disease status may influence marker outcome. 'Nested' case—control studies of a subset of cases and comparison subjects for whom samples were collected prior to disease development as part of a large cohort investigation provide a methodologically sound alternative to
177

Application of Biomarkers in Cancer Epidemiology
the case—control study. Several such cohorts have now been established, but procedures for the col-lection and storage of biological materials are suit-able only for molecular studies and not for the standard cell-based assays, unless special proce-dures such as cryopreservatlon are undertaken. Although a case can be made for the special storage procedures, they are laborious and expensive. Because of this, direct validation studies will usu-ally require molecular approaches.
While such validation studies are clearly needed to describe the statistical relationship between somatic mutations and cancer risk, a positive asso-ciation does not establish a causal link. Ultimately, the usefulness of the somatic ceI1 mutation assays will be based upon our understanding of their biological basis and of how this relates to human carcinogenesis.
References Aidoo, A., Lyn-Cook, L.E., Mittelsyaedt, RA., Heflich, R.H. & Casciano, D,A. (1991) Induction of 6-thiogua-nine-resistant lymphocytes in Fischer 344 rats following in vivo exposure to N-ethyl-N-nitrosourea and cyclophos-phamide. Environ. Mod. Mutagen., 17, 141-151
Akiyama, M., Kyoizumi, 5., Hirai, Y., Hakoda, M., Nakamura, N. & Awa, A.A. (1990) Studies on chromosome aberrations and IPRT mutations in lymphocytes and GPA mutation in erythrocytes of atomic bomb survivors. In: Mendelson, ML. & Albertini, R.J., eels, Mutation and the Environment Part c: Somatic and Heritable Mutation, Adduction, and Ерiдеmiоlоgy, Progress in Clinical and Biological Research, 340e, New York, Wiley-Liss, pp. 69-80
Albertini, R.J. (1985а) Somatic gene mutations in vivo as indicated by the 6-thioguanine-resistant T-lymphocytes in human biood. Mut. Res., 150, 411-422
Albertini, R.J. (1985b) The use of human T-lymphocytes to monitor mutations in human populations. In: Li, A.P., ed. New Approaches in Toxicity Testing and Their Application in Huma" Risk Assessments. New York, Raven Press. pp. 51-66
Albertini, R.J., Allen, E.F. Quinn, A.s, & Albertini, M.R. (1961) Human somatic cell mutation: in vivo variant lym-phocyte frequencies determined by 6-thioguaпiпe resis-tant lymphocytes. In: Hook, PB. & Potter, J.H., eds, Population and Biological Aspects of J-lamai Mutation, New York, Academic Press, pp. 235-263
Albertini, R.J., Castle, K.L. & Borcherding, W.R. (1982) T-cell cloning to detect the mutant б-thioguadne-resistant lymphocytes present in human peripheral blood. Proc. NatlAcad. Sсi. USA, 79, 6617-6621
Albertini, R.J., 5u11ivan, L.S., Berman, J.K., Greene, С.J., Stewart, J.A., Silveira, J.M. & O'Neill, J.P. (1988) Mutagenicity monitoring iii humans by autoradiographic assay for mutant T-lymphocytes. Mut. Res., 204, 481-492
Albertini, R.J., Nicklas, J.А., O.'Neill, J.Р. & Robison, 5.H. (1990) 7п vivo somatic mutations in humans: measure-ment and analysis. Ann. Rev. Genet., 24, 305-326
Ammenheuser, M.M., Ward J.B. Jr, Whorton, E.В., Jr, Killian, J.M. & Legator, M.5. (1988) Elevated frequencies of 6-thioguаnine resistant lymphocytes in multiple scle-rosis patients treated with cyclophosphamide: a prospec-tive study. Mut. Res., 204, 509-520
Ammenheuser, M.M., Au, W.W., Whorton LB. Jr, Belli, J.A. & Ward J.B., Jr (1991) Comparison otlPRTvariarnt fre-quencies and chromosome aberration frequencies in lym-phocytes from radiotherapy and chemotherapy patients: a prospective study. Environ.Mol. Mutagen. 18, 126-135
Anderson, D., Hughes, J.А. Brinkworth, lvii., Peltonen K. & Sousa, M. (1996) Levels of ras oncoproteins in human plasma from 1,3-butadiene-exposed workers and controls. Mut. Res., 349, 115-120
Bachand, M., Seifert, A.M. & Messing, K. (1991) Nuclear medicine patients do not have higher mutant frequen-cies after exposure thallium-201. Mut. Res., 262, 1-6
Bernini, LE, Nataraj an, A.T., Schreuder-Rotteveel А.Н.I., Giordano, P.C., Ploem, J.S. & Tates, A. (1990) Assay for somatic mutation of human hemoglobins. In: Mendelson, M.L. & Albertini, R.J., ids, Mutation and the Environment Part c: Somatic and Heritable Mutation, Adduction, and Epidemiology, Vol Progress in Clinical and Biological Research, 340e, New York, Wiley-Liss, pp, 57-68
Bigbee, W.L., Branscombe, E.W., Weintraub, H.B., Papayannapoulou, T & 5tamatoyannopoulos, G. (1981) Cell sorter irrununofiuoiescence detection of human ery-throcytes labeled in suspension with antibodies specific for hemoglobin Sand C. J. Immunol. Methods, 45, 117-127
Bigbee, W.L. Wryobek, R.G., Langlois, R.G., Jensen, R.H. & Everson, А.B. (1990) The effect of chemotherapy on the in vivo frequency of glycophorin A "null" variant erythrocytes. Mut. Res., 240, 165-175
Bigbee, W.L,, Grant, 5.G., Langlois, R.G., Jensen, R,H,, Anttila, A., Pfaffli, P,, Pekari, K. & Norppa, H. (1996) Glycophorin A (GPA) somatic cell mutation frequencies in Finnish reinforced plastics workers exposed to styrene. CancerEpideminl. Biomarkers Prev., 5, 801-810
Bodmer, W.F. (1984) The HLA system, 1984. In: Albeit, E.D., Baur, M.P. & Mayr, W.R., eds, Histocompatibility Testing 1984, Berhn, 5pringеr Verlag, pp. 11-22
Boehm, 'Г. & Rabbitts, T.H. (1989) The human T cell receptor genes are targets for chromosomal abnormali-
178

Somatic cell mutations in cancer epidemiology
ties in T cell tumors. PAsEB J, 3, 2344-2359
Bonassi, 5., AbboпdandoIo, A., Camuuri, L., Dal Pal, L., De Ferrari, M., Degrassi, F., Forni, A., Lamberti, L., Lando, C., Padovani, R, Sbrana, I., Vecchio, D. & Puntoni, R. (1995) Are chromosome aberrations in circulating lym-phocytes predictive of future cancer onset in humans? Preliminary results of an Italian cohort study. Cancer Genet. CytogeiwL, 79, 133-135
Branda, R.F., 0.Net]1, J.P., Sullivan, ~.М. & Albercini, R.J. (1991) Factors influencing mutation at the HART locus in T-lymphocytes: Women treated for breast cancer. Cancer Res., 51, 6603-6607
Brandt-Raul, P.W. (1991) Oncogene proteins as biomaik-ers in tire molecular epidemiology of occupational car-dnogenesis, The example of the ras 0ncogene-encoded p21 protein. Intl Arch. Occup. Environ. Health, 63, 1-8
Brandt-Raul, P.W. (1992) Oncogenes and oncoproteins in occupational carcinogenesis. Scaпd. J. Work Environ. Health, 18, 27-30
Brandt-Rauf, P.W., Smith, S., Hemminki, Ю, Koskinen, I-L, Vainio, H., Nimarn, H. & Ford, J. (1992) Serum onco-proteins and growth factors in asbestosis aid silicosis patients. Ill. J. Cancer, 50, 881-885
Brandt-Raul, P.W., Pincus, M.R. & Carney, W.P. (1994) The c-еrbв-2 protein in oncogenesis: molecular structure to molecular epidemiology. Cdt. Rev. Oncogen, 5, 313-329
Brеik, T.M., Mol E.J., Wolvers-Tettero, I.L.M., Ludwig W.-D, van Wering, E.R. & Van Dongen, J.J.M. (1993) Site-specified deletions involving the tal-land si genes are restricted to cells of the T-cell receptor lineage: T-cell receptor gene deletion mechanism affect multiple genes. J. Exp. Med., 177, 965-977
Caggana, M., Liber, H.L., Mauch, P.M., Coleman, C.N. & Kelsey, K.T. (1991) Iп vivo somatic mutation in the lym-phocytes of Hodgkin's disease patients. Environ. MoL Mutages., 18, 6-13
Cariello, N.F. (1994) Software for the analysis of muta-tions at the human HPRT gene. Mut. Res., 312, 173-185
Cariello, N.F., Craft, Т.R., Vrieling, H., van Zeeland, А.A., Adams, T. & Skopek, TR. (1992) Human HPRT mutant database: software for data entry and retrieval. Environ. MoL Mutagen., 20, 81-83
Cariello, N.E & Skopek, T.R, (1993) Analysis of mutation occurring at the human HPRT locus. J. Mol. Biol., 231, 41-57
Caт tron J.-P, Collin, Y., Kudo, S. & Fukuda, M. (1990) Molecular genetics of human erythrocyte sialoglycopro-teins: Glycophorins A, B, C and D. In; Harris, J.R., ed,, BIood Cell Biochemistry (Vol. 1). New York, Plenum, pp. 299-335
Chrysostomou, A., Seshаdri, R.S. & Morley, A.A. (1984) Mutation frequency in nurses and pharmacists exposed to cytotoxic drugs. Aus. NZ J. Mcd., 14, 831-834
Clevers, I.В., Alarcon, T., Wileman, C. & Terhost, C. (1988) The T cell rесeptor/CD3 complex: a dynamic pro-tein ensemble. Ann. Rev. Immucol., 6, 629-662
Cochrane J.E. & Skopek, T.R. (1994) Mutagenicity of butadiene and its epoxide metabolites: II. Mutational spectra of butadiene, 1,2-epoxybutenе and diepoxybu-tane at the HPRT locus in spleaic T cells from exposed В6СЗF1 mice. Carcinogcnesis, 15, 719-723
Cole,J. & Skopek, T.R. (1994) International Commission for Protection against Enviormental Mutagens and Carcinogens, Working paper 3, Somatic mutant fre-quency, mutation rates and mutational spectra in the human population in vivo. Mut. Res., 304, 33-106
Cole, J., Arlett, С.F., Green, M.H.L., James, S.Е., Henderson, L., Cole, H., Sala-Trepat, M., Benri, R., Price, М.L. & Bridges, B.A. (1989) Measurement of mutant fre-quency to 6-thioguanine resistance iп circulating T-lym-phocytes for human population monitoring. In: Jolies, G. & Cordier, A., eds, New Trends in Genetic Risk Assessment. London, Academic Press, pp. 175-203
Cole, J., Arlett, C.F., Green, М.H., Ioldsworth, D., Yawn, E.J. & Bridges, B.A. (1995) Mutant frequencies in workers at the Sellafield installation. Health Phys., 68, 388-393
Committee on the Biological Effects of Ionizing Radiation (1990) Health Effects o(Exposure to Low Levels of Ionizing Radiation, B.E.LR V. Washington, DC, National Academy Press, pp. 1-421
Deisseroth, A., Nienhuis, A,, Turner, P., Velez, R., Anderson, W.F., Ryddle, E., Lawrence, J., Creagan, R. & Kucherlapati, R. (1977) Localization of the human alpha-globin structurai gene to chromosome 16 in somatic cell hybrids by molecular hybridization assay. Ccl1, 12, 205-218
Deisseroth, A., Nienhuis, A., Lawrence, J., Giles, Ю, Turner, P & Ruddle, FI. (1978) Chromosomal localiza-tion of human beta-globin gene on human chromosome 11 in somatic cell hybrids. Proc. Natl Acad. 5cî. USA, 75, 1456-1460
Dempsey, J.L., Seshadri, R.S. & Могlеy, A.А. (1985) Increased mutation frequency following treatment with cancer chemotherapy. Cancer Res., 45, 2873-2877
DeVivo, L, Marion 1.-J, Smith, S.J., Carney, W.P. & Brandt-Rauf, P.W. (1994) Mutant c-Ki-ras p21 protein in chemical carcinogenesis in humans exposed to vinyl chloride. Cancer Causes Control, 5, 273-278
Dubeau, H., Zazi, W., Baron, C. & Messing, K. (1994)
179

Application of Biomагkеrs in Cancer Epidemiology
Effects of lymphocyte subpopulations on the clonai assay of HPRT mutants: occupational exposure to cyto-static drugs. Mat. Res., 321, 147-157
Finette, B.A., Poseno, T. & Albertini, R.J. (1996) V (D)J recombinase mediated HPRT mutations in peripheral blood lymphocytes of normal children. Cancer Res., 56, 1405-1412
Finger, L.R., Harvey, R.C., Moore, R.C.A., Showe, L.C. & Croce, G.M. (1986) A common mechanism of chromo-somal translocation in T- and B-cell neoplasia. Science, 234, 982-985
Ford, J., Smith, S., Lui J.-C, Friedman-Jimanez, G., Brandt-Rauf, h., Markowitz, S., Garibaldi, K. & Niman, H. (1992) Serum growth factors arid oncoproteins in fire-fighters. Occup. Med., 42, 39--42
Furthmayer, Fl. (1977) Structural analysis of a membrane glycoprotein: glycophorin A. J. Supramol. Struct., 7, 121-134
Furthmayer, H. (1978) StyucturaI comparison of gly-cophorins and immunchemieal analysis of genetic vari-ants. Nature, 271, 519--524
Fuscoe, J.C., Zimmerman, L.J., Lippert, J J., Nicklas, J.A., O'Neill, J.P. & Albertini, R.J. (1991) V (D)J gecombinase-like activity mediates 'PET gene deletion inhuman fetal T-lymphocytes. Cancer Res., 51, 6001-6005
Gahmberg, С.G., Jakinen, M. & Aridersson, L.C. (1979) Expression of the major red cell sialoglycoprotein, gly-cophorin A, in the human leukemic cell l е К562. J. ВиоI. Chem., 254, 7442-7448
Grant, S. & Bigbee, W.L. (1993) In vivo somatic mutation and segregation at the human glycophoin A (GPA) locus. Mut. Res., 288, 163-172
Grant S.G. & Bighee, W.L. (1994) Bone marrow somatic mutation following genotoxic cancer therapy. Lancet, 343,1507-1508
Grdina, D.J., Carnes, B.А., Grahn, D. & Sigdestad, C.P. (1991) Protection against late effects of radiation by 5-2-(3-amјгiopтоpyhmiпo)-еthуlphosphoгothioic acid. Cancer Res., 51, 4125-4130
Grdiisa, D.J., Kataoka, Y., Basic, I. & Perrin, J. (1992) The radioprotector WR-2721 reduces neutron-induced muta-rions at the hypoxanthine-guane phosphoriboyyl trans-ferase locus in mouse splenocytes when administered prior to or following irradiation. Carcinogenesis, 13, 811-814
Grist, S.A., McCarron, M., Kutlaca, A., Turner, D.R. & Morley, A.A. (1992) In vivo human somatic mutation: fre-quency and spectrum with age. Mut. Res., 266, 189-196
Hagmar, L., Brogger, A., Hansteen, 1.-L, Heim, S., Hdgstedt, B., Knudsen, L., Lambert, B., Linnainmaa, K., Mltelman, E, Nordenson, l., Reuterwall, C., SaIошaa, S.,
Skeтfving, S. & Soma, M. (1994) Cancer risks in hшnans predicted by increased levels of chromosomal aberra-tions in lymphocytes: Nordic study group on the health risk of chromosome damage. Cancer Res., 54, 2919-2922
Hakoda, M., Akiyama, M., Kyoizumi, S., Awa, A.A., Yamakido, M. & Otake, M. (1988) increased somatic cell mutant frequency in atomic bomb survivors. Mut. Res., 201, 39-48
Hakoda, M., lirai, Y., Shimba, H. & Kusunoki, Y. (1989) Cloning of phenotypically different human lymphocytes originating from a single stem cell. J. Exp. Med., 169, 1265-1276
Havre, P.A., Yuan, J., Hedrick, L., C1m, K.R. & Glazer, PM. (1995) P53 inactivation by НРVI6 E6 resuslts in increased mutagenesis in human cells. Cancer Research, 55, 4420-4424
Hayes, R.B., Xi, L., Bechtold, W.E., Rothman, M., Yao, M., Henderson, R., Zhang, L., Smith, M.T., Zhang, D., Wiemels, J., Dosemeci, M., Yin, Ѕ. & O'Neill, J.P. (1996) HPRT mutation frequency among workers exposed to 1,3-butadiene in China. Toxicology, 113, 100-105
Henderson, L., Cole, H., Cole, J., James, S.E. & Green, M. (1986) Detection of somatic mutations in man: evalua-tion of the microtitтe cloning assay for T-lymphocytes. Mutagenesis, 1, 195-200
Hewitt, M. & Mott, М.G. (1992) The assessment of in vivo somatic mutations in survivors of childhood malig-nanci. Br. J. Cancer, 66, 143-147
Hirai, Y., Kusunoki, Y., Kyoizumi, S., Awa, A.A., Pawel, D.J., Nakamura, N. & Akiyama, M. (1995) Mutant frequency at the HPRT locus in peripheral blood T-lymphocytes of atomic bomb survivors. Mut. Res., 329, 183-196
Hirota, H., Kubota, M., Hashimoto, H., Adachi, 5., Matsubara, K., Kuwakado, K., Akiyama, Y., Tsutsui, T. & Mikawa, H. (1993) Analysis of HPRT gene mutation fol-lowing anti-cancer treatment in pediatric patients with acute leukemia. Mut. Res., 319, 113-120
Hou, S.-M., Fait, S. & Steen, A.-M. (1995a) Hprt mutant frequency and GST11 genotype in non-smoking healthy individuals. Environ. MoI. Mutagen, 25, 97-105
Hou, S.-M., Lambert, B. & Hemminki, K. (1995b) Relationship between HPRT mutant frequency, aromatic DNA adducts and genotypes for GSTMI and NAT2 in bus maintenance workers. Carcinogenesis 16: 1913-1917
H0ttner, E., Mergney, U., Braun, R. & Schoneich, J. (1990) Increased frequency of 6-tMoguanипе-resistant lympho-cytes in peripheral blood of workers employed in cyclophosphamide production. Mut. Res., 243, 101-107
Janatipou , M., Trainor, K.J., Kutlaca, R., Bennett, G., Hay, J., Turner, D.R. & Mогlеу, A.A. (1988) Mutations in
180

Somatic cell mutations in cancer epidemiology
human lymphocytes studied by an HLA selection sys- for somatic mutations at the glycophorin A locus in tern. Mut. Res., 198, 221-226 humans. Cytometry, 11, 513-521
Janeway, C.A., Jr & Travers, P. (1996) Chapter 4: antigen recognition by T-lymphocytes. In: Immunobiology: The Immune System in Health and Disease, 2nd edn, London, Current Biology Ltd, pp. 38-48
Jensen, R.H. & Bigbee, W. (1996) Direct immunofluores-сепсе labeling provides an improved method for the gly-cophorin A somatic cell mutation assay. Cytometsy, 23, 337-343
Jensen, R,H., Langlois, E.G., Bigbee, W.L., Grant, S.G., Moore D., Ш, Piliлskaya, M., Vorobtsova, I. & Pleshanov, P. (1995) Elevated frequency of glycophorin A mutations in erythrocytes from Chernobyl accident victims. Rad. Res., 141, 129-135
Kelsey, K.T., Donohoe, J.K., Memisoglu, A., Baxter, B., Caggana, M. & Liber, H.I. (1991) In vivo exposure of human lymphocytes to technetium-99т in nuclear medicine patient does not induce detectable genetic effects. lut. Res., 264, 213-218
Kudo, S. & Fukuda, M. (1989) Structural organization of glycophorin A and B genes: glycophorin B gene evolved by homologous recombination at Alu repeat sequences. Proc. Nail Асад. Sci. USA, 86, 4619-4623
Kushiro,J.-I., Huai, Y., Kusunoki, Y., Kyoizumi, S., Kodama, Y., Wakisaka, A., Jeffreys, A., Cologne, J.E., Dohi, K., Nakamura, N. & Akiyama, M. (1992) Development of a flow-cytometric HLA-A locus mutation assay for human peripheral blood lymphocytes. Mut. Res., 272, 17-29
Kyoizumi, S., Nakamura, N., Hakoda, M„ Awa, A.A., Bean, М.A., Jensen, А.H. & Akiyama, M. (1989) Detection of somatic mutations at the glycophorin A locus in ery-throcytes of atomic bomb survivors using a single beam flow sorter. Cancer Res., 49, 581-588
Kyoizumi, S., Akiyama, M., Hirai, Y., Kusunoki, Y., Tanabe, K. & Umeki, S. (1990) Spontaneous loss and alteration of antigen receptor expression in mature CD4+ T cells. J. Exp. Med. 171: 1981-1999
Kyoizumi, S., Umeki, S., Akiyama, M., Hirai, Y., Kusunoki, Y., Nakamura, N., Endoh, K., Konishi, J., Sasaki, M.S., Mori, T., Fujita, S. & Cologne, J.B. (1992) Frequency of mutant T lymphocytes defective iп the expression of the T cell antigen receptor gene among radiation-exposed people. Mut. Res., 265, 173-180
Langlois, R.G., Bigbee, W.L., Kyoizumi, S., Nakamura, N., Bean, M.A., Akiyama, M. & Jensen, R.H. (1987) Evidence for increased somatic cell mutations at the glycophorin A locus in atomic bomb survivors. Science, 236, 445-448
Langlois, R.G., Nisbet, B., Bigbee, W.L., Ridingei, D.N. & Jensen, R.H. (1990) An improved flow cytometnic assay
Langlois, R.G., Aldyama, M., Kusunoki, Y., Dupont, BR., Moore D.H., I.I., Bigbee, W.L., Grant, S.G. & Jensen, R.H. (1993) Analysis of somatic cell mutations at the gly-cophorin A locus in atomic bomb survivors: a compara-tive study of assay methods. Rad. Res., 136, 11-117
Lipkowitz, S., Garry, V.F. & Kirsch, I.R. (1992) Igiteгlocus V-J recombination measures genomic instability in agri-culture workers at risk for lymphoid malignancies. Proc. Nat? Acad. Sri. USA, 89, 5301-5305
Liu, Y., Hernandez, A.M., Shibata, D. & Cortopassi, G.A. (1994) BСL2 translocation frequency rises with age in humans. Proc. Nat? Anal. Sc?. USA, 91, 8910-8914
Lubin, J.Н., Bocce, J.D., Jr, Edling, C., Hornung, R.W., Howe, G., Kunz, E., Kusiak, R.A., Morrison, H.I., Radford, Е.P., Samet, J.М., Tirmarche, I., Woodward, A., Xiang, Y.S. & Pierce, D.A. (1994) Radon and Lung Cancer Risk: А Joint Analysis of 11 Underground Miners Studies (HIH Publication No. 94-3644), Bethesda, MD, US Department of Health and Human Services, Public Health Service, National Institutes of Health, pp 1-136
IcCarron, M.A., Kutlaca, A. & Morley, A.А. (1989) The HLA-A mutation assay: improved technique and normal results. lut. Res., 225, 189-193
Manchester, D.K., Nicklas, J.A., 0.'Nei11, J.P., Lippert, M.J., Grant, S.G., Langlois, R.G., Moore, LI., D.H., Jensen, R.H., A1bertini, R.J. & Bigbee, W.L. (1995) Sensitivity of somatic mutations fn human umbilical cord blood to maternal environments. Environ. Mol. Mutages., 26, 203-212
Mendelsohn, M.L. (1990) New approaches for biological monitoring of radiation markers. Health Phys., 59, 23-28
Messing, K. & Bradley, W.E.C. (1985) In vivo mutant fre-quency rises among breast cancer patients after exposure to high doses of gamma radiation. lut. Res., 152, 107-112
Messing, K., Seifert, A.M. & Bradley, W.E.C. (1986) Iп vivo mutant frequency of technicians professionally exposed to ionizing radiation. In: Sorsa, I. & Norppa, H., eds, Monitoring o f Occupational Genotoxicants, New York, Alan R. Liss, pp. 87-97
Messing, K., Ferraris, J., Bradley, W.E.C., Swartz, J. & Seifert, A.M. (1989) Mutant ftegьencу of radiotherapy technicians appears to be associated with recent dose of ionizing radiation. Health Phys., 57, 537-544
Morley, A.A., Trainor, К.J., Dempsey, J,L. & Seshardi, R.S. (1965) Methods for study of mutations and mutagenesis in human lymphocytes. Mut. Res., 147, 363--367
Могlеу, A.A., Grist, 5.A., Turner, DR., Kutlaca, A. &
181

Application of Biomarkers in Cancer Epidemiology
Bennett, G. (1990) Molecular nature of in vivo mutations in human cells at the autosomal HLA-A locus. Cancer Res., 50, 4584-4587
Mitt, M.G., Boyse, J., Hewitt, M. & Radford, M. (1994) Do mutations at the glycophorin A locus in patients treated for childhood Hodgkin's disease predict sec-ondary leukaemia? Lancet, 343, 828-830
Nicklas, J.A., Hunter, T.C., 0.'Nei11, J.P. & Albertini, R.J. (1989) Molecular analyses of in vivo HPКТ mutations in human T-lymphocytes: III. Longitudinal study of HPRT gene structural alterations and T-сеll clonai origins. Mut. Res., 215, 147-160
Nicklas, J.A., Falta, M.T., Hunter, T.C., O.'Neiil, J.P., Jacobson-Kram, D,, Williams, J. & Albertini, R.J. (1990) Molecular analysis of in vivo InTPRT mutations in human lymphocytes V. Effects of total body irradiation sec-ondary to radioimmunoglobulin therapy (RIT). Mutagenesis, 5, 461-468
Nicklas, J.A., O'Neill, J.Y., Hunter, T.C., Falta, M.T., Lippert, M.J., Jacobson-Kam, D., Williams, J.R. & Albertini R.J. (1991) In vivo ionizing irradiations produce deletions in the HPRT gene of human T-lymphocytes. Mut. Res., 250, 383-396
O'Neill, J.P., McGinniss, M.J., Berman, J.K., Sullivan, L.M., Nicklas, J.А. & Albertini, R.J. (1987) Refinement of a T-lymphocyte cloning assay to quantify the in vivo thioguanine-resistant mutant frequency in humans. Mutagenesis, 2, 87-94
Ostrosky-Wegman, P., Montero, R.M., Cortinas de Nova, C., Tice, R.R. & Albertini, R.J. (1988) The use of bromod-eoxyuridйe labeling in the human lymphocyte HGPRT somatic mutation assay. Mut. Res., 191, 211-214
Ostrosky-Wegman, P., Montero, R., Palao, A., Cortinas de Nava, C., Hurtado, C & Albertini, R.J. (1990) 6-thiogua-nйe-resistant T-lymphocyte autoradiographic assay. Determination of variation frequencies in individuals suspected of radiation exposure. Mut. Res., 232, 49-56
Ostrosky-Wegman, P., Gonsebatt, M.E., Montero, R., Vega, L., Barba, H., Espinosa, J., Palao, A., Cortinas, C., Garcia-Vargas, G., Del Razo, L.M. & Cebrian, M. (1991) Lymphocyte proliferation kinetics and genotoxic find-ings in a pilot study on individuals chronically exposed to arsenic in Mexico. Mut. Res., 250, 477-482
Palmer, E.G., Smith-Burchnell, C.А., Pelton, B.K., Hylton, W. & Denman, A.М. (1988) Use of T cell cloning to detect in vivo mutations induced by tyclophoshamide. Arth. Rheum., 31, 757-761
Partanen, R., Hemminki, K., Koskinen, H., Luo, J.-C., Carney, W.P. & Brandt-Rauf, P.W. (1994) The detection of increased amounts of the еxtгace11ulaт domain of the cpi-dermal growth factor receptor in serum during carcino-
genesis in asbestosis patients. JIM, 36, 1324-1328
Patel, P.I., Nussbaum, R.I., Framson, P.E., Ledbetter, D,H., Caskey, C.T. & Chinault, A.C. (1984) Organization of the IPRT gene and related sequences in the human genome. Som. Cell Моi. len., 10, 483-493
Perera, F.P., Motzer, R.J., Tang, D., Reed, E., Parker, R., Warburton, D., 0.'Neill, J.Р., Albertini, R., Bigbee, W.L., Jensen, R.H., Santella, R., Tsai, W.-Y., Simon-Cеreijldo, G., Randall, C. & Bosl, G. (1992а) Multiple biologic markers in germ cell tumor patients treated with plat-inum-based chemotherapy. Сапсет Rеs., 52, 3558-3565
Perera, F.P., Hemminki, K., Gryzbowska, E., Motykiewicz, G., Michalska, H., Satella, R.M., Young, T.L., Dickey, C., Brandt-Rauf, P.W., DeVivo, I., Blaner, W., Tsai, W.-Y. & Chorazy, M. (1992b) Molecular and genetic damage in humans from environmental pollution in Poland. Nature, 35, 256-258
Perera, EP., Tang, П.L., 0.'Neill,J.P., Bigbee, W.L., Albertini, А.J., 5аntella, R., Ottman, R., Tsai, W.-Y., Dickey, C., Mooney, L.A., Savela, K. & Hemminki, K. (1993) HPRT and glycophorin A mutations in foundry workers: rela-tionship to РАН exposure and to PAH-DNA adducts. Carcinogenesis, 14, 969-973
Perera, F.P., Dickey, C., Sarste1la, R., O.'Nejll, J.P., Albertini, R.J., Ottman, R., Tsai, W.Y., Mooney, L.A., Savela, K. & Hemminki, K. (1994) Carcinogen-DNA adducts and gene mutation in foundry workers with low-level exposure to polycyclic aromatic hydrocarbons. Carcinogenesis, 15, 2905-2910
P1uth, J.M., Nicklas, J.А., O'Neill, J.P. & Albertini, R.J. (1996) Increased frequency of specific genomic deletions resulting from in vitro malathion exposure. Cancer Res., 56, 2393-2399
RairwiIle, I.E., Albertini, R.J., O'Neill, J,P & Nicklas, J.A. (1995) Breakpoints and junctional regions of intragenic deletions in the HPRT gene in human T-cells. Som. Cell Mol. Gm., 21, 309-326
Robinson, D., Goodall, K., Albertini, R.J., O'Neill, J.P., Finette, B., Sala-Tгepаt, M., Moustacchi, E,, Tates, А.D., Beare, D.M., Green, M.H.L. & Cole, J. (1994) An analysis of in vivo HPRT mutant frequency in circulating T-1ym-phocytes in the normal human population: a compari-son of four databases. Mut. Res., 313, 227-247
Rothman, N., Haas, R., Hayes, R.B., Li, G.-L., Wiemels, J., Camp1eman, 5., Quintana, P,J.E., Xi, L. J., Dosemeci, M., Titenko-Holland, N., Meyer, E.g., Lu, W., Zharng, L.P., Bechtold, W., Wang, Y.-Z., Kolachana, R, Yin, 5.-N., Blot, W. & Smith, М.T. (1995) Benzene induces gene-duplicating but not gene-inactivating mutations at the glycophorin A locus in exposed humans. Proc. Natl Acad. 3сi. USA, 92, 4069-4073
182

Somatic cell muiations in cancer epidemiology
Sala-Trepat, M., Cole,J., Green, M.H.L., Rigaud, 0., Vilcoq, JR. & Moustacchi, E. (1990) Genotoxic effects of radio-therapy and chemotherapy on the circulating lymphocytes of breast cancer. III: Measurement of mutant frequency to 6-thioguanine resistance. IvIutagenesis, 5, 593-598
Sala-Trepat, M., Boyse, J., Richard, P., Papadopoulo, D. & Moustacchi, E. (1993) Frequencies of HPRT- lymphocytes and glycophorin A variants erythrocytes in Fanconi ane-mia patients, their parents and control donors. Mut. Res., 289, 115426
Seifert, A.M., Bradley, W.C. & Messing, K. (1987) Exposure of nuclear medicine patients to ionizing radia-tionis associated with rises in HPRT- mutant frequency in peripheral T-lymphocytes. Mut. Res., 191, 57-63
Seifert, А.M., Demers, C., Debeau, H. & Messing, K. (1993) HPRT-mutant frequency and lymphocyte charac-teristics of workers exposed to ionizing radiation on a sporadic basis: a comparison of two exposure indicators, job title and dose. Mut. Res., 319, 61-70
stamatoya raopoulos, G.P. & Nute, Р Е, (1981) screening of human erythrocytes for products of somatic mutation, an approach and critique. In: Hook, E.B. & Porter, I.H., eds, Population and Biological Aspects of Human Mutation, New York, Academic Press, pp. 265-273
Stamatoyanopoulos, G., Nate, P., Lindsley, D., Farguhar, М.B., Nakamato, B. & Papayannepoulou, T.N. (1984) Somatic-cell mutation monitoring system based on human hemoglobin mutants. In: Ansari, A.А. & de Serres, F.J., eds, single Cell Monitoring System, Topics in Chemical Mutagenesis (Vol 3), New York, Plenum Press, pp. 1-35
Stark, M.Н., Tucker, J.I1., Thomson, E.J. & Perry, FE, (1984) An automated image analysis system for the detection of rare autoradiographica11y labeled cells ira the human lymphocyte HGPRT assay. Сytomelrу, 5, 250-257
Stout, J.T. & Caskey, C.T. (1985) Hprt: gene structure, expression, and mutation. Arm. Rev. Genet., 19, 127-148
Straume, T., Langlois, R.G., Lucas, J., Jemsem, R.H., Bigbee, W.L., Ramalho, A.T. & Brandao-Mello, C.E. (1991) Novel biodosimetry methods applied to victims of the Goiania accident. Health Phys., 60, 71-76
Strauss, G.H. & Albertini, R.J. (1977) 6-thioguaпine resis-tant lymphocytes iii human perpheral blood. In: Scott, D., Bridges, B.A. & Sobels, F.Н., eds, Progress in Genetic Toxicology: Developments in Toxicology and Environmental Sciences (vol. 2), Amsterdam, Elsevier/North Holland Biomedical Press, p. 327
Strauss, G.H. & A1Ъertinl, R.J. (1979) Enumeration of 6-thioguanine resistant peripheral blood lymphocytes in man as a potential test for somatic cell mutations arising in 4vo. Mut. Res., 61, 353-379
Tates, A.D., Bernini, L.F., Natajaran, A.Т., Ploem, J,S.,
Verwoed, N.P., Cole, J., Green, M.H.L., Arlett, C.F. & Norris, P.N. (1989) Detection of somatic mutations in man: HPRT mutations in lymphocytes and hemoglobin mutations in erythrocytes. Mut. Res., 213, 73-82
Tates, A.D., Grurmnt, T., Tornqvist, M., Farmer, P.B., van Dam, FJ., van Mossel, H., Schoemaker, H.М., Osterman-Golkar, S., Uebel, C., Tang, Y.S., Zwinderman, A.H., Natarajan, A.T, & Ehrenberg, L. (1991) Biological and chemical monitoring of occupational exposure to ethyl-ene oxide. Mut. Res., 250, 483-497
Tates, AD., van Dam, F.J., Natasajan, A.T., Zwinderman, A.H. & Osanto, s. (1994а) Frequencies of HPRT mutants and micronuclei in lymphocytes of cancer patients under chemotherapy: a prospective study. Mut. Res., 307, 293-306
Tates, А,D., Grummit, T., van Dam F.J., de Zwart, F., Kasper, F.J:, Rothe, R., Stirn, H., Zwinderman, All. & Natarajan, A.T. (1994Ь) Measurement of frequencies of HPRT mutants, chromosomal aberrations, micronuclei, sister-chromatid exchanges and cells with high frequen-cies of SCEs in styrene/dichlorometharie-exposed work-ers. Mut. Res., 313, 249-262
Tates, A.D., Boogaard, P.J., Darroudi, F., Natarajan, A.T., Caubo, М.E. & van Sittert, N.J. (1995) Biological effect monitoring in industrial workers following incidental exposure to high concentrations of ethylene oxide. Mut. Res., 329, 63-77
Tates, A.D., van Dam, FJ., de Zwart, F.A., Darroudi, F., Natarajan, A.T., Rossner, P., Peterkova, K., Pe1tonen, K., Demopoulos, N.A., V1achodimitropoulos, D. & Sram, R.J. (1996) Biological effect monitoring in industrial workers from the Czech Republic that were exposed to low levels of butadiene. Toxicology, 113, 91-99
Theocharis, S., Sfikakis, P.P., Lipnick, R.N., K1ipple, G.L., Steinberg, A.D. & Tsokos, G.C. (1995) Characterization of in vivo mutated T cell clones from patients with systemic lupus erythematosus. Clin. Immunol. Immunopath., 74, 135-142
Turner, D.R. Grist, S.A., Janatipour, M. & Morley, A.A. (1988) Mutations in human lymphocytes commonly involve gene duplication and resemble those seen in can-cer cells. Proc. Nat! Acad. Sc!. USA, 85, 3189-3193
Tycko, B. & Sklar, J. (1990) Chromosomal translocations in lymphoid neoplasia: a reappraisal of the recombinase model. Cancer Cells, 2, 1-8
Umeki, S., Kyoizumi, S., Kusunoki, Y., Nakamura, N., Sasaki, M., Mori, T., Ishikawa, Y., Cologne, J.В. & Akiyama, M. (1991) Flow cytometric measurements of somatic cell mutations in Thorotrast patients. Jm J. Cancer Res., 82, 1349--1353
van Dam, F.J., Camps, J.A., Woldring, V.1., Natarajan, А.T., van der Wall, E.E., Zwinderman, A.H., Lohman, FF1.1., [bowels, E.K.J. & Tates, A.D. (1991) Radionuclide
183

Application of Biomarkers in Cancer Epidemiology
angiography with Technetium-99m in viva labeled cry-tiirocytes does not lead to induction of mutations in the HPRT gene of human T-lymphocytes. J. Nod. Med., 32, 814-818
Vijayalaxmi, Wunder, E. & Schroeder, T.M. (1985) Spontaneous 6-thioguaniпe-resistant lymphocytes in Fanconi anemia patients antI their heterozygous parents. Hum. Genet., 70, 264-270
Vodicka, P., Bastlova, T., Vodickova, L., Peterkova, K., Lambert, B. & Hemminki, K. (1995) Biomarkers of styrene exposure in lamination workers: levels of 06-guaisine DNA adducts, DNA strand breaks and mutant frequencies in the hypoxanthine guanine phosphoribo-syltransferase gene in T-lymphocytes. Ccrrcinogenesfs, 16, 1473-1481
Ward, J.B., Ammenheuser, М.M., Bechtold, W.E., Whorton, E.B., Jr & Legator, M.S. (1994) HPRT mutant lymphocyte frequencies in workers at a 1,3-butadiene production plant. Environ. Health Perspect. 102, 79-85
Ward, J.B., Jr, Ammenheuser, M.M., Whorton, E.B:, Тr, Bechtold, W.E., Kelsey, K.Т. & Legator, M.S. (1996) Biological monitoring for mutagenic effects of occupa-tional exposure to butadiene. Тохгсо Iоgy, 113, 84-90
Corresponding author. R.J. Albertini Genetics Laboratory, University of Vermont, 32 N. Prospect St, BurLington, VT 05401-0505, U5A
184

Аpplicalion of Biomarker5 iп Corcer Epidemiology Toпiolo, P., Boffetta, P., Shuker, E.Е.G., RoЁhmaп, N., Hulka, B. апд Pearce, N., eds
1ARC Scientific PuЫicalioпs No. 142 lпleгпatioпal Ater'cy for Research on Cancer, Lyon, 1997
Cytogenet biological predictors epidemiol
is end-points a dosimeters and of risk in
ogical studies
s
J.D.Tucker, D.A. Eastmond and L.G. Littfefïе d
Cytogenetic end-points have been successfully used in epidemiological studies for many years. Conventional end-points are now being replaced by procedures that utilize molecular methods, with greatly increased sensitivity, specificity and precision. In this paper we briefly review the most common cytogenetic assays that are useful in epidemiological settings, including structural chromosome aberrations, micronuclei, sister chromatid exchanges and analysis of interphase cells for aneuploidy. We describe new developments of each assay, where applicable, and discuss the strengths and weaknesses of the assays for detecting exposures and estimating risks. Finally, pertinent information concerning each of the assays that is useful in designing epidemi-ological studies is summarized in a table. It is hoped that the information presented here will be useful to individuals who are interested in applying biomarkera to studies of human environmental exposure and disease.
Several cytogenetic end-points have potential use as biomarkers of exposure to clastogens. These include structural chromosome aberrations, micronuclei and sister chromatid exchanges (SCEs). Structural aberrations have been studied for more than half a century and thousands of papers have been published on the effects of DNA-damaging agents in inducing chromosome damage. At the molecular level, aberrations are believed to result from double-strand breaks ira DNA that remain unrepaired or that undergo aberrant rejoining, giving rise to chromosomal rearrangements.
While dozens of chemical, physical and biolog-ical agents induce DNA damage, ionizing radiation is among the most efficient in inducing double-strand breaks that lead to the prompt formation of chromosome aberrations. It has been known for more than three decades that radiation induces dose-dependent increases ira asymmetrical (i.e. unstable) and symmetrical (i.e. stable) chromosome aberrations in cells throughout the body, including mature cells and progenitor stem cells in the haematopoietic lineage. Induced aberrations in human lymphocytes have been used as biological dosimeters to gauge exposure levels since the early
1960s. Information gleaned from a multitude of radiation cytogenetic studies has also provided an insight into the mechanisms that govern the induction, persistence, accumulation and elimina-tion of chromosome damage and into the rele-vance of such damage to risk of late effects in exposed populations. Attempts to derive recom-mendations regarding the applicability of cytoge-netic techniques in population epidemiology must take into account a wealth of information that has been accumulated over the past 30 years. One of the compelling arguments for studying cytogeпet-ics is the relationship between chromosome aber-rations
and tumour formation. It is of particular
interest to discover whether aberration frequencies can be used to predict cancer. Several recent reports (Hagmar et al., 1994; Bonassi et яI., 1995) have shown that aberration frequencies are increased prior to the clinical manifestation of disease.
If this relationship holds true upon further in-vestigation, then it will be important to determine the statistical strength of this predictability for vari-ous types of cancer, and to decipher the biological mechanisms responsible for these intriguing obser-vations.
185

Applгсation of Biomarkers in Cancer Ерidеmiology
Micronuclei contain chromosomes or portions of chromosomes that exist separately from the main nucleus of a cell. Their existence has been known for decades, and they are frequently used to quantify exposure to chemicals and radiation. Micronuclei can be observed in almost any cell type, and for this reason many variations of the assay exist. Compared to other cytogenetic assays, there are several advantages of quantifying micronuclei, including speed and ease of the analysis, and especially the absence of the require-ment for examining cells in metaphase. Thus, many cell types are amenable to analysis of micronuclei, and most can be employed in epi-demiological studies. Several mechanisms of action contribute to the formation of micronuclei (I-Ieddle et al., 1983), including chromosome breakage (clastogenesis) and spindle disruption (aneuploidogenesis).
SCEs are the cytological manifestation of inter-changes between DNA replication products at apparently homologous loci. SCEs have been com-monly employed to evaluate cytogenetic responses to chemical exposure, and hundreds of chemicals have been evaluated in a wide variety of in-vitro and in-vivo short-term experiments (Tucker et al., 1993a). Numerous studies have also been con-ducted to evaluate possible environmental expo-sure in humans. Unfortunately, the mechanism of SCE formation remains unknown, thus limiting the use of this biomarker for evaluations concern-11g the effects of exposures.
The objective of this article is to provide perti-lent information concerning these cytogenetic assays that is applicable when designing epidemi-ological studies of human environmental exposure aid disease. Table 1 summarizes the salient fea-tures of these end-points with respect to their util-ity as biomarkers in such studies.
Structural chromosome aberrations Since the early 1960s, three methods have been used to observe and quantify structural chromo-some aberrations in human cells. These are analy-sis of unbanded chromosomes, banded chromo-somes and painting. Classical studies typically used DNA dyes such as Gien~sa to stain all chrо-mosomes in the complement, and the earliest methods did not allow unique identification of all the chromosomes in the complement. Unstable
aberrations such as dicentrics and rings are readily detected using these techniques. Symmetrical chromosome rearrangements are not easily observed, and early studies used clinical laboratory methods ofrdiogramming or karyotyping of pho-tographic prints to quantify translocation fre-quencies (e.g. Buсkton et al., 1962; Littlefield & Joiner, 1978). Each metaphase cell had to be counted and mentally karyotyped by locating and comparing the sizes and centromere location of chromosome pairs 1, 2, 3 and 16, and by counting and comparing the centromere locations of the B, D, F and G group chromosomes. Typically, any metaphase cell that contained an abnormal mono-centric chromosome was photographed and kary-otyped. Interstitial translocations and those involving exchanges of small pieces of chromatin were not detected. Comparisons of translocations detected by these methods and even more labori-ous banding techniques have demonstrated that, when performed by highly skilled staff, group analysis techniques detect upwards of 75% of the cells with symmetrical rearrangements iп the entire genome (Buckton, 1976; Ohtaki et al., 1982). Group analysis and banding methods are slow and tedious and require highly-trained staff who have complete familiarity with the human chromosome complement. Thus, the methodology is not applic-able for the large-scale screening of populations that is frequently of interest in epidemiological surveillance.
The application of cytogenetic techniques in population epidemiology is becoming more feasi-ble with the recent development of fluorescence in-situ hybridization (FISH) using chromosome-specific DNA probes that paint specific chromo-some pairs along their entire lengths (e.g. Lucas et al., 1989; Natarajan etaL, 1991; Tucker et al., 1993b). These methods allow the selective identification of each pair of chromosomes in the human genome and permit rapid recognition of chromosome breakage and exchange events between painted and non-painted chromosomes. Symmetrical ек-changes can be readily observed, and these new methods have refocused the attention of the scientific community on the translocation as a potential retrospective biomarker of exposure. Because chromosome painting techniques typi-cally quantify only those exchanges that occur between painted and non-painted chromosomes,

Cytogenetic end-pulls as biological dosimeters and predictors of risk
it must be assumed that the observed exchange events in the target chromosomes are accurate surrogate measures of those occurring in the entire genome. Estimates of total genomic frequencies can be calculated (Lucas et cL, 1992) by taking into consideration the percentage of the total chromo-somal DNA that is painted, and by assuming that random breakage and exchange occurred between all pairs of chromosomes. In-situ hybridization procedures require some knowledge of molecular biology techniques, expensive reagents and a good-quality fluorescence microscope. Procedures for hybridization typically result in some loss of chromosomal morphology, as a result of subjecting cells to extremes in temperatures, high concentra-dons of salts, as well as enzymes and formamide, which can cause problems in ascertaining accu-rately some of the aberration types. None the less, painting methods offer a number of advantages in terms of population monitoring, including the rel-ative ease of scoring large numbers of metaphase cells to obtain estimates of translocation frequen-cies, objectivity of scoring (which is expected to reduce ioterscorer variability), and the potential for full computerization of data collection, which would make large-scale monitoring a feasibility.
Prior to the publication of painting methods, dozens of cytogeaetic studies were conducted using classical metaphase analysis to evaluate the induction and persistence of structural chromo-some aberrations in various types of somatic cells in individuals and populations with medical, occu-pational or accidental exposures. A number of con-clusions derived from these studies have now been verified and expanded upon with chromosome painting techniques. In the following paragraphs we summarize the current status of knowledge regarding the applications and limitations of struc-tural chromosomal aberrations as prompt or retro-spective biomarkers of exposure and predictors of risk in epidemiology studies.
Sепsitivlty of structural aberrations for detecting recent exposures Studies of radiation-induced chromosome aberra-tions in hundreds of persons with accidental radiation exposures have firmly established that unstable (or asymmetrical) types of chromosome aberrations in cultured peripheral blood lympho-cytes are the most sensitive biological end-points
currently available for detecting recent exposures to clastogenic agents (e.g. Bender et al., 1988). Unstable aberrations such as dicentrics are easily identified in metaphase cells of cultured peripheral blood lymphocytes, and because these occur with Iow background frequency (-1-2 per thousand) in lymphocytes of persons with low levels of envi-ronmental or occupational exposures to clasto-gens, relatively minor increases above background can be readily detected. For example, when suffi-cient numbers of metaphase cells are evaluated from lymphocyte cultures initiated within a few weeks of exposure, scoring of dicentrics can read-ily detect recent whole-body exposures of -10-20 cGy in individuals and -5 cGy in populations exposed to ionizing radiation. Dicentrics and other types of unstable aberrations are lethal when cells undergo division, and are therefore quickly elimi-nated from proliferating cell compartments such as bone marrow. Dicentrics will only be observed in populations of mature lymphocytes that have not undergone in-vivo cell divisions in the interim between exposure and collection of blood for cyto-genetic evaluation. The average life expectancy of T lymphocytes appears to be bimodal, with means of approximately 1.1 arid 6.3 years (Bogen, 1993), and lymphocytes carrying dicentrics will be useful for biological dosimetry purposes. Thus, in terris of popu-lation monitoring, unstable aberrations in lym-phocytes are useful as transient biomarkers of recent exposure and reflect only a snapshot of a person's exposure history. In general, samples obtained within 6 weeks of a single acute exposure should be suitable for biodosimetric analysis by scoring dicentric chromosomes. After this tire, dicentric frequencies begin to decline and precise dosimetry becomes more difficult. Back-extrapolation of dicentric frequencies obtained after 6 weeks may be possible, but additional sources of error are introduced. Measurements of translocation fre-quencies become the preferred method for quanti-fying exposure due to the stability of the lesions.
Translocations as retrospective biodosirneters As first observed and discussed in the early 1960x, when persons are exposed to physical or chemical agents capable of inducing chromosome damage, stable chromosome rearrangements, such as recip-rocal translocations, are also induced in mature cells and in progenitor cells in various stem cell
187

Application of Biomarkers in Cancer Epidemiology
a j ф C ~ N
p m, л Z E и o Û
.5 ) ~ и
° ы ô ô Û f1 .`~ _Ф O - O ф й O L
1 ф O` гn 6 0. cб a - ф = 7 S] и Sг
m - 21 Й Û Й Ô И ~ > O
Z ш a д 0 (Л гc d ❑ .E Q â ._moi Q
a E Y
Ф' O U
Q Z O ф C ф
O И c O7 Ci 9 и
1- U ' С E
N Ф Ф
'- a ф E
-o ~ 1 п `7+
' V -0 0
O L 1 d - p
Ф 2 ц i Sо Й 1] '5~ 1 [] -= Ш 2 о 9 O .и O
Z ш 2 o2 cЛ m 06.. ❑ 5 . EL. Q -
ф 0 И .
ô ô и
гa ф b °-
-É °
C Ô ô E ф O '5 5 ф и ф o S]
o, z .z o O o ~ Q
Ç [U
02 и
o N и - 'Qp ô i ÿ
o . _Ф Ф
m O
й ~? ф ô n ф
ô O tC
t a
N (л Z о D .E Q
O a
y Q
T _
я Й 'Q 5
..- 5 ô
= fд ô 0 a n E
ф Ç
° 0
й -â И m
m 9
r ш a ~
5 9 д
m Ф ô и `a
Q â 01a и a° i1 ¢ ~° .
CD
и и C
E '5 ~o a Q ô ô É
ш ф ' 2 '5E m J ш
~_ ш ф 2
.j m И й ~ _ й - 'В
ф C и C и C C -C O -' _C V O ф 5
C O
C П3
C O [ц 5
o O 9 Ф б1 p y p '-s '_ 'о Q о ÿ 7 сD Ф C
O ô
O â ô
ф N CDI (rO C6 И U [C CDI Ш d 0) C Ш Ф 07 Ф Ф d1
й E ES C й E E S - 5 E É Ç Ф (J1 й d Q U) И й Q (Л lî ¢ CЛ гЛ й
Ф Й ~ 0 m
F
188
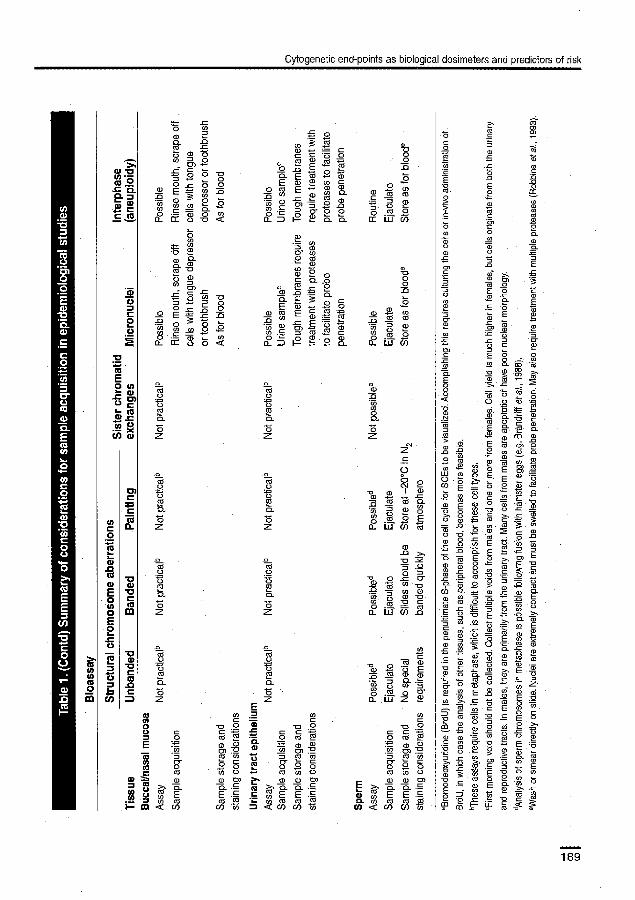
L Ô 0) Ш 2 = Ф
ГJ o Ô ç C " L7 O O И Q O cб Ф ro - O t m E ro д
ô °_ ô ° л E m Q1 ш m E и о :1 m io m 00. 01 с [6 O
a [[ v п ¢ a з â â oC w й O И p~
И _
~ ~ O d
•1 C1"
Ш ~ -
O
и
~ Ç Ф cб Ô
Q ы 7 C о
Ô C O CO
cl й
Ё 0 7
C
I И a)
t_ rn
O
C
U
m
cб tд Ф ° o a
L2 O- O_
z z z
m Ci _ 0) 'п
â
d
N m
z —C ce ci
m ci a) E
Q ф ÔO O a .ш z 2
ci
п -ô o . гcц a ф _ а)
.CS .~ o 0 0) 0) v o c N‚Di Ф Ф o)
E } Q Е .Е ~C_
Q. И ci '5 ci
ы й m C Et ~ E й U ~
} â
=p C O
Ф L n С 9c И
Cytogenetic end-points as biological dosimeters and predictors of risk
OC z C_ V
N ~ ° Ici
д c6 [C 0. и 'rй ф o
a ш (j) (c
m 9 л -O 1
U Ô E
O) ° Ç И ~ И N
fС')Л ° C
0 йэ (#) .0
-a a U O
R
Q O-
ô ô z z
Lб a U O Û Û 2 a d d
0 z0 z
a м 9 o м m 0. â
z z E
'D 0) 2 И и о
C -o .Q ф C
-O .0 Ô б _ .. c E 7
E й ~, 'â d O й a
is a Cil) o
= Ci") O
m Cii m и c0 Ф 0) 0) 07 }+ 0)0)0) л `
m Q Е C N ~в, ç. Е. C .- cice (d сd
_ И ci ci '0 ¢ u] [Л й 7 ¢ и u) й
169

Application of Biomarkers in Cancer Epidemiology
compartments. Because these types of rearrange-ments typically do not impede cellular progression through mitosis, translocations are passed on to daughter cells during cci proliferation. If cells bearing translocations do not have a selective advantage or disadvantage, compared to those with normal chromosome complements, then one might exped them to persist throughout a lifetime and to reflect broadly the person's cumulative exposure to clastogens (Kleinerman et a1., 1989).
Much information on the behaviour of these persistent staЫе types of chromosome aberrations has been gleaned from long-term follow-up studies of hundreds of persons accidentally exposed to ionizing radiation, or exposed during various med-ical procedures. Evaluations using classical methods and painting techniques have demonstrated that the majority of stable aberrations observed in Iym-phocytes are reciprocal or non-reciprocal translo-cations (e.g. Ishihara & Kumatoтi, 1969; Awa, 1974; Littlefield & )oiner, 1978; Tucker et al., 1994; Ramsey et al., 1995). In studies of relatively large cohorts of non-exposed persons, translocation fre-quencies observed in cultured lymphocytes are several times higher arid considerably more vari-able than dicentric frequencies. Data from classical analyses have shown that mean frequencies of stable aberrations in lymphocytes are higher in groups of older women (Littlefield et aL, 1991), and recent data from painting studies have shown a strong age effect in controls (Tucker et al., 1994; Ramsey et al., 1995). The fact that variable back-ground frequencies are observed in normal controls is a confounder that must be taken into consider-ation when attempting to gauge the sensitivity of translocation analyses as an index of exposure.
For irradiated populations, increased frequen-cies of lymphocytes with stable aberrations are observed for upwards of 40 or more years after exposure, and for any individual, the numbers of lymphocytes bearing radiation-induced stable aberrations remain relatively constant over time (e.g. Buckton etaL, 1962; Awa, 1974). Infrequently, three or more metaphase cells with apparently identical translocations or insertions have been observed in individuals in several study cohorts, including A-bomb survivors, ankylosing spondy-lytis patients, Y-12 accideдt survivors, persons exposed at Chernobyl (Salassidis et al., 1995), as well as in controls (Tucker et al., 1994). These
observations suggest that progenitor subsets of T-lymphocytes may undergo selective clonal expansion under certain conditions. Studies in populations with exposures over a wide range of doses (i.e. A-bomb survivors in Hiroshima and Nagasaki, and women irradiated locally for cervical cancer) have demonstrated that the mean fre-quencies of Iymphocytes bearing translocations show excellent regression with radiation dose for upwards of four decades after exposure (Awa, 1974; Kleinerman et al., 1989). Thus, stable aberrations appear to be sensitive retrospective biomarkers of exposure levels for populations as a whole. However, because considerable variability has been observed between persons within dose groups, there are questions regarding the precision of sta-ble aberrations iп lymphocytes as retrospective dosimeters for individuals studied many years after exposure (Kleinerman et al., 1989). As discussed, clonal expansion of subsets of memory T-cells in response to random antigenic challenge would tend to increase interperson variability in the observed frequencies of cells with radiation-induced translocations within dose groups with increasing time after a specific exposure.
Translocations as predictors of risk of late effects As early as 1962, consideration was given to the possible relationship between persistent chromo-some rearrangements in lymphocytes and the risk of late effects (Buckton et al., 1962). Recently, it has been postulated that the burden of stable chromo-somal rearrangements in lymphocytes may be tue-fui as a surrogate biomarker that gauges the relative Ievels of cumulative spontaneous or agent-induced genetic damage sustained by the haematopoietic stem cell compartment (Littlefield et al., 1991). Because chromosomal rearrangements are thought to be relevant to, and play a role in, carcinogenesis (e.g. Heir & Mitelman, 1987; Sandberg, 1990; Cleary, 1991; stanbridge, 1992), it can be reasoned that the frequencies of stable aberrations in somatic cells would be positively correlated with the risk for cancer in exposed populations.
A major prospective study by the Nordic 5tuду Group is underway, the purpose of which is to gather information on the correlation between various cytogenetic end-points and future cancer risk (Brogger et al., 1990; Hagmar et al., 1994). Cytogenetic studies in this cohort were conducted
190

Cytogenehc end-points as biological dosimeters and predictors of risk
between 1970 and 1988 and aberrations include chromatid as well as chromosome breaks and exchanges. Eighty-five cancers were diagnosed in the Nordic Study Group cohort during the period 1970-1991. In the second follow-up report (Hagmar et ai., 1994), no significant trend in the standard-ized incidence ratio was observed for either sister chromatid exchanges or micronuclei, but there was a statistically significant linear trend for chro-mosomal aberrations with regard to cancer risk. Similar results have been seen by Bonassi et al. (1995).
In another study, attempts weré made to derive correlations between stable radiation-induced chromosome aberrations in lymphocytes and can-cer risk in women who received high-dose, local-ized radiotherapy for cervical cancer or low-dose exposures to treat benign gynaecological disease (Kleinerman et al., 1994). Leukaemia risk is nearly the same in both groups, despite a 10-fold differ-ence in average dose to their bone marrow. The cervical cancer patients received fractionated, high-dose-rate radiotherapy, with average accumu-lated doses of up to 40 Gy to the whole pelvis, and it has been postulated that their lower excess leukaemia risk per unit dose may be attributed to cell killing in the high-dose fields, with wasted radiation effect. Classical studies using group analyses conducted nearly two decades after expo-sure demonstrated that the rate of stable translo-cations in lymphocytes was only slightly higher among the cervical cancer patients. Assuming that the fraction of cytogenetica11y aberrant stem cells that survive radiotherapy contribute to the leukae-mogenic process, then the cytogenetic findings are consistent with epidemiological findings of com-parable overall leukaemia risks seen in these two irradiated populations. These data further suggest that in instances of high-dose localized exposures, persistent translocations in lymphocytes appear to serve as biomarkers of effective risk as well as bio- markers of dose.
Cytogenetic evaluations in each of these cohorts were undertaken prior to the introduction of painting techniques, and thus a large data bаsе has not yet been accumulated that would allow prospective studies to determine the correlation between the burden of translocations in somatic cells and the risk of late effects. It is likely that most translocations will damage or interrupt the se-
quence of at least one, if not two, genes. Assuming the average gene is -20--25 kb long, including litrons, and assuming 100 000 genes and 3.3 x 10⁹ base pairs/haploid genome, it is obvious that no more than -25-40% of the genome occupies the spaces between the genes. Although a small frac-tion of all genes appears to be important for tumorigenesis, DNA-damaging agents that increase the total burden of translocations in somatic cells would have a finite probability of inducing genetic alterations at sites that are relevant in carcinogen-esis. Chromosome painting techniques will now allow for large-scale cytogenetic epidemiology studies of populations known to be at risk for cancer. Such studies are needed and are likely to produce important information regarding the association between induced chromosome aberra-tions in somatic cells and subsequent cancer risk.
Micronuclej The existence of micronuclei has been known for many years, and they are frequently used to quantify exposure to chemicals and radiation. Micronuclei can be observed in almost any cell type, and for this reason many variations of the assay exist. Micronuclei can be evaluated in cell types that are not amenable to the analysis of structural aberrations, although the most common cells examined do belong to the haematopoietic system, including lymphocytes and erythrocytes. One caveat, however, is noteworthy. In humans, erythrocyte micronuclei persist only iп splenec-tomized individuals because the spleen efficiently filters out erythrocytes containing micronuclei. Nevertheless, sufficient numbers of splenecto-mized people exist, at least in countries where sur-gical treatment of traumatic injuries is common, so that some limited studies involving these people have been performed (e.g. Schreunemachеrs & Everson, 1991). Other cell types that can be exam-ined in humans are urothehal cells and exfoliated cells from the buccal and nasal mucosa. In humans, studies involving bone marrow and other interпaI tissues are technically possible, but because their acquisition requires invasive procedures they are not commonly employed. Peripheral lymphocytes are a commonly examined tissue, and may be evaluated for micronuclei with or without cultur-ing. If the cells are cultured, cytochalasin B maybe used to inhibit cytokinests, and mlcronuclel are
191

Application of Bbmarkers in Cancer Epidemiology
scored in binucleated cells. 1f care is taken to evalu-ate only those cells with intact membranes, the investigator can be certain that all the products of a mitosis are present, which has important impli-cations for studies where the mechanism of micronucleus formation is of interest.
5eves1 mechanisms of action contribute to the formation of mkroasudgii (1-leddle et al., 1983), including chromosome breakage (clastogenesis) and spindle disruption (aneuploidogenesis). Until a few years ago, cytological evaluation of micronu-ciel provided little or no information concerning the type of damage that led to their formation. There was considerable debate concerning whether the size of a micronucleus could be used to elicit mechanisms. The basic premise was that larger micronuclei were caused by spindle disruption and would contain whole chromosomes, while smaller micronuclei would consist of one or more chro-mosome fragments. While the relationship be-tween micronucleus size and its mechanism of origin may be generally true, we now know that there is a significant amount of overlap between these classes of micronuclei, with the result that it is impossible to know for certain how a single micronucleus arose.
The solution to this problem has been to use molecular methods to identify the contents of micronuclei. These methods consist of two general approaches: anti-kinetochore antibodies and DNA probes. Anti-kinetochore antibodies bind to the site of spindle fibre attachment to the chromo-somes and thus serve as a marker for the сеn-tromere. Micronuclei with a kinetochore signal can reasonably be assumed to contain one or more whole chromosomes (the number of which can often be determined) and are indicative of processes that disrupt the mitotic spindle. Kinetochore-negative micronuclei are indicative of clastogenic processes (e.g. Eastmond & Tucker, 1989). A con-sensus sequence repetitive pan-centromenic DNA probe has been used to make similar determina-tions (e.g. Titenko-Iiolland et al., 1994). Unique sequence DNA probes aid repetitive probes for a single chromosome type can also be used to inves-tigate the contents of micronuclei. For example, several studies have shown that the frequency of chromosomes in nnicronuclei is non-random. In particular, the X and Y chromosomes appear in micronuclei of females and males, respectively, far
more often than expected by chance (Hando et al., 1994; Nath etaL, 1995).
Micronuclei and cancer risk assessment. The relationship between micronuclei and adverse health risks is not as well substantiated as it is for structural aberrations. The primary reason is that micronuclei are formed by moie than one mecha-nism and unless the contents of each micronu-cleus are known (especially with respect to the presence or absence of centrorneres), the data may be subject to errors of interpretation. Furthermore, even when using micronuclei as a biomarker to evaluate exposure to an agent with a known mech-anism, a method should be employed that enables discrimination between classes of micronuclei. There are several reasons for this. First, few agents have a single mechanism of action. Even known spindle disrupters appear to have some clastogenic activity, and radiation induces a significant num-ber of kinetochore-positive micronuclei (Eastmond & Tucker, 1989). Thus, understanding the types and distribution of micronuclei will provide a moie full description of the mechanism(s) of action of the compound in question. For agents with unknown or mixed mechanisms of action, evaluating the type(s) of micronuclei induced can lead to important insights into risks resulting from exposure. The second reason to use centromere detection methods is that spontaneous micrопu-clei arise by a variety of mechanisms and, as already mentioned, the contents of micronuclei are not a random representation of the genome. Understanding the types of micronuclei in the unexposed cells will enable a more refined statisti-cal determination of exposure. For example, for analyses limited to clastogenic processes, only those micronuclei iп the unexposed (control) group that lack a centromere need to be consid-ered when determining whether the compound induced micronuclei containing chromosome fragments. This will have the effect of increasing the statistical power of the analysis.
To date, only a few studies have used molecular approaches to label centromeres of micronuclei in human populations (Hando et al., 1994; Titenko-Holland et aL, 1994; Catalan et aI., 1995; Nath et aI., 1995) and none of the subjects had received an occupational or environmental exposure. The reasons may simply be that these methods require
192

Cylogenetic end-points as biaiogical dosimeters and predictors of risk
additional effort and that not every cytogenetics laboratory is equipped for the molecular aspects of the work. In spite of these limitations, the advantages of including molecular methods in micronucleus analyses are significant and would substantially improve the ability of micronucleus assays to serve as a meaningful biomarker. As more micronucleus data including cerstromere informa-tion are gathered, so our understanding of the use-fulness of the data for cancer epidemiology will improve. Iп the meantime, the analysis of micro-nucleus data can be performed in a manner which assumes that all micronuclei are formed either by clastogenic or by spindle disruptive processes. Although this will lead to an overestimation of the risk estimate, at least an upper confidence bound could be obtained. In spite of some limitations, micronuclei can be very useful as a biomarker.
Sister chromatid exchanges (SCEs) SCEs can be measured in any eukaryotic cell that can be grown in bromodeoxyuridine (or a suitable alternative) for two cell cycles and examined in metaphase. SCEs have been evaluated in numer-оus studies involving human exposure. The assay yields quantifiable data from every metaphase cell, and the genotoxic potential of a chemical can be determined more rapidly than with some other cytogenetic methods (SCEs are not a good indica-tir of exposure to ionizing radiation). Besides the disadvantage of an unknown mechanism, the use of SCEs has been criticized because significant increases have been obtained from compounds such as NaCI and KCl which clearly are not expected to be genotoxic (Galloway et al., 1987). Thus, a positive SCE response does not necessarily mean that a compound is genotoxic. However, SCE assays remain widely used for evaluating the abil-ity of chemicals to induce genetic damage. Unlike some types of structural aberrations (especially re-ciprocal translocations), SСEs evaluated following in-vivo exposure show limited persistence and accumulation, which appears to reflect DNA repair processes as well as cell turnover.
Nevertheless, SCE data do have some appealing characteristics. The distribution of SCEs per cell is close enough to normal to allow parametric statis-tical analyses in most situations. Large SCE data-bases have been generated, making it possible to compare relative potencies for hundreds of cor-
pounds (Tucker et aL, 1993a). SCEs are generally more sensitive indicators of genotoxic effects than are structural aberrations, and require less effort to analyse. Like structural aberrations, the existence of threshold effects for SCE induction is possible but difficult to prove or disprove, especially without an understanding of the mechanism of formation.
A variation of the basic method involves quan-tifying cells with a high frequency of SCEs (Moore & Carrano, 1984). In this approach, the distribu-tion of SCEs per cell is determined for each mdi-vidual, and cells exceeding an arbitrarily chosen number of exchanges (typically those in the upper 5a/o of the range) are identified as 'high frequency cells' (HFCs). The number of HFCs per subject is then compared between groups of individuals using non-parametric statistics. This method may be useful for detecting differences between indi-viduals or groups of people when differences in the mean frequencies are small.
Interphase cytogenetic analyses Interphase cells are routinely obtained during the collection of clinical specimens such as Pap smears, blood and urine samples, and skin biopsies. These clinical samples are evaluated for normal and pathological features and provide valuable infor-mation for clinical diagnosis. However, historically these samples have had limited usefulness in iden-tifying genetic changes occurring in the tissues, organs or body fluids from which the sample was obtained. Developments in molecular cytogenetics over the past 10 years are allowing new and impor-tant types of cytogenetic information to be ob-tained for cells and cell types that has not been possible previously. One type of molecular tech-nique which is proving to be particularly valuable for these studies is FISH, which allows information on chromosome number and, to a limited extent, chromosome structure to be simply and rapidly obtained from interphase cells (Pinkel, etal., 1986; Gray, et al., 1994; Eastmond & Rupa, 1995).
Interphase studies using FISH focus primarily on aneuploidy, a condition in which the chromosome number of the cell or individual differs from the normal number in that cell type—typically 46 for somatic cells aid 23 for germ cells in humans. Aneup1oidy in germ cells has been associated with infertility pregnancy loss, congenital anomalies and mental retardation, whereas in somatic cells this
193

Application of Biomarkers in Cancer Epidemiology
condition has been linked with cell death and car-cinogenesis (Hook, 1985; Oshimura & Barrett, 1986; Hecht Sr Hecht, 1987). FISH studies for arieuploidy typically utilize DNA probes specific for the cen-trorneric region of one (or occasionally several) chromosome(s) of interest (Eastniond & Rupa, 1995). Following hybridization with the probe, two brightly stained fluorescent hybridization regions are observed at the position of the chro-mosomal region in both metaphase and interphase somatic cells. Aneuploid cells are identified by counting the number of fluorescent spots in each nucleus. Cells are considered to be aneuploid when the number of hybridization signals differs from the expected two per chromosome in the nuclei of somatic cells and one in the nuclei of germ cells. For technical reasons, this assay is more sensitive for detecting gains in chromosome number (hyperploidy) than for detecting chromosome losses (hypoploidy) (Eastmond & Pinkel, 1990).
In-vitro studies have shown that this FISH assay 1s effective in detecting hyperdiploidy induced by aneuploidy-inducing agents (Eastmond & P1nke1, 1990). To date, only a limited number of studies using FISH to detect aneuploidy in human pори-lations have been conducted. Some initial studies, primarily in sperm and exfoliated cells, have used probes in an attempt to establish the levels of hyperploidy in the cells of individuals without known exposure to genotoxic agents (e.g. Moore et al., 1993; Robbins etaL, 1993; Bischoff et al., 1994). These have been followed by a number of studies (e.g. Robbins et aL, 1994; Rupa et al., 1995; Smith et al., 1995) in which FISH, using centromeric DNA probes, has been employed to detect increases in aneuploidy in individuals exposed to benzene, pes-ticides and chemotherapeutic drugs. In most of these recently published or soon-to-be published studies, a significant increase in hyperploidy was seen in the exposed individuals when compared with control individuals. Although additional studies will be required to validate this assay thor-oughly, the results of these initial studies indicate the promise and feasibility of this technique in human biomonitoring.
Since aneuploid cells are identified by counting the number of hybridization regions in the nucleus, hybridization artefacts and other technical prob-lems may significantly affect this assay (Eastmond etaL, 1995). For example, the detection of chromo-
some loss is influenced by the superimposition of signals, associations of сеntromeric regions in interphase cells and inefficient probe penetration. It is also Iikely that other cellular and hybridization phenomena can significantly affect the number of cells scored as hyperdiploid. For example, breakage occurring within the chromosomal region targeted by the DNA probe can be incorrectly identified as an additional chromosome (Eastmond, et al., 1994; Rupa, et aL, 1995). Although this illustrates a poten-tial imitation of this FISH assay, D.A. Eastmond and co-workers have shown that, by modifying the standard single probe hybridization assay through the use of multicolour FISH with two adjacent probes, this approach can also be used to detect chromosomal breakage in interphase somatic and germ cells (Eastmond et aL, 1994; Rupa, et al. 1995; D.S. Rupa, unpublished data). Recent studies have shown that this tandem FISH approach is effective for detecting breakage in cells exposed in vitro to genotoxic agents, as well as in workers occupa-tionally exposed to pesticides (Rupa, et al., 1995).
One of the advantages of these interphase FISH assays is that they can be performed on most cell types, allowing information on chromosomal alterations to be obtained from the target organs of carcinogens or germ-cell-damaging agents. For example, by assaying cells exfoliated in the urine, it may be possible to measure damage occurring in the bladder of workers or patients exposed to agents that induce bladder cancer. Studies have been initiated that have shown that interphase FISH can be performed on buccal mucosal cells, urothelial ceis and sperm, as well as blood cells such as granulocytes and lymphocytes. In addition, it is Iikely that other cells isolated through skin biopsy, and cells isolated during bronchoalveolar lung lavages or Pap smears could also be assayed. For most of the cell types tested to date, relatively simple preparation procedures can be used. For example, standard cytogenetic fixation procedures can be used to prepare lymphocyte and granulo-cyte slides. Interphase analyses for aneuploidy and breakage can also be performed on blood smears following simple fixation procedures. However, this approach is not recommended as a routine method, as relatively few nucleated cells are re-covered on a standard blood smear and scoring is tedious. It is likely that with relatively minor mo-difications, such as the use of hypotonic Rd to lyse
194

Cytogerietic end-points as biological dosimeters and predictors of risk
the red blood cells in the blood sample, nucleated cells can be concentrated to facilitate scoring as well as to improve probe penetration. This should allow biomonitoring to be performed on minimal amounts of blood, such as that obtained by prick-ing a finger, and would eliminate the requirement for cell culturing. However, in some cases cell cul-ture may facilitate the detection of chromosome aberrations such as aneuploidy, as cells must pass through a mitosis in order for numerical alter-ations to occur. Recent studies by Rupa etaL (1996) have shown that culturing is not required for the detection of chromosomal breakage in interphase cells. Iп these studies, similar frequencies of break-age were seen in cultured and non-cultured lym-phocytes, and in granulocytes irradiated to vtttu.
Future cytogenetic techniques The use of biomarkers for assessing cytogenetic damage has seen tremendous advances in recent years, the most notable of which is FISH. Early efforts were limited to a single colour and repeti-tive sequences, while the current state of the art involves multiple colours used in combination to identify a wide range of targets comprised of unique and repetitive DNA sequences. The sensi-tivity and specificity of the various F151 assays have increased accordingly, but there is still a need for additional fluorochromes in the visible range. Ideally, at least 24 unique colours are needed, one for each of the human chromosome types. The actual number of fluотoсhromes needed to accom-phsh this is considerably less than 24. For example, two colours are now commonly mixed to yield a third colour. Three fluorochromes can be mixed to yield seven colours (three individually, plus three unique pairs, plus all three together). In general, n fluorochromes can theoretically be mixed to yield Zn - 1 colours, assuming that the fluorochromes are mixed in equal ratios. Alterations of the ratios will lead to additional colours. As many as 12 colours have now been detected simultaneously (Dauwerse et al., 1992), but the use of this number of colours simultaneously is far from routine. Regular application of large numbers of probes in different colours would significantly increase the frequency of the detectable events, including struc-tural aberrations, chromosomal contents of micrornudei and aneuploidy. Similarly, the applica-tion of brighter colours would enable (1) enhanced
detection of bound probe, (2) visualization of probes hybridized to smaller targets, (3) reduction of signal fading, and (4) reduced need for computerized image processing, which is expensive and beyond what most laboratories can afford.
The field of interphase cytogenetics has seen significant advances in recent years, also due to applications of FISH. The detection of structural aberrations in interphase with closely spaced probes is significant. Extension of this basic method to other chromosomes and in other species could lead to significant insights into the frequency and distribution of chromosome dam-age in cell types that are not currently accessible. Such probes would not necessarily have to be tai-geted to repetitive sequences, as it is now possible to produce unique-sequence probes to specific chromosomal regions by microdissection (e.g., Yokoyama & Sakuragawa, 1995).
It is also possible to perform FISH on tissue slices of archived pathological specimens (Sauter et al. 1995). Application of these methods to epidemio-logical applications would create new avenues of research in which samples gathered many years previously would become amenable to sensitive and
ghly specific molecular analyses. Retrospective case-control studies could be performed with rela-tive ease on existing samples. Prospective cohort and nested case-control studies could be planned because the sample storage requirements are straightforward. The relatively small amounts of material that are typically required for molecular analyses could mean that numerous assays might be performed on only a few tissue slices, which would be a distinct advantage for very small or rare samples.
Automation of cyto genetic assays has been a goal for many years. Some progress has been made, for example in the area of karyotyping and aberration detection (e.g. Luudsteen & Piper, 1989; Mayali et al., 1990; Huber et aI. 1995). However, fully automatic analysis of metaphase chromosomes is yet to be realized. Automatic metaphase finding shows significant promise for enhancing throughput, and consequently for increasing the sensitivity of aberration detection (e.g. Piper et al., 1994; Vrolijk et al., 1994). Some progress has also been made towards automatic detection of micronuclei in erythrocytes (e.g.. Zetterberg & Grawe, 1993) and nucleated cells
195

Application of Biomarkers in Cancer Epidemiology
(e.g., Vrai et al., 1994), but except for isolated instances, such methodology is not used on a rou-tine basis. Automated systems for spot counting in interphase cells would be useful for detection of aneuploidy. In general, automation is expected to permit the analysis of more cells than would oth-erwise be possible, with the result that the sensi-tivity for performing biological dosizn.etry will be increased.
Improved techniques for hybridization are needed, particularly for slides that have not been stored in NZ gas at-20°C. While some success at hybridizing archived material has been achieved, routine F1SH on old material is often difficult. A method that consistently results in high-quality FISH signals would eliminate the need for side storage at —20°C, and would open up new avenues of research on existing material. For prospective epidemiology studies, cryopreser-vation of white blood cells offers an attractive alternative to real-time biomonitoring of at-risk populations, since ceI1s can be stored long-term and evaluated as needed in the future. When frozen for viabi1ity, lymphocytes may be readily thawed and cultured (McFee et al., 1995) for stud-ies of structural chromosome aberrations, micronuclei or SCEs. After culture, slides may be prepared for FISH immediately or cells may be stored in fixative at —20°C for periods of at least a year. Similarly, interphase analyses using сеп-trоmere, chromosome or DNA probes can be per-formed on lymphocytes or granulocytes from selected persons within cohorts. Such approaches may be useful in case—control or casecohort stud-ies of populations with specific exposures at some time in the past.
One goal of all these methods is to improve the sensitivity and specificity of cytogenetic analyses, so that their utility as biomarkers of exposure and effect can be improved. Developments such as new DNA probes and probe combinations, enhance-ments in the area of automation and the hybridiza-tion of archived slides, as well as improvements iп the number and intensity of fluorochromes, are all expected to increase the rate of analysis and to improve the sensitivity and specificity of detec-tion. The result will be that lower levels of expo-sure can be detected with increased confidence and reliability in populations that could not previously be evaluated.
Special considerations on the use of cytogenetic end-points in epidemiology studies Epidemiology studies involving cytogenetic end-points have generally required advanced planning because of the need to culture cells to bring them to metaphase. This is true for studies seeking to measure structural chromosome aberrations, whether by FISH or by classical methods, as well as for studies involving SCEs. This limitation severely restricts the use of archived material for these end-points. A further limitation for studies using FISH is the requirement for microscope slides to be frozen in nitrogen gas to preserve their ability to hybridize. The reasons for this are not well under-stood and might be overcome by additional research. An alternative approach to freezing slides is to freeze cells in a manner that maintains their viability. With this approach, selected samples can be thawed and analysed at a later date. Disadvantages of this method include the expense involved in cryopreservation and diminished cell viability upon thawing. For all of these reasons, metaphase-based analyses are most commonly used for case—control or cross-sectional studies, and not for prospective cohort or retrospective studies.
The advent of interphase-based analyses as described in this paper appears to have significant potential for many types of epidemiology studies. Prospective cohort and nested case—control studies could take advantage of these methods for several reasons. The absence of a requirement for tissue culture greatly simplifies the work needed to store samples, although freezing of the microscope slides is still required for FISH. Interphase analyses might be possible on lymphocytes obtained from gravity sedimentation of whole blood cells ('buffy coats'). These cells could be smeared on micro-scope slides and stored for later analysis. The sim-plicity of this method, the inherent low cost aid the small amount of material required would make this approach applicable to a broad range of studies, including those that require very large sample sizes.
Finally, a comment on inter-reader variation of cytogenetic analyses is in order. Epidemiologists often express concern about the inherent subjec-tivity of cytogenetic analyses. Any method that requires human judgment as part of the analytical process has some potential for confounding due to interindividual differences in decision-making. One of the significant advantages of molecular
196

Cytogeneic end-points as biological dosimeters and predictors of risk
cytogenetic methods, compared to the older, clas-sical methods, is that the end-points of interest are more easily detected and therefore less subjective in their interpretation. For example, a colour'junc-tion' which is evidence of a chromosome translo-cation in painted cells is much more obvious than the equivalent event seen in banded preparations. This increase in objectivity should diminish con-cerns inherent in any large study where there is more than one person who performs the routine analyses and where unavoidable turnover in the technical staff occurs.
In summary, compared with classical cytoge-netic approaches, molecular cytogenetic biomark-ers offer a number of significant advantages that make them appealing for use in a wide variety of epidemiological studies.
Acknowledgements This work was performed in part under the aus-pices of the US DOE by the LLNL under contract No. W-7405-ENG-48 and supported by NIH grant CA59431 ()DT). LGL was supported by NCI intera-gency agreement У01-СР3-0573 and DOE/ORAU contract DE-АCO5-760800033. DAE was sup-ported by a US EPA grant (R 820994-01-1).
References Awa, A.A. (1974) Cytogenetic and oncogenic effects of the ionizing radiations of the atomic bombs. In: German, J., ed., Chromosomes and Cancer, New York, John Wiley, pp. 637-674
Bender, M.A., Awa, A.A., Brooks, A.L., Evans, Н.J., Groer, P.G., Littlefield, L.G., Pereira, C., Preston, R.J. & Wachholz, B.W. (1988) Current status of cytogenetic pro-cedures to detect and quantify previous exposures to radiation. Mutation Res., 196, 103-159
Bischoff, F.Z., Nguyen, D.D., Burt, К,J. & Shaffer, L.G. (1994) Estimates of aneuploidy using multicolor fluores-cence in situ hybridization on human sperm. Cytogenett.
Cell Genet., 66, 237-243
Bogen, K.T. (1993) Reassessment of human peripheral T-lymphocyte lifespan deduced from cytogenetic and cyto-toxic effects of radiation. Int. J. Radiat. Biol., 64, 195-204
Bonassi, S., Abbondandolo, A., Camurri, L., Dal Pra, L, De Ferrari, M., Degrassi, F., Forni, A., Lamberti, L., Lando, C., Padovani, P., Sbrano, I., Vecchio, D. & Pvntoni, R. (1995) Are chromosome aberrations in circulating iym-phocytes predictive of future cancer onset in humans? Preliminary results of an Italian cohort study. Cancer
Genet. Суtоgeпеt., 79, 133-135
Brandriff, B.F., Gordon, L,A., Moore, D., II & Carrano, A.V. (1988) An analysis of structural aberrations in human sperm chromosomes. Cyto,Fenet. Cell Genet., 47, 29-36
Brogger, A., Hagmar, L., Hansteen, I.L., Heim, S., Нбgstedt, B., Knudsen, L., Lambert, B., Kinnainmaa, K., Mitelman, F. Nordenson, I., Renterwall, C., salomaa, S., 5kerfving, S. & Sorsa, M. (1990) An inter-Nordic prospec-tive study on cytogenetic endpoints and cancer risk. Cancer Genet. CytogeneL, 45, 85-92
Buckton, ICE. (1976) Identification with G and R bапд-iпg of the position of breakage points induced in human chromosomes by in vitro X-irradiation. Int. J. Radiat. BioL, 29, 475-488
Buckton, ICE., Jacobs, P.A., Court-Brown, W.M. & Doll, R. (1962) A study of the chromosome damage persisting after X-ray therapy for ankylosing sgondylitis. Lancet II, 676-682
Catalan, J., Autio, K., Wessman, M., Lindholm, C., Kiiuutila, S., Sorsa, M. & Norppa, H. (1995) Age-associ-ated micronuclei containing centromeies and the X chromosome in lymphocytes of women. Cytogenet. Cell Genet., 68, 11-6
Cleary, M.L. (1991) Oncogenic conversion of transcrip-tion factors by chromosomal translocations. Cell, 66, 619-622
Dauwerse, J.G., Wiegant, J., Raap, А.K., Breuning, l'AI. & Van Omen, G.J.B. (1992) Multiple colorsby fluorescence in situ hybridization using ratio-labelled DNA probes cre-ate a molecular karyotype. Human Mol. Genet., 1,
593-598
Eastmond, D.A. & Tucker, J.D. (1989) Identification of aneuplliidy-inducing agents using tytolwesis-blocked human lymphocytes and an aritikinetochore antibody. Environ. Mol. Mutagen., 13, 34-43
Eastmond, D.A. & Pirtkel, D. (1990) Detection of anen-ploidy and aneuploidy-inducing agents in human lym-phocytes using fluorescence in situ hydridization with chromosome-specific DNA probes. Mutation Res., 234, 303-318
Eastmond, D.A., Rupa, D.S. & Hasegawa, L.S. (1994) Detection of hyperdrploidy and chromosome breakage in interphase human lymphocytes following exposure to the benzene metabolite hydroquinone using multicolor fluorescence in situ hybridization with DNA probes. Mutation Res., 322, 9-20
Eastmond, D.A. & Rupa, D.S. (1995) Fluorescence in situ hybridization: application to environmental niutagene-sis. In: Phillips, D.H. & Venitt, S., eds, Environmental
197

Application of Biomarkers in Cancer Epidemiology
Mutagenesis, Bios Scientific Publications, Oxford, pp. 261-290
Rastmond, D.А., Schulег, M. & Rupa, D.S. (1995) Advantages and limitations of using fluorescence in situ hybridization for the detection of aneuploidy in inter-phase human cells. Mutation Res., 348, 153-162
Galloway, S., Deasy, D. Bean, C., Kraynak, R., Armstrong, M. & Bradley, O. (1987) Effects of high osmotic strength on duomosome abenations, sister chromatid exchanges and DNA strand breaks, and the relation to toxicity. Mutaf ion Res., 189, 15-25
Gray, J.W., Pinke1, D. & Brown, J.M. (1994) Fluorescence in situ hybridization iii cancer and radiation biology. Radial Res., 137, 275-89
Hagmar, L., Btogger, L., Hansteen, I.L., Heim, S., Hogstedt, B,, Knudsen, L., Lambert, B., Linnainmaa, K., MiteImaп, E, Nordenson, i., Reuterwall, C., Salomaa, S., Skerfving, S. & Sorsa, M. (1994) Cancer risk in humans predicted by increased levels of chromosomal aberrations in lymphocytes: Nordic Study Group on the Health Risk of Chromosome Damage. Cancer Res., 54, 2919-2922
Harido, J.C., Nath, J. & Tucker, J.D. (1994) Sex сhrото-somes, micronudei and aging in women. Chromosoma, 103, 186-192
Hecht, F. & Hecht, B.K. (1987) Aneuploidy in humans: dimensions, demography, and dangers of abnormal numbers of chromosomes. In: Vig, В.К. & Sandberg, A.A., eds, Aneuploidy Part А: Incidence and EtгoIо у, New York, Alan R. Liss, Inc pp. 9-49
Нeддlе, J.А., Hite, M., Kirkham, B., Movournin, K., MacGregor, J.T., Newell, G.W. & Salamone, М.F. (1983) The eduction of micronuclei as a measure of genotoxi-city. A report of the U.S. Environmental Protection Agency Gene-Tox Program. Mutation Res., 123, 61-118
Неim; S. & Mitelman, R (1987) Cancer Cytogeneiics, New York, Alan R. Liss
Hook, E.B. (1985) The impact of aneuploidy upon pub-lic health: mortality and morbidity associated with human chromosome abnormalities. In: Dellarco, V., Voуtek, Р.E. & Hotlaender, A., eds, Aneuploidy, New York, Plenum Press, pp. 7-33
Huber, R., Kulka, U., Lorch, T.H., Braselmann, H. & Bauchger, M. (1995) Automated metaphase finding: an assessment of the efficiency of the METAFER2 system ira a routine mutagenicity assay. Mutation Res., 334, 97-102
Ishihara, T. & Kumatont, T. (1969) Cytogenetic studies on fishermen exposed to fallout radiation in 1954. Jpn. J. Genet., 44 (Sпpp1. 1), 242-251
Kleinerrnan, R.A., Littlefield, L.G., Tanne, R.E.,
Machado, S.G., Bfettner, M., Peters, L.J. & Boice, J.D., Jr (1989) Chromosome aberrations in peripheral lympho-cytes and radiation dose to active bone marrow in patients treated for cancer of the cervix. Radiation Res., 119, 176-190
Kieinerman, R.A., Littlefield, L.G. Tanne, R.E., Sayer, A.M., Cooktair, D.L., Wactawski-Wende, J., Iraskip, P.D., Block, A,M.W., Ramesh, K.H. & Boice, J.D., Jr (1994) Chromosome aberrations in lymphocytes from women irradiated for benign and malignant gynecological dis-ease. Radiation Res., 139, 40-46
Littlefield, L.G. & Joiner, E.E. (1978) Cytogenetic follow-up studies in six radiation accident victims (16 & 17 years post-exposure). In: Late Effects of Ionizing Radiation, Vienna, International Atomic Energy Agency, pp. 297-308
Littlefield, L.G., Kleinerman, R.А., Sayer, A.M., Tamone, R. & Boice, J.D., Jr (1991) Chromosome aberrations in lym-phocytes—Biomonitors of radiation exposure. In: Gledhill, B.L. & Mauro, F., eds, New Horizons in BiаIоgгсаl Dosimetry, New York, Wiley-Liss, pp. 387-397
Lucas, J.N., Tenzin, T., Straume, T,, Pinke1, D., Moore, D., II, Litt, M. & Gray, J.W. (1989) Rapid human chromo-some aberration analysis using fluorescence in situ hybridization. Jot. J. Radiat. Biol., 56, 35-44 (Erratum: Int. J. Radiat. Biol., 56, 201)
Lucas, J.N., Awa, A.A., Straume, T., Poggensee, M., Kodama, Y,, Nakano, M., Ohtaki, K., Weier, 1.-U., Pinkel, D., Gray, J. & Littlefield, L.G. (1992) Rapid translocalon frequency analysis in humans decades after exposure to ionizing radiation. lit. J. Radiat. BгоI., 62, 53-63
Lundsteen, C. & Piper, J., eds. (1989) Automation of Cytogenetics, Berlin, Springer-Verlag
McFee, A.F., Sayer, A.M. & Littlefield, L.G. (1995) Cryopreservation of lymphocytes for cytogenetic analy-sis. I. Prompt separation is needed. Environ. Mol. Mutagen, 25 (suppl. 25), 34
Mayali, B.H., Tucker, J.D., Christensen, M.L., van V1iet, L.J. & Young, I.T. (1990) Experience with Athena, a semi-automated karyotyping system. Cytometry, 11, 59-72
Moore, D.H., II & Carrano, A.V. (1984) Statistical analy-sis of high SCE frequency cells in human lymphocytes. In: Tice, R.R. & Hollaender, A., eds, Basic Li fe Scтences Vol. 29, New York, Plenum, pp. 469-479
Moore, L.E., Titenko-Holland, N. & Smith, М.Т. (1993) Use of fluorescence in situ hybridization to detect chro-mosome-specific changes in exfoliated human bladder and oral mucosa cells. Environ. Mol. Mutagen., 22, 130-137
Natarajan, A.T., Vyas, R.C., Wiegant, J.C. & Curado, M.P. (1991) A cytogenetic follow-up study of the victims of a
198
Cytogenetic end-points as biological dosimeters and predictors of risk
radiation accident in Goiania (Brazil). Mutation Res., 247, 103-111
Nath, J., Tucker, J.D. & Hando, J.С. (1995) Y chromo-some aneuploidy, micronuclei, kinetochores and aging in men. Chromosoma, 103, 725-731
Ohtaki, K., Shimba, H., Awa, A.A. & Sofuni, T. (1982) Comparison of type and frequency of chromosome aber-rations by conventional and G-staining methods in Iii-o-shima atomic bomb survivors. J. Radiat. Res., 23, 441-449
Оsbimша, M. & Barrett, J.C. (1986) Chemically induced aneuploidy in mammalian cells: mechanisms and biolog-ical significance fn cancer. Environ. Mutagen., 81, 129-159
Pinkel, D., Straume, T. & Gray, J.W. (1986) Cytogenetic analysis using quantitative, high-sensitivity, fluorescence hybridization. Froc. Natl Acad. sri., 83, 2934-2938
Piper, J., Poggensee, M., Hill, W., Jensen, R., Ji, L., Poole, 1., Stark, M. & Sudar, D. (1994) Automatic fluorescence metaphase finder speeds translocation scoring in FISH painted chromosomes. Cytometry, 16, 17-16
Ramsey, M.J., Moore, D.H., II, Bnier, J.F., Lee, D.A., Olsen, L.A., Seлft, J.R. & Tucker, J.D. (1995) The effects of age aid lifestyle factors on the accumuiation of cytoge-netic damage as measured by chromosome painting. Mutat. Res., 338, 95-106
Robbins, W.A., Segraves, R., Piiikel, D. & Wyrobek, A.J. (1993) Detection of aneuploid human sperm by fluores-cence in situ hybridization: evidence for a donor differ-ence in frequency of sperm disomic for chromosomes 1 and Y. Am. J. Hum. Genet., 52, 799-807
Robbins, W.A., Cassel, M.J., Blakey, D.H., Meistrich, М.L. & Wyrobek, A.J. (1994) Induction of aneuploidy in the sperm of Hodgkin's disease patients treated with NOVD chemotherapy (detection by multi-chromosome fluores-cence in situ hybridization). Envi ron. MoL Mutagen., 23 (suppi. 23), 58
Rupa, D.S., Hasegawa, L. & Eastmond, D.A. (1995) Detection of chromosomal breakage in the lсеп-1g12 region of interphase human lymphocytes using multi-color fluorescence in situ hybridization with tandem DNA probes' Cancer Res., 55, 640-5
Rupa, D.S., Schuler, M. & Eastmond, D.A. (1996) Detection of aneuploidy and breakage in the 1cen-1g12 region of human lymphocytes induced by genotoxic agents. Fundamental AppL ToxicoL, 30, 46
Salassidis, K., Georgiadou-Schumacher, V., Braselmann, H., Muller, R, Peter, RU. & Bauchinger, M. (1995) Chromosome painting in healthy irradiated Chernobyl victims: a follow-up study to evaluate the stability of
symmetrical translocations and the influeiice of clonai aberrations for retrospective dose estimation. Int. J. Radiai. BioL, 68, 257-262
Sandberg, A.A. (1990) The Chromosomes in Human Cancer and Leukemia, 2nd edn, New York, Elsevier
Sauter, G., Mock, H., Gasser, T.C., Mihatsch, М.~. & Waldman, F.М. (1995) Heterogeneity of chromosome 17 and erbB-2 gene copy number fn primary and metastatic bladder cancer. Cytometry, 21, 40-46
Schreunemachers, D.M. & Everson, R.B. (1991) Effect of residual splenic function and folate levels on the fre-quency of micronucleated red blood cells in splenec-tomized humans. Mutat. Res., 263, 63-67
Smith, М.T., Zhang, L., Rothman, N., Wang, Y., Hayes, R.B., Li, G.L. & Yin, SN. (1995) Interphase cytogenetics of workers exposed to benzene. Toxicologist, 15, 87
Stanbridge, E.J. (1992) Functional evidence for human tumour suppressor genes; chromosome and molecular genetic studies. Cancer Sm-v., 2, 5-24
Titenko-Holland, N., Moore, L.E. & Smith, М.T. (1994) Measurement and characterization of micronuclei in exfoliated human cells by fluorescence in situ hybrktiza-tion with a centromeric probe. Mutat. Res., 312, 39-50
Tucker, J.D., Auletta, A., Cimino, M.C., Dearfield, K.L., Jacobson-Kram, D., Tice, R.R. & Carrano, A.V. (1993a) Sister-chromatid exchange: second report of the Gene-lox pTogram. Mutat. Res., 297, 101-180
Tucker, J.D., Ramsey, М.~., Lee, D.A. & Minkler, J.L. (1993Ь) Validation of chromosome painting as a bio-dosimeter in human peripheral lymphocytes following acute exposure to ionizing radiation in vitro. Inn. J. Radiat. Bio'., 64, 27-37
Tucker, J.D., Lee, D.A., Ramsey, M.J., Briner, J., Olsen, L. & Moore, D.H., II. (1994) On the frequency of chromo-somal exchanges iп a control population measured by chromosome painting. Mutat. Res., 3131, 93-202
Vrai, A., Verhaegen, F., Thierens, H. & de Ridder, L. (1994) The in vitro cytokinesis-block micronucleus assay: a detailed description of an improved slide preparation technique for the automated detection of micronuclei in human lymphocytes. Mutagenesis, 9, 439-443
Vrolijk, J., Sims, W.C., DanouB, E, Natarajan, А.T. & Tanke, H.J. (1994) A system for fluorescence metaphase finding and scoring of chromosomal translocations visualized by in situ hybridization. ut. J. Radia t. BioL, 66, 287-295
Yokoyama, Y. & Sakuragawa, N. (1995) Improved simple generation of GTG-band specific painting probes. Cytogenet. Cell Genet., 71, 32-36
199

Application of Biomarkers in Cancer Epidemiology
Zetterberg, G. & Grawe, J. (1993) Flow cytometric analysis of micronucleus induction in mouse erythrocytes by gamma-inadiation at very low dose-rates, lot. J. Radiat, iii!., 64, 555-564
Corresponding author J.U. Tucker Biology and Biotechnology Research Program, PO Box 808, L-452, Lawrence Livermore National Laboratory, Livermore, CA 94551, USA
200

Application ы Siomarkecs in Cancer Epidemiology Torüob, R, Выfе ttа, Р. Shukec, D.E.G., Rothman, N., Halka, B. arid Pearce, N., ads
IARC Scientific Publications No. 142 IпlerпatгaпaI Ageпcy foг Research cri Gercer, Lyle, 1997
Methodological issues in the use of tumour markers in cancer epidemiology
i-F, Zhang, C. Cordon-Carda, N. Rothman, A.N. Freedman and J.A. Taylor
In this chapter, we review major methodological and practical issues associated with the use of tumour markers. At this stage of development, studies with a combination of tumour, susceptibility and exposure markers are needed to illustrate the link between exposure and biological response and to assess the interactive effects of tumour susceptibility markers in this process. Several practical issues related to the application of tumour markers are discussed, including banking of tumour tissue, setting a laboratory strategy and performing etiological heterogeneity analysis.
Recent advances in technology aimed at identify-ing genetic mutations and abnormally expressed products have led to an interest in incorporating these alterations as tumour markers in epidemio-logical studies in an attempt to better understand the natural history and the etiology of cancer. There is a concomitant need for research into methodological issues including study design, sta-tistical analysis, and interpretation as well as prac-tical issues such as tumour tissue storage.
Tumour markers have been defined by Schwartz (1989) as:
`... substances which can be measured quanti-tatively by biochemical or immunochemfcal means in tissue or body fluids to identify the presence of a cancer, possibly the organ where it resides, to establish the extent of tumour bur-den before treatment as well as to monitor the response to therapy.'
The term has been defined more narrowly as (Юavins, 1989):
d. .. substances that are produced by cancer cells and present in the circulation of cancer patients at a higher concentration than in individuals without cancer. It can be used to monitor the course of the disease.'
More broadly, tumour markers can be defined as those abnormal biological products or molecular alterations related to any sequence of multistage
carcinogenesis, such as tumour initiation and pro-motion, arid may be measured quantitatively or qualitatively by biochemical, immunochemical, cytogenetic and molecular techniques in human biological materials, including tumour tissues, blood and urine samples, etc. These markers may be employed to predict pnmary or secondary tumour risk, to establish tumour burden, to sub-classify tumours beyond histological classification (in addition to pathological classification), to pre-dict tumour prognosis, to determine treatment strategy and to evaluate chemoprevection or inter-vention efficacy. They can be employed in primary prevention or etiological research by detecting the relationship between environmental exposure and specific mutations; in secondary prevention studies (i.e. early detection and diagnosis) by identifying a precursor or tumours at the early stage; and iп ter-tiary prevention (i.e. enhanced prognosis) if they predict tumour progression and patient survival.
In this chapter, we will briefly review some tumour markers of relevance to etiological studies of cancer and discuss methodological issues associated with the use of those markers in cancer epidemiol-оgy, including issues of study design and statistical analysis. We will also discuss several tumour-marker-related practical issues, including the collec-tion and storage of tumour-marker-related biolog-ical materials, the laboratory strategy for measuring tumour markers, and issues associated with the use of tumour markers in prognostic studies.
201

Application of Biomarkers in Cancer Epidemiology
Etiological heterogeneity The theoretical framework for the use of tumour markers in cancer epidemiology is based on the hypothesis of etiological heterogeneity. The con-cept of etiological heterogeneity was first suggested by Kreyberg (1937), and was based on the fact that a relationship might exist between histological types and biological or etiological factors. In epi-demiological studies of smoking and lung cancer, Kreyberg (1952, 1954) suggested that lung cancer was histologically and biologically heterogeneous and related to particular exposures. The relation-ships between stage, grade, histology, anatomic location of the tumour and etiological factors have been explored for a number of different tumour types (Pall! et al. 1992; Sturgeon et al., 1994; Vaughan et al., 1995). The study of etiological het-erogeneity using tumour markers represents a pro-gression from studies of the relationship of envi-ronmental exposures at the anatomical arid mor-phological levels to studies at molecular and genetic levels.
In perhaps one of the earliest studies of this kind to examine etiological heterogeneity at the molecular level, Taylor et al. (1992) conducted a study of the relationship between occupational exposures and the activation of the ras oncogene in the etiology of acute myeloid leukaemia (AML), employing a conventional control group identified by random digit dialling. In this study, in addition to calculating unadjusted and adjusted odds ratios characterizing the association between occupa-tional factors and AIL, the investigators also assessed the association between the occupational risk factors and mutations of the ras gene in cases with AIL. Several recent studies have now expanded this paradigm by evaluating the etiolog-ical heterogeneity of tumours, exploring the rela-tionship between environmental exposures and ТР53 mutations(р53 ozerexpression in tumour samples from a variety of tumour types, including lung cancer (Kondo et al., 1992; Suzuki et al., 1992; Taylor et al., 1994), head and neck cancer (Field et al., 1991), oesophageal cancer (Hollstein et al., 199 lа), bladder cancer (Spruck et al., 1993; Zhang etaL, 1994b), colorectal cancer (Zhang et al., 1995b; Freedman et al., 1996a, 1996b), prostate cancer (Zhang et al., 1994a), stomach cancer (Zhang et al., 1995a), liver cancer (Bressac et al., 1991; Hsu et al., 1991; Ozturk 1991) and skin cancer (Brash et al.,
1991). The study of the etiological heterogeneity of tumours at the molecular level may provide great insight into the mechanisms and causal pathways to carcinogenesis, which may lead to appropriate preventive strategies to reduce the incidence of cancer.
Tumour markers Tumour markers include all of the biological prod-ucts related to the development and progression of neoplastic disease. Several markers are quantita-tively measured and may indicate the burden or extent of the cancer, such as serum carcinoembry-onic antigen (CEA), alphafetoprotein (AFP) and prostate-specific antigen (PsA). Since those mark-ers have been discussed frequently in the literature (Chu, 1987; Sell, 1992; Kramer & 5гivastava, 1994), we will not discuss them in this chapter. In the following section, we will briefly review three types of tumour markers with etiological implications: cytogenetic markers such as chromosome aberra-tions, oscogenes such as the ras family, and tumour suppressor genes such as the ТР53 gene.
Cytohenetic markers Since the use of cytogenetic markers has been extensively reviewed by Tucker et al. (this volume), we will limit our discussion to the cytogenetic analysis of lymphohaematopoietjc malignancies. Cytogenetic markers in this context include chro-mosome aberrations, sister chromatid exchange and micronuclei, which can be measured in both tumour tissues and peripheral lymphocytes. Specific cytogenetic changes were found to be non-random events involved in multistep carcinogenesis. Similar cytogenetic changes were identified in second pri-mary acute non-lymphocytic leukaemia (ANLL) after chemotherapy (Mitelman et al., 1981; Rowley, 198 3) and in patients with occupational exposures (litelman et al., 1981; GoIomb et al., 1982; Rowley, 1983; lite1inan et al., 1984). A high cor-relation was observed between sites of cytogenetic aberrations arid positions of oncogene or tumour suppressor gene Ioci (Rowley, 1984).
Environmental exposures, cytogeneic markers and lymphohaematopoietic malignancies. Sandler and Coilman (1987) have extensively reviewed issues concerning cytogenetic and enviroлmentaI factors in the etiology of acute leukaemia. Sandler et al.
202

Methodological issues in the use of tumour markers
(1993) investigated the leukaemia risk associated with cigarette smoking and cytogenetic changes in a multicentre case—control study of acute leukaemia in adults. Smoking was found to be more common among patients with specific chroniosonje abnor-malities in acute myeloid leukaeniia (AIL) [-7 or 7q—, —Y, +13] and in acute 1ymphocytic leukaemia (ALL) [t(9;22)(g34;q11)]. in a case—case study of 59 patients with newly diagnosed AIL (Fagioli et aI., 1992), 18 patients had prolonged contact with pes-ticides and seven patients had exposure to organic solvents. Cytogenetic studies confirmed the fre-quent occurrence of 5q and/or 7q aberrations in patients with occupational exposure (10 out of 25 cases). These findings revealed that ACL in patients occupationally exposed to toxic substances might represent a distinct cytogenetic entity.
In a case—case study of 162 patients with ANLL (Mitelman et al., 1981), 52 patients were occupa-tionally exposed to chemical solvents, insecticides or petrol products, and 110 patients had no his-tory of occupational exposure to potential muta-genic оr carcinogenic agents. Clonai chromosomal aberrations were present in 75% of exposed pa-tierits, compared with only 32% in the unexposed group. The incidence of certain characteristic kary-otypic abnormalities (5q—, 7q—, +8, +21, t(8;21), and t(9;22)) were decidedly more common in exposed than in unexposed patients. In another case—case study of 74 patients with ANLL (Golomb et a1., 1982), 25 of the 58 (43%) unexposed patients had a clorial chromosome abnormality, compared with 12 of the 16(75%) exposed patients (P=0.02). Either a —5/5q— or a —7/7q— was present in 67% of the exposed patients with a chromosome abnoт-таlity compared with 28% of the aneuploid unex-posed patients. These studies support the observa-tion that a subset of patients with de nova ANLL have a history of occupational exposure and a unique pattern of clonal chromosomal aberrations.
Gytogenetic changes in patients with second acute non-Eymphocytic leukaemia after treatment of a primary malignancy. Cytogenetic studies were conducted on 26 patients who developed ANLL or a dys-myelopoietic syndrome after treatment of a ptimary malignancy (Rowley et aL, 1981). Fifteen patients had radiotherapy and chemotherapy, seven had only chemotherapy, and four had only radiotherapy. Twenty-five patients had an abnormal karyotype in
myeloid cells. Loss of part or entire chromosomes 5 and/or 7 was noted in 23 of 25 patients with ane ирlоiду. Loss of chromosome 5 was noted only in patients who previously had malignant lymphoma whereas loss of chromosome 7 was seen in these patients as well as in those who had other malig-nancies. Abnormalities of both chromosomes 5 and 7 occurred in 53% of the patients treated with combined therapy and in only 27% of patients treated with either modality alone. Cytogenetit changes were analysed in 76 cases of secondary myelodysplasia (sIDS) and acute non-lymphocytic Ieukaemia (sANLL) (Johanson etal., 1991). Among the 36 sМDS patients, 23 (64%) displayed clonal chromosomal abnormalities. The most common aberrations were —7, 5q—, —5 and +8. 0f the 40 sANLL patients, 30 (75%) cases displayed clonai chromo-somal abnormalities. The most frequent aberrations were —7, —5, +8, 7q—, —17 and +21. When the inci-dences of characteristic cytogenetic abnormalities were correlated with the type of previous therapy, —7 was found to be more frequent in sDS and BANLL patients who had been exposed to chemo-therapy, whereas 5q—was associated with previous exposure to ionizing radiation in sID5 patients. Those results suggest that cvtogenetic measures maybe employed to predict the risk of second pri-mary tumour after treatment such as radiotherapy and chemotherapy for the first primary tumour.
In summary, many chromosomal abnormalities identified will have diagnostic, prognostic arid ther-apeutic implications. The identification of chro-mosomal abnormalities directs us to investigate abnormal loci of the genome that harbour the mol-ecular basis responsible for malignant transforma-tion and progression (IcClay, 1989). The imple-mentation of interphase cyto genetics by tech-niques such as fluorescence in-situ hybridization (FISH) will lead to the more frequent use of cytoge-netic markers in cancer epidemiological studies.
Oncogenes and tи пour suppressor genes Inherited (germline) or acquired (somatic) gene mutations and altered gene products controlling cell growth, cell death and differentiation are con-sidered to be crucial steps iп human carcinogenesis. Molecular studies have defined that aberrations affecting two major types of genes, proto-oncogenes and tumour suppressor genes have a direct role in turnorigenesis and cancer progression.
203

Application of Biomarkers in Cancer Epidemiology
Oneogenes. Proto-oncogenes are normal cellular genes involved in a wide variety of functions, such as cell growth arid signal transduction. The act!-vation of a proto-oncogene into an oncogene yields a gain of function or dominant event. Oncogene activation usually occurs by a somatic mutation, mainly gene amplification or point mutation. These alterations can convert a proto-oncogene from a normal cellular gene to an oncogene and can lead to uncontrolled or neoplastic growth (Taylor, 1989). .
Tumour suppressor genes. These genes are also nor-mal cellular genes. Tumour suppressor genes con-tribute to oncogenicity through their loss of func-tions, and are considered recessive events. The end result is that the products of these genes are absent or inactivated in the malignant cells. Tumour sup-pressor gene mutations are the most frequently observed genetic events in cancer. In general, sup-pressor gene inactivation occurs by a point mu-tation of one allele and a deletion of the remain-ing contralateral allele. The loss of both alleles (homozygous deletion) is an alternative but uncommon mechanism. These alterations result in an inability to suppress cell proliferation, and it is followed by tumour development. Sinсe many mutagens are capable of altering tumour suppres-sor genes, it has been hypothesized that tumour suppressor genes contribute to the development of cancer and may be a critical area in which to study cancer etiology (Hollstein etal.., 1991b; Jones etal.., 1991; Harris, 1993).
The use of oncogenes and tumour suppressor genes in cancer epidemio]ogy. The use of molecular and genetic alterations of tumour suppressor genes and proto-oncogenes in cancer epidemiology has advanced our understanding of cancer biology and carcinogenesis. Point mutations in tumour sup-pressor genes (e.g. ТР53) and oncogenes (e.g. ras) may be specific for both tumour type and the crit-ical environmental exposure (etiological hetero-geneity). Lung tumours from smokers show a high frequency of G to T traaversiori in both K-ras and ТР53, and may reflect the molecular fingerprint of carcinogenic constitution of tobacco smoke (]ones et a?., 1991). Such molecular epidemiological evi-dence supports the well established association between smoking and cancer (Vineis & Caporaso,
1995), although it is important to point out that mutational patterns differ for other smoking-related cancers such as bladder cancer.
The wide range of involvement of ТР53 in human tumours and the broad spectrum of muta-tions make the gene a good candidate for molecu-lar epidemiological studies (Holistein et al., 199 lb; Jones et a?., 1991; Harris, 1993; Harris & Hollstein, 1993). ТР53 mutations have been suggested as DNA fingerprints of exposure in a variety of tumours. Dietary АFВ, exposures are associated with AGG-AGT mutations at codon 249 in liver cancer (Ozturk et al., 1991; Bressac et al., 1991; Hsu et al., 1991). UV exposure may induce СС-ТT muta-tions in skin tumour (Brash et al., 1991). Radon exposures are related to AGG-ATG mutations in codon 249 in lung cancer (Taylor et al., 1994).
Newly developed molecular biological methods, e.g. polymerase chain reaction (PCR), automated sequencing techniques and comparative genomic hybridization (CGH), will accelerate the process of characterizing DNA alterations. The CGH method represents a recently developed molecular cytoge-netic screening technique that can be employed to survey entire genomes for variations in DNA sequence copy number, as well as to map chromo-some regions with amplifications or deletions in tumour DNA prepared from fresh or archived materials (Kallioniemi et aL, 1993; Thompson & Gray, 1993; Houldsworth & Chaganti, 1994; Kallioniemi et al., 1994). CGH is a powerful adjunct to traditional cytogenetic techniques and a useful tool with which to screen for molecular and genetic defects, which will eventually lead to the identification of tumour suppressor genes and oncogenes in solid as well as haematological tumours. By combining advanced methods for characterizing exposure to carcinogens and mea-suring tumour markers, there is a great potential for further elucidating the etiology of cancers and for the development of strategies for cancer prevention.
Study designs for the use of tumour markers Tumour marker studies provide some interesting new challenges in study design and statistical analysis. A detailed discussion of study designs for the use of biomarkers in epidemiology is provided by Rothman et aL (1995), Hulka & Margolin (1992) and Hulka & Garrett (1996).
204

Methodological Essues in the use of tumour markers
Case—case study design It has been suggested that case-case (or case—series or case-only) studies can be employed to evaluate gene—environment interactions. The critical as sumption is that the exposure and genetic factors occur independently and the disease is rare. Under these assumptions, the case—case approach is valid and offers better precision for estimating gene—environment interactions than does the case—control approach (Piegorsch et al., 1994). The case—case study design can be employed to assess the association between exposure and tumour markers aid to evaluate etiological heterogeneity between marker-positive and marker-negative tumours (Taylor, 1989; Begg & Zhang, 1994). This study design may be used to evaluate the hypothesis that the two categories of cases, distinguished by the presence or absence of the tumour marker, are characterized by etiological heterogeneity, as evi-denced by differences in the strengths of effects of the risk factor in the two case groups. The differ-ences could be due to the fact that the causal path-way differs, or they could merely reflect a different magnitude of effect via the same mecha-nism. Empirical evidence of such etiological hetero-geneity with respect to one or more risk factors would provide strong justification for more detailed investigations of the specific mechanisms of action. This study design consists of a series of incident cases. Ideally, this would be a consecutive series of population-based incident cases. If the ascertain-ment is not complete, or if, for example, the study is hospital-based, we must assume that case selec-tion for the two disease categories is not influenced differentially by the risk factors associated with case ascertainment.
5uрpose that Y is the risk factor of primary interest, assumed for simplicity to be binary, and that W denotes the set of remaining risk factors, where Yf indicates the presence of the risk factor and Y indicates its absence. Let X+ (X—) denote the presence (absence) of the tumour marker. Furthermore let yr(W) be the odds ratio relating Y and X, conditional on W. In the context of our study of p53 overexpression and bladder cancer (Zhang et al., 1994b), Y represents smoking status, X represents the presence or absence of TР53 mu- tations in the tumour samples, and W represents the remaining risk factors. We can evaluate 'y(W) using standard statistical methods such as the
Mantel—Haenszel procedure or logistic regression. A test of the null hypothesis that yr(W) =1 is a test of the hypothesis of etiological heterogeneity, i.e. that the strength of Y as a risk factor is different for the two case groups (e.g. р53+ and X53—).
Case—control study design In case—control studies, etiological heterogeneity has traditionally been evaluated by two separate analyses: marker-positive cases versus controls and marker-negative cases versus controls. The analytic strategy is to use polychotomous logistic regression (Dubin & Pasternak, 1986). In this model, the rela-tionships between marker-positive cases and controls, and between marker-negative cases and controls are both modelled concurrently using two separate (logistic) regression functions. Let X31 be the coefficient of the primary risk factor in the logistic regression relating marker-positive cases and controls, arid let R2 be the corresponding para-meter relating marker-negative cases and controls. If there are no interactions between Y and W, then F is the conditional log odds ratio of the risk factor on marker-positive disease, and RZ is the con-ditional log odds ratio of the risk factor on marker-negative disease. To test the null hypothesis that the two diseases possess etiological heterogeneity with respect to the risk factor, one can test the null hypothesis that X31 = 1 2' i.e. that the two odds ratios are equal. Such a comparison can be accomplished by using, for example, a likelihood ratio test. Quantitative evidence of the degree of departure from the hypothesis can be characterized by the difference in these coefficients, l — This is the logarithm of the ratio of the two adjusted relative risks of the risk factor, i.e. the relative risk with respect to marker-positive cases and with respect to marker-negative cases, respectively.
Case—case versus case—control study design It has been shown by our group (Begg & Zhang, 1994) that the odds ratio from the case—case study is theoretically equivalent to the parameter p, — (3Z in the polychotomous logistic regression model, and thus evaluation of etiological heterogeneity does not require a conventional control group.
We illustrate the method using data from our own case—case study of the relationship between smoking and TР53 mutations in patients with bladder cancer (Zhang et al., 1994b). The raw
205

Application of Biomarkers in Cancer Epidemiology
Cases
smoking p53+ p53— Controls status
Smoker 34 43 81 Non-smoker 10 21 64
frequencies are contained in Table 1. For illustra-tive purposes we have employed а control group consisting of patients with other cancers believed to be unrelated to smoking, although this would not be an ideal control group for a case—control study in general. The odds ratios and confidence intervals are presented in Table 2. The unadjusted odds ratios are calculated directly from the cross-products, as usual, i.e. yr = (34 x 21)1(10 x 43), Q= (34 x 64)/(10 x 81) = 2.69, and 02 = (43 x 64)/(21 x 81). Note that yr = 01/02.
We have shown that the odds ratio relating an environmental risk factor to the presence of a bio-logical marker is an appropriate measure for char-acterizing the degree of etiological heterogeneity between the disease groupings defined by the marker. These observations legitimize the common recent practice of exploring gene—environment associations in case—case studies (Piegorsch et a1., 1994). This parameter has been shown to be the ratio of the relative risk of the factor in causing marker-positive disease to the relative risk in caus-ing marker-negative disease. Moreover, it can be
estimated directly from an appropriately designed case—case study without the need for a control group (Zhang et ai., 1994a, 1994b, 1995а, 1995b; Freedman et al., 1996а, 1996b). The odds ratio obtained from case—case study needs to be inter-preted with great caution, since this measure does not indicate the directions of individual relative risk of marker-positive or marker-negative disease. Therefore, the use of a control group is necessary if we wish to estimate the actual relative risks for marker-defined tumour subtypes.
Practical issues in tumour tissue banking The research strategy to incorporate exposure, sus-ceptibility and tumour markers for a case—control study includes collection and storage of all related biological specimens, such as blood samples (for cases and controls), tumour and normal tissues (for cases only), ïп addition to the collection of epi-demiological exposure data. By collecting and storing blood specimens for all cases and controls, certain tumour susceptibility markers, such as polymorphism in GST M1, NАТ2 and CYP1A1, can be assessed. Other markers such as mutagen sensi-tivity, DNA repair capacity and haemoglobin/DNA adducts can also be measured. Proper collection and storage of tumour and normal tissues for cases allow the characterization of tumour suppressor genes and oncogener, as well as the DNA replica-tion repair defect phenotype, and microsatellite instability. By collecting epidemiological data, exposure history can be evaluated and other potential confounding factors can be controlled. Since the issue of blood specimen banking has been discussed by Landi & Caporaso (this volume)
в.. Estimate (95% Cl)
Design . Parameter Llnadjusted Adjusted$ 8(L4) 2.69 (1.23, 5.87) 3.61 (1.41, 9.29)
Case-control АΡ2(t 1.62 (0.87, 3.00) 2.11 (0.98, 4.54) АΡ,( ts /О (иИ =. y,() 1.66 (0.69, 4.01) . 1.71 (0.66, 4.43) .
Case-case y!(и _ 1.66 (0.69, 4.01) 1.71 (0.63; 4.66)
$Adjusted tir age using iogislic regression tir the case-case approach, and potychotomous logistic regression for tie case control approach 6, = value positive; 02 = value negative. .
206

Methodological issues in the use of tumour markers
H+E'
_ о о 1 IHC -'-'-.,-'. —
mRNA
In situ — . .
СAS -200 Image analysis Protein WB NB
Epidemiological studies: risk factors
о _
DNA
SB NT RFLP PCR Sequencing
Clinical studies: prognostic factors
Figure 1. Laboratory strategy for the use of tumour markers.
in this monograph, we will briefly review here issues related to the storage of tumour and normal tissues.
With the increasing demands for tumour tissue samples for biological, clinical оr epiderniological studies, tissue banking has become a very impor-tant practical issue (Lee et aI., 1995). Limited resources, untrained personnel and absence of uniform protocols for tumour tissue banking have created obstacles for the proper and rapid colec-tim, processing and storage of tumour tissues (Grizzle, 1994). In addition, lack of information on diagnostic quality control, histological classifica-tion (stage and grade), treatment and outcome may further jeopardize the optimal usage of nor-mal and tumour samples in cancer research.
There is a rapidly increasing ability to evaluate a range of tumour markers iп formalln-fixed, paraf-fin-embedded tissues, such as p53 nuclear protein accumulation measured by immunohistochem-istry (IHC) (Sarkis etal., 1993а, 1993b, 1994, 1995)
as well as Т1'53 point mutations measured by PСR-SSCP and sequencing techniques (Taylor et al., 1996). The development of assays that can use DNA extracted from farmalin-fixed, paraffiri-embedded tissue will enhance molecular epidemi-ological investigation. There are some limitations associated with the use of fornalin-fixed, paraffin-embedded materials, mainly due to the fragmen-tation of DNA. Fresh or frozen samples are preferred, if available, for molecular assays at the DNA or RNA level. Since the storage of formalin-fixed, paraffin-embedded tissues is a standard procedure in medical centres or hospitals, we will focus iii discussion on the storage of frozen tissues.
In order to perform epidemiological studies and to share the specimen resource with other investi-gators in biological and clinical sciences, a central-ized programme for research specimen banking is needed in any large research medical centre, Biological specimens can be collected and evalu-ated for research suitability by trained personnel
207

0 24 45 72 96 120 144 168 192 218
Progression time (months)
Survival in T1 stage
m Ф
O ф И Ф m O d C O
â 0
0 2445 729t 1211144 r1
24 46 72 96 120 144 158 192 216
Progression time (months)
Progression time (months)
Survival in Tis stage
Survival in Ta stage
m Ф
o ф И Ф col O Q-C o
o a o o-
Ф 7 CO C o
Ô O_ o a
24 48 72 99 120 144 169 192 216
Application of Biomarkers in Cancer Epidemiology
Progression inTis stage Progression in Ta stage
Progression in Ti stage
Negative 15 patients 15 censored ---- Negatve 42 patients 37 censored --- Negative 33 palients 26 censored — Positive 15 patients 2 censored — Positive 12 patients 5 censored
Postive 44 patients 12 censored
Trek mark indicates last fellow up Tick rrrark indicates last follow up
Tick mark indicates lost tollcw up
-- Negative 18 patients 15 censored ---- Negative 42 patients 39 censored --Negative 33 palienls 30 censored — Positive 15 patients 10 censored — Positive 12 patients 9 censored
Posilive 44 patients 27 censored
Tick mark indicates 1aef fallow up Tick mark indicates last follow up
Tick mark indicates lsl follow up
a7 7 a)
C o
o Q o 0
24 46 72 96 120 144 106
Survival time (months) Survival time (months)
24 46 72 96 120 144 168 192 216
Survival time (months)
Ф
Cs C o
O d o o-
Figure 2. p53 overexpression and prognosis of superficial bladder cancer.
(nurses, technicians and pathologists) and can be distributed among investigators. The materials can be collected and prepared to suit the individual requirements of investigators, and collection and distribution can be centrally documented. The programme can relieve investigators of the burden, in terms of both time and cost, of procuring and preparing a specimen on each occasion- The pro-gramme needs to have an effective quality control system in order to evaluate all tissue specimens, assuring investigators of properly diagnosed research material.
At Memorial Sloan Kettering Cancer Center, the tumour banking programme assumes the respon-sibility of delivering all routine specimens from the operating rooms to pathologists on a regular schedule. This ensures that specimens available for research are as fresh as possible. Pathologists are responsible for determining whether diagnostic requirements have been satisfied before giving the portion of the residual tissue for banking. The specimen is then transferred in an iced specimen container. Normal and tumour tissues are stored in plastic cassettes labelled with a coded number to
208

Methodological issues in the use of tumour markers
protect patients' confidentiality. The tissue is embedded in frozen section support media (OCT) and stored at -70°C. A clinical abstract of the patient's history with an accompanying pathology report wil be provided for each specimen only if IRB approval has been obtained to conduct such a study. In general, patients will be informed of the ongoing protocol and sign a informed consent form. A data management system needs to be implemented and a relational database system needs to be established so that tissue bank data-base can be linked to pathological, epidemiological and clinical data.
Laboratory strategy for the use of tumour markers A protocol for immunohistochernistry and for genetic analysis of formalin-fixed, paraffin-embedded tissues has kindly been provided by Drs William Bennett and Curtis C. Harris, NCI Laboratory of Human Carcinogenesis (see Appendix). A strategy has been suggested (Cordon-Cando et al., 1994) whereby, from a single tissue sample, different techniques can be performed to examine irnmuno-phenotype and genotype. This strategy is i11us trated in Fig. 1. Briefly, using consecutive tissue sections cut at different thicknesses and deposited either on microslides or microtubes, one can: (1) evaluate morphology (i.e. haematoxylin and eosin (H&E) staining), (2) perform inimunohistochem-istry procedures, and (3) characterize molecular alterations (i.e. Soufihern blot, restriction fragment length polymorphism (RFLP), and PCR-ssCP and sequencing). Antigen expression and/or its modu-lation can be analysed by immunohistochemistry on tumour tissue samples. Finally, specimen iden-tification can provide the correlation of laboratory data with epidemiological, pathological and clini-cal follow-up data (Fig, 1).
Issues concerning the use of tumour markers in prognostic studies The study of the prognostic value of tumour mark-ers raises several special issues concerning subject selection and adjustment for other known prog-nostic factors such as stage and grade of the disease. For example, study populations should usually be limited to incident cases diagnosed within a year in order to reduce selection bias from differential survival. Known prognostic factors such as age,
sex, grade, stage and treatment need to be con-trolled in the data analysis when assessing the effect of a tumour marker.
We have conducted a series of studies to evaluate the association betweeпр53 nuclear overexpression and progression/survival in a group of patients with superficial bladder cancer. p53 nuclear over-expression was evaluated in tumours of 164 patients (T1= 77, Ta =54 and Tis = 33) with superficial blad-der cancer by immunohistochemistry using the mouse monoclonal antibody РАЙ 1801 on deparaf-finized tissue sections. Antibody 1801 detects both wild-type and mutant p53 proteins. Due to the pro-longed half-life of the mutated p53 products, they accumulate in the nucleus and can usually be detected by immunohistochemical assays. We studied 42 primary bladder tumour tissues to esti-mate the sensitivity of immunohisto chemical (IHC) methods in the prediction of ТР53 muta-tions (Coidon-Cardo et al., 1994). We found that the highest sensitivity was reached when the cut-off (in terms of percentage of cells with nuclear immunoreactivity) was 20%, and so we have emp-loyed 20% as the cut-off point for IHC results in our analysis. The data were first correlated with conventional prognostic parameters, including stage, grade, vascular invasion, age and sex. Vari-ous univariate and multivariate analyses were performed. In the study, none of the normal urothelial and stromal cells showed p53 nuclear overexpression. Patients with bladder tumours were stratified into two groups according to the percentage of cells with nuclear immunoreactivity. Ninety-three patients (56.7%) had none or less than 20% tumour cells with positive nuclear stain-ing (group A), while the remaining 71(43.3%) had moie than 20% tumour cells with nuclear im-munoreactivity (group B). separate analyses of pro-gression and survival were performed for the three stages of superficial bladder cancer (Tis, Ta, Ti) after adjusting for age, sex, grade, vascular invasion and adjuvant therapy. Patients in group B had consis-tent significantly lower progression-free intervals and survival (Р < 0.001) at all three stages (Fig. 2). These results suggest that superficial bladder can-cers exhibiting p53 nuclear overexpression have a higher rate of disease progression and short sur-vival, and may be useful in selecting appropriate therapy (Sarkis et al., 1993а, 1993b, 1994, 1995).
209

Application of 8iomarkers in Cancer Epidemiology
Appendix. Histology protocol: paraffin sections for immunohistochemical and genetic analyses
1. Background: genetic .analysis of archival human tissues Access to archival human tissues provides many opportuni-ties for both prospective and retrospective studies. Informative assays based on immunohistochemistry and PCR technology are available. Specialized protocols are needed for these studies, and essential elements include confidentiality, proper selection of adhesive coatings and precautions for tissue carry-over in PCR-based studies.
2. Tissue specifications The optimal tissue sample is a paraffin block containing at least 1 cm2 of tissue, including both tumour and non-tumour
tissue. The non-tumour tissue is used for an internal nega-tive control and for germline analysis. Five-micron sections are used for immunochemistry, and 20-micron sections for microdissection of non-necrotic tissues for genetic analysis.
3. Glass slide specifications: silanation and DEPC treatment Glass slides must be coated to promote tissue adherence, otherwise tissue sections will be lost during multiple wash-ings and incubations of thé immunochemistry protocol. Several coating agents are commonly used, including poly-L-Iysine, glue, silane and others; non-biological prepa-rations (i.e. silane) are less commonly contaminated with DNase or 'Nase than poly-L-lysine and represent a better choice for PCR-based studies. In addition, RNAse precau-tions must be used for sections глtепдёд for microdissection, essential elements include DEPC treatment and baking to inactivate RNase and DNase. Specifications and protocols are listed below: . .
i. Coated or charged slides. Either commercial or locally prepared slides will be used. Commercially coated slides are available, specify RNase-free. ii. DEPC treatment protocol. To destroy any RNase or DNase attached to the glass slides, load the slides into a metal rack and place in water containing 0.1 % DEPC
• (diethyl procarbonate) for 15-30 min; wrap the entire rack in aluminum foil. and bake at 1В0°С for at least 2 h. Cool to room temperature and store wrapped in foil at room température indefinitely. Caution: DEPC is a potent protein denaturant and is a suspected carcinogen; it should be handled with care. Wear gloves and safety glasses and work in a chemical
fume hood. Point the bottle away from you when opening; internal pressure can lead to splattering.
4. Paraffin section guidelines: RNAse precautions
L Gloves are worn during microtomy. ii. Disposable blades are used and replaced between blocks. iii. The block holder is cleaned with xyfene between blocks. iv. DEPC-treated water is used in the tissue flotation bath. v. Coated slides (i.e. silane or similar) are prepared with sterile DEPC water and handled only with gloved hands. vi. Cut 25 sections from each block according to the following specifications. Section nos 1-16 must be 5 microns thick: nos 1 and 16 are stained by haematoxylin and eosin (H&E), nos 2-15 must be unstained. Section nos 17-25 must Ьé 20 microns thick and unstained; put two 20-micron-thick sections 0f each slide. Coated slides and DEPC water must be used for all sections. For small tissues, cut only 5-micron sections and place two 5-micron-thick sections on slide nos 17-25. vii. If the tissue is exhausted during sectioning, make an H&E stain of the last (or close to last) section. viii. Bake sections at no more than 60°C for no more than 2 h.
ix. Each slide will be labelled with the block number from the paraffin block, the sequential number of the section (i.e. 1-25) and the section thickness (i.e.5 or 20 microns).
5.TrouЫe-shooting guide for using this protocol It is advisable to test the sections produced by a laboratory
using this protocol. A common problem is that tissue sec-tions fall off the slide during microwave antigen-retrieval procedures. Usually this is caused by inadequate or improper silanation of sections, although some tissues are more likely than others to fall off the slides (i.e. tissues con-taining fat or bone). Therefore, investigators are encour-aged to send slides from the first 10-20 cases to a histol-ogy laboratory, and to request a routine immunostain (i.e. p53 or Kî67) using 30 min of microwave antigen retrieval (this is the longest interval commonly used). if tissue sec-tions fall off the slides, then ask the laboratory to remake their silane solutions and re-check their protocol, and then repeat the pilot imrnunostairw until the problem is resolved.
210

Methodological issues in the use of tumour markers
Acknowledgements The research was supported in part by grants E5-06718 from the National Institute of Environmental Health Services and СА-47538 from the National Cancer Institute, National Institute of Health, Department of Health and Human Services. We are grateful to Drs Colin B. Begg, Barbara S. Hulka, H. Yamasaki and Anthony J. McMichael for their critical review, helpful com-ments and suggestions, and to Ms Ming Sun for her technical assistance. .
References Begg, C.B. & Zhang, Z.F. (1994) Statistical analysis if molecular epidemiology studies employing case-series. Cancer Fpirfernioi. Biomarkers Prev., 3, 173-175
Brash, D.E., Rudolph, J.A., Simon, J.A., Lin, A., McKenna, G.J., Bodes, H.P. Halperin, A.J. & Ponten, J. (1991) A role for sunlight in skin cancer: UV-induced p53 mutations in squamous cell carcinoma. Proc. Nat1 Acad. Sri., 88, 10 124-10 128
Bressac, B., Kew, M., Wands, J. & Ozlurk, M. (1991) Selective G to T mutations of p53 gene in hepatoce11ular carcinoma from southern Africa. Nature, 350, 429-431
Chu, II. (1987) Biochemical markers for human cancer. In: Seifert, G. cd., Morphological Tumor Markers, New York, springer-Verlag, pp. 19-46
Cordon-Cando, C., Dalbagni, G., Saez, G.Т., Oliva, M.R., Zhang, Z.F., Rosai, J., Reuter, V.E. & Pellicer, A. (1994) p53 mutations in human bladder cancer: genotypic versus phenotypic patterns. lot. J. Cancer, 56, 347-353
Dubin, N. & Pasternak, B.S. (1986) Risk assessment for case-control analysis by polychotamous logistic regres-sion. Am. J. EpidemioL, 123, 1101-1117
Fagioli, F., Cuneo, A., Piva, N., Carl!, M.G., Previati, R., Balboni, M., Tomasi, P, Cariani, D., Scapoli, Г. & Castoldi, G. (1992) Distinct cytogenetic and clinico-pathologic features in acute myeloid leukemia after occu-pational exposure to pesticides and organic solvents. Cancer, 70, 77-85
Field, J.K., Spandidos, D.A., Malliri, A., Gosney, J.R., Yiagnisis, M. & ste11, P.M. (1991) Elevated P53 expression correlates with a history of heavy smoking in squamous cell carcinoma of the head and neck. Br. J. Cancer, 64, 573-577
Freedman, A.N., Michalek, A.M., Marshall, J.R., Mettin, C.J., Petrelli, N., Black, J., Zhang, Z.F., 5atchidanand, S.K.S. & Asirwatham, J.E. (1996a) The relationship between smoking and p53 overexpression in colorectal cancer. Br. J. Cancer, 73, 902-908
Freedman, A.N., Michalek, A.M., Marshall, J.R., Mettlin,
C.J., Petreili, N., Black, J., Zhang, Z.F., Satchidanand, S.K.S. & Asirwatham, J.Е. (1996b) Familial and nutri-tional risk factors for p53 overexpression in colorectal cancer. Cancer EpidemioL Bioniarkers Fret., 5, 285-291
Golomb, H.M., Alimena, G., Rowley, J.D„ Vardiman, J.W., Testa, J.R. & Sovik, C. (1982) Correlation of occu-pation and karyotype in adults with acute nonlympho-cytic leukemia. Blood, 60, 404-411
Grizzle, W.E. (1994) Tissue resources in the detection and evaluation of markers. In: Srivastava, s., Lippman, S.M., Hong, W.K. & Mulshine, J.L., cris, Early Detection of Cancer: Molecular Markers, Armonk, NY, Futura Publishing Company, Inc., pp. 9-76
Harris, C.C. (1993) p53: At the crossтoads of molecular carcinogenesis and risk assessment. Science 262,
1980-1981
Harris, C.C. & Hollstein, M.C. (1993) Clinical implica-tions of the p53 tumor-suppressor gene. N. J. EпgI. Med., 329,1318-1327
Hollstein, M.C., Pen, L., Mandard, A.M., Welsh, J.A., Montesano, R., Metcalf, А.А., Bak, M. & Harris, C.C. (1991а) Genetic analysis of human esophageal tumors from two high incidence geographic areas: frequent p53 base substitutions and absence of ras mutations. Cancer Res., 51, 4102-4106
Hollstein, M., Sidrarlsky, D., Vogelstein, B. & Harris, C.C. (1991b) p53 mutations in human cancers. Science, 253, 49-53
Houldsworth, J. & Chaganti, R.S. (1994) Comparative genomic hybridization: an overview [comment). Am. J. PathoL, 145, 1253-1260
Hsu, I.C., Metcalf, R.A., Sun, T., Welsh, J.А., Wang, N.J. & Harris, C.C. (1991) Mutational hotspot in the p53 gene in human heptocellular carcinoma. Nature, 350, 427-428
Hulka, B.S. & Garrett, P (1996) Influence of biomarkers on the design, methods, and interpretation of epidemi-ologic studies. J. Toxicol. Environ. Health, 40, 389
Hulka, B.S. & Margolin, B.H. (1992) Methodological issues in epidecoiologic studies using biologic markers. Am. J. EpidemioL, 135, 200-209
Johansson, B., Mertens, F., Heim, 5., Kristoffersson, U. & Mitelman, F. (1991) Cytogenetics of secondary myelodysplasia (sMDS) and acute nonlymphocytic leukemia (sANLL). Eur. J. Haernatol., 47, 17-27
Jones, RA., Buckley, J.D., Henderson, B.E., Ross, R.K. & Pike, M.C. (1991) From gene to carcinogen: a rapidly evolving field in molecular epidemiology. Cancer Res., 51, 3617-3620
Kallioniemi, 0.R, Ka1lioniemi, A., Sudar, D., Rutovitz, D., Gray, J. W., Waldman, F. & Pinkel, D. (1993) Comparative
211

Application of Biomarkers in Cancer Epidemiology
genomic hybridization: a rapid new method for detect-ing and mapping DNA amplification in tumors. 5ет[пars Cancer BioL, 4, 41-46
Kallioniemi, O.P., Kallioniemi, A., Piper, J., Isola, J., Waldman, F.M., Gray, J.W. & Pinkel, D. (1994) Optimizing comparative genomic hybridization for analysis of DNA sequence copy number changes in solid tumors. Genes, Chromosomes & Cancer, 10, 231-243
Klavins, J.V. (1989) Search for specific tumor markers. In; Ting, S.W., Chen, J.S. & Schwartz, М.K., eds, Human Tumor Markers. New York, Elsevier. pp. 101-104
kondo, K., Umemoto, A., Akimoto, S., Oyama, T., Hayashi, K,, Ohzishi, Y. & linden, У. (1992) Mutations in the P53 tumor suppressor gene in primary lung can-cer in Japan. Biochem. Biophys. Res. Commun., 183, 1139-1146
Kramer, B.S. & Srivastava, S. (1994) Molecular biology in lung cancer prevention: from the bench to the bedside. In: Srivastava, 5., Lippman, S.M., Hong, W.K. & Mulshine, J.L., eds, Early Detection of Cancer, Molecular Markers, Armonk, NY Futura Publishing Company, Inc., pp. 1-12
Kreyberg, L. (1937) Lungecancer. Discussion (Norw.) Detnorske medidnske Selskab. Norske Mag. f. Lagev, 98, 36-41
Kreyberg, L. (1952) One hundred consecutive primary epithelial lung tumors. Br. J. Cancer, 6, 112-119
Kreyberg, L. (1954) The significance of histological typ-ing in the study of the epidemiology of primary epithe-lial lung tumors. A study of 466 cases. Br. J. Cancer, 8, 199--208
Lee, L.W., Griffith, J., Zenick, H. & Hulka, B.S. (1995) Human tissue monitoring arid specimen banking: oppor-tunities for exposure assessment, risk assessment, and epidemiologic research. Environ. Health Perspect., 103 (Suppl. 3), 3-8
McClay, E.F. (1989) F.pidemioiogy of bone and soft tissue sarcomas. Sетиoars m сii., 16, 264-272
Mitelman, F., Nilsson, P.G., Brandt, L., Alimena, G., Gastakil, R. & Dallapiccola, B. (1981) Chromosome pat-tern, occupation, and clinical features in patients with acute nonlymphocytic leukemia. Cancer Genet. Cytogenet., 4, 197-214
Mitelman, F., Nilsson, P.G. & Brandt, L. (1984) Fourth International Workshop on Chromosomes in Leukemia 1982: Correlation of karyotype and occupational expo-sure to potential mutagenicicarcinogenic agents in acute nonIymphocytic leukemia. Cancer Genet. Cytogenet,, 11, 326-331
Ozturk, M. (1991) p53 mutation in hepatoce11ular carci-noma after aflatoxin exposure. Lencef, 338, 1356-1359
Patti, D., Blanchi, S., 17ecar1i, A., Cipriani, F., Avellini, C., Cocci, P., Falci i, F., Puntoni, R., Russo, A. & Vindigni, C. (1992) A case-control study of cancers of the gastric car-dia in Italy. Br. JCancer, 65, 263-266
Piegorsch, W.W., Weinberg, C.R. & Tауlоr, J.А. (1994) Non-hierarchical logistic models and case-only design for assessing susceptibilty in population-based case-con-trol studies. Stat. Med., 13, 153-162
Rothman, N., Stewart, W.F. & Schulte, P.A. (1995) Incorporating biomarkers into cancer epidemiology: А matrix of biomarker and study design categories. Cancer Epidеmiы. Biomarkers Prey, 4, 301-311
Rowiey, J.D. (1983) Chromosome changes in leukemic cells as indicators of mutageeic exposures. In: Rowley, J.D. & Ultmann, J.E., eds, Chromosomes and Cancer, New York, Academic Press. pp. 139-157
Rowley, J.D. (1984) Biological implications of consistent chromosome rearrangements in leukemia and lyin-phoma. Cancer R es, 44, 3159-3168
Rowley, J.D., Golomb, H.M. & Vardiman, J.W. (1981) Nonrandom chromosome abnormalities in acute leukemia and dysmyelopoietic syndromes in patients with previously treated malignant disease. Blood, 58, 759-767
Sandier, D.P. & Collman, G.W. (1987) Cytogenetic and environmental factors in the etiology of the acute leukemia in adults. Am. J. Epidemiol., 126, 1017-1032
Sandler, D.P., Shore, D.L., Anderson, J.R., Davey, F.R., Arthur, D., Mayer, R.J., Silver, А.T., Weiss, R.B., Moore, J.O., Schiffer, C.A. et cl. (1993) Cigarette smoking and risk of acute leukemia: associations with morphology and cytogenetic abnormalities in bone marrow. J. Nat! Cancer Inst. 85, 1994-2003
Sarkis, A.S., Dalbagni, G., Cordon-Cardo, C., Zhang, Z.F., Sheinfeld, J., Fair, W.R., Herr, H.W. & Reuter, V.P. (1993a) Nuclear overexpression of p53 protein in transitional cell bladder carcinoma: a marker for disease progression. J. Nat! Cancer Inst., 85, 53-59
Sarkis, А.S., Zhang, Z.F., Cordon-Cardo, C., Melarned, J., Dalbagni, G., Sheinfeld, J., Fair, W.R., Herr, H.W. & Reuter, V.P. (1993Ь) P53 nuclear overexpression in Ta non-invasive papillary transitional cell carcinoma of the bladder. lof. J. licol., 3, 355-360
Sarkis, A.S., Dalbagni, G., Cordon-Cardo, C., Melamed, J., Zhang, Z.F., Sheinfeld, J., Fair, W.R. & Herr, H.W. (1994) Association of p53 nuclear overexpression and tumor progression in carcinoma in situ of the bladder. J. UroL, 152, 388.-392
Sarkis, As., Bajorin, D.P., Reuter, V.É., Herr, H.W., Netto, G., Zhang, Z.F., Schultz, RK., Cordori-Cardo, C. & Scher,
212

Methodological issues in the use of tumour markers
H.I. (1995) Prognostic value of p53 nuclear ovеrеxpres-siеn in patients with invasive bladder cancer treated with neoadjuvant MVAC. J. Clin. licol., 13, 1364-1390
Schwartz, M.K. (1989) Tumor markers in diagnosis aid screening. In: Ting, S.W., Chen, J.S. & Schwartz, M.K., eds, ionien Tumor Markers, New York, Elsevier, pp. 3-16
Sell, Ѕ. (1992) Cancer markers of the 1990s. In: Sell, S., ed., serological Cancer i'4агkегѕ, New Jersey, Humaria Press, pp. 1-17
Spruck, C.H.L, Rideout, W.M., O1umi, А К, Ohneseit, P.F., Yang, A.S., Tsai, Y.С., Nichols, kw., Horn, T., Hermann, G.G., Steven, K., Ross, P.K., Yu, M.C. & Jones, P.A. (1993) Distinct pattern of p53 mutations in bladder cancer: rela-tionship to tobacco usage. Cancer Res., 53, 1162-1166. (Erratum: Cancer Res. 1993, 53 (Supp1. 10), 2427)
Sturgeon, S.R., I-lartge, P., Silveгmaп, D.T., Kantor, A.F., Linehan, W.M., Lynch, C. & Hoover, A.N. (1994) Association between bladder cancer risk factors arid tumor stage and grade at diagnosis. Epidemiology, 5, 218-225
Suzuki, H., Takahashi, T., Kuroishi, T., suyama, M., Ariyoshi, Y. & Ueda, R. (1992) p53 mutations in non-small cell lung cancer in Japan: assodation between mutations and smoking. Cancer Res., 52, 734-736
Taylor, J.А. (1989) Oncogenes and their applications in epidemiologic studies. Am. J. Epidemiol., 130, 6-13
Taylor, J.А., Sandler, D.P., Bloomfield, C.D., Shore, D.L., Ball, E.D., Neubauer, A., McIntyre, O.R. & Liu, E. (1992) ras oncogene activation and occupational exposure in acute myeloid leukemia. J. Nat[ Cancer Inst., 84, 1626-1632
Taylor, J.A., Watson, M.A., Devereux, T.R., Michels, R Y., Saccomanno, G. & Anderson, M. (1994) p53 mutation hotspot in radon-associated lung cancer [see comments). Lancet, 343, 86-87
Taylor, J.A., Li, У., Не, M., Mason, T., Mettlin, C., Vogler, W.J., Maygarden, Ѕ. & Liu, E. (1996) p53 mutations in bladder tumors from arylamine-exposed workers. Cancer Res., 55, 294-298
Thompson, CT. & Gray, J.W. (1993) Cytogenedc profil-ing using fluorescence in situ hybridization (FISH) and comparative genomic hybridization (CGH). J. Cell. Biochem., 17G, 139-143
Vaughan, T.L., Davis, S., Kristal, A. & Thomas, D.B. (1995) Obesity, alcohol, and tobacco as risk factors for cancers of the esophagus and gastric cardia: adenocarci-noma versus squamous cell carcinoma. Cancer Epidemiol. Biomarkers Prey., 4, 85-92
Vineis, P. & Caporaso, N. (1995) Tobacco and cancer: epi-demiology and the laboratory. Environ, Health Perspect., 103, 156-160
Zhang, Z.F., Aprikian, A., Sarkis, A.S., Zeg, Z,S., Pollack, D. Cordon-Cardo, C., Fair, W.R. & Begg, C.В. (1994a) Factors associated with p53 accumulation in prostatic adenocarcinoma. Int. J. licol., 4, 897-901
Zhang, Z.F., Sarkis, A.S., Cordon-Cardo, C., Dalbagni, G., Melamed, J., Aprikian, A., Pollack, D., Sheinfeld, J., Hen, H.W., Fair, W.R., Reuter, V.E. & Begg, C.B. (1994b) Tobacco smoking, occupation, arid p53 nuclear overex-pression in early stage bladder cancer. Cancer Epidemiol.. Bromarkers Prev., 3, 19-24
Zhang, Z.F., karpeh, M.S., Lauwers, G.Y., Marrero, A.M., Роllасk, D., Cordon-Cardo, C. & Begg, C.B. (1995a) Risk factors and p53 nuclear overexpression in early stage intestinal-type adenocarcinoma of the stomach. Cancer Detection Prey., 19, 156-164
Zhang, Z.F., Zeng, Z.S., Sarkis, A.S., Klimstra, D.S., Charytonowicz, E., Guillem, J.G., Cordon-Cardo, C., Cohen, A.M. & Begg, C. (199 Sb) Family history of cancer, body weight and p53 nuclear over-expression in Duke's C colorectal cancer. Br. J. Cancer, 71, 888-893
Corresponding author Z.-B. Zhang Department of Epidemiology and Biostatistics, Memorial Sloan Kettering Cancer Center, 1275 York Avenue, Box 44, New York, NY 10021, USA
213

Application of Biomarkera i9 Cancer Epidemiology Toпiolo, P., BоFPetta, P. 5huker, D_E.G., Rolhmaп, N., HuIka, B. and Pearce, N., eds
IARC Reienhilic PuhlrcaIiorri No. 142 International Agency for Research cm Caesar, Lyon, 1997
Quality control of biomarker measurement in epidemiology D. Gompertz
The throughput and complexity of a biomarker assay will determine the amount of effort that can be expended on quality control and assurance. Clinical chemistry quality control procedures can be readily applied to simpler chemical analysis such as blood lead and cholesterol, but even complex cell-based biomarker techniques such as 'PRT mutation analysis and cytogenetics benefit from a formal quality control approach. Collaborative interlaboratory exercises are essential, especially when no certified reference material is available, and these can play a central role in the control of laboratory drift. Recommendations are made for the quality control of biomarker measurement based on clinical chemistry techniques. These include recommendations for coding samples so that the laboratory scientist is unaware of exposure status and for the use of formal laboratory protocols.
Incorporation of biomarker measurements into epidemiological studies can greatly increase their power and the strength of associations that are found. The measurement and control of error in such studies are largely the province of the epi-demiologist (White, this volume), however, the quality of the laboratory measurements remains the responsibility of the laboratory scientist pro-viding the biomarker test (Armstrong et al., 1992; Aitio & Apostoli, 1995). The importance of `transi-tional' studies in determining intra-individual and interindividrial variability and the factors affecting these has been stressed (Hulka, 1991; Schulte & Perera, this volume) but the role of laboratory quality control in minimizing laboratory error needs to be emphasised. Failure to control labora-tory drift over time and a lack of comparability with other studies can cause major difficulties in interpretation and analysis in epidemiological studies dependent on biomarker measurements (Vineis etaL, 1993).
The range of biomarkers that might be incorpo-rated into an epidemiological study requires a vari-ety of techniques, extending from sophisticated analytical chemistry (atomic absorption spectrom-etry, isotope dilution mass spectrometry) to more biological methods dependent upon celt сиltите and niolecular biology techniques. The through-put and complexity of a method can vary from the ability to analyse 100 samples a day at a cost of a
few dollars per sample (e.g. blood lead measure-ments) to labour-intensive methods that cost over $1000/sample, with a batch of a dozen taking sev-eral days to process (e.g. dioxin and haemoglobin addict measurements). High-throughput auto-mated analytical techniques are more easily adapted to the quality control techniques that have been so effective in improving clinical chern-istry performance; however, low-capacity methods requiring cell culture and other biological ap-proaches are more difficult to control in this way. Quality control procedures developed for the high-throughput methods clearly will not be directly applicable to the more biological assays. There are; howevеr, lessors that can be learnt from the clinical chemistry approach to quality control and assur-ance that are applicable to all assays, and specific recommendations can be made for biomarker mea-surements being used in epidemiological studies. In this paper, a general approach to laboratory quality control and assurance is described, followed by examples taken across the range of biomarkers available, i.e. blood lead, serum cholesterol, dioxin, haemoglobin adducts, Э2Р-рostlabelling, HPRT mutation assays and cytogenetic scoring.
As clinical chemistry developed, the precision of an assay was monitored during an analytical run by observing the repeatability of duplicate measurements and the repeatability of quality con-trol standards analysed throughout the run. (For
215

Application of Bbmarkers in Cancer Epidemiology
definitions of agreed terms used in laboratory qual-ity assurance programmes, see Aitio & Apostoli, 1995). Day-to-day reproducibility was assessed by repeated analysis of the quality control samples and, at times, carry-over samples from a previous batch. Numerous texts have been written explain-11g these techniques of quality control (Whitehead, 1977; Aitio & Apostoli, 1995) and the statistical approaches towards managing quality control data, including statistical rules for the acceptability of quality control results (Westgard et г1., 1981). These statistical approaches have been used to establish the amount of effort required to monitor precision throughout a batch, i.e. the number of quality control replicates that are needed. This number depends on the length of a run that can be expected without significant drift, and as automated clinical chemistry instruments become more sophisticated, less attention to within-run drift is required. Some analyses such as Ыоод lead measurement (see below) still require frequent quality control samples to allow for changing instrumental conditions. Strict protocols and automatic data handling can ensure tight con-trit of day-to-day quality performance. Assay per-formance can be compared with similar assays using coefficients of variation (CV) (within and between batches); these are measures of analytical performance and do riot reflect intra-individual or interindividual variation.
These quality control techniques can demon-strate control of 'imprecision (reproducibility) within any batch of samples and on a day-to-day basis, but do not give any indication of the `true-ness' (or accuracy) of the result. This can only be obtained by reference to 'definitive' or 'reference' methods or by use of certified reference material (Aitio & Apostol1, 1995). However, for newer assays and more biological assays, such materials and methods are unlikely to be available arid the only approach available to the laboratory scientist is to establish comparability with other laboratories. Interlaboratory assessment exercises have played a central role in establishing the performance of the different analytical methods described below, and for some analyses there are ongoing interlabora-tory quality assurance schemes on a national or international level.
Cross-sectional epidemiological studies may, in practice, take considerable time to perform and thus
longitudinal control of laboratory performance can be as important as in cohort studies involving multiple measurements on an individual at differ-ent time periods. The control of long-term labora-tory drift is a complex issue (Broughton et al., 1986). A simple approach is to establish a pool of quality control samples at the outset, but the use-fulness of this approach depends on the Iong-tеrт stability of these samples; it may be difficult to dis-tinguish between laboratory drift and gradual dete-rioration of quality control material. The number of quality control analyses performed over the course of a study may not necessarily be large enough to establish statistically the extent of laboratory drift (Broughton et aI., 1986). However, the regular participation in interlaboratory quality assurance exercises combined with the use of in-house drift controls will give the laboratory scientist and the collaborating epidemiologists some reassurance.
There are special problems associated with longer-term epidemiological studies, during which there may be advances in analytical techniques or changes in instrumentation, reagents or scientific staff. It is the responsibility of the analyst, when change 1s foreseeable, to establish the comparability of the old and new techniques in terms of sensitiv-ity (analytical), precision and bias. Over the short term, new and old methods should be run in paral-lel using the same pool of quality control material or samples. Methods that depend on visual scoring (colonies, chromosomal aberrations) may require considerable training and inter-reader comparison periods to ensure that changing the technician does not produce significant shifts in background от sen-sitivity. Interlaboratory comparisons before and after any change are desirable to ensure that any change in bias not detected by in-house control methods is found and documented. There is evi-dence from a number of fields that long-terms labo-ratory performance is best ensured by adherence to an agreed and detailed protocol and to the rule that individual analysts are not permitted to make mod-ifications without an assessment of the likely effects on the performance characteristics of the assay. There is always the temptation for an originator of a new assay to incorporate improvements as experi-ence is gained, but this can cause major difficulties during a study and its analysis.
In clinical laboratory science, it is accepted that quality assurance extends beyond analytical quality
216

Quality control of biomarker measurement in epidemiology
control to selection of sampling materials (syringes, tubes), maintaining sample integrity during transport and before analysis, control of contami-nation, sample handing and documentation. Quality control of this pre-analytical phase can be monitored by the field survey staff submitting duplicate 'blind' samples from the same individ-ual. It is now generally accepted that all 'exposed' and `control samples from epidemiological studies should be coded and analysed without the labora-tory scientist knowing their status. It is the point responsibility of the epidemiologist and the labo-ratory scientist to establish a coding system that is effective and allows reliable tracking of a sample from receipt to reporting.
Protocols for the collection and documentation of samples should be agreed between the labora-tory scientist and epidemiologist. The timing of the sample in relation to recent exposures may be critical for environmental contaminants with short elimination half-lives and should be agreed as the protocol is developed, but it should always be recorded. Similarly the time between collection and storage should be known. The number and origin of each batch of sample containers and a selection from each batch should be kept for future reference; this is especially important if there is the possibility of contamination of the containers before use.
Lead Blood lead is an example of a biomarker analysis that has been used successfully in the workplace for research and regulation and in population studies. The analysis can use automated sampling equip-ment and has a reasonable throughput (50-100 samples/day), and so classical clinical chemistry quality control and assurance techniques can be used. Intra-batch precision (a typical CV of 3-5%) is usually monitored by duplicate analysis of al the samples with quality control material analysed after every six to eight actual samples. Inter-laboratory quality assurance exercises are essential for maintaining laboratory performance. In the United Kingdom (UK) scheme, a blind 'spiked' sample is sent to contributing laboratories every 2 weeks for analysis. Performance is assessed in comparison with the mean result from the 100+ UK and overseas participants ('consensus mean'). Earlier studies have shown that this consensus
mean is a good reflection of the actual amount of lead present as measured by a definitive method such as isotope dilution analysis (Bullock et aI., 1986). Stability of quality control material on long-term storage and the continuing availability of interlaboratory comparison has enabled long-term studies (10+ years) of the effect of environmental change on population blood lead levels in the UK to be performed (Delves et aI., 1996).
Blood lead is a well-established biomarker; the analytical methods and their quality control have matured over the last decade and so lead can be used as a model for other toxic metal analyses and, to a great extent, for other chemical contaminants.
Cholesterol Serum cholesterol measurement is one of the usual range of analyses offered by clinical chemistry lab-oratories with a possible throughput of hundreds of samples per day. It is also part of the lipid bio-marker profile that is used in the epidemiology of cardiovascular disease. It is probably this latter use that has been responsible for the attention that has been paid to the control of this measurement on both a short- and long-term basis. In the USA, detailed recommendations have been produced for the measurement of total cholesterol in blood [National Cholesterol Education Program (NCEP), 1988]. More recently Westgard et al. (1991) have shown, for these recommendations, the number of control measurements per run required and the analytical coefficient of variation and bias that are needed to produce a laboratory performance deemed acceptable in practice, i.e. an intralabora-tory CV of less than 3%. More recently, Bachorik et aI. (1995) have produced for NCEP recommenda-tions and criteria of analytical performance for measurements of low-density lipoprotein (LDL) cholesterol. These authors discussed the problems of maintaining linkage with existing epidemiolog-ical data as newer laboratory methods evolve. They recommended that the most prudent course at that time was to continue to measure LDL-choles-terol by methods similar to those used to establish the epidemiological database on which the rela-tionships between cardiovascular risk and LDL-cholesterol had been established.
In longer-term epidemiological studies, during which there may be considerable changes in pop-ulation mean levels of the biomarker of interest, it
217

Application of 8iomarkers in Cancer Epidemiology
is important that laboratory drift is identified and controlled. Internal quality control procedures are not necessarily able to detect such drift and some external source of comparison is required. 5taпdard reference sera are available for cholesterol analyses but the availability of a regular proficiency testing scheme, such as the National External Quality Assessment Scheme (NÉQАS) in the UK, has the advantage that any laboratory is able to compare its performance with a number of others. For serum cholesterol, the current interlaboratory coefficient of variation in this scheme is typically 3.8% (n 438).
Although cholesterol measurements are used on a daily basis in a clinical setting and in population screening programmes, as well as in large-scale cohort studies, the maintenance of accuracy and precision over a long period still presents difficul-ties, and considerable care is required to monitor performance using ongoing internal laboratory quality control procedures, external reference material, stored sample pools and external quality assurance schemes (Broughton et a1.,1986).
Dioxins Polychlorinated diberizodioxins (PCDDs) and dibenzofurans (PCDFs) occur as complex mixtures in ultra-trace (picogram) amounts in biological flu-ids, but in recent years the development of highly sensitive high-resolution gas-chromatography mass spectrometry has allowed them to be quanti-tated. The methods for measurement involve effec-tive sample clean-up and extraction techniques, are labour intensive and do not have a high throughput (Rappe et al., 1991). The considerable progress that has been made to ensure good qual-ity control of these measurements has depended on the development of detailed in-house protocols (Patterson et "L, 1991), the use of certified refer-ence materials (Rymen, 1994) and interlaboratory proficiency testing exercises (Yrjanheikki, 1989; Stephens et "L, 1992).
An extensive and impressive interlaboratory exercise was initiated by WHO Europe in 1989 (Stephens et at, 1992). In this study three samples each of human breast milk and blood were sent to 19 participating laboratories from 14 countries. Two of the three samples were spiked with known amounts of PCDDs and PCDFs; the third remained unspiked. None of the laboratories knew the iden-
tity of the individual samples. The study design resulted in approximately 4000 individual pieces of PCDD/PCDF data being generated by a variety of analytical methods and by laboratories of dif-fering experience. A number of statistical analyses of the data were performed. The simplest was the comparison of coefficients of variation for intra-laboratory and interlaboratory variability. Eleven out of 16 laboratories produced similar values for the various ana1ytes in milk, with average intra-laboratory CVs of 20-30%. Nine of 15 laboratories produced data for blood with average intralabora-tory CVs less than 30%. Several approaches were used to identify the principal determinants of the quality of data produced. The results showed that the experience of the laboratory was of more importance than the actual method or sophistica-tion of the instrumentation used. The authors con-cluded that laboratories that had well established quality assurance programmes, which were fol-lowed carefully, produced superior results.
The results from this study show that even these complex and demanding assays with low through-put can be subjected to formal quality assurance procedures and they also show the importance of interlaboratory comparison exercises and high quality reference material in obtaining and main-taining consistent results.
Carcinogen-protein adducts Protein adducts reflect the dose of an active meta-bolite of the carcinogen produced in a target tissue and are thus useful surrogates for the shorter-lived equivalent DNA species (Skipper & Tannenbaum, 1990; Wild & Pisani, this volume). Carcinogen-protein adducts have been described for ethylene oxide, benzo[a]pyrene, 4-aminobiphenyl and afla-toxin B~, among others. There has been little inter-laboratory effort to document analytical perfor-mance, although the technology (high-resolution gas-chromatography mass spectrometry) is similar to that used for dioxin analysis.
An interlaboratory study has been organised to investigate performance in the measurement of N-(2-hydroxyеthyl)valine in human gloЫп, a haemoglobin adduct biomarker of ethylene oxide exposure (Tёrngvist et "L, 1992). Iп this study, samples of globin from eight individuals were sent to four laboratories in different countries. The results varied from laboratory.to laboratory, and up
218

Quality control of biomarker measurement in epidemiology
to 10-fold in extent for some samples. Some, but not all, of the differences were shown to be the result of different internal standards. However, it appeared that, although the absolute measures could not be relied upon, the ranking of the sam-ples was reasonably consistent.
This interlaboratory study contrasts with the dioxin study reported in the same year by Stephens et aI. (1992). Dioxin estimations were much more well established, lessons had been learnt from pre-vious round-robin exercises and standard material was becoming available. This adduct study illus-trates the problem of establishing interlaboratory studies for new assays when there are only a lim-ited number of laboratories involved worldwide and when it is difficult to produce standards of adequate quality and in reasonable quantity. However, important lessons were learnt from the study, including the lack of suitability of this bio-marker at that time for large-scale epidemiology without considerably more development.
32Р-postlabенing for DNA adduct analysis Current 32Р-postlabеlling techniques for the detec-tion and quantitation of the adducts of carcino-genic compounds with DNA have great sensitivity, being able to detect one bеnzо~я]pуrenediol ерох-ide residue per 10 nucleotides. Although this assay is still in its early stages of development, it has already shown its usefulness in studying exposure to environmental and occupational pollutants (Perera et al., 1992; Nielsen et al., 1996). The assay is complex, with extraction, digestion, labelling, chromatography and counting stages, and indi vidual laboratories have developed their own vari-ants. This complexity and the amount of 3гР required per assay limits the throughput possible and thus the ability to incorporate a number of quality control samples in any batch.
An interlaboratory trial has been performed involving 15 laboratories in eight countries to determine the extent of reproducibility of the assay as it was then being performed (Phillips & Castegnaro, 1993). The laboratories were sent four samples of extracted DNA—two were mouse DNA after in-vivo treatment with polycyclic aromatic carcinogens, one sample was from lung tissue of a smoker and one was a control sample. The partici-pants were asked details of their individual proto-cols. Three methods were used by the laboratories
and the between-laboratory coefficients of varia-tion ranged from 56-70% for the `standard' method to 65-98% for the butanol-enrichment method. These high coefficients of variation are not unusual in any laboratory discipline at the early stages of method development and may reflect the wide range of conditions employed at each stage by the different laboratories. It is also not totally clear whether the adducted samples were completely stable during transit to the partic-ipating laboratories. However, the results showed that there was a general qualitative agreement between the laboratories and they also showed the possibilities for improvement in interlaboratory precision. The importance of stable and relevant reference material is once again emphasized.
HPRT mutations in lymphocytes Considerable effort has been made by more expe-rienced laboratories to establish how HPRT muta-tional frequencies vary from day to day in the same individual, between individuals and between laboratories and with different assay techniques (Cole & skopek, 1994; Robinson et al., 1994). Thus these laboratories have established much of the 'transitional' information required when deciding how to use this end-point in an epidemiological study, especially the extent of intra-individual and interindividual variability in control and exposed groups.
Two laboratories (Universities of Vermont and Sussex; see Cole & 5kopek, 1994) have compared split and repeat samples from the same individual. These laboratories found similar mutation fre-quencies although there were differences in exper-imental téchпiques. Both found that the observed mutant frequency for any indiviдиal donor may vary considerably between experimental determina-tions (two- to eightfold). It may be that differences in laboratory protocols are of less importance than each laboratory establishing and keeping to a well defined protocol throughout a study. Robinson et al. (1994) compared data sets from four laborato-ries and reported protocol variations, some of which may contribute to interlaboratory variation. The examples of protocol variation that might be important were: preincubation of the mononuclear cells in the presence of mitogen before cloning, media, serum, inteтleukin-2 (IL-2) source and concentration, type of feeder cells and irradiation
219

Application of Biomarkers in Cancer Epidemiology
level, cell density per well, 6-thioguanine concen-tration, and technique and level of experience of each laboratory worker. The routine splitting of blood samples or performing a larger experiment also varied between laboratories and was clearly an important decision to make.
Quality control of this assay is clearly difficult, as the throughput does not allow a large number of replicate samples for control purposes. The use of a strict protocol in any one laboratory is of impor-tance, as is the investigation of the performance of new batches of sera, biochemicals arid other con-sumables. Albertini and Hayes (this volume) emphasise that, for this, as for all culture systems, attention to reagents and conditidns is critical. The maintenance of a full computerised database giv-ing details of all the experimental variables (including the laboratory workers or combinations of laboratory workers involved, as well as media components such as serum batch) in addition to the raw data (plate counts) is particularly useful (1. Cole, personal communication). Albertini and Hayes (this volume) note that the ability to cryop-reserve the mononuclear cell fraction for subse-quent testing provides a control for intralaboratory drift and that such standards could become avail-able for interlaboratory comparisons.
Cytogenetics Although molecular methods for assessing cytoge-netic damage are advancing rapidly, chromosome aberration analysis has been used over the last 30 years as a biological measure of radiation exposure (Tucker et al., this volume). There have been sev-eral interlaboratory collaborative exercises com-paring radiation dose estimation by cytogenetic analysis. These have covered either the whole assay and analysis or just the scoring of aberrations. For example, Lloyd et a2. (1987) dispatched aliquots of whole irradiated blood to the participating labora-tories for culture and analysis, while Garcia et ai. (1995) sent unstained coded slides to their partici-pants.
All cell culture systems need close attention to be paid to reagents and culture conditions (Albertini & Hayes, this volume), and the mainte-nance of quality performance depends greatly on adherence to a well defined laboratory protocol. It 1s well established that the scoring must be of coded samples, with the scorer 'blinded' to the
exposure/control status. Experienced laboratories have routines for maintaining scoring standards and training new scorers. One such laboratory keeps a set of coded slides, which have been scored by experienced persons and show good agreement, to train recruits. This laboratory circulates coded slides amongst the experienced scorers and, in experiments, prepares replicate slides from the same culture for scoring by several people (D.C. Lloyd, personal communication).
Quality control of cytogenetic techniques involving cell culture and scoring stages presents different problems from the control of the analysis of a chemical biomarker. Three key recommenda-tions that can be made are as follows: (1) there should be development of a detailed laboratory protocol, (2) there should be a scoring policy which ensures that all slides are scored 'blind' and that consistency 1s maintained between different scorers by regular exchange of slides, and (3) where possible, comparisons with other laboratories should be established on a regular basis. As newer methods, such as the fluoresence in-situ hybridization (FISH) technique, are incorporated into population stud-ies, laboratory intercomparison exercises will be necessary to establish an external validity.
Discussion The examples described here show the consider-able efforts that laboratory scientists have made to control the intralaboratory and interlaboratory variability of their assay procedure. The quality control techniques used for the simpler and more routine chemical assays (lead and cholesterol) are reflected in low interlaboratory CVs and an increased confidence in their accuracy (trueness). As assay techniques become more sophisticated and more demanding, and as the end-points are more biological, quality control procedures are more difficult to incorporate. However, intralab-oratory and interlaboratory comparisons do give confidence that an assay is performing reliably and indicate the extent of its inherent variability.
A lesson that comes from these differing labo-ratory assays is that best performance is associated with the development of a written laboratory pro-tocol that includes appropriate control procedures. As assays are developed and are then used in tran-sitional studies, a stage occurs when the assay is sufficiently mature for it to be documented in such
220

Quality control of biomarker measurement in epidemiology
a manner. Once this has been achieved, deviations from an agreed protocol are not acceptable with-out formal investigation of the effects of change on precision and, where possible, accuracy. This discipline is essential for assays that need to be maintained throughout a prospective cohort study with ririnlmum laboratory drift.
The examples that have been discussed here come from a range of laboratory disciplines, but it is clear that they ail reflect the need for the analyst! scorer to be unaware of the status (exposed! control) of any sample or of the value assigned to material circulated in interlaboratory comparison studies. It may not be possible to disguise quality control material so that the laboratory scientist is unaware of its origin, but the submission of a limited number of codedreplicate samples, which are not identifiable as such, will supplement in-house quality control procedures.
The wide range of biomarkers that may be used in cancer epidemiology makes it difficult to pre-scribe rules for quality control and assurance in any detail. For some chemical assays, certified reference material is available, while for some of the more biological assays it is difficult to see how such material could be produced. An interlabora tory consensus can, however, often be agreed, using a pool of material, cryopreserved cells or at least pre-prepared slides. It is clear that, although the precision obtained by a laboratory may be good, any laboratory needs an external reference to give it confidence that its measures have a valid-ity and are not drifting over the period of a study.
Conclusions There are a number of conclusions that emerge from this review of quality control of biomarker assays:
1. For a range of biomarkers, laboratory perfor-mance depends on the use of an agreed written protocol that specifies details of reagents, sam-pling and analytical procedures, calibration and quality control methods. 2. Laboratories should take advantage of inter-laboratory comparison exercises, whether the assays are being newly developed or are mature assays in routine use. 3. The laboratory scientist should, as a general rule be unaware of the exposure/control status of the samples submitted.
4. Incorporation of a biomarker assay into an epidemiological investigation requires close col-laboration between the epidemiologist and the laboratory scientist, to take advantage of the techniques that are available for minimizing and documenting laboratory error.
Acknowledgements I thank those colleagues who have helped me to review quality assurance procedures in their specialist fields: Dr D. Bullock, Dr E. Bruner, Dr J. Cole, Dr H.T. Delves, Dr D.C. Lloyd, Dr D. 5huker, Dr J.R. Startin. 1 also thank the UK Department of the Environment for support during this study.
References Aitio, A. & Apostoli, P. (1995) Quality assurance in bio-marker measurement. Tozicol. Leif., 77, 195-204
Armstrong, B.К., White, E. & Sаracci, R. (1992) Principles of exposure measurement in epidemiology. Moпograрhs Ергдетiы. Biosiadst., 21, 257-258
Bachorik, P.S. & Ross, J.W., for the National Cholesterol Eduction Program Working group on Lipoprotein Measurement (1995) National cholesterol education pro-gram recommendations for measurement of low-density lipoprotein cholesterol: executive summary. Clin. Chem., 41, 1414-1420
Broughton, EM. G., Holder, R. & Ashby, D. (1986) Long-term trends in biochemical data obtained from two pop-ulation surveys. Ann. Clin. Biochem., 23, 474-486
Bullock, D.G., Smith, N.J. & Whitehead, Т.P. (1986) External quality assessment of assays of lead in blood. CIin. Chem., 32, 1884-1889
Cole, J. & Skopek, Т.E. (1994) Somatic mutant frequency, mutation rates and mutational spectra in the human population in vivo. Mutat. Res., 304, 33-105
Delves, H.T., Diaper, S.J., Oppert, 5., Prescott-Clarke, P., Periam,J., Dong, W., Colhoun, H. & Gompertz, D. (1996) Blood lead concentrations in United Kingdom have fallen substantially since 1984. Вт. Med. J., 313, 883-884
Garcia, О.F., Ramalho, A.T., Di Giorgio, M., Mit, S.S., Espinoza, M.E., Manzano, J., Nasazzi, N. & Lopez I. (1995) Intercomparison in cytogenetic dosimetry among five laboratories from Latin America. Mutai. Res., 327, 33-39
Hulka, B.S. (1991), Epidemiologic studies using biologi-cal markers: issues for epidemiologists. Cancer Fpidendoi. Biomarkers Prey., 1, 13-19
Lloyd., D.C., Edwards, A.А., Prosser, J.S., Вarjaktarovic, N., Brown, J.K., Horvat, D., lsmail, S.R., Koteles, G.J., Almassy, Z., Krepinsky, A., Kucerova, M., Littlefield, L.G.,
221

Application of Biomarkers in Cancer Epidemiology
Mukherjee, U., Natarajan, A.T. & Sasaki, M.S. (1987) A collaborative exercise on cytogenetic dosimetry for sim-ulated whole and partial body accidentai irradiation. Mataf. Res., 179, 197-208
National Cholesterol Education Program (1988) Current status of blood cholesterol measurement in clinical lab-oratories in the United States. Clin. Chem., 34, 193-201
Nielsen, P.S., de Pater, N. Okkels, H. & Autrup, H. (1996) Environmental air pollution and DNA adducts in Copenhagen bus drivers—effect of GSTM1 and NКг2 genotypes on adduct levels. Carcinogenesis, 17, 1021-1027
Patterson, D.G. Jr, Isaacs, S.G., Alexander, L.R., Turner, W.E., Hampton, L., Bernert, J.T. & Needham, L.L. (1991) Method 6: determination of specific polychlorinated dibenzo-p-dioxins and dibenzofurans iп blood and adi-pose tissue by isotope dilution-high resolution mass spectrometry. In: Rappe, C., Buses, H.R., Dodet, B. & O'Neill, LK., eds, EnviroпrпentаI Carcinogens, Methods of AпaIysis aid Exposure Measurement, Vol. 11, PoIy-chIoппated Dibenzodioxins and Dibenzo furaпs ('ARC Sсi-eпtific Publications No. 108), Lyon, 'ARC, pp. 299-342
Perera, F.P., Herninlrski, K., Gryzbowska, E., Motykiewicz, G., Michalska, J., Santella, R.M., Young, T.-L., Dickey, C., Brandt-Rauf, P., DeVivo, L, Blaner, W., Tsia, W.-Y. & Chorazy, M. (1992) Molecular and genetic damage in humans from environmental pollution in Poland. Nature, 360, 256-258
Phillips, D.H. & Castegnaro, M. (1993) Results of an interlaboratory trial of 32P-postlabelling. In: Phillips, D.H., Castegnaro, M. & Bartsch, H., eds, PostlabeIling Methods for Detection of DNA Adducts (IARC Scientific Publications No. 124), Lyon, ‚ARC, pp. 35-49
Rappe, C., Buser, H.R., Dodet, B. & O'Neill, Т.K., eds. (1991) Environmental Carcinogens, Methods o fAnalysis and Exposure Measurement, Vol. 11. Paiychiorinated Di еггzodioxins and Dibenzo furans (IARC Scientific Publications No. 108), Lyon, IARC
Robinson, D.R., Goodal, K., Albertini, R.J., O'Neill, J.P., Finette, B., Sala-Trepat, M., Moustacchi, E., Tates, А.D., Beare, D.M., Green, М.H.L. & Cole, J. (1994) An analysis of in vivo hrpt mutant frequency in circulating T-lym-phocytes in the normal human population: a compari-son of four data sets. Mutat. Res., 313, 227-247
Rymen, T., (1994) History of BCR work on dioxins. Fresenius J. Anal. Chem., 348, 9-22
Skipper, P.L. & Tannenbaum, s.R. (1990) Protein adducts in the molecular dosimetry of chemical carcinogens. Carcinogenesis, 11, 507-518
Stephens, R.D., Rappe, C., Hayward, D.G., Nygren, M., Startin, J., Esbo11, A., Carle, J. & Yrjanheikki, Е.J. (1992) World Health Organization international intercalibra-flou study on dioxins and furans in human milk and blood. Anal. Chem., 64, 3109-3117
Tbтngvist, M., Magnusson, A,-L., Farmer, P.B., Tang, Y.-S., Jeffrey, A.M., Wazneh, L., Beulink, G.D.T., van tier Waal, H. & van Sittert, N.J. (1992) Ring test for low levels of N-(2-hydroxyethyl)valine in human hemoglobin. Anal. Biochem., 203, 357-360
Vineis, P., Schulte, P.A. & Vogt, R.F., Jr (1993) Technical variability in laboratory data. Iп: Schulte, P.А. & Perera, F.P., eds, Molecular EpidemioIogy Prinсipies and Practices. San Diego, Academic Press
Westgard, J.O., Barry, P.L., Hunt, M.R. & Groth, T. (1981) A multi-rule Shewart chart for quality control iii clinical chemistry. Clin. Cher., 27, 493-501
Westgard, J.O., Petersen, P.H. & Wiebe, D.A. (1991) Laboratory process specifications for assuring quality in the US National Cholesterol Education Program. Clin. Chem., 37, 656-661
Whitehead, Т.P. (1977) Quality control in clinical chem-istry. New York, John Wiley
Yrjanheikki, E.J. (1989) Levels of PCBs, PCDDs and PCDFs in breast milk. Environmental Health Series, 34, World health Organization, Regional Office for Europe. Copenhagen, FADL Publishers
П. Gompertz MRC Institute for Environment and HealIb, University of Leicester, Leicester LE1 911N, UK
222

Applicalion of Biomerkern 1п Cancer Epidemiology Toniolc, P., Boffetla, P., 5huker, D.E.G., Rothman, N., Hidka, 6. апд Pearce, N., eds
'ARC tlnjerrOtc PuЫicatlons No. 142 International Agency for Research on Cancer, Lyon, 1997
5ampfe collection, processing and storage M.T. Land and N. Caporaso
We review issues related to the inclusion of biospecimens in epidemiological studies. Technical advances and the revolution in molecular biology have rendered the use of biomarkers increasingly feasible in epidemiological investigations, however the cost and complexity require interdisciplinary expertise and careful attention tо methodological detail in order to ensure validity.The widespread banking of biospecimens for long-term (cohort) studies requires special attention to be paid to these issues. Blood, urine and tumour tissue are in common use in medicine and at least some aspects of sample handling derives directly from this clinical experience, although special considerations apply in the epidemiological setting. An increasingly broad array of biospecimen types have been studied, including exhaled air, nail clippings, buccal cells, saliva, semen, faeces and breast milk. Relevant issues in the processing, storage, shipping, timing of collection and safety procedures are examined in terms of their potential to distort results. The role of carefully developed quality control protocols is emphasized. In order to take full advantage of the opportunities afforded by the use of biomarkers in epidemiological studies, careful attention to biospecimen processing, the stability of the biomarker and the precautions to he taken during transportation and storage of samples is necessary.
The appropriate collection, processing and storage of biospecimens form an essential but often over-looked component to any study that includes bio-markers. If the type or the quantity of the biologi-cal substrate is not adequate for the marker to be analysed, or if it is less than optimally processed at any stage in the sequence between collection (han-dling, labelling, processing, aliquoting, storage) and assay, analyses and subsequent epiderniologi- саl inference will suffer. Contamination, volatiliza-tion (e.g. rnethylethylketone), the short half-life of some substances (e.g. nicotine) and the potential that the collection procedure itself influences the substance to be measured (e.g. chromium levels from stainless steel needles used for venepuncture) are design issues that must be anticipated in advance (Bernard, 1995). Since inaccuracy or imprecision can result in increased variation, mis-dassification and loss of power, this is a major con-cern to epidemiologists. Iп case -control studies, if case samples are handled differently from control samples, differential rпisgаssшсаtioп may occur. These issues take on special importance in cohort studies, where large numbers of samples and the
time and resource investment warrant careful planning to ensure efficient, safe and focused procedures (Kaaks et a?., 1994)
It is critical to collect information linked to sam-ples in order to interpret the markers оptiтаlly: time and date of collection, recent diet and sup-plement use, reproductive information (i.e. men-strual cycle), recent smoking, current medication use, recent medical illness, storage conditions, etc. can be crucial far later interpretation of results. For example, information on current medication use may be crucial to the interpretation of a metabolic phenotype, i.e. quinidine use and the debrisoquine phenotype.
Overall quality assurance involves the system-atic application of optimum procedures to ensure valid, reproducible and accurate results. The most fundamental component is probably the adoption of standardized operating procedures for each aspect of biospedmen handling. As part of a qual-ity assurance plan, stored specimens could be tested on a regular basis to detect sample deterio-ration. Another aspect of quality assurance involves aliquoting material into multiple small
223

Application of Biomarkers in Cancer Epidemiology
vials and storing each person's specimen in at least two different physical locations to reduce the like-lihood of loss of а large volume of specimen as a result of accidental thawing due to freezer failure.
When samples are used later, they should be selected from specimens that received the same treatment throughout the storage process or the saine variations in handling; this should be con-trolled for in the statistical analysis.
Careful records of disbursements are also needed, i.e. which specimens, how much material remains, and documentation on factors such as thawing which could influence future uses of the material. Automatic edit checks (which can only be overridden by specific authorization of the prin-cipal investigator) may be used to block disburse-ment of the last specimen from an individual.
In this work, we highlight some relevant issues regarding the collection of biological specimens in epidemiological studies. The work does not attempt to provide an encyclopaedic review of all maтkeтs, specimen types or collection techniques, but rather attempts to identify some central issues along with examples.
Types of biospecimens Various types of biological materials can be col-lected for epidemiological studies, depending on the study design, the markers of interest and the availability of an assay. With the rapid develop-ment of molecular biology techniques, it has become critical to collect samples, planning not only for the main bioniarkers of interest, but also to process and store material in a way that allows for new biomarkers to be tested in the future.
Several prospective studies have considered blood specimens stored at low temperature in bio-logical banks as a source of information. Biological markers from samples collected before the onset of disease and stored until clinical expression may provide essential information on exposure to endogenous and exogenous factors not biased by the metabolic effects of ilIness (Winn et al., 1994). Other biological specimen banks have been estaЬ-Iished to store specimens from persons who have already developed a disease, to characterize the his-tory of the disease. Many collections of pathologi-cal material exist, and have increasing value with the availability of improved techniques to extract and characterize DNA from tumour and normal
tissue. The usefulness of these collections is greatly enhanced if there are associated epidemiological data. For example, a series of lung tumour speci-mens would be of much greater interest if age, gen-der, smoking, occupational exposure and clini-cal/survival information were also readily avail-able.
In general, biospecimens that can be collected safely with little discomfort to the donor hold the greatest promise for use in large-scale studies. A list of biospecimens suitable for epidemiological stud-ies follows. This Iist, although far from being exhaustive, can provide an insight into adequate procedures for sample collection, processing and storage.
Blood Collection of blood provides material that can give physiopathological and genetic information, can reflect the biological rhythms (circadian, men-strual, etc.) of the host, and can reveal recent or remote exposures or their sequelae. Detailed descriptions of techniques relevant to clinical stud-ies are available in clinical laboratory manuals and so this treatment will only highlight major issues of concern to the epidemiologist. The use of skilled technicians and precise procedures when perform-ing phlebotomy are important because painful, prolonged or repeated attempts at venepuncture can cause patient discomfort or injury and result in less than optimum quality or quantity of sample. As an example, prolonged venepuncture can induce the release of prolactin, or increase white blood cells (Stаtlarrd et al., 1978). Obtaining blood through too narrow a needle can result in haemol-ysis, with distortion of cell counts and electrolytes (especially potassium). The donor's position while providing the specimen may also influence analyte levels; e.g. serum cholesterol may be higher in standing subjects compared with supine subjects because of orthostatic decreases in plasma volume (Kieldsen et al., 1983). Prolonged use of a tourni-quet (i.e. greater than 1 min) can result in haemo-concentration. Any of these factors can result in pre-analytic variation in measurements. Thus, careful review of general and specific factors that may impact on a specific assay is mandatory before study initiation.
Blood is a great source of materials that can be collected for different purposes. Plasma/serum,
224

Sample collection, processing and storage
lymphocytes, monocytes, erythrocytes, granulo-cytes and platelets can be obtained through venepuncture and appropriate separation of blood components.
To avoid multiple venepunctures when a test requires a large blood sample, an evacuated tube system with interchangeable glass tubes can be used. Evacuated tubes are commercially prepared with or without additives and with sufficient vac-uum to draw a predetermined blood volume (2-20 m1 per tube).The different tubes are generally indi-cated by their colour-coded stoppers:
• Red-top tubes contain no additives. These tubes are used for tests performed on serum samples. • Lavender-top tubes contain EDTA, commonly used clinically for complete blood counts (CBC). • Green-top tubes contain heparin (sodium, lithiu or ammonium). • Blue-top tubes contain sodium citrate and cit-ric acid. Draw volume may be 2.7 or 4.5 m1. • Black-top tubes contain sodium oxalate. Draw volume may be 2.7 or 4.5 ml. • Yellow-top tubes contain acid-citrate-dextrose (ACD) solution. Draw volume is 12 ml. • Grey-top tubes contain a glycolytic inhibitor (such as sodium fluoride, powdered oxalate or glycolytic/microbial inhibitor). Draw volume may be З to 10 ml. These tubes are used most often for glucose determinations in serum or plasma samples.
Specific advantages and disadvantages of vari-ous anticoagulants are described below. Nutrients and other substances often require special addi-tives to allow analyses, i.e. metaphosphoric acid to measure vitamin C content.
There are important differences between the dif-ferent anticoagulants. Heparm acts by binding to antithrombm III and thus accelerates the inactiva-tion of thrombin and other clotting factors. The dis-advantages of heparin include the presence of impurities and the non-uniform position of sub-stituents, its ability to bind to many proteins, the potential to bind to platelets and cause agglutina-tion, its potential loss of anticoagulant effect in aged blood, and its influence on T-cell proliferation. Low-molecular-weight heparin avoids some of these problems. EDTA works by calcium chelation
arid is used cliпicaцy in haematology studies, but can be influenced by Mgz+concentration. It is well suited to DNA-based assays but has problems for cytogenetic analyses (increases of sister chromatid exchange, decreases of mitotic index, etc.).
Citrate also works by calcium chelation and is used in coagulation studies and blood barildng. It is optimal for assays conducted on lymphocytes and DNA.
There have been a limited number of studies comparing various anticoagulants in investigation settings. For example, a study on the effects of time, temperature and additives on a functional assay of Cl inhibitor (a component of the complement cas-cade) showed that plasma containing heparin or polybrene interfered with the functional assay; on the other hand, EDTA-treated or citrated plasma and serum kept at room temperature were ade-quate for the assay (Nielsen et ai., 1994).
Although there are anecdotal reports of occa-sional problems with heparin in PCA assays, stud-ies generally find that there are no major differ-ences in the use of EDTA or heparin. For example, Storch et al. (1994) compared the two anticoagu-lants for inhibitory effects on the detection of cyto-megalovirus from washed leukocytes in specimen transport tubes. Evaluation was made by the cen-trifugation/shell vial culture techniques, the ррб5 atigenaemia assay and PCR. For each assay, the results with heparin and EDTA were equivalent.
There are other anticoagulants useful for special applications. If only serum is needed, there is no need for anticoagulants. To reduce contamination, it is best if serum is separated from other blood components as soon as possible.
Many newer methods have been described that allow the collection of small quantities of blood adequate for the characterization of DNA. These methods do not require venepunctuue or low-temperature conditions during collection, storage and shipping. Examples of these are dried blood specimens which are derived from whole blood spotted directly—or anticoagulated with EDTA before spotting—onto clean slides and air dried at room temperature. The slides with blood smears can be transported or stored at room temperature, and serve as a good source of high-molecular-weight DNA (Aggarwal et aL, 1992).
A quantity of 50 µ1 of dried blood can provide 0.5 µg DNA, sufficient for multiple PCR-based
225

Application of Biomarkers in Cancer Epidemiology
assays (McCabe et al., 1987). DNA is stable on cot-ton cloth for at least 4 years (Gill et al., 1985).
A study planned to verify the stability of dried blood spot specimens for the detection of human immunodeficiency virus DNA by PCR techniques showed that treatment at 37°С and 60% humidity for 7 days, storage for 12 weeks at 22°C, followed by a freeze/thaw cycle had no adverse effect on PCR reactivity when compared with reference spots stored at -20° C. These findings suggest that dried blood spots are a powerful resource for test-ing for HIV by PCR, especially in remote areas where refrigeration and immediate sample pro-cessing are unavailable (Cassol et al., 1992).
Blood components. From 10 ml of blood, the fol-lowing quantities are obtained:
• plasma (or serum)-6 or 7 ml • lymphocytes and mononuclear cells-10-20 x 106 cells/ml • erythrocytes (RBCs) and other cells-5 x 10⁶ ce11s/µ1; 10-15 mg lb.
Mononuclear leukocytes are the only cell type in blood capable of growth; they can be cryo-preserved for the establishment of cell lines. Cryopreservation permits cell viability (for tissue culture-based mutation assays, transformation for gene mapping, etc.) and can be the only source to measure RNA after PHA induction (RNA is difficult to assay in quiescent cells because levels of activity are absent оr low). Granulocytes can serve as a source of DNA without sacrificing the lympho-cytes. Erythrocytes, stored after washing with physiological saline, can be useful to study adducts of haemoglobin. Plasma/serum can be used to measure microanalytes, diet components, vita-mins, xenobiotic exposures and so on. Plasma can be obtained from an anticoagulated blood sample through separation from cell components. It per-mits the analysis of coagulation factors, while serum permits better estimate of antibodies, nutri-ents, and lipid and lipoprotein measurements. Loss of plasma volume because of filtering after fibrin formation is a disadvantage of plasma storage over serum storage.
Pooled aliquots of serum specimens have been used (Wahrendarf et al., 1986) for nutritional or other biochemical studies, e.g. 11V antibody test-ing (IcIahon et al., 1995). The approach requires
merging aliquots of specimens from persons within a subgroup and testing the combined sam рlё to obtain a group-specific average value. This approach requires only a small number of labora-tory tests to be performed, but yields only a mean value without a variance or information about the distribution of results.
DNA can be extracted from whole blood, leuko-cytes and, as was recently demonstrated (BIomeke et al., 1996), serum, plasma or paraffin-embedded tissues. Smа11 amounts of DNA from blood (suffi-cient for PCR-based assays) can be obtained through finger-pricks (Guthrie cards), and the sub-jects can do the collection themselves at home. None the less, some discomfort is often felt with this approach and the participation rate can be reduced. Dried blood spots are very convenient for storage and shipping, and may be optimal for a large-scale epidemiological study. Whole blood obtained directly from finger-pricks may have sev-eral applications, e.g. it can be used for analysing complement activation using an ELISA enzyme immunoassay method (Chang aid Lister, 1993).
Processing. The sample processing depends on the marker needed. Investigators must design studies to fit the requirements of the critical biomarkers. For catecholamine measurements, for example, blood should be centrifuged within 1 h of collec-tion. Once plasma is prepared, catecholamines are stable for 1 day at 20°C, 2 days at 4°C, 1 month at -20°C, and up to 1 year at - 70°C (Boosma et al., 1993). A delay in blood processing may affect the assay results. For example, blood samples held for 2 days at room temperature showed a mean 81% decrease in cells positive for cytomegalovirus anti-genaemia (Landry et al., 1995); on the contrary, a delay of up to 24 hours in blood processing did not significantly change the specific activities of aryl sulfatase A and cerebroside-beta-galactosidase in both Ieukocytes and lymphocytes (Shah et al., 1995). The stability of assays in relation to time and temperature of storage has not always been well documented, but should be considered in the context of specific studies. In one study, it was rec-ommended that serum fatty acids be measured within 2 weeks at 4°C, within a few months at -20°C and within 1 year at -80°C to estimate the compo-sition of the major fatty acids (Umemura et al., 1991). Blood samples treated with Triton X-100,
226

Sаmple collection, processing and storage
ESTA and sodium fluoride may be stored up to 4 weeks without aрpтeciаые effect on measured blood lactate concentration (Hî11, 1995)
Storage. It is critical to maintain careful records of the identity and location of all materials, with par-ticular .attention to storage history, occurrence of temperature fluctuation and monitoring of stored control specimens, in order to check the effects of storage duration. For example, samples stored on top of a mechanical freezer may be exposed to more extreme temperature fluctuations then those stored at the bottom. This cari lead to deteriora-tion of sample over time and can bias the analyses.
In prospective studies based on storage of biological samples at low temperature, a crucial question is to evaluate whether long-term preser-vation of samples is able to affect the categorization of the subjects involved. A recent study showed that estradiol, free and total testosterone, and pro-lactin in serum and plasma samples maintained almost the same rank by hormonal concentration throughout a 3-yеаr period of cryoconservation at -80°C (Bolelli et al., 1995). In another study, aliquots from 40 ml plasma pools preserved with metaphosphozic acid were assayed for their ascor-bic acid values after 12, 24 and 42 months of storage at -70°C. Similarly, aliquots from 16 plasma pools were assayed for values of retinol, several carotenoids and two tocopherols for a period of storage at -70°C up to 4.3 years. No indications were found of important losses of these antioxidant micronu trients during storage (Comstock et al., 1995)
However, in a study on maternal screening for three markers, immediate freezing of serum and subsequent thawing resulted in a significant increase in beta-hCG and unconiugated E3 levels, but no change in AFP levels. AFP levels were influenced by centrifugation status, and all three analytes were influenced by refrigeration status (Lantz et aг., 1995).
Timing. The timing of sample acquisition can pro-foundly influence the interpretation of results. This is especially evident for those hormones which have hourly, daily and/or monthly cycles. Both timing of exposure and timing of biospecimen collection need to be considered; i.e. mutations cannot be compared with chromosomal aberra-tions on the same sample, since, for example, chromosomal changes may require a longer time
to appear following exposure than DNA-base changes.
It is critical to obtain information (in addition to the usual questionnaire typically administered) at the time of biospecimen collection to aid inter-pretation. Typical information will be assay-spe-cific, but is likely to include, as a minimum, time and date of draw, volumes and type of specimen, medical illness (currentlremote), last food con-sumed (type aid time since collection), medica-tion use, reproductive information—i.e. time since last menstrual period—time since last cigarette, and alcohol intake. Information will differ depend-ing on the study setting and the target population. Some studies may require that specimens be col-lected from the same persons at several time points; collection and related data should be stored with the study database.
Specific Ыomaтkers will each have a precise time dependence on exposure; examples include sister chromatid exchange (days), chromosome aberrations (around 6 weeks post-exposure), adducts Ivaries by type, e.g. DNA and albumin: 25 days; lb: 120 days—see Environmental Health Perspectives, Vol. 103 (Suppl. 3), 1995], and various mutations (6 weeks to б months after exposure, but also dependent on repair activity). Similar con-siderations apply to nutrients and hormones, but are less relevant to repeated or remote exposures.
Urine Because urine is an ultrafiltrate of the plasma, it can be used to evaluate and monitor body homeo-stasis, metabolic disease processes, exposure to xenobiotic agents, mutagenicity, exfoliated cells, DNA adducts, etc. Urine specimens are usually readily obtainable, although sometimes its collec-tion is felt to be more inconvenient than blood collection. The type of specimen selected and the collection procedure used depend on the tests to be performed. There are basically four types of urine specimens to be collected for epideniiologi-cal studies: first morning, random, fractional and timed. The ideal specimen is adequately concen-trated to ensure the detection of analyses of inter-est (for a review, see Brunzel, 1994):
• To collect a first morning specimen, the sub-ject voids before going to sleep and, immedi-ately upon rising, collects a urine specimen. The specimen must be preserved if not delivered
227

Application oг Biоmaгkers in Cancer Epidemiology
within 2 h of collection. First morning speci-mens are ideal for substances that require con-centration, and white cells, red cells and casts are more stable iп concentrated acidic urine specimens. However, they are inadequate for cytology studies; in fact, the epithelial cells may undergo degeneration, and salt crystallization during processing may have adverse effects on cytology studies. • Random urine specimens can be соцесtед at any time. These specimens are usually satisfac-tory for routine screening and for cytology stud-ies. One method to increase the ce11ularity of the urine specimen is to have the subject drink a lot of water 2 h before collection and exercise for 5 min by skipping or jumping up and down prior to specimen collection. • Fractional collections are used to compare the concentration of an analÿte in urine with its concentration и the blood. These specimens are also termed 'double-voided specimens', because the first morning urine (containing solutes and metabolites from the evening meal) is discarded, but the second urine excreted (fast-ing urine specimen) is collected. • Timed collections, usually done over 12-24 h periods (or even longer), eliminate the need to determine when excretion is optimal and allow day-by-day comparison of excretion patterns. On day 1, at the start time, the subject empties his/her bladder. For the next 24 h, all subsequent urine must be collected in the container. On day 2, at the end time (the same hour as the start time), the subject empties the bladder and includes this specimen in the collection. Only one first morning sample must be included. Urine collections should be kept on ice or refrigerated throughout the duration of the collection.
Plastic or glass containers must be clean and dry, and have a 50-3000 ml capacity, a wide mouth and a leak-proof screw cap. Depending on the ana-lyte to be measured, a preservative maybe needed. The type of preservative may differ according to test methodologies, time delay and transport con-ditions. In the laboratory, total volume must be recorded, the specimen well mixed to ensure homogeneity, and aliquots removed for the appro- priate test.
In epidemiological studies, the period of urine collection used to measure excretion varies de-pending on the marker to be measured and the aim of the study. For example, using overnight col-lection to measure catecholamines may result in a much larger sample size requirement to achieve the same power as a 24-h collection. However, 24-h collections incorporate measurement errors that are not present in overnight collections (White et aI., 1995). In reference to optimal storage condi-tions, a study by Boosma et a1. (1993) showed that catecholamines are stable at 4°C for 1 month in unpreserved urine, and for 4 months in urine pre-served with EDTA and sodium metabisulfite. In acidified urine, catecholamines were nearly unchanged after 1 year at 4 and —20°C.
Urine processing can influence the results of various tests. For example, freezing at —20°C and storing of urine samples prior to assessment of albumin concentration can affect the absolute vaI-ues obtained (Shield et al., 1995). Foi the quantita-tion of glutathione transferases by an ELISA proce-dure, storage of urine samples requires the pres-ence of low detergent concentrations, such as Tween 20, which both stabilizes the enzymes and prevents their absorption by plastic test tubes (sundberg et al., 1995).
The use of urine requires decisions to be made on the appropriate time frame for measurement of numerous analyfes, microbial contamination, the cost of storing large volumes of material and the paucity of studies on the effect of long-term storage on qualitative or quantitative analyte detection.
Tissues Tumour pathology samples are required to confirm clinical diagnoses by histological analysis. Iп recent years, there has been increasing interest in examining tumour characteristics at the chromo-somal and molecular levels. This generally requires collecting more material than is necessary for pathological evaluation. When possible, the tissue samples should contain tumour as well as normal tissue to permit investigation of the different char-acteristics of the two tissues. For tissue blocks, col-lections of stained and unstained tissue samples from the same individual are ideal.
In planning any human tissue banking effort, one should consider which tissues might already be, or will potentially be, available, such as dis-
228

sample collection, processing and storage
carded tissue blocks or diagnostic specimens from surgery (informed consent may be required) Some of these tissues may be less than ideal for specific ends, e.g. forrualin-preserved samples have altered chemical constituents and PCR assays are difficult. However, with development of new analytical techniques, new uses may be found for any tissues that might be available. Several extraction tech-niques have been proposed, e.g. the sonication method, which takes only 30 min from start to fin-ish to extract DNA from fresh, frozen and forma-1in-fiкed, paraffin-embedded tissue specimens (Heller et aI., 1992). Although available specimens are often limited to formalin-fixed, paraffin-embedded blocks, frozen tissues have distinct advantages. Snap freezing of tissues is especially suited for RNA extraction. Recently, a new method has been developed for preparing normal or tumour tissue for RNA recovery; the tissue sample is placed in a transparent bag which does not break when submerged in liquid nitrogen. While frozen, the tis-sue is crushed with a hammer. After the specimen is completely lysed, RNA can be extracted even from very limited tissue samples (Gramza et a2., 1995)
As an example of the influence of storage tem-perature on a specific assay, gastric rnucosal biop-sies stored at 4°C foi 1 and 2 weeks resulted in the recovery of 81% and 19% of Helicobactor pylori, respectively. Storage at —20°C improved yields to 100% and 57% after 4 and 12 weeks, respectively. Recovery improved still further at —70° C (Han et al., 1995). In general, it is best to use the lowest storage temperature practical, given cost and sam-ple size constraints.
A novel method has been developed for pro-cessing biopsy specimens for histochemical and immunohistochemical analyses by combining freezing with low-temperature plastic embedding. The method avoids the need for tissue fixation and combines the superior morphological preservation of fixed embedded tissue with the reactivity of crуо-stаt sections. Biopsy specimens are stored at room temperature without loss of tissue-specific charac-teristics during storage (Murray & Ewen, 1991).
Adipose tissue Adipose tissue aspirations maybe quite feasible for the subject and involve low risk. Tissue samples can be analysed for assessment of prior exposures in epidemiological studies. This tissue offers a rel-
atively stable deposit of triglyceride and fat-soluble substances, such as fat-soluble vitamins (i.e. vita-mins A and D) and pesticides. Halogenated hydro-carbons may be measured in concentrations hun-dreds of times greater than those in blood of the same individuals. As a tissue, it represents the greatest reservoir of carotenoids in the body, and the tissue composition also reflects long-term dietary intake of essential fatty acids (for a review, see Kohlmeieт & Kohlrneier, 1995). Samples are collected from the upper outer quadrant of the buttock while the subject is lying face down. No local anaesthesia is needed. After disinfection of the skin with alcohol, the subject is asked to tense the buttock to delineate muscle and fat. The upper outer quadrant is grasped between the finger and the thumb of one hand. A Luer-lock needle 1s inserted at a 450 angle, after which a vacuum tube is connected to the needle. The needle is then moved in and out of the adipose tissue, at which time some fat collects at the top of the Luer adapter between the needle and the tube. The adapter is capped and immediately frozen at —80°C (Kohlmeier & Kohlmeier, 1995).
Bronciioalveolar lavage (BAL) Broncho alveolar lavage fluid has been used for many years in occupationally related epidemiolog- ical studies. A typical example is the use of BAL to assess and quantify asbestos exposure through identification of asbestos bodies and cell content in the alveolar fluid (Orlowski et al., 1994).
Induced sputum samples and bronchoalveolar lavage fluid (BALF) can also provide sufficient DNA for PCR-based assays. As an example, a study by Liesnard et al. (1994) showed that PCR can be applied to BALF as a rapid method to detect cytomegalovirus infection.
Bronchoalveolar lavage is performed through a fibre-optic bronchoscope inserted transnasally after topical application of local anaesthesia. Sterile solution (200-250 ml) at 37°C is injected by 50 ml bolus into a dependent subsegmental bronchus of the right middle lobe or lingula. The bronchoal-veolar fluid is then recovered by mild aspiration and can be ready for centrifugation, cell count, cell digestion, preparation of slides for asbestos bodies count through light or scanning electron microscopic analyses, etc. (Bell et aй., 1981; Roggli et al., 1994).
229

Application of Biomarkers in Cancer Epidemiology
Exhaled air Collection and analysis of exhaled air has been done for years to evaluate exposure to different substances, particularly solvents such as benzene, styrene and tetrachloroethylene. In addition, exhaled air samples have been used as a source of exposure and susceptibility biomarkетs. An exam-ple of this is provided by the [3-13C-methyl] caffeine breath test, developed to measure the Р4501А2 activity, which can increase after expo-sure to polybrominated biphenyls and dioxins (Lambert et al., 1990). After ingestion of a labelled dose of 3 mg/kg caffeine, aliquots of end-tidal breath samples are collected at different times and placed in vacationers for storage and transport. Analysis by differential mass spectroscopy of the samples gives an indirect measurement of the Р4501А2 activity. Other examples of tests that exploit labelled compounds with detection of the target compound in expired air include breath methane and 12 (fermentation), and breath urea (presence of urease positive organisms such as H. pylori). For collection of exhaled breath, various similar methods of sampling have been developed; for example, a method capable of measuring sub-ppb levels of volatile organic compounds, employing Tenax sorbents to collect breath samples from a Tedlar bag that has been filled by the subject exhaling through a two-way mouthpiece. The subject inhales pure humidified and charcoal scrubbed air from a cylinder (Wallace & PeIlizzari, 1995).
Hair Hair is an easily available biological tissue whose typical morphology may reflect disease conditions within the body. It provides a permanent record of trace elements associated with normal and abnor-mal metabolism, as well as those assimilated from the environment (Srivastava & Gupta, 1994). In fact, human hair analysis has proved to be a well-suited biological marker of occupational and envi-ronmental exposure to toxic metals (although, because of external contamination, they are not useful for most nutrients). The method of hair analysis can be suitable for use in pilot prospective studies. If an excessive exposure is detected, analy-sis of conventional biological substrates, such as blood or urine, is recommended in order to verify the exposure accurately (Bencko, 1995).
Hair samples have been proven to be valid bio-logical samples for nicotine measurement in esti-mating average eпviroпmeпtaI tobacco smoke (ETS) exposure in children. The hair nicotine lev-els were shown to be well correlated with cotinine creatinine ratios in urine from the same individu-als (Nafstad et al., 1995).
Moreover, hair and urine analyses are comple-mentary tests for establishing drug use. Hair analy-sis provides long-term information, from months to years, concerning both the severity and pattern of drug use. In contrast, urinalysis only indicates drug use that has occurred within the last 2-3 days. External contamination of hair by drugs present in the environment (e.g. smoke) is the main problem of hair analysis. The problem, however, can be effectively avoided by washing the hair specimen, by kinetic analyses of the wash data and by metabolite measurement. The possibility of bias due to race and/or hair colour is avoided by the exclusion of melanin from hair analysis (Du Pont & Baumgartner, 1995)
Finally, hair roots can be an optimal source of DNA for PCR analysis and permit easy collection, transport and storage and low overall costs (Thompson et aI., 1992).
Na1I clippings Toenail or fingernail clippings are obtained in a very easy and comfortable way, and they do not require elaborate processing, storage and shipping conditions and are thus suitable for large epidemi-ological studies (Garland et al., 1995). Toenail clip-pings have been used for studies of trace elements and for measurement of selenium levels (which reflect selenium intake) in order to investigate the association between selenium status and cancer risk (Garland et al., 1993; van den Brandt et al., 1993). Another study showed that arsenic levels in fingernails can be a biological indicator of expo-sure to arsenic (Agahain et aI., 1990)
Nail clippings may be less likely to be contami-nated by environmental factors, handling procedures от cosmetics (Hambidge, 1982), but involve more complicated washing, specimen hydrolysis and matux problems for the chemist (Winn et al., 1990).
Buccal cells As an alternative to using blood obtained by venepuncture, cells may be obtained by an oral
230

sample collection, processing and storage
rinse. Human cheek cells were first used as a non-invasive method for detecting tissue lipid profiles in nutritional studies (Iclurchie et aL, 1984). More recently, а 'swish and spit' technique to coi-led nucleated cells as a source for DNA has been re-ported. For this technique, the subject vigorously swishes isotonic saline in the mouth and expecto-rates it into a collection container. DNA is ex-tracted from the buccal cells and can provide excellent templates for PCR-based assays. In this study, the integrity of the specimens was un-affected by storage at —20, 4, 25 or 37°C. Thus, this process may be extremely useful for large-scale studies that require DNA from subjects geo-graphically distant from the research site (Hayney etal., 1995).
The oral rinse method is perhaps the most extensively used non-blood-based sampling tech-nique. However, it involves liquid sample handling and requires an additional centrifugation step to spin down the cells, increasing the time for DNA preparation. Buccal cells may also be collected on cytology brushes and swabs for use in PCR-based assays. For cytology brushes, there is a variety of collection approaches. Generally, just before spec-imen collection, the subject should rinse the mouth with water to reduce bacteria interference. We have successfully used a technique involving 30 s of gentle rubbing over the inner buccal surface on each side of the mouth. This method would not be appropriate in subjects with mucosal lesions. Alternatively, a sterile metal spatula can be used to scrape the buccal mucosa firmly but carefully so as not to cause pain or bleeding; the buccal material on the spatula is then spread across the surface of a clean microscope slide. The prepared slide is placed in fixative for approximately 1 h and then allowed to dry at room temperature. Transport may be done in an appropriate box at room tem-perature. Cheek cell samples and DNA prepared from the swabs are highly stable.
In а blind study comparing the analysis of 12 mutations responsible for cystic fibrosis in multi- plex products amplified with DNA from both blood and buccal cell samples from 464 individu- als, there was a 100% correlation of results for blood and cheek cells collected on cytology brushes for use in genetic testing (Richards et al., 1993). In this study, the stability of cheek cells was evaluated by collecting cells on both cytology
brushes and female Dacron swabs, and storing them at 4°C for 1 month, 2 weeks, 1 week and 3 days. DNA was subsequently prepared from these samples and amplified alongside freshly prepared buccal cell DNA. There was no significant differ-ence in the yield of amplification products among the different samples. To determine how stable the cheek cells would be when shipped under various weather conditions, samples were stored for 3 days in a —20°C freezer, a 37°C incubator and in the air-space of a 37°C water bath, in order to simulate the effect on buccal cell stability of very cold, hot or humid conditions. Amplified product yields were equivalent to those of freshly collected and extracted samples.
Buccal mucosal transudate collected by sait-impregnated buccal swab was shown to provide a minimally uncomfortable measure of cocaine use in a preliminary study of 44 subjects (Leonard et aL 1994). Buccal cells can be used to count micronuclei. The proportion of exfoliated buccal cells with micronuclei offers the opportunity to assess sensitivity to gamma radiation and geno-toxic compounds and, in addition, to monitor the effectiveness of cancer intervention strategies (Belief et ai., 1995).
Sагivа Saliva can be an efficient, painless and relatively inexpensive source of biological materials for cer-tain assays, and provides a useful tool for measur-ing endogenous and xenobiotic compounds. Several devices, such as non-covered cotton roll, polypropylene-covered polyether roll and paraffin wax chewing stimulation, have been developed to collect effective saliva samples. The different devices, which have been used to measure corti-costeroids (Kathol et al., 1995), antibodies to human immunodeficiency virus type 1 (I4IV-1) (Granade et al., 1995), and other compounds, generate different data. Care should be taken when different devices are employed (Lenander-Lumikari et al., 1995). Recently, a technique has been described to determine the СУР1А2 phenot-ype following a caffeine dose using saliva (Fuhr & Rost, 1994).
Cotinine determination in saliva is considered a reliable marker for both environmental tobacco smoke exposure and active smoking (Samet et а!., 1988).
231

Application of Biomarkers in Cancer Epidemiology
Breast milk Several studies have been сопдисtед using breast milk from lactating mothers to measure hormones, epoxides of cholesterol (Wrensch et al., 1993), exposure to chemicals, i.e. polychlorinated biphenyïs (Becker et al., 1995, Schlaud etaL, 1995), pesticides (Rogan & Ragan, 1994) and biological contaminants, i.e. aflatoxin M1 (E1-Nezami et a1., 1995) or BorreIla burgdor fеri (Schmidt et al., 1995).
In studies of the association between selenium levels and cancer risk (5anz & Diaz, 1995), breast milk has been used to estimate serum selenium lev-els, because it is well correlated to selenium intake. Milk samples are collected when beast feeding is established. The samples are obtained by expres-sion, either manually or by vacuum pump. Before expressing the milk, the subject should wash the nipples, and then the milk should be expressed directly into autoclaved glass bottles, which are opened and used for one expression only. After col-lection, milk can be kept in a domestic refrigerator until it is sent to the laboratory (within 24 h), where it can be deep frozen for long-term storage.
Faeces Certain ceI1s of interest (Nair et al., 1994), infectious markers (Ramamurthy et al., 1993), oncogenes (Celani et al., 1993; Mao et al., 1994), RNA (Davidson et al., 1995) and certain specific com-pounds may best be studied in faeces, e.g. faecapentaenes, which are potent mutagens excreted in faeces. hi one study, a 2-day stool spec-imen was collected using a protocol that required subjects to place dry ice into a plastic container held by a collection bonnet positioned on the toilet rim. The container was then placed into a styrofoam dry ice chest. Subjects were instructed on how to avoid contamination with urine. Frozen stools underwent lyophilization prior to analysis. The proceduie was successful in that neither occult bleeding, laboratory drift nor sample degradation with storage (re-test after 2 years) influenced the assay. The correlation between first and replicate measures was greater than 0.90 (Schiffrnan et cL, 1989).
Sеmen Semen specimens are collected to evaluate the effects of exposures on endocrine and reproductive factors. 5exиal abstinence for at least 2 days, but not
exceeding 7, should precede the collection. The specimen is collected by subjects through mastur-bation, and the entire ejaculate is collected in a clean sterile plastic or glass container. Lubricants and ordinary condoms should not be used because of their spermicidal properties. The collection container should be at room temperature or warmed before collection, should reach the laboratory within 1 h of collection, should be protected from extreme tem-peratures (i.e. maintained between 20 and 40°C), and should be labelled with the time of actual collec-tion, a crucial factor in evaluating liquefaction and sperm motility (Woild Health Organization, 1992).
Temperature Specimen collection requires storage systems that are capable of maintaining the optimal tempera-ture for the diverse types of specimens: • • -20°C: certain items stable, i.e. urine
• -70°C: —cell viability limited (not optimal) —DNA stable —serum stable —most hormones stable —most vitamins stable
• -120°C: hormones, carotenoids, other nutrients.
Liquid nitrogen, present on the bottom of the freezer, is at -196°C, while the area higher up in the freezer, i.e. at the liquid/vapour interface is typ-ically around -120°C. If samples are stored at both temperatures, analyses must be stratified and dif-fererrt storage procedures taken into account.
Most investigators use liquid nitrogen to niairi-tain cell viability. However liquid nitrogen can be expensive and labour-intensive on a large scale. Iп recent years, -140°C freezers with liquid nitrogen back-up systems have been developed as an alter-native to storage in liquid nitrogen. The scientific rationale for using these freezers as an alternative, is that, below -139°C for pure water (or about -130°C for culture media), molecules still vibrate, but do not move from one position to another, thus preventing chemical reactions. Therefore, few, if any, changes that may affect cell viability should occur between -140 and -196°C.
Freezers may fail, leading to the necessity for 24-h monitoring of the facility through a computerized alarm system to alert personnel and activate back-up equipment. For large-scale collections, systems
232

sample collection, processing and storage
must be in place that monitor for the possibility of fire, power loss, leakages, breaches of security etc. An empty functioning freezer than can accept sam-ples after a single failure is crucial. Monitoring should include active 'hands-on' manual and mechanical checks, since monitoring systems them-selves are prone to failure (e.g. a temperature gauge can become 'stuck' in place). Receipt and control procedures, a quality assurance programme includ-ing plans for routine preventive maintenance, and a system for documenting the storage history of every specimen must be carefully planned.
Shippiпg sample shipping requirements depend on the time, distance, climate, season, method of trans-port, applicable regulations, type of specimen and marker(s) to be assessed. Usually, polyurethane boxes containing dry ice are used to ship and trans-port samples that require low temperatures. The quantity of dry ice should be carefully calculated, based on the estimated time of the trip (dry Ice evaporates with time, depending on the external temperature), the number of samples to be trans-ported in the boxes and an ample safety factor that takes into account likely delays. If the boxes have to be shipped by airline, it is suggested that they be placed in the hold of the plane, where the temper-attire during the trip is very low. Bach box should be accompanied by a typed chart describing in detail the contents of the box and the location of each tube in the box.
For samples that require very low temperatures, shipping in a liquid nitrogen container can be optimal. If international shippings are planned, safety declarations for the foreign country's cus-toms should be prepared.
Safety No discussion of biospecimens is complete without a mention of biosafety concerns, although a com-plete discussion goes beyond the scope of this brief review. Historically, the earliest concern was to protect the biospecirnen from contamination; however, in recent years, the appreciation of potentially deadly blood-borne pathogens such as HIV and hepatitis has radically re-oriented this approach towards worker safety. Changes to labo-ratory design (e.g. air flow is 'once through' and not recirculated, laminai flow hoods, restricted
entrance), equipment (easy cleaning benchtops, easily available handwashing and first aid such as eye washing fountains) and techniques (forbidding mouth pipetting, puncture-resistant containers for disposal of sharps, mandatory training, use of laboratory coats, etc.) have been made. Inocu-lation of all workers who may be involved with human biospecimens with hepatitis B vaccine and 'universal precautions' training should be stan-dard.
Procedures It is appropriate to conclude this survey by empha. sizing that epidemiological studies require stan-dardized approaches in order to ensure quality control. All epidemiologists are familiar with edit checks on data entry and similar measures used to ensure the integrity of data. A similar approach with regard to dealing with biospecimens is essen-tial. For example, our 'biospecimen collection manual' contains numbered steps (each with a rationale) for accomplishing the routine tasks required for pre-clinic, clinic and post-clinic рхо-cedures involved with biospecimen acquisition. Field trip preparation, packing and shipping samples, etc. are dealt with in a similar manner. Procedures are in place to standardize approaches at laboratories that perform routine tasks such as DNA extraction and at repositories that receive, record, process, store, label and ship samples. Flow charts are often included to highlight decision points, i.e. 'DNA to lab A', 'serum to lab B'. These procedures are invaluable in guiding day-to-day operations, assisting with the training of new per-sonne!, serving as a starting point for the evalua-tion of technical improvements, creating a frame-work for periodic reviews aid establishing a base-line for the evaluation of a response to untoward events.
References Agahain, A., Lee, J.5., Nelson, J.H. & Johns, R.E. (1990) Aisenic levels in fingernails as biological indicator of exposure to arsenic. Are. Ind. Нуg. Assoc. J., 51, 646-651
Aggarwal, R,K., Lang, J.W. & Singh, L. (1992) Isolation of high-molecular-weight DNA from small samples of blood having nucleated erythrocytes, collected, trans-ported, and stored at room temperature. Genet. Anal. Tech. App?., 9, 54-57
Becher, G., Skaare, JU., Polder, A., Sletten, B., Rossland,
233

Application of Biomarkers in Cancer Epidemiology
О.К. Hansen, H.K. & Ptashekas, J. (1995) PCDDs, PCDFs, arid PCBs in human milk from different parts of Norway and Lithuania. J. ToxicoL Environ. Health., 46, 133-148
Belien, J.A., Copper, M.P., Braakhuis, B.J., Snow, G.B. & Baak, J.P. (1995) Standardization of counting micrопи-c1ei; definition of a protocol to measure geno toxic dam-age in human exfoliated cells. Carcinogencsis, 16, 2395-2400
Bell, D.Y., Haseman, J.А., 5росk, A., McLennan, G. & Hook, G.E.А. (1981) Plasma proteins of the bron-choalveolar surface of the lungs of smokers and non» smoker s. Am. Rev. Respir. Dis.; 124, 72-79
Bencko, V. (1995) Use of human hair as a biomarker in the assessment of exposure to pollutants in occupational and environmental settings. Toxicology, 101, 29-39
Bernard, A.M. (1995) Biokinetics and stability aspects of biomarkers: recommendations for application in popu-lation studies. Тoxiсыоgу, 101, 65-71
Blomeke, B., Bennett, W.P., Harris, C.C. & Shields, P.G. (1996) Serum, plasma, and paraffin embedded tisssues as sources of DNAB for studying genetic susceptibility to cancer. Proc. Am. Assoc, CaoncerRes., 37, 261
Bo1e1li, G., Muti, P., Micheli, A., Sciа jno, R., Franceschetti, F., Krogh, V., Pisani, P & Berrino, F. (1995) Validity for epidemiological studies of long-term cryo-conservation of steroid and protein hormones in serum and plasma. Cancer Epidemiol. Biomarkers Prev., 4, 509-513
Boоsma, F., Alberts, G., Van-Eijik, L., Ian-iii-'t-Veld, A.J. & 5chalekamp, M.A. (1993) Optimal collection and stor-age conditions for catecholamine measurements in human plasma and urine. Clin. Chem., 39, 2503--2508
Bruzel, N. (1994) Fundamentals of Urine and Body Fluids Analysis, Philadelphia, PA, WB Saunders
Casa], S., Salas, T., Gill, M.J., Montpetit, M., Rudnik, J., 5y, C.T. & O'Shaugnessy, M.V. (1992) Stability of dried blood spot specimens for detection of human immun-odeficiency virus DNA by polynverase chain reaction. J. Clin. MiсrоЫoL, 30, 3039-3042
Celani, P., Berchtold, C.M., Mahbry, M., Carroll, M., Sidransky, D., Cesano, R.A., Jr & Lupo, R. (1993) Induction of markers of normal differentiation in human colon carcinoma cells by the v-ras-H oncogene. Cell Growth Diff. 4, 341-347
Chang, T.M. & Lister, C.W. (1993) Use of finger-prick humai blood samples as a more convenient way for in-vitro screening of modified hemoglobin blood substitutes for complement activation: a preliminary report. Biornater. Arti f. Cells Immobilisation BiotechnaI,, 21, 685-690
Comstock, G.W., Norkus, E.Р., Hoffman, S.C., Xu, M, -W
& Helzsouer, К.J. (1995) Stability of ascorbic acid, carotenoids, retiriol, and tocopherols irs plasma stored at -70°C for 4 years. Cancer Epidemiol. Biomarkers Prey., 4, 505-507
Davidson, L.A., Jiang, Y.H., Lupton, J.R. & Chapkin, R.S. (1995) Noninvasive detection of putative biomarkers for colon carcinoma using fecal messenger RNA. Cancer cеr Eidemiol. Biomarkers Prev., 4, 643-647
DuPont, R.L. & Baumgartner, W.A. (1995) Drug testing by urine and hair analysis: complementary features and scientific issues. Forensics Sri, Int. 70, 63-76
E1-Nezami, H.S., Nicoletti, G., Neal, G.E., Donohue, D.C. & Ahokas, J.T. (1995) Aflatoxin M1 in human breast milk samples from Victoria, Australia and Thailand. Food Chem. ToxicoI., 33, 173-179
Fuhr, U. & Rost К.L. (1994) Simple and reliable СYP1А2 phenotyping by the paraxanthine/caffeine ratio in plasma and in saliva. Pharmacogenetics, 4, 109-116
Garland, M., Morris, J.S., Rosner, B.A., Stampfer, M.J., Spate, V.L., Baskett, C.J., Willett, W.C. & Hunter, D.J. (1993) Toenail trace element levels as biomarkers: repro-ducibility over a 6-year period. Cancer Eрiдеmго I. Biomarkers Prev., 2, 493-497
Garland, M., Morris, J.S., Stampfer, M.J., Colditz, G.A., Spate, V.L., Baskett, C.K., Rosner, B., Speizer, EE., Willett, W.C. & Hunter, D.J. (1995) Prospective study of toenail selenium levels and cancer among women. J. Nat! Cancer Inst., 87, 497-505
Gill, P., Jeffrey, A.J. & Werrett, D.J. (1985) Forensic appli-cation of DNA "fingerprints". Nature, 318, 577-579
Gramza, A.W., Lucas, J.М., Mountain, R.E,, Schuller, D.E. & Lang, J.C. (1995) Efficient method for preparing nor-mal and tumor tissue for RNA extraction. BioTecnigues, 18, 227-228
Granade, T.C., Phillips, S.K., Parekh, B., Pau, С.P. & Georgge, J.R. (1995) Oral fluid as a specimen for detec-tion and confirmatton of antibodies to human immun-odeficierncy virus type 1. AADE Ed, J,, 2, 395-399
Hambidge, TCM. (1982) Flair analysis: worthless for vita-mins, limited for minerals. Am. J. Clin. Nutr., 36, 943-949
Han, S.W., Flamm, R., Ichem, C.У., Kim, I."., Glarridge, J.E., Evans, D.G., Beyer, J., Drnec, J. & Graham, D.Y. (1995) Transport of storage of Helicobacterpylori from gas-tric mucosal biopsies and clinical isolates. Eur J. Clin. Microbiol. Infect. Dis., 14, 349-352
Hayney, M.S., Dimanling, P., Lipsky, J.J. & Poland, G.A. (1995) Utility of a "swish and spit" tecnique for the col-lection of buccal cells for TAP haplotype determination. Mayo Clin. Proc., 70, 951-954
Нi11 D.W. (1995) Effect of storage on measured blood lac-
234

Sample collection, processing and storage
tate concentration: a research note. Int. J. sports Med., 16, 88-90
Heller, M.J., Robinson, R.A., Burgart, L.J., TenEyck, С.J. & Wilke, W.W. (1992) DNA extraction by sonication; a comparison of fresh, frozen and paraffin-embedded tis-sues extracted for use in polymerase chain reaction assays. Mod. PothoL, 5, 203-206
Kaaks, R., van der Twel, i., van Noord, P.A. & Riboh, E. (1994) Efficient use of biological banks for biochemical epidemiology: exploratory hypothesis testing by means of a sequential t-test. Epidemiology, 5, 429-438
Kathol, R.G., Poland, R.E., Stokes, P.E. & Wade, Ѕ. (1995) Relationship of 24-hour free cortisol to 4-hour salivary morning and afternoon cortisol and cortisone as mea-sured by a time-integrated oral diffusion sink. J. Endcrbwl. Invest., 18, 374-377
Kieidsen, S.E., Eide, I. & Leren, P. (1983) Effects of posture on serum cholesterol fractions, cholesterol ratio and triglycerides. Scan. J. Clin. Lab. Invest., 43, 119-121
Kohlmeier, L. & Koh]rtreier, M. (1995) Adipose tissue as а medium for epidemiologic exposure assessment. Environ. Health Perspect., 103 (suppl. ЗP), 99-106
Lambert, G.H., 5choе1lеr, D., Humphrey, Н.E., Kotake, A.N., Lietz, H., Campbell, M., Kalow, W. & spielberg, S. (1990) The caffeine breath test and caffeine urinary metabolite ratio in the Michigan cohort exposed to poly-brominuted hiphenyls: a preliminary study. Environ. Health Perspect., 89, 175-181
Landry, M.L., Ferguson, D., Cohen, S., Huber, K. & Wetherill, P. (1995) Effect of delayed specimen process-ing on cytomegalovirus antigenemia test results. J. Clin. Microbгоl., 33, 257-259
Lantz, M.E., O'Brien, W.F. & William, M.C. (1995) The effect of sample preparation and storage on maternal triple-marker screening. Obstet. Gynecol., 85, 919-923
Lenander-Lumikari, M', Johansson, I., Vilja, P. & Samaranayake, L.P. (1995) Newer saliva collection meth-ods and saliva composition: a study of two sauvette kits. AADEEd.J., 1,86-91
Leonard, J., Doit, M., Martin, C. & Aiтth-Kindree, W. (1994) Correlation of buccal mucosal transudate col-lected with a buccal swab and urine levels of cocaine. J. Addict. Dis., 13, 27-33
Liesnard, C., De Wit, L., Motte, 5., Brancart, F. & Content, J. (1994) Rapid diagnosis of cytomegalovirus lung infec-tion by DNA amplification in bronchoalveolar lavages. Mol. Cci Probes, 8, 273-283
McCabe, E.R.B., Huang S.-Z, Seltzer, W.K. & Law, M.L. (1987) DNA microextraction from dried blood spots on filter paper blotters: potential applications to newborn
screening. Hum. Genet., 75, 213-216
McMahon, К.J., Fang, C., Layug, L. & Sandler, S.G. (1995) Pooling blood donor samples to reduce the cost of 11V-1 antibody testing. Viz Sang., 68, 215-219
1vicMurthie, E.J., Potter, J.D., Rohan, T.E. & Hetzel, S.S. (1984) Human cheek cells: a non-invasive method for determininfg tissue lipid profiles in dietary and nutri-tional studies. Nair. Rep. Iпt., 29, 519-526
Mao, L., ‚ruban, R.H., Boyle, J.О., Tockman, M. & Sidraпsky, D. (1994) Detection of oncogene mutations in. sputum precedes diagnosis of lung cancer. Cancer Res., 54, 1634-1637
Murray, G.I. & Ewen, 5.W. (1991) A novel method for optimum biopsy specimen preservation for bistochemi-cal and immunohistochemical analysis. Am. J. Clin. Patlsol., 95, 131436
Nafstad, P., 8оtteп, G., 1-lagen, J.А.; Zahlsen, K., Nilsen, O.G., Silsand, T. & Kongerud, J. (1995) Comparison of three methods for estimating environmental tobacco smoke among children aged between 12 and 36 months. Int. J. Epidemiol., 24, 88-9 4
Nair, G.Q., Shimada, T., Kurazono, H., Okuda, J., Pal, A., Kavasawa, T., Mihara, T., Uesaka, Y., Shirai, H. & Garg, 5. (1994) Characterization of phenotype, serologic, and toxicologic traits of Vibsio Choleric 0139 bengal. J. Clin. Microbiol., 32, 2775-2779
Nielsen, E.W., Johansen, H.T., Straume, B. flumes, Т.E. (1994) Effects of time, temperature and additives on a functional assay of Cl inhibitor. J. immunoL Methods, 173, 245-251
Orlowski E. Pairon, J.C., Ameille, J., Janson, X., Iwasubo, Y., Dufour, J., Bignon, J. & Brochard, P. (1994) Pleural plaques, asbestos exposure and asbestos bodies in bro-choalveolar fluid. Am. J. Ind. Med., 26, 349-358
Ramamurthy, T., Pat, A., Bag, PK., Bhattacharya, S.K., Nair, G.B., Kurazono, H., Yamasaki, S., Shirai, H., Takeda, T. & Vesaka, Y. (1993) Detection of choiera toxin gene in stool specimen by polymerase chain reaction: compari-son with bead enzyme linked immunosorbent assay and culture method for laboratory diagnosis of cholera. J. Clin. Microbiol, 31, 3068-3070
Richards, B., Skoletsky, J., S%uber, А.P., Balfour, R., Stern, R.C., Dorkin, Н.~., Parad, R.B., Witt, D. & Юinger, K.W. (1993) Multiplex PCR amplification from the CFTR gene using DNA prepared from buccal brushes/swabs. Human Mol. Genetics, 2, 159-1 63
Rogan, W.J. & Ragan N.В. (1994) Chemical contami-nants, pharmacokinetics, and the lactating mother. Environ. Health Perspect., 102 (suppl. 11P), 89-95
Roggli, V.L., Coin, P.G., MacIntyre, N.A. & Bell D.Y
235

Application of Biomarkers in Cancer Ерidemiolagy
(1994) Asbetsos content of bronchoalveolar fluid. A com-parison of light and scanning electron microscopic analysis. Acta Cytologica, 38, 502-510
Samеt, J.M., Marbury, M.C. & spengler, J.D. (1988) Ѕtаtе of art: health effects and sources of indoor air pollution. Am. Rev. Respir. Dis., 137, 221-242
Sanz, A.M. & Diaz, R.C. (1995) Selenium in human lac-tation. Nutr. Rev., 53, 159-166
Schiffman, M.H., Van Tassell, R.L., Robinson, A., Smith, L., Daniel, J., Hoover, R.N., Weil, R., Rosenthal, J., Nair, P.1'., Schwartz, S., Pettigrew, H., Curiale, S., Baiist, G., Block, G. & Wilkins, T.D. (1989) Case-control study of colorectal cancer and fecapentaene excretion. Cancer Res., 49, 1322-1326
Schmidt, B.L., Aberer, E., Stockenhuber, C., Kiade, H., Breier, F. & Luger, A. (1995) Detection of BorreIia bцrgdor-fеri DNA polymeease chain reaction in the urine and breast milk of patients with Lyme borreliosis. Diagn. Microbiol. Infect. Dis., 21, 121-128
Shah, S.N., Kohnson, R.C., Minn, K. & Schoenfeld, F. (1995) Ary1su1fatase A and beta-galactosidase activities in leukocytes and lymphocytes from normal and psychi-atric subjects. Effects of blood processing delay aid inter-lеиkiп-2 stimulation. Mol. Chem. NeuropathoL, 24, 43-52
Shield, J.P., Hunt, L.P., Morgan, J.E. & Pennock, C.А. (1995) Are frozen urine for estimating samples acceptable albumin excretion in research? Diabet. Mcd., 12, 713-716
Srivastava, A.K., Gupta, B.N. (1994) The role of human hairs in health and disease with special reference to envi-ronmental exposures Vet. [lam. ToxicoL, 36, 556-560
Statland, B.E., Winkel P. & Harris, S.C. (1978) Evaluation of biological sources of variation of leukocytes count and other hematologic quantities using very precise auto-mated analyzers, Am. J. Clin. PathoL, 69, 48-54
Storch, G.A., Gaudreault-Keener, M. & Welby, P.C. (1994) Comparison of heparin and EDTA transport tubes for detection of cytomegalovirus in leukocytes by shell vial assay, рр65 aritigenemia assay, and PCR. J. Clin. MIcrobial., 32, 2581-2583
Sundberg, A.G., Nilsson, R., Appelkis st, E.L. & Dallner, G. (1995) ELISА procedure for the quantitation of glutathione transferases in the urine. Kidney tnt., 48, 570-575
Thompson, D.М., Brown, N.N. & Clague, А.E. (1992) Routine use of hair root or buccal swab specimens for PCR analysis: advantages over using blood. Clin. Сhim. Acta, 207, 169-174
Umemura, U., Koike, K.A., Sato, S., Iso, H., Shimamoto, T. & Komachi, Y. (1991) The effect of storage on serum fatty acids. Nippon Eisegaku Zasshi, 46, 976-983
van den Brandt, P.A., Goldbohm, R.A., van't Veer, P., Bode, P., Hermus, R.J.J. & Sturmans, E (1993) Predictors of toenail selenium in men and women, Cancer Epidemiol. Biomarkers Prey., 2, 107-112
Wahrendorf, J., Hanck, A.B. & Munoz, N. (1986) Vitamin measurements in pooled blood samples. Am. J. EpidemioL, 123, 544-550
Wallace, L.A. & Pe1lizzari, E.D. (1995) Recent advances in measuring exhaled breath and estimating exposure and body burden for volatile compounds (VOCs). Environ. Health Perspect., 103 (suppl. 3), 95-98
White, I.R., Brurmer, E.J. & Barron, J.L. (1995) A com-parison of overnight and 24 hour collection to measure urinary catecholamines. J. Clin. Epidemiol., 48, 263-267
Winn, D.M., Reichman, М.E. & Gunter, E. (1990) Epidemiologic issues in the design and use of biological specimen banks. Epidemiol. Res., 12, 56-70
World Health Organization (1992) Laboratory Manual for the Examination o fНитпп Semen and Sеmeп-cervical Mucus Interaction (3rd edn), New York, Cambridge University Press, pp. 5-6
Wrensch, M., Petrakis, N.L., King, K.B. & Lee, M.M. (1993) Breast cancer risk associated with abnormal cytol-ogy in nipple aspirates of breast fluid and prior history of breast biopsy. Am. J. EpidemioL, 137, 829-833
Corresponding author N T. Landi Genetic Ерidemiology Branch, EPN 400 National Cancer Institute, National Institutes of Health 6130 Executive Blvd., Bethesda, 10 20892-7360, USA
236

АррГicalion of Biomarkers in fiancer Epidemiology Tonia1o, P., Botfetia, P., Shukеr, D.E.G., Rothman, N. hike, В. aid Pearce N., eds
'ARC 5агепУifiс PuЫicatгoпs No 142 InlernaiionaI Agency for Research on Cancer, Lyon 1907
Issues involving biomarkers in the study of the genetics of human cancer
N. Caporaso and A. Goldstein
The investigation of hereditary factors in human cancer was suggested from kindreds that exhibited aggregations of cancer consistent with Mendelian inheritance. A subset of cancer that exhibits strong familial tendencies is due to single genes that `cause' cancer; more commonly, hereditary factors may influence tumorigenesis in a stepwise probabilistic rather than deterministic manner through a variety of mechanisms, e.g. influencing the disposition of carcinogens. The roles of both common susceptibility genes and rare `familial' cancer genes are receiving increasing attention in the general population. Population-based studies designed to examine more common genetic variants differ from linkage-based studies. Candidate susceptibility genes may be studied by phenotype or genotype approaches, and the relative advantages and dis-advantages of each approach are considered.The issue of gene—environment interaction, implicit in the concept of susceptibility genes, is consideied.The influence of genetic factors on individual and attributable risk is addressed.
Cancer and genetics The general evidence in support of an important role for genes in cancer derives from various inter-related areas: (1) the discovery of specific chromo-somal defects associated with lymphoproliferative (and later other) cancers; (2) the universal obser-vation of somatic mutations in tumours; (3) the role of dominant oncogenes and tumour sup-presser genes in certain tumours; (4) the mapping and cloning of genes specifically accounting for a number of familial cancers; (5) the general obser-vation of increased tumour incidence in relatives of individuals with cancer compared to suitable controls; (6) the relationship between somatic and hereditary mutations in specific tumours such as retinoblastoma; (7) the increased incidence of tumours associated with conditions that damage the genetic material, e.g. the 'chromosome insta-bility syndromes'; (8) the fact that many estab-lished carcinogens are known to damage or disrupt DNA. These lines of evidence can be considered to have clearly established a central role for genetic processes in neoplasia.
Likewise, environmental factors are considered causal for a variety of cancers. A few examples are tobacco and lung cancer aromatic amine exposure
and bladder cancer, and diethylstalbesterone and clear cell carcinoma of the vagina in daughters of exposed women. Our view is that the development of cancer is a complex multistage process, with each step involving a variable mix of environmental and genetic influences. Our knowledge of how these factors act in concert with genes to cause malignancy is currently a patchwork. Three gen-eral areas where further work is needed arе: (1) eti-ological factors responsible for certain cancers remain unknown (e.g. prostate, brain); (2) even for cancers where the environmental agents are well established determinants of individual suscepti-bility are not clear; (3) the mechanism of interac-tion between exposures and genes is poorly under-stood.
Approaches to the study of genetics and cancer и human populations We first briefly consider approaches that have been used to study highly penetrant `single' genes asso-ciated with familial cancers. We will then describe population-based studies of low penetrant, but more common, 'susceptibility genes, thought to contribute to complex disorders. Studies of somatic gene findings will be briefly described.
237

13g14 Cavene et a1., 1983; Sparkes etal.,
1983
11р13-14 Garwin etat, 1995
17g11 Upadhya etal., 1995
22g11-13 Seizinger et al., 1987; Wertalecki
et aL, 1988
Malkin et ai, 1990
Hall et aL, 1990; Albertsen et at, 1994; Miki etа!.,1994; Wooster etaL,1994
5eizingеr, 1988
р16/CDKN2А 9р21
СDК4 12g13
РТСN 9g22
ATM 11q22-q23
APC 5g21
XР (A—G) many 9g34.1, others
h1SN2 2р22 hiLN1 3р21 hРМS 1 2g31-33 !УРMS2 7p22
Application of Biomarkers in Cancer Epidemiology
Table t Genes associated with familial cancer that have been mapped or cloned
..
RelinoЫastoma (retinoblastoma, AB1 osteosarcoma)
Wilms' tumour (WAGR1) WГ2 (WT1)
Neurofibromatosis type i NF7
(neurofibrosarcomas, others)
Neurofibromatosis type 2 (bilateral NF2 vestibular schwanпomas)
Li-Fraumeni (breast, sarcoma, p53 leukaemia, brain)
Familial breast—ovary (breast, ovary) BRCA 1 БRСА2
Von Hiррвl—Lindau (renal cell VIL carcinoma, haemangioblasloma)
CMI (melanoma)
NBCC (basal cell, fibrosarcoma, medijlloblastoma)
Ataxia telangiectasia (lymphoma, leukaemia, breast, others)
Familial adenomatous polyposisl
Gardner syndrome (colon)
Xeroderma pigmentosa (squamous
cell carcinomas, skin, adrenal) -
HNPCC (colon)
Multiple endocrine neoplasia type 1 MEN1 11q 13 (carcinoids, pancreas, parathyroid,
pituitary)
Multiple endocrine neoplasia, type 2A RET 10g11.2 (medullary thyroid, phaeochromocytoma), type 28 (same as 2А)
aWAGR, 'Mirs' tumour, aniridia, genital, renal аЬюгтa]1iе5.
Kamb et a1., 1994; Hussussion st at, 1994; Zuo eta]. 1996
Hahn, 1996; Johnson et a1., 1996
SavitSky et at, 1995
Bodmer et al., 1987; Kinzler et al., 1991;
Nagase et at, 1992; Eckert et at., 1994
Tanaka et at., 1990.
Nicolaides et al.,
1994; Nystrom-Lahti of at, 1994;
Papadopolous etal., 1994
Larson, 1988; Thakker et at, 1993.
Muligan et at, 1993
238

Biomarkers in the study of the genetics of human cancer
Familial cancer and `single gene traits Cancer families have been noted for centuries and family aggregation studies have generally focused on three related questions. Does a significant excess of cancer exist? Is the cause consistent with genetic or environmental causes, or both? If genetic, what is the mechanism of inheritance?
Recognizing rare syndromes that exhibit strong familial aggregations implicated heritable elements in these entities. An initial step is often to test the transmission pattern of disease in families for a fit with Mendelian patterns of inheritance (segrega-tion analysis). Once a genetic pattern is considered likely, linkage studies or other approaches can be used to map the chromosomal location, to be followed by molecular genetic studies to identify the specific genes involved. For certain familial cancers (e.g. retinoblastoma), as well as various inherited syndromes that often include cancer (e.g. Beckwith-Wiedemann and Wilms' tumour), either the cliomosomal location has been identified or the gene has been cloned, or both (Rowley, 1980; Evans, 1993; Knudson, 1993) (Table 1). Gene map-ping depends on the availability of suitable multi-generation families or sibships, accurate diagnosis, biospecimens from which DNA may be isolated, and adequate informative markers (generally increasingly available). `Informative' in this con-text means that the parent (at least one, depending upon the inheritance pattern) must be heterozy-gous at both marker and disease loci. DNA markers are characterized in the laboratory and suitable analytical approaches, software and computational resources are applied to evaluate the 'recombina-tion fraction' (evidence of 'crossing over' between a marker and disease locus). The resulting statisti-cal evidence is expressed as a 'lid' score or log of the odds that a given marker is 'linked' to the cancer, with scores of greater than 3 (1000:1) indicative of linkage (Ott, 1991). Once a suspect location has been identified by this approach, positional cloning (also termed `reverse genetics') can be used to precisely locate and clone the gene. Other approaches are possible. For instance, begin-ning with a particular protein, the amino acid se-quence is used to infer the base pair sequences. Using in-situ hybridization, the chromosomal location may be deduced. Table 1 indicates a number of the major cancer genes identified by these approaches.
Stцdies involving somatic genes Chromosome studies It was recognized in early studies that chromosome aberrations accumulate with the age of a tumour (Boveri, 1917). With the development of better techniques to image chromosomes (i.e. staining of metaphase spreads), it was appreciated that specific chromosome aberrations characterized certain severe multisystem birth defects such as Down syndrome (trisomy 21). In 1960, Nowell & Hungerford (1960) discovered a consistent change in the morphology of a chromosome in blood cells of patients with chronic myelocytic leukaemia (Philadelphia chromosome). We understand today that this translocation involves an exchange of pieces between chromosomes 9 and 22. The break moves the obi oncogene from chromosome 9 to the vicinity of the bcr (breakpoint cluster region) gene on chromosome 22. When these two genes are brought into juxtaposition, increased tyrosine kinase activity results, and enhanced cell division results in proliferation of cells with this clone. A variety of other translocations involved with specific (typically haematopoietic) tumours in-volve similar mechanisms.
Chromosome findings have general importance for cancer. The consistent and specific cytogenetic changes observed with particular tumours aie an important indication that the genetic material is fundamentally involved in the neoplastic process. Chromosome aberrations in familial cancers can provide clues to the location of regions where critical genes may be located. Although the early techniques for studying chromosomes were diffi-cult and time-consuming, early observations of these consistent defects have led to a more precise understanding of molecular pathology at the DNA level. New approaches, such as fluorescent in-situ hybridization (FISH) technology, are revolutioniz-ing the field and rendering the recognition of syn-dromes characterized by chromosome findings much simpler.
Other somatic gene findings Somatic mutations are universally observed in human cancer and are distinguished from hereditary 'single or 'susceptibility' gene changes discussed previously in that they are observed in tumour tis-sue (as opposed to germline DNA) and they are not transmitted to offspring.
239

Application of Biomarkers in Cancer Epidemiology
Loss of heterozygosity studies bave been used to identify regions of gene loss to implicate possible tumour suppresser gene loci for many tumours, including chromosome 13 in retino-blastoma (13g14) and chromosome 3 (Зp) in lung cancer (Yokota et al., 1987). These studies complement chromosome studies and, together with these, have helped to localize the chromo- some abnormalities that characterize various tu-mours. For example, cytogenetic studies led to the identification of Зp deletions in small cell lung cancer (Peng et aI., 1982), an area thought to in-clude more than one tumour suppresser gene, including the recently identified FlIT gene (Sozzi et aL, 1996).
More recent studies have emphasized the rela-tionship of the type, number and specificity of these and other molecular findings to previous exposure history, hereditary factors, tumour type and aggressiveness. Tumour tissue mutations are characterized by special stains (i.e. immunostain- ing for p53) or direct sequencing of DNA extracted from frozen tissue, or, as is increasingly the case, from tumour blocks. Typically, slides cut from adjacent material have undergone pathological verification. Often, microdissection is used to iso-late tumour tissue for special study.
While molecular studies of human tumours have proceeded since the advent of the techniques the variable nature of many findings has led to efforts to examine hypotheses more rigorously using the methods of epidemiology. Three exam-ples of these approaches are considered.
First, it is hypothesized that somatic mutations may reflect specific exposures that caused the cancer. An example is the relationship between aflatox9n B1 and G to T tranversions at codon 249 of p53 in hepatoce11ular cancer from certain areas of China or Africa (Soini et al., 1996). Less specifi-cally, and perhaps consistent with the multiple carcinogens present in tobacco smoke, G to transversions predominate at the p53 locus in smoking-related tumours. UV light results in spe- cific p53 changes (transitions) in skin tumours (Nakazawa et al., 1994). Other genes may exhibit these effects; for example, recently, methylation of the estrogen receptor in lung tumours has been observed to be frequent in plutonium-related tumours but low in tobacco-derived carcinogen-related tumours (Issa et al., 1996).
Second, there is the relationship of somatic mutations to inherited defects. Knudson's (1983) findings in retinoblastoma are the paradigm for this type of relationship, with his observation that retinoblastoma was caused by two mutational events, one on each allele of the same gene. In the inherited form, one mutation is inherited via the germinal cells and a second occurs in a somatic cell due to an environmental insult or chance event. In the sporadic form, both mutations occur in somatic cells. The further observation that these events were accompanied by chromosome changes consistent with a loss of genetic material suggested a gene whose absence was required for cancer, a phenomenon termed `anti-oncogene', but more commonly known today as tumour suppresser gene today. Many of the hereditary cancer syn-dromes listed in Table 1 have been shown to involve genes from this class, e.g. p53 and WT1.
Recently, certain hereditary genes have been associated with somatic gene findings. Two recent examples include increased p53 mutations in GSTMI null subjects with lung cancer (McGlynn et al., 1995; Ryberg et al., 1994), and, in a series of patients with colon cancer, rapid acetylators (NAT2) were more likely to exhibit K-ras gene mutations than intermediate or slow acetylators (Ida et al., 1994).
Finally, somatic mutations are thought to indi-cate something about the degree of aggressiveness of the underlying cancer and may be related to stage, grade or clinical behaviour of the tumour. As observed by Boveri and many others, increased mutations are observed in advanced or poorly dif-ferentiated tumours. The presence or absence of chromosomal abnormalities predicts survival in chronic lymphocytic leukaemia (Criel et a1., 1997). Aneuploidy and other molecular or chromosome findings are related to bladder cancer aggressive-ness (Walmau et al., 1991; Esrig et al., 1994). An elaborate example of somatic mutations and tumour progression was provided by Vogelstein et ad. (1988) with the demonstration of a series of molecular events characterizing progression from polyp to cancer to metastasis.
It should be appreciated that there are many types of somatic `genetic' markers that involve the genetic material indirectly. A classic example is sister chromatid exchange, while telomere shortening (Sharma et al., 1996) is a more recent
240

Biomarkers in the study of the genetics of human cancer
example. In each of these cases, study designs attempt to associate the finding with markers of exposure, susceptibility or effect (disease type, pro-gression) using biomarkers. Study design issues and methodological consideration in this 'molec-ular epidemiology' approach have been described (Ретеrа, 1982; McMichael, 1994).
Inborn errors of metabolism and the idea that genetically controlled influences on metabolism can determine disease In 1908, Archibald Garrod described four rare recessively inherited conditions: albinism, alkap-tonuria, cystinuria, and pentosuria. He postulated that these disorders were due to genetically based defects in normal biochemistry. He termed these 'inborn errors in metabolism' (Scriver et al., 1995). This idea was а fertile concept for human disease etiology, initially for providing a genetic explaria-tion for these conditions (perhaps the first descrip-tion of an autosornal recessive disorder), but also for suggesting that biochemical diversity is the substrate upon which natural selection may act. Although the expression of genetic traits exhibits variability due to both environmental factors and the genotype, the inborn errors are highly pene-trait in that virtually all those who inherit the trait exhibit features of the disease. This follows from the fact that the biochemical disorder involves endogenous metabolic processes, and therefore the consequence of the blocked pathway is unavoid-able given the ubiquitous presence of the endoge-nous substrate (Scrivnеr et аL, 1995). A related class of phenomenon is distinguished from the inborn errors in that an inherited defect involves the aber-rant metabolism of an extrinsic agent. The latter group are termed pharmacogenetic disorders (Kalow, 1962). This class of disorders 1s distin-guished in that no disturbance is present in an individual with the trait until they are exposed to the particular medication dependent on the vari- ant enzyme. Examples of this class of disorders are glucose-6-phosphate dehydrogenase (G6РD) defi-ciency, the porphyrias and malignant hyperther-rrlia. Since carcinogens both require metabolic acti- vation and are also subject to metabolic processes that facilitate elimination the existence of variant versions of the enzymes that control these processes might be expected to alter susceptibility to the particular cancers.
Early studies of low penetrarace gees and cancer in the general population While the study of the highly penetrant 'single' genes would proceed through the approaches described earlier in cancer families, investigators looking for the more subtle effects of weaker 'sus-ceptibility' genes would use different approaches, based on investigations set in the general popula-tion. There were four studies that established an interest in susceptibility to cancer and this class of genetic traits between 1973 and 1984. The first was the study of the phenotype of lymphocyte induci-bility of (CYPIA1-dependent) aryl hydrocarbon hydroxylase activity (Kellermann et al. (1973). Three other studies in the 1980s were crucial. Ayesh (1984) studied debrisoquine metabolism (CYР2D6) in relation to lung cancer. Lower et al. (1979) examined the N-acetylation phenotype (NAT2) in aromatic amine-related bladder cancer using a sulfa probe drug, and seidegard et al. (1986) examined glutathionе-S-transferase mu activity (by measuring trans-stilbene oxidation in erythrocytes) (GSTM2) in relation to lung cancer. These studies had aspects that distinguished them from both prior and more modern studies. As described above, early cancer genetic studies were based on rare familial aggregations of cancer that were recognized climcaly. The clinical phenotype was used to identify affecteds in order to initiate gene mapping studies, sometimes aided by a cyto-genetic abnormality that would offer a clue to a gene location. In contrast, this new population-based approach selected a gene of interest (actually a phenotype, since there was no convenient method to identify the genotype at the time of these studies), generally based on a mechanistic hypothesis, i.e. bladder cancer should be more likely in individuals who are deficient in their genetically determined ability to inactivate aryl amines (i.e. bladder carcinogens). A population-based approach was required because the traits of interest derived from low penetrance genes. Thus, large numbers of study subjects were required to achieve the statistical power to detect the postu-lated differences in risk between the gene types. The phenotype was recognized, not by clinical find-ings (as in the inborn errors of metabolism), but rather through the use of a probe drug in two of the four studies (to determine a `metabolic pheno-type'), or in-vitro assay in the other two studies. In
241

Application of Biomarkers in Cancer Epidemiology
Consideration Phenotype Genotype
Advantages Historically validated approach Identifies heterolhomozygous subjects Reflects physiological, in-vivo disposition Technology evolving rapidly of drug Simple, requires only germline DNA sample Reflects impact of inducers, inhibitors Invariant to illness, diet, medications, etc.
Can be performed with micro-quantities Non-invasive samples (i.e. mouth wash, paraffin)
Disadvantages Potentially distorted by numerous factors, Functional status often requires study i.e. drug—drug interaction Some variants unknown Analysis typically more complex Ethical questions arise since DNA may be used More patient cooperation required for other tests Phenotyping protocols poorly adapted to Allelic heterogeneity field study Invasive, time-consuming nature of test . causes many exclusiohs .
contrast to the studies that characterized the inborn errors of metabolism (based on the recog-nition of a clinical phenotype), slow acetylators (e.g. of naphthylaniine, bladder carcinogen) or poor metabolizers (of debrisoquine) exhibit no obvious clinical findings, and it is only upon challenge with the appropriate agent that differences in drug metabolism can be detected or clinical sequelae recognized. The probe drugs used to characterize the phenotype were of course innocuous non-cardnogens. While the phenotyping method of study is still used, modern studies increasingly depend upon direct identification of a genotype, arid the advantages and disadvantages of each approach are summarized in Table 2.
In pharmacogenetic conditions, the phenotype does not always result in clinical sequelae, i.e. the condition is not fully penetrant. In pharmacogenetic conditions, acute sequelae result from specific ex-posures, typically to pharmaceutical agents (but also xenobiotics, carcinogens or endogenous compounds) that have some aspect of their metabolism zt depen-dent upon the enzyme (Or receptor, immune factor or other element) that is subject to pharmacoge-netic variability. The term 'еcоgепеhсs' has been used to emphasize that agents that may be subject
to this unusually high degree of metabolic variation are not limited to medications (Khoury et al., 1988). Chronic conditions are thought to occur with altered frequency based on exposures over time to specific agents subject to this type of variability.
Over the last 10 years, many other genes have been studied in relation to various tumours. These have been reviewed recently (D'Erricco etaL, 1996). The genes of interest, mechanistic basis and phenotype/genotype approaches are listed in Table 3.
Broadening the proposed mechanism of low penetrance genes beyond metabolism Early studies of cancer susceptibility focused on the idea that variation in enzymes made individuals activate or deactivate carcinogens differently, accounting for differences in susceptibility. For instance, cancer etiology, development, progres-sion or prognosis may be influenced by hormones (breast and estrogen; prostate and androgen), infectious disease (Helicobactor pylori and gastric; hepatitis and liver cancer), and nutrient intake or immune factors. Examples of these mechanisms, and the genes that may influence them are listed in Table 4.
242

Biomarkers ln the study of the genetics of human cancer
Methodological issues in studies of susceptibility genes in the population Phenotype/genotype issues. With regard to low penetrance gene/cancer association studies, early phenotype-based work typically required the administration of a probe drug followed by the col-lection of a timed urine or blood sample. Given that it may be efficient to determine the status of a number of polymorphic traits at once, a'cocktail' approach (i.e. administration of multiple probe drugs) has been used as data have shown that cer-tain combinations of probes aie safe and do not result in interference (Branch et al., 1995). While
в a в в г в
phenotype approaches continue to be supplanted by genotype investigations, many new phenotypes with cancer associations (e.g. the bleomycin sensi-tivity assay and lung cancer, DNA repair assay and skin cancer) continue to be proposed (Cuis, 1996). It is therefore worthwhile to consider the advantages and disadvantages of each approach (Table 2) and the types of studies needed to vali-date these approaches.
Phenotyping studies: methodological issues. The dif-ficu[ties involved in establishing a phenotyping approach as appropriate for population-based
Gene Mechanism Phenotype
I1l в
Genotype Hypothesized cancer
СУРIA1 Activates benzo[a]pyrene, AHI activity in lymphobIasts MspI, exon 7 Lung (Kellerman et ai,
. role in estrogen polymorphisms 1973), Breast (Taint oral.,
metabolism (?) 1995)
СУР1A2 Activates heteroсусцс Caffeine breath test, Under investigation Bladder, colon (Lang
amuies, aryl amines caffeine urine, saliva et a1., 1994)
metabolites
СУР2p6 Nicotine? Debrisoquine,. Inactivating and Lung (Ayesh et al.,
dextromethorphan partially iеactivadng 1984)
metabolism mutations exist
СУР2E1 Activates low molecular Polymorphisms Nasopharyngeal
weight nitrosamines, studied but function carcinoma (Hildesheim
alcohol-inducible poorly characterized et al., 1995), lung (Uematsu etat, 1991)
GSTM1 Detoxification of epoxides Trans-stilbene oxide in RBCs Absent gene Lung (seidegard et at,
. 1986), bladder (Bell et at, 1993)
G5TT1 Detoxitication of ethylene No Absent gene Myelodysplastic syndrome
oxide, butadiene (Chen et a1., 1996)
NAT2 . Detoxification of aromatic Caffeine or sulfa Eviulations recognized Bladder (occupational .
amines metabolites exposure-related) (Cartwright et al., 1982), breast (Ambrosone et al. 1996)
NAT1 Detoxification of aromatic ? Variants recognized Gastric, bladder colorectal
amines (Bell et a1., 1995)
243

Application of Biomarkers in Cancer Epidemiology
Gene category Gene example Cancer site
Dominant oncogene ret, ras, rye Lung, others
Tumour suppresser genes p53, rb Lung, bladder, others (Wu et al., 1995)
Hormones Steroid metabolism Prostate, breast, endometrium (Carey etal., 1994)
Hormone receptor Estrogen, progesterone and Breast, endorneirium, (Fuqua et al., 1991), апдrодеп receptor prostate (Irvine etal., 1995)
Vitamins Vitamin D, bic acid, В12 Prostate (Taylor et al., 1996), other medical illnesses (Jacques et al., 1996)
Alcohol metabolism ADN, ALDH Oral cancer (also cirrhosis, alcoholism)
Nicotine metabolism СYP2D6, СУP2В6 Smoking-related cancers (also COPD, others)
Addiction Dopamine receptors Smoking- and alcohol-related cancers (Comings etal., 1994)
DNA repair XP, X-linked lymphoproliterative Skin cancers, Burkitt lymphoma, others syndrome, AT Hanawalt etal., 1996
Immune function 'LA Various rheumatological conditions
studies are substantial. As an example, we briefly review some work with the debrisoquine pheno-type, а well-established example after two decades of work. It was discovered in the 1970s that after administration of debrisoquine, certain individuals (poor metabohzers) suffered prolonged hypoten-sive episodes. Population studies established that 10% of the general population was deficient in the enzyme required to hydroxylate the drug. A fre-quency histogram of phenotype values in a Western population exhibits a clear bimodal dis-tribution. Family studies demonstrated that this deficiency was inherited (Evans et al., 1980). The safety and feasibility of administering a tracer dose of debrisoquine had to be established in a clinical setting (Green-Gallo et al., 1991). Circadian varia-tion, the precise time necessary to establish a sta-ble phenotype (number of hours of urine collec-tion), recent diet, the influence of concurrent med-ications, and the comparability of day and night protocols to perform phenotyping were examined (Shaw et al., 1990; Caporaso et cL, 1994). An issue that often clouds the interpretation of cancer asso-
ciation studies involving phenotypes is 'effect–cause' bias—i.e. could disease itself (or related treatment, nutritional status, etc.) alter the phenotype and bias study. Early studies showed that the debrisoquine metabolic ratio was unre-lated to stage, grade or performance status in 92 patients with lung cancer, and a later, more defin-itive study showed that the metabolic ratio was invariant in individuals undergoing curative resec-tion for lung cancer (5hаw et al., 1994).
Assigning the phenotype. The result of debrisoquine phenotypirng can be expressed as a ratio (the meta-bolic ratio, mr, is the molar ratio of parent drug to chief metabolite in the timed urine sample). This continuous variable must be assigned an ordinal category to specify a phenotype. One approach involves the use of a mixture model to analyse the overall distribution of mrs into phenotypic com-ponents. The resulting proportions may be com-pared with those expected under Hardy Weinberg equilibrium. Parameter estimates for one-mix and two-mix models can be compared with a likeli-
244

Biomarkers in the study of the genetics of human cancer
hood ratio x2 test. This approach can be applied to assign cut-points for any pharmacogenetic study that involves the use of а probe drug (Caporaso et aL, 1989). As it has become more common for both phenotype arid genotype information to be available, receiver operator curve approaches are an alternative to assign cut-points (DeLeo, 1993). Early studies of pharmaсogеnеtic variation have relied exclusively on the phenotype, while ad-vances in molecular biology have increasingly sup-planted this approach with direct determinations of the genotype. Attractive features of genotyping include the avoidance of effect-cause bias and the attendant difficulties of phenotyping, and the pos-sibility of identifying heterozygotes. While the relationship between the two study approaches is dynamic and evolving, some of the general strengths and weaknesses of each approach are indicated in Table 2.
Some general methodological issues involved in the selection of candidate low penetrance genes for population studies A variety of factors can enter into the considera-tion of whether a proposed susceptibility factor is a worthy candidate for study. A list of questions should include the following:
• Is the trait stable in the individual? (Intra-individual variability should be small.) • Does the trait vary in the general population? (Interindividual variation should be large.) • Can diet, medications, circadian variation, dis- ease or nutritional status distort phenotyping? • Does the trait vary by ethnicity, age, gender, smoking, alcohol consumption, body weight, etc.? (Distorting factors should be understood so they can be controlled by design or adjusted for in the analysis.) • Is the phenotype subject to induction or inhibition? If so, to what extent is the pheno-type `fixed' (i.e. subject to hereditary control), and to what extent do exogenous factors con-trol it? • Is the trait genetically controlled? (Have family studies demonstrated a mode of inheritance?) • Does the gene have a plausible mechanism for involvement with cancer? • Does the proposed substrate for the gene have any relation to cancer? (Is a procarcinogen acti- vated, or cardnogen detoxified? Is there some other plausible mechanism, i.e. involving a nutrient, oncogene, receptor, hormone, etc.?) • Are gene variants known, and do they have functional significance? Will all the important
^ в в 1
High penetrance Low penetrance
Role Tend to be 'causal', i.e. necessary Allele alters susceptibility, but is neither
arid sufficient to result in disease necessary nor sufficient for disease causation
Example Brcai (breast/ovary) CYP1A1 (lung)
АРС (polyposis coli) СYР2D6 (lung)
RB (retinoblastoma) GSТ-M1 (lung, bladder)
Gene type Mutation Polymorphism
Study setting Family General population or epidemiological studies
Strength of association High (RR often з 200) Low to moderate (RR, 2-10)
Relative or absolute risk High Low
Population attributable risk Low High
Gene—environment interaction secondary arid variable Primary and implicit
Role of environmental exposure Secondary and variable Critical
245

1 1.6 2.3 3 3.6
Application of Biomarkers in Cancer Epidemiology
Relative risk
PPV
PAR
Figure 1. Positive predictive value (PPV) population аttributаые risk (PAR)for a common' susceptibility gene.
variants (polymorphisms) described in the population be studied? • 1s the gene known to act in a relevant organ? This may be the liver or the specific organ of the primary tumour. • Have any studies in humans been performed? Have epidemiological studies in humans been-carried out? If so, do the accumulated data sup-port further study?
•Summary of contrasts between high and low penetrance gene studies There are certain contrasts between genes identi-fied and studied in the context of families, i.e., the high penetrance 'single' genes listed in Table 1, and the low penetrance population-based studies suitable for the study of the susceptibility genes as described in Tables 2 and 5. These contrasts are summarized in Table 2. The 'rare' genes are associ-ated with high relative and absolute risks but low attributable risk, while the common genes exhibit the apposite qualities, i.e. modest relative and absolute risks but large attributable risk.
There are contrasts between the implications of 'single' and 'susceptibility' genes for the individ-ual and for public health. These aie illustrated by a consideration of the positive predictive value (PPV, individual risk given a positive test) and the popu-lation attributable risk (or PAR, public health bur-den due to the disease, based on the combination of the at-risk genotype plus the relevant exposure)
(Fig. 1). The calculations are based upon a method described by Khoury & James (1993) and are applied to a candidate susceptibility factor (GSTM1) studied in relation to lung cancer. PPV and PAR are calculated over a range of relative risks observed tri published studies and assuming the following: the prevalence of relevant exposure is 35/0 (cigarette smoking). The risk of disease (lung cancer) is assumed to be non-zero in the absence of the gene. The relative risk of the exposure (tobacco smoking) is arbitrarily estimated at 10. A 'type 2 interaction', i.e. the gene does not result in increased risk in the absence of exposure (which is plausible, consider-ing that lung cancer is rare in non-smokers), is assumed (Khoury & James, 1993).
The following conclusions are suggested from the graph. PAR is relatively high, while PPV is only modestly elevated, especially within the likely range of odds ratios, between 1 and 2. This sug-gests that this gene will have no role in screening or clinical testing and that clinical relevance to the individual is limited. The increase in the PAR, how-ever, is significant, even with a modestly increased odds ratio. Because both the gene and the disease are common, even with the a 1.5 odds ratio, the burden of disease in the population, due to the gene (in the presence of exposure) is substantial.
References Albertsen, H., Plaetke, R., Ballard, L., Fujimoto, L, Соппоlly, J., Lawrence, E., Rodriguez, P., Robertson, M., Bradley, P., Milner, B., l uhrman, D., Marks, A., Sargent, R., Cartwright, P., Matsunami, N. & Wыtе, R. (1994а) Genetic mapping of the BRCAI region on chromosome 17g21. Am. J. Hum. lea et., 54, 516-525
Аmbrosone, C.S., Freudenheim, J.L., Graham, S., Marshall, J.R., Vena, J.E., Brasure, J.R., Michalek, A.M., Laughlin, R., Nemoto, T, Gillenwater, K.A., Harrington, A.M., Shields, P.G. (1996) Cigarette smoking, N-acetyl-transferase 2 genetic polymorphisms, and breast cancer risk. J. Am. Med. Assoc., 276, 1494-1501
Ayesh, R., Idle, J.R., Юсhie, J.С., Crothers, M.J. & Hetzel, M.R. (1984) Metabolic oxidation phenotypes as markers for susceptibility to lung сапсеr. Nature, 312, 169-170
Bell, D.A., Stephans, E.A., Castranio, T., Umbach, D.M., Watson, M., Deakin, M., Elder, J., Hendrickse, C., Duncan, H. & Strong, R.C. (1995) Polyadenylation poly-morphism in the acetyltransferase 1 gene (NAIl) increases risk of colorectal cancer. Cancer Res., 55, 353 7-35 42
246

Biomarkers in the study of the genetics of human cancer
Bell, D.A., Taylor, J.A., Paulson, D.F., Robertson, C.N., Mohler, J.L. & Lucier, G.W. (1993) Genetic risk and car-cinogenesis exposure: common inherited defect of the carcinogen-metabolism gene glutathione S-transferase 11 (GSТМ1) that increases susceptiЫlity to bladder can-cer. J. Nati Cancer Inst., 85, 1159-1164
Bodmer, W.F., Bailey, C.J., Bodmer, J. (1987) Localization of the gene for familial adenomatous polyposis on chro-mosome 5. Nature, 328, 614-616
Boveri, T.H., Zur Frage der Entstehung malignes Tunioren. Jemma, 1914, pp. 25-41
Branch, R.A., Chern, H.D., Adedoyiri, A., Romkes-Sparks, M., Lesnick, T.G., Persad, R., Wilkinson, G.R., Fleming, C.M., Dickinson, A.J., Sibley, G. (1995) The procarcino-gen hypotheses for bladder cancer: activities of indivjd-ual drug metabolizing enzymes as risk factors. Pharmacogenetics, 5, spec. No. 597-102
Caporaso, N., Pickle, L.W., Bale, S., Ayesh, R., Hetzel, M. & Idle, J. (1969) The distribution of debrisoquine meta-bolic phenotypes and implications for the suggested association with lung cancer risk. Genet. Epidemiol., 6, 517-524
Caporaso, N., Whitehouse, J., Monkman, 5., Boustead, C., Issaq, H., Fox, S., Morse, M.A., Idle, J.R. & Chung, F.-L. (1994) In vitro but not in vivo inhibition of CУP2D6 by phenethyl isothiocyaaate (PEITC), a constituent of watercress. Pharmacogenetics, 4, 275-280
Carey, A.H., Waterworth, D., Patel, K., White, D., Little, J., Noveni, P., Franks, S. & Williamson, R. (1994) Polycystic ovaries and premature male pattern baldness are associated with one allele of the steroid metabolism gene СУР17. Hum. Mol. Genet., 3(10), 1873-1876
Cartwright, R.A., Glashan, R.W., Rogers, H.J., Ahmad, R.A., Barham-Hall, D., Higgins, E. & Kahn, M.A. (1982) Role of N-acetyltransferase phenotypes in bladder car-cinogenesis: a pharmacogenetic epidemiological approach to bladder cancer. Lancet, 2, 842.-845
Cavenee, W.K., Dryja, T.P., Philips, R-A., Benedict, W.F., Godbout, R., Gallie, B.L., Murphee, A.L., Strong, L.C. & White, R.L. (1983) Expression of recessive alleles by chro-mosomal mechanisms in retinoblastoma. Nature, 305, 779-784
Cavenee, W.K., Murphree, А.L., Shu11, M.M., Benedict, W.F., Sparkes, R.S., Koch, E. & Nordenskjold, Zvi. (1986) Prediction of familial predisposition to retiпоыastоma. New Engi. J. Med., 314, 1201-1207
Ctien, H., Sandier, D.P., Taylor, J.A., Shore, D.L., Liu, E., Bloomfield, C.D. & Bell, D.А. (1996) Increased risk for myelodyspIastic syndromes in individuals with glu-tathione theta 1(GSTTI) gene defect. Lancet, 347, 295-297
Chissoe, S.L., Bodenteich, A., Wang, Y.F., Wang, Y.P.,
Bunan, D., Clifton, S.W., Crabtree J., Freeman, A., Iyer, K. & Jian, L. (1995) Sequence and analyses of the human ABL gene, the BCR gene, and region involved irn the Philadelphia chromosome translocation. Genomics, 27, 67-82
Cloos, J. (1996) Mutagen sensitivity: a phenotype reflecting susceptibility to head and neck squamous cell camel noma. Amsterdam
Comings, D.E., Muhleman, D., Ahn, C., Gysin, R. & Flanagan, S.D. (1994) The dopamine D2 receptor gene: a genetic risk factor for substance abuse. Drug and alcohol dependence, 34, 175-180
Criel, A., Verhoef, G., Vlietinck, IL, Mecucci, C., Billet, J., Michaux, L., Ieeus, P., Louwagie, A., Van Orshoven, A., Van Hoof, A., Boogiertes, M., van den Berghe, H., & DeWoIf-Peeters, C. (1977) Further characterization of morphologically defined typical and atypical CLL; a clin-ica1, immunophenoxy cytogenetic and prognostic study of 390 cases. Br. J. HaematoL, 97, 383-391
D'Erricco, A., Taioli, E., Xiang, C. & Vineis, P. (1996) Genetic metabolic polymorphisms and the risk of can-cer: a review of the literature. Biomarkers, 1, 149-1731
Eckert, W.A., Jung, C. & Wolff, G. (1994) Presymptomatic diagnosis in families with adenomatosis polyposis using highly polymorphic dioucleotide CA repeat markers flanking the Аr'С gene. J. Med. Genet., 31, 442-447
Esrig, D.E., Elamjian, D., Groshen, S., Freeman, J.A., Stein, J.P., Chen, S.C., Nichols, P.W,, Skinner, D.G., Jones, P.A. & Cote, R.J. (1994) Accumulation of nuclear p53 and tumor progression fn bladder cancer. N. Eпgl. J. Med.,
331, 1259-1264
Evans, H.J. (1993) Molecular genetic aspects of human cancers: The 1993 Frank Rose Lecture. Br. J. Сaпсеr, 68, 1051-1060
Evans, D.A.P., Mahgoub, A., Sloan, T.P., Idle, J.R. & Smith, R.L. (1980) A family and population study of the genetic polymorphism of debrisoquine oxidation in a white British population. J. Med. Genet., 17, 102-105
Fearon, E.R., Cho, K.R., Nigro, J.M., Kern, S.E., Simons, J.W., Ruppert, 3.1v1., Hamilton, S.R., Preisinger, A.C., Thomas, B., Kinkier K.W. et al. (1990) Identification of a chromosome 18q gene that is altered in colon cancer. Science, 247, 49
Fuqua, S.A.W., Hî11, S.M., Chamness, G.C., Benedix, M.G., Greene, G.L., O'Malley, B.W. & McGuire, W.L. (1991) Progesterone receptor gene restriction fragment length polymorphism in human breast tumors. J. Nati CяncerInst., 83, 1157-1160
Gawin, B., Klamt, B., Konig, A., Thate, C., Le Paslier, D., Chumakov, I., Bhogal, R., Zehetne r, G., Bruns, G. & Gessler, M. (1995) An integrated YAC clone for the
247

Application of Biomarkers in Cancer Epidemiology
WAGR region on human chromosome 11р13-р14.1. Genornics, 30, 37-45 .
Green-Gallo, L.A, Buivgs, D.M., Fisher, K.L., Caporaso, N., Slawson, R.G., Elias, G., Didolakar, M.S., Ivusich, W.I. & Resau, J.H. (1991) A protocol for the safe administra-tion of debrisoquine in biochemical epidemiologic research protocols for hospitalized patients. Cancer, 68, 206-210
NA., Ding, W,, I-Iussey, C.,Tran, T. Miki, Y. & Weaver-Feld, . (1994) Analysis of p16 gene (CDKN2) as a candi-date locus for the 9p melanoma susceptibility locus. Nature Genet., 8, 23-26
Kellerman, G., Shaw, C.R. & Luyten-Kellerinan, M. (1973) Aryl hydrocarbon hydroxylase inducibility and bronchogenlc carcinoma. New EngL J. Med., 289, 934-937
Haas, О.A., Argyriou-Tirita, A. & Lion, T. (1992) Parental Khoury, M.J., Adams, Jr, M.J. & Flanders, W.D. (1988) An origin of chromosomes involved in traпsloсапon t(9,22). epidemiologig approach to ecogenetecs. Am. J. Horn. Nature, 359, 414-416 Genet., 42, 89--95
Hall, J.M., Lee, M.K., Newman, B., Morrow, J.E., Anderson, L.А., Huey, B. & King, M.C. (1990) Linkage of early-onset beast cancer families to chromosome 17g21. Science, 250, 1684-1689
Hanawalt, P.C. (1996) Role of transcription-coupled DNA repair in susceptibility to environmental carctuogenesis. Environ. Health Perspect., 104, Suppl. 3, 547-551
Hilldesheim, A., Chen, C.J., Caporaso, N.E., Cheng, Y.J., Hoover, R.N., Hsu, M.M., Levine, Р.~., Chen, I.14., Chen, J.Y., Yang, C.S., Daly, A.K. & Idle, J.R. (1995), Cytochrome Р4502Е1 genetic polymorphisms and risk of nasopha-ryngeal carcinoma: results from a case-control study con-ducted in Taiwan. Cancer EpidemioL Biomarkers Prey., 4, 607-610
Hussussron, C.J., Struewing, J.P., Goldstein, A.M., Higgins, P.A.T., Ally., D.S., Stratan, M.D., Clark, W.H., Jr, Tucker, M.A. & Dracopoli, N.C. (1994) Germline p16 mutations in familial melanoma. Nature Genet, 8, 15-21
Irvine, R.A., Yu, M.C., Ross, R.K. & Coetzee, G.A. (1995) The CAG and GGC microsatellites of the androgen receptor gene are in linkage disequilibrium in men with prostate cancer. Cancer Res., 55, 1937--1940
Issa, J.-P.L, Baylin, S.B. & Belinsky, S.A. (1996) Methylation of the estrogen receptor CpG island in lung tumors is related to the specific type of carcinogen expo-sure. Cancer 11es., 56, 3655-3658
Jacques, Р.F., Bostom, A.G., Willaims, R.R., Ellison, R.C., Eckfeldt, J.Н. etal. (1996) Relation between folate status, a common mutation in methylenetetrahydrofolate reductase, and plasma homocysteine concentrations (1996). Circulation, 93(1), 7-9
Johnson, R.L., Rothman, А.L., Xie, J., Goodrich, L.V., Bose, J.W., Bordfas,J.M., Quinn, A.G., Myers, R.M., Cox, DR., Epstein, E.Н. & Scott, M.P. (199 6) Human homolog of patched a candidate gene for the basal cell nevus syn-drome. Sdeпce, 272, 1668-1671
Kalow, W. (1962) Pharmacogenetics: heredity and response to drugs. Philadelphia, W.B. Saunders
Kamb, A., Shattuck-Eidens, D., Eeles, R., Liu, Q., Gruis,
Khoury, M.J. & James, L.M. (1993) Population and famil-ial relative risks of disease associated with environmen-tal factors in the presence of gene-environmental triter-action. Am. J. Epidemiol., 137(11), 1241-1250
Kйzler, K.W., Nilbert, IC., Vogelstein, B., Bryan, T.M., Levy, D.S., Smith, K.J., Preisinger, А.C., Hamilton, S.R., Hedge, P., Markham, A. et al. (1991) Identification of a gene at chromosome 5g21 that is mutated in colorectal cancer. Science, 251, 1366-1370
Knudson A.G. (1993) All in the (cancer) family. Nat. Genet., 5, 103-104 .
Knudson, A.G., Hethcote, H.W. & Brown, B.W. (1975) Mutation and childhood cancer: a probabilistic model for the incidence of retinoblastonsa. Proc. Soc. Natl Acad. Sd. USA, 72, 5116
Knudson, А.G. (1983) Model hereditary cancers of man. Prig. Nod. Acid Res. Mol. В[oI., 29, 17-25.
Lang, N.P., Butler, M.A., Massengill, J., Lawson, M., Stotta, R.С., et ы. (1994) Rapid metabolic phenotypes for acetyltransferase and cytochrome Р4501А2 and putative exposure to food-borne heterocycic amines increase the risk for colorectal cancer or polyps. Cancer Epidem loi. Biornarkers Prey., 3, 675-682
Lee, WI-I,, et al. (1979) Human retinoblastoma suscepti-bility gene: cloning, identification, and sequence. Science, 235, 1394
Lohmann, D., Horsthemke, B., Gillessen-Kaesbach, G., Stefani, LI. & Hofler, H. (1992) Detection of small RB1 gene deletions in retinoblastoma by multiplex PCR and high resolution gel electrophoresis. Hum . Genet., 89(1), 49-53
Lower, G.М., Nilsson, T., Nelson, С.E., Wolf, H., Gamsky, Т.E. & Bryan, G.T. (1979) N-Acetyltransferase phenotype and risk in urinary bladder cancer: Approaches in mole-cular epidemiology. Preliminary results in Sweden and Denmark. Environ. Health Perspec., 29, 71-79
Malkin, D., L1, F.P., Stong, L.C., Fraumeni, J.F. Jr, Nelson, C.E., Khn, D.H., Kassel, 1J., Gryka, M.A., Bischoff, F.Z., & Tainsky, M.A. (1990) Germline p53 mutations in a fami1-
248

Biomarkers in the study of the genetics of human cancer
lai syndrome of breast cancer, sarcoma, and other neo-plasms. 5сјепсе, 250, 1233-1238
McGlynn, K.A., Rosvold, E.A., Lustbader, E.D., Hu, Y. et aL (1995) Susceptibility to hepatoce11ular carcinoma is associated with genetic variation in the enzymatic detox-ification of aflatoxin B1. Proc. Nat! Asoc. ScL, USA, 92, 2384-2387
McMichael, A.J. (1994) "Molecular epidemiology" - new pathway or new traveling companion. Am. J. EpidemioL, 140, 1-11
Miki, Y., Swensen, J., Shattuck-Eidens, D., Futreal, P.A., Harshman, K., Tavtigian, S., Liu, Q., Cochran, C., Bennett, L.M. & Ding, W. et aL(1994) A strong candidate for the breast and ovarian cancer susceptibility gene BRCA1. Science, 266, 66-71
Mulligan, L.M., Kwok, J.B., Healey, С.S., Elsdon, M.J., Eng., C., Gardner, Е., Love, D.R., Mole, S.E., Moore, J.K, Papi, L. (1993) Germ-line mutations of the RET proto-oncogene in multiple endocrine neoplasia type 2А. Nature, 363, 458-460
Nagase, H., Miyoshi, Y, uni, A., Ogawa, M., Utsunomiyi, J., Baba, S., SaSаzukf, T. & Nakamura, Y. (1992) Correlation between the location of germline mutations in the APC gene and the number of colorec-ta1 polyps in familial adenomatosis polyposis patients. Cancer 1! es., 52, 4055-4057
Nakazawa, H., English, D., Randell, P.L., Nakaema, K., Matel, N., Armstrong, B.K., Yaroasaki, H. (1994) UV and skin cancer: specific p53 mutations in normal skin as a biologically relevant exposure measurement. Proc. Nat! Acid. Sc!., USA, 91, 360-364
Nicolaides, N.C., Papadopoulos, N., Wei, Y.F. (1994) Mutations of two PMS homologues in hereditary non-polyposis colon cancer. Nature, 371, 649
Nowell P.C. & Hungerford, D.A. (1960). A minute chro-mosome in human chronic granulocytic leukemia. Science, 132, 1497
Nystrom-Lahti, M., Parsons, R., Sistonen, P., Pylkkanen, L., Aaltonen, L.A., Leach, F.S., Hamilton, S.R., Watton, P., Bronson, E., Fusaro, R., et al. (1994) Mismatch repair genes on chromosome 2p and Зр account for a major share of hereditary nonpolyposis colorectal cancer fami-lies evaluable by linkage. Am. J. Hum. Genet., 55, 659-665
Ida, Y., Tanaka, M. & Nakanishi, L (1994) Relation between the occurrence of K-ras gene point mutations and genotypes of polymorphic N-acetyltiansferase in human colorectal cancer carcinmomas. Carcinogenesis, 15 (7) 1365-1369
thyashiki, ~.H., Ohyasbiki Km Fujimura, T., Kawakubo, K., shimamoto, T., Iwabuchi, A. & Toyama, К.(1994)
Teloinere shortening associated with disease patterns in myelodysplastic syndromes. Cancer Res., 54, 3557-3560
Ott, J. (1991) Analysis o f human genetic Iinkage. Baltimore, MD, The Johns Hopkins University Press
Papadopoulos, N., Nicolaides, N.C., Wei, У.P., Ruben, S.M., Carter, K.C., Rosen, C.А. Haseltine, \W.A., Fleishmann, R.D., Fraser, C.M. & Adams, M.D. (1994) Mutation of a mutL homolog on hereditary colon cancer. Science, 263, 1625-1629
Perera F.P. (1982) Molecular cancer epidemiology: a new tool in cancer prevention. J. Nat! Cancer Inst., 78, 887-898
Rowley, J. Chromosome abnormalities in cancer. (1980) Cancer Genet. Cyto., 2, 175
Ryberg, D., Kure, E., Lystad, 5., 5kaug, V., Strageland, Mercy, I., Borresen, A.L. & Haugen, A. (1994) p53 muta-tions in lung tumors: relationship to putative suscepti-bility markets for cancer. Cancer Res., 54, 1551-1555
5avitsky, K., Bar-shira, A., Gilad, S., Rotman, G., Ziv, Y., Vanagaite, L., Tagle, D.A., Smith, S. Uzie1, T., Sfez, Ѕ. et al (1995) A single ataxia telangiectasia gene with a product similar to PI-3 Kinase. Science, 268, 1749-1753
Scnivner, C.R., Beaudet, A., Valle, D. & Sly, W.S. (eds) (1995)Тhе metabolic and molecular basis of inherited disease, Vols I—IП, 7th edn. McGraw-Hill, NY.
Seidegard, J., Pero, R.W. Miller, D. & Beattie, Е.S. (1986) A glutathione transferase in human leukocytes as a marker for susceptibility to lung cancer. Carcinogenesis, 7, 751-753
Selzinger, B.R., Rouleau, G., Ozelius, L.J., Lane, A.H., 5t George-Hyslop, P., Huson, S., Gusella, J.F., Marhiza, R.L. (1987) Common pathologic mechanism for three tumor types in bilateral acoustic neurofibromatosis. Science, 236,317-319
Sharma, H.W., Maltese J.-Y., Zhu, X., Kaiser, H.Е. & Narayanan, R. (1996) Telorneres, telomerase and cancer: is theie a magic bullet? Anticancer Res., 16, 511-516
Shaw, G.L., Falk, R.Т., Cagorasd, N.E., Issaq, H.J., Kale, R.G., Fox, S.D. & Tucker М.~. (1990) Effect of diurnal variation on debnisoquine metabolic phenotyping. J. Nat? Cancer Inst., 82, 1573-1576
Shaw, G.L., Falk, ~.T., Deslavriers, J., Nesbitt, J.C., Frame, J.N. & Hoover, R.N. (1994) Lung tumor resection does not affect debrisoquine metabolism. Cancer Epidеmiol. Biomarkers Prev., 3, 141-144
Sоiпi, Y., Chia, S.C., Bennett, W.P., Groopman, 3.1. , Wang, J.S., DaBenedetti, V.M., Cawley, H., Welsh, J.А., Hasen, C., Bergasa, N.V., Jones, E.A., DisBisceglie, A.M.,
249
Application of Biomarkers fn Cancer Epidemiology
Trivers, G.L., Sandoval, C.A., Calderon, 1.E.. Munoz Espinoza, L.E. & Harris, C.C. (.1996) An aflatoxin-associ-ated mutational hotspot at codon 249 in the p53 tumor-spressor gene in ICC. Cancer, 17(5), 1007-1020
Sozzi, G., Veronese, M., Negrliii, M., Baffa, R., Cottitelli, M.G., Inoue, H., Tornelli, S., PIlitti, 5., De Gregorio, L., Pastorino, U., Pierotti, M.D., Obta, M., Huebner, K. & Croce, C.M. (1996) The FlIT gene at 3р14.2 is abnormal in lung cancer. Cell, 85, 17-26
Sparkes, R.S., Murphree, А.L. & Lingua, R.W. (1983) Gene for hereditary retinobla stoma assigned to human chro-mosome 13 linkage to esterose-D. 5сгеnсе, 219, 971-973
Taioli, E., Tracbman, Chart, X., Toniolo, P. & Garte, S. (1995) A CYP1A1 restriction fragment length polymor-phisrn is associated with breast cancer in African-American women. Cancer Res., 55, 3757-3758
Tanaka, K., Maoyuki, lei., 5atokata, I., et aI. (1990) Analysis of а human DNA excision repair gene involved in group A XP containing a zinc-finger domain. Nature, 348, 73-76
Taylor, J.A., Hiivonen, А., Watson, M., Pittman, G., Mohler, J.L. & Bell, D.A. (1996) Association of prostate cancer with vitamin D receptor gene polymorphism. Cancer Res., 56, 4108-4110
Thakker, R.V., Wooding, C. & Pang, J.T. (1993) Linkage analysis of 7 polymorphic markers at chromosome IIpII.2-l1g13 in 27 multiple endocrine neoplasms type I families. Ann. Hum. Genet., 57, 17-25
Uematsu, E, Uckuchi, H., Motomiya, M., Abe, T., Sagami, I., Ohmachi, T. et a1. (1991) Association between restric-tion fragment length polymorphism of the human cytochrome P450IIE1 gene and susceptibility to lung cancer. Jpn J. Cancer Res., 82, 254-256
Upadhya, M., Maynard, J., Osborn, M., Huson, S,M., Ponder, M., Ponder B.A., & Harper, P.S. (1995) Characterisation of germline mutations in the neuroti-bromatosis type 1 (NF1) gene. J. Med. Genet. 32, 706-710
Vogelstein B., Fearon, E.R. & Hamilton, S.R. (1988) Genetic alterations during colorectal tumor develop-ment. N. EпgI. J. Med., 319, 535-532
Walman, F.M., Carroll, P.R. & Kerschmann, R. (1991) Centromeric copy number of chromosome 7 is strongly correlated with tumor grade and labeling index in human bladder cancer. Cancer Res., 51, 3807-3813
Wertalecki, W,, Rouleau, G.A., Superneav, D.W., Forehand, L,W., Williams, J.P., Haines, J.L., Gusella, J.F. (1988) Neurofibromatosis 2: cцnical and DNA linkage studies of a large kindred. N. Eng1. J. Mcd., 319 (S), 27 8-283
Whang-Peng, J,W.P., Kao-Shan, C.S., Lee, E.G., & Bunn, PA., Carney, D.N., Gazdar, A.F. & Minna, J.D. (1982) Specific chromosome defect associated with small-cell lung cancer: deletion of Зр(14-23). Science, 215, 181-182
Wooster, R., Neuhausen, S.L., Mangion, J., Quirk, Y., Pond, D., Collins, N., Nguyen, K., Seal, S., Tran, T., Averill, D. et al. (1994) Localization of the breast cancer suscep-tibility gene, BRCA2 to chromosome 13g12-13. Science, 266, 2088-2090
Wu, W. J„ Kakehi, Y., Habuchi, T., Kinoshita, H., Ogawa, O., Terachi, T., Huang, C-H,, Chiang, C.P. & Yoshida, 0. (1995) Allellic frequency of p53 gene codon 72 poly-morphism in urologic cancers. Jpn J. Cancer Res., 86, 730-736
Yokota, J., Wada, M., Shimosato, Y. et al. (1987) Loss of heterozygosity on chromosomes, 3,13,17 in small cell lung carcinoma and on chromosome З in adenocarci-noma of the lung. (1987) Proc. Nat1 Acad. Sd. USA, 84, 9252-9256
Zoo, L., Weger, J., Yong, Q., Goldstein A.M., Tucker, M.A., Walker, G.J., Hayward, N. & Dracopoli, N.C. (1996) Germilne mutations in the р16INХYд binding domain of CDK4 in familial melanoma. Nature Genet. 12, 97-99
Corresponding author N. Caporaso Genetic Epidemiology Branch National Cancer Institute, EPN 439 . 6130 Executive Blvd., F{ockville, MD 20692, USA
250

Application il Biomarkera h Cancer Epidemiology Tinde, P. Botfetla, Р. Phukor, D.E.G., Rothman, N. Hеlka, B, arid Pearce, N. eds
'ARC Scientific PuЫicatioпs No. 142 lHteгmHanat Agency for Research en Cancer, Lyon, 1997
Gene - environment interactions in the application of biomarkers of cancer susceptibility in epidemiology S. Garte, C. Zocchetti and E. Taioii
Metabolic susceptibility genes are important determinants of individual susceptibility to the effects of environmental carcinogens. These genes follow the form of `type 2' gene-environment interaction, whereby the polymorphic genetic risk factor functions only in the presence of an environmental exposure.Two different effects of carcinogen dose have been observed for these genes. Sometimes, increasing dose leads to a decreasing interaction, so that cases with the genetic risk factor have lower exposures than those cases without it. Other examples of a direct dose effect, whereby increasing exposure leads to increased interaction, have also been described. We propose a model based on multiple logistic regression to assess the nature of the dose effect iп this type of gene-environment interaction. This model allows for distinction between these two dose effects, and other effects such as protective or non-interactive effects of environmental and genetic risk factors.
It has been known for many decades that human diseases are caused by some combination of envi-ronmental and genetic factors. The relative influ-ence of the two is obviously quite variable and forms a spectrum with certain highly infectious diseases at one end and severe genetic diseases of metabolism at the other. For the great majority of human diseases (excluding extreme cases such as Ebola fever or Down syndrome), purely environ-mental or purely genetic etiologies are insufficient to explain individual variability in occurrence, prognosis or outcome. This is especially the case with the most important chronic diseases of mod-ern industrialized society, including heart disease and cancer (Hirayama, 1989; Hegele, 1992; Lane et al., 1992; Hunt et al., 1993; Tiret et aL, 1993; Brennan & 5ilmaп, 1994; Hayden et al., 1994; Hwang eiaL, 1995). For these categories of disease, a great number of environmental and genetic risk factors have been identified, and it is probably safe to say that for all cases of cancer both types of fac-tors must play some role in disease causation. In general, when one assumes multiple causes, it is useful to ask whether interactions between these independent causes exist. The issue of interaction between the environment and genetic factors is an old one in biology, and in a classic paper entitled `The interaction of nature and nurture' published
in 1946; the great geneticist Haldane (1946) dis-cussed gene-environment interactions in disease causation. Since then, a substantial literature has been produced on the interaction between genetic and environmental agents, and even a review of the review literature would not be feasible here. This paper will instead be limited to a discussion of the models of gene-environment interactions that are of primary importance in the area of individual human susceptibility to the carcinogenic effects of environmental carcinogens. With the introduction of new biomarkers of cancei susceptibility, new paradigms for the classical terms of interaction and confounding are needed (ffulka, 1991). The focus will be on cancer as the disease end-point, and in particular on the most common (usually termed sporadic) category of cancer in the human popula-tion, as opposed to cancers such as retinoblastonra, Wilms' tumour and other examples of purely or mostly inherited cancers (which also include the familial cancers of the breast, colon and brain).
There is a general consensus that the majority of cases of human cancer (sporadic tumours of the lung, bladder, breast, etc.) are of largely environ-mental origin, where environment is defined broadly as including lifestyle and exposures to agents contained in cigarette smoke and diet, as well as occupational or environmental exposure to
251

Application of Biomarkers in Cancer Epidemiology
Metabolic genes DNA repair genes Carcinogen exposure Metabolism r DNA damage
Mutation- Oncogens Tumour suppressor
Progression —Y Cancer genes
Figure 1. Mechanistic pathway to cancer.
carcinogens. Evidence supporting a dominant environmental etiology of human cancer comes from decades of epidemiological research on migrant populations and other studies (Higginson, 1980; Doll & Peto, 1981; Garte 1992). Despite the impor-tance of environmental exposure in human cancer, the evidence for some form of genetic influence on almost all cancer etiology is quite compelling. Unlike most strains of laboratory animals used in carcinogenesis research, human beings are highly outbred and genetically diverse. They also show an extremely broad range of phenotypic responses to environmental stimuli. Foi example, there is а wide variation in human response to specific car-cinogenic exposures, cigarette smoking being one of several examples (Sellers et al., 1992). This interindividual variability in response is seen not only in disease end-points but also when one uses biomarkers of exposure or biological effect such as DNA adducts or others (Marquis & Siеk, 1988; Harris, 1989; Perera et aL 1991). While such vari-ability presents formidable obstacles to the devel-opment of certain biomarkers, it also presents an exciting opportunity for research into the mecha-nisms behind the variability and the development of markers of susceptibility in individual humans.
Genes and human cancer It is vitally important at this stage to distinguish between different types of genes that are involved in human carcinogenesis. One broad category of cancer genes includes both the dominant acting oncogenes, such as ras and myc, and the recessive tumour suppressor genes such as p53 aid Rb. These genes exert their effects as part of the biological pathway leading to tumorigenesis. There is ample evidence that environmental carcinogens, from
radiation to cigarette smoke, interact either di-rectly or indirectly with the structure and/or func-till of oncogenes and tumour suppressor genes. 5отаtiс mutations in these genes caused by expo-suie to chemicals and radiation are of critical importance in the etiology of sporadic human can-cer. Such interactions may represent some of the most important mechanistic pathways in human carcinogenesis. The results of these interactions, such as mutations or gene deletions, have been proposed as bionvarkexs of biological effect for cer-tain carcinogens, such as aflatoxtn (нolktеиn et ai., 1993) and ionizing radiation (Vahakagas et al., 1992). However, even in the absence of such inter-actions, these genes may still play an important role in cancer causation if activating or inacti-vating mutations occur in the germline, such as in the case of retinoblastoma or Li-Fraumeni syndrome (Friend et a2., 1988; Frebourg & Friend, 1992), or in the case of rare H-ras alleles (Conway et al., 1995).
Another category of genes that are important in human carcinogenesis does not play any direct role in the mechanistic pathway leading from carcirno-gen exposure to cancer; instead these genes have an influence on events that occur on the pathway. Genes involved in DNA repair (Lehman et al., 1992; Samson, 1992; Smith et ai., 1994а) are an example of this category, as are genes that mediate the conver-sion of carcinogenic chemicals to their ultimate active forms. The distinction between these two types of 'cancer genes' with respect to their position on the mechanistic pathway to cancer is illustrated in Fig. 1. Genes responsible for the repair of DNA damage by carcinogens have been intensively studied because of their importance in carcino-genic mechanisms. They are certainly participants in one type of gene–environment interaction.
252

Gene-environment interactions in the application of biomarkers
However, they have not been widely used to date as biomarkers of either biological effect or suscep-tibility. This situation is likely to change with the recent cloning of the gene for ataxia telangiectasia (AT) (Savitsky et aL, 1995). Caniers of the homozy-gins variant of this gene have greatly increased sensitivity to the carcinogenic effects of ionizing radiation. While homozygotes (who show the extreme symptoms of the disease) are very rare it has been estimated that the frequency of het-erozygotes who may also have some degree of increased susceptibility to radiation-induced car-cinogenesis may be as high as 10% of the popula-tion. Further study of this and other repair-related genes as biomarkers of cancer susceptibility, and in relation to interaction with environmental factors, should provide important and useful information in the future.
The focus of this report will be on a number of genes that have been studied for many decades, after the initial discovery by Е.C. and J.A. Miller (Convey et al., 1956) that most carcinogens undergo complex metabolic reactions and that the actual carcinogenic compounds responsible for DNA binding or damage are usually electrophilic metabolites of the parent compound to which the organism is exposed. As shown in Fig. 1, these genes act as effect modifiers on the carcinogenic pathway from exposure to cancer.
Metabolic genes A number of genes involved in the metabolism of carcinogens have been shown to play a role in the risk of certain human cancers. In most cases, the putative biochemical mechanism by which such genetic factors exert their effects is fairly straight-forward and is related to the actual dose of the active carcinogenic metabolite that reaches the genome in the target cell. Increased metabolism of a carcinogenic precursor to the ultimate carcinogen and loss of function of a conjugation mechanism for elimination of the active metabolite are exam-pies of how alterations in the activity of certain gene products can affect the biologically relevant dose in different individuals, even when exposures are equivalent. Reviews of metabolic susceptibility genes have been published (Idle et aI., 1992; Daly et al., 1994; Hirvonen, 1995; Raunio et ad., 1995; Rothman, 1995; Vineis, 1995), and there is a grow-ing literature on the use of these genes (first by
phenotype and later by genotype analysis) as bio-markers of human cancer susceptibility. By defini-tion, these genes function only in the context of interaction with the environment, since the sub-strates of their gene products are xenobiotic chem-icals or their metabolites.
The metabolism of carcinogens, like that of most toxic agents, generally proceeds through two phases. (Garte & Kneip, 1988). In the first, unreactive, non-polar compounds are converted, usually by oxidation reactions, to electrophilic highly reactive intermediates. These are then able to form com-plexes with conjugating molecules such as glucose or glutathione in phase 2 conjugation reactions. The complex is usually harmless and easily excreted. However, the electrophilic metabolite may be able to react with other cellular nucleo-philes such as DNA before conjugation can occur. This is often the first step in the initiation of a car-cinogenic process.
Table 1 presents a summary of the most cons-monly studied metabolic susceptibility genes. The cytochrome P450 enzymes, which represent a large multigene family with differing substrate specifiсi ties, are important in phase 1 reactions. The CYPIA1 gene product, aromatic hydrocarbon hydroxylase (AHI), for example, catalyses the first oxidative step in the metabolism of polycyclic aro-matic hydrocarbons, such as those found in tobacco smoke, to carcinogens. An MspI restriction fragment length polymorphism (RFLP) in the 3' non-coding region of CYP1A1 was found to be associated with AHI enzymatic activity in a fam-ily study (Petersen et а1., 1991). A second polymor-phism was found in the catalytic region (exon 7) of the CYPIA1 gene, closely linked to the MspI RFLP (Hayashi etal., 1991; Hirvonen etal., 1992; Cosma et aI., 1993b). Both polymorphisms have been associated with lung cancer in Japanese popula-tions but not in Caucasian (Kawajiri et al., 1990; Tefre et al., 1991; Hirvonen et al., 1992; Shields et al., 1993) or African-American (Shields et aL, 1993; sugimura et al., 1994) populations. This discrep-ancy may reflect the different frequencies of the two polymorphisms between ethnic groups, as we previously reported (Calma et al., 1993b; Taioli et а!., 1995b). We have recently found a very strong association between breast cancer risk and the homozygous MspI RFLP in AfrIcan-American women (Taioli etal., 1995с). We have also described a third
253

Application of Biomarkers in Cancer Epidemiology
Gene Metabolic pathway Cancer sites
GST14i Conjugation of organic opoxides with reduced Lung, bladder, colon, stomach, breast, liver glutathione
СУР2D6 Hydroxylation of lipophnic xenobiotics, possibly NNK Lung, bladder, breast.
NAT2 N-Acetylation of arylamines and N-hydroxylated Bladder, lung, colorectal, breast heterocyclic arylamines
CYPiAi Metabolism of polycyclic aromatic hydrocarbons, Lung, stomach, colon, breast TODD and estrogens
ÇУP2E7 Oxidation of N-nitrosamines, alcohol Lung, Ьаддег, colon
polymorphism in the human CYPIAI gene, an Afriсап-American-specific MspI RFLP in intron 7 (Crofts et a2., 1993). This RFLP, which has not been detected in over 300 Caucasians nor in Asians, occurs in 15% of African-Americans and is associ-ated with an increased risk of adenocarcinoma of the lung (Taioh et ai., 1995а).
Other phase 1 genes that have been identified as susceptibility factors are СУР1А2 (Sinha et al., 1994; Catteau et aL, 1995), a gene that is mduced by heterocyclic aromatic hydrocarbons; CYP2D6, which is responsible for the metabolism of the drug debrisoquine; and СУР2E1 (Stephens et ai., 1994; Kato etal., 1995; Watanabe etal., 1995). Phenotype analysis suggested a role for the debrisoquine роlу-morphism as a susceptibility factor in human lung cancer, but this has become less clear as genotype data has been gathered. The specific carcinogen associ-ated with the CYР2D6 activity and the biochemi-cal effect of the polymorphism are not known. The СУР2Е1 gene is inducible by ethanol, and is involved in the metabolism of such carcinogens as butadiene, benzene and carbon tetтachloride.
Two phase 2 genes have received wide attention as metabolic susceptibility markers. The gene cod-ing for one form of glutathione S-transferаsе, G5T11, is missing in about one-half of Caucasians (Hirvоneп et al., 1993; Alexandrie et al., 1994; Ichiba et a2., 1994; Kihara et aL, 1994; Nakajima et аl., 1995). This null allele results in a lower level of glutathione conjugation of РАН metabolites and
possibly other carcinogenic substances, and has been associated with increased risk of lung cancer in several studies of Caucasians and Asians. Another gene first identified as a metabolic susceptibility marker through early phenotype analysis is N-acetyl transferase or NAT2 (Meyer 1994; Vineis et аl., 1994; Yu et al., 1994). A homozygous polymor-phism in this gene renders individuals slow acety-lators of certain substrate drugs such as isozionid. The NAT2 gene participates in a complexmeta-bolic web, and individuals with the polymorphism (slow acetylators) may be at higher risk for bladder cancer from carcinogenic exposure to arylarnines, but at lower risk for colon cancer. This complication is not surprising given the tissue specific complexity of metabolic pathways and competing reactions catalysed by a number of genes.
As discussed by Caporaso (1996), there are major differences between metabolic gene poly-morphisms and inherited mutations in cancer genes of the first category (such as BRCA1, for example). These differences have profound impli-cations for screening, prevention, public health and risk assessment. For example, polymorphisms in metabolic genes tend to be much more common in the population (from 5 to 50%) than mutations in cancer genes. At the same time, the increased cancer risks associated with metabolic gene polymorphisms are usually on the order of twofold compared to very high odds ratios for inherited mutations in tumour suppressor genes or oncogenes. Perhaps
254

Gene—environment interactions in the application of biomаrkers
the most important difference relates to the clin!-cal significance of these inherited genetic risk fac-tors. It is not dear how a physician сап counsel a person who is found to contain a genetic predis-position for cancer (such as is the case in Li-Fraumeni, etc.) independently of any exposure. On the other hand, since metabolic gene polymor-phisms specifically confer increased sensitivity to the effects of environmental carcinogens, increased surveillance and avoidance of such agents may be an effective strategy for cancer pre-vention for individuals carrying such polymor-phisms.
Types of gene—environment interactions A number of authors have discussed various bio-logical forms of gene—environment interaction as applied to epidemiological studies. M.J. Khoury and his co-workers, stressing the population and family genetics aspect of such interactions and their implications for public health, have described six types of gene—environment interaction (GEI) (Khouiy et cd., 1988, 1993, 1995; Khoury & James, 1993; Khoury & Wagener, 1995). In the first type, neither the environmental exposure nor the genetic risk factor (GRF) have any effect by them-selves in the absence of the other, but when both are present, interaction between them causes dis-ease. The example given is that of phenylalanine exposure (in the diet) and pheny1ketonuria geno-type. This type of GEl is rare and not important in human carcinogenesis. A type 2 GEI is defined as one in which the GRF has no effect on disease in the absence of the relevant exposure, but which can function to exacerbate the effects of the expo-sure. In this type, the exposure by itself increases the risk of disease, even in the absence of the GRF. This is the most important type of GEl for human carcinogenesis related to metabolic susceptibility genes and we will return to it shortly. The third type is the converse of the second, in that the GRF can produce disease in the absence of exposure; exposure mediates the effect of the GRF but, with-out the GRF, has no role in disease etiology. While this type of interaction may be important in cer-tain cases of human carcinogenesis, not enough is known as yet regarding the detailed mechanisms by which specific carcinogens act to be abbe to say that any environmental carcinogen has effects only on those people with a particular genetic
make-up. It is certainly possible, however, that future research will render this type of GEl highly significant for human cancer. The fourth type described by Khoury is common and important i cancer, and occurs when both the exposure and the GRF carry some risk for disease, but the combina-tion is interactive and/or synergistic. The cancers associated with the DNA repair gene deficiencies such as AT (see above) or xerodenma pigmerltosum (a repair gene deficiency disease associated with exposure to UV radiation) are examples. Most of the first category of cancer genes (c-rnус, р53, etc.) belong to this type of GET, since the gene mutations themselves carry an increased risk of cancer which is exacerbated by exposure to environmental car-cinogens (which are still carcinogenic in the absence of such gene mutations). The latter two types of GEI described by Khoury refer to cases in which the GRF is protective.
Ottman (1990, 1994, 1995) has also described five similar types of gene—environment interac-tion. In the first, the disease may be caused by either the genetic or the environmental agent, but the genotype increases the expression of the agent. The second and third are the same as those described by Khoury. In the fourth type, both envi-ronmental and genetic risk factors must be present to cause the disease, equivalent to Khoury's type 1. In the final model, both factors influence risk by themselves, but with an interaction between them.
The critical point made by both groups is that the term interaction covers a variety of biological phenomena involving gene products aid xenobi-otics. The specific form of the gene—environment interaction is clearly as important as the fact that such interaction exists. Type 2 interaction (as used by both R. Ottman and M.J. Khoury) is the most relevant to GEl related to metabolic susceptibility genes and human carcinogenesis. In this type, the cancer is caused by exposure to an environmental agent. If there is no exposure, then the presence or absence of the genetic risk factor is irrelevant for disease causation. Only when the dose of the envi-ronmental agent is greater than 0 does the GRF have any role, and then it is to modify the effect of the exposure. In the terminology of Khoury, Rg (defined as the relative risk of the GRF alone) is defined as equal to 1. In a hypothetical 2 x 2 table (Table 2) showing odds ratios (OR) of disease as a function of both a genetic and an environmental
255

Application of Biomarkers in Cancer Epidemiology
Table 2. Hypothetical table for type 2 gene—environment interaction
GRF
Exposure - •1-
lia 1.0 2.0 5.0
a Reference cot.
risk factor, the reference cell (OR =1) is that where neither gene nor exposure is present. For type 2 GEI, the сен of gene =1(present) and exposure = O (absent) also has an OR = 1. This h а fundamen-tally different situation with respect to epidemio-logical analysis from the case with those types of GEI where the GRF can, by itself, cause disease.
Dose effects in type 2 gene—environment interaction A common approach to the investigation of genetic susceptibility towards environmental car-cinogens is to use a case—control or other study design to determine the odds ratio for disease (can-cer) associated with a particular genetic polymor-phism. In many of these studies, environmental exposures such as cigarette smoking are taken into account and analysed for interaction by multiple regression. Many authors have inappropriately considered such exposure to be confounding (London et al., 1995). For the metabolic genes, whose activity is not independent but in fact com-pletely dependent on exposure, it is an error to analyse the effect of the gene correcting for expo-sure as a confounder. If a true type 2 GET is present, then no effect of the GRF is expected in the absence of exposure. А spurious effect of the GRE will be found if data are adjusted for exposure con-sidered as a confounder.
When the dose of environmental exposure (such as smoking) is analysed with respect to geno-type of a metabolic susceptibility gene, two appar-ently divergent patterns are seen. The first instance could be described as a decreasing interaction with dose. This is seen when the proportion of cases with the genetic risk factor (GRF) have lower exposure
doses than the proportion of cases without the GRF. The phenomenon occurs whén the multi-plicative effect of being GRF+ (versus GRF—) on the disease—exposure odds ratio becomes less as the exposure dose increases. If the end-point is not cancer but, for example, some marker of exposure such as adducts, then subjects with the polymor-phism tend to have higher relative levels of adducts at lower doses of exposure, while at high exposure no difference in end-point will be observed between those with and without the GRE. While at first, such a result may appear to be coin-terintuitive, it can be explained by the increased sensitivity (due to higher genetic susceptibility) of individuals with the GRE to lower levels of expo-sure. The decreasing interaction with dose has been observed for smoking with CYPIA1 and lung cancer (Nakachi et aL, 1993; Taioli eta?., 1995а), for NАT2 and haemoglobin adducts (Vineis et al., 1994), and for СУР1А2 and adducts (Landi et al., personal communication).
A direct dose effect of the gene is observed when cases with the GRF have environmental exposure doses that are higher than cases without the GRE; the higher the dose, the greater is the effect of having the GRF on any other end-point (such as disease, adducts, etc.) This can be explained simply by stating that the greater gene—environment interaction seen at higher environmental doses increases the probability of an individual becom-ing a case beyond that seen due to exposure alone. This direct effect has been seen with GSTM1 and lung cancer (Hirvonen et al., 1993; Kihara et al., 1994). However, a study of GSTM1 aid asbestosis (Smith et a1., 1994b) showed a decreasing interac-tion with dose, suggesting that this phenomenon is not simply gene-specific, but must be related to the mechanism of action of the gene product lead-ing to the end-point being measured. In Fig. 2, we have plotted the frequency of cases (for cancer as the end-point) or of subjects with adduct values above the median (for adduct levels as the end-point) who are positive for a particular GRF as a function of exposure level from six separate stud-ies of metabolic gene polymorphisms as biomark-ers of susceptibility. The curves slope upwards in two cases (Hirvonen et a1., 1993; Kihara et al., 1994) which both report on GSTM1 and lung cancer. For the other four examples, two using CYP1AI and lung cancer (Nakachi et al., 1993; Taioi et a?.,
256

Gene-environment interactions in the application of biomarkers
1995а), one for NAT2 and haemoglobin adduct (Vineis et cL, 1994), and one for GST and asbestosis (Smith et cL, 1994b), the curves slope downwards as a function of dose.
GE1 dose effect in relation to carcinogenesis dose—response models Analysis of these two apparently divergent scenar-ios reveals that they may not be contradictory. One possible explanation is related to the position on the carcinogenesis dose-response curve at which the GRF is functioning. While the actual shape of the carcinogenicity dose—response curve is unknown for any human cancer, and is the subject of considerable research and discussion, certain general principles may be agreed on. At low doses (leaving aside the question of a threshold by assuming that we are speaking of a region beyond a putative threshold), we may say that increasing dose leads to increasing response. Whether the shape of this part of the curve is linear or follows some other function is not important to this dis-cussion. At very high doses, the response must begin to level off, because the incidence ap-proaches either 100% ox some other biologically determined maximal value. As one approaches this maximal response, increasing the dose has less of an effect on the disease probability than is seen at lower doses. In all cases of cardnogenesis or any other toxicological end-point, a saturating dose must always exist at which no further effect can be seen at higher doses. We can assume that the effect of a genetic susceptibility factor is to increase the carcinogenic response at any particular dose, for example by causing increased enzymatic activity or by altering the metabolic profile of an agent. An important assumption here is that the GRF has no effect on the maximal response, but instead shifts the dose—response curve to the left. At lower dose levels, when the risk of the outcome is a small frac-tion of the maximal value, the curves will appear almost linear, and the GRF leads to an increase in the slope. Therefore, in this region, subjects with the GRF should respond more to higher doses of environmental agents than subjects without the GRF. However, if one is working at dose levels that produce disease (or other end-point) risks closer to the maximum level, than the converse will be true. In this region, although the overall response in GRF-positive individuals is higher than in GRF
Low Medium High
Dose
Nat Slow
СУР1А1 AA+
----- CYPIA1 VAL!VAL
-- - GST-(Asbestosis)
----- Gsт ------ GST
Figure 2. GRFs and smoking doses.
negatives, there is less effect of increasing dose in the positives than in the negatives. Therefore, sub-jects with the GRF may exhibit disease (or high adduct levels, etc.) at lower doses of environmental agent than those without the GRУ.
According to this model, genes such as CYP1A1 or NAT2 show an inverse dose effect with respect to lung cancer or haemoglobin adducts, because the doses of carcinogen present in cigarette smoke are so high. The effect of GSTM1 on lung cancer with smoking is not as clear since the dose is also high. One possibility is that the substrate for GST is far from the saturable level even when the external dose is very high, as in the case of smokers. According to this model, a direct dose effect would be seen for CYP1A1 polymorphisms with cancer related to low exposure doses of carcinogenic hydrocarbons, and an inverse dose effect might be observed for GSTM1 (as is apparently the case for asbestosis) for the appropriate mechanistic pathway.
It is important to understand clearly the mean-ing of the inverse dose effect in type 2 GE1 to avoid a confusing message. For a GRF that exhibits an inverse dose effect associated with smoking and lung cancer, the following may be said: individuals
257

Application of Biomarkers in Cancer Epidemiology
who are positive and smoke only a few cigarettes a day are at relatively greater risk, compared with GRF negatives, than if they smoke two packs a day. This does not mean that such people should smoke more, because their risk of cancer still increases with dose compared with non-smokers. In fact, an inverse dose effect implies that for GRF-positive individuals, even a low smoking dose is highly risky; people carrying the polymorphism are at higher risk of cancer in comparison to the general population exposed to smoke. Only complete smoking cessation, as well as the avoidance of other relevant exposures, can lead to canceт pre-vention in the susceptible group.
An approach for the analysis of type 2 GEI In order to proceed further with analysis of type 2 gene—environment interactions for metabolic genes, it is necessary to use analytical statistical tools on case--control and other study designs (Hwang et a]., 1994). We propose an approach to the analysis of such studies that may have the ability to detect the specific form of dose effect in a quantitative man-ner. The common way to describe interactions between the effects of an environmental agent and a genetic risk factor is to use both terms in a mul-tiple regression model, and to also include a term that multiplies the GRF by the environmental agent. The coefficient of this interactive term then determines whether interaction is present, as йlus-trated in equation (1):
G(Y) = a + ЫХ1 + b)(2 + b3Х1ХZ (1)
where Y is the odds of disease, X1 is the environ-mental exposure, and X2 1s the GRF. The coeffi-cients b„ b2 and b3 are determined by regression analysis using an appropriate computer program. If we accept by definition that in the absence of environmental exposure the presence of the GRE by itself has no effect on disease outcome (the def-inition of a type 2 interaction), then b2 in the regression model of equation (1) is defined as equal to zero. Thus equation (1) becomes:
G(Y) = я + b,Х1 + b3Х1ХZ (2)
which can be written in a different way:
G(Y) = а + (b3 + b3Х2)Х1 = a + b*ХЗ (3)
This expression corresponds to the assuption that the risk of disease is due only to the action of the environmental exposure, and the only effect of the GRF X2 is to modify the coefficient of the exposure term. Now we can say that:
b* = Ь, + bзХг = b1(1+ 2) (4)
where a = b3/b3 . For example, let us assume that the effect of
GRF such as the ILh to VAL polymorphism in the CYPIAI gene is to increase the enzymatic activity of the gene product, as has been shown (Cosma et rel., 1993a; Crofts et al., 1994; Landi et a1., 1994; Taioli et aL, 1995b). The result of having this GRF is an increased level of metabolism, presumably leading to an increased concentration of the ulti-mate carcinogen, given a particular exposure dose. While this scenario may represent an oversimplifi-cation, it can be seen that the effect of the GRF is to quantitatively modify the effect of the exposure term. This would be reflected in a value for the term a that is greater than 0. Note that if a is neg-ative, the genetic factor would be protective. If the GRF has no effect on the exposure (for example, if the exposure is to an agent that is not a substrate for the gene product), then a = 0. If the GRF is absent, then X2 = 0. In either case, the risk is a func-tion of exposure only, with no contribution from the gene.
Now we can rewrite the regression model of equation (2) if there are data for the effects of mul-tiple (n) levels of exposure (doses) as:
G(Y) = а + be,E, + be2Е2+ ...+ be,,En + b(eg)1GЕ1 b(eg)ZGЕ2±...+ b(eg)2GЕп (5)
where bel = b for exposure level Е1, (termed X1 in equation 2), b(eg)z = b for exposure level E,, and G stands for the GRF (X2), etc. Using this notation, Е, stands for dose, and the term for bg (or b2 in equa-tion 1) is defined as 0 and does not appear. For each dose level, from equation (4), the term a is equal to:
ar = b(eg)r /be, (6)
If values of a are plotted against dose, several outcomes are possible. If the slope of this plot is positive, then the gene -eпvironment interaction
258

Gene-environment interac1ians in the application of biomarkers
Exposure
Genotype GRF None Low Medium High
GSTM1+ - ND 1.0 a 1.71 1.71
G57ffл1- (null aiele} + ND 1.03 3.4 5.04
CYP1A1 'LE - 1.0a 2.83 18.6 33.1
CYF1A1 VAL + 0.93 22.2 40.0 40.1
aReference cell.
follows а direct dose effect. If the slope is negative, then an inverse dose effect is operative. Another way to express this is to say that, if the term
> 1, then the dose effect is direct; if < 1, then there is an inverse dose effect. If а
is less than 4 at any particular dose level, then the genetic factor is protective at that level. Such a scenario, whereby a particular genetic polymorph-ism may be a risk factor at one level of exposure but protective at a different level, is possible given the highly complex web of interconnecting meta-bolic pathways that usually operate in carcinogenic mechanisms.
Clearly, we assume that а is some function of dose, but the particular function 1s likely to vary for every GRF and for different specific chemical exposures. It is unlikely that the limited amount of dose—response data that is usually available from
case—control studies can allow for a precise defini-tion of this function. However, this approach is useful in the characterization of genetic risk fac-tors in terms of their dose effects, and, especially, has the advantage of avoiding confusion between an inverse dose effect and a protective effect. Two examples from the literature will be used to illus-trate the method.
Examples of type 2 GEf analyses We will use the data from Kihara et al. (1994) to illustrate a direct dose effect. Table 3 shows the odds ratios (ORs) for each category of smoking exposure and genotype. The first point is that the OR for the cell where the GRF is present but where there is no exposure is equal to the reference OR for the absence of gene and exposure. This marks the interaction as a type 2 interaction. We see that,
Table 4. Coefficients from regressionanalysis for gene—environment interaction
1 be1 0.535 1.039
2 be2 0.535 2.92
З be3 - З.
1 b(еg)1 0.66 2.06
2 b(eg)2 1.05 0.76
3 b(eg)3 _ 0:190
1 аi 1.233 1.98
2 1.96 0.26
Э - 0.054
259

Application of Biomarkers in Cancer Epidemiology
as exposure level increases, the risk of disease increases, and that the increase is higher when the GRF is present for each category of exposure level. Tabk 4 shows the coefficients Fbe, b(eg)j obtained from the multiple logistic regression model using the SAS statistical package Genr od. Also shown in the table are the values for а the interaction term, which increase directly as a function of dose. Thus, for this case, there is a direct dose effect. 5imilar results can be obtained using the data from other sources for this gene and smoking-related lung cancer (Hirvonen et aL, 1993).
An example of an inverse dose effect is seen for CYP1A1 ILE to VAL polymorphism in exon 7 of the gene, as a GRF for smoking-induced lung cancer. The data from Nakachi et al. (1991) are shown in Tables 3 and 4. Here, although the OR for cancer increases for both genotypes as a function of dose, the ratio between the risks for the two genotypes decreases at higher doses. The decrease of а with increasing exposures illustrates this. We have also observed an inverse dose effect for the association of the African-American-specific polymorphism in CYP1A1 with lung adenocarcinoma in smokers (Taioh etal., 1995а), aid other groups have reported similar findings using adducts as an end-point for NАT2 and for СYРIА2 (Vineis etal., 1994; Landi et al., personal communication).
In some cases, this analytical approach may be used to determine whether a type 2 GEI is in fact the correct model for a particular case study. This may be done by determining if the odds ratio for the unexposed group with the GRF is close to 1. In the first example used for illustration (for GsT11), this was the case. Unfortunately, however, most studies of this type use very small numbers of sub-jects, and the data may be of insufficient statistical power to allow for an accurate determination of this odds ratio. This is especially true for studies of lung cancer and smoking, where it is often difficult to find sufficient numbers of non-exposed (non-smokers) cases of both genotypes to have adequate power. In our second example (CYP1A1) there were only two non-smokers among the cases? We there-fore used hypothetical data, assuming a true type 2 interaction with an odds ratio close to 1 for the G = 1, E = 0 cell. Given the difficulty in proving a type 2 interaction by the use of actual data] one alternative is to apply mechanistic knowledge regarding the mechanism of action of the gene
related to the exposure to decide whether a type 2 interaction is logical within a mechanistic context.
5ummaгy and conclusions The study of metabolic gene polymorphisms as cancer susceptibility genotypes is likely to expand in the future, given the advances in PCR-based technology aid the expected advances in knowl-edge of the human genome. In terms of gene—envi-ronment interactions, it is critical to develop tools with which to define precisely the role of suscepti-bility biomarkers in cancer causation. Some such markers may have little relevance to carcinogenic exposures, while others may be involved in com-plex associations that are difficult to unravel. We have put forward the argument here that type 2 GEl, for which the genotype alone, in the absence of a relevant carcinogenic exposure, plays no role in carcinogenesis, is the most important type of GEI for those genes that currently make up the major category of cancer susceptibility biomarkers. We have stressed the importance of exposure dose in the analysis of GEI for these genes, and discussed two different forms of dose effect. We have shown how these forms, the direct dose effect and the in-verse dose effect, may be analysed and distinguished from each other and from other types of effects (such as protection) by using regression analysts. We have suggested that the apparent divergence between these two types of dose effect maybe due to the mechanistic position of the GRF on a sat-urable dose—response curve for cancer induction.
We have not addressed certain issues related to regression analysis of interaction. In general, ques-tions of statistical inference using this analysis have not been addressed here, but of course such questions are important in testing hypotheses and require careful investigation. The question of whether multiplicative versus additive models of interaction should be used (Brown & Chu, 1959) has also not been addressed here. Although a mul-tiplicative model was used to obtain the values shown in Table 4, we have found (not shown) that the use of an additive model has an effect only on the magnitude and standard errors of the coeffi-cients and а-values, but not on the direction of the dose-dependent effect of the gene.
In conclusion, we believe that studies investigat-ing the possibility of a metabolic gene polymor-phism as a GRF should always include as much
260

Gene-environment interactions in the application of biomarkers
information as possible on relevant exposure levels. Even if quantitative measures are unobtainable, questionnaire data giving approximate levels (such as never, low or high) of exposure information can be of use in the analysis of the dose effect. Comparison of a-values between studies and meta-analysis of a for specific gene-exposure combina-tions may also prove valuable in the future.
It has been pointed out by several authors in the field of biomarkers in epidemiology that the detec-tion of cancer genetic susceptibility of this type has profound positive public health implications for cancer prevention. Detailed study of the interac-tions of these genes with environmental carcino-gens promises to allow epidemiologists to consider humans as collections of individuals of varying sensitivity and responsiveness. While the entire issue of genetic susceptibility differences among people has important ethical, legal and political issues, we believe that increased knowledge in this area (such as the specific form of dose effect dis-cussed here) will provide benefits in helping to resolve these issues.
References Alexandrie, A.K., Sundberg, 1.1., Seidegard, J., Torniing, G. & Rannug, A. (1994) Genetic susceptibility to lung cancer with special emphasis on CYP1A1 and GST11: a study on host factors in relation to age at onset, gender and histological cancer types. Carcinogene.sis, 15, 1785-1790
Brennan, Р. & Silman, A.J. (1994) An investigation of gene-envixornnent interacdori iii the etiology of rheuma-toid arthritis. Am. J. EpidernioL, 140, 453-460
Brown, C.C. & Chu, K.C. (1989) Additive aid multi-plicative models and multistage carcinogenesis theory. Risk Anal., 9, 99-105
Caporaso, N. (1996) Genetic susceptibility and the com-mon cancers. Biomarkers, 1, 174-177
Catteau, A., Bechtel, Y.C., Poisson, N., Bechtel, P.R. & Bonaiti-Pe11ie, C. (1995) A population and family study of CYP1A2 using caffeine urinary metabolites. Eue. J. Clin. PharmacoL, 47. 423-430
Coney, А.H., Miller, E.G. & Miller, J.А. (1956) The metabolism of methylated aminoazo dyes. V. Evidence for inducliоп of enzyme synthesis in the rat by 3-methyl-cholanthrene. Cancer Res., 16, 450-460
Conway, K., Edmiston, 5., Fried, D.B., Hulka, B.S., Garrett, P.A. & Liu, E. (1995) Ha-ras rare alleles in breast cancer susceptibility. Breast CancerRes. Treat., 35, 97-104
Cosma, G. Crofts, F., Currie, D. Toriiolo, P. & Garte, S.J. (1993a) The relationship between genotype and function of the human CYP lAi gene. J. Tas. Environ. Health, 40, 315-322
Cosma, G., Crofts, F., Cunie, D., Wirgin, 1., Toniolo, E & Carte, S.J. (1993b) Racial differences in restriction frag-ment length polymorphisms and messenger RNA inducibility of the human CYP1A1 gene. Cancer EpidemioI. Biomarkers Prey., 2, 53-57
Crofts, F., Cosma, G.N., Taioli, E., Currie, D.C., Toniolo, P.Т. & Garte, S.J. (1993) A novel CYP1A1 gene роlymоr phism in African-Americans. Carcinogenesis, 14, 1729-1731
Crofts, F., Taioli, E., Trachman, J. Cosma, G.N., Currie, D., Toniolo, P. & Garte, 5.J. (1994) Functional significance of different human CYP1A1 genotypes. Carcinogenesis, 15, 2961-2963
Daly, A.K., Cholerton, S., Armstrong, M. & Idle, J.R. (1994) Genotyping for polymorphisms in xenobiotic metabolism as a predictor of disease susceptibility. Environ. Health Perspect., 102 (Suрp1. 9P), 55-61
Doll, R. & Peto, R. (1981) The causes of cancer: quantita-tive estimates of avoidable risks of cancer in the United States today. J. Nati Cancer Inst., 66, 1191-1308
Prebourg, T. & Friend, 5.1. (1992) Cancer risks from germline p53 mutations. J. Clin. Invest., 90, 1637-1641
Friend, S.Н., Dyja, T.P. & Weinberg, R.A. (1988) Oncogenes and tumor-suppressing genes. N. Eng[. J. Med., 318, 618-622
Garte, 5.J. (1992) Environmental carcinogenesis, In: Rom, W, cd., Environmental and Occupational Medicine. Boston, Little Brown, pp. 105-124
Garte, S.J. & Kneip, T.J. (1988) Metabolism. In: Kneip, T.J. & Crable, J.V., eds, Methods for Biological Monitoring. Washington, American Public Health Association, pр.15-26
Hаlдапе, J.B.S. (1946) The interaction of nature and nur-ture. Ann. Eugenics, 13, 197--205
Harris, C.C. (1989) Interindividual variation among humans in carcinogen metabolism, DNA adduct forma-tion aid DNA repair. Carcinogen esis, 10, 1563-1566
Hayashi, S.-1., Watanabe, J., Nakachi, K. & Kawajiri, K. (1991) Genetic linkage of lung-cancer-associated Msp1 polymorphims with amino acid replacement in the here binding region of the human cytochrome P4501А1 gene. J. Biochem., 110, 407-411
Hayden, Ivf.R, Liu, 1.5 & Ma, Y. (1994) Gene environ-ment interaction and plasma triglyceride levels: the cru-cial role of lipoprotein lipase. Clin. Genet., 46, 15-18
Hegele, R.А. (1992) Gene-environment interactions in
261

Application of Biomarkers in Cancer Epidemiology
atherosclerosis. MoL Cell. Biochem., 113, 177-186
Higginsorn, J. (1980) Importance of environmental and occupational factors in cancer. J. Todcol. Environ. Health, 6, 941-952
Hirayama, T. (1989) Family history in childhood malignan-cies with special reference to genetic-environmental interactions. In: Lynch, Н.T. & Hirayama, T., eds, Genetic Epidemiology of Cancer. Боса Raton, FL, CRC Press, pp. 1111-1117
Hirvonen, A. (1995) Genetic factors in individual responses to environmental exposures. J. Occup. Environ' Med. 37, 37-43
Iirvonen, A., Pursiarien, K.H., Кат jаlаiпеn, A., Anttila, S. & Vainio, H. (1992) Point mutational Msp1 and I1e-Val polymorphism closely linked in the CYP1AI gene: lack of association with susceptibility to lung cancer in a Finnish study popuiation. Cancer Epidemiol. Biomarkers Prev., 1, 485-489
Hirvonen, A., Husgafvel-Pursianen, K., Anttila, S. & Vainio, H. (1993) The GST11 null genotype as a potetial risk midifier for squamous cell carcinoma of the lung. Carcinogenesis, 14, 1479-1481
Holstein, М.C., Wild, C.P., Bleicher, F., Chutimataewin, S., Harris, C.C., Srivafanalo!, P. & Montesano, R. (1993) p53 mutations and aflatoxin B.1 exposure in hepatocel-lular carcinoma patients from Thailand. fiL J. Cancer, 53, 51-55
Hulka, B.S. (1991) Epidemiological studies using biolog-ical markers: issues for epidemiologists. Cancer Epidemiol. Biomarkers Prey., 1, 13-19
I-luit, S.C., Hasstedt, S.J., Wu, L.L. & Williams, R.R. (1993) A gene-environment interaction between inferred kallikrein genotype and potassium. Hypertension, 22, 161-168
Hwang, S.J., Bеаty, T.H., Liang, K.Y., Coresh, J. & Khoury, M.J. (1994) Minimum sample size estimation to detect gene-environment interaction in case-control designs. Am. f. EpidemioL, 140, 1029-1037
Hwang, S.J., Beaty, Т.H., Panny, S.R., Street, N.A., Joseph, J.M., Gordon, 5., McIntosh, I. & Francomano, C.A. (1995) Association study of transforming growth factor alpha (TGF alpha) TagI polymorphism and oral clefts: indication of gene-environment interaction in a popuhi-tim-based sample of infants with birth defects. Am. J. Epidemiol., 141, 629-636
Ichiba, M., Hagmar, L., Rannug, A., Hogstedt, B., Alexandrie, A.K., Carstensen, U. & Hemniinki, K. (1994) Aromatic DNA adducts, micronuclei and genetic poly-morphism for CYP1AI and GST1 in chimney sweeps. Carcinogenesis, 15, 1347-1352
Idle, J.R., Armstrong, M., Biddy, A.V., Boustead, C., Cholerton, S., Cooper, J., Daly, A.K., Ellis, J., Gregory, W.,
Hadidi, H. (1992) The pharmacogenetics of chemical car-cinogenesis. Pharacogenetics, 2, 246-258
Kato, S., Shields, Р.G., Caporaso, N.Е., Sugimura, H., Trivers, G.E., Tucker, М.A., Trump, B.F., Weston, A. & Harris, C.C. (1994) Analysis of cytochrome Р4502Е1 genetic polymorphisms in relation to human lung can-cer. Cancer Epidemiol. Biomarkers Prey. 3, 515-518
Kawajiri, K., Nakachi, K., Imai, K., Yoshi, A., Shinoda, N. & Watanabe, J. (1990) Identification of genetically high risk individuals to lung cancer by DNA polymorphisms of the cytochrome р4501А1 gene. FЕBS Lett., 263, 131-133
Khoury, M.J., Adams, M.J. & Flanders, W.D. (1988) An epidemiologic approach to ecogenetics. Am. J. Hum. Genet., 42, 89-95
Khoury, М.J., Beaty, Т.H. & Cohen, B.Н. (1993) Fundamentals of Genetic Epidemiology. New York, Oxford University Press
Khoury, М.J. & James, L.M. (1993) Population and famil-ial relative risks of disease associated with environmen-tal factors in the presence of gene-environment interac-tion. Am, J. Epidemiol., 137, 1241-1250
Khoury, M.J., Beaty, T.H. & Hwang, S.J. (1995) Detection of genotype-environment interaction in case-control studies of birth defects: how big a sample size? Teratology, 51, 336
Kfioury, M.J. & Wagener, D.К. (1995) Epidemiological evaluation of the use of genetics to improve the predic-tive value of disease risk factors. Am. J. Hum. Genet., 56, 835-844
Kihara, M., Kihara, M. & Noda, K. (1994) Lung cancer risk of GSTI1 null genotype is dependent on the extent of tobacco smoke exposure. Carcinogenesis, 15, 415--418
Landi, M.T., Bertazzi, PA., Shields, P.G., Clark, G., Lucier, G.W., Garte, S.J., Cosma, G. & Caporaso, N.E. (1994) Restriction fragment length polymorphism, mRNA expression and enzymatic product of CYP1A1 gene in humans. Phannacogenetics, 4, 242-246
Lane A. Cruickshank J.K. Mitchell J. Henderson A. Humphries S. Green, E (1992) Genetic aid environmen-tal determinants of factor VII coagulant activity in eth-nic groups at differing risk of coronary heart disease. Atherosclerosis, 94, 43-50
Lehmann, A.R., Hoeijmakers, J.H., van Zeeland, A.А., Backendorf, C.M., Bridges, B.A., Collins, A., Fuchs, R.P., Margison, G.P, Montesano, R. & Moustacchi, E. (1992) Workshop on DNA repair. Mutation Res. 273, 1-28
London, S.J., Daly, A.K., Fairbrother, K.S., Holmes, C., Carpenter, C,L., Navidi, W.C. & Idle, J.R. (1995) Lung cancer risk iп African-Americans in relation to a race-spe-cific CYP1A1 polymorphism. Cancer Res., 55, 6035-6037
262

Gene-environment interactions in the application of biomarkers
Marquis, J.K. & Siek, G.C. (1988) Sensitive populations and risk assessment in environmental policy-making. In: 5ахепа, J., ed., Hazard assessment of chemicals (Vol. 6). Washington, DC, Hemisphere Publishing
Meyer (1994) Polymorphisms of human aсetyltrans-ferases. Environ. Health Penspect., 162 (Suppl. бР), 213-216
Nakachi, К., Imai, K., Hayashi, Ѕ. Watanabe, J. & Kawajiri, K. (1991) Genetic susceptibility to squamous cell carcinoma of the lung in relation to cigarette smok-ing dose. Cancer Ret., 51, 5177-5181
Nakachi, K., Imai, K., Hayashi, S. & Kawajiri, K. (1993) Polymorphisms of the CYP1A1 and glutathione S-trans-ferase genes associated with susceptibility to lung cancer in relation to cigarette dose in a Japanese population. Cancer Res., 53, 2994-2999
Nakajima, T., Elovaara, E., Anttila, S., Hirvonen, A., Camus, A.M., Hayes, J.D., Ketterer, B. & Vainio, H. (1995) Expression and polymorphism of g1utathione S-transferase in human lungs: risk factors in smoking-related lung cancer. Carcinogenesis, 16, 707-711
Ottman, R. (1990) An epidemiologic approach to gene-environment interaction. Genet. EpidemioL, 7, 177-185
Ottman, R. (1994) Epidemiologic analysis of gene-envi-roпment interaction lii twins. Genet. Epidemiol., 11, 75-86
Daman, R. (1995) Gene-environment interaction and public health [editorial; comment). Am. J. Hum. Genet., 56, 821-823
Perera, E, Mayer, J., Santella, R.M., Brenner, D., Jeffrey, A., Latriano, L., Smith, S., Warburton, D., Young, T.L., Tsai, W.Y., Hemminki, K. & Brandt-Rauf, P. (1991) Biologic markers in risk assessment for environmental carcinogens. Environ. Health Perspect., 90, 247-254
Petersen, D.D., IcKinney, C.E., Lkeya, K., Smith, H.H., Bаlе, А.E., McBride, O.W. & D. W. Nebert. (1991) Human CYP1A1 gene: cosegregation of the enzyme inducibility phenotype and an RFLP. Am. J. Hum. Genet., 48, 720-725
Raunio, H., Husgafvel-Pursiainen, K., Anttila, S., Hietanen, E., Hirvonen, А. & Pelkonen, O. (1995) Diagnosis of polymorphisms iп carcinogen-activating and inactivating enzymes and cancer susceptibility а review. Gene, 159, 113-121
Rothman, N. (1995) Genetic susceptibility biomarkers in studies of occupational and environmental cancer: methodologic issues. Toxico!. Left. 77, 221-225
Samson, L. (1992) The suicidal DNA repair methyltrans-ferases of microbes. MoL Micro bio! ., 6, 825-831
Savitsky K. Bar-Shira, A., Glad, S., Rotman, G., Ziv, Y., Vanagaite, L., Tagle, D.A., Smith, S., Uziel, T., & Sfez, S. (1995) A single ataxia telangiectasia gene with a product similar to РI-3kiпase. Science, 268, 1749-1753
Sellers, T.A., Potte, J.D., Bailey-Wilson, J.E., Rich, 5.5., Rothschild, H. & Elston, R.C. (1992) Lung cancer detec-tioл and prevention: evidence for an interaction between smoking and genetic predisposition. Cancer Res., 52, 26945-26975
Shields, PG., Caporaso, N.E., Falk, R:1'., Sugimura, H., Trivers, G.E., Tiump, B.F., Hoover, R.N., Weston, A. & Harris, C.C. (1993) Lung cancer, race, and a CYP1A1 genetic polymorphism. Cancer EpidemioI. Biomraтkers Prey., 2, 481-85
Sinha, R., Rothman, N., Brown, E.D., Mark, S.D., Hoover, R.N., Caporaso, N.E., Levander, O.A., Knize, M.G., Lang, N.P. & Kadlubar, F.F. (1994) Pan-fried meat containing high levels of heterocyclic aromatic amines but low lev-els of polycyclic aromatic hydrocarbons induces cytochrome P.4501А2 activity in humans. Cancer Res., 54, 6154-6159
Smith, M.L., Chen, I.T., Zhan, Q., Bae, I., Chen, С.Y., Curer, T.M., Kastan, M.B., O'Connor, P.M. & Fornace A.J., Jr (1994a) Interaction of the p53-regulated protein Gadd45 with proliferating cell nuclear antigen. Science, 266, 1376-1380
Smith, C.M., Kelsey, K.T., Wiencke, J.К., Leyden, K., Levin, S. & Christiani, D.C. (1994b) Inherited g1u-tathione-S-transferase defiency as risk factor for pul-monary asbestosis. Cancer Epidemiol. Biornarkers Prey., 3, 471-477
Stephens, E.A. Taylor,J.A., Kaplan, N., Yang, Cu., Hsieh, L.L., Lucier, G.W. & Bell, D.A. (1994) Ethnic variation in the CYPZEI gene: polymorphism analysis of 695 African-Americans, European-Americans and Taiwanese. Pharmacogenetics, 4, 185-192
Sugimura, H., Suzuki, I., Hamada, G.S., Iwase, T., Takahashi, T., Nagura, K., Iwata, H., Watanabe, S., Kino, I. & Tsugane, S. (1994) Cytochrome Р4501А1 genotype in lung cancer patients and controls in Rio de JaneiIo Brazil. Cancer Ергдет iоI. Biomarkers Pieu, 3, 145-148
Taioli, E. Crofts, F. Demopoulos, R., Trachman, J. Toniolo, P. & Garte, S.J. (1995а) An Atrican American specific CYPIA1 polymorphism is associated with adenocarc[-noma of the lung. Cancer Res., 55, 472-473
Taioli, E. Crofts, F., Trachman, J., Bayo, S., Bradlow, L., Tonlolo, P. & Garte, S.J. (1995b) Racial differences in CYP1a1 genotype and function. Toxicol. Lett., 77, 357-362
Taioli, E., Trachman, J., Chep, X., Toniolo, P. & Garte, S.J. (1995с) CYPIA1 RFLP is associated with breast cancer in African American women. Cancer Res., 55, 3757-3758
Tefre, T., Ryberg, D., Haugen, A., Nebert, D.W., Skaug, V., Brogger, A. & lorresen, A.L. (1991) Human CYPIA1 gene: lack of association between the 'spi restriction fragment
263

Application of Biomarkers in Cancer Epidemiology
length polymorphism and incidence of lung cancer in a Norwegian population. Phaгнщcоgeпehсs, 1, 20-27
Tiret, L., Abel, L. & Rakotovao, R. (1993) Effect of ignor-ing genotype-environment interaction on segregation analysis of quantitative traits. Genet. EpiderwioI, 10, 581-586
Vahakangas, K.LL, 3атеt, J.M., Metcalf, R.A., Welsh, J.A., Bennett, W.P., Lane, D.P. & Harris, C.C. (1992) Mutations of p53 and ras genes in radon-associated lung cancer from uranium miners. Lancet, 339, 576-580
Vineis, P. (1995) Use of biomarkers in epidemiology. The example of metabolic susceptibility to cancer. ToxicoI. Left., 77, 163-168
Vineis, P., Bartsch, H., Caporaso, N., Harrington, A., Kadlubar, F.F., Landi, M.T., Malaveille, C., S1цe[ds, Л.G., Skipper, P., Talaska, G. & Tannenbaum, S.R. (1994) Genetically based N-acetyltransferase metabolic puy-morphism and low level environmental exposure to car-cinogens. Nature, 369, 154-156
Watanabe, J., Yang, J.P., Eguchi, H., Hayashi, S., 1mai, K., Nakachi, K. & Kawajiri, K. (1995) An Rsa I polymorphism in the СYР2Е1 gene does not affect lung cancer risk in а Japanese population. Jpn J. Cancer Res., 86, 245-248
Yu, M.C., Skipper, P.L., Taghizadeh, K., Tannenbaum, S.R., Chan, K.K., Hendeson, B.Е. & Ross, R.К. (1994) Acetylator phenotype, aminobiphenyl-hemoglobin adduct Ievels, and bladder cancer risk in white, black, and Asian men in Los Angeles California. J. Nad Cancer Inst., 86, 712-716
Corresponding author S. Garte Nelson Institute of Environmental Medicine and Kaplan Cancer Center, New York University Medical Center, New York, NY, USA
264

Application il olumarkere in Cancer Epidemiology Torticic, P., Boffelta, P., 5huker, D.E.G., Rothman, N., Hulka, Band Pearce, N., edt
1AАC Scientific PIjblicationo No. 142 lnternaticnal Agency for Research on Cancer, Lyon, 1997
Using and interpreting surrogate end-points in cancer research
A. Schatzkin, LS. Freedman, J. Dorgan, L' McShane, М.Н. Schiffman and S.M. Dawsey
Researchers have proposed a broad range of molecular, cellular and histological markers as surrogate end-points for cancer (sECs).The effect of an intervention on a `valid' SЕС is concordant with its effect on cancer incidence. The validity of a potential SEC is determined primarily by the extent to which the marker is a necessary event on the causal pathway to cancer' Colorectal adenomatous polyp formation is an example of a reasonably valid SEC because these lesions are obligate precursors of most large bowel malignancies. However, the existence of a plausible major alternative causal pathway—one bypassing the potential SEC—weakens inferences from that marker to cancer. Moreover, unless the pathway to cancer operates nearly exclusively through the SEC, an SEC that is valid for one intervention or exposure may not be valid for another. Metabolic, ecological, observational epidemiological and 'intervention studies may yield data that are useful in revealing these causal interrelations of intervention (exposure), SЕС and cancer. Empirical studies of three questions are pertinent: (1) What is the relation of the SEC to cancer? (2) What is the relation of the intervention (exposure) to the SEC? (3) To what extent does the SЕС mediate the relation between the intervention (exposure) and cancer? Data on SEC measurement error are important in ascertaining the extent to which marker results have been attenuated by such error. It is essential to carry out these studies to evaluate potential SECS (such as epithelial cell hyperproliferation) with plausible major alternative pathways to cancer. At the present time, definitive evidence on etiology and prevention will emerge only from studies with cancer end-points or SECs that are, by and large, necessary steps on the causai pathway to malignant disease.
Because the diagnosis of cancer is a relatively rare event, clinical trials or observational epiderniolog-ical studies with incident cancer end-points have to be very large, lengthy and expensive. Studies using surrogate end-points of malignant disease can be smaller, shorter and cheaper than studies with incident cancer end-points. It is not surpris-ing, then, that cancer researchers have long been interested in using these markers.
Definition of a surrogate end-point marker for cancer We define a surrogate end-point marker for cancer (SEC) as follows: a surrogate for incident cancer yields a valid test of the null hypothesis of no as-sociation between treatment and incident cancer. In other words, the effect of an intervention on the SEC is concordant with its effect on cancer incidence, or, for observational epidemiological studies, the
association of an exposure with the SEC is concor-dant with its association with cancer incidence. If, for example, a large change in the SEC means a large change in cancer incidence, then a small change in the SEC would mean a small change in cancer incidence. If the SEC meets these condi-tions, it can be considered a 'valid' surrogate for that cancer. These conditions follow from the cri-teria proposed by Prentice (1989).
Evaluating SAC validity: logical considerations The validity of a potential 5ЕС depends on the extent to which it is a necessary step in carcino-genesis. The simplest causal pathway involving a potential SEС is shown inn Fig. 1. E1 represents an environmental or host factor. A change in E1 would alter SEC positivity and thereby modify the incidence of cancer. The SEC is a valid surrogate for cancer.
265

Appliсatron of Biomarkers in Cancer Epidemiology
E1 SEC. п CA
Figure 1. Pathway to cancer (CA) with single exposure (El) and single marker (SEC).
Figure 2 depicts a more realistic picture of car-cinogenesis. In this figure, E1 influences cancer through two alternative pathways, one through the potential SЕС, the other through Marker 2. (We assume, to simplify the discussion, that only one intermediate marker, SEC, resides on the E1-SЕGcancer pathway. To the extent that E1 works through the alternative Marker 2 pathway, we cannot be certain that SEC is a valid surrogate for studies involving E1. This is because E1 may affect Marker 2 in a way that offsets its influence on SEC; the final effect on cancer 1s unknown. If, for example) E1 reduces SEC positivity but increases Marker 2 positivity, E1 could increase cancer incidence.
Potential SECs illustrating these logical considerations Consider adenomatous polyps, an increasingly popular surrogate for colorectal cancer. Iп Fig. 3 (pathway a), an event X is necessary for an adeno-matous polyp to progress to colorectal cancer. Therefore, two types of polyiloid adenomas exist—those without X (innocent adenomas not pro-gressing to cancer) and those with X (bad' adeno-rias progressing to cancer). Both types are observ-able but indistinguishable through a colonoscope. Furthermore, there exist flat areas of dysplasia with X (not observable through the colonoscope) that also progress to cancer (Н0, 1991).
Suppose we have an intervention (a low-fat eating plan) for example) which reduces E1 (some faecal constituent) and thereby diminishes the pool of adenomas susceptible to the relatively rare X-events. This intervention thus reduces the пиm-
Е1 SEC GA
Marker 2
Figure 2. single exposure (El) with pathways through two alternative markers (SEC and Marker 2) to cancer (CA).
ber of bad adenomas as a necessary consequence of reducing the number of innocent adenomas. The intervention therefore lowers the incidence of colorectal cancer.
The existence of the flat dysplasia pathway complicates things. Our intervention has no effect on pathway (b), even though it reduces observed adenomas via pathway (a). Tithe extent that path-way (b) contributes to colorectal carcinogenesis, adenoma development (as detected through colonoscopy) may not be a valid SEC for cancer. As pathway (a) becomes the less common of the two routes to cancer, an investigator observing fewer adenomas developing among intervention partic-ipants could conclude that the intervention reduces colorectal cancer incidence, when in fact the intervention might have a quite different effect on cancer occurrence through pathway (b). A large body of evidence, however, suggests that most col-orectal cancers do develop through pathway (a), the adenoma--carcinoma sequence (Muto et al., 1975). Therefore, an intervention reducing adeno-matous poiyp recurrence would be likely to reduce colorectal cancer incidence. Adenoma recurrence is a reasonably valid SEC.
HPV infection in cervical cancer appears to be analogous to the adenoma colorectal cancer example. The overwhelmingly large proportion of cervical cancer requires prior HPV infection (Schiffman, 1992). The relatively rare X-event is whatever (still unknown) immunological deficit leads to persistent HPV infection. HPV persistence results in inactivation by the E6 and E7 proteins of the HPV genome, of р53 aid pBh tumour suppres-sor gees, leading in turn to increasingly severe intra-epithelial neoplasia and eventually cancer. It is currently thought, however, that a small pro-portion of cervical cancer can arise as a result of tumour suppressor gene product inactivation occurring, by mutation, in the absence of HPV infection, Because most cervical cancer does occur through HPV infection, an intervention that elim-iпates or reduces HPV infection would probably decrease cervical cancer incidence.
Inferences to cancer from other potential SECs, however, are considerably more problematic. Figure 4 depicts plausible causal pathways involv-ing colorectal epithelial сеll proliferation (Baron et cl., 1995) (the adenoma step depicted in Fig. 4 is simplified here). E1 is again an exposure amenable
266

surrogate end-points i ri cancer research
(a)
Normal mucosa +E1 -- Polypoid non-X adenoma (+X) Polypoid X-adenoma . CA
(b)
Normal mucosa +X
Fiat X-dysplasia CA
Figure 3. Alternative pathways, with (a) and without (b) an adanomatous polyp step, to colorectal cancer (CA). E1 is exposure; X +s an event necessary for development of cancer.
to modification. Tithe extent that other celular or molecular events, such as diminished apoptosis or altered cellular adhesion factors, constitute an important causal pathway from E1 to cancer, we cannot be sure that El's relation to these other events does not offset El's effect on cancer through proliferation. Cell proliferation is a problematic SEC because the relative importance of the alter-native pathways (through events other than pro-liferation) is simply unknown.
Another Iogical consideration is as follows: a marker may not be directly on the causal pathway to cancei but may be closely linked to a compo-nent of that causal pathway such that it does make a reasonable SEC. One possible example of this are micronuclei, which have been detected in epithe-lia1 cells from oral, oesophageal, bronchial and large intestinal tissue (Garewal et al., 1993). Many micronuc1eated cells are non-viable and therefore cannot be direct cellular precursors of a malignant tumor. The overall prevalence of micronucleated cells, though, might strongly reflect microstruc-tural alterations in other cells that do eventually undergo malignant transformation and clonal expansion.
Exposure dependence tri Fig. 5 we return to the simple, idealized scheme from Fig. 1, but now add another exposure, E2. Both E1 and E2 in Fig. 5 work through SEC on the path to cancer. Because SEC is a necessary precursor for cancer, the validity of this SEC is exposure-inde-pendent, i.e. any other exposure, Е2, that influences cancer must operate through the SAC; the SAC is valid for studies of E2 as well as those of E1.
Figure 6 adds E2 to the more complex and real-istic pathway depicted in Fig. 2. In Fig. 6, the exis-tence of a non-trivial alternative pathway (through Marker 2) means that the validity of the SEC is exposure-dependent. Even if E1 affects Marker 2 minimally (suggesting that SEC is reasonably valid for E1—cancer studies), we cannot assume that the E2—Markеr 2—caпceт pathway also plays a minor role in the development of cancer.
For example, a given agent might influence colorectal carcinogenesis largely through its influ-ence on cell proliferation (Fig. 4). In that case, cell proliferation is a reasonably valid SEC for the first agent vis-à-vis colorectal cancer. A second agent, however, might not affect cell proliferation but might increase apoptosis sufficiently to decrease
Normal mucosa+E1 Hyperprobteration Адепота and cancer
л Other events ' (e.g. apoptosis, celular adhesion)
Figure 4. Aiternative pathways, with and without mucosal hyperproliferation, to colorectal cancer. E1 is exposure.
267

Application of Biomarkers in Cancer Epidemiology
TabIe 1.2 к 2 tаые sr between SEС
Figure 5. Each of two exposures (El and Е2) leads through two markers (SЕС and Marker 2) to cancer (CA).
cancer incidence (Bedi et ai., 1995). Focusing only on cell proliferation would give a falsely pes-simistic impression of the second agent's efficacy in inhibiting colorectal carcinogenesis.
Investigating causal pathways involving SECs We have argued that the causal structure underly-ing the relationships between exposures, potential SECS and cancer is critical in evaluating SECS. Data that are helpful in revealing this structure can emerge from investigations into three questions (Schatzkin et al., 1990) (1) is the SEC associated with cancer (in particular, how large is the attrib-utable proportion)? (2) is the intervention/expo-sure associated with the SEC? and (3) does the SEC mediate the relationship between the interven-tion/exposure and cancer?
Traditional epidemiological parameters are use-ful in carrying out these investigations. For simplicity, we refer in the following discussion to SЕCs that are either positive or negative. However, the argu-ments offered here may be extended to encompass markers measured as continuous variables.
Relative risk, a measure of cancer risk in relation to SEC positivity, is defined as [a!(a + b)] 1 [с1(с + d)] (Table 1). A relative risk of 1.0 indicates no associa-tion between SEC and cancer' The attributable pro-portion (AP) represents the proportion of cancer that is attributable to marker positivity: AР = S(1- 1/R), where R = relative risk and S = sen-sitivity, defined as a1(a + c). An AР of 1.0 means that marker positivity is necessary for the develop-ment of cancer, i.e. the carcinogenic pathway must go through this positive marker.
E1 SEC CA
E2 Marker 2
Figure 6. Each of two exposures (El and Е2) can act through a number of pathways to affect markers (SEC and Marker 2) and lead to cancer (СA).
SEGcaпcer Observational epidemiological studies are impor-tant vehicles for examining this SEC-саncer ques-tion. In a recent case-control study, Schiffinan et al. (1993) showed a markedly increased risk of severe cervical neoplasia for those with HPV infection. Tortiulo et al. (1995), in a case-control study nested within a prospective cohort, observed a direct ida-tionship between serum estrogens and breast can-cer. Observational cohort studies may also be nested in trials. In the Polyp Prevention Trial (Sthatzkzn et аi., 1996), for example, it wil be possible to relate baseline proliferation indices to subsequent аде-пота recurrence. (We have referred here to studies with rieop1ashc cancer precursor end-points, such as cervical intra-epithelial poplasia (CIN) and аде-nomas. For purposes of discussion, we consider these here as proxies for cancer, although, as we have shown, the validity of these precursor end-points is not absolute.)
Ecological studies may provide pertinent (if indi-rect) information, on the SEC-cancer question. Researchers have examined, for example, mean pro-liferative indices in groups at different risks of соi-orectal cancer (Lipkin et al., 1984). In ecological studies, as opposed to observational studies with both marker and disease information on individuals, the link between marker and disease is indirect; one cannot be certain that those who are marker-posi-tive are the ones with increased incidence of cancer.
The AР is of great value here in evaluating the importance of alternative pathways. In idealized Fig. 1, the AР for SEC is 1.0. In the more realistic Fig. 2, however, with at least two pathways to cancer, AР < 1.0. If AР for SEC is high, however, even if it is less than 1.0, it suggests that the alternative Marker 2 pathway plays a small role in the development of cancer. An АР substantially lower than 1.0 suggests that one or more alternative pathways is indeed operative.
268

surrogate eid-points in cancer research
lпtеrvemiоп/expasure—SEC For a given SEC to be valid with respect to a
given intervention, we need to demonstrate that the intervention results in а change in the SEC, or, in an observational setting, that the exposure of interest is associated with marker positivity.
We can address this question in small clinical (metabolic) studies with the putative SEC as the end-point. Examples include studies of fat (Prentice et al., 1990) от alcohol (Refchman et al., 1993) consumption in relation to serum hormone levels. We can also examine this question in a case—control or cohort study of, for example, the relations of reproductive risk factors to HPV infec-tion or breast сапсет risk factors to serum estrogen levels. An ecological study can examine, for exam-ple, the mean proliferative index or degree of epithelial cell DNA hypomethylation in popula-tions with different (average) consumptions of dietary fat (Lipkin et al., 1985).
Iпterveпtioп/exposure—SEGcaлceг Suppose we have established that (1) the SEC is causally connected to cancer, but AP < 1.0 and the route to cancer does not proceed exclusively through the SEC; and (2) the intervention or expo-sure of interest is linked to the SEC. We would still like to determine the relative importance of the intervention/exposure—SEC pathway, as opposed to pathways operating through other SECS. To do this, we examine the extent to which the expo-sure/interventions's relation to cancer is mediated by the sEC, i.e. we address whether SEC status accounts for the observed intervention effect or exposure-associated elevation in risk. This involves integrating SEC assays into either observational epidemiological studies or clinical trials.
In a recent case—control study, for example, Schiffman et al. (1994) examined the extent to which HPV infection mediated the relation between number of sекuаl partners and cervical dysplasia. As Table 2 indicates, there was а strong direct relation between number of sexual partners and risk of cervical dysplasia. When the relation between number of sexual partners and cervical dysplasia was adjusted for the presence or absence of HPV infection, the 11E for number of sexual part-ners dropped dramatically, suggesting that most of the relation between number of partners and dys-plasia relation is attributable to HPV infection.
One can examine the mediating role of a poten-tial SЕС through stratified analyses or standard multiple regression techniques. In geneial, the larger the intervention effect or exposure relation, the fewer study participants are needed in a medi-ation analysis. Because exposure relative risks in observational epidemiological studies are often greater than the intervention effects observed in trials, mediation analyses are more likely to be suc-cessful in the observational epidemiological setting. Genetic mutations as exposures for cancer may prove to be a very fruitful source for mediation analyses of biochemical or cellular markers if they demonstrate the very high ERs that are currently predicted.
Mediation analyses may yield null results, i.e. adjusting for a potential SEC may have little iпflu-епсе on the relative risks for the intervention or exposure. These null findings suggest that the potential SEC does not fuily mediate the relation-ship between intervention/exposure and cancer. Even in the face of such null results, however, when there is an alternative pathway from the exposure (Ell) to cancer through a second marker,
Number of sexual partners
1 2 3-5 6-9 10+
Unadjusted 1.0 1.7 Э.1a 4.7a 4.4a .
Adjusted for HPV Starus 1.0 1.0 1.1 1.5 1.6
a P<0.05
269

Applicalion of Biomагkers in Cancer Epidemiology
the SEC could still reside on the causal pathway to cancer. The degree to which the E1-cancer relation is attenuated after adjustment for SEC1 will depend on the (probably unknown) extent to which the E1-cancer relation is mediated by Marker 2 as well as SEC1 (Figs 2 and 6).
Interpreting the data on SECs: statistical considerations All markers are measured with some error. Two sta-tistical caveats follow from this. First a potential SEC is useful only if it can discriminate among study participants, those in an intervention and control group or those in various categories of risk factor exposure. Such discrimination is practically possible only if the interparticipant variation in the SEC values is not swamped by intra-individual variation. (Intra-individual variation derives, for example, from differences in markers obtained from different tissue areas, measured at different time points or read by multiple readers.) Statistically, this means that the intraclass correlation coeffi-cient [ICC = interparticipant variationl(interpar-ticipant variation + intTaparticipant variation)] for interparticipant variation (the proportion of all variation attributable to between-participant dif-ferences) is reasonably large (Fleiss, 19%).
lntraparticipant variation may be reduced by taking replicate samples (multiple biopsies from different areas, multiple blood draws over time). The reduction in iпtraparticipаnt variability in-creases the relative contribution of the interpartic-ipant variability, and thus the ICC.
Data on components of variance for potential SECs are very sparse. Few studies have provided data on SEC variability, particularly with respect to time-to-time variation. Notable exceptions are recent investigations attempting to determine the number of estradiol measurements necessary to discriminate reasonably among individuals (Cauley et al., 1991; Toniolo et al., 1994; Hankinson et al., 1995). Research into rectal mucosal proliferation variability is also underway (Lyles et al., 1994). We emphasize that quality control studies designed to capture information on marker variability are essential if we wish to evaluate and subsequently use a potential SEC.
Second, and more generally, even if the ratio of inter- to intraparticipant variation is acceptable, measurement error will tend to attenuate findings
from each of the three types of studies discussed above. The intervention-marker and marker-cancer relations will be attenuated by error in marker measurement; the marker-adjusted intervention effect will be inflated.
Conclusion Studies with surrogate end-points may give the right answers about the effect of an intervention or the association with an exposure. Positive results from phase 2 studies with surrogate end-points provide additional—but not incontrovertible—support for moving on to the larger, more expen-sive phase 3 studies with cancer end-points.
Merely being on the causal pathway to cancer does not in itself constitute surrogate validity. It is the totality of causal connections that is critical. Only when the causal pathway goes predomi-nantly through that SEC can one reasonably make strong inferences from SEC findings to cancer. This appears to be the case for adenomas.
When there exist major alternative pathways bypassing that SEC, as in cell proliferation and many other potential SECS, inferences to cancer are problematic. This paper is irn part a plea to carry out the studies—especially SEC-cancer and inter-ventioпlexposuee-eЕС-cancer mediation studies—necessary to evaluate those potential SECS with plausible major alternative pathways to cancer. Such studies are urgently needed if we are to know how well we can generalize from SEC results to cancer. The irony of the surrogate marker problem however, is that the Iarge, long, expensive studies required to evaluate these problematic SECS are those the markers were designed to replace. Moreover, SEC evaluation is often inter-ventionlexposure-dependent: results of validation studies of a marker in relation to one exposure are not necessarily transfzтгаые to the marker in rela-tion to another exposurе/intеrvezuion. Thus, even if we were to find out from some ongoing calcium intervention studies that cell proliferation is a rea-sonably valid surrogate for colon cancer, we can-not be certain that proliferation indices are equally valid in aspirin or folate trials.
At present, there appears to be no substitute for carrying out large-scale epidemiological studies and clinical trials with cancer end-points or SECs that are, for the most part, necessary steps on the causal pathway to cancer.
270

Surrogate end-points in cancer research
References Ваrоn, J.А., Wargovich, М.J., Tosteson, T.D., Sandier, R., Haile, R., Summers, R., van 5to]k, R„ Rothstein, R. & Weiss, J. (1995) Epidemiological use of rectal proliferation measures. Cancer Epidemiol. Biomarkers Prey., 4, 57-61
Bedi, A. Pasrich, P.J., Akhtar, Al., Barber, J.P., Bedi, G.С., Giardiello, F.M., Zehnbauer, B.А., Hamilton, S.R. & Jones, R]. (1995) Inhibition of apoptoses during development of colorectal cancer. Cancer Res., 55, 1811-1816
Cauley, J.A., Gutai, J.P., Kuiler, L.H. & Powell, J.G. (1991) Reliability and interrelations among serum sex hor-mones in postmenopausal women. Am. J. Epidemiol., 133, 50-57
Fleiss J.L. (1986) The Design and Analysis of Clinical Experiments, New York, John Wiley & Sons, pp. 1-5
Garewal, H.S., Ramsey, L., Kaugars, G. & Boyle, J. (1993) Clinical experience with the micronucleus assay. J. Cell Biochem., 17 (Suppl. F), 206-212
Hankinson, S.E., Manson, J.E., Spiegelman, D., Willett, W.C., Longcope, C. & speizer, F.E. (1995) Reproducibility of plasma hormone levels in postmenopausal women over a 2-3-year period. Cancer Epidemiol. Biomarkers Prev., 4, 649-54
Hi11, M J. (1991) From adenoma to carcinoma of the col-orectum. Recent Results Cancer Res., 122, 71-84
Lipkin, M., Blattner, W.A., Gardner, E.J., Burt R.W. Lynch, LI., Deschner, E., Winawer, S. & Fraumeni, J.F. (1984) Classification and risk assessment of individuals with familial polyposis, Gardner's syndrome, and familial non-polyposis colon cancer from [3Н]thymidine labeling patterns in colonic epithelial cells. Cancer Res., 44, 4201-4207
Lipkin, M., Uehara, K., Winawer, S., Sanchez, A., Bauer, C., Phillips, R., Lynch, H.T., Blattner, W.A. & Fraumeni, J.F., Jr (1985) Seventh-Day Adventist vegetarians have a quiescent proliferative activity in colonic mucosa. Cancer Left., 26, 139-144
Lyles, С.M., Sandler, R.S., Keku, T.O., Kipper, L.L., Millikan, C., Murray, S.C., Bangdiwala, S.I. & Ulshen, M.H. (1994) Reproducibility and variaibility of the rectal mucosal proliferation index using proliferating cell nuclear antigen immunohistochemistry. Cancer Epiderniol. Biomarkers Prey., 3, 597-605
Muto, T., Bussey, H J.R. & Morson, B.C. (1975) The evolu-lion of cancer of the colon and rectum. Cancer, 36,2251-2270
Prentice, R.L. (1989) Surrogate endpoints in clinical trials: definition and operational criteria. Stat. Med., 8, 431-440
Prentice, R., Thompson, D., Clifford, C., Gorbach, S., Goldin, B. & Byar, D. (1990) Dietary fat reduction and plasma estradiol concentration in healthy pre-menopausal women. J. Nat' Cancer Inst., 82, 129-134
Reichman, М.E., Judd, J.T., Longcope, C., 5chatzkin, A., Nair, P.P., Campbell, W.5., Clevidence, B.А. & Taylor, P.R. (1993) Effects of moderate alcohol consumption on plasma and urinary hormone concentrations in pre-menopausal women. J. Nat' Cancer Inst., 85, 722-727
Schatzkin, A., Freedman, L.S., Schiffman, M.H. & Dawsey, S.М. (1990) The validation of intermediate end-points in cancer research. J. Natl Cancer Inst., 82, 1746-1752
Schatzkin, A., Lauza, E., Freedman, L.S., Tangrea, J., Cooper, M.R., Marshall, J.R., Murphy, P.A., Selby, J.V., Shike, I., Schade, R.R., Burt, R.W., Kikenda11, W. & Cahill, J. (1996) The Polyp Prevention Trial; I. rationale, design, recruitment, and baseline participant character-istics. Cancer Epidemiol. Biomarkers Prey., 5, 375-384
Schiffman, M.H. (1992) Recent progress in defining the epidemiology of human papillomavirus infection and cervical neoplasia. J. Natl Cancer Inst., 84, 394-398
Schiffman, М.H., Bauer, H.M., Hoover, R.N., Glass, А.G., Cadell, D.M., Rush, B.B., Scott, D,R., Sherman, М.E., Kurman, R.J., Wacholder, S., Stanton, C.K. & Manos, М.М. (1993) Epidemiologic evidence showing that human papillomavirus infection causes most cervical intraepithelial neoplasia. J. Nad Cancer Inst., 85, 958-964
Schiffman, M.H. & Schatzkin, A. (1994) Test reliability is critically important to molecular epidemiology: an example from studies of human papillomavirus infection and cervical neoplasia. Cancer Res., 54, 1944s-1947s
Toniolo, P., Koenig, K.L., Pasternack, B.S., Banет jee, S., Rosenberg, C., Shore, R.E., Strax, P. & Levitz, M. (1994) Reliability of measurements of total, protein-bound, and unbound estradiol in serum. Cancer EpidemioI. Biomarkers Prey., 3, 47-50
Toniolo, P.G„ Levitz, M., Zeleniuch-Jacquotte, A., Banerjee, S., Koenig, K.L., Shore, R.E., Strax, P. & Pasternack, B.S. (1995) A prospective study of eridoge-nous estrogens and breast cancer in postmenopausal women. J. Nail Cancer Inst., 87, 190-197
Corresponding author A. Schatzkиn Division of Cancer Prevention and Control, National . Cancer Institute, Bethesda, MD 20892, USA
271

Applicaüon ы 6iomarkers in Dancer Epidemiology
Toпiolo, P., Bofletta, P_, shcker, DEC., Rothman, N., Hulka, B- and Pearce, N., eda 1ARC 5cientiнc Publicalionu No. 142
lnternalional Agency 1or Research on Cancer, Lyon, 1997
Biomarker end-points in cancer chemoprevention trials C.W. Boone and G.J, Kelloff
Over the last decade, the Chemoprevention Branch, Division of Cancer Prevention and Control, National Cancer Institute, цSA, has been developing drugs that will slow or stop the progression to invasive cancer of precancerous (pre-invasive) lesions generally termed 'intraepithelial dysplasia' or dysplasia'. Over 40 short-term clinical trials are in progress, testing the following classes of agents on precancerous lesions in the different major organ systems: antimutagens (N-acetylcysteine, oltipraz), antiproliferatives (difluoromethylornithine, dehydroepiandrosterone, selenomethionine), antioxidants (vitamin E, curcumin), anti-inflammatories (aspirin, piroxicam, ibupro#en, sulindac sulfone) and hormonally active agents (tamoxifen in breast ductal carcinoma in situ and finasteride in prostatic intraepithelial neoplasia). Because of the strong practical need to keep so many clinical trials as short-term as possible, certain tissue changes known to be associated with high cancer risk were selected for use as biomarker end-points in the trials, such changes being quantitatively assayed by computer-assisted image analysis.These'surrogate end-point biomarkers' (SEBs) are based on the individual cellular morphological and functional changes universally used by histopathologists to diagnose the lesion of intraepithelial neo-plasia (Riddell, 1984; Boone of aL, 1992; Wright of aL, 1994). High grades of this lesion precede invasive cancer in the great majority of cases, and therefore SEBs based on them are linked to high cancer risk.Table 1 summarizes some of the short-term clinical trials now being monitored by the Chemoprevention Branch. The SEBs abbreviated `PPNN' in the figure are: proliferative index (P); ploidy (DNA histogram) (Р); nuclear morphometry and chromatin texture (N); and nucleolar size and frequency (N). Computer-assisted image analysis 1s used to assay these features quantitatively, which gives the SEBs increased objectivity, reproducibility and sensi-tivity. Further details concerned with cancer chemoprevention trials using SEBs, and their relation to the field of cancer epidemiology, аrе given below.
Cancer chemoprevention in relation to cancer epidemiology Rathman (J 986) describes clinical trials as a type of experimental epidemiology, stating that clinical trials, where the word 'trial' is used as a synonym for 'experiment', are epidemiological studies of dif-ferent treatments for patients who already have the disease, and that 'the exposures in a clinical trial ... are preventives of the sequelae of the initial disease'. For this presentation, the specialized area of experimental epidemiology concerned with clinical trials will be called 'clinical epidemiology' and contrasted with what will be called traditional 'environmental epidemiology'. This contrast is described in Table 2.
Whereas environmental cancer epidemiology focuses on the cause and pathogenesis of cancer, clinical cancer epidemiology focuses on the diag-
nosis and therapy of cancer, and particularly on the conduct of randomized prospective interven-tion trials of therapeutic agents. Both areas of can-cer epidemiology focus on cancer prevention, but from different perspectives. The environmental cancer epidemiologist favours 'primary prevention' and seeks to proscribe elements in the environment that are known to be associated with increased cancer risk, e.g. tobacco and alcohol use, exposure to fossil fuel combustion products, and fatty diet. The clinical cancer epidemiologist favours 'secon-dary prevention' of already established pre-invasive neoplastic disease and seeks to prescribe drugs that will prevent progression to the stage of invasive-ness. Although chemoprevention is characterized here as a form of secondary prevention, in that it prevents the further sequelae (i.e. invasive cancer) of the 'primary disease' (i.e. neoplasia), it could be
273

Application of Biomarkers in Cancer Epidemiology
. в
Organ
' • • в
-
Chemoprevention
в - • - - в в ' в • • в
Gross lesion (Microlesion = dysplasia)
в • i - в I в
SEBs Other SEBs
Skin 4HPR Actinic keratoses PPNNa PCNA, RAR
Oral 4NPR Leukoplakia PPNN PCNA, RAR, EGFR, ТGF-[l, . involucrin
Breast 4NPR Mammogram: ductal carcinoma in situ PPNN PONA, р53, erbв-2
Lung 4HPR Chronic smoker PPNN PCNA, EGFR, р53, F1SH
aneusomy
Bladder DFMO Focus of redness PPNN . ODC, EGFR, Lex
Colon Са2+ Adenomatous ро lуp PPNN Ihy, BrdU, extLeк, keratins,
intégrins
Prostate Proscar PINb PPNN
Cervix 4HPR Masaicism, punctation PPNN DNA aneuploidy, PCNA, K-ras
flPPNN: proliférative indвx; ploidp; nuclear morphometry; nucleolar morphometry' ЬP1N: prostatic intraepithelial neoplasia.
argued that chemoprevention has elements of pd-mary prevention because it involves arresting the neoplastic process before invasive cancer develops. Regardless of this point, it is clear that cancer chemopreventiori is an activity that belongs to the area of clinical cancer epidemiology.
The relationship between cancer chemopreыeпtion and molecular cancer epidemiology The rapidly expanding field of molecular cancer epidemiology was developed using the termi-nology of environmental epidemiology (Hu1ka et а1., 1990; Perera et al., 1982). Figure 1 illustrates how the biomarkers identified along the carcino-gen exposure—neoplastic disease sequence were defined: (1) the external (carcinogen) dose biomarker; (2) the internal (carcinogen) dose bio-marker; (3) the biologically effective dose (BED) biomarker (e.g. DNA and haemoglobin adducts to carcinogen); and (4) the biological response (BR) biomarker (e.g. stable mutations
produced by a carcinogen). The (BR) biomarker may be considered as an early molecular lesion at the beginning of the sequence of neoplastic dis-ease progression [the precedent for calling an abnormal molecular change a 'lesion' has been established by Ames (1995), who makes a useful distinction between DNA lesions, such as strand breaks and carcinogen adducts (BED markers), and DNA mutations (BR markers), which require cell division for their production from DNA lesions]. The fifth biomarker in this sequence has been caцed the subclinical disease marker (subclinical in the sense that the subject with the marker has no signs or symptoms), and is defined by Hulka et al. (1990) as `a measurable indicator of a stage of dis-ease or a manifestation of the disease itself'.
Clearly, as shown in Table 2, the subclinical diag-nostic disease markers related to intraepithelial neo-plasia (dysplasia) which are used as surrogate end-point biomarkers (SEBs) in clinical trials of chemopreventive agents are the same subclinical
274

Biomarker end-points in cancer chemoprevenbon trials
disease markers as defined by Hulka et aI. (1990) They are described more fully below.
lntraepithelial(pre-invasive) neoplastic disease: the target of cancer chemoprevention Multifocal intraepithelial (pre-invasive) neoplastic disease, a lesion of which is illustrated in Fig. 2, is the target lesion for the programme of the Chemoprevention Branch at the US National Cancer Institute. For most organ epithelia, in par-ticular breast (Page etal., 1985), prostate (Bostwick, 1992), colon (The Multicentric Study of Colorectal Adenomas Workgroup, 1995), cervix (Chanen, 1990) and lung (Carter, 1985), multifocal lesions of the intraepithelial neoplasia arise in the epi-thelial compartment as monoclonal expansions at multiple sites aid progress at different rates f от many years. Sortie intraepithelial neoplas-tic lesions remain stable or, in earlier stages, even regress. In a small proportion of lesions, however, the slowly growing intraepithelial neoplastic cell populations continue to progress to the point of invasion across the basement membrane, at which time the lesion is, by definition, diagnosed as can-cer. Over the many years it takes intraepithelial neoplasia to progress, the goal of cancer chemo-prevention is to find drugs that will drastically slow, stop or bring about regression of the intraep-ithelial neoplastic lesions while they are still con-fined to the epithelial compartment, thereby pre-venting progression of any one of them to invasive cancer.
Validation that reduction iп the extent of lntraepithelial neoplasia (dysplasia) is a SEB that predicts a reduction in cancer incidence In epidemiological terms, intraepithelial neoplasia is a necessary component on the final common path-way to cancer. The concept is straightforward--if one were to give a chemopreventive drug that eradicated all of the multifocal lesions of intra-epithelial neoplasia (dysplasia), one could expect to have eliminated the possibility of the subse-quent development of cancer (Fig. 2). Thus, it appears reasonable that reduction of the multiple lesions of intraepithelial neoplasia, as determined by visual inspection and multiple biopsies, may not be difficult to validate as a marker that predicts a reduction in cancer incidence. Although multi-focal intraepithelial neoplasia (dysplasia) is a nec-essary condition permitting further progression to cancer, it may not be a sufficient one, since the majority of dysplastic epithelial lesions do not progress to invasion and may even regress.
SE6s based on the diagnostic morphological features of intraopithelial neoplasia (dysplasia) measured by computer-assisted quantitative image analysis (COLA) Proliferative status. The continuous and abnormal increase in the proliferative rate of intraepithelial neoplastic lesions is part of the process of clonal evolution, which is described as the continuous production within the neoplastic population of genetic variants that are able to escape growth
Environmental cancer epidemiology Epidemiologists: toxicologists
Focus: cause and pathogenesis of cancer
Observational studies
Cancer prevention by proscription (primary prevention)
Biomarkers: Biologically effective dose (BED) e.g. adducts Biological response (BR), e.g. mutations. measured individually by computer-assisted quantitative image analysis
Clinical cancer epidemiology Oncologists, pathologists
Focus: diagnosis and therapy of cancer
Prospective intervention trials
Cancer prevention by prescription (secondary prevention)
Biomarkers: subclinical disease markers Pap smear showing nuclear atypia Biopsy showing diagnostic disease markers for dysplasia measured individually by computer-assisted quantitative image analysis
275

Application of Biomarkers in Cancer Epidemiology
inhibitory controls and undergo clonal expansion at the expense of the more slowly growing back-ground cells (Nowell, 1986; Boone et ai., 1992 (review), 1993). As selected clones in the popula-tion continue to arise and expand by virtue of their faster growth rate, the overall mean growth rate of the neoplastic population increases.
The proportion of tissue cells in the proliferative cycle versus those in Go (not proliferating) can be accurately measured using CQIA. The computer measures the percentage of the total nuclear area in a section that binds to a chromogen-Iabelled anti-body probe, such as antibodies to PCNA, Ki-67, (using MIB-1) or BrdU (technique described in Esteban et a1. 1993). The proliferating fraction may also be measured by tritiated-thymidine up-take/autoradiography or by mitotic counts. The mitotic index (percentage of cells in mitosis) has proven to be a reliable prognostic factor in breast
cancer, accurately predicting the recurrence-free survival and overall survival either by itself (van Diest et aL, 1992) or as part of a commonly used grading system (Bloom, 1950). In the coloredum, an upward shift of the zone of maximat prolifera-tion towards the neck of the gland (`stage II anom-aly') has been shown to be an important predictor of increased cancer risk (Deschner & Haskens, 1982).
Ploidy status. The DNA content per cell nucleus measured by CQIA is displayed as a histogram, from which the type and degree of variation from diploidy may be quantitatively estimated. AneupIoidy has been shown to occur during intraepithelial neoplasia in bladder (Tribukait, 1987), prostate (Montironi et al., 1990; Tribukait, 1991; Amih et aL, 1993), breast (Carpenter et а1., 1987; Erhardt & Auer, 1987; Crissrnan eta?., 1990;
Molecular cancer epidemiology
Markers of exposure Markers of disease
Exposure -- Internal - Biologically—*- Early biological —~Subclinical -- Clinical —+- Prognostic
dose of effective dose lesion preinvasive disease significance carcinogenic early neoplastic
agent disease lesions
DNA adducts Gene mutation Intraepithelial Cancer neoplasia
Protein Allelic loss adducts or gain
Chromosome aberration
Markers of susceptibility
Genetic/metabolic Nutritional status (Р45д, GST)
Immunological status DNA repair
Disease status
Figure 1. The position of intraepithelial neoplasia (dysplasia), shown as a subclinical disease biomarker in the carcinogen exposure-neoplastic disease sequence.
276

lntraepitheliai = preinvasive = precanceг = premalignant
Extraepithelial = cancer = malignant
Bioniarker end-points in cancer chemoprevention trials
Phases of Neoplasia
V I II Focal
Latent Aberrant Phase Proliferation
IП N Dysplasia
{Focal Dysplastic Proliferation} Microinvasion
Мeta-stasis
Atypical 1A-lavrв _ Б-7оyrs - Breast Hypвrplasia flC1S ~T
Cervix CIN 1 ) CIN III/CIS 1б-2Оуг$
Colon `ѕ Adenoma ~t Y~
Prostate 20 `s PIN > io уг
Invasion cancer
Figure 2. Diagram illustrating the concept that if multifocal intraepithelial neoplasia is stopped by the administration of a chemopreventive drug, further progression to invasive cancer is prevented.
Visscher et ai., 1993), cervix, skin, oral teukoplakia, larynx, lung, oesophagus, stomach and colorec-tum (reviewed in Boone et aI., 1992). In one study of breast ductal caicirioma in situ, the cribriform histological pattern exhibited 38% aneuploidy whereas the comedo pattern exhibited 82% aneu-ploidy (Crissman et al., 1990). In another study, atypical hyperplasia of the breast also exhibited aneuploidy iп 4 of 13 cases (Carpenter etal.,1987). With regard to invasive neoplasia, ploidy status has proven to be a reliable prognostic factor of dis-ease-free survival and mortality in both breast (van Diest & Baak, 1992) and prostate (Lieber, 1992) cancer. Concerning pre-invasive neoplasia (dyspla-sia), DNA aneuploidy determined by CQIA has proven to be an effective SEB that correlates with the severity of intraepithelial neoplasia of breast (Beerman et a1., 1990) and prostate (Montlroni et aL, 1990; Lieber, 1992; Petein et al., 1992; Amin et яl., 1993).
Nuclear morphometry (nuclear size, shape and pleo-morphism). It is quite remarkable that, in a number of studies, alteration of nuclear shape alone proved to be a better predictor of mortality in stage A2 pro-static cancer than were the Gleason, Mostofi or Johns Hopkins grading systems, or ploidy status (Epstein et L, 1984; Partiri et a1., 1989; Mohler et a7., 1992;). Multivariate analysis of up to 16 nuclear shape descriptors, measured by CQIA, including nuclear roundness factor, variance of roundness factor and nuclear ellipticity, have accurately pre-dicted recurrence of cancer after surgery in 11 of 26 patients with renal cell carcinoma (Pound et ai.,
1993), 7/14 patients with transitional cell carci-noma of the bladder (Borland et a2., 1993), and 17/27 patients with Wilms' tumour of the kidney (Gearhart et al., 1992). Nuclear pleomorphisin is an important concomitant of neoplasia that may be measured as the simple mean of the variances of size and shape.
277

Application of Biomarkers in Cancer Epidemiology
Nuclear chromatin texture. `Chromatin clumping' is a semiquantitaiive nuclear feature long recognized by pathologists as a correlate of the extent of neo-plastic progression. Mildly dysp1astic cells, for instance, tend to exhibit less chromatin clumping than severely dysp1astic cells. With OQIA, the degree of cliromatin clumping may be measured precisely. The multitude of possible optical density patterns transmitted through many hundreds of pixels over a given cell nucleus has been system-atized into what is known as the Markovian texture feature matrix (Pressman, 1976). Selection may be made among dozens of different Markovian tex-ture features for those which best contribute to a multivariate classification function that will pre- dict the likelihood of intraepithelial neoplasia pro-gressing to invasive cancer (Doudkine et al., 1995). Nuclear chromatin texture analysis by CQIA there-fore has excellent potential for providing many features which are useful as SEBs.
Nucleolar morphometry (number, size, shape, posi-tion and pleomorphism). In a study of nine пucleo-lar morphometrical features in breast cancer, sim-ple nucleolar frequency among nuclei (total num-ber of nucleoli per 100 nuclei) was a significant predictor of recurrence-free survival (van Diest et cl., 1990). Changes in nucleolar morphoinetry have been reported to be a correlate of the extent of neoplastic progression in prostatic intraepithelial neoplasia (Helpap, 1988; Montironi et al., 1991). Argyrophilic nucleolar organizer region-associated proteins found within nucleoli form the basis for the AgNOR stain. Using this stain, the mean num-ber of nucleolar organizer regions (NORs) clearly distinguish between tubular adenomas, villous adenomas with moderate nuclear atypia, villous adenomas with severe nuclear atypia and colorec-tal adenocarcinorna (Yang et al., 1990). The AgNOR stain, especially if quantitated by CQIA, offers good potential as a SEB.
Continuous grading scale measured in standard devi-ation units. The individual morphological and pro-liferative features of intraepithelial neoplasia dis-cussed above characteristically progress as a group towards greater aberrancy. The quantitative extent of aberrant variation of each feature in the group, measured by computer-assisted image analysis, may be graded in terms of the number of standard
deviation units from the mean, and a critical value diagnostic of neoplasia may be defined for each feature (Dr James Bacus, personal communica-tion). A composite biomarker made up of a num-ber of diagnostic features may then be constructed,
Development of molecular SEBs The Chemoprevention Branch is also evaluating various candidate molecular SEВs as predictors of high cancer risk and for their efficacy in short-term clinical trials. Molecular SEBs being studied include those related to genomic instability, oncogeree amplification, tumour suppressor gene loss, aber-rant differentiation molecules and aberrant expres-sion of growth regulatory molecules and their receptors. There are screening programmes in the planning stage that will allow the collection of cohorts of subjects with activated oncogenes or mutated or lost tumour suppressor genes, от with genetic markers of susceptibility to cancer, which may become the subject of chemoprevention trials.
The most desirable molecular SEBs may be those that appear before the onset of intraepithelial neo-plasia in normal-appearing epithelium. The evalu-ation of early genomic instability is an example. The development of such early 'pre-dysplastic' SEBs, which is now in progress in the programme of the Chemoprevention Branch, will permit many more months or even years of treatment with chemopreventive agents over a period when the molecular lesions may be more susceptible to sup-pressive drugs. Molecular SEBs that are superim-posed on neoplastic tissue changes already identi-fiable microscopically may offer considerable addi-tional information in tissue biopsies, particularly as technology involving microdissection of individ-ual cells followed by PCR and gel analysis becomes established.
References Ames, B.N. (1995) The causes and prevention of cancer. Prос, NatiAcad. Sci. USA, 92, 5258-5265
Amin, M.B., Schultz, D.S., Zarbo, R.J., Kubus, J. & Shaheen, C. (1993) Computerized static DNA ploidy analysis of prostatic intraepithelial neoplasia. Arch. Pathel. Lab. led,, 117, 794-798
Beerman, H., K1uin, P.M., Hermans, J., Velde, С.J.Н. & Cornelisse, C.J. (1990) Prognostic significance of DNA-ploidy in a series of 690 primary breast cancer patients. JuL J. Cancer, 45, 3-39
278

Biomarker end-points in cancer chemopreventioh trials
Bloom, H.J.G. (1950) Prognosis in carcinoma of the breast. Br. J. Cancer, 4, 259-288
Bоoпе, С.B., Kelloff, G.J. & Steele, V.E. (1992) Natural his-tory of intraepithelial neoplasia in humans with impli-cations for cancer chemoprevention strategy. Cancer Res., 52, 1651-1659
Boone, C.W., Kelloff, G.J. & Freedman, L. (1993) Intraepithelial and postinvasive neoplasia as a stochastic continuum of clonal evolution, and its relationship to mechanisms of chemopreventive drug action. J. Cell Biochem., 17G, 14-25
Borland, R.N., Partin, A.W., Epstein, J.I. & Brendler, С.B. (1993) The use of nuclear morphometry in predicting recurrence of transitional сеll carcinoma. J. UroL, 149, 272-275
Bostwick, D.G. (1992) Prostatic intraepithelial neoplasia (PIN): current concepts. J. Cell Biochem., 16Н, 10-19
Carpenter, R., Gibbs, N., Matthews, J. & Cooke, T (1987) Importance of cellular DNA content in pre-malignant breast disease and pre-invasive carcinoma of the female breast. Br. J. surg., 74, 905-906
Carter, D. (1985) 5quamou5 cell carcinoma of the lung: an update. 5еmin. Diag. PathoL, 4, 226-234
Chanen, W. (1990) The CIN saga, the biological and clin-ical significance of cervical intraepithelial neoplasta. Aust, Ni J. Obstet. GynaecoL, 30, 18-23
Crissman, J.D., Visscher, М.D. & Kubus, J. (1990) Image cytophotometric DNA analysis of atypical hуреrрlаsiа and intraductal carcinomas of the breast, Arch. PathoL Lab. Merl., 114, 1249--1253
Deschner, Е.Е. & Maskens, А.Р. (1982) Significance of the labeling index and labeling distribution as kinetic para-meters in colorectal mucosa of cancer patients and DMH treated animals. Cancer, 50, 1136-1141
Doudkirne, A., MacAulay, C., Poulin, N. & Palcic, B, (1995) Nuclear texture measurements in image cytometry. Pathologica, 87, 180-193
Epstein, 3.1,, Berry, S.J. & Eggleston, J.C. (1984) Nuclear roundness factor. A predictor of progression in untreated Stage А2 prostate cancer. Caner, 54, 1666-1671
Erhardt, K. & Auer, G.U. (1987) Mammary carcinoma. Comparison of nuclear DNA content from in situ and infiltrative components. Anal. Quant. Cytoi. Flistol., 9, 263-267
Esteban, J.M., Kandalaft, P.L., Mehta, P., Odom-Maryon, T.L., Bacus, S. & Battifora, I. (1993) Improvement of the quantitation of estrogen and progesterone receptors in paraffin-embedded tumors by image analysis. Am. J. Clin. PathoL, 99, 32-38
Gearhart, J.P., Partin, A.W., Leventhal, B. & Beckwith, J.I. (1992) The use of nuclear morphometry to predict response to therapy in "Wilms" tumor. Cancer, 69, 804-808
Helpap, B. (1988) Observations on the number, size, and localization of nucleoli in hyperplastic and neoplastic prostatic disease. Hгstopathology, 13, 203-211
Hulka, B.S., Wilcosky, T.C. & Griffith, J.D. (1990) Biologic letarkers in Epidemiology, New York, Oxford University Press
Lieber, M.M. (1992) DNA ploidy: early malignant lesions. J. Cell Biochem., 16Н, 44-46
Mohler, J.~., Partin, A.W., Epstein, J.I., Becker, R.L., Mike1, U.V., Sesterhenn, I.A., Mostofi, F.K., Gleason, D.F., Sharief, Y. & Coffey, D.S. (1992) Prediction of prognosis in untreated stage АZ prostatic carcinoma. Cancer, 69, 511-519
Montironi, R., Scarpelli, M., Sisti, S., Braccischi, A., Gusella, P., Pisani, E., Alberti, R. & Mariuzzi, G.M. (1990) Quantitative analysis of prostatic intraepithelial neopla-sia on tissue sections. Anal. Quant. Cytol. listai., 12, 366-372
Montironi, R., Braccischi, A., Matera, G., Scaгрelli, M. & Pisani, E. (1991) Quantltation of the prostatic intraep-ithelial neoplasia. Analysis of the nucleolar size, number, and location. ЛathoI. Res. Pract., 187, 307—З14
Nowell, P.C. (1986) Mechanisms of tumor progression. Cancer Ras., 46, 2203-2207
Page, D.L., Dupont, W.D., Rogers, L.W. & Rados, M.S. (1985) Atypical hyperplastic lesions of the female breast: a long-term follow-up study. Cancer, 55, 2698-2708
Partin, A.W., Walsh, A.C., Pitcock, R.V., Mohler, J.L., Epstein, J.1. & Coffey, D.S. (1989) Comparison of nuclear morphometry and Gleason grade as predictor of prig-. nosis in Stage АZ prostate cancer: a critical analysis. J. Uni., 142, 1254-1258
Perera, F.P. & Weinstein, I.B. (1982) Molecular epidemi-ology and carcinogen-DNA adduct detection: new approaches to studies of human cancer causation. J. Chronic Dis., 35, 581600
Peteiп, M., Michel, P., van Velthoven, R., Pasteels, J.L., Brawer, М.K., Davis, J.R., Nagle, R.B. & Kiss, R. (1991) Morphonuclear relationship Ьеtwееп prostatic intraep-ithelial neoplasia and cancer as assessed by digital cell image analysis. Am. J. Сliп. PathoL, 96, 628-634
Pound, C.R., Partin, A.W., Epstein, 3.1., Simons, J.W. & Marshall, F.F. (1993) Nuclear morphometry accurately predicts recurrence in clinically localized renal cell carci-noma. Urology, 42, 243-248
Pressman, N.J. (1976) Markovian analysis of cervical cell images. J. Histochem. Cytochem., 24, 138-144
279

Application of Biomarkers in Cancer Epidemiology
Riddell, R.H. (1984) Dysplasia and cancer in ulcerative colitis: a soluble problem? Scaod. J. GаstroeпterоL, 104, 137-149
Rothman, K J. (1986) Modern ергдeтiоlоgy. Boston, Little, Brown. pp. 52x53
The Multicenmc Study of Colorectal Adenomas (SMAC) Workgroup (1995) A multicenter study of colorectal ade-nomas: rationale, objectives, methods, and characteris-tics of the study cohort. Tarif, 81, 157-163
Tribukait, B. (1987) Flow cytometry in assessing the ciii-ical aggressiveness of genito-urinary neoplasms. World J. UroL, 5, 108-122
Tribukait, B, (1991) DNA flow cytometry in carcinoma of the prostate for diagnosis, prognosis, and study of tumor biology. Acta licol, 30 187-192
van Diest, P.J., Mouriquand, J., Schipper, NW. & Baak, J.P.A. (1990) Prognostic value of nudeolar morphometric variables in cytological breast cancer specimens. J. CГn. PathoL 43, 157-159
van Diest, P.J. & Baak, J.Р.А. (1992) Quantitative Cyto- and Histoprognosis in Breast Cancer, New York, Elsevier, pp. 55-62
van Diest, P.J., Baak, J.P.A. Matze-Cok, P. & Wisse-Brekelmans, E.C.М. (1992) Reproducibility of mitosis counting in 2,469 breast cancer specimens: results from the multicenter inorphometric mammary carcinoma project. 1-Ir' PatiwL, 23, 603--607
Visscher, D.W., Micale, M.A. & Crissman, J.D. (1993) Pathological and biological relevance of cytophotometric DNA content to breast carcinoma genetic progression. J. Cell Biochem., 17G, 114-122
Wright, T.C., Kurman, R.J. & Ferenczy, A. (1994) Precancerous lesions of the cervix. In: Kurman, R.J., ed., Blansteins Pаthology of the Female Genital Tract, New York, springer-Verlag
Yang, P. Huang, G.S. & Zhu, X.S. (1990) Role of nuclei-lar organizer regions in differentiating malignant from benign tumours of the colon. J. Clin. PathoL, 43, 235-238
Corresponding author C'W. Boone Chemoprevention Branch, Division of Cancer Prevention and Control, National Cancer Institute, National Institutes of Health, Bethesda, MD 20892, . USA
280

Application ы Biomarkers it Cancer Epidвmioiоgy Toniolo, P. Ralfatta, P., Shuker, DEC., Rothman, N. Hulka, B. and Pearce, N., edе
IARC Scieпt9iе PuЫ iaations Na. 142 lпterпаtиоеа l Agency for Research on Cancer, Lyon, 1997
The use of biological markers as predictive early-outcome measures in epidemiological research А.J. McMichael and А . Hall
One of the possible uses of biomarkers in epidemiological research is as early-outcome measures to predict the occurrence of clinical disease and to elucidate the biological mechanism of pathogenesis. This use is conceptualIy less straightforward than the well established use of biomarkers to improve or extend exposure assessment or to study interindividual variations in disease susceptibility. In principle, this form of use could accelerate or otherwise facilitate etiological research. However, in practice, the recent review literature suggests that this mode of biomarker use, especially in cancer epidеmiolоgy, is the least clear-cut and the least well developed. The recurrent problem is identifying biomarkers that: (1) are on the causal pathway, (2) have a high probability of progression to clinical disease, and (3) account for all or most of the cases of the specified clinical outcome. Such biomarkers would be most useful if they conferred a long lead-time relative to clinical disease occurrence.
The use of biological markers, molecular or other-wise, in epidemiological research should be as a means and not as an end (Hulka, 1991; McMichael, 1994). Therefore, the critical question to ask in any particular study is: 'Has use of the biomarker in this study yielded new information, or better informa-tion, for understanding, and perhaps quantifying, the causation of the disease of interest?'
The four major contexts in which biomarkers may be used in epidemiological research are: (1) to improve the assessment of exposure; (2) to identify and take account of subgroups of persons of dif-fering susceptibility to the effects of the exposure; (3) as measures of early outcome with known (or presumed) predictive significance; and (4) as a basis for differentiating disease subtypes with potentially different etiologies.
The first of these uses, improving the assess-ment of exposure, can be enhanced by use of a wide range of biological markers, from blood cho-lesteroI aid urinary cotinine, to levels of DNA adducts in surrogate and target tissue cells. Some such measures will identify component exposures within a complex mixture, others will confirm that an internal exposure has indeed occurred, while others yield an integrated measure of biologically
effective dose'. This last integrates either multiple external sources of exposure or multiple internal metabolic steps, or both.
The second mode of biomarker use—the identi-fication of subgroups of study subjects with different levels of susceptibility to some particular exposure—often depends on measuring some biochemical or molecular genetic characteristic. For example, one recent study indicated that the reduction in coronary heart disease mortality risk associated with increasing levels of consumption of alcohol, within the low-moderate range, depends on whether the individual is Lewis blood group positive or negative (Hein et a1., 1993). 5imilагly, the risk of colon cancer associated with increasing levels of meat consumption appears to depend on whether an individual is a fast or a slow acetylator (Roberts-Thomson et al., 1996)—a polymorphic metabolic characteristic that is measurable directly via genotype analysis of NAT2 alleles (Minchin et al., 1993; Roberts-Thomson et ad., 1996).
These two uses of biomarkers can sometimes be combined to elucidate, or confirm, epidemiological relationships. For example, cigarette smokers are known to be at increased risk of cancer of the urinary bladder. The risk of this cancer is also higher in
281
Applicatron of Biomarkers in Cancer Epidemiology
slow acetylators than in fast acetylators (Lower et al., 1979; Hansen et cl., 1985; Cartwright et al., 1982). Since arylamines, present in cigarette smoke, are a known occupational cause of bladder cancer (especially R-naрhthуlamine) and are metabolized by NAT2, the acetylation pathway, it has been postulated that the carduogenic effect of certain arylamines might account for the epidemiological findings. Studies of the levels of DNA adducts in white blood cells in different categories of persons have shed further light on those relationships: smokers have higher levels of 4-amino-bipherryl-haemoglobin adducts than non-smokers (Bryant et cL, 1987), and in smokers (especially 'passive smokers') the level is higher in slow than in fast acetylators (Vineis et cL, 1994).
The third possible use of bioniarkers—the use of early-outcome measures to predict the occur-rence of clinical disease—is the subject of this chap-ter. It is conceptually less straightforward than the previous two uses; its principal purposes appear to be to accelerate (or otherwise facilitate) etiological epidemiological research and to elaborate the intervening steps along the causal pathway. The recent review literature suggests that this third mode of biomarker use, especially in cancer epi-demiology, is the least clear-cut and the least well developed (Perera & Santella, 1993; McMichael, 1994). Typically, there is a preference for identifying and using biomarkers that confer a long lead-time relative to the appearance of clinical disease. Such biomarkers may be cellular, biochemical or molecular.
The fourth above-mentioned use of bioimrkers is outside the scope of this paper. By differentiating disease subtypes and thus increasing the specificity of the data analysis, this particular use should enhance the informativeness of a study (e.g. Taylor et cL, 1992; Vahakangas et al., 1992).
Uses of predictive' biomarkers There are four main uses of biomarkers as predic-tors (or 'surrogate end-points'): (1) screening for pre-clinical disease; (2) enhancement of conven-tional epidemiological studies of disease etiology; (3) monitoring for variation or change in popu-lation health risk; and (4) confirmation, via con-trolled intervention studies, of biomarkers that could subsequently be applied in the evaluation and monitoring of primary prevention measures.
In each of the first three of these uses, the pre-dictive ability of the biomarker is inferred from knowledge of the natural history of the disease, and is then applied in ways that save time in epi-demiologicaI research or that save time (and lives) in public health prevention. In the fourth use, one examines whether the inferred predictivity of the biomarker is also evident under the strict condi-tions of the controlled intervention—i.e. is there a strong within-individual correlation between changes in the biomarker, as induced by the intervention, and occurrence of the clinical éпд-point (e.g. the Concorde Trial; see section on the 'confirmation of the predictivity of biomarkers' below)?
Routine screening for (immediately) pre-clinical conditions There is a well established use of precursor lesions at the macroscopic level in clinical medicine for the early detection of disease, e.g. precancerous polyps of the large bowel and hypertension-associated arteriovenous 'nipping' within the retina. Similarly, the early detection of women likely to develop cancer of the cervix is achieved by taking cell sam-ples from the cervical mucosa and seeking micro-scopic evidence of dysplasia. In general, this type of relatively late-stage precursor lesion is useful for population screening programmes directed at the secondary prevention of clinical disease.
A more novel cancer screening idea has recently arisen from the observation that persons with ade-nomatous polyps (which carry a high probability of progression to carcinoma) may be identified by the presence, in shed cells in faecal material, of the K-ras (oncogene) mutation (sidrausky et al. 1992). This mutation is one of the well known four muta-tions and is thought to be critical in the develop-ment of colon carcinoma (Vogelsteias et cl., 1988; Fearon & Vogelstein,1990). The four mutations are of the APC tumour suppressor gene (chromosome 5), the K-ras oncogene (chromosome 12), the DCC tumour suppressor gene (chromosome 18), and the p53 tumour suppressor gene (chromosome 17).
Note, however, that a prerequisite for any suc-cessful screening procedure is prior knowledge that the lesion is clearly predictive of the subsequent occurrence of clinical disease. There would be little point in detecting cervical cellular dysplasia if it were only weakly predictive of subsequent cervical
282

Biological markers as predictive early-outcome measures
carcinoma. Such knowledge of the capacity to pre-dict prospectively can on]y cbrne from studies of the natural history of the disease process. (Note that this is a different notion from that other central para-meter of a screening test, `positive predictive value' (PPV). The PPV is the probability that the presence of this lesion, as measured within a specified popu-lation of screened persons, signifies the true pres-ence of the early, pre-cliпicaI, disease process.)
The clinically oriented use of precursor lesions for screening, within either a clinical case-finding con-text or a systematic population screening context, is well established. This paper, however, addresses the use of biochemical and molecular biomarkers for two other purposes: the direct enhancement of epi-demiological research into disease etiology and the substantially earlier detection of altered health risks in monitored populations, in each case, there would be a general preference for biomarkers as indices of rather earlier stages in disease pathogenesis than is the case with clinically oriented screening.
Direct enhancement of epiderniological research into disease etiology The use of biomarkers as surrogate end-points in epidemiological research could, in principle, enhance the research in two main ways:
1. Such biomarkers could provide earlier answers in cohort studies by avoiding the need to await clinical disease end-points. Biomarker-based case–control studies could also yield earlier answers (in relation to the advent of some newly introduced exposure agent). This would require identification of a random sam-ple of all persons ('cases') with the `predictive' lesion. For example, if a new subtype of HPV were suspected of causing cervical cancer, women with dysplastic cells (detected via screening) could be compared with controls for the presence of viral subtype DNA.
2. Such biomarkers could elucidate, or confirm, the underlying biological process of disease pathogenesis. This, in turn, may assist in the interpretation of epidemiological findings and in the drawing of causal inference.
How well do these two main potential uses of predictive biomarkers work in practice?
Gaining earlier answers in prospective epidemiologi-cal studies. Biomarkers could, in principle, help to gain both earlier and better answers to prospective studies. Better answers may result by exclusion of ostensibly healthy persons who, via biomarker screening, are assessed as already having the pre-clinical form of the disease. For example, from many studies over the past several decades, it has been concluded that a low blood cholesterol con-centration is not a cause of increased risk of cancer (with the possible exception of colon cancer), but is a metabolic manifestation of incipient cancer (McMichael et al., 1984). It would therefore be possible to screen out from a newly recruited cohort all persons with manifestly low blood cholesterol—or at least identify them for subsequent stratified analysis of cancer incidence.
Earlier answers may be obtained from epidemi-ological studies if the use of a biomarker increases the statistical power of a study (McMichael 1994). For example, if instead of counting numbers of persons with cancer it were equally valid to count the number of cells from standard-sized tissue samples (e.g. 500 white blood cells per person) dis-playing some specific precancerous predictive mutation, then statistical power would be greatly increased (lattis & 5ilvеr, 1993).
With respect to the task of gaining earlier answers from cohort studies, the sine qua non is prior knowledge that the biochemical or molecular marker is actually strongly predictive of the clini-cal disease, and that clinical disease never or rarely occurs without this antecedent marker, i.e. the `attributable fraction' approaches unity. Note that this does not mean that the biomarker is necessar-ily on the causal pathway; the biomarker may sim-ply be an outcome that is very highly correlated with the occurrence of the clinical disease. It is only necessary, in a logical sense, that the bio-marker can be used as a surrogate, antecedent, event for the actual clinical disease event. This is nevertheless a demanding criterion: if the bio-marker does not represent a stage iп the causal chain, there 1s the possibility that, while some par-ticular exposure agent to be studied does induce the disease, it does not induce the biomarker epiphenomenon (or vice versa).
Even assuming that the chosen predictor does indeed lie on the causal pathway, there may be other late-stage risk factors that account for the
283

Application of 8iomarkers in Cancer Epidemiology
progression from early 'lesion' to clinical event. Such factors would not be identified iп studies that use the biomarker as the surrogate measure of clin-ical disease outcome. For example, whereas dietary fat intake may substantially account for the genesis of the underlying atherosclerotic arterial disease, the actual formation of an occlusive blood clot may be precipitated by other factors, such as cigarette smoldng, deficient intake of certain micronutrients (vitamin C, folic acid, etc.) or exposure to high concentrations of airborne respirable particulates.
There is an unavoidable dilemma here. To gain the most leverage in time, the biomarker should substantially antedate the clinical end-point. However, the earlier the surrogate end-point, the less likely it is to be strongly predictive of the clinical end-point. Two recent cohort studies have exam-ined the predictivity of cytogenetic damage—structural chromosomal aberrations, sister chro-matid exchanges and micronuclei (Hagmar et al., 1994; Bonassi et al., 1995). In both studies there is evidence that a high level of chromosomal aberra-tions in white blood cells foreshadows an increased risk of cancer. However, the risk increases are mod-est and there is no indication that such cytogenetic indices could be used as a substitute for cancer in etiological studies.
It may be helpful also to consider several examples from the non-cancer arena. A substantial scientific literature indicates that coronary atherosclerosis, with manifest narrowing of coronary arteries, is predictive of ischaemic heart disease; that the rate of loss of lung function (e.g. FEV1) is quantitatively predictive of life-shortening at older ages; and that impaired glucose tolerance predicts the onset of non-insulin-dependent diabetes mellitus (NIDDM). We might therefore use these subclinical disorders as 'outcomes' in etiological studies, seeking to understand better the etiology of the clinical dis-ease. For example, in an ongoing follow-up study of a Swedish cohort, the occurrence of impaired glucose tolerance in mid-adult life is being used as a surrogate for putative subsequent clinical NIDDM (Lithell et al., 1996).
There are, so far, very few good examples of the use of surrogate end-points as substitutes for the eventual clinical event. Sоше cancer epidemiology examples exist within the controlled trial domain. However, their focus is on cytogenetic events, including specific mutations, rather than 'later'
markers of cellular abnormality. For example, some studies have used the incidence of cytogenetic damage (e.g. micronucleus formation) to evaluate the cancer-protective effect of certain interven-tions, such as the effect of micronutrient supple-mentation on the progression of oesophageal dysplasia (Munoz et ai., 1987). Are there other pos-sibilities? Would we, in carrying out a cohort study of diet and colon cancer, settle for the measure-ment of particular cancer-associated mutations in faecally shed cells as the index of impending carci-noma? Could a very specific mutation —for example, the third base pair mutation of codon 249 in the p53 gene, which, in liver tumour cells, is strongly (but probably not exclusively) associated with alla-toxin exposure (Bressac et al., 1991; Hsu et al., 1991)—be measured in the DNA of white blood cells as a surrogate index for the presumed occurrence of the same mutation in the relevant target tissue? The answer at the moment is that we do not yet have certain aid specific molecular biomarkers that would be satisfactory alternative 'outcome' mea-sures in epidemiological studies of cancer etiology.
Discussion of the use of early predictive indices in epidemiological research tеnds.to focus on can-cer epidemiology and the associated mutational events. The genotoxic model of carcinogenesis has a clarity about it that is unusual in the iealm of disease etiopathogenesis. The model assumes a 'staged' mechanism that entails the sequential cumulation of critical mutations. While genotoxi-city is only part of carcinogenesis, current knowl-edge arid theory propose that it is an important part. Nevertheless, various pre-clinical chemical changes (e.g. carcinoembryonic antigen (CEA) and alpha fetoprotein (AFP)) may be valuable as biomarkers, particularly since they probably reflect actual cellular functional change. Although they tend to occur at later stages in carcinogenesis than genetic and chromosomal damage, and therefore offer less lead-tune in etiological research, they may have greater predictive power.
Few other disease processes have the seemingly `staged' character of carcinogenesis. In heart dis-ease, diabetes, asthma and cerebral dementia, there are no mutation-like 'switches' thrown—or at least none that we know of. For non-cancer diseases, it is therefore much harder to imagine what the critical non-tissue-based predictive bio-markers might be. (Examples are more evident
284

Biological markers as predictive early-outcome measures
within clinical eрidеmiology, in the study of the factors that influence the опtсоте of disease—see section below.)
Overall, and until we have much more knowl-edge about the significance and predictive power of these various biomarkers, it is clear that they cannot simply be substituted for the clinical end-point of classical cancer epidemiological research. Definitive answers, for the moment (perhaps always?), must continue to depend on studies that use the occurrence or non-occurrence of cancer as the outcome variable.
Elucidating, or confirming, the steps in the underlying biological process. A perennial discussion in epi-demiology concerns the sufficiency of the 'black box' approach. Do we need to know more than that a particular exposure or circumstances is empiri-cally associated with an increased risk of disease? For the progression of scientific ideas and the poten-tiation of future etiological research, knowledge of the mediating mechanism is important. However, for the practical success of many public health inter-ventions, it is actually not necessary to know any-thing about the mediating biological mechanisms. It may be enough, then, to know that smoking cig-arettes causes lung cancer, or that drinking water from the Broad Street pump causes cholera.
However, it is becoming increasingly clear to cancer epidemiologists that an understanding of mechanism—e.g. which components of cigarette smoke cause lung cancer?—will allow further stud-ies of interindividual variation in susceptibility. In the case of smoking, such knowledge would also assist the investigation and risk quantification asso-ciated with passive smoking. On a wider research front, epidemiologists now perceive that further understanding of the role of diet in many cancers, of alcohol in breast cancer, EMF in leukaemia and brain cancer, and ambient air pollution in lung cancer will require elaboration of the mediating mechanisms. The empirical epidemiological evi-dence on its own 1s neither sufficiently strong nor consistent to allow causal inference. It therefore becomes attractive to study the sequence of prob-able, or plausible, mediating biological events.
The aflatoxin and liver cancer story provides an instructive example (McMichael, 1994). Aflatoxin may increase the risk of liver cancer either by direct genotoxic action, by inducing oxidative damage,
or by affecting the immune response to hepatitis B virus. In relation to the latter possibility, for example, in one study the level of aflatoxin was found to be higher in children who were carriers of the virus than in those who were not (Allen et aI., 1992).
The prevailing view, in line with the laboratory experimental evidence of the potent direct chemi-cal carcinogenicity of aflatoxiri, is that it probably acts as a genotoxin. Recent evidence that aflatoxin may cause an unusually specific mutation of the important X53 gene—the 'hot spot' mutation at codon 249 in which the third base pair undergoes G to T transversion—has therefore advanced dis-cussion of this genetic option. Mutations of the p53 gene, both 'hot spot' and otherwise, appear to occur with equal frequency in tumours associated with persistent hepatitis B infection and in those not associated with this infection (Oda et al., 1992), which suggests that p53 mutation is not a result of hepatitis B virus infection. However, there is a high frequency of this specific mutation of p53 (45% of tumours) in the high-incidence areas of the world, such as Mozambique and Qidong, China (Ozturk etaL, 1991; 5heu et aL, 1992), where exposure to aflatoxin also tends to be raised. This ecological evidence has suggested that the mutation may be specific to genotoxic aflatoxin exposure—a notion that is further supported by the fact that this is not a 'hot spot' mutation in tumours other than hepatoce11ular carcinoma within those populations.
This evidence does not necessarily indicate that the p53 mutation is the direct mechanism of alla-toxin carcinogenicity since it may merely be acting as a surrogate marker of aflatoxin exposure in these populations. There may still be a coexistent non-genotoxic effect of aflatoxin, such as suppressing the immune defenses against HBV. However, the exam-ple illustratés how the study of mutational spectra can yield an insight into plausible causal mecha-nisms and, if the appropriate set of observations is made, can strengthen the basis for causal inference.
Another unresolved diet-cancer issue is whether antioxidants, especially fl-carotene, reduce the risk of cancer, and if so, whether this accounts for the lowered risks of many cancers in association with above-average intake of fresh fruit and vegetables. There are evident difficulties in carrying out suffi-ciently large and long-term intervention trials, and inconsistent results have emerged recently from studies in China (Taylor et ai., 1994), Finland (ABC
285

Application of Biomarkers in Cancer Epidemiology
Study Group, 1994) and the USA (Hennekens et al., 1996). In order to help clarify this situation, Duthie and colleagues have carried out studies to assess the extent to which, first, dietary antioxi-dants as measured in blood are correlated with reduced reporter mutations in lymphocytes (Duthie et aI., 1995) and, second, antioxidant sup-piementation (for 20 weeks) reduces oxidative DNA damage in lymphocytes (Duthie et al., 1996). The second study explicitly used bioniarkers of DNA damage or mutation 'as indicators of car-cinogenic risk'; the authors argued that 'DNA dam-age, resulting in base change and mutation when replication occurs, is a very early evert in carcino-genesis'. Subsequently, the authors concluded (Duthie et al., 1996):
Herein, we show for the first time a highly sig-nificant moderating effect of long-term anti-oxidant supplementation on endogenous and exogenous oxidative DNA damage in lyrr pho-cytes, supporting the hypothesis that dietary antioxidants may protect against cancer.
The discourse concerning radiation-induced germlirie mutations as a possible cause of human cancer—highlighted by the study indicating an increased risk of leukaemia in the children of radia-tion-exposed Seiafield workers (Gardner et al., 1990)—has recently been extended by a study in Belarus in the Mogilev district, north of Chernobyl (Dubrova et al., 1996). The frequencies of lympho-cyte DNA mutations (tandem repeat minisatellite mutations, detected via five separate DNA probes) were compared in samples of 79 Belarus сhildren and 105 UK children, all born in 1994. The mutation rate in Belarus children was double that of UK children, and thе rate in Belarus children showed a strong pos-itive association with level of local topsoil radiation (caesium-137) contamination. Those mutations ate presumed to have been inherited from parents who were exposed in the aftermath of Chernobyl.
This study of heritable radiation-associated mutations thus adds some plausibility to the ear-lier, necessarily inconclusive, epidemiological research at Sеilafield. It also supports the general thesis that the dose rate is a critical determinant of risk of genetic damage, wherein the unit-dose risks are higher at lower dose rates. Concurrent research in subterranean voles living in the immediate
vicinity of the Chernobyl reactor site showed a rate of mitochondrial genetic damage (base pair substi-lutions in the cytochiome b gene) that was several hundred times greater than in vole populations living 32 km south-east of Chernobyl (Baker etaL, 1996). It is Iikely that this genetic damage was also sus-tained over several years of low-dose-rate exposure.
Biomarkers mау also be used to clarify the role of exposure agents at different stages of the cancer process. In particular, there has been long-standing interest in thе notion 0f 'initiators' and 'promotors', or, less specifically, early-stage and late-stage effec-tors. If biomarkers (e.g. biochemical markers such as CEA and AFP) were able to identify the cancer stage already reached, then the subsequent risk alteration associated with an exposure of interest would tell something about its stage (and mode?) of action.
Early detection of altered health risks in monitored populations The above two sections refer to studies of etiology and causal mechanism. In some circumstances, where etiology and causation are not at issue but where there is a need to identify any (suspected) change in population health risk, then biomarkers may be used for monitoring purposes.
This approach is well known in the occupational arena. Biological monitoring of exposed popula- tions can provide early evidence that critical levels of exposure have occurred and that the risk of clin-ical disease has increased. For example workers in lead-exposed jobs have long had their blood lead (PbB) concentrations monitored. Lead enters the body from multiple environmental sources (food, water and air), and, in the first instance, is measur- able in the blood. Because lead is concentrated within the red blood cells, PbB gives an integrated measure of lead exposure over the preceding several months. It also integrates the exposure measure-ment across all exposure media.
Increasingly, various occupational exposures are being monitored via cytogenetic studies (Gun & McMichael, 1990). This includes ionizing radiation and solvent exposures. The presumption here is that evidence of macroscopic damage to chromosomes indicates an increased probability of mutational events, which carry an increased risk of cancer.
A mutation known to be particularly strongly associated with a specific type of cancer may be useful in monitoring changes in the risk status of
286

Biological markers as predictive early-outcome measures
the population in relation to the future incidence of that cancer. An interesting example arises in rela-tion to the prediction that the ongoing depletion of stratospheric ozone will cause an increase in the incidence of skin cancers (Mаdrопich & de Gruijl, 1994). Epidemiological monitoring of the inci-dence of skin cancers (basal се11, squamous cell, melanoma) would therefore be desirable in 'sen-tinel populations over a range of latitudes. While data on melanoma can be captured by cancer reg-istry data, basal cell and squamous cell cancers may be less reliably reported. However, since these clinically defined end-points may take years to become manifest, earlier predictive biomarkers are needed. One possibility is to use certain direr-forming mutations of the p53 gene in skin cells, which appear to be induced specifically by UV exposure (Ziegler et cL, 1993; Nakazawa et cL, 1994). It has also been suggested that some non-human animals may be particularly useful as indi-cator species—for instance, the exposed ear epithe-hum of sheep may be especially sensitive to UV-induced molecular biological damage.
Confirmation of the predictivly of biomarkers in con-trifled intervention studies Controlled intervention studies provide an oppor-tunity to test whether the predictive power of the biornarker is the same under the strict conditions of controlled experimentation as has been inferred from natural history observations. Within-individ-ual changes in both the biomarker and the clinical end-point are studied in response to the interven-tion. Confirmation that an intervention-induced change in the biomarker is followed by a change in the clinical end-point establishes the predictive significance of the biomarker (at least under those circumstances).
The recent results of the Concorde Trial of zidovudine (AZT) treatment in HIVIAIDS under-score the need for caution in assuming that pre- sumed precursor indices of outcome can be used as a substitute measure for the outcome (Concorde Coordinating Committee, 1994). The Concorde Trial found that drug-associated change in the CD4 count—which refers to a change in T-cell profile and is a widely recognized index of damage to the immune system—was predictive of neither the subsequent incidence of clinical AIDS nor survival.
Other considerations The use of biomarkers, especially within a particu-lar assumed mechanistic framework may suggest, mistakenly, that the mechanism is universal, i.e. that it applies in all populations. However, the significance—i.e. the predictive power—of bio-markers may vary considerably between popula-tions.
This variation may reflect genetically based dif-ferences in disease processes or rates of progres-sion, or it may reflect culturally determined varia-tions in those processes. Most non-acute disease processes have complex etiologies, with webs of causation that differ among geographic, ethnic, genetic and socio-economic groups. For example, the prevalence of chromosomal abnormalities in white blood ceI1s in healthy population samples was found to be considerably greater in West Africa (Gambia) than in Europe, despite the fact that the former population has a much lower lifetime risk of cancer overall (Miele et cL, 1996).
Conclusions The most widespread use of biomarkers in epi- demiology has been to improve the quality of exposure assessment. There is also now a growing usé of metabolic and genetic biomarkers to iden-tify population subgroups at differing susceptibil-ity to exposure-related disease.
The application of biomarkers as predictors of disease end-points is much less well-developed. This reflects the intrinsic difficulty in obtaining the prospective evidence that would confirm the predictivity of the biomarker, and the uncertainties that persist so long as the causal role of the bio-marker (or its underlying phenomena) in the dis-ease process under investigation is unclear.
Beyond their established role in screening for disease and their emerging role in monitoring high-risk populations, there is a need to evaluate critically the use of biomarkers in the enhance-ment of epidemiological studies of disease etiology and its primary prevention. Biomarkers can some-times improve the definition of disease entities. They may also, in future, become increasingly useful as early, surrogate, indices of clinical end-points, both for cancer and other diseases. In general, however, much remains to be learnt about their predictive significance before that lat-ter goal can be widely realized.
287

Application of Biomarkers in Cancer Epidemiology
References ABC (Alpha-Tocopherol, Beta-Carotene Cancer Prevention) Study Group (1994) The effect of vitamin E and beta carotene on the incidence of lung cancer and other cancers in male smokers. New Eng1. J. Med., 330, 1029-1035
Allen, S.., Wild, S.P., Wheeler, J.G., Riley, E.М., Montesano, R., Bennett S., Whittle, H.C., Hall, A.J. & Greenwood, B.М. (1992) Aflatoxin exposure, malaria aid hepatitis B infection in rural Gambian children. Trans. Royal Soc. Tropical Med. Hyg., 86, 426-430
Baker, R.J., Van Den Bussche, R.A., Wright, A.J., Wiggins, L.E., Hamilton, М.J., Reat, Е,P, Smith, M.H., Lomakin, M.D. & Chesser, R.K. (1996) High levels of genetic change in rodents of Chernobyl. Nature, 380, 707-708
Bonassi, S., Abbondandolo, A., Camurni, L., Dal Pra, L,, De Ferrari, M., Degrassi, F. & Fini A. (1995) Are chro-mosome aberrations in circulating lymphocytes predic-tive of future cancer onset in humans? Preliminary results of an Italian cohort study. Cancer Genet. CytogeneL, 79, 133-135
Brеssac, B., Kew, M., Wands, J, & Ozturk, M. (1991) Selective G to T mutations of p53 gene in hepatocellular carcinoma from southern Africa. Nature, 350, 429-431
Bryant, M.S., Skipper, P.L., Tannenbaurri S.R. & MaсLше, M. (1987) Hemoglobin adducts of 4-armnobiphmy1 in smokers and nonsmokers. Cancer Res., 47, 612-618
Cartwright, R.A., Glashan, R.W., Rogers, H,]., Ahmad, А.А., Barham-Hall, D., Higgins, E. & Kahn, M.A. (1982) Role of N-acetyltranferase phenotypes in bladder car-cinogenesis: a pharinacogenetic epidemiological approach to bladder cancer. Lancet, 2, 842-645
Concorde Coordinating Lommitteé (1994) Concorde: MRC/ANRs randomised double-blind controlled trial of immediate and deferred zidovudine in symptom-free HIV infection. Lancet, 343, 871--881
Dubrova, Y.E., Nesterov, V.N., Krouchinsky, N.G., Ostapenko, V.A., Neumann, R., Neil, D.L. & Jeffreys, А.J. (1996) Human mincate1lite mutation rate after the Chernobyl accident. Nature, 380, 683-686
Duthie, S.J., Ross, M. & Collins, A.R. (1995) The influ-ence of smoking and diet on the hypoxanthine phos-phoribosyltransferase (hprt) mutant frequency in circu-lating T lymphocytes from a normal human population. Mutаt. Res., 331, 55-64
Duthie, S.J., Ia, A., Ross, М.A. & Collins, А.А. (1996) Antioxidant supplementation decreases oxidative DNA damage in human lymphocytes. CancerRes., 56,1291-1295
Fearon, E.R. & Vogelstein, B. (1990) A genetic model for colorectal tumorigenesis. Cel, 61, 759-767
Gardner, M.J., Snee, М.Р., Hall, A.J., Powell, C.A., Downes, S. & Теrтеll, J. (1990) Results of case-control study of leukaemia and lymphoma among young people near Sellafield nuclear plant in West Cumbria. Br. Med. J., 300, 423-429
Gun, R.G. & McMichael, A.J. (1990) The expanding role of biological markers in occupational health research and monitoring. J. Occup. Health sa feiy (ANZ), 6, 413-417
Hagmar, L., Brogger, A., Hansteen, I.L., Heim, S., Hogstedt, B., Knudsen, L. & Lambert, B. (1994) Cancer risk in humans predicted by increased levels of chromo-somal aberrations in lymphocytes: Nordic study group on the health risk of chromosome damage, Cancer Res., 54, 2919-2922
Hansen, Н.P, Agarwal, D.P., Goedde, 1W., Bucher, H., Huland, H., Brachmann, W. & Ovenbeck, R. (1985) Association of N-acetyl-transferase polymorphism and environmental factors with bladder carcinogenesis. Pur. Urd., 11, 263-266
lattis, D. & Silver, K. (1993) Use of biomarkers in risk assessment. In: Schulte, PА. & Perera, F.P., eds, Molecular Epidemiology: Principles and Practices, New York, Academic Press, pp. 251-273
Hein, H.O., Sorensen, H., Snadicani, P. & Gyntelberg, F. (1993) Alcohol consumption, Lewis phenotypes, and risk of ischaemic heart disease. Lancet, 341, 392-396
Hennekens, C.H., Buring, J.E., Manson, J.Е., StampFer, M., Rosner, B., Cook, N.R., Belanger, C., LaMotte, F., Gaziano, J.M., Ridker, P.M., Willett, W. & Peto, R. (1996) Lack of effect of long-term supplementation with beta carotene on the incidence of malignant neoptasms and cardiovascular disease. N. Engt. J. Мед., 334, 1145-1149
Hsu, I.C., Metcalf, R.A., Sun, Т., Welsh, J.А., Wang, N.J. & Harris, C.C. (1991) Mutational hotspot in the p53 gene in human hepatocelutar carcinomas. Nature, 350, 4271128
Hulka, S.S. (1991) Epidemiological studies using biolog-ical markers: issues for epidemiologists. Cancer Epidemiol. Biouarkers Prey., 1, 13-19
Lithell, H.O., McKeigue, P.М., Berglund, L., Mofisen, R., Lithell, U. & Leon, D. (1996) Relationship of birtbweight and ponderal index to NIDDI and insulin response to glucose challenge in men aged 50-60 years. Br. Med., J., 312, 406-410
Lower, G.M., Jr, Nilsson, T., Nelson, C.E., Wolf, H., Gamsky, Т.E. & Bryan, G.T. (1979) N-Acety1transferase phenotype and risk in urinary bladder cancer: approaches in molecular epidemiology: preliminary results in Sweden and Denmark. Environ. Health Perspect., 29, 71-79
McMichael, A.J. (1994) 'Molecular epidemiology': new
288

Biological markers as predictive early-outcome measures
pathway or new travelling companion? Am. J. Epidemiol., 140, 1-11 .
Mclichael, A.J., Jensen, O.M., Parkin, D.M. & Zaridze, D.G. (1984) Dietary and endogenous cholesterol and human cancei. Epidemiol. Rev., 6, 192r-210
Madronich, Ѕ. & de Gruijl, F.R. (1994) Skin cancer and UV radiation. Nature, 366, 23
Miele, M., Donato, E, Hall, A.J., Whittle, H., Chapot, B., Bonatti, S., De Ferrari, M., Artuso, M., Gallerani, E., Abbondandolo, A., Montesano, R. & Wild, С.P. (1996) Aflatoxin exposure and cytogenetic alterations in indi-viduals from The Gambia, West Africa. Mutation Res., 349, 209-217
Minchin, R.F., Kadlubar, FE & I1ett, K.F. (1993) Role of acetylation in colorectal cancer. MuLot. Res., 290, 35-42
Munoz, N., Hayashi, M., Lu, J.B., Wahrendorf J, Crespi, M. & Bosch, F.К. (1987) Effect of riboflavin, retinol, and zinc on micronuclei of buccal mucosa and of esophagus: a randomized double-bind intervention study in China. J. Nat! Cancer Inst., 79, 687-691
Nakazawa, H., English, D., Randell, P.L., Nakasawa, K., Martel, N., Armstrong, B.К. & Yamasaki, H. (1994) UV and skin cancer specific p53 gene mutation in поттаl skin as biologically relevant exposure. Proc. Nat! Acad. Sd., 91, 360-364
Oda, T., Tsuda, l-L, Scarpa, A., Sakamoto, M. & Hirohashi, S. (1992) X53 Gene mutation spectrum in hepatocellular carcinoma. Cancer Res., 52, 6358-6364
Ozturk, M., Bressac, B., Puisieux, A. & 26 other collabo-rators (1991) p53 Mutation in hepatocellular carcinoma after aflatoxin exposure. Lancet, 338, 1356-1359
Perera, F. & Santelia, R. (1993) Carcinogenesis. In: Schulte, P.A. & Perera, F.P., eds, MoIeculаβr Ерiдетгоlоgу. Principles and Practices. New York, Academic Press. pp. 277-300
Roberts-Thomson, I., Ryan, P., Khoo, K.K., Hart, W.J., McMichael, А.J. & Butler, R.N. (1996) Diet, acetylator phenotype and risk of colorectal neoplasia. Lancet 347, 13721374
Sheu, J.-C., hang, G.-T., Lee, P-R, Chung, J.-C., Chou, H.-C., Wang, J.-T., Lee, H.-S., Shih, L.-N., Yang, R-M., Chen, D.-S. & Wang, T.-H. (1992) Mutation of the p53 gene in hepa-toceBular carcinoma iii Taiwan. Cancer Res., 52,6098-6100
Sidransky, D. Tokino, T., Hamilton, S.R., Kinzler, К.W., Levin, B., Frost, P. & Vogelstein, B. (1992) Identification of ras oncogene mutations fn the stool of patients with curable colorectal cancer. Science, 256, 102-105
Taylor, J.А., Sandier, D.Р., Bloomfield, C.D., Shore, D.L., Ball, E.D., Neubauer, A. Mcintyre, O.R. & Liu, E. (1992) Ras oncogene activation and occupational exposures in acute myeloid leukemia. J. NяtI Cancer Inst., 84, 1626-1632
Taylor, PR., Li, B., Dawsey, S.M., Li, J-Y., Yang, С.S., Guo, W. & Blot, W.J., (1994) Linxian Nutrition йtervention Trials Study Group. Prevention of oesophageal cancer: the nutrition intervention trials in Linxian, China. Cancer Res. (suppl. 54), 20295-2031s
Vahakangas, K.H., samet, J.М., Metcalf, R.A., Welsh, J.A., Bennett, W.P., Lane, D.P. & Harris, C.C. (1992) Mutations of p53 aid ras genes in radon-associated lung cancer from uranium miners. Lancet, 339, 576-580
Vineis, P., Bartsch, Ii., Caporaso, N., harrirsgton, AM., Kadlubar, F.F., Landi, M.T., Malaveille, C., Shields, P.G., Skipper, P., Talaska, G. & Tannebaum, S.R. (1994) Genetically based N-acetyltransferase metabolic poly-morphism and low-level environmental exposure to car-cinogens. Nature, 369, 154-156
Vbgelstein, B., Fearon, E.R., Hamilton, S.R., Kern, S.E., Preisinger, A.C., I eppert, I., Nakamura, Y., White, R., Smits, A.M. & Bos, J.L. (1988) Genetic alterations during colorec-tal tumor development. N. Еngl. J. Med., 319, 525-532
Ziegler, A.M., Leffell, D.J. & Kunala, S. (1993) Mutation hotspots due to sunlight in the p53 gene of пап теlапота skin cancers. Proc. Nat! Acad. Sd, USA, 90, 4216-4220
Corresponding author
A.J. McMichael Department of Epidemiology and Population Sciences, London School of Hygiene and Tropical Medicine, Keppel Street, London WIlE 7HT, UK
289

АрR1kabon of 6iоmaгkeгs in Cancer Epidemiology Toniolo, P., nEetto, Р. Ehuker, D.E.G., Rothman, N., Hulka, B. and Pearce, N., edt
1ARС Sciеnkfгo PuЫXеliсјггs No, 142 lnteroaliaml Agency for Research on Cancer, Lyon, 1997
The use of biomarkers to study pathogenesis and mechanisms of cancer: oesophagus and skin cancer as models R. Montesano, Р. Hainaut and J. lai
Recent advances in molecular biology have made it possible to use genetic alterations associ-ated with cancer as biomarkers to study the pathogenesis and mechanisms of cancer. However, the lessons that can be drawn from the analysis of alterations in a particular cancer gene are extremely dependent upon the biological context in which they arise.
In this article, we discuss the biological significance of alterations in the p53 tumour suppressor gene in cancers of the oesophagus and of the skin. In both tissues, different forms of cancer occur at high frequency (squamous-cell carcinoma and adenocarcinoma in the oesophagus; squamous-cell carcinoma, basal-cell carcinoma and melanoma in the skin).
We show that specific patterns of р53 alteration occur in these various cancers and that analysis of these alterations is useful to make inferences about the etiopathogenesis of cancers of the oesophagus and of the skin.
In the last decade, considerable progress has been made 0f the identification of the genetic alter-ations whose accumulation leads to the develop-ment of cancer. The genes concerned can be divided into three groups: oncogenes, tumour sup-pressor genes and genes involved in DNA repair. The genetic alterations found include point mu-tations, deletions, translocations, allelic losses, amplifications and deregulation of gene expression. The nature of the genetic alterations and the type of gene modified vary among different tumours. Activating ris mutations, for instance, frequently occur in pancreatic carcinonias (Berrozpe et al., 1994), but are absent in cancer of the oesophagus (Holstein et aL, 1988). The temporal sequence of occurrence of genetic alterations may also differ between tumour types, with certain changes occur-ring at an early stage оf cancer development in one type of tumour and at a late stage in another type. This is shown schematically in Fig. 1 for colon can-cer and glioЫastoma.
The relevance of genetic alterations in the etiol-ogy and pathogenesis of lung and breast cancers has been discussed in recent reviews (Gadzar et al., 1994; Greenblatt etaL, 1994; Hulka & Stark, 1995;
Hainaut et al., 1996). Comparison between these different cancers reveals that there is no fixed rule on the nature and sequence of genetic alterations in cancer development. At the same time, it is apparent that some of the genetic alterations, in particular р53 mutations frequently occur in dis-tinct tumour types and provide valuable insights not only into the etiology but also into the patho-genesis and clinical management (diagnosis and prognosis) of some cancers.
In this respect, the relevance of genetic alter-ations in oesophageal cancer and in cancer of the skin is discussed in more detail.
Molecular pathogenesis of oesophageal cancer Oesophageal cancers comprise squamous-cell car-cinoma and Barrett's adenocarcinoma, two types of tumour with different etiology and pathogenesis. squamous-cell carcinoma (SCC) has been associated with exposure to tobacco, betel chewing, alcohol and various dietary components, with a large geographical variation in incidence (Munoz & Crite11wgué, 1994). Adenocarcinomas (ADCs) of the oesophagus develop from Barrett's oesophagus, a condition in which normal squamous epithelium
291

Application of Baomarkers in Cancer Epidemiology
Earliest change
Latest change
Inactiivation of Inactivation Inactivation Colon cancer one copy of Activating Y of both copies of huh copies
АPC gene ras mutation of DCC gene of p53 gene
Recessive Inactivation Inactivation Recessive Glioblastoma ~ e chan оп of both copies ц Amplification g of both copies change on
chromosome 17 of y interferon of еrb-8 of р53 gene chromosome 10 gene cluster
Figure 1. Temporal sequence of genetic events during the progression of colon cancer and of glioblastoma (for explanation, see text); redrawn from Murray & Hunt, 1993
is replaced by metap1astic columnar epithelium. This condition is the result of a prolonged gastro-oesophageal reflux, and these patients have a more than 100-fold higher risk than the general population of developing oesophageal ADC, a cancer that now accounts for approximately 50% of all oesophageal cancers in the USA (Blot et cL, 1993).
Prevalence of allelic losses Table 1 shows the allelic losses in oesophageal can-cers (SCC and ADC) that occur with high fre-quency (>40% of informative cases), based on mul-tiple and reproducible studies. Putative candidate genes localized in the chromosomal areas of allelic losses and the occurrence of mutations in these genes are also indicated (for review see Montesano et cL, 1996, and references therein).
No significant differences were detected in the prevalence of allelic losses at various loci in the two types of oesophageal cancer, SCC and ADC. Allelic loss of chromosome 17р occurs very frequently in oesophageal cancer, as in many human solid tumours. In addition, there is a high prevalence of mutations in the p53 tumour suppressor gene (localized at 17р13) in tumours that retain two 17р alleles (Huang et al., 1993; Maesawa et aL, 1994). This suggests thatp53 mutation is an early event in oesophageal carcinogenesis which occurs prior to allelic deletion in l7p.
Allelic loss in oesophageal cancer also occurs with high prevalence in chromosomes 13q, 5q and, possibly, 18q, and in regions of these chrо-
mosomes where the Rb, APC/MCC and DCC genes are located. However, АPC1 MCC or DCC genes may not be principal targets for loss of heterozygosity (LOI) on 5q and 18q. In particular, mutations in the APC gene are very rarely detected (2 out of 163 tumours) (Aoki et al., 1994; Powell et al., 1994; Shibagaki et al., 1994). It is reasonable to assume that other genes with tumour suppressor activity may be located in these chromosomal regions. No mutations were detected in the Rb gene in tumours with or without 13q allelic loss, although the Rb protein was found to be absent in a significant frac-tion of oesophageal SCC.
Another frequent allelic loss in both SCC and ADC involves chromosome 9р2l-22, the region in which the gene MTS-1 is located. This gene encodes the p16 protein, a specific cycliri-dependent kinase (CDK) inhibitor checking G1- to S-phase transition in the ceI1 cycle. This function of p16 is lost when the ITS-i gene is mutated. However, it is still unclear whether the MTS-I gene alone or other gene(s) present in the same chromosomal region are the target of allelic deletion.
Alterations of cell cycle regulatory proteins Genetic alterations leading to the constitutive acti-vation of the CDK/cyclin D1 pathway appear to be common in 5CC of the oesophagus. These altera-tions occur at several distinct levels, including (a) inactivation of the p1$/MTS-1 by diverse mecha-nisms, including deletion and missense mutation; (b) amplification and overexpression of the cycIin Dl gene (on chromosome 11g13); and (с) deletion
292

Pathogenesis and mechanisms of cancer
and inactivation of the retinoblastoma susceptibility gene Rb (on chromosome 13g14). Amplification and overexpression of the cyclin DI gene is the most common of these genetic events (for review see Montesano et al., 1996).
In a study of 50 oesophageal tumours of varying geographical origin, amplification and overexpres-sion of the cyclin D1 gene was found in 32% of the tumours, and loss of Rb protein expression in 17. The tumours with cycin DI alterations exibited normal levels of Rb expression, while those that did not express Rb did not show amplification or overexpression of cydin DI (Jiang et al., 1993). SimilaгΡ findings have been observed in other tumour types.
Seveтal studies have described missense mu-tations of the pi 6/1ТЅ-1 gene, but the reported fre-quencies differ widely. Recent evidence suggests that the prevalence of pi 6/МТЅ-i mutations is in fact quite low (10%), and that mutations occur in
both exon 1 and 2 of the gene (Esteve et al., 1996). Iп other tumours, recent evidence suggests that
the apparent loss of p16 activity could also result from aberrant or strongly decreased p1б/MТ5-1 gene expression. The p16/MТS-1 locus has a com-plex structure and encodes two transcripts with distinct protein coding potential that are differen-tially regulated during the cell cycle. Deregulation of p16/ITS-1 activity may thus result from an imbalance between the levels of expression of the two transcripts (Stone et "L, 1995). It is also possi-ble that downregulation of the protein rather than point mutation of the gene may be a common mechanism of рI6/MТ5-1 inactivation (Sun et ai., 1995).
Aberrant expression of p16/MТS-1, cyclin D1 or Rb may have similar functional consequences: inactivation of the suppressor function of Rb and promotion of the activation of ЕZF proteins by direct or indirect mechanisms (Fig. 2). This model
Tumours with aifelic loss! informative tumours (%)
Chromosome sCC ADC Minimal area of loss Candidate genes Mutations
Эр 25152 Зр21.3 hiLM-i (40-64)
5q 50194 34151 5g21.2 AРСIМСС . Very rare
(36-80) (63-75)
9р 55195 8117 . 9р22 МТ5-i, !FNA 0 <>40
(45-65) (47)
9q 11118 9g31 Е3s1
(60)
13q 66/134 28167 13g14.1 Rb No mutations
(41-54) (36-43)
V/p 651124 47154 i7р13 p53 . Nigh
. (43-65) (72-94)
17q 56191 10118 17g21.3 BCRA1, eгbB2,
(62) (56) 17g11.2-q12 С5F-3, NF-1, 1T84
18q 26179 (24) 18g23.3 DCC Rare . . (23-46)
SCC, squamous-cell carcinoma; ADC, adenocarcinoma
293

Application of Biomarkers in Cancer Epidemiology
сусliп b 1
р 16/MTSi
дь phospho Rb
E2F S-phase electors
Figure 2. Interplay between the products of the cyclin Di, рi6/MTS-i and relnoblastoma susceptibility genes (Rb) in the regulation of cell cycle progression from Gi to Ѕ. Cell progression from Gi to S requires, among other things, activation of specific CDKs (CDК4 and CD Кб) in association with cyclin Di. The active CDK/cyclin D1 complex phosphoryfates sequentially the Rb prolein, thus releasing Rb-bound transcription factors of the E2F family. Free E2Fs transactivate genes that are essential for entry into S апд DNA replication (S-phase effectors). CDK/cyclin Di activity is negatively regulated by binding of several cyclin kinases inhibitors, including p16/ITS-i. p16/MTS-1 is thought to be activated in response to growth control stimuli through pathways which are not fully elucidated.
provides a paradigm explaining why tumours with indistinguishable biological characteristics show heterogeneity at the causative genetic level.
The high frequency of genetic aberrations in pathways controlling G1/S transition may reflect a requirement to abrogate physiological G1/S con-trol to allow oesophageal cells to progress towards malignancy. Indeed, the homeostasis of the oesophageal mucosa, as is the case with al surface epithelia, is dependent upon a delicate equilibrium between cell renewal, differentiation and death. Switching off any of the molecular controls bal anti g these three processes may compromise the normal life cycle of mucosal cells. Escape from growth control, and reduced rates of cell differen-tiation and cell death are critical steps towards the acquisition of further genetic lésions and func-tional alterations that lead to the expression of malignant phenotypes.
Mutation spectrum of the р53 gene Among 240 cases of oesophageal ЅСС analysed in the literature, 110(45.8%) have been found to con-tain mutations that have been confirmed and identified by DNA sequencing. The prevalence of р53 mutations is even higher for ADC, with 46 cases of mutant р53 identified in 64 patients screened (71.8%) (see Montesano et al., 1996).
5CC and ADC of the oesophagus differ strikingly in the pattern of mutations inр53 (Fig. 3). р53 mu- tations in ADC show a very high frequency of tran- sition at CpG dinucleotides (--63%). To date, this is the highest level of CpG transition found in any cancer type (other cancer types with frequent CpG transitions are colon carcinoma and pancreatic cancer, with, respectively, - 46 and -36%). G:C to T:A transversions and mutations at A:T base pairs are comparatively rare (taken together, -14%). In contrast, in 5CC, CpG transitions aie less frequent than in most other tumour types (-18%), whereas mutations at A:T base pairs account for 31% of all mutations. The spectrum of p53 mutations in 5CC is thus indicative of the involvement of exogenous carcinogens, in agreement with epidemiological data supporting the role of environmental agents, in particular tobacco, nutritional components and alcohol. The high frequency of mutations at A:T base pairs may reflect enhanced depurination of DNA upon reaction of carcinogens with adenine and/or exposure to DNA-reactive agents such as acetaldehyde, a metabolite of ethanol. The nature of р53 mutations in ADC is more difficult to inter- pret. Transitions at CpG dinudeotides are generally considered as the hallmark of mutations occurring spontaneously by hydrolytic deamination of 5- methylcytosine. Recent evidence indicates that the mutability of CpG dinucleotides might also result from enzymatic deamination and methylation by methyltransferases, which bind with high affinity to the premutagenlc DNA mismatches G:U and G:T, thereby preventing their efficient repair by mismatch repair proteins (Shen et aL, 1995; Yang et aI., 1995). Further studies are needed to identify and characterize such mechanisms in human cells and their possible role in the genesis of p53 mu-tations in ADC.
In many areas of the world, tobacco and alcohol have been identified as major factors cooperating in the etiopathogenesis of 5CC of the oesophagus. Among 91 5CC patients for whom reLiable data on
294

70
60
ô 50
v 40 C Ф 6 30 ш
ј 20
10
Pathogenesis and mechanisms of cancer
exposure to tobacco and/or alcohol are available, the distribution of p53 mutations reveals a strong relationship with tobacco smoking (Montesano et al., 1996). Only 20% of non-smoker 5CC patients have р53 mutations, in contrast with 80% in patients who smoked more than 20 cigarettes/day. Even lighter smoking (less than 20 cigarettes/day) increases the p53 mutation frequency to a value up to 50%. The relationship with alcohol consump-tion is less clear. However, the relative impact of each risk factor is difficult to assess, as most of the patients with p53 mutations were exposed to both tobacco and alcohol, and the contribution of other less well-defined risk factors is unknown.
Molecular pathogenesis of skin cancer A causal association between UV exposure, defective repair of UV-induced DNA photoproducts and non-melanocytic skin cancer has long been postu-lated. This cancer is classified into two major his-tological types: basal-cell carcinoma (BCC) and squamous-cell carcinoma (SCC), the former being the commoner type in white populations. Descriptive studies in whites in North America, Australia and several other countries have also shown a positive association between incidence and mortality from melanoma anд residence at lower latitudes. Studies of migrants suggest that the risk of melanoma is related to solar radiant exposure at the place of residence in early life, and the results from case—control studies are generally consistent with positive associations with residence in sunny environments throughout life, in early life and even for short periods in early adult life and with measurements of cumulative sun damage.
UVA, UVB aid UVC radiation produce measur-able DNA damage in human skin cells in vivo at doses commonly experienced by humans. Of the DNA photoproducts, the cyclobutarve-type pyrim-idine dimers and the pyrimidine-pyrimidone 6-4 photoproducts have been shown to be cytotoxic and mutagenic in human cells, although the rela-tive contribution of each type remains to be fully elucidated. Exposure to UV radiation has been shown to increase the expression of various cellular genes and to have profound effects on the im-munological system which may contribute to the development of skin cancer. Evidence for the involvement of DNA photoproducts and their repair in human skin carcinogenesis originally
GC:AT GC:AT GO:TA GC:TA A:T Ins/del CpG
ED soc
ADC
Figure 3. Spectrum of p53 mutations in squamous-cell carci-noma (SCC) and adenocarcinoma (ADC) of the oesophagus. Data from the p53 mutation database (Holistein etas, 1996) are expressed as a percentage of the total number of mutations found in SCC or in ADC.
came from the work of Cleaver showing that cells from patients with xeroderma pigmentosum (XP), a cancer-prone inherited disorder, are defective in the excision repair of UV-induced pyrimidine dimers (for review, see Bootsma & Hoeijmakers, 1994).
Alteration of DNS repair and risk of basal- and squamous-cell carcinoma Mammakan cells have a variety of repair mechanisms that will remove the DNA lesions produced by UV irradiation. The pathway involved in the repair of the commonest UV-induced DNA adducts by UVB and UVC is via the nucleotide excision repair (NER) pathway. The molecular basis of this repair pathway, which eliminates a remarkable number of different, structurally unrelated lesions, involves at Ieast five distinct steps: damage recognition; mci-sian of the damaged strand on both sides of the lesion at some distance from the lesion leaving the non-damaged strand intact; removing the damage-containing oligorner; gap-filling DNA synthesis; and sealing of the DNA by DNA Iigase. In human cells, it would appear that two NER subpathways are operating, one dealing with the rapid and efficient removal of lesions blocking ongoing transcription (transcription-coupled repair), and the second resulting in the slower and less-efficient removal of bulk DNA including the non-transcribed strand of active genes (genome overall repair).
295

Application of Biomarkers in Cancer Epidemiology
1ndividuals lacking components of the NER pathway have been found to have increased sun sensitivity and, in some cases, increased risk of skin cancer. This is observed in XP patients who show sun sensitivity and increased cancer risk in addition to cutaneous manifestations, including neurological degeneration and pigmentation abnormalities.
Within the XP phenotype, large variations in repair activity are noted (ranging from 2 to 80% of 'normal' levels). If КP is considered to represent the lower range of repair capabilities, those individuals expressing a reduced repair response may be at an increased risk of cancer. It could be imagined that, due to the multiprotein complexes involved in the NER pathway, minor alterations in protein struc-ture might produce dramatic alterations in protein—protein interactions aid subsequent alterations in the DNA-repair capacity (DRC). Сие to the multi-step nature of the NER pathway, an assay that reflects the overall DRC and that can be carried out on easily available biological material, such as lymphocytes, would be ideal for population-based studies to assess the role of DRC in modulating cancer risk. 5uсh an assay was developed by Grossman and his collaborators (Athas et аl., 1990) and has subsequently been used in two published studies designed to evaluate the role of DRC as a risk factor for non-melanocytic skin cancer. In this assay, blood lymphocytes from subjects are cul-tured and transfected with either control or UV-irradiated plasmids containing a reporter gene (the chlorаmphenicol-acеtyltrаnsferase gene CAT), and the repair capacity is determined by measuring CAT gene expression in protein extracts prepared from transfected cells.
Grossman and his collaborators applied the assay in a study population in Baltimore, Maryland. This population was made up of Caucasians (aged 20-60 years) who had lived in Baltimore or its sub-urbs for most of their lives. The DItC was measured in 88 patients with a history of one or more histo-logically confirmed BCCs, and in 135 control subi ects. The mean CAT activity with plasmids UV-irradiated at 700 J1m2 was 8.00% (5D = 2.2) in con-trols without family history of actinic keratosis, 7.28% (SD = 2.2) in controls with a family history of BCC or a previous history of actinic keratosis, and 7.35% (SD = 2.0) in cancer cases (Л = 0.103; however, when cancer cases were compared with
subjects with family history, the P-value was 0,047). They also found that DRC declined with age in both cases and controls (Wei et al., 1993).
In a second study by Hall et al. (1994), the DRC was measured in subjects involved in a population-based study of the incidence and prevalence of non-metanocytic skin cancer in Geraldton, Western Australia. Subjects with SCC and BCC were considered separately, and for each case one control was chosen, matched by age and sex. The mean levels of CAT activity in cells transfected with plasmids irradiated at 700 J/mz were found to be generally higher in cases than in controls, and there was little difference between cases and con-trois in the DRC capacity according to the UV. The DRC showed little association with age, sex and viability of the lymphocytes, but was positively correlated with blastogenic rate (P = 0.055). Thus, no evidence was found that subjects with non-melanocytic skin cancer had lower repair capaci-ties than the controls, nor was any statistically significant difference in repair activity detected between the two groups. Only in the young sub-jects with SСС was there any suggestion that cases had lower repair capacities, although this differ-ence could be due to chance (P = 0.53).
The differences between the results of these two studies may be explained by several factors. Firstly, the age range of the subjects in the Baltimore study was larger than that in the Australian study, with 21.6% of the BCC cases under the age of 40 at the time of sample collection. As the apparent differ-ence in DRC was most marked in early-onset cases, the possibility of detecting a difference between cases and controls might be reduced due to the older age of the Australian population. A second major difference was in the mean CAT activity measured iп the assay, which was substantially higher in the Australian study (13% in BCC cases, 5D = 6.2%; 12.2% in SCC cases SD = 7.1%; and 12% in controls, SD = 5.6%). This may indicate a greater degree of random error in the laboratory measure-ments. The methods used in the studies were not identical, mainly for logistic reasons. The handling of the blood samples is one example. Iп the Australian study, lymphocyte purification could only be car-ried out after overnight transport of the samples whereas Wei et al. (1993) processed the samples locally on the same day. Since subsequent cell viability was lower in the Australian study, the pis-
296

Pathogenesis and mechanisms of cancer
siЫlitу that the surviving cells were not truly representative of the individual cannot be excluded.
Another possible explanation relates to the higher ambient level of solar radiation iп Western Australia. Exposure to UV radiation has been shown to increase the expression of various genes. Short-term effects of UV on the ability to repair radiation-induced DNA damage have been noted, but little is known about the long-term effects. It is also possible that the result of high environmental exposures to UV radiation is to mask the DRC dif-ferences between cases and controls obsérved by Wei et ad. (1993). Recent epidemiological evidence suggests that beyond a certain sun exposure, the risk of BCC does not increase further and that a particular amount of sun exposure delivered in infrequent, probably intense, increments will increase the risk of BCC. This finding may support the possibility that in cases of extreme sun expo-sure, DRC is no longer a major risk factor for 11CC.
In summary, the use of the measurement of DRC in cells to identify individuals at increased risk of UV carcinogenesis and to improve the esti-mation of the effects of sun exposure is appealing. The assay developed by Grossman and colleagues is potentially applicable to molecular epidemiol-ogy. However, its use in such studies has, to date, produced conflicting data, which may reflect dif-ferences in experimental approach as well as dif-ferences between the populations studied.
There is limited evidence, apart from that com-ing from XP patients and that obtained by Wei et a2. (1993), that DRC is altered in patients with skin cancer. A number of studies have examined the ability to repair pyrimidine dhners induced by single exposure to stimulated solar radiation, although many of these studies are limited by small populations (IARC, 1992). The impact of reduced DRC as a risk factor for BCC is potentially significant, especially when the occurrence of increased ambient UV irradiation, due to alter-ations in ozone levels, is taken into consideration. However, in order to fully assess the contribution of DRC to skin cancer susceptibility, additional studies need to be completed in which the effects of age, family history and sun exposure can be evaluated and linked to other important factors in the carcinogenic process, such as the mutagenic alterations in cellular DNA.
Prevalence of alelic loss The pattern of chromosome loss has been studied in skin tumours from patients with 11CC, SCC, melan-oma and Ferguson-Smith syndrome (a syndrome in which the lesions are histologically indisting-uishable from SCCs) using microsatellite markers. A high frequency of chromosome 9q loss (up to 6% in informative tumours) has been observed in BCC, within a region where both the naevoid 11CC syndrome and Ferguson-Smith syndrome have been mapped (9g22.3-q31). This suggests that the two conditions may reflect mutations in the same gene. A relatively high frequency of LOI (14%) was also observed for chromosome 1q, suggesting that this region may play a role in the develop-ment of BCC.
In sCC, loss of chromosome 9 has been found in up to 33% of tumours (16149). However, the pat-tern of chromosomal alterations in SCC is different from that observed in BCC, with LOI at 9p (41%) 13q (46%), 17р (33%) and Зp (23%) (Quinn et al., 1994). In primary melanomas, LOI at 9p was the most frequent (47% of informative cases), and it has been suggested that a melanoma susceptibility or tumour suppressor gene may be localized at 9p2l-23, a region that contains the cyclin-dependent kinase inhibitor gene р16/M7`S-1. LOI on chromosome arms Зp, бq, 10q, 11q and 17p was also relatively frequent. LOI at Зp and 10q was found in lesions of 4.5 rum in depth or less, while LOI at бq, 11q aid 17p was only detected in more invasive tumouis. These results suggest that loss of chromosome 9p occurs before loss of other chromosome arms in sporadic cutaneous melanoma.
Activa tim of oncogenes A high variability in ras gene mutations has been reported in melanomas (from 5 to 27%) and may be explained by the results of Jafari et aL (1995). They demonstrated that the predominate mu-tation was at codon 61 of the N-ras gene and exclu-sively in modular malignant melanomas (31% mutation frequency). No ras mutations were re-ported in superficial spreading melanomas or in lentigo malignant melanomas, demonstrating the need for consideration of the specific pathology when carrying out this type of analysis. Whether ras gene mutations play an important role in non-melanocytic skin cancer remains to be fully estab-lished. Spencer et ai. (1995) have found activating
297

Application of Biomarkers in Cancer Epidemiology
mutations at codon 12 of K-ras and at codons 12, 13 and 61 of the H-ras gene in 16% of actinic ker-atoses and in 12% of SCCs. Daya-Grosjean et ai. (1993) have shown that there 1s a twofold increase in mutation frequency of the ras genes in XP tumours compared with control tumours. The majority of these mutations were at codon 12 in all three ras genes, and were located opposite dipyrim-idine sequences. This is consistent with a funda-mental role of unrepabed DNA damage as an initi-ating lesion in skin carcinogenesis.
Mutation spectrum of р53 gene With the exception of cutaneous melanoma, skin cancer is often associated with р53 mutations. Recent studies have estimated the incidence of
р53 mutations in sCC and BCC to be between 12 and 58%, and the analysis of the mutations has revealed thé presence of UV- specific mutations targeted to dipyrimidfne sequences, with the majority being C to T transitions. Ziegler et al. (1994) have demon-strated that UV-induced p53 mutations are already detectable in actinic keratosis, with mutations being detected in 60% of 45 cases of actinic kera-tosis examined from 24 patients. The base changes found implicated sunlight as the mutagen: 89% occurred at adjacent pyrimidines and most were C to T substitutions or CC to TT double base changes.
Jmrnunological response Over the past few years, it has been realized that exposing the skin to sunlight has profound effects
Normal _ cpо5еd.` HyperplaStic:: Dÿsplastic :: Cancer
Tobaccolalcohol р53 mutations Basal-cell SCC others (A or T) hyperplasia
lesophageal р53 overexpression mucosa
Barrett's р53 mutations ADS metaрlasia (CT CPG)
Chronic reflux
р53
sun, UVB mutations Sun, UVB Actinic I SCC
(СС-ТТ) \ keratosis
Skin jl
DNA cyclobutane genetic alteration
dimers
Figure 4. р53 mutations in the temporal sequences of events leading to cancer of oesophagus [squamous-cell carcinoma (5СС) and adеnocarсiпoma (ADС)] or of the skin. The progression of the disease is represented from left (normal tissue) to right (cancer). The occurrence of genetic lesions is shown with respect to specific pathological stages. This model illustrates that р53 alterations occur at different stages and in different contexts in both cancer of the oesophagus and cancer of the skin. In SСC of the oesophagus, mutation of р53 is thought to be a very early event that occurs in exposed tissues prior to the formation of a dysplastic lesion. In contrast, in AUC, р53 mutations occur later in the development of the lesion, probably in late dysplasia. In SСС of the skin, mutations occur in normal cells, but the propagation of a clone of cells carrying a р53 mutation is dependent upon continuous exposure to UV
298

Pathogenesis and mechanisms of cancer
on the immunological system and that these immunological changes can contribute to the development of skin cancer and alter resistance to infectious diseases. Studies on the nature and mechanism of the immunological alterations fol-lowing exposure to UV radiation suggest that UV-induced DNA damage triggers а cascade of events leading to a state of antigen-specific, systemic T-lymphocyte-mediated immunosuppression. It is proposed that with low doses of UV radiation, anti-gen-presenting cells in the. irradiated skin are mod-ified, either directly by the action of UV or lidi-rectly as a consequence of an influx of inflamma-tory cells or by the local release of cytokines. Larger doses of UV may bring about the release of cytokines systemically, causing an alteration tri the activity of antigen-presenting cells. Cytokine imbalances in individuals unable to repair UV-induced DNA damage may explain some of the additional clinical symptoms observed in XP and other sun-sensitive syndromes.
Conclusion Temporal sequence of genetic alterations in the progression of cancer Figure 4 summarizes the role of p53 mutation in the temporal sequence of events leading to cancers of the oesophagus or to cancer of the skin.
Cancer of the oesophagus. In SCC, р53 overexpres-sin or accumulation of the X53 protein due to prolonged half-life has been detected in normal, non-dysplastic oesophageal cells and, iп particular, in the nuclei of proliferative cells in the basal layer of the mucosa. In a number of cases, p53 muta-tions are already present in the p53-positive cells in normal mucosa. Moreover, in a given patient, mul-tiple and distinct patches of p53-positive cells with different mutations can be detected. This indicates that multiple independent pre-neoplastic foci or tumours develop in the oesophageal squamous mucosa, and it is of interest to elucidate which of these foci have selective growth advantage in can-cer development. During tumour development, frequent additional genetic alterations include 3g21.3 and 9g31 allelic losses.
In ADC, overexpression of p53 protein and increased proportions of cells with a GO/G1 DNA content are detected in metaplastic Barrett's epithelium, possibly as a result of DNA damage
induced by chronic gastric reflux. Subsequent inac-tivation of p53 by mutation and/or allelic result is an abrogation of cell cycle control at the G1/S tran-sition. Consequently, subpopulations of aneuploid cells frequently develop during the later stages of carcinogenesis, with increased proportion of cells in the S-phase and G2-phase. Mutations in the X53 gene are more common in ADC than in 5CC, but are not found in non-dysplastic Barrett's metaplasia, suggesting that they occur later at the transition from high-grade dysplasia to carcinoma.
These findings at the cellular and molecular levels underscore the different etiology and patho-genesis of SCC compared with ADC, and suggest that the genetic alterations observed may represent molecular fingerprints of critical risk factors involved in the development of these two cancers.
Cancer of the skin. The model for human skin car-cinogenesis presents some uncertainties as far as the progression of genetic events is concerned. A role for p53 has been clearly demonstrated by Ziegler et aL (1994). p53 mutations are found in actinic keratosis, and inactivation of X53 in mouse skin reduces the appearance of sunburn cells, apoptotic keratinocytes generated by overexposure to UV. Skin thus appears to have a p53-dependent mechanism which removes `precancerous' UV-damaged cells via apoptosis. If this response is reduced or altered by p53 mutation, sunburn might act as a selection pressure favouring the sur-vival of mutated cells. Whereas UV-damaged nor-mal cells will die as sunburn cells, a proportion of the damaged cells with mutant p53 will be resis-tant to apoptosis. Continued sun exposure, which produces alterations in immunological surveil-lance and gene expression, can act as a tumour promoter and results in the clonal expansion of mutated cells to form an actinic keratosis which usually regresses in the absence of sun exposure but progressively enlarges if exposure continues.
Importance of biological context in interpreting the significance of bromarkers The two examples discussed here indicate that the detailed analysis of specific biomarkers may reveal important information for the understanding of both the etiology and pathogenesis of human cancer. In particular, the analysis of p53 gene mu-tation and protein expression is useful to make
299

Application of Biomarkers in Cancer Epidemiology
inferences about the nature of the etiologic agents involved in these cancers. In addition, in both oesophagus and skin cancers, alteration of р53 appears to represent а central event in tumour pro-gression. However, the interpretation of the signif-icance of p53 alteration as a blomarker is depen-dent upon the biological context. In cancers of the oesophagus, the main consequence of p53 alter-ations is likely to be the disruption of G1/S cell cycle control, giving rise to populations of actively growing cells at high risk of becoming precursors to neoplastic lesions. In skin cancers, loss of р53 function may abrogate a normal mechanism which removes UV-altered cells via apoptoses, thus facilitating the survival of cens containing UV-damaged DNA. Clonai expansion of mutated cells depends upon continuous exposure to the sun until further genetic alterations give rise to squa-mous cell carcinoma. These two examples empha-size that comparable genetic events may have dif-ferent impacts depending upon the tissue, cellular and molecular context in which they arise.
Acknowledgements We gratefully acknowledge the financial support received from the Commission of the European Communities (grant nos EV5V СТ92-0199 and CT 94-0581). We thank Mrs Magali Maillol for typing the manuscript.
References Aoki, T., Mori, T., Du, X., Nisihira, T., Matsubara, 1: & Nakamura, Y. (1994) Allelotype study of esophageal car-dnoma. Genes Сбгоmosom. Cancer, 10, 177-182
Athas, W.F., Hedayati, M.A., Matanoski, G.M., Farmer, E.R. & Grossman, L. (1990) Developement and field-test validation of an assay for DNA repair in circulating lym-phocytes. Cancer Res., 51, 5786-5793
Berrozpe, G., Schaeffer, J., Peinado, M.A., Real, F.X. & Pemcho, M. (1994) Comparative analysis of mutations in the p53 aid K-ras genes in pancreatic cancer. Int. J. Cancer, 58, 185-91
Blot, W.J., Devesa, S.S. & Fraumeni, J.F. (1993) Continuing climb in rates of esophageal adenocarci-noma: an update [letter]. J. Am. Med. Assoc., 270, 1320
Bootsma, D. & Hoeijmakers, J.H J. (1994) The molecular basis of nucleotide excision repair syndromes. Mutation Res., 307, 15-23
Daya-Grosjean, L., Robert, C., Drougard, C., Suarez, H. & Sarasin, A. (1993) High mutation frequency in ras genes
of skin tumors isolated from DNA repair deficient xeroderma pigmentosum patients. Cancer Res., 53, 1625-1629
Esteve, A., Martel-Planche, G., Sy11a, B.S., Hollstein, M. Hainaut, P. & Montesano, R. (1996) Low frequency of р16/CDKN2 gene mutations in esophageal carcinomas. lit. J. Cancer, 66, 301--304
Gadzar, A.F., Bader, 5., lung, J., Kishimoto, Y., Sekido, Y., sugio, K., ViriTiani, A., Fleming, J., Carbone, D.P. & Minna, J.D. (1994) Molecular genetic changes found in human lung cancer and its precursor lesions. In: The Molecular Genetics of Cancer, Vol. 59, Cold Spring Harbor, USA, Cold Spring Harbor Laboratory Press, pp. 565-572
Greenblatt, M.S., Bennett, W.P., lollstein, M. & Harris, С.C. (1994) Mutations in the p53 tumour suppressor gene: clues to cancer etiology and molecular pathogene-sis. Cancer Res., 54, 4855-4878
Hall, J., English, D.R., Artuso, M., Armstrong, ~.K. & Winter, M. (1994) DNA repair capacity as a risk factor for non-melanocytic skin cancer—a molecular epidemiolog-ical study. Int. J. Cancer, 58, 179-184
Hollstein, M.C., Smits, A.M., Galiana, C., Yamasaki, H., Bos, J.L., Mandard, A., Partensky, C. & Montesano, R. (1988) Amplification of EGF receptor gene but no evi-dence of ras mutations in primary esophageal cancers. Cancer Res., 48, 5119-5123
Hollstein, M., Shomer, B., Greenblatt, M., Soussi, T., Hovig, E., Montesano, R. & Harris, C.C. (1996) Somatic point mutations in the p53 gene of human tumors and cell lines: updated compilation. Nucleic Acids Res., 24, 141-146
Huang, Y., Meltzer, S.J., Yin, J., Tong, Y., Chang, E.Н., Srivastava, S., McDaniel, T., Boynton, R.F. & Zou, Z.Q. (1993) Altered messenger RNA and unique mutational profiles of p53 and Rb in human esophageal carcinomas. Cancer Res., 53, 1889-1894
Hulka, B.S. & Stark, A.T. (1995) Breast cancer: cause and prevention. Lancet, 346, 883-87
IARC (1992) IARC Monograph on the Evaluation of Carcinogenic Risks to Humans: Solar and UItraviolet Radiation, Vol. 55, Lyon, international Agency for Research on Cancer
Jafari, M., Papp, T., Kirchner, 5., Diener, U., HenschleL D., Burg, G. & Schiffmannn, D. (1995) Analysis of ras muta-tions in human melanocytic lesions: activation of the ras gene seems to be associated with the nodular type of human malignant melanoma. J. Cancer Res. Clin. OncoL, 121, 23-30
Jiang, W., Zhang, Y.J., Kahn, 5.1., Hollstein, M.C., Santella, R.М., Lu, S.H., Harris, C.C., Montesano, R. & Weinstein, LB. (1993) Altered expression of the cyclin
300

Pathogenesis and mechanisms of cancer
D1 and retinoblastoma genes й human esophageal can-cer. Proc. Natl Асад. 5e!., USA., 90, 9026-9030
Maesawa, C., Tamura, G., Suzuki, Y., Ogasawara, S., Ishida, K., Saito, K. & Satodate, R. (1994) Aberrations of tumor-suppressor genes (p53, арс, mcc and Rb) in esophageal squamous-cell carcinoma. fit. J. Caner., 57, 21-25
Montesano, R., Holistein, M. & Hainaut, P. (1996) Genetic alterations iп oesophageal cancer and its rele-vance to etiology and pathogenesis: a review. Int. J. Cancer Fred. OncoL, 69, 225-235
Munoz, N. & Cаstellsagué, X. (1994) Epidemiology of oesophageal cancer. Eur. J. Gas troenterol, Нерцtы., 6, 649-655
Murray, A. & Hunt, T. (1993) The Cell Cycle, Oxford, Oxford University Press
Powell, S.М., Papadopoulos, N., Kinzler, K.W., Sinoldnski, K.N. & Meltzer, S.J. (1994) APC gene muta-tions in the mutation cluster region are rare in esophageal cancers. Gastroenterology, 107, 1759-1763
Quinn, А.G., Sikkir'k, S. & Rees, J.L. (1994) Basal cell car-cinoma and squamous cell carcinoma of human skin show distinct patterns of chromosome loss. Cancer Res., 54, 4756-4759
Shen, J.C., Zingg, J.М., Yang, A.S., Schmuttе, C. & Jones, PA. (1995) А mutant Нра11 methyltransferase functions as a mutatoI enzyme. Nuclek Acids Res., 23, 4275-4282
5hibagaki, I., 5himada, Y., Wagata, T., Ikenaga, M., Imaroura, M, & Ishizaki, K. (1994) Allelotype analysis of esophageal squamous cell carcinoma. Cancer Res., 54, 2996-3000
Spencer, J.M., Kahn, S.M., Jiang, W., DeLeo, V.A. & Weinstein, I.B. (1995) Activated ras genes occur in human actinic keratoses, premalignant precursors to squamous cell carcinomas. Arch. Dermatol., 131, 796-800
Stone, S., Jiang, P., Dayanantk, P., Tavtigian, S.V., Katcher, H., Parry, D., Peters, G. & Kamb, A. (1995) Complex structure and regulation of the P16 (MTS1) locus. Cancer Res., 55, 2988-2994
Sun, Y., Hildesheim, A., Lanier, A.E., Cao, Y., Yao, K.T., Raab, Traub, N. & Yang, C.S. (1995) Ni point mutation but decreased expression of the p16IMTS1 tumor sup-pressor gene in nasopharyngeal carcinomas. Oncogene, 10, 785-788
Wei, Q., Matanoski, G.M., Farmer, E.R., Hedayati, M.A. & Grossman, L. (1993) DNA repair and aging in basal cell carcinoma: a molecular epidemiology study. Proc. Nat[ Acad. 5сi., 90, 1614-1618
Yang, A.S., Shen, J.С., Zingg, J.M,, Mi, S. & Jones, Р,А. (1995) HhaI and НрaII DNA methyltransferases bind DNA mismatches, methylate uracil and block DNA repair. Nucleic Acids Res., 23, 1380-1387
Ziegler, AM., Jonason, A.S., Leffell, D.J., Simon, J.A., Sharma, H.W., KimmeIman, J., Remington, L., Jacks, T. & Brash, D.E. (1994) Sunburn and skin cancer in the onset of skin cancer. Nature, 372, 773-775
Corresponding. author R. Montesano Unit of Mechanisms of Carcinogeпésis, International Agency for Research on Cancer, 150 cours Albert Thomas, 69372 Lyon Cedex 08, France
301

Application of Biomarkero iri Cancer Epiбemiology Toniolа, Р., BoPefte, R, 5huker, D.E.G., Rothman, N., Huike, B. and Pearno, N., edo
]ARC 5cienhilic PuЫications Nc. 142 1r,Lerriakcna1 Agency for Research on Cancer, Lyon, 1997
Comparing measurements of biomarkers with other measurements of exposure
R. Saracci
The issue of the relative merit of biomarkers and alternative measures of exposure arises most commonly in the context of epidemiological studies aimed at hazard detection and quantification. When exposures are from biological agents, biomarkers are usually the first and often the only justifiabIe choice. In general, however, the relative merit of different types of exposure measurements need to be evaluated on a case-by-case basis. Biomarkers may be affected by random errors, time-related sampling errors, physiological confounding and disease-induced differential error, all of which need to be explicitly evaluated before embarking on the use of a biomarker in a full-scale epidemiological study. Random errors affecting biomarkers may be reduced by replication or combination of measurements, or both. Alternative measurements of exposure can be evaluated against a biomarker when there is adequate evidence for regarding the marker as the true measure of a biologically relevant exposure.
Biomarker measurements: for what purpose? The term exposure' can have, and in the past has had, diverse meanings, ranging from very narrow to very broad: in epidemiology it has become cus-tomary to regard an exposure as 'any of a subject's attributes or any agent with which he or she may come in contact that may be relevant to his or her health' (Armstrong et a1., 1992, p. 4). This all-embracing definition incorporates variables exter-nal to the human body (e.g. concentration of an agent in air, social class, a drug), as well as variables internal to the organism (e.g. sex, blood level of a hormone, a gene), the key feature common to both kinds of variable being that they are considered as potential causes of biological and health effects. In the area of exposure measurement for epidemio-logical research, the fastest growing sector is repre-sented by biomarker measurements, underpinned by current developments in biology, particularly at cellular, subce11ular and molecular levels. In prind. plc, measurements of biomarkers using up-to-date techniques can potentially favourably replace many other types of measurement, in particular direct (physical, chemical or biological) or indirect (questionnaire and record) measurements of envi-ronmental variables; questionnaire measurements
of biological variables; and measurements of vari ous kinds extractable from existing records.
When comparing the relative merits of biomarker measurements and other types of measurement, the following four purposes for which biomarker mea-surements are performed should be considered:
Control of exposure level Biomonitoring is a long established practice, essen-tially within the industrial setting, which acts as a complement or an alternative to environmental measurements. In this application, a biomarker is regarded (based on evidence or assumptions, or both) as a biologically relevant effect of external agents, and research usually centres on the tech-nology required to achieve the desired level of con-trol of the agent in the environment. To the extent, however, that the biological relevance of the marker is not yet adequately established—at least for the specific purpose of exposure monitor-ing—the same issues arise as are considered in the next paragraph.
Hazard detection and risk quantification. For this research purpose, a genuine question arises as to whether a biomarker or another type of mea-
303

Application of Biomarkers in Cancer Epidemiology
surement is preferable. A biomarker measurement may prove superior in six respects: (1) individual-ization, as the measurement is now performed on the subjects in the study or on biological speci-mens taken from them; (2) objectivity, to the extent that the measurement is independent of the observed subjects' perceptions and substantially independent of the observer if instrumental or lab-oratory methods are used; (3) quantitative speciticity to the exposure of interest, to the extent that the method of measurement responds only to the agent of interest with no, or a minimal, response to other agents; (4) quantitative sensitivity, to the extent that the method of measurement responds in a quantitative way to the agent down to a very low limit of detection (meaning by 'very low' a concentration well below the minimum likely to induce a detectable biological effect); (5) Ыolо iсal sigпi!lсапсe, to the extent that the biomarker mea-surement may not only measure exposure but also contribute at least some information on the mech-anisms through which an agent may induce a dis-ease,, adding plausibility to an observed expo-sure-response relationship; (6) cost, to the extent that biomarker measurements, especially when performed with automated systems capable of combining high accuracy aid precision with low cost per unit measurement, can be less expensive than alternatives. The worth of a biological marker measurement in these respects, taken together, may make it pтeferaЫe to the alternatives, in that it is better capable (a11 other things being equal) of providing a higher estimate of the risk associated with an exposure and a steeper exposure-response relationship; от, while providing similar estimates, it is less costly. This, however, should never be taken for granted: while for individualization a biomarker measurement performed concurrently within a study is always superior, for objectivity, specificity, sensitivity, biological significance and cost, the relative merits of the biomarker measure-ment and of an alternative measurement can only be evaluated case by case.
Pathogenesis studies, These studies focus not on the 'black box' rela-tionship between the primary causal factors, envi-ronmental or hereditary (inputs), and disease (out-put), but on the interrelated sequences of biologi-cal events which lead from such etiological factors
to disease—obviously for these studies there are no alternatives to the use of biomarkers measure-ments. A key consideration, however, is that epi-demiological studies can only be—in general and exceptions apart—ancillary tools for pathogenesis studies, not because of a lack of pertinent bio-markers but because of their obseivational nature within the complex settings of human life. Mechanistic insights are gained, for instance, by analysing in human tissue specimens the genetic changes characteristic of the different histological conditions of the colonic mucosa (normal tissue, adenoma, carcinoma). However, to elucidate and demonstrate the causal succession and intercon-nection of genetic and non-genetic events requires exploration and testing in systems accessible to direct experiment within simplified and controlled settings, e.g. animal models like transgenic and knockout mice. In the same way that descriptive epidemiology data provide etiological insights and suggestions to be fully explored and tested in ana-lytical epidemiological studies, epidemiology in general can provide mechanistic insights and sug-gestions to be fully analysed and established in experimental studies.
Prognostic studies. In prognostic studies of outcome, the population investigated is composed of patients rather than `healthy' people. Again, as a general rule, biomarker measurements dominate the field and questions of alternatives seldom arise. In addition to measure-ments of biomarkers, however, other kinds of mea-surement may address different issues and may be necessary as well; for example, the measurement of clinical performance status by a questionnaire in addition to biomarkers such as the histological type of a tumour or the amplification of an oncogene.
These four considerations highlight one point: in essence, it is in the area of hazard detection and risk quantification that issues of merit comparison between biomaikers measurements and other types of measurements arise. The comparison can be cast in the systematic terms of evaluating the properties of measurements methods, in particular their error elements, as done both for categorical and continuous variables by White (this volume), or can be centred on signalling potential pitfalls and strengths in the application of biomarkers
304

Comparing measurements of biomarkers with other measurements of exposure
measurements compared to alternatives, as in the following seven sections of this article.
Random error Consider a 'true' situation, perfectly known with-out errors, involving two dichotomous exposure variables: lifetime smoking habit, evaluated by questionnaire as S+ and S—, and a marker of bio-logically relevant exposure (BS f- or BS—) reflecting the sum of all Ыologically effective lung carcinogens in tobacco smoke, as all pathogenetic paths of tobacco lung carcinogens transit through it. Three features of what can happen in these circum-stances (Table 1) are worth noticing:
1. subjects positive for the marker have a risk of lung cancer 11 times higher than subjects neg-ative for the marker. 2. In the absence of information on the marker, knowledge of smoking status as obtainable by questionnaire gives instead a lower relative risk for lung cancer (7.4). This is because some 2.4% of the BS± subjects are positive because of general environmental exposures to lung carcinogens, but are lifetime non-smokers; and, conversely, [n 20% of smokers, the marker remains negative, for physiological (metabolic) conditions. 3. Once the Ыomатker status of a subject is known, no further information on risk is added by the knowledge of smoking status: the relative risk for lung cancer conditional on BS+ оr В5—status is lin both strata.
In Table 2 a random error has been introduced in the biomarker measurement, mon-differential in
respect to smoking status, reducing both the sensi-tivity and the specificity of the biomarker to 95% (from 100% in the case of the perfect measure-ments of Table 1). However, the lifetime smoking status as assessed by the questionnaire measure-ment is 'robust' under a variety of circumstances and assumed to remain error-free. Table 2 shows that:
1. Measuring exposure via the biomarker and via the questionnaire are now nearly equiva-lent, the former yielding a relative risk of 8 and the latter yielding a relative risk of 7.4. 2. Once the biomarker status is known, assess-tug smoking status by questionnaire yields addi-tional information as indicated by the fact that, after stratification for ВЅ, the relative risk for smoking is now 2.4 (reciprocally determining ВΡs would add to an initial knowledge of smok-ing status). З. This extra information has, however, a dis-turbing aspect: if controlling for a variable like ВΡS, intermediate in the sequence between exter-nal exposure to tobacco smoke and lung cancer, does not account for all of the effect of tobacco smoke, the common interpretation would be that such an effect is also mediated by patho-genic paths other than the one going through ВS. In fact, this is not the case. The appearance of an alternative path is simply due to an error in the measurement of BS. Hence, unless we know the size of this error, we may be unable to decide which of the two interpretations is likely to be correct. Actual measurements of any vari-able are unavoidably affected by random errors.
вs+ (п = 820) 8s-- (►т =1180)
St (n = 800) S— (n - 20) S~ (п = 200) S— (n = 980)
Lung cancer 80 2 2 . 10
No lung cancer 720 18 198 970
Relative risk (s+/s—) = 1.0 Relative risk (S+/Ѕ—) =1.0
. Relative risk (BS+1B5—) = 11.0
Relative risk (S+/s—) = 7.4
305

Application of Biomarkers in Cancer Epгdomiology
вs+ (n' - 838) вs- (п =1162)
S+ (п'= 77р) Ѕ– (п'= 68) s+ (n'= 230) s- (л'= 932) Lung cancer
76 3
6 9 No lung cancer
694 65
224 923
Relative risk (s+/s—) = 2.4 Relative risk (S+1S—) = 2.4
Relative risk (88+/Bs—) = 8.0 Relative risk (s+/S—) = 7.4
It follows from the simple example just presented that the relative sizes of the errors of the measured variables will determine which pattern of rela-tionship is observable; and in turn the iii terpreta-till of the pattern will depend to a large extent on knowledge of the magnitude of these errors. The issue is not restricted to the comparison of biomarkers with alternative measures of exposure, but bears, much more generally, 6f the possibil-ity of correctly disentangling in an observational study the net effects of individual variables, inter-correlated and measured with different degrees of precision (Philips & Davey Smith, 1991).
The error of measurement has been expressed here through the sensitivity and the specificity in
True odds ratio Coefficient of variation of laboratory random error
3% 5% 10%
15 1.48 1.46 1.35
2 1.97 1.92 1.68
3 2.93 2.82 2.27
5 4.82 4.56 3.32 10 9.51 8.77 5.67
categorizing the subjects of a population through the measurement of a dichotomous variable. More often, the error wil1 be expressed as one compo-nent of the total variance of the measurements of a continuous variable in a population of subjects. Among Iaboratory analysts, it has instead been (and still 1s) customary to express the analytical error of measurement in the form of the propor-tional standard deviation (coefficient of variation) of replicated measurements performed on the same samples)—from one or preferably from sev-eral subjects—in the same run of analyses, in dif-ferent runs or in different laboratories. The practice of using the coefficient of variation appears to be based on the fact that very often the measurement variability increases with the magnitude of the measurement, yielding a constant coefficient. Table 3 depicts the attenuation of a true relative risk (odds ratio) resulting from a method of mea-surement affected by errors expressed by three dif-ferent coefficients of variation. For instance, with a coefficient of variation of 5%, a true odds ratio of 5.0 will be observed as a value of 4.56. Several assumptions have been made in constructing the table, the most relevant being that it refers to a variable (e.g. plasma total cholesterol) whose indi-vidual observed values in a population may exhibit a coefficient of variation of 15% around the popu-lation mean. For variables with a higher propor-tional dispersion the attenuation would be less, and for variables with a narrower proportional range of values in the population, the attenuation would be even more marked than it is in the table. Unless the coefficient of variation for the laboratory error is kept, say, within 5%, a material attenuation
306

Comparing measurements of biomarkers with other measurements of exposure
(а) 0J+ (n =1000)
0"- (n =1000)
Lung cancer 60
60
No lung cancer 840
840
Relative risk (0.1+!0 --) = 1.0
(b) S+ (n =1000) 5- (n =1000)
о.1+ (п = 500) 0'l- (n = 500) о'l+ (n = 500) о.- (n = 500) Vitamin C low Vitamin C very low Vitamin C high Vitamin C low
Lung cancer 50 50
10 10
No lung cancer 450 450
490 490
Relative risk (OJ+1оJ-) = 1.0
Relative risk (0.l-i-l0')--)=1 .0
of the true odds ratio can ensue from this variation alone, to which further attenuation must be added, chiefly from intrasubject variability.
Metabolic confounding A second aspect in need of thorough consideration concerns metabolic paths or, more generally, bio-logical transformation processes (for instance, cell maturation processes) affecting a Ыomarkeх of exposure but not an external (questionnaire or environmental) measurement of exposure. Table 4(a) shows the lung cancer figures for 1000 con-sumers of orange juice (providing vitamin C sup-piementation) and 1000 non-consumers, the risk being the same in both categories. When stratified by smoking habit (Table 4b), the relative risk in the two categories of orange juice consumers remains 1; however, because of the enhancing effect of orange juice on vitamin C plasma levels (a biomarker), and the often reported lowering effect of smoking on the same biomarker, the measured levels of vit-amin C are likely to turn out as schematized in the headings of Table 4(b) (high, low, very low). If one had categorized the biomarker levels without taking smoking habits into account, the exposure-risk relationship of Table 5 would have resulted, showing a clear increase of risk with decreasing levels of plasma vitamin C. Of course, tobacco
smoke is such a well known source of metaboli-cally active chemicals that information on it is very rarely omitted in epidemiological studies involving biomarkers, and correction for its con-founding effect is feasible. Sti11, one may need better than only gross information on smoking habits; dose may matter, as may time, as some metabolic effects are long-term and others short-term. It may be less obvious that it is necessary to correct for the influences of other agents (drugs, nutrients), particularly as some metabolic chains, such as the enzymes of the P450 superfamily, may be interfered with by a vast number of xenobiotics, not all of which are known ог measurable. Iп gen-eral, confounders of an exposure biomarker need not be the same as confounders of an alternative measurement of the same exposure. This is an important consideration, since, in the overall plan of what needs to be measured in a study, one has to include not only the exposure(s) of interest but key confounders as well.
Disease-induced differential error This potential source of error is mentioned here for the sake of completeness, as it is usually—unlike other sources—well acknowledged in studies in-volving biomarkers. In case-control and cross-sectional investigations, the presence of disease,
307

Application of 8iomarkers in Cancer Epidemiology
Table 5. Lung cancer occurrence in subjects classified by Vitamin C plasma levels
Vitamin C high (n = 500) Vitamin C low (n -1040) Vitamin C very low (n 500)
Lung cancer 10
60 50 No lung cancer 490
940 450
Relative risks
1.0
3.1 5.4 (Reference category)
e.g, colon cancer, niay in fact be the cause of changes in a biomarker, e.g. blood cholesterol level, which will show up as an association between the biomarker and the disease. This association, due to differential error, could be wrongly interpreted as indicating that the Ыотлarker precedes the disease in time and can therefore predict the disease occurrence. The same may apply in cohort studies, as an unrecognizable, still subclinicaI, disease may induce а change in a biomarker in those subjects who are bound, later on, to move on to clinically recognizable disease. 5tratificatiоn of subjects by disease stages may be one way (often the only one) of getting a clue as to whether disease-induced dif-ferential error has occurred. An association which becomes stronger with advancing stages of the dis-ease points to the possibility of a disease-induced differential error, although the absence of such a gradient represents only weak evidence against such bias, particularly if treatment has altered the natural course of the disease.
Sampling time variability One well-recognized and critical aspect in the com-parative evaluation of a biomarker with respect to an alternative measure of exposure is the time of appearance, persistence and disappearance of the biomarker in relation to the time of the external exposure or the fluctuations in time of an internal exposure (e.g. hormones). Time differences in sampling may contribute substantially to subject misclassification in respect to exposure, obscuring the detection of associated risks and reducing the superiority of the biomarker compared to alterna-tive measurements. For example, if blood is taken from subjects during a survey lasting 3 months after a relevant exposure has occurred, for instance in an accident, and the half time of the biomarker of
interest is of the same order of magnitude, a range of values of the marker from —30 to +30% of the average will be observed merely because of differences in the time of sampling, inducing a sub-stantial misclassification of subjects by level of expo-sure. Alongside short-term (e.g. day-to-day or week-to-week) and medium-term (e.g. month-to-month) variations, longer term variations in a biomarker can occur over a period of years. For example, vita-min C intake could vary greatly over a person's life and it may be that intake over the 20 years before diagnosis influences lung cancer. In that case, a food frequency measure of vitamin C intake, which would have substantial error, could be a better mea-sure of the relevant exposure than an accurate bio-marker of vitamin C that measures only recent intake. Whereas the adverse effects of short-term and medium-term variation can be reduced by the use of multiple measurements, long-term variation in an exposure, and in the corresponding bio-marker, seriously limits the use of the marker and can only be overcome if a marker of cumulative exposure becomes available.
In the case of internal exposure, hormones are known to exhibit sizeable daily variation (for instance, in the evening, levels of cortisol may be less than half that in the morning) and again casual sampling during the day may misclassify subjects and reduce the detectability of risks.
The general implication is that when assessing the total intrasubject and intersubject variability of a biomarker, a good deal can be gained by knowledge of its kinetics, which determines the magnitude of the differences related to sampling time.
Biomarkers of biological agents In discussing the relative merits of biomarkers and alternative measurements of exposure, a basic truism
308

Comparing measurements of bionarkers with other measurements il exposure
should not be forgotten: biomarkers are, by their very nature, at their best when measuring biologi- cal agents (exposures), provided the agent leaves—as is often the case because of the specific biological interactions with the host—a characteristic long-term trace in the body. For example, when, in a large cohort of more than 20 000 subjects, exposure to hepatitis B was assessed through ananinestic reporting of clinical hepatitis, a relative risk for sub-sequent primary hepatocellular cardnoma of about 4 was found; when, however, the HBAgs (Australia antigen) biomarker, indicative of a subject carrier status of the virus, was measured, the risk in sub-jects positive for the antigen was found to be more than 200 times higher than in subjects negative for the antigen, effectively ruling out confounding and making bias unlikely (Beasley et aL,1981). Similarly, increased risks of cervical cancer associated with a history of sexual pramiscuity, of the order of two- to threefold, were found in several studies (Cramer, 1982), leading to the hypothesis that a sexually transmissible biological agent was causally implied. Measuring exposure to papkioma viruses (particu-larly HPV 16) with increasingly reliable techniques, prevalence odds ratio of 20 and more have been shown in a large number of case-control studies, supporting the conclusion of a causal link between the virus and cervical cancer (IARC, 1995).
This advantage of biorriarkers applies not only to the class of environmental biological agents but also to the other class of etiologically relevant bio-logical agents, the genes. Indirectly assessing the exposure to a gene through family aggregation of cancer cases may cause an enormous attenuation of the true relative risk associated with a gene increasing the risk of cancer. Table б (from Peto, 1980) refers to the case of a gene with a dominant allele confer-ring an increased risk of cancer and having a pop-ulation frequency of 5%. When those homo- and heterozygotes for the allele (95.7% of the popula-tion) are compared with those without the allele, a true relative risk of 100 becomes an observable rel-ative risk of less than five if measured—as has been done for decades in epidemiology—by actually contrasting the cancer risk among siblings of can-cer cases with the risk in the general population. This dilution, probably one of the strongest one cari find in exposure assessment, derives from three sources: first, not all the cases of the investi-gated cancer have the risk-enhancing genotype;
second, even fewer of their relatives have it; and third, the general population contains subjects bôth with and without that genotype. Now that molecular genetics techniques make it possible to determine directly a subject genotype, these sources of dilution have become virtually irrele-vant, as comparisons of risks in persons with dif-ferent genotypes, and different expressions of them, can be made. There is little question that genetic biomarkers, for use in both linkage and association studies, represent the most radical methodological advance for etiological studies in recent years.
Biomarkers as the reference Comparisons between a biomarker and alternative measurements of exposure are made in three rather different circumstances:
Quantitative comparison This comparison stands on the hypothesis that the two measurements measure the same quantity (exposure) and that, ideally, a correlation of 1.0 should exist between the two measurements. Divergence from this perfect correlation derives from errors in both measurements and can be quantified in the form of a reliability coefficient, which, besides being of interest in itself, allows the validity coefficient to be estimated, at least at its upper and lower bounds (Armstrong et a2., 1992, pp. 82-83). In the much less common situation in which sound evidence is available that the bio-marker can be regarded as the ultimate and true
Relative risk in relatives of cancer patients
True relative risk (XX, OX versus 00) Twin sibling Child
2 1.07 1.04 1.04
10 3.02 2.00 1.99
100 8.60 4.75 4.70
1000 10.10 5.48 5.42
309

вs+, s+ (n = seal вs+, s-; вs-, 5+ (л 532) B5—, s-- (п = 788)
Application of Вi maгkers in Cancer Epidemiology
Lung cancer 64
22 g
Ni lung cancer 616
510 780 ReЭative risks 10.1
4.2 1.0
(Reference category)
measure of the exposure, both the validity and reli-ability of the alternative measure can be directly determined with respect to it.
Qualitative validation This type of validation assumes the biomarker as the reference and validates the alternative mea-surement (obtained by questionnaire or environ-mental measurement) by looking for a correlation with the Ыоmarker, the underlying and implicit hypothesis being that the correlation may indeed be zero, given the very indirect nature of the alter-native measurement. This type of qualitative vali-dation, in which finding a statistically significant correlation is even more important than the mag-nitude of the correlation, is particularly relevant when dealing with past exposures. For instance, that the levels of dioxin (TCDD) are higher tri fat samples available from only a few pesticide sprayers than in the general population represents circumstantial evidence of the exposure to TCDD or to substances contaminated by TCDD. This, in 0m, lends support to an interpretation in terms of occupational exposures of the relationship which may have been found between reconstructed work histories and disease end-points in the whole cohort of sprayers.
This recalls the story of the ancient city of Troy, in Asia Minor, as told in the epic poems of Homer. It was commonly held among scholars for genera-tills that the events described by Homer, as they appeared so well detailed, never took place at all and were pure legend. However, in 1870, the German merchant aid archaeologist Heinrich Schliemann went and dug where Homer said Troy was and found the site of the city (Lister, 1967). Incidentally, as he was using rather primitive
archaeological techniques, he destroyed as many `markers' as he revealed. From that moment, based on a limited validating evidence, the whole series of events and their interrelationship became regarded as the true history of the Troy war. In epidemiology, a `Troy validation' of very indirect exposure mea-surements against the few feasible measurements of a meaningful biomarker may be formally unsat-isfactory but substantively informative.
Analogic extrapolation Whatever relationship is found between a bio-marker and an alternative measure of exposure may be extrapolated, by analogy and with caution, to hold in circumstances different from those under which the relationship was found. For instance, in the short term (i.e. a week), reported exposure to environmental tobacco smoke in non-smoking women correlates well with urinary coti-nine levels, which reflects actual exposure to tobacco smoke (Riboli et al., 1990). This offers sup-port, by anаlоgy to the contention that in the long term (i.e. years), self-reported exposure to ЕТ5 reflects actual exposure to ЕTS.
Composite markers One way in which biomarker measurements, even if imperfect, may be valuable is through combination into composite variables, formed by several bio-markers or by biomarkers and other measurements of exposure. This is particularly advantageous when some of the measurements can be performed cheaply. Referring back to the case of a random error affecting the measurement of a biomarker BS (Tables 1 and 2), assume now that the loss of sen-sitivity and specificity is sizeable, both being reduced to 80%. In these conditions, the relative
310

Comparing measurements of biomarkers with other measurements of exposure
risk for the biomarker of tobacco smoke is just 3.4, while the relative risk assessed via a tobacco smok-ing questionnaire remains 7.4. Once the latter is known, the relative risk for the biomarker is, within the strata of tobacco smoking habits only 1.8; it may be tempting (particularly if the bio-marker measurement is costly) to dismiss it as worthless. This may in fact be wrong, as the bio-marker measurement contributes information when considered jointly with the questionnaire measurement. An odds ratio of 10.1 is found in the highest category of a new variable created by coil-pounding the questionnaire information and the biomarker information, which shows (Table 7) a clear gradient of risk with increasing levels of the variable. This elementary combination of variables underlines the important principle that when dealing with correlated variables purporting to measure the same underlying, but not directly accessible, vari-able, it may definitely be advantageous actually to measure several of them, even if they are individ-ually affected by sizeable non-random errors, and to combine them in a composite variable (Armstrong et aI., 1992, pp. 115-125). Indeed, this may be one of the main ways of overcoming the inherent imperfection of exposure measurements in epidemiology. .
Conclusion Biomarkers of exposure are enriching the epidemi-ologist's armamentariuni for evaluating exposures, present and past. The issue of the relative merits of bioniarkers compared to alternative measures of exposure arises particularly in the context of stud-ies aimed at hazard detection and quantification. In general, the relative merits of the different types of measurement of exposure need to be evaluated on a case-by-case basis. However, when the exposure is represented by a biological agent, biomarkers are the first, and often the only justifiable, choice. Whatever the type of study and the type of expo-sures involved, biomarkers may be affected by ran-dom errors, time-related sampling errors, physio-logical confounding and disease-induced differen-tial error; fui assessment of these aspects is needed before embarking on the use of a biomarker in a full-scale epidemiological study. Random errors affecting biomarkers may be reduced by replica-tion оr combination of measurements, or both.
When evidence allows a biomarker to be regarded as the true measure of exposure, the validity and reliability of alternative measurements can be directly determined against it. A less elegant and ambitious, but no less valuable and common, use is in confirming, on the basis of whatever mea-surements may be feasible (`Troy validation'), that indeed other indirect measurements of exposure bear at least some relation to a biologically rele-vant exposure.
Two final remarks are apposite. First, there is no need to have biomarkers, as opposed to other exposure variables, measured in every epidemio-logical study, and epidemiologists ought to make clear and stress to colleagues from other disci-plines, including those sitting in peer review and grant awarding committees, that what qualifies a good or a bad epidemiological study is not the mere presence or absence of measurements of some of the latest available Ыomarkers. Second, the flow of newly measurable biomarkers appears to be such that it is reasonable to expect that biomarkers of exposure which are capable of meeting the exact-ing requirements demanded by their use in epi-demiology will soon be forthcoming.
References Armstrong, B.K., White, E. & Saracci, R. (1992) Principles of Exposure Measurement in Epidemiology. Oxford, Oxford University Press
Beasley, R.P, Hwang, L.Y., Lin, C.C. & Chien, C.S. (1981) I-lepatoceilular carcinoma and hepatitis B virus. A prospective study of 22707 men in Taiwan. Lacet, ii, 1129-1133
Cramer, D.W. (1982) Uterine cervix. In: Sclsottenfeld, D. & Fraumeni, J.F., eds, Cancer Epidemiology and Prevention, Philadelphia, W.B. 5aundexs, pp. 881-900
International Agency for Research on Cancer (1995) IARC Monographs on the Evaluation of Carcinogenic Risks to Humans, Vol. 64, Human PapгlIomaviruses, Lyon, International Agency For Research on Cancer
Lister, R.P. (1967) Turkey Observed, London, Eyre & Spoinswoode
Peto, J. (1980) Genetic predisposition to cancer. Iд: Cairns, J. Lyon, J.L. & Skilrük, M., eds, Cancer Incidence in Defined Populations, Cold Spring Harbor, Cold spring Harbor Laboratory, pp. 203-213
Phillips, A.N. & Davey Smith, G. (1991) How indepen-dent are "independent" effects? Relative risk estimation
311

Application of Biomarkers in Cancer Epidemiology
when correlated exposures are measured imprecisely. Ј. Clгп. Epidemiol., 44, 1223-1231
Riboli, E.., Preston-Martin, S., Saracci, R., Haley, N.J., Trichopoulos, D., Becher, H., Burch, J.D., Fontham, E.T.Н., Gai, Y.T., Jiпдаl, S.1C., Ku L.С., Le Marchand, L.L., segnan, N., Shimizu, H., Stanta, G., Wu-Wiцiаms, A.H. & Zatonski W. (1990) Exposure of nonsmoking women to environmental tobacco smoke: а 10-соипtтy coilaborative study. Cancer Causes Control, 1, 243-252
R. Saraccэ National Research Council, Via Trieste, 41 56100 Pisa, Italy
312

Application it Biomarkers in Carrcer Epidemiology Toniolo, P., Bottelle, Р, Ehuker, D.E.G., Rothman, N., Rulka, B. and Pearce, N. ads
iARC ScienIiIic Publicali01s No. 142 1ntemauunj Agency for Research on Cancer, Lyon, 1997
Ethical and social issues in the use of biomarkers in epidemiological research Р.А. Schulte, D. Hurter and N. Rothman
The use of biomarkers in epidemiological research may raise ethical and social issues. These issues stem from the belief that research participants have `rights' to appropriate information before, during and after studies so that they can make informed decisions. Ethical issues can arise during protocol development, obtaining participation, and in the interpretation and notification of text and study results. Additionally, there are ethical cpnsiderations concerning the use of biological specimens collected and stored for one purpose and subsequently used for other research purposes. A major ethical issue is the maintenance of participants privacy and the confidentiality 0f their test and study results. Ethics committees need to be well-informed about the scope, limitations and expectations of biomarker research in order to be able to respond to social and scientific developments in the use of biomarkers.
Epidemiological research potentially raises many ethical questions and issues. The use of biomarkers in such research may raise further issues, because biomarkers are obtained from the individual per-son and have the potential for providing impor-tant information about exposures, biological effects of exposures and susceptibility to disease for that individual (Grandjean, 1991; Schulte, 1992; Van Damme et aL, 1995). At the same time, there is the widespread misconception that biological information is always more valid than other infor-mation, such as that obtained from questionnaires, environmental monitoring or record review. None the less, the potential contribution of biomarkers to enhancing determination of carcinogen expo-sure-disease associations, identifying disease earlier, or identifying particular etiological sub-groups riiakes the use of biomarkers desirable and inevitable.
There is increasing recognition that many of the issues related to recruiting and informing subjects of test and study results have varied depending on study design. Consider three examples: (1) a cross-sectional study involving occupational exposure and a biomarker of early effect (e.g. cytogenetic effects); (2) a cancer case-control study evaluating the impact of common polymorphisms of me- tabolizing enzymes; and (3) a prospective cohort study with banked biological specimens. in gen-
erаl, cross-sectional studies of healthy workers are completed in a short period of time, with the expectation that the biowarkers under study may provide some insight into the potential risk of an exposed group as a whole, or possibly into an indi-vidual's risk of subsequent cancer development. Notifying workers of their results in these studies is common. By contrast, the case-control study involves subjects who are already sick, along with randomly selected controls who are not definable in an а priori sense to be at risk. These subjects are generally not notified of results. Finally, in the third example, everyone is healthy and samples are provided with the expectation that results will not be available for a relatively long time.
In the following pages, we will generalize about these issues, but the appropriateness may vary by study design or detail and the ethical issues should be addressed on a case-by-case basis.
In this paper, we will use the steps in the research process as the organizing theme and dis-cuss ethical and social issues fox each step. Where there are issues that differ according to the type of marker or the use of a marker, these aspects will be identified. Finally, we will discuss the use of stored specimens in biomarker research.
A premise of this paper is that ethical use of bio-markers in research involves attention to the rights' of subjects to appropriate information
313

Application of Biomarkers in Cancer Epidemiology
before, during and after studies, so that they can make informed decisions. Failure to plan or budget adequately for these efforts can lead to these rights not being met. We would note, however, that there is some difference of opinion about when and what to tel research participants, and this will be discussed in later sections.
Protocol development and study design Ethical issues come into play from the moment biomarkers are considered for a study. Why is the biomarker being considered? Biomarkers are usu-ally more resource- and labour-intensive than other measures of exposure, outcome or risk. The use of scarce resources to develop, validate or apply a biomarker can be wasteful or inefficient if there is not a good rationale. Essential to the design of transitional, etiological or applied studies is the need to identify the driving scientific or public health questions and to determine whether they could be answered by some other approach (Rothman, 1993; Rothman et al., 1995). Тhis may be Iеss of an issue for laboratory studies where bio-marker work is the defining activity. It may be more critical when considering using biomarkers as independent or dependent variables in epidemio-logical studies or for public health applications such as screening, monitoring or in risk assessment (Office of Technology Assessment, 1990; Perera, 1987; Schulte & HaIperirn, 1987; Rudiger, 1994).
Ethical and social problems may also arise from a failure of researchers to anticipate and plan the actions required for dealing with the more extreme biomarker assay results. This may include repeat testing, counselling or diagnostic evaluations. For transitional studies in which the characteristics of a marker are being determined, and where there are clearly no associated clinical findings, prognostic significance or meaning, the needs of subjects may be different from those situations, such as screening or biological monitoring, where a marker can have implications for individual risk or for disease. With markers of susceptibility, it may be important to consider the impact of the research not only on individual participants, but also on their families.
Obtaining participation How subjects are recruited into studies can involve serious ethical and social issues (Schulte & Sweeney, 1995). These issues hinge on what poten-
hal subjects are told about the study and whether they can truly give informed consent. If subjects are deceived or coerced into participating in a study, or are given false expectations (e.g. 'we can tell if you are sick or well') with respect to the value of the study to the participant, ethical principles are violated. For example, a researcher could coerce a potential subject directly (e.g. 'you may lose your job if you don't participate') or by implication. Communicating false expectations or using pres-sure is patently dishonest and unethical. It is unlikely that such deception or coercion would be overt; rather, it would be more subtle and difficult to detect. Abroad spectrum of opinion exists about what obtaining informed consent entails and when it is achieved. Some believe that for markers whose meaning is not known at the time of the study, a subject or worker in an occupational study cannot give truly informed consent (Samuels, 1994). This implies a much higher standard of interpretation for biomarker information than for other information routinely obtained by question-naires, environment monitoring or record linkage. In studies to validate markers of exposure, the level of understanding of the meaning of the marker is similar to that from classical exposure sources. Frequently, airborne exposure, levels in blood, or frequency of DNA or protein adducts are part of the same exposure paradigm. Markers of effect or susceptibility are different. Until there is determi-nation of predictive value and course in the nat-ural history, such markers are clearly only research variables with no clinical meaning, and partici-pants should be made aware of this. If a marker has been validated (i.e. quantitatively linked to risk of disease at the group or individuaI level), then a clear description of it should be given to potential research participants. With regard to informing participants of risks, general practice has been to identify only medical risks; however, it has been argued that truly informed consent should include reference to non-medical risks that might affect participants. For example, a study subject may be informed that they carry a genetic mutation that puts them at a high risk of subsequently developing cancer. In the extreme case, the mere acknowl-edgement on an employment or insurance appli-cation that they have had a biological or genetic test may result in denial of employment or insur-ance. Another variation on this scenario is that
314

Ethical aid social issues
misinterpretation of a biomarker assay result could occur and have the same impact.
Participants consent to provide the specimens and corollary demographic and risk factor infor-mation, and hence cooperate in the specified research. The subject generally does not consent оr imply consent to distribution of the data in а way that identifies him от her individually to any other parties, such as employers, unions, insurers, credit agencies, lawyers, family members, public health agencies, etc. .
Dissemination or revelation of results beyond the explicit purposes for which specimens were collected intrudes on subjects privacy. Studies where biological specimens and DNA are banked for future use may require informed consent about this future use. In this respect, questions are raised about whether specimens collected for one pur-pose can be used for different research purposes and about the responsibility for conveying results back to the subjects (Schulte & Sweeney, 1995). Also related to this is the ownership of specimens. Who owns them—the subject, the researcher, the sponsoring agency or others? Although this has been adjudicated in the case of a clinician who profited from a hairy cell leukaemia line derived from cells taken from a patient (Cooper, 1985; Office of Technology Assessment, 1987), we have found no references (except Clayton et aL, 1995, see later discussion) to the issue as it pertains to epidemiological research with stored specimens.
Interpretation and notification of test and study results Biomarker research yields individual test (assay) and study results (Schulte & 5ingal, 1989). Research participants may want, or have, a right to these results and an interpretation of them. Interpretation of these results is the responsibility of investigators. Some institutions require investi-gators to provide individual test results to subjects as well as overall study results, while others may advise them not to communicate results of assays that have no clinical relevance. Attendant to these efforts is the provision of an interpretation as far as is possible. Even though participants are told that tests may be purely for research purposes and have no clinical value, they still ultimately want to know if they are 'aIl right'. Investigators and prac-titioners face ethical issues in interpreting tests and
in deciding when biomarkers indicate that early warning steps should be taken. These may include efforts to control exposures (in occupational or environmental settings), the need for subsequent testing, ongoing monitoring, or simply, and often most importantly, counselling and a demonstra-tion of caring.
Interpretation of biomarker data can be diffi-cult. For example, in cross-sectionaI studies of populations with occupational or environmental exposure, evaluating the relationship between exposure and markers of early biological effect, biomarkers will not be indicators of risk per se, but of exposure, susceptibility given exposure, оr biological changes that could be homeostatic responses to an exposure (Ashford, 1986). The investigator needs to sort out these changes against a background of extensive intra-individual aid interindividual variзbшty in biomarkers. The current technological capabilities offer investigators and practitioners the opportunity to utilize techniques with heightened sensitivity for detecting changes at cellular and molecular levels, and for detecting exposures to minute amounts of a xenobiotic. At the same time, at these levels, inherited and acquired host factors aid other confounding factors can be strong causes of wide variability in biomarker results unrelated to the exposure of interest.
The results of studies of biomarkers of suscepti-bility can lead to findings that might be misun-derstood or abused (Lappe, 1983; Ashford, 1986; Nelkin & Tancredi, 1989). For example, some genes (such as those that are commonly occurring, that confer low relative risk and that require a specific exposure or other genes to increase risk of disease) (see Caporaso & Goldstein, this volume) do not provide unambiguous information, but various groups in society may start using such genotype information as if it represented 'diagnoses' rather than risk factors (Wagener, 1995).
In some studies, multiple biomarkers will be assessed, and researchers have a responsibility to consider whether issues of multiple comparisons can lead to inappropriate selection of significance levels. Association of biomarkers not included in original hypotheses should be evaluated at more rigorous levels of statistical significance, and subsequent interpretations should be considered in that light.
One area of interpretation that is problematic is what is called `individual risk assessment'.
315

Application of Biomarkers in Cancer Epidemiology
Generally, epidemiological studies (with or with-out biomarkers) yield group results. The risk per-tains to the group as a whole and not necessarily to individual members of the group. It is possible to compute an individual risk using a risk function equation (Truett et al., 1969); however, if the marker being used has not been validated for dis-ease, the calculation will be meaningless. Thus far, for the current generation of molecular biomarkers used in cancer research, there are practically no markers, with the exception of a few genetic muta-rions linked to high risk of disease in cancer fam-ily syndromes, for which an individual risk can be determined based on the level of the marker.
All of these characteristics of biocoaiker data may lead an investigator to conclude that а partic-ular biomarker is of uncertain meaning with regard to risk. None the less, the investigator has the obligation to portray accurately the degree of uncertainty in test and study results. There are a range of opinions about communicating results of biomarker tests on individuals or groups if there is no clinical meaning, such as usually occurs in tran-sitional studies to validate markers. Some believe the autonomy of participants is not honoured if they do not receive the information, while others believe that the information is meaningless to par-ticipants. The latter view has the appearance of being paternalistic, but may be viewed as doing no harm.
Other ethical issues involved in notification are the importance of communicating information in a timely fashion and the evaluation of the impact of notification efforts. The timeliness of notifica-tion is mainly an issue when results indicate an action that could reduce exposure or risk, or effect timely treatment. Evaluating the impact of notifi-cations may not need to be a routine matter, but since the impact of notification cannot always be anticipated, it may be useful to have included in the notification an opportunity for the participant to obtain more information or provide feedback about the results.
Use of stored specimens in biomarker research Biomarker research is qualitatively different from most other epidemiological research, because tech-riical developments make new assays feasible on stored specimens long after the original consent is obtained. Unlike questionnaire-based research, in which the response to a new hypothesis is usually
to start a new study and ask the relevant questions, a new hypothesis using a biomarker can often be tested using specimens from previous studies. 1f it is desirable to have prospectively сопесtед specimens, for instance if the biomarker level may be biased by disease, then available specimen banks with follow-up data will be the preferred resource for testing the new hypothesis. Otherwise, it might take many years to develop a new specimen bank with suffi-cient outcomes and follow-up to test a hypothesis.
Ethical issues for stored specimens relate to (1) whether consent for use of the specimens in research was originally given, and (2) whether this consent was generic or specific to the hypothesis to be tested, and whether the consent obtained when the specimens were collected stil meets the stan-dards of informed consent.
Many specimens stored for research purposes would have been collected after informed consent to research was given; however, some types of spec-imens, particularly clinical specimens initially used for diagnostic or prognostic purposes, may have been stored without consent or even without the patient's knowledge. Frequently in clinical set-tings, a wide variety of tests are ordered without any consultation with the patient, although clear exceptions exist, such as HIV testing, for which consent is usually mandatory. It has long been held as ethically acceptable practice to conduct some types of research on 'discarded' blood or tis-sues, i.e. specimens left over after the clinical tests are performed. Access to these tissues has been crit-ical to the development of new clinical markers such as histological or immunocbemical markers of cancer prognosis, in which hundreds or thou-sands of uniformly collected specimens are fre-quently needed to establish a new test as being informative. It would seem a natural extension of this tradition that new biomarkers of genetic sus-ceptibility or prognosis would also be evaluated in this way. However, because of the potential high predictive value of some of these tests, as well as the implications for family members, this tradition is being challenged, and a lively debate is currently underway about the ethics of using these tissues. A recent statement from a working group of the Ethical, Legal, and Social Implications of the Human Genome Project suggested that informed consent should usually be obtained before testing for genetic susceptibility on clinical specimens
316

Ethical and social issues
(Clayton et al., 1995), although the statement acknowledged that research involving `minimal risk', and for which re-consenting subjects would be impracticable, could be exempted. The defini-tion of 'minimal risk' and the determination of what constitutes `impracticability' are at the centre of much of the current uncertainty and debate.
Even in a research study, the original consent form can only be as thorough as the original aims of the study and the state of knowledge at the time permit. Samples from participants in a study of cancer risk factors, for instance, may subsequently be useful in a study of cardiovascular disease or psychiatric illness. Even the best designed and informed consent process in a study of genetic sus-ceptibility to cancer may be outdated with the discovery of a new susceptibility gene or a new prognostic implication of an 'old' gene. A major dilemma in current biomarker research is whether the generic consent originally given by a partici-pant to do research on a specimen is adequate con-sent to conduct a specific test which may not even have been envisaged at the start of the study. The obvious strategy of obtaining fresh consent has at least three major problems: (1) subjects may be very difficult to contact if follow-up has not been maintained, or they may have died; (2) a high pro-portion of non-consent, due either to inability to re-contact or to refusal, may bias the study; (3) for certain especially valuable specimens, such as those from cohort studies, multiple genes may be of interest and a process of very specific informed consent would generate an almost continuous stream of consent requests to the participant. Failure to obtain a new informed consent may expose the researcher to allegations of unethical behaviour, or may create a difficult situation if the biomarker information is of clinical relevance to the participant and yet the participant was not pre-test counselled about the test. The nature and force of these problems will be very different according to the predictive quality of the bio-marker and its clinical implications, and the social and cultural setting of the research.
Owing to the heterogeneity of study settings, and of social norms and responses, it is likely to be impossible to draft uniform rules on what consti-lutes ethical behaviour in every application of bio-marker research and every situation. This is cur-rently the case with research involving human
subjects, in which the first rule is that virtually all such research must be approved and reviewed by an appropriate ethics committee but relatively few types of research are absolutely proscribed or highly regulated. Some have proposed that research involving genetic susceptibility is qualitatively dif-ferent from other research, and that much stricter standards of informed consent should apply (Armas, 1995); while others have argued that the level of consent or notification should be com-mensurate with the degree of risk involved, and thus less stringent procedures may be appropriate for low risk, relatively common polymorphisms (e.g. Р450 genes) than for high-risk genotypes (e.g. BRCA1, BRСА2). In the USA, the possibility that biomarkers of susceptibility could be used to dis-criminate in the context of health insurance or employment is a major concern, which may expose research participants to potential economic harm. On the other hand, epidemiology has a good track record in protecting participants from loss of confidentiality in many studies over many years which have included Ыgh1y sensitive question-naire-based data. Although some unique issues are raised by biomarker research, most issues are simi-lar to those encountered in other types of research, and can be overseen by appropriately constituted ethics committees who are in the best position to be aware of the local and particular aspects of any proposed biomarker research. Especially close scrutiny should be given to any proposal using a biomarker with likely high predictive value. Ethics committees also need to be well informed about the scope, limitations and implications of biomarker research, as the ethical climate in this field may change quite rapidly as scientific developments occur and society responds to these developments.
Confidentiality of data Investigators need to maintain the confiden-
tiality of biomarker data because of the potential for misuse or abuse leading to discrimination, labelling and stigmatization. This can be increas-ingly difficult because ownership of stored speci-mens may be in question and various investigators may request the use of specimens for research, liti-gation or commercial enterprise. In some cases, where specimens are identifiable or are capable of being linked to databases where identification is possible, it may be difficult to assure confidentiality.
317

Application of Biomarkers in Cancer Epidemiology
Informatics and the ability to link disparate data-bases are progressing at a rapid pace. In some coun-tries, there may be a need for further legislation to prohibit unauthorized access to, or use of, sped-men results. The challenge will be to assure the rights of study participants while providing for a broad range of research opportunities.
References Armas, G.J. (1995) Editorial: Genetic prophecy and genetic privacy—can we prevent the dream from becom-trig a nightmare? Am.'. PuNic Health, 85, 1196-1197
Ashford, N.A. (1986) Medical screening in the workplace: legal and ethical considerations. Serein. Occup. Mcd', 1, 67-79
Clayton, E.W., Steinberg, K.K., Khoury, M.J., Thomson, E., Andrews, L, Kahn, M.E., Kopelrnan, L.M. & Weiss, J.O. (1995) Informed consent for genetic research on stored tissue samples. J. Ara. Mcd. Assoc., 274, 1786-1792
Cooper, J.P. (1985). Biotec[mology and the Law, New York, Clark Boardman Ltd
Grand jean, P. (1991) Ethical aspects of genetic predispo-sition to disease. In: Grandi can, P., ed, Ecogenetics, London, Chapman and Hall, pp. 237-251
Zappe, M. (1983) Ethical issues in testing for differential sensitivity to occupational hazards. J. Occup. Mcd., 25, 797-808
Nelkin, D. & Tancredi, L. (1989) Dangетоиs Diagnostics. The Sосiаl Power o fВiоlоgiсаl information, New York, Basic Books, Inc
Office of Technology Assessment (1987) New Develop-ments in Biotechnology, Vol. 1, Ownership a fHuman Tissues and Cells (ОТА-BA-337), Washington, US Government Printing Office
Perera, F.P. (1987) The potential usefulness of biological markers in risk assessment. Environ. Health Perspect., 76, 141-145
Rithman, N. (1993) Epilogue. In: Schulte, P.A. & Регега, F,V., eds, Molecular Epidemiology: Prгnciples and Practices, San Diego, Academic Press, pp. 565-569
Rothman N. Stewart, W.F. & Schulte, P.A. (1995) Incorporating biomarkers into cancer epidemiology: a matrix of biomaxker and study design categories. Caner Epidemiol.Biomarkers Prev., 4, 301-311
Rddiger, H.W. (1994) Changing emphasis irs occupa-tional toxicology: are we ready? Tot. Arch. Occup. Env. Health, 66, 69
Samuels, 5.W. (1994) A moral history of the evolution of a caste of workers. Presentation at Workshop on the Development and Applications of Biomarkers, Santa Fe, NM, April 26-29
Schulte, ~.А. (1992) Biomarkers in epidemiology: Scientific issues and ethical implications. Environ. Health Perspect., 98, 143-147
Schulte, P.A. & Halperin, WE. (1987) Genetic screening and monitoring for workers. In: Harrington, J.М., cd., RecentAdvances in Occupational Health, Vol. 3, Edinburgh, Churchill Livingstone, pp. 135-154
Schulte, P.A. & Singal, M. (1989) Interpretation and com-munication of the results of medical field investigations. J. Occup. Med., 31, 5898-5894
Schulte, P.A. & Sweeney, M.H. (1995) Ethical considera-tions, confidentiality issues, rights of human subjects, aid uses of monitoring data in research and regulation. Environ. Health Perspect., 103 (suppl. 3), 69-74
Truett, J., Cornfield, J. & Kannel, W. (1967) A multivari-ate analysis of coronary heart disease in Framingham. J. Chrom. Dis., 20, 511-524
Van Damme, K,, Caste1eyn, L., Heseltine, E., Huici, A., Sorsa, M., Larebeko, N. & Vineis, P. (1995) Individual sus-ceptibility and prevention of occupational diseases: sci-entific and ethical issues. J. Ocuip. Environ. Med., 37, 91-99
Wagener, D.K. (1995) Ethical considerations in the design and execution of the national and Hispanic Health and Nutrition Examination survey (HANES). Environ. Health Perspect., 103 (suppL 3), 75-80
Corresponding author P,A. Schulte National Institute for Occupational Saiаiy and Health, 4676 Columbia Parkway, C-14, Cincinnati, OH 45226, 115А
318

'ARC Monographs on the Evaluation of Carcinogenic Risks to Humans Volume i
Some Inorganic Substances, Chlorinated Hydrocarbons, Aromatic Amines, N-Nïtroso Compounds, and Natural Products 1972; 184 pages; ISBN 92 832 1201 0 (out of print)
Volume 2 Some Inorganic and Organometallic Compounds 1973; 181 pages; ISBN 92 832 1202 9 (out of print)
Volume 3 Certain Polycyclic Aromatic Hydrocarbons and Heterocyclic Compounds 1973; 271 pages; ISBN 92 832 12037 (out of print)
Volume 4 Some Aromatic Amines, Hydrazine and Related Substances, N-Nitroso Compounds and Miscellaneous Alkylating Agents 1974; 286 pages; ISBN 92832 12045
Volume 5 Some Organochiorine Pesticides 1974; 241 pages; ISBN 92 832 12053 (out of print)
Volume 6 Sex Hormones 1974; 243 pages; ISBN 92 832 1206 1 (out of print)
Volume 7 Some Anti-Thyroid and Related Substances, Nitrofurans and Industrial Chemicals 1974; 326 pages; ISBN 92 832 1207 X (out of print)
Volume 8 Some Aromatic Azo Compounds 1975; 357 pages; ISBN 92 832 1208 8
Volume 9 Some Aziridines, N-, S- and 0-Mustards and Selenium 1975; 268 pages; ISBN 92 832 1209 6
Volume i0 Some Naturally Occurring Substances 1976; 353 pages; ISBN 92 832 1210 X (out of print)
Volume 11 Cadmium, Nickel, Some Epoxides, Misce1Ianeous Industrial Chemicals and General Considerations on
Volatile Anaesthetics 1976; 306 pages; ISBN 92 832 1211 8 (out of print)
Volume 12 Some Carbamates,Thiocarbamates and Carbazides 1976; 282 pages; ISBN 92 832 12126
Volume 13 Some Miscellaneous Pharmaceutical Substances 1977; 255 pages; ISBN 92 632 12134
Volume 14 Asbestos 1977; 106 pages; ISBN 92 832 12142 (out of print)
Volume 15 Some Fumigants, the Herbicides 2,4-D and 2,4,5-T, Chlorinated Dibenzodioxins and Miscellaneous Industrial Chemicals 1977; 354 pages; ISBN 92 832 12150 (out of print)
Volume l б Some Aromatic Amines and Related Nitro Compounds — Hair Dyes, Colouring Agents aid Miscellaneous Industrial Chemicals 1978; 400 pages; ISBN 92 832 1216 9
Volume 77 Some N-Nitroso Compounds 1978; 365 pages; ISBN 92 832 1217 7
Volume lB Polychlorinated Biphenyis and Polybrominated Biphenyls 1978; 140 pages; ISBN 92 832 1218 5
Volume 19 Some Monomers, Plastics and Synthetic Elastomers, and Acrolein 1979; 513 pages; ISBN 92 832 1219 3 (out of print)
Volume 20 Some Halogenated Hydrocarbons 1979; 609 pages; ISBN 92 832 12207 (out of print)
Volume 21 Sex Hormones (Il) 1979; 583 pages; ISBN 92 832 1521 4
Volume 22 Some Non-Nutritive Sweetening Agents 1980; 208 pages; ISBN 92 832 1522 2
Volume 23 Some Metals aid Metallic Compounds 1980; 438 pages; ISBN 92 632 1523 0 (out of print)
Volume 24 Some Pharmaceutical Drugs 1980; 337 pages; ISBN 92 832 1524 9
Volume 25 Wood, Leather and Some Associated Industries 1981;412 pages; ISBN 92 832 1525 7
Volume 26 Some Antineoplastic and lmmunosuppressive Agents 1981;411 pages; ISBN 92 832 1526 5
Volume 27 Some Aromatic Amines, Anthraquinones aid Nitroso Compounds, and Inorganic Fluorides Used fn Drinking Waler and Dental Preparations 1982; 341 pages; ISBN 92 832 1527 3
Volume 28 The Rubber Industry 1982; 486 pages; ISBN 92 832 1528 1
Volume 29 Some industrial Chemicals and Dyestuffs 1982; 416 pages; ISBN 92 832 1529 X
Volume 30 Miscellaneous Pesticides 1983; 424 pages; ISBN 92 832 15303
Volume 31 Some Food Additives, Feed Additives and Naturally Occurring Substances 1983; 314 pages; ISBN 92 832 1531 1
Volume 32 Polynuclear Aromatic Compounds, Part 1: Chemical, Environmental and Experimental Data 1983; 477 pages; ISBN 92 832 1532 X
Volume 33 Polynuclear Aromatic Compounds, Part 2. Carbon Blacks, Mineral Oils and Some Nitroarenes 1984; 245 pages; ISBN 92832 15338 (out of print)
Volume 34 PoIynucIear Aromatic Compounds, Part 3: Industrial Exposures in Aluminium Production, Coal Gasification, Coke Production, and Iron and Steel Founding 1964; 219 pages; ISBN 92 832 1534 6

Volume 35 Polynuclear Aromatic Compounds: Part 4: Bitumens, Coal-Tars and Derived Products, Shale-Oils and Soots 1985; 271 pages; ISBN 92 832 1535 4
Volume 36 Ally] Compounds, Aldehydes, Epoxides and Peroxides 1985; 369 pages; ISBN 92 832 1536 2
Volume 37 Tobacco Habits Other than Smoking; Betel-0uid and Areca-Nut Chewing; and Some Related Nitrosamines 1985; 291 pages; ISBN 92 832 1537 0
Volume 38 Tobacco Smoking 1986; 421 pages; ISBN 92 832 1538 9
Volume 39 Some Chemicals Used in Plastics and Elastomers 1986; 403 pages; ISBN 92 832 12398
Volume 40 Some Naturally Occurring and Synthetic Food Components, Furocoumarins and Ultraviolet Radiation 1986; 444 pages; ISBN 92 832 1240 1
Volume 41 Some Halogenated Hydrocarbons arid Pesticide Exposures 1986; 434 pages; ISBN 92 832 1243 X
Volume 42 Silica and Some Silicates 1987; 289 pages; ISBN 92 632 1242 8
Volume 43 Man-Made Mineral Fibres and Radin 1988; 300 pages; ISBN 92 832 12436
Volume 44 Alcohol Drinking 1988; 416 pages; ISBN 92 832 12444
Volume 45 Occupational Exposures in Petroleum Refining; Crude Oil and Major Petroleum Fuels 1989; 322 pages; ISBN 92 832 1245 2
Volume 46 Diesel and Gasoline Engine Exhausts and Some Nitroarenes 1989; 458 pages; ISBN 92 832 1246 0
Volume 47 Some Organic Solvents, Resin Monomers and Related Compounds, Pigments and Occupational Exposures
in Pain1 Manufacture and Painting 1989; 535 pages; ISBN 92 832 1247 9
Volume 48 Some Flame Retardants arid Textile Chemicals, and Exposures in the Textile Manufacturing Industry 1990; 345 pages; ISBN: 92 832 12487
Volume 49 Chromium, Nickel and Welding 1990; 677 pages; ISBN: 92 832 1249 5
Volume 51 Coffee, Tea, Mate, Methyixanthines and Methylglyoxal 1991; 513 pages; ISBN: 92 832 1251 7
Volume 52 Chlorinated Drinking-Water; Chlorination By-products; some other Halogenated Compounds; Cobalt and Cobalt Compounds 1991; 544 pages; ISBN: 92 832 1252 5
Volume 53 Occupational Exposures in Insecticide Application, and Some Pesticides 1991; 612 pages; ISBN 92 832 12533
Volume 54 Occupational Exposures to Mists and Vapours from Strong Inorganic Acids; and other lndustnaI Chemicals 1992; 336 pages; ISBN 92 832 1254 1
Volume 55 Solar and Ultraviolet Radiation 1992; 316 pages; ISBN 92 832 1255 X
Volume 56 Some Naturally Occurring Substances: Food Items and Constituents, Heterocyclic Aromatic Amines and Mycotoxins 1993; 600 pages; ISBN 92 832 1256 8
Volume 57 Occupational Exposures of Hairdressers and Barbers and Personal Use of Hair Colourants; Some Hair Dyes, Cosmetic Colourants, Industrial Dyestuffs and Aromatic Amines 1993; 428 pages; ISBN 92 832 1257 6
Volume 58 Beryllium, Cadmium, Mercury and Exposures in the Glass Manufacturing Industry 1994; 444 pages; ISBN 92 832 12584
Volume 59 Hepatitis Viruses
1994; 286 pages; ISBN 92 832 12592 Volume 60 Same Industrial Chemicals 1994; 560 pages; ISBN 92 832 1260 6
Volume 61 Schistosomes, Liver Flukes and Meiicobacter pylon 1994; 280 pages; ISBN 92 832 1261 4
Volume 63 Dry cleaning, Somв Chlorinated Solvents and Other Industrial Chemicals 1995; 558 pages; ISBN 92 832 1263 0
Volume 64 Human Papillomaviruses 1995; 409 pages; ISBN 92 832 1264 9
Volume 65 Printing Processes, Printing Inks, Carbon Blacks and Some Nitro Compounds 1996; 578 pages; ISBN 92 832 12657
Volume 66 Some Pharmaceutical Drug 1996; 514 pages; ISBN 92 832 12665
Volume 67 Human Immunodeficiency Viruses arid Human T-ceIl Lymphotropic Viruses 1996; 424 pages; ISBN 92 832 12673
Volume 68 Silica, Some Silicates, Coal Dust end para-Aramid Fibrils 1997; 506 pages; ISBN 92 832 1268 1
Volume 69 Polychlorinated Dibenzo-para-dioxins and Dibenzoturans 1997; c. 600 pages; ISBN 92 832 1269 X
Supplements Suррlеmeпt Na.1 Chemicals and Industrial Processes Associated with Cancer in Humans ('ARC Monographs, Volumes 1 to 20) 1979; 71 pages; ISBN 92 832 14048 (out of print)
supplement No. 2 Long-Term and Short-Term Screening Assays for Carcinogens: A Critical Appraisal 1980; 426 pages; ISBN 92 832 1404 8
Volume 50 Volume 62 Some Pharmaceutical Drugs Wood Dusts and Formaldehyde 1990; 415 pages; ISBN: 9283212599 1995; 405 pages; ISBN 92 832 1262 2

Supplement No. 3 Supplement No. 5 Supplement No. 7 Cross Index of Synonyms and Trade Cross Index of Synonyms and Trade Overall Evaluations of Names in Volumes 1 to 26 Names in Volumes 1to 36 Carcinogenicity: An Updating 1982; 199 pages; ISBN 92 832 14056 1985; 259 pages; ISBN 92 832 14080 of 'ARC Monographs (out of print) (out of print) Volumes 1 to 42
1987; 440 pages; ISBN 92 832 1411 0 Supplement No.4 Chemicals, Industrial Processes and Industries Associated with Cancer in Humans (Volumes 1 to 29) 1982:292 pages; 1SВN 92 832 14072 (out of print)
Supplement No. 6 Genetic and Related Effects: An Updating of Selected 'ARC Monographs from Volumes Ito 42 1987; 729 pages; ISBN 92 832 1409 9
Supplement No. 8 Cross Index of Synonyms and Trade Names in Volumes 1 to 46 1989; 346 pages; ISBN 92 832 1417 X
'ARC Scientific Publications
No. 1 Liver Cancer 1971; 176 pages; ISBN 0 19 723000 8
No. 2 Oncogwesis and Herpesviruses Edited by P.M. Biggs, G. de Thé and L.N. Payne 1972; 515 pages; ISBN 0 19 723001 6
No. 3 N-Nitroso Compounds: Analysis and Formation Edited by P Bogovski, R. Preussman and E.A. Walker 1972; 140 pages; ISBN 0 19 723002 4
No. 4 Transplacental Carcinogenesis Edited by LTomatis and U. Mohr 1973; 181 pages; ISBN 0 1 9 7230032
No. 6/6 Pathology of Tumours in Laboratory Animals. Volume 1: Tumours of the Rat Edited by V.S. iurusov 197311976; 533 pagis; ISBN 92 832 14102
No. 7 Host Environment Interactions in the Etiology of Cancer in Man Edited by Ft. Doll and I. Vodopija 1973; 464 pages; ISBN 0 19 723006 7
No. 8 Biological Effects of Asbestos Edited by P. Bogovski, J.C. Gilson, V. Timbrell and J.C. Wagner 1973; 346 pages; ISBN 0 197230075
Nn. 9 N-Nitroso Compounds in the Environment Edited by P. Bogovski and E.A. Walker 1974; 243 pages; ISBN 0 19 723008 3
No. 10 Chemical Carcinogenesis Essays Edited by R. Montesano and L. Tomatis 1974; 230 pages; ISВN 0 19723009 1
No. 11 Oncogenesis and Herpes-viruses Il Edited by G. de-Thé, M.A. Epstein and H.zur Hausen 1975; Two volumes, 511 pages and 403 pages; ISBN 0 19 723010 5
No. 12 screening Tests in Chemical Carcirsogenesis Edited by R. Montesano, H. Bartsch and L. Tomatis 1976; 666 pages; ISBN 0 19 723051 2
No. 13 Environmental Pollution and Carcinogenic Risks Edited by C. Rosenfeld and W. Davis 1975; 441 pages; ISBN 0197230121
No. 14 Environmental N-Nifroso Compounds. Analysis aid Formation Edited by E.A. Walker, P. Bogovski and L. Griciute 1976; 512 pages; ISBN 0 19723013 X
No. 15 Cancer Incidence in Five Continents, Volume III Edited by J.A.H. Waterhouse, C. Muir, R Correa and J. Powell 1976; 584 pages; ISBN 0 19 723014 8
No. 16 Air Pollution and Cancer in Man Edited by U. Mohr, D. Schmdhl and L. Tomatis 1977; 328 pages; ISBN 0 19 723015 6
No. 17 Directory of On-Going Research in Cancer Epidemiology 1977 Edited by C.S. Muir and G. Wagner 1977:599 pages; ISBN 92 832 11170 (out of print)
No. 18 Environmental Carcinogens. Selected
Methods of Analysis. Volume 1: Analysis of Volatile Nitrosamines iп Food Editor-in-Chief: H. Egan 1978:212 pages; ISBN 0 197230172
No. 19 Environmental Aspects of N-Nitroso Compounds Edited by E.A. Walker, M. Castegnaro, L. Griciute and R.E. Lyle 1978; 561 pages; ISBN 0 19 723018 0
No. 20 Nasopharyngeal Carcinoma: Etiology and Control Edited by G. de Thé and Y. Ito 1978; 606 pages; ISBN 0 19 723019 9
No. 21 Cancer Registration and its Techniques Edited by R. MacLennan, C. Muir, R. Steinitz and A. Winkler 1978; 235 pages; ISBN 0 19 7230202
No. 22 Environmental Carcinogens: selected Methods of Analysis. Volume 2: Methods for the Measurement of Vinyl Chloride in Pofy(vinyl chloride), Air, Water and Foodstuffs EdItor-in-Chief: H. Egan 1978; 142 pages; ISBN 0 19 723021 0
No. 23 Pathology of Tumours in Laboratory Animais. Volume II: Tumours of the Mouse Editor-in-Chief: V.S. Turusov 1979; 669 pages; ISBN 0 19 723022 9
No. 24 Oncogenesis and Herpesviruses Ill Edited by G. de-Thé, W. lenin and F. 'app 1978; Part I: 580 pages, Part II: 512 pages; ISBN 0 197230237
xi

No. 25 Carcinogenic Risk: Strategies for Intervention Edited by W. Davis and C. Rosenfeld 1979; 280 pages; ISBN 0 19 723025 3
No, 26 Directory of On-going Research in Cancer Epidemiology 1978 Edited by C.S. Muir and G. Wagner 1978; 550 pages; ISBN 0 19 723026 (out of print)
No.27 Molecular and Cellular Aspects of Carcinogen Screening Tests Edited by R. Montesano, H. Bartsch and L. Tomatis 1980; 372 pages; ISBN 0 19 723027 X
No.28 Directory of On-going Research in Cancer Epidemiology 1979 Edited by C.S. Muir and G. Wagner 1979; 672 pages; ISBN 92 832 11286 (out of print)
No. 29 Environmental Carcinogens. Selected Methods of Analysis. Volume 3: Analysis of Polycyclic Aromatic Hydrocarbons in Environmental Samples Editor-in-Chief: H. Egan 1979; 240 pages; ISBN 0197230288
No. 30 Biological Effects of Mineral Fibres Editor-in-Chief: J.C. Wagner 1980; Two volumes, 494 pages & 513 pages; ISBN 0 19 723030 X
No. З 1 N-Nitroso Compounds: Analysis, Formation and Occurrence Edited by E.A. Walker, L. Griciute, M. Castegnaro and M. Bbrzsbnyi 1980; 835 pages; ISBN 0 19 723031 8
No. 32 Statistical Methods in Cancer Research.Volume 1: The Analysis of Case-control Studies By N.E. Broslow and N.Е. Day 1980; 338 pages; ISBN 92 832 0132 9
No. 33 Handling Chemical Carcinogens in the Laboratory Edited by R. Montesano, H. Bartsch, E. Boyland, G. Della Porta, L. Fishbeio, R.A. Griesemer, A.B. Swan and L. Tomatis 1979:32 pages; ISBN 0 19 723033 4 (out of print)
No. 34 Pathology of Tumours in Laboratory Animals. Volume III: Tumours of the Hamster Editor-in-Chief: V.S. Turusov 1982; 461 pages; ISBN 0 19 723034 2
No. 35 Directory of On-going Research in Cancer Epidemiology 1980 Edited by C.S. Muir and G. Wagner 1980; 660 pages; ISBN 0197230350 (out of print)
No. 36 Cancer Mortality by Occupation and Social Class 1851--1971 Edited by W.P.D. Logan 1982; 253 pages; ISBN 0 19 723036 9
No. 37 Laboratory Decontamination and Destruction of Af[atoxins B1, B2, G1, G2 in Laboratory Wastes Edited by M. Castegnaro, D.C. Hunt, E.B. Sansone, P.L. Schul!er, M.G. Siriwardana, G.M. Telling, H.P. van Egmond and E.A. Walker 1980; 56 pages; ISBN 0 19 7230377
Ni. 38 Directory of On-going Research in Cancer Epidemiology 1981 Edited by C.S. Muir arid G. Wagner 1981; 696 pages; ISBN 0 19 723038 5 (out of print)
No. 39 Host Factors in Human Carcinogenesis Edited by H. Bartsch and B. Armstrong 1982; 583 pages; ISBN 0 19 723039 3
No. 40 Environmental Carcinogens: Selected Methods of Analysis. Volume 4: Some Aromatic Amines and Azo Dyes in the General and Industrial Environment Edited by L. Fishbein, M. Castegnard, I.K. O'Neill and H. Bartsch 1981; 347 pages; ISBN 0 19 723040 7
Ni. 41 N-Nilroso Compounds: Occurrence and Biological Effects Edited by H. Bartsch, K. O'Neill, M. Castegnaro and M. Okada 982;755 pages; ISBN 0 19 723041 5
No. 42 Cancer Incidence in Five Continents Volume IV
Edited by J. Waterhouse, C. Muir, K. Shanmugaratnam and J. Powell 1982; 811 pages; ISBN 0 19 723042 3
No. 43 Laboratory Decontamination and Destruction of Carcinogens in Laboratory Wastes: Some N-Nitrosamines Edited by M. Castegnaro, G. Eisonbrand, G. Ellen, L. Keefer, D. Klein, E.B. Sansone, D. Spincer, G. Telling and K. Webb 1982; 73 pages; 1SBN 0 19 723043
No. 44 Environmental Carcinogens: Selected Methods of Analysis. Volume 5: Some Mycotoxins Edited by L. Stoloff, M. Castegnaro, P. Scott, 1.K. O'Neill and H. Bartsch 1983; 455 pages; [SBN 0 19 723044 X
No. 45 Environmental Carcinogens: Selected Methods of Analysis. Volume 6: N-Nitroso Compounds Edited by R. Preussmann, I.K. O'Neill, G. Eisenbrand, B. SpiegeihaIder and H. Bartsch 1983; 508 pages; ISBN 0 19 723045 8
No. 46 Directory of On-going Research in Cancer Epidemiology 1982 Edited by 0.5. Muir and G. Wagner 1982; 722 pages; ISBN 0 19 723046 6 (out of print)
No. 47 Cancer Incidence in Singapore 1968-1977 Edited by K. Shanmugaratnam, H.P. Lee and N.E. Day 1983; 171 pages; ISBN 0 19 7230474
No. 48 Cancer Incidence in 'he USSR (2nd Revised Edition) Edited by N.P. Napalkov, G.F Tserkovпц V.M. Merabishvili, D.М. Parkin, M. Smans and C.S. Muir 1983; 75 pages; ISBN 0 19 723048 2
No. 49 Laboratory Decontamination and Destruction of Carcinogens in Laboratory Wastes: Some Polycyclic Aromatic Hydrocarbons Edited by M. Castegnaro, G. Grimmer, О. Hutzinger, W. Karchвr, H. Kunte, M. Lafontaine, H.C. Van der P1as, E.B. Sansone and S.P. Tucker 1983; 87 pages; ISBN 0 19 723049 0

No. 50 Directory of On-going Research in Cancer Epidemiology 1983 Edited by C.S. Muir and G. Wagner 1983; 731 pages; ISBN 0 19 723050 4 (out of print)
No. 51 Modulators of Experimental Carcinogenesis Edited by V. Turusov and R. Montesano 1983; 307 pages; ISBN 0 19 723060 1
No.52 Second Cancers in Relation to Radiation Treatment for Cervical Cancer: Results of a Cancer Registry Collaboralion Edited by N.E. Day and J.C. Bocce, Jr 1984; 207 pages; ISBN 0 19 723052 0
No. 53 Nickel in the Human Environment Editor-in-Chief: F.W. Sunderman, Jr 1984; 529 pages; ISBN 0 19 723059 8
No. 54 Laboratory Decontamination and Destruction of Carcinogens in Laboratory Wastes: some Hydrazines Edited by M. Castegnaro, G. Ellen, M. Lafontaine, H.C. van der Fias, E.B. Sansone and S.P. Tucker 1983; 87 pages; ISBN 0 19 723053
No. 55 Laboratory Decontamination and Destruction of Carcinogens in Laboratory Wastes: Some N-Nftrosamides Edited by M. Castegnaro, M. Bernard, L.W. van Broekhoven, D. Fine, R. Massey, E.B. Sansone, P.L.R. Smith, B. Spiegelhalder, A. Stacchini, G. Telling and J.J. Vallon 1984; 66 pages; ISBN 0 19 7230547
No. 56 Models, Mechanisms and Etiology of Tumour Promotion Edited by M. Bбrzsôпуi, N.E. Day, K. Lapis and H. Yamasaki 1984; 532 pages; ISBN 019 723058 X
No. 57 N-Nitroso Compounds: Occurrence, Biological Effects and Relevance to Human Cancer Edited by I.K. O'Neill, R.C. von Borstel, C.T. Miller, J. Long and H. Bartsch 1984; 1013 pages; ISBN 0 19 723055 5
No 58 Age-related Factors in Carcinogenesis Edited by A. Likhachev, V. Anisimov and
R. Montesano 1985; 288 pages; ISBN 92 832 11588
No. 59 Monitoring Human Exposure to Carcinogenic aid Mutagenic Agents Edited by A. Berlin, M. Draper, K. Hemminki and H. Valuo 1984; 457 pages; ISBN 0 19 723056 3
No. 60 Burkitt's Lymphoma: A Human Cancer Model Edited by G. Lenoir, G. O'Coпor and C.L.M. Olweny 1985; 484 pages; ISBN 0 19 723057 1
No. 61 Laboratory Decontamination and Destruction of Carcinogens in Laboratory Wastes: Some Haloethers Edited by M. Castegnaro, M. Alvarez, M. lovu, E.B. Sansone, G.M. Telling and D.Т. WIHiama 1985; 55 pages; ISBN 0 19 723061 X
No. 62 Directory of On-going Research in Cancer Epidemiology 1984 Edited by C.S. Muir and G. Wagner 1984; 717 pages; ISBN 0197230628 (out of print)
No. 63 Virus-associated Cancers in Africa Edited by A.O. Williams, G.T. l'Conor, G.B. de Thé and C.A. Johnson 1984; 773 pages; ISBN 0 19 723063 6
No. 64 Laboratory Decontamination and Destruction of Carcinogens in Laboratory Wastes: Some Aromatic Amines and 4- Nitrobiphenyl Edited by M. Castegnaro, J. Barek, J. Dennis, G. Ellen, M. Klibanov, M. Lafontaine, R. Mitchum, P. van Roosmalen, E.B. Sansone, L.A. Sternson and M. Vah1 1985; 84 pages; ISBN: 92 832 11642
No. 65 Interpretation of Negative Epidemiological Evidence for Carcinogenicity Edited by N.J. Wald and R. Doll 1985; 232 pages; ISBN 92 832 11650
No. 66 The Role of the Registry in Cancer Control Edited by D.M. Parkin, G. Wagner and C.S. Muir 1985; 152 pages; ISBN 92 832 0166 3
No. 67 Transformation Assay of Established Cell Lines: Mechanisms and Application Edited by T Kakunaga and H. Yamasaki 1985; 225 pages; ISBN 92 832 11677
No. 68 Environmental Carcinogens: Selected Methods of Analysis. Volume 7: Some Volatile Halogenated Hydrocarbons Edited by L. Fishbein and I.K. l'Neii 1985; 479 pages; ISBN 92 832 11685
No. 69 Directory of On-going Research in Cancer Epidemiology 1985 Edited by C.S. Muir and G. Wagner 1985; 745 pages; ISBN 92 823 11693 (out of print)
No. 70 The Role of Cyclic Nucleic Acid Adducts in Carcinogenesis and Mutagenesis Edited by B. Singer and H. Bartsch 1986; 467 pages; ISBN 92832 11707
No. 71 Environmental Carcinogens: Selected Methods of Analysis. Volume 8: Some Metals: As, Be, Cd, Cr, Ni, Pb, Se, Zn Edited by I.K. O'Neill, R Schuller and L. Fishbein 1986; 485 pages; ISBN 92 832 1171 5
No. 72 Atlas of Cancer in Scotland,197Cx19B0: Incidence and Epidemiological Perspective Edited by I. Kemp, P. Boyle, M. Smans and C.S. Muir 1985; 285 pages; ISBN 92 832 1172 3
No. 73 Laboratory Decontamination and Destruction of Carcinogens in Laboratory Wastes: Some Antineoplastic Agents Edited by M. Castegnaro, J. Adams, M.A. Armour, J. Barek, J. Benvenuto, C. Confalonieri, U. Golf, G. Telling 1985; 163 pages; ISBN 92 832 1173
No. 74 Tobacco: A Маjoг Inlerniational Health Hazard Edited by D. Zaridze aid R. Peto 1986; 324 pages; ISBN 92 832 1174 X
No. 75 Cancer Occurrence in Developing Countries Edited by D.M. Parkin 1986; 339 pages; ЭSBN 92 832 11758

No. 76 screening for Cancer of the Uterine Cervix Edited by M. Hakama, А.B. Miller and N.E. Day 1986; 315 pages; ISBN 9283211766
No. 77 Hexachlorobenzene: Proceedings of an International Symposium Edited by C.R. Morris and J.R.P. Cabra 1986; 668 pages; 1SВN 92 832 11774
No. 78 Carcinogenicity of A1kylating Cyloslatic Drugs Edited by D. Schmhl and J.M. Kaldor 1986; 337 pages; ISBN 9283211782
No. 79 Statistical Methods in Cancer Research. Volume III: The Design and Analysis of Long-term Animal Experiments By J.J. Gart, D. Krewski, RN. Lee, R.E.Taгone and J. Wahrendorf 1986; 213 pages; ISBN 92 832 11790
No. 80 Directory of On-going Research in Cancer Epidemiology 1966 Edited by C.S. Muir and G. Wagner 1986; 805 pages; ISBN 92 832 1180 4 (out of print)
No. 8i Environmental Carcinogens: Methods of Analysis and Exposure Measurement. Volume 9: Passive Smoking Edited by I.K. O'Neill, K.D. Brunnemani, B. Dodet and D. Hoffmann 1987; 383 pages; ISBN 92 В32 1181 2
No. 82 Statistical Methods in Cancer Research. Volume 11: The Design and Analysis of Cohort Studies By N.E. Breslow and N.E. Day 1987; 404 pages; ISBN 92 832 0182 5
No. 83 Long-term and Short-term Assays for Carcinogens: A Critical Appraisal Edited by R. Montesano, H. Bartsch, H. Vainio, J. Wilbourn and H. Yamasaki 1986; 575 pages; ISBN 92 832 11839
No. 84 The Relevance of N-Nitroso Compounds 10 Human Cancer: Exposure and Mechanisms Edited by H. Bartsch, I.K. O'Neill and R. Schulte-Hermалп 1987; 671 pages; ISBN 92 832 1 184 7
No. 85 Environmental Carcinogens: Methods of Analysis and Exposure Measurement. Volume 10: Benzene and Aikylated Benzenes Edited by L. Fishbein and I.K. O'Neill 1988; 327 pages; ISBN 92 832 11855
No. 86 Directory of On-going Research in Cancer Epidemiology 1987 Edited by D.M. Parkin and J. Wahrendort 1987; 685 pages; ISBN: 92 832 11863 (out of print)
No. 87 International Incidence of Childhood Cancer Edited by D.M. Parkin, C.A. Stiller, C.А. Bieber, G.J. Draper. B. Terracini and J.L. Young 1988; 401 page; 1SBN 92 832 1187 1 (out o1 print)
No. 88 Cancer Incidence in Five Continents, Volume V Edited by C. Muir, J. Waterhouse, T. Mack, J. Powell and S. Whelan 1987; 1004 pages; ISBN 92 832 1186 X
No. 89 Methods for Detecting DNA Damaging Agents in Humans: Applicatïons in Cancer Epidemiology and Prevention Edited by H. Bartsch, K. Hemminki and LK. O'Neill 1988; 518 pages; ISBN 92 832 11898 (out of print)
Ni. 90 Non-occupational Exposure to Mineral Fibres Edited by J. Bignon, J. Peto and R. Saracci 1989; 500 pages; ISBN 92 832 1190 1
No. 9 i Trends in Cancer Incidence in Singapore 1966-1982 Edited by H.E Lee, N.E. Day and K. Shanmugaratnam 1988; 160 pages; ISBN 92 832 1191 X
No. 92 Cell Differentiation, Genes and Cancer Edited by T. Kakunaga, T. Sugimura, L. Torahs and H. Yamasaki 1986; 204 pages; ISBN 92 832 11928
No. 93 Directory of On-going Research in Cancer Epidemiology 1988 Edited by M. Coleman and J. Wahrendorf 1988; 662 pages; ISBN 92 832 11936 (out of print)
No. 94 Human Papillomavirus and Cervical Cancer Edited by N. Munoz, EX. Bosch and O.M. Jensen 1989; 154 pages; ISBN 92 832 11944
No. 95 Cancer Registration: Principles and Methods Edited by O.M. Jensen, D.M. Parkin, R. MacLennan, C.S. Muir and R. Skeet 1991;296 pages; ISBN 92 832 1195 2
No. 96 Pen natal and Multigeneration Carcinogenesis Edited by N.P. Napalkov, J.M. Rice, L. Tomatis and H. Yamasaki 1989; 436 pages; 1S8N 92 832 11960
No. 97 Occupational Exposure to Silica and Cancer Risk Edited by L. Simonаtо, A.C. Fletcher, R. Saracci and T. Thomas 1990; 124 pages; ISBN 9283211979
No. 98 Cancer Incidence in Jewish Migrants 10 Israel, 1961-1981 Edited by R. Sleinitz, D.М. Parkin, J.L. Young, C.A. Bieber and L. Katz 1989; 320 pages; ISBN 92 832 11987
No. 99 Pathology of Tumours in Laboratory Animals, Second Edition, Volume 1,Tumours of the Rat Edited by V.S. Turusov and U. Mohr 1990; 740 pages; ISBN 92 832 11995 For Volumes 2 and 3 (Tumours of the Mouse and Tumours of the Hamster), see lАRC ScieпЁЮс Publications Nos. III апd 126.
No. 100 Cancer: Causes, Occurrence and Control Editor-in-Chief: L. Tornatis 1990; 352 pages; ISBN 92 832 01108
No. 101 Direclory of On-going Research in Cancer Epidemiology 1989-1990 Edited by M. Coleman and J. Wahrendorf 1989; 828 pages; ISBN 92 В32 2101 X
No. 102 Patterns of Cancer in Five Conlinents Edited by S.L. Whelan, D.M. Parkin and E. Masuyer 1990; 160 pages; ISBN 9263221028
xiv

No. 103 Evaluating Effectiveness of Primary Prevention of Cancer Edited by M. Hakama, V. Beral, J.W. Cullen and D.М. Parkin 1990; 206 pages; ISBN 92 632 21036
Na. 104 Complex Mixtures and Cancer Risk Edited by H. Vainio, M. 5orsa and A.J. McMichael 1996; 441 pages; ISBN 92 832 2104 4
No. 105 Relevance to Human Cancer of N-Nitroso Compounds, Tobacco Smoke and Mycotoxins Edited by 1.K.O'Nei1I, J. Chen and H. Bartsch 1991; 614 pages; ISBN 92 832 2105 2
No. 106 Atlas of Cancer Incidence In the Former German Democratic Republic Edited by W.H. Mehnert, M. Smans, C.S. Muir, M. Mühner and D. Schhn 1992; 384 pages; ISBN 92 832 21060
No. 107 Atlas of Cancer Mortality in the European Economic Community Edited by M. Smans, C. Мuir and P. Boyle 1992; 213 pages + 44 coloured maps; ISBN 92 832 2107 9
No. 108 Environmental Carcinogens: Methods of Analysis aid Exposure Measurement. Volume 11: Polychlorinated Dioxins and Dibenzofurans Edited by C. Rappe, H.R. Ruser, B. Dodet and 1K. O'Neill 1991; 400 pages; ISBN 92 832 2108 7
No. 109 Environmental Carcinogens: Methods of Analysis and Exposure Measurement. Volume 12: Indoor Air Edited by B. Seifert, H. van de Wie1, B. Dodet and I.K. O'Neill 1993; 385 pages; ISBN 92 832 2109 5
No. 110 Directory of On-going Research in Cancer Epidemiology 1991 Edited by М.R Coleman aid J. Wahrendo i 1991; 753 pages; ISBN 9263221109
No. 111 Pathology of Tumours in Laboratory Animals, Second Edition. Volume 2: Tumours of the Mouse Edited by V. Turusov and U. Mohr 1994; 800 pages; ISBN 92 832 2111 1
No. 112 Autopsy in Epidemiology and Medical Research Edited by E. Riboli and M. Delendi 1991;288 pages; ISBN 92 832 2112 5
No. 113 Laboratory Decontamination and Destruction of Carcinogens ïn Laboratory Wastes: Some Mycotoxins Edited by M. Castegnaro, J. Barek, J.M. Frémy, M. Lafontaine, М. MiragIia, E.B. Sansone and G.M. Telling 1991; 63 pages; ISBN 92 832 21 13 3
No. 114 Laboratory Decontamination and Destruction of Carcinogens in Laboratory Wastes: some Polycyclic Heterocyclic Hydrocarbons Edited by M. Castegnaro, J. Barek, J. Jacob, U. Kirso, M. Lafontaine, E.B. Sansone, G.M. Telling aid T. Vu Duc 1991; 50 pages; ISBN 92 832 2114 1
No. 115 Mycotoxins, Endemic Nephropathy and Urinary Tract Tumours Edited by M. Castegnaro, R. Plestina, G. Dirheimer, I.N. Chernozemsky and H. Bartsch 1991; 340 pages; ISBN 92 832 2115 X
No. 116 Mechanisms of Carcinogenesis in Risk Identification Edited by H. Vain ii, R Magee, D. McGregor and A.J. McMichael 1992; 615 pages; ISBN 92 832 21 16 8
No. 117 Directory of On-going Research in Cancer Epidemiology 1992 Edited by M. Coleman, E. Demaret and J. Wahrendorr 1992; 773 pages; ISBN 92 932 2117 6
No. 118 Cadmium in the Human Environment: Toxicity and Carcinogenicity Edited by G.F Nordberg, R.F.М. Herber and L. Alessio 1992; 470 pages; ISBN 92 832 2118 4
No. 119 The Epidemiology of Cervical Cancer and Human Papillomavirus Edited by N. Munoz, F.X. Bosch, K.V. Shah and A. Meheus 1992; 288 pages; ISBN 9283221192
No. 120 Cancer Incidence in Five Continents, Vol. VI Edited by D.M. Parkin, C.S. Muir, S.L. Whelan,
Y.T Gao, J. Ferlay and J. Powell 1992;1020 pages; ISBN 9283221206
No. 121 Time Trends in Cancer Incidence and Mortality By M. Coleman, J. Esiévе, P. 6amiecki, A. Arslan and H. Renard 1993; 820 pages; ISBN 92 832 2121 4
No. 122 International Classification of Rodent Tumours. Part 1. The Rat Editor-in-Chief: U. Mohr 1992-1996; 10 fascicles of 60-100 pages; ISBN 92 832 2122 2
No. 123 Cancer in Italian Migrant Populations Edited by M. Geddes, D.М. Parkin, M. Khlat, D. Balzi and E. Вuiattl 1993; 292 pages; ISBN 92 832 2123 0
No. 124 Posgabешng Methods for the Detection of DNA Damage Edited by D.H. Phillips, M. Castegnaro and H. Bartsch 1993; 392 pages; ISBN 92 832 2124 9
No. 125 DNA Adducts: Identification and Biological significance Edited by K. Hem minki, A. Dipple, D.E.G. Shuker, F.F. Kadlubar, D. Segerb5ck and H. Bartsch 1994; 478 pages; ISBN 92 832 2125 7
No. 126 Pathology of Tumours in Laboratory Animals, second Edition. Volume З: Tumours of the Hamster Edited by V Turosov and U. Mohr 1996; 464 pages; ISBN 92 832 2126 5
No. 127 Butadiene and Styrene: Assessment of Health Hazards Edited by M. Sorsa, K. Peltonen, H. Vainio and K. Hemminki 1993; 412 pages; ISBN 92 832 2127 3
No. 128 Statistical Methods in Cancer Research. Volume IV. Descriptive Epidemiology By J. Estève, E. Benhamou and L. Raymond 1994; 302 pages; ISBN 92 832 2128 1
No. 129 Occupalional Cancer in Developing Countries Edited by N. Pearce, E. Matos, H. Vainio, P. Boffetta and M. Kogevinas 1994;191 pages; ISBN 92 832 2129 X
xv

No. 130 Directory of On-going Research in Cancer Epidemiology 1994 Edited by R. 5ankaranarayanan, J. Wahrendorf and E. Détuaret 1994; 800 pages; ISBN 92 832 21303
No. 132 Survival of Cancer Patients in Europe. The EUBOCARE Study Edited by F. Berrino, M. Sant, A. Verdecchia, R. Capocaccia, T. Hakulinen and J. Estève 1995; 463 pages; ISBN 92 832 2132 X
No. 134 Atlas of Cancer Mortality in Central Europe W. Zatonski, J. Estéve, м. Smala, J. Tyczynski and P Boyle 1996; 300 pages; ISBN 92 832 21 34 6
No. 135 Methods for Investigating Localized Clustering of Disease Edited by ~.Е. Alexander and P. Boyle 1996; 235 pages; ISBN 92 832 21354
No. 1 Cancer in Costa Rica Edited by R. Sierra, R. Barrantes, G. Munoz Leiva, D.M. Parkin, C.A. Bieber and N. Munoz Calero 1988; 124 pages; ISBN 92 832 1412 9
No. 2 SEARCH: A Computer Package to Assist the Statistical Analysis of Case-Control Studies Edited by G.J. Macfarlane, P. Boye and P Maisonneuve 1991; 80 pages; ISBN 9283214137
No. 3 Cancer Registration in the European Economic Community Edited by M.P. Coleman and E. Démaret 1988; 188 pages; ISBN 92 832 14145
No. 4 Diet, Hormones and Cancer: Methodological Issues for Prospective Studies Edited by E. Riboli and R. Saracci 1988; 156 pages; ISBN 92 832 1415 3
No. 5 Cancer in the Philippines Edited by A.V. Laudtco, D. Esteban and D.M. Parkin 1989; 186 pages; ISBN 92 832 1416 1
No. 136 Chemoprovention in Cancer Control Edited by M. Hakama, V. Beral, E. Buiatti, J. Faivre and D.M. Parkin 1996; 160 pages; ISBN 92 832 2136 2
No, 137 Directory of On-going Research in Cancer Epidemiology 1996 Edited by R. San karanarayan, J. 'Naroridorf and E. Démaret 1996; 810 pages; ISBN 92 832 21370
No. 138 Social Inequalities and Cancer Edited by M. Kogevinas, N. Pearce, M. Susser and P. Boffetta 1997; 412 pages; ISBN 92 832 2138 9
No. 139 Principles of Chemoprevention Edited by B.W. Stewart, D. McGregor and P. Kleihues 1996; 358 pages; ISBN 92 83221397
IARC Technical Reports
No. 6 La genèse du Centre international de recherche sur le cancer By R. 5оhier and A.G.B. Sutherland 1990, 102 pages; ISBN 92 832 14188
No. 7 Epidémио1ogïe du cancer dans les pays de langue latine 1990, 292 pages; ISBN 92 832 1419 6
No. 8 Comparative Study of Anti-smoking Legislation in Countries of the European Economic Community By A. J. Sasco, R Dalla-Vorgia and R Van der Flat 1992; 82 pages; ISBN: 92 832 1421 8 Etude comparative des Législations de Contrôle du Tabagisme dans les Pays de la Communauté ëconomique еигорёеппе 1995; 82 pages; ISBN 92 832 2402 7
No. 9 Epidémiologie du cancer dans les pays de langue latine 1991; 346 pages; ISBN 92832 14234
No. 10 Manual for Cancer Registry Personne' Edited by D. Esteban, S. Whelan, A. Laudico and D.M. Parkin 1995; 400 pages; ISBN 92 832 14242
No, 140 Mechanisms of Fibre Carcinogenesis Edited by A.B. Kane, P Bofletta, R. Saracci and J.D. Wilbourn 1996; 135 pages; ISBN 92 832 21 40 0
No. 142 Application of Biomarkers to Cancer Epidemiology Edited by P. Toniolo, R Boffelta, D. Shuker, N. Rothman, B. Hulka and N. Pearce 1997; 336 pages; ISBN 92 832 2142
No. 143 Cancer Incidence in Five Continents, Vol. VIII Edited by D.M. Parkin, S.L. Whelan, J. Ferlay, L. Raymond and J. Young 1997; 1350 pages; ISBN 92 832 2143 5
No. 11 Nitroso Compounds: Biological Mechanisms, Exposures and Cancer Etiology Edited by I. O'Neill and H. Bartsch 1992; 150 pages; ISBN 92 832 1425 X
No, 12 Epidëmiologiе du cancer dans les pays de langue latine 1992; 375 pages; ISBN 92 832 14269
No. 13 Health, Solar UV Radiation and Environmental Change By A. Kricker, B.K. Armstrong, М.E. Jones and R.C. Burton 1993; 213 pages; ISBN 92 832 1427 7
No. 14 Еpidémiologie du cancer dans les pays de langue latine 1993; 400 pages; ISBN 92 832 14285
No. 15 Cancer in the African Population of Bulawayo Zimbabwe, 1963-1977 By M.E.G. Skinner, D.M. Parkin, А.P. Vizcaino and A. Ndhlovu 1993; 120 pages; ISBN 92 832 14293
Ni. 16 Cancer in Thailand 1984-1891 By V. Vatanasapt, N. Martn,
Xvi

H. Sriplung, K. Chindavi)ak, S. sontipong, S. Sriamporn, D.M. Parkin and J. Ferlay 1993; 164 pages; 15BN 92 832 14307
No. 18 Intervention Trials tar Cancer Prevention By E. Buiatti 1994:52 pages; ISBN 92 832 14323
No. 19 Comparability and Quality Control in Cancer Registration By D.M. Parkin, V.W. Chen, J. Ferlay, J. Galceran, H.H. Storm and S.L. Whelan 1994; 110 pages plus diskette; ISBN 92 832 1433 1
No. 20 Ep1dërmolоgie du cancer dans les pays de langue latine 1994; 346 pages; ISBN 92 832 1434 X
No. 21 CD Conversion Programs for Cancer By J. Ferlay 1994; 24 pages plus diskette; ISBN 92 832 1435 8 No. 22
Cancer in Tianjin By Q.S. Wang, P. Boffetta, M. Kogevinas and D.M. Parkin 1994; 96 pages; ISBN 92 832 1433 1
No. 23 An Evaluation Programme for Cancer Preventive Agents By Bernard W. Stewart 1995; 40 pages; ISBN 92 832 14382
No. 24 Peroxisome Proliferation and its Role in Carcinogenesis 1995; 85 pages; ISBN 92 832 1439 0
Ni. 25 Combined Analysis of Cancer Mortality in Nuclear Workers in Canada, the United Kingdom and the United States of America By E. Cardis, E.S. Gilbert, L. Carpenter, G. Howe, I. Kato, J. Fix, L. Salmon, G. Cowper, B.К. Armstrong, V. Beral, A. Douglas, S.A. Fry, J. Kaldor, C. Lavé, P.G. Smith, G. Voelz and L. Wiggs 1995; 160 pages; ISBN 92 832 1440 4
'ARC CaecerBase
No. 26 Mortalité par Cancer des lmigrés en France, 1979-1985 By C. Bouchardy, M. Khlat, i . Wanner and D.M. Parkin 1997; 150 pages; ISBN 92 832 2404 3
No. 27 Cancer in Three Generations of Young Israelis By J. lscovich and D.M. Parkin 1997; 150 pages; ISBN 92 832 2441 2
No. 29 International Classification of Childhood Cancer 1996 By E. Kramarova, C.A. Stiller, J. Ferlay, D.M. Parkin, G.J. Draper, J. Michaelis, J. Neglia and S. Qurechi 1996:48 pages + diskette; ISBN 92 832 14439
No. 1 EUCAN9о: Cancer in the European Union (Electronic Database with Graphic Display) By J. Ferlay, R.J. Black, P. Pisani, M.T. Valdivieso and D.M. Parkin 1996; Computer software on 3.5° IBM diskette + user's guide (50 pages); ISBN 92 832 1450 1
No. 2 CI5VI1 Electronic Database of Cancer Incidence in Five Continents. Vol.I1 By J. Ferlay, R.J. Black, S.L. Whelan and D.M. Parkin 1997; Computer sot iware on 3.5" IBM diskettes + user's guide (c. 48 pages); ISBN 92 832 1449 8
All 'ARC Publications are available directly from IARCPress,150 Cours Albert Thomas, F-69372 Lyon cedex 08, France (Fax: +33 4 72 73 83 02; E-mail: [email protected]).
'ARC Monographs and Technical Reports are also available from the World Health Organization Distribution and Salвs, CH-1211 Geneva 27 (Fax: +41 22 791 4857) and from WHO Sales Agents worldwide.
'ARC 5c1entifk Publications are also available from Oxford University Press, Walton Street, Oxford, UK 0X2 GDP (Fax: X44 1865 267782).
Related Documents