Resource Application of a Translational Profiling Approach for the Comparative Analysis of CNS Cell Types Joseph P. Doyle, 1,4 Joseph D. Dougherty, 1,4 Myriam Heiman, 2 Eric F. Schmidt, 1 Tanya R. Stevens, 1 Guojun Ma, 1 Sujata Bupp, 1 Prerana Shrestha, 1 Rajiv D. Shah, 1 Martin L. Doughty, 3 Shiaoching Gong, 1,3 Paul Greengard, 2 and Nathaniel Heintz 1,3, * 1 Laboratory of Molecular Biology, Howard Hughes Medical Institute 2 Laboratory of Molecular and Cellular Neuroscience 3 GENSAT Project The Rockefeller University, 1230 York Avenue, New York, NY 10065, USA 4 These authors contributed equally to this work *Correspondence: [email protected] DOI 10.1016/j.cell.2008.10.029 SUMMARY Comparative analysis can provide important insights into complex biological systems. As demonstrated in the accompanying paper, translating ribosome affin- ity purification (TRAP) permits comprehensive stud- ies of translated mRNAs in genetically defined cell populations after physiological perturbations. To es- tablish the generality of this approach, we present translational profiles for 24 CNS cell populations and identify known cell-specific and enriched tran- scripts for each population. We report thousands of cell-specific mRNAs that were not detected in whole-tissue microarray studies and provide exam- ples that demonstrate the benefits deriving from comparative analysis. To provide a foundation for further biological and in silico studies, we provide a resource of 16 transgenic mouse lines, their corre- sponding anatomic characterization, and transla- tional profiles for cell types from a variety of central nervous system structures. This resource will enable a wide spectrum of molecular and mechanistic stud- ies of both well-known and previously uncharacter- ized neural cell populations. INTRODUCTION The histological, molecular, and biochemical complexities of the mammalian brain present a serious challenge for mechanistic studies of brain development, function, and dysfunction. To pro- vide a foundation for these studies, we applied several classical principles to the exploration of anatomical and functional diver- sity in the mouse central nervous system (CNS). First, as exem- plified by Ramon y Cajal, detailed comparative analysis of myriad cell types can permit strong inferences about their specific con- tributions to CNS function (Ramon y Cajal et al., 1899). Second, as demonstrated from invertebrate studies, a deep understand- ing of the contributions of specific cells to behavior can best be achieved if one has reproducible, efficient genetic access to these cell populations in vivo (Bargmann, 1993; Zipursky and Rubin, 1994). Third, as illustrated by detailed studies of signal transduction in striatal medium spiny neurons (Greengard, 2001; Svenningsson et al., 2004), the highly specialized proper- ties of even closely related neurons arise from the combined actions of their many protein components. Previously, we have broadly applied the BAC transgenic strat- egy (Heintz, 2004; Yang et al., 1997) to provide high-resolution anatomical data and BAC vectors for genetic studies of morpho- logically defined cells in the CNS (Gong et al., 2003). In the accompanying paper (Heiman et al., 2008), we have reported the development of the TRAP methodology for the discovery of the complement of proteins synthesized in any genetically de- fined cell population. Here, we describe the generation of addi- tional bacTRAP transgenic mice and translational profiles for 24 distinct cell populations, including all of the major cerebellar cell types. We also demonstrate some of the analytical tools that can be employed for comparative analysis of selected cell types and illustrate as an example of this analysis the many features of spinal motor neurons that can be discovered using this approach. As anticipated in the studies of Heiman et al. (2008), this resource will allow molecular phenotyping of CNS cell types at specified developmental stages, and in response to a variety of pharmacological, genetic or behavioral alterations. The mice and data we present here confirm the generality of the TRAP approach and provide an important new resource for studies of the molecular basis for cellular diversity in the mouse brain. RESULTS Selection of BAC Drivers to Target Specific CNS Cell Types As illustrated by Heiman et al. (2008), the TRAP methodology requires accurate targeting of the EGFP-L10a ribosomal fusion Cell 135, 749–762, November 14, 2008 ª2008 Elsevier Inc. 749

Welcome message from author
This document is posted to help you gain knowledge. Please leave a comment to let me know what you think about it! Share it to your friends and learn new things together.
Transcript
Resource
Application of a TranslationalProfiling Approach for the ComparativeAnalysis of CNS Cell TypesJoseph P. Doyle,1,4 Joseph D. Dougherty,1,4 Myriam Heiman,2 Eric F. Schmidt,1 Tanya R. Stevens,1 Guojun Ma,1
Sujata Bupp,1 Prerana Shrestha,1 Rajiv D. Shah,1 Martin L. Doughty,3 Shiaoching Gong,1,3 Paul Greengard,2
and Nathaniel Heintz1,3,*1Laboratory of Molecular Biology, Howard Hughes Medical Institute2Laboratory of Molecular and Cellular Neuroscience3GENSAT Project
The Rockefeller University, 1230 York Avenue, New York, NY 10065, USA4These authors contributed equally to this work*Correspondence: [email protected]
DOI 10.1016/j.cell.2008.10.029
SUMMARY
Comparative analysis can provide important insightsinto complex biological systems. As demonstrated inthe accompanying paper, translating ribosome affin-ity purification (TRAP) permits comprehensive stud-ies of translated mRNAs in genetically defined cellpopulations after physiological perturbations. To es-tablish the generality of this approach, we presenttranslational profiles for 24 CNS cell populationsand identify known cell-specific and enriched tran-scripts for each population. We report thousandsof cell-specific mRNAs that were not detected inwhole-tissue microarray studies and provide exam-ples that demonstrate the benefits deriving fromcomparative analysis. To provide a foundation forfurther biological and in silico studies, we providea resource of 16 transgenic mouse lines, their corre-sponding anatomic characterization, and transla-tional profiles for cell types from a variety of centralnervous system structures. This resource will enablea wide spectrum of molecular and mechanistic stud-ies of both well-known and previously uncharacter-ized neural cell populations.
INTRODUCTION
The histological, molecular, and biochemical complexities of the
mammalian brain present a serious challenge for mechanistic
studies of brain development, function, and dysfunction. To pro-
vide a foundation for these studies, we applied several classical
principles to the exploration of anatomical and functional diver-
sity in the mouse central nervous system (CNS). First, as exem-
plified by Ramon y Cajal, detailed comparative analysis of myriad
cell types can permit strong inferences about their specific con-
tributions to CNS function (Ramon y Cajal et al., 1899). Second,
as demonstrated from invertebrate studies, a deep understand-
ing of the contributions of specific cells to behavior can best be
achieved if one has reproducible, efficient genetic access to
these cell populations in vivo (Bargmann, 1993; Zipursky and
Rubin, 1994). Third, as illustrated by detailed studies of signal
transduction in striatal medium spiny neurons (Greengard,
2001; Svenningsson et al., 2004), the highly specialized proper-
ties of even closely related neurons arise from the combined
actions of their many protein components.
Previously, we have broadly applied the BAC transgenic strat-
egy (Heintz, 2004; Yang et al., 1997) to provide high-resolution
anatomical data and BAC vectors for genetic studies of morpho-
logically defined cells in the CNS (Gong et al., 2003). In the
accompanying paper (Heiman et al., 2008), we have reported
the development of the TRAP methodology for the discovery of
the complement of proteins synthesized in any genetically de-
fined cell population. Here, we describe the generation of addi-
tional bacTRAP transgenic mice and translational profiles for
24 distinct cell populations, including all of the major cerebellar
cell types. We also demonstrate some of the analytical tools
that can be employed for comparative analysis of selected cell
types and illustrate as an example of this analysis the many
features of spinal motor neurons that can be discovered using
this approach.
As anticipated in the studies of Heiman et al. (2008), this
resource will allow molecular phenotyping of CNS cell types at
specified developmental stages, and in response to a variety
of pharmacological, genetic or behavioral alterations. The mice
and data we present here confirm the generality of the TRAP
approach and provide an important new resource for studies
of the molecular basis for cellular diversity in the mouse brain.
RESULTS
Selection of BAC Drivers to Target Specific CNS CellTypesAs illustrated by Heiman et al. (2008), the TRAP methodology
requires accurate targeting of the EGFP-L10a ribosomal fusion
Cell 135, 749–762, November 14, 2008 ª2008 Elsevier Inc. 749
protein to desired CNS cell types and affinity purification of cell-
specific polysomal RNAs, which can then be analyzed with
microarray technology. We selected BACs reported by the
GENSAT project to specifically target a wide range of neurons
and glia from different structures throughout the CNS, including
BAC drivers expected to target less-well-defined populations
(http://www.gensat.org/). BAC transgenic lines generated for
the TRAP methodology, with the EGFP-L10a transgene, are
referred to here as bacTRAP lines.
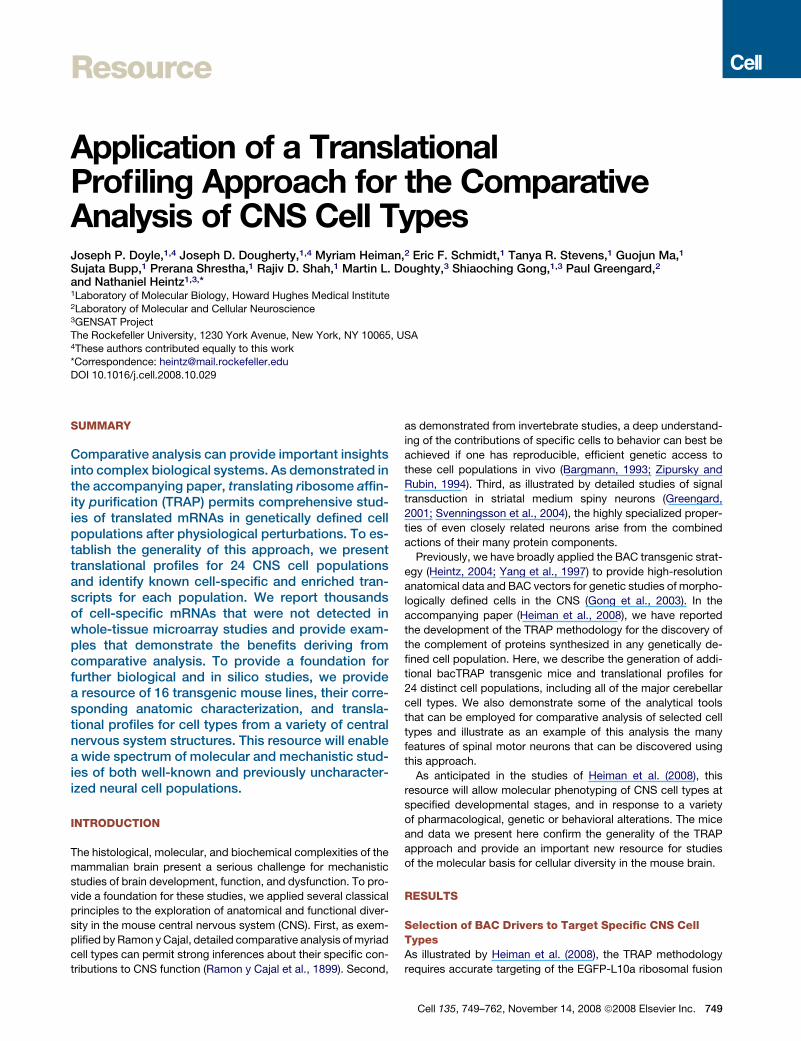
Anatomic Characterization of bacTRAP TransgenicMouse LinesTo ensure that expression of the EGFP-L10a fusion protein is ac-
curate, and to clearly define the cell types to be further analyzed
by TRAP, we conducted detailed anatomic studies. For each
line, transgene expression was carefully assayed by immunohis-
tochemistry (IHC) with an antibody against enhanced green
fluorescent protein (EGFP) (Figure 1). The regions covered in
this survey include cerebellum (panels 1–9), spinal cord (10),
basal forebrain and corpus striatum (11–14), brainstem (15),
and cerebral cortex (16–25).
For well-characterized cell types, confirmation of transgene
targeting was straightforward. For example, one can easily iden-
tify Purkinje cells (Pcp2, panel 1), granule cells (Neurod1, panel
2), Golgi neurons (Grm2, panel 3), and Bergmann glia (Sept4,
panel 8) on the basis of their morphology and position in the cer-
Figure 1. bacTRAP Lines Express the
EGFP-L10a Transgene in Specific CNS Cell
Populations
DAB immunohistochemistry with anti-EGFP anti-
body on each mouse line reveals a unique and
specific pattern of expression for the EGFP-L10a
transgene. Panels (103) show the morphology
and localization of cell types expressing the trans-
gene, and insets show the location of the panel, for
cerebellar (1–9), spinal cord (10), striatal and basal
forebrain (11–14) brainstem (15), and cortical
(16–25) cell types. A key for all cell types is in
Figure 2A. Dashed lines (panels 16–25) indicate
corpus callosum.
ebellum. Two points can be made from
this analysis. First, the expression of the
EGFP-L10a transgene from each BAC
driver is correct, conforming both to the
published literature and to the GENSAT
atlas. Second, the cytoplasmic distribu-
tion of the EGFP-L10a fusion protein, al-
though more limited than that of soluble
EGFP, provides sufficient morphological
detail to unambiguously identify well-
described CNS cell types.
However, in many cases, cell identity
cannot be assigned by morphology and
regional position alone. Therefore, we
confirmed the presumed cellular identity
using double immunofluorescence (IF)
for the EGFP-L10a fusion protein and
cell type-specific markers (Figure 2). In most cases, these
studies established that any further analyses would be restricted
to a well-defined cell population, such as Purkinje cells (Fig-
ure 2B), Golgi cells (Figure 2E), or glial cell types, including
astrocytes (Aldh1L1), mature oligodendrocytes (Cmtm5), and
a mixed oligodendroglial line that included mature oligodendro-
cytes and oligodendrocyte progenitors (Olig2) (Figure S1 avail-
able online).
These studies also identified mouse lines in which the trans-
gene is expressed in two or more cell types. For example, the
IF analysis of the Lypd6 line (Figure 2D) revealed that EGFP-
L10a is found in all Pvalb-positive and NeuN-negative interneu-
rons of the cerebellar molecular layer, suggesting that this line
targets both stellate and basket cells. Also, in certain lines, it is
apparent that the transgene is expressed in only a subset of
a particular cell type. For instance, in the Grp line, the EGFP-
L10a fusion protein is restricted to the subpopulation of unipolar
brush cells (Nunzi et al., 2002) that are immunoreactive for Grm1
but not Calb2 (calretinin) (Figure 2F).
Transgenic lines that express as anticipated from GENSAT,
but do not conform to readily identified cell types, were also
analyzed by IF analysis to provide data concerning the broad
classification of cell populations targeted. For example, in the
cerebral cortex of the Cort line, Calb1 was detected in nearly
50% of EGFP-L10a-positive cells, Pvalb was found in less than
5% of these cells, and Calb2 was not detected (data not shown).
750 Cell 135, 749–762, November 14, 2008 ª2008 Elsevier Inc.
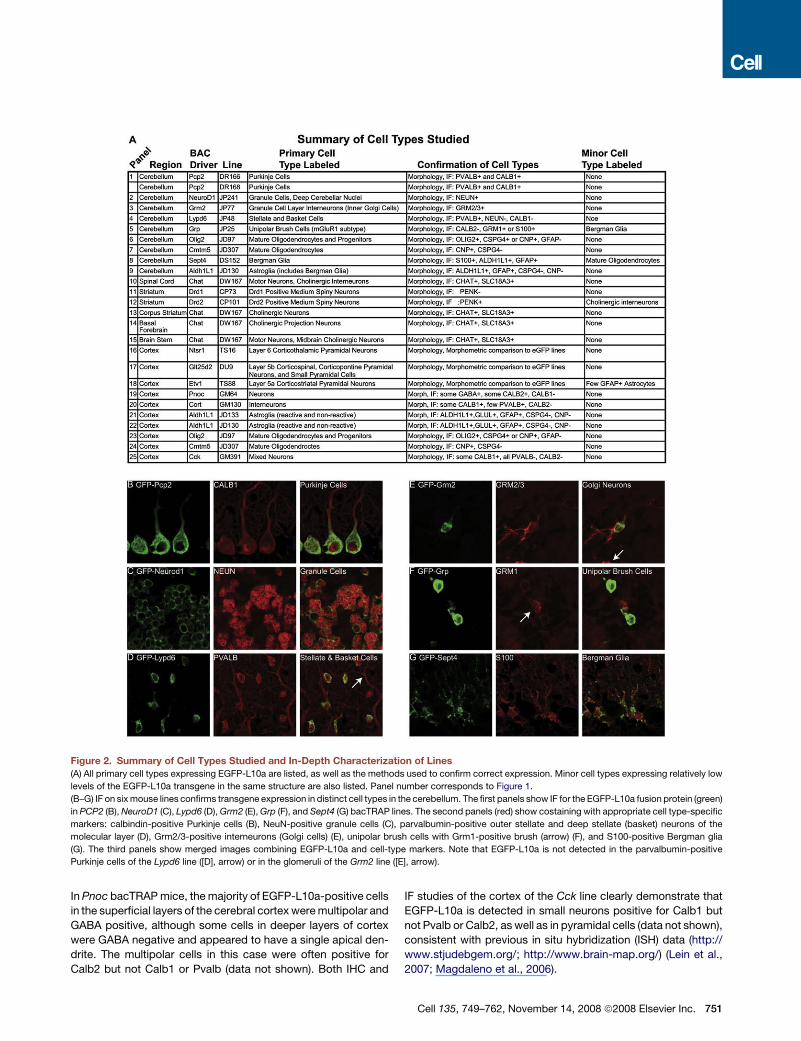
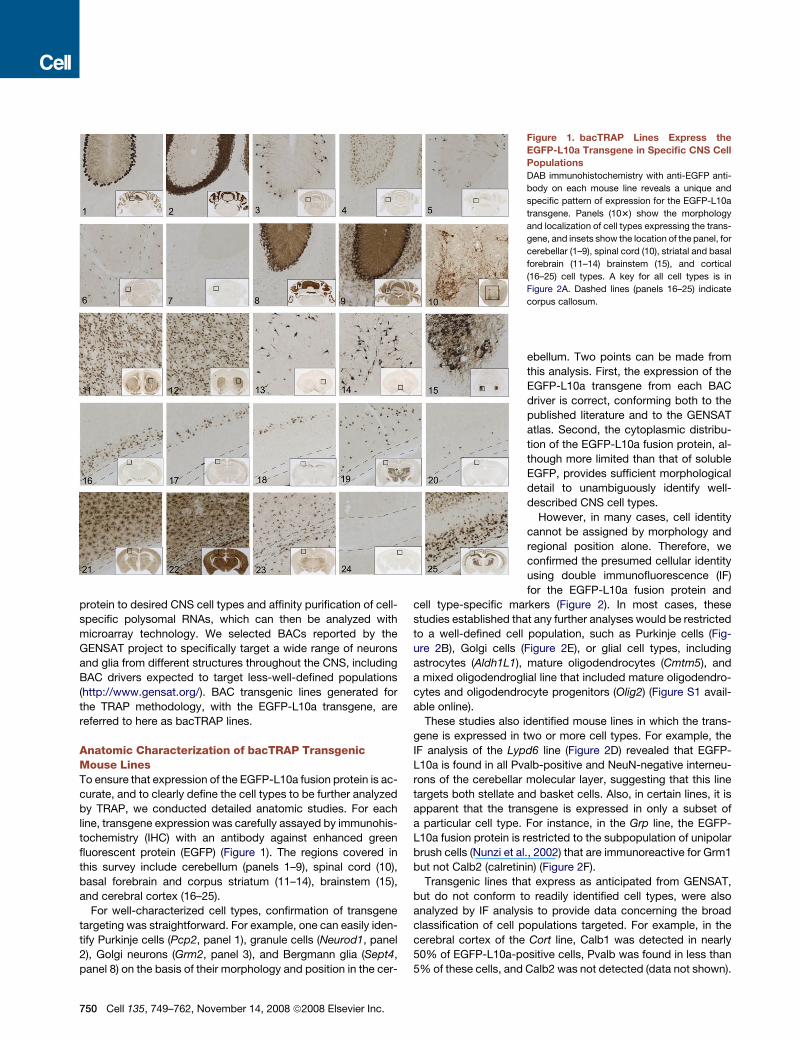
Figure 2. Summary of Cell Types Studied and In-Depth Characterization of Lines
(A) All primary cell types expressing EGFP-L10a are listed, as well as the methods used to confirm correct expression. Minor cell types expressing relatively low
levels of the EGFP-L10a transgene in the same structure are also listed. Panel number corresponds to Figure 1.
(B–G) IF on six mouse lines confirms transgene expression in distinct cell types in the cerebellum. The first panels show IF for the EGFP-L10a fusion protein (green)
in PCP2 (B), NeuroD1 (C), Lypd6 (D), Grm2 (E), Grp (F), and Sept4 (G) bacTRAP lines. The second panels (red) show costaining with appropriate cell type-specific
markers: calbindin-positive Purkinje cells (B), NeuN-positive granule cells (C), parvalbumin-positive outer stellate and deep stellate (basket) neurons of the
molecular layer (D), Grm2/3-positive interneurons (Golgi cells) (E), unipolar brush cells with Grm1-positive brush (arrow) (F), and S100-positive Bergman glia
(G). The third panels show merged images combining EGFP-L10a and cell-type markers. Note that EGFP-L10a is not detected in the parvalbumin-positive
Purkinje cells of the Lypd6 line ([D], arrow) or in the glomeruli of the Grm2 line ([E], arrow).
In Pnoc bacTRAP mice, the majority of EGFP-L10a-positive cells
in the superficial layers of the cerebral cortex were multipolar and
GABA positive, although some cells in deeper layers of cortex
were GABA negative and appeared to have a single apical den-
drite. The multipolar cells in this case were often positive for
Calb2 but not Calb1 or Pvalb (data not shown). Both IHC and
IF studies of the cortex of the Cck line clearly demonstrate that
EGFP-L10a is detected in small neurons positive for Calb1 but
not Pvalb or Calb2, as well as in pyramidal cells (data not shown),
consistent with previous in situ hybridization (ISH) data (http://
www.stjudebgem.org/; http://www.brain-map.org/) (Lein et al.,
2007; Magdaleno et al., 2006).
Cell 135, 749–762, November 14, 2008 ª2008 Elsevier Inc. 751
Figure 3. TRAP Identifies Both Known and New Markers
(A) Known markers of spinal cord motor neurons (green dots) are highly enriched in the TRAP RNA (IP) (x axis), whereas nonmotor neuron genes (glial genes, red
dots) are enriched in the whole-tissue (UB) RNA.
(B) Averages of known cell-specific markers (green bars) are consistently enriched in the IP RNA, whereas negative controls (red bars) are not. Exceptions are
the mature oligodendrocytes (Cmtm5) with low transgene expression and granule cells (Neurod1), which contribute the majority of the cerebellar UB RNA, thus
precluding enrichment.
752 Cell 135, 749–762, November 14, 2008 ª2008 Elsevier Inc.
Unfortunately, good markers are not known for every cell type.
For example, the markers for cortical interneurons assayed
above have only limited correspondence to physiological prop-
erties of the cells (Markram et al., 2004), and markers for various
pyramidal cell populations have not been established. Rather,
since the initial studies of Ramon y Cajal et al. (1899) and Lorente
de No (1934), projection neurons in the cerebrum have been
identified by their pyramidal shape and broadly classified by their
laminar specificity, dendritic arbor, and axonal targets. Accord-
ingly, we have produced lines that clearly label large pyramidal
cells of layers 6 (Ntsr1, panel 16), 5b (Glt25d2, panel 17), and
5a (Etv1, panel 18). Although axons were not clearly labeled in
these bacTRAP mice, morphometric studies provide additional
data indicating that the GENSAT EGFP lines and bacTRAP
EGFP-L10a lines target similar cortical pyramidal cell popula-
tions (Figure S2). In the corresponding GENSAT lines these cell
populations were shown to project to the thalamus (Ntsr1),
pons and spinal cord (Glt25d2), and striatum (Etv1) (http://
www.gensat.org/).
It is important to note that in most of the bacTRAP lines, the
EGFP-L10a fusion protein is detected in multiple CNS struc-
tures. A salient example is the cholinergic cell populations
targeted in the Chat lines. In this case, we have clearly demon-
strated correct expression in spinal cord motor neurons, neurons
of the corpus striatum, basal forebrain projection neurons, brain-
stem motor neurons (Figure 1, panels 10, 13, 14, and 15), and
neurons of the medial habenula (data not shown). As detailed
below, we have collected translational profiles for the first four
of these cholinergic cell populations by separately dissecting
these regions prior to affinity purification of the EGFP-L10a-
tagged polysome populations. Likewise, we assayed the glial
cell lines in both cerebellar and cortical tissue. Since specifically
expressed genes are often found in distinct cell types from phys-
ically separable brain structures, the lines we present here offer
opportunities for the study of additional cell types.
Translating Ribosome Affinity Purification, RNAExtraction, and Control Microarray ExperimentsIn total, we identified 24 cell populations in five regions that
we chose to assay by TRAP (Heiman et al., 2008). As shown
in Figure S3, this procedure yielded the purification of EGFP-
ribosomal fusion protein along with cell-specific mRNAs. We
also harvested RNA from the unbound (UB) fraction of the immu-
noprecipitation to measure the genes expressed in the dissected
region as a whole.
As shown by Heiman et al. (2008), and in Figure S4A, replicates
for the same cell type gave nearly identical genome-wide trans-
lational profiles. The average Pearson’s correlation between
independent replicates was above 0.98 across all cell types.
To determine whether the transgene’s integration position would
influence the data, we also examined independent bacTRAP
lines prepared with the same engineered BAC. This analysis re-
vealed that the variation between independent founder lines was
low and no more extensive than it was for replicate samples iso-
lated from the same founder line (Figure S4D). Thus, the location
of the transgene insertion into the genome had little global im-
pact on the data. Finally, we tested four different custom mono-
clonal antibodies and one goat polyclonal against EGFP. Each
antibody immunoprecipitated comparable levels of mRNA and
yielded similar global gene translational profiles (data not
shown). Thus, the monoclonal antibodies, a renewable reagent
for future TRAP studies, were used for the remainder of the work.
We noticed that a small number of probesets (Table S2) are
consistently enriched in every data set analyzed. Since these
same probesets were also enriched in immunoprecipitates
from control mice with no transgene expression, we conclude
that they represent background, which we systematically elimi-
nated from further analysis.
Translational Profile Analysis and ConfirmationTo provide a measure of the enrichment for each mRNA immu-
noprecipitated from the targeted cell type (IP) versus its expres-
sion in the tissue sample dissected for the analysis (UB), we
calculated the ratio of IP/UB. Figure S4B shows scatter plots
for three representative cell types of the cerebellum. Dramatic
differences are evident between the genome-wide translational
profiles of IP samples compared to whole tissue, with each cell
population displaying a unique profile of thousands of enriched
genes (Figure S4C). Venn diagrams of the top 1000 most
enriched probesets for each cell type illustrate this point. Thus,
approximately 75% of the enriched probesets are not shared
between Purkinje cells, granule cells, and unipolar brush cells,
and only 52 of the probesets enriched in these three cell types
are shared between them. To aid in the use of these lines and
allow users to investigate mRNAs in specific CNS cell types,
we present IP/UB data for each cell type in Table S5.
To determine whether this methodology accurately enriched
for cell-specific genes, we examined the TRAP microarray data
for known markers (positive controls) for each cell type. We
also examined genes expressed exclusively in other cell types
(negative controls). Figure 3A shows a scatter plot of IP/UB for
spinal cord motor neurons. Probesets for markers of motor neu-
rons with measurable signal (green dots) are clearly enriched in
the IP sample, whereas probesets for glial-specific RNAs (red
dots, negative controls), are clearly enriched in the UB sample.
To establish the generality of this finding, we quantified the en-
richment by calculating an average ratio of IP/UB for positive
and negative controls for each cell type with at least three known
markers. As shown in Figure 3B, all IPs showed a clear enrich-
ment for appropriate known markers, (Figure 3B, plotted in log
base 2). Even for cell types with only one known marker (such
as Pnoc- or Grp-positive cells), probesets for these genes
were consistently enriched in the IP. In the IPs with the lowest rel-
ative yield of RNA, such as those for mature oligodendrocytes
(Figure 3B), and Cort-expressing interneurons (data not shown),
background was proportionally higher, and enrichment was less
(C) ISH (red) and IF (green) images for genes predicted to be expressed in cerebellar Golgi cells show five of six genes with clear double labeling.
(D) qRT-PCR confirms that the sixth gene, Ceacam10, is expressed in the cerebellum and enriched in Golgi cells. qRT-PCR also confirms TRAP data for genes in
motor neurons and Purkinje cells. Slc18a3, Chat, Gfap, Pcp2, and Cnp are positive and negative controls for these populations. *Crygs and Tpm2 failed to amplify
by RT-PCR for either IP (Tpm2) or UB (Crygs), and thus no ratio could be calculated. All plots show mean ± SEM.
Cell 135, 749–762, November 14, 2008 ª2008 Elsevier Inc. 753
robust. Nonetheless, TRAP microarray data successfully iden-
tifies the known markers for these cells as well.
We next attempted to identify novel cell-specific markers for
rare cell types. For this, we screened 11 genes predicted by the
TRAP data to be enriched in either the Pnoc-expressing cells of
the cerebral cortex or Grm2-expressing cerebellar Golgi cells
with confocal microscopy for fluorescent ISH and IF for EGFP-
L10a. For the nine genes where ISH gave clear results, all were
clearly overlapping withEGFP-L10a (Figure3 and datanot shown).
In Golgi cells, there is a high degree of overlap between EGFP-
L10a expression in the Grm2 line and expression of the ISH anal-
ysis (Figure 3C). This substantial overlap confirms the specificity
of the results we have obtained for this and other cell types.
Nonetheless, the enrichment of a particular mRNA in the IP sam-
ple cannot be used to conclude that it is expressed in the cell
type exclusively or that it is expressed in all cells of that type.
For example, consistent with the ISH databases (http://www.
stjudebgem.org/; http://www.brain-map.org/), our data clearly
indicate that Penk1 is expressed in Golgi cells and in scattered
cells in the molecular layer (Figure 3C, panel 1). Finally, some
mRNAs were not detected with the ISH technique, perhaps
reflecting limited sensitivity of ISH for genes expressed at
moderate levels (Figure 3C, panel 6).
In order to validate the quantitative aspects of the TRAP micro-
array datasets, we measured the enrichment of a variety of
mRNAs isolated from the Chat (motor neuron) and Pcp2 (Purkinje
cell) transgenic lines with quantitative real time PCR (qRT-PCR)
(Figure 3D). For all of the control genes tested, this methodology
confirmed our TRAP results. For genes not previously known to
be expressed in a specific cell type, results from qRT-PCR dem-
onstrated that seven out of the eight mRNAs assayed were in
fact cell-type enriched. Moreover, despite an inconclusive ISH
result (Figure 3C, panel 6), qRT-PCR validated the expression
of Ceacam10 in the cerebellum and its enrichment in Golgi cells
(Figure 3D). In some cases, therefore, the TRAP methodology
appears to be more sensitive than ISH.
Comparative Analysis of TRAP Microarray DataCollected from Many Cell TypesHaving established that the microarray data accurately reflect
expression of known controls for each cell type and can be con-
firmed by independent experimental analysis (Heiman et al.,
2008), we were next interested in illustrating the broad properties
of these cells that could be inferred from their comparative anal-
ysis. We first performed a hierarchical clustering of all 24 IP and
six UB samples using the 20% of probesets with the highest
coefficient of variation (Figure 4A). This unsupervised clustering
essentially recapitulates the known biology of CNS cell types.
Thus, the three populations of cortical projection neurons are
more similar to one another than they are to cortical interneu-
rons, Purkinje cells, or motor neurons. Astroglial TRAP microar-
ray data collected from different regions of the brain are, as
expected, more similar to one another and to Bergmann glia
than they are to oligodendrocytes. Oligodendroglia are more
similar to each other than they are to any neuronal population,
etc. These findings support the concept that cells with similar
gene expression patterns share similar functions and suggest
that analysis of TRAP microarray data will permit the identifica-
754 Cell 135, 749–762, November 14, 2008 ª2008 Elsevier Inc.
tion of those gene products responsible for the distinguishing
characteristics of each cell type.
There are some surprising features to this analysis. Remark-
ably, the diversity of translational profiles across neuronal types
nearly rivals the diversity between neurons and glia. Although re-
lated cell subtypes, such as different motor neurons, are clearly
tightly clustered, many neuronal types (e.g., Purkinje cells) are
not strongly clustered with any other cell type. This suggests
that comparative analysis of translational profiles obtained from
highly specialized cell types may yield unanticipated insights
into their biochemical properties. Finally, individual cell types
did not generally cluster tightly with their tissue of origin. In fact,
profiles from different brain regions were clustered more closely
to each other than to their respective IP samples, suggesting that
microarray data produced from dissected regions are signifi-
cantly less informative than TRAP analysis of individual cell types.
To examine this point in more detail, we compared the data
from total cerebellum to that of the individual cerebellar cell types
analyzed in this study. As can be seen in Figure 4B, any single cell
type has fewer probesets detectable than the whole cerebellar
sample, since the whole cerebellar sample represents an aggre-
gate of different cell types. However, the union of the probesets
detectable in each of the six individual cerebellar cell types in-
cludes over 4000 probesets that are undetectable in the microar-
ray from whole cerebellum. Importantly, these undetectable pro-
besets tend to represent cell type-enriched genes (Figure 4C). In
fact, for rare cell types, up to 42% of the genes enriched in that
cell may not be detectable at all in whole-tissue microarray stud-
ies. For detection of genes expressed in specific cell types within
complex brain regions, therefore, the TRAP methodology is more
sensitive than microarray analysis of dissected brain regions.
The increased sensitivity of the TRAP methodology results in
identification of more mRNAs in each cell type, yielding a more
complete picture of the translational profile for each cell type
or, simply put, more information. To assess whether this
increased sensitivity in fact does give better information, we
calculated the Shannon entropy for each probeset across the
six whole-tissue samples and across the 24 individual cell pop-
ulations (Fuhrman et al., 2000; Shannon and Weaver, 1969).
Shannon entropy is a measure of information content that de-
scribes the complexity of a signal across samples, with values
ranging from 0 (low information) to 2 (high information). The aver-
age Shannon entropy in cell type-specific experiments (IPs) is
over twice as high as that calculated from microarray data of
whole-tissue samples (Figure 5A) (t test, p < 0.0001, average
across all IPs: 0.88 ± 0.002, whole tissue: 0.41 ± 0.003). Exam-
ples of probesets with low and high information are shown in
Figure 5B. This analysis directly demonstrates that microarray
data collected from specific cell types using the TRAP strategy
can provide significantly better information than traditional
microarray studies of dissected brain tissues.
Using this measure of information, we next classified the 10%
of the probesets with either the highest or the lowest entropy
(Figure 5C) with Gene Ontologies and searched for functional
categories that were significantly overrepresented. According
to this analysis, cell type diversity in the nervous system is driven
primarily by the expression of cell-surface proteins, such as
channels and receptors, and also to some extent by the specific
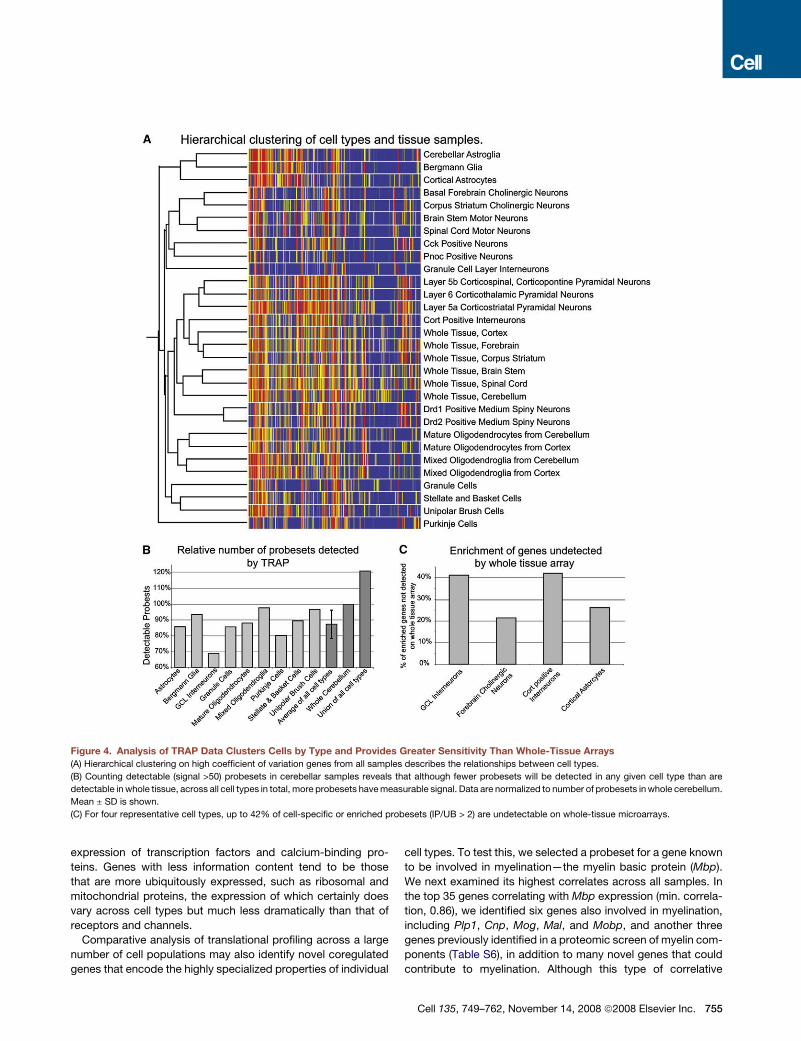
Figure 4. Analysis of TRAP Data Clusters Cells by Type and Provides Greater Sensitivity Than Whole-Tissue Arrays
(A) Hierarchical clustering on high coefficient of variation genes from all samples describes the relationships between cell types.
(B) Counting detectable (signal >50) probesets in cerebellar samples reveals that although fewer probesets will be detected in any given cell type than are
detectable in whole tissue, across all cell types in total, more probesets have measurable signal. Data are normalized to number of probesets in whole cerebellum.
Mean ± SD is shown.
(C) For four representative cell types, up to 42% of cell-specific or enriched probesets (IP/UB > 2) are undetectable on whole-tissue microarrays.
expression of transcription factors and calcium-binding pro-
teins. Genes with less information content tend to be those
that are more ubiquitously expressed, such as ribosomal and
mitochondrial proteins, the expression of which certainly does
vary across cell types but much less dramatically than that of
receptors and channels.
Comparative analysis of translational profiling across a large
number of cell populations may also identify novel coregulated
genes that encode the highly specialized properties of individual
cell types. To test this, we selected a probeset for a gene known
to be involved in myelination—the myelin basic protein (Mbp).
We next examined its highest correlates across all samples. In
the top 35 genes correlating with Mbp expression (min. correla-
tion, 0.86), we identified six genes also involved in myelination,
including Plp1, Cnp, Mog, Mal, and Mobp, and another three
genes previously identified in a proteomic screen of myelin com-
ponents (Table S6), in addition to many novel genes that could
contribute to myelination. Although this type of correlative
Cell 135, 749–762, November 14, 2008 ª2008 Elsevier Inc. 755
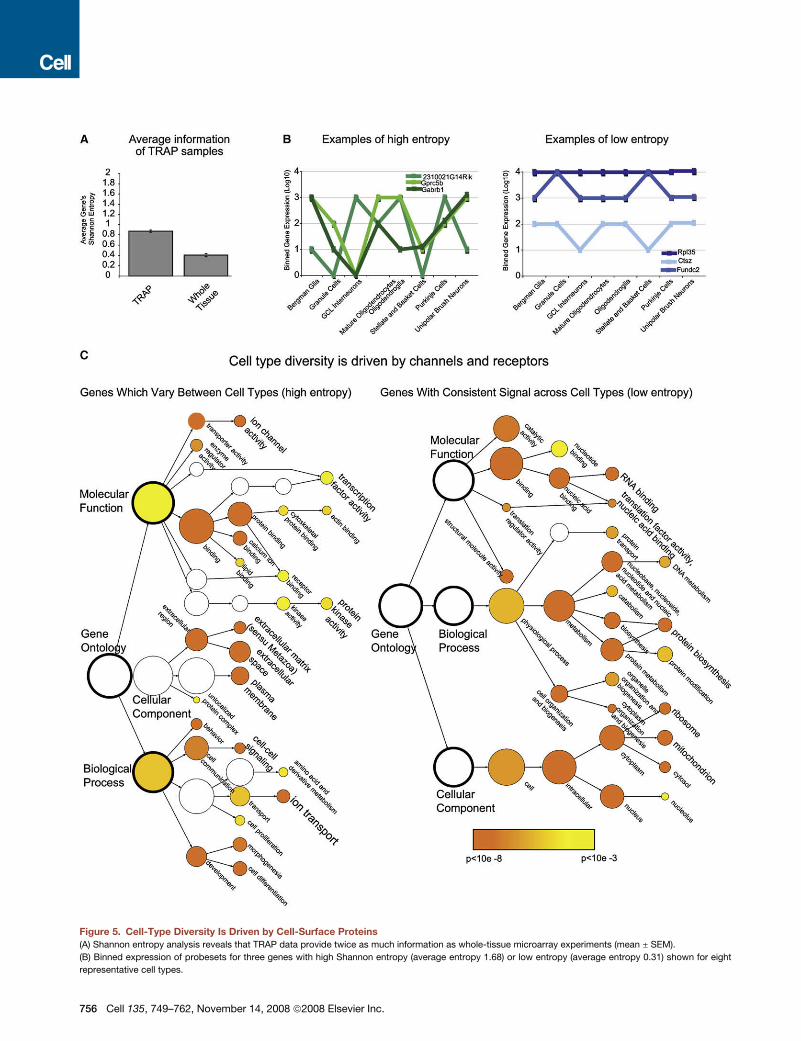
Figure 5. Cell-Type Diversity Is Driven by Cell-Surface Proteins
(A) Shannon entropy analysis reveals that TRAP data provide twice as much information as whole-tissue microarray experiments (mean ± SEM).
(B) Binned expression of probesets for three genes with high Shannon entropy (average entropy 1.68) or low entropy (average entropy 0.31) shown for eight
representative cell types.
756 Cell 135, 749–762, November 14, 2008 ª2008 Elsevier Inc.
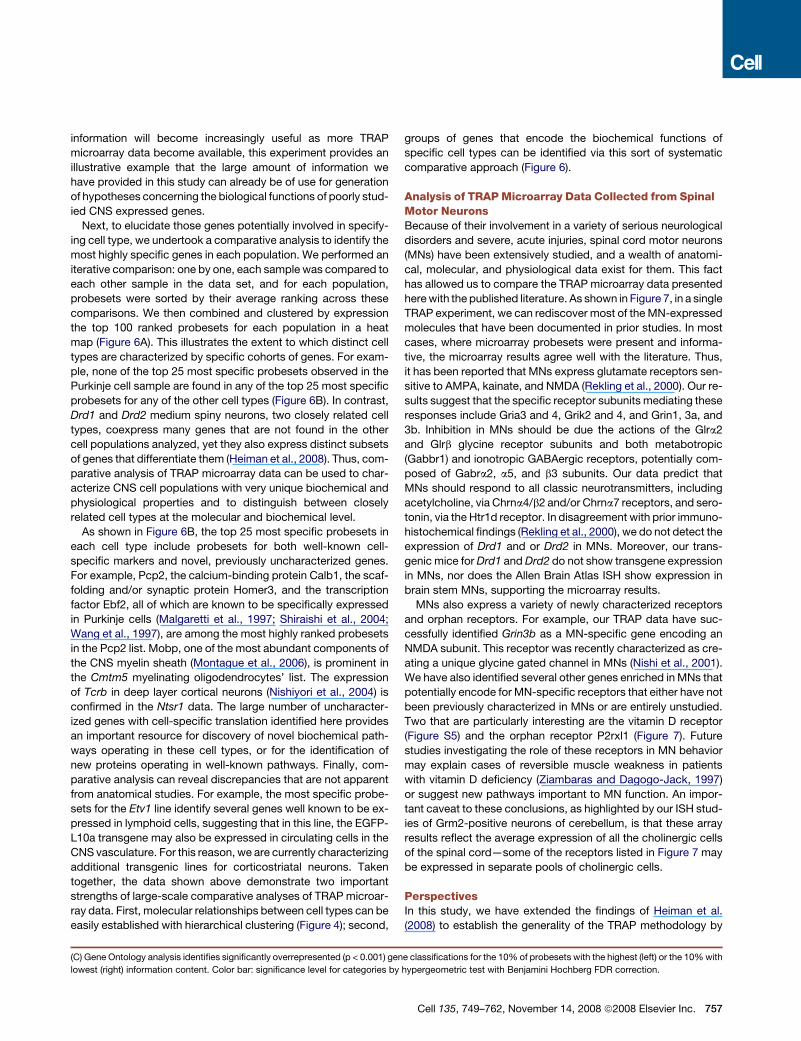
information will become increasingly useful as more TRAP
microarray data become available, this experiment provides an
illustrative example that the large amount of information we
have provided in this study can already be of use for generation
of hypotheses concerning the biological functions of poorly stud-
ied CNS expressed genes.
Next, to elucidate those genes potentially involved in specify-
ing cell type, we undertook a comparative analysis to identify the
most highly specific genes in each population. We performed an
iterative comparison: one by one, each sample was compared to
each other sample in the data set, and for each population,
probesets were sorted by their average ranking across these
comparisons. We then combined and clustered by expression
the top 100 ranked probesets for each population in a heat
map (Figure 6A). This illustrates the extent to which distinct cell
types are characterized by specific cohorts of genes. For exam-
ple, none of the top 25 most specific probesets observed in the
Purkinje cell sample are found in any of the top 25 most specific
probesets for any of the other cell types (Figure 6B). In contrast,
Drd1 and Drd2 medium spiny neurons, two closely related cell
types, coexpress many genes that are not found in the other
cell populations analyzed, yet they also express distinct subsets
of genes that differentiate them (Heiman et al., 2008). Thus, com-
parative analysis of TRAP microarray data can be used to char-
acterize CNS cell populations with very unique biochemical and
physiological properties and to distinguish between closely
related cell types at the molecular and biochemical level.
As shown in Figure 6B, the top 25 most specific probesets in
each cell type include probesets for both well-known cell-
specific markers and novel, previously uncharacterized genes.
For example, Pcp2, the calcium-binding protein Calb1, the scaf-
folding and/or synaptic protein Homer3, and the transcription
factor Ebf2, all of which are known to be specifically expressed
in Purkinje cells (Malgaretti et al., 1997; Shiraishi et al., 2004;
Wang et al., 1997), are among the most highly ranked probesets
in the Pcp2 list. Mobp, one of the most abundant components of
the CNS myelin sheath (Montague et al., 2006), is prominent in
the Cmtm5 myelinating oligodendrocytes’ list. The expression
of Tcrb in deep layer cortical neurons (Nishiyori et al., 2004) is
confirmed in the Ntsr1 data. The large number of uncharacter-
ized genes with cell-specific translation identified here provides
an important resource for discovery of novel biochemical path-
ways operating in these cell types, or for the identification of
new proteins operating in well-known pathways. Finally, com-
parative analysis can reveal discrepancies that are not apparent
from anatomical studies. For example, the most specific probe-
sets for the Etv1 line identify several genes well known to be ex-
pressed in lymphoid cells, suggesting that in this line, the EGFP-
L10a transgene may also be expressed in circulating cells in the
CNS vasculature. For this reason, we are currently characterizing
additional transgenic lines for corticostriatal neurons. Taken
together, the data shown above demonstrate two important
strengths of large-scale comparative analyses of TRAP microar-
ray data. First, molecular relationships between cell types can be
easily established with hierarchical clustering (Figure 4); second,
groups of genes that encode the biochemical functions of
specific cell types can be identified via this sort of systematic
comparative approach (Figure 6).
Analysis of TRAP Microarray Data Collected from SpinalMotor NeuronsBecause of their involvement in a variety of serious neurological
disorders and severe, acute injuries, spinal cord motor neurons
(MNs) have been extensively studied, and a wealth of anatomi-
cal, molecular, and physiological data exist for them. This fact
has allowed us to compare the TRAP microarray data presented
here with the published literature. As shown in Figure 7, in a single
TRAP experiment, we can rediscover most of the MN-expressed
molecules that have been documented in prior studies. In most
cases, where microarray probesets were present and informa-
tive, the microarray results agree well with the literature. Thus,
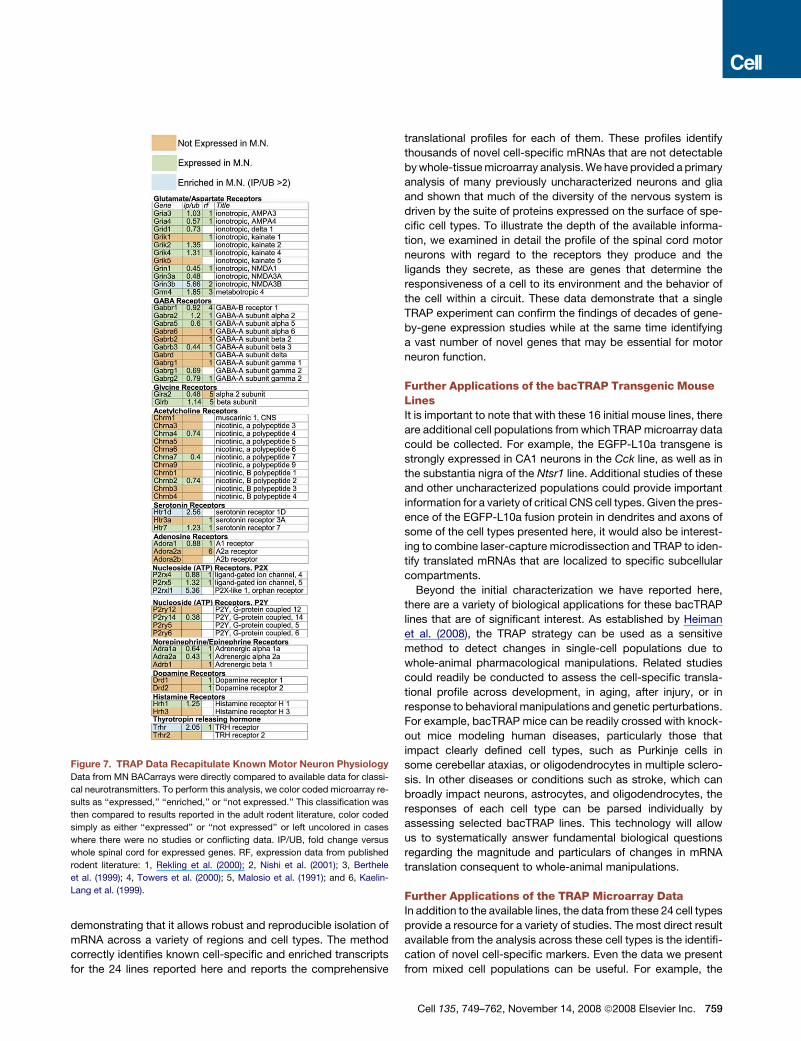
it has been reported that MNs express glutamate receptors sen-
sitive to AMPA, kainate, and NMDA (Rekling et al., 2000). Our re-
sults suggest that the specific receptor subunits mediating these
responses include Gria3 and 4, Grik2 and 4, and Grin1, 3a, and
3b. Inhibition in MNs should be due the actions of the Glra2
and Glrb glycine receptor subunits and both metabotropic
(Gabbr1) and ionotropic GABAergic receptors, potentially com-
posed of Gabra2, a5, and b3 subunits. Our data predict that
MNs should respond to all classic neurotransmitters, including
acetylcholine, via Chrna4/b2 and/or Chrna7 receptors, and sero-
tonin, via the Htr1d receptor. In disagreement with prior immuno-
histochemical findings (Rekling et al., 2000), we do not detect the
expression of Drd1 and or Drd2 in MNs. Moreover, our trans-
genic mice for Drd1 and Drd2 do not show transgene expression
in MNs, nor does the Allen Brain Atlas ISH show expression in
brain stem MNs, supporting the microarray results.
MNs also express a variety of newly characterized receptors
and orphan receptors. For example, our TRAP data have suc-
cessfully identified Grin3b as a MN-specific gene encoding an
NMDA subunit. This receptor was recently characterized as cre-
ating a unique glycine gated channel in MNs (Nishi et al., 2001).
We have also identified several other genes enriched in MNs that
potentially encode for MN-specific receptors that either have not
been previously characterized in MNs or are entirely unstudied.
Two that are particularly interesting are the vitamin D receptor
(Figure S5) and the orphan receptor P2rxl1 (Figure 7). Future
studies investigating the role of these receptors in MN behavior
may explain cases of reversible muscle weakness in patients
with vitamin D deficiency (Ziambaras and Dagogo-Jack, 1997)
or suggest new pathways important to MN function. An impor-
tant caveat to these conclusions, as highlighted by our ISH stud-
ies of Grm2-positive neurons of cerebellum, is that these array
results reflect the average expression of all the cholinergic cells
of the spinal cord—some of the receptors listed in Figure 7 may
be expressed in separate pools of cholinergic cells.
PerspectivesIn this study, we have extended the findings of Heiman et al.
(2008) to establish the generality of the TRAP methodology by
(C) Gene Ontology analysis identifies significantly overrepresented (p < 0.001) gene classifications for the 10% of probesets with the highest (left) or the 10% with
lowest (right) information content. Color bar: significance level for categories by hypergeometric test with Benjamini Hochberg FDR correction.
Cell 135, 749–762, November 14, 2008 ª2008 Elsevier Inc. 757
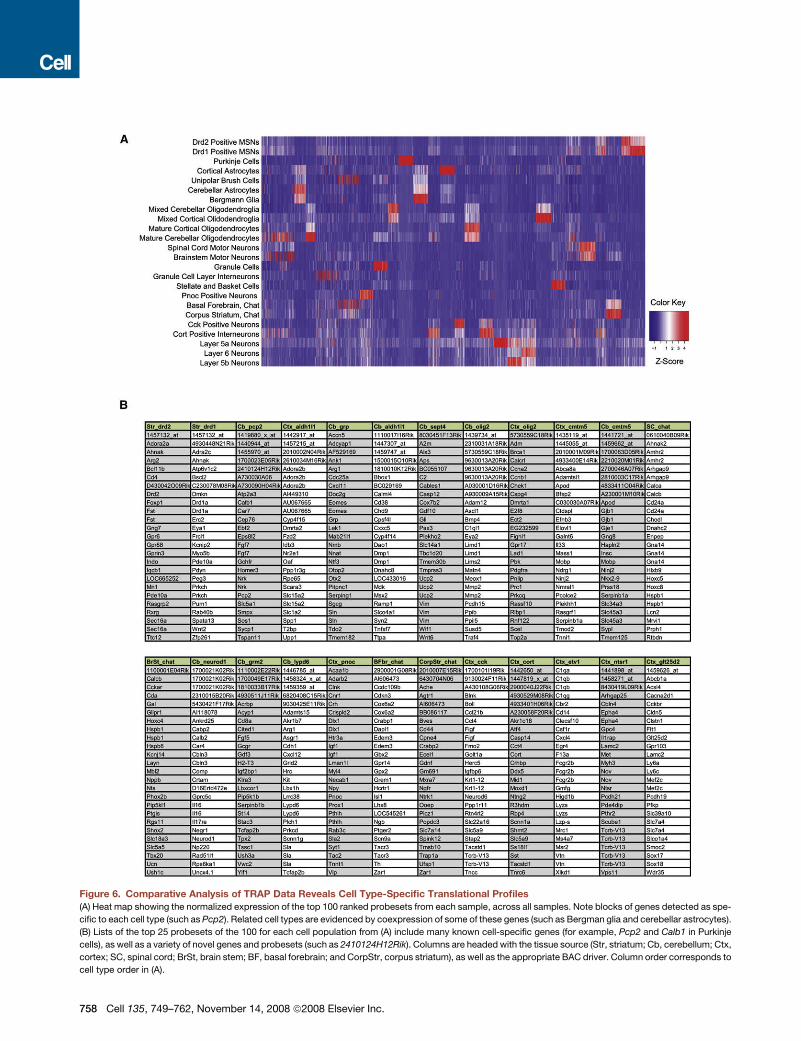
Figure 6. Comparative Analysis of TRAP Data Reveals Cell Type-Specific Translational Profiles
(A) Heat map showing the normalized expression of the top 100 ranked probesets from each sample, across all samples. Note blocks of genes detected as spe-
cific to each cell type (such as Pcp2). Related cell types are evidenced by coexpression of some of these genes (such as Bergman glia and cerebellar astrocytes).
(B) Lists of the top 25 probesets of the 100 for each cell population from (A) include many known cell-specific genes (for example, Pcp2 and Calb1 in Purkinje
cells), as well as a variety of novel genes and probesets (such as 2410124H12Rik). Columns are headed with the tissue source (Str, striatum; Cb, cerebellum; Ctx,
cortex; SC, spinal cord; BrSt, brain stem; BF, basal forebrain; and CorpStr, corpus striatum), as well as the appropriate BAC driver. Column order corresponds to
cell type order in (A).
758 Cell 135, 749–762, November 14, 2008 ª2008 Elsevier Inc.
demonstrating that it allows robust and reproducible isolation of
mRNA across a variety of regions and cell types. The method
correctly identifies known cell-specific and enriched transcripts
for the 24 lines reported here and reports the comprehensive
Figure 7. TRAP Data Recapitulate Known Motor Neuron Physiology
Data from MN BACarrays were directly compared to available data for classi-
cal neurotransmitters. To perform this analysis, we color coded microarray re-
sults as ‘‘expressed,’’ ‘‘enriched,’’ or ‘‘not expressed.’’ This classification was
then compared to results reported in the adult rodent literature, color coded
simply as either ‘‘expressed’’ or ‘‘not expressed’’ or left uncolored in cases
where there were no studies or conflicting data. IP/UB, fold change versus
whole spinal cord for expressed genes. RF, expression data from published
rodent literature: 1, Rekling et al. (2000); 2, Nishi et al. (2001); 3, Berthele
et al. (1999); 4, Towers et al. (2000); 5, Malosio et al. (1991); and 6, Kaelin-
Lang et al. (1999).
translational profiles for each of them. These profiles identify
thousands of novel cell-specific mRNAs that are not detectable
by whole-tissue microarray analysis. We have provided a primary
analysis of many previously uncharacterized neurons and glia
and shown that much of the diversity of the nervous system is
driven by the suite of proteins expressed on the surface of spe-
cific cell types. To illustrate the depth of the available informa-
tion, we examined in detail the profile of the spinal cord motor
neurons with regard to the receptors they produce and the
ligands they secrete, as these are genes that determine the
responsiveness of a cell to its environment and the behavior of
the cell within a circuit. These data demonstrate that a single
TRAP experiment can confirm the findings of decades of gene-
by-gene expression studies while at the same time identifying
a vast number of novel genes that may be essential for motor
neuron function.
Further Applications of the bacTRAP Transgenic MouseLinesIt is important to note that with these 16 initial mouse lines, there
are additional cell populations from which TRAP microarray data
could be collected. For example, the EGFP-L10a transgene is
strongly expressed in CA1 neurons in the Cck line, as well as in
the substantia nigra of the Ntsr1 line. Additional studies of these
and other uncharacterized populations could provide important
information for a variety of critical CNS cell types. Given the pres-
ence of the EGFP-L10a fusion protein in dendrites and axons of
some of the cell types presented here, it would also be interest-
ing to combine laser-capture microdissection and TRAP to iden-
tify translated mRNAs that are localized to specific subcellular
compartments.
Beyond the initial characterization we have reported here,
there are a variety of biological applications for these bacTRAP
lines that are of significant interest. As established by Heiman
et al. (2008), the TRAP strategy can be used as a sensitive
method to detect changes in single-cell populations due to
whole-animal pharmacological manipulations. Related studies
could readily be conducted to assess the cell-specific transla-
tional profile across development, in aging, after injury, or in
response to behavioral manipulations and genetic perturbations.
For example, bacTRAP mice can be readily crossed with knock-
out mice modeling human diseases, particularly those that
impact clearly defined cell types, such as Purkinje cells in
some cerebellar ataxias, or oligodendrocytes in multiple sclero-
sis. In other diseases or conditions such as stroke, which can
broadly impact neurons, astrocytes, and oligodendrocytes, the
responses of each cell type can be parsed individually by
assessing selected bacTRAP lines. This technology will allow
us to systematically answer fundamental biological questions
regarding the magnitude and particulars of changes in mRNA
translation consequent to whole-animal manipulations.
Further Applications of the TRAP Microarray DataIn addition to the available lines, the data from these 24 cell types
provide a resource for a variety of studies. The most direct result
available from the analysis across these cell types is the identifi-
cation of novel cell-specific markers. Even the data we present
from mixed cell populations can be useful. For example, the
Cell 135, 749–762, November 14, 2008 ª2008 Elsevier Inc. 759
Grp TRAP data clearly identify mRNAs expressed in both unipolar
brush cells and Bergmann glial, as we would predict from the an-
atomic characterization of this line. Comparative analysis of these
data with those obtained from the Sept4 line allows us to subtract
Bergmann glial cell mRNAs from these data and identify additional
mRNAs specific to unipolar brush cells in order to uniquely target
these cell types for second-generation TRAP studies. Further-
more, in cases of relatively weakly expressing lines, such as
Cmtm5, new drivers can be selected to more effectively target
the same cell type. Indeed, preliminary studies with a new mature
oligodendrocyte line (Cnp JD368) have demonstrated improved
RNA yield and data quality from a more strongly expressing trans-
gene (Figure S6). In addition, TRAP microarray data canbe used to
identify suites of candidate epitopes for cross-species compari-
sons to examine the evolution of the distribution of cell-types in
species from mouse through primates.
A number of sophisticated analytical methods have been
applied with some success to traditional microarray data sets
in order to infer complex biological information from gene
expression data. For instance, there are now a variety of ap-
proaches to identify transcriptional regulatory networks and
novel transcription factor binding sites from microarray data in
yeast or cell culture (Blais and Dynlacht, 2005). In higher organ-
isms, however, these analyses are complicated by the cellular
complexity of the tissue samples involved, thus confounding
the elucidation of ‘‘coexpressed’’ genes. This type of analysis
should therefore benefit from the collection of numerous cell
type-specific data sets. For the same reason, the use of the
TRAP methodology should enhance the search for functional
‘‘modules’’ of genes in the CNS (Oldham et al., 2006). The com-
bination of these analytical methods with our cell type-specific
TRAP microarray data sets should significantly enhance our
understanding of global gene expression patterns within the
CNS. We believe, because of the enhanced information content,
that TRAP and other cell-specific technologies should become
the standard for microarrays in neuroscience. To this end, we
have generated this TRAP resource.
TRAP ResourcesThe resources we provide here include 16 bacTRAP transgenic
lines expressing the EGFP-L10a fusion protein in well-character-
ized cell types, an anatomic database showing serial coronal
sections of EGFP-L10a fusion protein expression in the adult
mouse brain, IPvUB data sets for 24 cell types listing all mRNAs
enriched in that cell type, detailed protocols for conducting
TRAP experiments from the brain, and anti-EGFP monoclonal
antibodies. This resource provides the materials, data, and
knowledge to enable a wide variety of studies not previously
available to the neuroscience community.
EXPERIMENTAL PROCEDURES
BAC Modification, Transgenesis, and Animal Husbandry
All protocols involving animals were approved by the Rockefeller University In-
stitute Animal Care and Use Committee. BACs from Table S1 were modified as
described to insert an EGFP-L10a fusion protein into the translation start site of
the driver gene (Gong et al., 2002; Gong et al., 2003). Founders and subse-
quent generations were bred to either Swiss-Webster or c57bl/6 wild-type
mice. Lines were maintained as transheterozygotes.
760 Cell 135, 749–762, November 14, 2008 ª2008 Elsevier Inc.
Immunoprecipitation of Polyribosomes
All immunoprecipitations, except for the Drd1 and Drd2 lines, which used the
goat anti-EGFP described in the accompanying paper (Heiman et al., 2008),
were done with a mix of two monoclonal antibodies (19C8, 19F7). Three to
six mice for each replicated sample were euthanized with CO2, and distinct
brain regions were dissected. Each cell population was assayed in triplicate.
RNA quantity and quality were determined with a Nanodrop 1000 spectropho-
tometer (Wilmington, DE) and Agilent 2100 Bioanalyzer (Foster City, CA). For
each sample, 15 ng of total RNA was amplified with the Affymetrix two-cycle
amplification kit and hybridized to Affymetrix 430 2.0 microarrays according
to the manufacturer’s instructions.
Histological Methods
Brains were processed identically with MultiBrain Technology (NSA, Neuro-
Science Associates, Knoxville, TN) for DAB IHC with a 1:75,000 dilution of
Goat anti-EGFP serum (Heiman et al., 2008) according to the Vectastain elite
protocol (Vector Labs, Burlingame, CA). Serial sections were digitized with
a Zeiss Axioskop2 microscope at 103 magnification.
For IF, sections were blocked with 5% normal donkey serum and 0.25% tri-
ton and then incubated with primary antibodies (Table S7) and appropriate
Alexa dye-conjugated secondary antibodies (Molecular Probes/Invitrogen,
Carlsbad, CA). Probes for ISH were prepared from EST clones (Open Biosys-
tems, Table S3) with the DIG RNA labeling kit (Roche, Basel, Switzerland) and
purified with ProbeQuant G-50 microcolumns (GE Healthcare). Twenty micron
fixed brain sections were treated with 0.05% Triton X-100 and 50 ug/ml Pro-
teinase K and acetylated (0.1 M triethanolamine, 0.25% acetic anhydride).
Sections were prehybridized (500 ug/ml salmon sperm DNA, 2.53 Denhardt’s,
53 sodium chloride sodium citrate [SSC]), hybridized overnight with ribop-
robe, rinsed (53 SSC, 65�C), and washed for 1 hr (0.23 SSC, 68�C). Develop-
ment with HNPP and fast red followed manufacturer’s protocols (Roche), with
the addition of goat anti-EGFP and alexa-488 donkey anti-goat (Invitrogen) for
IF. Images were acquired as Z stacks (2 mm sections) with a Zeiss Inverted
LSM 510 confocal microscope.
Microarray Normalization and Analysis
In brief, samples were normalized with GCRMA and filtered to remove probe-
sets with low signal and those identified as background (Table S2). Each IP
was compared to unbound samples from the same tissue to calculate a ratio
of IP/UB as a measure of ‘‘enrichment.’’ Analyzed data for each cell type are
available in Table S5, which contains the IP/UB values for all genes with fold
change greater than 2 and p < 0.05 by Welch’s t test, with Benjamini and Hoch-
berg false discovery rate (FDR) multiple testing correction. Three cell types
were further corrected to remove signal from minor cell types described in
Figure 2A (Supplemental Experimental Procedures). Hierarchical clustering
and Pearson’s correlation with MBP were performed in Genespring 7.0 (Agilent
technologies). Shannon entropy was calculated in Excel from GCRMA-nor-
malized values with published formulas (Schneider, 2007). Gene Ontologies
was performed with the BiNGO plugin for the cytoscape software (Maere
et al., 2005). Comparative anlaysis of all cell types, and heat maps (Figure 6),
were generated with the R stastistical software. A full description of analytical
methods is in the Supplemental Data. MIAME-compliant raw data are available
from Gene Expression Omnibus.
Quantitative Real-Time RT-PCR
cDNA was synthesized from 20 ng of total RNA from the three replicate IP and
UB samples with M-MulV reverse transcriptase (New England Biolabs, Ips-
wich, MA), with oligo dT23VN as a primer, and then purified with the QIAGEN
Quick PCR cleanup, according to the manufacturer’s instructions (QIAGEN,
Valencia, CA).
PCR was performed with Biorad iQ syber green supermix according to the
manufacturer’s protocols (Biorad, Hercules, CA), with 500 nm final concentra-
tion of each primer (Table S4). Cycling and quantitation were performed with
Biorad iQ5 multiplex real-time detection hardware. PCR was carried out for
45 cycles (94�C, 30 s, 63�C, 30 s, 72�C, 30 s), followed by a melt curve.
Each replicate was assayed in triplicate. Conditions yielding significant dimers,
as demonstrated by melt curve and/or gel electrophoresis, were excluded
from further analysis. Primers that did not yield product in at least two of three
replicates prior to 35 cycles were excluded from further analysis. Data were
normalized to ActB with the ddCT method, via iQ5’s optical system software
version 2, and averaged across replicates. All qPCR products were subcloned
and sequenced to confirm accuracy of PCR. Microarray data were also
normalized to ActB for comparison purposes (Figure 3).
ACCESSION NUMBERS
The microarray data reported in this paper have been deposited in the Gene
Expression Omnibus with the accession number GSE13379.
SUPPLEMENTAL DATA
Supplemental Data include Supplemental Experimental Procedures, seven
figures, and seven tables and can be found with this article online at http://
www.cell.com/supplemental/S0092-8674(08)01366-4.
ACKNOWLEDGMENTS
We thank Cuidong Wang, Huifen Feng, Christine Grevstad, Clint Earnheart,
Wenxiang Zhang, Miho Nakajima, George Skabardonis, Ayse Tekinay, and
members of the P. Greengard and N. Heintz laboratories for their advice and
assistance. We also thank the Rockefeller University Bio-Imaging Resource
Center and Genomics Resource Center, the Memorial Sloan-Kettering Cancer
Center Monoclonal Antibody Core Facility, and Neuroscience Associates. This
work was supported by the Howard Hughes Medical Institute (HHMI), the
Adelson Medical Research Foundation, The F.M. Kirby Foundation, The Pi-
cower Foundation, The Jerry and Emily Spiegel Family Foundation, The Peter
Jay Sharp Foundation, The Michael Stern Foundation, the Simons Foundation,
National Institute on Aging grant AG09464, National Institute of Mental Health
Conte Center grant MH074866, National Institute on Drug Abuse (NIDA) grant
5F32DA021487 to M.H., and NIDA grant DA10044 to P.G. N.H. is an HHMI In-
vestigator.
Received: April 22, 2008
Revised: July 18, 2008
Accepted: October 28, 2008
Published: November 13, 2008
REFERENCES
Bargmann, C.I. (1993). Genetic and cellular analysis of behavior in C. elegans.
Annu. Rev. Neurosci. 16, 47–71.
Berthele, A., Boxall, S.J., Urban, A., Anneser, J.M., Zieglgansberger, W.,
Urban, L., and Tolle, T.R. (1999). Distribution and developmental changes in
metabotropic glutamate receptor messenger RNA expression in the rat lumbar
spinal cord. Brain Res. Dev. Brain Res. 112, 39–53.
Blais, A., and Dynlacht, B.D. (2005). Constructing transcriptional regulatory
networks. Genes Dev. 19, 1499–1511.
Fuhrman, S., Cunningham, M.J., Wen, X., Zweiger, G., Seilhamer, J.J., and
Somogyi, R. (2000). The application of shannon entropy in the identification
of putative drug targets. Biosystems 55, 5–14.
Gong, S., Yang, X.W., Li, C., and Heintz, N. (2002). Highly efficient modification
of bacterial artificial chromosomes (BACs) using novel shuttle vectors contain-
ing the R6Kgamma origin of replication. Genome Res. 12, 1992–1998.
Gong, S., Zheng, C., Doughty, M.L., Losos, K., Didkovsky, N., Schambra, U.B.,
Nowak, N.J., Joyner, A., Leblanc, G., Hatten, M.E., and Heintz, N. (2003). A
gene expression atlas of the central nervous system based on bacterial artifi-
cial chromosomes. Nature 425, 917–925.
Greengard, P. (2001). The neurobiology of slow synaptic transmission.
Science 294, 1024–1030.
Heiman, M., Schaefer, A., Gong, S., Peterson, J., Day, M., Ramsey, K., Suarez-
Farinas, M., Schwarz, C., Stephan, D.A., Surmeier, J., et al. (2008). A transla-
tional profiling approach for the molecular characterization of CNS cell types.
Cell 135, this issue, 738–748.
Heintz, N. (2004). Gene expression nervous system atlas (GENSAT). Nat. Neu-
rosci. 7, 483.
Kaelin-Lang, A., Lauterburg, T., and Burgunder, J.M. (1999). Expression of
adenosine A2a receptors gene in the olfactory bulb and spinal cord of rat
and mouse. Neurosci. Lett. 261, 189–191.
Lein, E.S., Hawrylycz, M.J., Ao, N., Ayres, M., Bensinger, A., Bernard, A.,
Boe, A.F., Boguski, M.S., Brockway, K.S., Byrnes, E.J., et al. (2007).
Genome-wide atlas of gene expression in the adult mouse brain. Nature
445, 168–176.
Lorente de No, R. (1934). The cerebral cortex: Architecture, intracortical
connections and motor projections. In Physiology of the Nervous System,
J.F. Fulton, ed. (London: Oxford University Press), pp. 291–339.
Maere, S., Heymans, K., and Kuiper, M. (2005). BiNGO: A Cytoscape plugin to
assess overrepresentation of gene ontology categories in biological networks.
Bioinformatics 21, 3448–3449.
Magdaleno, S., Jensen, P., Brumwell, C.L., Seal, A., Lehman, K., Asbury, A.,
Cheung, T., Cornelius, T., Batten, D.M., Eden, C., et al. (2006). BGEM: An
in situ hybridization database of gene expression in the embryonic and adult
mouse nervous system. PLoS Biol. 4, e86.
Malgaretti, N., Pozzoli, O., Bosetti, A., Corradi, A., Ciarmatori, S., Panigada,
M., Bianchi, M.E., Martinez, S., and Consalez, G.G. (1997). Mmot1, a new
helix-loop-helix transcription factor gene displaying a sharp expression
boundary in the embryonic mouse brain. J. Biol. Chem. 272, 17632–17639.
Malosio, M.L., Marqueze-Pouey, B., Kuhse, J., and Betz, H. (1991). Wide-
spread expression of glycine receptor subunit mRNAs in the adult and devel-
oping rat brain. EMBO J. 10, 2401–2409.
Markram, H., Toledo-Rodriguez, M., Wang, Y., Gupta, A., Silberberg, G., and
Wu, C. (2004). Interneurons of the neocortical inhibitory system. Nat. Rev.
Neurosci. 5, 793–807.
Montague, P., McCallion, A.S., Davies, R.W., and Griffiths, I.R. (2006). Myelin-
associated oligodendrocytic basic protein: A family of abundant CNS myelin
proteins in search of a function. Dev. Neurosci. 28, 479–487.
Nishi, M., Hinds, H., Lu, H.P., Kawata, M., and Hayashi, Y. (2001). Motoneuron-
specific expression of NR3B, a novel NMDA-type glutamate receptor subunit
that works in a dominant-negative manner. J. Neurosci. 21, RC185.
Nishiyori, A., Hanno, Y., Saito, M., and Yoshihara, Y. (2004). Aberrant
transcription of unrearranged T-cell receptor beta gene in mouse brain.
J. Comp. Neurol. 469, 214–226.
Nunzi, M.G., Shigemoto, R., and Mugnaini, E. (2002). Differential expression
of calretinin and metabotropic glutamate receptor mGluR1alpha defines
subsets of unipolar brush cells in mouse cerebellum. J. Comp. Neurol. 451,
189–199.
Oldham, M.C., Horvath, S., and Geschwind, D.H. (2006). Conservation and
evolution of gene coexpression networks in human and chimpanzee brains.
Proc. Natl. Acad. Sci. USA 103, 17973–17978.
Ramon y Cajal, S., Pasik, P., and Pasik, T. (1899). Texture of the Nervous
System of Man and the Vertebrates (Wien, New York: Springer).
Rekling, J.C., Funk, G.D., Bayliss, D.A., Dong, X.W., and Feldman, J.L. (2000).
Synaptic control of motoneuronal excitability. Physiol. Rev. 80, 767–852.
Schneider, T.D. (2007). Information Theory Primer (Frederick, MD: National
Cancer Institute).
Shannon, C.E., and Weaver, W. (1969). The Mathematical Theory of Commu-
nication (Urbana, IL: University of Illinois Press).
Shiraishi, Y., Mizutani, A., Yuasa, S., Mikoshiba, K., and Furuichi, T. (2004).
Differential expression of Homer family proteins in the developing mouse brain.
J. Comp. Neurol. 473, 582–599.
Svenningsson, P., Nishi, A., Fisone, G., Girault, J.A., Nairn, A.C., and Green-
gard, P. (2004). DARPP-32: An integrator of neurotransmission. Annu. Rev.
Pharmacol. Toxicol. 44, 269–296.
Towers, S., Princivalle, A., Billinton, A., Edmunds, M., Bettler, B., Urban, L.,
Castro-Lopes, J., and Bowery, N.G. (2000). GABAB receptor protein and
Cell 135, 749–762, November 14, 2008 ª2008 Elsevier Inc. 761

mRNA distribution in rat spinal cord and dorsal root ganglia. Eur. J. Neurosci.
12, 3201–3210.
Wang, S.S., Tsai, R.Y., and Reed, R.R. (1997). The characterization of the
Olf-1/EBF-like HLH transcription factor family: Implications in olfactory gene
regulation and neuronal development. J. Neurosci. 17, 4149–4158.
Yang, X.W., Model, P., and Heintz, N. (1997). Homologous recombination
based modification in Escherichia coli and germline transmission in trans-
762 Cell 135, 749–762, November 14, 2008 ª2008 Elsevier Inc.
genic mice of a bacterial artificial chromosome. Nat. Biotechnol. 15,
859–865.
Ziambaras, K., and Dagogo-Jack, S. (1997). Reversible muscle weakness in
patients with vitamin D deficiency. West. J. Med. 167, 435–439.
Zipursky, S.L., and Rubin, G.M. (1994). Determination of neuronal cell
fate: lessons from the R7 neuron of Drosophila. Annu. Rev. Neurosci. 17,
373–397.
Related Documents


