ERADICATING EXTREME POVERTY AND HUNGER The World Bank’s Application for Development:

Application for development
Aug 20, 2015
Welcome message from author
This document is posted to help you gain knowledge. Please leave a comment to let me know what you think about it! Share it to your friends and learn new things together.
Transcript

ERADICATING EXTREME POVERTY
AND HUNGER
The World Bank’s Application for Development:

Alleviating Global Poverty and Hunger
Implementing an application that helps the United Nations reach its Millennium Development Goals
Connecting people in developing countries with the funding they need, focussing on agriculture
Transparency, accountability and help for those who receive funding, aid and philanthropic donations.

Selected World Bank Data
Agricultural DataThe data sets chosen for this application intend to raise
the awareness of governments, organisations and companies involved within the agricultural industry. These data sets illustrate the opportunities within the agricultural industry to help eradicate poverty and hunger.
Data Sets Used in this application:- Rural Population (as a percentage of the total
population)- Agricultural machinery, tractors per 100 sq. km of arable
land- Crop Production Index (1999 – 2001 = 100)- Agriculture, value added (as a percentage of GDP)

Achieving Millennium Development Goals
Connecting organisations and stakeholders to funding from non-profit organisations and philanthropic organisations.
Allotting funding to the right people in the right location.
Setting and meeting benchmarks towards meeting the Millennium Development Goals

RURAL POPULATION (AS A PERCENTAGE OF THE TOTAL
POPULATION)

Data set parameters: Rural population (as a percentage of the total population) According to the World Bank, rural
population refers to people living in rural areas as defined by national statistical offices. It is calculated as the difference between total population and urban population.
A rural area is a large and isolated area of open country with a low population density.

Global Indicator Map (2005-2009 Data)

Global Indicator Graph (1960-2009 Data)

Indicator Summary: Rural population (as a percentage of total population)
The world’s rural population has declined steadily since 1960. In that year, 67.2 per cent of the world’s population lived in a rural region. In 2009, less than half of the world’s population (49.7 per cent) lived in rural regions.
A smaller proportion of the world’s population must provide food for a growing larger proportion. This application utilises indicator data to pin-point rural regions with a declining rural population.

AGRICULTURAL MACHINERY, TRACTORS
PER 100 SQ KM OF ARABLE LAND

Data set parameters: Agricultural machinery, tractors per 100 sq km arable land This particular data set illustrates the
continual growth in the utilisation of wheel and crawler tractors.
According to the World Bank, arable land includes: land under temporary crops, temporary meadows for mowing or for pasture, land under market or kitchen gardens, and land temporary fallow.

Global Indicator Map (2005-2009 Data)

Global Indicator Graph (1961-2007 Data)

Indicator Summary: Agricultural machinery, tractors per 100 sq. km of arable land The indicator’s graph illustrates a steady
growth in utilisation of agricultural machinery around the world. In 1961, there were 97.6 tractors per 100 sq km of arable land, whereas in 2007, there were 195.3 tractors per sq km of arable land.
Industry organisations, non-profit and for-profit, can use this application to locate regions where demand exists for tractors.

CROP PRODUCTION INDEX (1999-2001 = 100)

Data set parameters: Crop production index (1999-2001 = 100)
The crop production index illustrates agriculture production for each year relative to the base period 1999-2001, according to the World Bank. The index includes all crops except fodder crops.
The index uses the Laspeyres method, where regional and income group aggregates for the FAO’s production indices are calculated from the underlying values in international dollars, normalised to the base period, according to the World Bank.
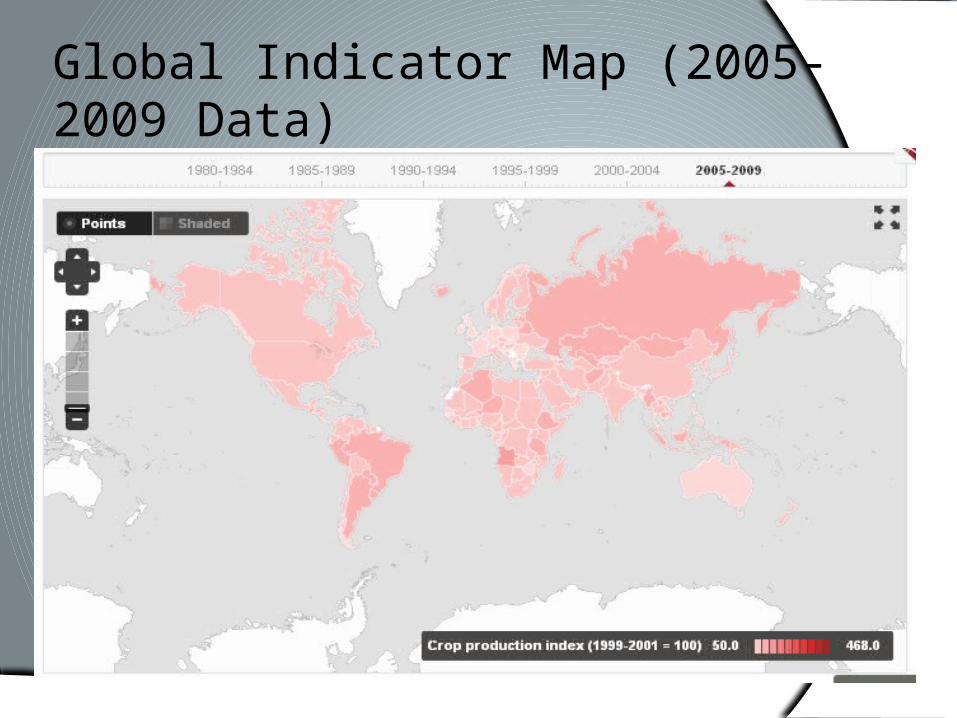
Global Indicator Map (2005-2009 Data)

Global Indicator Graph (1961-2007 Data)

Indicator summary: Crop production index (1999-2001 = 100)
Crop production increased globally from a reading of 40 in 1960 to a reading of 116.8 in 2007, with 1999-2001 as the base year (100). This increase portrays the growing global demand for food.
The index shows that the highest growth regions for crop production are in developing countries.

AGRICULTURE, VALUE ADDED AS A PERCENTAGE OF GDP

Data set parameters: Agriculture, value added (as a percentage of GDP)
According to the World Bank, agriculture corresponds to ISIC divisions 1-5 and includes forestry, hunting and fishing, as well as, cultivation of crops and livestock production.
It is calculated without making deductions for depreciation of fabricated assets or depletion and degradation of natural resources.

Global Indicator Map (2005-2009 Data)

Global Indicator Graph (1970-2008 Data)

Indicator summary: Agriculture, value added (as a percentage of GDP)
Agriculture as a portion of Gross Domestic Product (GDP) has declined on a global scale from a level of 8.8 percent of GDP in 1970 to 2.9 percent of GDP in 2008.
A decline in a percentage of GDP correlates to advances in technology, agricultural practice, expansive irrigation, or other factors in farming, fishery, forestry or livestock practices.
Related Documents