NORWAY NORWAY 1 Application and verification of ECMWF products at the Norwegian Meteorological Institute (met.no) 2012 by Bjørn Røsting, Mariken Homleid and Pål Evensen 1. Summary of major highlights The ECMWF products are widely used by forecasters to make forecasts for the public, as boundary values in HIRLAM, as basis for LAM ensembles, as input to statistical methods, and more or less directly by end users. The forecasts are mainly verified directly against observations and less against computed areal observations. Results are presented in quarterly reports and on internal web pages. 2. Use and application of products 2.1 Post-processing of model output 2.1.1 Statistical adaptation There is ongoing research in calibration of EPS. A Kalman filter procedure is operationally applied to 2 metre temperature forecasts. 2.1.2 Physical adaptation Output from the ECMWF model is used to provide lateral boundary values for limited area modelling. Two HIRLAM models are run with 12 km and 8 km resolution (HIRLAM12/8), respectively, at 00, 06, 12 and 18 UTC. The latter provide lateral boundary values to a Unified Model with 4 km resolution (UM4) both run at 00, 06, 12 and 18 UTC. The ECMWF model provides lateral boundary values for Harmonie (versions with 2.5 and 5.5 km horizontal resolution respectively) as well. The ECMWF is running a dedicated version of EPS for Norway called TEPS which started daily runs at the ECMWF mid February 2005. TEPS runs with the same set up and resolution as operational EPS at ECMWF, and hence it has been upgraded accordingly. TEPS differs from EPS in the following way; it has a local target area for the singular vectors covering Northern Europe and adjacent sea areas. The forecast time is 72 hours, and only 20 + 1 ensemble members are run. Then TEPS is used for perturbing our LAMEPS system, both the initial conditions and the lateral boundaries are perturbed with TEPS. The LAMEPS system then has 20 + 1 members, and is run at 06 UTC for 48 hours and at 18 UTC for 60 hours. The current resolution for LAMEPS is about 12 km and 60 levels in the vertical. Our end product is a combined ensemble called NORLAMEPS. NORLAMEPS is simply a combination of TEPS and LAMEPS, thus giving us an ensemble with 40 + 2 members. In this way NORLAMEPS is designed to partly account for forecast errors caused by model imperfections. 2.1.3 Derived fields The ECMWF EPS has since March 2009 been used to produce uncertainty and probability forecasts for the medium range at yr.no to the public. Uncertainty is indicated for weather, temperature and wind in terms of green, yellow and red markers. Probability forecasts comprise the 10, 25, 75 and 90 percentiles for temperature and 6- hours precipitation, see for example http://www.yr.no/place/Norway/Oslo/Oslo/Oslo/long.html. Probability maps for selected weather parameters based on EPS are presented in the meteorological visualisation system, Diana. 2.2 Use of products ECMWF products - both disseminated and on ECMWF website - are highly valuable in operational short range forecasting and indispensable in medium range forecasting. Deterministic variables are presented as horizontal maps and vertical profiles and cross sections in our Diana tool, and as time series (meteograms). EPS products are presented as probability fields in horizontal maps, as well as clusters and single members. EPS time series display ensemble spread in t2m, z500 and rr6h, respectively.

Welcome message from author
This document is posted to help you gain knowledge. Please leave a comment to let me know what you think about it! Share it to your friends and learn new things together.
Transcript
NORWAY NORWAY
1
Application and verification of ECMWF products at the Norwegian Meteorological Institute (met.no) 2012
by Bjørn Røsting, Mariken Homleid and Pål Evensen
1. Summary of major highlights The ECMWF products are widely used by forecasters to make forecasts for the public, as boundary values in HIRLAM, as basis for LAM ensembles, as input to statistical methods, and more or less directly by end users. The forecasts are mainly verified directly against observations and less against computed areal observations. Results are presented in quarterly reports and on internal web pages.
2. Use and application of products
2.1 Post-processing of model output 2.1.1 Statistical adaptation
There is ongoing research in calibration of EPS. A Kalman filter procedure is operationally applied to 2 metre temperature forecasts. 2.1.2 Physical adaptation
Output from the ECMWF model is used to provide lateral boundary values for limited area modelling. Two HIRLAM models are run with 12 km and 8 km resolution (HIRLAM12/8), respectively, at 00, 06, 12 and 18 UTC. The latter provide lateral boundary values to a Unified Model with 4 km resolution (UM4) both run at 00, 06, 12 and 18 UTC. The ECMWF model provides lateral boundary values for Harmonie (versions with 2.5 and 5.5 km horizontal resolution respectively) as well. The ECMWF is running a dedicated version of EPS for Norway called TEPS which started daily runs at the ECMWF mid February 2005. TEPS runs with the same set up and resolution as operational EPS at ECMWF, and hence it has been upgraded accordingly. TEPS differs from EPS in the following way; it has a local target area for the singular vectors covering Northern Europe and adjacent sea areas. The forecast time is 72 hours, and only 20 + 1 ensemble members are run. Then TEPS is used for perturbing our LAMEPS system, both the initial conditions and the lateral boundaries are perturbed with TEPS. The LAMEPS system then has 20 + 1 members, and is run at 06 UTC for 48 hours and at 18 UTC for 60 hours. The current resolution for LAMEPS is about 12 km and 60 levels in the vertical. Our end product is a combined ensemble called NORLAMEPS. NORLAMEPS is simply a combination of TEPS and LAMEPS, thus giving us an ensemble with 40 + 2 members. In this way NORLAMEPS is designed to partly account for forecast errors caused by model imperfections. 2.1.3 Derived fields
The ECMWF EPS has since March 2009 been used to produce uncertainty and probability forecasts for the medium range at yr.no to the public. Uncertainty is indicated for weather, temperature and wind in terms of green, yellow and red markers. Probability forecasts comprise the 10, 25, 75 and 90 percentiles for temperature and 6-hours precipitation, see for example http://www.yr.no/place/Norway/Oslo/Oslo/Oslo/long.html. Probability maps for selected weather parameters based on EPS are presented in the meteorological visualisation system, Diana.
2.2 Use of products ECMWF products - both disseminated and on ECMWF website - are highly valuable in operational short range forecasting and indispensable in medium range forecasting. Deterministic variables are presented as horizontal maps and vertical profiles and cross sections in our Diana tool, and as time series (meteograms). EPS products are presented as probability fields in horizontal maps, as well as clusters and single members. EPS time series display ensemble spread in t2m, z500 and rr6h, respectively.

NORWAY NORWAY
2
Monthly temperature and precipitation forecasts (split into separate weeks) are distributed internally and to dedicated users within the energy supply industry. These forecasts are presented both as tables and plotted charts covering the Nordic and Baltic countries and supplemented with an explanatory text. Monthly forecasts are generally not yet presented to the general public due to some consistency deficiencies in relation to the seasonal forecasts. Seasonal temperature anomaly forecast charts are presented every month on our public website for an area covering the Nordic countries, Iceland and Great Britain. A simple verification diagram for a limited number of cities is presented in addition to the charts, see http://retro.met.no/sesongvarsler/index.html. Public medium range (i.e. 10 days) forecasts has traditionally been in a worded, deterministic form with the precision level decreasing as the time horizon increases. Use of EPS has been confined to express the uncertainties associated with the actual forecasts. However, the opening of our public website (yr.no) has made possible the introduction of graphical products, including probabilistic approaches, see 2.1.3. Other applications of ECMWF medium range products - both deterministic and probabilistic - include data supply and consultancy services for the energy supply and offshore industry, shipping a.o. Severe weather: Our main focus is to give authorities and the public special warnings if severe weather conditions are expected to occur within the next 72 hours. Warnings are mainly based upon deterministic models, both limited area models (up to 2 days) and the ECMWF model (up to 3 days). Elements include strong winds, heavy precipitation (flood risk), avalanche risk and storm surge. EPS/EFI and LAMEPS are used usually as supplementary products. However, the new clustering products (for 500 and 1000 hPa) as well as the so-called “stamp maps” have proven to be highly useful in forecasting severe weather. (E.g. the severe winter storm “Dagmar” that affected Scandinavia 25-26 December 2011 was forecast in about 50 % of the ensemble members and was supported by the clustering products at least 3 days before the event took place. )
3. Verification of products
3.1 Objective verification 3.1.1 Direct ECMWF model output (both deterministic and EPS)
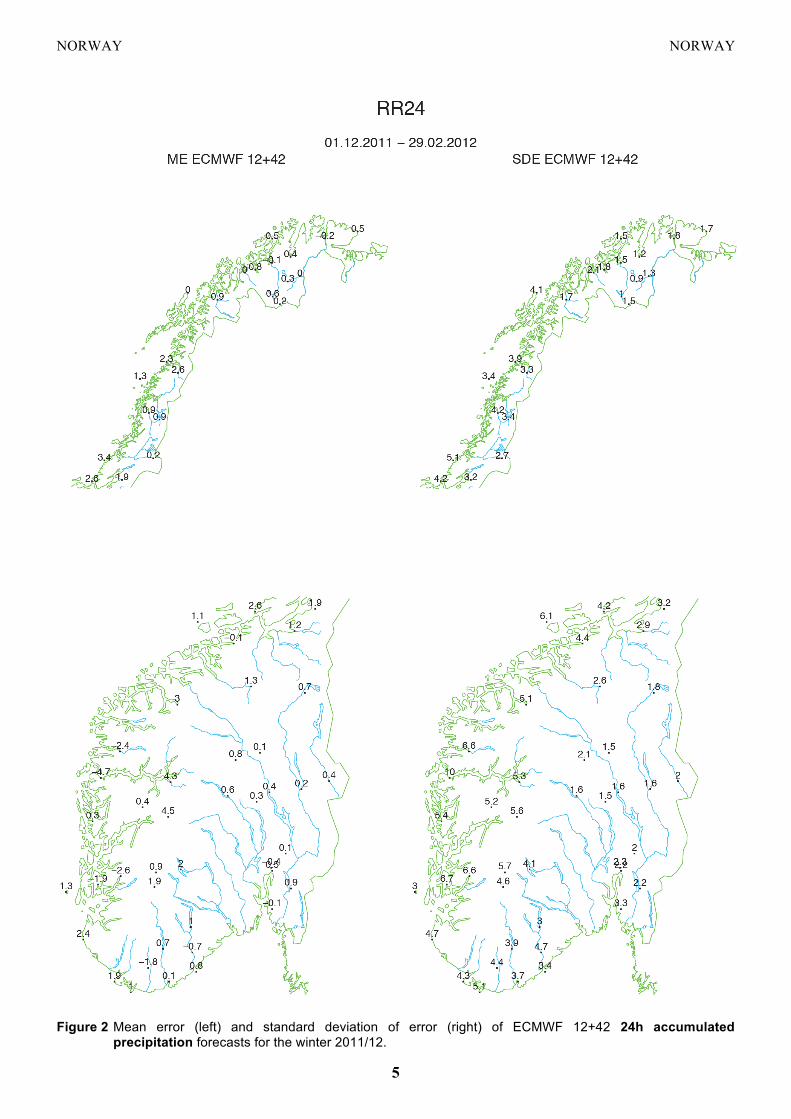
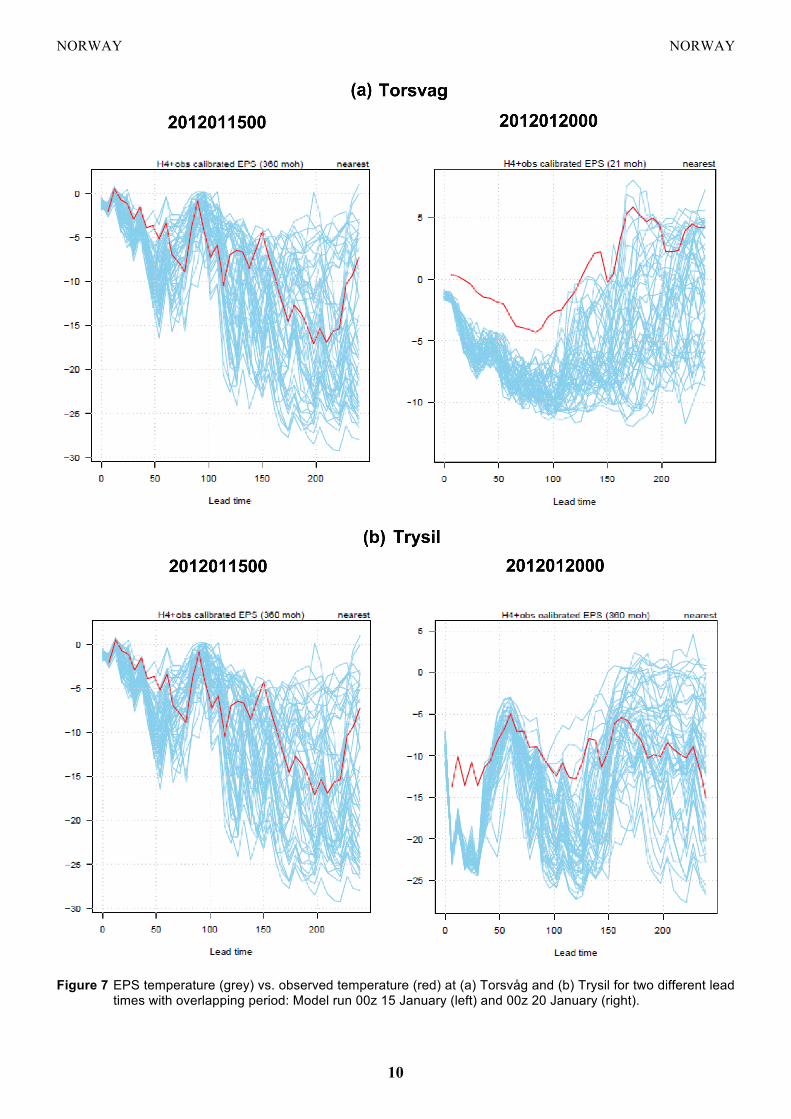
Local weather parameters are continuously verified against a large number of observations. An example for 2 metre temperature is given in Figure 1 with quarterly mean errors (ME) and standard deviations of errors (SDE) at all Norwegian synoptic stations for the winter 2011/2012. The results show large geographical variations. The MEs can partly be explained by the differences in elevations, but relatively large negative MEs at many coastal stations in autumn and winter indicate that the forecasts could have been more influenced by the sea temperature. Low radiation resolution leads to isolated points with temperature errors particularly near coast lines and orography. Similarly, the EPS has very large negative biases during winter time for certain weather types in areas around e.g. Torsvåg on the coast of northern Norway. These biases may be consistent through many runs, see figure 7(a). Figure 2 demonstrates the quality of the precipitation forecasts at selected synoptic stations for the winter 2011/2012. In general, very large amounts are underestimated and small amounts seem to occur too often, at least when compared to rain gauge measurements. The precipitation is overestimated at coastal stations but underestimated at stations recording the largest precipitation amounts. EPS verification is carried out for the shortest lead times. The cold bias problem The cold bias problem has already been known for some time. This is specially the case for coastal stations as mentioned above, due to low radiation resolution. A modified scheme (37r3) improves spatial characteristics of super-cooled liquid layers which - hopefully - should reduce the T2m cold bias for the inland stations. Figure 7b
NORWAY NORWAY
3
shows a tendency for a cold bias, in this case for fairly short lead times, for a typical inland station in eastern Norway in January 2012 which may be related to errors in low cloud cover. 3.1.2 ECMWF model output compared to other NWP models
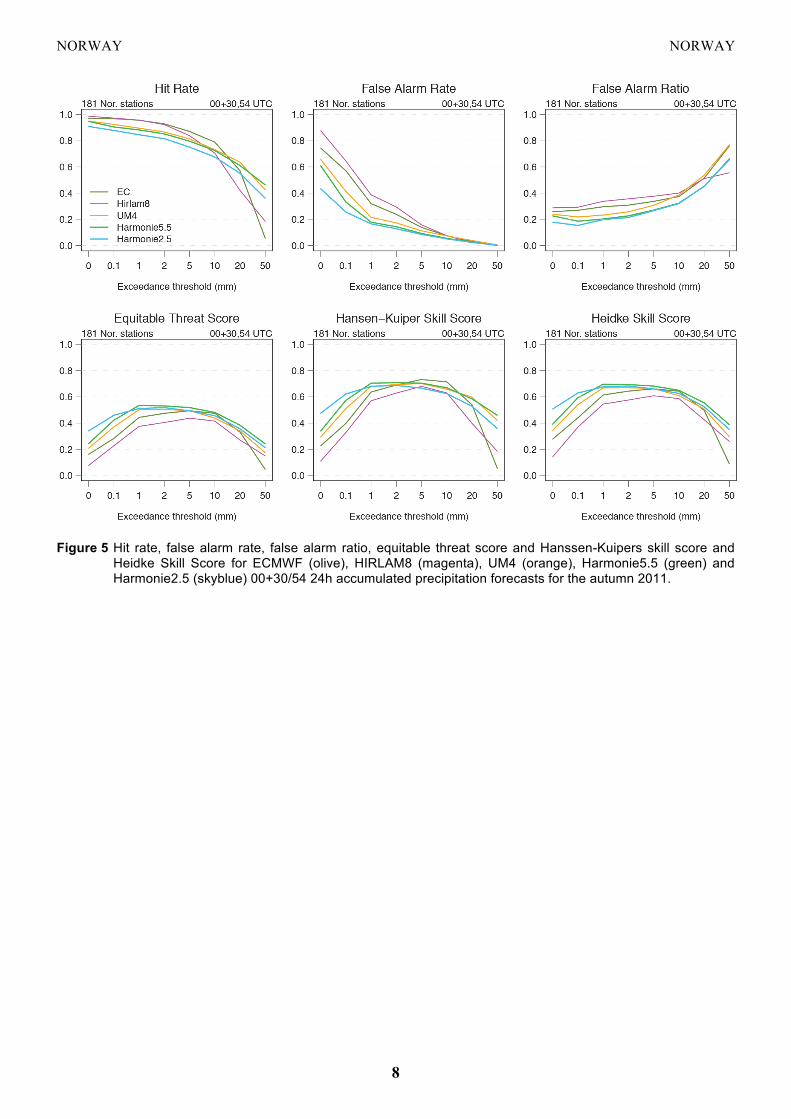
Examples of 10 metre wind speed forecast verification of the ECMWF model compared to HIRLAM10/8, UM4, Harmonie5.5 and Harmonie 2.5 are given in figures 3 and 4 showing times series of monthly mean and standard deviation of errors from May 2009 to July 2012. The results are averaged over various selections of stations. Large negative mean errors for the 5 mountainous stations demonstrate that the wind speed is too weak in mountainous regions. Along the coastline the wind speed forecasts were unbiased or slightly underestimated. Figure 4 shows that all models have similar quality of the 10 metre wind speed with respect to standard deviation of errors. Precipitation forecasts are verified using several measures in addition to ME, SDE and MAE. Figure 5 shows the hit rate, false alarm rate, false alarm ratio, equitable threat score, Hanssen-Kuipers skill score and Heidke Skill Score as a function of exceedance threshold for the autumn 2010 for ECMWF, HIRLAM8, UM4, Harmonie 5.5 and Harmonie 2.5. It should be pointed out that in order to compare to other NWP models we have to change grid for the ECMWF model output. This may cause some interpolation errors and thus affect the result. 3.1.3 Post-processed products
The quality of Kalman filter adjusted 2 metre temperature forecasts (T2mK) has been compared to direct model output (T2m) and forecasts adjusted to station height (T2mH). The latter adjustment is simply to increase the temperature by 0.6° per 100 meter difference between model and real orography. Figure 6 gives mean absolute errors of T2m, T2mH and T2mK as a function of forecast lead time for HIRLAM8 and ECMWF. The results are averaged over 84 Norwegian synop stations and one year of data, January to December 2011. The Kalman filter procedure gives best results with respect to mean absolute errors, but also the simple ‘height correction’ procedure improves the quality of 2 metre temperature forecasts significantly. 3.1.4 End products delivered to users
3.2 Subjective verification 3.2.1 Subjective scores (including evaluation of confidence indices when available)
3.2.2 Synoptic studies
4. References to relevant publications

NORWAY NORWAY
4
Figure 1 Mean error (left) and standard deviation of error (right) of ECMWF 12+48 2 metre temperature forecasts for the winter 2011/12.
NORWAY NORWAY
5
Figure 2 Mean error (left) and standard deviation of error (right) of ECMWF 12+42 24h accumulated precipitation forecasts for the winter 2011/12.

NORWAY NORWAY
6
Figure 3 Monthly mean errors from May 2009 to July 2012 of ECMWF (olive), HIRLAM10/8 (magenta), UM4 (orange), Harmonie4 /5.5 (green) and Harmonie2.5 (skyblue) 12+18,+30 wind speed forecasts.

NORWAY NORWAY
7
Figure 4 Monthly standard deviation of errors from May 2009 through July 2012 of ECMWF (olive), HIRLAM10/8 (magenta), UM4 (orange), Harmonie5.5 (green) and Harmonie2.5 (skyblue) 12+18,+30 wind speed forecasts.
NORWAY NORWAY
8
Figure 5 Hit rate, false alarm rate, false alarm ratio, equitable threat score and Hanssen-Kuipers skill score and Heidke Skill Score for ECMWF (olive), HIRLAM8 (magenta), UM4 (orange), Harmonie5.5 (green) and Harmonie2.5 (skyblue) 00+30/54 24h accumulated precipitation forecasts for the autumn 2011.

NORWAY NORWAY
9
Figure 6 Mean absolute errors as a function of forecast lead time for 2 metre temperature ECMWF (left) and HIRLAM8 (right) forecasts; direct model output (solid lines), ‘height corrected’ (dashed lines) and Kalman filter corrected (dashed-dotted lines). The results are based on data from January to December 2011 averaged over 84 Norwegian stations.
NORWAY NORWAY
10
Figure 7 EPS temperature (grey) vs. observed temperature (red) at (a) Torsvåg and (b) Trysil for two different lead times with overlapping period: Model run 00z 15 January (left) and 00z 20 January (right).
Related Documents