Apple Juice Roundtable

Welcome message from author
This document is posted to help you gain knowledge. Please leave a comment to let me know what you think about it! Share it to your friends and learn new things together.
Transcript

Apple Juice Roundtable
Apple Juice Roundtable
Panelists
Christian Freberg Dr Pepper Snapple Group
Michael Choi Zhonglu America Corporation
Rene Alarcon Doehler North AmericaFruit & Vegetable, Inc.
Christian Freberg - Dr Pepper Snapple Group 2

USA Apple Juice Market Update
August 25, 2016

Christian Freberg - Dr Pepper Snapple Group4
Source: U.S. Census Bureau
USA Apple Juice Concentrate Imports12 Months Ended June(Thousands of Metric Tons)
76%
78%
76%
46%
82%
73%79%
-
50.0
100.0
150.0
200.0
250.0
300.0
350.0
400.0
2008 2009 2010 2011 2012 2013 2014 2015 2016
China 293.2 254.1 274.4 291.5 200.4 250.9 222.3 124.9 221.7
S. America 73.7 74.7 53.2 85.9 68.6 58.2 48.8 73.8 65.0
Europe 6.9 3.7 2.6 2.0 1.9 6.3 8.3 69.4 24.2
Other 5.1 3.0 3.3 5.9 2.9 2.3 5.1 4.6 5.3
76%
378.9 335.6 333.5 385.2 273.8 317.8 284.5 272.8 316.2
77%
82%
76%
73%
79%
78% 46%
70%

Christian Freberg - Dr Pepper Snapple Group5Source: U.S. Census Bureau
USA Apple Juice Concentrate Imports from S. America12 Months Ended June(Thousands of Metric Tons)
-
10.0
20.0
30.0
40.0
50.0
60.0
70.0
80.0
90.0
2008 2009 2010 2011 2012 2013 2014 2015 2016
Chile 11.5 23.6 18.0 21.9 11.7 18.4 27.4 45.0 37.0
Argentina 35.0 39.9 21.6 37.9 38.7 21.7 12.7 17.6 19.3
Brazil 27.2 11.3 13.6 26.1 18.2 18.1 8.7 11.2 8.8
Other 0.0 0.0 0.0 0.0 0.0 0.1 0.0 0.0 0.0
73.7 74.7 53.2 85.9 68.7 58.4 48.8 73.8 65.1
Christian Freberg - Dr Pepper Snapple Group 6
Source: U.S. Census Bureau
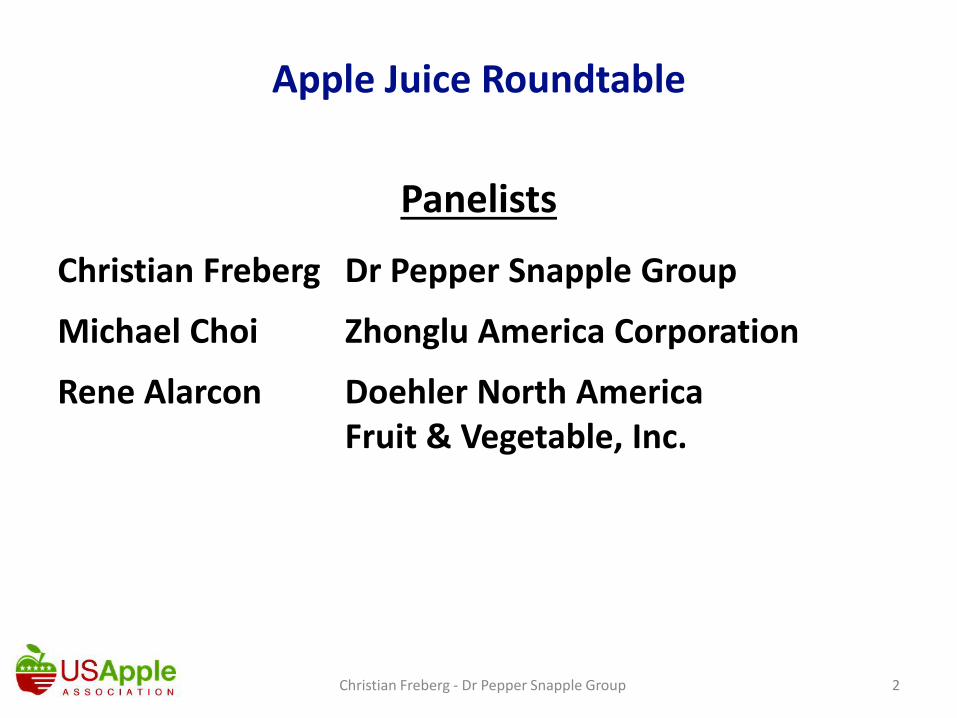
USA Apple Juice Concentrate ImportsPrimary Supplying Countries
(Thousands of Metric Tons)2015 2016 Change
China 124.9 221.7 96.7
S. America 73.8 65.0 (8.8)
Chile 45.0 37.0 (8.0)
Argentina 17.6 19.3 1.7
Brazil 11.2 8.8 (2.4)
Europe 69.4 24.2 (45.2)
Turkey 18.1 8.1 (10.0)
Poland 22.4 3.9 (18.5)
Italy 10.3 2.2 (8.0)
Netherlands 1.2 2.2 1.0
France 0.5 0.4 (0.1)
Ukraine 0.0 4.2 4.2
Germany 6.1 0.5 (5.5)
Hungary 3.5 0.0 (3.5)
Austria 4.6 1.2 (3.4)
Spain 3.3 1.0 (2.3)

Christian Freberg - Dr Pepper Snapple Group 7
Source: U.S. Department of Commerce
USA Apple Juice Concentrate Imports12 Months Ended
(Million USD)
$-
$100
$200
$300
$400
$500
$600
$700
$800
2002 2003 2004 2005 2006 2007 2008 2009 2010 2011 2012 2013 2014 2015 2016

Christian Freberg - Dr Pepper Snapple Group 8
Source: Agricultural Marketing Service, USDA
USA Apple Juice Concentrate Import PricesEx. Dock East Coast
(USD/gallon)
$-
$2.00
$4.00
$6.00
$8.00
$10.00
$12.00
$14.00
4-Nov-10 4-Nov-11 4-Nov-12 4-Nov-13 4-Nov-14 4-Nov-15

Christian Freberg - Dr Pepper Snapple Group 9
Source: DTN
Exchange Rates for Major AJC Exporting Countries vs. USD2011 - 2016(Million USD)
USD 20% strongervs. EUR
USD 5% stronger vs. CNY
USD 333% stronger vs. Arg. Peso
USD 28% stronger vs. Chilean Peso

Christian Freberg - Dr Pepper Snapple Group 10
USA Apple Utilization12 Months Ending June 30, 2016
(000’s Metric Tons) Fresh 69%3,110 M Tons
Juice 13%578 M Tons
Slices / Other 2%156 M Tons
Dried & Frozen 4%187 M Tons
Total4,558 M Tons
Source: USDA – NASS
Sauce/Canned 11%492 M Tons
Not Marketed 1%36 M Tons

Christian Freberg - Dr Pepper Snapple Group 11
0
1,000
2,000
3,000
4,000
5,000
6,000
2008-09 2009-10 2010-11 2011-12 2012-13 2013-14 2014-15 2015-16
2,846 2,864 2,856 2,859 2,991 3,1283,605
3,110
1,481 1,424 1,327 1,368 1,0581,563
1,470
1,449
Fresh Process
USA Processing Apple Utilization8 Years Ending June 30, 2016
(000’s Metric Tons)
Source: USDA – NASS
31%
69%
4,327 4,288 4,183 4,227 4,049 4,691 5,075 4,558

Christian Freberg - Dr Pepper Snapple Group 12
0
500
1,000
1,500
2,000
2008-09
2009-10
2010-11
2011-12
2012-13
2013-14
2014-15
2015-16
Other 109 88 91 141 82 118 114 156
Fzn/Dry 192 180 157 170 131 182 183 187
Juice 612 630 606 548 504 689 664 578
Canned 569 525 473 510 340 574 509 492
USA Processing Apple Utilization8 Years Ending June 30, 2015
(000’s Metric Tons)
Source: USDA – NASS
’08 – ‘15
+ 43.1%
- 2.6%
-5.5%
- 13.5%
1,481 1,424 1,327 1,368 1,058 1,563 1,470 1,413

Christian Freberg - Dr Pepper Snapple Group 13
Total USA Shelf Stable Apple Juice288 Oz Equivalent Cases (000’s)
2012-YTD 2016 (7/16/15)
Source: AC Nielsen
15,000
20,000
25,000
30,000
35,000
40,000
45,000
2012 2013 2014 2015 2016 YTD
41,099 41,486 41,297 42,143
21,971
YoY Growth: +1.0% -0.5% +2.0%

Christian Freberg - Dr Pepper Snapple Group14
Total USA Shelf Stable Apple JuicePrivate Label vs. Branded Volume 2012-YTD 2016 (7/16/16)
(288 oz. Equivalent Cases 000’s)
Source: AC Nielsen
-
5,000
10,000
15,000
20,000
25,000
2012 2013 2014 2015 2016 YTD
Branded Volume Private Label Vol.
52% 48% 51% 49% 50.5% 49.5% 49.5% 50.5%
47.3% 52.7%

Christian Freberg - Dr Pepper Snapple Group 15
Total USA Shelf Stable Apple JuiceBranded Vs. Private Label Average Pricing
Multi-Serve, Single Pack2012- YTD 2016 (7/16/16)
Source: AC Nielsen
$-
$0.50
$1.00
$1.50
$2.00
$2.50
$3.00
$3.50
2012 2013 2014 2015 2016
Branded Private Label
$2.63 $2.76 $2.68 $2.99 $3.06
$2.12 $2.05 $1.99 $1.92 $1.84
$0.41 $0.71 $0.69 $1.07 $1.22Gap Gap Gap Gap Gap

Christian Freberg - Dr Pepper Snapple Group 16
Thank You!
Christian FrebergDirector, Commodities
Dr Pepper Snapple [email protected]
Related Documents