SE0300128 SKI Report 00:5 7 Appication of the Pin-Loading Tension Test to Measurements of Delayed Hydride Cracking Velocity in Zircaloy Cladding V. GrigoMYe R. Jakobsson November 2000 ISSN 1104-1374Si

Welcome message from author
This document is posted to help you gain knowledge. Please leave a comment to let me know what you think about it! Share it to your friends and learn new things together.
Transcript
SE0300128
SKI Report 00:5 7
Appication of the Pin-Loading Tension Testto Measurements of Delayed HydrideCracking Velocity in Zircaloy Cladding
V. GrigoMYeR. Jakobsson
November 2000
ISSN 1104-1374Si
SKI perspective
Beginning in 1998 the IAEA runs a Co-ordinated Research Programme entitled"Hydrogen and hydride induced degradation of the mechanica properties of zirconiumbased alloys". Swedish participation in the programme by KTH and Studsvik issupported economically by SKI. The Programme was initially limited to the delayedhydride cracking (DHC) problem. In the first part of the programme the participantsperformed a standardised measurement of crack growth in specimens made frompressure tubes of Zr2.5Nb alloy, an alloy in which DHC failures have occurred in thefield. This round robin was a great success since all participants got very similar valuesof the crack growth rate.
Currently D1HC is also of great interest as a possible mechanism for the degradation ofzirconium alloy fuel cladding after an initial penetration of the cladding by anothermechanism. In order to learn more about the DHC phenomenon as a secondary fuelfailure mechanism SKI has already supported a doctoral student project on DH-C atKTH and an extensive theoretical review on DH1C by the consultancy ANT. It is clearthat this aspect of DH-C also has to be included in the AEA programme. However thereis no standardised test method for fuel cladding material as there is for pressure tubematerial. The IAEA group noted that the Pin Loading Test (PLT) developed in Studsvikfor measurement of the fracture toughness of fuel cladding might also be used formeasuring crack growth during DH1C. Therefore, with support from SKIt, Studsvik hasperformed the present study of the PLT test applied to the measurement of crack growthunder DH-C conditions. The tests have been performed on statically loaded specimens ofstress relieved Zircaloy-2 with 200 ppmn hydrogen concentration. The growth of crackshas been monitored by the potential drop method. The result is that DHC growth didoccur in the specimens and that the potential drop signals were good enough to permit aquantitative evaluation of crack growth rate. It has thus been demonstrated that the PLTmethod can be used as a standardised test method for DH-C in fuel cladding in thecontinued IAEA programme on hydrogen induced degradation of zirconium alloys.
Responsible for the project at SKI has been Jan in de Betou.SKI reference: 14.6-990669/99 159
SKI Report 00:5 7
Application of the Pin-Loading Tension Testto Measurements of Delayed HydrideCracking Velocity in Zircaloy Cladding
V. GrigorievR. Jakobsson
Studsvik Nuclear ABSE-61 1 82 Nyk6pingSweden
November 2000
This report concerns a study which hasbeen conducted for the Swedish NuclearPower Inspectorate (SKI). The conclusionsand viewpoints presented in the report arethose of the author/authors and do not
SKI Project Number 99 159 necessarily coincide with those of the SKI.
List of contents
Abstract IHuvudinnehAll
1 Introduction 1
2 Material and equipment 22.1 Material for testing 22.2 Equipment 22.3 Specimen and fixture configuration 2
3 Test procedures 43.1 Specimen preparation 43.2 Specimen set-up 43.3 Fatigue pre-cracking 43.4 Heating / Cooling temperature - Time schedule 53.5 DHC cracking 53.6 Fracture surface examination 53.7 DHC-velocity calculations 63.8 KI-calculations 6
4 Results and discussions 74.1 DHC testing 74.2 Hydrogen extraction 74.3 Crack extension measurements 7
5 Conclusions 8
Acknowledgements
References
Figures 1 through 15
Appendix A: Cladding tube material properties (Sandvik lot 83080)
Appendix B: Instrument calibration record sheet
Appendix C: Correction factor f(a/W) for PLT-specimens
Appendix D: Summary of DHC test results
Appendix E: Raw data for PLT-DHC specimensSpecimen 9-4 El-E3Specimen 9-5 E4-E6Specimen 9-6 E7-E9Specimen 13-4 E10-E12Specimen 13-5 E13-E15Specimen 13-6 E1 6-E 18
rapp\ski\00-57\vg
ABSTRACTThe International Atomic Agency (AEA) has recently initiated a Co-ordinated ResearchProgramme (CRP) on "Hydrogen and hydride induced degradation of the mechanical andphysical properties of Zirconium-based alloys". In the first phase of this CRP themethodology for measuring the velocity of Delayed Hydride Cracking (DHC) in pressure tubematerials was established. Studsvik Nuclear AB among the other participating laboratoriesfrom nine countries around the world carried out identical tests in "round robin" on hydridedmaterial of CANDU pressure tube. As an extension of the work the measurements of DHC inhydrided cladding materials were suggested.
The objective of the present work is to develop at Studsvik Nuclear the procedure of aconstant load cracking test on unirradiated Zircaloy cladding. The procedure is based on thePin-Loading Tension test recently developed at Studsvik for fracture toughness testing of thethin-walled tubing. The DHC tests are performed on specimens cut from unirradiated PWRcladding (SRA Zircaloy-4) hydrided for approximately 200 ppm and the rate of an axial crackpropagation is determined in each test.
Six PLT-specimens have been tested for DHC at test parameters similar to the parametersused in the previous work for the pressure tube material. The axial crack growth velocitiesmeasured are within the interval of (2.6÷3.0) 108 m/s showing very good reproducibility andbeing slightly below the data for pressure tube material. The procedure developed formeasuring the axial crack velocity in the thin-walled tubing is adapted for the testing ofirradiated cladding.
HUVUDINNEHALLInternationella Atomenergikommissionen (AEA) ar nyligen initierat ett samordnatforskningsprogram ("Co-ordinated Research Prograrme" CRP) ang~iende v~te- ochhydridinducerad degradering av mekaniska och fysikaliska egenskaper hoszirkoniumbaserade legeringar ("Hydrogen and hydride induced degradation of the mechanicaland physical properties of zirconium-based alloys"). den frsta delen av dettaforskningsprogram etablerades metoder for att mata propageringshastigheter vid frdrojdhydridsprickning (Delayed Hydride Cracking, DHC) i trycktubsmaterial. Studsvik NuclearAB deltog tillsammans med andra laboratorier frAn sammanlagt nio olika lnder i en "roundrobin" provning av hydrerat material frAn trycktuber CANDU-reaktorer. Som en utoikning avdetta arbete freslogs m~tning av DH4C i hydrerat kapslingsmnaterial.
M~sttningen med freliggande arbete har varit att hos Studsvik Nuclear ta fram en metodfor maitning av sprickpropageringshastighet i konstant belastat, icke-bestr~lat kapslings-material av Zircaloy. Metoden har baserats pA den "Pin-Loading Tension Test" som nyligenutvecklats vid Studsvik for brottseghetsprovning av tunnvaggiga rr. DH4C-provningen utfbrspA prover pA icke-bestr~ilade kapslingsrdr fr tryckvattenreaktorer (SRA Zircaloy-4) somhydrerats till ca. 200 ppm. Vid provningen mats propageringshastigheten for en axiell spricka.
Sex PLT-prover har undersokts med avseende pA DHC under liknande provningsbetingelsersom vid tidigare provning av trycktubsmaterial. De uppmatta axiella sprickpropagerings-hastigheterna ligger mnom intervallet (2.6 - 3.0).10-8 m/s. Data uppvisar mycket godreproducerbarhet och ligger nigot under data for trycktubsmaterialet. Den metod somutvecklats for maning av axiell sprickpropageringshastighet hos tunnvaggiga rr kommer attanpassas fr provning av bestr~ilat kapslingsinaterial.
rapp\ski\00- 57\vg
1. INTRODUCTION
The International Atomic Agency (IAEA) has recently initiated a Co-ordinated ResearchProgramme (CRP) on "Hydrogen and hydride induced degradation of the mechanical andphysical properties of Zirconium-based alloys". In the first phase of this CRP themethodology for measuring the velocity of Delayed Hydride Cracking (DHC) was establishedand participating laboratories from nine countries around the world carried out identical testsin "round robin" on hydrided material of CANDU pressure tube. The results obtained atStudsvik Nuclear (Grigoriev and Jakobsson, 1999) agree well with the data from otherlaboratories.
As an extension of the work performed with pressure tube material the measurements of DH--Cin hydrided cladding materials were suggested. The Swedish Nuclear Power Inspectoratesponsors the development of a constant load cracking test procedure and supports theparticipation of Studsvik Nuclear in the IAEA CRP. The objective of the present work is todevelop the procedure for measuring the axial crack velocity in hydrided Zircaloy cladding.
The procedure is based on the Pin-Loading Tension test recently developed at Studsvik forfracture toughness testing of thin-walled tubing (Grigoriev et. al., 1996, 1997, 2000). Constantload tests in the present work are performed at 2500 C on the specimens cut from unirradiatedhydrided PWR cladding (SRA Zircaloy-4, 200 wtppm of hydrogen) and the velocity of crackpropagation is determined in each test.
Six PLT-specimens of different length (9 and 13 mm) have been tested for DHC at testparameters similar to the parameters earlier used for pressure tube material. The axial crackgrowth velocities measured on the PLT-specimens are within the interval of (2.6-3.0) .10-8
m/s showing very good reproducibility and being slightly below the data for pressure tubematerial. The procedure developed for measuring the axial crack velocity in the thin-walledtubing is adapted for the testing of irradiated cladding.
I rapp\ski\00- 57\vg
2. MATERIAL AND EQUIPMENT
2.1I. Material for testing
The PWR SRA Zircaloy-4 cladding tube manufactured by Sandvik Steel AB is used in thepresent work. Detailed information about the tube properties (Sandvik lot 86080) is collectedin Appendix A.
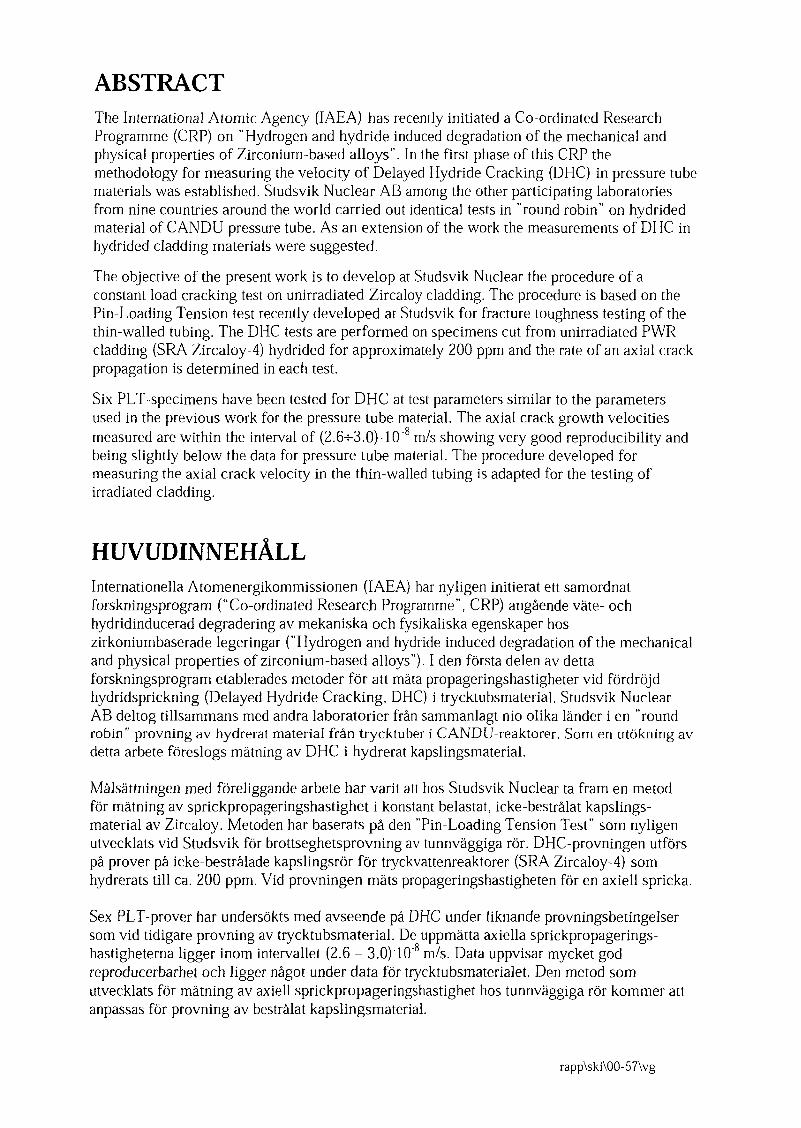
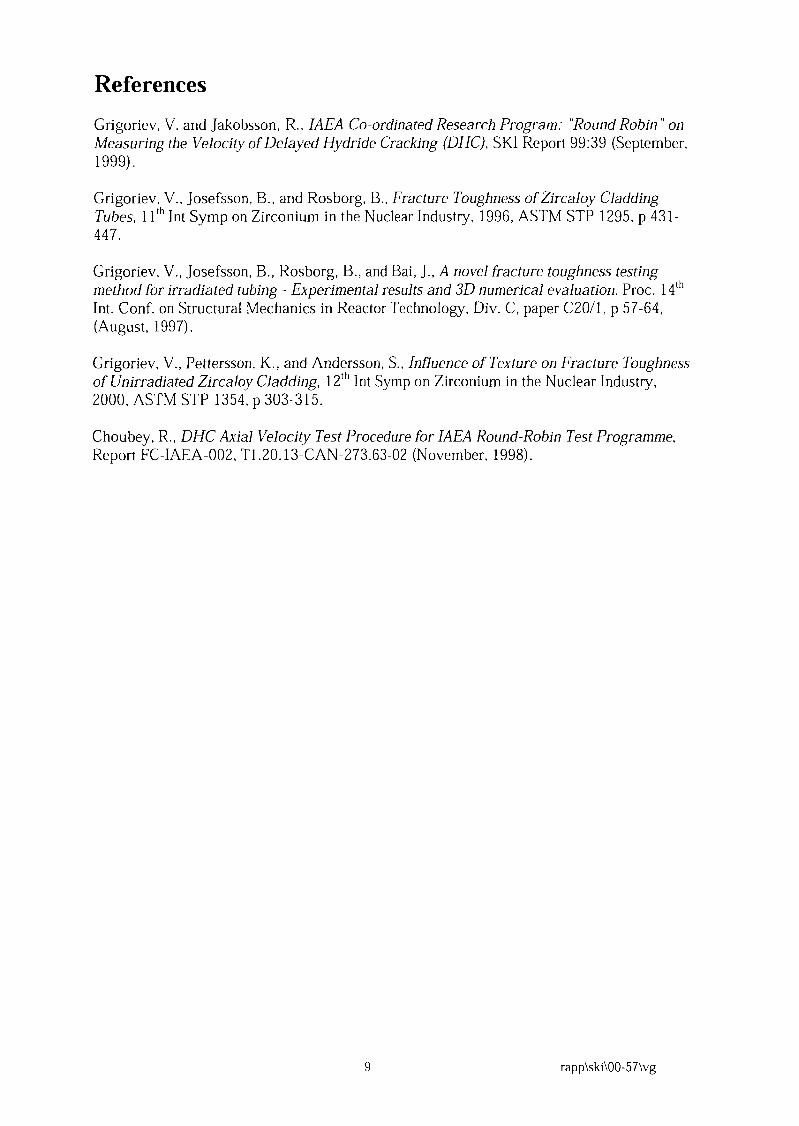
The pieces of cladding were electrolytically hydrided to hydrogen concentration of about 200ppm. Hydrided pieces were heat treated at 4100 G during 10 hours to obtain homogeneoushydride distribution. Fig. 1 show hydride morphology in the cladding wall thickness after 3 h,7 h, and 16 h of electrolytic hydriding followed by heat treatment. The uniform distribution ofhydrides is observed. To get a nominal concentration of 200 wtppm the hydriding has beenperformed during 14 hours. Hydriding and heat treatment of cladding pieces are performed atthe Royal Institute of Technology in Stockholm.
2.2. Equipment
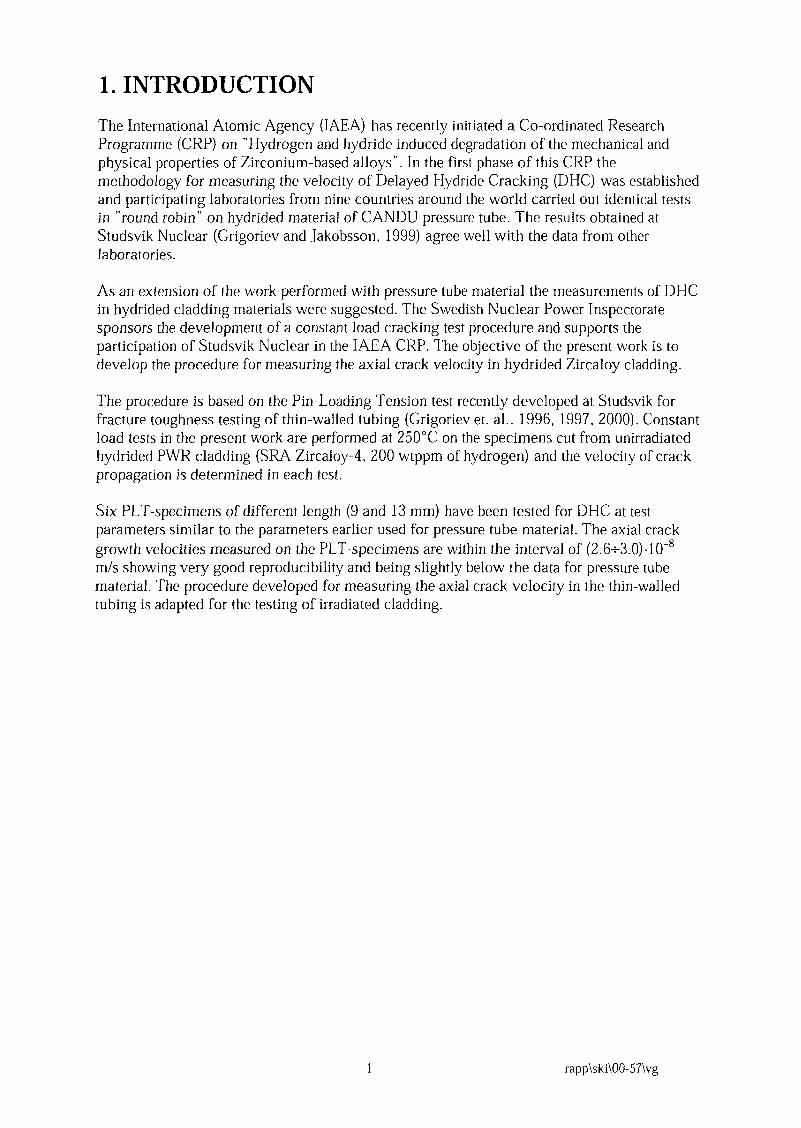
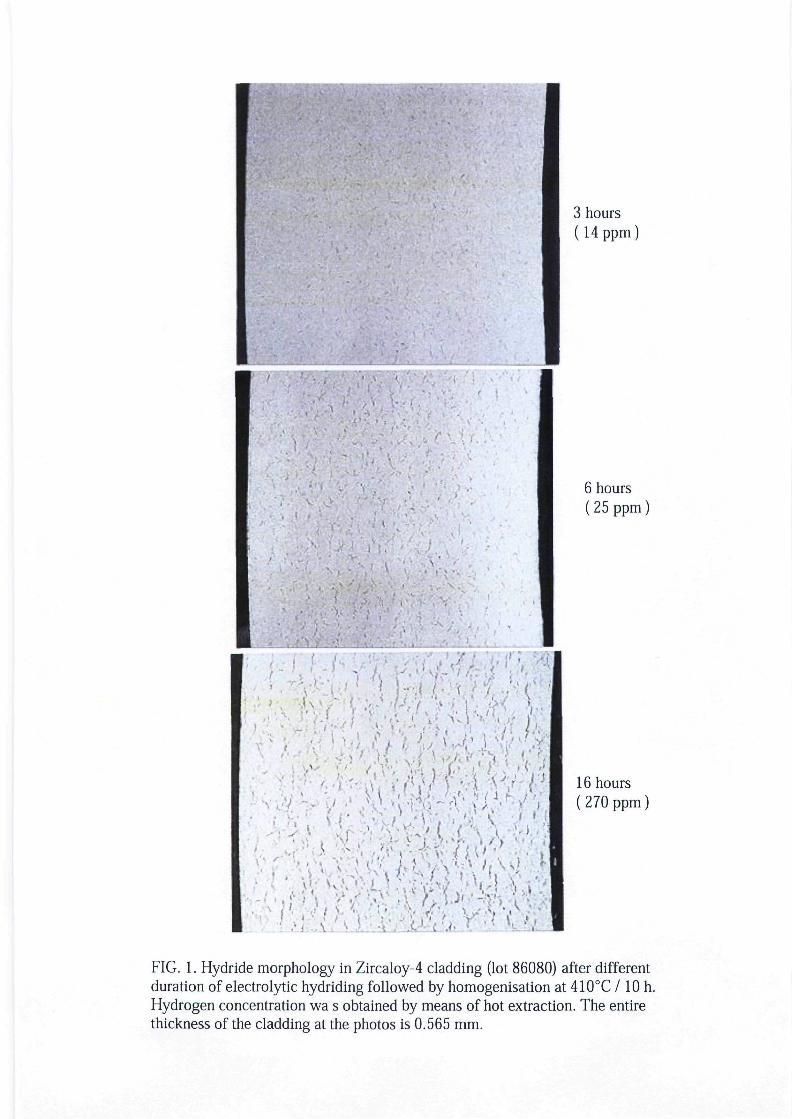
The testing is performed in a servo-hydraulic Instron 1362 machine with a 50 kN capacity(specimens PL-T- 13) and in a servo-hydraulic Instron 8872 machine with a 1 0 kN capacity(specimens PL-T-9). The testing machines are calibrated for machine class 0.5 (accuracywithin 0.5 %) according to the Swedish National Standard SS-EN 10002-2 by an accreditedbody. The experimental set up for the measurements is the same for both machines and issimilar to that used in the Round Robin tests on CANDU pressure tubes (Grigoriev andJakobsson, 1999). The calibration record sheet for the instruments used in the present work isshown in Appendix B. Main units of measuring equipment are shown in Fig. 2.
2.3. Specimen and fixture configuration
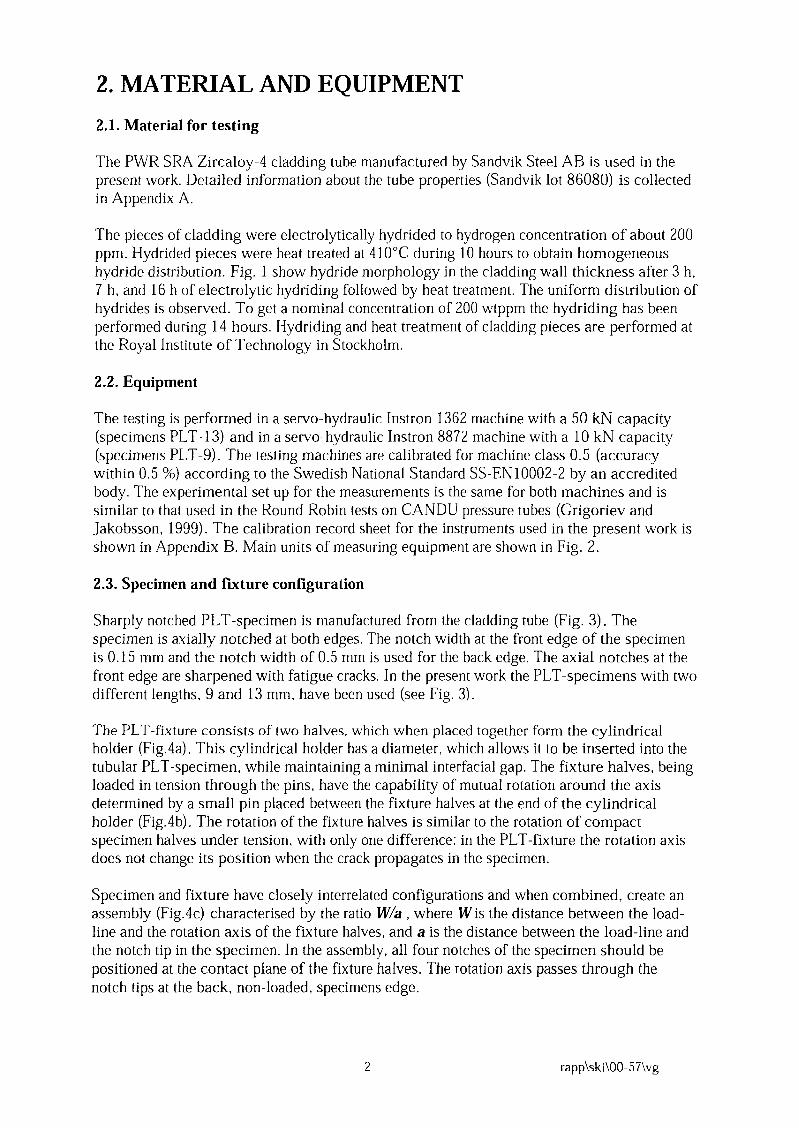
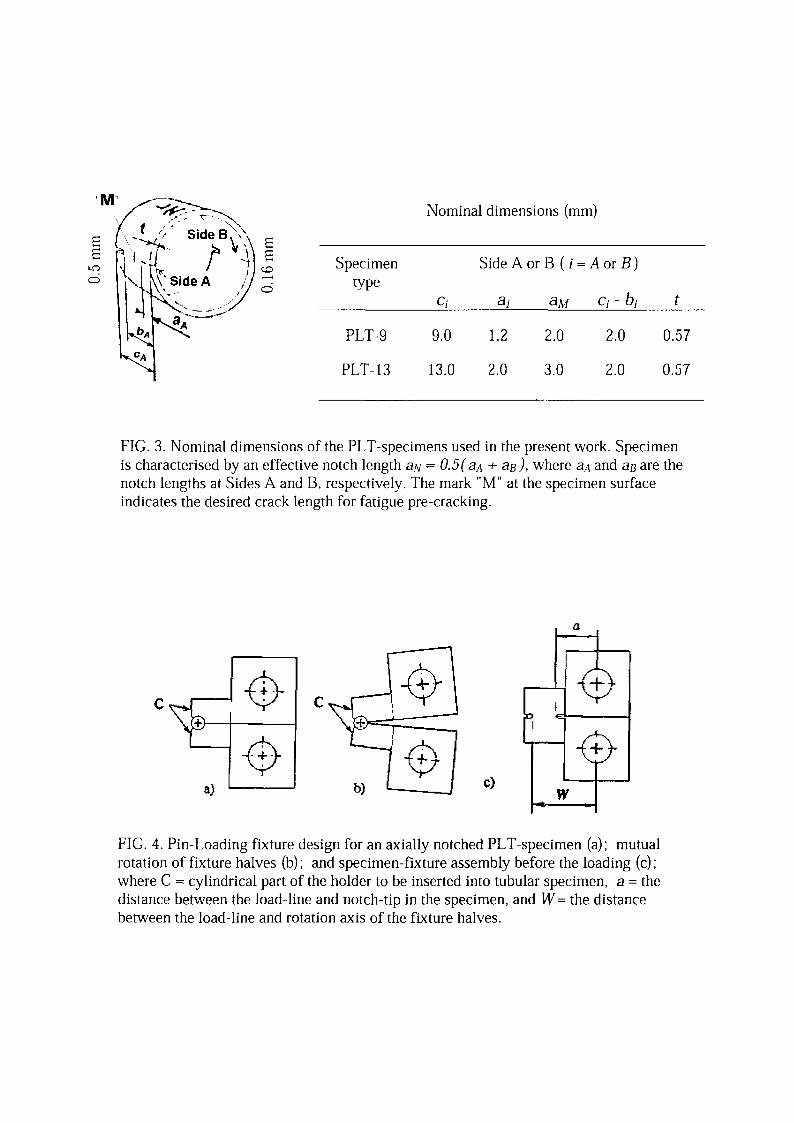
Sharply notched PLT-specimen is manufactured from the cladding tube (Fig. 3). Thespecimen is axially notched at both edges. The notch width at the front edge of the specimenis 0. 15 mm and the notch width of 0. 5 mm is used for the back edge. The axial notches at thefront edge are sharpened with fatigue cracks. In the present work the PLT-specimens with twodifferent lengths, 9 and 13 mm, have been used (see Fig. 3).
The PLT-fixture consists of two halves, which when placed together form the cylindricalholder (Fig.4a). This cylindrical holder has a diameter, which allows it to be inserted into thetubular PLT-specimen, while maintaining a minimal interfacial gap. The fixture halves, beingloaded in tension through the pins, have the capability of mutual rotation around the axisdetermined by a small pin placed between the fixture halves at the end of the cylindricalholder (Fig.4b). The rotation of the fixture halves is similar to the rotation of compactspecimen halves under tension, with only one difference: in the PL-T-fixture the rotation axisdoes not change its position when the crack propagates in the specimen.
Specimen and fixture have closely interrelated configurations and when combined, create anassembly (Fig.4c) characterised by the ratio W/a , where W is the distance between the load-line and the rotation axis of the fixture halves, and a is the distance between the load-line andthe notch tip in the specimen. In the assembly, all four notches of the specimen should bepositioned at the contact plane of the fixture halves. The rotation axis passes through thenotch tips at the back, non-loaded, specimens edge.
2 rapp\ski\00-57\vg
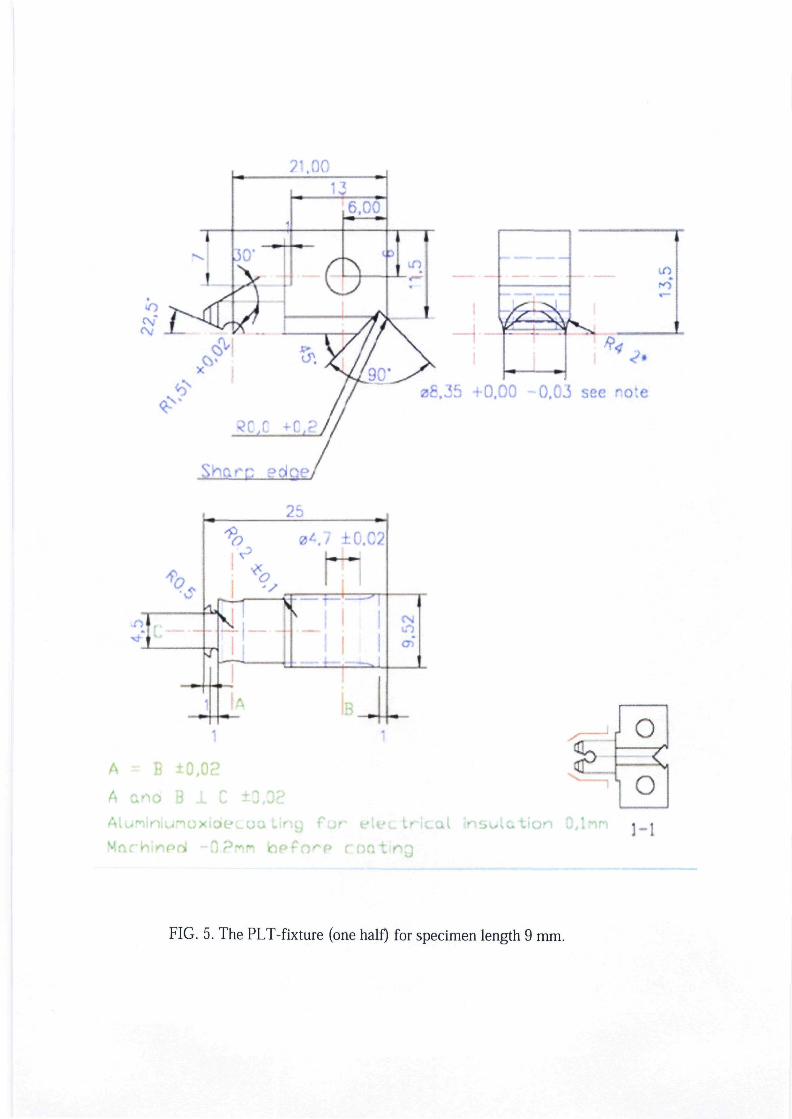
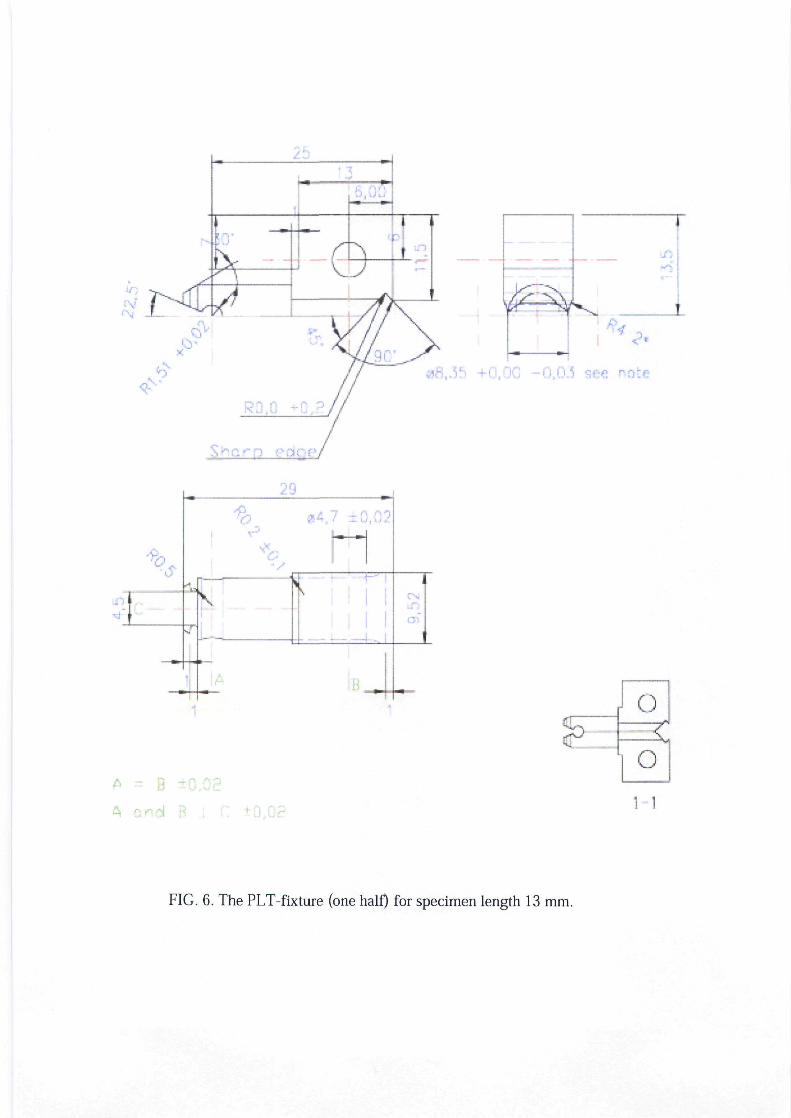
To perform the potential drop measurements of the crack extension the fixture should beinsulated from the specimen. In the present work the cylindrical holder was insulated bymeans of a ceramic layer (A120 3) precipitated at the fixture surface due to plasma injection.Finally, the ceramic layer was polished down to the final diameter 8.35 (+0.00 -0.03) mmshown in Figs. 5, 6. The PLT fixtures for the specimen lengths of 9 mm and 13 mm are shownin Fig.7a. The fixture for specimens PLT-13 is shown without ceramic coating. Though noindications of specimen slippage from cylindrical holder have been noticed, a catch made ofstainless steel wire (see Fig.7a) is used at the backside of cylindrical holder during fatiguepre-cracking. The catch is taken away before the DH-C loading. The specimen-fixtureassembly with attached electrical connections for potential drop measurements is shown inFig. 7b.
The loading of the fixture is performed through the pins of 4.0 mm in diameter, while a pin of3.0 mm in diameter determines the rotation axis for the fixture halves (Fig. 7a, b). The fixtureis manufactured from Nimonic 90 and pins are made from hardened steel. The schematicview of the pull rod assembly is shown in Fig. 7d. Displacement transducer (LVDT) isattached to the mouth of the PET-fixture to measure fixture opening during the test.
3 rapp\ski\00- 57\vg
3. TEST PROCEDURES
3.1. Specimen preparation
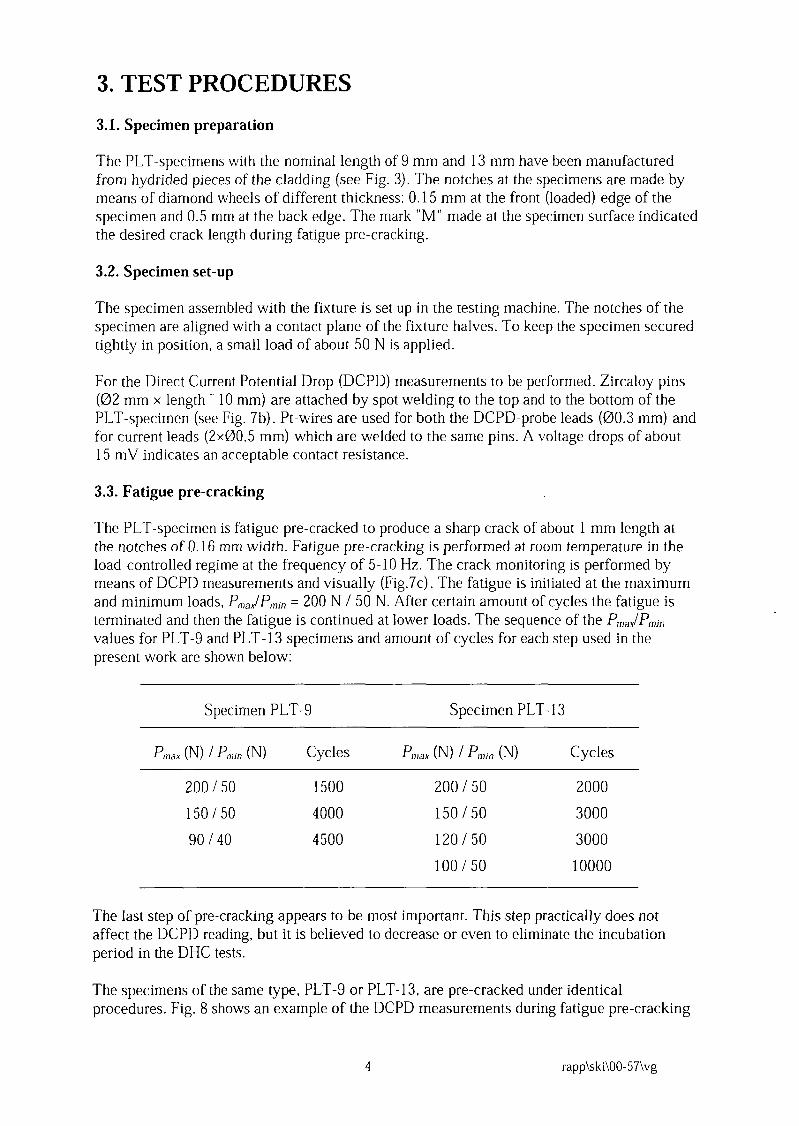
The PLT-specimens with the nominal length of 9 mm and 13 mm have been manufacturedfrom hydrided pieces of the cladding (see Fig. 3). The notches at the specimens are made bymeans of diamond wheels of different thickness: 0. 15 mm at the front (loaded) edge of thespecimen and 0.5 mm at the back edge. The mark M` made at the specimen surface indicatedthe desired crack length during fatigue pre-cracking.
3.2. Specimen set-up
The specimen assembled with the fixture is set up in the testing machine. The notches of thespecimen are aligned with a contact plane of the fixture halves. To keep the specimen securedtightly in position, a small load of about 50 N is applied.
For the Direct Current Potential Drop (DCPD) measurements to be performed, Zircaloy pins(02 mm x length - 10 mm) are attached by spot welding to the top and to the bottom of thePLT-specimen (see Fig. 7b). Pt-wires are used for both the DCPD-probe leads (00.3 mm) andfor current leads (2x00.5 mm) which are welded to the same pins. A voltage drops of about15 mV indicates an acceptable contact resistance.
3.3. Fatigue pre-cracking
The PLT-specimen is fatigue pre-cracked to produce a sharp crack of about 1 mm length atthe notches of 0. 16 mm width. Fatigue pre-cracking is performed at room temperature in theload-controlled regime at the frequency of 5-10 Hz. The crack monitoring is performed bymeans of DCPD measurements and visually (Fig.7c). The fatigue is initiated at the maximumand minimum loads, Pmax/Pmin = 200 N / 50 N. After certain amount of cycles the fatigue isterminated and then the fatigue is continued at lower loads. The sequence of the Pmnax/Pminvalues for PLT-9 and PLT-13 specimens and amount of cycles for each step used in thepresent work are shown below:
Specimen PLT-9 Specimen PLT-13
P.a (N) / I (N) Cycles P., (N) P P..117 (N) Cycles
200/50 1500 200/50 2000
150/50 4000 150/50 3000
90/40 4500 120/50 3000
100/50 10000
The last step of pre-cracking appears to be most important. This step practically does notaffect the DCPD reading, but it is believed to decrease or even to eliminate the incubationperiod in the DHC tests.
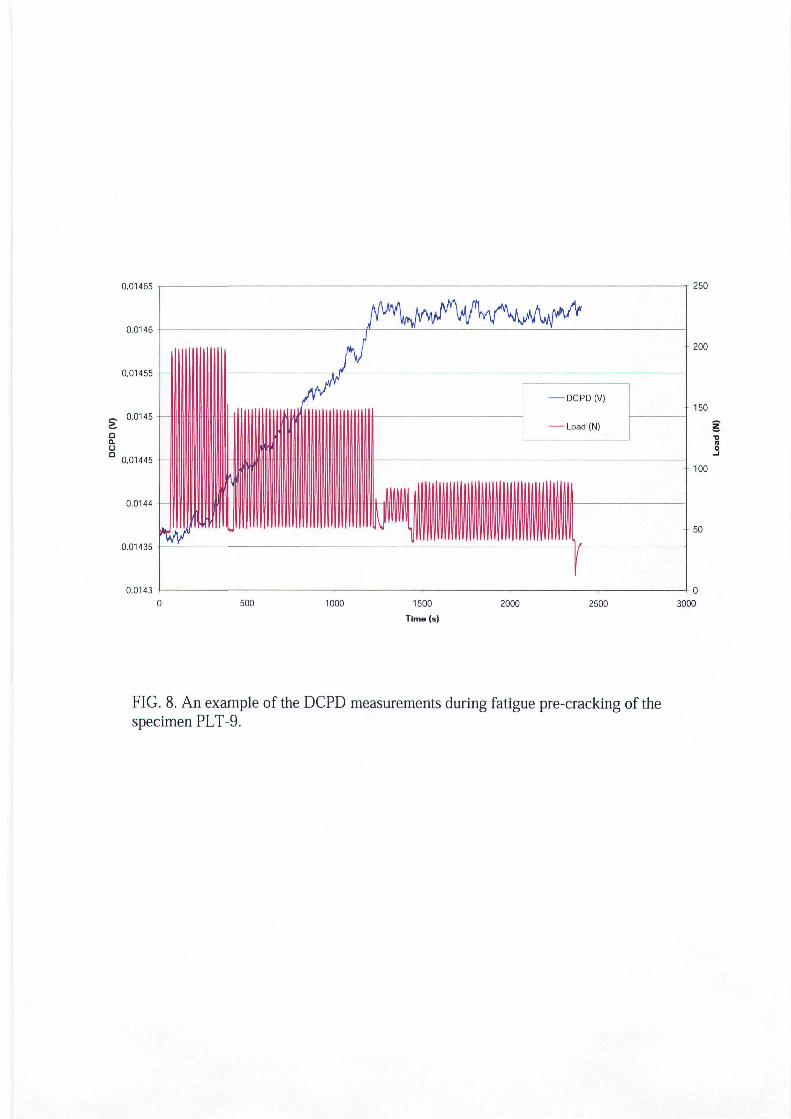
The specimens of the same type, PLT-9 or PLT- 13, are pre-cracked under identicalprocedures. Fig. 8 shows an example of the DCPD measurements during fatigue pre-cracking
4 rapp\ski\00-57\vg
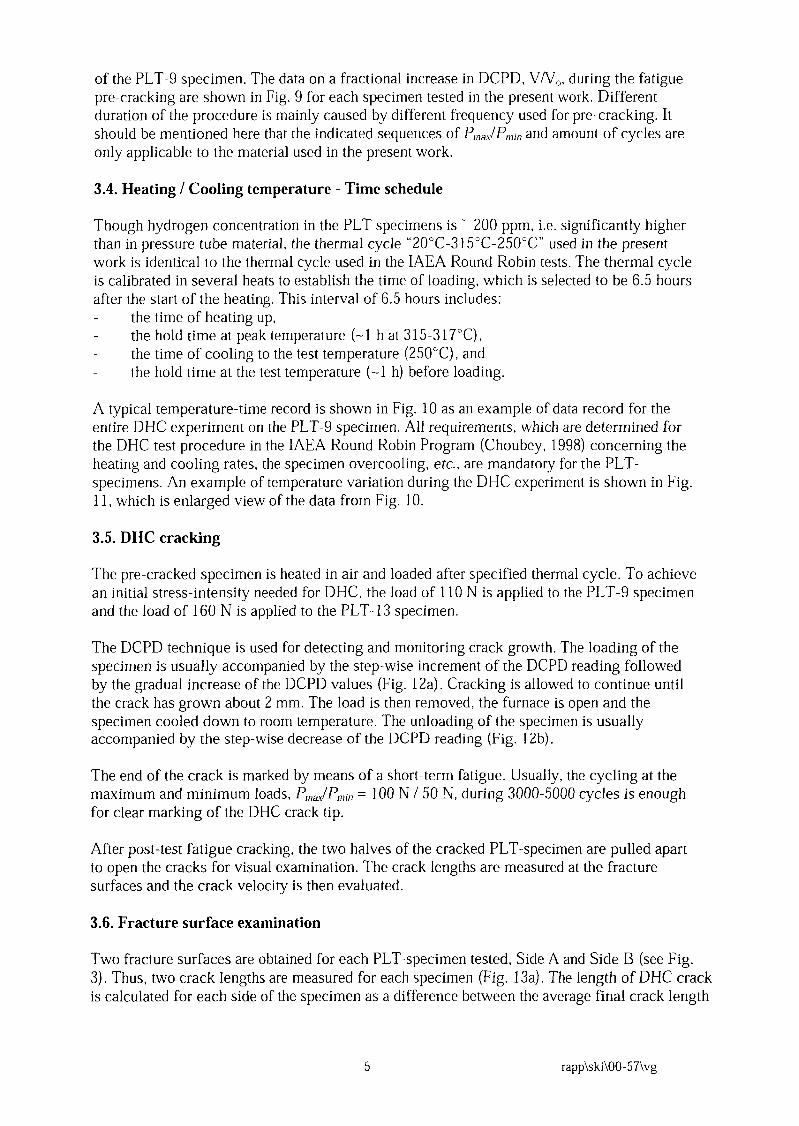
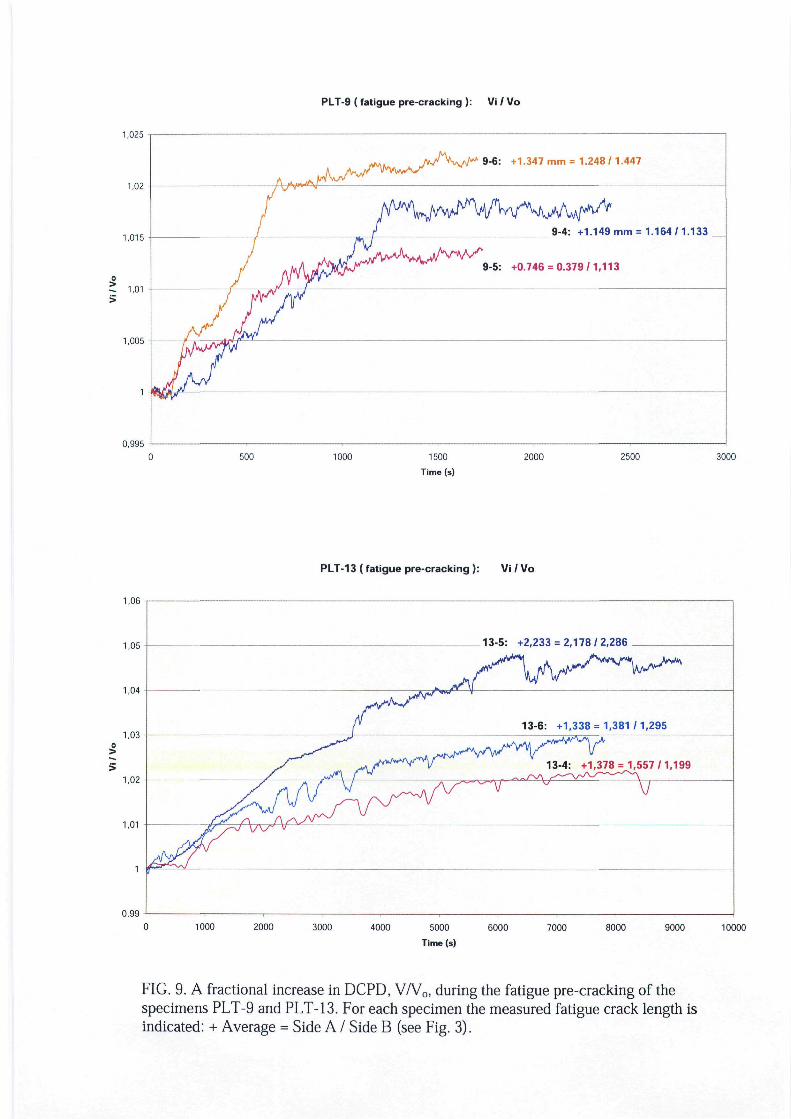
of the PLT-9 specimen. The data on a fractional increase in DCPD), V/' 0, during the fatiguepre-cracking are shown in Fig. 9 for each specimen tested in the present work. Differentduration of the procedure is mainly caused by different frequency used for pre-cracking. Itshould be mentioned here that the indicated sequences of P,,,1P,,, and amount of cycles areonly applicable to the material used in the present work.
3.4. Heating / Cooling temperature - Time schedule
Though hydrogen concentration in the PLT specimens is 200 ppm, i.e. significantly higherthan in pressure tube material, the thermal cycle "20 0 C-315'C-250'C" used in the presentwork is identical to the thermal cycle used in the AEA Round Robin tests. The thermal cycleis calibrated in several heats to establish the time of loading, which is selected to be 6.5 hoursafter the start of the heating. This interval of 6.5 hours includes:- the time of heating up,- the hold time at peak temperature (-1 h at 315-317'C),- the time of cooling to the test temperature (250'C), and- the hold time at the test temperature (-1 h) before loading.
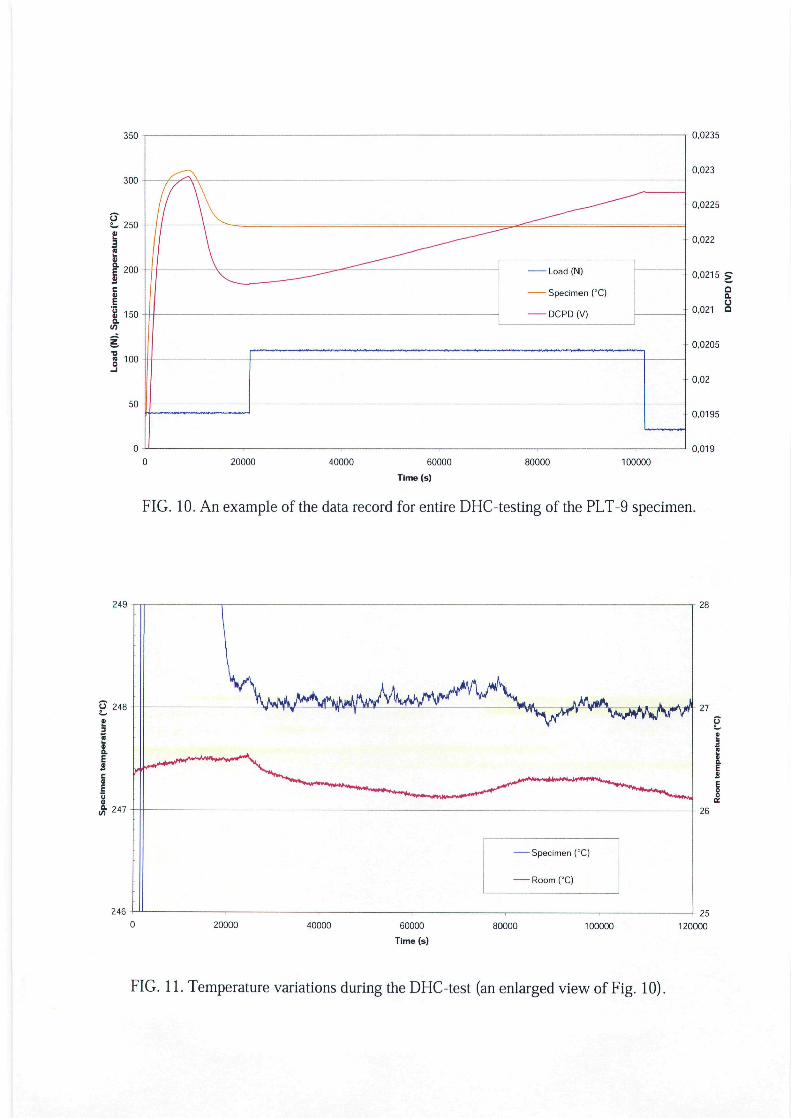
A typical temperature-time record is shown in Fig. 10 as an example of data record for theentire DH-C experiment on the PLT-9 specimen. All requirements, which are determined forthe DH-C test procedure in the AEA Round Robin Program (Choubey, 1998) concerning theheating and cooling rates, the specimen overcooling, etc., are mandatory for the PLT-specimens. An example of temperature variation during the DI-C experiment is shown in Fig.1 1, which is enlarged view of the data from Fig. 10.
3.5. DHC cracking
The pre-cracked specimen is heated in air and loaded after specified thermal cycle. To achievean initial stress-intensity needed for DH-C, the load of 1 10 N is applied to the PLT-9 specimenand the load of 160 N is applied to the PLT- 13 specimen.
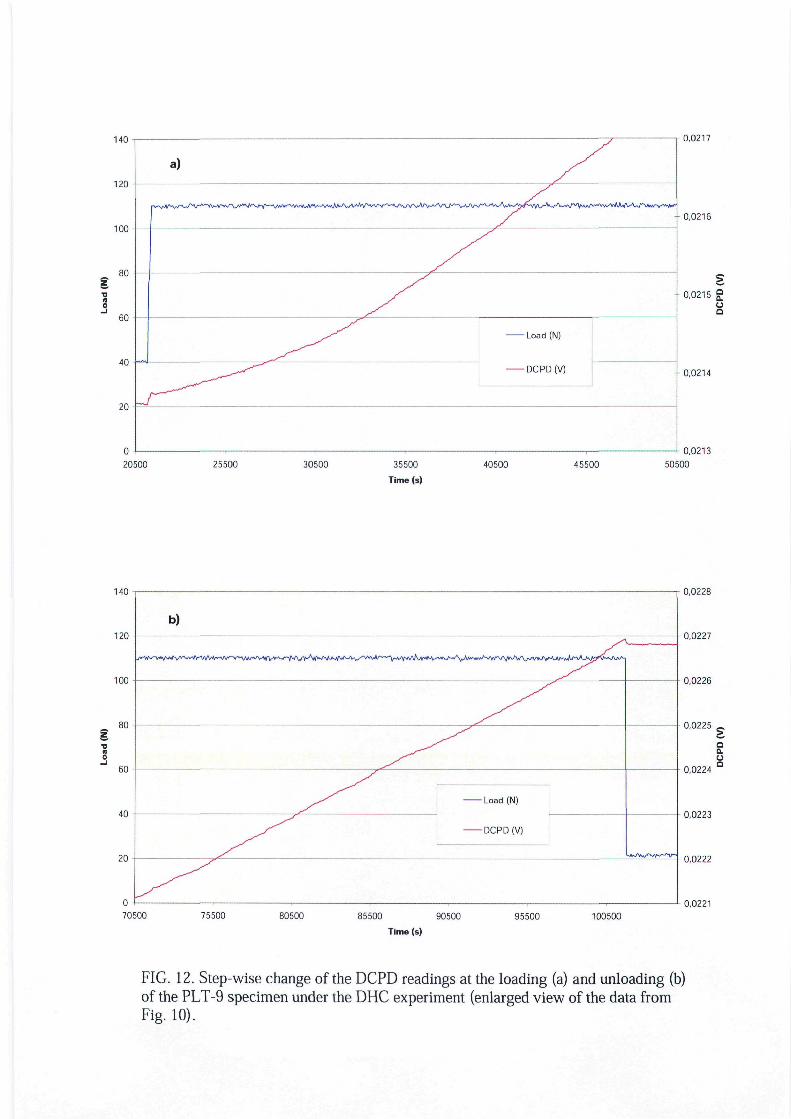
The DCPD) technique is used for detecting and monitoring crack growth. The loading of thespecimen is usually accompanied by the step-wise increment of the DCPD) reading followedby the gradual increase of the DCPD) values (Fig. 1 2a). Cracking is allowed to continue untilthe crack has grown about 2 mm. The load is then removed, the furnace is open and thespecimen cooled down to room temperature. The unloading of the specimen is usuallyaccompanied by the step-wise decrease of the DCPD) reading (Fig. I12b).
The end of the crack is marked by means of a short-term fatigue. Usually, the cycling at themaximum and minimum loads, Pmax/Pnj = 100 N / 50 N, during 3000-5000 cycles is enoughfor clear marking of the DH4C crack tip.
After post-test fatigue cracking, the two halves of the cracked PLT-specimen are pulled apartto open the cracks for visual examination. The crack lengths are measured at the fracturesurfaces and the crack velocity is then evaluated.
3.6. Fracture surface examination
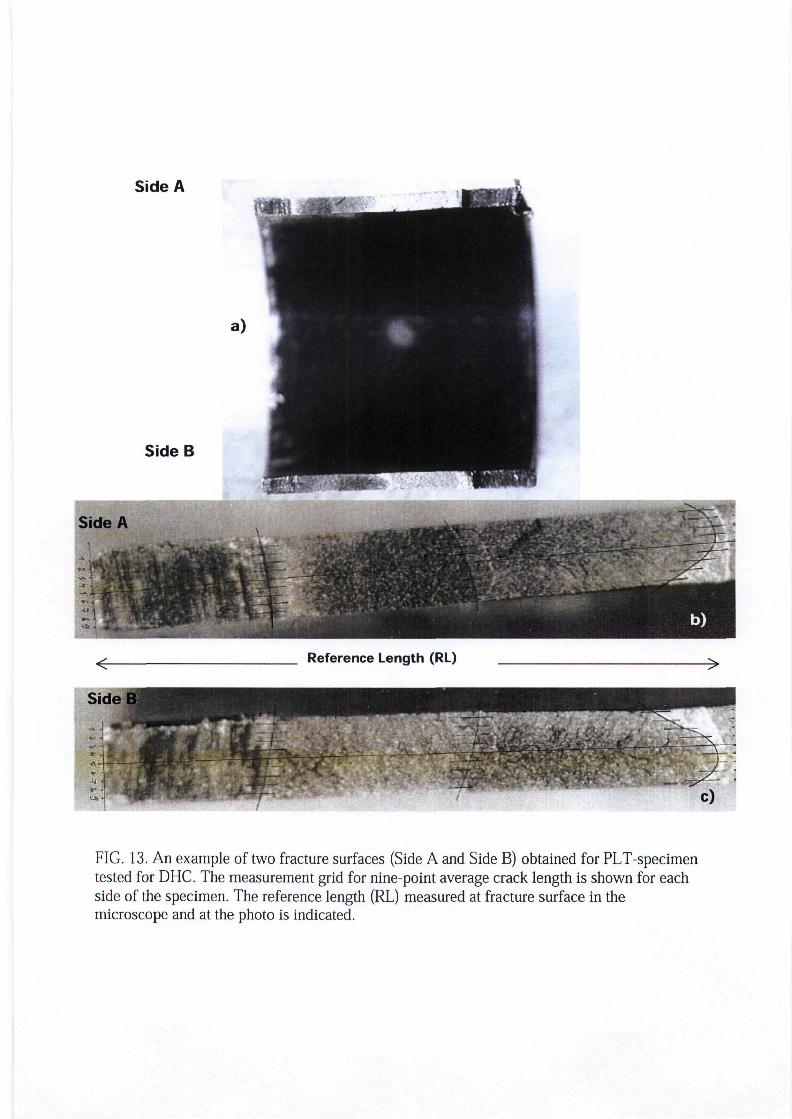
Two fracture surfaces are obtained for each PLT-specimen tested, Side A and Side B (see Fig.3). Thus, two crack lengths are measured for each specimen (Fig. 3a). The length of DHC crackis calculated for each side of the specimen as a difference between the average final crack length
5 rapp\ski\00-57\vg
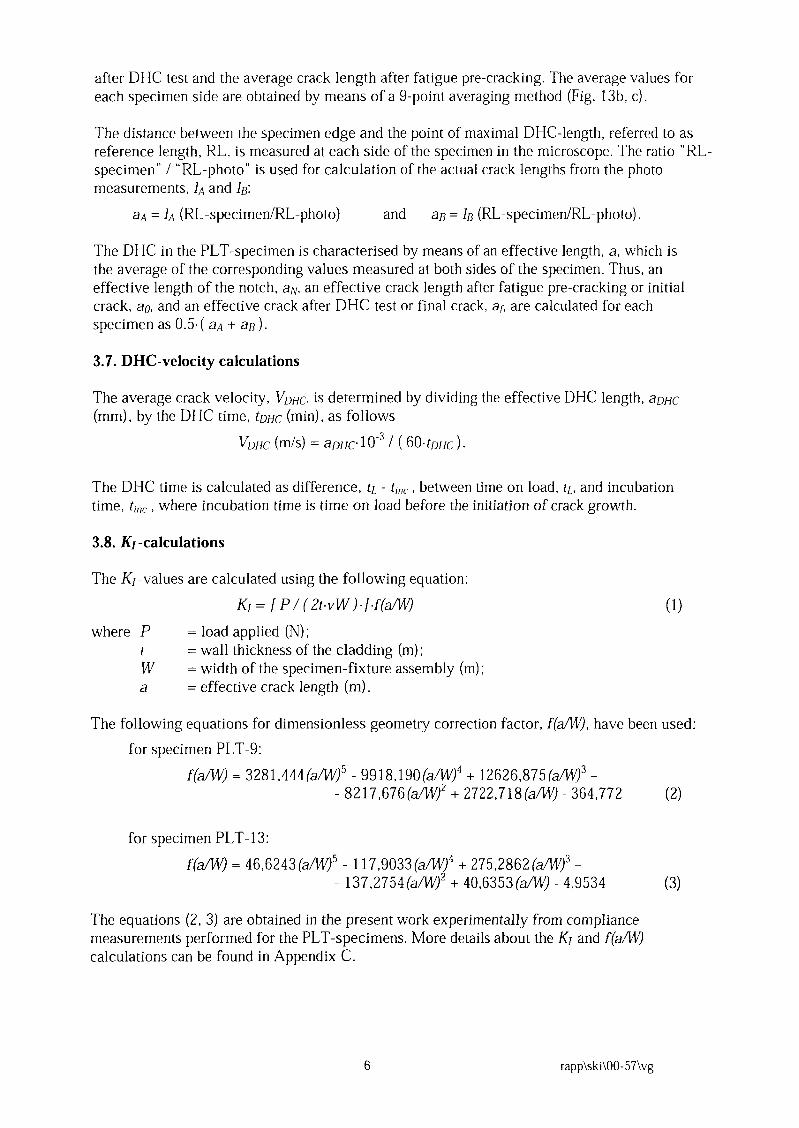
after DHC test and the average crack length after fatigue pre-cracking. The average values foreach specimen side are obtained by means of a 9-point averaging method (Fig. 13b, c).
The distance between the specimen edge and the point of maximal DHC-Iength, referred to asreference length, RL, is measured at each side of the specimen in the microscope. The ratio RL-specimen" / "RL-photo` is used for calculation of the actual crack lengths from the photomeasurements, A and B:
aA = A (RL-specimen/RL-photo) and aB = B (RL-specimen/RL-photo).
The DHC in the PLT-specimen is characterised by means of an effective length, a, which isthe average of the corresponding values measured at both sides of the specimen. Thus, aneffective length of the notch, aN, an effective crack length after fatigue pre-cracking or initialcrack, ao, and an effective crack after DH-C test or final crack, a, are calculated for eachspecimen as O. 5. ( aA + aB ).
3.7. DHC-velocity calculations
The average crack velocity, VDHC, is determined by dividing the effective DHC length, aDHC
(mm), by the DHC time, tDHC (min), as follows
VDHC (/S) = aDHclO 1 / (O4. DHc)
The D1HC time is calculated as difference, QtL -c between time on load, tL, and incubationtime, tic where incubation time is time on load before the initiation of crack growth.
3.8. K1 -calculations
The K1 -values are calculated using the following equation:
K, = [ P/ (2tvW).].f(aW)(1
where P = load applied (N);= wall thickness of the cladding ();
W =width of the specimen-fixture assembly ():a = effective crack length ().
The following equations for dimensionless geometry correction factor, (a/W), have been used:
for specimen PLT-9:
.f(a/W) 3281,444(a/W)5 - 9918,190(a/W/' + 12626,875(a/) -
- 8217,676 (aW)2 + 2722,718(a/W) - 364,772 (2)
for specimen PLT- 13:
f(a/W) = 46,6243(/) -117,9033(aW + 275,2862 (aW)-- 137,2754(a/W)2 + 40,6353(a/W) - 4,9534 (3)
The equations (2, 3) are obtained in the present work experimentally from compliancemeasurements performed for the PLT-specimens. More details about the K, and f(a/W)calculations can be found in Appendix C.
6 rapp\ski\00-57\vg
4. RESULTS AND DISCUSSIONS
4.1I. DHC testing
The summary of the DH-C tests on hydrided Zircaloy cladding performed by means of thePLT-technique is shown in Appendix D. Independently of the specimen length, 9 or 13 mm,good reproducibility of the axial crack velocity, VDHC, is observed. The VDHC-values for allspecimens tested are within the interval from 2.6. 10-8 m/s to 3.0. 10-8 m/s. This is slightlybelow the axial crack velocities earlier obtained for Zr-2.5Nb CANDLJ pressure tube materialtested at the same temperature (315'C / 2500 C) and stress intensities (1 5-25 MPavm).Detailed information about each specimen tested is collected in Appendix E.
4.2. Crack extension measurements
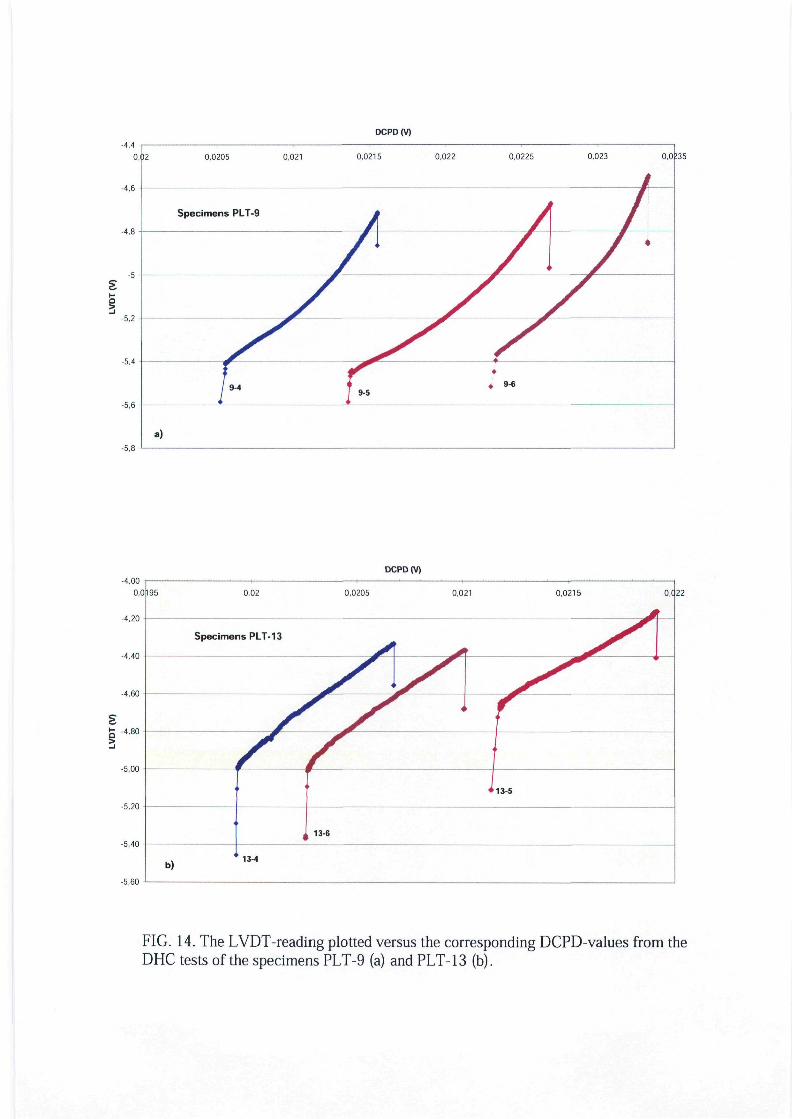
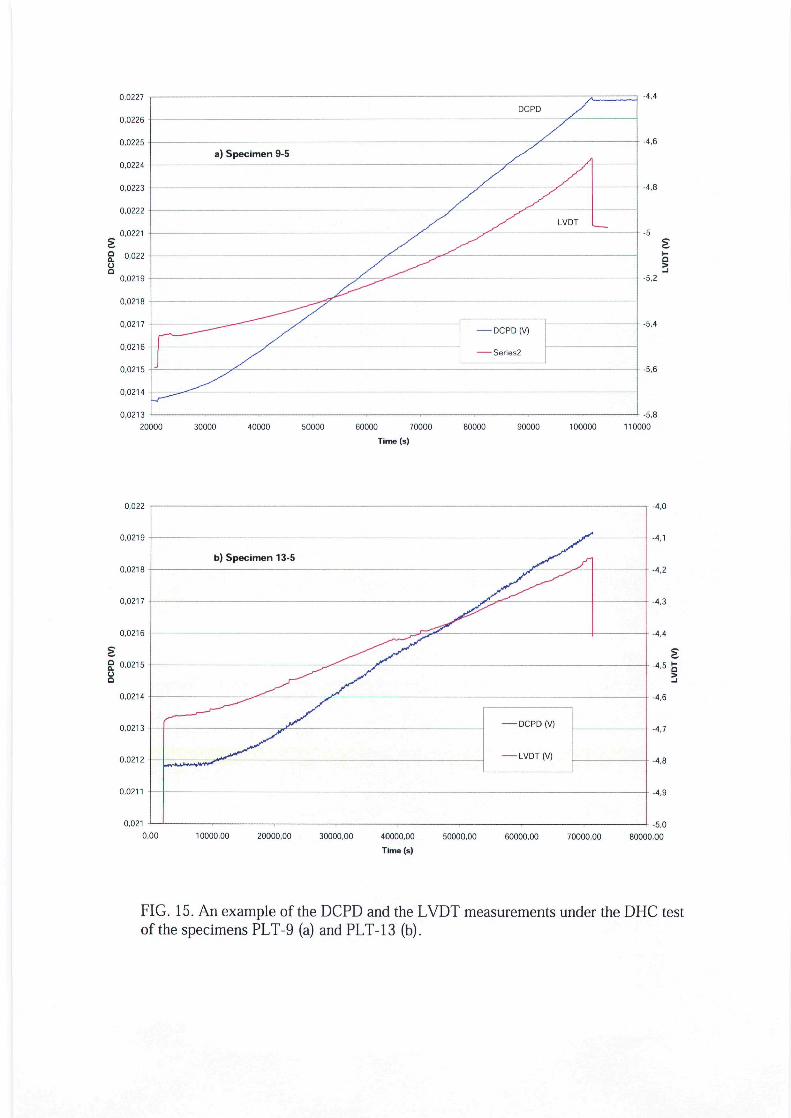
The use of the DCPD) technique for crack extension measurements in the PL-T-specimensmight be difficult because of the problems with an insulating layer at the fixture surface. Insuch a case, the use of the LVDT for measuring of the fixture mouth opening can be analternative solution. The LVDT readings plotted versus the corresponding DCPD-values areshown in Fig. 14 for all specimens tested. In all cases, the LVDT readings clearly indicate theloading/unloading moments and, in general, are proportional to the DCPD) values. The LVDTmeasurements appear to be an acceptable alternative for DCPD) measurements to detect aninitiation of an axial crack extension (Fig. 15).
4.3. Crack surface topography
The DH-C-crack surface topography obtained in the present work for unirradiated specimensappears to reproduce the main topographical features observed for axial splits in failed fuelrods:
- crack surface is macroscopically flat and oriented along the radial plane of the cladding;
- clear "shevron" pattern is observed along the entire DH-C-crack length;
- despite the notch length and fatigue crack length are longest at the inner surface of thespecimen, the DHC-crack propagates faster in the outer layers of the specimen;
- visual examination of the specimen outer surface shows that the fatigue crackpropagates without any signs of the specimen thinning. However, clear indications ofthe localised thinning of the specimen wall are observed along the DHC-crack.
7 rapp\ski\00- 57\vg
CONCLUSIONS
The procedure for measuring the axial crack velocity in hydrided Zircaloy cladding has beendeveloped. The procedure is based on the Pin-Loading Tension test recently developed atStudsvik for fracture toughness testing of thin-walled tubing.
Six specimens of hydrided Zircaloy cladding (SRZA Zircaloy-4, 200 wtppm) have been testedfor delayed hydride cracking at 250'C. The axial crack growth velocities measured in thetests are within the interval of (2.6+ 3.0).10-8 rn/s. The experimental set-up shows very goodreproducibility of the test results and is adapted for the testing of irradiated claddingmaterials.
ACKNOWLEDGMENTS
The Swedish Nuclear Power Inspectorate, whose support is gratefully acknowledged, hassponsored this work.
The authors would like to thank:
Mr. T. Andersson - Sandvik Steel AB, for delivery of Zircaloy cladding;
Mr. K. Pettersson - Royal Institute of Technology, for arranging of Zircaloy claddinghydriding and valuable discussions:
Mr. H. Ericsson - Studsvik Nuclear AB, for making photographs:
Mr. M. Nykvist - Studsvik Nuclear AB, for help in performing DI-IC tests:
Mr. . In de Betou - the Swedish Nuclear Power Inspectorate, for interest in this work.
Mr. K. Coleman - Chalk River Laboratory, for all encouragement and help:
Mr. . Ritchie - International Atomic Energy Agency, as well as all members ofthe IAEA CRP group, for stimulating support and interest in thiswork.
8 rapp\ski\00- 57\vg
References
Grigoriev, V. and Jakobsson, R., IAEA Co-ordina ted Research Program: Round Robin " onMeasuring the Velocity of Delayed Hydride Cracking (DHC), SKI Report 99:39 (September,1999).
Grigoriev, V., Josefsson, B.,- and Rosborg, B., Fracture Toughness of Zircaloy CladdingTubes, 1 rh It Symp on Zirconium in the Nuclear Industry, 1996, ASTM STP 1295, p 431-447.
Grigoriev, V., Josefsson, B.,- Rosborg, B., and Bai, J., A novel fracture toughness testingmethod for irradiated tubing - Experimental results and 3D numerical evaluation. Proc. 14th
Int. Conf. on Structural Mechanics in Reactor Technology, Div. C, paper C20/1, p 57-64,(August, 1997).
Grigoriev, V., Pettersson, K., and Andersson, S_, Influence of Texture on Fracture Toughnessof Unirradiated Zircaloy Cladding, 1 2 th Int Symp on Zirconium in the Nuclear Industry,2000, ASTM STP 1354, p 303-3 15.
Choubey, R_, DHC Axial Velocity Test Procedure for IAEA Round-Robin Test Programme,Report FC-IAEA-002, TlI.20.1 3-CAN-273.63-02 (November, 1998).
9 rapp\ski\00-57\vg
1 • • • , • • • • . '.'.'f ',V.'> / , •' r; '• .-• • . .<
3 hours(14ppm)
6 hours(25 ppm)
16 hours(270 ppm)
FIG. 1. Hydride morphology in Zircaloy-4 cladding (lot 86080) after differentduration of electrolytic hydriding followed by homogenisation at 410°C / 10 h.Hydrogen concentration wa s obtained by means of hot extraction. The entirethickness of the cladding at the photos is 0.565 mm.
FIG. 2. Experimental set of measuring equipment for the DHC testing:1 Thermometer Comark 62002 DC Power Supply HP E3614A3 Nano-voltmeter HP 344204 LVDT Readout Lucas Schaevitz MP2000
M ~~~~~~~~~~Nominal dimensions (mm)
Side S>
~~ side; ~~~~Specimen Side A or B (iAor B)C:5 A ~~~~~~~type
Ci ai am c - b t
bA aA ~~~~PLT-9 9.0 1.2 2.0 2.0 0.57
PLT- 13 13.0 2.0 3.0 2.0 0.57
FIG. 3. Nominal dimensions of the PLT-specimens used in the present work. Specimenis characterised by an effective notch length aN = US ( aA + aB ), where aA and aB are thenotch lengths at Sides A and B, respectively. The mark M` at the specimen surfaceindicates the desired crack length for fatigue pre-cracking.
+ c
a) b)w
FIG. 4. Pin-Loading fixture design for an axially notched PLT-specimen (a); mutualrotation of fixture halves (b); and specimen-fixture assembly before the loading (c);where C = cylindrical part of the holder to be inserted into tubular specimen, a = thedistance between the load-line and notch-tip in the specimen, and W= the distancebetween the load-line and rotation axis of the fixture halves.
1C
,J5 -i 0.00 -0.03 see note
r>
"PY?,j
• O.C2
•s
rs
crT
r^1 iA - B ±0,02
1-1' •
FIG. 5. The PLT-fixture (one half) for specimen length 9 mm.
1 '» •'
-.
•
X
1
%
1
_
"i s
*
•?'%
B
oo
1 1
FIG. 6. The PLT-fixture (one half) for specimen length 13 mm.
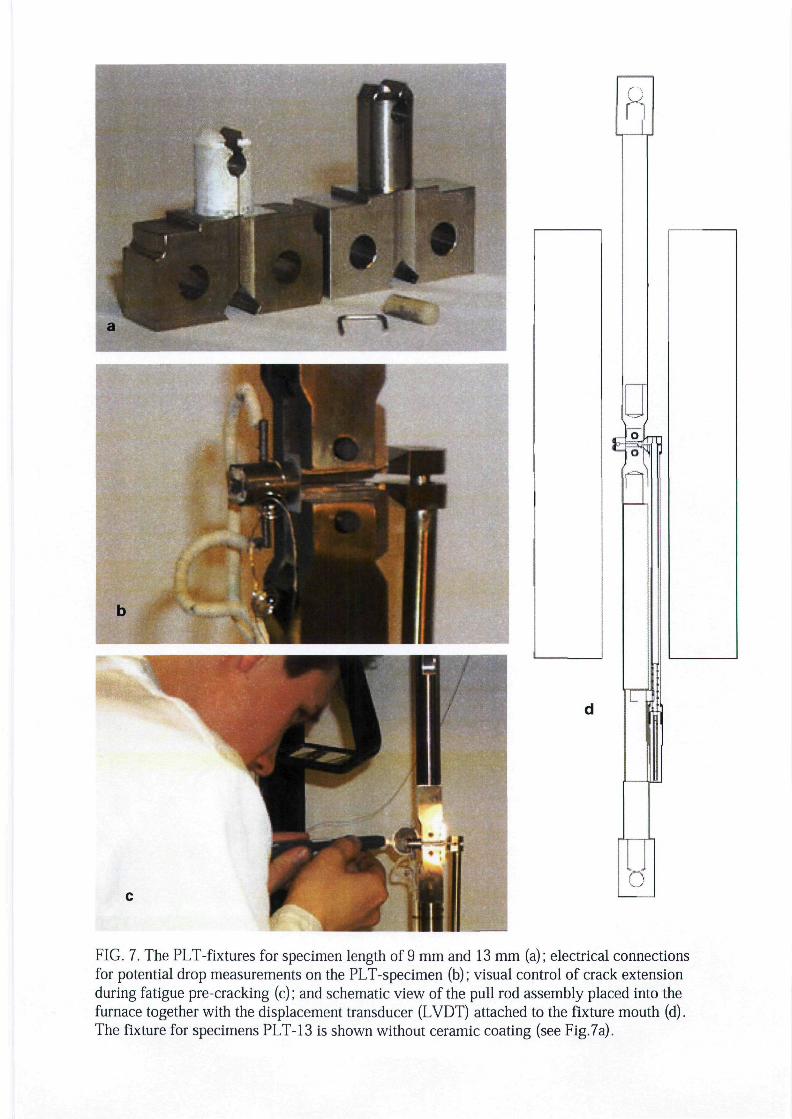
FIG. 7. The PLT-fixtures for specimen length of 9 mm and 13 mm (a); electrical connectionsfor potential drop measurements on the PLT-specimen (b); visual control of crack extensionduring fatigue pre-cracking (c); and schematic view of the pull rod assembly placed into thefurnace together with the displacement transducer (LVDT) attached to the fixture mouth (d).The fixture for specimens PLT-13 is shown without ceramic coating (see FigJa).
0,01465
0,0146
0,01455
0,0145
0,01445
0,0144
0,01435
0,0143
500 1000 1500
Time (s)
2000 2500
250
200
150
100
50
L 0
3000
FIG. 8. An example of the DCPD measurements during fatigue pre-cracking of thespecimen PLT-9.
PLT-9 ( fatigue pre-cracking ): Vi / Vo
9-6: +1.347 mm = 1.248/1.447
9-4: +1.149 mm = 1.164/1.133
9-5: +0.746 = 0.379/1,113
0,9952500 3000
PLT-13 (fatigue pre-cracking ): Vi / Vo
1,06
0,99
13-5: +2,233 = 2,178/2,286
13-6: +1,338 = 1,381/1,295
13-4: +1,378 = 1,557/1,199
1,05
1,04
1,03
1,02
1,01 -
9000 10000
FIG. 9. A fractional increase in DCPD, V/V0) during the fatigue pre-cracking of thespecimens PLT-9 and PLT-13. For each specimen the measured fatigue crack length isindicated: + Average = Side A / Side B (see Fig. 3).
350
300
250
200
150 -
I•o
- Load (N)
Specimen (°C)
-DCPD(V)
100
50
0,0235
0,023
0,0225
0,022
0,0215 5-
e0,021 Q
0,0205
0,02
0,0195
0,019
20000 40000 60000
Time (s)
80000 100000
FIG. 10. An example of the data record for entire DHC-testing of the PLT-9 specimen.
249 28
O 248
s.I
§
£ 247
27
26
246
Specimen (°C)
— Room (°C)
2512000020000 40000 60000
Time (s)
80000 100000
FIG. 11. Temperature variations during the DHC-test (an enlarged view of Fig. 10).
140 0,0217
20500 25500 30500 35500
Time (s)
40500 45500
0,0213
50500
140
120
100
f•o
80
60
40
20
b)
- Load (N)
-DCPD(V)
70500 75500 80500 85500 90500 95500
Time (s)
100500
0,0225
0,0228
0,0227
0,0226
0,0224
0,0223
0,0222
0,0221
FIG. 12. Step-wise change of the DCPD readings at the loading (a) and unloading (b)of the PLT-9 specimen under the DHC experiment (enlarged view of the data fromFig. 10).
Side A
Reference Length (RL)
C)
FIG. 13. An example of two fracture surfaces (Side A and Side B) obtained for PLT-specimentested for DHC. The measurement grid for nine-point average crack length is shown for eachside of the specimen. The reference length (RL) measured at fracture surface in themicroscope and at the photo is indicated.
DCPD(V)
0,0235
DCPD(V)-4,00
-4,60
-4,80
-5,00 -
-5,20
-5,40
-5,60
0 ,C22
FIG. 14. The LVDT-reading plotted versus the corresponding DCPD-values from theDHC tests of the specimens PLT-9 (a) and PLT-13 (b).
0,0213
20000 30000 40000 50000 60000 70000
Time (s)
80000 90000 100000 110000
0,022
0,0219
0,021
70000,00 80000,00
FIG. 15. An example of the DCPD and the LVDT measurements under the DHC testof the specimens PLT-9 (a) and PLT-13 (b).
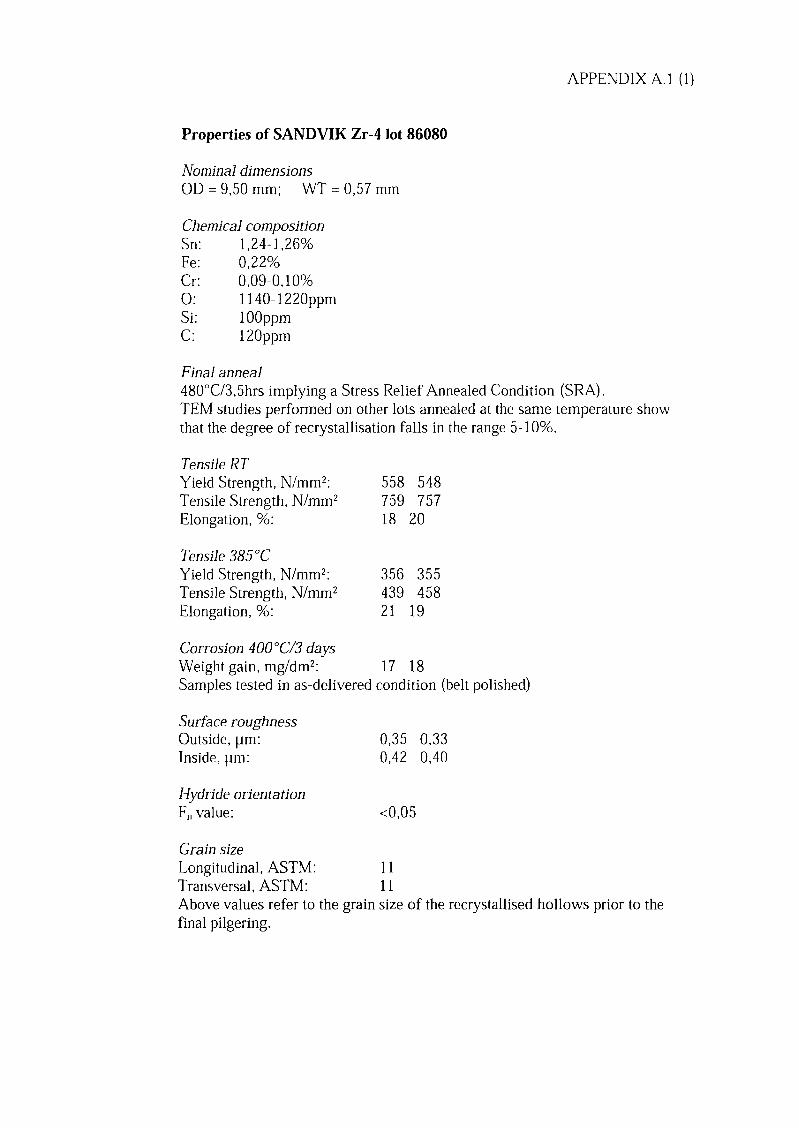
APPENDIX A. 1 (1)
Properties of SAND VIK Zr-4 lot 86080
Nominal dimensionsOD = 9,50 mm; WT = 0,57 mm
Chemical compositionSn: 1,24-1,26%Fe: 0,22%Cr: 0,09-0,10%0: 1140-122OppmSi: lO00ppmnC: l20pprn
Final anneal480'C/3,5hrs implying a Stress Relief Annealed Condition (SRA).TEM studies performed on other lots annealed at the same temperature showthat the degree of recrystallisation falls in the range 5- 10%.
Tensile RTYield Strength, N/mm2 : 558 548Tensile Strength, N/mm2' 759 757Elongation, %: 18 20
Tensile 385'CYield Strength, N/mm2l: 356 355Tensile Strength, N/mm2 439 458Elongation, %: 21 19
Corrosion 400 0C/3 daysWeight gain, mg/din 2: 17 18Samples tested in as-delivered condition (belt polished)
Surface roughnessOutside, pm: 0,35 0,33Inside, pm: 0,42 0,40
Hydride orientationF,,value: <0,05
Grain sizeLongitudinal, ASTM: 1 1Transversal, ASTM: 1 1Above values refer to the grain size of the recrystallised hollows prior to thefinal pilgering.
APPENDIX B. 1 (1)
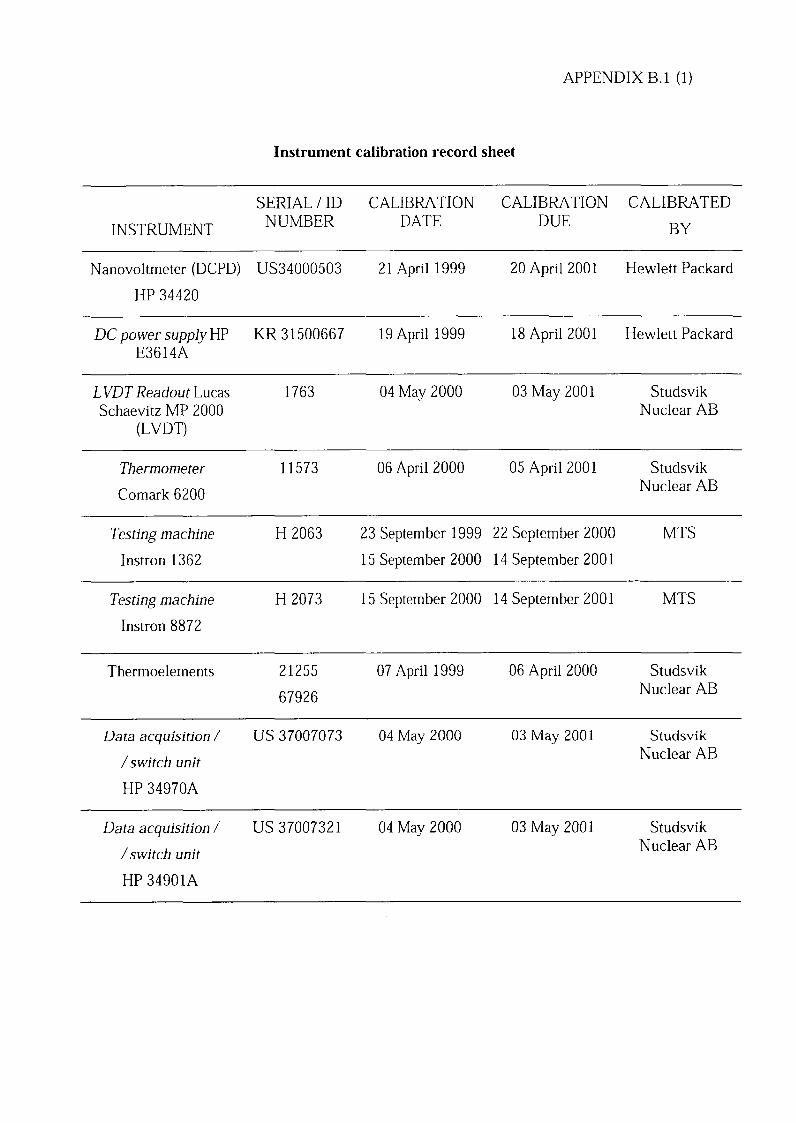
Instrument calibration record sheet
SERIAL / ID CALIBRATION CALIBRATION CALIBRATED
INSTRUMENT NUMBER DATE DUE BY
Nanovoitmeter (DCPD) US34000503 21 April 1999 20 April 2001 Hewlett Packard
HP 34420
DC power supply HP KR 31500667 19 April 1999 18 April 2001 Hewlett PackardE36 14A
L VDT Readout Lucas 1763 04 May 2000 03 May 2001 StudsvikSchaevitz MP 2000 Nuclear AB
(LVDT)
Thermometer 11573 06 April 2000 05 April 2001 Studsvik
Comark 6200 Nuclear AB
Testing machine H 2063 23 September 1999 22 September 2000 MTS
Instron 1362 15 September 2000 14 September 2001
Testing machine H 2073 15 September 2000 14 September 2001 MTS
Instron 8872
Thermoelements 21255 07 April 1999 06 April 2000 Studsvik
67926 Nuclear AB
Data acquisition / US 37007073 04 May 2000 03 May 2001 Studsvik
/ switch unit Nuclear AB
HP 34970A
Data acquisition!/ US 37007321 04 May 2000 03 May 2001 Studsvik
/ switch unit Nuclear AB
HP 34901A
APPENDIX Cl (3)
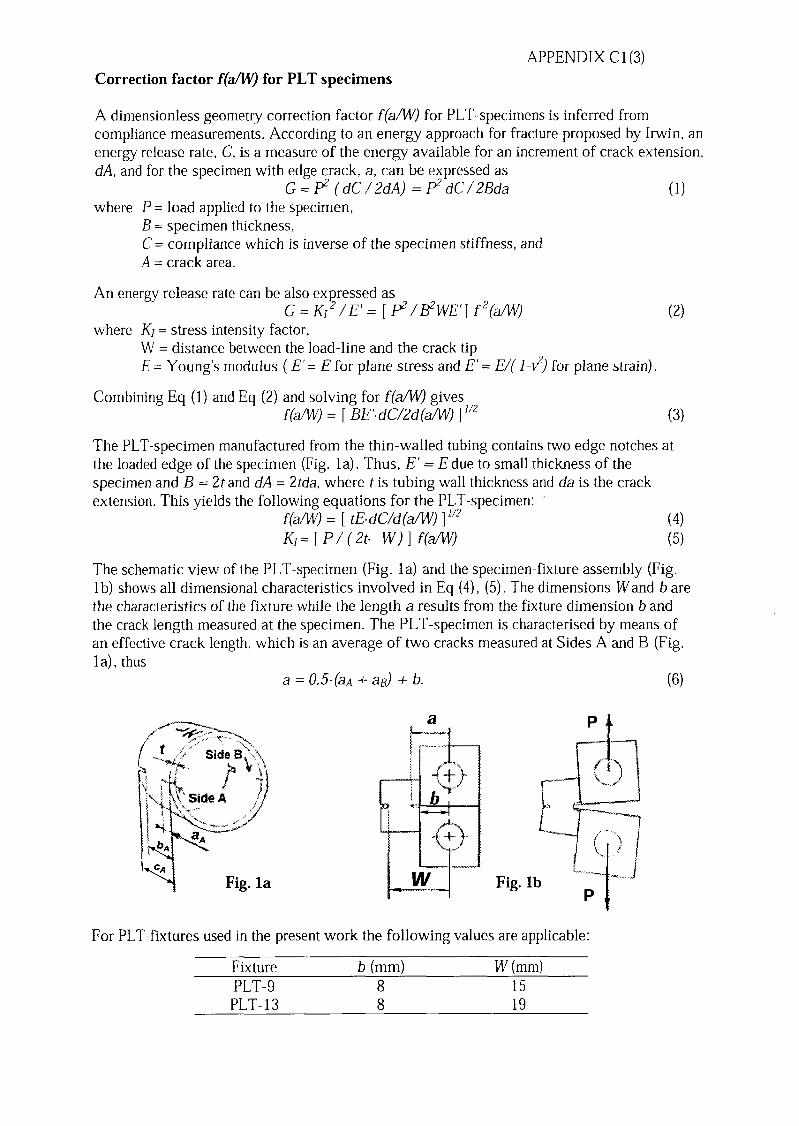
Correction factor f(a/W) for PLT specimens
A dimensionless geometry correction factor f(aA4/) for PLT-specimens is inferred fromcompliance measurements. According to an energy approach for fracture proposed by Irwin, anenergy release rate, C, is a measure of the energy available for an increment of crack extension,dA, and for the specimen with edge crack, a, can be expressed as
GC=P12 (dC /2dA) = PdC /Bda (1)where P = load applied to the specimen,
B = specimen thickness,C = compliance which is inverse of the specimen stiffness, andA crack area.
An energy release rate can be also expressed asG = KI E= [: 2 / B 2WE, J f 2(a/W) (2)
where K = stress intensity factor,W = distance between the load-line and the crack tipE = Young's modulus ( E'= E for plane stress and E'= E/( 1-v2) for plane strain).
Combining Eq (1) and Eq (2) and solving for f(a/W) gives 1
f (a/l') = [ BE.d C2d (a/W) ]2 (3)
The PLT-specimen manufactured from the thin-walled tubing contains two edge notches atthe loaded edge of the specimen (Fig. Ila). Thus, E' E due to small thickness of thespecimen and B = 2 t and dA = 2 tda, where t is tubing wall thickness and da is the crackextension. This yields the following equations for the PLT-specimen:
f(a/W) = [ tE. d Cd(aA4) 1/2 (4)K=[ P / (2t. W)]1f(aW) (5)
The schematic view of the PL-T-specimen (Fig. l a) and the specimen-fixture assembly (Fig.i b) shows all dimensional characteristics involved in Eq (4), (5). The dimensions Wand b are'the characteristics of the fixture while the length a results from the fixture dimension b andthe crack length measured at the specimen. The PLT-specimen is characterised by means ofan effective crack length, which is an average of two cracks measured at Sides A and B (Fig.l a), thus
a .O5 .(aA + aB) + b. (6)
a P
\IX~ ~ide B
Fig. la WFig. b P
For PLT-fixtures used in the present work the following values are applicable:
Fixture b (mm) W (mm)PLT-9 8 1 5PLT 1 3 8 1 9
APPENDIX C2 (3)
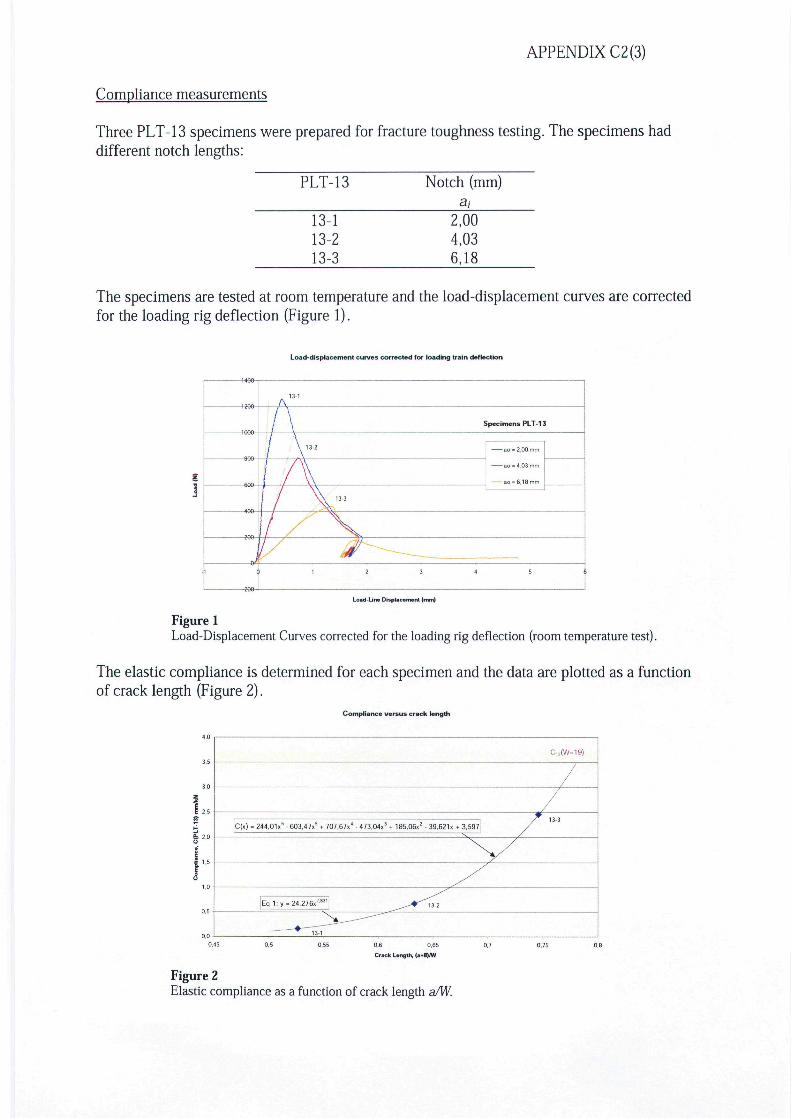
Compliance measurements
Three PLT-13 specimens were prepared for fracture toughness testing. The specimens haddifferent notch lengths:
PLT-13 Notch (mm)
13-113-213-3
2,004,036,18
The specimens are tested at room temperature and the load-displacement curves are correctedfor the loading rig deflection (Figure 1).
Load-displacement curves corrected for loading train deflection
Load Line Displacement (mm)
Figure 1Load-Displacement Curves corrected for the loading rig deflection (room temperature test).
The elastic compliance is determined for each specimen and the data are plotted as a functionof crack length (Figure 2).
Compliance versus crack length
|C(x) - 244,01x6 - 603,47xs t 707,67*' - 473,04xJ * 185,06x* - 39,621x + 3,597
Eq 1:y = 24,276x"31
0,55 0,6 0,65 0,7
Crick Length, (»*H)/W
Figure 2Elastic compliance as a function of crack length a/W.
APPENDIX C3(3)
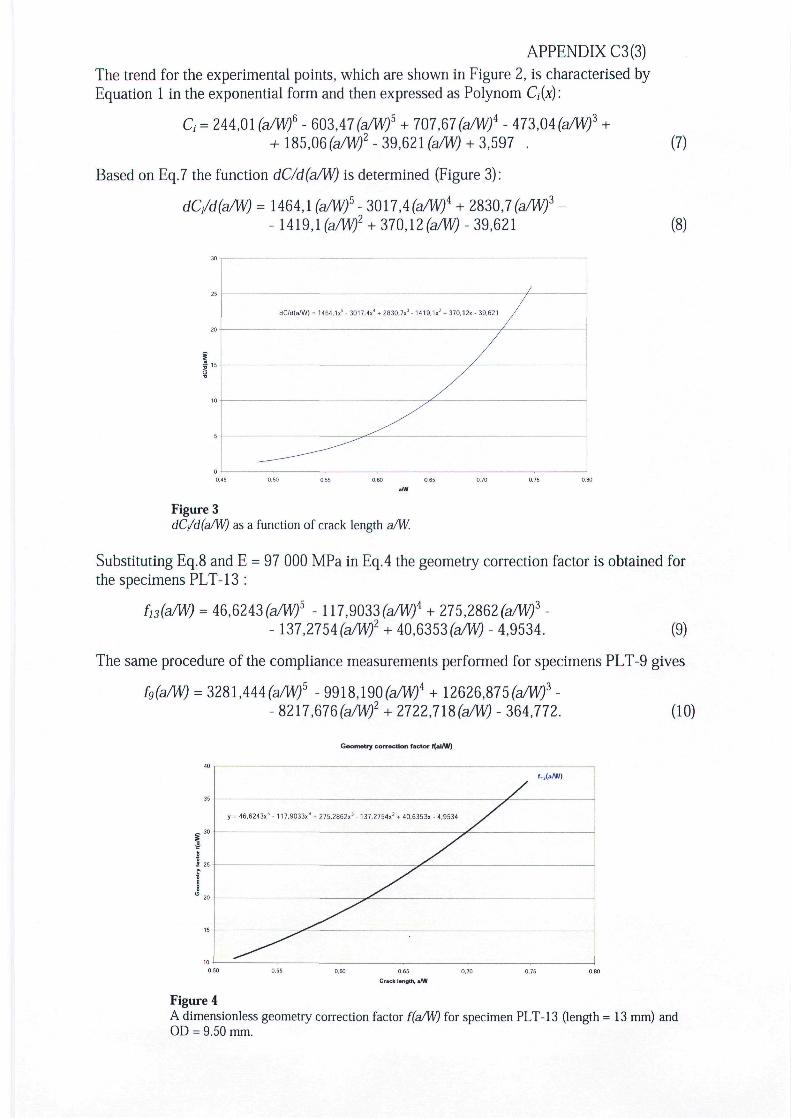
The trend for the experimental points, which are shown in Figure 2, is characterised byEquation 1 in the exponential form and then expressed as Polynom Ci(x):
Ci = 244,01 (a/W)6 - 603,47(a/W)5 + 707,67(a/W)4 - 473,+ m,Q6(a/W)2- 39,621(3/1^ + 3,597 .
Based on Eq.7 the function dC/d(a/W) is determined (Figure 3):
dCi/d(a/W) = 1464,1 (a/W)5 - 3017,4(a/W;4 + 2830,- 1419,1 (a/W)2 + 370,12 (a/W) - 39,621
(7)
(8)
dC/d(a/W) , 1464,lx4 - 3017,4x* t 2830,7<J - 1419,1x! » 370,12x -39,621
Figure 3dC/d(a/W) as a function of crack length a/W.
Substituting Eq.8 and E = 97 000 MPa in Eq.4 the geometry correction factor is obtained forthe specimens PLT-13 :
fi3(a/W) = 46,6243(a/W)5 -117,9033(a/W)4 + 275,2862 (a/W)3 -- 137,2754(a/W)2 + 40,6353(a/W) - 4,9534. (9)
The same procedure of the compliance measurements performed for specimens PLT-9 gives
fo(a/W) = 3281,444fa/W5 - 9918,190fe/W4 + 12626,875(a/W)3 -9918,190(a/W94 + 12626,1. ̂ ,.,- 8217,676(a/W^2 + 2722,718(a/Wfl - 364,772. (10)
Geometry correction factor f(ai/W)
y - 46,6243xs - 117,9033x' + 275,2862x3 - 137.2754x ! * 40,6353x - 4,9534
0,65
Crack length, a/W
Figure 4A dimensionless geometry correction factor f(a/W) for specimen PLT-13 (length =13 mm) andOD = 9.50 mm.
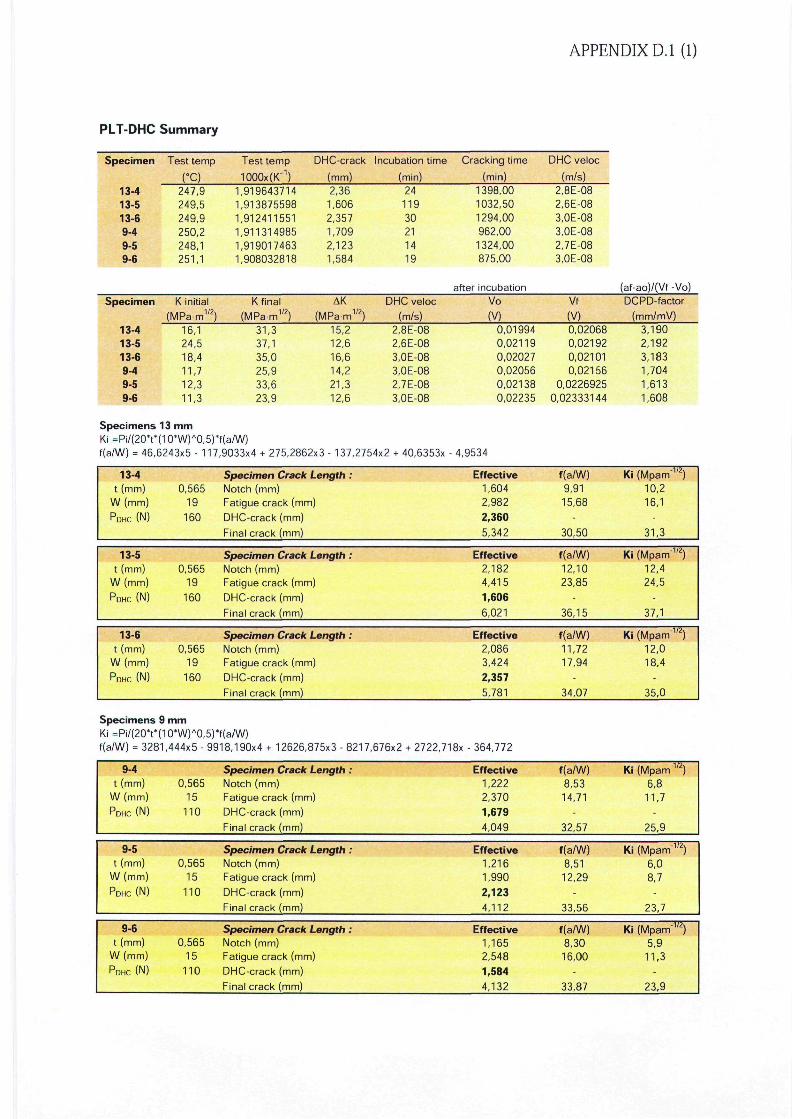
APPENDIX D.I (1)
PLT-DHC Summary
Specimen
13-413-513-69-49-59-6
Specimen
13-413-513-69-49-59-6
Test temp
(°C)247,9249,5249,9250,2248,1251,1
K initial(MPam1'2)
16,124,518,411,712,311,3
Test temp
1000x(K'1)1,9196437141,9138755981,9124115511,9113149851,9190174631,908032818
K final(MPam1'2)
31,337,135,025,933,623,9
DHC-crack
(mm)2,361,6062,3571,7092,1231,584
AK
{MPam1'2)15,212,616,614,221,312,6
Incubation time
(min)2411930211419
DHC veloc(m/s)
2.8E-082.6E-083,OE-083.0E-082.7E-083.0E-08
Cracking time
(min)1398,001032,501294,00962,001324,00875,00
after incubationVo
(V)0,019940,021190,020270,020560,021380,02235
DHC veloc
(m/s)2.8E-082.6E-083.0E-083.0E-082.7E-083.0E-08
Vf
(V)0,020680,021920,021010,02156
0,02269250,02333144
(af-ao)/(Vf -Vo)DCPD-factor
(mm/mV)3,1902,1923,1831,7041,6131,608
Specimens 13 mmKi =Pi/(20't*(10'W)A0,5)*f(a/W)f(a/W) = 46,6243x5 - 117,9033x4 + 275,2862x3 - 137,2754x2 + 40,6353x - 4,9534
13-4t (mm)
W(mm)
PDHC (N)
0,56519
160
Specimen Crack Length :Notch (mm)Fatigue crack (mm)DHC-crack (mm)Final crack (mm)
Effective1,6042,9822,3605,342
f(a/W)9,9115,68
-
30,50
Ki (Mpam 1/2)10,216,1
-
31,3
13-5t (mm)
W(mm)
PDHC (N)
0,56519
160
Specimen Crack Length :Notch (mm)Fatigue crack (mm)DHC-crack (mm)Final crack (mm)
Effective2,1824,4151,6066,021
f(a/W)12,1023,85
-
36,15
Ki (Mpam'1'2)12,424,5
37,1
13-6t (mm)
W(mm)
PDHC (N)
0,56519
160
Specimen Crack Length :Notch (mm)Fatigue crack (mm)DHC-crack (mm)Final crack (mm)
Effective2,0863,4242,3575,781
f(a/W)11,7217,94
-
34,07
Ki (Mparrr1'2)12,018,4
-
35,0
Specimens 9 mmKi =Pi/(20*t*(10*W)A0,5)"f(a/W)f(a/W) = 3281,444x5 - 9918,190x4 + 12626,875x3 - 8217,676x2 + 2722,718x - 364,772
9-4t (mm)
W(mm)
PDHC (N)
0,56515
110
Specimen Crack Length :Notch (mm)Fatigue crack (mm)DHC-crack (mm)Final crack (mm)
Effective1,2222,3701,6794,049
f(a/W)8,5314,71
-
32,57
Ki (Mparrf1'2)6,811,7
-
25,9
9-5t (mm)
W(mm)
PDHC (N)
0,56515
110
Specimen Crack Length :Notch (mm)Fatigue crack (mm)DHC-crack (mm)Final crack (mm)
Effective1,2161,9902,1234,112
f(a/W)8,5112,29
-
33,56
Ki (Mparrr1'2)6,08,7
-
23,7
9-6t (mm)
W(mm)
PDHC (N)
0,56515
110
Specimen Crack Length :Notch (mm)Fatigue crack (mm)DHC-crack (mm)Final crack (mm)
Effective1,1652,5481,5844,132
f(a/W)8,3016,00
-
33,87
Ki (Mpam'1'2)5,9
11.3-
23,9
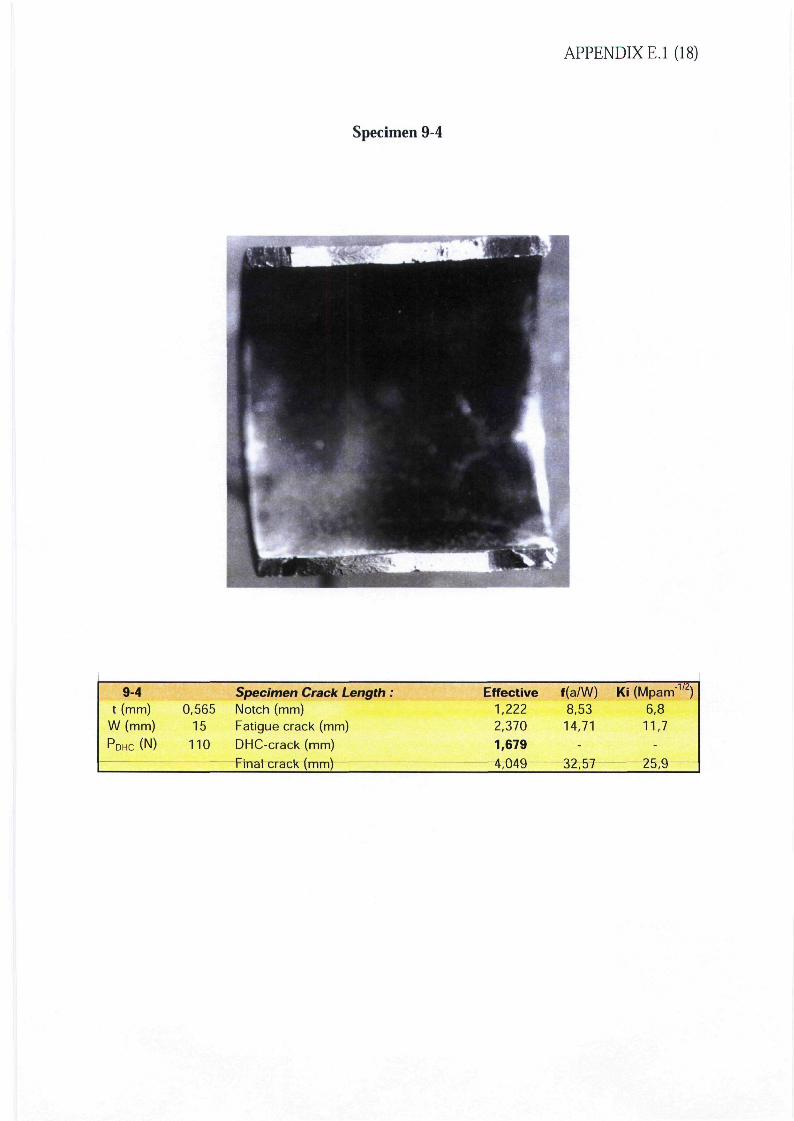
APPENDIX E.I (18)
Specimen 9-4
9-4t (mm)
W(mm)
PDHC (N)
0,56515
110
Specimen Crack Length :Notch (mm)Fatigue crack (mm)
DHC-crack (mm)I— . , / \rinal crack (mm)
Effective1,2222,370
1,679
4,049
f(a/W)8,5314,71
-oo mJ£,O/
Ki (Mpam" )6,811,7
-">r n£o,y
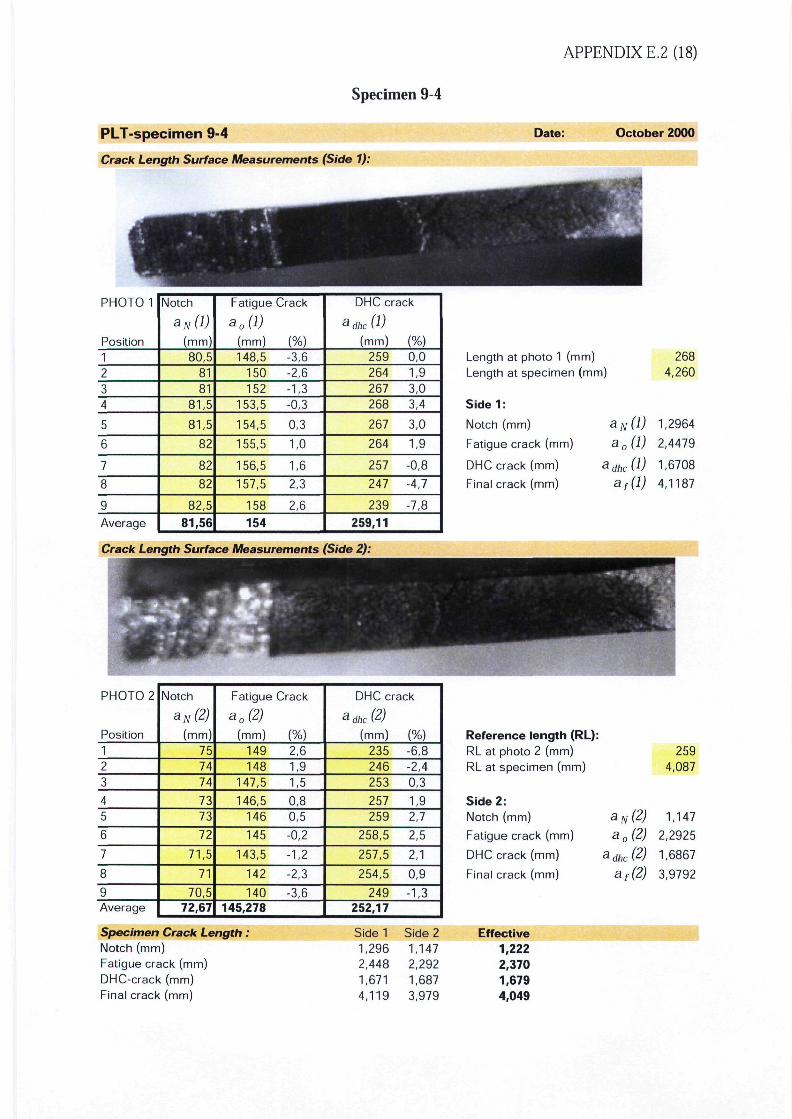
APPENDIX E.2 (18)
Specimen 9-4
PLT-specimen 9-4
Crack Length Surface Measurements (Side 1):
Date: October 2000
PHOTO 1
Position1234
5
6
7
8
9
Average
Notch
aN(l)(mm)80,5
8181
81,5
81,5
82
82
82
82,5
81,56
Fatigue
ajl)(mm)148,5
150152
153,5
154,5
155,5
156,5
157,5
158
Crack
(%)-3,6-2,6-1,3-0,3
0,3
1,0
1,6
2,3
2,6
154
DHC crack
a dhc (1)(mm) (%)
259264267268
267
264
257
247
239
0,0
1,93,03,4
3,0
1,9
-0,8
-4,7
-7,8
259,11
Length at photo 1 (mm)Length at specimen (mm)
2684,260
Sidel:
Notch (mm)
Fatigue crack (mm)
DHC crack (mm)
Final crack (mm)
aN(l) 1,2964
a0(l) 2,4479
adhc(l) 1,6708a {(I) 4,1187
Crack Length Surface Measurements (Side 2):
PHOTO 2
Position123
45
6
7
8
9Average
Notch
aN(2)(mm)
757474
7373
72
71,5
71
70,572,67
Fatigue
a0(2)(mm)
149148
147,5
146,5146
145
143,5
142
140
Crack
(%)2,61,91,5
0,80,5
-0,2
-1,2
-2,3
-3,6145,278
DHC crack
a dhc (?)(mm) (%)
235246253
257259
258,5
257,5
254,5
249
-6,8-2,40,3
1,92,7
2,5
2,1
0,9
-1,3252,17
Reference length (RL):RL at photo 2 (mm)RL at specimen (mm)
Side 2:Notch (mm)
Fatigue crack (mm)
DHC crack (mm)
Final crack (mm)
2594,087
3N(2) 1,147
a0(2) 2,2925adhc(2) 1,6867
a f ( 2 ) 3,9792
Specimen Crack Length :Notch (mm)Fatigue crack (mm)DHC-crack (mm)Final crack (mm)
Side 1 Side 21,296 1,1472,448 2,2921,671 1,6874,119 3,979
Effective1,2222,3701,6794,049
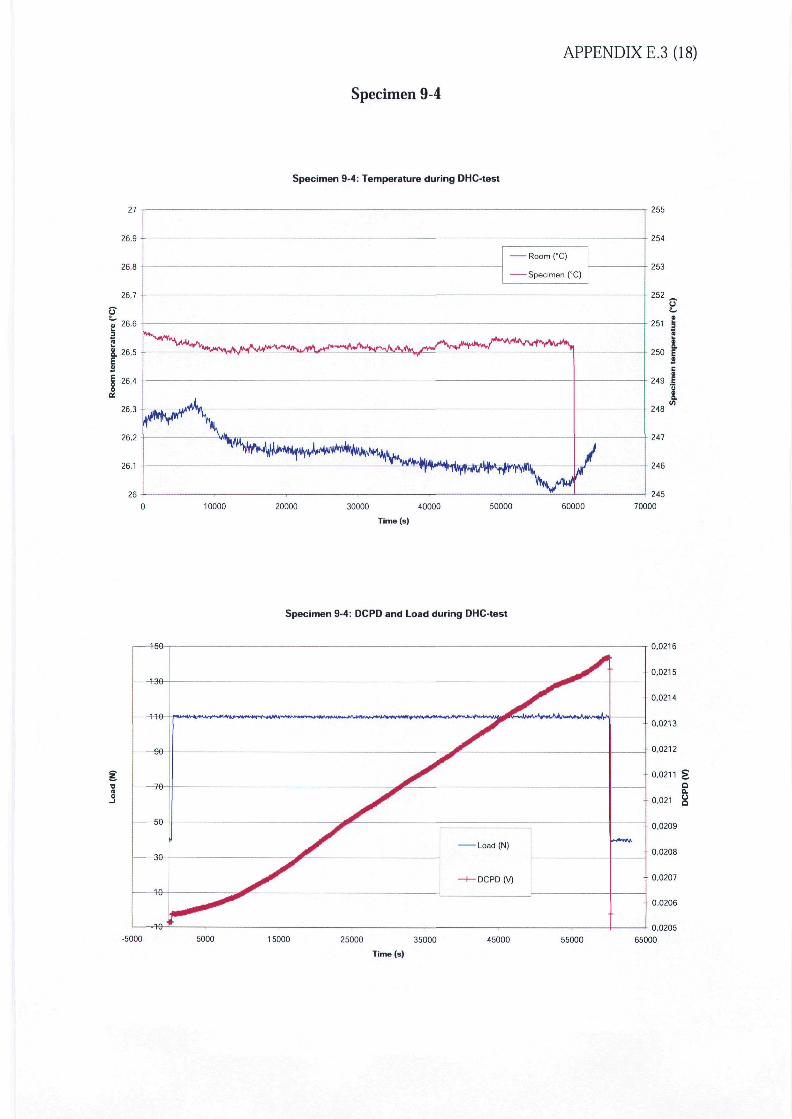
APPENDIX E.3 (18)
Specimen 9-4
27
26,9
26,8
26,7
26,6 •-
26,5
26,4
26,3
26,2
26,1
2610000
Specimen 9-4: Temperature during DHC-test
-Room (°C)
-Specimen (°C)
,^^^f^^^^^^
tv*
20000 30000 40000
Time (s)
50000
/
60000
255
254
253
252
251
250
249
248
247
246
245
I
70000
Specimen 9-4: DCPD and Load during DHC-test
-5000 5000
0.0216
0,020565000
APPENDIX E.4 (18)
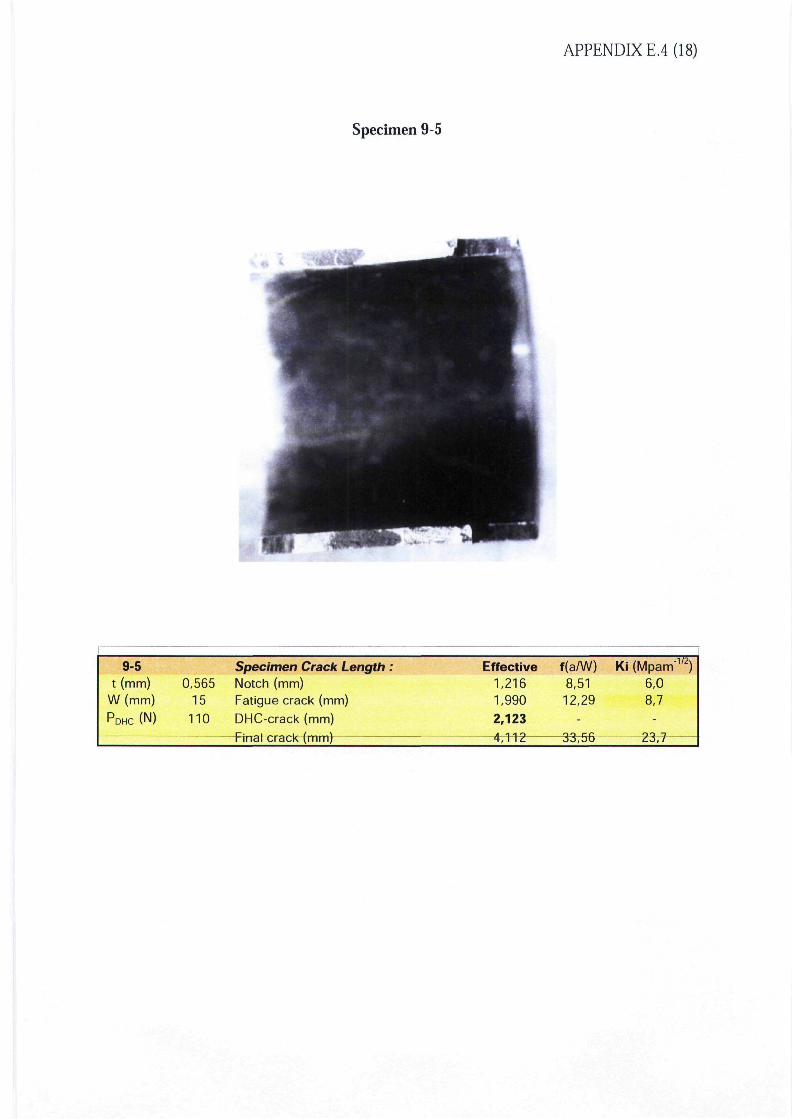
Specimen 9-5
9-5t (mm)
W(mm)PDHC (N)
0,56515
110
Specimen Crack Length :Notch (mm)Fatigue crack (mm)
DHC-crack (mm)
riiidl uac,k (nun)
Effective1,2161,990
2,123
,112
f(a/W)8,5112,29
-
jo,5u
Ki (Mpam'1/2)6,08,7-
£3,1
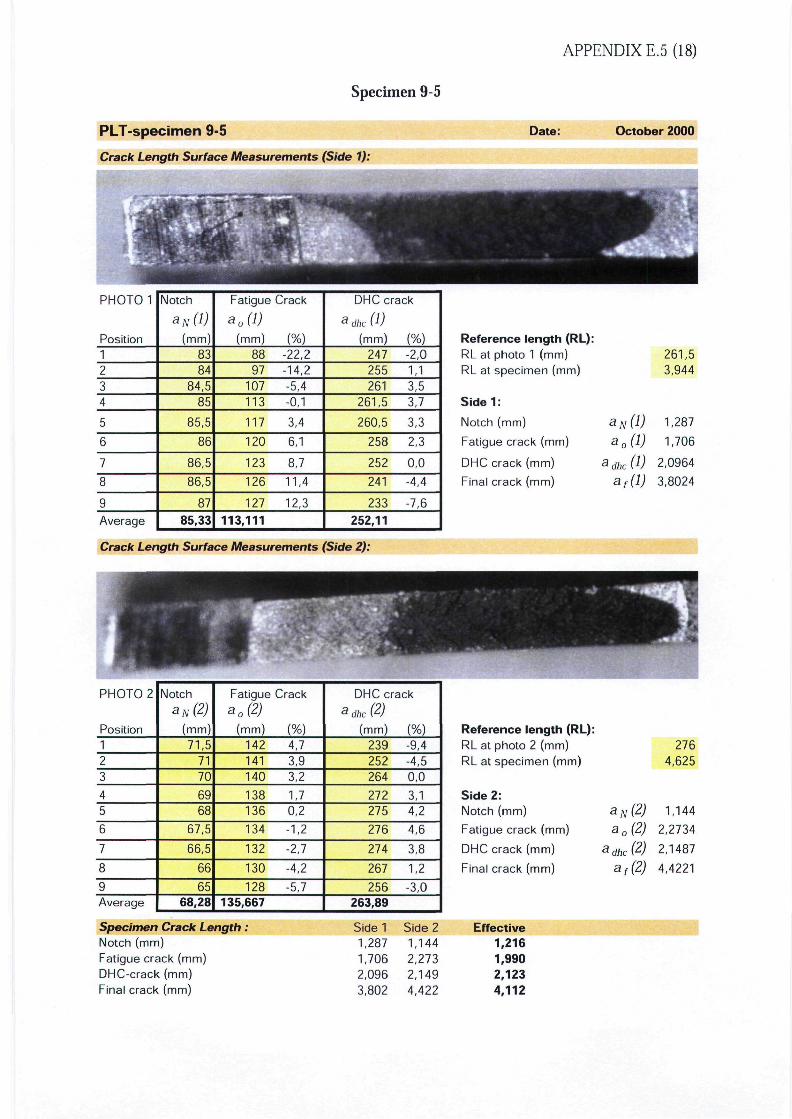
APPENDIX E.5 (18)
Specimen 9-5
PLT-specimen 9-5
Crack Length Surface Measurements (Side 1):
Date: October 2000
PHOTO 1
Position1234
5
6
7
8
9
Average
Notch
(mm)8384
84,585
85,5
86
86,5
86,5
87
85,33
Fatigue
(mm)8897
107113
117
120
123
126
127
Crack
-22,2-14,2-5,4-0,1
3,4
6,1
8,7
11,4
12,3
113,111
DHC crack
a^ (1)a dhc I •*/
(mm) (%)247255261
261,5
260,5
258
252
241
233
-2,0
1,13,53,7
3,3
2,3
0,0
-4,4
-7,6
252,11
Reference length (RL):RL at photo 1 (mm)RL at specimen (mm)
Sidel:
Notch (mm)
Fatigue crack (mm)
DHC crack (mm)
Final crack (mm)
261,53,944
a N (1) 1,287
a0(l) 1,706adhc(l) 2,0964
af(l) 3,8024
Crack Length Surface Measurements (Side 2):
PHOTO 2
Position123
45
6
7
8
9Average
Notch
aN(2)
(mm)71,5
7170
6968
67,5
66,5
66
6568,28
Fatiguea0(2)
(mm)142141140
138136
134
132
130
128
Crack
(%)4,73,93,2
1,70,2
-1,2
-2,7
-4,2
-5,7135,667
DHC crack
a dhc (2)
(mm) (%)239252264
272275
276
274
267
256
-9,4-4,50,0
3,14,2
4,6
3,8
1,2
-3,0263,89
Reference length (RL):RL at photo 2 (mm)RL at specimen (mm)
Side 2:Notch (mm)
Fatigue crack (mm)
DHC crack (mm)
Final crack (mm)
2764,625
aN(2) 1,144a 0 (2) 2,2734
adhc(2) 2,1487at(2) 4,4221
Specimen Crack Length:Notch (mm)Fatigue crack (mm)DHC-crack (mm)Final crack (mm)
Side 1 Side 21,287 1,1441,706 2,2732,096 2,1493,802 4,422
Effective1,2161,9902,1234,112
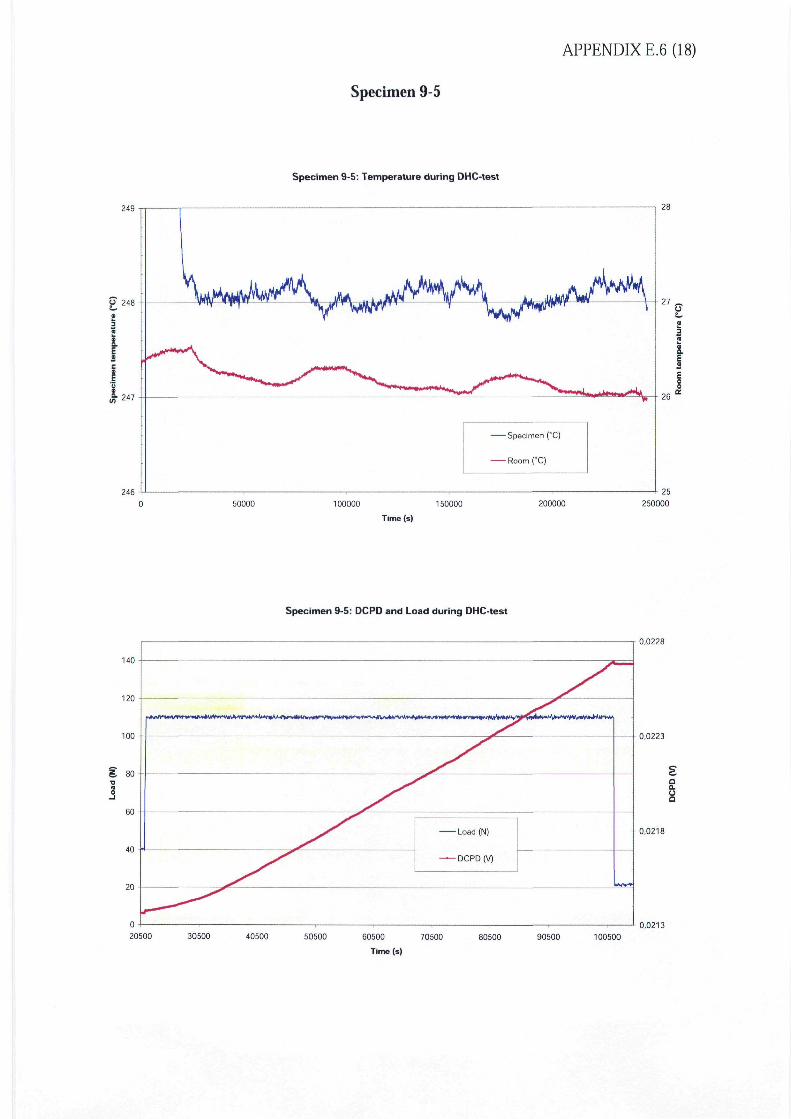
APPENDIX E.6 (18)
Specimen 9-5
Specimen 9-5: Temperature during DHC-test
249 i
50000 100000 150000
Time (s)
200000
25
250000
Specimen 9-5: DCPD and Load during DHC-test
140
120
100
I
60
40
20
- Load (N)
- DCPD (V)
0
20500 30500 40500 50500 60500 70500
Time (s)
0,0228
0,0223
0,0218
0,0213
80500 90500 100500
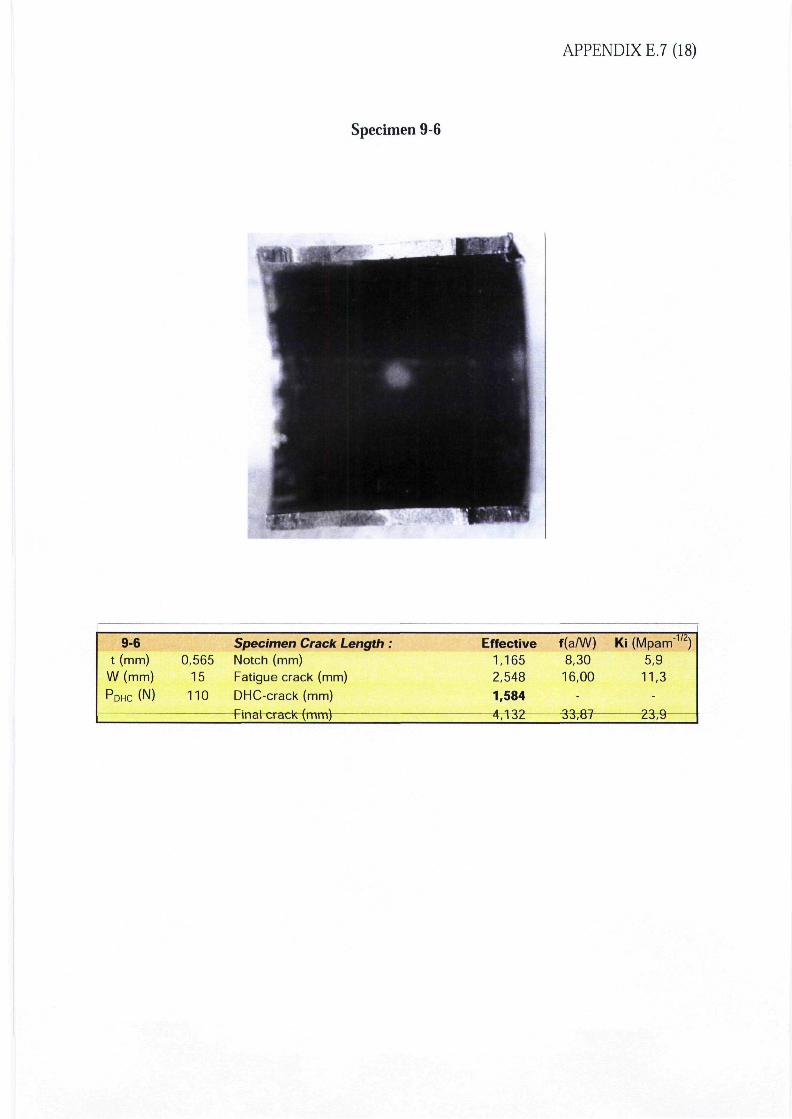
APPENDIX E.7 (18)
Specimen 9-6
9-6t (mm)
W(mm)
PDHC (N)
0,56515
110
Specimen Crack Length :Notch (mm)Fatigue crack (mm)
DHC-crack (mm)i-- i • / \rinal crack ^mmj
Effective1,1652,548
1,584A 1 OO4, loz-
f(a/W)8,3016,00
-OO Q~733,01
Ki (Mpam-1/2)5,9
11,3
-O1 Q£j,y
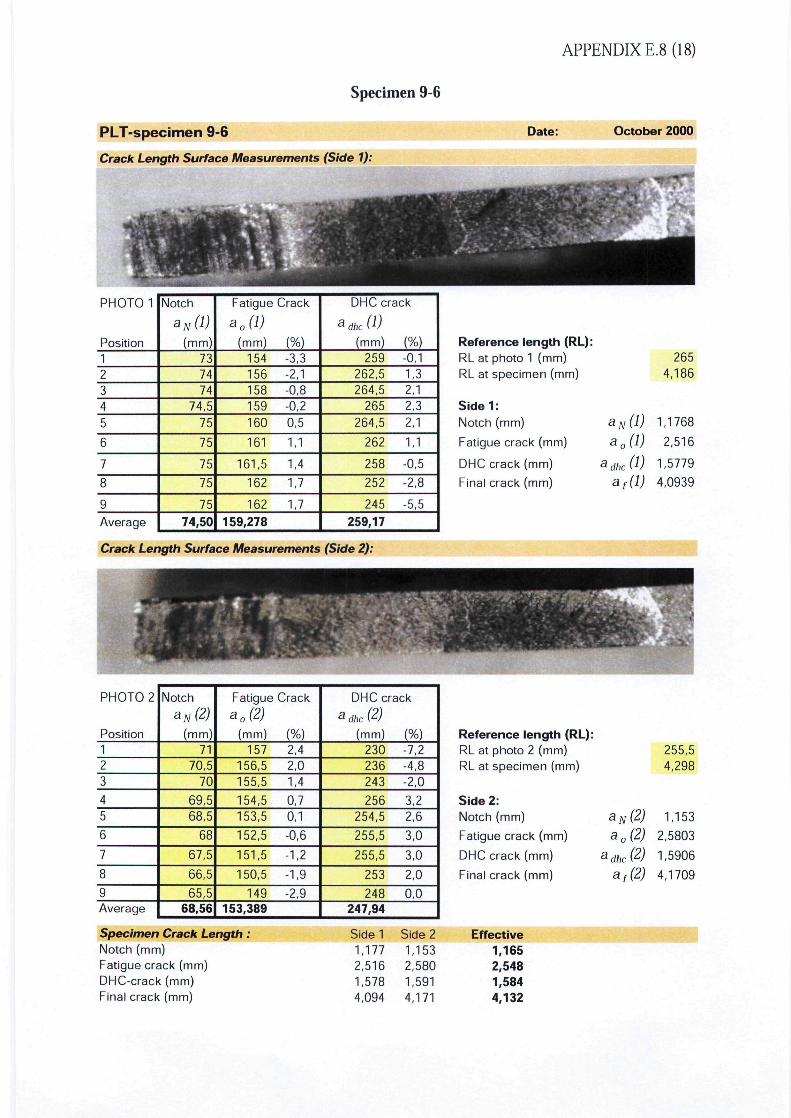
APPENDIX E.8 (18)
Specimen 9-6
PLT-specimen 9-6
Crack Length Surface Measurements (Side 1):
Date: October 2000
PHOTO 1
Position12345
6
7
8
9Average
Notch
a* ft)(mm)
737474
74,575
75
75
75
75
74,50
Fatigue
a0(l)(mm)
154156158159160
161
161,5
162
162
Crack
(%)-3,3-2,1-0,8-0,20,5
1,1
1,4
1,7
1,7
159,278
DHC crack
a dhc (1)(mm) (%)
259262,5264,5
265264,5
262
258
252
245
-0,11,32,12,32,1
1,1
-0,5
-2,8
-5,5
259,17
Reference length (RL):RL at photo 1 (mm)RL at specimen (mm)
Side 1:Notch (mm)
Fatigue crack (mm)
DHC crack (mm)
Final crack (mm)
2654,186
ajvft) 1,1768a0(l) 2,516
adhc(l) 1,5779
af(l) 4,0939
Crack Length Surface Measurements (Side 2):
PHOTO 2
Position123
45
6
7
8
9Average
Notch
aN(2)
(mm)71
70,570
69,568,5
68
67,5
66,5
65,568,56
Fatiguea0(2)
(mm)157
156,5155,5
154,5153,5
152,5
151,5
150,5
149
Crack
(%)2,42,01,4
0,70,1
-0,6
-1,2
-1,9
-2,9153,389
DHC crack
a dhc (2)(mm) (%)
230236243
256254,5
255,5
255,5
253
248
-7,2-4,8-2,0
3,22,6
3,0
3,0
2,0
0,0247,94
Specimen Crack Length:Notch (mm)Fatigue crack (mm)DHC-crack (mm)Final crack (mm)
Side 1 Side 21,177 1,1532,516 2,5801,578 1,5914,094 4,171
Reference length (RL):RL at photo 2 (mm)RL at specimen (mm)
Side 2:Notch (mm)
Fatigue crack (mm)
DHC crack (mm)
Final crack (mm)
Effective1,1652,5481,5844,132
255,54,298
aN(2) 1,153a0(2) 2,5803
adhc(2) 1,5906af(2) 4,1709
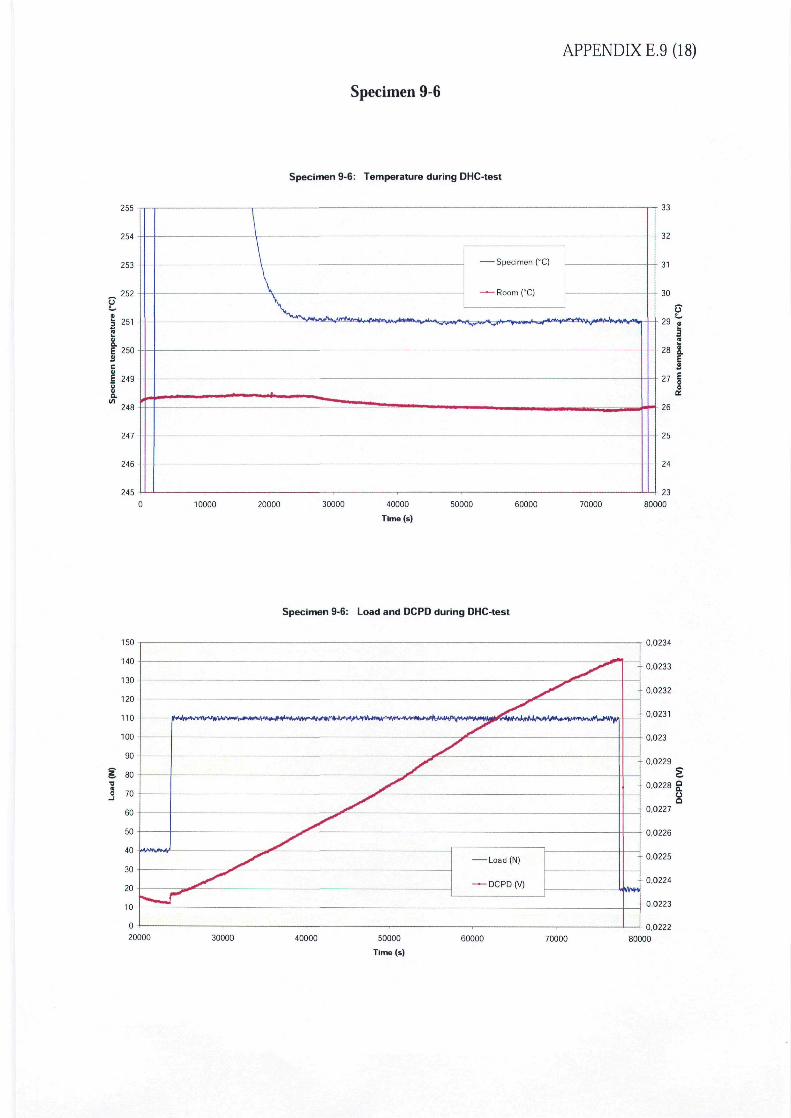
APPENDIX E.9 (18)
Specimen 9-6
Specimen 9-6: Temperature during DHC-test
254 -
253
252g
I ,5,
c
i248
tm
\\
0BM
•*•«—
0
TOO
90
•o0 70J /U
40
1 0000 20000 30000 40000 50000 60000 70000
Time (s)
Specimen 9-6: Load and DCPD during DHC-test
^^
^^
JWA*s-V
___ _X^
^syT
S^
^s^
^S^
^>r^r Load (N)
^r — DCPD (V)
' 1~^
20000
- -
30000 40000 50000 60000 70000 800
Time (s)
• ••
^
a26
80000
0,0234
0,0233
0,0232
0,0231
0,023
0,0229
£0,0228 g
OQ
0,0227
0,0226
0,0225
0,0224
0,0223
0,0222
30
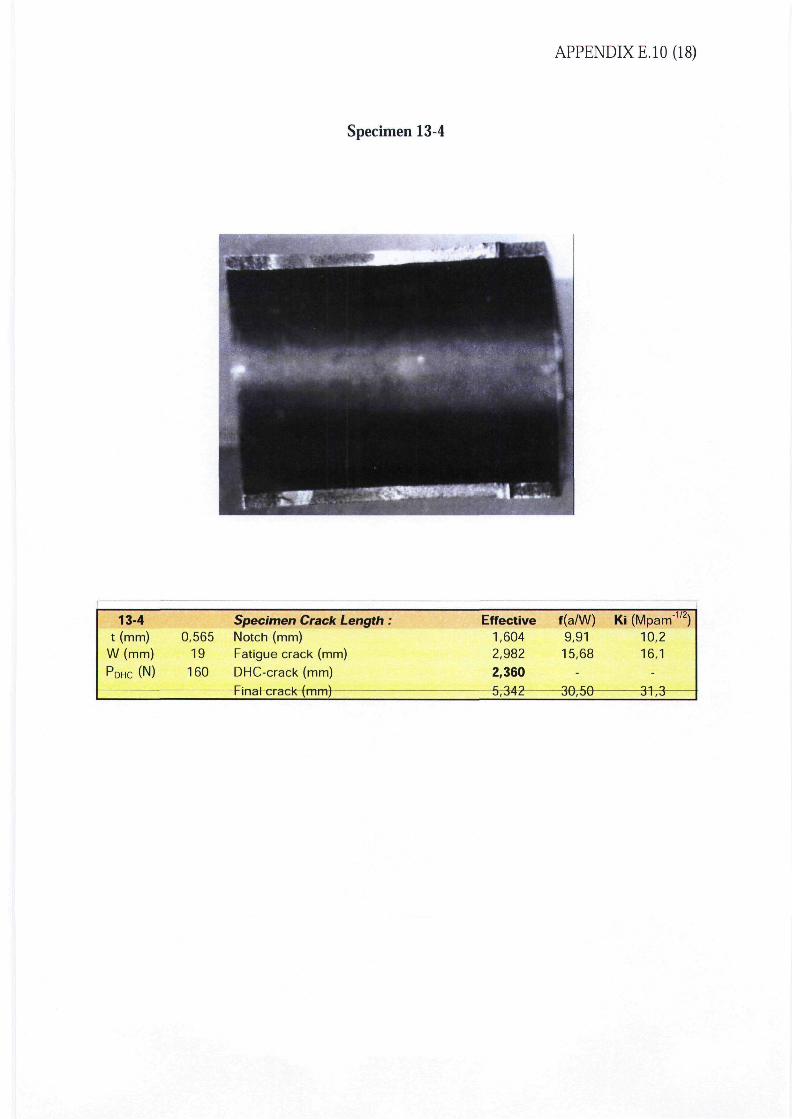
APPENDIX E.I0(18)
Specimen 13-4
13-4t (mm)
W(mm)
PDHC (N)
0,56519
160
Specimen Crack Length :Notch (mm)Fatigue crack (mm)
DHC-crack (mm)
i inai cracK ^mmj
Effective1,6042,982
2,360
5 0 yl O
,o4£
f(a/W)9,9115,68
-on ^noU.oU
Ki (Mparrf1'2)10,216,1
-Q1 QO I,O
Specimen 13-4
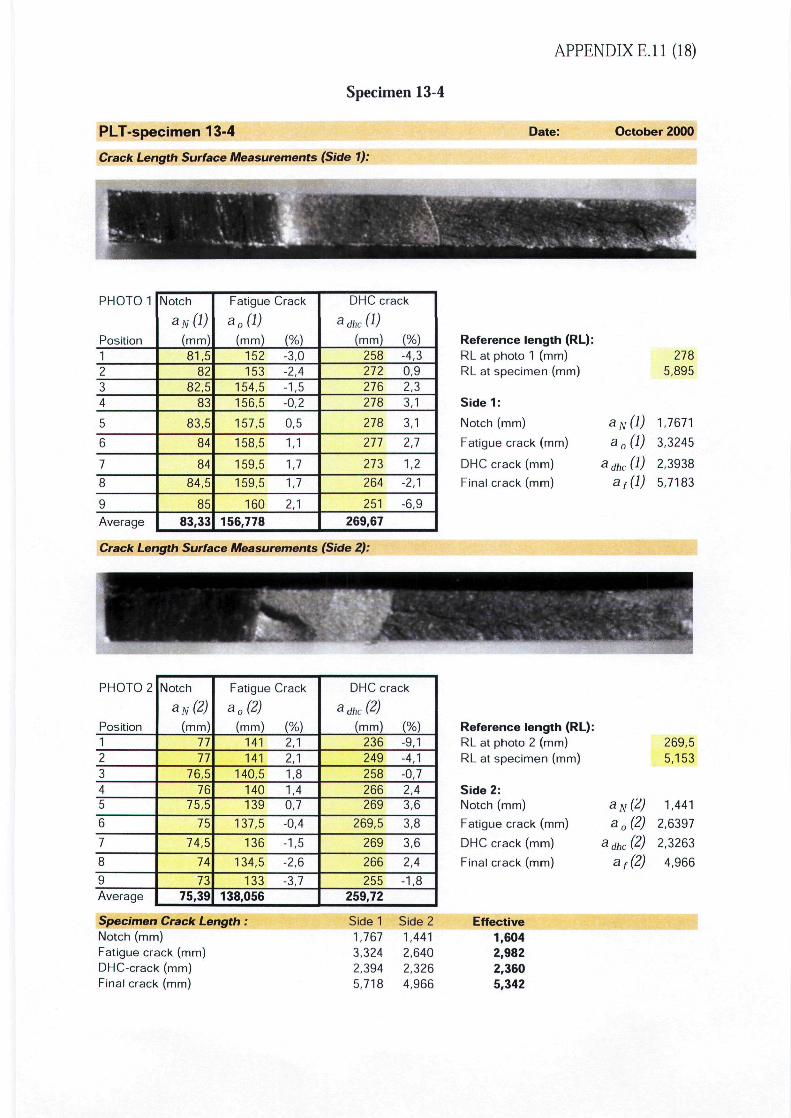
APPENDIXE.il (18)
PLT-specimen 13-4
Crack Length Surface Measurements (Side 1):
Date: October 2000
PHOTO 1
Position1234
5
6
7
8
9
Average
Notch
*N(*)(mm)81,5
8282,5
83
83,5
84
84
84,5
85
83,33
Fatigue
a0(l)(mm)
152153
154,5156,5
157,5
158,5
159,5
159,5
160
Crack
(%)-3,0-2,4-1,5-0,2
0,5
1,1
1,7
1,7
2,1
156,778
DHC crack
a<ftcft)(mm) (%)
258272276278
278
277
273
264
251
-4,30,92,33,1
3,1
2,7
1,2
-2,1
-6,9
269,67
Crack Length Surface Measurements (Side 2):
Reference length (RL):RL at photo 1 (mm)RL at specimen (mm)
Sidel:Notch (mm)
Fatigue crack (mm)
DHC crack (mm)
Final crack (mm)
2785,895
aN(l) 1,7671a0(l) 3,3245
adhc(l) 2,3938af(l) 5,7183
PHOTO 2
Position12345
6
7
8
9Average
Notch
aN(2)
(mm)7777
76,576
75,5
75
74,5
74
7375,39
Fatigue
B0(2)
(mm)141141
140,5140139
137,5
136
134,5
133
Crack
(%)2,12,11,81,40,7
-0,4
-1,5
-2,6
-3,7138,056
DHC crack
3 dhc (2)
(mm) (%)
236249258266269
269,5
269
266
255
-9,1-4,1-0,72,43,6
3,8
3,6
2,4
-1,8259,72
Specimen Crack Length:Notch (mm)Fatigue crack (mm)DHC-crack (mm)Final crack (mm)
Side 1 Side 21,767 1,4413,324 2,6402,394 2,3265,718 4,966
Reference length (RL):RL at photo 2 (mm)RL at specimen (mm)
Side 2:Notch (mm)
Fatigue crack (mm)
DHC crack (mm)
Final crack (mm)
Effective1,6042,9822,3605,342
269,55,153
aN(Z) 1,441a0(2) 2,6397
adhc(2) 2,3263a {(2) 4,966
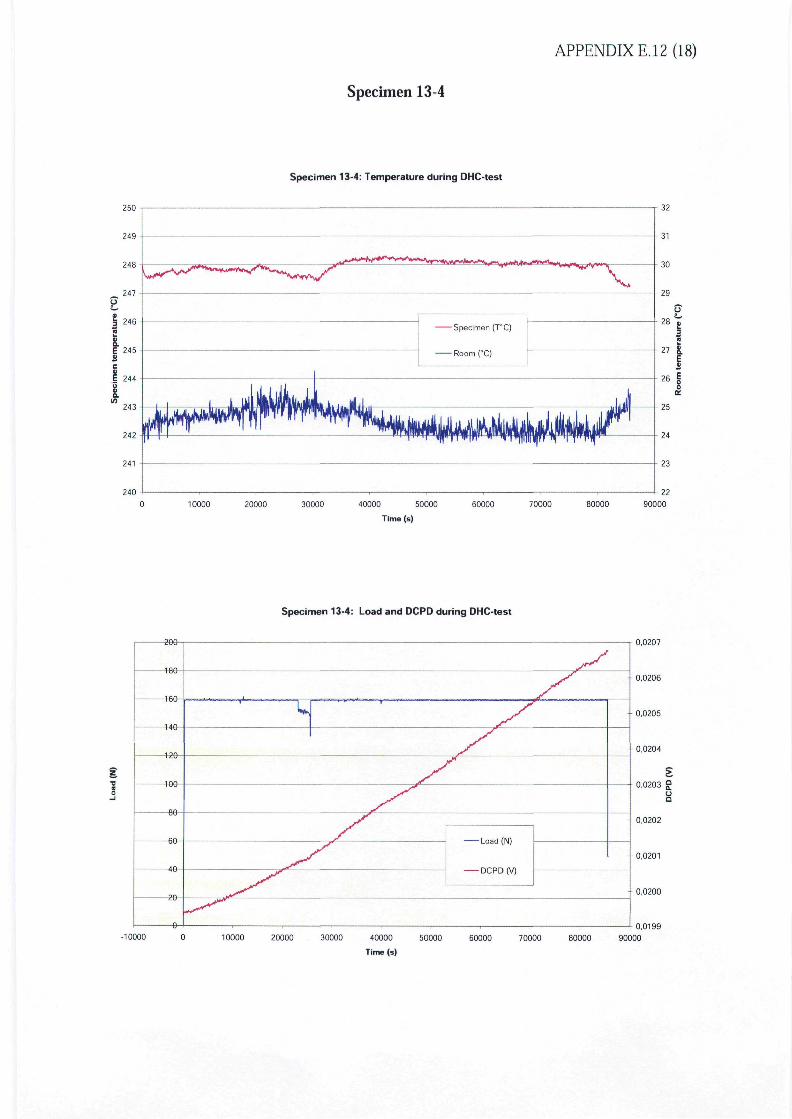
APPENDIX E.I2 (18)
Specimen 13-4
Specimen 13-4: Temperature during DHC-test
250
240
10000 20000 30000 40000 50000
Time (s)
60000 70000 80000 90000
Specimen 13-4: Load and DCPD during DHC-test
0,0207
0,0206
-10000
0,0200
0,019980000 90000
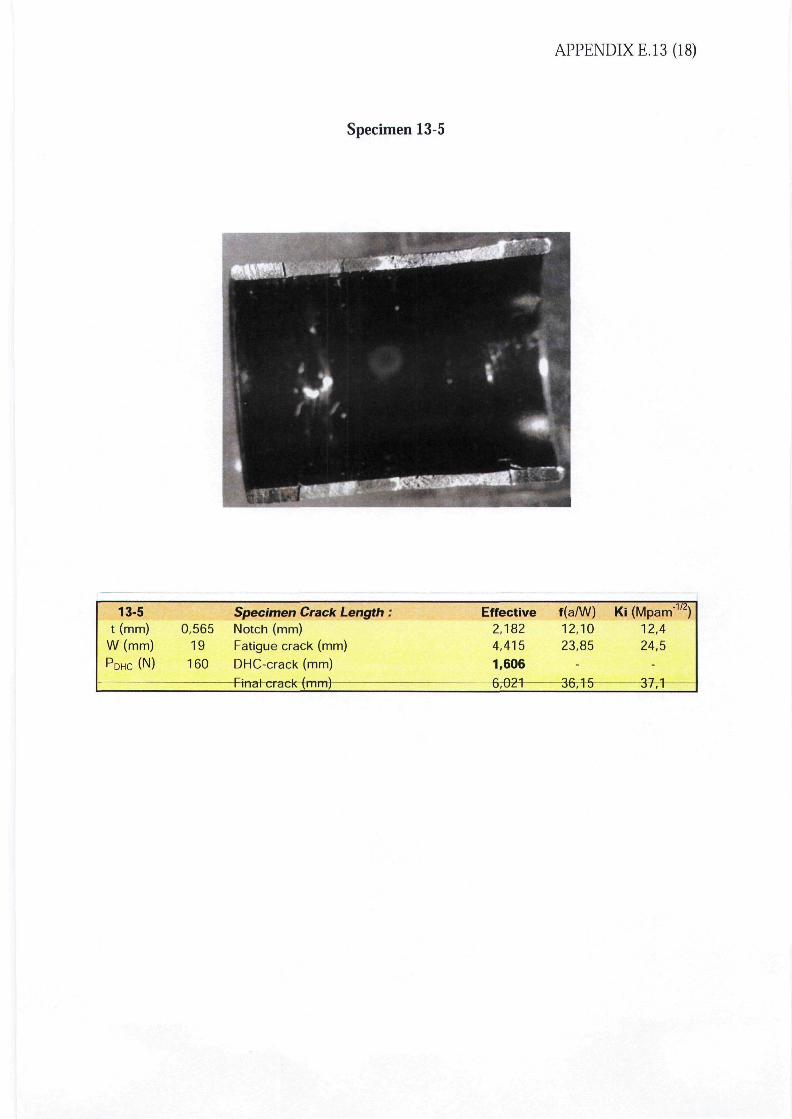
APPENDIX E.13 (18)
Specimen 13-5
13-5t (mm)
W(mm)PDHC (N)
0,56519
160
Specimen Crack Length :Notch (mm)Fatigue crack (mm)DHC-crack (mm)i~. i / \I inal crack ^mmJ
Effective2,1824,4151,606
6 n9i,\jf. I
f(a/W)12,1023,85
-Tfi 1 ^oD, I O
Ki (Mpam"1'2)12,424,5
-
37̂ 1
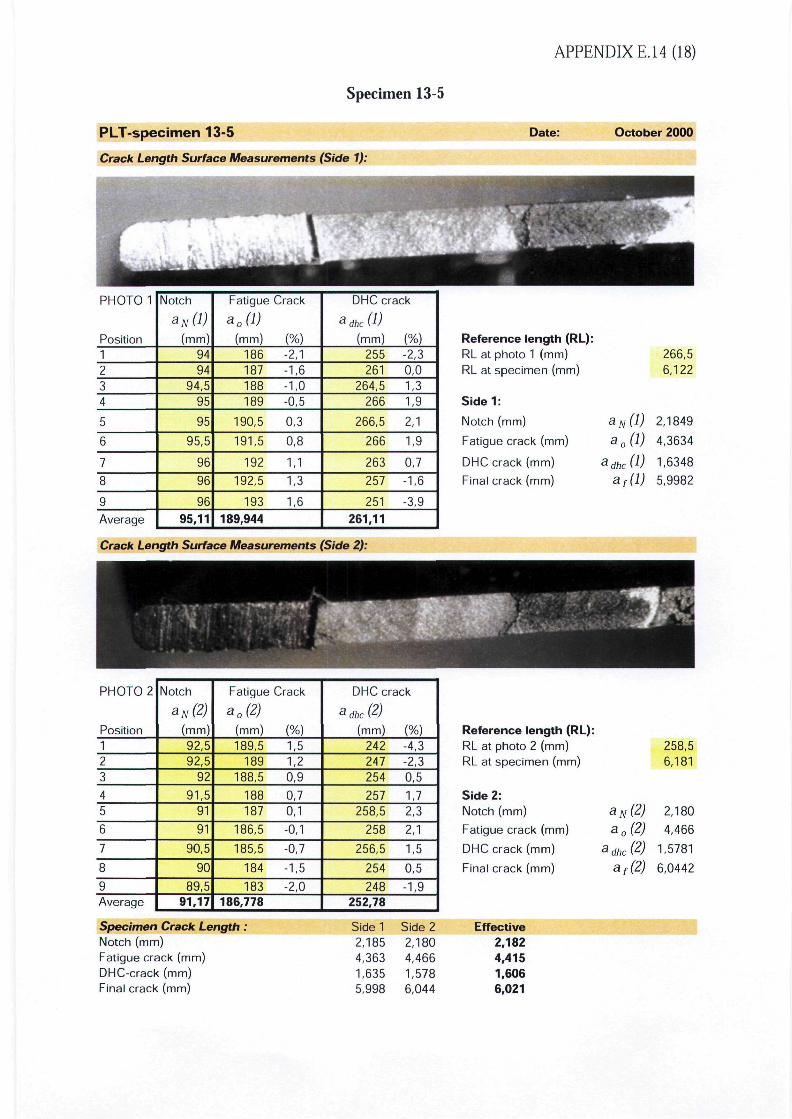
Specimen 13-5
APPENDIX E.I4 (18)
PLT-specimen 13-5
Crack Length Surface Measurements (Side 1):
Date: October 2000
PHOTO 1
Position1234
5
6
7
8
9
Average
Notch
aN(l)(mm)
9494
94,595
95
95,5
96
96
96
95,11
Fatigue
a0(D(mm)
186187188189
190,5
191,5
192
192,5
193
Crack
(%)-2,1-1,6-1,0-0,5
0,3
0,8
1,1
1,3
1,6
189,944
DHC crack
adhc(D(mm) (%)
255261
264,5266
266,5
266
263
257
251
-2,30,01,3
1,9
2,1
1,9
0,7
-1,6
-3,9
261,11
Reference length (RL):RL at photo 1 (mm)RL at specimen (mm)
Sidel:
Notch (mm)
Fatigue crack (mm)
DHC crack (mm)
Final crack (mm)
266,56,122
aN(l) 2,1849a0(l) 4,3634
adhc(l) 1,6348af(l) 5,9982
Crack Length Surface Measurements (Side 2):
PHOTO 2
Position123
45
6
7
8
9Average
Notch
aN(2)
(mm)92,592,5
92
91,591
91
90,5
90
89,591,17
Fatigue
a0(2)(mm)189,5
189188,5
188187
186,5
185,5
184
183
Crack
(%)1,51,20,9
0,70,1
-0,1
-0,7
-1,5
-2,0186,778
DHC crack
a dhc (2)(mm) (%)
242247254
257258,5
258
256,5
254
248
-4,3-2,30,5
1,72,3
2,1
1,5
0,5
-1,9252,78
Reference length (RL):RL at photo 2 (mm)RL at specimen (mm)
Side 2:Notch (mm)
Fatigue crack (mm)
DHC crack (mm)
Final crack (mm)
258,56,181
aN(2) 2,180a 0 (2) 4,466
a dhc (2) 1,5781a i (2) 6,0442
Specimen Crack Length :Notch (mm)Fatigue crack (mm)DHC-crack (mm)Final crack (mm)
Side 1 Side 22,185 2,1804,363 4,4661,635 1,5785,998 6,044
Effective2,1824,4151,6066,021
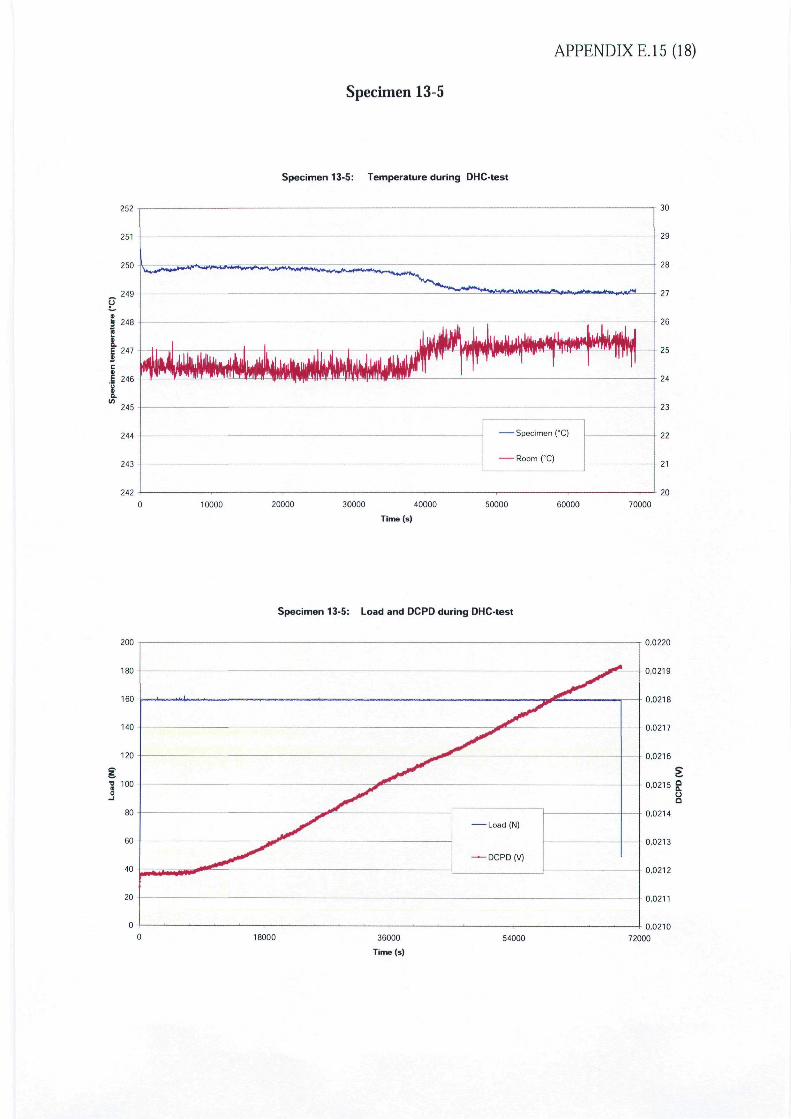
APPENDIX E.15 (18)
Specimen 13-5
252
251
Specimen 13-5: Temperature during DHC-test
244
243
242
Specimen (°C)
Room (°C)
10000 20000 30000 40000
Time (s)
50000 60000 70000
Specimen 13-5: Load and DCPD during DHC-test
200
180
18000 36000
Time (s)
54000
0,0220
0,0219
0,0218
0,021072000
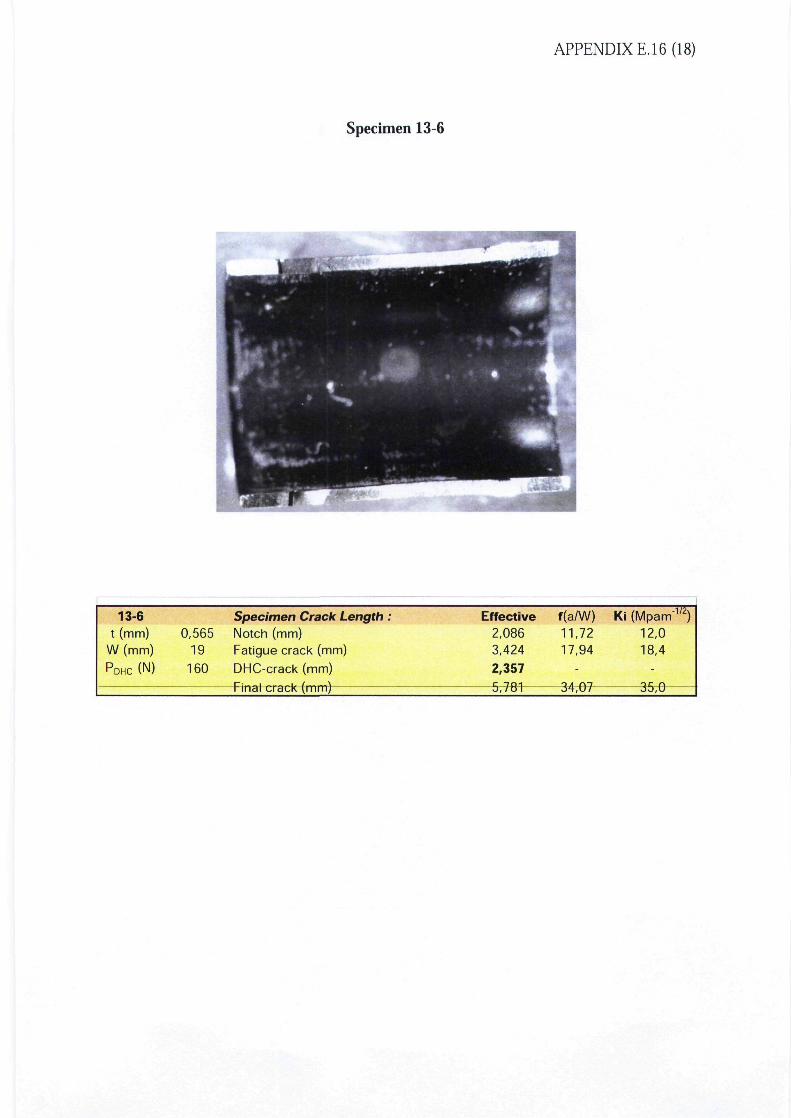
APPENDIX E.I6 (18)
Specimen 13-6
13-6t (mm)
W(mm)
PDHC (N)
0,56519
160
Specimen Crack Length :Notch (mm)Fatigue crack (mm)
DHC-crack (mm)i~. . / \I inal crauK ^mmj
Effective2,0863,424
2,357^ 7R10, To I
f(a/W)11,7217,94
-IA r\iOH,U/
Ki (Mpam'1'2)12,018,4
-TR r\oD,U
Specimen 13-6
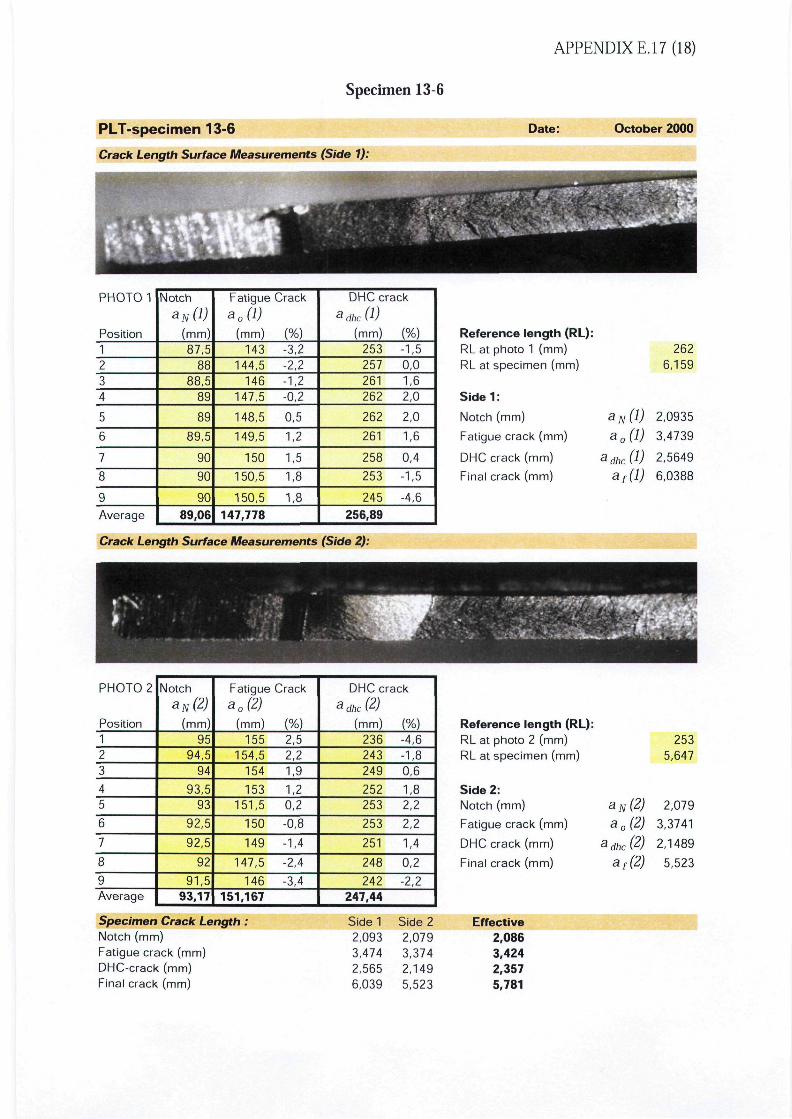
APPENDIX E.I7 (18)
PLT-specimen 13-6
Crack Length Surface Measurements (Side 1):
Date: October 2000
PHOTO 1
Position1234
5
6
7
8
9
Average
Notch
*H(1)
(mm)87,5
8888,5
89
89
89,5
90
90
9089,06
Fatigue
a0(D(mm)
143144,5
146147,5
148,5
149,5
150
150,5
150,5
Crack
(%)-3,2-2,2-1,2-0,2
0,5
1,2
1,5
1,8
1,8147,778
DHC crack
a dhc W(mm) (%)
253257261262
262
261
258
253
245
-1,50,01,62,0
2,0
1,6
0,4
-1,5
-4,6256,89
Reference length (RL):RL at photo 1 (mm)RL at specimen (mm)
Sidel:
Notch (mm)
Fatigue crack (mm)
DHC crack (mm)
Final crack (mm)
2626,159
aN(l) 2,0935a0(l) 3,4739
ldhc(l) 2,5649
af(l) 6,0388
Crack Length Surface Measurements (Side 2):
PHOTO 2
Position123
45
6
7
8
9Average
NotchaN(2)
(mm)95
94,594
93,593
92,5
92,5
92
91,593,17
Fatiguea0(2)
(mm)155
154,5154
153151,5
150
149
147,5
146
Crack
(%)2,52,21,9
1,20,2
-0,8
-1,4
-2,4
-3,4151,167
DHC crack
a dhc (2)
(mm) (%)236243249
252253
253
251
248
242
-4,6-1,80,6
1,82,2
2,2
1,4
0,2
-2,2247,44
Specimen Crack Length:Notch (mm)Fatigue crack (mm)DHC-crack (mm)Final crack (mm)
Side 1 Side 22,093 2,0793,474 3,3742,565 2,1496,039 5,523
Reference length (RL):RL at photo 2 (mm)RL at specimen (mm)
Side 2:Notch (mm)
Fatigue crack (mm)
DHC crack (mm)
Final crack (mm)
Effective2,0863,4242,3575,781
2535,647
aN(2) 2,079a0(2) 3,3741
adhc(2) 2,1489
a {(2) 5,523
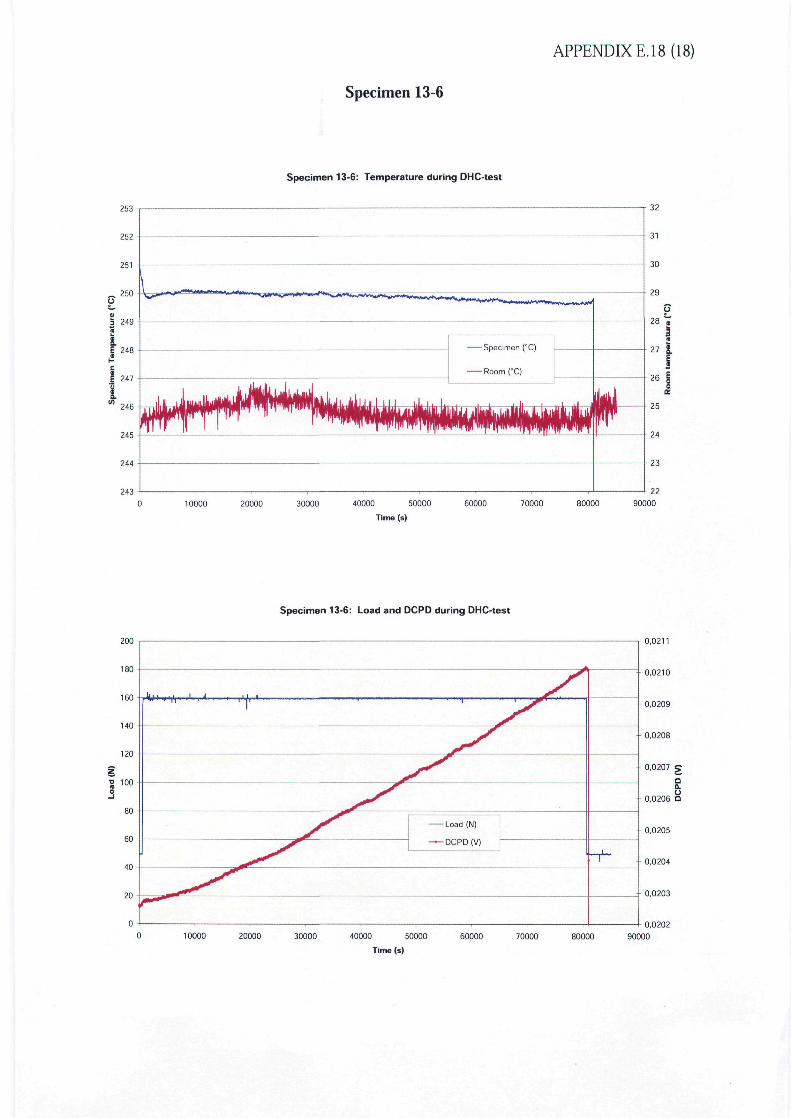
APPENDIX E.I8 (18)
Specimen 13-6
Specimen 13-6: Temperature during DHC-test
253
243
10000 20000 30000 40000 50000 60000
Time (s)
70000 80000 90000
Specimen 13-6: Load and DCPD during DHC-test
200
10000 20000 30000 40000 50000
Time (s)
60000 70000 80000
0,0211
: 0,0210
0,0202
90000

www.skis e
STATENS KARNKRAFTINSPEKTION
Swedish Nuclear Power Inspectorate
POSTIPOSTAL ADDRESS SE-i106 58 StockholmBES6K/OFFICE Klarabergsviodukten 90TELEFON/TELEPHONE +46 (0)8 698 84 00TELEFAX +46 (0)8 661 90 86E-POST/E-MAIL ski~ski seWEBOPLATS/WEB SITE www.ski.se
Related Documents

![[0429 2 3] 금융권 차세대 시스템 구현을 위한 Appication Framwork …](https://static.cupdf.com/doc/110x72/62111d7c34ed4d058b585c77/0429-2-3-appication-framwork-.jpg)


