Olympic Dam Expansion Draft Environmental Impact Statement 2009 Appendix O 955 APPENDIX O13 Coastal processes modelling

Welcome message from author
This document is posted to help you gain knowledge. Please leave a comment to let me know what you think about it! Share it to your friends and learn new things together.
Transcript

Olympic Dam Expansion Draft Environmental Impact Statement 2009 Appendix O 955
APPENDIX O13
Coastal processes modelling

Olympic Dam Expansion Draft Environmental Impact Statement 2009 Appendix O956

Olympic Dam Expansion Draft Environmental Impact Statement 2009 Appendix O 957
APPENDIX O13
Coastal Processes Investigation for Landing Facility in Upper Spencer Gulf:
Impact Assessment (report by BMT WBM, 2008)
See overleaf for report.

Olympic Dam Expansion Draft Environmental Impact Statement 2009 Appendix O958
Coastal Processes Investigation for Landing Facility in Upper Spencer Gulf: Impact Assessment
A part of BMT in Energy and Environment
R.B16727.002.03.Impacts.doc December 2008


Coastal processes investigation for landing
facility in Upper Spencer Gulf: Impact Assessment
Prepared For: ARUP HLA Olympic Dam EIS Project
Prepared By: BMT WBM Pty Ltd (Member of the BMT group of companies)
Offices
Brisbane Denver
Karratha Melbourne
Morwell Newcastle
Perth Sydney
Vancouver

CONTENTS I
CONTENTS
1 INTRODUCTION 1-1
2 LANDING FACILITY OPTIONS 2-1
3 LANDING FACILITY COASTAL PROCESS IMPACTS 3-1
3.1 Causeway Structure 3-1 3.1.1 Tidal Current Impacts 3-1 3.1.2 Tidal Sediment Transport impacts 3-1 3.1.3 Wave Climate Impacts 3-1 3.1.4 Shoreline Impacts 3-2
3.2 Piered Structure 3-9 3.2.1 Tidal Current Impacts 3-9 3.2.2 Tidal Sediment Transport impacts 3-9 3.2.3 Wave Climate Impacts 3-9 3.2.4 Shoreline Impacts 3-9
4 RISK ASSESSMENT 4-1
5 REFERENCES 5-1

LIST OF FIGURES II
LIST OF FIGURES
Figure 2-1 Causeway Option 2-2 Figure 2-2 Piered Option 2-3 Figure 3-1 Peak Flood Tide Velocity Distribution; a) Existing; b) Causeway
Landing Facility; c) Difference Due to Causeway Landing Facility. 3-3 Figure 3-2 Peak Ebb Tide Velocity Distribution; a) Existing; b) Causeway Landing
Facility; c) Difference Due to Causeway Landing Facility. 3-4 Figure 3-3 Net Tidal Sediment Transport Potential; a) Existing; b) Causeway
Landing Facility; c) Difference Due to Causeway Landing Facility. 3-5 Figure 3-4 Wave Field during a 25 knot SSE Wind and 0 m AHD Tide; a) Existing;
b) Causeway Landing Facility; c) Difference Due to Causeway Landing Facility. 3-6
Figure 3-5 Wave Field at during a 25 knot N Wind and 0 m AHD Tide; a) Existing; b) Causeway Landing Facility; c) Difference Due to Causeway Landing Facility. 3-7
Figure 3-6 Shoreline Impacts Due to Causeway Structure. 3-8 Figure 3-7 Peak Flood Tide Velocity Distribution; a) Existing; b) Piered Landing
Facility; c) Difference Due to Piered Landing Facility. 3-11 Figure 3-8 Peak Ebb Tide Velocity Distribution; a) Existing; b) Piered Landing
Facility; c) Difference Due to Piered Landing Facility. 3-12 Figure 3-9 Net Tidal Sediment Transport Potential; a) Existing; b) Piered Landing
Facility; c) Difference Due to Piered Landing Facility. 3-13 Figure 3-10 Wave Field during a 25 knot SSE Wind and 0 m AHD Tide; a) Existing;
b) Piered Landing Facility; c) Difference Due to Piered Landing Facility. 3-14
Figure 3-11 Wave Field during a 25 knot N Wind and 0 m AHD Tide; a) Existing; b) Piered Landing Facility; c) Difference Due to Piered Landing Facility. 3-15
LIST OF TABLES
Table 4-1 Summary of Generic Hazards at the preferred site. 4-1 Table 4-2 Summary of Likely Impacts Due to a Causeway Structure. 4-1 Table 4-3 Summary of Likely Impacts Due to a Piered Structure. 4-2

INTRODUCTION 1-1
1 INTRODUCTION
BHP Billiton is proposing to expand the existing Olympic Dam copper, uranium, gold and silver mine and processing plant, including associated infrastructure. Olympic Dam is located approximately 570km NNW of Adelaide, South Australia. As part of the proposed expansion, BHP Billiton is investigating a landing facility in Upper Spencer Gulf to enable super pre-assembled modules (SPAMS) and/or pre-assembled modules (PAMS) to be received from vessels and then dispatched from the facility to a nearby laydown yard or directly to the mine site. These SPAMS/PAMS will comprise mainly mining and processing equipment and pre-assembled accommodation units.
The preferred site, Site 1 (of four sites investigated), is located on the western side of Upper Spencer Gulf, approximately 10 km to the south of Port Augusta.
BMT WBM Pty Ltd were commissioned to undertake an investigation of existing hydrodynamic and coastal process prior to assessing the potential impacts of the proposed landing facility developments in this context.
This report details the assessment of hydrodynamic and coastal processes related impacts associated with the proposed landing facility. A separate report, BMT WBM (2008), provides details of the existing environment at the potential landing facility locations, and of the calibration and validation of the numerical models that have been used in this assessment.
The broad outline of this coastal process impact assessment report is:
• Introduction (Section 1);
• A description of the landing facility options that have been investigated (Section 2);
• An assessment of the coastal process impacts associated with each option (Section 3);
• A risk assessment of the landing facility options in the context of the coastal process impacts (Section 4).

LANDING FACILITY OPTIONS 2-1
2 LANDING FACILITY OPTIONS
The existing environment at the landing facility site has been investigated in detail in BMT WBM (2008). Effects of the landing facility on sediment transport and coastal dynamics were predicted using three models (BMT WBM 2008):
• the Estuary, Lake and Coastal Ocean Model (ELCOM) was applied at three nested scales with grid size ranging from 2 km to 40 m.
• the TRANSPOR model was used to predict sand/sediment movement in the vicinity of the landing facility.
• the Simulating Waves Nearshore (SWAN) model was used to predict the wave climate of Upper Spencer Gulf
The current report considers the coastal process impacts of two landing facility options at this site.
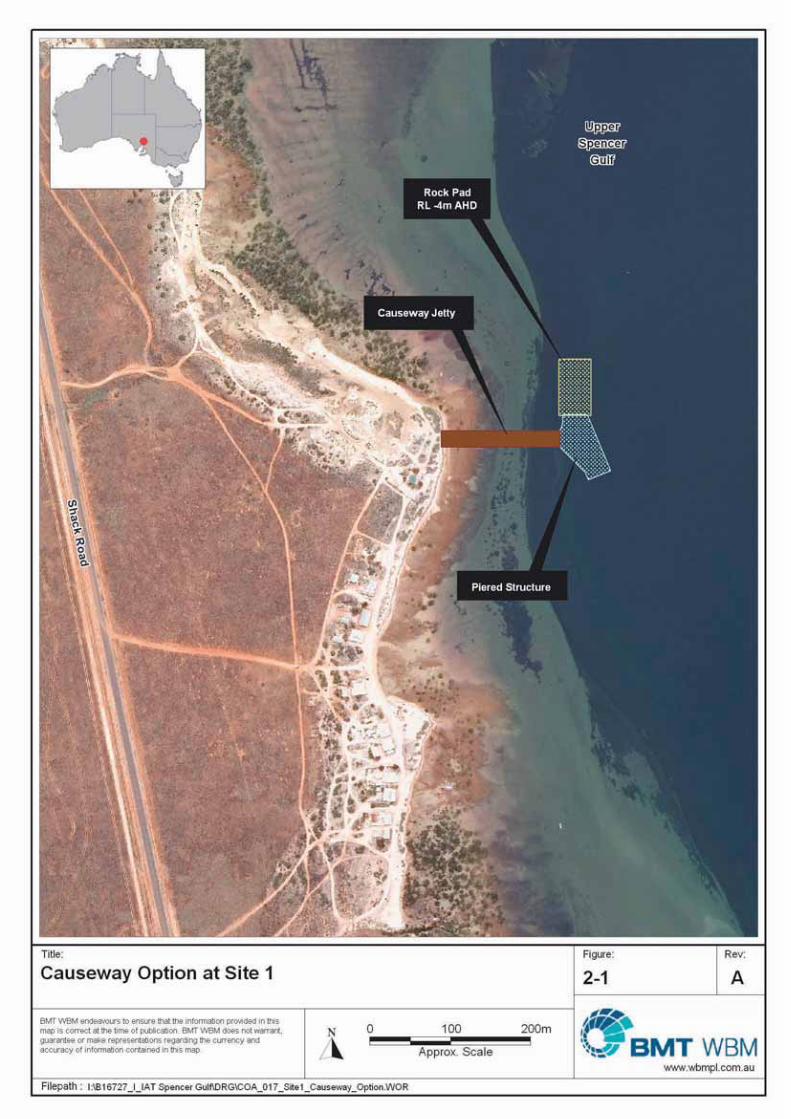
The first option (Figure 2-1) consists of a causeway structure extending approximately 160 m from the shoreline to a depth of about –5 m AHD. It was assumed that the final 40 m extending out to about –8 m AHD would be a piered platform. A rock pad built to a finished surface level of –4 m AHD was located on the northern side of the structure where the natural seabed level is between –4 and –8 m AHD. This option was considered unlikely to be adopted, but was included as it presented a potential worst-case scenario at the site in terms of coastal process impacts.
The causeway structure was represented in the hydrodynamic and wave numerical models by changing the model grid points corresponding to the causeway into land cells. The rock pad was represented by raising the bathymetric level of the relevant model grid points to reflect the –4 m AHD finished level.
The second option (Figure 2-2) consists of a fully piered structure extending form the shoreline to approximately –8 m AHD water depth. A rock pad built to a finished surface level of –4 m AHD was located on the northern side of the structure where the natural seabed level is between –4 and –8 m AHD.
The piered jetty would be highly permeable to tidal flow and wave propagation and would have only very minor fine-scale impacts on these processes. The rock pad was represented in the numerical models by raising the bathymetric level of the relevant model grid points to reflect the –4 m AHD finished level.


LANDING FACILITY COASTAL PROCESS IMPACTS 3-1
3 LANDING FACILITY COASTAL PROCESS IMPACTS
3.1 Causeway Structure
3.1.1 Tidal Current Impacts
Tidal flow occurs in a north-south direction approximately parallel to the shoreline at the preferred site. As identified in BMT WBM (2008) the high tidal current velocities of up to 1 m/s are restricted to the deep water channel approximately 250 m offshore. Landward of the landing facility deepwater extent the peak tidal current velocities are less than 0.4 m/s.
The causeway structure presents an impermeable obstruction to the nearshore flow, which will result in localised flow re-distribution leading to both increases and decreases in tidal current velocities. In addition the rock pad will have some relatively minor potential to cause localised flow re-distribution. However, the causeway structure does not have the potential affect tidal currents on a regional scale (more than 1km from the structure).
Figure 3-1 shows the impacts of the causeway structure on peak flood tide currents. There is a pronounced reduction in the nearshore velocities immediately south and north of the impermeable structure and a slight increase in velocities just offshore of the structure. A gyre is observed to develop in the lee of the structure, leading to a reversal in currents along the shoreline to the north.
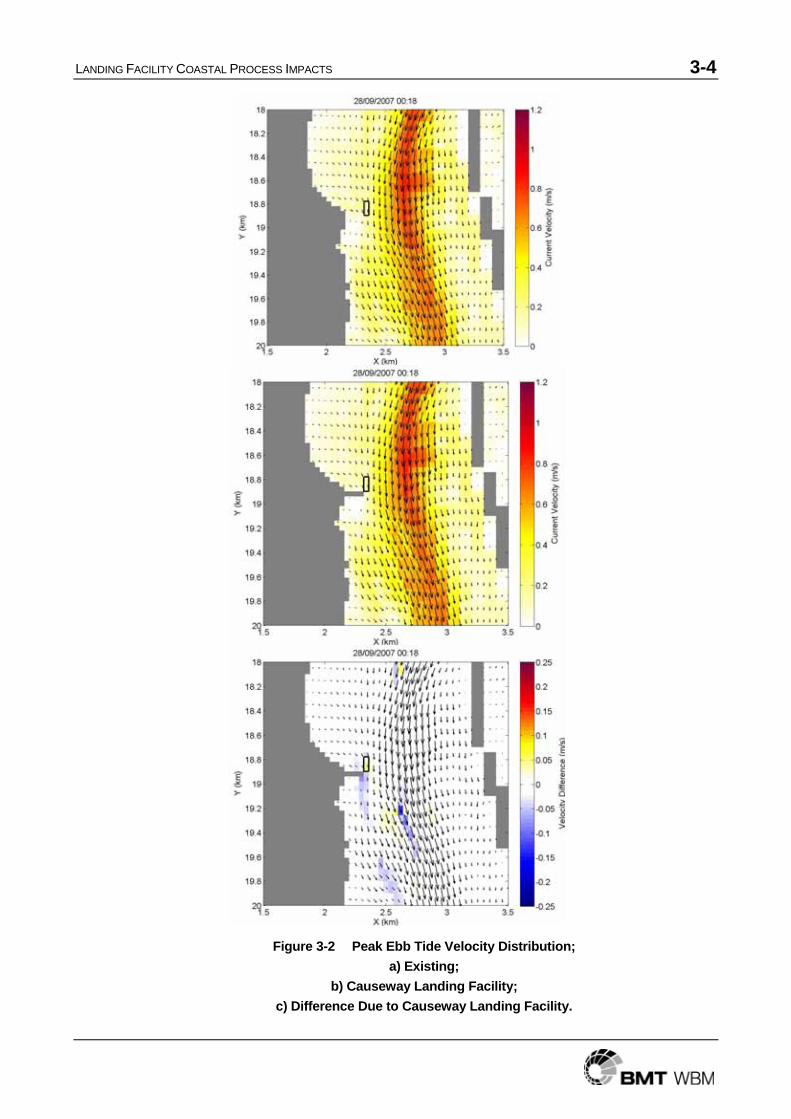
The impact of the causeway structure on the peak ebb tide currents is shown in Figure 3-2. There is a reduction in nearshore velocities immediately north and south of the impermeable structure. An increase in velocities above the rock platform is apparent
3.1.2 Tidal Sediment Transport impacts
As discussed in BMT WBM (2008) the net potential for sediment transport due to tidal currents is low in the nearshore vicinity of the preferred site. In addition the nearshore rock shelf area is starved of mobile (fine) sediment, meaning that the actual tidal sediment transport will be significantly less than the calculated potential values. The tidal sediment transport potential impacts due to the causeway structure are shown in Figure 3-3. In effect, the low amount of northward nearshore tidal sediment transport would be blocked by the causeway structure. The causeway landing facility would not have the potential to have any tidal sediment transport impacts on a regional scale.
On a scale less than the model resolution (40 m) there would be a likelihood of scour developing in any fine (sand or silt) sediments at the toe of the causeway and rock pad structures, particularly at their seaward extent.
3.1.3 Wave Climate Impacts
The causeway landing facility option would have a localised impact on the wave climate inshore to the south and in particular to the north, largely due to the wave-shadow created by the impermeable structure. There would be no regional impacts on wave climate due to the causeway landing facility.

LANDING FACILITY COASTAL PROCESS IMPACTS 3-2
BMT WBM (2008) derived a nearshore wave climate which was strongly dominated by local wind waves from the South-South-East. Figure 3-4 shows the impacts that the causeway structure would have on the nearshore wave field due to a 25 knot wind from the SSE. The structure can be seen to create a wave shadow in its lee, which extends some 200 m to the north. This wave shadow would result in a local reduction in littoral transport and would in turn generate a shoreline response (refer Section 3.1.4). The causeway structure would have no wave climate impacts on the embayment to the south of the preferred site for the predominant SSE wave direction.
Winds from the Northerly sector are also commonly experienced in the study area, however due to the limited fetch from this direction only relatively small wave heights (Hs <0.4 m) are generated at the preferred site (BMT WBM 2008). Figure 3-5 shows the impacts that the causeway structure would have on the nearshore wave field due to a 25 knot wind from the North. The structure casts a wave shadow along the embayment to the south. This would have some impact on littoral transport within the embayment under northerly waves, however BMT WBM (2008) identified that this accounted for less than 10% of the gross littoral transport which is strongly dominated by waves from the SSE sector.
3.1.4 Shoreline Impacts
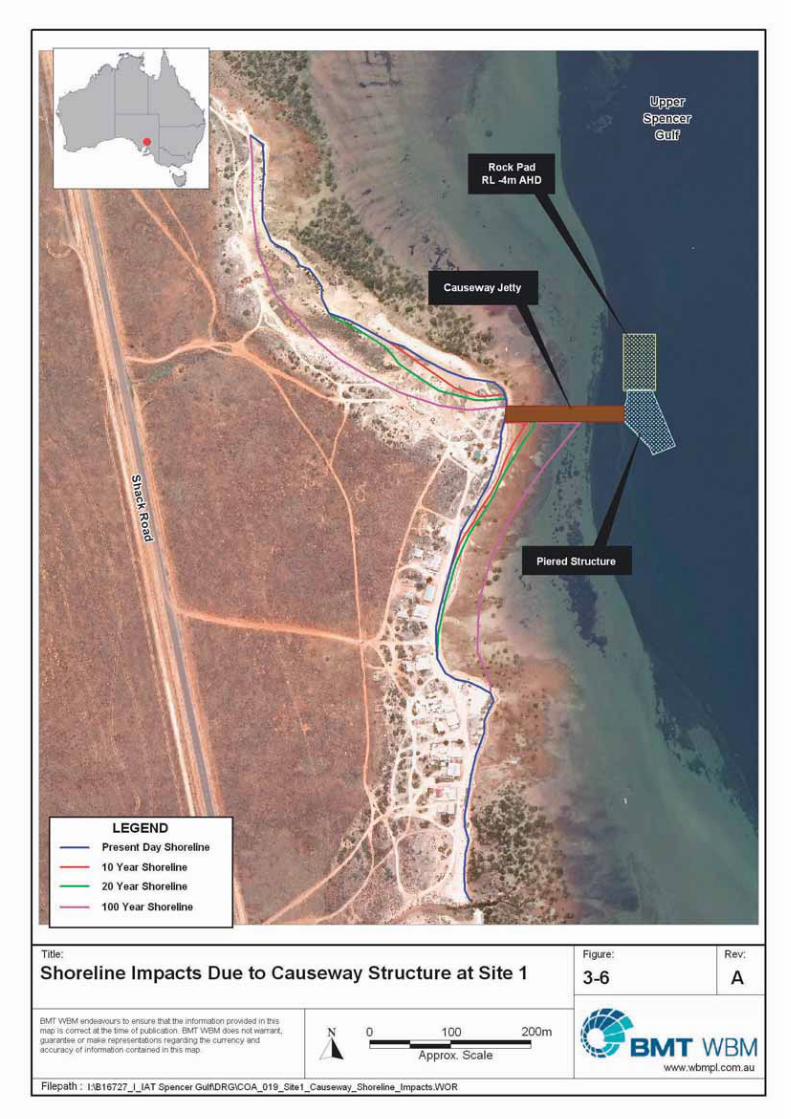
The causeway landing facility structure would not have any shoreline erosion/accretion impacts on a regional (> 1km) scale within a timeframe of the next 100 years, however it would lead to a re-alignment of the shoreline immediately updrift (to the south) and downdrift (to the north). This would be predominantly due to the impermeable structure acting to block the net northward littoral transport of sediment. Modifications to the updrift and downdrift nearshore wave climates (Section 3.1.3) would have a secondary impact on the resulting shoreline re-alignment.
A schematic of the potential shoreline impacts of the causeway structure after a period of 10, 20 and 100 years is shown in Figure 3-6. Based on the littoral drift analysis results undertaken in BMT WBM (2008), a net longshore transport rate of 180 m3/annum has been assumed in calculating the updrift accretion and downdrift erosion volumes represented in Figure 3-6.
Shoreline recession on a regional scale is also likely to occur due to accelerating sea level rise associated with global warming. As discussed in BMT WBM (2008) the range of expected sea level rise rates is between 2.8 and 7.9 mm/year averaged over the next 100 years and would result in up to 20 m of shoreline recession at the preferred site over that period. The sea level rise induced recession would be distributed approximately uniformly along the shoreline and in the case of the causeway option would be superimposed on the shoreline impacts shown in Figure 3-6.

LANDING FACILITY COASTAL PROCESS IMPACTS 3-3
Figure 3-1 Peak Flood Tide Velocity Distribution; a) Existing;
b) Causeway Landing Facility; c) Difference Due to Causeway Landing Facility.
LANDING FACILITY COASTAL PROCESS IMPACTS 3-4
Figure 3-2 Peak Ebb Tide Velocity Distribution; a) Existing;
b) Causeway Landing Facility; c) Difference Due to Causeway Landing Facility.

LANDING FACILITY COASTAL PROCESS IMPACTS 3-5
Figure 3-3 Net Tidal Sediment Transport Potential; a) Existing;
b) Causeway Landing Facility; c) Difference Due to Causeway Landing Facility.

LANDING FACILITY COASTAL PROCESS IMPACTS 3-6
Figure 3-4 Wave Field during a 25 knot SSE Wind and 0 m AHD Tide; a) Existing;
b) Causeway Landing Facility; c) Difference Due to Causeway Landing Facility.

LANDING FACILITY COASTAL PROCESS IMPACTS 3-7
Figure 3-5 Wave Field at during a 25 knot N Wind and 0 m AHD Tide; a) Existing;
b) Causeway Landing Facility; c) Difference Due to Causeway Landing Facility.

LANDING FACILITY COASTAL PROCESS IMPACTS 3-9
3.2 Piered Structure
3.2.1 Tidal Current Impacts
The piered structure would be relatively permeable to nearshore flow and as such would have only a small-scale impact on the tidal hydrodynamics. The rock pad component of this option would be the most significant change of relevance to coastal processes and is the only component that was able to be resolved in the hydrodynamic models used in this study.
Figure 3-7 shows the impacts of the piered structure on peak flood tide currents. Apart from a minor increase in velocities immediately above the rock pad the impacts are insignificant.
The impact of the piered structure on the peak ebb tide currents is shown in Figure 3-8. As for the flood tide currents the most significant change is a minor increase in velocities above the rock pad.
On a scale less than the model resolution (40 m) individual piers will generate turbulence, which may have the potential to cause some localised scouring of the bed.
3.2.2 Tidal Sediment Transport impacts
The relatively insignificant hydrodynamic impacts of the piered structure and associated rock pad are reflected in the correspondingly small tidal sediment transport impacts shown in Figure 3-9. Significant impacts in the vicinity of the structure are not apparent due to the low background transport levels in the nearshore region.
On a scale less than the model resolution (40 m) there would be a likelihood of scour developing in any fine (sand or silt) sediments around the individual piers and at the toe of rock pad structures.
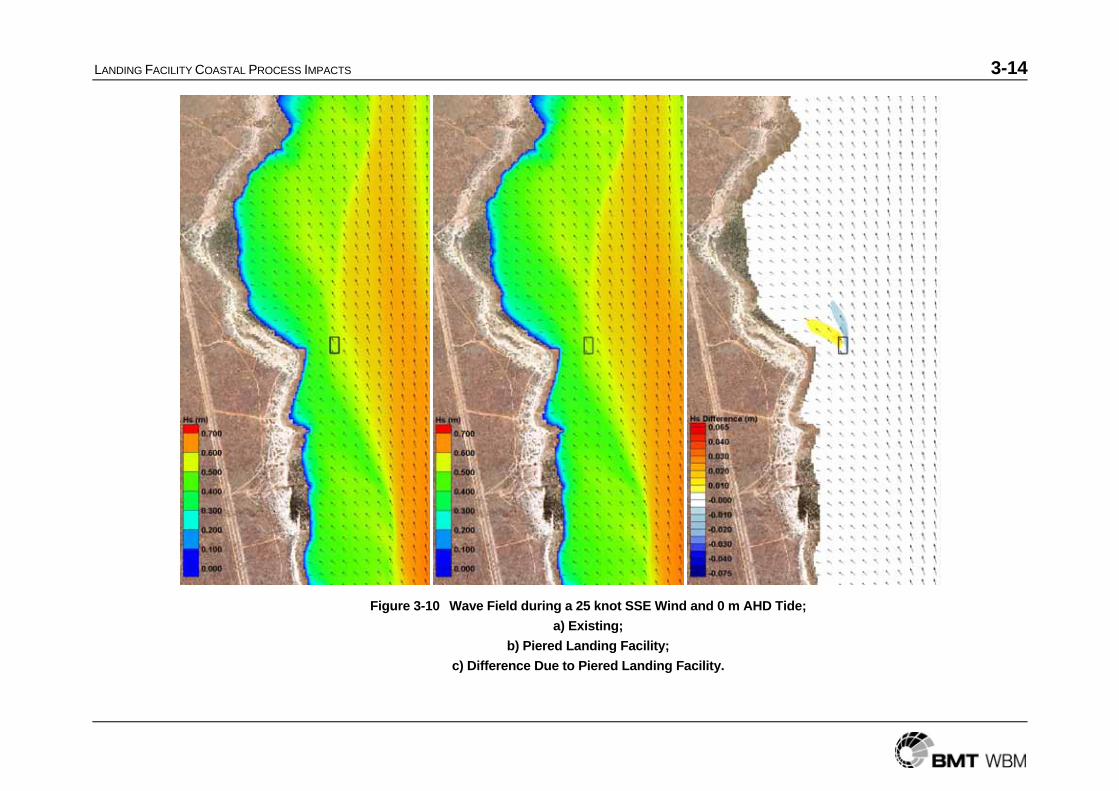
3.2.3 Wave Climate Impacts
The permeable nature of the piered structure and the limited extent of the rock pad component mean that the piered option would have an insignificant impact on the nearshore wave field. This is confirmed in Figure 3-10 which shows the wave field impacts for a 25 knot SSE wind and in Figure 3-11 which shows the impacts for a 25 knot N wind.
3.2.4 Shoreline Impacts
The piered structure would not be expected to generate any significant shoreline impacts due to its permeable nature and the insignificant hydrodynamic and wave impacts that are associated with this option.
As discussed in BMT WBM (2008), while the shoreline at the preferred site has been relatively stable over the last 50 years, there is some evidence of a reduction, over time, in the total volume of sediment in the “beach” which occurs above high water. This probably indicates that there is ongoing erosion of the embayment to the south at a slow rate (< 0.1 m/annum shoreline recession), which is due to a longshore transport differential generated by limited supply of fine sediment from the south. The piered landing facility structure would not be likely to contribute further to this progressive erosion problem due to its permeable nature and its location downdrift of the embayment.

LANDING FACILITY COASTAL PROCESS IMPACTS 3-10
Irrespective of the proposed option, shoreline recession on a regional scale is likely to occur due to accelerating sea level rise associated with global warming. As discussed in BMT WBM (2008) the range of expected sea level rise rates is between 2.8 and 7.9 mm/year averaged over the next 100 years and would result in up to 20 m of shoreline recession at the preferred site over this period.

LANDING FACILITY COASTAL PROCESS IMPACTS 3-11
Figure 3-7 Peak Flood Tide Velocity Distribution; a) Existing;
b) Piered Landing Facility; c) Difference Due to Piered Landing Facility.

LANDING FACILITY COASTAL PROCESS IMPACTS 3-12
Figure 3-8 Peak Ebb Tide Velocity Distribution; a) Existing;
b) Piered Landing Facility; c) Difference Due to Piered Landing Facility.

LANDING FACILITY COASTAL PROCESS IMPACTS 3-13
Figure 3-9 Net Tidal Sediment Transport Potential; a) Existing;
b) Piered Landing Facility; c) Difference Due to Piered Landing Facility.
LANDING FACILITY COASTAL PROCESS IMPACTS 3-14
Figure 3-10 Wave Field during a 25 knot SSE Wind and 0 m AHD Tide; a) Existing;
b) Piered Landing Facility; c) Difference Due to Piered Landing Facility.

LANDING FACILITY COASTAL PROCESS IMPACTS 3-15
Figure 3-11 Wave Field during a 25 knot N Wind and 0 m AHD Tide; a) Existing;
b) Piered Landing Facility; c) Difference Due to Piered Landing Facility.

RISK ASSESSMENT 4-1
4 RISK ASSESSMENT
A risk assessment has been undertaken for the landing facility options at the preferred site. This has involved identifying the coastal process hazards and impacts associated with each option.
Firstly the generic hazards that apply to all options have been summarised in Table 4-1. These hazards, while they need to be addressed during the landing facility design process, are not considered to be a significant impediment to the development of a landing facility at this site.
Table 4-1 Summary of Generic Hazards at the preferred site.
Hazard Degree of Hazard
Storm tide inundation Frontal dune likely to be overtopped with an AEP of >10% particularly with future sea level rise (refer BMT WBM 2008 Section 4.2.3).
Storm erosion Storm erosion is likely to be < 5 m (refer BMT WBM 2008 Section 4.2.6.2).
Long term progressive erosion Up to 20 metres over a 100 year period, predominantly due to future sea level rise (refer BMT WBM 2008 Section 4.2.6.4).
Secondly the likely coastal process impacts due to a causeway structure have been summarised in Table 4-2 and for the piered structure in Table 6-3. It is apparent that the piered structure has a low likelihood of inducing significant coastal process impacts while the causeway structure would be highly likely to cause significant shoreline changes over time. For this reason there is considerably less coastal process related risk associated with the proposed piered structure than there is with the causeway structure.
Table 4-2 Summary of Likely Impacts Due to a Causeway Structure.
Impact Degree of Impact
Shoreline – updrift Progressive accretion due to impoundment of littoral sand transport of between 35 and 180 m3/annum (refer Figure 3-6 for upper bound impact).
Shoreline – downdrift Progressive erosion due interruption of longshore sand transport of between 35 and 180 m3/annum annum (refer Figure 3-6 for upper bound impact).

RISK ASSESSMENT 4-2
Table 4-3 Summary of Likely Impacts Due to a Piered Structure.
Impact Degree of Impact
Shoreline – updrift Insignificant impact due to permeable structure.
Shoreline – downdrift Insignificant impact due to permeable structure.
REFERENCES 5-1
5 REFERENCES
BMT WBM, 2008. Coastal Processes Investigation for landing facility in Upper Spencer Gulf: Existing Environment and Model Calibration. R.B16727.001.00.doc.

BMT WBM Brisbane Level 11, 490 Upper Edward Street Brisbane 4000
PO Box 203 Spring Hill QLD 4004 Tel +61 7 3831 6744 Fax +61 7 3832 3627 Email [email protected] Web www.wbmpl.com.au
BMT WBM Denver 14 Inverness Drive East, #B132 Englewood Denver Colorado 80112 USA Tel +1 303 792 9814 Fax +1 303 792 9742 Email [email protected] Web www.wbmpl.com.au
BMT WBM Melbourne Level 5, 99 King Street Melbourne 3000 PO Box 604 Collins Street West VIC 8007 Tel +61 3 8620 6100 Fax +61 3 8620 6105 Email [email protected] Web www.wbmpl.com.au
BMT WBM Morwell Cnr Hazelwood Drive & Miners Way Morwell 3840 PO Box 888 Morwell VIC 3840 Tel +61 3 5135 3400 Fax +61 3 5135 3444 Email [email protected] Web www.wbmpl.com.au
BMT WBM Newcastle 126 Belford Street Broadmeadow 2292 PO Box 266 Broadmeadow NSW 2292 Tel +61 2 4940 8882 Fax +61 2 4940 8887 Email [email protected] Web www.wbmpl.com.au
BMT WBM Perth 1 Brodie Hall Drive Technology Park Bentley 6102 Tel +61 8 9328 2029 Fax +61 8 9486 7588 Email [email protected] Web www.wbmpl.com.au
BMT WBM Sydney Suite 206, 118 Great North Road Five Dock 2046 PO Box 129 Five Dock NSW 2046 Tel +61 2 9713 4836 Fax +61 2 9713 4890 Email [email protected] Web www.wbmpl.com.au
BMT WBM Vancouver 1190 Melville Street #700 Vancouver British Columbia V6E 3W1 Canada Tel +1 604 683 5777 Fax +1 604 608 3232 Email [email protected] Web www.wbmpl.com.au
Related Documents