TRANS-CANADA HIGHWAY 1 - MALAHAT CORRIDOR STUDY July 2007 Final Report Appendix K Assessment of Inter-Regional Transit Options

Welcome message from author
This document is posted to help you gain knowledge. Please leave a comment to let me know what you think about it! Share it to your friends and learn new things together.
Transcript
TRANS-CANADA HIGHWAY 1 - MALAHAT CORRIDOR STUDY
July 2007 Final Report
Appendix K Assessment of Inter-Regional Transit
Options
Halcrow Consulting Inc Suite 508, 4190 Lougheed Highway, Burnaby, British Columbia V5C 6A8 Canada Tel +1 (604) 293-2882 Fax +1 (604) 293-2892 www.halcrow.com Halcrow Consulting Inc has prepared this report in accordance with the instructions of their client, Ministry of Transportation and BC Transit, for their sole and specific use. Any other persons who use any information contained herein do so at their own risk. © Halcrow Group Limited 2007
Ministry of Transportation and BC Transit Malahat Travel Demand Study – Assessment of Inter-Regional Transit Options Final Report November 2006
Halcrow Consulting Inc
Ministry of Transportation and BC Transit Malahat Travel Demand Study – Assessment of Inter-Regional Transit Options Final Report
Contents Amendment Record This report has been issued and amended as follows: Issue Revision Description Date Approved by
0 1 Draft Report 10/03/06 K. Krajczar
1 1 Final Report 11/23/06 K. Krajczar

Doc No Rev: Date: November 2006
Report_CTLBET_Final2.doc
Contents 1 Introduction 1
1.1 Background 1 1.2 Study Objectives and Approach 2 1.3 Structure of Report 2
2 Traffic and Travel Survey Data 4 2.1 Introduction 4 2.2 Existing Traffic Count Data 4 2.3 2006 Roadside Survey 7 2.4 Stated Preference Survey 14 2.5 2001 Place of Work / Place of Residence Data 15 2.6 Jack Bell Vanpool and Greyhound Travel Data 18
3 Travel Demand Model Development 20 3.1 Introduction 20 3.2 Traffic Zones and Demographics 20 3.3 Road and Transit Network 22 3.4 Development of Base Year Demand Matrices 23 3.5 Growth Model 25 3.6 Mode Split Model 26
4 Bus and Commuter Rail Service Options 29 4.1 Bus Service Alternatives 29 4.2 Commuter Rail 32
5 Ridership Forecasts 36 5.1 Scenario Descriptions 36 5.2 Ridership Forecasts 36 5.3 Preliminary Cost and Performance Statistics 39 5.4 Benchmarking of Ridership Forecasts 40
6 Summary and Conclusions 41
Appendix A – Roadside Origin-Destination Survey
Appendix B – Stated Preference Survey
Appendix C – Vehicle Classification Definitions
Appendix D – Commuter Rail Cost Estimates
Doc No Rev: Date: November 2006
Report_CTLBET_Final2.doc
List of Figures Figure 1.1 – Study Area Map.......................................................................................................................3 Figure 2.1 - Historic Traffic Growth on the Malahat Hwy (AADT)....................................................4 Figure 2.2 - Monthly Traffic Volumes on Highway 1 .............................................................................5 Figure 2.3 – 2005 Total Hourly Volumes (Both Directions) .................................................................5 Figure 2.4 – 2005 Northbound Hourly Volumes.....................................................................................6 Figure 2.5 – 2005 Southbound Hourly Volumes .....................................................................................6 Figure 2.6 – 2006 Northbound Summer Traffic Volume Comparison ...............................................7 Figure 2.7 – 2006 Southbound Summer Traffic Volume Comparison ................................................8 Figure 2.8 – Directional Vehicle Classification Summary.....................................................................10 Figure 2.9 – CVRD Residents working in Downtown Victoria ..........................................................18 Figure 3.1 – CVRD Traffic Zones............................................................................................................21 Figure 3.2 – CVRD Road and Rail Network ..........................................................................................23 Figure 3.3 – Growth Factor Comparison................................................................................................26 Figure 3.4 – Logit Curve ............................................................................................................................27 Figure 4.1 – Proposed Express Bus Services..........................................................................................32 Figure 4.2 – Proposed Commuter Rail Line ...........................................................................................34 Figure 5.1 – Daily Ridership Estimates....................................................................................................38
Doc No Rev: Date: November 2006
Report_CTLBET_Final2.doc
List of Tables Table 2.1 – Vehicle Classification by Direction (Summer Weekday) ...................................................9 Table 2.2 – Summer Weekday Trip Purpose by Time Period (Northbound) ...................................11 Table 2.3 – 2006 Annual Average Weekday Trip Purpose by Time Period (Northbound)............11 Table 2.4 – Summer Daily Vehicle Occupancy by Purpose (Northbound) ......................................12 Table 2.5 – Summer Weekday OD Trip Table (Northbound) ............................................................13 Table 2.6 – Percent of NB Trips Making SB Trip on Same Day ........................................................14 Table 2.7 – Frequency of Use by Trip Purpose .....................................................................................14 Table 2.8 – Completed SP Surveys by Market Segment .......................................................................15 Table 2.9 - Place of Residence by Place of Work for CVRD Residents Working in the CRD......16 Table 2.10 – Summary of Vanpool Data for South Cowichan Valley................................................19 Table 3.1 – CVRD Population Estimates ...............................................................................................22 Table 3.2 – PM Peak Period Trip Matrices (Northbound)...................................................................25 Table 3.4 – Summary of Stated Preference Survey Results ..................................................................28 Table 3.5 –Stated Preference Values of Time and Transit Weights....................................................28 Table 4.1 – Express Bus Travel Distances, Times and Fares...............................................................30 Table 4.2 - Rail Travel Times and Fares ..................................................................................................33 Table 5.1 – Scenario Summary..................................................................................................................36 Table 5.2 – PM and Daily Ridership Forecasts ......................................................................................37 Table 5.3 – 2006 PM Peak Period Commuter Rail OD’s (3 Train Option) ......................................38 Table 5.4 – Preliminary Cost and Performance Statistics .....................................................................39
Doc No Rev: Date: November 2006
1 Report_CTLBET_Final2.doc
1 Introduction
1.1 Background
1.1.1 The Malahat Highway is a two lane undivided facility that is the primary highway connection between the Capital Regional District (CRD) and north Island communities. The highway is part of the Trans Canada Highway system, which extends between Nanaimo and Victoria, a distance of approximately 90 kilometres.
1.1.2 The highway was constructed as a gravel road in 1911 and has undergone many upgrades since that time. Average daily traffic volumes are currently in the 20,000 to 25,000 range and the highway is experiencing significant congestion as more and more people choose to live in the South Cowichan area and commute to Victoria.
1.1.3 The Ministry of Transportation is currently evaluating different long-term highway improvement options for the Malahat corridor. Multi-modal solutions for the corridor have not been examined in detail, but recently, questions have been raised regarding the feasibility of commuter rail or other transit service between the Cowichan Valley and Victoria and the impact that this might have on future vehicular demand on the Malahat Highway.
1.1.4 The E&N Railway runs parallel to the Malahat Highway and provides connectivity between Victoria and the Cowichan Valley, linking the communities of Duncan, Chemainus, and Ladysmith and extending as far north as Courtney. Within the CRD the railway is being devolved to the Island Corridor Foundation, a group of municipalities and First Nations bordering the existing E&N corridor. On behalf of the City of Langford, Halcrow is currently assessing the ridership potential associated with a commuter rail service between Langford and downtown Victoria. However, the Langford study does not treat the ridership potential between the Cowichan Valley Regional District (CVRD) and the CRD.
1.1.5 While the BC MoT is looking at long-term options within the corridor, including commuter rail, BC Transit is interested in the feasibility of operating a regional transit link between the CVRD and the CRD. BC Transit requires a better understanding of the potential demand for inter-regional transit services in the short-term (2006 to 2008), as well as the relevant and cost-effective transit service options.
1.1.6 Although the Ministry maintains current traffic count information for the highway, the last roadside origin-destination survey was conducted in 1996. Thus, information on travel characteristics (e.g., trip purposes, origin-destinations) is out-of-date. This information, along with current data on travellers’ perception of alternative modes and their value of time is required in order to provide a reliable estimate of the potential demand for different transit alternatives.
Doc No Rev: Date: November 2006
2 Report_CTLBET_Final2.doc
1.2 Study Objectives and Approach
1.2.1 The objectives of this study are:
Undertake roadside interview survey to collect travel demand information for the Malahat corridor (e.g., origin-destination, trip purpose, and trip frequency information for travel between CVRD and CRD);
develop commuter rail service options between Duncan and the CRD with associated operating characteristics such as frequency, travel time, station locations, park-and-ride facilities, bus integration, fare structure etc.;
undertake stated preference surveys to assess the ridership potential for commuter rail under different operating characteristics and fare structures;
develop forecasts for commuter rail patronage and the resulting impact on vehicular demand along the Malahat;
characterize and estimate travel demand for inter-regional transit services between the Cowichan Valley Regional District (CVRD) and the Victoria Regional Transit System (VRTC) in the short-term (2006 to 2008); and
recommend relevant and cost-effective transit service options to satisfy the identified travel demands.
1.2.2 Major activities included: travel demand and stated preference surveys, model development, transit option development, ridership forecasting and assessment of transit options.
1.2.3 Figure 1.1 provides a map highlighting the communities along the corridor, Highway 1 and the E&N Railway. The map also shows the location of three Ministry traffic count stations that were used in this study.
1.2.4 It is important to note that the ridership forecasts developed for this study focus on trips between the CRD and CVRD. The proposed service options could also serve markets between the Langford area and Victoria which are not included in this assessment. However, while the additional ridership from Langford to Victoria may decrease the subsidies required to run the service, this increase in ridership will not affect traffic over the Malahat Highway, which is the focus of this study.
1.3 Structure of Report
1.3.1 This report is organized into six sections. The travel survey data is presented in the second section and the third section treats development of the travel demand model. The fourth section of the report describes the bus and commuter rail service options for the CVRD. Ridership forecasts for future and current years are detailed in the fifth section. The summary and conclusions are presented in the sixth and final section of the report.

Doc No Rev: Date: November 2006
3 Report_CTLBET_Final2.doc
Figure 1.1 – Study Area Map
Doc No Rev: Date: November 2006
4 Report_CTLBET_Final2.doc
2 Traffic and Travel Survey Data
2.1 Introduction
2.1.1 This section provides a summary of existing travel information for the Malahat corridor (e.g., traffic counts, census place of work place of residence, Jack Bell Vanpool data) and an overview of the 2006 counts and surveys undertaken for this study.
2.2 Existing Traffic Count Data
2.2.1 Traffic count data available from the Ministry of Transportation’s permanent and short count stations located along the Highway 1 corridor is summarized below.
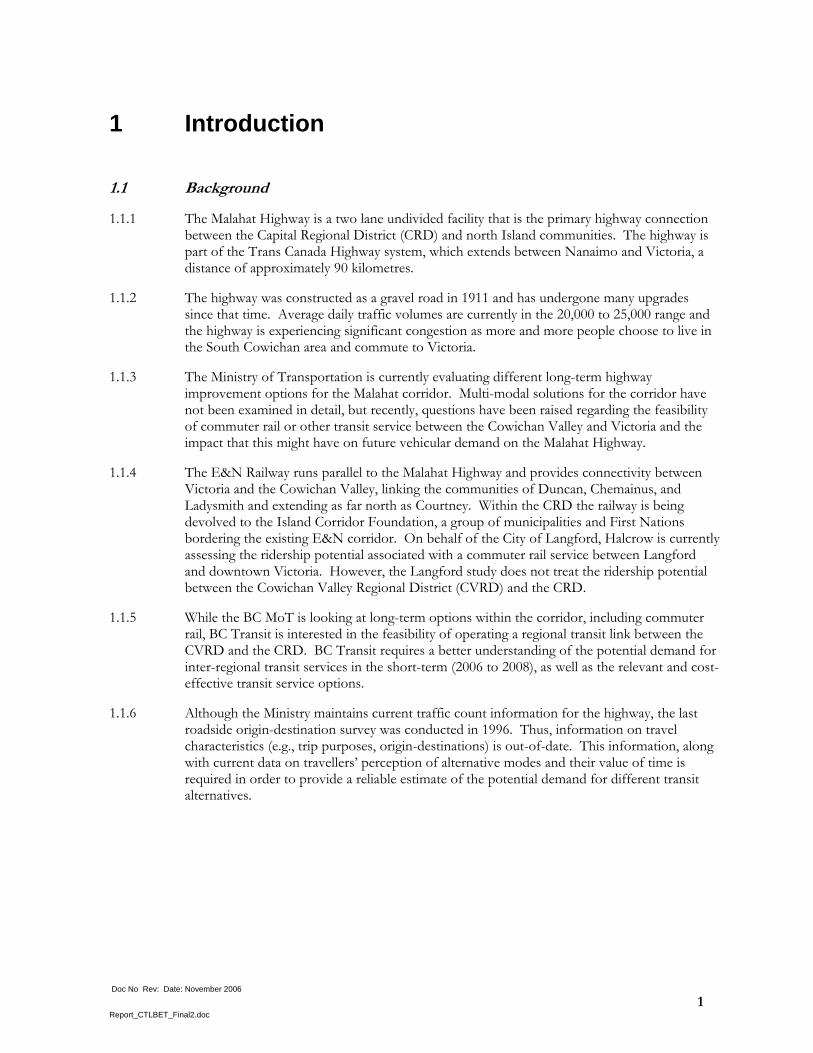
2.2.2 Figure 2.1 provides the historic growth in Annual Average Daily Traffic (AADT) at Shawnigan Lake Road and Goldstream Road on Highway 1. Data is not available for all years, so two stations are shown to confirm year to year changes. Note that in 1995, daily traffic levels peaked at both locations. Between 1994 and 2000, the annual compound traffic growth rates were 5.9 percent at Shawnigan and 5.2 percent at Goldstream. Data is not available for the Goldstream location beyond 2001. However, for the Shawnigan location, traffic volumes seem to have more or less stabilized since 2000. This slowing in highway traffic growth appears to be related to capacity constraints during the peak travel periods. At approximately 22,000 vehicles per day, the highway is currently operating at or near its capacity.
Figure 2.1 - Historic Traffic Growth on the Malahat Hwy (AADT)
0
5000
10000
15000
20000
25000
AA
DT
1994 1995 1996 1997 1998 1999 2000 2001 2002 2003 2005
Year
Historic AADT on Highway 1
South of S. Shawnigan Lake Road
South of Goldstream Ave
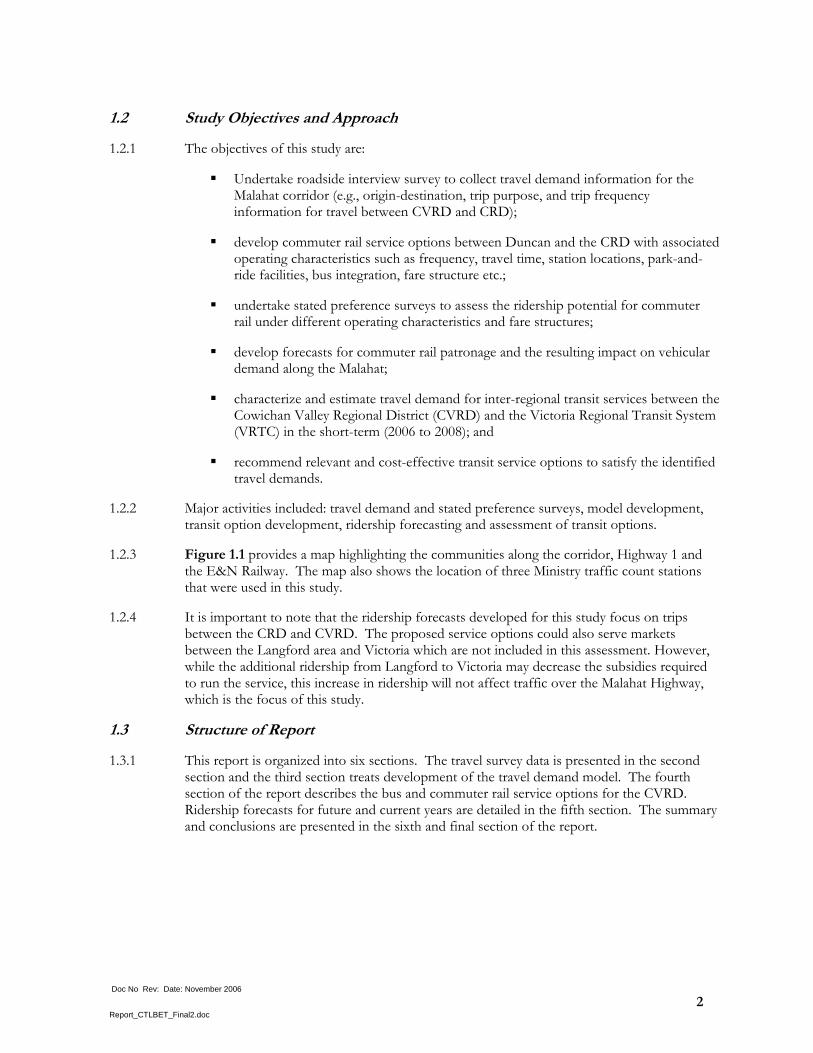
2.2.3 While there is no Highway 1 monthly count data available near the study area, two locations to the north and south of the study area, respectively, have monthly count data available for 2005. The northern count station is located near the Hidden Hills Road exit, which is at the south end of the City of Nanaimo. The southern count station is located on Highway 1, to the north of Six Mile Road. These locations provide an indication of the monthly traffic profile on Highway 1 for the southern section on Vancouver Island as shown in Figure 2.2.
Doc No Rev: Date: November 2006
5 Report_CTLBET_Final2.doc
Traffic volumes are highest during the summer months (approximately 10-15 percent higher than the AADT), with more pronounced peaks in the north reflecting a higher proportion of tourist traffic. Traffic volumes during the fall months of September and October appear to be closest to the AADT volumes.
Figure 2.2 - Monthly Traffic Volumes on Highway 1
Monthly Traffic Volumes
0.60
0.70
0.80
0.90
1.00
1.10
1.20
Janu
ary
Februa
ryMarc
hApri
lMay
June Ju
ly
Augus
t
Septem
ber
Octobe
r
Novem
ber
Decem
ber
MA
DT
/ AA
DT
Hw y 1 South of HiddenHills Rd Exit
Hw y 1 @ Goldstream
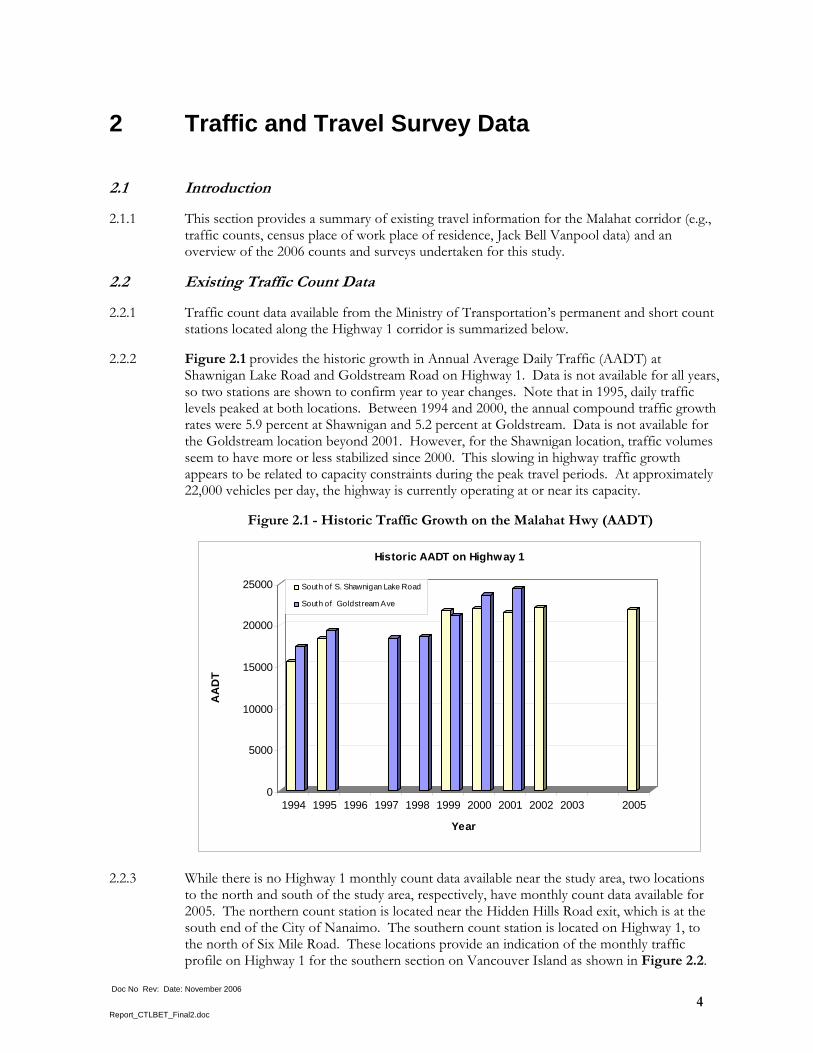
2.2.4 Figures 2.3 to 2.5 show the 2005 average hourly traffic profiles at the Shawnigan Lake Road count station. This location exhibits a typical commuting profile between the CVRD and the CRD, with the southbound peak period falling between 7:00am and 9:00am and the northbound peak period between 3:00pm and 6:00pm.
Figure 2.3 – 2005 Total Hourly Volumes (Both Directions)
Malahat Hwy, South of Shawnigan Lake Road, Total Road Volumes
0
500
1000
1500
2000
2500
12:0
0 AM
2:00
AM
4:00
AM
6:00
AM
8:00
AM
10:0
0 AM
12:0
0 PM
2:00
PM
4:00
PM
6:00
PM
8:00
PM
10:0
0 PM
12:0
0 AM
Hou
rly V
olum
e
Mar-05
Aug-05

Doc No Rev: Date: November 2006
6 Report_CTLBET_Final2.doc
Figure 2.4 – 2005 Northbound Hourly Volumes
Malahat Hwy, South of Shawnigan Lake Road, Northbound Volumes
0
200
400
600
800
1000
1200
1400
12:0
0 AM
2:00
AM
4:00
AM
6:00
AM
8:00
AM
10:0
0 AM
12:0
0 PM
2:00
PM
4:00
PM
6:00
PM
8:00
PM
10:0
0 PM
12:0
0 AM
Hou
rly V
olum
eMar-05
Aug-05
Figure 2.5 – 2005 Southbound Hourly Volumes
Malahat Hwy, South of Shawnigan Lake Road, Southbound Volumes
0
200
400
600
800
1000
1200
1400
12:0
0 AM
2:00
AM
4:00
AM
6:00
AM
8:00
AM
10:0
0 AM
12:0
0 PM
2:00
PM
4:00
PM
6:00
PM
8:00
PM
10:0
0 PM
12:0
0 AM
Hou
rly V
olum
e
Mar-05
Aug-05
Doc No Rev: Date: November 2006
7 Report_CTLBET_Final2.doc
2.3 2006 Roadside Survey
Description of Roadside Surveys
2.3.1 A roadside classification count and origin-destination (OD) survey was conducted for four days between 7:00am and 7:00pm from July 31st to August 3rd, 2006. The survey site was located just north of Finlayson Arm Road where the northbound passing lane begins. The survey crew utilized the northbound right lane and shoulder area for surveying purposes, leaving the centre lane open in order to minimize traffic disruptions.
2.3.2 Classification counts were conducted in both directions, while the OD survey focused on northbound traffic (excluding trucks and buses). The purpose of the OD survey was to provide insight into the origins, destinations, and permanent residences of Malahat highway users, as well as the purpose of their trips. A total of 1,320 randomly selected vehicles and drivers completed the roadside origin-destination (OD) survey. A sub-sample of these respondents were asked to take part in a follow-up stated preference survey (SP), with selection for the SP survey based on permanent residence location and frequency of Malahat use. Further information on the SP survey is found in Section 2.4. Appendix A contains a copy of the roadside OD survey questionnaire.
Summary of Classification Survey Results
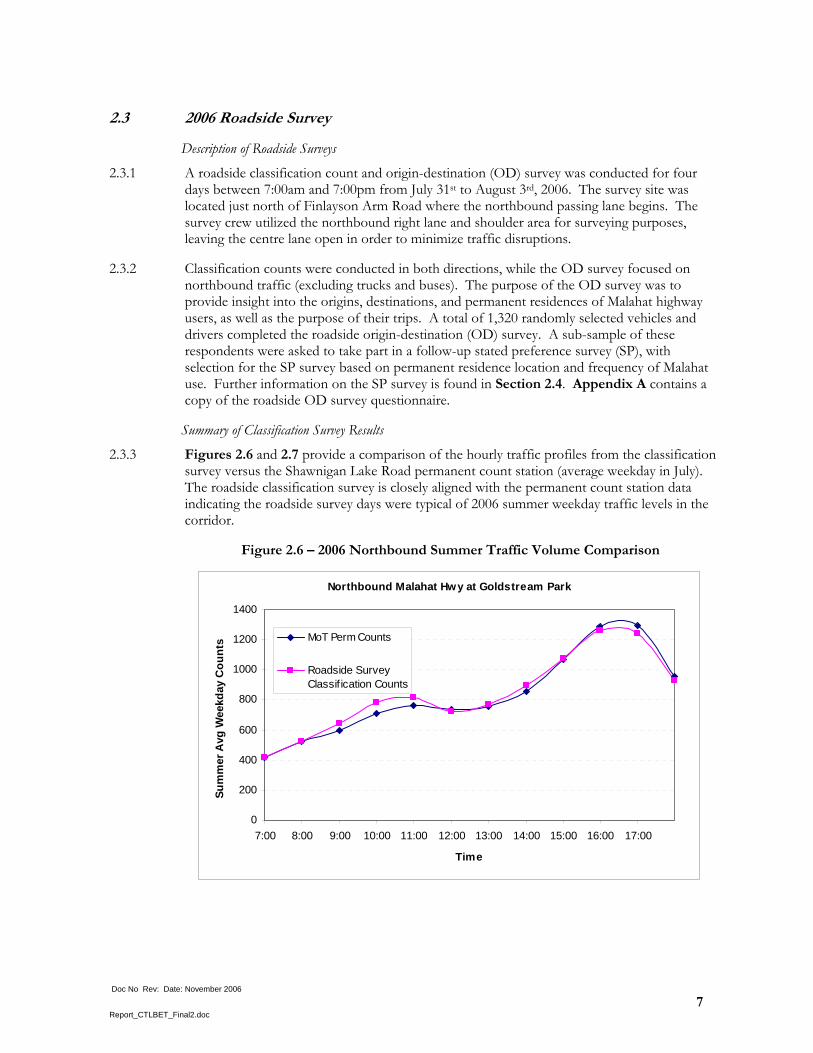
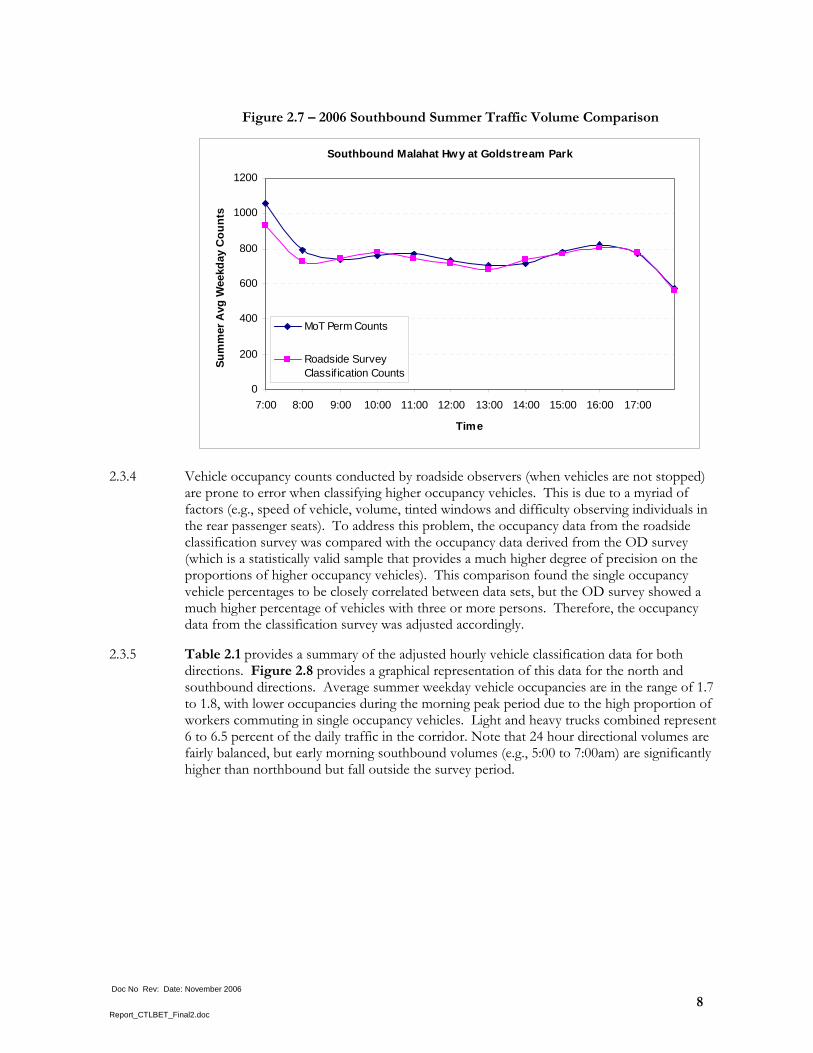
2.3.3 Figures 2.6 and 2.7 provide a comparison of the hourly traffic profiles from the classification survey versus the Shawnigan Lake Road permanent count station (average weekday in July). The roadside classification survey is closely aligned with the permanent count station data indicating the roadside survey days were typical of 2006 summer weekday traffic levels in the corridor.
Figure 2.6 – 2006 Northbound Summer Traffic Volume Comparison
Northbound Malahat Hwy at Goldstream Park
0
200
400
600
800
1000
1200
1400
7:00 8:00 9:00 10:00 11:00 12:00 13:00 14:00 15:00 16:00 17:00
Time
Sum
mer
Avg
Wee
kday
Cou
nts MoT Perm Counts
Roadside SurveyClassif ication Counts
Doc No Rev: Date: November 2006
8 Report_CTLBET_Final2.doc
Figure 2.7 – 2006 Southbound Summer Traffic Volume Comparison
Southbound Malahat Hwy at Goldstream Park
0
200
400
600
800
1000
1200
7:00 8:00 9:00 10:00 11:00 12:00 13:00 14:00 15:00 16:00 17:00
Time
Sum
mer
Avg
Wee
kday
Cou
nts
MoT Perm Counts
Roadside SurveyClassif ication Counts
2.3.4 Vehicle occupancy counts conducted by roadside observers (when vehicles are not stopped) are prone to error when classifying higher occupancy vehicles. This is due to a myriad of factors (e.g., speed of vehicle, volume, tinted windows and difficulty observing individuals in the rear passenger seats). To address this problem, the occupancy data from the roadside classification survey was compared with the occupancy data derived from the OD survey (which is a statistically valid sample that provides a much higher degree of precision on the proportions of higher occupancy vehicles). This comparison found the single occupancy vehicle percentages to be closely correlated between data sets, but the OD survey showed a much higher percentage of vehicles with three or more persons. Therefore, the occupancy data from the classification survey was adjusted accordingly.
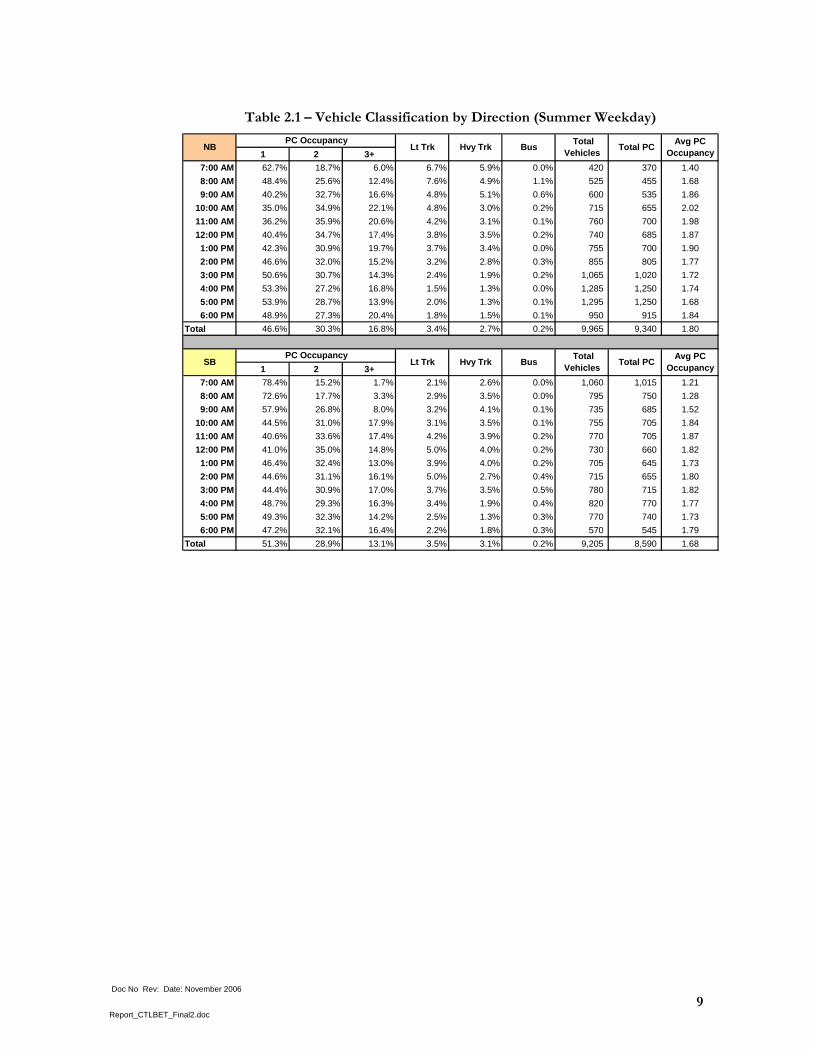
2.3.5 Table 2.1 provides a summary of the adjusted hourly vehicle classification data for both directions. Figure 2.8 provides a graphical representation of this data for the north and southbound directions. Average summer weekday vehicle occupancies are in the range of 1.7 to 1.8, with lower occupancies during the morning peak period due to the high proportion of workers commuting in single occupancy vehicles. Light and heavy trucks combined represent 6 to 6.5 percent of the daily traffic in the corridor. Note that 24 hour directional volumes are fairly balanced, but early morning southbound volumes (e.g., 5:00 to 7:00am) are significantly higher than northbound but fall outside the survey period.
Doc No Rev: Date: November 2006
9 Report_CTLBET_Final2.doc
Table 2.1 – Vehicle Classification by Direction (Summer Weekday)
1 2 3+7:00 AM 62.7% 18.7% 6.0% 6.7% 5.9% 0.0% 420 370 1.408:00 AM 48.4% 25.6% 12.4% 7.6% 4.9% 1.1% 525 455 1.689:00 AM 40.2% 32.7% 16.6% 4.8% 5.1% 0.6% 600 535 1.86
10:00 AM 35.0% 34.9% 22.1% 4.8% 3.0% 0.2% 715 655 2.0211:00 AM 36.2% 35.9% 20.6% 4.2% 3.1% 0.1% 760 700 1.9812:00 PM 40.4% 34.7% 17.4% 3.8% 3.5% 0.2% 740 685 1.871:00 PM 42.3% 30.9% 19.7% 3.7% 3.4% 0.0% 755 700 1.902:00 PM 46.6% 32.0% 15.2% 3.2% 2.8% 0.3% 855 805 1.773:00 PM 50.6% 30.7% 14.3% 2.4% 1.9% 0.2% 1,065 1,020 1.724:00 PM 53.3% 27.2% 16.8% 1.5% 1.3% 0.0% 1,285 1,250 1.745:00 PM 53.9% 28.7% 13.9% 2.0% 1.3% 0.1% 1,295 1,250 1.686:00 PM 48.9% 27.3% 20.4% 1.8% 1.5% 0.1% 950 915 1.84
Total 46.6% 30.3% 16.8% 3.4% 2.7% 0.2% 9,965 9,340 1.80
1 2 3+7:00 AM 78.4% 15.2% 1.7% 2.1% 2.6% 0.0% 1,060 1,015 1.218:00 AM 72.6% 17.7% 3.3% 2.9% 3.5% 0.0% 795 750 1.289:00 AM 57.9% 26.8% 8.0% 3.2% 4.1% 0.1% 735 685 1.52
10:00 AM 44.5% 31.0% 17.9% 3.1% 3.5% 0.1% 755 705 1.8411:00 AM 40.6% 33.6% 17.4% 4.2% 3.9% 0.2% 770 705 1.8712:00 PM 41.0% 35.0% 14.8% 5.0% 4.0% 0.2% 730 660 1.821:00 PM 46.4% 32.4% 13.0% 3.9% 4.0% 0.2% 705 645 1.732:00 PM 44.6% 31.1% 16.1% 5.0% 2.7% 0.4% 715 655 1.803:00 PM 44.4% 30.9% 17.0% 3.7% 3.5% 0.5% 780 715 1.824:00 PM 48.7% 29.3% 16.3% 3.4% 1.9% 0.4% 820 770 1.775:00 PM 49.3% 32.3% 14.2% 2.5% 1.3% 0.3% 770 740 1.736:00 PM 47.2% 32.1% 16.4% 2.2% 1.8% 0.3% 570 545 1.79
Total 51.3% 28.9% 13.1% 3.5% 3.1% 0.2% 9,205 8,590 1.68
Total PC PC Occupancy
SB Lt Trk
NB Lt Trk Hvy Trk BusPC Occupancy Avg PC
Occupancy Total
Vehicles Total PC
Avg PC OccupancyHvy Trk Total
Vehicles Bus

Doc No Rev: Date: November 2006
10 Report_CTLBET_Final2.doc
Figure 2.8 – Directional Vehicle Classification Summary
Northbound Vehicle Classification
0%
20%
40%
60%
80%
100%
7:00AM
8:00AM
9:00AM
10:00AM
11:00AM
12:00PM
1:00PM
2:00PM
3:00PM
4:00PM
5:00PM
6:00PM
1 2 3+ Lt Trk Hvy Trk Bus
Southbound Vehicle Classification
0%
20%
40%
60%
80%
100%
7:00AM
8:00AM
9:00AM
10:00AM
11:00AM
12:00PM
1:00PM
2:00PM
3:00PM
4:00PM
5:00PM
6:00PM
1 2 3+ Lt Trk Hvy Trk Bus
Summary of OD Survey Results
2.3.6 Information from the roadside OD survey was analysed to determine trip purpose, and to develop origin-destination matrices to be used for model development and forecasting purposes. At this stage, the survey results were expanded to hourly flows and then converted from summer average weekday conditions to average fall weekday traffic conditions. This process is described in further detail in Section 3.
2.3.7 The following tables provide a brief summary of the OD survey information for the summer period. The trip purpose information is shown for both the summer weekday and the
Doc No Rev: Date: November 2006
11 Report_CTLBET_Final2.doc
estimated annual average weekday condition (as the summer trip composition is characterized by significantly more tourist or non-resident trips). The remaining information is shown for the actual summer survey period.
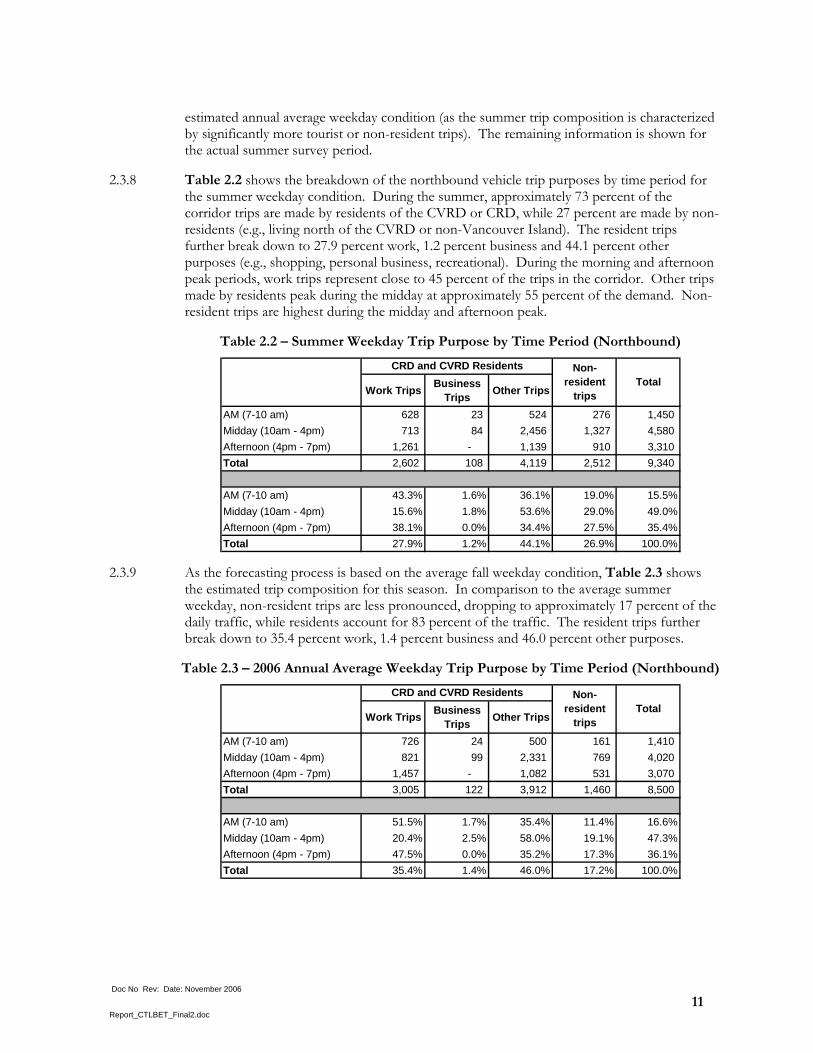
2.3.8 Table 2.2 shows the breakdown of the northbound vehicle trip purposes by time period for the summer weekday condition. During the summer, approximately 73 percent of the corridor trips are made by residents of the CVRD or CRD, while 27 percent are made by non-residents (e.g., living north of the CVRD or non-Vancouver Island). The resident trips further break down to 27.9 percent work, 1.2 percent business and 44.1 percent other purposes (e.g., shopping, personal business, recreational). During the morning and afternoon peak periods, work trips represent close to 45 percent of the trips in the corridor. Other trips made by residents peak during the midday at approximately 55 percent of the demand. Non-resident trips are highest during the midday and afternoon peak.
Table 2.2 – Summer Weekday Trip Purpose by Time Period (Northbound)
Work Trips Business Trips Other Trips
AM (7-10 am) 628 23 524 276 1,450 Midday (10am - 4pm) 713 84 2,456 1,327 4,580 Afternoon (4pm - 7pm) 1,261 - 1,139 910 3,310 Total 2,602 108 4,119 2,512 9,340
AM (7-10 am) 43.3% 1.6% 36.1% 19.0% 15.5%Midday (10am - 4pm) 15.6% 1.8% 53.6% 29.0% 49.0%Afternoon (4pm - 7pm) 38.1% 0.0% 34.4% 27.5% 35.4%Total 27.9% 1.2% 44.1% 26.9% 100.0%
CRD and CVRD Residents Non-resident
tripsTotal
2.3.9 As the forecasting process is based on the average fall weekday condition, Table 2.3 shows the estimated trip composition for this season. In comparison to the average summer weekday, non-resident trips are less pronounced, dropping to approximately 17 percent of the daily traffic, while residents account for 83 percent of the traffic. The resident trips further break down to 35.4 percent work, 1.4 percent business and 46.0 percent other purposes.
Table 2.3 – 2006 Annual Average Weekday Trip Purpose by Time Period (Northbound)
Work Trips Business Trips Other Trips
AM (7-10 am) 726 24 500 161 1,410 Midday (10am - 4pm) 821 99 2,331 769 4,020 Afternoon (4pm - 7pm) 1,457 - 1,082 531 3,070 Total 3,005 122 3,912 1,460 8,500
AM (7-10 am) 51.5% 1.7% 35.4% 11.4% 16.6%Midday (10am - 4pm) 20.4% 2.5% 58.0% 19.1% 47.3%Afternoon (4pm - 7pm) 47.5% 0.0% 35.2% 17.3% 36.1%Total 35.4% 1.4% 46.0% 17.2% 100.0%
CRD and CVRD Residents Non-resident
tripsTotal
Doc No Rev: Date: November 2006
12 Report_CTLBET_Final2.doc
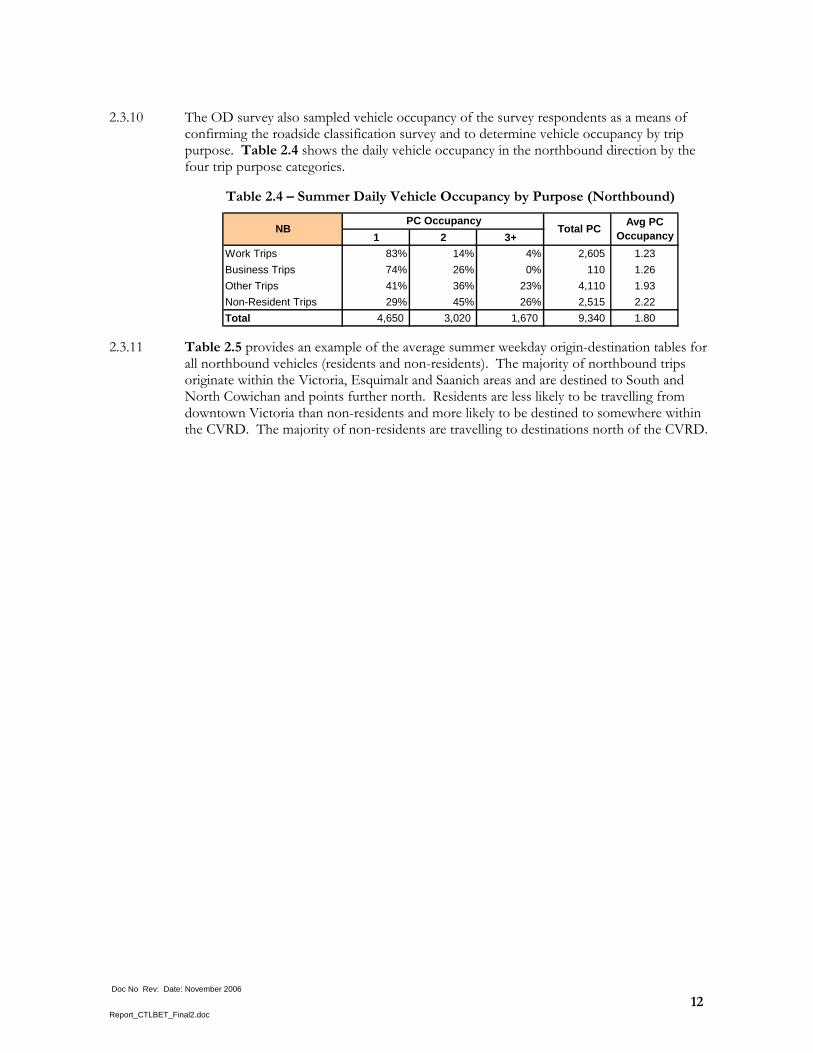
2.3.10 The OD survey also sampled vehicle occupancy of the survey respondents as a means of confirming the roadside classification survey and to determine vehicle occupancy by trip purpose. Table 2.4 shows the daily vehicle occupancy in the northbound direction by the four trip purpose categories.
Table 2.4 – Summer Daily Vehicle Occupancy by Purpose (Northbound)
1 2 3+Work Trips 83% 14% 4% 2,605 1.23Business Trips 74% 26% 0% 110 1.26Other Trips 41% 36% 23% 4,110 1.93Non-Resident Trips 29% 45% 26% 2,515 2.22Total 4,650 3,020 1,670 9,340 1.80
NBPC Occupancy
Total PC Avg PC Occupancy
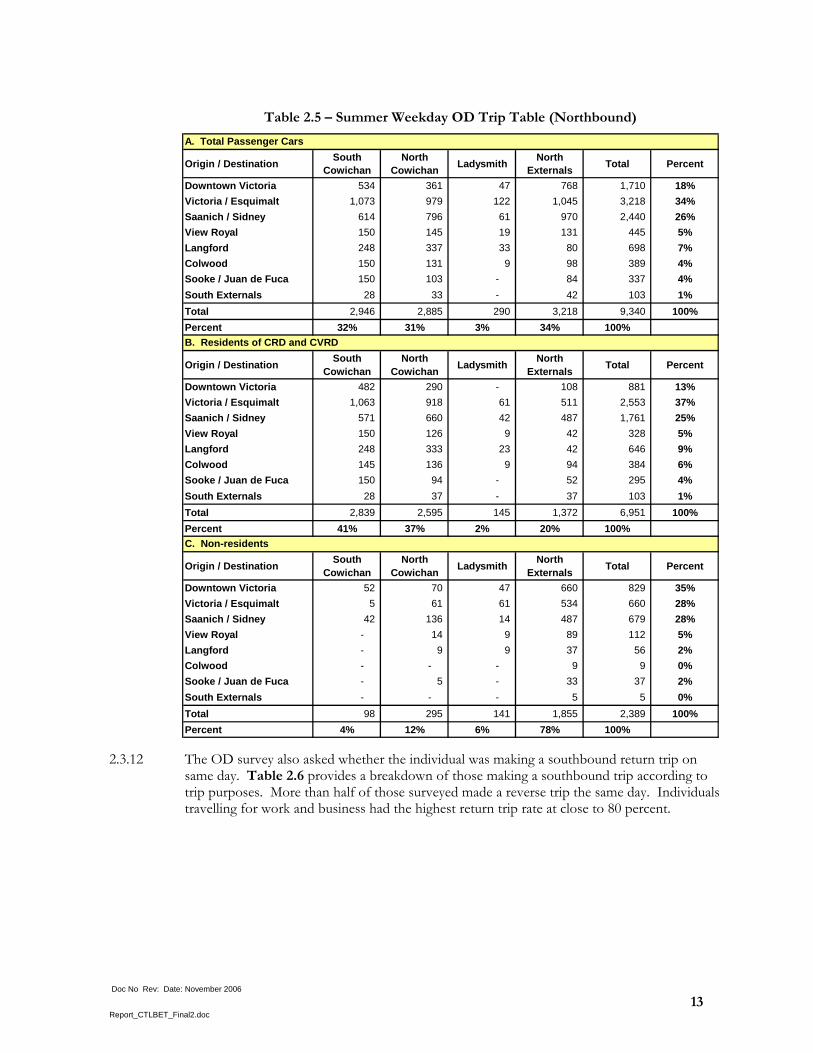
2.3.11 Table 2.5 provides an example of the average summer weekday origin-destination tables for all northbound vehicles (residents and non-residents). The majority of northbound trips originate within the Victoria, Esquimalt and Saanich areas and are destined to South and North Cowichan and points further north. Residents are less likely to be travelling from downtown Victoria than non-residents and more likely to be destined to somewhere within the CVRD. The majority of non-residents are travelling to destinations north of the CVRD.
Doc No Rev: Date: November 2006
13 Report_CTLBET_Final2.doc
Table 2.5 – Summer Weekday OD Trip Table (Northbound)
Origin / Destination South Cowichan
North Cowichan Ladysmith North
Externals Total Percent
Downtown Victoria 534 361 47 768 1,710 18%Victoria / Esquimalt 1,073 979 122 1,045 3,218 34%Saanich / Sidney 614 796 61 970 2,440 26%View Royal 150 145 19 131 445 5%Langford 248 337 33 80 698 7%Colwood 150 131 9 98 389 4%Sooke / Juan de Fuca 150 103 - 84 337 4%South Externals 28 33 - 42 103 1%Total 2,946 2,885 290 3,218 9,340 100%Percent 32% 31% 3% 34% 100%
Origin / Destination South Cowichan
North Cowichan Ladysmith North
Externals Total Percent
Downtown Victoria 482 290 - 108 881 13%Victoria / Esquimalt 1,063 918 61 511 2,553 37%Saanich / Sidney 571 660 42 487 1,761 25%View Royal 150 126 9 42 328 5%Langford 248 333 23 42 646 9%Colwood 145 136 9 94 384 6%Sooke / Juan de Fuca 150 94 - 52 295 4%South Externals 28 37 - 37 103 1%Total 2,839 2,595 145 1,372 6,951 100%Percent 41% 37% 2% 20% 100%
Origin / Destination South Cowichan
North Cowichan Ladysmith North
Externals Total Percent
Downtown Victoria 52 70 47 660 829 35%Victoria / Esquimalt 5 61 61 534 660 28%Saanich / Sidney 42 136 14 487 679 28%View Royal - 14 9 89 112 5%Langford - 9 9 37 56 2%Colwood - - - 9 9 0%Sooke / Juan de Fuca - 5 - 33 37 2%South Externals - - - 5 5 0%Total 98 295 141 1,855 2,389 100%Percent 4% 12% 6% 78% 100%
A. Total Passenger Cars
B. Residents of CRD and CVRD
C. Non-residents
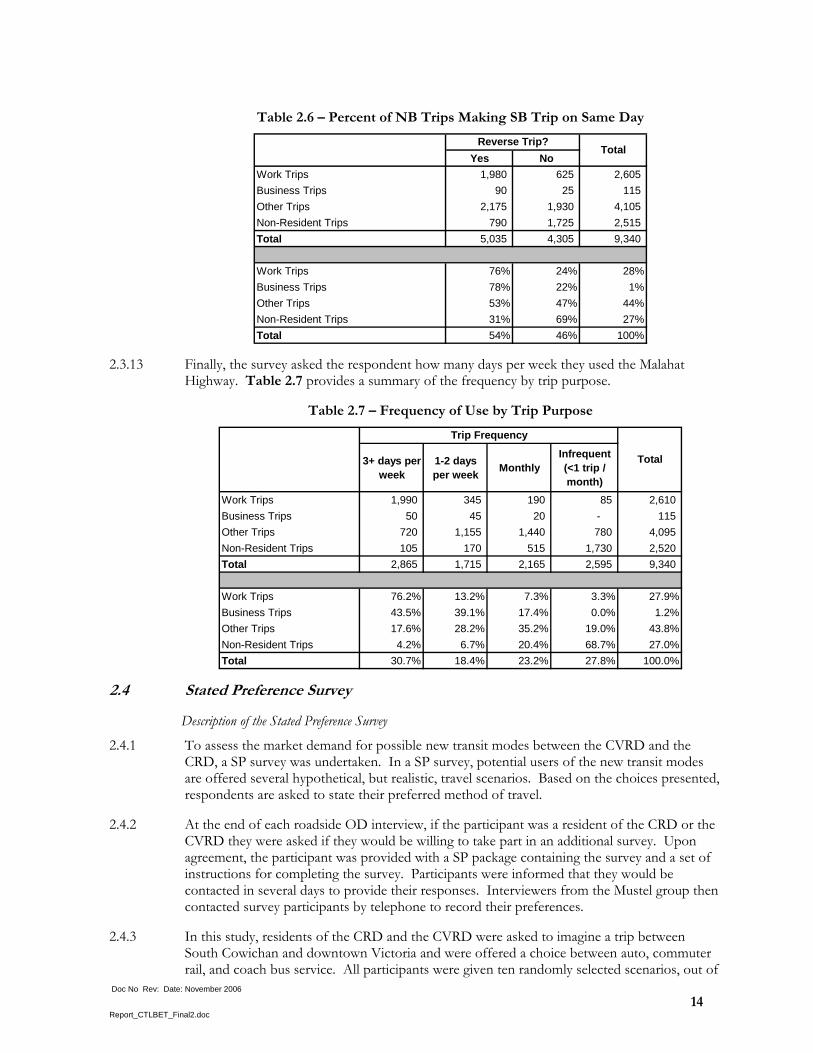
2.3.12 The OD survey also asked whether the individual was making a southbound return trip on same day. Table 2.6 provides a breakdown of those making a southbound trip according to trip purposes. More than half of those surveyed made a reverse trip the same day. Individuals travelling for work and business had the highest return trip rate at close to 80 percent.
Doc No Rev: Date: November 2006
14 Report_CTLBET_Final2.doc
Table 2.6 – Percent of NB Trips Making SB Trip on Same Day
Yes NoWork Trips 1,980 625 2,605 Business Trips 90 25 115 Other Trips 2,175 1,930 4,105 Non-Resident Trips 790 1,725 2,515 Total 5,035 4,305 9,340
Work Trips 76% 24% 28%Business Trips 78% 22% 1%Other Trips 53% 47% 44%Non-Resident Trips 31% 69% 27%Total 54% 46% 100%
Reverse Trip?Total
2.3.13 Finally, the survey asked the respondent how many days per week they used the Malahat Highway. Table 2.7 provides a summary of the frequency by trip purpose.
Table 2.7 – Frequency of Use by Trip Purpose
3+ days per week
1-2 days per week Monthly
Infrequent (<1 trip / month)
Work Trips 1,990 345 190 85 2,610 Business Trips 50 45 20 - 115 Other Trips 720 1,155 1,440 780 4,095 Non-Resident Trips 105 170 515 1,730 2,520 Total 2,865 1,715 2,165 2,595 9,340
Work Trips 76.2% 13.2% 7.3% 3.3% 27.9%Business Trips 43.5% 39.1% 17.4% 0.0% 1.2%Other Trips 17.6% 28.2% 35.2% 19.0% 43.8%Non-Resident Trips 4.2% 6.7% 20.4% 68.7% 27.0%Total 30.7% 18.4% 23.2% 27.8% 100.0%
Trip Frequency
Total
2.4 Stated Preference Survey
Description of the Stated Preference Survey
2.4.1 To assess the market demand for possible new transit modes between the CVRD and the CRD, a SP survey was undertaken. In a SP survey, potential users of the new transit modes are offered several hypothetical, but realistic, travel scenarios. Based on the choices presented, respondents are asked to state their preferred method of travel.
2.4.2 At the end of each roadside OD interview, if the participant was a resident of the CRD or the CVRD they were asked if they would be willing to take part in an additional survey. Upon agreement, the participant was provided with a SP package containing the survey and a set of instructions for completing the survey. Participants were informed that they would be contacted in several days to provide their responses. Interviewers from the Mustel group then contacted survey participants by telephone to record their preferences.
2.4.3 In this study, residents of the CRD and the CVRD were asked to imagine a trip between South Cowichan and downtown Victoria and were offered a choice between auto, commuter rail, and coach bus service. All participants were given ten randomly selected scenarios, out of

Doc No Rev: Date: November 2006
15 Report_CTLBET_Final2.doc
a total of 16 scenarios, and were asked to rank their first and second mode choices for travel based on the variables presented. Each scenario contained a range of variables such as travel time, transit fare, driving and parking costs, station and bus access time, and transit headway. Each survey contained only 10 scenarios in order to reduce the risk of “respondent fatigue.” A sample SP survey is provided in Appendix B.
2.4.4 Careful consideration was given to the values of each variable within the 16 scenarios, particularly for the auto option, as it is understood that mode biases with respect to auto are generally high. Existing auto users typically do not find other modes of transportation attractive unless they are very competitive in terms of time and cost. Therefore, it is important to provide a range of scenarios that will “force” the existing auto-user to consider the alternate mode. In this survey, auto costs (gas, parking, maintenance) were set for all scenarios at $12 for a one-way trip. Commuter rail fares ranged from $4 to $11 and coach bus fares from $3 to $6 for a one-way trip. Travel time is also an important consideration; auto travel time was set at 45 minutes while bus and rail times varied from 30 minutes to 60 minutes.
2.4.5 Table 2.8 shows the number of completed SP surveys. Approximately 40 percent of the surveys that were handed out were completed. A total of 220 surveys were completed, giving 2,200 possible observations (as each participant responded to ten scenarios).
Table 2.8 – Completed SP Surveys by Market Segment
Commuters Non-Commuters Total
CVRD Residents 101 47 148CRD Residents 22 50 72Total 123 97 220
2.4.6 The primary output of a SP survey is a series of mathematical (logit) models upon which the diversion of auto demand to rail or bus alternatives can be estimated. A detailed discussion of these models is presented in Section 3.6.
2.5 2001 Place of Work / Place of Residence Data
2.5.1 The 2001 Census Place of Work data provides a secondary source of information that can be used to confirm the OD survey results and to identify recent trends. Analysis of the 2001 data suggests that most potential commuters live south of Duncan and are going to Victoria. These data also show that whereas downtown Victoria accounts for less than 25 percent of CRD work trip destinations, half of all transit work travel destinations are to locations in downtown Victoria. As is the case in other Canadian cities, the downtown area attracts the large majority of transit use by so-called “choice” commuters, those who have a car available for their trips. Most, if not all, Cowichan valley commuters have a car available, given the auto-oriented character of their communities.
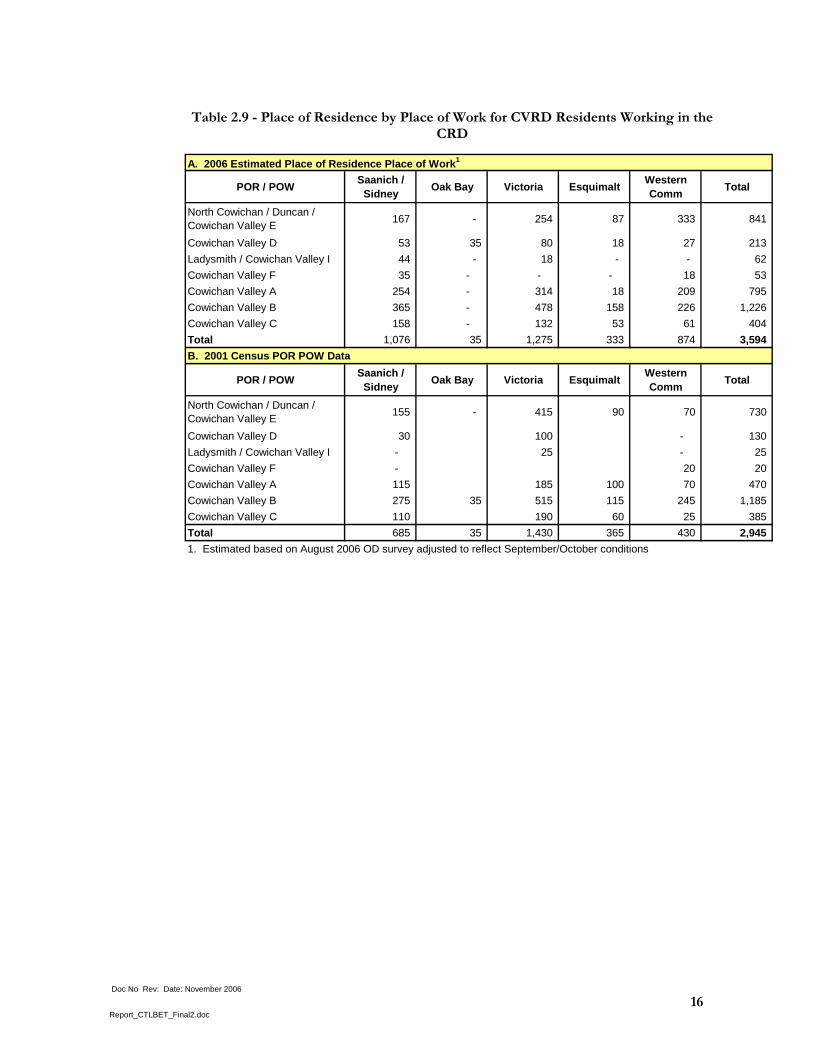
2.5.2 While the 2001 Census data provide an excellent context for assessing the potential role of transit in serving commuter travel from the Cowichan Valley to the CRD, this information is not current. The 2006 OD survey data is used to estimate the current place of residence and place of work for CVRD residents. Table 2.9 provides a comparison of the 2006 OD patterns for home to work travel against the 2001 Census Place of Residence by Place of Work Data.
Doc No Rev: Date: November 2006
16 Report_CTLBET_Final2.doc
Table 2.9 - Place of Residence by Place of Work for CVRD Residents Working in the CRD
A. 2006 Estimated Place of Residence Place of Work1
POR / POW Saanich / Sidney Oak Bay Victoria Esquimalt Western
Comm Total
North Cowichan / Duncan / Cowichan Valley E 167 - 254 87 333 841
Cowichan Valley D 53 35 80 18 27 213 Ladysmith / Cowichan Valley I 44 - 18 - - 62 Cowichan Valley F 35 - - - 18 53 Cowichan Valley A 254 - 314 18 209 795 Cowichan Valley B 365 - 478 158 226 1,226 Cowichan Valley C 158 - 132 53 61 404 Total 1,076 35 1,275 333 874 3,594 B. 2001 Census POR POW Data
POR / POW Saanich / Sidney Oak Bay Victoria Esquimalt Western
Comm Total
North Cowichan / Duncan / Cowichan Valley E 155 - 415 90 70 730
Cowichan Valley D 30 100 - 130 Ladysmith / Cowichan Valley I - 25 - 25 Cowichan Valley F - 20 20 Cowichan Valley A 115 185 100 70 470 Cowichan Valley B 275 35 515 115 245 1,185 Cowichan Valley C 110 190 60 25 385 Total 685 35 1,430 365 430 2,945 1. Estimated based on August 2006 OD survey adjusted to reflect September/October conditions
Doc No Rev: Date: November 2006
17 Report_CTLBET_Final2.doc
2.5.3 Based on the 2006 survey, approximately 3,600 CVRD residents work in the CRD, with approximately 1,300 in Victoria. The 3,600 total compares to the approximately 3,000 workers estimated from the 2001 Census and 1,400 in Victoria.
Changing Live-Work Relationships
2.5.4 The comparison of this data suggests that fewer Cowichan Valley commuters are working in Victoria (including the downtown) in 2006 than was the case in 2001, while more are working in Saanich/Sydney and the Western Communities of the CRD. This shift is consistent with the documented suburbanization of people and jobs within the CRD between 1996 and 20011 marked by increased suburb-to-suburb commuting and less suburb-to-downtown commuting.
2.5.5 The changes in the Victoria/downtown area as a destination are important in assessing both commuter rail and bus potential. These changes suggest that transit ridership potential has probably declined over the last five years to the extent that fewer work trips are destined to the transit-oriented downtown and more are destined for dispersed suburban workplaces. Furthermore, these trends suggest that unless there is significant growth in jobs in downtown Victoria, the transit market will tend to get smaller over time.
2.5.6 The experience in cities with commuter rail services to their downtowns suggests that such services tend to increase long distance commuting and make more distant suburban communities more desirable places to live for downtown workers.
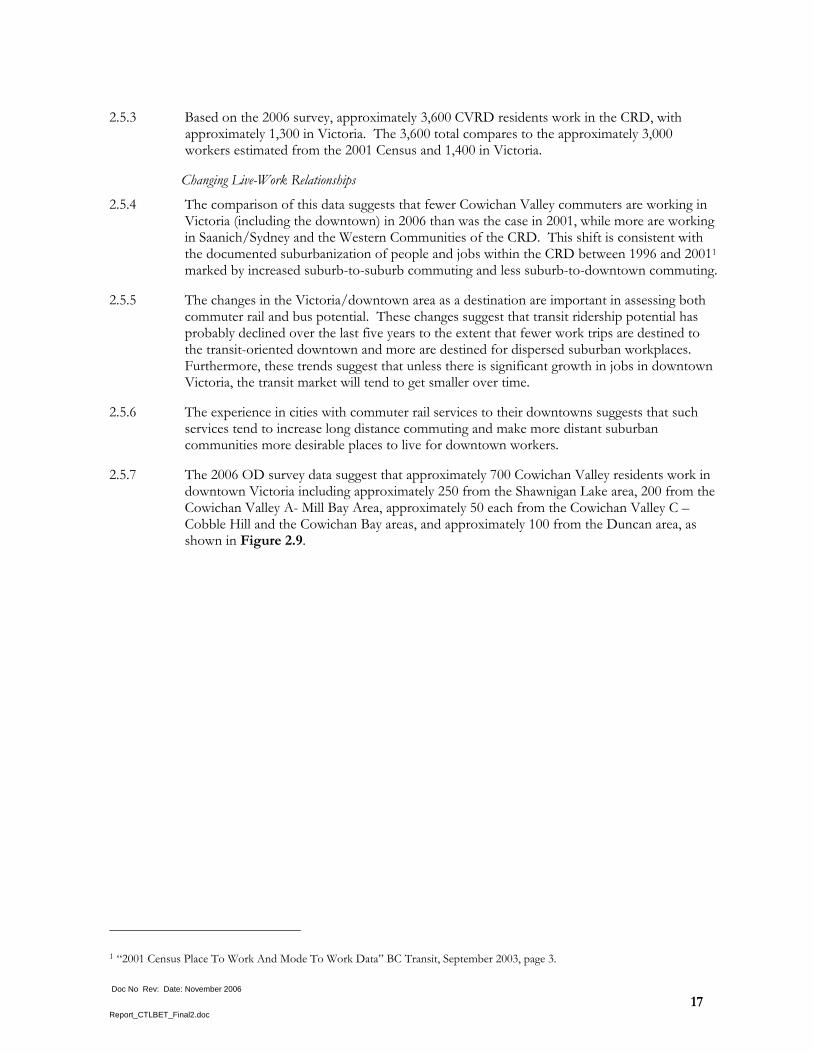
2.5.7 The 2006 OD survey data suggest that approximately 700 Cowichan Valley residents work in downtown Victoria including approximately 250 from the Shawnigan Lake area, 200 from the Cowichan Valley A- Mill Bay Area, approximately 50 each from the Cowichan Valley C – Cobble Hill and the Cowichan Bay areas, and approximately 100 from the Duncan area, as shown in Figure 2.9.
1 “2001 Census Place To Work And Mode To Work Data” BC Transit, September 2003, page 3.
Doc No Rev: Date: November 2006
18 Report_CTLBET_Final2.doc
Figure 2.9 – CVRD Residents working in Downtown Victoria
2.5.8 The 700 downtown commuters are the primary sub-market that could be expected to use public transit services (including van pools, buses or commuter rail) and, therefore, the travel market analysis focused on this primary sub-market. These downtown-destined commuters appear to be concentrated in 5 areas that together account for approximately 90 percent of the total commuters travelling to downtown Victoria: Cowichan Valley E (Duncan Area), Shawnigan Lake and nearby areas, Cowichan Bay, Cobble Hill and area, and Cowichan Valley A South (Bamberton/Malahat and vicinity). These are the communities that would need to be directly served by transit, if this option is to be competitive with the car for commuting.
2.6 Jack Bell Vanpool and Greyhound Travel Data
2.6.1 Vanpools currently provide the only alternative means of transportation for those commuting between the CVRD and the CRD. The Jack Bell Foundation organizes carpooling and vanpooling services by providing vehicles and arranging for ride-sharing groups. Currently, there are approximately 30 vehicles (both vans and cars) in service from the CVRD to the CRD, including 19 vans, indicating approximately 140 riders. Of the 19 vanpools identified

Doc No Rev: Date: November 2006
19 Report_CTLBET_Final2.doc
from the Cowichan Valley area, ten are from Duncan, three from Cobble Hill, two from Cowichan Bay, two from Shawnigan Lake, and one each from Lake Cowichan and Crofton. Table 2.10 shows the residential locations and work destinations of current vanpool users. The large majority of vanpools in operation between the CVRD and the CRD serve South Cowichan Valley residents who work in or near to downtown Victoria. Costs to participate in the vanpool depend on distance travelled, number of riders in the van and fuel costs. A commute from Duncan, the centre of vanpool activity, is approximately 70 km each way (140 km per day) costs approximately $200 per month for each participant, assuming six passengers are sharing the costs of operating an 8 passenger van. This is equivalent to a daily fare of approximately $5.00 each way.
Table 2.10 – Summary of Vanpool Data for South Cowichan Valley
Total From Destination Downtown Victoria UniversityHome Location South Cowichan Victoria (all) Or Douglas St. of Victoria EsquimaltDuncan 10 8 7 1 2Cowichan Bay 2 2 2Cobble Hill 3 3 3Shawnigan Lake 2 2 2Lake Cowichan 1 1 1Crofton 1 1 1total van pools 19 17 16 1 2*Source: Jack Bell Ride-Share Foundation - Island Routes & Cost Breakdown report - August 06
2.6.2 The vanpool data indicates that Duncan accounts for 10 of the 19 vans serving the corridor, with seven of these travelling to downtown Victoria. This implies that more than 40 persons commute regularly between Duncan and downtown Victoria by van while the 2006 roadside survey data suggest that the total commuter market from the Duncan area to downtown Victoria is about 100. The high van pool use reported suggests that the Duncan area may account for a higher proportion of the total transit travel market than is indicated in the 2006 survey (and the 2001 Census). It also points to the strengths of the van pool option for this travel submarket.
2.6.3 Greyhound Bus Lines offer a coach bus service from Victoria to points north on the Island. This service is not intended as a commuter service, but it is currently the only bus service available that connects the CVRD with the CRD. The bus stops in many small communities along Highway 1, with four bus stops between Ladysmith and Duncan, and nine stops between Duncan and downtown Victoria. Bus travel times from Duncan to Victoria range from 50 minutes in the evening to one hour and fifteen minutes during the midday. Southbound buses pass through Duncan six times each day, beginning at 8:45 am and continuing until 10:25 pm. In the northbound direction there are also six buses per day, with buses departing Victoria beginning at 5:30 am and continuing until 7:20 pm. Cost to travel from Victoria to Duncan on the Greyhound bus is $11.40 each way.

Doc No Rev: Date: November 2006
20 Report_CTLBET_Final2.doc
3 Travel Demand Model Development
3.1 Introduction
3.1.1 The objective of this study is to evaluate the ridership potential of a range of commuter rail and bus service options operating in the Malahat corridor. For the purpose of this study a PM peak period model was developed focusing on northbound travel between the CRD and the CVRD. Information from the roadside OD survey was adjusted to reflect annual average weekday conditions in the model (otherwise the model would reflect ridership levels during the summer period). Note that daily two-way estimates of ridership are developed based on information from the roadside OD survey and supporting traffic count data.
3.1.2 The travel demand model is comprised of the following components:
traffic zones and demographics
road and transit network
base year trip tables
travel demand growth models
mode split models
3.1.3 The model has been implemented using a combination of the EMME/2 software platform and spreadsheets. Note that the CRD Regional Travel Model was used to obtain future CRD demographics and current and future year PM peak period travel times. The following sections provide a description of each model component.
3.2 Traffic Zones and Demographics
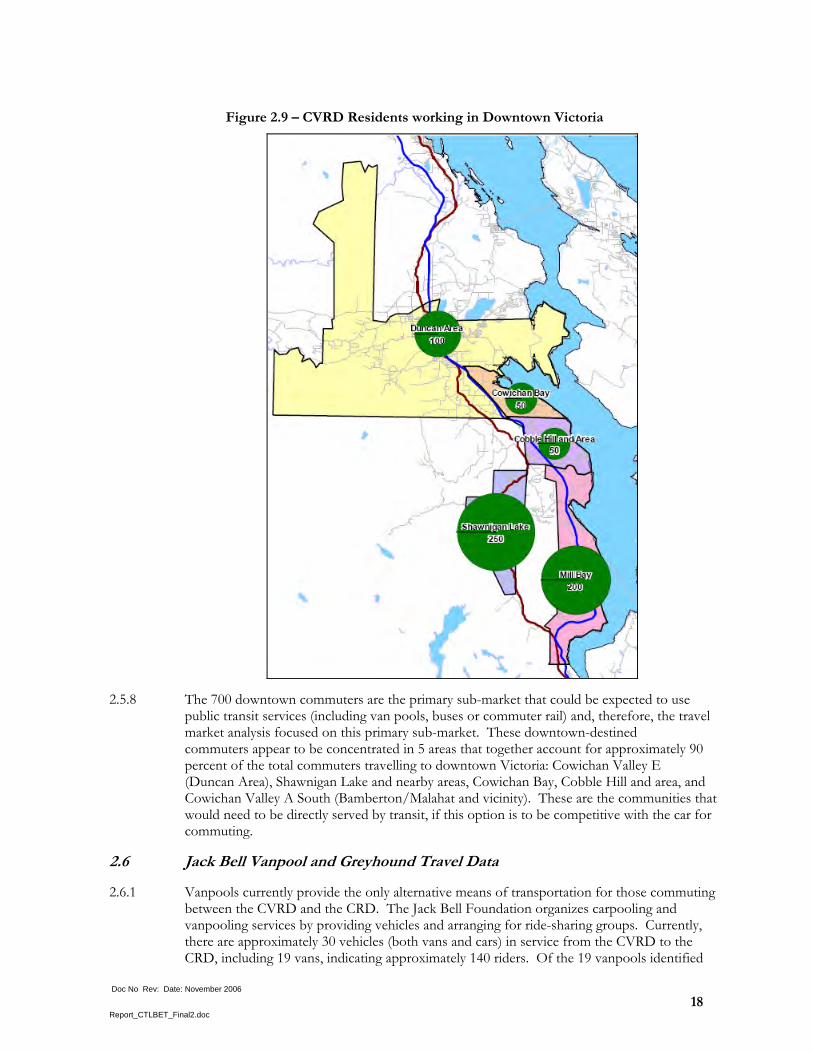
3.2.1 The current CRD Regional Travel Model provides traffic zone and network coverage between Sidney and the Western Communities. For this study, the traffic zone system and network was extended north to Ladysmith. Figure 3.1 shows the traffic zone system developed for the Malahat study area, which divides the area into 25 zones. Within the CVRD, traffic zones were developed based on census subdivision boundaries, and smaller zones surrounding the major municipalities in the region were added. The traffic zone system used for the CRD was based on the Regional Travel Model and features more than 500 zones.
3.2.2 For each CVRD traffic zone, population estimates were developed in five year increments to 2026 by Urban Futures Inc. Based on discussions with regional and municipal planners (as well as on stated Official Community Plan objectives) the magnitude and location of short-term residential development activity within the CVRD was identified and used to allocate future population growth within the region. Forecasts were controlled to BC Stats latest forecast series for Local Health Areas 65, 66 and 67.
3.2.3 Table 3.1 provides a summary of the CVRD total population by sub-area. The current population of this area is approximately 80,000 and is forecast to grow to 100,000 by 2026 (approximately 1.1 percent compound annual growth rate).
Doc No Rev: Date: November 2006
21 Report_CTLBET_Final2.doc
Figure 3.1 – CVRD Traffic Zones
C. V. F
C.V. I West
C.V. B NE
C. V. H
Mill BayMill BayMill BayMill BayMill BayMill BayMill BayMill BayMill Bay
Cobble HillCobble HillCobble HillCobble HillCobble HillCobble HillCobble HillCobble HillCobble Hill
Shawnigan LakeShawnigan LakeShawnigan LakeShawnigan LakeShawnigan LakeShawnigan LakeShawnigan LakeShawnigan LakeShawnigan Lake
MalahatMalahatMalahatMalahatMalahatMalahatMalahatMalahatMalahat
BambertonBambertonBambertonBambertonBambertonBambertonBambertonBambertonBamberton
ChemainusChemainusChemainusChemainusChemainusChemainusChemainusChemainusChemainus
DuncanDuncanDuncanDuncanDuncanDuncanDuncanDuncanDuncan
CroftonCroftonCroftonCroftonCroftonCroftonCroftonCroftonCrofton
LadysmithLadysmithLadysmithLadysmithLadysmithLadysmithLadysmithLadysmithLadysmith
Cowichan BayCowichan BayCowichan BayCowichan BayCowichan BayCowichan BayCowichan BayCowichan BayCowichan Bay
Rur. Shawn. Lk
C.V. A North
C. V. E
C. V. D
C. V. B
C. V. A South
C. V. C
C.V. B East
N. Cow. SW
N. Cow. NWN. Cow. NE
N. Cow. SE
C.V. I East

Doc No Rev: Date: November 2006
22 Report_CTLBET_Final2.doc
Table 3.1 – CVRD Population Estimates
Traffic Zone Abbreviation 2001 2006 2011 2016 2021 2026 CAGR
06-26Chemainus 1,936 2,096 2,277 2,475 2,657 2,826 1.5%Cobble Hill 1,850 1,938 2,074 2,221 2,346 2,455 1.2%Cowichan Bay 2,720 2,918 3,117 3,302 3,480 3,659 1.1%C. V. A North 681 740 791 836 884 935 1.2%C. V. A South 970 1,013 1,075 1,150 1,216 1,309 1.3%C. V. B 448 477 507 534 559 579 1.0%C. V. B East 1,830 1,924 2,054 2,207 2,344 2,450 1.2%C. V. B NE 1,041 1,091 1,164 1,239 1,310 1,378 1.2%C. V. C 2,840 3,091 3,351 3,637 3,931 4,253 1.6%C. V. D 3,646 3,851 4,052 4,276 4,505 4,713 1.0%C. V. E 10,202 10,720 11,218 11,852 12,449 12,760 0.9%C. V. F 4,993 5,227 5,366 5,502 5,605 5,648 0.4%C. V. H 2,969 3,182 3,411 3,627 3,815 3,985 1.1%C. V. I East 2,395 2,609 2,829 3,044 3,239 3,436 1.4%C. V. I West 1,198 1,270 1,323 1,370 1,405 1,430 0.6%Crofton 2,699 2,851 3,020 3,205 3,383 3,538 1.1%Duncan 5,871 6,276 6,750 7,316 7,879 8,416 1.5%Ladysmith 6,742 7,163 7,672 8,215 8,710 9,116 1.2%Mill Bay 819 889 954 1,016 1,079 1,151 1.3%N. Cow. NE 2,165 2,317 2,482 2,650 2,803 2,940 1.2%N. Cow. NW 744 803 858 913 957 998 1.1%N. Cow. SE 8,871 9,494 10,085 10,627 11,162 11,709 1.1%N. Cow. SW 2,028 2,145 2,263 2,377 2,486 2,582 0.9%Rur. Shaw. Lk 1,102 1,167 1,221 1,280 1,342 1,401 0.9%Shawnigan Lake 4,395 4,568 4,873 5,176 5,465 5,752 1.2%
75,155 79,821 84,788 90,047 95,013 99,420 1.1%Total
3.3 Road and Transit Network
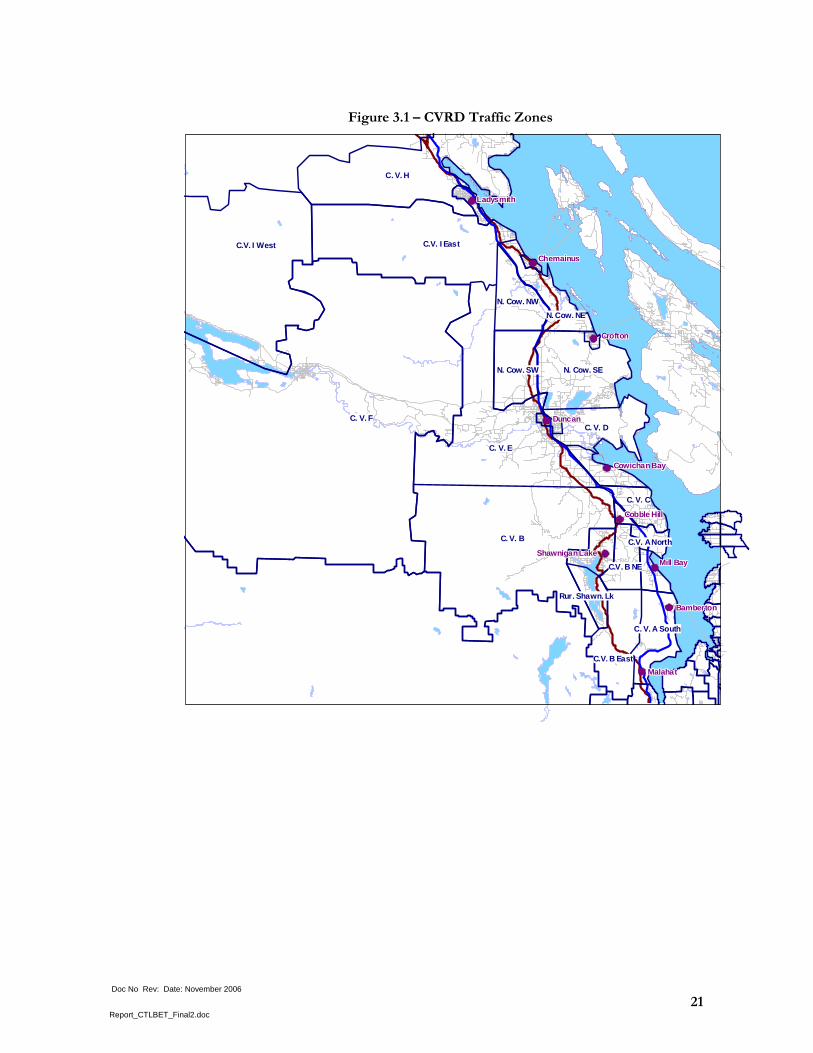
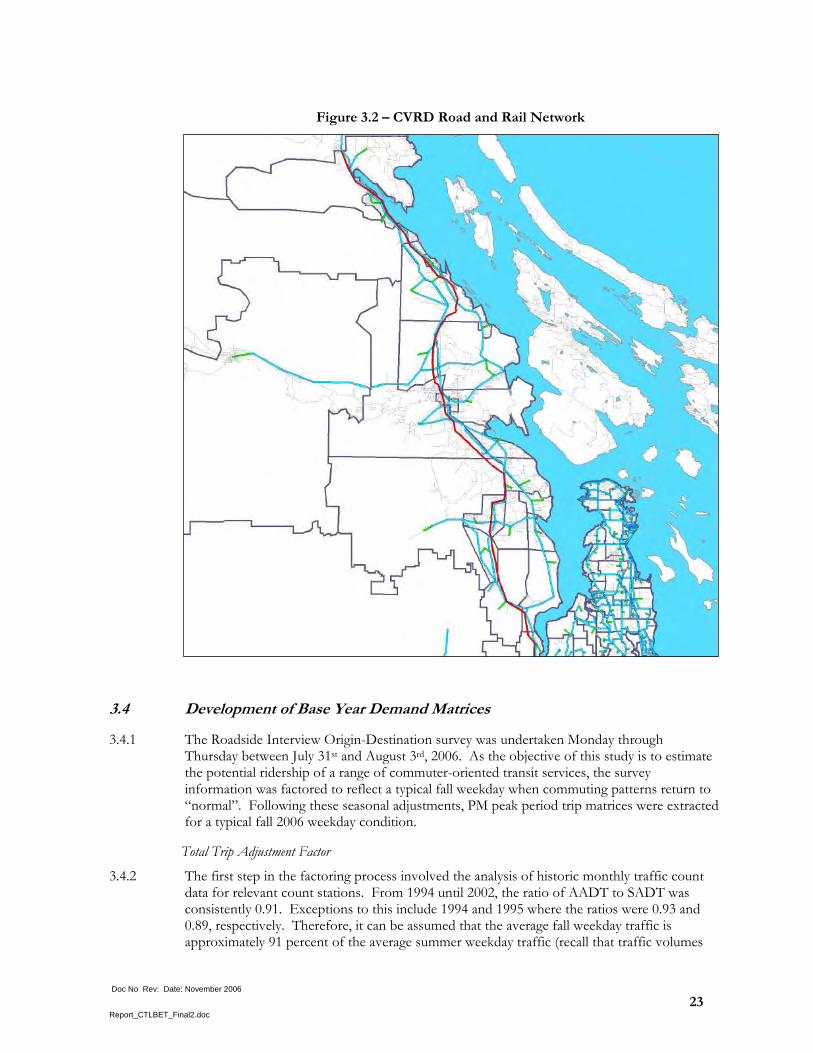
3.3.1 The baseline road and transit network contained in the CRD Regional Travel Model was expanded to provide coverage of the road network north to Ladysmith. Additionally, the commuter rail service (following the E&N railway) and the proposed bus services were coded into the model as future options. Figure 3.2 highlights the road and rail network added in the CVRD study area. The rail line is shown as a red line, the road network is shown by blue lines, and green lines represent access to the zones.
Doc No Rev: Date: November 2006
23 Report_CTLBET_Final2.doc
Figure 3.2 – CVRD Road and Rail Network
3.4 Development of Base Year Demand Matrices
3.4.1 The Roadside Interview Origin-Destination survey was undertaken Monday through Thursday between July 31st and August 3rd, 2006. As the objective of this study is to estimate the potential ridership of a range of commuter-oriented transit services, the survey information was factored to reflect a typical fall weekday when commuting patterns return to “normal”. Following these seasonal adjustments, PM peak period trip matrices were extracted for a typical fall 2006 weekday condition.
Total Trip Adjustment Factor
3.4.2 The first step in the factoring process involved the analysis of historic monthly traffic count data for relevant count stations. From 1994 until 2002, the ratio of AADT to SADT was consistently 0.91. Exceptions to this include 1994 and 1995 where the ratios were 0.93 and 0.89, respectively. Therefore, it can be assumed that the average fall weekday traffic is approximately 91 percent of the average summer weekday traffic (recall that traffic volumes
Doc No Rev: Date: November 2006
24 Report_CTLBET_Final2.doc
during the fall months of September and October are similar to AADT volumes as shown earlier in Figure 2.2).
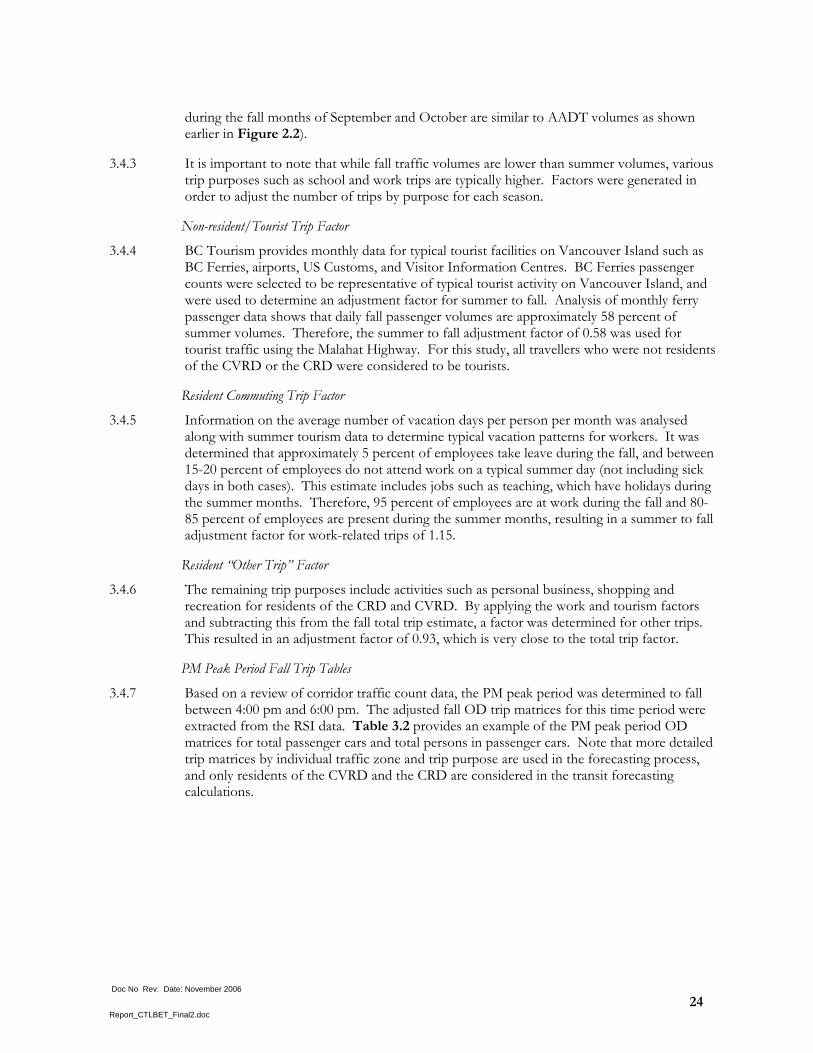
3.4.3 It is important to note that while fall traffic volumes are lower than summer volumes, various trip purposes such as school and work trips are typically higher. Factors were generated in order to adjust the number of trips by purpose for each season.
Non-resident/Tourist Trip Factor
3.4.4 BC Tourism provides monthly data for typical tourist facilities on Vancouver Island such as BC Ferries, airports, US Customs, and Visitor Information Centres. BC Ferries passenger counts were selected to be representative of typical tourist activity on Vancouver Island, and were used to determine an adjustment factor for summer to fall. Analysis of monthly ferry passenger data shows that daily fall passenger volumes are approximately 58 percent of summer volumes. Therefore, the summer to fall adjustment factor of 0.58 was used for tourist traffic using the Malahat Highway. For this study, all travellers who were not residents of the CVRD or the CRD were considered to be tourists.
Resident Commuting Trip Factor
3.4.5 Information on the average number of vacation days per person per month was analysed along with summer tourism data to determine typical vacation patterns for workers. It was determined that approximately 5 percent of employees take leave during the fall, and between 15-20 percent of employees do not attend work on a typical summer day (not including sick days in both cases). This estimate includes jobs such as teaching, which have holidays during the summer months. Therefore, 95 percent of employees are at work during the fall and 80-85 percent of employees are present during the summer months, resulting in a summer to fall adjustment factor for work-related trips of 1.15.
Resident “Other Trip” Factor
3.4.6 The remaining trip purposes include activities such as personal business, shopping and recreation for residents of the CRD and CVRD. By applying the work and tourism factors and subtracting this from the fall total trip estimate, a factor was determined for other trips. This resulted in an adjustment factor of 0.93, which is very close to the total trip factor.
PM Peak Period Fall Trip Tables
3.4.7 Based on a review of corridor traffic count data, the PM peak period was determined to fall between 4:00 pm and 6:00 pm. The adjusted fall OD trip matrices for this time period were extracted from the RSI data. Table 3.2 provides an example of the PM peak period OD matrices for total passenger cars and total persons in passenger cars. Note that more detailed trip matrices by individual traffic zone and trip purpose are used in the forecasting process, and only residents of the CVRD and the CRD are considered in the transit forecasting calculations.

Doc No Rev: Date: November 2006
25 Report_CTLBET_Final2.doc
Table 3.2 – PM Peak Period Trip Matrices (Northbound)
Origin / Destination South Cowichan
North Cowichan Ladysmith North
Externals Total
Downtown Victoria 169 90 7 128 394 Victoria / Esquimalt 348 254 21 181 804 Saanich / Sidney 181 196 14 177 568 View Royal 47 34 5 23 108 Langford 73 90 7 14 184 Colwood 45 37 1 25 108 Sooke / Juan de Fuca 43 24 - 14 81 South Externals 7 9 - 7 23 Total 912 735 55 568 2,271
Origin / Destination South Cowichan
North Cowichan Ladysmith North
Externals Total
Downtown Victoria 236 142 16 266 660 Victoria / Esquimalt 478 393 42 361 1,275 Saanich / Sidney 261 314 23 342 940 View Royal 65 55 7 46 174 Langford 106 137 12 28 283 Colwood 64 55 3 39 161 Sooke / Juan de Fuca 63 39 - 29 131 South Externals 11 14 - 15 39 Total 1,284 1,150 103 1,125 3,662
A. Total Passenger Cars
B. Total Persons in Passenger Cars
3.5 Growth Model
3.5.1 A variety of regional trends influence travel growth. Heanue2 identifies three main factors that have driven the increase in person and vehicular travel following the post-war period:
Demographic factors, such as growth in population and households, auto ownership, and licensed drivers.
Economic factors, such as labour force participation, employment, transportation costs, and income.
Lifestyle choice factors, such as smaller household size and campus-style office parks.
3.5.2 With respect to travel on an individual facility, other factors such as the facility’s capacity and the availability of improved alternate routes or modes will affect demand.
3.5.3 In order to predict future ridership levels, a growth model was developed to factor the base year matrices to reflect trends in traffic and future population and economic growth. Between 1994 and 2000, annual daily traffic was growing at approximately 5 percent per annum. Since 2000, traffic volumes appear to have more or less stabilized as the highway is approaching capacity (especially in the peak hours).
2 Heanue K (1998) Highway capacity expansion and induced travel: evidence and implications. Transportation Research Circular. No. 48 1.
Doc No Rev: Date: November 2006
26 Report_CTLBET_Final2.doc
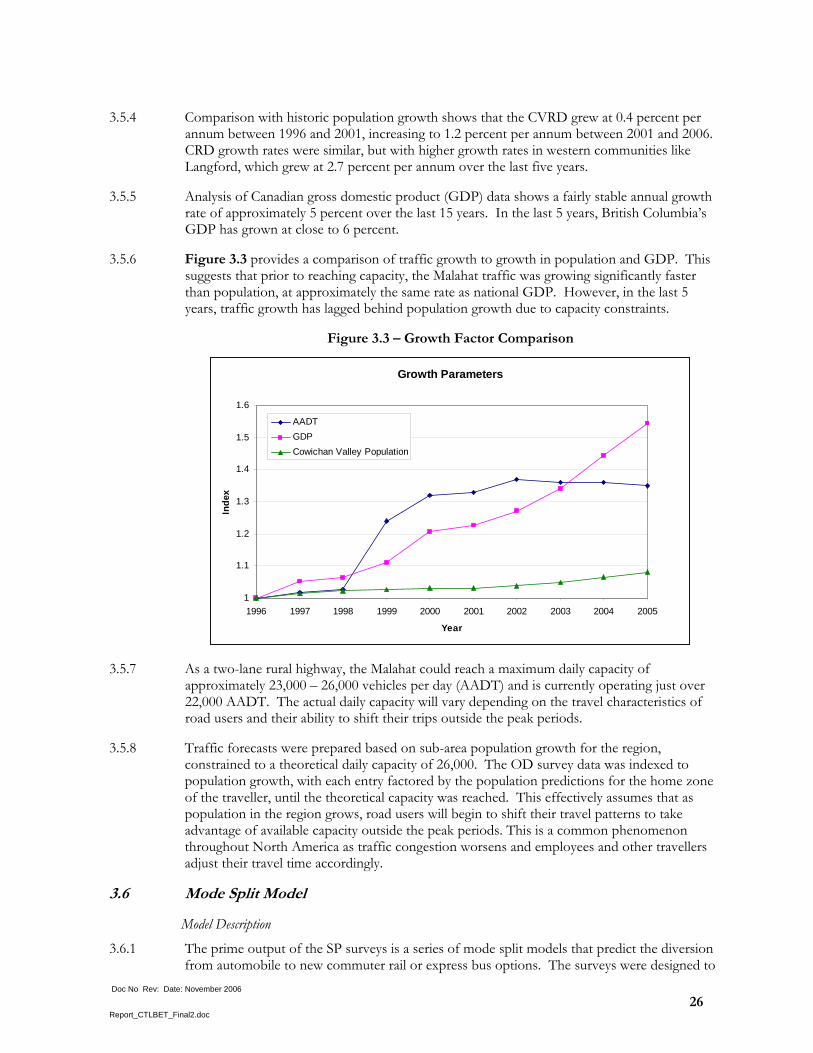
3.5.4 Comparison with historic population growth shows that the CVRD grew at 0.4 percent per annum between 1996 and 2001, increasing to 1.2 percent per annum between 2001 and 2006. CRD growth rates were similar, but with higher growth rates in western communities like Langford, which grew at 2.7 percent per annum over the last five years.
3.5.5 Analysis of Canadian gross domestic product (GDP) data shows a fairly stable annual growth rate of approximately 5 percent over the last 15 years. In the last 5 years, British Columbia’s GDP has grown at close to 6 percent.
3.5.6 Figure 3.3 provides a comparison of traffic growth to growth in population and GDP. This suggests that prior to reaching capacity, the Malahat traffic was growing significantly faster than population, at approximately the same rate as national GDP. However, in the last 5 years, traffic growth has lagged behind population growth due to capacity constraints.
Figure 3.3 – Growth Factor Comparison
Growth Parameters
1
1.1
1.2
1.3
1.4
1.5
1.6
1996 1997 1998 1999 2000 2001 2002 2003 2004 2005
Year
Inde
x
AADTGDPCowichan Valley Population
3.5.7 As a two-lane rural highway, the Malahat could reach a maximum daily capacity of approximately 23,000 – 26,000 vehicles per day (AADT) and is currently operating just over 22,000 AADT. The actual daily capacity will vary depending on the travel characteristics of road users and their ability to shift their trips outside the peak periods.
3.5.8 Traffic forecasts were prepared based on sub-area population growth for the region, constrained to a theoretical daily capacity of 26,000. The OD survey data was indexed to population growth, with each entry factored by the population predictions for the home zone of the traveller, until the theoretical capacity was reached. This effectively assumes that as population in the region grows, road users will begin to shift their travel patterns to take advantage of available capacity outside the peak periods. This is a common phenomenon throughout North America as traffic congestion worsens and employees and other travellers adjust their travel time accordingly.
3.6 Mode Split Model
Model Description
3.6.1 The prime output of the SP surveys is a series of mode split models that predict the diversion from automobile to new commuter rail or express bus options. The surveys were designed to

Doc No Rev: Date: November 2006
27 Report_CTLBET_Final2.doc
develop models for the following resident markets: (i) commuters; and (ii) non-commuters (e.g., shopping, recreational, personal business).
3.6.2 Following a review and verification of the SP data (e.g., testing for illogical respondents), the data was analyzed to estimate mode split models by market segment. Model estimation is an iterative process where various mode split structures are examined (e.g., multi-nomial logit, nested-logit) and different data combinations are assessed (e.g., exclusion/inclusion of non-traders, usage of 1st only preference or 1st and 2nd preference data, etc.) for their statistical validity. Approximately 40 models were estimated and tested as part of this process and the final model took the form of a multi-nomial logit model as illustrated below:
( ))exp(U)exp(U)exp(U)exp(UP
busrailauto
railrail
++=
where:
Uauto = c1xIVT+c2xFare
Urail = c1xIVT+c2xFare+c3xHdwy+c4xAccess+Biasrail
Ubus = c1xIVT+c2xFare+c3xHdwy+c4xAccess+Biasbus
3.6.3 The logit model operates by comparing the ‘utility’ of travel by each mode with the utility of the alternative – the new rail link - at the most disaggregate level and returns a forecast mode share based upon the difference in utility. An example of the relationship between difference in utility and mode share is shown in Figure 3.4.
Figure 3.4 – Logit Curve
0
0.1
0.2
0.3
0.4
0.5
0.6
0.7
0.8
0.9
1
-5 -4 -3 -2 -1 0 1 2 3 4 5
Utility Difference
Mod
e Sh
are
3.6.4 The utility (or disutility) of travel is based on the conversion of the different aspects of the journey (travel time, waiting time, travel cost, etc.) into a standard unit to enable a direct comparison to be made across modes. For example, if all trip characteristics were to be converted into units of in-vehicle time, the comparison may be made, for instance, of a trip by car of 45 generalized minutes compared with a trip by rail of 60 generalized minutes, resulting in a forecast mode share.
Doc No Rev: Date: November 2006
28 Report_CTLBET_Final2.doc
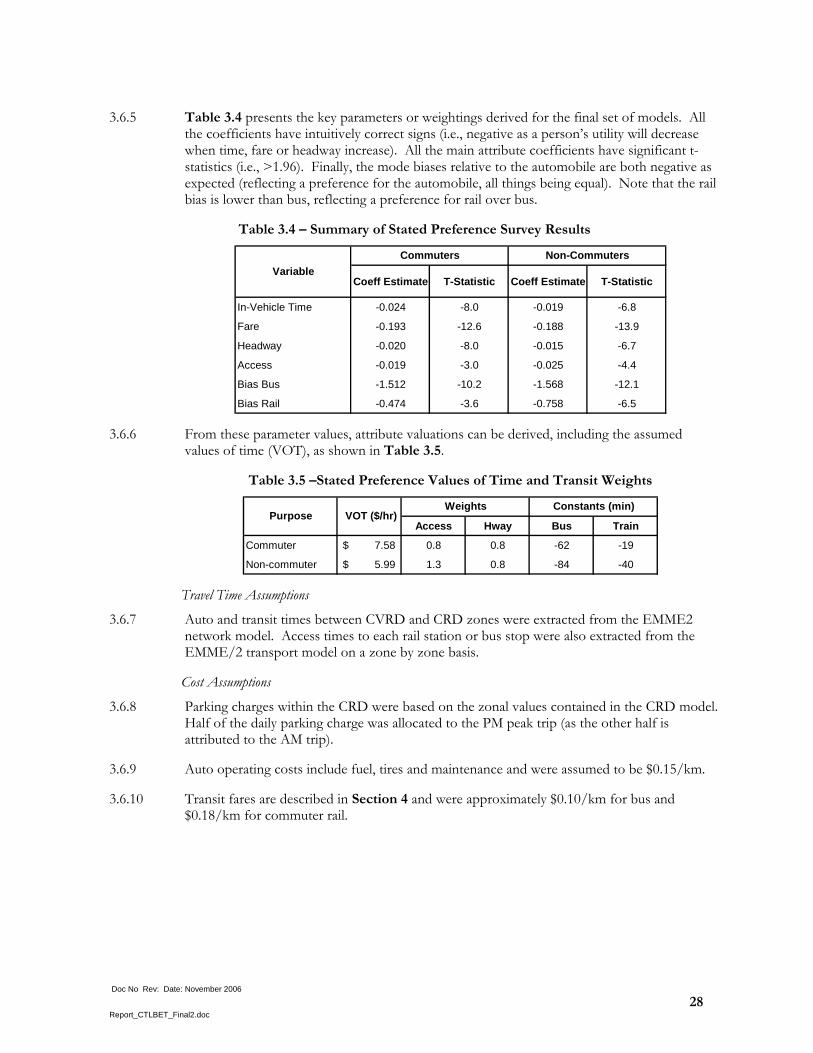
3.6.5 Table 3.4 presents the key parameters or weightings derived for the final set of models. All the coefficients have intuitively correct signs (i.e., negative as a person’s utility will decrease when time, fare or headway increase). All the main attribute coefficients have significant t-statistics (i.e., >1.96). Finally, the mode biases relative to the automobile are both negative as expected (reflecting a preference for the automobile, all things being equal). Note that the rail bias is lower than bus, reflecting a preference for rail over bus.
Table 3.4 – Summary of Stated Preference Survey Results
Coeff Estimate T-Statistic Coeff Estimate T-Statistic
In-Vehicle Time -0.024 -8.0 -0.019 -6.8
Fare -0.193 -12.6 -0.188 -13.9
Headway -0.020 -8.0 -0.015 -6.7
Access -0.019 -3.0 -0.025 -4.4
Bias Bus -1.512 -10.2 -1.568 -12.1
Bias Rail -0.474 -3.6 -0.758 -6.5
VariableCommuters Non-Commuters
3.6.6 From these parameter values, attribute valuations can be derived, including the assumed values of time (VOT), as shown in Table 3.5.
Table 3.5 –Stated Preference Values of Time and Transit Weights
Access Hway Bus Train
Commuter 7.58$ 0.8 0.8 -62 -19
Non-commuter 5.99$ 1.3 0.8 -84 -40
VOT ($/hr) Weights Constants (min)
Purpose
Travel Time Assumptions
3.6.7 Auto and transit times between CVRD and CRD zones were extracted from the EMME2 network model. Access times to each rail station or bus stop were also extracted from the EMME/2 transport model on a zone by zone basis.
Cost Assumptions
3.6.8 Parking charges within the CRD were based on the zonal values contained in the CRD model. Half of the daily parking charge was allocated to the PM peak trip (as the other half is attributed to the AM trip).
3.6.9 Auto operating costs include fuel, tires and maintenance and were assumed to be $0.15/km.
3.6.10 Transit fares are described in Section 4 and were approximately $0.10/km for bus and $0.18/km for commuter rail.

Doc No Rev: Date: November 2006
29 Report_CTLBET_Final2.doc
4 Bus and Commuter Rail Service Options
4.1 Bus Service Alternatives
4.1.1 Commuter bus services using standard transit buses (or motor coaches) can be provided between downtown Victoria and those communities within the Cowichan Valley that are home to downtown-oriented workers. The travel market analysis, summarized in Sections 2.5 and 2.6, suggests that the primary market for transit services in the short-term would be the 700 CVRD residents working in downtown Victoria. These downtown-destined commuters are concentrated in five areas that together account for approximately 90 percent of the total commuters travelling to downtown Victoria: Cowichan Valley E (Duncan Area), Shawnigan Lake and nearby areas, Cowichan Bay, Cobble Hill and area, and Cowichan Valley A South (Bamberton/Malahat and vicinity).
4.1.2 In developing the bus service option, the intent was to provide these commuters with a competitive transit option by connecting each community to downtown Victoria by the most direct route possible. Given the current travel market characteristics, a series of bus routing options were examined before defining two routes for testing that would serve the communities that appear to have the highest ridership potential:
Route A would run from Duncan to downtown Victoria via the Trans Canada Highway serving Cowichan Bay, Cobble Hill, Mill Bay, Bamberton, and Malahat.
Route B would run from the Shawnigan Lake community to downtown Victoria, serving South Shawnigan Lake and Malahat, via Shawnigan Lake Road and the Trans Canada highway.
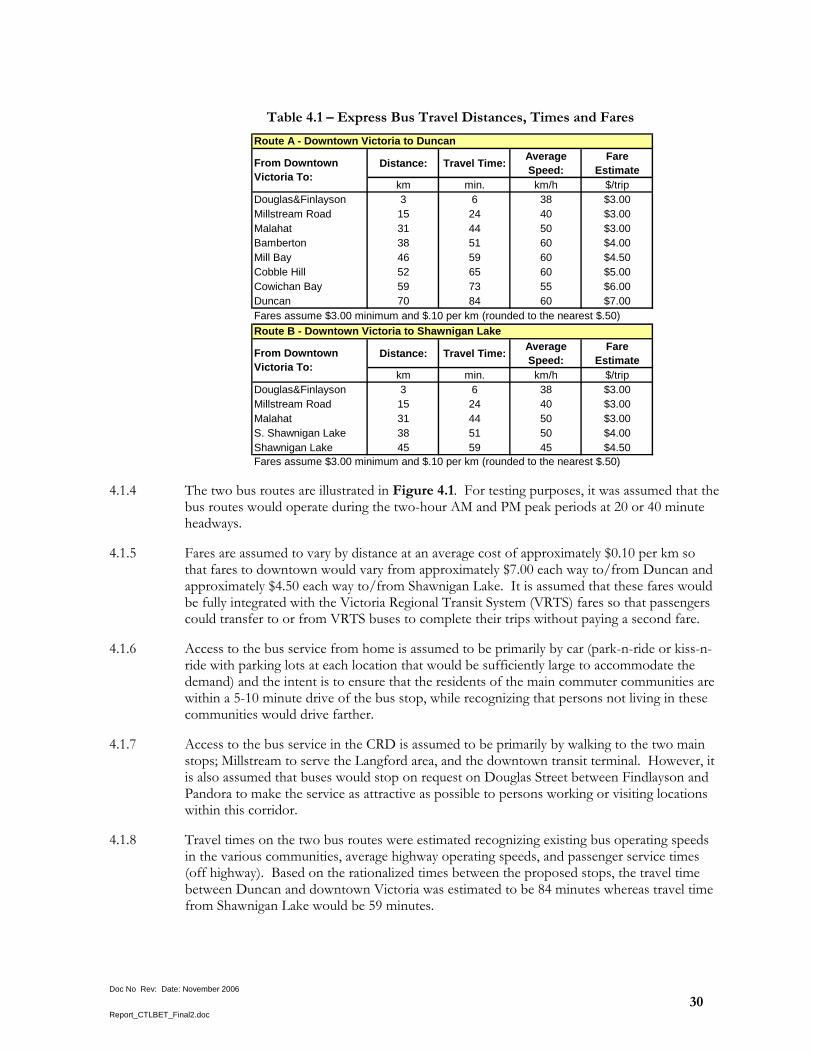
4.1.3 Table 4.1 summarizes the travel distances, times, speeds and costs assumed for the two bus routes.
Doc No Rev: Date: November 2006
30 Report_CTLBET_Final2.doc
Table 4.1 – Express Bus Travel Distances, Times and Fares
Distance: Travel Time: Average Speed:
Fare Estimate
km min. km/h $/tripDouglas&Finlayson 3 6 38 $3.00 Millstream Road 15 24 40 $3.00 Malahat 31 44 50 $3.00 Bamberton 38 51 60 $4.00 Mill Bay 46 59 60 $4.50 Cobble Hill 52 65 60 $5.00 Cowichan Bay 59 73 55 $6.00 Duncan 70 84 60 $7.00
Distance: Travel Time: Average Speed:
Fare Estimate
km min. km/h $/tripDouglas&Finlayson 3 6 38 $3.00 Millstream Road 15 24 40 $3.00 Malahat 31 44 50 $3.00 S. Shawnigan Lake 38 51 50 $4.00 Shawnigan Lake 45 59 45 $4.50
From Downtown Victoria To:
Fares assume $3.00 minimum and $.10 per km (rounded to the nearest $.50)
Route A - Downtown Victoria to Duncan
From Downtown Victoria To:
Fares assume $3.00 minimum and $.10 per km (rounded to the nearest $.50)Route B - Downtown Victoria to Shawnigan Lake
4.1.4 The two bus routes are illustrated in Figure 4.1. For testing purposes, it was assumed that the bus routes would operate during the two-hour AM and PM peak periods at 20 or 40 minute headways.
4.1.5 Fares are assumed to vary by distance at an average cost of approximately $0.10 per km so that fares to downtown would vary from approximately $7.00 each way to/from Duncan and approximately $4.50 each way to/from Shawnigan Lake. It is assumed that these fares would be fully integrated with the Victoria Regional Transit System (VRTS) fares so that passengers could transfer to or from VRTS buses to complete their trips without paying a second fare.
4.1.6 Access to the bus service from home is assumed to be primarily by car (park-n-ride or kiss-n-ride with parking lots at each location that would be sufficiently large to accommodate the demand) and the intent is to ensure that the residents of the main commuter communities are within a 5-10 minute drive of the bus stop, while recognizing that persons not living in these communities would drive farther.
4.1.7 Access to the bus service in the CRD is assumed to be primarily by walking to the two main stops; Millstream to serve the Langford area, and the downtown transit terminal. However, it is also assumed that buses would stop on request on Douglas Street between Findlayson and Pandora to make the service as attractive as possible to persons working or visiting locations within this corridor.
4.1.8 Travel times on the two bus routes were estimated recognizing existing bus operating speeds in the various communities, average highway operating speeds, and passenger service times (off highway). Based on the rationalized times between the proposed stops, the travel time between Duncan and downtown Victoria was estimated to be 84 minutes whereas travel time from Shawnigan Lake would be 59 minutes.
Doc No Rev: Date: November 2006
31 Report_CTLBET_Final2.doc
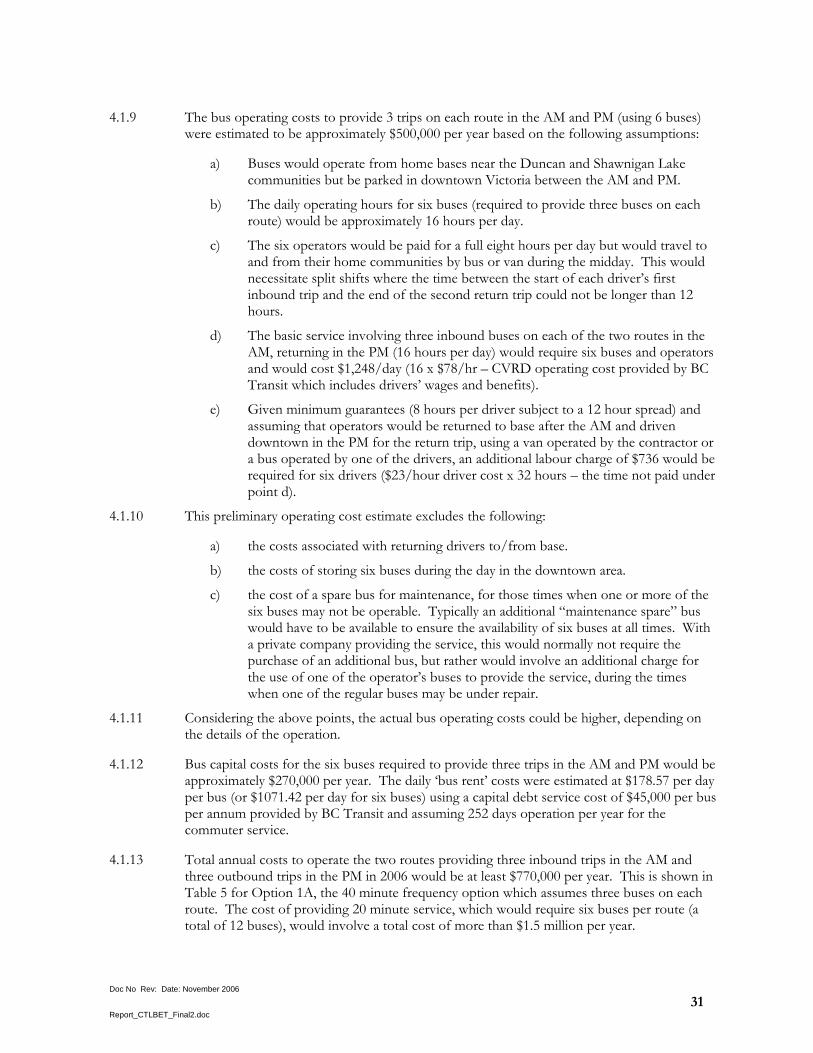
4.1.9 The bus operating costs to provide 3 trips on each route in the AM and PM (using 6 buses) were estimated to be approximately $500,000 per year based on the following assumptions:
a) Buses would operate from home bases near the Duncan and Shawnigan Lake communities but be parked in downtown Victoria between the AM and PM.
b) The daily operating hours for six buses (required to provide three buses on each route) would be approximately 16 hours per day.
c) The six operators would be paid for a full eight hours per day but would travel to and from their home communities by bus or van during the midday. This would necessitate split shifts where the time between the start of each driver’s first inbound trip and the end of the second return trip could not be longer than 12 hours.
d) The basic service involving three inbound buses on each of the two routes in the AM, returning in the PM (16 hours per day) would require six buses and operators and would cost $1,248/day (16 x $78/hr – CVRD operating cost provided by BC Transit which includes drivers’ wages and benefits).
e) Given minimum guarantees (8 hours per driver subject to a 12 hour spread) and assuming that operators would be returned to base after the AM and driven downtown in the PM for the return trip, using a van operated by the contractor or a bus operated by one of the drivers, an additional labour charge of $736 would be required for six drivers ($23/hour driver cost x 32 hours – the time not paid under point d).
4.1.10 This preliminary operating cost estimate excludes the following:
a) the costs associated with returning drivers to/from base.
b) the costs of storing six buses during the day in the downtown area.
c) the cost of a spare bus for maintenance, for those times when one or more of the six buses may not be operable. Typically an additional “maintenance spare” bus would have to be available to ensure the availability of six buses at all times. With a private company providing the service, this would normally not require the purchase of an additional bus, but rather would involve an additional charge for the use of one of the operator’s buses to provide the service, during the times when one of the regular buses may be under repair.
4.1.11 Considering the above points, the actual bus operating costs could be higher, depending on the details of the operation.
4.1.12 Bus capital costs for the six buses required to provide three trips in the AM and PM would be approximately $270,000 per year. The daily ‘bus rent’ costs were estimated at $178.57 per day per bus (or $1071.42 per day for six buses) using a capital debt service cost of $45,000 per bus per annum provided by BC Transit and assuming 252 days operation per year for the commuter service.
4.1.13 Total annual costs to operate the two routes providing three inbound trips in the AM and three outbound trips in the PM in 2006 would be at least $770,000 per year. This is shown in Table 5 for Option 1A, the 40 minute frequency option which assumes three buses on each route. The cost of providing 20 minute service, which would require six buses per route (a total of 12 buses), would involve a total cost of more than $1.5 million per year.

Doc No Rev: Date: November 2006
32 Report_CTLBET_Final2.doc
Figure 4.1 – Proposed Express Bus Services
4.2 Commuter Rail
4.2.1 Commuter rail service can be provided between downtown Victoria and Ladysmith, travelling southbound during the AM peak period and northbound during the PM peak period. Available vehicle types range from bi-level equipment now used by West Coast express in Vancouver to the current Budd rail diesel cars (RDCs) now used by VIA rail on the E&NR. However, order of magnitude estimates of demand, as well as the condition of the existing infrastructure suggest that VIA Rail-type equipment appears most appropriate. Since these vehicles are no longer manufactured, it would be necessary to acquire refurbished used vehicles.
4.2.2 Individual RDCs normally have a seating configuration that provides 90 seats. Unless high-level platforms are constructed in stations, these cars are not readily accessible by persons with physical disadvantages. Depending upon forecast demand and frequency of service, train consists of either 2 car or 3 car RDCs would be used. Park-and-ride facilities would be

Doc No Rev: Date: November 2006
33 Report_CTLBET_Final2.doc
provided at all rail stations within the CVRD, and local bus service would be integrated with the stations.
4.2.3 For the existing railway infrastructure, it would be possible to operate 3 trains per direction per day at 20 minute intervals (e.g., 3 AM inbound and 3 PM outbound). However, for a new commuter rail service, it is fairly common to start with 1 train per direction per day and increase capacity or frequency as demand dictates. For the purpose of this study, two frequency levels were examined:
1 train per direction per day (timed to coincide with median work start and end times)
3 trains per direction per day (operating on 20 minute frequency during the AM and PM peaks)
4.2.4 Since total travel time between downtown Victoria and Duncan, including stop time, is estimated to be one and a half hours, there is no opportunity to use trains more than once each during the peak period. Total travel time from downtown Victoria to Ladysmith is estimated to be two hours.
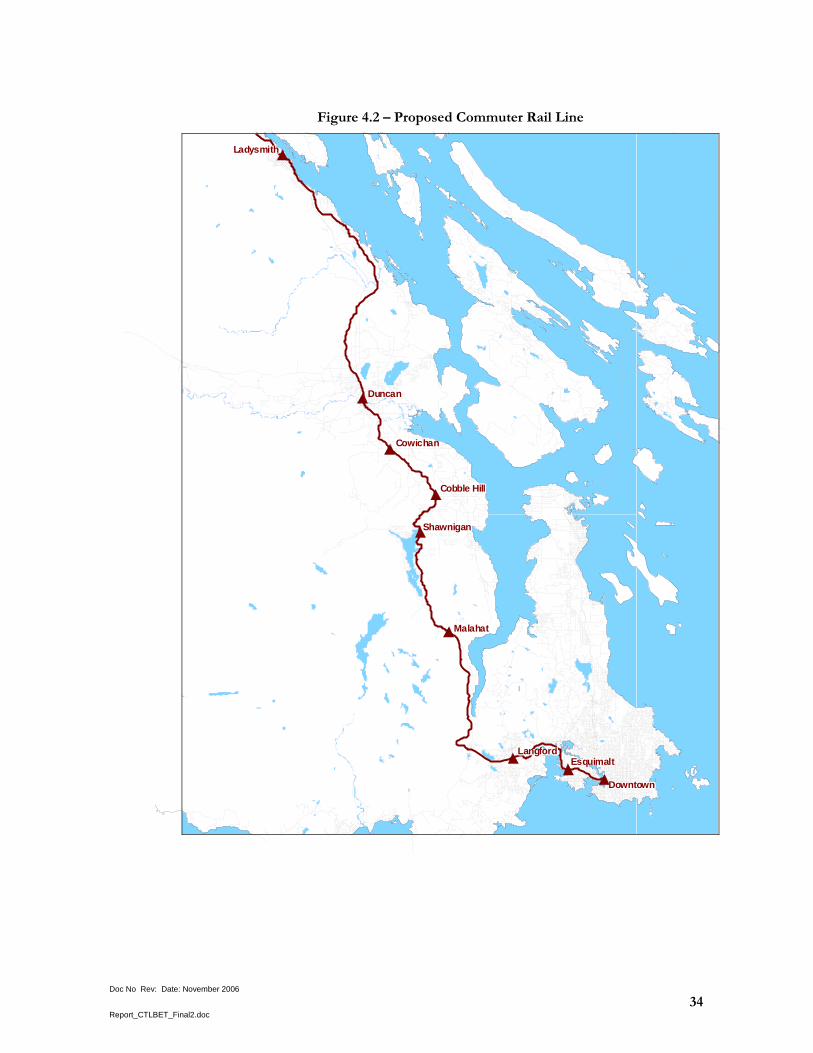
4.2.5 For the purpose of this analysis, the one-way fares for rail service would be $11 to Duncan and $16 to Ladysmith. The cost of travel on the CRD transit system would be included in the rail fares. The fare estimate is based on the 2005 West Coast Express fares and is pro-rated by travel time. Proposed station locations are shown in Figure 4.2, with estimated travel times and fares in Table 4.2.
Table 4.2 - Rail Travel Times and Fares
Distance: Travel Time:
Average Speed:
Fare Estimate
km min. km/h $/tripEsquimalt 6 14 26 $3.00 Langford 13 22 35 $3.00 Malahat 32 43 45 $5.50 Shawinigan 45 58 47 $8.00 Cobble Hill 50 63 48 $8.50 Cowichan 58 73 48 $10.00 Duncan 64 82 47 $11.00 Ladysmith 93 115 49 $16.00
From Downtown Victoria To:
Doc No Rev: Date: November 2006
34 Report_CTLBET_Final2.doc
Figure 4.2 – Proposed Commuter Rail Line
DowntownDowntownDowntownDowntownDowntownDowntownDowntownDowntownDowntown
EsquimaltEsquimaltEsquimaltEsquimaltEsquimaltEsquimaltEsquimaltEsquimaltEsquimaltLangfordLangfordLangfordLangfordLangfordLangfordLangfordLangfordLangford
MalahatMalahatMalahatMalahatMalahatMalahatMalahatMalahatMalahat
ShawniganShawniganShawniganShawniganShawniganShawniganShawniganShawniganShawnigan
Cobble HillCobble HillCobble HillCobble HillCobble HillCobble HillCobble HillCobble HillCobble Hill
LadysmithLadysmithLadysmithLadysmithLadysmithLadysmithLadysmithLadysmithLadysmith
CowichanCowichanCowichanCowichanCowichanCowichanCowichanCowichanCowichan
DuncanDuncanDuncanDuncanDuncanDuncanDuncanDuncanDuncan
Doc No Rev: Date: November 2006
35 Report_CTLBET_Final2.doc
4.2.6 Clearly, these fares are a matter of policy with regard to the extent of service subsidies. However, these fares would not cover costs of operation, let alone the capital costs of railway infrastructure improvements required and the procurement of vehicles.
4.2.7 The extent of infrastructure improvements is unclear at this time. The route presently lacks any form of right-of-way protection from the standpoint of both adjacent land use and pedestrians. In addition, there is a significant number of unprotected grade crossings with roads, the net effect of both being fairly strict constraints on maximum operating speeds.
4.2.8 For purpose of preliminary cost analysis, the following assumptions have been made:
$2 million to $3 million (depending upon service frequency) has been allowed for minor station improvements, fare machines, and the installation of grade crossing protection at critical locations,
refurbished Budd RDCs, which would require one crew person per car could be procured for about $1.5 million each, with a reliable service life of 10 years,
no allowance has been made for spare vehicles,
one additional crew member has been allowed for vacations, overtime, and sickness,
service would be provided on weekdays only, or about 240 days per year (allowing for statutory holidays),
labour work rules would permit split shifts so that one crew would operate both inbound and outbound trains on the same day, and
typical unit operating costs for similar services are used in estimating annual operating costs.
4.2.9 Based on the above assumptions and the final operating characteristics, a preliminary cost estimate for this service could range between $1.3 and $3.5 million per year (See Appendix D for a detailed cost summary). Depending on the ridership levels, the daily one-way cost per trip could fall anywhere between $20 and $73. Section 5 provides ridership estimates for various operating configurations, which can be used to determine an appropriate operating configuration and the associated cost per ride.

Doc No Rev: Date: November 2006
36 Report_CTLBET_Final2.doc
5 Ridership Forecasts
5.1 Scenario Descriptions
5.1.1 Based on the models described in Section 3, ridership forecasts were developed for commuter rail and express bus in three time horizons (2006, 2016 and 2026). Details of the express bus and commuter rail options are described in Section 4 and summarized below and in Table 5.1:
Express Bus Option 1A – featuring two routes (A-Duncan and B-Shawnigan Lake), 40 minute peak period frequency, fares ranging from $3 to $7 ($7 between downtown Victoria and Duncan), travel time between Duncan and downtown Victoria at 84 minutes;
Express Bus Option 1B – the same as 1A except running at a 20 minute frequency during the peak periods;
Commuter Rail Option 2A – featuring 1 train per day per direction, fares between $2 and $16 ($11 between downtown Victoria and Duncan), travel time between Duncan and downtown Victoria at 82 minutes; and
Commuter Rail Option 2B – the same as 2A except running 3 trains per day per direction.
5.1.2 Note that today the average automobile travel time between downtown Victoria and Duncan is approximately 60 minutes and the vehicle operating costs are $9. Average daily parking charges in downtown Victoria are approximately $4, of which the cost would be equally divided between the morning and afternoon commute.
Table 5.1 – Scenario Summary
# of Buses/TrainsFrequencyFare (Victoria to Duncan)2006 Travel Time (Victoria to Duncan) 84 min 84 min 82 min 82 min
$7 $7 $11 $1140 minute 20 minute N/A 20 minute6 Buses 12 Buses 1 Train 3 Trains
Bus RailOption 1A Option 1B Option 2A Option 2B
5.2 Ridership Forecasts
5.2.1 Table 5.2 provides a summary of the PM peak period and daily ridership forecasts for the Express Bus and Commuter Rail options. It is important to note that these ridership forecasts focus on trips between the CRD and CVRD. The proposed service options could also serve markets between the Langford area and Victoria which are not included in these estimates. However, while the additional ridership from Langford to Victoria may decrease the subsidies required to run the service, this increase in ridership will not affect traffic over the Malahat Highway, as is the focus of this study.
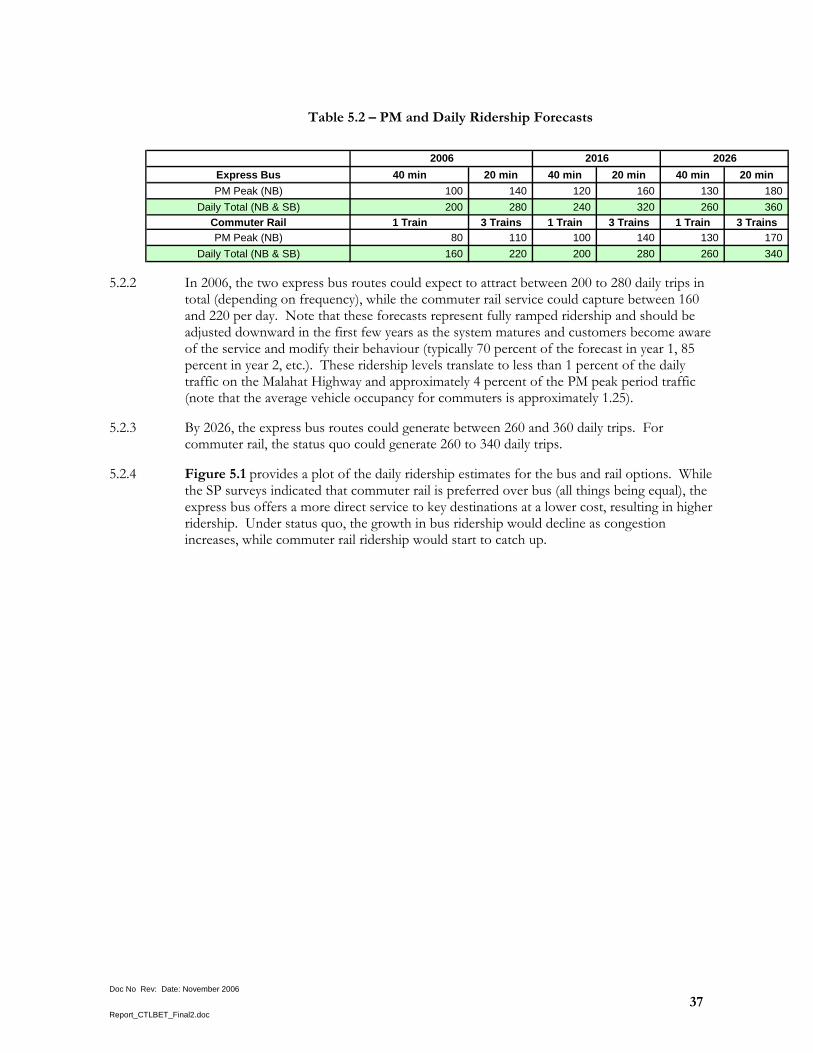
Doc No Rev: Date: November 2006
37 Report_CTLBET_Final2.doc
Table 5.2 – PM and Daily Ridership Forecasts
Express Bus 40 min 20 min 40 min 20 min 40 min 20 minPM Peak (NB) 100 140 120 160 130 180
Daily Total (NB & SB) 200 280 240 320 260 360 Commuter Rail 1 Train 3 Trains 1 Train 3 Trains 1 Train 3 TrainsPM Peak (NB) 80 110 100 140 130 170
Daily Total (NB & SB) 160 220 200 280 260 340
2006 2016 2026
5.2.2 In 2006, the two express bus routes could expect to attract between 200 to 280 daily trips in total (depending on frequency), while the commuter rail service could capture between 160 and 220 per day. Note that these forecasts represent fully ramped ridership and should be adjusted downward in the first few years as the system matures and customers become aware of the service and modify their behaviour (typically 70 percent of the forecast in year 1, 85 percent in year 2, etc.). These ridership levels translate to less than 1 percent of the daily traffic on the Malahat Highway and approximately 4 percent of the PM peak period traffic (note that the average vehicle occupancy for commuters is approximately 1.25).
5.2.3 By 2026, the express bus routes could generate between 260 and 360 daily trips. For commuter rail, the status quo could generate 260 to 340 daily trips.
5.2.4 Figure 5.1 provides a plot of the daily ridership estimates for the bus and rail options. While the SP surveys indicated that commuter rail is preferred over bus (all things being equal), the express bus offers a more direct service to key destinations at a lower cost, resulting in higher ridership. Under status quo, the growth in bus ridership would decline as congestion increases, while commuter rail ridership would start to catch up.

Doc No Rev: Date: November 2006
38 Report_CTLBET_Final2.doc
Figure 5.1 – Daily Ridership Estimates
-
50
100
150
200
250
300
350
400
2006 2016 2026
Dai
ly R
ider
ship
Rail - Low Rail - High Bus - Low Bus - High
5.2.5 Table 5.3 shows the PM peak period origin and destinations for the 2006 commuter rail trips (assuming 3 trains per direction) and the corresponding mode shares. The majority of the ridership would be to/from downtown Victoria. Overall, commuter rail could attract approximately 3 percent of the PM peak person demand in the corridor and up to 4 percent of the vehicle demand (as commuters have lower vehicle occupancies).
Table 5.3 – 2006 PM Peak Period Commuter Rail OD’s (3 Train Option)
Origin / Destination South Cowichan
North Cowichan Ladysmith North
Externals Total
Downtown Victoria 62 21 2 85 Victoria / Esquimalt 20 3 1 24 Saanich / SidneyView RoyalLangford 1 1 ColwoodSooke / Juan de FucaSouth ExternalsTotal 83 24 3 - 110
Origin / Destination South Cowichan
North Cowichan Ladysmith North
Externals Total
Downtown Victoria 26% 15% 12% 13%Victoria / Esquimalt 4% 1% 2% 2%Saanich / SidneyView RoyalLangford 1%ColwoodSooke / Juan de FucaSouth ExternalsTotal 6% 2% 3% 0% 3%
A. PM Peak Period Commuter Rail Ridership - 3 Trains
B. Percentage of Total Demand Travelling by Commuter Rail
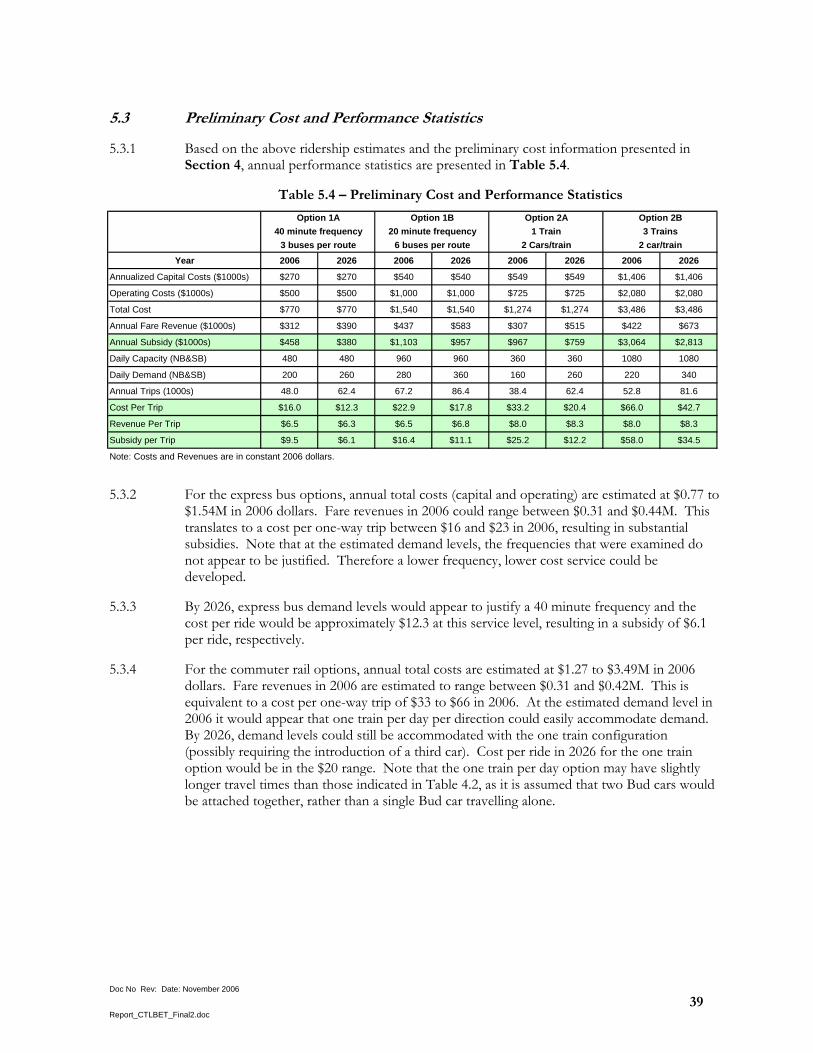
Doc No Rev: Date: November 2006
39 Report_CTLBET_Final2.doc
Year 2006 2026 2006 2026 2006 2026 2006 2026
Annualized Capital Costs ($1000s) $270 $270 $540 $540 $549 $549 $1,406 $1,406
Operating Costs ($1000s) $500 $500 $1,000 $1,000 $725 $725 $2,080 $2,080
Total Cost $770 $770 $1,540 $1,540 $1,274 $1,274 $3,486 $3,486
Annual Fare Revenue ($1000s) $312 $390 $437 $583 $307 $515 $422 $673
Annual Subsidy ($1000s) $458 $380 $1,103 $957 $967 $759 $3,064 $2,813
Daily Capacity (NB&SB) 480 480 960 960 360 360 1080 1080
Daily Demand (NB&SB) 200 260 280 360 160 260 220 340
Annual Trips (1000s) 48.0 62.4 67.2 86.4 38.4 62.4 52.8 81.6
Cost Per Trip $16.0 $12.3 $22.9 $17.8 $33.2 $20.4 $66.0 $42.7
Revenue Per Trip $6.5 $6.3 $6.5 $6.8 $8.0 $8.3 $8.0 $8.3
Subsidy per Trip $9.5 $6.1 $16.4 $11.1 $25.2 $12.2 $58.0 $34.5
Note: Costs and Revenues are in constant 2006 dollars.
3 buses per route 6 buses per route 2 Cars/train 2 car/train40 minute frequency 20 minute frequency 1 Train 3 Trains
Option 1A Option 1B Option 2A Option 2B
5.3 Preliminary Cost and Performance Statistics
5.3.1 Based on the above ridership estimates and the preliminary cost information presented in Section 4, annual performance statistics are presented in Table 5.4.
Table 5.4 – Preliminary Cost and Performance Statistics
5.3.2 For the express bus options, annual total costs (capital and operating) are estimated at $0.77 to $1.54M in 2006 dollars. Fare revenues in 2006 could range between $0.31 and $0.44M. This translates to a cost per one-way trip between $16 and $23 in 2006, resulting in substantial subsidies. Note that at the estimated demand levels, the frequencies that were examined do not appear to be justified. Therefore a lower frequency, lower cost service could be developed.
5.3.3 By 2026, express bus demand levels would appear to justify a 40 minute frequency and the cost per ride would be approximately $12.3 at this service level, resulting in a subsidy of $6.1 per ride, respectively.
5.3.4 For the commuter rail options, annual total costs are estimated at $1.27 to $3.49M in 2006 dollars. Fare revenues in 2006 are estimated to range between $0.31 and $0.42M. This is equivalent to a cost per one-way trip of $33 to $66 in 2006. At the estimated demand level in 2006 it would appear that one train per day per direction could easily accommodate demand. By 2026, demand levels could still be accommodated with the one train configuration (possibly requiring the introduction of a third car). Cost per ride in 2026 for the one train option would be in the $20 range. Note that the one train per day option may have slightly longer travel times than those indicated in Table 4.2, as it is assumed that two Bud cars would be attached together, rather than a single Bud car travelling alone.
Doc No Rev: Date: November 2006
40 Report_CTLBET_Final2.doc
5.4 Benchmarking of Ridership Forecasts
5.4.1 The potential transit ridership from Cowichan Valley was estimated as part of the: Short Term Transit Feasibility Study, Travel Market Analysis. This assessment was based on observed Victoria Regional Transit System ridership from remote suburban areas in the CRD to downtown Victoria, which is thought to represent the “best case” that might apply to future transit services between Duncan and other communities in the Cowichan Valley and downtown Victoria.
5.4.2 Whereas transit was reported to serve approximately 21 percent of all commuter (work) trips to downtown Victoria in 2001 (Census Place of Work data), the highest observed transit share to downtown from relatively remote suburban areas were reported from Sooke (37 percent), Sidney (34 percent), North Saanich (24 percent), and Central Saanich (27 percent).
5.4.3 Sooke stands out as having the highest reported modal split for work trips to downtown at 37 percent in 2001. The route 61 bus offers a 66 minute ride, much of it on highways, from Sooke Town Centre to downtown Victoria, which compares to an estimated 45 minute drive by car. While Sooke and Sidney are both higher density communities, compared to the CVRD communities, the North and Central Saanich communities provide an indication of the transit ridership potential from more dispersed areas. Taken together, the experience of the remote suburban communities in the CRD suggests that the potential transit market shares for downtown work travel from the CVRD could be in the 24 to 37 percent range. Given the van pool experience, especially in Duncan, the potential could be toward the higher end of the range, so a best case figure of 35 percent was assumed in estimating the potential transit modal split for downtown oriented work trips.
5.4.4 Assuming very good transit connections between the five main commuter communities in the CVRD and downtown Victoria, and a potential transit market share of 35 percent of average daily commuter person trips to/from downtown, it is estimated that transit services, if introduced today, would serve approximately 137 outbound commute trips in the PM or 275 downtown oriented work trips per day.3.
5.4.5 Allowing for potential commute trips to other work destinations that would be served by the proposed bus routes, the total work related demand is estimated to be 330 per day (assuming other destinations would add approximately 20 percent more work trips).
5.4.6 The proposed bus services would attract some additional non-commuter trips for personal business and shopping, perhaps, so the benchmark estimate was increased by a further 10 percent, which suggests that the total two way bus demand could be as high as approximately 360 per day. These totals include current (and future) van pool customers who account for virtually all of the current non-auto commute trips from the study area to the CRD today.
3 This estimate assumes that 530 of the 700 commuters would be served, 85 percent work on a given week day and 71 percent would be traveling directly to and from work (and not need their personal vehicles to serve passengers, shop etc.).
Doc No Rev: Date: November 2006
41 Report_CTLBET_Final2.doc
6 Summary and Conclusions
6.1.1 The main objectives of this study are to develop long range forecasts for commuter rail and express bus use along the Malahat corridor and to determine the resulting impact on vehicular demand along this corridor.
6.1.2 Based on a preliminary assessment of corridor demand, the following four service options were defined for detailed ridership analysis:
Express Bus Option 1A – featuring two routes (A-Duncan and B-Shawnigan Lake), 40 minute peak period frequency, fares ranging from $3 to $7 ($7 between downtown Victoria and Duncan), travel time between Duncan and downtown Victoria at 84 minutes;
Express Bus Option 1B – the same as 1A except running at a 20 minute frequency during the peak periods;
Commuter Rail Option 2A – featuring 1 train per day per direction, fares between $2 and $16 ($11 between downtown Victoria and Duncan), travel time between Duncan and downtown Victoria at 82 minutes; and
Commuter Rail Option 2B – the same as 2A but running 3 trains per day per direction.
6.1.3 For comparison purposes, the current automobile travel time between downtown Victoria and Duncan is approximately 60 minutes and the vehicle operating costs are $9. Average daily parking charges in downtown Victoria are approximately $4, of which the cost would be equally divided between the morning and afternoon commute.
6.1.4 Current corridor demand was estimated using a combination of existing information and surveys conducted specifically for this study. A roadside classification survey was conducted over a four day period tracking passenger car occupancy and truck categories in both directions. During this same time, a northbound OD survey was conducted to obtain information on trip purpose and OD’s as well as to solicit participation in a follow-up stated preference survey. These surveys provided up-to-date information on corridor travel characteristics and served as the basis for assessing the ridership potential of express bus and commuter rail options.
6.1.5 In 2006, Annual Average Daily Traffic (AADT) on the Malahat Highway is estimated at 22,000, increasing in the summer by approximately 10 percent. During the summer, residents of the CVRD and the CRD account for approximately 73 percent of the weekday travel, with the remaining 27 percent made by non-residents (e.g. north Vancouver Island, rest of B.C., Canada and International). Work and business trips by residents account for approximately 30 percent of the total demand. During the fall, it is estimated that residents account for 83 percent of the weekday demand, while non-residents account for 17 percent. In the fall, work and business trips represent around 37 percent of the total demand.
6.1.6 Average summer weekday vehicle occupancy is estimated at between 1.7 and 1.8 persons per vehicle (dropping to between 1.6 and 1.7 in the fall). Automobiles account for approximately 94 percent of the total vehicular demand, with light and heavy trucks accounting for 6 percent.
6.1.7 A PM peak period demand forecasting model and a logit mode split model were developed for the study area based on the OD and SP survey data. These models were used to estimate
Doc No Rev: Date: November 2006
42 Report_CTLBET_Final2.doc
the ridership potential of the four service options in three time horizons (2006, 2016 and 2026). It is important to note that the ridership forecasts developed for this study focus on trips between the CRD and the CVRD. The proposed service options could also serve markets between the Langford area and Victoria which are not included in this assessment. However, while the additional ridership from Langford to Victoria may decrease the subsidies required to run the service, this increase in ridership will not affect traffic over the Malahat Highway, which is the focus of this study.
6.1.8 In 2006, the two express bus routes could expect to attract between 200 to 280 daily trips in total (depending on frequency), while the commuter rail service could capture between 160 and 220 per day. These ridership levels translate to less than 1 percent of the daily traffic on the Malahat Highway and make up approximately 4 percent of the PM peak period traffic.
6.1.9 In 2026, the express bus routes could generate between 260 and 360 daily trips and the commuter rail could generate 260 to 340 daily trips.
6.1.10 Based on a preliminary costing analysis, annual costs for the express bus options (capital and operating) are estimated at $0.77 to $1.54M in 2006 dollars. Fare revenues in 2006 could range between $0.31 and $0.44M. This translates to a cost per trip between $16 and $23 in 2006. Note that at the estimated demand levels, the frequencies that were examined would not appear to be justified. Therefore a lower frequency, lower cost service could be developed.
6.1.11 By 2026, express bus demand levels would appear to justify a 40 minute frequency and the cost per ride would be approximately $12.3 at this service level, resulting in subsidies of $6.1 per ride.
6.1.12 For the commuter rail options, annual total costs are estimated at $1.27 to $3.49M in 2006 dollars. Fare revenues in 2006 are estimated to range between $0.31 and $0.42M. This translates to a cost per trip of $33 to $66 in 2006. At the estimated demand level in 2006 it would appear that 1 train per day per direction could easily accommodate demand. By 2026, demand levels could still be accommodated with the 1 train configuration (possibly requiring the introduction of a third car). Cost per ride in 2026 for the 1 train option would be in the $20 range.
6.1.13 In summary, the key conclusions drawn from this study are:
The express bus and commuter rail service options tested do not appear to divert significant demand from the Malahat Highway (approximately 1 percent of daily demand and 4 percent of PM peak period demand).
Annual costs for both the bus and rail options are high – requiring annual subsidies close to $1 million for the commuter rail option and $0.5 million for the express bus option, assuming these services were introduced in 2006.
Vanpools appear to be a popular alternative for commuters in the region, and are an attractive alternative to commuter rail or coach bus service due to relatively low operating costs (for users) and greater flexibility of service. The existing van pool services also operate without direct subsidy.
6.1.14 Additional planning and detailed analysis would be required if further consideration is given to either the bus or the rail options.

Doc No Rev: Date: November 2006
Report_CTLBET_Final2.doc
APPENDIX A – Roadside Origin-Destination Survey
Doc No Rev: Date: November 2006
Report_CTLBET_Final2.doc
APPENDIX B – Stated Preference Survey
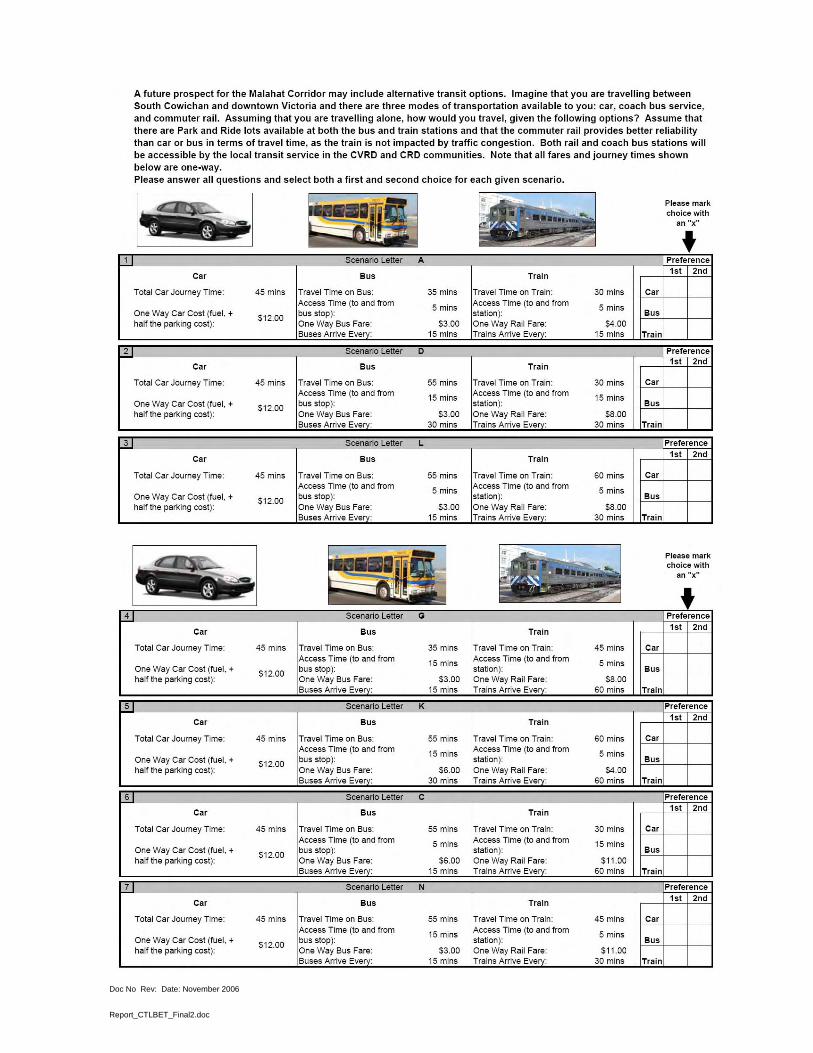
Doc No Rev: Date: November 2006
Report_CTLBET_Final2.doc
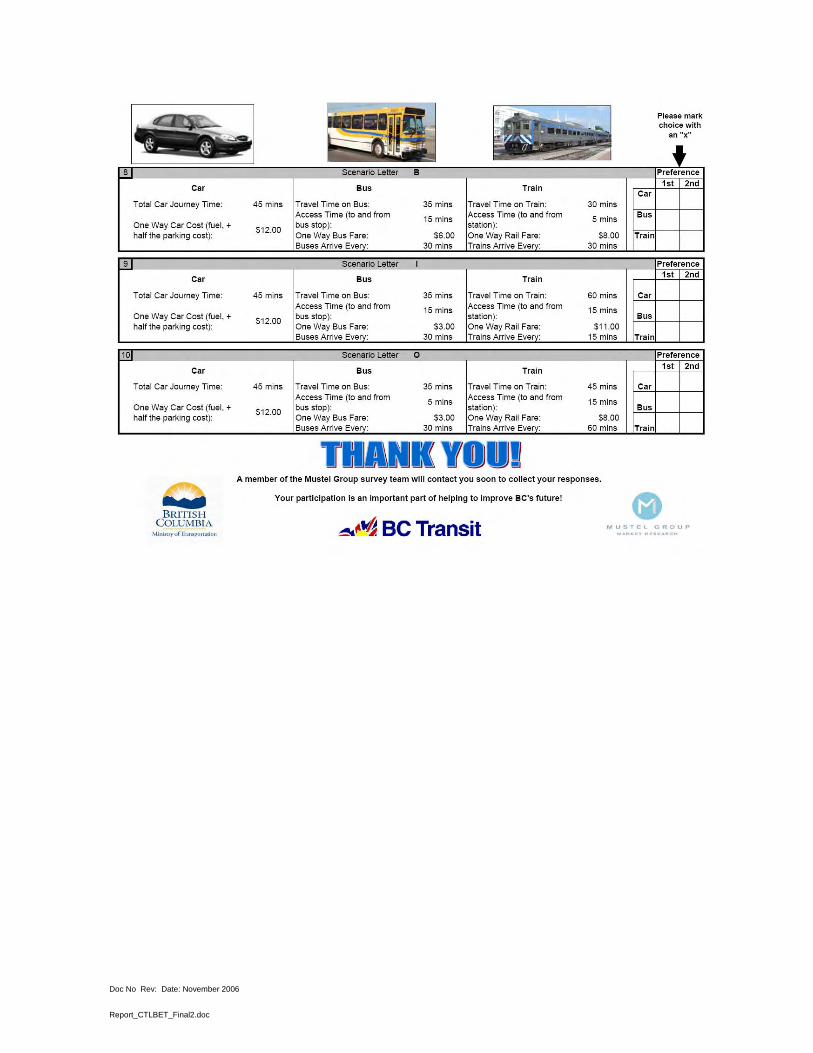
Doc No Rev: Date: November 2006
Report_CTLBET_Final2.doc

Doc No Rev: Date: November 2006
Report_CTLBET_Final2.doc
APPENDIX C – Vehicle Classification Definitions
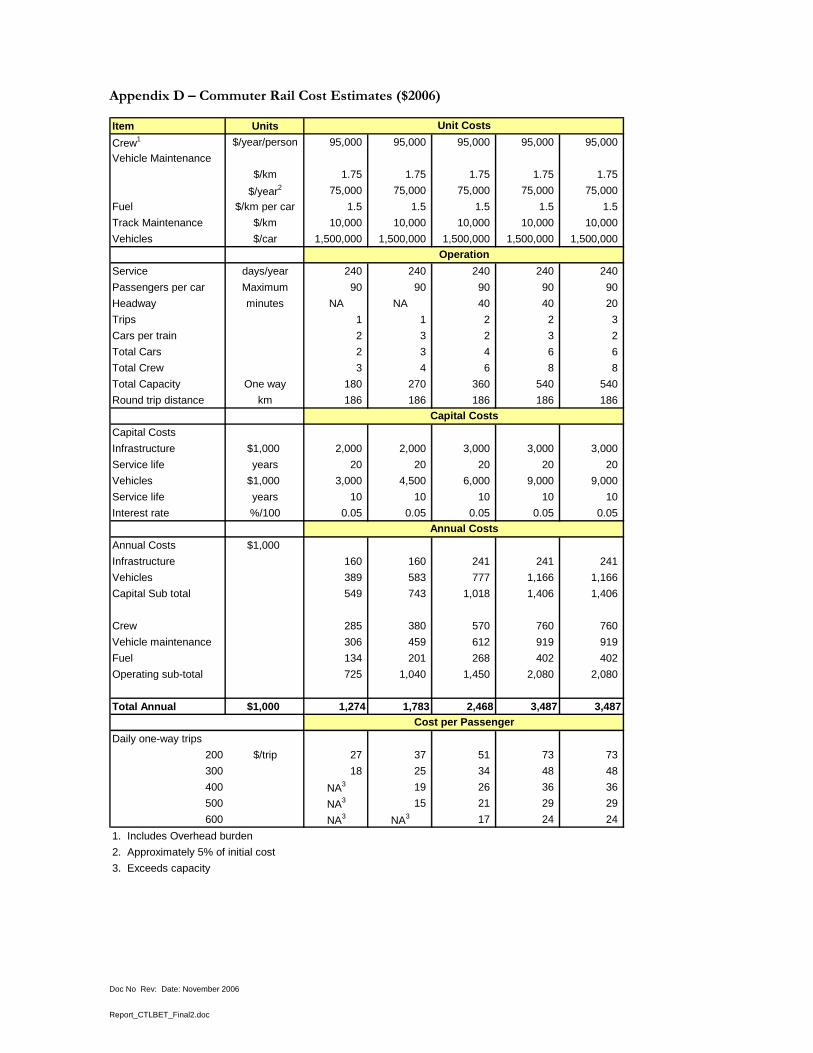
Doc No Rev: Date: November 2006
Report_CTLBET_Final2.doc
Appendix D – Commuter Rail Cost Estimates ($2006)
Item UnitsCrew1 $/year/person 95,000 95,000 95,000 95,000 95,000 Vehicle Maintenance
$/km 1.75 1.75 1.75 1.75 1.75 $/year2 75,000 75,000 75,000 75,000 75,000
Fuel $/km per car 1.5 1.5 1.5 1.5 1.5 Track Maintenance $/km 10,000 10,000 10,000 10,000 10,000 Vehicles $/car 1,500,000 1,500,000 1,500,000 1,500,000 1,500,000
Service days/year 240 240 240 240 240 Passengers per car Maximum 90 90 90 90 90 Headway minutes NA NA 40 40 20 Trips 1 1 2 2 3 Cars per train 2 3 2 3 2 Total Cars 2 3 4 6 6 Total Crew 3 4 6 8 8 Total Capacity One way 180 270 360 540 540 Round trip distance km 186 186 186 186 186
Capital CostsInfrastructure $1,000 2,000 2,000 3,000 3,000 3,000 Service life years 20 20 20 20 20 Vehicles $1,000 3,000 4,500 6,000 9,000 9,000 Service life years 10 10 10 10 10 Interest rate %/100 0.05 0.05 0.05 0.05 0.05
Annual Costs $1,000Infrastructure 160 160 241 241 241 Vehicles 389 583 777 1,166 1,166 Capital Sub total 549 743 1,018 1,406 1,406
Crew 285 380 570 760 760 Vehicle maintenance 306 459 612 919 919 Fuel 134 201 268 402 402 Operating sub-total 725 1,040 1,450 2,080 2,080
Total Annual $1,000 1,274 1,783 2,468 3,487 3,487
Daily one-way trips200 $/trip 27 37 51 73 73 300 18 25 34 48 48 400 NA3 19 26 36 36 500 NA3 15 21 29 29 600 NA3 NA3 17 24 24
1. Includes Overhead burden2. Approximately 5% of initial cost3. Exceeds capacity
Unit Costs
Operation
Capital Costs
Cost per Passenger
Annual Costs
Related Documents