APPENDIX H THE EFFECT OF WELD INDUCED RESIDUAL STRESSES ON PIPE CRACK OPENING AREAS AND IMPLICATIONS ON LEAK-BEFORE-BREAK CONSIDERATIONS

Welcome message from author
This document is posted to help you gain knowledge. Please leave a comment to let me know what you think about it! Share it to your friends and learn new things together.
Transcript
APPENDIX H
THE EFFECT OF WELD INDUCED RESIDUAL STRESSES ON PIPE CRACK OPENING AREAS AND IMPLICATIONS ON
LEAK-BEFORE-BREAK CONSIDERATIONS
H-1
As part of Task 9 of the BINP program the effect of weld residual stresses on the predicted crack-opening displacements (COD) used in Leak-Before-Break (LBB) analyses was investigated. The key findings from that effort are:
• Weld residual stresses tend to hold
circumferential cracks closed • Traditional crack opening displacement
equations over-predict crack opening displacements in areas with weld residual stresses
• Over-prediction of crack opening causes under-prediction of the postulated crack length for a prescribed leak rate
• Correction factors for traditional equations have been developed to model this effect for tension, bending, and combined loading
The details supporting these findings are documented in this appendix. The USNRC is anticipating updating their leak-before-break (LBB) procedures. One of the technical areas of concern in the existing procedures is the prediction of the crack-opening-displacements (COD) needed for estimating the postulated leakage crack size for a prescribed leakage detection capability. If cracks develop in the welded area of a pipe, as is often the case, residual stresses in the weld may cause the crack to be forced closed. Earlier studies have shown that pipe welding produces high residual stresses with a sharp stress gradient ranging from tension to compression through the thickness of the welded area of the pipe1. The current guidelines are inadequate to predict crack size based on leak rates for cracks in welded areas of pipes. The current guidelines rely on the calculation of the crack-opening-displacement as related to pipe loading. Values from the current guidelines are used to predict a crack’s cross sectional area and, in turn, to determine the severity of an
1 For very thick pipe, the residual stress state tends to be tension-compression-tension through the thickness.
existing crack by monitoring in-service leakage rates. The equations currently in use are applicable to service loaded pipe material only. Residual stresses caused by cold work, welding, etc. are neglected. This study uses two and three dimensional finite element models and weld residual stress calculation software developed at Battelle to develop correction factors to be used with the traditional crack-opening displacement equations. The correction factors will compensate for the effects of welding induced residual stresses on cracks in pipe welds. This study concentrates on type 316 stainless steel material properties, but the COD corrections should be equally applicable to all stainless steels, and also can be used for ferritic steels by a simple ratio correction of the room temperature yield strengths. However, this contention still needs to be verified. A test matrix of pipe radius, thickness, and crack size was used to develop the equation correction factors. Pipe wall thicknesses (t) of 7.5 mm (0.295 in.), 15 mm (0.590 in.), 22.5 mm (0.886 in.), and 30 mm (1.181 in.) were studied in pipes with mean radius to thickness ratios of 5, 10, and 20. Cracks with half-lengths in radians of π / 16, π / 8, π / 4, and π / 2 were introduced in these virtual pipes. The matrix of results was used to produce correction factors for crack opening displacement equations applicable to a broad range of pipe sizes. H.1 NOMENCLATURE A - Weld pass cross section area (in2) a - Half the cracks length in linear units
a = Rθ b - Half the pipe’s mean circumference b
= πR C1 - Non-dimensional function of a / b,
R / t, and t used to modify the slope of the GE/EPRI equation to predict crack opening displacements in weld created residual stress fields
E - Modulus of elasticity I - Weld current (amps) IID - Non-dimensional function of a / b,
R / t, and t used to calculate intercept
H-2
of the linear equation describing crack opening displacement on the inside diameter of the pipe
IOD - Non-dimensional function of a / b, R / t, and t used to calculate intercept of the linear equation describing crack opening displacement on the outside diameter of the pipe
M - Applied Moment P - Applied load q’ - Weld power input per volume
[(BTU/sec)/in3] R - Mean radius of the pipe in question t - Pipe wall thickness V - Weld voltage (volts) V1 - Non-dimensional function of a / b
and R / t used in GE/EPRI equation to predict crack opening displacements
δ - Total crack opening displacement at the center of a crack’s length
δID - Crack centerline displacement on the pipe inner diameter
δOD - Crack centerline displacement on the pipe outer diameter
η - Weld energy transfer efficiency σT
∞ - Applied nominal stress in tension = P / 2πRt
σB∞ - Applied nominal outer diameter
stress in bending on bending axis = MROD / I
σ∞Critical - Stress loading below which a crack
in a weld residual stress field will remain closed
∆t - ∆z / ν (sec) ν - Weld pass speed (in / sec) ∆z - Unit Depth (1 in) θ - Half the cracks length in radians H.2 INTRODUCTION The USNRC is anticipating updating their leak-before-break (LBB) procedures with the publication of a new Regulatory Guide and possibly a finalized version of the Standard Review Plan (SRP) section for LBB. The reason that the NRC is updating these procedures now is that most of the key research topics related to the subject of LBB technology have been addressed in past research programs or are being
addressed in ongoing research programs, such as the Battelle Integrity of Nuclear Piping (BINP) program. One of those topics is the issue of the effect of weld residual stresses on the crack-opening-displacement predictions used to estimate the size of the postulated leakage crack for a LBB analysis. Past studies have shown that weld residual stresses can cause the crack faces of a leaking through-wall crack to rotate causing the flow through the crack to be somewhat restricted. One of the tasks of the BINP program was to quantitatively assess this effect and to develop a means of accounting for this effect in the analysis. The purpose of this work was to develop correction factors, which account for the effects of weld residual stresses, for the currently used crack-opening-displacement (COD) estimation equations. One such equation is Equation H.1 which is the linear elastic crack opening displacement prediction equation developed by Kumar and German (Ref. H.1) which is known as the GE/EPRI equation for COD. (H.1) In this equation, δ is the total crack opening displacement, and V1 is a dimensionless function that is tabulated for both tension stress and bending stress. This equation is valid for service loading only, i.e., it does not account for the effects of residual stresses. It will be shown that residual stresses due to welding tend to set up an axial stress field that is in tension on the inner diameter of the pipe in the weld heat affected zone and in compression on the outer diameter of the welded area. This is true for all the pipe sizes examined except those with 30 mm (1.181 in.) thickness. The compression stresses on the outer diameter of the pipe tend to hold an existing through wall crack closed under zero load conditions, and the tension residual stresses on the inner diameter tend to hold the crack surfaces apart. The GE/EPRI equation predicts that a crack will open in a linear fashion starting at zero load. This is not the behavior, however, that would be expected from a crack in the weld area of a pipe.
),(41 t
RbaV
Ea⋅=
∞σδ
H-3
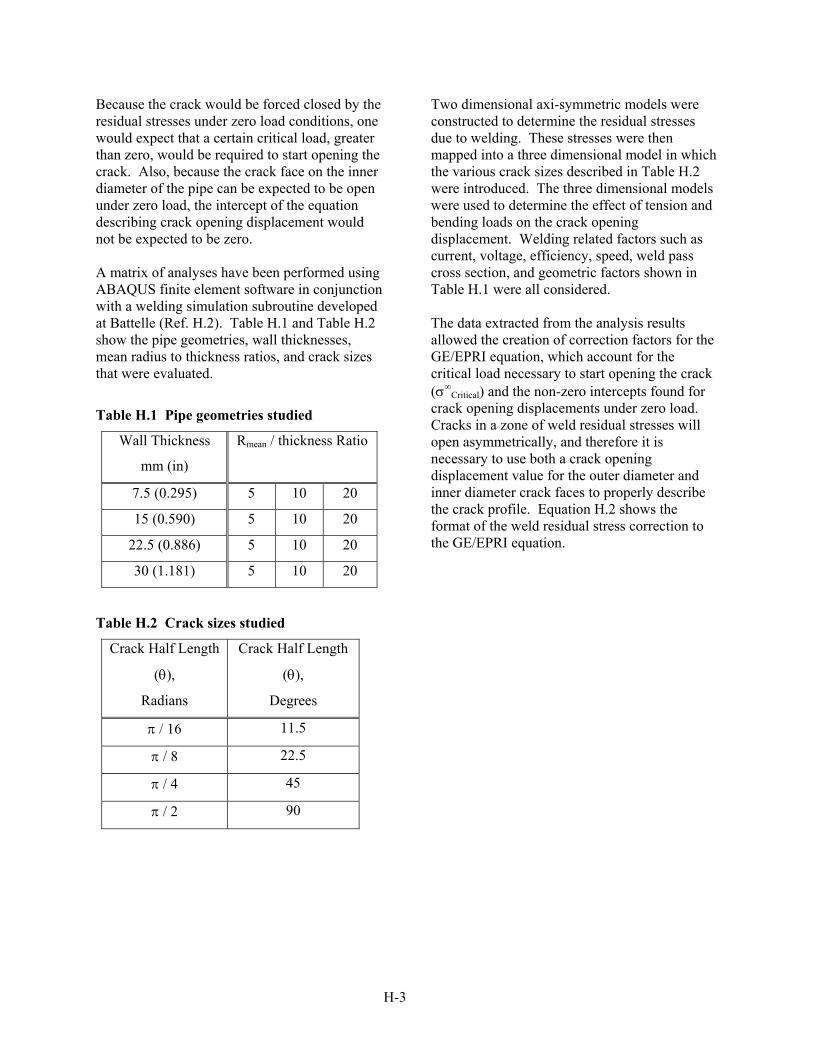
Because the crack would be forced closed by the residual stresses under zero load conditions, one would expect that a certain critical load, greater than zero, would be required to start opening the crack. Also, because the crack face on the inner diameter of the pipe can be expected to be open under zero load, the intercept of the equation describing crack opening displacement would not be expected to be zero. A matrix of analyses have been performed using ABAQUS finite element software in conjunction with a welding simulation subroutine developed at Battelle (Ref. H.2). Table H.1 and Table H.2 show the pipe geometries, wall thicknesses, mean radius to thickness ratios, and crack sizes that were evaluated.
Table H.1 Pipe geometries studied
Wall Thickness
mm (in)
Rmean / thickness Ratio
7.5 (0.295) 5 10 20
15 (0.590) 5 10 20
22.5 (0.886) 5 10 20
30 (1.181) 5 10 20
Table H.2 Crack sizes studied
Crack Half Length
(θ),
Radians
Crack Half Length
(θ),
Degrees
π / 16 11.5
π / 8 22.5
π / 4 45
π / 2 90
Two dimensional axi-symmetric models were constructed to determine the residual stresses due to welding. These stresses were then mapped into a three dimensional model in which the various crack sizes described in Table H.2 were introduced. The three dimensional models were used to determine the effect of tension and bending loads on the crack opening displacement. Welding related factors such as current, voltage, efficiency, speed, weld pass cross section, and geometric factors shown in Table H.1 were all considered. The data extracted from the analysis results allowed the creation of correction factors for the GE/EPRI equation, which account for the critical load necessary to start opening the crack (σ∞
Critical) and the non-zero intercepts found for crack opening displacements under zero load. Cracks in a zone of weld residual stresses will open asymmetrically, and therefore it is necessary to use both a crack opening displacement value for the outer diameter and inner diameter crack faces to properly describe the crack profile. Equation H.2 shows the format of the weld residual stress correction to the GE/EPRI equation.
H-4
IF: (H.2)
THEN:
IF:
THEN:
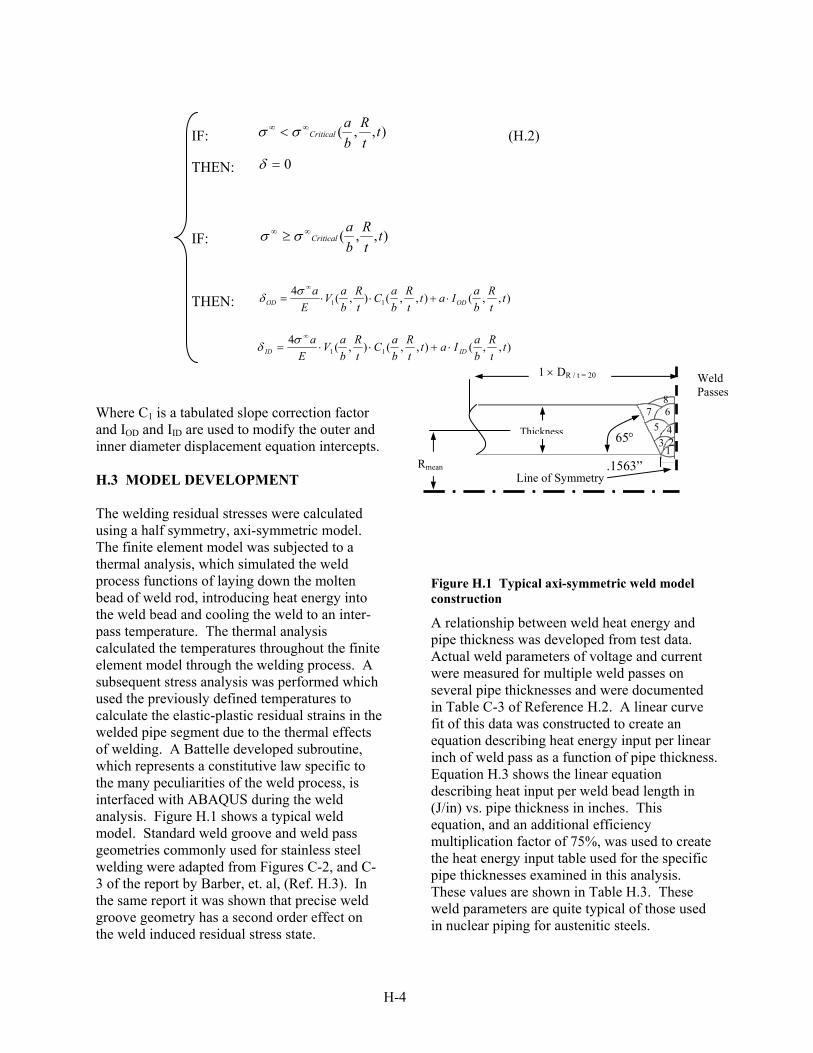
Where C1 is a tabulated slope correction factor and IOD and IID are used to modify the outer and inner diameter displacement equation intercepts. H.3 MODEL DEVELOPMENT The welding residual stresses were calculated using a half symmetry, axi-symmetric model. The finite element model was subjected to a thermal analysis, which simulated the weld process functions of laying down the molten bead of weld rod, introducing heat energy into the weld bead and cooling the weld to an inter-pass temperature. The thermal analysis calculated the temperatures throughout the finite element model through the welding process. A subsequent stress analysis was performed which used the previously defined temperatures to calculate the elastic-plastic residual strains in the welded pipe segment due to the thermal effects of welding. A Battelle developed subroutine, which represents a constitutive law specific to the many peculiarities of the weld process, is interfaced with ABAQUS during the weld analysis. Figure H.1 shows a typical weld model. Standard weld groove and weld pass geometries commonly used for stainless steel welding were adapted from Figures C-2, and C-3 of the report by Barber, et. al, (Ref. H.3). In the same report it was shown that precise weld groove geometry has a second order effect on the weld induced residual stress state.
Figure H.1 Typical axi-symmetric weld model construction
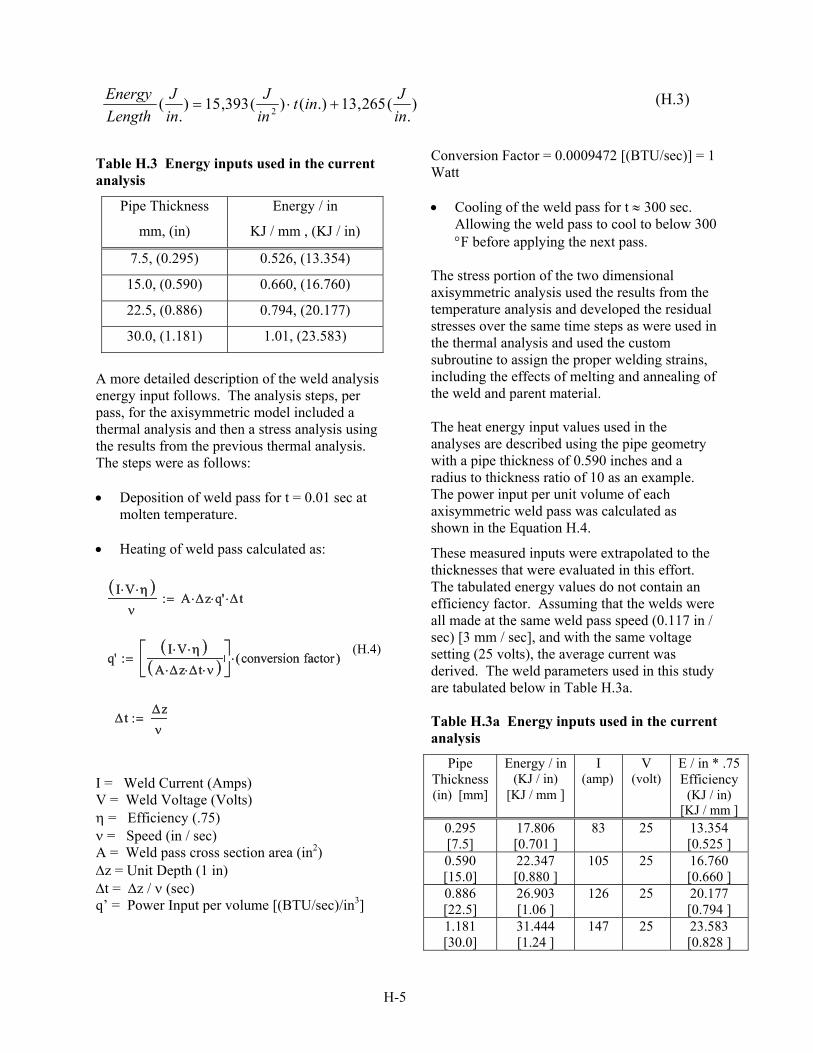
A relationship between weld heat energy and pipe thickness was developed from test data. Actual weld parameters of voltage and current were measured for multiple weld passes on several pipe thicknesses and were documented in Table C-3 of Reference H.2. A linear curve fit of this data was constructed to create an equation describing heat energy input per linear inch of weld pass as a function of pipe thickness. Equation H.3 shows the linear equation describing heat input per weld bead length in (J/in) vs. pipe thickness in inches. This equation, and an additional efficiency multiplication factor of 75%, was used to create the heat energy input table used for the specific pipe thicknesses examined in this analysis. These values are shown in Table H.3. These weld parameters are quite typical of those used in nuclear piping for austenitic steels.
Rmean
Thickness
Line of Symmetry
1 × DR / t = 20 Weld Passes
1
457
8
.1563”
65°
6
23
0=δ
),,( ttR
ba
Critical∞∞ < σσ
),,( ttR
ba
Critical∞∞ ≥ σσ
),,(),,(),(411 t
tR
baIat
tR
baC
tR
baV
Ea
ODOD ⋅+⋅⋅=∞σδ
),,(),,(),(411 t
tR
baIat
tR
baC
tR
baV
Ea
IDID ⋅+⋅⋅=∞σδ
H-5
Table H.3 Energy inputs used in the current analysis
Pipe Thickness
mm, (in)
Energy / in
KJ / mm , (KJ / in)
7.5, (0.295) 0.526, (13.354)
15.0, (0.590) 0.660, (16.760)
22.5, (0.886) 0.794, (20.177)
30.0, (1.181) 1.01, (23.583)
A more detailed description of the weld analysis energy input follows. The analysis steps, per pass, for the axisymmetric model included a thermal analysis and then a stress analysis using the results from the previous thermal analysis. The steps were as follows: • Deposition of weld pass for t = 0.01 sec at
molten temperature. • Heating of weld pass calculated as:
(H.4)
I = Weld Current (Amps) V = Weld Voltage (Volts) η = Efficiency (.75) ν = Speed (in / sec) A = Weld pass cross section area (in2) ∆z = Unit Depth (1 in) ∆t = ∆z / ν (sec) q’ = Power Input per volume [(BTU/sec)/in3]
Conversion Factor = 0.0009472 [(BTU/sec)] = 1 Watt • Cooling of the weld pass for t ≈ 300 sec.
Allowing the weld pass to cool to below 300 °F before applying the next pass.
The stress portion of the two dimensional axisymmetric analysis used the results from the temperature analysis and developed the residual stresses over the same time steps as were used in the thermal analysis and used the custom subroutine to assign the proper welding strains, including the effects of melting and annealing of the weld and parent material. The heat energy input values used in the analyses are described using the pipe geometry with a pipe thickness of 0.590 inches and a radius to thickness ratio of 10 as an example. The power input per unit volume of each axisymmetric weld pass was calculated as shown in the Equation H.4. These measured inputs were extrapolated to the thicknesses that were evaluated in this effort. The tabulated energy values do not contain an efficiency factor. Assuming that the welds were all made at the same weld pass speed (0.117 in / sec) [3 mm / sec], and with the same voltage setting (25 volts), the average current was derived. The weld parameters used in this study are tabulated below in Table H.3a. Table H.3a Energy inputs used in the current analysis
Pipe Thickness (in) [mm]
Energy / in (KJ / in)
[KJ / mm ]
I (amp)
V (volt)
E / in * .75 Efficiency
(KJ / in) [KJ / mm ]
0.295 [7.5]
17.806 [0.701 ]
83 25 13.354 [0.525 ]
0.590 [15.0]
22.347 [0.880 ]
105 25 16.760 [0.660 ]
0.886 [22.5]
26.903 [1.06 ]
126 25 20.177 [0.794 ]
1.181 [30.0]
31.444 [1.24 ]
147 25 23.583 [0.828 ]
).
(265,13.)()(393,15).
( 2 inJint
inJ
inJ
LengthEnergy
+⋅= (H.3)
I V⋅ η⋅( )ν
A ∆z⋅ q'⋅ ∆ t⋅:=I V⋅ η⋅( )ν
A ∆z⋅ q'⋅ ∆ t⋅:=
q'I V⋅ η⋅( )
A ∆z⋅ ∆ t⋅ ν⋅( )⎡⎢⎣
⎤⎥⎦
conversion factor( )⋅:=q'I V⋅ η⋅( )
A ∆z⋅ ∆ t⋅ ν⋅( )⎡⎢⎣
⎤⎥⎦
conversion factor( )⋅:=
∆ t∆zν
:=∆ t∆zν
:=
H-6
For example, the following values were used for the 0.590 inch thick pipe: I = 105 Amps V = 25 Volts η = .75 ν = 0.117 in / sec A = Weld pass cross section area (in2) ∆z = 1 in ∆t = 8.547 sec q’ = Power Input per volume [(BTU/sec)/in3] Conversion Factor = 0.0009472 [(BTU/sec)] = 1 Watt
q’ = 1.865 / A
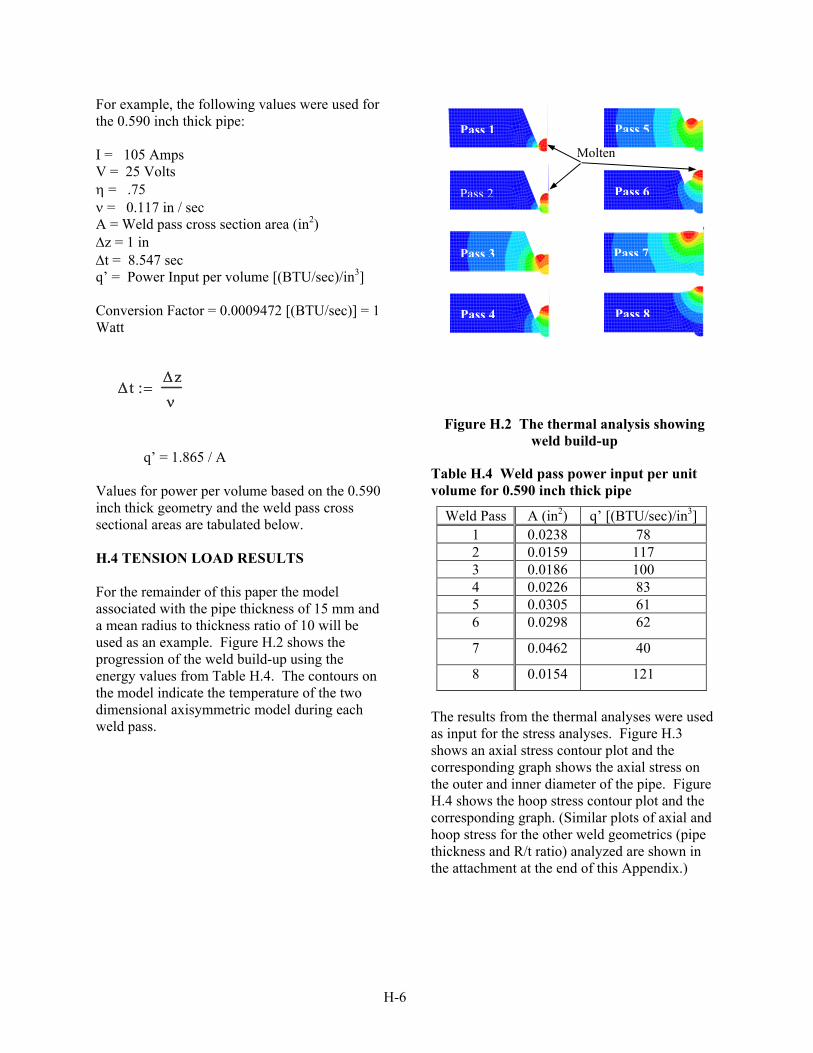
Values for power per volume based on the 0.590 inch thick geometry and the weld pass cross sectional areas are tabulated below. H.4 TENSION LOAD RESULTS For the remainder of this paper the model associated with the pipe thickness of 15 mm and a mean radius to thickness ratio of 10 will be used as an example. Figure H.2 shows the progression of the weld build-up using the energy values from Table H.4. The contours on the model indicate the temperature of the two dimensional axisymmetric model during each weld pass.
Figure H.2 The thermal analysis showing weld build-up
Table H.4 Weld pass power input per unit volume for 0.590 inch thick pipe
Weld Pass A (in2) q’ [(BTU/sec)/in3] 1 0.0238 78 2 0.0159 117 3 0.0186 100 4 0.0226 83 5 0.0305 61 6 0.0298 62
7 0.0462 40
8 0.0154 121
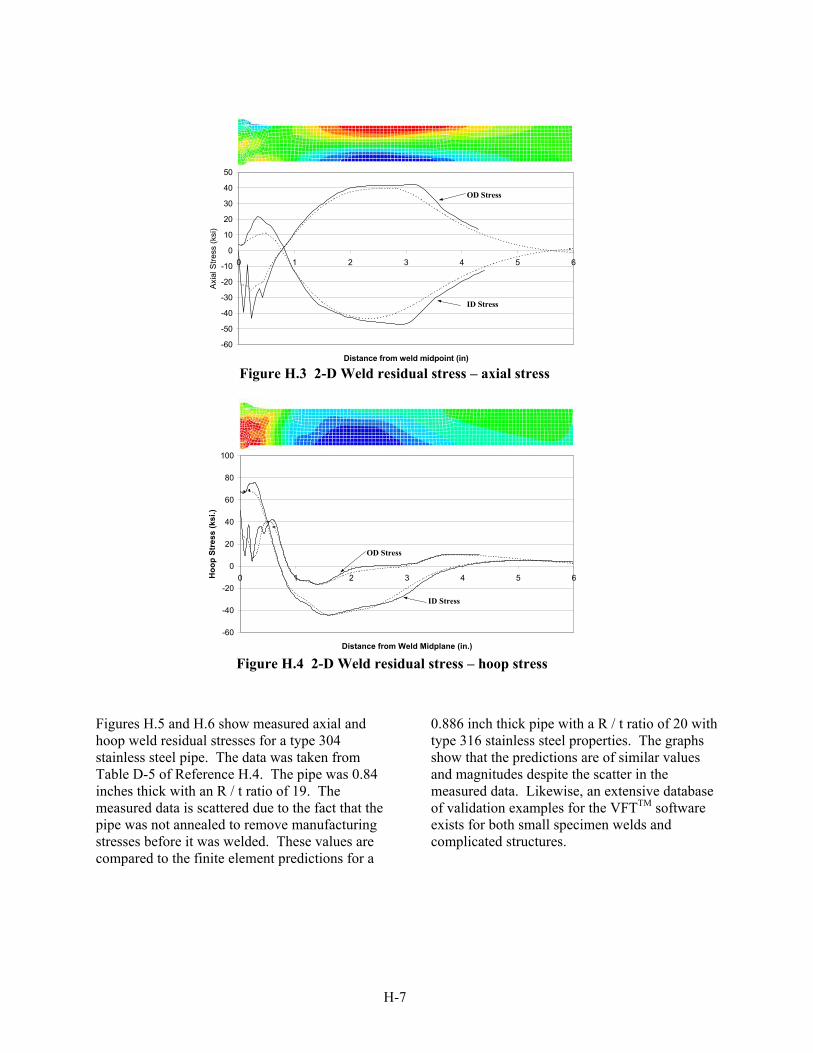
The results from the thermal analyses were used as input for the stress analyses. Figure H.3 shows an axial stress contour plot and the corresponding graph shows the axial stress on the outer and inner diameter of the pipe. Figure H.4 shows the hoop stress contour plot and the corresponding graph. (Similar plots of axial and hoop stress for the other weld geometrics (pipe thickness and R/t ratio) analyzed are shown in the attachment at the end of this Appendix.)
∆ t∆zν
:=∆ t∆zν
:=
Pass 1
Pass 2
Pass 3
Pass 4 Pass 8
Pass 5
Pass 7
Pass 6
Molten
H-7
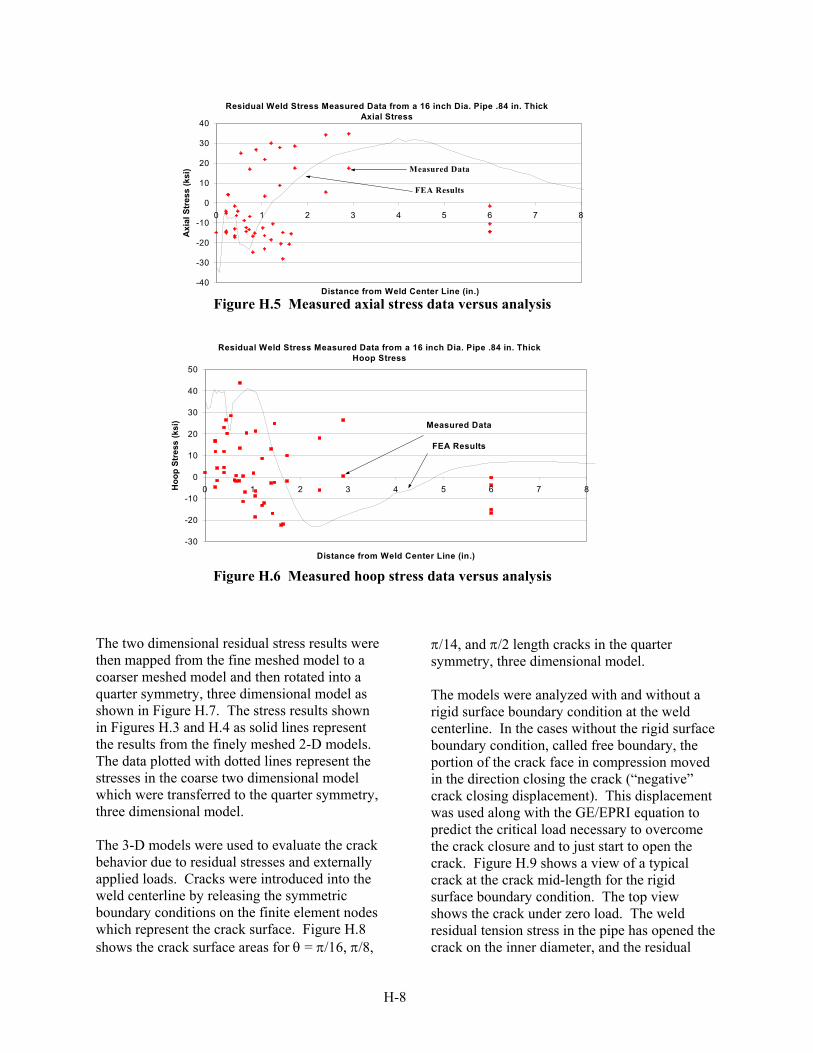
Figures H.5 and H.6 show measured axial and hoop weld residual stresses for a type 304 stainless steel pipe. The data was taken from Table D-5 of Reference H.4. The pipe was 0.84 inches thick with an R / t ratio of 19. The measured data is scattered due to the fact that the pipe was not annealed to remove manufacturing stresses before it was welded. These values are compared to the finite element predictions for a
0.886 inch thick pipe with a R / t ratio of 20 with type 316 stainless steel properties. The graphs show that the predictions are of similar values and magnitudes despite the scatter in the measured data. Likewise, an extensive database of validation examples for the VFTTM software exists for both small specimen welds and complicated structures.
-60
-50
-40
-30
-20
-10
0
10
20
30
40
50
0 1 2 3 4 5 6
Distance from weld midpoint (in)
Axia
l Stre
ss (k
si)
ID Stress
OD Stress
Figure H.3 2-D Weld residual stress – axial stress
-60
-40
-20
0
20
40
60
80
100
0 1 2 3 4 5 6
Distance from Weld Midplane (in.)
Hoo
p St
ress
(ksi
.)
ID Stress
OD Stress
Figure H.4 2-D Weld residual stress – hoop stress
H-8
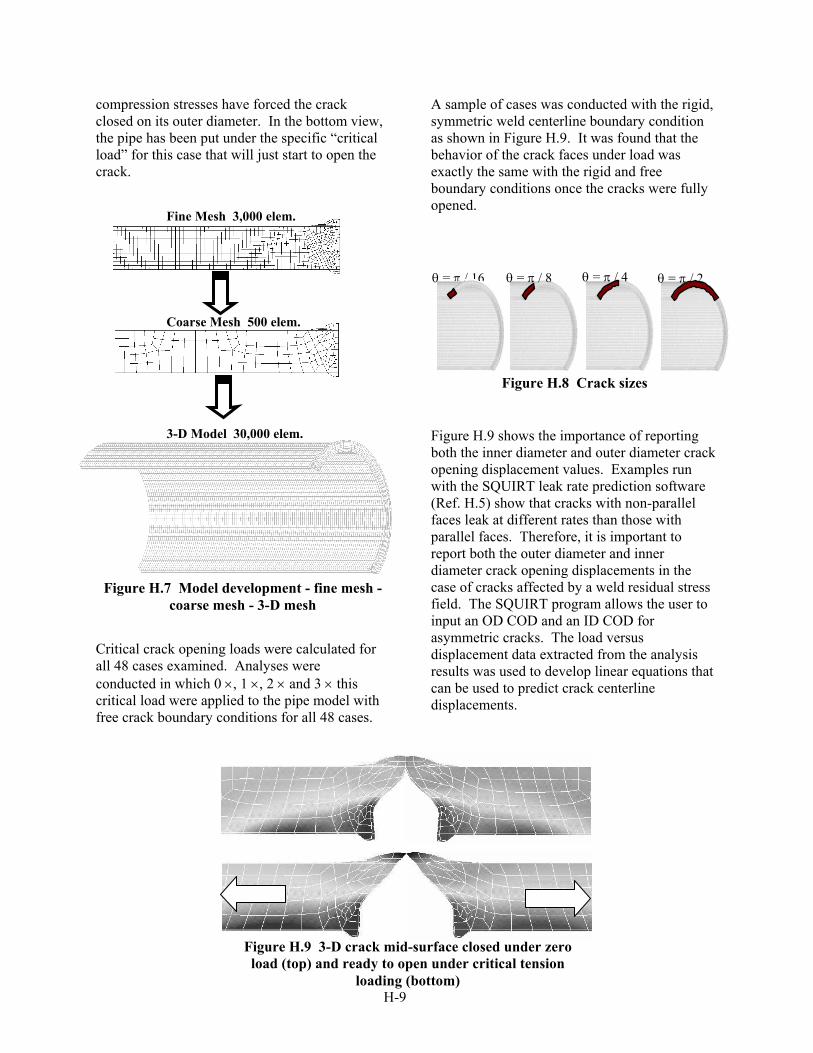
The two dimensional residual stress results were then mapped from the fine meshed model to a coarser meshed model and then rotated into a quarter symmetry, three dimensional model as shown in Figure H.7. The stress results shown in Figures H.3 and H.4 as solid lines represent the results from the finely meshed 2-D models. The data plotted with dotted lines represent the stresses in the coarse two dimensional model which were transferred to the quarter symmetry, three dimensional model. The 3-D models were used to evaluate the crack behavior due to residual stresses and externally applied loads. Cracks were introduced into the weld centerline by releasing the symmetric boundary conditions on the finite element nodes which represent the crack surface. Figure H.8 shows the crack surface areas for θ = π/16, π/8,
π/14, and π/2 length cracks in the quarter symmetry, three dimensional model. The models were analyzed with and without a rigid surface boundary condition at the weld centerline. In the cases without the rigid surface boundary condition, called free boundary, the portion of the crack face in compression moved in the direction closing the crack (“negative” crack closing displacement). This displacement was used along with the GE/EPRI equation to predict the critical load necessary to overcome the crack closure and to just start to open the crack. Figure H.9 shows a view of a typical crack at the crack mid-length for the rigid surface boundary condition. The top view shows the crack under zero load. The weld residual tension stress in the pipe has opened the crack on the inner diameter, and the residual
Residual Weld Stress Measured Data from a 16 inch Dia. Pipe .84 in. ThickAxial Stress
-40
-30
-20
-10
0
10
20
30
40
0 1 2 3 4 5 6 7 8
Distance from Weld Center Line (in.)
Axi
al S
tres
s (k
si) Measured Data
FEA Results
Figure H.5 Measured axial stress data versus analysis
Residual Weld Stress Measured Data from a 16 inch Dia. Pipe .84 in. ThickHoop Stress
-30
-20
-10
0
10
20
30
40
50
0 1 2 3 4 5 6 7 8
Distance from Weld Center Line (in.)
Hoo
p St
ress
(ksi
) Measured Data
FEA Results
Figure H.6 Measured hoop stress data versus analysis
H-9
compression stresses have forced the crack closed on its outer diameter. In the bottom view, the pipe has been put under the specific “critical load” for this case that will just start to open the crack.
Critical crack opening loads were calculated for all 48 cases examined. Analyses were conducted in which 0 ×, 1 ×, 2 × and 3 × this critical load were applied to the pipe model with free crack boundary conditions for all 48 cases.
A sample of cases was conducted with the rigid, symmetric weld centerline boundary condition as shown in Figure H.9. It was found that the behavior of the crack faces under load was exactly the same with the rigid and free boundary conditions once the cracks were fully opened.
Figure H.9 shows the importance of reporting both the inner diameter and outer diameter crack opening displacement values. Examples run with the SQUIRT leak rate prediction software (Ref. H.5) show that cracks with non-parallel faces leak at different rates than those with parallel faces. Therefore, it is important to report both the outer diameter and inner diameter crack opening displacements in the case of cracks affected by a weld residual stress field. The SQUIRT program allows the user to input an OD COD and an ID COD for asymmetric cracks. The load versus displacement data extracted from the analysis results was used to develop linear equations that can be used to predict crack centerline displacements.
Fine Mesh 3,000 elem.
Coarse Mesh 500 elem.
3-D Model 30,000 elem.
Figure H.7 Model development - fine mesh - coarse mesh - 3-D mesh
θ = π / 16 θ = π / 8 θ = π / 4 θ = π / 2
Figure H.8 Crack sizes
Figure H.9 3-D crack mid-surface closed under zero load (top) and ready to open under critical tension
loading (bottom)
H-10
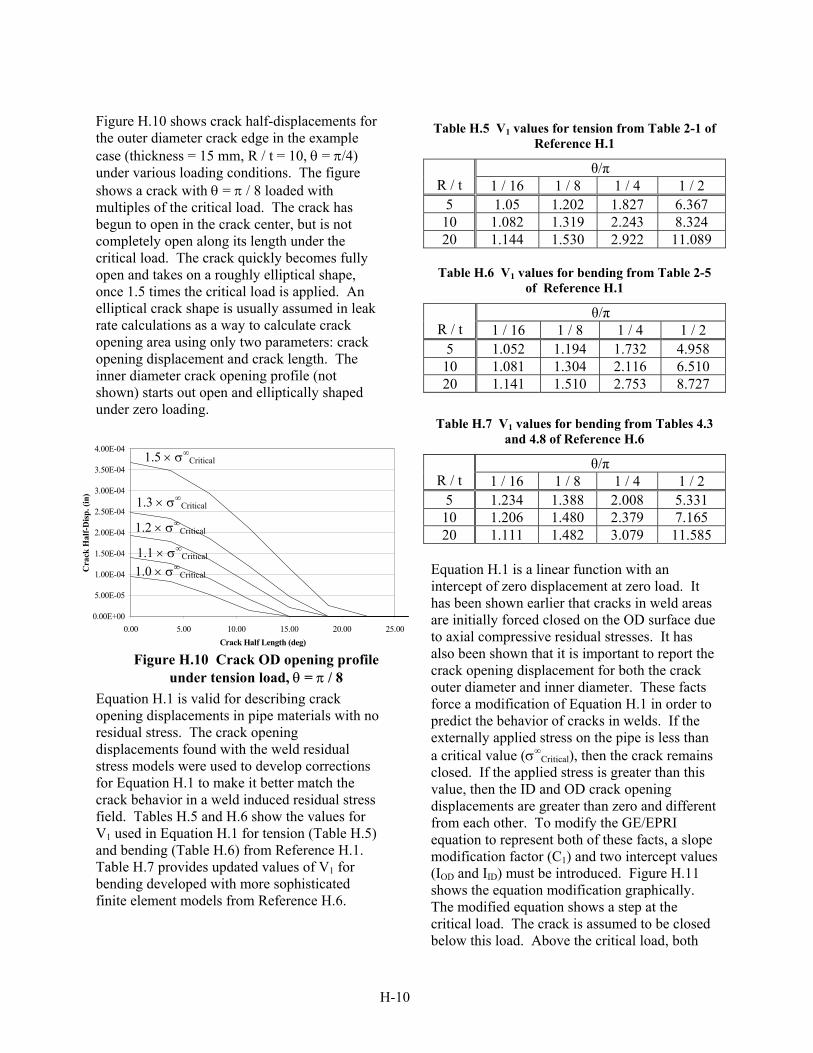
Figure H.10 shows crack half-displacements for the outer diameter crack edge in the example case (thickness = 15 mm, R / t = 10, θ = π/4) under various loading conditions. The figure shows a crack with θ = π / 8 loaded with multiples of the critical load. The crack has begun to open in the crack center, but is not completely open along its length under the critical load. The crack quickly becomes fully open and takes on a roughly elliptical shape, once 1.5 times the critical load is applied. An elliptical crack shape is usually assumed in leak rate calculations as a way to calculate crack opening area using only two parameters: crack opening displacement and crack length. The inner diameter crack opening profile (not shown) starts out open and elliptically shaped under zero loading.
Equation H.1 is valid for describing crack opening displacements in pipe materials with no residual stress. The crack opening displacements found with the weld residual stress models were used to develop corrections for Equation H.1 to make it better match the crack behavior in a weld induced residual stress field. Tables H.5 and H.6 show the values for V1 used in Equation H.1 for tension (Table H.5) and bending (Table H.6) from Reference H.1. Table H.7 provides updated values of V1 for bending developed with more sophisticated finite element models from Reference H.6.
Table H.5 V1 values for tension from Table 2-1 of Reference H.1
θ/π R / t 1 / 16 1 / 8 1 / 4 1 / 2
5 1.05 1.202 1.827 6.367 10 1.082 1.319 2.243 8.324 20 1.144 1.530 2.922 11.089
Table H.6 V1 values for bending from Table 2-5
of Reference H.1
θ/π R / t 1 / 16 1 / 8 1 / 4 1 / 2
5 1.052 1.194 1.732 4.958 10 1.081 1.304 2.116 6.510 20 1.141 1.510 2.753 8.727
Table H.7 V1 values for bending from Tables 4.3 and 4.8 of Reference H.6
θ/π R / t 1 / 16 1 / 8 1 / 4 1 / 2
5 1.234 1.388 2.008 5.331 10 1.206 1.480 2.379 7.165 20 1.111 1.482 3.079 11.585
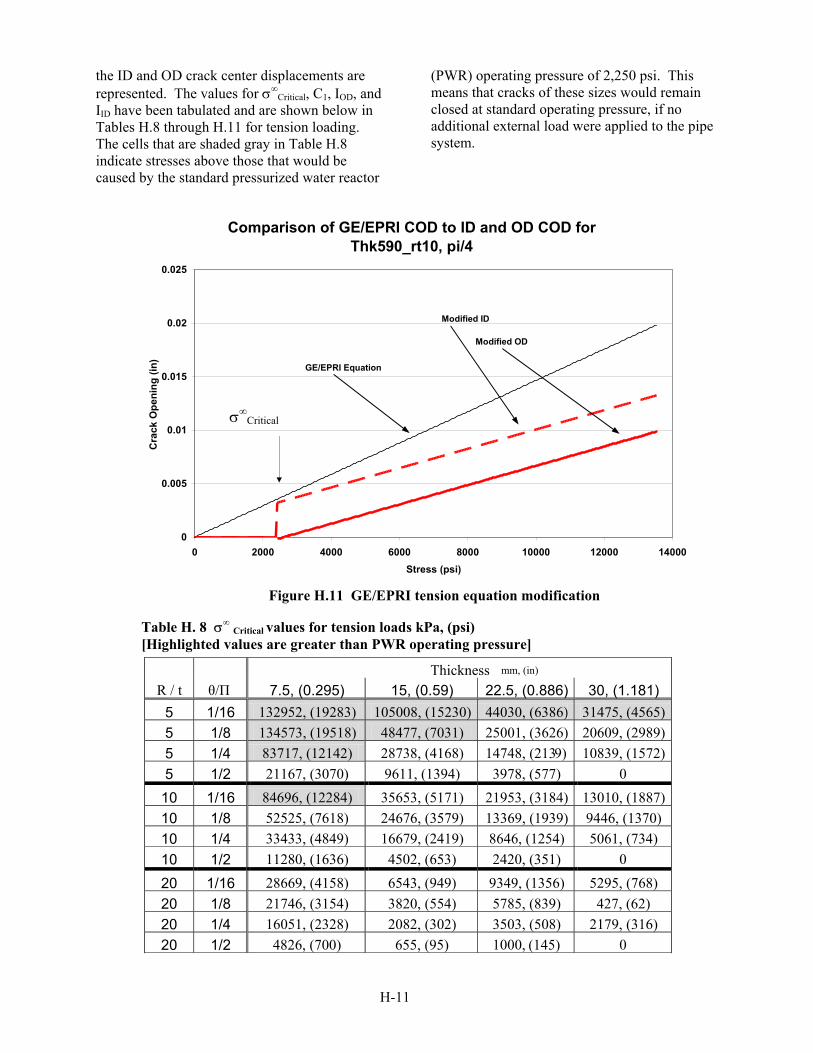
Equation H.1 is a linear function with an intercept of zero displacement at zero load. It has been shown earlier that cracks in weld areas are initially forced closed on the OD surface due to axial compressive residual stresses. It has also been shown that it is important to report the crack opening displacement for both the crack outer diameter and inner diameter. These facts force a modification of Equation H.1 in order to predict the behavior of cracks in welds. If the externally applied stress on the pipe is less than a critical value (σ∞
Critical), then the crack remains closed. If the applied stress is greater than this value, then the ID and OD crack opening displacements are greater than zero and different from each other. To modify the GE/EPRI equation to represent both of these facts, a slope modification factor (C1) and two intercept values (IOD and IID) must be introduced. Figure H.11 shows the equation modification graphically. The modified equation shows a step at the critical load. The crack is assumed to be closed below this load. Above the critical load, both
0.00E+00
5.00E-05
1.00E-04
1.50E-04
2.00E-04
2.50E-04
3.00E-04
3.50E-04
4.00E-04
0.00 5.00 10.00 15.00 20.00 25.00Crack Half Length (deg)
Cra
ck H
alf-
Dis
p. (i
n)
1.0 × σ∞Critical
1.1 × σ∞Critical
1.2 × σ∞Critical
1.3 × σ∞Critical
1.5 × σ∞Critical
Figure H.10 Crack OD opening profile under tension load, θ = π / 8
H-11
the ID and OD crack center displacements are represented. The values for σ∞
Critical, C1, IOD, and IID have been tabulated and are shown below in Tables H.8 through H.11 for tension loading. The cells that are shaded gray in Table H.8 indicate stresses above those that would be caused by the standard pressurized water reactor
(PWR) operating pressure of 2,250 psi. This means that cracks of these sizes would remain closed at standard operating pressure, if no additional external load were applied to the pipe system.
Comparison of GE/EPRI COD to ID and OD COD for Thk590_rt10, pi/4
0
0.005
0.01
0.015
0.02
0.025
0 2000 4000 6000 8000 10000 12000 14000Stress (psi)
Cra
ck O
peni
ng (i
n)
GE/EPRI Equation
Modified ID
Modified OD
σ∞Critical
Figure H.11 GE/EPRI tension equation modification
ThicknessR / t θ/Π 7.5, (0.295) 15, (0.59) 22.5, (0.886) 30, (1.181)
5 1/16 132952, (19283) 105008, (15230) 44030, (6386) 31475, (4565)5 1/8 134573, (19518) 48477, (7031) 25001, (3626) 20609, (2989)5 1/4 83717, (12142) 28738, (4168) 14748, (2139) 10839, (1572)5 1/2 21167, (3070) 9611, (1394) 3978, (577) 0
10 1/16 84696, (12284) 35653, (5171) 21953, (3184) 13010, (1887)10 1/8 52525, (7618) 24676, (3579) 13369, (1939) 9446, (1370)10 1/4 33433, (4849) 16679, (2419) 8646, (1254) 5061, (734)10 1/2 11280, (1636) 4502, (653) 2420, (351) 0
20 1/16 28669, (4158) 6543, (949) 9349, (1356) 5295, (768)20 1/8 21746, (3154) 3820, (554) 5785, (839) 427, (62) 20 1/4 16051, (2328) 2082, (302) 3503, (508) 2179, (316)20 1/2 4826, (700) 655, (95) 1000, (145) 0
Table H. 8 σ∞ Critical values for tension loads kPa, (psi) [Highlighted values are greater than PWR operating pressure]
mm, (in)
H-12
Table H.9 C1 values for tension (CT)
Table H.10 IOD values
Thickness, mm (inch) 7.5 (0.295) 15 (0.59) 22.5 (0.886) 30 (1.181)
R/t θ/π IOD
5 1/16 -0.00256 -0.00240 -0.00074 0.00038 5 1/8 -0.00288 -0.00119 -0.00053 0.00049 5 1/4 -0.00271 -0.00086 -0.00040 0.00050 5 1/2 -0.00295 -0.00112 -0.00042 0.00055
10 1/16 -0.00172 -0.00060 -0.00037 0.00019 10 1/8 -0.00132 -0.00055 -0.00028 0.00026 10 1/4 -0.00103 -0.00051 -0.00024 0.00027 10 1/2 -0.00147 -0.00058 -0.00028 0.00033 20 1/16 -0.00051 -0.00022 -0.00016 0.00009 20 1/8 -0.00051 -0.00021 -0.00012 0.00012 20 1/4 -0.00055 -0.00019 -0.00010 0.00014 20 1/2 -0.00086 -0.00024 -0.00013 0.00021
Thickness, mm (inch) 7.5 (0.295) 15 (0.59) 22.5 (0.886) 30 (1.181)
R/t θ/π IOD
5 1/16 0.869 1.007 0.789 0.813 5 1/8 0.906 0.959 0.861 0.899 5 1/4 0.731 0.744 0.722 0.726 5 1/2 0.852 0.862 0.827 0.868
10 1/16 0.883 0.769 0.806 0.817 10 1/8 0.918 0.825 0.803 0.847 10 1/4 0.650 0.651 0.617 0.661 10 1/2 0.762 0.758 0.709 0.767 20 1/16 0.786 1.517 0.769 0.801 20 1/8 0.766 1.795 0.720 0.765 20 1/4 0.572 1.526 0.515 0.587 20 1/2 0.806 1.524 0.638 0.810
H-13
Table H.11 IID values
Thickness, mm (inch) 7.5 (0.295) 15 (0.59) 22.5 (0.886) 30 (1.186)
R/t θ/π IID
5 1/16 0.00214 0.00016 0.00028 -0.00050 5 1/8 0.00207 0.00082 0.00039 -0.00038 5 1/4 0.00139 0.00073 0.00027 -0.00025 5 1/2 -0.00012 -0.00001 0.00001 0.00004
10 1/16 0.00071 0.00019 0.00020 -0.00022 10 1/8 0.00082 0.00029 0.00026 -0.00019 10 1/4 0.00076 0.00022 0.00018 -0.00013 10 1/2 -0.00014 -0.00004 0.00001 0.00002 20 1/16 0.00033 0.00004 0.00007 -0.00009 20 1/8 0.00038 0.00008 0.00009 -0.00009 20 1/4 0.00028 0.00007 0.00007 -0.00007 20 1/2 -0.00017 -0.00003 -0.00001 0.00004
H.5 TENSION LOAD EXAMPLE An example will help illustrate the use of Equation H.2 and the significant difference in crack opening displacement from the results found with Equation H.1. The pipe size that has been used for illustration purposes throughout the paper will be used again here. The pipe is 15 mm (0.59 in.) thick and has a mean radius to thickness ratio of 10. The internal pressure is standard operating pressure for a PWR of 15.5 MPa (2,250 psi.). Crack half-length is θ = π / 4. The pipe is made from type 316 stainless steel with a Modulus of Elasticity of: E = 206,840 MPa (30 × 106 psi). The first step is to check to see if the loads on the pipe exceed σ∞Critical. The calculated nominal stress on the pipe produced from only the internal pressure is 70 MPa (10.15 ksi). Looking at Table H.8, one finds that the critical stress for this instance is 16.7 MPa (2,419 psi.). The applied pressure is well above this limit, so the crack will be open. The second step is to calculate the coefficient for Equation H.2. The crack half length (a) is equal to Rθ = 118 mm (4.634 in.). The coefficient of the equation 4aσ∞ / E = 0.159 mm (0.0063 in.).
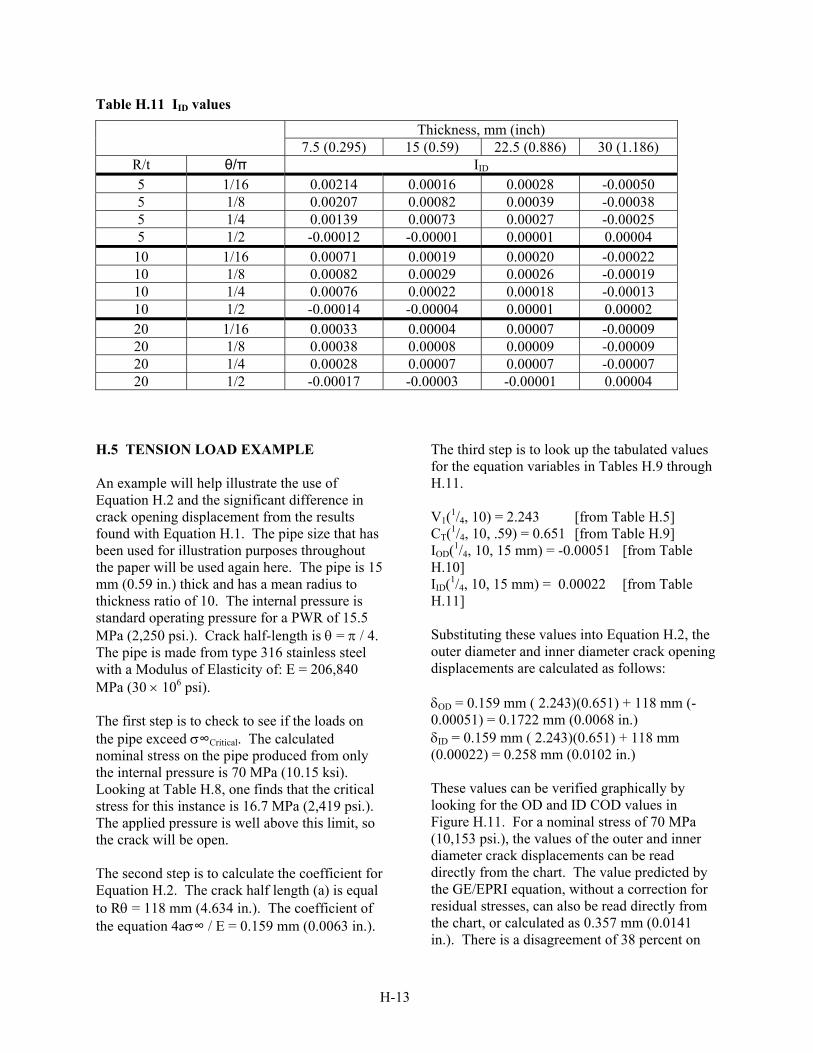
The third step is to look up the tabulated values for the equation variables in Tables H.9 through H.11. V1(1/4, 10) = 2.243 [from Table H.5] CT(1/4, 10, .59) = 0.651 [from Table H.9] IOD(1/4, 10, 15 mm) = -0.00051 [from Table H.10] IID(1/4, 10, 15 mm) = 0.00022 [from Table H.11] Substituting these values into Equation H.2, the outer diameter and inner diameter crack opening displacements are calculated as follows: δOD = 0.159 mm ( 2.243)(0.651) + 118 mm (-0.00051) = 0.1722 mm (0.0068 in.) δID = 0.159 mm ( 2.243)(0.651) + 118 mm (0.00022) = 0.258 mm (0.0102 in.)
These values can be verified graphically by looking for the OD and ID COD values in Figure H.11. For a nominal stress of 70 MPa (10,153 psi.), the values of the outer and inner diameter crack displacements can be read directly from the chart. The value predicted by the GE/EPRI equation, without a correction for residual stresses, can also be read directly from the chart, or calculated as 0.357 mm (0.0141 in.). There is a disagreement of 38 percent on
H-14
the inner diameter displacement and 107 percent on the outer diameter crack opening displacement. When these weld residual stress corrected COD values were used in the SQUIRT leak-rate code analysis of the example test case, the predicted leak rate for the half crack length of 118 mm (4.634 inches) was 33 lpm (8.74 gpm). When the uncorrected values from the GE/EPRI equations were used for this same test case, the predicted leak rate was 66 lpm (17.5 gpm), a factor of two greater. What this implies is that the predicted size of the postulated leaking through-wall crack for an LBB analysis is going to be much shorter if one does not account for the effect of the weld residual stresses on the COD values. If the crack size is proportional to the leak rate, then in this example case, the leakage crack, accounting for residual stresses, may be twice as long as the leakage crack, when one does not account for residual stresses, assuming the same prescribed leakage detection capability. Thus, not accounting for residual stresses may have eroded the margin on crack size of 2.0, typically assumed in a LBB analysis, to 1.0. H.6 MODEL CHECKS Two model checks, or sensitivity studies were performed to make sure that the results produced from the specific models used in this study would be applicable over a range of conditions. The two checks that were performed were a mesh density study in which the number of elements used in one of the 3-D models was increased by a factor of 2.8 and the resulting crack opening displacement values at no load were compared to those of the standard model. The second study examined the effect on weld residual stresses of altering the heat input in the weld. This was checked by varying the heat input ± 25 percent and examining the effect on axial and hoop stresses in one of the finely meshed 2-D models. H.6.1 Mesh Density Study A mesh density study was done to show that the number of elements that were used in the
standard models was sufficient. This was done, in part, by comparing the results from the stress results from the coarse and finely meshed 2-D models as shown in Figures H.3 and H.4. Remember, the solid lines represent the stress results from the finely meshed model and the dotted lines represent the stress from the coarsely meshed model. Figure H.7 shows that the mesh density reduction in going from the finely meshed 2-D model to the coarsely meshed 2-D model was a factor of 6. These results were considered to match well enough to proceed with using them for the 3-D models in which cracks were introduced. But, a 3-D comparison was never made of the effect on crack opening displacement. The ABAQUS routine, “Symmetric Model Generate,” was used to revolve the 2-D models into 3-D models while mapping stresses as well. It was used on all of the test cases. The easiest method to create a finely meshed 3-D model was to revolve one of the finely meshed 2-D models directly into a 3-D model. For the example case of 0.59 inches thick with a radius to thickness ratio of 10 this would not work. This is why the coarser models were originally created with the stresses mapped to them. The original fine meshed models had to be made more coarsely meshed before revolving because of a limitation in the number of elements that can be revolved. The 2-D fine mesh model with the least number of elements (1,233 elements) was the model with a thickness of 0.886 inches. Its coarse mesh model had 439 elements. Revolving the fine mesh model into a 3-D model would produce a finely meshed 3-D model with 2.8 times the number of elements as the original version. This worked, and the crack opening displacements were compared. Figure H.12 shows the half-crack opening displacement comparison for the coarsely and finely meshed model of the pipe 0.886 inches thick with a radius to thickness ratio of 10. The figure shows that there is a good comparison between the results of the two models. The ID values are shown on the upper part of the graph and the OD values are shown on the lower part of the graph. The graph shows the crack face displacement at the centerline when there is no

H-15
rigid boundary condition at the crack center. The OD of this crack moves in a direction that would create an interference fit (negative displacement) and the ID values show the crack opening. The graph also shows these crack profiles for the four crack sizes studied (π/16, π/8, π/4, π/2). In all cases, the finely meshed model produced resulting crack displacements
outboard of those produced by the coarser model. The outer diameter results were more closed than the closed outer diameter of the coarsely meshed model, and the inner diameter results were more open than the open crack displacements of the more coarsely meshed model.
The more coarsely meshed model is always conservative because it predicts that the cracks will be slightly more closed on the OD than the more finely meshed model. The conclusion of this study was that the results for the models used in developing the correction factors would be conservative and acceptable. H.6.2 Heat Input Study A heat input check was done for similar reasons. The check was done to find the effect of heat input on the stresses obtained in the weld model. The standard example case of a 0.59 inch thick
pipe with radius to thickness ratio of 10 was used in this study. Only the stresses produced in the finely meshed 2-D model were examined. The heat input values used were varied by ± 25 percent from those used in the nominal case and the models were rerun. The resulting axial and hoop stress profiles are shown in the following two figures (Figures H.13 and H.14). The figures show that the resulting change in stresses due to the change in heat input over the ± 25 percent range is almost insignificant.
Figure H.12 Mesh density study results

H-16
Figure H.14 Hoop stress results from heat input study
Figure H.13 Axial stress results from heat input study
Figure H.14 Hoop stress results from heat input study
H-17
),,(),,(),(),,(),(4
),,(),,(),(),,(),(4
),(),(4
ttR
baIat
tR
baC
tR
baVt
tR
baC
tR
baV
Ea
ttR
baIat
tR
baC
tR
baVt
tR
baC
tR
baV
Ea
tR
baV
tR
baV
Ea
IDBBBTTTID
ODBBBTTTOD
BBTT
⋅+⎥⎦⎤
⎢⎣⎡ ⋅⋅+⋅⋅⋅=
⋅+⎥⎦⎤
⎢⎣⎡ ⋅⋅+⋅⋅⋅=
⎥⎦⎤
⎢⎣⎡ ⋅+⋅⋅=
σσδ
σσδ
σσδ
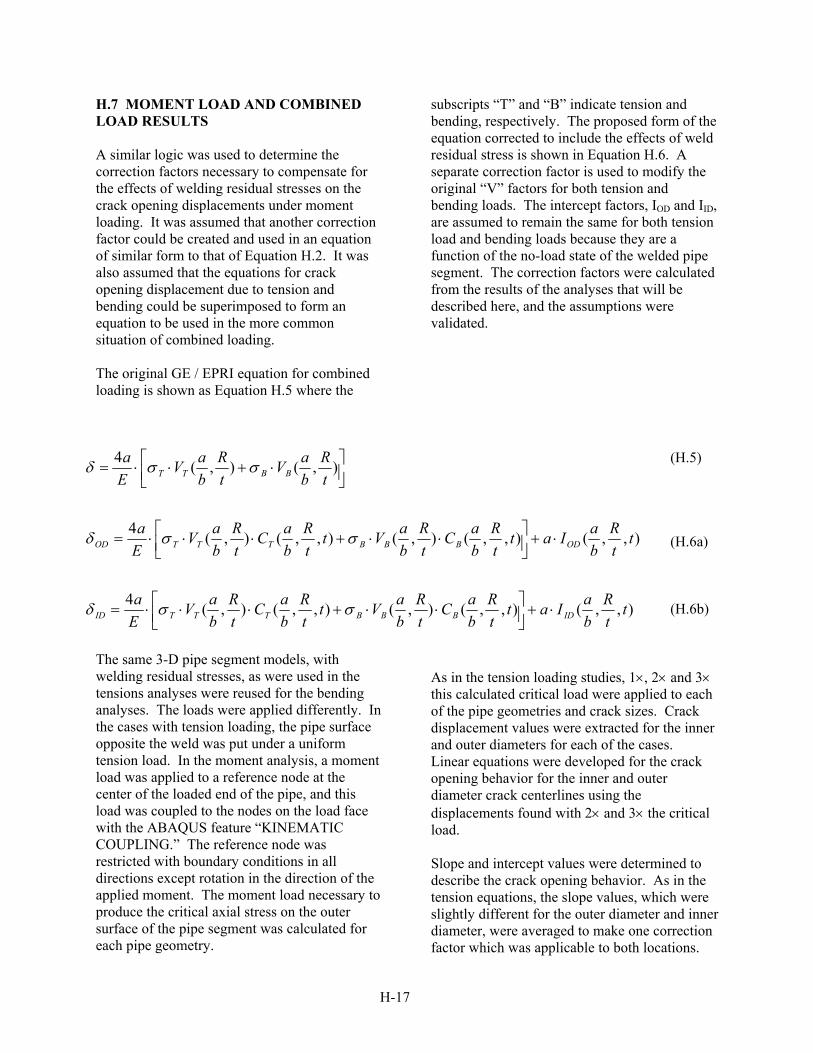
H.7 MOMENT LOAD AND COMBINED LOAD RESULTS A similar logic was used to determine the correction factors necessary to compensate for the effects of welding residual stresses on the crack opening displacements under moment loading. It was assumed that another correction factor could be created and used in an equation of similar form to that of Equation H.2. It was also assumed that the equations for crack opening displacement due to tension and bending could be superimposed to form an equation to be used in the more common situation of combined loading. The original GE / EPRI equation for combined loading is shown as Equation H.5 where the
subscripts “T” and “B” indicate tension and bending, respectively. The proposed form of the equation corrected to include the effects of weld residual stress is shown in Equation H.6. A separate correction factor is used to modify the original “V” factors for both tension and bending loads. The intercept factors, IOD and IID, are assumed to remain the same for both tension load and bending loads because they are a function of the no-load state of the welded pipe segment. The correction factors were calculated from the results of the analyses that will be described here, and the assumptions were validated.
(H.5) (H.6a) (H.6b) The same 3-D pipe segment models, with welding residual stresses, as were used in the tensions analyses were reused for the bending analyses. The loads were applied differently. In the cases with tension loading, the pipe surface opposite the weld was put under a uniform tension load. In the moment analysis, a moment load was applied to a reference node at the center of the loaded end of the pipe, and this load was coupled to the nodes on the load face with the ABAQUS feature “KINEMATIC COUPLING.” The reference node was restricted with boundary conditions in all directions except rotation in the direction of the applied moment. The moment load necessary to produce the critical axial stress on the outer surface of the pipe segment was calculated for each pipe geometry.
As in the tension loading studies, 1×, 2× and 3× this calculated critical load were applied to each of the pipe geometries and crack sizes. Crack displacement values were extracted for the inner and outer diameters for each of the cases. Linear equations were developed for the crack opening behavior for the inner and outer diameter crack centerlines using the displacements found with 2× and 3× the critical load. Slope and intercept values were determined to describe the crack opening behavior. As in the tension equations, the slope values, which were slightly different for the outer diameter and inner diameter, were averaged to make one correction factor which was applicable to both locations.
H-18
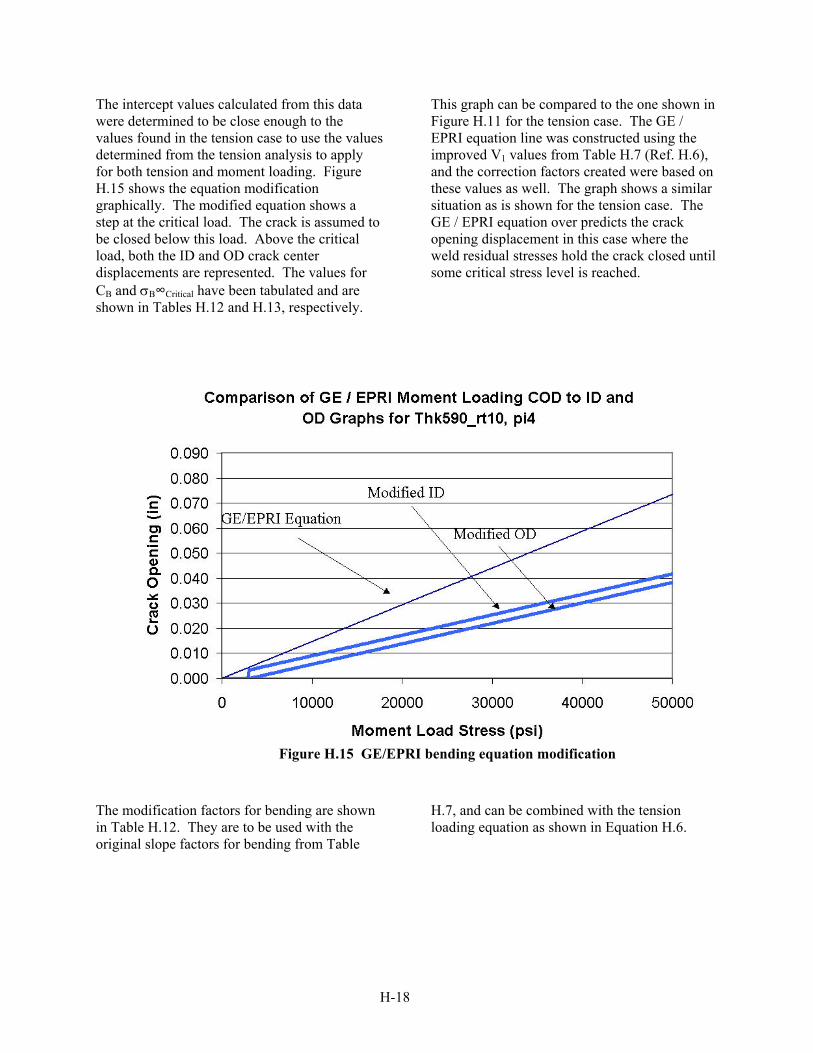
The intercept values calculated from this data were determined to be close enough to the values found in the tension case to use the values determined from the tension analysis to apply for both tension and moment loading. Figure H.15 shows the equation modification graphically. The modified equation shows a step at the critical load. The crack is assumed to be closed below this load. Above the critical load, both the ID and OD crack center displacements are represented. The values for CB and σB∞Critical have been tabulated and are shown in Tables H.12 and H.13, respectively.
This graph can be compared to the one shown in Figure H.11 for the tension case. The GE / EPRI equation line was constructed using the improved V1 values from Table H.7 (Ref. H.6), and the correction factors created were based on these values as well. The graph shows a similar situation as is shown for the tension case. The GE / EPRI equation over predicts the crack opening displacement in this case where the weld residual stresses hold the crack closed until some critical stress level is reached.
The modification factors for bending are shown in Table H.12. They are to be used with the original slope factors for bending from Table
H.7, and can be combined with the tension loading equation as shown in Equation H.6.
a/b
R/t 1/16 1/8 1/4 1/2
5 0.575 0.721 0.544 0.41710 0.688 0.672 0.513 0.26320 0.761 0.684 0.374 0.105
Figure H.15 GE/EPRI bending equation modification
H-19
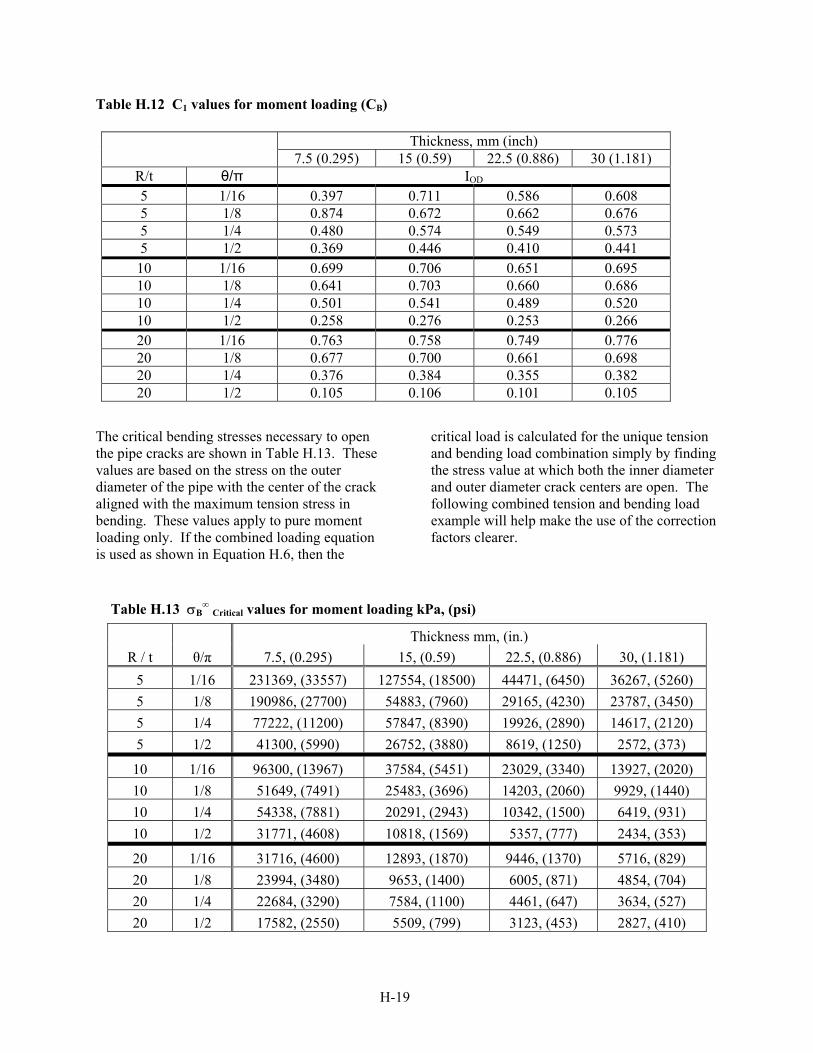
Table H.12 C1 values for moment loading (CB)
The critical bending stresses necessary to open the pipe cracks are shown in Table H.13. These values are based on the stress on the outer diameter of the pipe with the center of the crack aligned with the maximum tension stress in bending. These values apply to pure moment loading only. If the combined loading equation is used as shown in Equation H.6, then the
critical load is calculated for the unique tension and bending load combination simply by finding the stress value at which both the inner diameter and outer diameter crack centers are open. The following combined tension and bending load example will help make the use of the correction factors clearer.
Thickness, mm (inch) 7.5 (0.295) 15 (0.59) 22.5 (0.886) 30 (1.181)
R/t θ/π IOD
5 1/16 0.397 0.711 0.586 0.608 5 1/8 0.874 0.672 0.662 0.676 5 1/4 0.480 0.574 0.549 0.573 5 1/2 0.369 0.446 0.410 0.441
10 1/16 0.699 0.706 0.651 0.695 10 1/8 0.641 0.703 0.660 0.686 10 1/4 0.501 0.541 0.489 0.520 10 1/2 0.258 0.276 0.253 0.266 20 1/16 0.763 0.758 0.749 0.776 20 1/8 0.677 0.700 0.661 0.698 20 1/4 0.376 0.384 0.355 0.382 20 1/2 0.105 0.106 0.101 0.105
Thickness mm, (in.) R / t θ/π 7.5, (0.295) 15, (0.59) 22.5, (0.886) 30, (1.181)
5 1/16 231369, (33557) 127554, (18500) 44471, (6450) 36267, (5260) 5 1/8 190986, (27700) 54883, (7960) 29165, (4230) 23787, (3450) 5 1/4 77222, (11200) 57847, (8390) 19926, (2890) 14617, (2120) 5 1/2 41300, (5990) 26752, (3880) 8619, (1250) 2572, (373)
10 1/16 96300, (13967) 37584, (5451) 23029, (3340) 13927, (2020) 10 1/8 51649, (7491) 25483, (3696) 14203, (2060) 9929, (1440) 10 1/4 54338, (7881) 20291, (2943) 10342, (1500) 6419, (931) 10 1/2 31771, (4608) 10818, (1569) 5357, (777) 2434, (353)
20 1/16 31716, (4600) 12893, (1870) 9446, (1370) 5716, (829) 20 1/8 23994, (3480) 9653, (1400) 6005, (871) 4854, (704) 20 1/4 22684, (3290) 7584, (1100) 4461, (647) 3634, (527) 20 1/2 17582, (2550) 5509, (799) 3123, (453) 2827, (410)
Table H.13 σB∞ Critical values for moment loading kPa, (psi)
H-20
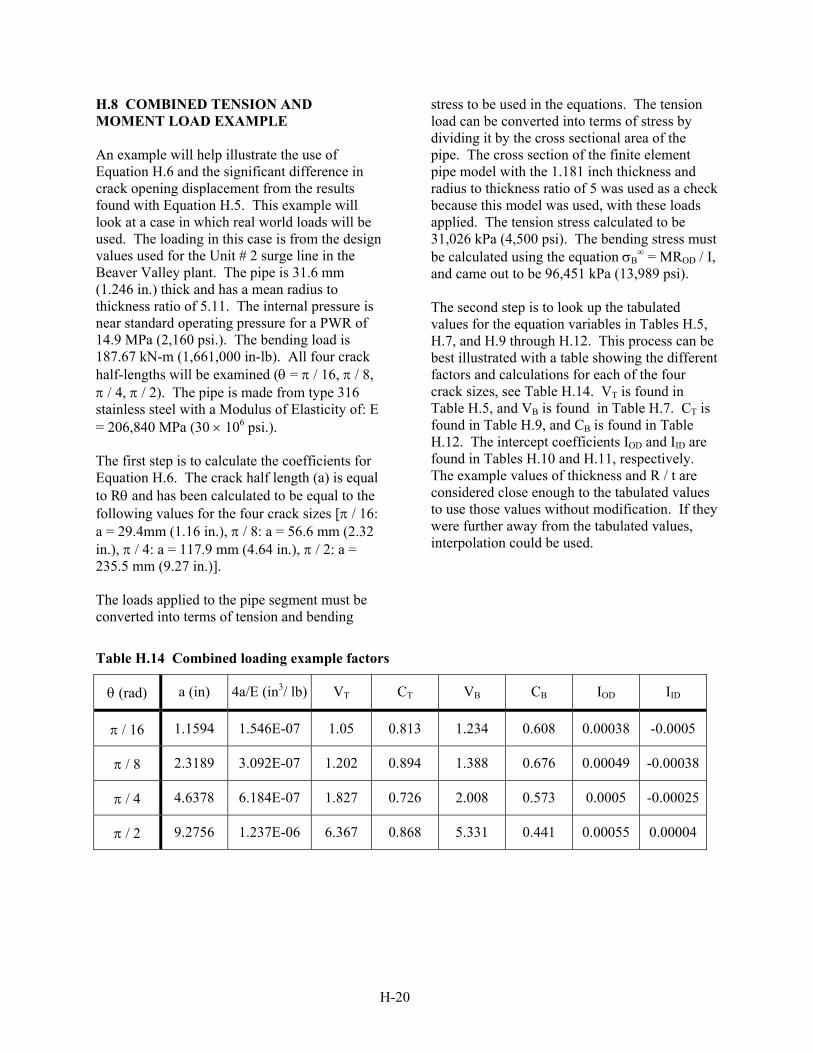
H.8 COMBINED TENSION AND MOMENT LOAD EXAMPLE An example will help illustrate the use of Equation H.6 and the significant difference in crack opening displacement from the results found with Equation H.5. This example will look at a case in which real world loads will be used. The loading in this case is from the design values used for the Unit # 2 surge line in the Beaver Valley plant. The pipe is 31.6 mm (1.246 in.) thick and has a mean radius to thickness ratio of 5.11. The internal pressure is near standard operating pressure for a PWR of 14.9 MPa (2,160 psi.). The bending load is 187.67 kN-m (1,661,000 in-lb). All four crack half-lengths will be examined (θ = π / 16, π / 8, π / 4, π / 2). The pipe is made from type 316 stainless steel with a Modulus of Elasticity of: E = 206,840 MPa (30 × 106 psi.). The first step is to calculate the coefficients for Equation H.6. The crack half length (a) is equal to Rθ and has been calculated to be equal to the following values for the four crack sizes [π / 16: a = 29.4mm (1.16 in.), π / 8: a = 56.6 mm (2.32 in.), π / 4: a = 117.9 mm (4.64 in.), π / 2: a = 235.5 mm (9.27 in.)]. The loads applied to the pipe segment must be converted into terms of tension and bending
stress to be used in the equations. The tension load can be converted into terms of stress by dividing it by the cross sectional area of the pipe. The cross section of the finite element pipe model with the 1.181 inch thickness and radius to thickness ratio of 5 was used as a check because this model was used, with these loads applied. The tension stress calculated to be 31,026 kPa (4,500 psi). The bending stress must be calculated using the equation σB
∞ = MROD / I, and came out to be 96,451 kPa (13,989 psi). The second step is to look up the tabulated values for the equation variables in Tables H.5, H.7, and H.9 through H.12. This process can be best illustrated with a table showing the different factors and calculations for each of the four crack sizes, see Table H.14. VT is found in Table H.5, and VB is found in Table H.7. CT is found in Table H.9, and CB is found in Table H.12. The intercept coefficients IOD and IID are found in Tables H.10 and H.11, respectively. The example values of thickness and R / t are considered close enough to the tabulated values to use those values without modification. If they were further away from the tabulated values, interpolation could be used.
Table H.14 Combined loading example factors
θ (rad) a (in) 4a/E (in3/ lb) VT CT VB CB IOD IID
π / 16 1.1594 1.546E-07 1.05 0.813 1.234 0.608 0.00038 -0.0005
π / 8 2.3189 3.092E-07 1.202 0.894 1.388 0.676 0.00049 -0.00038
π / 4 4.6378 6.184E-07 1.827 0.726 2.008 0.573 0.0005 -0.00025
π / 2 9.2756 1.237E-06 6.367 0.868 5.331 0.441 0.00055 0.00004
H-21
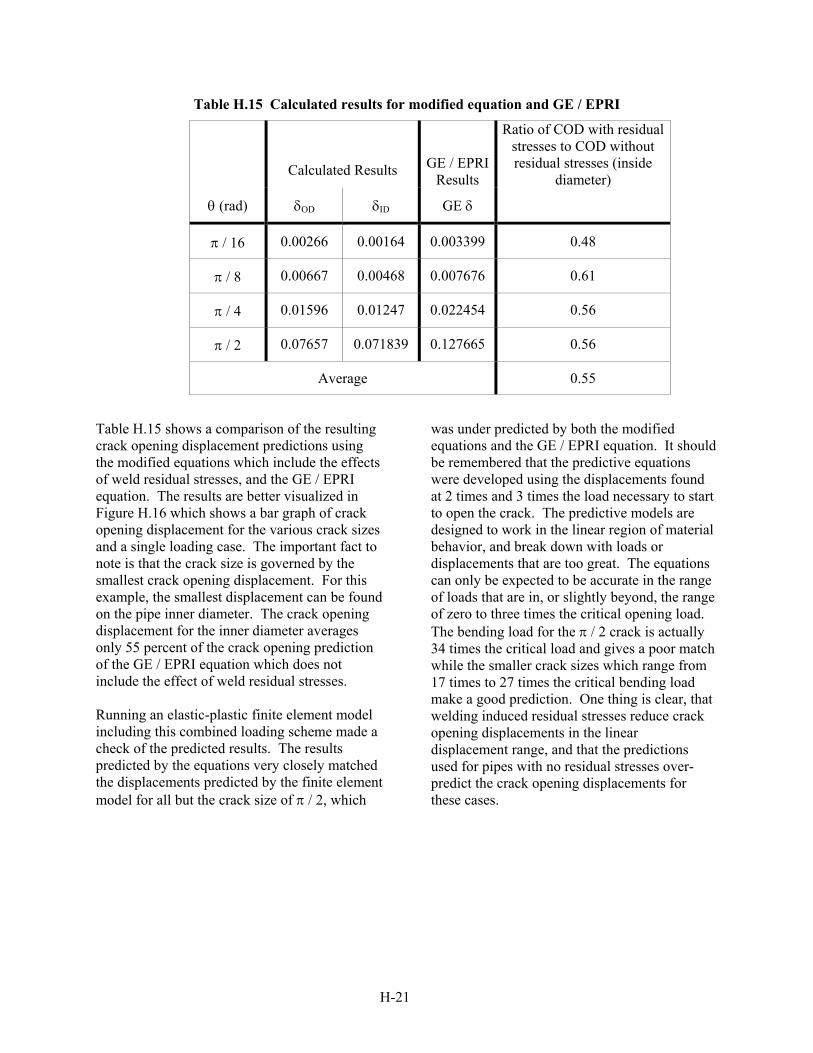
Table H.15 Calculated results for modified equation and GE / EPRI
Calculated Results
GE / EPRIResults
Ratio of COD with residual stresses to COD without residual stresses (inside
diameter)
θ (rad) δOD δID GE δ
π / 16 0.00266 0.00164 0.003399 0.48
π / 8 0.00667 0.00468 0.007676 0.61
π / 4 0.01596 0.01247 0.022454 0.56
π / 2 0.07657 0.071839 0.127665 0.56
Average 0.55
Table H.15 shows a comparison of the resulting crack opening displacement predictions using the modified equations which include the effects of weld residual stresses, and the GE / EPRI equation. The results are better visualized in Figure H.16 which shows a bar graph of crack opening displacement for the various crack sizes and a single loading case. The important fact to note is that the crack size is governed by the smallest crack opening displacement. For this example, the smallest displacement can be found on the pipe inner diameter. The crack opening displacement for the inner diameter averages only 55 percent of the crack opening prediction of the GE / EPRI equation which does not include the effect of weld residual stresses. Running an elastic-plastic finite element model including this combined loading scheme made a check of the predicted results. The results predicted by the equations very closely matched the displacements predicted by the finite element model for all but the crack size of π / 2, which
was under predicted by both the modified equations and the GE / EPRI equation. It should be remembered that the predictive equations were developed using the displacements found at 2 times and 3 times the load necessary to start to open the crack. The predictive models are designed to work in the linear region of material behavior, and break down with loads or displacements that are too great. The equations can only be expected to be accurate in the range of loads that are in, or slightly beyond, the range of zero to three times the critical opening load. The bending load for the π / 2 crack is actually 34 times the critical load and gives a poor match while the smaller crack sizes which range from 17 times to 27 times the critical bending load make a good prediction. One thing is clear, that welding induced residual stresses reduce crack opening displacements in the linear displacement range, and that the predictions used for pipes with no residual stresses over-predict the crack opening displacements for these cases.

H-22
H.9 CONCLUSIONS REGARDING WELD RESIDUAL STRESS EFFECTS ON COD The results found in this study reinforce the previously held belief that circumferential through wall cracks in pipes behave differently when they are located in a weld than when they are located in an area free from residual stresses. Correction functions have been tabulated for use in modifying the GE/EPRI linear elastic crack opening displacement equation to better predict crack opening behavior for pipe cracks in welds. The example used shows one instance in which the modified equation predicts a smaller crack opening displacement than does the GE/EPRI equation. This is significant in the case in which an attempt is made to back-calculate crack length from postulated pipe leakage rates, such as the case in traditional LBB analyses. Crack lengths can be calculated using the known leakage rates, calculated crack opening areas and crack opening displacements, among other factors. If the crack opening area is over predicted, as is the case with the GE/EPRI solution in the example above, the crack length will be under predicted. The equation modification factors provided in Tables H.8 through H.13 can be used to better predict crack
opening behavior, which will lead to better LBB evaluations. This work is also applicable only to type 316 stainless steels. Though it is thought that other materials with similar thermal and strength properties will behave similarly, this hypothesis must be evaluated. H.10 WELD START-STOP EFFECTS The previous analyses describing the effects of weld residual stresses on crack opening displacements assumed that the welds were deposited uniformly for the entire circumference of the pipe segments analyzed. The residual stress state of the pipes was developed in an axis-symmetric model. The axis-symmetric results consisting of stresses and plastic strains (if needed) were then transferred to a full three dimensional model. The full three-dimensional model was then in an axis-symmetric state of stress. When the cracks were introduced into the three-dimensional model, the stresses redistributed to eliminate the axis-symmetric nature of the stress. An axis-symmetric analysis of the welding process essentially assumes that
Figure H.16 Comparison of results from combined loading example
H-23
the entire pass is deposited at once along the entire circumference. In actual pipe welds there is a start and stop point of each weld pass which causes a discontinuity of the stress state in the pipe at this location. While an axis-symmetric analysis is not physically realistic, experience over the years has shown that an axis-symmetric analysis is reasonably accurate for regions away from the start/stop location of an actual pipe weld. This stress discontinuity near the start/stop region of the weld has an effect on crack opening behavior in and near the weld. It is important to know what this effect will be with regard to the results presented from the previous COD analysis. This section of the report will describe a study of crack opening behavior in a pipe model with a full three dimensional weld of seven passes where each pass starts and ends at the same point. An analysis in which the start and stop location of each weld pass is in the same location should be expected to show the most severe example of the start-stop effect on crack opening displacement. In some actual field welds, the passes start and stop at different locations around the circumference, which will lead to a more uniform stress state in the pipe. The following provides a summary of (i) weld start/stop effects on the residual stress state in pipe welds and (ii) the effect on the COD when the crack approaches and grows through a start/stop region of a pipe weld.
H.10.1 The Start/Stop Weld Model The model used for the analysis is the same as the one described in Appendix G of this report. The model is shown in Figure H.17. The pipe is a bimetallic weld made from several materials, as shown. This represents the geometry of the V. C. Summer bimetallic hot leg pipe weld analyzed in detail in Appendix G. The purpose of the analysis shown in Appendix G was to investigate the growth of pressurized water stress corrosion cracking (PWSCC) in the bimetallic hot leg welds. The welds joined a reactor vessel nozzle to a stainless steel pipe using inconel weld filler metal. The pipe was modeled with a seven-pass weld in which all have the start and stop locations of the weld passes were at the same location around the pipe circumference. Each weld pass traverses 360 degrees of the pipe. The nozzle (made of A508 steel) is 3.22 inches (81.8 mm) thick and has a radius-to-thickness ratio of 5 while the stainless steel pipe is 2.33 inches (59.2 mm) thick with a radius-to-thickness ratio of 6.7. The outer diameter of the nozzle was machined so that the outer diameter of the both the nozzle and stainless steel pipe were equivalent. This machining extended for about 1.5 to 2 thicknesses away from the edge of the weld (see Figure G.19 in Appendix G for more details).

H-24
Figure H.17 Start – Stop weld analysis model One will notice, from examination of Appendix G, that this analysis neglected the effect of the buttering, post weld heat treatment, and weld repair. In addition, the weld passes were lumped to produce seven passes instead of the 21 passes used in the axis-symmetric analysis in Appendix G. By comparing the detailed axis-symmetric solution results to this three dimensional analysis, it is seen that similar trends between the solutions are obtained for regions away from the start/stop locations. There were two reasons that this bimetallic weld was chosen for this weld start/stop effect study. First, in the actual V. C. Summer hot leg bimetallic weld that experienced field cracking, a significant amount of leaking occurred that was not detected by leak detection equipment, and the crack was not discovered until a scheduled outage. This analysis can provide an estimate of the expected crack opening behavior
in similar bimetallic pipe welds to provide understanding of the effects of bimetallic weld residual stress effects on COD (and hence leak rates). Second, the model was readily available and will provide information regarding start/stop effects on generic mono-material as well as bi-material welds. The materials and geometry of this model are different than those used in the crack opening displacement analyses discussed earlier in this appendix. Hence no direct comparison will be made between the prior and new results presented here. Instead, a qualitative comparison will be made between the crack opening displacements in this pipe model when the cracks are located in the start-stop location, and then in a separate analysis with the crack placed 180 degrees from the start-stop location.
S304
A508 Class 2
INCO182
(a) 3D model
S304
A508 Class 2
INCO182
S309
(b) Half 3D model
W1
W3
W5
(c) weld passes
A508 Class 2
INCO182 S304 W1
W2 W3
W5 W6
W4
W7
Butter Weld
H-25
Quarter symmetry models were used in the previous analyses to describe the crack opening displacements. Because of the varying stress field 360 degrees around the circumference of a pipe segment with start-stop weld effects, a full model of the pipe segment was required here. The model is shown in Figure H.17. Node constraints along the weld centerline were used to create the cracks in the previous quarter symmetric models. Node constraints were sequentially released to simulate the growth of the crack. A similar method was used in these full models. The model was split into two halves at the weld centerline. Kinematic nodal constraints were used to join the two halves of the model along the centerline of the weld, and these constraints were released to allow a crack to grow in the pipe segment. As was done previously, four crack lengths were studied with half crack lengths, θ, equal to π / 16, π / 8, π / 4 and π / 2. A total of eight analyses were performed to find crack surface displacements due only to residual stresses, i.e. with no applied axial load. Analyses were done in which the
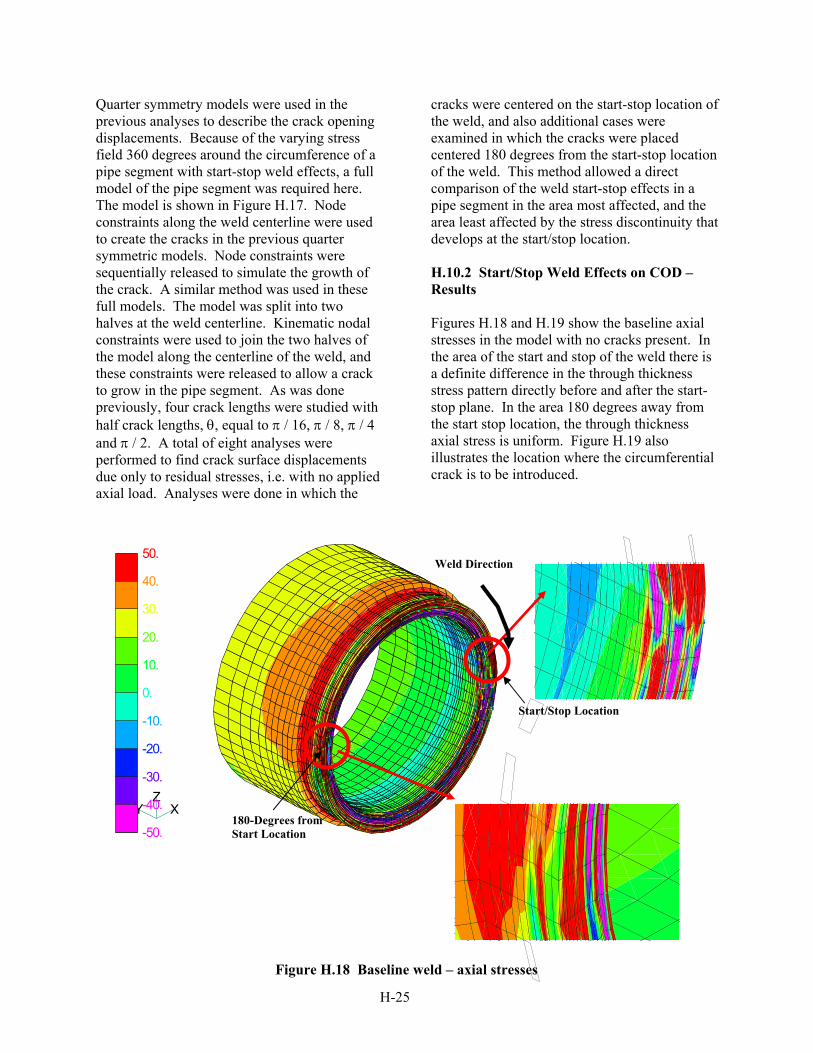
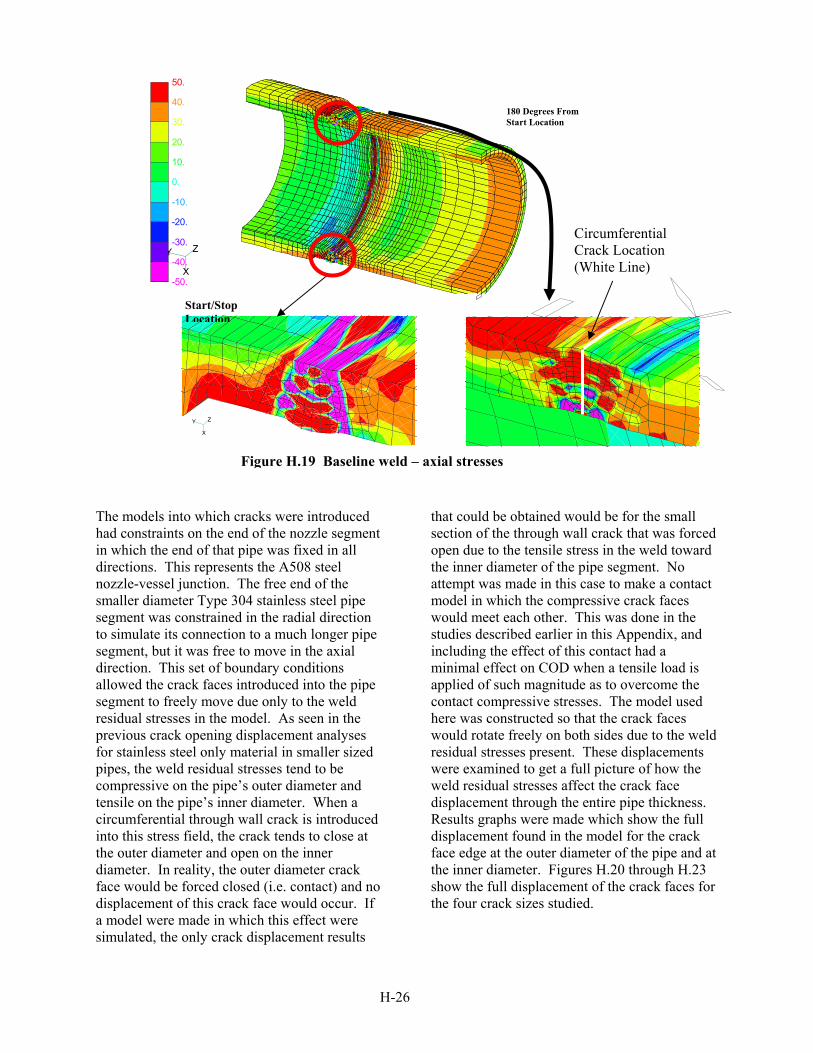
cracks were centered on the start-stop location of the weld, and also additional cases were examined in which the cracks were placed centered 180 degrees from the start-stop location of the weld. This method allowed a direct comparison of the weld start-stop effects in a pipe segment in the area most affected, and the area least affected by the stress discontinuity that develops at the start/stop location. H.10.2 Start/Stop Weld Effects on COD – Results Figures H.18 and H.19 show the baseline axial stresses in the model with no cracks present. In the area of the start and stop of the weld there is a definite difference in the through thickness stress pattern directly before and after the start-stop plane. In the area 180 degrees away from the start stop location, the through thickness axial stress is uniform. Figure H.19 also illustrates the location where the circumferential crack is to be introduced.
Figure H.18 Baseline weld – axial stresses
XYZ
XYZ
50.
40.
30.
20.
10.
0.
-10.
-20.
-30.
-40.
-50.
Start/Stop Location
Weld Direction
180-Degrees from Start Location
XYZ
H-26
The models into which cracks were introduced had constraints on the end of the nozzle segment in which the end of that pipe was fixed in all directions. This represents the A508 steel nozzle-vessel junction. The free end of the smaller diameter Type 304 stainless steel pipe segment was constrained in the radial direction to simulate its connection to a much longer pipe segment, but it was free to move in the axial direction. This set of boundary conditions allowed the crack faces introduced into the pipe segment to freely move due only to the weld residual stresses in the model. As seen in the previous crack opening displacement analyses for stainless steel only material in smaller sized pipes, the weld residual stresses tend to be compressive on the pipe’s outer diameter and tensile on the pipe’s inner diameter. When a circumferential through wall crack is introduced into this stress field, the crack tends to close at the outer diameter and open on the inner diameter. In reality, the outer diameter crack face would be forced closed (i.e. contact) and no displacement of this crack face would occur. If a model were made in which this effect were simulated, the only crack displacement results
that could be obtained would be for the small section of the through wall crack that was forced open due to the tensile stress in the weld toward the inner diameter of the pipe segment. No attempt was made in this case to make a contact model in which the compressive crack faces would meet each other. This was done in the studies described earlier in this Appendix, and including the effect of this contact had a minimal effect on COD when a tensile load is applied of such magnitude as to overcome the contact compressive stresses. The model used here was constructed so that the crack faces would rotate freely on both sides due to the weld residual stresses present. These displacements were examined to get a full picture of how the weld residual stresses affect the crack face displacement through the entire pipe thickness. Results graphs were made which show the full displacement found in the model for the crack face edge at the outer diameter of the pipe and at the inner diameter. Figures H.20 through H.23 show the full displacement of the crack faces for the four crack sizes studied.
X
Y Z
50.
40.
30.
20.
10.
0.
-10.
-20.
-30.
-40.
-50.
X
Y Z
X
Y Z
180 Degrees From Start Location
Figure H.19 Baseline weld – axial stresses
Start/Stop Location
Circumferential Crack Location (White Line)
H-27
Start Stop Pi/16 Crack Opening / Closing
-0.020
-0.015
-0.010
-0.005
0.000
0.005
0 30 60 90 120 150 180
Degrees
CO
D (i
n)
Weld Direction
STOP START
Start-Stop ID
Start-Stop OD
180o ID
180o OD
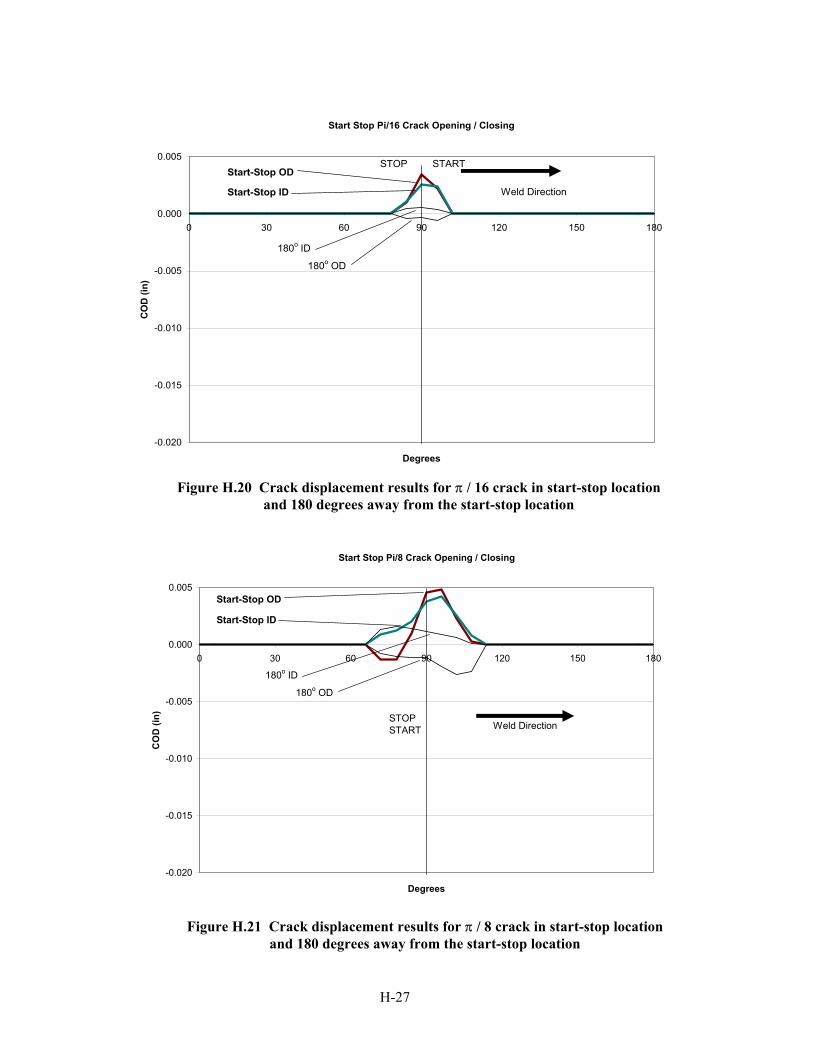
Figure H.20 Crack displacement results for π / 16 crack in start-stop location and 180 degrees away from the start-stop location
Start Stop Pi/8 Crack Opening / Closing
-0.020
-0.015
-0.010
-0.005
0.000
0.005
0 30 60 90 120 150 180
Degrees
CO
D (i
n)
Weld DirectionSTOP START
Start-Stop ID
Start-Stop OD
180o ID
180o OD
Figure H.21 Crack displacement results for π / 8 crack in start-stop location and 180 degrees away from the start-stop location

H-28
Start Stop Pi/4 Crack Opening / Closing
-0.020
-0.015
-0.010
-0.005
0.000
0.005
0 30 60 90 120 150 180
Degrees
CO
D (i
n)
Weld DirectionSTOP STARTStart-Stop ID
Start-Stop OD
180o ID
180o OD
Figure H.22 Crack displacement results for π / 4 crack in start-stop location and 180 degrees away from the start-stop location
Start Stop Pi/2 Crack Opening / Closing
-0.020
-0.015
-0.010
-0.005
0.000
0.005
0 30 60 90 120 150 180
Degrees
CO
D (i
n)
Weld DirectionSTOP STARTStart-Stop ID
Start-Stop OD
180o ID
180o OD
Figure H.23 Crack displacement results for π / 2 crack in start-stop location and 180 degrees away from the start-stop location
H-29
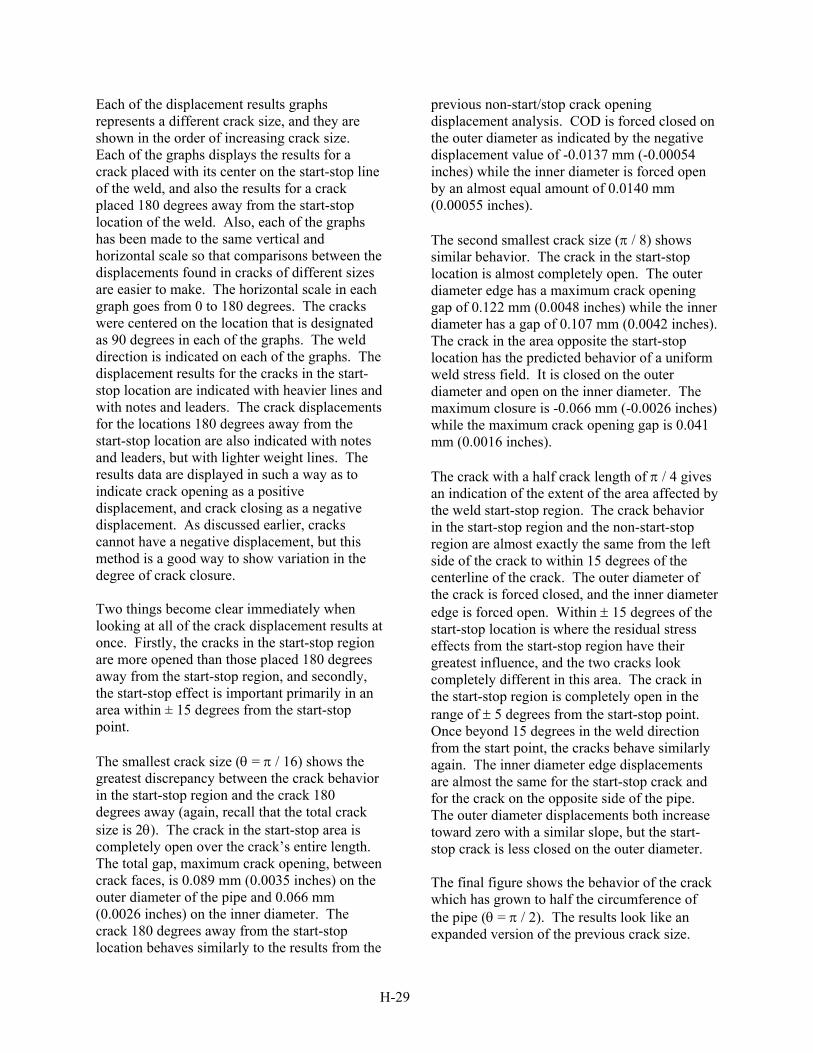
Each of the displacement results graphs represents a different crack size, and they are shown in the order of increasing crack size. Each of the graphs displays the results for a crack placed with its center on the start-stop line of the weld, and also the results for a crack placed 180 degrees away from the start-stop location of the weld. Also, each of the graphs has been made to the same vertical and horizontal scale so that comparisons between the displacements found in cracks of different sizes are easier to make. The horizontal scale in each graph goes from 0 to 180 degrees. The cracks were centered on the location that is designated as 90 degrees in each of the graphs. The weld direction is indicated on each of the graphs. The displacement results for the cracks in the start-stop location are indicated with heavier lines and with notes and leaders. The crack displacements for the locations 180 degrees away from the start-stop location are also indicated with notes and leaders, but with lighter weight lines. The results data are displayed in such a way as to indicate crack opening as a positive displacement, and crack closing as a negative displacement. As discussed earlier, cracks cannot have a negative displacement, but this method is a good way to show variation in the degree of crack closure. Two things become clear immediately when looking at all of the crack displacement results at once. Firstly, the cracks in the start-stop region are more opened than those placed 180 degrees away from the start-stop region, and secondly, the start-stop effect is important primarily in an area within ± 15 degrees from the start-stop point. The smallest crack size (θ = π / 16) shows the greatest discrepancy between the crack behavior in the start-stop region and the crack 180 degrees away (again, recall that the total crack size is 2θ). The crack in the start-stop area is completely open over the crack’s entire length. The total gap, maximum crack opening, between crack faces, is 0.089 mm (0.0035 inches) on the outer diameter of the pipe and 0.066 mm (0.0026 inches) on the inner diameter. The crack 180 degrees away from the start-stop location behaves similarly to the results from the
previous non-start/stop crack opening displacement analysis. COD is forced closed on the outer diameter as indicated by the negative displacement value of -0.0137 mm (-0.00054 inches) while the inner diameter is forced open by an almost equal amount of 0.0140 mm (0.00055 inches). The second smallest crack size (π / 8) shows similar behavior. The crack in the start-stop location is almost completely open. The outer diameter edge has a maximum crack opening gap of 0.122 mm (0.0048 inches) while the inner diameter has a gap of 0.107 mm (0.0042 inches). The crack in the area opposite the start-stop location has the predicted behavior of a uniform weld stress field. It is closed on the outer diameter and open on the inner diameter. The maximum closure is -0.066 mm (-0.0026 inches) while the maximum crack opening gap is 0.041 mm (0.0016 inches). The crack with a half crack length of π / 4 gives an indication of the extent of the area affected by the weld start-stop region. The crack behavior in the start-stop region and the non-start-stop region are almost exactly the same from the left side of the crack to within 15 degrees of the centerline of the crack. The outer diameter of the crack is forced closed, and the inner diameter edge is forced open. Within ± 15 degrees of the start-stop location is where the residual stress effects from the start-stop region have their greatest influence, and the two cracks look completely different in this area. The crack in the start-stop region is completely open in the range of ± 5 degrees from the start-stop point. Once beyond 15 degrees in the weld direction from the start point, the cracks behave similarly again. The inner diameter edge displacements are almost the same for the start-stop crack and for the crack on the opposite side of the pipe. The outer diameter displacements both increase toward zero with a similar slope, but the start-stop crack is less closed on the outer diameter. The final figure shows the behavior of the crack which has grown to half the circumference of the pipe (θ = π / 2). The results look like an expanded version of the previous crack size.
H-30
From the left side to within 10 degrees of the start-stop location, both the crack centered in the start-stop area and the one placed 180 degrees away behave almost exactly alike with the inner diameter cracks open and the outer diameter cracks closed. In the start-stop affected region, the crack is more open, but in this case, not completely open. The inner diameter opens a small amount over a 6 degree length, but the outer diameter remains firmly closed, though less so than the crack on the opposite side of the pipe. Once beyond 15 degrees in the weld direction from the weld start point, both cracks behave almost the same again for both the inner diameter and the outer diameter. General Conclusions. As stated earlier, some general conclusions can be made from the results found in this study. If a crack forms in the start-stop region of a weld, it will be generally more open than one that forms away from this region. The start-stop effect is most pronounced in a range of ± 15 degrees from its center, though there is a pronounced sinusoidal effect which progresses around the circumference and affects axial displacement results in the larger crack sizes. This seems to indicate that the start-stop effect has a more subtle effect on the stress state throughout the weld. The earlier analyses, in which equations were developed to predict crack opening displacements in terms of applied loads, are useful because they can be used as a method to indirectly determine crack lengths from measured leak rates and calculated crack opening displacements. The results of this start-stop analysis show that cracks that form in the start-stop area will be more opened than cracks that form in non-start-stop areas. Thus, ignoring the effect of start/stops would lead to a conservative estimation of the postulated leakage through-wall crack length in a leak-before-break assessment. This is because crack length is back calculated from an assumed crack area for a certain leak rate. The area is based on the crack opening displacement (COD) and the crack length. If the COD were more open in a start-stop area than would be predicted in a non-start-stop area, then the crack length would actually be shorter in the start-stop area than predicted, which is conservative. Of course,
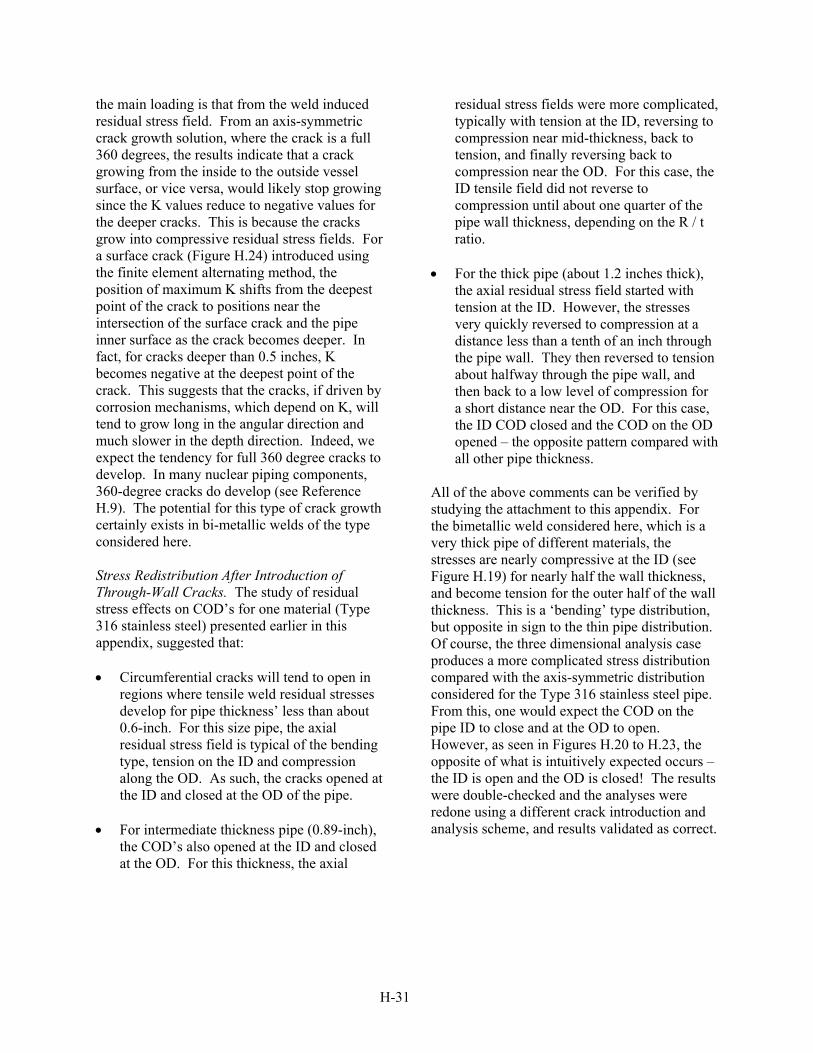
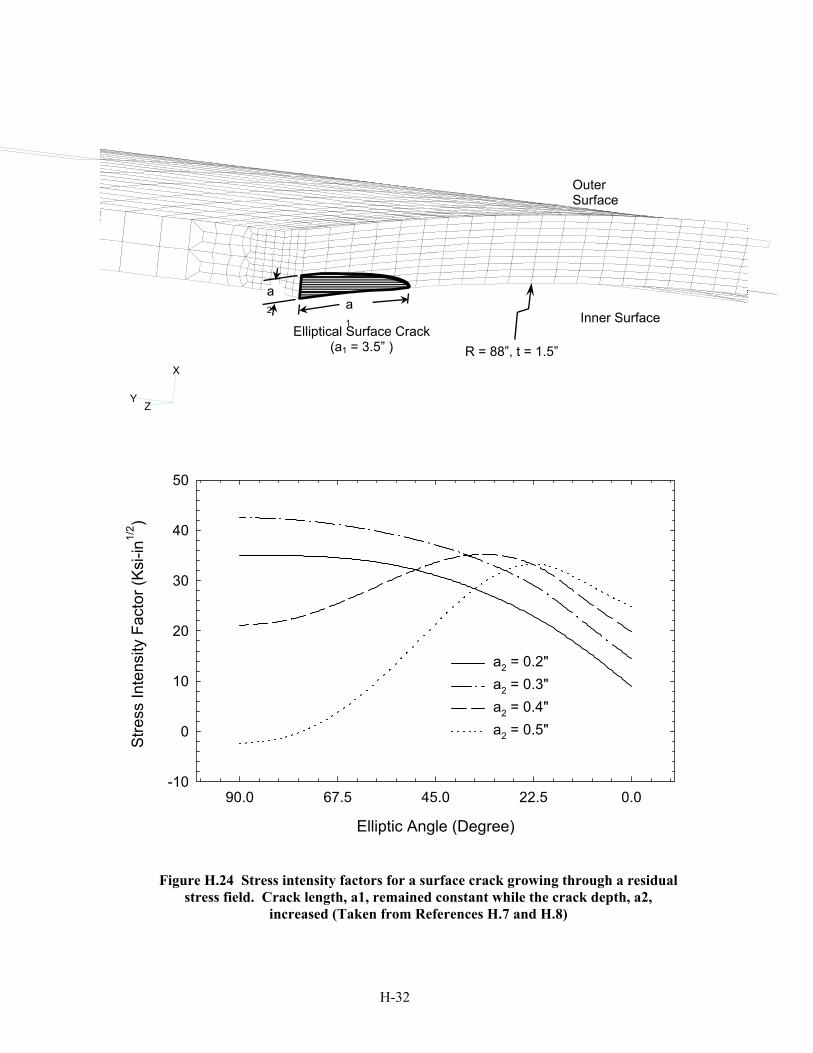
only one pipe geometry and size was evaluated in this analysis, and the results should be looked at more qualitatively than quantitatively. A range of pipe sizes and radius to thickness ratios should be studied to get a better understanding of the start-stop effect in a wider range of situations. H.10.3 Start/Stop Weld Effects on COD – Discussion There are several interesting general results that were obtained from this study that deserve further discussion. Three subjects are discussed in more detail here. Bimetallic Welds. The weld start/stop effect study was performed on a bimetallic weld for large diameter, thick pipe, which had the dimensions of the V. C. Summer hot leg pipe that experienced a pin hole sized indication in service. The pinhole emanated from a through-wall axial crack that grew in the IN82/182 weld material driven by hoop residual stresses. This is expected since weld hoop residual stresses are larger, and nearly fully tensile, compared with axial stresses, which alternate between tension and compression through the pipe wall. PWSCC is driven by tensile stresses. In this weld start/stop study we concerned ourselves with circumferential cracks since these are considered more severe than axial cracks since a circumferential crack can rupture the pipe and lead to rapid coolant loss. It is unlikely that a circumferential crack will grow through the pipe wall if driven mainly by weld residual stresses. Rather, a large part through crack can develop, which could potentially lead to a complex crack in service. This is illustrated in Figure H.24, taken from References H.7 and H.8. This consisted of an analysis of a core shroud weld. This diameter of this shroud is very large but is rather thick (see Figure H.24). The axial residual stress pattern in this vessel is typical of that in thick wall pipe, i.e., tension at the ID, compression in the mid thickness region, and tension again at the OD in the weld region (see References H.7 and H.8). References H.7 and H.8 were concerned with the crack growth behavior of a core shroud where
H-31
the main loading is that from the weld induced residual stress field. From an axis-symmetric crack growth solution, where the crack is a full 360 degrees, the results indicate that a crack growing from the inside to the outside vessel surface, or vice versa, would likely stop growing since the K values reduce to negative values for the deeper cracks. This is because the cracks grow into compressive residual stress fields. For a surface crack (Figure H.24) introduced using the finite element alternating method, the position of maximum K shifts from the deepest point of the crack to positions near the intersection of the surface crack and the pipe inner surface as the crack becomes deeper. In fact, for cracks deeper than 0.5 inches, K becomes negative at the deepest point of the crack. This suggests that the cracks, if driven by corrosion mechanisms, which depend on K, will tend to grow long in the angular direction and much slower in the depth direction. Indeed, we expect the tendency for full 360 degree cracks to develop. In many nuclear piping components, 360-degree cracks do develop (see Reference H.9). The potential for this type of crack growth certainly exists in bi-metallic welds of the type considered here. Stress Redistribution After Introduction of Through-Wall Cracks. The study of residual stress effects on COD’s for one material (Type 316 stainless steel) presented earlier in this appendix, suggested that: • Circumferential cracks will tend to open in
regions where tensile weld residual stresses develop for pipe thickness’ less than about 0.6-inch. For this size pipe, the axial residual stress field is typical of the bending type, tension on the ID and compression along the OD. As such, the cracks opened at the ID and closed at the OD of the pipe.
• For intermediate thickness pipe (0.89-inch),
the COD’s also opened at the ID and closed at the OD. For this thickness, the axial
residual stress fields were more complicated, typically with tension at the ID, reversing to compression near mid-thickness, back to tension, and finally reversing back to compression near the OD. For this case, the ID tensile field did not reverse to compression until about one quarter of the pipe wall thickness, depending on the R / t ratio.
• For the thick pipe (about 1.2 inches thick),
the axial residual stress field started with tension at the ID. However, the stresses very quickly reversed to compression at a distance less than a tenth of an inch through the pipe wall. They then reversed to tension about halfway through the pipe wall, and then back to a low level of compression for a short distance near the OD. For this case, the ID COD closed and the COD on the OD opened – the opposite pattern compared with all other pipe thickness.
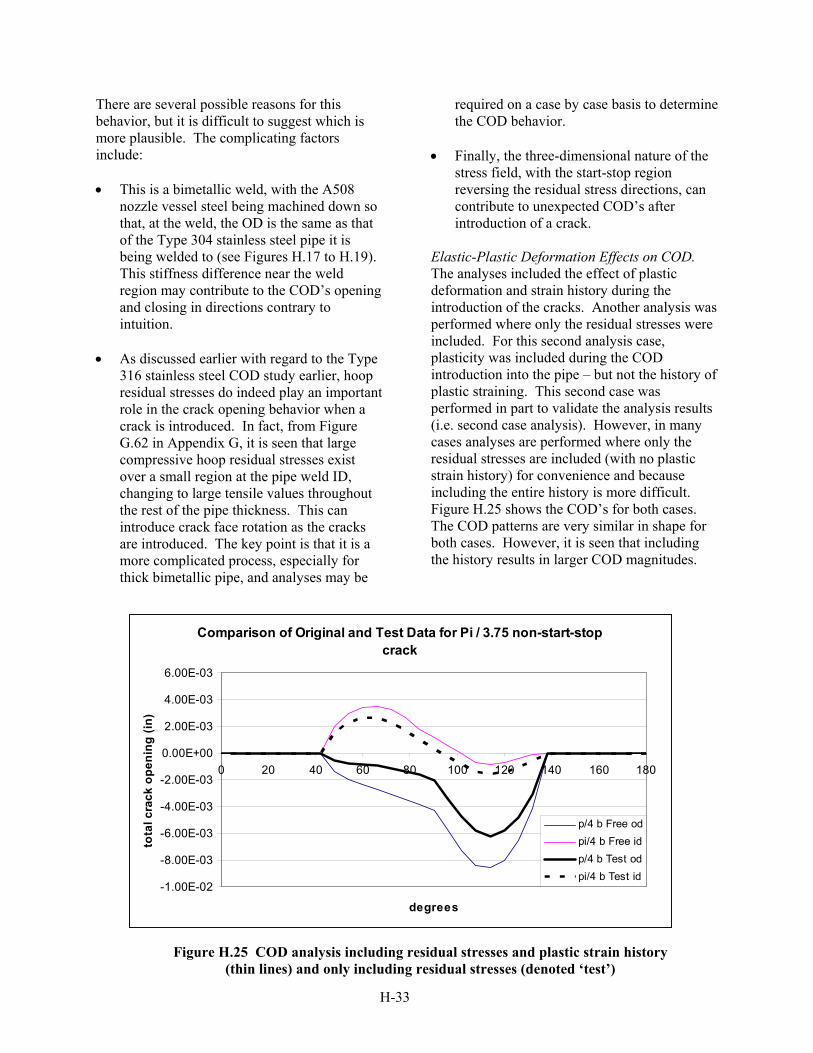
All of the above comments can be verified by studying the attachment to this appendix. For the bimetallic weld considered here, which is a very thick pipe of different materials, the stresses are nearly compressive at the ID (see Figure H.19) for nearly half the wall thickness, and become tension for the outer half of the wall thickness. This is a ‘bending’ type distribution, but opposite in sign to the thin pipe distribution. Of course, the three dimensional analysis case produces a more complicated stress distribution compared with the axis-symmetric distribution considered for the Type 316 stainless steel pipe. From this, one would expect the COD on the pipe ID to close and at the OD to open. However, as seen in Figures H.20 to H.23, the opposite of what is intuitively expected occurs – the ID is open and the OD is closed! The results were double-checked and the analyses were redone using a different crack introduction and analysis scheme, and results validated as correct.
H-32
Elliptic Angle (Degree)
0.022.545.067.590.0
Stre
ss In
tens
ity F
acto
r (Ks
i-in1/
2 )
-10
0
10
20
30
40
50
a2 = 0.2"a2 = 0.3"a2 = 0.4"a2 = 0.5"
X
YZ
a1
a2
Elliptical Surface Crack(a1 = 3.5” )
Inner Surface
Outer Surface
R = 88”, t = 1.5”
Figure H.24 Stress intensity factors for a surface crack growing through a residualstress field. Crack length, a1, remained constant while the crack depth, a2,
increased (Taken from References H.7 and H.8)
H-33
There are several possible reasons for this behavior, but it is difficult to suggest which is more plausible. The complicating factors include: • This is a bimetallic weld, with the A508
nozzle vessel steel being machined down so that, at the weld, the OD is the same as that of the Type 304 stainless steel pipe it is being welded to (see Figures H.17 to H.19). This stiffness difference near the weld region may contribute to the COD’s opening and closing in directions contrary to intuition.
• As discussed earlier with regard to the Type
316 stainless steel COD study earlier, hoop residual stresses do indeed play an important role in the crack opening behavior when a crack is introduced. In fact, from Figure G.62 in Appendix G, it is seen that large compressive hoop residual stresses exist over a small region at the pipe weld ID, changing to large tensile values throughout the rest of the pipe thickness. This can introduce crack face rotation as the cracks are introduced. The key point is that it is a more complicated process, especially for thick bimetallic pipe, and analyses may be
required on a case by case basis to determine the COD behavior.
• Finally, the three-dimensional nature of the
stress field, with the start-stop region reversing the residual stress directions, can contribute to unexpected COD’s after introduction of a crack.
Elastic-Plastic Deformation Effects on COD. The analyses included the effect of plastic deformation and strain history during the introduction of the cracks. Another analysis was performed where only the residual stresses were included. For this second analysis case, plasticity was included during the COD introduction into the pipe – but not the history of plastic straining. This second case was performed in part to validate the analysis results (i.e. second case analysis). However, in many cases analyses are performed where only the residual stresses are included (with no plastic strain history) for convenience and because including the entire history is more difficult. Figure H.25 shows the COD’s for both cases. The COD patterns are very similar in shape for both cases. However, it is seen that including the history results in larger COD magnitudes.
Comparison of Original and Test Data for Pi / 3.75 non-start-stop crack
-1.00E-02
-8.00E-03
-6.00E-03
-4.00E-03
-2.00E-03
0.00E+00
2.00E-03
4.00E-03
6.00E-03
0 20 40 60 80 100 120 140 160 180
degrees
tota
l cra
ck o
peni
ng (i
n)
p/4 b Free odpi/4 b Free idp/4 b Test odpi/4 b Test id
Figure H.25 COD analysis including residual stresses and plastic strain history (thin lines) and only including residual stresses (denoted ‘test’)

H-34
H.11 REFERENCES
H.1 Kumar, V., German, M. D., 1988, “Elastic-Plastic Fracture Analysis of Through-Wall and Surface Flaws in Cylinders,” EPRI Report Number NP-5596, Electric Power Research Institute, Palo Alto, Ca. H.2 VFTTM (Virtual Fabrication Technology) Software, Licensed Caterpillar Product, Distributed by Battelle, 2001, Columbus, OH. H.3 Barber, T. E., Brust, F. W., Mishler, H.W., 1981, “Controlling Residual Stresses by Heat Sink Welding,” EPRI Report Number NP-2159-LD, Electric Power Research Institute, Palo Alto, CA. H.4 Brust, F. W., Stonesifer, R. B., 1981 “Effect of Weld Parameters on Residual Stresses in BWR Piping Systems,” EPRI Report Number NP-1743, Electric Power Research Institute, Palo Alto, CA. H.5 Paul, D. D., Ghadiali, N., Rahman, S., Krishnaswamy, P., Wilkowski, G., 1994, “SQUIRT – Seepage Quantification of Upsets in Reactor Tubes, User’s Manual,” NRC Contract Number NRC-04-90-069, Battelle Memorial Institute, Columbus, OH.
H.6 Brust, F. W., Scott, P. Rahman, S., Ghadiali, N., Kilinski, T. Francini, B., Marschall, C. W., Miura, N., Krishnaswamy, P., Wilkowski, G. M., 1995, “Assessment of Short Through Wall Circumferential Cracks in Pipes – Experiments and Analysis,” U.S. Nuclear Regulatory Commission Report Number NUREG/CR-6235, U.S. Nuclear Regulatory Commission, Washington D. C. H.7 F. W. Brust, P. Dong, J. Zhang, “Crack Growth Behavior in Residual Stress Fields of a Core Shroud Girth Weld”. Fracture and Fatigue, H. S. Mehta, Ed., PVP-Vol. 350, pp. 391-406, 1997. H.8 J. Zhang, P. Dong, F. W. Brust, W. J. Shack, M. Mayfield, M. McNeil, “Modeling of Weld Residual Stresses in Core Shroud Structures”, International Journal for Nuclear Engineering and Design, Volume 195, pp. 171-187, 2000. H.9 Wilkowski, G. M., and others (1989): “Degraded Piping Program - Phase II, Summary of Technical Results and Their Significance to Leak-Before-Break and In-Service Flaw Acceptance Criteria”, March 1984 - January 1989, NUREG/CR-4082, Volume 8, March.
H-35
ATTACHMENT
ANALYSIS RESULTS INCLUDING AXIAL AND CIRCUMFERENTIAL STRESS PLOTS AND FOR ALL PIPE
THICKNESS AND R/t RATIO COMBINATIONS
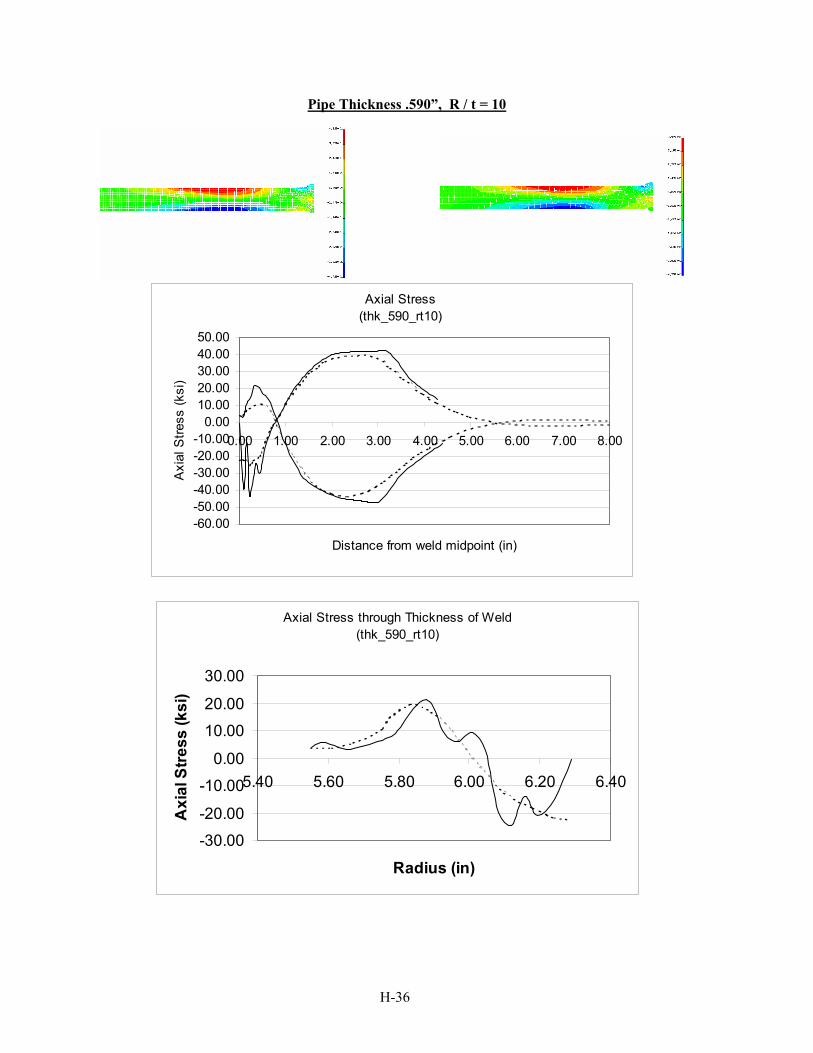
H-36
Pipe Thickness .590”, R / t = 10
Axial Stress (thk_590_rt10)
-60.00-50.00-40.00-30.00-20.00-10.00
0.0010.0020.0030.0040.0050.00
0.00 1.00 2.00 3.00 4.00 5.00 6.00 7.00 8.00
Distance from weld midpoint (in)
Axi
al S
tress
(ksi
)
Axial Stress through Thickness of Weld (thk_590_rt10)
-30.00-20.00
-10.000.00
10.0020.00
30.00
5.40 5.60 5.80 6.00 6.20 6.40
Radius (in)
Axi
al S
tress
(ksi
)
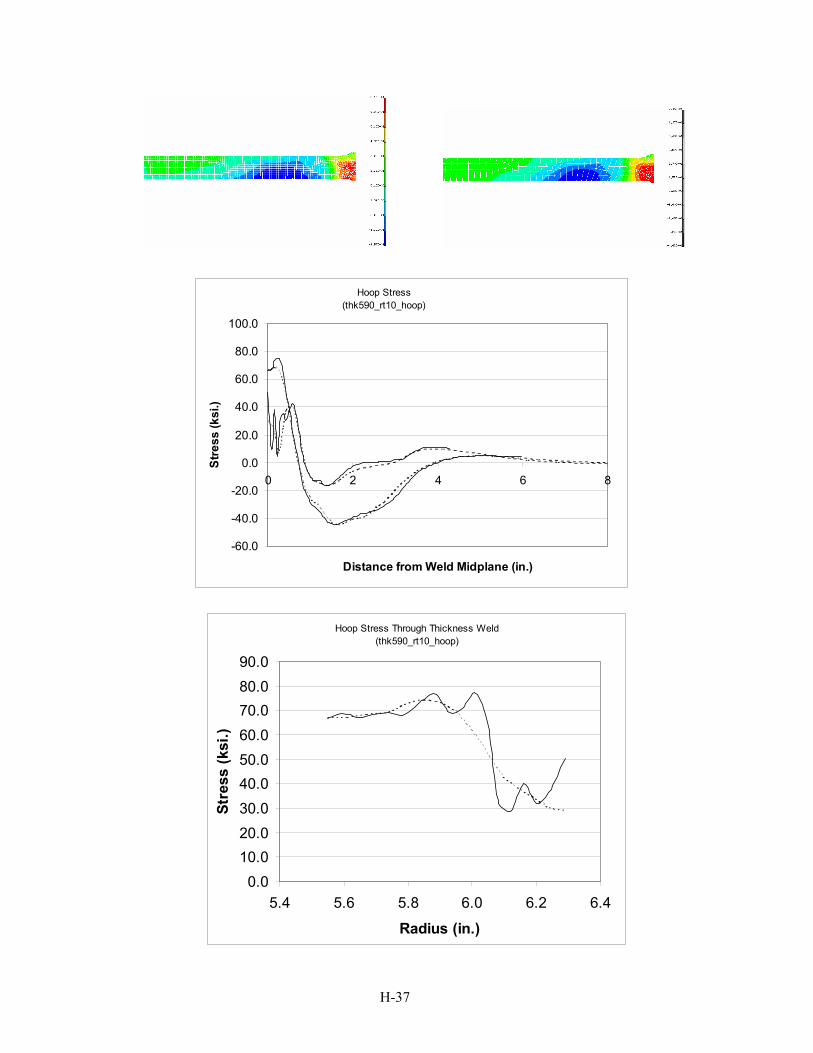
H-37
Hoop Stress (thk590_rt10_hoop)
-60.0
-40.0
-20.0
0.0
20.0
40.0
60.0
80.0
100.0
0 2 4 6 8
Distance from Weld Midplane (in.)
Stre
ss (k
si.)
Hoop Stress Through Thickness Weld (thk590_rt10_hoop)
0.010.020.030.040.050.060.070.080.090.0
5.4 5.6 5.8 6.0 6.2 6.4
Radius (in.)
Stre
ss (k
si.)
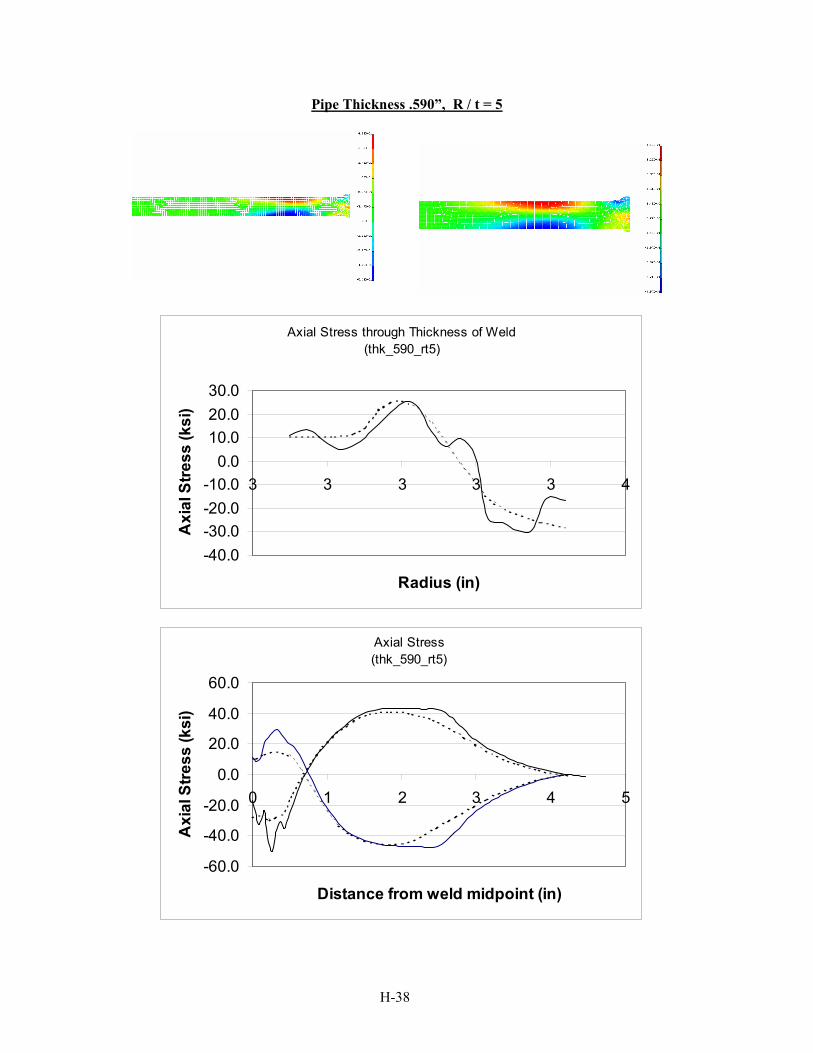
H-38
Pipe Thickness .590”, R / t = 5
Axial Stress (thk_590_rt5)
-60.0
-40.0
-20.0
0.0
20.0
40.0
60.0
0 1 2 3 4 5
Distance from weld midpoint (in)
Axi
al S
tress
(ksi
)
Axial Stress through Thickness of Weld (thk_590_rt5)
-40.0-30.0-20.0-10.0
0.010.020.030.0
3 3 3 3 3 4
Radius (in)
Axi
al S
tress
(ksi
)
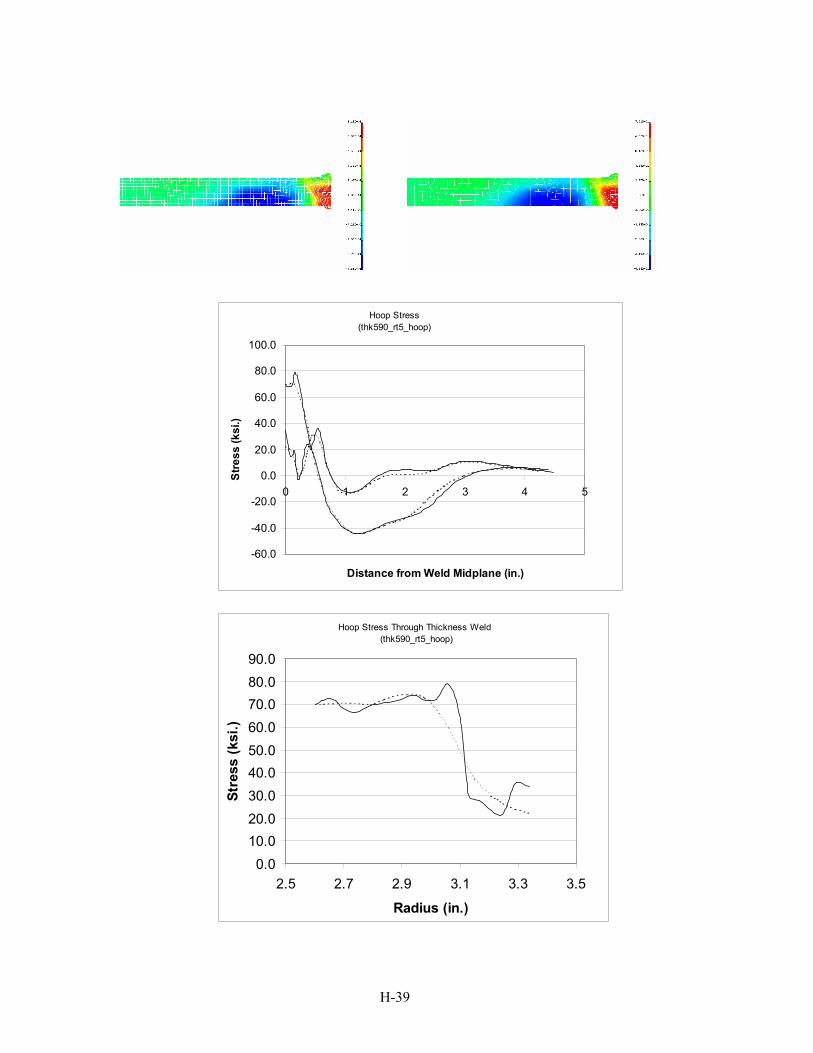
H-39
Hoop Stress (thk590_rt5_hoop)
-60.0
-40.0
-20.0
0.0
20.0
40.0
60.0
80.0
100.0
0 1 2 3 4 5
Distance from Weld Midplane (in.)
Stre
ss (k
si.)
Hoop Stress Through Thickness Weld (thk590_rt5_hoop)
0.010.020.030.040.050.060.070.080.090.0
2.5 2.7 2.9 3.1 3.3 3.5
Radius (in.)
Stre
ss (k
si.)
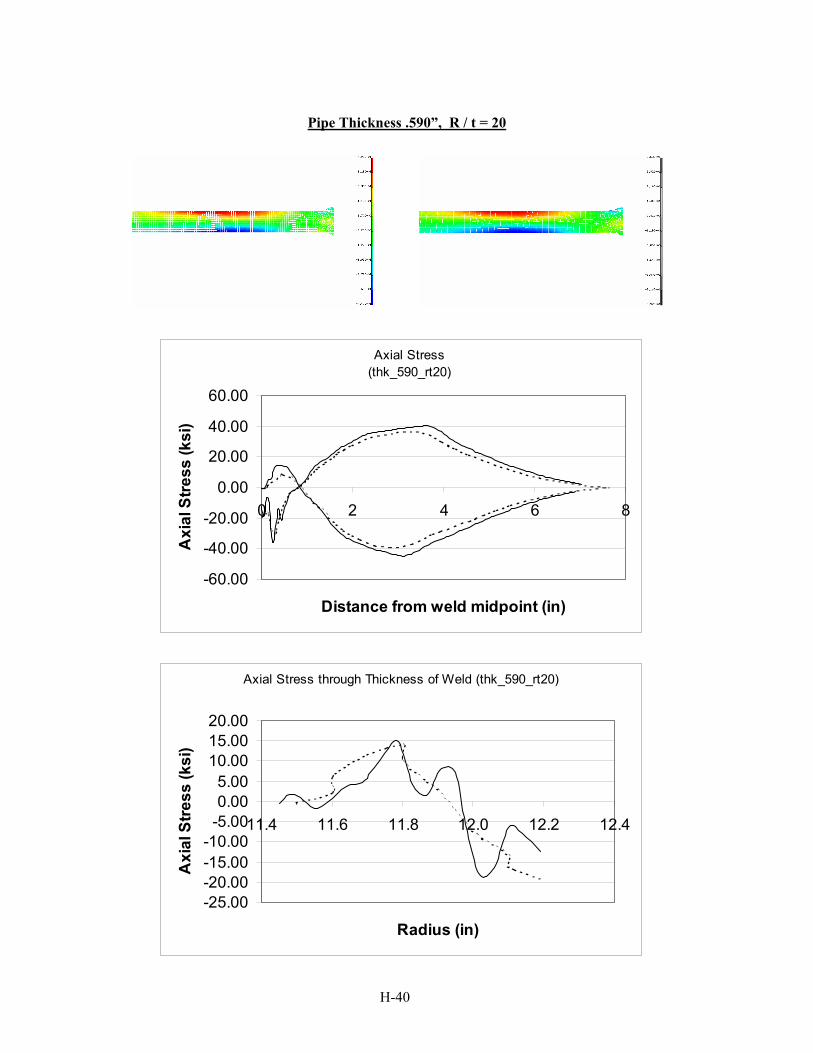
H-40
Pipe Thickness .590”, R / t = 20
Axial Stress (thk_590_rt20)
-60.00
-40.00
-20.00
0.00
20.00
40.00
60.00
0 2 4 6 8
Distance from weld midpoint (in)
Axi
al S
tress
(ksi
)
Axial Stress through Thickness of Weld (thk_590_rt20)
-25.00-20.00-15.00-10.00
-5.000.005.00
10.0015.0020.00
11.4 11.6 11.8 12.0 12.2 12.4
Radius (in)
Axi
al S
tress
(ksi
)

H-41
Hoop Stress (thk590_rt20_hoop)
-60.0
-40.0
-20.0
0.0
20.0
40.0
60.0
80.0
0 1 2 3 4 5 6 7 8
Distance from Weld Midplane (in.)
Stre
ss (k
si.)
Hoop Stress Through Thickness Weld (thk590_rt20_hoop)
0.0
10.0
20.0
30.0
40.0
50.0
60.0
70.0
80.0
11.4 11.6 11.8 12.0 12.2 12.4
Radius (in.)
Stre
ss (k
si.)
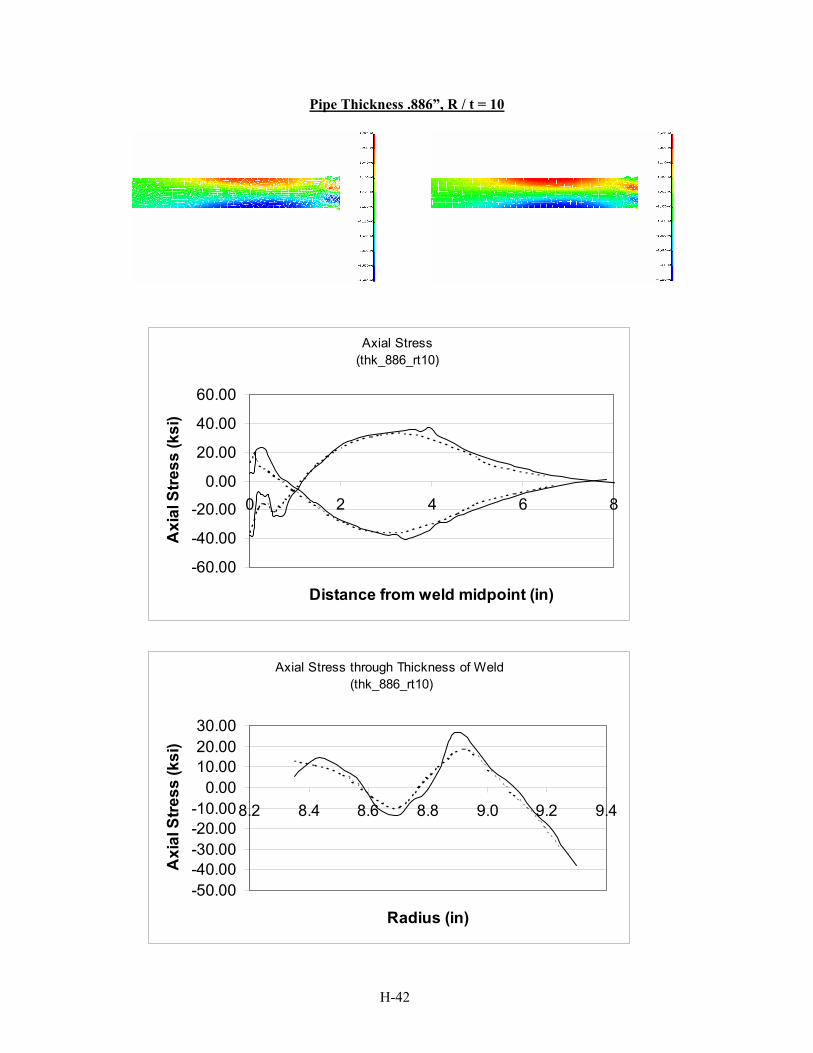
H-42
Pipe Thickness .886”, R / t = 10
Axial Stress (thk_886_rt10)
-60.00
-40.00
-20.00
0.00
20.00
40.00
60.00
0 2 4 6 8
Distance from weld midpoint (in)
Axi
al S
tress
(ksi
)
Axial Stress through Thickness of Weld (thk_886_rt10)
-50.00-40.00-30.00-20.00-10.00
0.0010.0020.0030.00
8.2 8.4 8.6 8.8 9.0 9.2 9.4
Radius (in)
Axi
al S
tress
(ksi
)
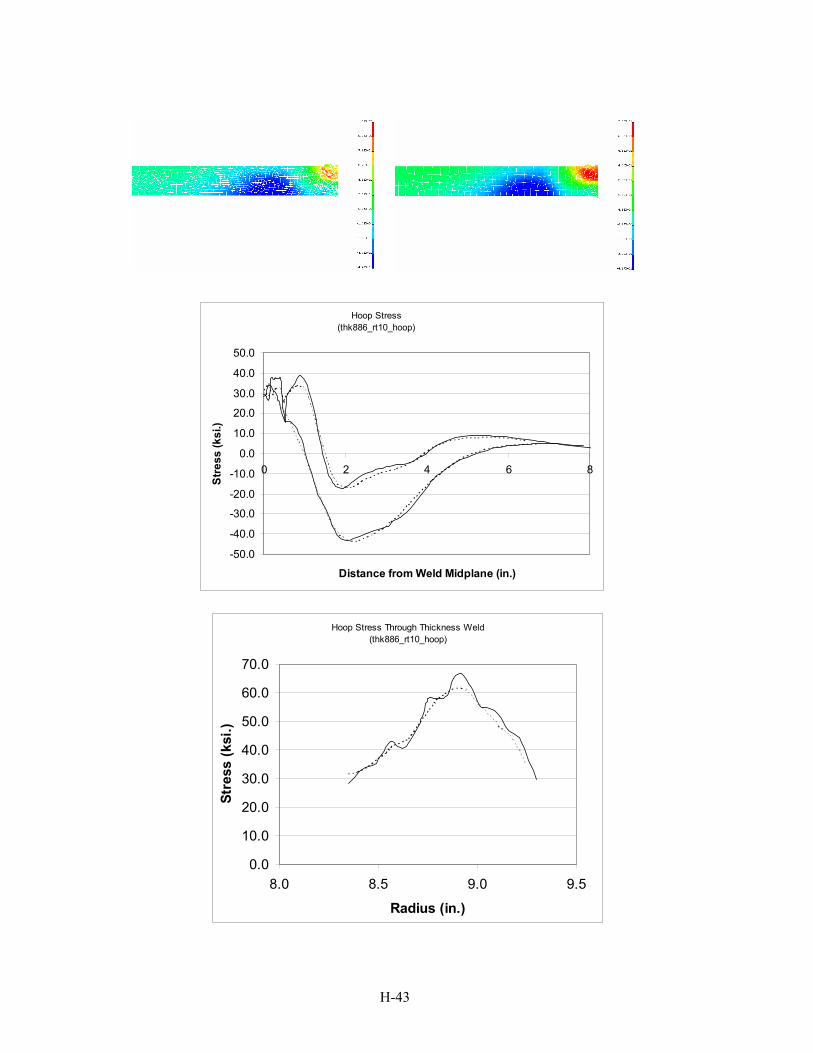
H-43
Hoop Stress (thk886_rt10_hoop)
-50.0
-40.0
-30.0
-20.0
-10.0
0.0
10.0
20.0
30.0
40.0
50.0
0 2 4 6 8
Distance from Weld Midplane (in.)
Stre
ss (k
si.)
Hoop Stress Through Thickness Weld (thk886_rt10_hoop)
0.0
10.0
20.0
30.0
40.0
50.0
60.0
70.0
8.0 8.5 9.0 9.5
Radius (in.)
Stre
ss (k
si.)
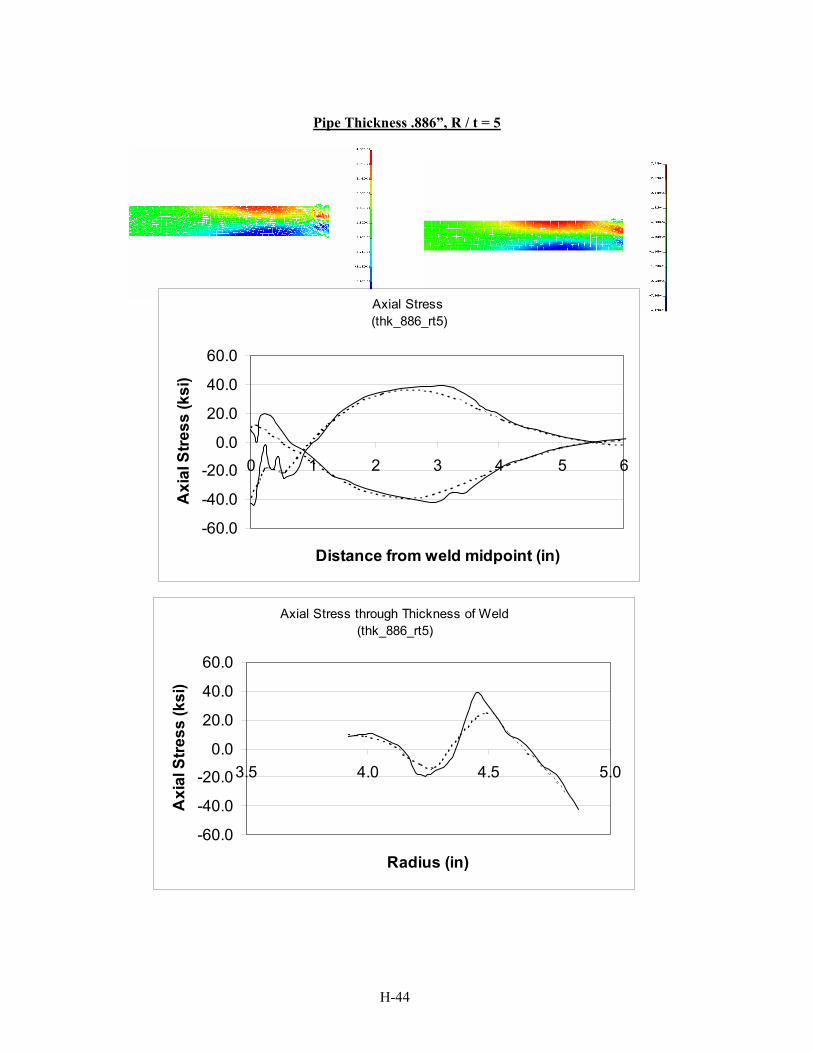
H-44
Pipe Thickness .886”, R / t = 5
Axial Stress (thk_886_rt5)
-60.0
-40.0
-20.0
0.0
20.0
40.0
60.0
0 1 2 3 4 5 6
Distance from weld midpoint (in)
Axi
al S
tress
(ksi
)
Axial Stress through Thickness of Weld (thk_886_rt5)
-60.0
-40.0
-20.0
0.0
20.0
40.0
60.0
3.5 4.0 4.5 5.0
Radius (in)
Axi
al S
tress
(ksi
)

H-45
Hoop Stress (thk886_rt5_hoop)
-50.0
-40.0
-30.0
-20.0
-10.0
0.0
10.0
20.0
30.0
40.0
50.0
0 2 4 6 8
Distance from Weld Midplane (in.)
Stre
ss (k
si.)
Hoop Stress Through Thickness Weld (thk886_rt5_hoop)
0.0
10.0
20.0
30.0
40.0
50.0
60.0
70.0
3.5 4.0 4.5 5.0
Radius (in.)
Stre
ss (k
si.)
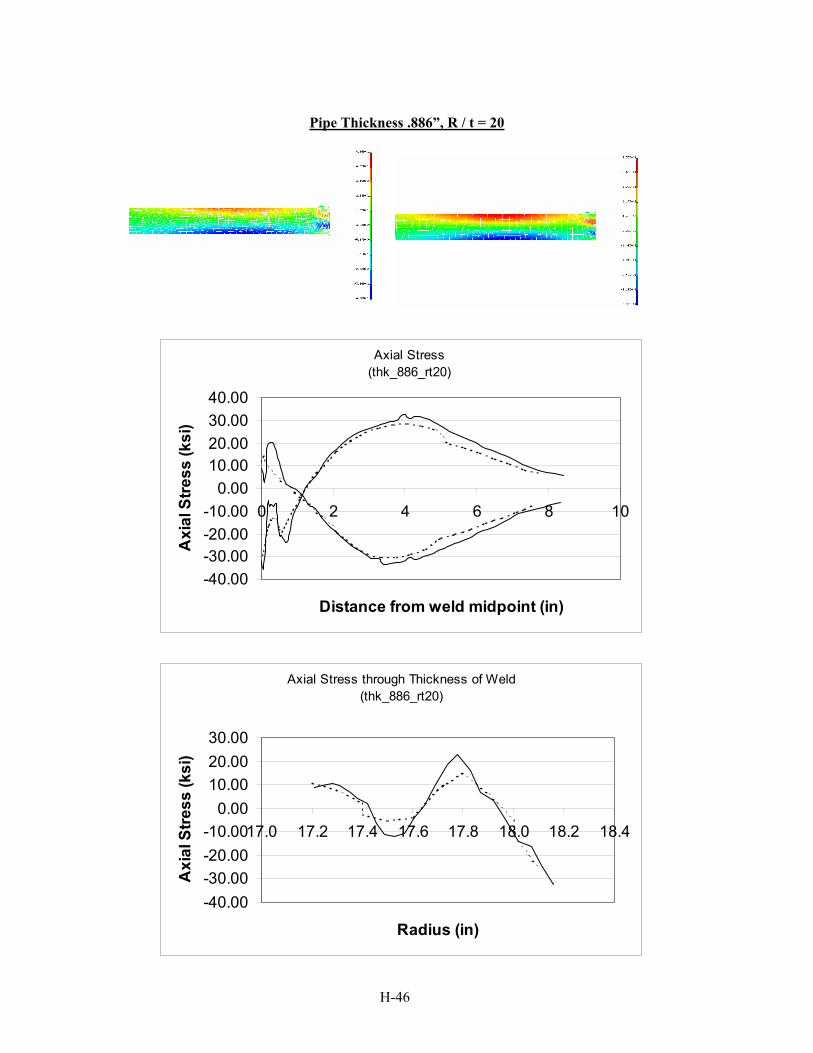
H-46
Pipe Thickness .886”, R / t = 20
Axial Stress (thk_886_rt20)
-40.00-30.00-20.00-10.00
0.0010.0020.0030.0040.00
0 2 4 6 8 10
Distance from weld midpoint (in)
Axi
al S
tress
(ksi
)
Axial Stress through Thickness of Weld (thk_886_rt20)
-40.00-30.00-20.00-10.00
0.0010.0020.0030.00
17.0 17.2 17.4 17.6 17.8 18.0 18.2 18.4
Radius (in)
Axi
al S
tress
(ksi
)
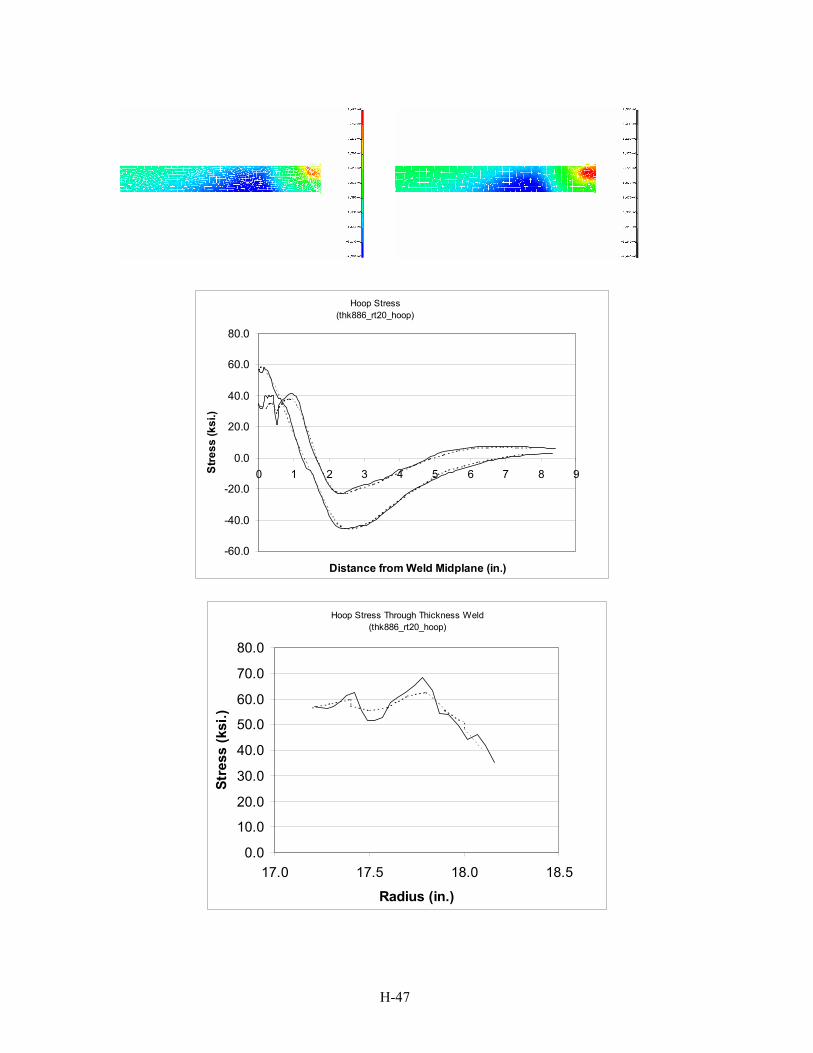
H-47
Hoop Stress (thk886_rt20_hoop)
-60.0
-40.0
-20.0
0.0
20.0
40.0
60.0
80.0
0 1 2 3 4 5 6 7 8 9
Distance from Weld Midplane (in.)
Stre
ss (k
si.)
Hoop Stress Through Thickness Weld (thk886_rt20_hoop)
0.0
10.0
20.0
30.0
40.0
50.0
60.0
70.0
80.0
17.0 17.5 18.0 18.5
Radius (in.)
Stre
ss (k
si.)
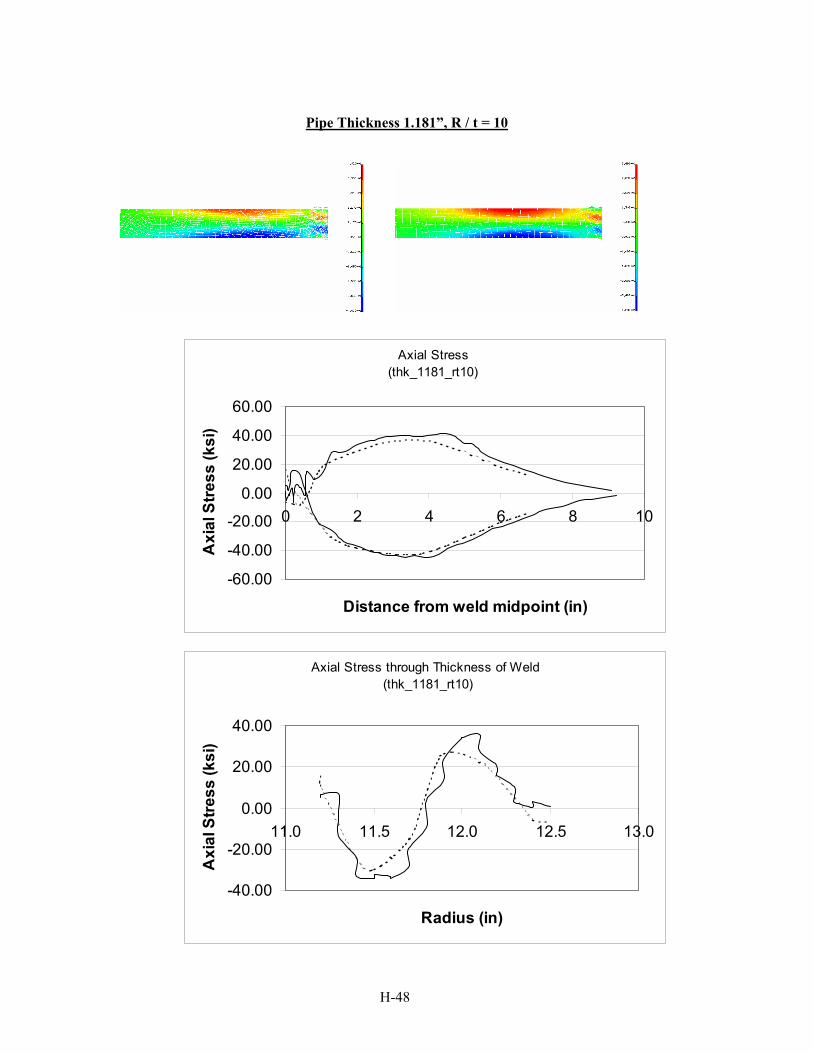
H-48
Pipe Thickness 1.181”, R / t = 10
Axial Stress (thk_1181_rt10)
-60.00
-40.00
-20.00
0.00
20.00
40.00
60.00
0 2 4 6 8 10
Distance from weld midpoint (in)
Axi
al S
tress
(ksi
)
Axial Stress through Thickness of Weld (thk_1181_rt10)
-40.00
-20.00
0.00
20.00
40.00
11.0 11.5 12.0 12.5 13.0
Radius (in)
Axi
al S
tress
(ksi
)
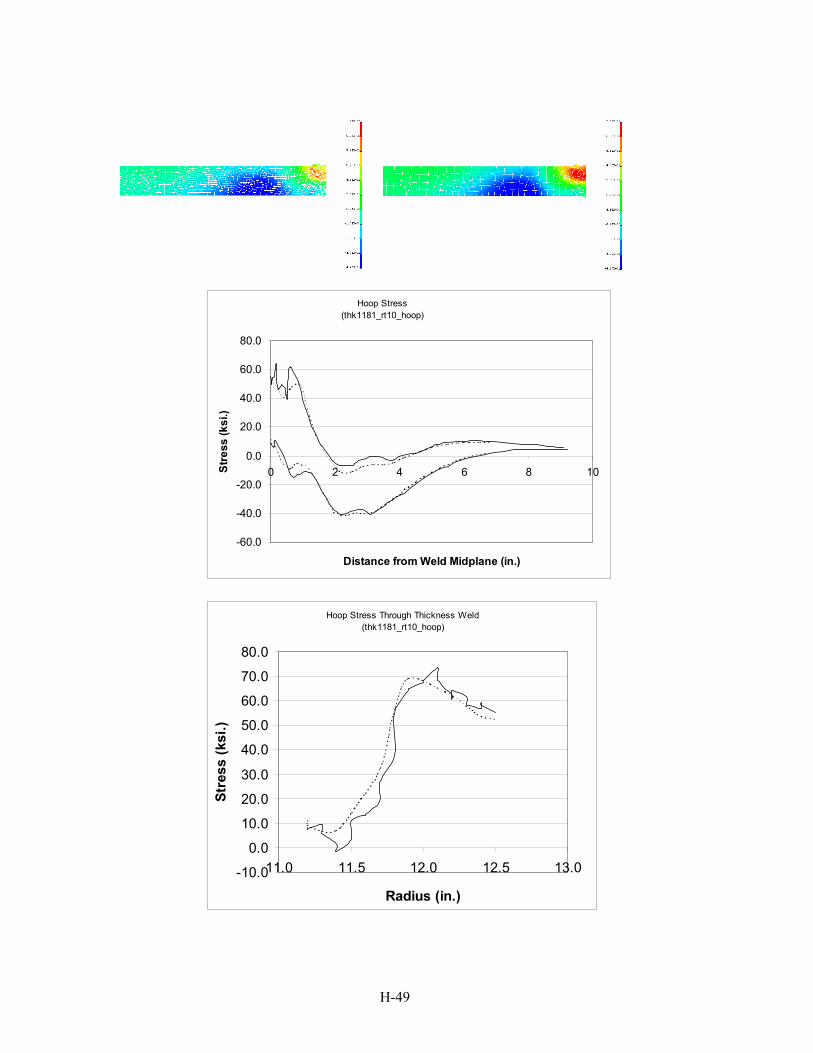
H-49
Hoop Stress (thk1181_rt10_hoop)
-60.0
-40.0
-20.0
0.0
20.0
40.0
60.0
80.0
0 2 4 6 8 10
Distance from Weld Midplane (in.)
Stre
ss (k
si.)
Hoop Stress Through Thickness Weld (thk1181_rt10_hoop)
-10.0
0.0
10.0
20.0
30.0
40.0
50.0
60.0
70.0
80.0
11.0 11.5 12.0 12.5 13.0
Radius (in.)
Stre
ss (k
si.)
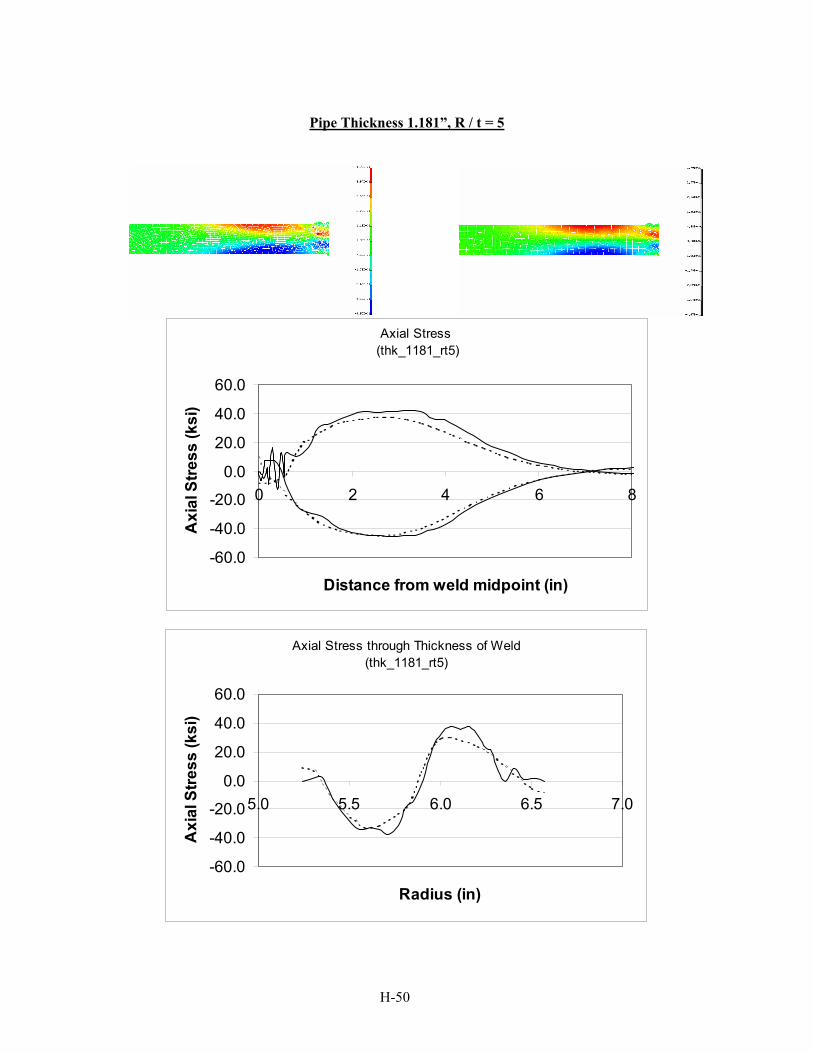
H-50
Pipe Thickness 1.181”, R / t = 5
Axial Stress (thk_1181_rt5)
-60.0
-40.0
-20.0
0.0
20.0
40.0
60.0
0 2 4 6 8
Distance from weld midpoint (in)
Axi
al S
tress
(ksi
)
Axial Stress through Thickness of Weld (thk_1181_rt5)
-60.0
-40.0
-20.0
0.0
20.0
40.0
60.0
5.0 5.5 6.0 6.5 7.0
Radius (in)
Axi
al S
tress
(ksi
)
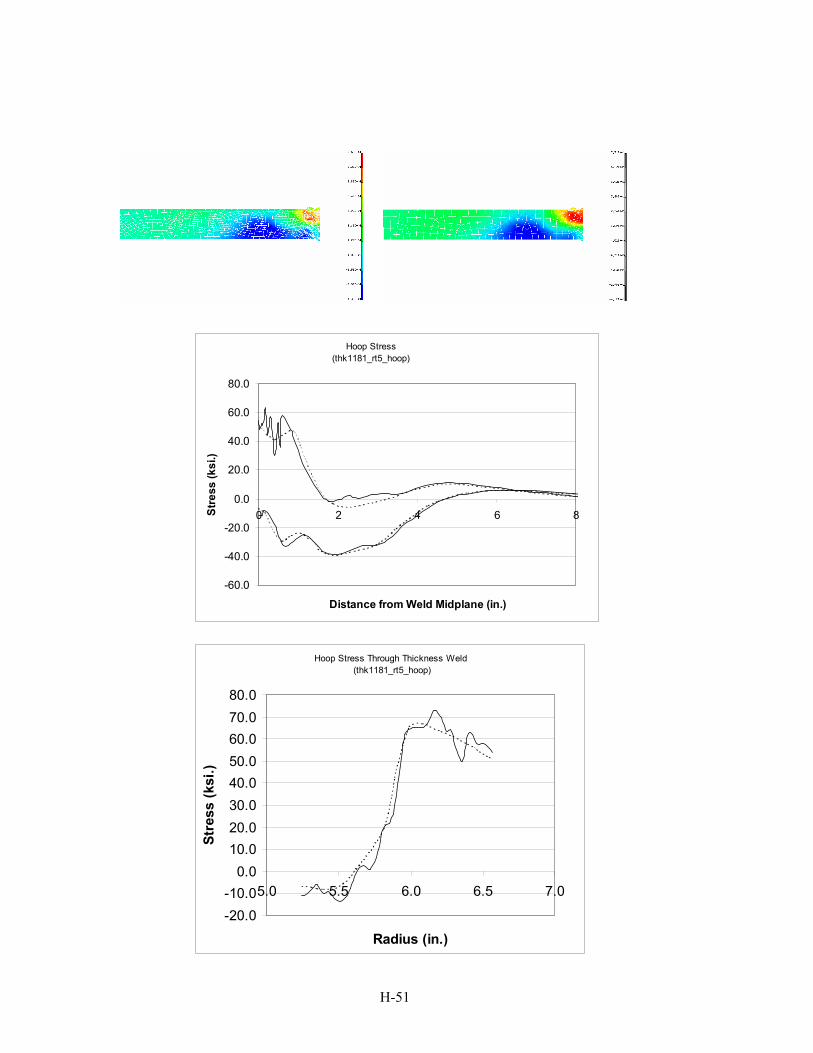
H-51
Hoop Stress (thk1181_rt5_hoop)
-60.0
-40.0
-20.0
0.0
20.0
40.0
60.0
80.0
0 2 4 6 8
Distance from Weld Midplane (in.)
Stre
ss (k
si.)
Hoop Stress Through Thickness Weld (thk1181_rt5_hoop)
-20.0-10.0
0.010.020.030.040.050.060.070.080.0
5.0 5.5 6.0 6.5 7.0
Radius (in.)
Stre
ss (k
si.)
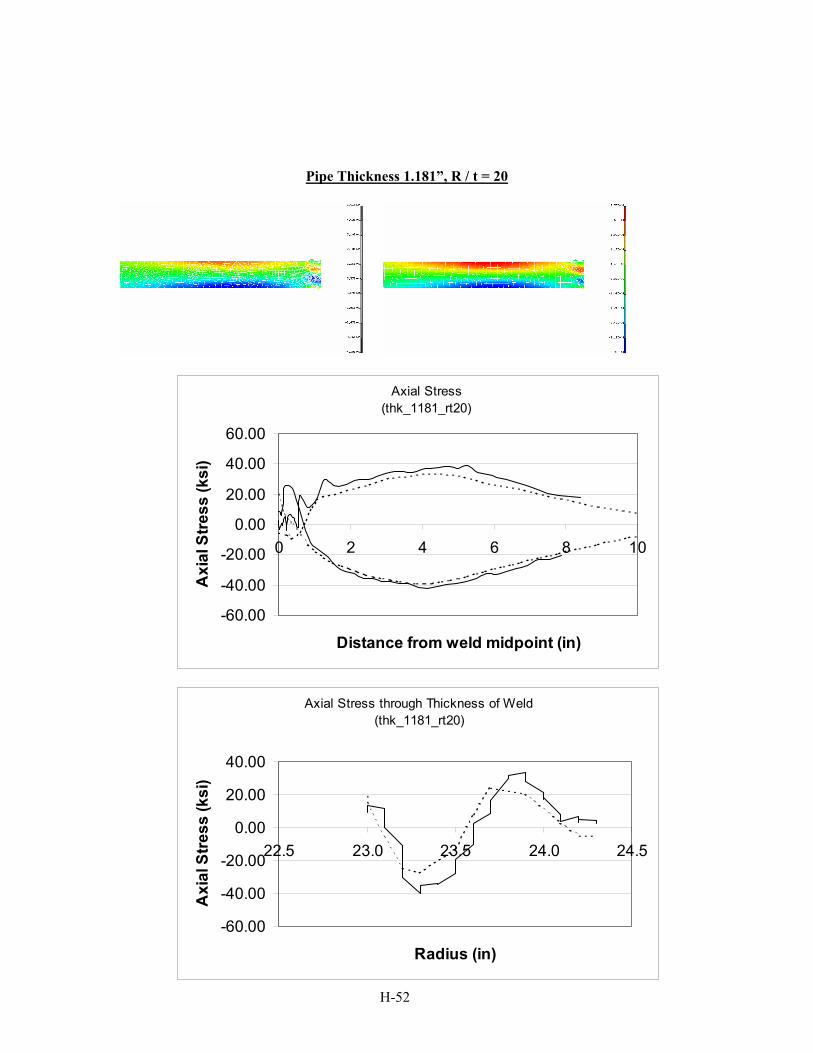
H-52
Pipe Thickness 1.181”, R / t = 20
Axial Stress (thk_1181_rt20)
-60.00
-40.00
-20.00
0.00
20.00
40.00
60.00
0 2 4 6 8 10
Distance from weld midpoint (in)
Axi
al S
tress
(ksi
)
Axial Stress through Thickness of Weld (thk_1181_rt20)
-60.00
-40.00
-20.00
0.00
20.00
40.00
22.5 23.0 23.5 24.0 24.5
Radius (in)
Axi
al S
tress
(ksi
)
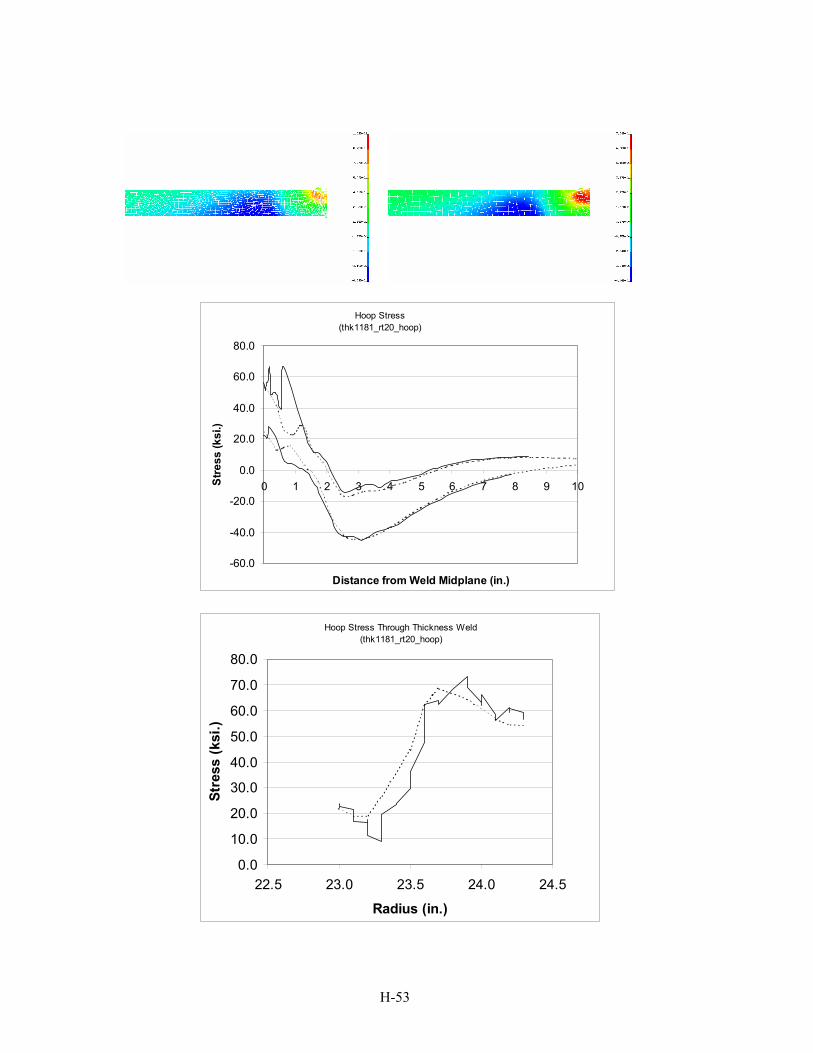
H-53
Hoop Stress (thk1181_rt20_hoop)
-60.0
-40.0
-20.0
0.0
20.0
40.0
60.0
80.0
0 1 2 3 4 5 6 7 8 9 10
Distance from Weld Midplane (in.)
Stre
ss (k
si.)
Hoop Stress Through Thickness Weld (thk1181_rt20_hoop)
0.0
10.0
20.0
30.0
40.0
50.0
60.0
70.0
80.0
22.5 23.0 23.5 24.0 24.5
Radius (in.)
Stre
ss (k
si.)
Related Documents