Appendix E Education and Health: A Review and Assessment Nancy Murray, Luisa Franzini, Dritana Marko, Philip Lupo, Jr., Julie Garza, and Stephen Linder

Welcome message from author
This document is posted to help you gain knowledge. Please leave a comment to let me know what you think about it! Share it to your friends and learn new things together.
Transcript
Appendix E
Education and Health: A Review and Assessment
Nancy Murray, Luisa Franzini, Dritana Marko, Philip Lupo, Jr., Julie Garza, and Stephen Linder

Appendix E
Education and Health: A Review and Assessment
Prepared by Nancy Murray, Ph.D., Luisa Franzini, Ph.D.,, Dritana Marko, M.D.,
Philip Lupo, Jr., M.P.H., Julie Garza, M.P.H., and Stephen Linder, Ph.D. Institute for Health Policy
The University of Texas Health Science Center – Houston
August 2005
EXECUTIVE SUMMARY The interaction between education and health is both complex and cyclical. Health in childhood affects academic performance; while in adulthood, level of education has a lasting effect on health prospects. A number of studies have attempted to elucidate parts of this interaction. Here, we consider the evidence on how educational attainment affects health status in adults, but concentrate on the linkages between chronic health conditions in children and their academic performance. Children of parents with lower educational attainment tend to model the poorer health prospects of their parents. As these children become adults and have offspring of their own, a pattern or cycle develops. If we intervene upon the health of children through certain school-based programs, the negative cycle can be broken. In other words, we improve not only children’s health, but also academic performance, and subsequently educational attainment. This influences a life course that positively shapes the lives of future generations.
Our purpose is to scrutinize the scientific evidence behind these linkages as a basis for
recommending ways to make improvements in both health and education. Again, we focus on interventions in childhood, specifically on those that are school-based. While there has been substantial attention to recommended ways to intervene during the school day – we list more than 100 from recent reports – surprisingly few have any documented impact on academic performance. The few that are supported by scientific research will be highlighted.
The report is divided into three parts. The first part addresses how health is linked to academic performance. To assess this link adequately, we examine the most prevalent, chronic, health conditions that are thought to impair academic performance in children. Conditions assessed include overweight and obesity, asthma, diabetes, depression, epilepsy, sleep disorders and sickle cell anemia. Because of our interest in non-medical, school-based interventions, much of our attention focuses on overweight, asthma and diabetes.
School-Based Interventions
Child Health Status
Adult Health Status
Educational Attainment
Academic Performance
E-ii
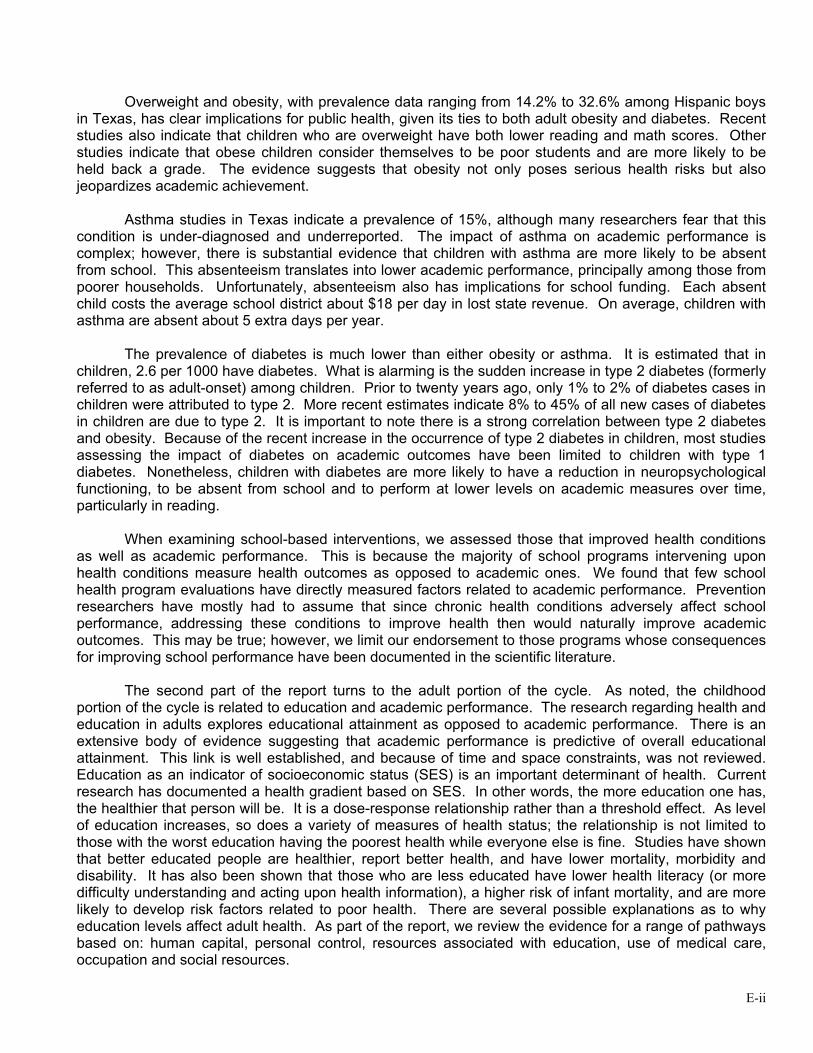
Overweight and obesity, with prevalence data ranging from 14.2% to 32.6% among Hispanic boys
in Texas, has clear implications for public health, given its ties to both adult obesity and diabetes. Recent studies also indicate that children who are overweight have both lower reading and math scores. Other studies indicate that obese children consider themselves to be poor students and are more likely to be held back a grade. The evidence suggests that obesity not only poses serious health risks but also jeopardizes academic achievement.
Asthma studies in Texas indicate a prevalence of 15%, although many researchers fear that this
condition is under-diagnosed and underreported. The impact of asthma on academic performance is complex; however, there is substantial evidence that children with asthma are more likely to be absent from school. This absenteeism translates into lower academic performance, principally among those from poorer households. Unfortunately, absenteeism also has implications for school funding. Each absent child costs the average school district about $18 per day in lost state revenue. On average, children with asthma are absent about 5 extra days per year.
The prevalence of diabetes is much lower than either obesity or asthma. It is estimated that in
children, 2.6 per 1000 have diabetes. What is alarming is the sudden increase in type 2 diabetes (formerly referred to as adult-onset) among children. Prior to twenty years ago, only 1% to 2% of diabetes cases in children were attributed to type 2. More recent estimates indicate 8% to 45% of all new cases of diabetes in children are due to type 2. It is important to note there is a strong correlation between type 2 diabetes and obesity. Because of the recent increase in the occurrence of type 2 diabetes in children, most studies assessing the impact of diabetes on academic outcomes have been limited to children with type 1 diabetes. Nonetheless, children with diabetes are more likely to have a reduction in neuropsychological functioning, to be absent from school and to perform at lower levels on academic measures over time, particularly in reading.
When examining school-based interventions, we assessed those that improved health conditions
as well as academic performance. This is because the majority of school programs intervening upon health conditions measure health outcomes as opposed to academic ones. We found that few school health program evaluations have directly measured factors related to academic performance. Prevention researchers have mostly had to assume that since chronic health conditions adversely affect school performance, addressing these conditions to improve health then would naturally improve academic outcomes. This may be true; however, we limit our endorsement to those programs whose consequences for improving school performance have been documented in the scientific literature.
The second part of the report turns to the adult portion of the cycle. As noted, the childhood
portion of the cycle is related to education and academic performance. The research regarding health and education in adults explores educational attainment as opposed to academic performance. There is an extensive body of evidence suggesting that academic performance is predictive of overall educational attainment. This link is well established, and because of time and space constraints, was not reviewed. Education as an indicator of socioeconomic status (SES) is an important determinant of health. Current research has documented a health gradient based on SES. In other words, the more education one has, the healthier that person will be. It is a dose-response relationship rather than a threshold effect. As level of education increases, so does a variety of measures of health status; the relationship is not limited to those with the worst education having the poorest health while everyone else is fine. Studies have shown that better educated people are healthier, report better health, and have lower mortality, morbidity and disability. It has also been shown that those who are less educated have lower health literacy (or more difficulty understanding and acting upon health information), a higher risk of infant mortality, and are more likely to develop risk factors related to poor health. There are several possible explanations as to why education levels affect adult health. As part of the report, we review the evidence for a range of pathways based on: human capital, personal control, resources associated with education, use of medical care, occupation and social resources.

E-iii
The human capital approach suggests that education improves the individual’s ability to produce health. Education enables people to integrate health producing behaviors into a lifestyle, and this lifestyle leads to control, augmenting the ability to use education as “capital” to produce health. The second pathway examined is personal control. As this perspective implies, education promotes a belief that the individual can alter his or her environment, which ultimately leads to adoption of a healthy lifestyle. Education also provides material resources, primarily a higher income. Several studies have indicated the positive effect of income on health. Use of medical care is not a sufficient explanation as to why more educated people are healthier. In fact, several studies indicate that low-income individuals use more medical services. Occupation is another possible link between education and health. Better educated people tend to work in jobs that are more rewarding financially and personally. Lower educated individuals, particularly men, tend to be employed in more hazardous occupations. Finally, social resources such as supportive relationships are more common in those with higher education. This may impart a protective effect against certain risk factors related to poor health. The third and concluding part of the report examines the multitude of recommendations that exist in the scientific literature and policy reports we reviewed. Many of the recommendations are vague, and few are supported by evidence of success. Fewer still are based on evidence of improved academic outcomes. We propose our own recommendations based on this evidentiary approach, also paying attention to the state of policy in Texas. Another concluding consideration is how chronic health conditions affect attendance and ultimately school funding. If chronic conditions increase absenteeism, they also result in a cost burden for schools, given that student attendance rates influence school funding. We sought to determine the formula that the Texas Education Agency uses to allocate funds for Texas school districts. Based on that formula we estimate the daily cost for one student’s absence is between $17 and $18. Table 1 compares estimates of per-pupil/per-day costs from several independent resources. Also, if average daily attendance is increased by 1%, Texas school districts could receive an additional $130 million from the state. Table 1, reproduced here from Part Three, shows the range of estimates available. To be sure, interventions that reduce absenteeism for less than about $18 per student will pay for themselves, over and above the benefits brought to the children they serve.
OrganizationPer Pupil State Expenditure ($)
Per Pupil State Expenditure per Day ($) Source of Information
Humble Independent School District 57141 32.29a http://www.humble.k12.tx.us/legislativ
eInfo_attendance.htm
Fort Worth Independent School District 47202 26.22b http://www.fortworthisd.org/comm/me
dia/05_13_05.pdf
Action for Healthy Kids 9.00-20.00c http://www.actionforhealthykids.org/devel/pdf/LC_Color_120204_final.pdf
Average District 31153 17.31d Action for Healthy Kids estimates
Houston ISD 16523 9.18d Action for Healthy Kids estimates
Institute for Health Policy 31454 17.50e
a Information from website; b Information from website (per student expenditure/days of instruction = 4,720/180); c Report information; d Information provided by Action for Healthy Kids; e Proper estimation
Table 1. Comparison of per student per day costs
1Information retrieved 2005/07/27; 22003-2004; 3 Per pupil revenue from state,Texas,1999-2000; 4 2002-03;

E-iv
Recommendations In determining our recommendations, we applied a “funnel” approach to pare down the hundreds of recommendations found in current policy reports. Of the recommendations for child health interventions, we selected those that were school-based programs and then narrowed this set to those that had evidence of some effect on academic performance. Finally, we reviewed Texas policy and practices to identify areas where improvement was possible. School-Based Nutrition Interventions Failure to eat breakfast and undernutrition have been shown to adversely affect children’s ability to problem solve in school and potentially have long-lasting effects on a child’s cognitive development and performance in school. One recent study indicated that children in a School Breakfast Program (SBP) had increased language, math and reading scores, as well as reduced tardiness. Another study demonstrated that participation in an SBP reduced absenteeism and improved math scores, although no difference was found in reading, social studies or science. Similar, well-designed studies replicate these results: children who participate in an SBP have higher math grades and lower absence and tardiness rates. Unlike many other areas of school health, the affects of this intervention on academic performance are consistent and significant.
• Based on compelling evidence of impact on academic performance, we recommend an expansion of the School Breakfast Program (SBP) in Texas schools.
The Texas Department of Agriculture established the Texas Public School Nutrition Policy which addresses the issue of SBP, along with other nutrition and food service policies in public schools. For the fiscal year 2003 – 2004, 6,903 Texas schools participated in the SBP. This is impressive when one considers there are 7,009 public schools in Texas. However, according to the Texas Joint Interim Committee on Nutrition and Health in Public Schools, Interim Report to the 79th Legislature, only 26% of students are actually getting a school breakfast. We recommend extending the school breakfast program to a larger number of students as a reliable means of improving academic performance while, at the same time, addressing chronic under-nourishment. School-Based Physical Activity Interventions The benefits of physical activity on health are well accepted; however, there is evidence that increasing its presence in school curricula does not impair academic achievement and may also improve school performance. Based on these findings, we recommend increasing the requirement of physical activity in Texas schools. The Texas Administrative Code (TAC §74.32) requires enrolled K-6 students to participate in a minimum of 30 minutes per day or 135 minutes per week of physical activity. The U.S. Department of Human Services and U.S. Department of Agriculture recommends 60 minutes or more of moderate to vigorous physical activity based on the most current research.
• Given the strength of the evidence, we recommend that Texas schools increase their physical activity requirements to 60 minutes per day.
Project SPARK, an elementary school physical education program, demonstrated significant gains for reading, losses for language, and no differences for math scores on a standardized test, suggesting that, even with time taken away from the academic program for physical education, overall academic functioning was not impaired. Another physical education program incorporating fitness or skill training for 75 minutes a day, compared to usual physical education offered three times a week for 30 minutes, demonstrated increased math scores, better classroom behavior as rated by teachers and no significant reduction in reading test scores compared with controls. Regarding level of fitness and academic performance, the California Department of Education has demonstrated a significant linear association
E-v
between standardized test scores (Stanford Achievement Test Ninth Edition [SAT-9]) and their fitness scores. A dose-response effect was noted for all grades studied where the highest SAT-9 scores were reported by students who met three or more standard levels among the six physical fitness measures, particularly among females, and particularly for mathematics rather than for reading scores. While physical activity may be very important for preventing obesity and diabetes in children, it most likely will also improve academic performance. School-Based Asthma Management Interventions The effectiveness of programs for asthma management has been well documented in a series of well-designed studies. Not only was absenteeism reduced but test scores improved in a number of areas. While Texas has policies that address environmental triggers of asthmatic episodes, there is no written policy on asthma education programs for children or staff or recommendations for schools to consider them.
• Based on compelling evidence, we recommend that Texas schools adopt asthma management education for affected children and support staff.
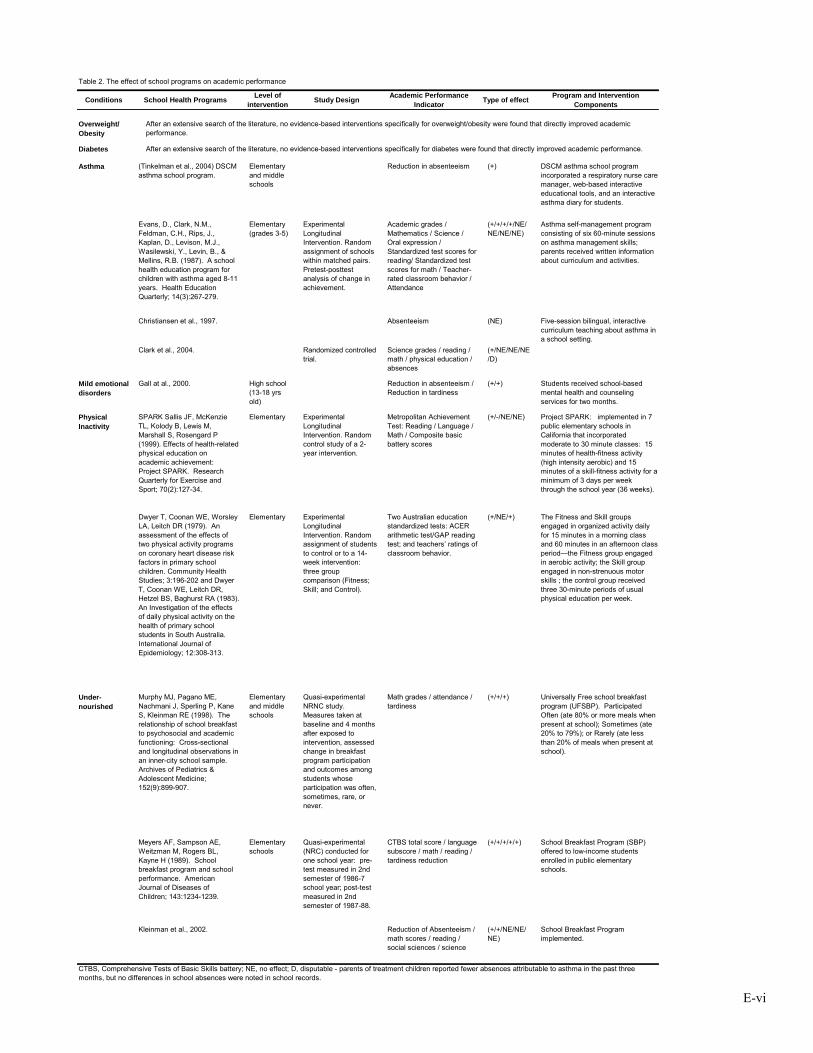
Table 2 is drawn from the text in Part Three and summarizes the research findings linking school-
based interventions and academic performance.
E-vi
Table 2. The effect of school programs on academic performance
Conditions School Health Programs Level of intervention Study Design Academic Performance
Indicator Type of effect Program and Intervention Components
Overweight/ Obesity
Diabetes
Asthma (Tinkelman et al., 2004) DSCM asthma school program.
Elementary and middle schools
Reduction in absenteeism (+) DSCM asthma school program incorporated a respiratory nurse care manager, web-based interactive educational tools, and an interactive asthma diary for students.
Evans, D., Clark, N.M., Feldman, C.H., Rips, J., Kaplan, D., Levison, M.J., Wasilewski, Y., Levin, B., & Mellins, R.B. (1987). A school health education program for children with asthma aged 8-11 years. Health Education Quarterly; 14(3):267-279.
Elementary (grades 3-5)
Experimental Longitudinal Intervention. Random assignment of schools within matched pairs. Pretest-posttest analysis of change in achievement.
Academic grades / Mathematics / Science / Oral expression / Standardized test scores for reading/ Standardized test scores for math / Teacher-rated classroom behavior / Attendance
(+/+/+/+/NE/NE/NE/NE)
Asthma self-management program consisting of six 60-minute sessions on asthma management skills; parents received written information about curriculum and activities.
Christiansen et al., 1997. Absenteeism (NE) Five-session bilingual, interactive curriculum teaching about asthma in a school setting.
Clark et al., 2004. Randomized controlled trial.
Science grades / reading / math / physical education / absences
(+/NE/NE/NE/D)
Mild emotional disorders
Gall at al., 2000. High school (13-18 yrs old)
Reduction in absenteeism / Reduction in tardiness
(+/+) Students received school-based mental health and counseling services for two months.
Physical Inactivity
SPARK Sallis JF, McKenzie TL, Kolody B, Lewis M, Marshall S, Rosengard P (1999). Effects of health-related physical education on academic achievement: Project SPARK. Research Quarterly for Exercise and Sport; 70(2):127-34.
Elementary Experimental Longitudinal Intervention. Random control study of a 2-year intervention.
Metropolitan Achievement Test: Reading / Language / Math / Composite basic battery scores
(+/-/NE/NE) Project SPARK: implemented in 7 public elementary schools in California that incorporated moderate to 30 minute classes: 15 minutes of health-fitness activity (high intensity aerobic) and 15 minutes of a skill-fitness activity for a minimum of 3 days per week through the school year (36 weeks).
Dwyer T, Coonan WE, Worsley LA, Leitch DR (1979). An assessment of the effects of two physical activity programs on coronary heart disease risk factors in primary school children. Community Health Studies; 3:196-202 and Dwyer T, Coonan WE, Leitch DR, Hetzel BS, Baghurst RA (1983). An Investigation of the effects of daily physical activity on the health of primary school students in South Australia. International Journal of Epidemiology; 12:308-313.
Elementary Experimental Longitudinal Intervention. Random assignment of students to control or to a 14-week intervention: three group comparison (Fitness; Skill; and Control).
Two Australian education standardized tests: ACER arithmetic test/GAP reading test; and teachers’ ratings of classroom behavior.
(+/NE/+) The Fitness and Skill groups engaged in organized activity daily for 15 minutes in a morning class and 60 minutes in an afternoon class period—the Fitness group engaged in aerobic activity; the Skill group engaged in non-strenuous motor skills ; the control group received three 30-minute periods of usual physical education per week.
Under-nourished
Murphy MJ, Pagano ME, Nachmani J, Sperling P, Kane S, Kleinman RE (1998). The relationship of school breakfast to psychosocial and academic functioning: Cross-sectional and longitudinal observations in an inner-city school sample. Archives of Pediatrics & Adolescent Medicine; 152(9):899-907.
Elementary and middle schools
Quasi-experimental NRNC study. Measures taken at baseline and 4 months after exposed to intervention, assessed change in breakfast program participation and outcomes among students whose participation was often, sometimes, rare, or never.
Math grades / attendance / tardiness
(+/+/+) Universally Free school breakfast program (UFSBP). Participated Often (ate 80% or more meals when present at school); Sometimes (ate 20% to 79%); or Rarely (ate less than 20% of meals when present at school).
Meyers AF, Sampson AE, Weitzman M, Rogers BL, Kayne H (1989). School breakfast program and school performance. American Journal of Diseases of Children; 143:1234-1239.
Elementary schools
Quasi-experimental (NRC) conducted for one school year: pre-test measured in 2nd semester of 1986-7 school year; post-test measured in 2nd semester of 1987-88.
CTBS total score / language subscore / math / reading / tardiness reduction
(+/+/+/+/+) School Breakfast Program (SBP) offered to low-income students enrolled in public elementary schools.
Kleinman et al., 2002. Reduction of Absenteeism / math scores / reading / social sciences / science
(+/+/NE/NE/NE)
School Breakfast Program implemented.
CTBS, Comprehensive Tests of Basic Skills battery; NE, no effect; D, disputable - parents of treatment children reported fewer absences attributable to asthma in the past three months, but no differences in school absences were noted in school records.
After an extensive search of the literature, no evidence-based interventions specifically for overweight/obesity were found that directly improved academic performance.
After an extensive search of the literature, no evidence-based interventions specifically for diabetes were found that directly improved academic performance.

INTRODUCTION Education plays a wide range of roles in our society. In addition to imparting certain cognitive and
interpersonal skills necessary for productive functioning, it also exerts a formative influence on the identities, norms and sentiments that work to integrate individuals into the larger society. Further, education is widely believed to be the key to social and economic advancement, with higher educational attainment thought to bring higher status, greater rewards and more valued accomplishments. These beliefs are firmly rooted in our cultural norms of individual achievement and upward mobility; they also help people make sense of their experiences with social stratification and resource disparities. Unfortunately, our system of mass, public education does not work equally well for everyone. And those whose academic performance is compromised by institutional or personal problems will sacrifice educational attainment and the promise of upward mobility. More importantly, as we will see, they are likely to sacrifice their health, as well.
Current research supports the notion that level of education matters not only for social and economic advancement but also for health status. In short, higher education yields better health. The gap in health status, however, is not limited to the contrast between those at the lowest educational levels and those at the highest. Each increase in level of education appears to make a positive difference for health status. When we consider this relationship across the adult population, it suggests that improvements in health might be made through indirect investment in educational opportunities. Most of this investment, however, is currently directed at children and young adults. Paradoxically, the offspring of parents of lower educational attainment, who are most in need of these opportunities, are also likely to have taken on the poorer health prospects of their parents. These children, in turn, are less likely to perform well academically or to attain a level of education that will enhance their own health status -- or the health status of their offspring. Children’s health, then, is important not only for its own sake, but also for its impact on academic performance and subsequently, through educational attainment, on children’s health prospects as adults. In effect, the relation between education and health across the life course assumes the form of a vicious cycle, where limited achievement and chronic health conditions become mutually reinforcing and reproduced in the next generation. The question is, can this cycle be broken? And if so, where do we best intervene in the cycle to prevent it from recurring?
There have been systematic efforts to prevent chronic health conditions in adults through literacy
campaigns and other kinds of educational interventions, especially for conditions linked to risky behavior. But these do little to mitigate the effects of poor educational attainment on social and economic advancement, a critical part of the cycle. While they can improve an adult’s health prospects, they may not be as effective at breaking the cycle as interventions attempted earlier in the life course. If we focus, instead, on the beginning of the cycle, with children whose chronic health conditions impair their academic performance, logically at least, chances should be better that we can improve both their health and economic prospects as adults. Because of the cost and complexity of fielding research that spans the full, education-and-health cycle, however, we are left with evidence on these kinds of prevention efforts that typically considers only one link in the cycle at a time. Accordingly, we will first identify the most prevalent chronic health conditions in school-age children, and then examine the available evidence documenting the impact these conditions have on academic performance. Next, we turn to an assessment of interventions intended to prevent or improve these health conditions. The interventions of greatest interest, for our purposes, are those purported to have direct implications for academic performance, as well as health. Since academic performance is largely confined to the school setting, we will concentrate on school-based interventions, perhaps, the largest class of prevention measures devoted to childhood after immunization.

E-2
The illustration above highlights the main linkages that make up the cycle. The childhood portion appears on the left of the cycle and the adult portion on the right. As noted earlier, our review of the evidence for these linkages concentrates on the relationships between health and education for children and adults and on school-based interventions on the childhood portion of the cycle. The table numbers appearing near the arrows in the figure correspond to our summary tables of findings from the scientific literature that will appear in subsequent sections of this report.
Our overall strategy in the first of three parts is to review all of the published, scientific literature relevant to each of the childhood links, paying special attention to the evidence that identifies interventions proven to work. Certainly, the weight of the evidence will vary with the number and quality of the published studies; in some instances, where much has been made of certain links, we will find that supporting evidence simply does not exist. Such interventions, supported largely by inference and reputation, seem to take on a life of their own. In other instances, simple, relatively inexpensive interventions will be shown to yield large dividends in academic performance. Our assessment will be ordered according to the prevalence of chronic, childhood health conditions. The link between these chronic conditions and academic performance will be considered first. The second link of interest is between school-based interventions and these chronic conditions; that is, we consider whether anything can be done during the school day to alleviate these conditions. Finally, we consider whether these health-oriented interventions are proven to make any difference for academic performance. Breaking the cycle depends upon it.
Part Two turns attention to the adult portion of the cycle, reviewing the extensive evidence relevant
to the link between educational attainment and health status in adulthood. This represents one of the most thoroughly documented of the links, at least in the health literature. To the extent that compromised academic performance in childhood impinges on overall educational attainment, affecting, say, high school completion or the pursuit of an advanced degree, then we are led to expect compromised health status in adulthood. Because of time and space constraints, however, we have not reviewed the extensive evidence linking academic performance to overall educational attainment. Similarly, the evidence linking parental educational attainment and health status to the health status of their offspring will have to await assessment on another occasion.
Part Three shifts away from an examination of the evidence behind the various links between
education and health to consider the issue of policy recommendations. Literally, hundreds of recommendations have been generated in more than 50 reports just in the last five years. The impetus for these has come from widespread perception of relatively dramatic increases in the prevalence of certain childhood conditions, most notably, obesity, Type II diabetes and asthma. Fortunately, for analytical purposes, the recommendations can be quickly pared down since few are supported by substantial evidence of success, and fewer still have been shown to make a difference for the academic achievement
Table 4
Table 5
School-Based Interventions
Child Health Status
Adult Health Status
Educational Attainment
Academic Performance
Table 2
Table 3
E-3
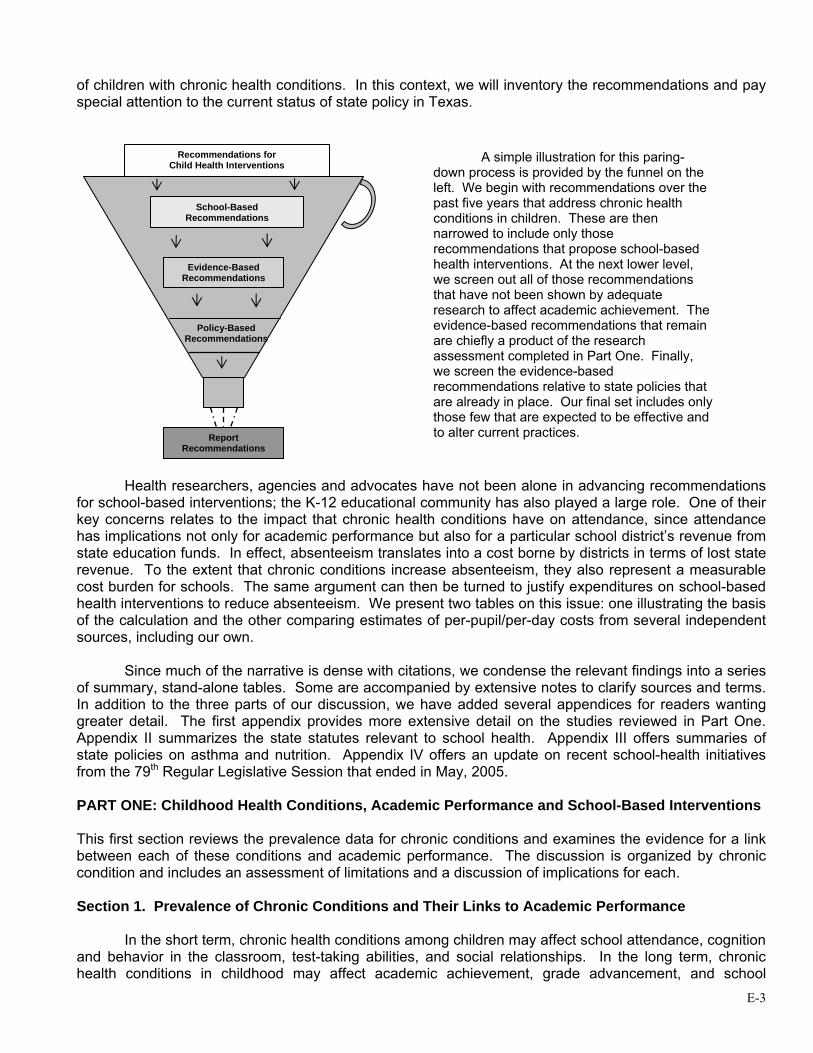
of children with chronic health conditions. In this context, we will inventory the recommendations and pay special attention to the current status of state policy in Texas.
Health researchers, agencies and advocates have not been alone in advancing recommendations
for school-based interventions; the K-12 educational community has also played a large role. One of their key concerns relates to the impact that chronic health conditions have on attendance, since attendance has implications not only for academic performance but also for a particular school district’s revenue from state education funds. In effect, absenteeism translates into a cost borne by districts in terms of lost state revenue. To the extent that chronic conditions increase absenteeism, they also represent a measurable cost burden for schools. The same argument can then be turned to justify expenditures on school-based health interventions to reduce absenteeism. We present two tables on this issue: one illustrating the basis of the calculation and the other comparing estimates of per-pupil/per-day costs from several independent sources, including our own.
Since much of the narrative is dense with citations, we condense the relevant findings into a series
of summary, stand-alone tables. Some are accompanied by extensive notes to clarify sources and terms. In addition to the three parts of our discussion, we have added several appendices for readers wanting greater detail. The first appendix provides more extensive detail on the studies reviewed in Part One. Appendix II summarizes the state statutes relevant to school health. Appendix III offers summaries of state policies on asthma and nutrition. Appendix IV offers an update on recent school-health initiatives from the 79th Regular Legislative Session that ended in May, 2005.
PART ONE: Childhood Health Conditions, Academic Performance and School-Based Interventions This first section reviews the prevalence data for chronic conditions and examines the evidence for a link between each of these conditions and academic performance. The discussion is organized by chronic condition and includes an assessment of limitations and a discussion of implications for each.
Section 1. Prevalence of Chronic Conditions and Their Links to Academic Performance
In the short term, chronic health conditions among children may affect school attendance, cognition and behavior in the classroom, test-taking abilities, and social relationships. In the long term, chronic health conditions in childhood may affect academic achievement, grade advancement, and school
Recommendations for Child Health Interventions
School-Based Recommendations
Report Recommendations
Policy-Based Recommendations
Evidence-Based Recommendations
A simple illustration for this paring-down process is provided by the funnel on the left. We begin with recommendations over the past five years that address chronic health conditions in children. These are then narrowed to include only those recommendations that propose school-based health interventions. At the next lower level, we screen out all of those recommendations that have not been shown by adequate research to affect academic achievement. The evidence-based recommendations that remain are chiefly a product of the research assessment completed in Part One. Finally, we screen the evidence-based recommendations relative to state policies that are already in place. Our final set includes only those few that are expected to be effective and to alter current practices.

E-4
completion. For our purposes, chronic health conditions in childhood include those amenable to some kind of school-based intervention, such as obesity, asthma, and diabetes, and those conditions that respond chiefly to medical management, such as epilepsy. How prevalent are these conditions in Texas? What is the effect of these health conditions on academic performance? Can academic achievement be enhanced with more effective school-based health interventions? In each instance, we look first to the peer-reviewed, scientific literature for an answer. At times, the results we cite will be accompanied by some technical detail in parentheses; these figures refer to either statistical estimates of particular measures or to their likelihood. Overweight and Obesity Prevalence. Overweight and obesity in children are widely perceived to be reaching alarming proportions. In Texas, a 2003 surveillance of children at the state level (Hoelscher et al., 2004) found the prevalence of overweight (body mass index greater than 95% of same-age and gender) to be 22.4% in fourth grade, 19.2% in eighth grade, and 15.5% in eleventh grade and to be highest among Hispanic boys (29.5% - 32.6%), fourth grade Hispanic girls (26.7%) and fourth and eighth-grade African-American girls (30.8% and 23.1%). For a more complete view of the range of estimates from a variety of sources, see Table 1. Among children found to be overweight, are there consequences for their academic performance? Overweight and Academic Performance. Two recent studies examined the effect of overweight on academic achievement and factors related to academic performance. Datar, Sturm, and Magnabosco (Datar et al., 2004) examined data from 11,192 kindergartners participating in the Early Childhood Longitudinal Study, a nationally representative sample of kindergarteners in the U.S. in 1998. This longitudinal study measured height and weight of the children in the fall of kindergarten, spring of kindergarten, and spring of first grade. Overweight was significantly associated with lower scores in reading for boys (1.42 points, p < .05) and girls (1.66 points, p<.05). Overweight boys (1.99 points, p < .05) and girls (1.21 points, p < .05) also scored lower in math. After controlling for additional factors related to academic performance (socio-economic status, parent-child interaction, birth weight, physical activity and TV-watching), overweight boys’ math test scores were still significantly lower than normal-weight boys. From a longitudinal perspective, there was no significant difference in test score gains during the first two years between overweight and non-overweight children after controlling for baseline scores. This finding suggests that the effect of overweight on academic achievement may derive from weight status at entry into kindergarten.
Falkner, et al., (Falkner et al., 2001) examined data from a statewide survey of adolescent health conducted in Connecticut in 1995/1996 among 9,943 seventh, ninth, and eleventh graders. This cross sectional study is limited as it relies on self-report of height and weight. However, after controlling for grade level, race, and parental socio-economic status, analysis suggests that obese (>95th percentile) girls were 1.51 times more likely to report being held back a grade (95% CI: 1.09, 2.10) and 2.09 times more likely to consider themselves poor students (95% CI: 1.35, 3.24). Obese boys were 1.46 times more likely to consider themselves poor students (95% CI: 1.05, 2.03) and 2.18 times more likely to report that they expect to quit school (95% CI: 1.45, 3.30) than average. Overweight (85th to 95th percentile) boys were 1.36 times more likely to consider themselves poor students (95% CI: 1.05, 1.76) and 1.54 times more likely to report that they expect to quit school (95% CI: 1.07, 2.22) than average weight boys. Study Limitations. In children and adolescents who are growing at different rates related to age and gender, establishing a criterion for overweight or obese, or for at-risk of overweight, has been challenging. Current guidelines are derived from the Centers for Disease Control and Prevention’s (CDC) Growth Charts (Kuczmarski, 2000). Charts are presented separately for age and gender groups but not for racial/ethnic groups, since factors related to differential growth by race/ethnicity are as yet unclear. The research on the relationship between overweight and academic performance is limited by the small number of studies, self-report measures of overweight, and controversy over the CDC Growth Charts.
E-5
Implications. Given the current prevalence of overweight conditions among children and the finding that as children age their later weight depends primarily on their earlier weight (Kelder et al., 2002), by the time they reach high school, we can expect that between a quarter and a third of them will be more likely to be held back a grade, consider themselves poor students and expect to quit school based on their overweight status. These inferences project current trends forward in time, assuming nothing interferes with them. The only way to be sure of them is to track children’s weight status carefully as they progress from grade school into high school. Asthma Prevalence. Asthma is another chronic health condition in childhood that has grown in prevalence over time, with research documenting an increasing impact on child health, academic performance and family functioning. The National Health Interview Survey conducted in 2002 revealed that 9 million U.S. children under the age of 18 have been diagnosed with asthma during their lifetime; that is 12% of U.S. children. More than 4 million children experienced an attack in the last 12 months (National Health Interview Survey, 2002). A recent telephone survey of 1,500 households in the South Plains/Panhandle region of Texas indicated that 15% of children had been diagnosed with asthma by a physician (Arif et al., 2004). Also in Texas, 10,500 children were admitted to a hospital for treatment of asthma in 2001; that is 170.1 admissions per 100,000 population (Texas Health Care Information Council, 2003). The 10,500 figure may underestimate the number of children living in Texas with the consequences of asthma, especially poorly managed asthma. Asthma surveillance in children is limited by issues of diagnostic criteria and access to health care, resulting in limited data on the prevalence of asthma. These difficulties contribute to unreliability in the estimates. For a clearer indication of these limitations, see Table 1. Asthma and Academic Performance. Studies of the impact of childhood asthma on school functioning have examined academic achievement, school absences, sleep disturbances, and restriction of physical activity and have made an effort to include physician-diagnosed and undiagnosed asthmatics. A recent study in North Carolina, in which 2,059 students from 25 of 30 middle schools in one district were surveyed about symptoms of asthma with the aid of a video depicting symptoms of asthma, found that 9% of the adolescents reported physician-diagnosed asthma with current symptoms and 27% reported wheezing but no diagnosis of asthma (Yeatts & Shy, 2001). Furthermore, physician-diagnosed asthmatics and “wheezers” were significantly more likely (2.6 and 1.8 times) to have missed school days than asymptomatic students and were substantially more likely (7.8 and 4.7 times) to report sleep disturbances. More than one-third of these students (36%) experienced functional consequences of asthma that are likely to negatively impact academic performance. The majority of these (27%) were efforts to cope with asthmatic symptoms without treatment. Joseph, Foxman, Leickly, Peterson, and Ownby (Joseph et al., 1996) conducted a study in Detroit in 1993, similar to the Yeatts and Shy study mentioned above, but undiagnosed asthmatics were identified through pulmonary function testing. Of the 230 third- through fifth-graders participating, 17.4% reported physician-diagnosed asthma and 14.3% were identified as undiagnosed asthmatics. Children who met symptom criteria were 7.1 times more likely to report sleep disturbances and 15 times more likely to miss physical education classes, than children without asthma. Children with physician-diagnosed asthma missed significantly more days of school than children without asthma. Undiagnosed asthmatics in this study typically missed 6 or more days of school. Maier, Arrighi, Morray, Llewllyn, and Redding’s 1995 study in Seattle (Maier et al., 1998) of 4,995 parents of first and second grade students found 11.5% of their sample to have physician-diagnosed asthma, and another 7.3% with current wheezing but no diagnosis. Compared to the asymptomatic population, both diagnosed and undiagnosed children reporting symptoms of asthma were 6 times more likely to miss school and 2 times more likely to experience sleep loss due to respiratory-related problems. An analysis of data from the 1988 National Health Interview Survey on Child Health gathered information from parents on 10,362 children in grades 1 through 12 (Fowler et al., 1985). Of these
E-6
children, 4.9% were reported to have had asthmatic symptoms in the past 12 months, a prevalence higher in males than females (5.8% vs. 4%), but varying little by race/ethnicity (although slightly higher among Black children), maternal education, or income. Compared with asymptomatic children, children with asthma missed more days of schools (7.6 mean days in previous 12 months vs. 2.5), had slightly higher rates of grade failure (17.5% vs. 14.6%), and higher rates of learning disabilities (9.1% vs. 5.2%). Three times as many asthmatic children from families with incomes less than $20,000 were described as in poor or fair health when compared to asthmatic children from families with incomes equal to or greater than $20,000. Asthmatic children described as in poor or fair health were absent substantially more days in the past year (17.4 days) than those in good or excellent health (6.7 days). Asthmatic children of poor families also had twice the odds of grade failure compared to well children. In contrast, for asthmatic children from higher income households (>$20,000) there was little increased risk of grade failure or learning disabilities. There is substantial evidence that children with asthma are more likely to be absent from school (Fowler et al., 1992) (Freudenberg et al., 1980; Joseph et al., 1996) (Maier et al., 1998) (O'Neil et al., 1985) (Parcel et al., 1979) (Silverstein et al., 2001) (Yeatts & Shy, 2001). However, the relationship between school absence and academic achievement for children with asthma has not been clarified in these studies. Gutstadt (Gutstadt et al., 1989) and ONeill (O'Neil et al., 1985) reported that, while children with asthma missed more days of school, academic performance was not necessarily related to school absences. These two studies relied on cross sectional designs, compromising the reliability of their conclusions. A longitudinal, case-control study of predominantly white, middle-class children from Rochester, Minnesota, relied on school records to document that asthmatic children missed an additional 2 days of school as compared to non-asthmatic children, but that school achievement was not significantly different between the two groups, as assessed by standardized test scores (Silverstein et al., 2001). Fowler’s (Fowler et al., 1992) analysis of national data from the National Health Interview Study found, however, that asthmatic children of poor families may be at increased risk of grade failure, suggesting that poor asthmatic children may be at greater risk for academic failure than their wealthier counterparts who appear able to compensate for missed days of school. Several studies have raised concerns about the effect of medications used in the management of chronic asthma on academic achievement. Gutstadt et al. (Gutstadt et al., 1989) conducted a study among 99 asthmatic children in grades 2-12 and found that a history of oral steroid use in the preceding year was significantly associated with lower mathematics and reading scores on standardized tests, even when controlling for socioeconomic status, age, and scores on the child behavior checklist. In contrast, Lindgren et al. (Lindgren & Lokshin, 1992) found that treatment with theophylline was not related to differences in standardized achievement test scores between 101 asthmatic children aged 6 to 18 and their sibling controls. This limited research on medication for management of asthma raises concern about treatment with oral steroids. Limitations. Research on asthmatic children in school settings is challenged by the reliable identification of children with asthma, as shown in a Detroit study by Joseph et al. (Joseph et al., 1996) where there were almost as many undiagnosed asthmatics as physician-diagnosed asthmatics. Disparities in access to health care may impede the proper diagnosis of asthma and affect the conduct of research with asthmatic children. Children of very poor families with access to health care, for example, may be more likely to be diagnosed than children of the lower middle class who lack insurance and access to health care. Implications. The evidence for the impact of asthma on academic achievement is complex but does suggest that asthma is related to school absences and may adversely affect academic performance for children from poor households. In addition, obesity has been found to be a risk factor for asthma in children (Bibi et al., 2004).
E-7
Diabetes
Prevalence. Diabetes in children, categorized as type 1 (Insulin Dependent Diabetes Mellitus or juvenile onset) and type 2 (formerly adult-onset), is a relatively less common chronic disease in children and adolescents; about 151,000 people in the U.S. below the age of 20 years have diabetes (National Center for Chronic Disease Prevention and Health Promotion, 2005). Behavioral Risk Factor Surveillance data from 2003 reports that 8.1% of Texas adults report that a doctor has told them that they have diabetes, an increase over the nationwide rate (7.2%) (Centers for Disease Control and Prevention, 2005). In children, the prevalence of type 1 diabetes for U.S. residents aged 0-19 years is 1.7 per 1000. The prevalence of type 2 diabetes is likely to be underestimated, since it is hard to detect type 2 diabetes in children given the mildness or lack of symptoms, the need for blood tests for diagnosis, and issues around criteria for differentiating between types. Despite this, case reports suggest that type 2 diabetes now accounts for between 8% and 45% of all new cases of diabetes referred to pediatric centers. If these numbers find corroboration in other studies, they represent an important public health problem, since as recently as 1985, only 1% to 2% of diabetes cases in children were attributable to type 2 diabetes (Aye & Levitsky, 2003).
The question is: what is causing this marked increase of type 2 diabetes in children? One important risk factor is obesity. The correlation between obesity and type 2 diabetes in adults has been documented previously (Bray, 1992) (Westlund & Nicolaysen, 1972). However, the relationship between these two chronic conditions in children is a more recently observed phenomenon. The tremendous increase in the incidence of type 2 diabetes in children was noted in 1996 by Pinhas-Hamiel et al. In 1994, among cases who were diagnosed with childhood diabetes in Cincinnati, 16% were classified as type 2. This was a sharp increase from 1982 data that showed only 4% of diabetes cases classified as type 2. Most importantly, the study found that in addition to family history and ethnicity, obesity is a major risk factor for type 2 diabetes. Ninety-two percent of the study population with type 2 diabetes had a body mass index that surpassed the normal range. In addition, African-American girls had not only the greatest increase in obesity among groups, but also the highest prevalence of type 2 diabetes (Pinhas-Hamiel et al., 1996). In fact, the clearest factor contributing to the increased risk of type 2 diabetes is increased body fat. Gutin et al found a strong correlation (Spearman rank r = 0.78) between percentage body fat and fasting insulin (Gutin et al., 1994).
The temporal connection between the increase in childhood obesity and rising prevalence of type 2 diabetes in children offers some preliminary evidence of an underlying relationship. Although African-American, Mexican-American and Native-American children in North America are more likely to be affected than Anglos, this is most likely due to higher rates of obesity in these groups as opposed to genetic differences (Miller J. et al., 2004). There is an important genetic contribution to the etiology of type 2 diabetes in children as in adults, but another study identifies an alternative source of these differences based in disparities and differences in socioeconomic status (Botero & Wolfsdorf, 2005). Diabetes and Academic Performance. Since the 1960s, numerous studies have examined the impact of Type I diabetes in children on their academic performance. Researchers have suspected that Type I diabetes may exert an important effect on childhood intelligence functioning, neuropsychological and neurobehavioral functioning and abilities, school attendance, and academic achievement. Unlike other aspects of diabetes, the mentioned literature is highly heterogeneous and contradictory.
Investigated outcomes have included neuropsychological/neurobehavioral functioning and school attendance as a way to measure academic performance. These factors have been measured by a wide collection of neurocognitive and achievement tests. Additionally, in some cases parent-self reporting measures of school attendance (Ryan et al., 1985a), academic performance (Hagen et al., 1990; Holmes et al., 1992; Yu et al., 2000) and social functioning (Yu et al., 2000) have been collected. These self-reported measures, however, are subject to recall bias and were not compared with the child’s perceptions or school records.
E-8
Compared to non-diabetic children, diabetic children present significantly lower scores on school achievement scores such as arithmetic, reading and spelling (Gath et al., 1980; Ryan et al., 1985a), increased learning difficulties, lower grades in English and language arts, more grades repeated and special instruction received (Hagen et al., 1990; Holmes et al., 1992; Yu et al., 2000). They were absent more frequently from school (Holmes et al., 1992; McCarthy et al., 2002; Ryan et al., 1985a; Yu et al., 2000), and their absence rate was associated negatively with GPA (Grade Point Average) and academic achievement (Kovacs et al., 1992; Ryan et al., 1985a). Diabetic children perform within normal range regarding overall intelligence and cognitive functions (Ack et al., 1961; Kaufman et al., 1999; Ryan et al., 1985a; Ryan et al., 1984; Weil & Ack, 1964) and particularly on associative learning ability, verbal/visual memory and visual-spatial tests (Ryan et al., 1984). Nevertheless, a pattern of mild deficit and slower performance in specific neurocognitive tests such as verbal intelligence (Hagen et al., 1990; Kovacs et al., 1992; Ryan et al., 1984), memory (Hagen et al., 1990; Holmes et al., 1992), visual-motor tasks and coordination (Ryan et al., 1985a; Ryan et al., 1984), and visual-spatial ability (Rovet, 1987), was found. On behavioral aspects, Ryan, et al., concluded that children with diabetes do not have poor self-image or excess anxiety (Ryan et al., 1984), but McCarthy, on the other hand, found diabetic children to have more behavioral problems such as mood variability, compliance and fatigue (McCarthy et al., 2003).
Further, several factors have been shown to be associated with the functional impact of diabetes: age of diabetes onset, hypoglycemic episodes or seizures, and metabolic control. Age-at-onset seems to determine the impact of diabetes on neurocognitive development and learning ability. Children with early onset diabetes, diagnosed before 4-5 years of age, achieved lower intelligence test scores than their respective siblings (Ack et al., 1961). They performed slower in processing information than both controls and children with late onset diabetes (Hagen et al., 1990). And, compared to controls, early onset diabetic children performed slower in verbal intelligence (Hagen et al., 1990; Ryan et al., 1985b), visual-spatial ability, learning and memory, mental and motor speed (Golden et al., 1989; Holmes et al., 1992; Rovet, 1987; Ryan et al., 1985a). Age at onset was found to be negatively related to memory (Golden et al., 1989) and to visual-perception but not to verbal comprehension, academic achievement (such as reading, math, written language, knowledge) or to overall cognitive scores (Kaufman et al., 1999). A related issue is the disease duration. While length of disease seems not to affect general intellectual functioning among diabetic children (Ack et al., 1961; Golden et al., 1989; Kaufman et al., 1999; Weil & Ack, 1964), disease duration was related to lower vocabulary and block test scores, lower school grades and higher absenteeism (Kovacs et al., 1992).
Mild/severe hypoglycemic episodes or seizures are suspected to be one of the pathways for the association of age of onset and cognitive impairment by affecting the brain development and increasing the risk of later neurobehavioral deficits or delays (Ryan et al., 1985a). Presence of hypoglycemic seizures was associated with lower scores in short and word memory, (Kaufman et al., 1999) or contrarily, has not exerted any effect on cognitive function (Ryan et al., 1984). Frequency of asymptomatic hypoglycemia is found to be associated with abstract/visual reasoning (copying subscales) (Golden et al., 1989). Mild hypoglycemia is related to reduced functioning on basic motor on dominant hand, attention, memory (Puczynski M. S. et al., 1990; Reich et al., 1990) and concentration (Puczynski M. S. et al., 1990). Mild hypoglycemia modifies the temporary performance rather than the long-term cognitive deficits but a lag may exist between blood sugar restoration and total mental efficiency recovery (Puczynski M. S. et al., 1990; Puczynski S. et al., 1992; Reich et al., 1990).
Metabolic control (measured by glucosylated hemoglobin-HbA1) was found to be negatively related with reading, math and basic academic skills (Kaufman et al., 1999). McCarthy, et al., in two large sample studies, showed that children with poor metabolic control performed worse in reading and had lower GPAs compared to children with good control (McCarthy et al., 2003; McCarthy et al., 2002). However, it did not relate to school performance in a six-year follow-up study of 87 diabetic children; although school performance and grades declined over time, verbal performance improved slightly (Kovacs et al., 1992).

E-9
Limitations. The cross-sectional design (with observations made at only one point in time) of most studies limits the weight of evidence for establishing linkages. Only one longitudinal study (with multiple observations made over time) was found, where academic performance was measured on more than one occasion (Kovacs et al., 1992). Overall, sample sizes for the studies reviewed above were small, from 20 to 100 children, with two studies including 200 or more subjects (McCarthy et al., 2003; McCarthy et al., 2002). Control groups typically have been used to account for different background experiences and environments. Some studies used siblings and others selected control groups to be demographically comparable in age, gender, lack of other diseases, child’s education level and parents’ socioeconomic status (SES). Other studies, however, did not adjust for such variables, even when differences were seen between groups (Ack et al., 1961; McCarthy et al., 2002). Samples were typically restricted to children of white ethnicity, even though, as a group they tend to receive the highest grades. Any attempt to generalize from these findings to other, more diverse populations is therefore of limited value. Implications. In summary, there is evidence that diabetic children may show subtle reductions in neuropsychological functioning. The importance of this to long-term academic achievement and learning has not been thoroughly explored. Diabetic children have a tendency to be absent more often, related to disease symptoms, and to have lower academic performance over time, particularly in reading. Most of these studies, however, have design flaws that limit the weight that should be assigned to their findings. Depression Prevalence. A depressed mood affects approximately four out of ten young people during any six-month period, while prevalence of major depressive disorder ranges from 0.4 to 6.6% (Anderson J., McGee, R., 1994; Fleming & Offord, 1990; Kashani et al., 1987; Lewinsohn et al., 1994; Lewinsohn et al., 1993). An investigation of an ethnically diverse sample of Texas middle-school students found an overall prevalence of 8.4% for major depression without impairment and 4.3% with impairment (Roberts et al., 1997). Of those with impairment, students of Chinese descent had the lowest prevalence (1.9%) while those of Mexican ancestry had the highest prevalence (6.6%). When a sample of ninth grade students from the Texas Lower Rio Grande Valley were evaluated, the prevalence of major depression and anxiety were both reported as 3.1% (Roberts et al., 2002). Depression and Academic Performance. The relationship between depression and anxiety and academic functioning among school children may operate in a cyclical fashion, both as risk factors and consequences of poor academic performance (Birmaher et al., 1996). Longitudinal research suggests that self-reported depressed mood among children, as early as the first grade, has been found to be predictive of their attention and concentration in the classroom in the short term (Edelsohn et al., 1992), of their academic functioning (grade point average and grade retention) in sixth grade, and of major depressive disorder in eighth grade (Ialongo et al., 2001). In adolescence, depression has been found to be related to grade point average and time spent doing homework (Field et al., 2001), to be preceded by dissatisfaction with grades and to result in school absenteeism (Lewinsohn et al., 1994). Using a two-wave longitudinal design, Rudolph, et al., (Rudolph et al., 2001) reported that academic disengagement related to transition to middle school was linked to increased school-related stress; and that increased school-related stress was subsequently linked to increases in depressive symptoms. Their additional finding that maladaptive self-regulatory beliefs were associated with low levels of academic engagement does suggest possible intervention strategies to prevent depression involving school-related issues.
Cross-sectional data from a nationally representative sample, aged 10-18, suggests that youth with high levels of depressive symptoms missed approximately 1 day more of school per month than children and youth with lower levels of depressive symptoms (Glied & Pine, 2002). Breuner, et al., (Breuner et al., 2004) report an association, from their retrospective study of 283 adolescents recruited through a headache clinic, between poorer school grades, symptoms of depression, and school absences. Headaches, anxiety symptoms were not found to be related to attendance. A small cross-sectional study among 79 high school seniors found that the group of adolescents who scored above the clinical cutoff for depression on a self-report measure spent less time doing homework and had a lower grade point

E-10
average (Field et al., 2001). There is also evidence that co-morbidity of diabetes and depression affects approximately 20% of youth with type 1 compared to 7% of youth without diabetes; but little is known about depression in youth with diabetes (Grey et al., 2002). A 1994 meta-analysis of 60 studies of depressive symptoms among children and adolescents with chronic medical problems (Bennett D. S., 1994) suggests that children with certain disorders (e.g., asthma, recurrent abdominal pain, sickle cell anemia) may be at greater risk of depressive symptoms than children with other disorders (e.g., cancer, cystic fibrosis, diabetes mellitus). Limitations. The validity of findings on depression and academic performance are limited by measurement issues; most of the studies cited above rely on children’s responses to questionnaires rather than clinical assessments of depression. While these scales have been utilized in many studies in different populations of children and adolescents, their reliability and validity for evaluating interventions aimed at academic performance may be open to challenge. Implications. The relationship between depression and academic performance is complicated; it appears that depression is both a risk factor and a consequence of poor academic performance. However, the prevalence of depressive symptoms, the risk of suicide, and the co-morbidity of depression with chronic medical problems such as asthma, support further research on the relationship between depression and academics. Epilepsy Prevalence. Epilepsy and seizures impact approximately 2.5 million Americans. Roughly 181,000 new cases of epilepsy are diagnosed each year and the incidence is greatest among those between the ages of 2 and 65 (Epilepsy Foundation). Specifically, 45,000 children under the age of 15 are diagnosed with epilepsy annually and 315,000 have epilepsy. Among those most affected by epilepsy are poor, inner-city, and immigrant children (Epilepsy Foundation). Epilepsy and Academic Performance. Children with epilepsy consistently demonstrate poorer academic achievement than those without epilepsy and those who suffer from other chronic illnesses such as asthma (Austin et al., 1998, 1999; Fowler et al., 1985; Huberty et al., 2000; Mitchell et al., 1991; Schoenfeld et al., 1999; Seidenberg et al., 1986). Seidenberg and colleagues (Seidenberg et al., 1986) compared the academic achievement of a sample of 122 children with epilepsy with national norms. They reported that as a group, the children with epilepsy made less academic progress than expected for their IQ levels and age levels. Arithmetic and spelling deficiencies were the most pronounced for the sample; however, reading comprehension and word recognition were also deficient. Mitchell et al. (Mitchell et al., 1991) also compared the academic achievement of a sample of 78 children with epilepsy between 5 and 13 years old who visited the Children’s Hospital Los Angeles Neurology Service with national norms. When IQ was not adjusted for, the epilepsy group reported very poor academic achievement. For example, 55% of the epileptic children were below the 25th percentile and 40% were below the 10th percentile for reading comprehension. After adjusting for IQ, 16% to 50% of the subjects were underachieving for each subscale of the Peabody Individual Achievement Test (Mitchell et al., 1991).
Austin, et al., (Austin et al., 1998) examined 117 children with epilepsy and 108 with asthma who
had been treated with medication for at least one year. They concluded that children with epilepsy were more at risk for poor academic achievement than those with asthma. Epileptics scored significantly worse in reading, mathematics, language, vocabulary, and composite than asthmatics (Austin et al., 1998). Austin et al. (Austin et al., 1999) also followed a sample of epileptic children and asthmatic children for four years. Again, they report that at follow-up the epileptic children continued to score significantly worse in all five achievement areas than the children with asthma. Huberty et al (Huberty et al., 2000) followed a sample of children with asthma and epilepsy for four years. At follow-up, they reported that the asthma sample improved more than the epilepsy sample for academic performance and learning. Fowler and colleagues (Fowler et al., 1985) examined a sample of 270 children who were being treated for a large array of chronic illnesses including arthritis, blood disorders, cardiac disease, chronic bowel disease,
E-11
chronic lung disease, cystic fibrosis, diabetes, epilepsy, hemophilia, sickle cell disease, and spina bifida. Children with epilepsy, sickle cell disease, or spina bifida scored the lowest on school achievement tests. They concluded that children with epilepsy were among three groups most at risk for academic difficulties; thus, they were more likely to receive special services, repeat a grade, or score more poorly on achievement tests than children with other chronic illnesses. Studies have indicated that academic achievement among children with epilepsy may be related to the severity of the epilepsy condition. Austin and colleagues (Austin et al., 1998, 1999) have reported that condition severity is related to academic achievement. For example, in a 1998 case-control study, they found that condition severity was significantly related to composite and language scores among the 117 children with epilepsy. Additionally, total adaptive functioning was significantly associated with composite, mathematics, and language scores (Austin et al., 1998). In a 1999 cohort study, Austin and colleagues found that subjects with high severity epilepsy on average scored 2 to 3 points below national norms while those with either inactive or low-severity epilepsy had mean scores comparable to national norms. Huberty et al. (Huberty et al., 2000) followed a sample of asthmatics and epileptics over four years and concluded that change in condition severity was significantly related to change in mean academic performance among their epileptic sample. Additional variables that are hypothesized to impact the influence of epilepsy on the academic achievement abilities of children include age of seizure onset, lifetime seizure frequency, seizure type, seizure control, and type of seizure medication. Individual level factors are hypothesized to include sex, age, behavioral problems and attention problems. Limitations. It does not appear that the challenges of diagnosis for epilepsy are as great as those for diagnosis for asthma, but the population of children diagnosed with epilepsy is relatively small compared to those with asthma or those who are overweight or at risk for overweight. Implications. While it appears that the severity of the epilepsy condition is strongly related to academic achievement, epilepsy affects a relatively small number of children. However, these children may be in need of special services and management that is appropriate for targeted, indicated, health services and mental health services in the school setting rather than for a more universal program for the majority of school children. Sickle Cell Anemia Prevalence. Sickle Cell Anemia has been diagnosed in over 2,000 Texas children since 1993. While 8 in every 100,000 people develop sickle cell anemia, those most affected by the condition include African-American and Hispanic children. For example, one in every 400 African-American children and 1 in every 1,200 Hispanic-American children are diagnosed with sickle cell anemia (Huberty et al., 2000; Texas Children's Sickle Cell Center & Texas Children's Hospital, 2005). Individuals with sickle cell anemia are often prone to episodes of pain that range from mild to extremely intense. Some of the precipitating factors of the pain include fatigue, strenuous activities, dehydration, exposure to cold, and stress. The episodes of pain can be managed with fluids, rest, heat, and pain medications as they are needed. Additional complications of sickle cell anemia can include acute chest syndrome, strokes, vision changes, hearing problems, infections, kidney problems, gallstones, and leg ulcers (Huberty et al., 2000; Texas Children's Sickle Cell Center & Texas Children's Hospital, 2005). Sickle Cell Anemia and Academic Performance. Several researchers have examined whether children with sickle cell anemia are more likely to suffer cognitive processing and academic functioning difficulties than their peers. Current literature has reported mixed findings (Bonner et al., 1999) (Brown et al., 1993). Fowler et al. (Fowler et al., 1988) compared neurological test results and academic functioning among 28 children with sickle cell anemia and 28 matched controls. With one exception, results indicated that there were no significant differences between groups on the overall verbal score, performance score, or the full-scale intelligence quotient. However, children with sickle cell anemia scored significantly lower on assessments of reading, spelling, and on a group administered standardized achievement test than their matched controls. Additionally, students with sickle cell anemia were absent from school on more

E-12
occasions and were more likely to receive academic special services (Fowler et al., 1988). Swift, et al (Swift et al., 1989) evaluated 21 children with sickle cell anemia and 21 sibling controls. There were significant differences on the Full Scale IQ assessments and almost all cognitive measures between the children with sickle cell anemia and their sibling controls. However, both groups demonstrated academic achievement that was appropriate for their intellectual ability. Wasserman et al. (Wasserman et al., 1991) examined 43 children with sickle cell anemia and 30 sibling controls. They reported that the children with sickle cell anemia missed a greater number of school days and scored significantly lower Performance and Full Scale IQ scores then their sibling controls. There were no significant differences between the groups on Verbal IQ, academic performance and the proportion placed in special education.
In 1993, Brown and colleagues examined 70 youth with sickle cell anemia and 18 sibling controls
(Brown et al., 1993). Children with sickle cell anemia scored significantly poorer than the non-disease children on a reading decoding achievement test and a sustained attention task. However, no significant differences were found for measures of intellectual functioning, language functioning and visual-motor tasks. A 2004 study by Schatz (Schatz, 2004) compared 50 children with sickle cell anemia and 36 matched controls. He reported that the children with sickle cell anemia were more likely to have repeated a grade and needed academic services. Cognitive ability and days of illness were recognized as unique predictors of academic attainment problems among children with sickle cell anemia. Hematocrit, parent education, and income were not unique predictors. Only cognitive ability was a unique predictor of academic achievement. Moreover, some studies have found no differences between children with sickle cell anemia and their peers. For example, Goonan et al. (Goonan et al., 1994) reported no significant differences between children with sickle cell anemia and their controls on attention and inhibitory impulse tasks. Furthermore, Richard and Burlew (Richard & Burlew, 1997) reported no significant difference on grades in mathematics or reading, standardized tests, and grade retention among 42 African-American children with sickle cell disease and 26 African-American controls. Both groups reported rates of absenteeism and below-average scores in math and reading. Evidence suggests that those who have suffered a stroke are more inclined to score lower on neuropsychological functioning and academic functioning than those who have not had a stroke (Armstrong et al., 1996). Armstrong and colleagues (1996) examined 194 children who were originally enrolled in the Cooperative Study of Sickle Cell Disease multi-center study. Among children with the homozygous condition (HbSS type), those with a history of cerebrovascular accident performed significantly poorer than those without a cerebrovascular accident on tests that assessed verbal knowledge and language abilities and visual-motor and spatial organization and integration. Children with MRIs suggestive of infarct also scored poorer than children with no MRI abnormalities on tests assessing arithmetic, vocabulary, reading, and visual-motor speed and coordination. In the year 2000, Brown and colleagues examined a sample of 63 youths with sickle cell anemia (Brown et al., 2000). Those who had suffered a documented clinical stroke performed more poorly on sustained attention and effort tasks than their peers. Children with evidence of a silent stroke on their MRI also demonstrated similar impairments in the areas of attention (Brown et al., 2000).
Wang and colleagues (2001) (Wang et al., 2001) longitudinally evaluated 373 children with sickle cell anemia who were participating in the Cooperative Study of Sickle Cell Disease. They performed several MRIs to assess whether the child had been exposed to a cerebral vascular accident. Their results indicated that those with sickle cell anemia who had suffered a silent infarct (n = 62) scored significantly lower on math and reading assessments, Full Scale IQ, and Verbal IQ than those with normal MRI findings. Nabors and Freymuth (2002) (Nabors & Freymuth, 2002) compared 12 children with sickle cell disease with a prior history of stroke, 14 children with sickle cell disease without evidence of stroke, and 13 sibling controls. This study found significant differences for attention and achievement between those with sickle cell anemia who had suffered a stroke and their sibling controls. However, when an outlier case was deleted, a significant difference in intelligence was also found between these two groups. Further, a significant difference in attention surfaced between those with sickle cell anemia who had suffered a stroke and those with sickle cell anemia who had not suffered a stroke. There were no
E-13
significant differences between those with sickle cell anemia who had not suffered a stroke and the sibling controls. Limitations. Some of the discrepancies between findings have been attributed to inconsistencies of subject selection and measurement techniques, a lack of consideration for potential covariates, and use of unreliable measurement techniques (Brown et al., 1993). Implications. It appears that the sickle cell anemia, especially strokes resulting from the condition, jeopardize academic achievement. Sickle cell anemia affects more children than epilepsy, but the numbers are still relatively small. However, similar to children with epilepsy, children with sickle cell anemia may be in need of special services and management that is appropriate for targeted, indicated, health services and mental health services in the school setting rather than for more universal programs. Sleep Disorders Prevalence. Sleep disorders in youth are attracting attention as sleep loss may be related to school schedules. Prevalence estimates for sleep disorders in youth are complicated by diagnostic criteria ranging from the neurological disorder of narcolepsy, to sleep disordered breathing, to life style-related sleep loss. Narcolepsy has been estimated to affect between four and 10 per 10,000 individuals with rare diagnosis among youth younger than 18 (Dahl et al., 1994) Sleep disordered breathing is estimated to affect between 1% and 4% of children and youth but this estimate may also be compromised by failures in diagnosis (Kaemingk et al., 2003). Prevalence studies of lifestyle-related sleep loss among school children describe that more than 40% of Ohio eighth-graders reported sleeping seven hours or less on school nights (Drake et al., 2003), middle and high school students in Maryland reported a mean of 6.7 hours on weekdays (Eliasson et al., 2002) and students from Rhode Island reported an average of 7.7 hours for students ages 13-14, and 7.25 hours for students age 16 (Wolfson A. R. & Carskadon, 1998). Sleep Disorders and Academic Performance. Studies examining the relationship between sleep disordered breathing or obstructive sleep apnea found a negative relationship between the existence of sleep abnormalities and school performance or memory. A retrospective study of a sample of 13- to 14-year-old children who ranked in the bottom quartile of their class, found that snoring between the ages of 2 to 6 was reported more frequently by their parents compared to children in the upper quartile of the class who were matched on age, gender, race, school and area of residence (Gozal & Pope Jr, 2001). A prospective study among first-graders in the lowest 10th percentile of their class from 32 public schools screened for sleep-associated gas exchange abnormalities through a rigorous overnight protocol of pulse oximetry, pulse signal and transcutaneous carbon dioxide tension identified 54 children (8.1% of the sample) with obstructive sleep apnea (Gozal, 1998). Of these 54 children, 24 underwent surgical adeno-tonsillectomy and 30 were not treated. The 24 treated children experienced a significant increase in school-reported academic grades from first to second grade compared to the non-treated children. A similar study screening children from Tucson schools, found 77 with an apnea/hypopnea index (AHI) > 5 indicative five or more apneas or hypopneas per hour of sleep time found significant decreases in learning and memory among this group with AHI > 5 compared to 72 children with AHI < 5. Scores on verbal IQ were similar between the two groups (Kaemingk et al., 2003).
Clinical studies also illustrate a relationship between sleep disorders and cognitive functioning related to academic performance. Among children with obstructive sleep apnea syndrome aged 5 to 12 years from a pediatric sleep clinic population, small deficits in executive functioning/attention as compared to normal children were found but these deficits were not related to disease severity. However, there were some improvements in attention after adeno-tonsillectomy (Owens et al., 2000), suggesting a mechanism for improvement of school performance. A clinical study of 5 children aged 11 to 14 years in a sleep disorder clinic found amelioration of symptoms of heavy nocturnal snoring and daytime somnolence and significant improvements in number of arithmetic problems solved after tonsillectomy and/or adenoidectomy (Guilleminault et al., 1982). Children from a pediatric endocrinology clinic who were

E-14
morbidly obese and diagnosed with obstructive sleep apnea were found to have lower scores on general memory, verbal memory, learning and vocabulary than those without obstructive sleep apnea (Rhodes et al., 1995). A laboratory study of children (mean ages 11.6 (intervention) and 12.3 (control)) with no medical, learning, attentional, behavioral or psychiatric disorders found that the children randomly assigned to the sleep-restricted group (5 hours in bed compared to 11 hours in bed) found significant impairment in executive function including abstract thinking, verbal processing and creativity in the sleep-deprived group compared to the controls with no difference in tasks requiring lower cognitive loads (Randazzo et al., 1998).
Cross-sectional surveys of youth provide mixed evidence for a relationship between lifestyle-related sleep loss and academic functioning. Among 3,120 Rhode Island high school students, those who report lower grades (Cs and below) sleep for approximately 25 fewer minutes and retire 40 minutes later than those who report higher grades (Wolfson A. R. & Carskadon, 1998). Among 1,200 high school and middle school students in Maryland, however, there was no consistent correlation between sleep time and children’s self reported GPA (Eliasson et al., 2002). Among 450 Ohio middle school students, there was a significant linear effect for self-reported total sleep time and school achievement and total sleep time was related to self-report of daytime sleepiness (Drake et al., 2003). A longitudinal study following 2,259 students from 6th to 8th grade found positive correlations between self-reported hours of sleep on school nights and self-reported grades at all cross-sectional timepoints (Fredriksen et al., 2004). However, decreasing amounts of sleep from 6th to 8th grade did not predict lower grades, although it did predict increased levels of depressive symptoms. The relationship between depression and sleep loss has been reported by others (Roberts et al., 1997) and may explain some of the relationship between sleep loss and academic performance. Limitations. The research on sleep related disorders resulting from sleep apnea syndrome is strengthened by clinical diagnostic criteria and longitudinal designs with treatments but limited by issues related to recruitment to sleep clinic studies or recruitment from sleep clinic populations and case-study designs. Studies of life-style related sleep loss are limited by their cross-sectional designs and self-report measures. Implications. The clinical studies do support the relationship between obstructive sleep apnea or sleep-disordered breathing and executive function that may be related to academic performance. Further evidence is provided by the increase in attention and academic grades among children treated for obstructive sleep apnea through tonsillectomy or adenoidectomy. For life-style related sleep loss, there is mixed evidence that fewer minutes of sleep on school nights are related to grades, some evidence that fewer minutes of sleep is related to daytime sleepiness, and some suggestion of a relationship between sleep loss and depression.

E-15
Table 1. Prevalence of Selected Chronic Health Conditions among Children and Adolescents Prevalence of Select Conditions Among Children and Adolescents Condition U.S. Texas Changes Remarks
Overweight – Obese 10.5%1
16%2 14.2%1 15.5%a,3 19.2%b,3 22.4%c,3
In U.S.: 4%4 – 1963-65 4%4 – 1971-94 7%4 – 1976-80 11%4 – 1988-94
a11th grade b8th grade c4th grade
Diabetes 0.17%d,5
0.26%f,6 0.20 – 0.25%d,e,7
Prior to twenty years ago, only 1% to 2% of diabetes cases were type 2. Now current estimates range from 8% to 45%14
dType 1 only eAccording to the the Texas Diabetes Council, there is no prevalence data for type 2 diabetes in Texas children. fType 1 and type 2
Asthma 13.0%8
12.2%g,15
8.3%h,15 5.8%i,15
15.0%9 In the U.S., from 1980 to 1996, asthma prevalence among children increased by an average of 4.3% per year, from 3.6% to 6.2%11
gChildren that have been told they have asthma hChildren who currently have asthma iChildren who had an asthma attack in last 12 months
Mild Emotional Disorders
9%j,10
30%k,10 Not available jModerate/Severe depression
kReport depression symptoms
Physical Inactivity 31.2%1 34.3%1 Texas data are for 2001 only
Undernourished 3.3%13 1.86%a,12 1.35%b,12 3%c,12
a11th grade b8th grade c4th grade
1. CDC, 2001, YRBSS 2. CDC, 1999-2002, National Health and Nutrition Examination Survey (NHANES) 3. Hoelscher D, 2004, American Journal of Public Health 4. CDC, 1963-2002, NHANES 5. CDC, 2004, http://www.cdc.gov/diabetes/projects/cda2.htm 6. CDC, 2002, http://www.cdc.gov/diabetes/pubs/estimates.htm 7. TDH, 2004, http://www.tdh.state.tx.us/diabetes/media/ 8. CDC, 2003, National Health Interview Survey 9. Arif A, et al, 2004, Journal of Paediatrics & Child Health 10. National Longitudinal Study of Adolescent Health, 2002, J. Am. Acad. Child Adol. Psyc. 11. CDC, 1996, http://www.cdc.gov/asthma/children.htm 12. Hoelscher D, 2004, Unpublished SPAN data 13. Wang Y, et al. 2002, Am J Clin Nutr. 14. Aye & Levitsky, 2003, Curr Opin Pediatr 15. CDC, 2004, Division of Adolescent and School Health, Fact Sheet on Asthma
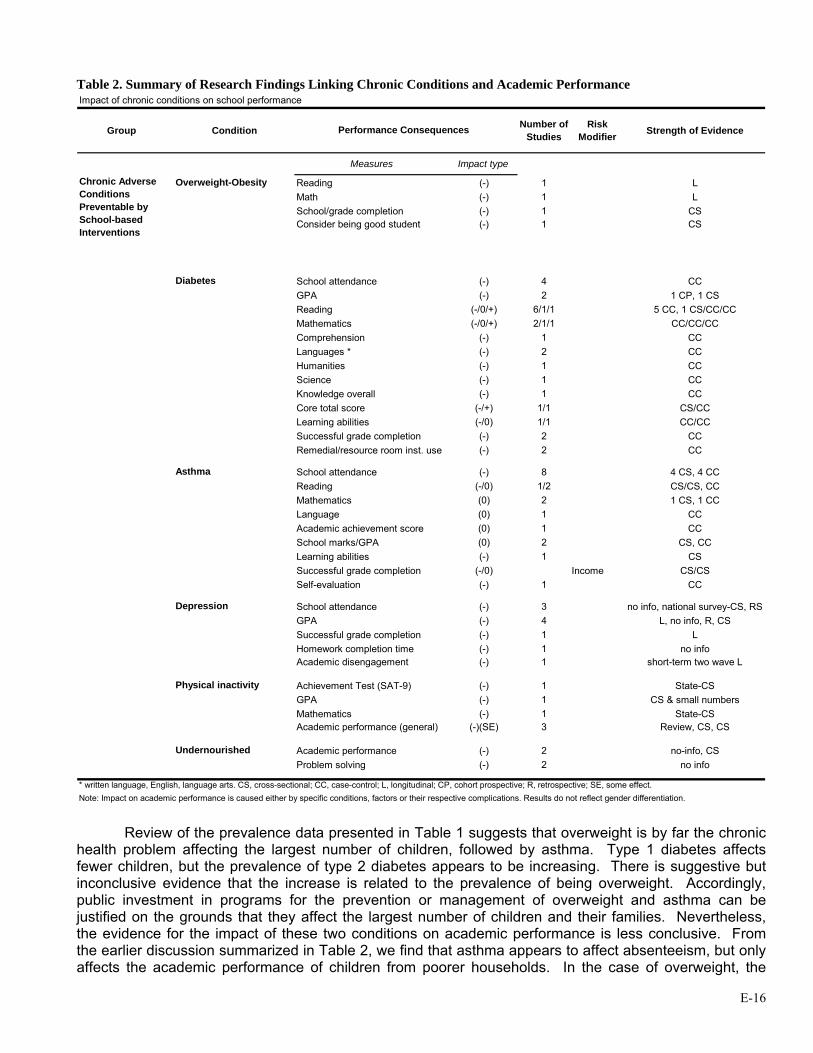
E-16
Table 2. Summary of Research Findings Linking Chronic Conditions and Academic Performance Impact of chronic conditions on school performance
Group Condition Number of Studies
Risk Modifier Strength of Evidence
Measures Impact type
Overweight-Obesity Reading (-) 1 LMath (-) 1 LSchool/grade completion (-) 1 CSConsider being good student (-) 1 CS
Diabetes School attendance (-) 4 CCGPA (-) 2 1 CP, 1 CSReading (-/0/+) 6/1/1 5 CC, 1 CS/CC/CCMathematics (-/0/+) 2/1/1 CC/CC/CCComprehension (-) 1 CCLanguages * (-) 2 CCHumanities (-) 1 CCScience (-) 1 CCKnowledge overall (-) 1 CCCore total score (-/+) 1/1 CS/CCLearning abilities (-/0) 1/1 CC/CCSuccessful grade completion (-) 2 CCRemedial/resource room inst. use (-) 2 CC
Asthma School attendance (-) 8 4 CS, 4 CCReading (-/0) 1/2 CS/CS, CCMathematics (0) 2 1 CS, 1 CCLanguage (0) 1 CCAcademic achievement score (0) 1 CCSchool marks/GPA (0) 2 CS, CCLearning abilities (-) 1 CSSuccessful grade completion (-/0) Income CS/CSSelf-evaluation (-) 1 CC
Depression School attendance (-) 3 no info, national survey-CS, RSGPA (-) 4 L, no info, R, CSSuccessful grade completion (-) 1 LHomework completion time (-) 1 no infoAcademic disengagement (-) 1 short-term two wave L
Achievement Test (SAT-9) (-) 1 State-CSGPA (-) 1 CS & small numbersMathematics (-) 1 State-CSAcademic performance (general) (-)(SE) 3 Review, CS, CS
Undernourished Academic performance (-) 2 no-info, CSProblem solving (-) 2 no info
Performance Consequences
Physical inactivity
Chronic Adverse Conditions Preventable by School-based Interventions
Note: Impact on academic performance is caused either by specific conditions, factors or their respective complications. Results do not reflect gender differentiation.* written language, English, language arts. CS, cross-sectional; CC, case-control; L, longitudinal; CP, cohort prospective; R, retrospective; SE, some effect.
Review of the prevalence data presented in Table 1 suggests that overweight is by far the chronic
health problem affecting the largest number of children, followed by asthma. Type 1 diabetes affects fewer children, but the prevalence of type 2 diabetes appears to be increasing. There is suggestive but inconclusive evidence that the increase is related to the prevalence of being overweight. Accordingly, public investment in programs for the prevention or management of overweight and asthma can be justified on the grounds that they affect the largest number of children and their families. Nevertheless, the evidence for the impact of these two conditions on academic performance is less conclusive. From the earlier discussion summarized in Table 2, we find that asthma appears to affect absenteeism, but only affects the academic performance of children from poorer households. In the case of overweight, the

E-17
findings of lower test scores are based on a single study. In contrast, diabetes has been shown to affect both absenteeism and academic performance. To the extent that overweight is a primary risk factor for type 2 diabetes, however, we find support for the argument that, at least indirectly, being overweight can affect performance. The question then is, what do we do about it?
The next section examines the research on whether school-based interventions are effective in preventing or managing certain chronic health conditions and factors related to these conditions. We pay special attention to the health conditions that appear to compromise academic performance. Later, we will consider whether such interventions also make a difference in remedying deficits in academic performance. Section 2: School-Based Interventions and Their Links to Health Conditions
There is a strong body of research evaluating the effect of school health programs incorporating physical education and/or nutrition service interventions on overweight and factors related to overweight such as physical activity, fat consumption and television-watching. At the elementary school level, the Eat Well and Keep Moving Program was effective in improving dietary intake of students and reducing television viewing (Gortmaker et al., 1999a). Another elementary school program designed to reduce media usage demonstrated decreases in indicators of overweight (BMI, triceps skinfold, waist circumference) along with decreases in television viewing reported by both child and parents (Robinson, 1999). The Bienestar program, a diabetes prevention program, demonstrated improvements in fitness scores and dietary fiber intake, had no effect on dietary saturated fat intake or percentage of body fat, but did find improvements in mean fasting capillary glucose levels and dietary fiber intake (Trevino et al., 2004). The SPARK elementary school program demonstrated increased physical activity during PE class for boys and girls and fitness for girls (Sallis et al., 1997) but had minimal effect on indicators of overweight (Sallis et al., 1993).
The Child and Adolescent Trial for Cardiovascular Health (CATCH) was a multi-component, multi-year coordinated school health project designed to decrease fat, saturated fat and sodium in children’s diets, increase physical activity and prevent tobacco use. The experimental trial of CATCH was conducted in 96 schools (56 intervention, 40 control) in 4 sites (CA, LA, MN, TX). At the completion of the trial, students exposed to the intervention consumed less fat and participated in more physical activity outside of school; school cafeterias provided meals that were lower in fat; and students were more physically active during physical education classes (Luepker et al., 1996). The CATCH cohort of students was re-measured three years after the original intervention began (in 8th grade), and positive effects were maintained: intervention students had significantly lower fat intakes and higher levels of physical activity compared to control students (Nader et al., 1999). In a quasi-experimental study of CATCH (now known as the Coordinated Approach to Child Health) implemented in 8 schools in El Paso, Texas among 896 third-graders, 93% of whom were Hispanic, the rate of increase in risk for overweight (greater than 85th percentile) and overweight (greater than 95th percentile) from third to fifth grade was significantly lower for both boys and girls in the CATCH schools compared to those in the comparison schools (Coleman et al., 2005).
At the middle school level, the Planet Health program was effective in reducing television hours among both girls and boys, and increasing fruit and vegetable consumption. Among girls, each hour of reduction in television viewing predicted reductions in obesity (Gortmaker et al., 1999b). The middle school MSPAN program improved moderate to vigorous physical activity in physical education classes, more for boys than for girls (McKenzie T. L. et al., 2004).
A review published in the Journal of Pediatrics in June of 2005 (Strong et al., 2005) of the effects of physical activity on health outcomes such as overweight and obesity, cardiovascular health, asthma, mental health, injuries, musculoskeletal health and fitness, and academic performance concludes that there is sufficient evidence to support a recommendation of 60 minutes per day of moderate to vigorous physical activity for school-age youth.
E-18
“Evidence-based data are strong for beneficial effects of physical activity on musculoskeletal health, several components of cardiovascular health, adiposity in overweight youth, and blood pressure in mildly hypertensive adolescents. Evidence is adequate to make informed judgments about the beneficial effects of physical activity on lipid and lipoprotein levels and adiposity in normal weight children and adolescents, blood pressure in normotensive youth, other cardiovascular variables, self-concept, anxiety, and depression symptoms, and academic performance.” (Strong et al., 2005, p. 736)
There is also a large body of literature examining the effect of physical activity on mood-related mental health issues such as depression and anxiety and concluding that physical activity benefits both clinical and nonclinical populations across the lifespan (Dunn et al., 2001; Landers & Petruzzello, 1994; Morgan, 1994; Office of the Surgeon General, 1996). Further, there is evidence that interventions designed to increase physical activity are effective in decreasing depressive symptoms among high-risk youth, free-living youth, and clinic populations (Hawkins et al., 1999; Norris et al., 1992; Tortolero et al., 2001). Unfortunately, the results of school-based depression prevention programs have been mixed. Possel et al (Possel et al., 2004) evaluated the LISA-T program based on cognitive-behavioral therapy among 648 8th graders and report that an increase in depressive symptoms was prevented in the non-depressed intervention group compared to the control over six months and depressive symptoms decreased in the adolescents with subsyndromal depression, concluding that the program was effective in the short term for 8th graders with minimal to mild depressive symptoms. In their report of the Problem Solving for Life program designed to promote cognitive restructuring and provide problem-solving skills training for eight graders, Spence et al. (Spence et al., 2005) conclude that the program was not demonstrated to be effective in preventing or managing depression at one- or four-year follow-up despite promising results in the short term (Spence et al., 2003, 2005). Gilham et al (Gillham et al., 1995), however, found that their program for 5th and 6th grade children demonstrated no effect at 12-month follow-up, an effect at 2 years, but no difference at 3 years. Delayed benefits have been noted by others, but a recent Cochrane review of psychological and educational interventions for the prevention of depression in children and adolescents concluded that school-based preventive interventions demonstrated weak effects on adolescent depression and, moreover, little effects remained over long-term follow-up. Perhaps the physical activity interventions would be as effective in improving depressive symptoms as the psychological or educational intervention.
School-based programs for children with persistent asthma hold promise for improving disease management, reducing disease severity and decreasing school absences. Tinkelman (Tinkelman & Schwartz, 2004) reports a case study of the DSCM asthma school program incorporating a respiratory nurse care manager, web-based interactive educational tools, and an interactive asthma diary for 41 elementary and middle school public school students and a telephonic educational disease management program for their parents. At 6 months students had 2/3 fewer unscheduled doctor visits, daytime frequency of symptoms dropped by 62% and nighttime frequency of symptoms dropped by 34%. Anderson (Anderson M. E. et al., 2004) reports a matched comparison study in which children who were enrolled in a special school for children with chronic diseases were matched with children attending regular schools but utilizing the same health care system as the children in the special school. Children were matched on age, annual hospitalizations and emergent care visits for asthma, and length of time in the health care system. Approximately 95% of the children were minority and more than 85% were on Medicaid. The daily structured routine of asthma management for the special school students improved the number of hospitalizations, emergent visits and follow-up visits for asthma compared to the comparison students. However, the school in this study is a highly specialized setting with resources beyond those in a typical school setting, limiting the generalizability of this program to regular public schools.
Clark (Clark et al., 2004) reports a study among 14 elementary schools in Detroit which included
components for children, their parents, classmates and school personnel to enable asthma management. Children in the treatment condition with persistent disease reported fewer nighttime and daytime symptoms and parents of treatment children scored higher on an asthma management index. McEwen et
E-19
al (McKewen et al., 1998) report a case study of 22 African American inner city children aged 5 to 12 years managed twice daily at their school clinic and treated with inhaled anti-inflammatory medications. The program incorporated regular inhaled anti-inflammatory medication and was found to reduce the need for inhaled bronchodilators, improve peak flow readings and reduce complaints of nocturnal asthma symptoms. Limitation in the collection and interpretation of absenteeism data precluded findings on absenteeism in this study (McKewen et al., 1998). Christiansen. et al., (Christiansen et al., 1997) report that their five-session bilingual, interactive curriculum teaching about asthma in a school setting did enhance peak flow meter technique and inhaler technique and reduce asthma symptom scores among the 27 intervention students compared to the 15 control asthmatics. While the research on school-based asthma programs is limited by issues of design and sample size, the findings suggest promise for management of asthma symptoms and savings in health care utilization.
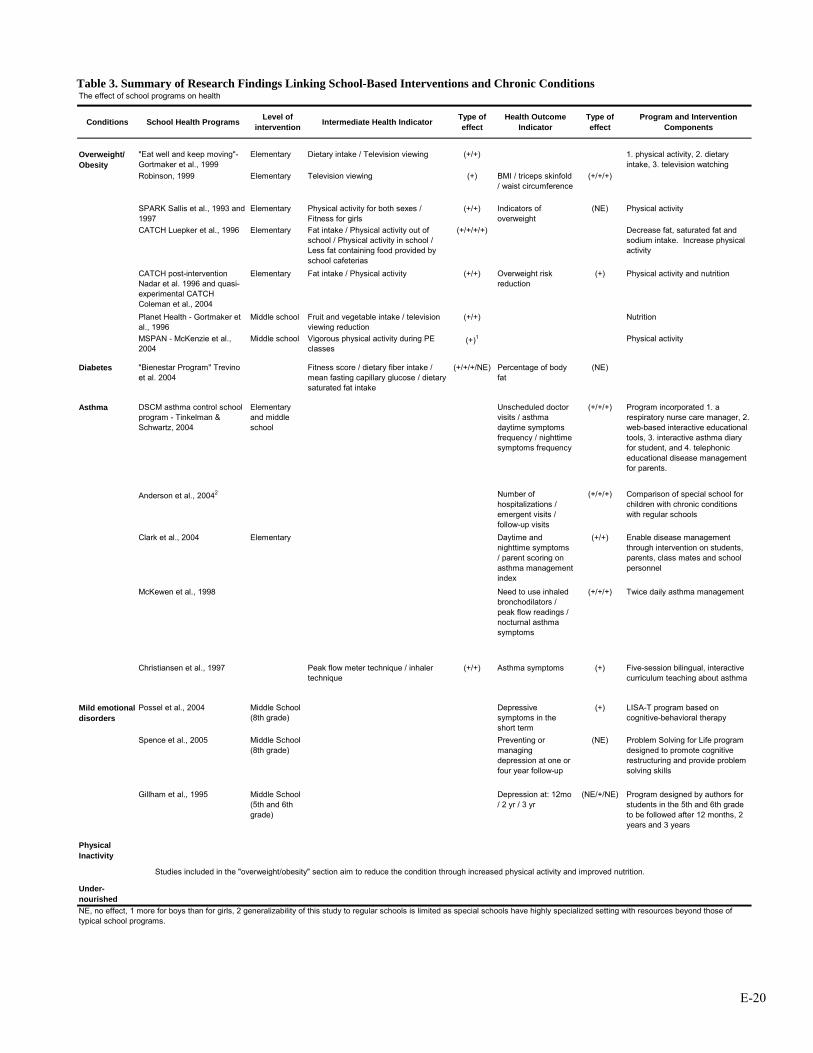
E-20
Table 3. Summary of Research Findings Linking School-Based Interventions and Chronic Conditions The effect of school programs on health
Conditions School Health Programs Level of intervention Intermediate Health Indicator Type of
effectHealth Outcome
IndicatorType of effect
Program and Intervention Components
Overweight/ Obesity
"Eat well and keep moving"- Gortmaker et al., 1999
Elementary Dietary intake / Television viewing (+/+) 1. physical activity, 2. dietary intake, 3. television watching
Robinson, 1999 Elementary Television viewing (+) BMI / triceps skinfold / waist circumference
(+/+/+)
SPARK Sallis et al., 1993 and 1997
Elementary Physical activity for both sexes / Fitness for girls
(+/+) Indicators of overweight
(NE) Physical activity
CATCH Luepker et al., 1996 Elementary Fat intake / Physical activity out of school / Physical activity in school / Less fat containing food provided by school cafeterias
(+/+/+/+) Decrease fat, saturated fat and sodium intake. Increase physical activity
CATCH post-intervention Nadar et al. 1996 and quasi-experimental CATCH Coleman et al., 2004
Elementary Fat intake / Physical activity (+/+) Overweight risk reduction
(+) Physical activity and nutrition
Planet Health - Gortmaker et al., 1996
Middle school Fruit and vegetable intake / television viewing reduction
(+/+) Nutrition
MSPAN - McKenzie et al., 2004
Middle school Vigorous physical activity during PE classes
(+)1 Physical activity
Diabetes "Bienestar Program" Trevino et al. 2004
Fitness score / dietary fiber intake / mean fasting capillary glucose / dietary saturated fat intake
(+/+/+/NE) Percentage of body fat
(NE)
Asthma DSCM asthma control school program - Tinkelman & Schwartz, 2004
Elementary and middle school
Unscheduled doctor visits / asthma daytime symptoms frequency / nighttime symptoms frequency
(+/+/+) Program incorporated 1. a respiratory nurse care manager, 2. web-based interactive educational tools, 3. interactive asthma diary for student, and 4. telephonic educational disease management for parents.
Anderson et al., 20042 Number of hospitalizations / emergent visits / follow-up visits
(+/+/+) Comparison of special school for children with chronic conditions with regular schools
Clark et al., 2004 Elementary Daytime and nighttime symptoms / parent scoring on asthma management index
(+/+) Enable disease management through intervention on students, parents, class mates and school personnel
McKewen et al., 1998 Need to use inhaled bronchodilators / peak flow readings / nocturnal asthma symptoms
(+/+/+) Twice daily asthma management
Christiansen et al., 1997 Peak flow meter technique / inhaler technique
(+/+) Asthma symptoms (+) Five-session bilingual, interactive curriculum teaching about asthma
Mild emotional disorders
Possel et al., 2004 Middle School (8th grade)
Depressive symptoms in the short term
(+) LISA-T program based on cognitive-behavioral therapy
Spence et al., 2005 Middle School (8th grade)
Preventing or managing depression at one or four year follow-up
(NE) Problem Solving for Life program designed to promote cognitive restructuring and provide problem solving skills
Gillham et al., 1995 Middle School (5th and 6th grade)
Depression at: 12mo / 2 yr / 3 yr
(NE/+/NE) Program designed by authors for students in the 5th and 6th grade to be followed after 12 months, 2 years and 3 years
Physical Inactivity
Under-nourishedNE, no effect, 1 more for boys than for girls, 2 generalizability of this study to regular schools is limited as special schools have highly specialized setting with resources beyond those of typical school programs.
Studies included in the "overweight/obesity" section aim to reduce the condition through increased physical activity and improved nutrition.
E-21
Section 3. School-Based Interventions and Their Links to Academic Performance What is the evidence that school-based interventions designed to promote physical activity and good nutrition or to manage asthma have a positive impact on academic outcomes including grades, test scores, attendance and other factors related to academic outcomes such as attention/concentration, cognitive functioning and classroom behavior? Careful review of the literature on the impact of school programs on academic outcomes has revealed one salient fact – there are few school health programs that have measured factors related to academic performance and implemented rigorous outcome evaluations. The majority of school health programs are designed to test the effect of the program on the health issue and prevention researchers have been slow to include academic factors of interest to the education community. The paucity of evidence is most likely due to the economic and scientific challenges of implementing stringent research designs with adequate sample sizes in the school setting, and a lack of inclusion of academic measures, rather than a lack of connection between school health programs and academic outcomes. However, this paper will discuss the evidence that is available and note school health programs that have been successful in impacting health and health-related factors but that have not measured academic factors. School-Based Physical Activity Interventions
A rigorous evaluation of Project SPARK, an elementary school physical education program,
demonstrated significant gains for reading, losses for language, and no differences for math scores on a standardized test, suggesting that, even with time taken away from the academic program for physical education, overall academic functioning was not impaired (Sallis et al., 1999). Another physical education program incorporating fitness or skill training for 75 minutes a day, compared to usual physical education offered three times a week for 30 minutes, demonstrated no significant decrease in test scores compared with controls (Dwyer et al., 1979). These studies suggest that implementation of physical education will not impair academic achievement on standardized tests, and implementation of asthma management programs may enhance academic grades for low-income asthmatic children.
The association between fitness and school performance has been examined by the California
Department of Education utilizing a state-required physical fitness test reported for all 5th, 7th and 9th grade students since 2001 and the Stanford Achievement test. This cross-sectional analysis demonstrated a significant linear association between standardized test scores (Stanford Achievement Test Ninth Edition [SAT-9]) of almost one million students (grade 5 n=353,000; grade 7 n=322,000; grade 9 n=279,000) and their fitness scores on the Fitnessgram, a teacher-administered physical fitness test measuring cardiovascular endurance, body composition, abdominal strength and endurance, trunk strength and flexibility, upper body strength and endurance, and general flexibility (California Department of Education & Standards and Assessment Division, 2002; Grissom, 2005). A dose-response effect was noted for all three grades so that highest SAT-9 scores were reported by students who met three or more standard levels among the six physical fitness measures, particularly among females, and particularly for mathematics rather than for reading scores. While the Fitnessgram does not represent a school program, but rather a measurement of fitness, these data suggest a relationship between levels of physical activity sufficient to develop and maintain fitness and academic performance as measured by a standardized achievement test. A recent meta-analysis of 44 studies pertaining to physical activity and cognition in children (Sibley & Etnier, 2003) concluded that exposure to physical activity was associated with an improvement in cognition of ½ a standard deviation – a relatively strong effect. While physical activity may be very important for preventing obesity, diabetes and depression in children, it most likely will also improve academic performance.
Unfortunately, neither CATCH, nor Planet Health, nor Eat Well and Keep Moving, nor Bienestar measured factors related to academic outcomes in the evaluation of their programs. However, a study is currently in the planning stages to test the effect of CATCH plus classroom physical activities on performance on standardized tests and factors related to academic performance such as attention problems, learning problems, study skills, attitudes to schools, attitudes to teacher, and academic

E-22
competence. This study, PASS and CATCH, will go into the field in August 2005 in eight Texas schools and is funded by the Centers for Disease Control and Prevention.
School-Based Nutrition Interventions
Some students may not achieve academic superiority because they are undernourished, thus hindering their ability to learn. It has been suggested that even moderate undernutrition can potentially have long-lasting effects on a child’s cognitive development and performance in school (Center on Hunger and Poverty and Nutrition Policy, 1998). In addition, research shows that failure to eat breakfast can have adverse affects on children’s ability to problem-solve in school (Pollitt, 1995; Pollitt et al., 1981; Pollitt et al., 1982). To further reinforce the importance of breakfast and school performance, Meyers, Sampson, Weitzman, Rogers and Kayne (Meyers et al., 1989) tested the hypothesis that low-income children in Massachusetts participating in the School Breakfast Program (SBP) for the first time would show improvements in their standardized achievement test scores. These test scores would be compared with the child’s own performance when no breakfast program was presented. The SBP was implemented in 16 elementary schools in the Lawrence school district in late January 1987, prior to the start of the second school semester of the 1986-1987 school year. Thus, the Massachusetts standardized achievement test being compared was the one in 1986 when no SBP was in place and in 1987 after the SBP had been operational for three months. Results showed that students participating in the SBP had significantly increased their scores on the battery total scale and the language score. There were also marginally greater scores for reading and mathematics (Meyers et al., 1989). Further research in Boston found that children who improved their nutritional intake in a school breakfast program decreased their absences and improved their math scores, although no improvements were seen for reading, social studies or science (Kleinman et al., 2002).
More recent studies have documented similar results of higher test scores in nourished children compared to their undernourished counterparts (Murphy et al., 1998; Powell et al., 1998). These studies also found that the children participating in the SBP had lower absence and tardiness rates than those who did not participate in the SBP (Murphy et al., 1998; Powell et al., 1998). Other researchers are focusing on the child’s social and emotional well-being of being properly nourished and have found that undernourished children tend to be less active, more anxious and interact less with their classmates and peers (Barrett et al., 1982; Rampersaud et al., 2005). Schools are a place where children and adolescents socialize with others and develop friendships. An undernourished individual will not have the energy to participate in school activities with their peers (be it on the playground or in the classroom) and may become socially withdrawn (Barrett et al., 1982).
Since eating patterns and other health-related habits tend to be established in early childhood, (Munoz et al., 1997) and given that schools have the potential to shape and direct the development of the students, nutrition education programs implemented and adopted by schools may play a large role in helping improve a child’s chance for higher academic attainment along with improvements in their health status related to nutritional intake. Many elementary school children depend on school meals, deriving approximately 50% to 60% of total daily intake of energy, protein, cholesterol, carbohydrate and sodium from school meals (Nicklas & Johnson, 2004). School nutrition programs will be very important in efforts to prevent obesity in children and are also likely to have a positive impact on academic performance.
School-Based Asthma Management Interventions
Few school-based asthma management programs have been evaluated. The most rigorous evaluation was conducted by Evans et al (Evans D. et al., 1987) using random assignment of 12 New York schools within matched pairs. Participants included 239 low-income predominantly Hispanic and African-American students from 3rd to 5th grade who experienced at least three episodes of asthma in the last year. The asthma self-management program consisted of six 60-minute sessions on asthma management skills for the students and written information on curriculum and activities for the parents. Asthma program students performed significantly better than control students on classroom grades in
E-23
mathematics, science and oral expression, but no effect of the program was evident for standardized test scores for reading or math, for teacher-rated classroom behavior, or for attendance. The Tinkelman (Tinkelman & Schwartz, 2004) case study of the DSCM asthma school program incorporating a respiratory nurse care manager, web-based interactive educational tools, and an interactive asthma diary for 41 elementary and middle school public school students did report a drop in school absences by 2/3. However, the Christiansen (Christiansen et al., 1997) study of the five-session bilingual, interactive curriculum teaching about asthma in a school setting did not report an effect on school absences among the 27 intervention students compared to the 15 control asthmatics. The Clark (Clark et al., 2004) randomized controlled trial is perhaps the strongest study in terms of design and sample size and this study found higher grades for science but not for reading, math or physical education. Parents of treatment children reported fewer absences attributable to asthma in the past three months, but no differences in school absences were noted in school records. The mixed results for the effects of the programs on school attendance is disheartening given that asthma is considered to be the leading cause of school absences (Tinkelman & Schwartz, 2004). However, the studies are limited by weaknesses in design and sample size and challenges in the accurate measurement of school absences along with the cause of the absence. The paucity of research linking asthma programs with academic performance suggests that more work needs to be done in both the development and implementation of school-based asthma management programs and the evaluation of those programs. School-Based Mental Health Interventions
Gall and colleagues (Gall et al., 2000), found that among 13- to 18-year-old public high school students, two months after they received school-based mental health and counseling services, absenteeism decreased by 50% and tardiness decreased by 25% (p<.0001). Students referred for mental health services significantly decreased absence from school by 2/3 of a day while those not referred increased both absenteeism and tardiness (p<.0001). Although, as discussed in a recent review of the literature by (Geierstanger et al., 2004), the evidence for a relationship between school-based health centers and academic performance is limited by the small number of studies and their methodological shortcomings, there is sufficient evidence to support SBHC for improvement of intermediate outcomes related to academic performance and for contributions to the educational process. These studies are not specific to depression programs but do suggest that the school component most likely to be responsible for depression prevention programs may have success in impacting academic factors such as absenteeism. Unfortunately none of the depression programs evaluated and included in the Cochrane review (Merry et al., 2004) have included academic factors as outcome measures.
Coordinated School Health Programs
School health programs are currently considered within the context of the Coordinated School Health Program (CSHP) model. CSHP provides policies, activities and services in an organized manner to promote the health of school students and staff through: comprehensive school health education; family and community involvement; physical education; school counseling, psychological, and social services; school health services; school nutrition services; and school-site health promotion for staff and faculty (McKenzie F. D. & Richmond, 1998). Programs may be designed for the general population of school children, such as those that target physical activity and nutrition, or for indicated groups of children identified with health problems such as asthma. CATCH is an exemplary coordinated school health program that directly incorporates health education, physical education, food services and parental involvement and usually involves health services and staff health promotion activities (Hoelscher et al., 2001).
Impact on Academic Performance
Chronic conditions such as obesity, asthma and diabetes negatively impact school performance. Coordinated School Health Programs improve the health of students. It logically follows these school-based health programs will result in better school performance. This has not been submitted to the scrutiny of an evidence-based approach. The problem partially lies in the fact that programs designed to
E-24
intervene upon these chronic conditions measure health outcomes as opposed to academic outcomes or school performance. This is not to imply there is no connection between school health programs and academic outcomes. More research exploring this link is necessary before it can be determined. There is some evidence that increasing physical activity and providing appropriate nutrition services, such as a school breakfast program, may improve school performance and reduce the incidence of certain chronic conditions. The recommendations made in this report will be based on this evidence.
A summary of the studies reviewed appears in Table 4 below. As noted earlier, most of the studies that considered the impact of interventions focused on health as their endpoint and not on academic achievement. Part of this may have been a function of the interests of the funders; those with health missions were not accountable for improvements in academic performance. Studies of interventions that targeted obesity, for example, seldom included any academic measures. The exceptions were few, but notable. We have several excellent studies of physical inactivity that demonstrate academic improvements. To the extent that obesity is highly correlated with physical inactivity, we could posit an indirect effect from programs designed to increase physical activity. The same is true of diabetes. To the extent that physical activity is a preventative against the onset of type 2 diabetes, we can infer an indirect effect through diabetes reduction as well.
As the table indicates, we have primarily three areas of scientifically documented health interventions that yield academic dividends: physical activity, asthma and under-nourishment. We will address the consequences of this in a later section.
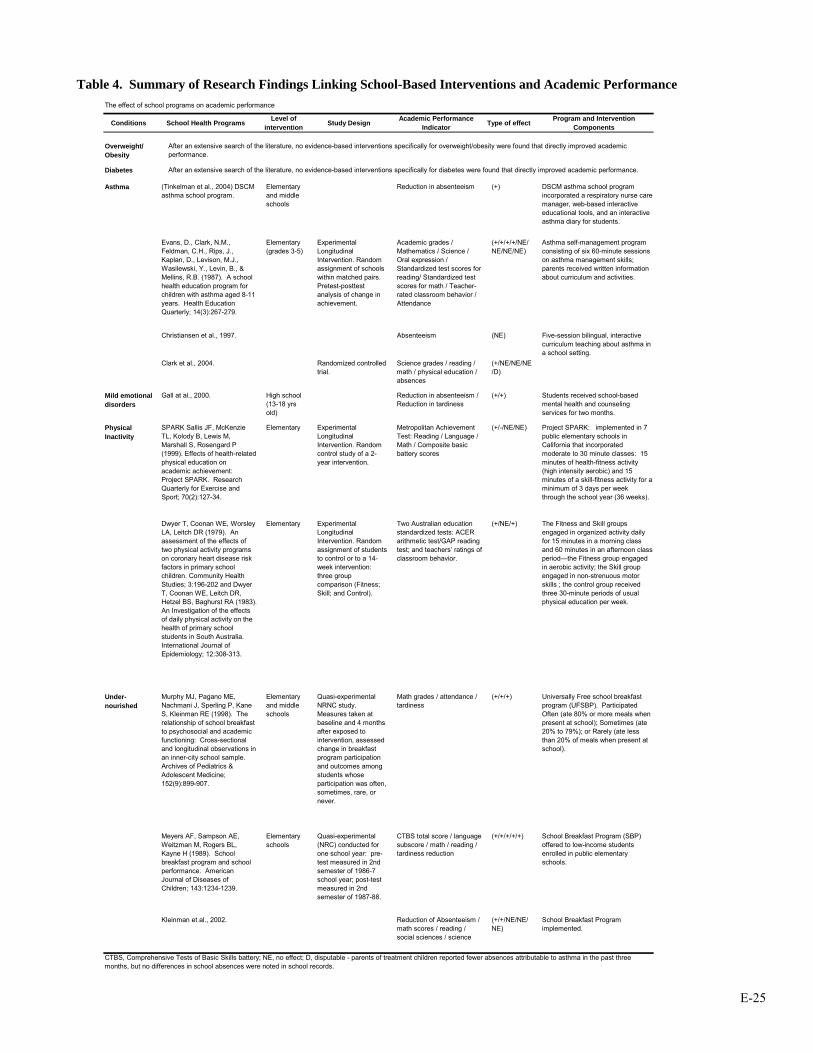
E-25
Table 4. Summary of Research Findings Linking School-Based Interventions and Academic Performance
The effect of school programs on academic performance
Conditions School Health Programs Level of intervention Study Design Academic Performance
Indicator Type of effect Program and Intervention Components
Overweight/ Obesity
Diabetes
Asthma (Tinkelman et al., 2004) DSCM asthma school program.
Elementary and middle schools
Reduction in absenteeism (+) DSCM asthma school program incorporated a respiratory nurse care manager, web-based interactive educational tools, and an interactive asthma diary for students.
Evans, D., Clark, N.M., Feldman, C.H., Rips, J., Kaplan, D., Levison, M.J., Wasilewski, Y., Levin, B., & Mellins, R.B. (1987). A school health education program for children with asthma aged 8-11 years. Health Education Quarterly; 14(3):267-279.
Elementary (grades 3-5)
Experimental Longitudinal Intervention. Random assignment of schools within matched pairs. Pretest-posttest analysis of change in achievement.
Academic grades / Mathematics / Science / Oral expression / Standardized test scores for reading/ Standardized test scores for math / Teacher-rated classroom behavior / Attendance
(+/+/+/+/NE/NE/NE/NE)
Asthma self-management program consisting of six 60-minute sessions on asthma management skills; parents received written information about curriculum and activities.
Christiansen et al., 1997. Absenteeism (NE) Five-session bilingual, interactive curriculum teaching about asthma in a school setting.
Clark et al., 2004. Randomized controlled trial.
Science grades / reading / math / physical education / absences
(+/NE/NE/NE/D)
Mild emotional disorders
Gall at al., 2000. High school (13-18 yrs old)
Reduction in absenteeism / Reduction in tardiness
(+/+) Students received school-based mental health and counseling services for two months.
Physical Inactivity
SPARK Sallis JF, McKenzie TL, Kolody B, Lewis M, Marshall S, Rosengard P (1999). Effects of health-related physical education on academic achievement: Project SPARK. Research Quarterly for Exercise and Sport; 70(2):127-34.
Elementary Experimental Longitudinal Intervention. Random control study of a 2-year intervention.
Metropolitan Achievement Test: Reading / Language / Math / Composite basic battery scores
(+/-/NE/NE) Project SPARK: implemented in 7 public elementary schools in California that incorporated moderate to 30 minute classes: 15 minutes of health-fitness activity (high intensity aerobic) and 15 minutes of a skill-fitness activity for a minimum of 3 days per week through the school year (36 weeks).
Dwyer T, Coonan WE, Worsley LA, Leitch DR (1979). An assessment of the effects of two physical activity programs on coronary heart disease risk factors in primary school children. Community Health Studies; 3:196-202 and Dwyer T, Coonan WE, Leitch DR, Hetzel BS, Baghurst RA (1983). An Investigation of the effects of daily physical activity on the health of primary school students in South Australia. International Journal of Epidemiology; 12:308-313.
Elementary Experimental Longitudinal Intervention. Random assignment of students to control or to a 14-week intervention: three group comparison (Fitness; Skill; and Control).
Two Australian education standardized tests: ACER arithmetic test/GAP reading test; and teachers’ ratings of classroom behavior.
(+/NE/+) The Fitness and Skill groups engaged in organized activity daily for 15 minutes in a morning class and 60 minutes in an afternoon class period—the Fitness group engaged in aerobic activity; the Skill group engaged in non-strenuous motor skills ; the control group received three 30-minute periods of usual physical education per week.
Under-nourished
Murphy MJ, Pagano ME, Nachmani J, Sperling P, Kane S, Kleinman RE (1998). The relationship of school breakfast to psychosocial and academic functioning: Cross-sectional and longitudinal observations in an inner-city school sample. Archives of Pediatrics & Adolescent Medicine; 152(9):899-907.
Elementary and middle schools
Quasi-experimental NRNC study. Measures taken at baseline and 4 months after exposed to intervention, assessed change in breakfast program participation and outcomes among students whose participation was often, sometimes, rare, or never.
Math grades / attendance / tardiness
(+/+/+) Universally Free school breakfast program (UFSBP). Participated Often (ate 80% or more meals when present at school); Sometimes (ate 20% to 79%); or Rarely (ate less than 20% of meals when present at school).
Meyers AF, Sampson AE, Weitzman M, Rogers BL, Kayne H (1989). School breakfast program and school performance. American Journal of Diseases of Children; 143:1234-1239.
Elementary schools
Quasi-experimental (NRC) conducted for one school year: pre-test measured in 2nd semester of 1986-7 school year; post-test measured in 2nd semester of 1987-88.
CTBS total score / language subscore / math / reading / tardiness reduction
(+/+/+/+/+) School Breakfast Program (SBP) offered to low-income students enrolled in public elementary schools.
Kleinman et al., 2002. Reduction of Absenteeism / math scores / reading / social sciences / science
(+/+/NE/NE/NE)
School Breakfast Program implemented.
CTBS, Comprehensive Tests of Basic Skills battery; NE, no effect; D, disputable - parents of treatment children reported fewer absences attributable to asthma in the past three months, but no differences in school absences were noted in school records.
After an extensive search of the literature, no evidence-based interventions specifically for overweight/obesity were found that directly improved academic performance.
After an extensive search of the literature, no evidence-based interventions specifically for diabetes were found that directly improved academic performance.

E-26
This report also seeks to determine the reverse relationship: that of academic performance on health. This relationship has been observed in the short-term. Studies in school aged children have indicated that poor school performance predicts health-compromising behaviors and physical, mental and emotional problems (Crum et al., 1998; Kessler et al., 1995; Miller D. S. & Miller, 1997; Young & Rogers, 1986). The long-term implications of academic performance on health status are not as clear, primarily because studies that assess health measures such as health literacy, mortality, infant mortality, morbidity, subjective health, risk factors and use of health care observe level of education as opposed to academic performance. There is a body of evidence that suggests academic performance, particularly test scores, predicts level of attainment. An obvious example is the acceptance of measures such as the Scholastic Aptitude Test (SAT) and Graduate Record Examination (GRE) as selective entrance requirements to colleges and graduate programs respectively, and as such they serve as predictors of higher education attainment. The studies that explore these relationships were not evaluated since they do not directly measure health outcomes, and they are found within a separate discipline. As stated, the relationship between academic performance and future attainment is assumed, so for this report, the question subtly shifts from how academic outcomes affect health to how education level affects health. However, focus should not merely be on the linear relationship but also the intergenerational and cyclical nature between education and health. Parents and families profoundly influence their children. Those children develop as adults and form family units of their own. The interplay of health and education is perpetuated in the family cycle. Future generations will be influenced by what is done in the present. From this point forward, the report will more fully focus on how education level affects health outcomes.
The next part reports on research that closely examines the link between educational attainment and adult health status. Here, the research has been more exploratory and has generated a range of alternative explanations. We consider a wide sample of these. In sharp contrast to Part One, however, there is little attention given to interventions designed to take advantage of this link. While there is some discussion of measures to attenuate the adverse effects of low educational attainment, say, through literacy campaigns, those in this field with an interest in educational interventions typically focus on early childhood as the most advantageous place to intervene.
PART TWO: Educational Attainment and Adult Health Status
Section 1. Background on Social Status and Educational Attainment
Many studies have identified the importance of socioeconomic status (SES) in determining individual health. SES refers to the individual’s position or status in society’s hierarchy. Income, education, occupational status and social class are all indicators of SES and have been shown to be important determinants of health (Antonovsky, 1967; Backlund et al., 1996; Evans R. G. et al., 1994; Kunst M. & Mackenbach, 1994; Marmot M. et al., 1987; Marmot M. & Shipley, 1996; Sorlie et al., 1995). Moreover, some studies report that disparities in all-cause mortality by socioeconomic class have been increasing rather than declining in recent years (Kunst A. et al., 1990; Pappas et al., 1993).
The negative effect of poverty on health has been known for centuries with references going back
to the ancient Greeks and Chinese (Krieger, 2001; Porter, 1997). Several historical records document poorer health among less advantaged populations. For example, Floud and Harris (1996) (Floud & Harris, 1996) report that, at the beginning of the 19th century, 14-year-old boys attending the Royal Military Academy at Sandhurst, the elite military school in Britain, were nearly six inches taller than their counterparts in the Marine Society, who came from the lower social classes. Similarly, Rowentree in 1901 documented an infant mortality gradient based on poverty in areas of York, England (Rowentree, 2001).
In recent years, an abundant literature has documented a health gradient based on SES,
particularly income. The evidence is overwhelming that SES and health are associated and that the association is represented by a gradient. Better-off individuals have better health than those who are less well-off, who in turn have better health than worse-off individuals. The gradient implies that the relationship
E-27
between SES and health is a dose-response relationship, and not a relationship described by a threshold effect where the worse-off have poor health while everyone else has good health.
The gradient has been found using different measures of SES and of health (Berkman & Kawachi,
2000). Health indicators consist of mortality (all-cause and disease-specific mortality, infant mortality and life expectancy), morbidity, and self-rated health, including quality of life indicators. In the U.S., the health gradient was first reported by Kitagawa and Hauser (1973) (Kitagawa & Hauser, 1973) who merged Census and death records and found a relationship between mortality and SES, whether income, education or occupation was used as the indicator of SES. The inverse association between SES and mortality was reported in several U.S. communities, for example Evans County Georgia (Tyroler et al., 1984), Washington County, Maryland (Comstock & Tonasica, 1977), Alameda County, California (Haan M. et al., 1987), and Tecumseh, Michigan (Williams D. R., 1986). More recently, Backlund, Sorlie, & Johnson (1996) (Backlund et al., 1996) and Sorlie, Backlund, & Keller (1995) (Sorlie et al., 1995) used the National Longitudinal Mortality Study surveys, which represent approximately 500,000 personal or telephone interviews and 40,000 deaths, to describe the relationship between income and mortality. An income-based gradient with declining mortality associated with increasing income exists in all age groups for both males and females, though it is steeper in working-age groups and for males. The gradient flattens but remains when controlling for household size, education, marital status and employment status, indicating that income has an independent effect on health.
An SES gradient in morbidity, impairments, and disability is also apparent (Williams D. R., 1990).
Rates of chronic illness are higher among the disadvantaged (Haan M. N. & Kaplan, 1986; Lerner, 1975; Newacheck et al., 1980). The mortality and morbidity gradient is present with other socioeconomic variables such as wealth, employment grade or social class. For example, a gradient was found in the classic Whitehall study of civil servants in the United Kingdom (Marmot M. G., 1986). The top grade administrative civil servants had a 10-year cumulative mortality rate half that of the next grade professional/executive civil servants, three times lower than the next grade clerical civil servants, and four times lower than civil servants in the lowest grade. The gradient holds for many, but not all, health outcomes, including cause-specific mortality, morbidity or self-reported health. The SES based health gradient is a fairly universal phenomenon. Differences in health by SES have been reported in Norway, Denmark, Finland, Germany, the Netherlands, Australia, New Zealand, Canada, Japan and several developing countries (Haan M. N. & Kaplan, 1986; Marmot M. et al., 1987; Williams D. R., 1990; Wolfson M. et al., 1993).
SES is usually measured by income, education, occupational status, social class or a combination of these factors. Among these measures, education stands out as the most basic SES component since it shapes future occupational opportunities and earning potential (Adler & Newman, 2002). Education is considered the primary and core status dimension that influences all other dimensions of status throughout the lifetime (Mirowsky & Ross, 2003). Education provides life skills that allow educated people to gain access to resources that promote health and to use these resources more effectively. Better educated people are more likely to be employed, to be working in well-paying jobs, to be in more prestigious occupations, and to have more control, autonomy, creativity and authority on the job (Mirowsky & Ross, 2003). Education is the antecedent to all other measures of SES as it comes early in life and influences all other measures of SES.
The association between SES and health becomes more robust when SES is measured by
education (Fuchs V. R., 1979; Kitagawa & Hauser, 1973; Lebowitz, 1977; Liberatos et al., 1988; Williams D. R., 1990). Winkleby and colleagues, in an attempt to untangle the relative effect of education, income and occupation, found that only education remained a significant predictor of cardiovascular disease when education, income and occupation were all included (Winkleby et al., 1992). These results taken together have lead researchers to conclude that education is the best SES predictor of health status (Williams D. R., 1990).
E-28
In the study of education and health, education is usually measured by years of completed formal education or by the highest degree obtained. For example high school graduates are compared to those without a high school diploma or to those with a college degree. The impact on health outcomes of college selectivity for those with a college degree and the credential of a college degree have also been investigated (Ross C. E. & Mirowsky, 1999). Section 2. The Links between Educational Attainment and Adult Health Status
This section reviews the evidence that education improves health outcomes. We rely heavily on
Low’s (Low, 2005) and Mirowsky and Ross (2003) (Mirowsky & Ross, 2003) excellent summaries in presenting this evidence. In general, better educated people are healthier, report better health, and have lower mortality, morbidity and disability (Coburn & Pope, 1974; Ross C. E. & Van Willigen, 1997). Ross and Mirowsky (Ross C. E. & Mirowsky, 1999) have shown that the quality of the education received and of the educational environment increase the positive effects of education on health. The evidence that more education is associated with better health is strong (Deaton & Paxton, 1999; Grossman & Kaestner, 1997; Kaplan & Kiel, 1993).
Health Literacy and Health Knowledge. While education improves health, lack of education, and the resulting low literacy, is associated with poor health. Literacy, one of the main products of education, is associated with several aspects of health. Health literacy allows individuals to understand and act upon health information and has been related to knowledge about health, personal health status, and the use of health service. Literacy improves health knowledge and skills in managing their disease in patients with hypertension, diabetes, and asthma (Williams M. V. et al., 1998a; Williams M. V. et al., 1998b). Literacy was a better predictor of metastases than age and race in prostate cancer patients (Bennett C. L. et al., 1998). Mortality. A strong inverse relationship between years of education and all-cause mortality is reported by Elo and Preston (Elo & Preston, 1996). Actuarial estimates show 5 to 6 years differences in life expectancy between the least and the most educated (Rogot et al., 1992). Mortality rates vary greatly with years of education, for example compared with individuals with 17 or more years of education, those with 16 years are 25% more likely to die and those with less than 9 years of education are 100% more likely to die (Rogers et al., 1999). These differences in mortality rates by educational level have been increasing over time (Elo & Preston, 1996; Feldman et al., 1989). Infant Mortality. Infant mortality is a key indicator of health and wellbeing of societies (UNICEF, 2003). One of the best predictors and contributors to fetal and infant mortality is thought to be low birth weigh (Chen et al., 1998; Newland, 1981; Shapiro et al., 1980; Shoham-Yakubovich & Barell, 1988). Research has shown that mother’s educational level is inversely related to both infant mortality (Arntzen & Nybo Andersen, 2004; Arntzen et al., 2004; Buor, 2003; Gisselmann, 2005; Olsen & Madsen, 1999; Pena et al., 2000) and low birth weight (Chen et al., 1998; Shapiro et al., 1980), that is, infant mortality risk decreases as the mother’s educational level increases (Bicego & Boerma, 1993; Burne & Walker, 1991; Caldwel, 1979; Newland, 1981; Wagstaff et al., 2004). Albeit the relationship might be well established, the explanatory mechanisms behind this relationship are still debated. One of the possible pathways is that mothers’ education increases the access and proper utilization of preventive or curative health care facilities (Buor, 2003; Gubhaju, 1991), the personal skills and abilities and, more importantly, education may change traditional familiar relationships (Caldwel, 1979). Morbidity and Chronic Disease. There is evidence of a morbidity gradient based on education. Mirowsky and Ross (2003) report that less educated persons are more likely to suffer from the common chronic conditions, with the exception of cancer. For example, arthritis and osteoporosis, hypertension, heart disease, diabetes and lung disease are more likely to be diagnosed among those with no high school degree and least likely in those with college degrees. The probability of reporting diagnosis of at least one of the above condition is 35.7% for those with college degrees, 41.6% for those who completed high school, and 64.7% for those who did not complete high school (Mirowsky & Ross, 2003).
E-29
Self-Rated Health. Evidence accumulated for more than 20 years indicates that self-rated health (SRH) is a powerful and reliable predictor of clinical outcome and mortality, even 10 years after the initial self-rating (Fayers & Sprangers, 2002; Idler & Angel, 1990). The association of SRH and mortality is particularly strong among individuals who report poor health (Burstrom & Fredlund, 2001) and this relationship is found among men and women, and among all the main ethnic groups in the U.S. (McGee et al., 1999). SRH has been proposed as a more reliable predictor of mortality even when compared to physician-rated health (Mossey & Shapiro, 1982). The measurement of SRH is captured by a single question “In general, would you say your health is …?” that is rated on a five-point Lykert scale from very good to very poor. SRH differs substantially across educational levels. About 17% of individuals with elementary education, 11% of those who did not complete high school, and 6% of those who completed high school report poor or very poor health, while only 2.5% of individuals with college degrees do so (Mirowsky & Ross, 2003).
Physical impairment, such as difficulty in climbing stairs, kneeling or stooping, lifting and carrying
bags of groceries, doing household work, shopping and getting around town, seeing even with glasses, and hearing, follows an educational gradient. Individuals who did not finish high school were more likely and those with college degrees least likely to report physical impairment (Mirowsky & Ross, 2003). Mirowsky and Ross calculated that between 70% and 50% of physical difficulty can be attributed to low education.
Education improves the likelihood of people feeling physically fit, having lots of energy, enjoying
life, being happy, and feeling hopeful about the future and decreases the likelihood of having trouble sleeping, finding everything an effort, being unable to get going, having trouble keeping their minds on things, and suffering from backaches and headaches (Mirowsky & Ross, 2003). Risk Factors. The educated tend to have healthier lifestyles than those with less education. Researchers in diverse disciplines have noted that more educated persons are more aware of health risks and more likely to initiate actions to reduce these risks (Williams D. R., 1990). According to Mirowsky and Ross (2003), education encourages people to acquire information with the intent to use it and makes individuals more effective users of information. Thus, well-educated persons pull together various healthy elements of different lifestyles. The more educated exercise more, are less likely to drink in excess, smoke less, and are less overweight than those with less education (Ross C. E. & Bird, 1994; Ross C. E. & Wu, 1995).
Individuals with more education are less likely to smoke than those with less education. They are
also more likely to have never smoked and, if they have smoked, to have quit smoking (Helmert et al., 1989; Jacobsen & Thelle, 1988; Liu et al., 1982; Matthews et al., 1989; Millar & Wigle, 1986; Mirowsky & Ross, 2003; Shea et al., 1991; Wagenknecht et al., 1990; Winkleby et al., 1992). While about 50% of individuals with some high school smoke, only approximately 15% of those with advanced degrees smoke (Mirowsky & Ross, 2003).
The well-educated are more likely to be physically active. Walking and engaging in strenuous
exercise increases with education (Ford et al., 1991; Helmert et al., 1989; Jacobsen & Thelle, 1988; Leigh, 1983; Mirowsky & Ross, 2003; Shea et al., 1991). The association between being overweight and education differs by gender. Better educated women tend to be less overweight than those with less education (Mirowsky & Ross, 2003). But body weight does not seem to be correlated with educational attainment for men (Ross C. E. & Mirowsky, 1983). This could be because lower educated men are more likely to be in jobs that require physical effort. A recent review confirms a negative relationship between education and weight gain (Ball & Crawford, 2005). Alcohol abuse is more common among people with lower education (Darrow et al., 1992; Midanik et al., 1990; Romelsjo & Diderichsen, 1989). Mirowsky and Ross (2003) report that better educated individuals are more likely to drink in moderation. Mirowsky and Ross (2003) argue that healthy behaviors associated with education are not consistently correlated with other sociodemographic characteristics. For example, men exercise more than women but smoke more and married people are more overweight than non-married people but smoke less. They state that “Only education correlates positively and consistently with health behaviors” (Mirowsky & Ross, 2003, p. 53).

E-30
Furthermore, health education campaigns are more effective in producing behavioral changes in
better educated people. For example, smoking did not show a SES based gradient in the 1940s. As information on the risks of smoking became widely available, the better educated quit at a higher rate than those with less education with the result that now smoking is concentrated among disadvantaged groups (Pierce et al., 1989). Similar patterns of change in the social distribution of risk factors have been observed for other diseases. Coronary heart disease (CHD) was a disease of the affluent with CHD risk factors positively associated with SES in the 1950s, only to become more prevalent among the less-educated groups as knowledge about risk factors increased (Morgenstern, 1980; Taylor, 1967). More recently, AIDS changed from being a disease of white middle-class homosexual to having a majority of new cases among minority groups with lower education (Peterson & Marin, 1988). Education and Health Care Costs. Low (2005) provides strong evidence that literacy predicts health care costs. In the 1990s, Medicaid recipients at the lowest literacy levels had annual health care costs of $12,974 compared to $2,969 for the overall Medicare population and were twice as likely to have been hospitalized in the previous year than patients with higher literacy (Weiss, 1999). Low literacy is responsible for about $73 billion annually in avoidable health care costs according to an estimate by a National Academy study on Aging Society. Section 3. How Educational Attainment Affects Adult Health Status
Mirowsky and Ross (2003) consider several broad pathways through which education affects
health. Education as learned effectiveness directly improves health, education increases the sense of personal control, and education enhances material, social and psychological resources. Following Mirowsky and Ross (2003), we will discuss these pathways in turn. The Human Capital View. Human capital is a concept derived from economics. In its original sense, human capital “concentrates on the agency of human beings – through skill and knowledge as well as effort -- in augmenting production possibilities” (Sen, 1997, p 1959). Human capital can thus be employed as capital in production in the way physical capital is. The human capital perspective has been broadened to cover not only economic production but to include production of other things that are valued, such as health and well-being.
The human capital approach to education and health implies that education improves individual’s ability to produce health. This is the approach that characterizes Mirowsky and Ross’ theory of education as learned effectiveness (Mirowsky & Ross, 2003). Mirowsky and Ross (2003) argue that “education enables people to coalesce health producing behaviors into a coherent lifestyle and that a sense of control over outcomes in one’s own life encourages a healthy lifestyle and conveys much of education’s effect” (Mirowsky & Ross, 2003, p. 25). In this theory, education and income are distinct in their effects on health. Education, defined by the accumulated knowledge learned in school, is an antecedent to income in that “education is the key to people’s position in the stratification system” (Mirowsky & Ross, 2003, p. 25). Those who are better educated are more likely to have better jobs and better paying jobs, which in turn improve health. But the major effect of education on health is not through economic resources.
Education is a root cause of health in that it gives individuals the capacity to control and shape
their own life in a way that promotes good health. The skills, knowledge, and resources acquired in school build abilities (the human capital) that increase effective agency and can be used to foster health. Thus “education as learned effectiveness” (Mirowsky & Ross, 2003). The resources acquired through education are inherent in the people themselves, not only external (like money). Education increases the motivation, and success at solving problems, reduces helplessness, and improves the efficiency in producing health from the material, social and psychological resources available to the individual. It teaches the ability to learn, to be persistent, to communicate effectively, and to find and use information. So, for example, well-educated people with lower income are better able to mange their reduced monetary resources to fend off
E-31
economic hardship. One of the skills learned through education is to substitute resources in solving a problem. This problem-solving ability is then successfully applied to acquiring and maintaining health. Personal Control. From this perspective the primary link between education and health is the sense of personal control that leads to the adoption of a healthy lifestyle (Mirowsky & Ross, 2003). The sense of personal control is a learned expectation that outcomes are affected by one’s own choices. Individuals with a sense of personal control feel they can control and alter the environment in which they live. It is the opposite of perceived powerlessness where individuals see no link between efforts and outcomes and feel they have no control over their life. Internal locus of control (Rotter, 1966), mastery (Pearlin et al., 1981), and self-efficacy (Bandura, 1986) and, on the opposite end, fatalism (Wheaton, 1980), helplessness (Seligman, 1975), and perceived powerlessness (Seeman M., 1983) are some of the names under which sense of control has been studied in psychology and the social sciences. The sense of personal control is learned through experience. Education increases the sense of personal control because school builds the skills, abilities and resources that allow better-educated people to have a rich experience of success at avoiding and solving problems, thus reinforcing their belief that their own behavior can favorably affect outcomes (Mirowsky & Ross, 1989; Ross C. E. & Mirowsky, 1992; Wheaton, 1980). Education teaches problem-solving skills and confidence. MR 2003 report a strong association between education and sense of control.
According to Mirowsky and Ross’s theory of personal control, the benefit of personal control lies in its effectiveness (Mirowsky & Ross, 1986, 1989). This effectiveness leads educated individuals to take control of their health by seeking out and using health related information and by adopting health promoting behaviors. This is partly why people with more education tend not to smoke, to exercise, to eat a healthy diet, to drink in moderation, to control their weight and, consequently, to have better health outcomes. Using a structural equation model, Mirowsky and Ross (2003) show that sense of control promotes a healthy lifestyle and mediates much of the effect of education on health, after controlling for socioeconomic characteristics such as age, gender, income, economic hardship, parents’ education and social support. This does not mean that income, economic hardship and social support do not affect health. As we will see in the next sections they are themselves determined by education and are important influences on health. These data mean that much of the influence of education on health is through the independent effect of sense of control and support the view of education as learned effectiveness. Education provides good jobs and high income, but also transcends them in fostering health. Education and Resources. According to this perspective, education’s main function is to provide material resources. Education is the main determinant of economic well-being since educational attainment usually translates into economic advantage. Better-educated people, those with a doctoral or professional degree, command a household income that is 5.4 times the income of those with elementary school education and 2.6 times the income of those with a high school degree (Mirowsky & Ross, 2003, ch. 4). Education influences household incomes because in the U.S., household income comes overwhelmingly from current wages and salaries and from pensions and savings based on past wages and salaries. Education increases the probability of being employed and of having higher wages and salaries during the earning years. It also increases the likelihood of being in a two-income household by increasing the probability of being married and of being married to someone with similar education and high income (Mirowsky & Ross, 2003).
The relationship between income and health is a very robust one (Low, 2005; Lynch et al., 1998;
Mirowsky & Ross, 2003; Ross N. A. et al., 2000; Wolfson M. et al., 1999). Income provides material resources that help families meet basic human needs such as food, shelter and medical care that directly affect health (Williams D. R., 1990). Though the overwhelming majority of people in developed countries have their basic needs met, differential access to material resources by income still affects health outcomes (Evans R. G. et al., 1994). For example, people with low income are more likely to live in poor housing and poor neighborhoods where they are exposed to unsafe conditions as well as to pathogens and toxins (Mayer, 1997).
E-32
Income is related to economic hardship: That is the difficulty of paying the bills and buying things the household needs. Economic hardship affects health in large part because of the stress associated with the endless struggle to get by. As Mirowsky and Ross (2003) point out “People exposed to economic hardship probably experience frequent, intense and prolonged activation of the physiological stress response, with consequences for their health” (Mirowsky & Ross, 2003, p. 86). The negative effects of chronic or prolonged stress on health have been extensively documented (Cohen et al., 1999; Fremont & Bird, 2000; Glaser et al., 1999; Sapolsky, 1997). The stress of economic hardship leads to a sense of powerlessness, helplessness, failure and shame that make individuals feel at the mercy of external factors and lowers their sense of personal control with negative influences on health behaviors and outcomes (Wilkinson, 2001).
The relationship between education and health which is mediated by income has two components
(Mirowsky & Ross, 2003). As we have seen, education reduces the risk of low income. But, if a household suffers from low-income, education can lower the risk of low income on health by aiding people to use income effectively. According to Mirowsky and Ross (2003) people can use education as an effective substitute for income. “The well-educated achieve economic well-being and physical health through higher income, but they can and do achieve the same ends just as well through other means” (Mirowsky & Ross, 2003, p. 98). Mirowsky and Ross (2003) show that, even among households with the same income and household composition, education reduces the economic hardship associated with low income and that, at any given level of income, health tends to be better at higher levels of education.
Mirowsky and Ross (2003) models indicate that the positive effect of income on health can be attributed to lower economic hardship measured by less trouble paying bills and buying household necessities (which account for 40% to 60% of income’s effect on health), lower exposure to poor neighborhoods (which accounts for about 5%), and increased sense of control that encourages healthy behaviors and reduces stress (which accounts for the remainder 35% to 55%). They also report that the differences in health by income decrease as education increases. Use of Medical Care. It is often believed that access to medical care explains the relationship between income and health. However, much research doubts the effectiveness of medical care in accounting for differences in population health. Epidemiological studies have shown that the rise in life expectancy in the 20th century cannot be explained by improvement in medical treatment of disease (Evans R. G. et al., 1994; McKeown, 1979; McKinlay & McKinlay, 1977). Furthermore, the contribution of medical resources and expenditures to differences in mortality across U.S. states and counties have been questioned (Auster et al., 1969; Miller M. K. & Stokes, 1978). Countries like the U.K. who introduced universal access to medical care saw a reversal in the social gradient in the use of service, but did not see the socioeconomic gradient in health and survival reduce (Macintyre, 1997; Marmot M. et al., 1987; Wagstaff et al., 1991).
In the U.S., low-income individuals use more medical services (Aday et al., 1980; Pincus, 1998).
This is because they have more medical problems and because they have a more favorable attitude towards the medical system (Sharp et al., 1983). Health can not be bought by buying medical services; it is produced chiefly through the benefits of education. While access to high quality medical care improves outcomes for a diseased individual, (Mirowsky & Ross, 2003, p. 90) conclude “Clearly, differential access to medical care can not explain the differences in health and survival across levels of education and income”.
Employment, Occupation, and Work. Employment, occupation and work have been posited as links between education and health. Better-educated people are more likely to be employed, to have jobs that are better paid and that are more satisfying because they allow autonomy and reward creativity. Better educated people are more likely to be in full-time employment and less likely to be in part-time employment or unemployed. Education brings people into the labor force and keeps them at the highest level of participation: full-time employment. Mirowsky and Ross (2003) estimate that, on average, each additional year of education increases the odds of full-time employment by 11%, decreases the odds of being unemployed by 10%, and decreases the odds of being unable to work because of disability by 23%.
E-33
Education also improves the stability of full-time employment by decreasing the probability of ever having been unemployed.
Health improves steadily with participation in the labor force. Persons in full-time employment have
the best health and those unable to work have the worst health (Mirowsky & Ross, 2003). Mirowsky and Ross (2003) point to three possible mechanisms that can account for differences in health across employment statuses. Traits that influence employment, such as age, gender and marital status, can affect both health and employment. However, health differences by employment remain after controlling for these factors, indicating that some other mechanism is at work. The two remaining mechanisms are causation and selection. Employment may cause better health because employed individuals have an economic advantage as well as healthier behaviors. Selection implies that good health increases the likelihood of full-time employment while bad health causes people to not be in the labor force because employers tend not to hire individuals in poor health. Mirowsky and Ross (2003) report that both processes are present, but that the link between employment and health mainly operates through a causal mechanism. They find evidence that employment and health are in symbiotic relationship: “Just as full-time employment helps individuals to stay or become healthy, health helps them stay or become employed full-time” (Mirowsky & Ross, 2003, p. 112). Selection seems to be a minor mechanism in the relationship between employment and health and to be declining over time.
Workers, particularly men, with lower levels of education tend to be in occupations where exposure to physical, chemical or biological hazards and noxious environments is more common. Better educated workers are less likely to be in harsh or dangerous occupations (Mirowsky & Ross, 2003). However, due to the remarkable safety of most of today’s workplaces, occupation has little effect on overall health and does not explain the differences in health by education (Mirowsky & Ross, 2003). Jobs that allow workers to use creativity, to have control over what they do and how to do it, and that involve autonomy and creativity favor health (Mirowsky & Ross, 2003). The classic Whitehall study of British civil service provides evidence that there is a gradient in health and mortality across job classification (Marmot M. G. et al., 1991). Marmot emphasizes that better health is associated with greater control over working conditions and job demands. More autonomous and creative jobs are usually at the top of workplace hierarchy, are well paid, and tend to go to better-educated individuals. Social Resources. Better-educated people are more likely to be married and tend to have more stable and supportive relationships (Mirowsky & Ross, 2003). Social support, and in particular marriage, are protectors of health. Married people have better health than those who are not married, probably because they face less economic hardship, have more social support, especially emotional support, and lead a more orderly and regulated life. General social support improves psychological well-being that is associated with better physical health. Married people also tend to have more contact with the health care system resulting in earlier detection and treatment of disease. The effect of marriage on health behaviors is mixed. Married people are less likely to smoke or to drink heavily, and are less prone to injuries and risky sexual behavior. However, they are less likely to exercise and more likely to be overweight (Mirowsky & Ross, 2003). Biological Risk. A possible explanation for educational inequality in health is differential exposure to chronic and acute stress. We have discussed above how persons with less education are more likely to be exposed to various types of stressors: physical, economic and social. Recent literature has attempted to elucidate the biological pathways that mediate educational-related exposures to stressors and increased morbidity and mortality (Marmot M. G. et al., 1995; Seeman T. E. & Crimmins, 2001; Seeman T. E. et al., 2004). Many studies have reported higher traditional risk factors for coronary heart disease, such as elevated blood pressure, cholesterol, weight, glucose, and fibrinogen, among lower SES individuals (Seeman T. E. et al., 2004, p. 1986). Recently, the concept of allostatic load has been used in explaining educational related differential in health. Allostatic load is defined by Seeman et al (Seeman T. E. et al., 2004, p. 1986) as reflecting “the cumulative total of physiological deregulations across multiple physiologic regulatory systems, a total that is postulated to impact significantly on health and longevity” (Seeman T. E. et al., 2004). The burden of such physiological wear and tear results, partially, from life experiences and
E-34
physiological reactions to them. Differences in life experiences are strongly conditioned by educational achievement. The concept of allostatic load, with its implication of general susceptibility, has the ability to explain the educational gradient observed in a wide range of diseases and causes of deaths. Allostatic load has been measured by levels of physiological activity across the hypothalamic-pituitary-adrenal axis, the sympathetic nervous system, cardiovascular systems, and metabolic processes, which have been linked to increased risk for disease (McEwen, 1998; Seeman T. E. et al., 2004). There is strong evidence of a negative relationship between allostatic load and educational attainment, with the better educated exhibiting lower cumulative allostatic load, and of a positive relationship between allostatic load and mortality (Seeman T. E. & Crimmins, 2001; Seeman T. E. et al., 2004; Seeman T. E. et al., 1997; Seeman T. E. et al., 2001). In a study of elderly Americans from new Haven, CT, East Boston, MA, and Durham, NC, the cumulative allostatic load explained 35% of the differences in mortality risk between those with less than high school and those with high school or greater educational achievement (Seeman T. E. et al., 2004). Education and Age. The advantages in health associated with education do not decline with age (Crimmins & Saito, 2001; Manton et al., 1997; Mirowsky & Ross, 2003; Preston & Elo, 1995). On the contrary, the positive effects of education on health accumulate during adulthood over many areas of life (socioeconomic, behavioral and biological) and grow over long periods of time (Mirowsky & Ross, 2003). The positive accumulations create feedbacks that amplify the effects of education over the lifetime. Even among the oldest old, those with less education have the greatest disability and limitations (Freedman et al., 2002). Declines in severe cognitive impairment appeared to be largest among those with less than a high school education, though there were no educational disparities in functional limitations and visual limitations (Freedman et al., 2002). The concept of cumulative biological risk discussed above can be used to explain the evidence that educational related mortality differentials grow at older ages. The cumulative burden of physiological deregulation, as reflected in the summary measure of allostatic load, increases faster over the lifetime for those with less education compared to those who are better educated (Seeman T. E. et al., 2004). Section 4. Alternative Views on the Link between Educational Attainment and Adult Health Status Reverse Causation. Low (2005) describes an alternative explanation for the correlation between education and health. Reverse causation, represented by the hypothesis that better health may lead to more and better education, could explain the relationship between education and health (Low, 2005). While this paper discusses the relationship between health and educational achievement in school age children, in adults the preponderance of evidence is that it is education that mainly promotes good health and not the other way round (Koivusilta et al., 1999; Ross C. E. & Wu, 1996; Shakotko et al., 1980). The Third Factor Hypothesis. Low (2005) describes the third factor hypothesis which posits that both education and health depend on some third factor. The factors that are proposed are “personal endowment” and “time preference” (Low, 2005). Personal endowment consists of a cluster of genetically inherited factors that predispose to both educational achievement and good health. While there is evidence of genetics component to general intelligence and of an association between IQ, educational achievement and health, it seems unlikely that inherited IQ alone can account for the observed relationship between education and health (Low, 2005). Other inherited traits such as personality and longevity may also affect both educational achievement and health, but evidence is lacking that those traits are socially distributed in the population and can explain the health of population groups (Low, 2005). The evidence provided in this paper, on the other hand, indicates that education promotes health independently of personal endowment and genetic traits. Time preference, or the ability and inclination to postpone gratification with the expectation of future benefit, is a concept taken from the economic literature (Fuchs V., 1982). Time preference can affect both educational attainment and health because those who are able and willing to postpone gratification are more likely to stay in school as well as to avoid risky behaviors such as smoking or risky

E-35
sex in the expectation of a more prosperous and healthier life in the future. A small role for time preference in both education and health has been demonstrated (Fuchs V., 1982; Kennedy, 2003). However, as Low (Low, 2005) argues, the key question is whether time preference is innate or acquired. Sociological research points to time preference being influenced by social and cultural factors, including education (Lawrence, 1991).
Other views of education include education as credential and education as a reproducer of inequality (Mirowsky & Ross, 2003). The credentialist view is that education produces an artificial effect, not a real effect, and is only a mark of status. If this was true we would only see a relationship of health to degree and not to years of schooling. But the evidence points to a strong positive relationship between years of education and health outcomes (Mirowsky & Ross, 2003). The view of education as a reproducer of inequality posits that education is solely used to perpetuate social status from one generation to the next. In this view, education does not develop productive abilities but merely provides the signs needed for students to be matched to positions so as to maintain the existing socioeconomic structure. However, research shows that persons from low status families gain the most from additional education, thus invalidating the education as reproducer of inequality view (Mirowsky & Ross, 2003).
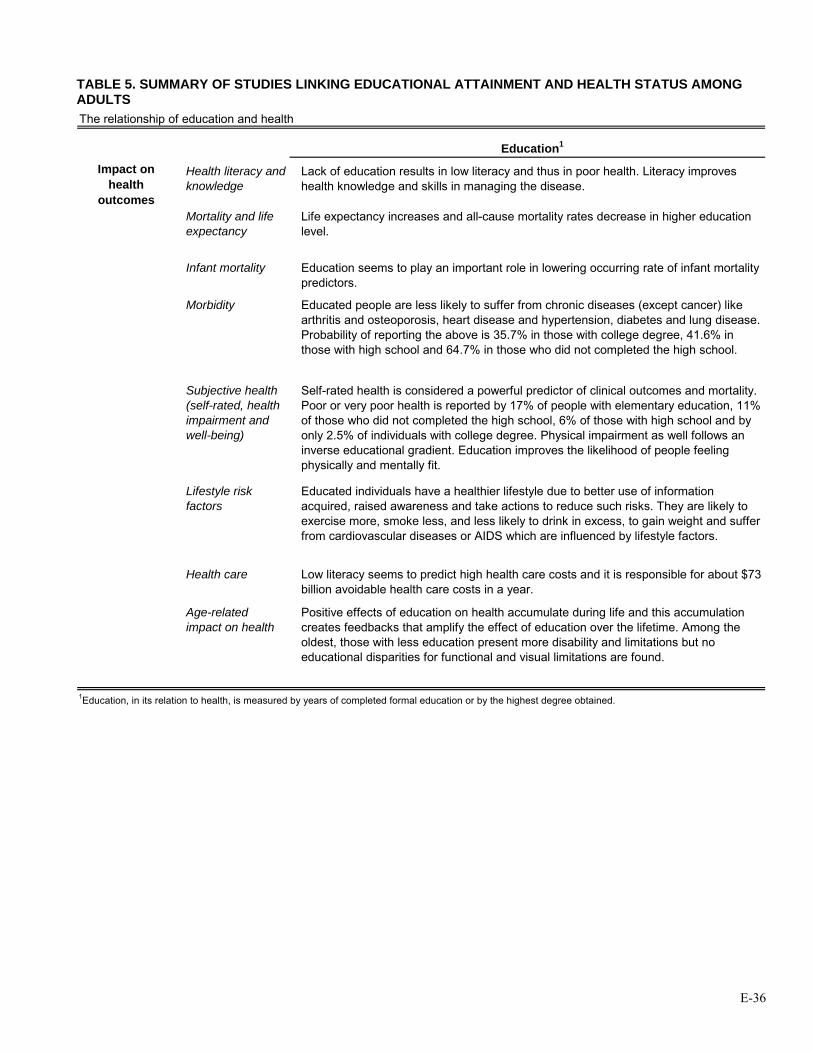
E-36
TABLE 5. SUMMARY OF STUDIES LINKING EDUCATIONAL ATTAINMENT AND HEALTH STATUS AMONG ADULTS The relationship of education and health
Education1
Impact on health
outcomes
Health literacy and knowledge
Lack of education results in low literacy and thus in poor health. Literacy improves health knowledge and skills in managing the disease.
Mortality and life expectancy
Life expectancy increases and all-cause mortality rates decrease in higher education level.
Infant mortality Education seems to play an important role in lowering occurring rate of infant mortality predictors.
Morbidity Educated people are less likely to suffer from chronic diseases (except cancer) like arthritis and osteoporosis, heart disease and hypertension, diabetes and lung disease. Probability of reporting the above is 35.7% in those with college degree, 41.6% in those with high school and 64.7% in those who did not completed the high school.
Subjective health (self-rated, health impairment and well-being)
Self-rated health is considered a powerful predictor of clinical outcomes and mortality. Poor or very poor health is reported by 17% of people with elementary education, 11% of those who did not completed the high school, 6% of those with high school and by only 2.5% of individuals with college degree. Physical impairment as well follows an inverse educational gradient. Education improves the likelihood of people feeling physically and mentally fit.
Lifestyle risk factors
Educated individuals have a healthier lifestyle due to better use of information acquired, raised awareness and take actions to reduce such risks. They are likely to exercise more, smoke less, and less likely to drink in excess, to gain weight and suffer from cardiovascular diseases or AIDS which are influenced by lifestyle factors.
Health care Low literacy seems to predict high health care costs and it is responsible for about $73 billion avoidable health care costs in a year.
Age-related impact on health
Positive effects of education on health accumulate during life and this accumulation creates feedbacks that amplify the effect of education over the lifetime. Among the oldest, those with less education present more disability and limitations but no educational disparities for functional and visual limitations are found.
1Education, in its relation to health, is measured by years of completed formal education or by the highest degree obtained.

E-37
TABLE 6. SUMMARY OF EXPLANATIONS FOR THE LINK BETWEEN EDUCATIONAL ATTAINMENT AND HEALTH STATUS
Pathway Education HealthIndependent effect to health
Human capital approach
The human capital approach implies that education improves individual ability to produce health. The skills, the knowledge and resources acquired in school build abilities that can be used to foster health. The resources acquired through education are inherent in the people themselves. Education as learned effectiveness helps individuals gain access to resources that promote health, use effectively these resources and health-related information, and thus adopt health promoting behaviors.
Personal control Education increases a sense of personal control, a perception of control and ability to alter the environment an individual lives in, which leads to adoption of healthy lifestyle. Education teaches problem-solving skills and confidence.
Controlling for income
At households of the same income level and demographics, families with higher levels of education tend to experience less economic hardship consequences and have better health at any level of income. Differences in health by income decrease as education increases.
Dependent (indirect) effect to health
SES* Education is antecedent to all the other measures of SES as it comes early in life and shapes future occupational opportunities and earning potentials. It is the best SES predictor of health status.
SES and health are inversely associated by a gradient. All SES indicators such as income, occupation, education level, social class, and wealth have proved to be related with health outcomes.
Income Education attainment usually translates in economic well-being and advantage. It increases household income due to higher chances of finding high wage employment, having two in the household and being married to someone with similar education and income level.
Income has a strong relationship with health. It provides the access to material resources for basic needs, including health care. Differential access to these resources by income will also have an impact on health outcomes. Income seems to have an independent effect on health. Declining mortality is associated on an income-based gradient with increasing income, particularly in males and in working age groups.
Use of medical care
Differences in health across levels of education and income cannot be explained by different access to medical care, although high quality medical care improves outcomes for people suffering from diseases.
Employment, occupation, work
Education increases the likelihood for individuals to be employed at full-time jobs that are better paid, and that allow workers to use their creativity, have control over their work and have work autonomy, all together thought to favor health.
Occupation and health are involved in a dual relationship where full-time employment help individual be healthy and vice versa.
Social resources Better educated people are likely to be married and tend to have stable relationships, emotional and social support, and more contacts with health care. As such they have better psychological wellbeing and physical health. The effect of marriage in health however is mixed.
Biological risk There is strong evidence that better educated people exhibit lower allostatic load where allostatic load is positively related with mortality. Allostatic load is defined like total cumulative of physiological deregulations across multiple physiologic regulatory systems and which impacts significantly health and longevity.
* SES, Socio-economic status
Possible pathways how education affects health
Socioeconomic status (SES) has consistently been found to influence to a great extent individuals’ health. The association between SES and health presents a positive gradient for most health outcomes (that is, the greater the SES, the better the health), whether SES is measured by education, occupation,

E-38
income, wealth or social class. Education is considered as a core SES dimension as it serves as precursor to other health determinants such as income and occupational status. Extensive evidence points out that a variety of health outcomes are influenced by education. Overall, people with higher educational attainment tend to be healthier than people with lower education. The effect has been attributed to higher general and health literacy and its application in informed decisions and actions they take towards healthier lifestyle behaviors. Health condition surveys support the claim for self-rated health, physical impairment and mental and physical well-being. Additionally, it is observed that the higher the educational grade obtained, lesser are the rates of all-cause mortality, life expectancy and morbidity. This positive influence of education on health does not diminish with years; on the contrary it accumulates and amplifies during the life span.
Education affects individual health through both direct and indirect pathways. Education is
positively associated with health outcomes even after controlling for other health determinants suggesting an independent effect on health. As learned skill, knowledge and effectiveness, education directly improves health; increases the sense of personal control, and enhances social, psychological resources and provides valuable tools for their proper use.
Alternatively, education strongly correlates with other indicators of socioeconomic status and as
their precursor in occurring early in life, it is very likely to determine future occupational and economical prospects for an individual. Educated individuals are likely to have better opportunities for full-time jobs, stable employment contracts, jobs over which they have control and where creativity and autonomy are encouraged. All of these factors are seen to improve health. Furthermore, these employment opportunities are accompanied by increases in income. Income provides to individuals access to material resources, health care services among others, to fulfill the basic needs, thus improving individual health. Section 5. Interventions in Early Childhood
The period during which brain development is the most rapid and important is in the first 3 to 5 years of life. Early life conditions affect the ability to learn and are important predictors of future academic success (Low, 2005). Jimerson et al. (2000) states: “The context from which the child emerges when entering elementary school provides a critical foundation for subsequent academic success”. Several studies have reported a strong relationship between early life conditions and dropping out of high school (Jimerson et al., 2000), later performance in school, adult literacy, health status and mortality (Keating & Hertzman, 1999). Readiness to learn when entering kindergarten has been associated with mathematical achievement in eighth grade (Fuchs V. R. & Reklis, 1997).
There is evidence that readiness to learn for at-risk children in the pre-kindergarten years can be
improved through intervention. Though health effects have not been established, there is suggestive evidence that programs such as Head Start and the Perry Preschool Project may confer long-term benefits (Hertzman, 1999). Pre-school enrichment programs have been shown to improve the cognitive and social capacity of poor children at high risk. One of the first programs to be evaluated, the classic High/Scope Perry program, provided evidence that per-school enrichment program improved high school graduation, avoidance of legal and marriage problems, home ownership, and use of social services (Schweinhart, 1993). In the evaluation by the Center for Educational Research at Stanford, Right Start, a compensatory education program, was shown to increase developmental test scores at ages 7, 8, and 9 (Case & Griffin, 1991). Recent evaluations of Head Start and Early Head Start, the largest early childhood intervention programs for low SES children in the U.S., have shown mixed results, but some positive effects on learning (Mathematica Policy Research Inc, 2002; McGroder, 1990).
The evidence presented in this section corroborates the importance of education to health and provides justification of why investing in education and evaluating and improving policies related to education, have an imperative relevance.

E-39
According to the Census 2000 data, 24.3 % of adults in Texas do not have a high school diploma. That is more than the percentage of adults with a college degree (15.6%) or graduate or professional degree (7.6). These averages reflect great variation in educational attainment by racial/ethnic status as shown in the table below.
Educational attainment in Texas by racial/ethnic groups Less than high school High school diploma
but no college degree College degree or higher
Non-Hispanic Whites
12.8 57.2 30.0
Hispanics 50.7 40.4 8.9
African Americans 24.2 60.5 15.3
Asians 19.3 32.9 47.8
Source: 2000 Census obtained from Texas State Data Center Improvement in the educational attainment of Texans would result in better health status, lower morbidity and mortality, and lower health care costs in Texas. PART THREE: Inventory of Recommendations The first section inventories general recommendations and their claims about how these interventions will affect academic performance.
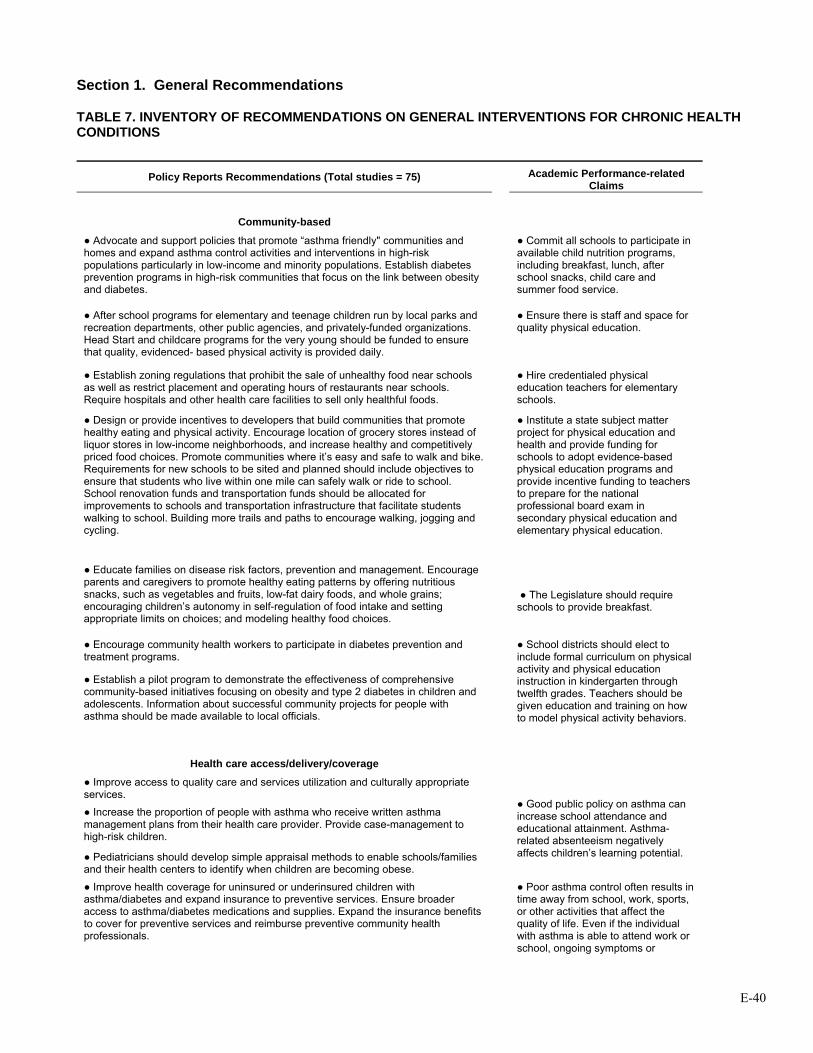
E-40
Section 1. General Recommendations
TABLE 7. INVENTORY OF RECOMMENDATIONS ON GENERAL INTERVENTIONS FOR CHRONIC HEALTH CONDITIONS
Policy Reports Recommendations (Total studies = 75)
Academic Performance-related Claims
Community-based
● Advocate and support policies that promote “asthma friendly" communities and homes and expand asthma control activities and interventions in high-risk populations particularly in low-income and minority populations. Establish diabetes prevention programs in high-risk communities that focus on the link between obesity and diabetes.
● Commit all schools to participate in available child nutrition programs, including breakfast, lunch, after school snacks, child care and summer food service.
● After school programs for elementary and teenage children run by local parks and recreation departments, other public agencies, and privately-funded organizations. Head Start and childcare programs for the very young should be funded to ensure that quality, evidenced- based physical activity is provided daily.
● Ensure there is staff and space for quality physical education.
● Establish zoning regulations that prohibit the sale of unhealthy food near schools as well as restrict placement and operating hours of restaurants near schools. Require hospitals and other health care facilities to sell only healthful foods.
● Hire credentialed physical education teachers for elementary schools.
● Design or provide incentives to developers that build communities that promote healthy eating and physical activity. Encourage location of grocery stores instead of liquor stores in low-income neighborhoods, and increase healthy and competitively priced food choices. Promote communities where it’s easy and safe to walk and bike. Requirements for new schools to be sited and planned should include objectives to ensure that students who live within one mile can safely walk or ride to school. School renovation funds and transportation funds should be allocated for improvements to schools and transportation infrastructure that facilitate students walking to school. Building more trails and paths to encourage walking, jogging and cycling.
● Institute a state subject matter project for physical education and health and provide funding for schools to adopt evidence-based physical education programs and provide incentive funding to teachers to prepare for the national professional board exam in secondary physical education and elementary physical education.
● Educate families on disease risk factors, prevention and management. Encourage parents and caregivers to promote healthy eating patterns by offering nutritious snacks, such as vegetables and fruits, low-fat dairy foods, and whole grains; encouraging children’s autonomy in self-regulation of food intake and setting appropriate limits on choices; and modeling healthy food choices.
● The Legislature should require schools to provide breakfast.
● Encourage community health workers to participate in diabetes prevention and treatment programs.
● Establish a pilot program to demonstrate the effectiveness of comprehensive community-based initiatives focusing on obesity and type 2 diabetes in children and adolescents. Information about successful community projects for people with asthma should be made available to local officials.
● School districts should elect to include formal curriculum on physical activity and physical education instruction in kindergarten through twelfth grades. Teachers should be given education and training on how to model physical activity behaviors.
Health care access/delivery/coverage ● Improve access to quality care and services utilization and culturally appropriate services.
● Increase the proportion of people with asthma who receive written asthma management plans from their health care provider. Provide case-management to high-risk children.
● Pediatricians should develop simple appraisal methods to enable schools/families and their health centers to identify when children are becoming obese.
● Good public policy on asthma can increase school attendance and educational attainment. Asthma-related absenteeism negatively affects children’s learning potential.
● Improve health coverage for uninsured or underinsured children with asthma/diabetes and expand insurance to preventive services. Ensure broader access to asthma/diabetes medications and supplies. Expand the insurance benefits to cover for preventive services and reimburse preventive community health professionals.
● Poor asthma control often results in time away from school, work, sports, or other activities that affect the quality of life. Even if the individual with asthma is able to attend work or school, ongoing symptoms or
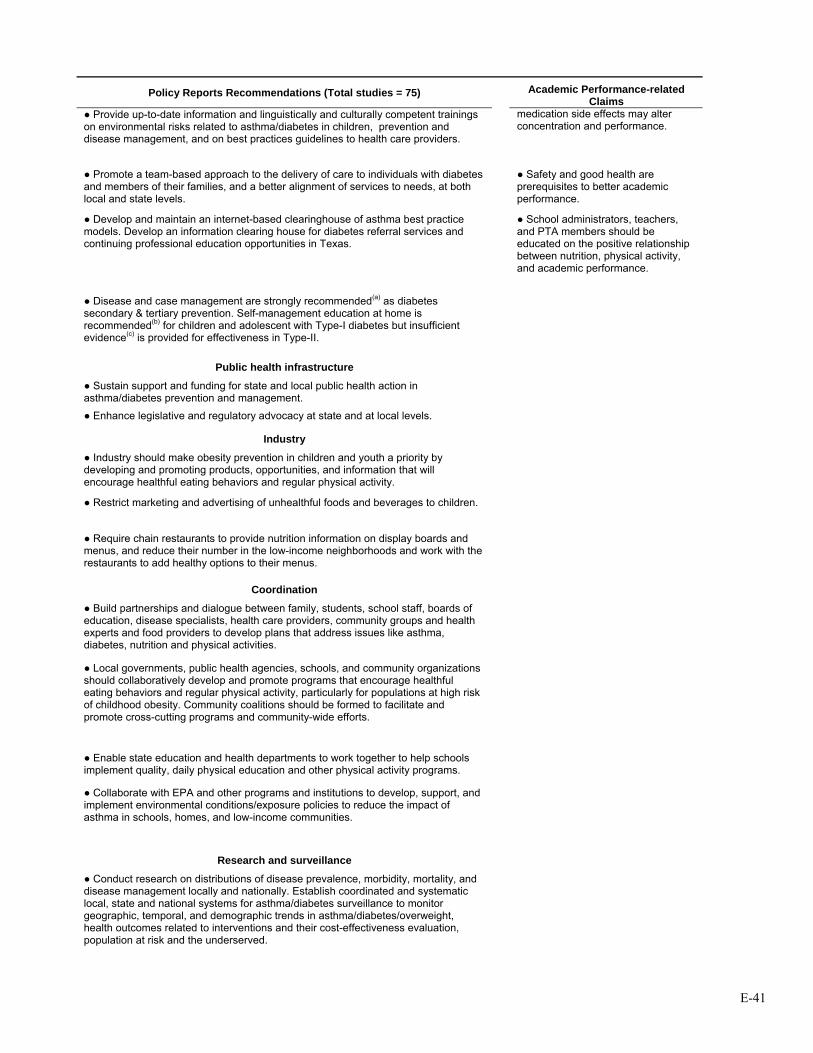
E-41
Policy Reports Recommendations (Total studies = 75)
Academic Performance-related Claims
● Provide up-to-date information and linguistically and culturally competent trainings on environmental risks related to asthma/diabetes in children, prevention and disease management, and on best practices guidelines to health care providers.
medication side effects may alter concentration and performance.
● Promote a team-based approach to the delivery of care to individuals with diabetes and members of their families, and a better alignment of services to needs, at both local and state levels.
● Safety and good health are prerequisites to better academic performance.
● Develop and maintain an internet-based clearinghouse of asthma best practice models. Develop an information clearing house for diabetes referral services and continuing professional education opportunities in Texas.
● School administrators, teachers, and PTA members should be educated on the positive relationship between nutrition, physical activity, and academic performance.
● Disease and case management are strongly recommended(a) as diabetes secondary & tertiary prevention. Self-management education at home is recommended(b) for children and adolescent with Type-I diabetes but insufficient evidence(c) is provided for effectiveness in Type-II.
Public health infrastructure
● Sustain support and funding for state and local public health action in asthma/diabetes prevention and management.
● Enhance legislative and regulatory advocacy at state and at local levels.
Industry
● Industry should make obesity prevention in children and youth a priority by developing and promoting products, opportunities, and information that will encourage healthful eating behaviors and regular physical activity.
● Restrict marketing and advertising of unhealthful foods and beverages to children.
● Require chain restaurants to provide nutrition information on display boards and menus, and reduce their number in the low-income neighborhoods and work with the restaurants to add healthy options to their menus.
Coordination
● Build partnerships and dialogue between family, students, school staff, boards of education, disease specialists, health care providers, community groups and health experts and food providers to develop plans that address issues like asthma, diabetes, nutrition and physical activities.
● Local governments, public health agencies, schools, and community organizations should collaboratively develop and promote programs that encourage healthful eating behaviors and regular physical activity, particularly for populations at high risk of childhood obesity. Community coalitions should be formed to facilitate and promote cross-cutting programs and community-wide efforts.
● Enable state education and health departments to work together to help schools implement quality, daily physical education and other physical activity programs.
● Collaborate with EPA and other programs and institutions to develop, support, and implement environmental conditions/exposure policies to reduce the impact of asthma in schools, homes, and low-income communities.
Research and surveillance
● Conduct research on distributions of disease prevalence, morbidity, mortality, and disease management locally and nationally. Establish coordinated and systematic local, state and national systems for asthma/diabetes surveillance to monitor geographic, temporal, and demographic trends in asthma/diabetes/overweight, health outcomes related to interventions and their cost-effectiveness evaluation, population at risk and the underserved.
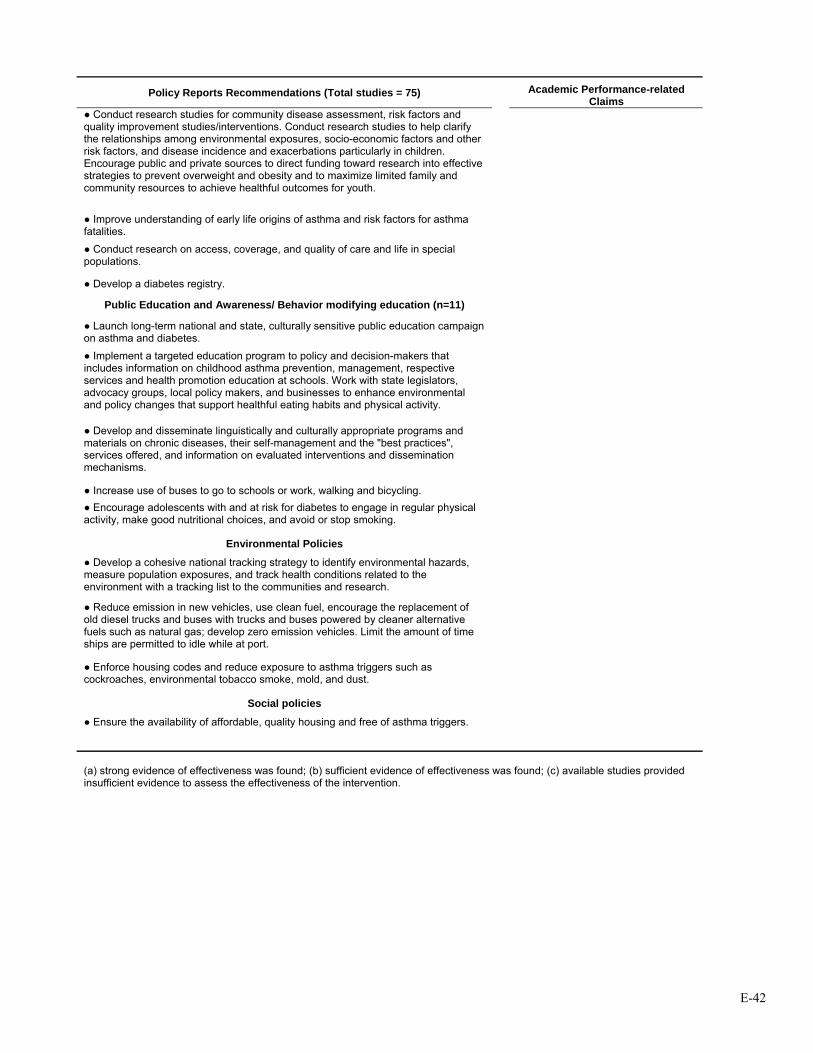
E-42
Policy Reports Recommendations (Total studies = 75)
Academic Performance-related Claims
● Conduct research studies for community disease assessment, risk factors and quality improvement studies/interventions. Conduct research studies to help clarify the relationships among environmental exposures, socio-economic factors and other risk factors, and disease incidence and exacerbations particularly in children. Encourage public and private sources to direct funding toward research into effective strategies to prevent overweight and obesity and to maximize limited family and community resources to achieve healthful outcomes for youth.
● Improve understanding of early life origins of asthma and risk factors for asthma fatalities.
● Conduct research on access, coverage, and quality of care and life in special populations.
● Develop a diabetes registry. Public Education and Awareness/ Behavior modifying education (n=11)
● Launch long-term national and state, culturally sensitive public education campaign on asthma and diabetes.
● Implement a targeted education program to policy and decision-makers that includes information on childhood asthma prevention, management, respective services and health promotion education at schools. Work with state legislators, advocacy groups, local policy makers, and businesses to enhance environmental and policy changes that support healthful eating habits and physical activity.
● Develop and disseminate linguistically and culturally appropriate programs and materials on chronic diseases, their self-management and the "best practices", services offered, and information on evaluated interventions and dissemination mechanisms.
● Increase use of buses to go to schools or work, walking and bicycling. ● Encourage adolescents with and at risk for diabetes to engage in regular physical activity, make good nutritional choices, and avoid or stop smoking.
Environmental Policies
● Develop a cohesive national tracking strategy to identify environmental hazards, measure population exposures, and track health conditions related to the environment with a tracking list to the communities and research.
● Reduce emission in new vehicles, use clean fuel, encourage the replacement of old diesel trucks and buses with trucks and buses powered by cleaner alternative fuels such as natural gas; develop zero emission vehicles. Limit the amount of time ships are permitted to idle while at port.
● Enforce housing codes and reduce exposure to asthma triggers such as cockroaches, environmental tobacco smoke, mold, and dust.
Social policies
● Ensure the availability of affordable, quality housing and free of asthma triggers.
(a) strong evidence of effectiveness was found; (b) sufficient evidence of effectiveness was found; (c) available studies provided insufficient evidence to assess the effectiveness of the intervention.
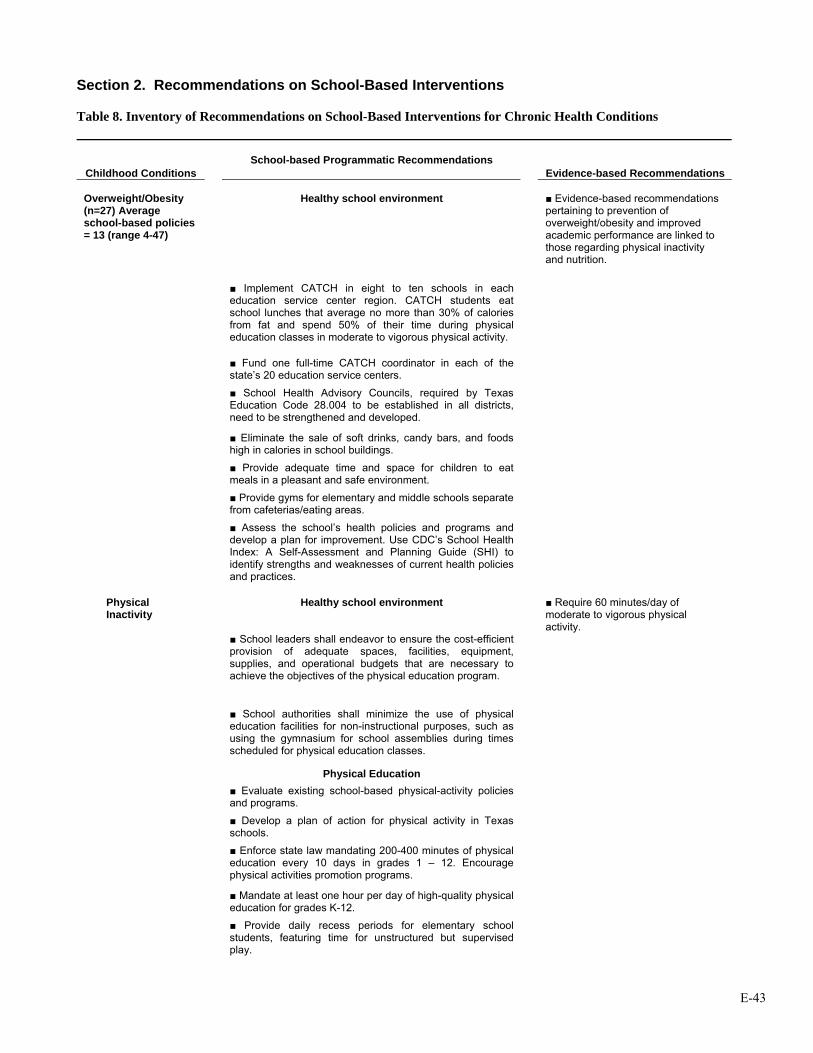
E-43
Section 2. Recommendations on School-Based Interventions Table 8. Inventory of Recommendations on School-Based Interventions for Chronic Health Conditions
Childhood Conditions School-based Programmatic Recommendations
Evidence-based Recommendations
Healthy school environment ■ Evidence-based recommendations pertaining to prevention of overweight/obesity and improved academic performance are linked to those regarding physical inactivity and nutrition.
Overweight/Obesity (n=27) Average school-based policies = 13 (range 4-47)
■ Implement CATCH in eight to ten schools in each education service center region. CATCH students eat school lunches that average no more than 30% of calories from fat and spend 50% of their time during physical education classes in moderate to vigorous physical activity.
■ Fund one full-time CATCH coordinator in each of the state’s 20 education service centers.
■ School Health Advisory Councils, required by Texas Education Code 28.004 to be established in all districts, need to be strengthened and developed.
■ Eliminate the sale of soft drinks, candy bars, and foods high in calories in school buildings.
■ Provide adequate time and space for children to eat meals in a pleasant and safe environment.
■ Provide gyms for elementary and middle schools separate from cafeterias/eating areas.
■ Assess the school’s health policies and programs and
develop a plan for improvement. Use CDC’s School Health Index: A Self-Assessment and Planning Guide (SHI) to identify strengths and weaknesses of current health policies and practices.
Healthy school environment ■ Require 60 minutes/day of moderate to vigorous physical activity.
Physical Inactivity
■ School leaders shall endeavor to ensure the cost-efficient provision of adequate spaces, facilities, equipment, supplies, and operational budgets that are necessary to achieve the objectives of the physical education program.
■ School authorities shall minimize the use of physical education facilities for non-instructional purposes, such as using the gymnasium for school assemblies during times scheduled for physical education classes.
Physical Education ■ Evaluate existing school-based physical-activity policies
and programs.
■ Develop a plan of action for physical activity in Texas schools.
■ Enforce state law mandating 200-400 minutes of physical education every 10 days in grades 1 – 12. Encourage physical activities promotion programs.
■ Mandate at least one hour per day of high-quality physical
education for grades K-12.
■ Provide daily recess periods for elementary school students, featuring time for unstructured but supervised play.

E-44
Childhood Conditions School-based Programmatic Recommendations
Evidence-based Recommendations ■ Suitably adapted physical education shall be included as
part of individual education plans for students with chronic health problems, other disabling conditions, or other special needs that preclude such students' participation in regular physical education instruction or activities.
■ Health-related physical fitness testing shall be integrated into the curriculum as an instructional tool, except in the early elementary grades. Staff will maintain the confidentiality of fitness test results, which will be made available only to students and their parents/guardians.
Pupil/student health education ■ Educate all children about the importance of physical
activity and the role of school and community environments in influencing their activity choices.
School personnel education ■ Educate school administrators, teachers, and PTA
members on the positive relationship between physical activity and academic performance.
■ All physical education teachers shall be adequately prepared and regularly participate in professional development activities to effectively deliver the physical education program. Preparation and professional development activities shall provide basic knowledge of the physical development of children and adolescents combined with skill practice in program-specific activities and other appropriate instructional techniques and strategies designed to promote lifelong habits of physical activity.
■ Develop sensitivity of staff to the problems encountered by the overweight child.
Healthy school environment ■ Develop a mandatory school breakfast program
Undernourished
■ Use only healthful foods as rewards and as fundraisers. Increase the availability and affordability of fresh produce and healthy food choices in schools.
■ Use subsidies to lower the price of healthy foods. ■ Students and staff shall have adequate space to eat
meals in pleasant surroundings and shall have adequate time to eat, relax, and socialize: at least 10 minutes after sitting down for breakfast and 20 minutes after sitting down for lunch. Safe drinking water and convenient access to facilities for hand washing and oral hygiene shall be available.
■ Each district/school shall employ a food service director,
who is properly qualified and certified according to current professional standards, to administer the school food service program and satisfy reporting requirements.
■ Develop and implement nutritional standards for foods
and beverages sold in state vending machines and cafeterias.
■ Limit access to area restaurants during school hours. Nutrition Services ■ Evaluate existing school-based nutrition policies and
programs.
■ Develop an action plan on physical activity and nutrition in Texas schools.
■ Implement SB 19 nutrition standards in grades K-12. Encourage healthy eating promotion programs.
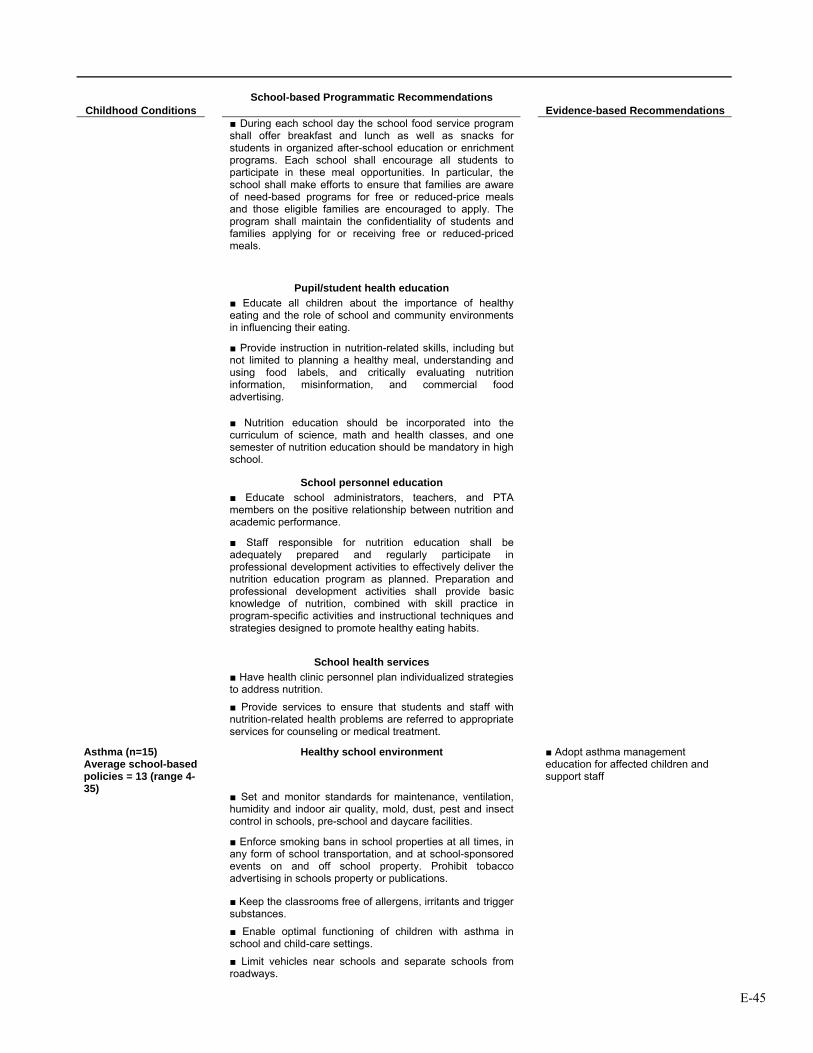
E-45
Childhood Conditions School-based Programmatic Recommendations
Evidence-based Recommendations ■ During each school day the school food service program
shall offer breakfast and lunch as well as snacks for students in organized after-school education or enrichment programs. Each school shall encourage all students to participate in these meal opportunities. In particular, the school shall make efforts to ensure that families are aware of need-based programs for free or reduced-price meals and those eligible families are encouraged to apply. The program shall maintain the confidentiality of students and families applying for or receiving free or reduced-priced meals.
Pupil/student health education ■ Educate all children about the importance of healthy
eating and the role of school and community environments in influencing their eating.
■ Provide instruction in nutrition-related skills, including but not limited to planning a healthy meal, understanding and using food labels, and critically evaluating nutrition information, misinformation, and commercial food advertising.
■ Nutrition education should be incorporated into the
curriculum of science, math and health classes, and one semester of nutrition education should be mandatory in high school.
School personnel education ■ Educate school administrators, teachers, and PTA
members on the positive relationship between nutrition and academic performance.
■ Staff responsible for nutrition education shall be adequately prepared and regularly participate in professional development activities to effectively deliver the nutrition education program as planned. Preparation and professional development activities shall provide basic knowledge of nutrition, combined with skill practice in program-specific activities and instructional techniques and strategies designed to promote healthy eating habits.
School health services ■ Have health clinic personnel plan individualized strategies
to address nutrition.
■ Provide services to ensure that students and staff with nutrition-related health problems are referred to appropriate services for counseling or medical treatment.
Healthy school environment ■ Adopt asthma management education for affected children and support staff
■ Set and monitor standards for maintenance, ventilation, humidity and indoor air quality, mold, dust, pest and insect control in schools, pre-school and daycare facilities.
Asthma (n=15) Average school-based policies = 13 (range 4-35)
■ Enforce smoking bans in school properties at all times, in any form of school transportation, and at school-sponsored events on and off school property. Prohibit tobacco advertising in schools property or publications.
■ Keep the classrooms free of allergens, irritants and trigger substances.
■ Enable optimal functioning of children with asthma in school and child-care settings.
■ Limit vehicles near schools and separate schools from roadways.
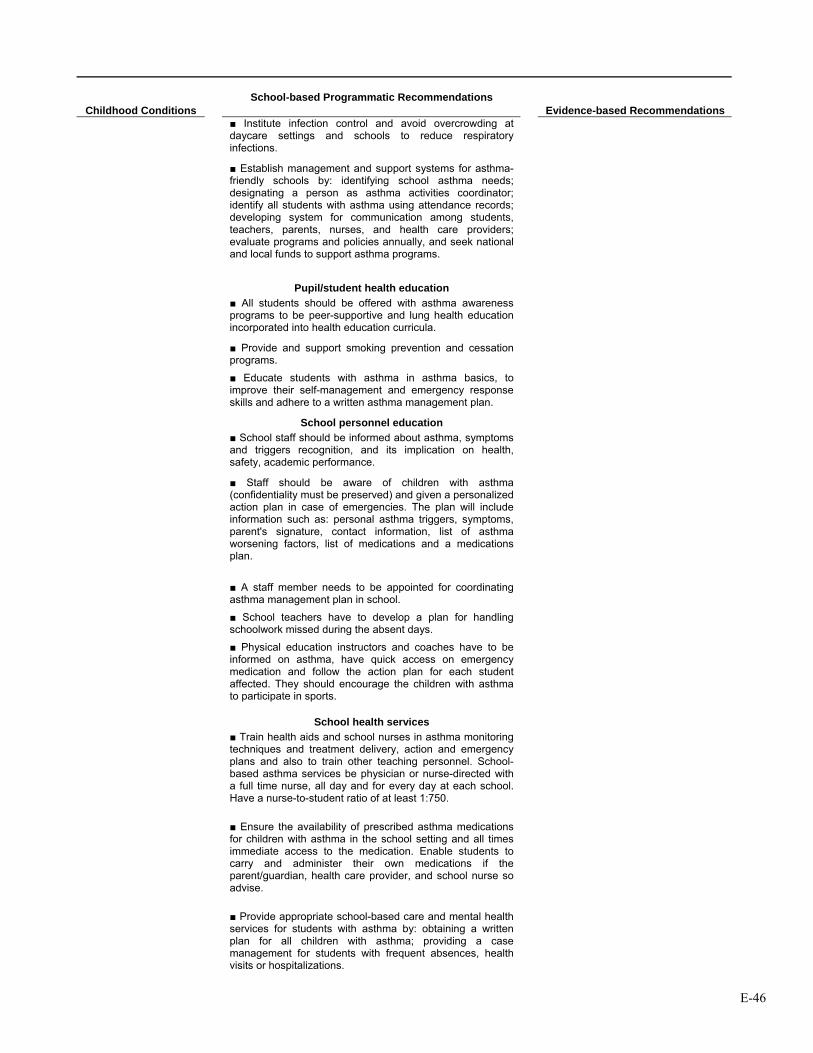
E-46
Childhood Conditions School-based Programmatic Recommendations
Evidence-based Recommendations ■ Institute infection control and avoid overcrowding at
daycare settings and schools to reduce respiratory infections.
■ Establish management and support systems for asthma-friendly schools by: identifying school asthma needs; designating a person as asthma activities coordinator; identify all students with asthma using attendance records; developing system for communication among students, teachers, parents, nurses, and health care providers; evaluate programs and policies annually, and seek national and local funds to support asthma programs.
Pupil/student health education ■ All students should be offered with asthma awareness
programs to be peer-supportive and lung health education incorporated into health education curricula.
■ Provide and support smoking prevention and cessation programs.
■ Educate students with asthma in asthma basics, to improve their self-management and emergency response skills and adhere to a written asthma management plan.
School personnel education ■ School staff should be informed about asthma, symptoms
and triggers recognition, and its implication on health, safety, academic performance.
■ Staff should be aware of children with asthma (confidentiality must be preserved) and given a personalized action plan in case of emergencies. The plan will include information such as: personal asthma triggers, symptoms, parent's signature, contact information, list of asthma worsening factors, list of medications and a medications plan.
■ A staff member needs to be appointed for coordinating asthma management plan in school.
■ School teachers have to develop a plan for handling schoolwork missed during the absent days.
■ Physical education instructors and coaches have to be informed on asthma, have quick access on emergency medication and follow the action plan for each student affected. They should encourage the children with asthma to participate in sports.
School health services ■ Train health aids and school nurses in asthma monitoring
techniques and treatment delivery, action and emergency plans and also to train other teaching personnel. School-based asthma services be physician or nurse-directed with a full time nurse, all day and for every day at each school. Have a nurse-to-student ratio of at least 1:750.
■ Ensure the availability of prescribed asthma medications for children with asthma in the school setting and all times immediate access to the medication. Enable students to carry and administer their own medications if the parent/guardian, health care provider, and school nurse so advise.
■ Provide appropriate school-based care and mental health services for students with asthma by: obtaining a written plan for all children with asthma; providing a case management for students with frequent absences, health visits or hospitalizations.
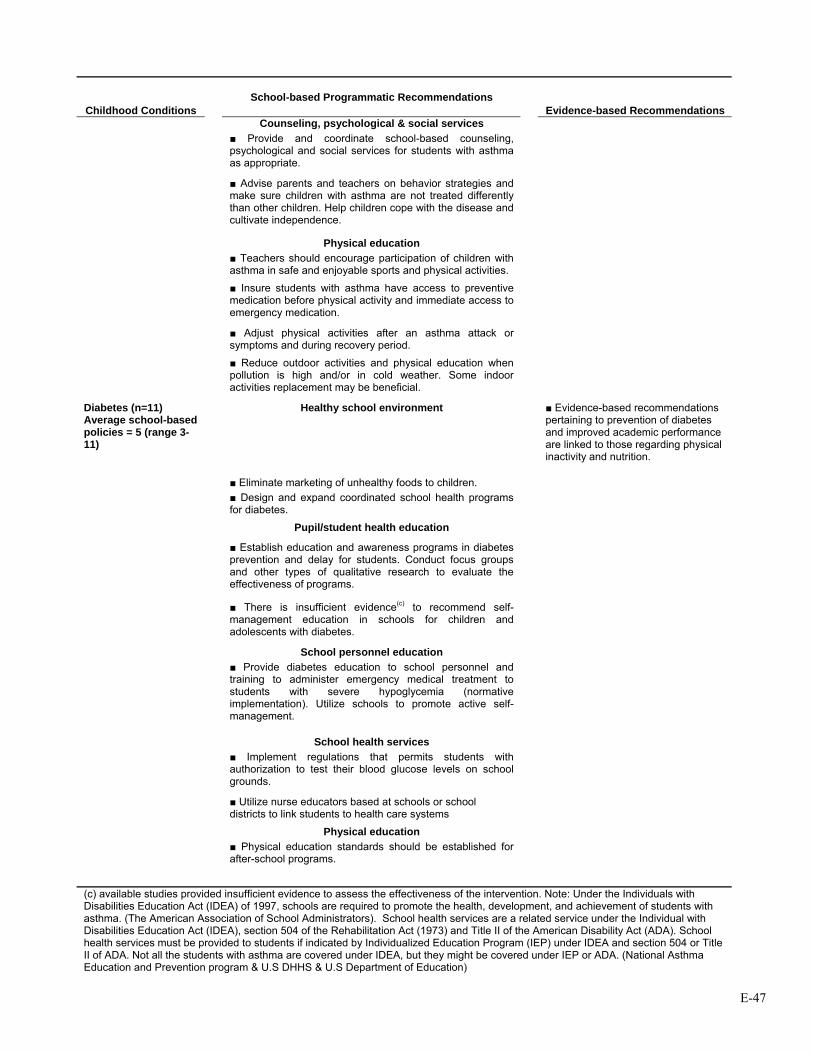
E-47
Childhood Conditions School-based Programmatic Recommendations
Evidence-based Recommendations Counseling, psychological & social services ■ Provide and coordinate school-based counseling,
psychological and social services for students with asthma as appropriate.
■ Advise parents and teachers on behavior strategies and make sure children with asthma are not treated differently than other children. Help children cope with the disease and cultivate independence.
Physical education ■ Teachers should encourage participation of children with
asthma in safe and enjoyable sports and physical activities.
■ Insure students with asthma have access to preventive medication before physical activity and immediate access to emergency medication.
■ Adjust physical activities after an asthma attack or
symptoms and during recovery period.
■ Reduce outdoor activities and physical education when
pollution is high and/or in cold weather. Some indoor activities replacement may be beneficial.
Healthy school environment ■ Evidence-based recommendations pertaining to prevention of diabetes and improved academic performance are linked to those regarding physical inactivity and nutrition.
■ Eliminate marketing of unhealthy foods to children.
Diabetes (n=11) Average school-based policies = 5 (range 3-11)
■ Design and expand coordinated school health programs for diabetes.
Pupil/student health education
■ Establish education and awareness programs in diabetes prevention and delay for students. Conduct focus groups and other types of qualitative research to evaluate the effectiveness of programs.
■ There is insufficient evidence(c) to recommend self-management education in schools for children and adolescents with diabetes.
School personnel education ■ Provide diabetes education to school personnel and
training to administer emergency medical treatment to students with severe hypoglycemia (normative implementation). Utilize schools to promote active self-management.
School health services ■ Implement regulations that permits students with
authorization to test their blood glucose levels on school grounds.
■ Utilize nurse educators based at schools or school districts to link students to health care systems
Physical education ■ Physical education standards should be established for
after-school programs.
(c) available studies provided insufficient evidence to assess the effectiveness of the intervention. Note: Under the Individuals with Disabilities Education Act (IDEA) of 1997, schools are required to promote the health, development, and achievement of students with asthma. (The American Association of School Administrators). School health services are a related service under the Individual with Disabilities Education Act (IDEA), section 504 of the Rehabilitation Act (1973) and Title II of the American Disability Act (ADA). School health services must be provided to students if indicated by Individualized Education Program (IEP) under IDEA and section 504 or Title II of ADA. Not all the students with asthma are covered under IDEA, but they might be covered under IEP or ADA. (National Asthma Education and Prevention program & U.S DHHS & U.S Department of Education)
E-48
Recommendations In determining our recommendations, we applied a “funnel” approach to pare down the hundreds of recommendations found in current policy reports. Of the recommendations for child health interventions, we selected those that were school-based programs and then narrowed this set to those that had evidence of some effect on academic performance. Finally, we reviewed Texas policy and practices (See Appendices) to identify areas where improvement was possible. School-Based Nutrition Interventions Failure to eat breakfast and undernutrition have been shown to adversely affect children’s ability to problem solve in school and potentially have long-lasting effects on a child’s cognitive development and performance in school. One recent study indicated that children in a School Breakfast Program (SBP) had increased language, math and reading scores, as well as reduced tardiness. Another study demonstrated that participation in an SBP reduced absenteeism and improved math scores, although no difference was found in reading, social studies or science. Similar, well-designed studies replicate these results: children who participate in an SBP have higher math grades and lower absence and tardiness rates. Unlike many other areas of school health, the affects of this intervention on academic performance are consistent and significant.
• Based on compelling evidence of impact on academic performance, we recommend an expansion of the School Breakfast Program (SBP) in Texas schools.
The Texas Department of Agriculture established the Texas Public School Nutrition Policy which addresses the issue of SBP, along with other nutrition and food service policies in public schools. For the fiscal year 2003 – 2004, 6,903 Texas schools participated in the SBP. This is impressive when one considers there are 7,009 public schools in Texas (Texas Department of Agriculture, 2004). However, according to the Texas Joint Interim Committee on Nutrition and Health in Public Schools, Interim Report to the 79th Legislature, only 26% of students are actually getting a school breakfast (Joint Interim Committee on Nutrition and Health in Public Schools, 2004). We recommend extending the school breakfast program to a larger number of students as a reliable means of improving academic performance while, at the same time, addressing chronic under-nourishment. School-Based Physical Activity Interventions The benefits of physical activity on health are well accepted; however, there is evidence that increasing its presence in school curricula does not impair academic achievement and may also improve school performance. Based on these findings, we recommend increasing the requirement of physical activity in Texas schools. The Texas Administrative Code (TAC §74.32) requires enrolled K-6 students to participate in a minimum of 30 minutes per day or 135 minutes per week of physical activity (National Association of State Boards of Education). The U.S. Department of Human Services and U.S. Department of Agriculture recommends 60 minutes or more of moderate to vigorous physical activity based on the most current research (Dietz, 2005).
• Given the strength of the evidence, we recommend that Texas schools increase their physical activity requirements to 60 minutes per day.
Project SPARK, an elementary school physical education program, demonstrated significant gains for reading, losses for language, and no differences for math scores on a standardized test, suggesting that, even with time taken away from the academic program for physical education, overall academic functioning was not impaired. Another physical education program incorporating fitness or skill training for 75 minutes a day, compared to usual physical education offered three times a week for 30 minutes, demonstrated increased math scores, better classroom behavior as rated by teachers and no significant
E-49
reduction in reading test scores compared with controls. Regarding level of fitness and academic performance, the California Department of Education has demonstrated a significant linear association between standardized test scores (Stanford Achievement Test Ninth Edition [SAT-9]) and their fitness scores. A dose-response effect was noted for all grades studied where the highest SAT-9 scores were reported by students who met three or more standard levels among the six physical fitness measures, particularly among females, and particularly for mathematics rather than for reading scores. While physical activity may be very important for preventing obesity and diabetes in children, it most likely will also improve academic performance. School-Based Asthma Management Interventions The effectiveness of programs for asthma management has been well documented in a series of well-designed studies. Not only was absenteeism reduced but test scores improved in a number of areas. While Texas has policies that address environmental triggers of asthmatic episodes, there is no written policy on asthma education programs for children or staff or recommendations for schools to consider them.
• Based on compelling evidence, we recommend that Texas schools adopt asthma management education for affected children and support staff.
Section 3. The Economic Impact of Absenteeism Another concluding consideration is how chronic health conditions affect attendance and ultimately school funding. If chronic conditions increase absenteeism, they also result in a cost burden for schools, given that student attendance rates influence school funding. We sought to determine the formula that the Texas Education Agency uses to allocate funds for Texas school districts. Table 9 shows the impact of attendance on school district revenue. The results are calculated under three different assumptions about the state revenue share, since it varies by district; the 40.8% typically used is the state average across districts. Based on that formula we estimate the daily cost for one student’s absence is between $17 and $18. Table 10 compares estimates of per-pupil/per-day costs from several independent resources. Also, if average daily attendance is increased by 1%, Texas school districts could receive an additional $130 million from the state. Table 10, shows the range of estimates available. To be sure, interventions that reduce absenteeism for less than about $18 per student will pay for themselves, over and above the benefits brought to the children they serve.
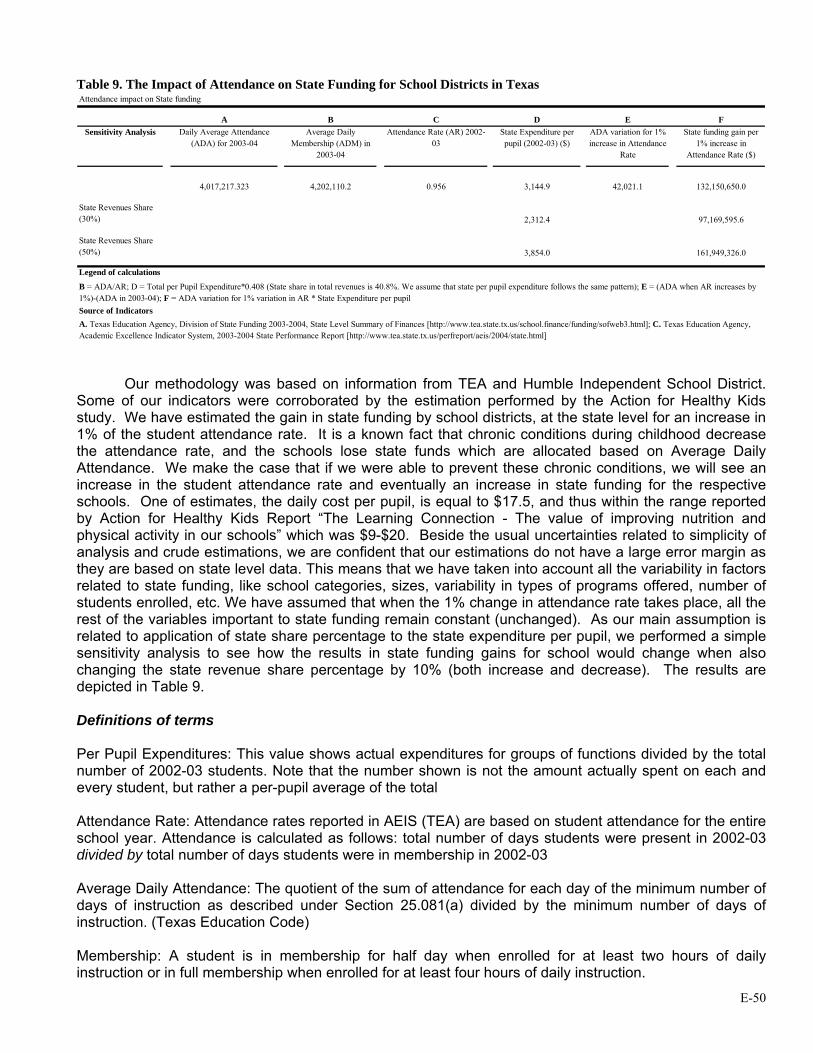
E-50
Table 9. The Impact of Attendance on State Funding for School Districts in Texas Attendance impact on State funding
A B C D E FSensitivity Analysis Daily Average Attendance
(ADA) for 2003-04Average Daily
Membership (ADM) in 2003-04
Attendance Rate (AR) 2002-03
State Expenditure per pupil (2002-03) ($)
ADA variation for 1% increase in Attendance
Rate
State funding gain per 1% increase in
Attendance Rate ($)
4,017,217.323 4,202,110.2 0.956 3,144.9 42,021.1 132,150,650.0
State Revenues Share (30%) 2,312.4 97,169,595.6
State Revenues Share (50%) 3,854.0 161,949,326.0
Legend of calculations
Source of Indicators
B = ADA/AR; D = Total per Pupil Expenditure*0.408 (State share in total revenues is 40.8%. We assume that state per pupil expenditure follows the same pattern); E = (ADA when AR increases by 1%)-(ADA in 2003-04); F = ADA variation for 1% variation in AR * State Expenditure per pupil
A. Texas Education Agency, Division of State Funding 2003-2004, State Level Summary of Finances [http://www.tea.state.tx.us/school.finance/funding/sofweb3.html]; C. Texas Education Agency, Academic Excellence Indicator System, 2003-2004 State Performance Report [http://www.tea.state.tx.us/perfreport/aeis/2004/state.html]
Our methodology was based on information from TEA and Humble Independent School District. Some of our indicators were corroborated by the estimation performed by the Action for Healthy Kids study. We have estimated the gain in state funding by school districts, at the state level for an increase in 1% of the student attendance rate. It is a known fact that chronic conditions during childhood decrease the attendance rate, and the schools lose state funds which are allocated based on Average Daily Attendance. We make the case that if we were able to prevent these chronic conditions, we will see an increase in the student attendance rate and eventually an increase in state funding for the respective schools. One of estimates, the daily cost per pupil, is equal to $17.5, and thus within the range reported by Action for Healthy Kids Report “The Learning Connection - The value of improving nutrition and physical activity in our schools” which was $9-$20. Beside the usual uncertainties related to simplicity of analysis and crude estimations, we are confident that our estimations do not have a large error margin as they are based on state level data. This means that we have taken into account all the variability in factors related to state funding, like school categories, sizes, variability in types of programs offered, number of students enrolled, etc. We have assumed that when the 1% change in attendance rate takes place, all the rest of the variables important to state funding remain constant (unchanged). As our main assumption is related to application of state share percentage to the state expenditure per pupil, we performed a simple sensitivity analysis to see how the results in state funding gains for school would change when also changing the state revenue share percentage by 10% (both increase and decrease). The results are depicted in Table 9. Definitions of terms Per Pupil Expenditures: This value shows actual expenditures for groups of functions divided by the total number of 2002-03 students. Note that the number shown is not the amount actually spent on each and every student, but rather a per-pupil average of the total Attendance Rate: Attendance rates reported in AEIS (TEA) are based on student attendance for the entire school year. Attendance is calculated as follows: total number of days students were present in 2002-03 divided by total number of days students were in membership in 2002-03 Average Daily Attendance: The quotient of the sum of attendance for each day of the minimum number of days of instruction as described under Section 25.081(a) divided by the minimum number of days of instruction. (Texas Education Code) Membership: A student is in membership for half day when enrolled for at least two hours of daily instruction or in full membership when enrolled for at least four hours of daily instruction.
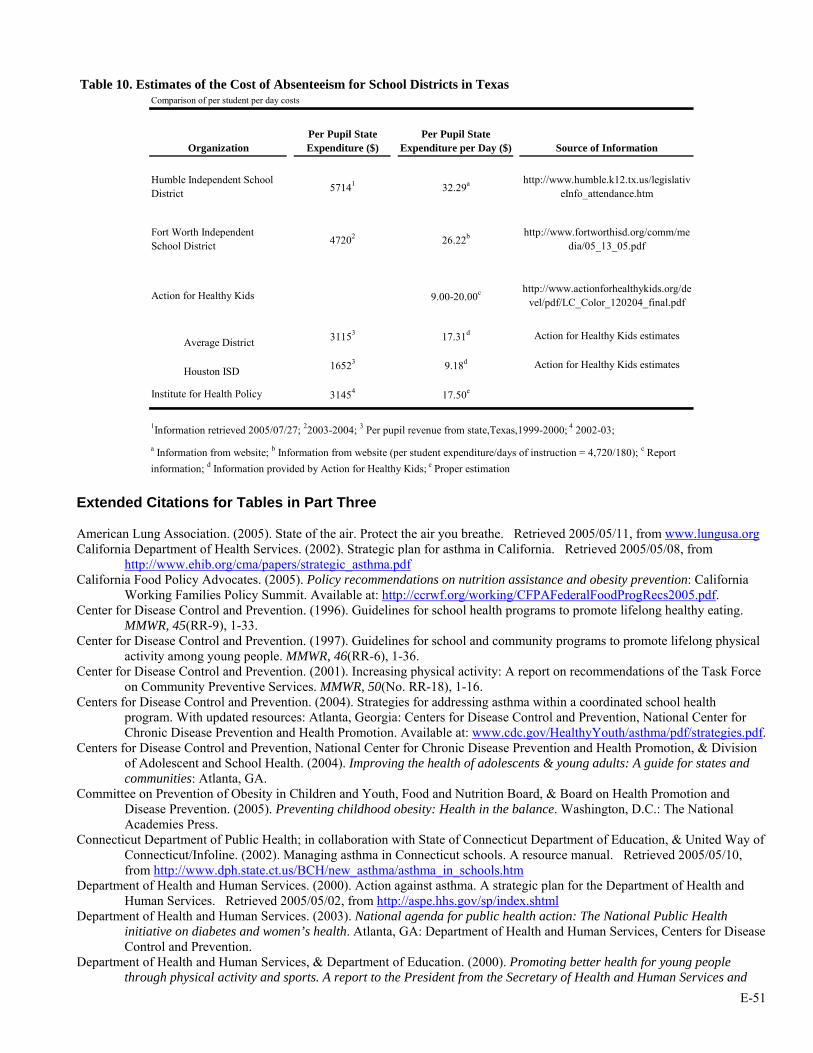
E-51
Table 10. Estimates of the Cost of Absenteeism for School Districts in Texas
OrganizationPer Pupil State Expenditure ($)
Per Pupil State Expenditure per Day ($) Source of Information
Humble Independent School District 57141 32.29a http://www.humble.k12.tx.us/legislativ
eInfo_attendance.htm
Fort Worth Independent School District 47202 26.22b http://www.fortworthisd.org/comm/me
dia/05_13_05.pdf
Action for Healthy Kids 9.00-20.00c http://www.actionforhealthykids.org/devel/pdf/LC_Color_120204_final.pdf
Average District 31153 17.31d Action for Healthy Kids estimates
Houston ISD 16523 9.18d Action for Healthy Kids estimates
Institute for Health Policy 31454 17.50e
a Information from website; b Information from website (per student expenditure/days of instruction = 4,720/180); c Report information; d Information provided by Action for Healthy Kids; e Proper estimation
Comparison of per student per day costs
1Information retrieved 2005/07/27; 22003-2004; 3 Per pupil revenue from state,Texas,1999-2000; 4 2002-03;
Extended Citations for Tables in Part Three American Lung Association. (2005). State of the air. Protect the air you breathe. Retrieved 2005/05/11, from www.lungusa.org California Department of Health Services. (2002). Strategic plan for asthma in California. Retrieved 2005/05/08, from
http://www.ehib.org/cma/papers/strategic_asthma.pdf California Food Policy Advocates. (2005). Policy recommendations on nutrition assistance and obesity prevention: California
Working Families Policy Summit. Available at: http://ccrwf.org/working/CFPAFederalFoodProgRecs2005.pdf. Center for Disease Control and Prevention. (1996). Guidelines for school health programs to promote lifelong healthy eating.
MMWR, 45(RR-9), 1-33. Center for Disease Control and Prevention. (1997). Guidelines for school and community programs to promote lifelong physical
activity among young people. MMWR, 46(RR-6), 1-36. Center for Disease Control and Prevention. (2001). Increasing physical activity: A report on recommendations of the Task Force
on Community Preventive Services. MMWR, 50(No. RR-18), 1-16. Centers for Disease Control and Prevention. (2004). Strategies for addressing asthma within a coordinated school health
program. With updated resources: Atlanta, Georgia: Centers for Disease Control and Prevention, National Center for Chronic Disease Prevention and Health Promotion. Available at: www.cdc.gov/HealthyYouth/asthma/pdf/strategies.pdf.
Centers for Disease Control and Prevention, National Center for Chronic Disease Prevention and Health Promotion, & Division of Adolescent and School Health. (2004). Improving the health of adolescents & young adults: A guide for states and communities: Atlanta, GA.
Committee on Prevention of Obesity in Children and Youth, Food and Nutrition Board, & Board on Health Promotion and Disease Prevention. (2005). Preventing childhood obesity: Health in the balance. Washington, D.C.: The National Academies Press.
Connecticut Department of Public Health; in collaboration with State of Connecticut Department of Education, & United Way of Connecticut/Infoline. (2002). Managing asthma in Connecticut schools. A resource manual. Retrieved 2005/05/10, from http://www.dph.state.ct.us/BCH/new_asthma/asthma_in_schools.htm
Department of Health and Human Services. (2000). Action against asthma. A strategic plan for the Department of Health and Human Services. Retrieved 2005/05/02, from http://aspe.hhs.gov/sp/index.shtml
Department of Health and Human Services. (2003). National agenda for public health action: The National Public Health initiative on diabetes and women’s health. Atlanta, GA: Department of Health and Human Services, Centers for Disease Control and Prevention.
Department of Health and Human Services, & Department of Education. (2000). Promoting better health for young people through physical activity and sports. A report to the President from the Secretary of Health and Human Services and
E-52
the Secretary of Education: Available at: http://www.cdc.gov/HealthyYouth/physicalactivity/promoting_health/index.htm.
Diabetes in California Task Force. California's Plan for Diabetes 2003-2007: California Diabetes Program. Available at: http://www.caldiabetes.org/content_display.cfm?CategoryID=10&ContentID=92.
Dunn, A. L., & Blair, S. N. (2002). Translating evidenced-based physical activity interventions into practice. The 2010 challenge. American Journal of Preventive Medicine, 22(4 Suppl), 8-9.
Eckersley, R. M. (2001). Losing the battle of the bulge: Causes and consequences of increasing obesity. Medical Journal of Australia, 174(11), 590-592.
Environmental Health Tracking Project Team. (2000). America's environmental health gap: Why the country need a nationwide health tracking network: The Pew Environmental Health Commission. Available at: http://www.pewtrusts.com/pubs/pubs_item.cfm?content_item_id=539&content_type_id=8&page=p1.
Federal Liaison Group on Asthma, & NHLBI. (2001). Coordination of federal asthma activities. Retrieved 2005/04/28, from http://www.nhlbi.nih.gov/resources/docs/asth01rpt.htm
Fifty-Seventh World Health Assembly. (2004). Global strategy on diet, physical activity and health: World Health Assembly. Eighth plenary meeting. Available at: http://www.who.int/dietphysicalactivity/goals/en/.
Florida Department of Health. (2001). The obesity epidemic in Florida: Available at: www.doh.state.fl.us. Florida Department of Health. (2004). Obesity in Florida. Report of the Governor’s Task Force on the obesity epidemic:
Available at: http://www.doh.state.fl.us/Family/GTFOE/index.html. Hearne, S. A., Segal, L.M., Unruh, P.J., Earls, M.J., Smolarcik, P. (2004). F as in Fat. How the obesity policies are failing in
America: Trust for America's Health. Available at: www.healthyamericans.org. Henze, C., & Plaza, C. (2004). Public health issue brief: Physical education. Year end report-2004. Issue Brief Health Policy
Track Serv., 1-16. Hoppin, P., & Donahue, S. (2004). Improving asthma management by addressing environmental triggers: Challenges and
opportunities for delivery and financing. Asthma Regional Council of New England Retrieved 2005/05/15, from http://www.asthmaregionalcouncil.org/
Hoppin, P., & Donahue, S. (2005). Improving asthma management by addressing environmental triggers: Model projects from across the country. Asthma Regional Council of New England Retrieved 2005/05/15, from http://www.asthmaregionalcouncil.org/
International Obesity TaskForce, & European Association for the Study of Obesity. (2002). Obesity in Europe. The case for action: International Obesity TaskForce. Available at: http://www.iotf.org/.
Jeffery, R. W. (1998). Prevention of obesity. In G. A. Bray, Bouchard, C., James W.P.T (Ed.), Handbook of obesity. New York: Marcel Dekker, Inc.
Kahn, E. B., Ramsey, L. T., Brownson, R. C., Heath, G. W., Howze, E. H., Powell, K. E., et al. (2002). The effectiveness of interventions to increase physical activity. A systematic review. American Journal of Preventive Medicine, 22(4 Suppl), 73-107.
Krebs, N. F., Jacobson, M. S., & American Academy of Pediatrics Committee on Nutrition. (2003). Prevention of pediatric overweight and obesity. Pediatrics, 112(2), 424-430.
Kriska, A. (2002). Striving for a more active community. Lessons from the diabetes prevention program and beyond. American Journal of Preventive Medicine, 22(4 Suppl), 6-7.
Kunzli, N., McConnell, R., Bates, D., Bastain, T., Hricko, A., Lurmann, F., et al. (2003). Breathless in Los Angeles: The exhausting search for clean air. American Journal of Public Health, 93(9), 1494-1499.
Lara, M., Nicholas, W., Morton, S., Vaiana, M., Genovese, B., Rachelefsky, G., et al. (2001). Improving childhood asthma outcomes in the United States. A blueprint for policy action: RAND. Available at: www.rand.org.
Lara, M., Rosenbaum, S., Rachelefsky, G., Nicholas, W., Morton, S. C., Emont, S., et al. (2002). Improving childhood asthma outcomes in the United States: A blueprint for policy action. Pediatrics, 109(5), 919-930.
League, C., & Dearry, A. (2004). Obesity and the built environment: Improving public health through improving community design. Research Triangle park, NC: National Institute of Environmental Health Sciences/National Institute of Health, Division of Research Coordination, Planning and Translation.
Lobstein, T., Baur, L., Uauy, R., & IASO International Obesity TaskForce. (2004). Obesity in children and young people: A crisis in public health. Obesity Reviews, 5 Suppl 1, 4-104.
McConnell, R., Berhane, K., Gilliland, F., London, S. J., Islam, T., Gauderman, W. J., et al. (2002). Asthma in exercising children exposed to ozone: A cohort study. Lancet, 359(9304), 386-391.
McKinlay, J., & Marceau, L. (2000). US public health and the 21st century: Diabetes mellitus. Lancet, 356, 757–761. National Association of State Boards of Education. Fit, healthy, and ready to learn: A school health policy guide. Retrieved
2005/07/23, from http://www.nasbe.org/healthyschools/fithealthy.mgi National Asthma Control Task Force. (2000). The Prevention and management of asthma in Canada: A major challenge now
and in the future: Available at: http://www.phac-aspc.gc.ca/publicat/pma-pca00/.
E-53
National Asthma Education and Prevention program & U.S Department of Health and Human Services & U.S Department of Education. Managing Asthma: A guide for Schools: Available at: http://www.nhlbi.nih.gov/health/prof/lung/asthma/asth_sch.htm.
National Diabetes Education Program. (2003). Helping the student with diabetes succeed. A guide for school personnel (No. 03-5217): A Joint Program of the National Institutes of Health and the Centers for Disease Control and Prevention.
National School Board Association. (2003). Helping school boards enact policies that support healthy eating. Retrieved 2005/05/20, from http://www.doh.wa.gov/sboh/Priorities/Children/SPAN/CommunityForumMaterials.htm
Nestle, M., & Jacobson, M. F. (2000). Halting the obesity epidemic: A public health policy approach. Public Health Reports, 115(1), 12-24.
New England Asthma Regional Council. (2001). New England asthma action plan. Retrieved 2005/05/07, from http://www.asthmaregionalcouncil.org/actionplan/guiding.html
Nicholas, E. (2003). Asthma: Why California’s children can’t breathe - Legislative Hearing. Long Beach Alliance for Children with Asthma Retrieved 2005/05/10, from http://www.asthma.umich.edu/meet_the_AAA_sites/projectSum.html#long
Nicholas, E., Lara, M., & Morton, S. (2002). Improving childhood asthma outcomes in the United States. A blueprint for policy action. A description of group process methods used to generate committee recommendations: RAND. Available at: www.rand.org.
Norris, S. L., Nichols, P. J., Caspersen, C. J., Glasgow, R. E., Engelgau, M. M., Jack, L., et al. (2002a). The effectiveness of disease and case management for people with diabetes. A systematic review. American Journal of Preventive Medicine, 22(4 Suppl), 15-38.
Norris, S. L., Nichols, P. J., Caspersen, C. J., Glasgow, R. E., Engelgau, M. M., Jack, L., et al. (2002b). Increasing diabetes self-management education in community settings. A systematic review. American Journal of Preventive Medicine, 22(4 Suppl), 39-66.
Nutrition Council of Oregon. (2003). A healthy, active Oregon: The Statewide Public Health Nutrition Plan. Retrieved 2005/04/14, from www.healthoregon.org/hpcdp/physicalactivityandnutrition/
Oregon Coalition for Promoting Physical Activity. (2003). A healthy active Oregon: The Statewide Physical Activity Plan. 2005/04/16, from www.healthoregon.org/hpcdp/physicalactivityandnutrition/
President’s Task Force on Environmental Health Risks and Safety Risks to Children. (Revised May 2000). Asthma and the environment: A strategy to protect children: Available at: http://yosemite.epa.gov/ochp/ochpweb.nsf/content/whatwe_tf_proj.htm.
Rigby, N., & James, P. (2003). Obesity in Europe-2. Waiting for a green light for health? International Obesity TaskForce Position Paper. Available at: www.iotf.org/media/euobesity.pdf.
Robert Wood Johnson Foundation. (2000). Healthy places, healthy people. Promoting public health and physical activity through community design. Report of an expert's meeting. Washington, DC: Available at: http://www.rwjf.org/files/publications/other/HealthyPlaces.pdf.
Samuels and Associates. (2002). An epidemic: Overweight and unfit children in California Assembly Districts: The California Center for Public Health Advocacy. Available at: www.publichealthadvocacy.org.
Samuels and Associates. (2004). An early warning sign: Diabetes deaths in California Legislative Districts: California Center for Public Health Advocacy. Available at: www.publichealthadvocacy.org.
Statewide Obesity TaskForce. (2003). Strategic plan for the prevention of obesity in Texas: Available at: http://www.tdh.state.tx.us/phn/obesity-plan.pdf.
Task Force on Community Preventive Services. (2001). Strategies for reducing morbidity and mortality from diabetes through health-care system interventions and diabetes Self-management education in community settings (No. 50(RR16); 1-15): CDC.
Task Force on Community Preventive Services. (2002a). Recommendations for healthcare system and self-management education interventions to reduce morbidity and mortality from diabetes. American Journal of Preventive Medicine, 22(4 Suppl), 10-14.
Task Force on Community Preventive Services. (2002b). Recommendations to increase physical activity in communities. American Journal of Preventive Medicine, 22(4 Suppl), 67-72.
Texas Department of State Health Services. (2004). Assessing the burden of asthma in Texas: A summary of Texas asthma surveillance system (DSHS Publication Number: 04-12094): Texas Asthma Program. Available at: http://www.dshs.state.tx.us/chronic/publications.shtm.
Texas Diabetes Council. The changing face of diabetes. A plan to prevent and control diabetes in Texas 2006-2007: Texas Diabetes Council. Available at: http://www.tdh.state.tx.us/diabetes/tdc/stateplan.htm.
Texas Diabetes Council. Putting the brakes on diabetes. A community planning guide to improve health and nutrition for Texas children and adolescents and reduce the risk of Type 2 diabetes: Texas Department of Health. Available at: http://www.tdh.state.tx.us/diabetes/PDF/t2child/Planning%20Guide1.pdf.
Texas Diabetes Council. Type 2 diabetes in children and adolescents: Statewide action plan: Texas Department of Health. Available at: http://www.tdh.state.tx.us/diabetes/PDF/t2child/Statewide%20Action1.pdf.
E-54
The American Association of School Administrators. (Spring 2003). Asthma management, policies and procedures. School Governance and Leadership, 5(No. 1), 6 &13.
The Office of the Governor and the Texas Department of Agriculture. (2004). Charting a course for change: A summary of the Governor's conference on children's obesity in Texas. Retrieved 2005/07/25, from http://squaremeals.org/fn/home/page/0,1248,2348_0_0_0,00.html
The Pew Environmental Health Commission. (2000). Attack asthma: Why America needs a public health defense system to battle environmental threats: The Pew Environmental Health Commission. Available at: http://www.pewtrusts.com/pubs/pubs_item.cfm?content_item_id=310&content_type_id=8&page=p3.
U.S. Department of Health and Human Services. (2001). The Surgeon General’s call to action to prevent and decrease overweight and obesity. [Rockville, MD]: U.S.: Department of Health and Human Services, Public Health Service, Office of the Surgeon General. Available from: U.S. GPO, Washington.
U.S. Department of Health and Human Services, National Heart, Lung and Blood Institute, & National Institutes of Medicine. (1995). Asthma and physical activity in the school. Making a difference (NIH Publication No. 95-3651): Available at: http://www.nhlbi.nih.gov/health/public/lung/asthma/phy_asth.htm.
U.S. Department of Health and Human Services, & National Institutes of Health. (2004). Strategic plan for NIH obesity research. A report of the NIH Obesity Research Task Force: NIH Publication No. 04-5493. Available at: http://obesityresearch.nih.gov/.
U.S. Environmental Protection Agency. (May 2000). Managing asthma in school environment. IAQ tools for schools. Office of Air and Radiation, Office of Radiation and Indoor Air, Indoor Environments Division. EPA # 402-K-00-003. Retrieved 2005/05/27, from http://www.epa.gov/iaq/schools/asthma/
Wechsler, H., McKenna, M. L., Lee, S.M., Dietz, W.H. (December, 2004). The role of schools in preventing childhood obesity. The State Education Standard, 5(2), Available at: http://www.nasbe.org/Standard/Past.html.
Whalen, L. G., Grunbaum, J.A., Kann, L., Hawkins, J., McManus, T., Davis, K.S. (2004). School health profiles: Surveillance for characteristics of health programs among secondary schools (Profiles 2002). Atlanta, GA: Centers for Disease Control and Prevention.
Wheeler, L. S., Boss, L.P., Williams, P.V. (2004). School-based approaches to identifying students with asthma. Journal of School Health, 74(No. 9).
WHO & FAO. (2003). Diet, nutrition and the prevention of chronic diseases. Report of a joint WHO/FAO expert consultation (No. 916). Geneva, Switzerland: WHO Technical report series.
Yancey, A. G., M.; Brown, ER.; McCarthy, W.; Diamant, A. (2003). Diabetes is major health problem for African Americans: UCLA Center for Health Policy Research.

E-55
REFERENCES
Ack, M., Miller, I., & Weil, W. B., Jr. (1961). Intelligence of children with diabetes mellitus. Pediatrics, 28, 764-770. Aday, L. A., Andersen, R., & Fleming, G. V. (1980). Health care in the US. Equitable for whom? Beverly Hills, CA: Sage. Adler, N. E., & Newman, K. (2002). Socioeconomic disparities in health: Pathways and policies. Inequality in education,
income, and occupation exacerbates the gaps between the health "haves" and "have-nots" (Project Hope). Health Affairs, 21(2), 60-76.
Anderson, J., McGee, R. (1994). Comorbidity of depression in children and adolescents. In W. Reynolds & H. F. Johnson (Eds.), Handbook of depression in children and adolescents (pp. 581-601). New York: Plenum.
Anderson, M. E., Freas, M. R., Wallace, A. S., Kempe, A., Gelfand, E. W., & Liu, A. H. (2004). Successful school-based intervention for inner-city children with persistent asthma. The Journal of Asthma, 41(4), 445-453.
Antonovsky, A. (1967). Social class, life expectancy and overall mortality. The Milbank Memorial Fund Quarterly, 45(2), 31-73. Arif, A. A., Borders, T. F., Patterson, P. J., Rohrer, J. E., & Xu, K. T. (2004). Prevalence and correlates of paediatric asthma and
wheezing in a largely rural USA population. J Paediatr Child Health, 40(4), 189-194. Armstrong, F. D., Thompson, R. J., Jr., Wang, W., Zimmerman, R., Pegelow, C. H., Miller, S., et al. (1996). Cognitive
functioning and brain magnetic resonance imaging in children with sickle cell disease. Neuropsychology Committee of the Cooperative Study of Sickle Cell Disease. Pediatrics, 97(6 Pt 1), 864-870.
Arntzen, A., & Nybo Andersen, A. M. (2004). Social determinants for infant mortality in the Nordic countries, 1980-2001. Scandinavian Journal of Public Health, 32(5), 381-389.
Arntzen, A., Samuelsen, S. O., Bakketeig, L. S., & Stoltenberg, C. (2004). Socioeconomic status and risk of infant death. A population-based study of trends in Norway, 1967-1998. International Journal of Epidemiology, 33(2), 279-288.
Auster, R., Leveson, I., & Sarachek, D. (1969). The production of health: An explanatory study. Journal of Human Resources, 4, 411-436.
Austin, J. K., Huberty, T. J., Huster, G. A., & Dunn, D. W. (1998). Academic achievement in children with epilepsy or asthma. Developmental Medicine and Child Neurology, 40(4), 248-255.
Austin, J. K., Huberty, T. J., Huster, G. A., & Dunn, D. W. (1999). Does academic achievement in children with epilepsy change over time? Developmental Medicine and Child Neurology, 41(7), 473-479.
Aye, T., & Levitsky, L. L. (2003). Type 2 diabetes: An epidemic disease in childhood. Curr Opin Pediatr, 15(4), 411-415. Backlund, E., Sorlie, P. D., & Johnson, N. J. (1996). The shape of the relationship between income and mortality in the United
States. Evidence from the National Longitudinal Mortality Study. Annals of Epidemiology, 6(1), 12-20. Ball, K., & Crawford, D. (2005). Socioeconomic status and weight change in adults: A review. Social Science & Medicine,
60(9), 1987-2010. Bandura, A. (1986). Social foundation of thought and action. Englewood Cliffs, NJ: Prentice-Hall. Barrett, D. E., Radke-Yarrow, M., & Klein, R. E. (1982). Chronic malnutrition and child behavior: Effects of early caloric
supplementation on social and emotional functioning at school age. Developmental Psychology, 18(4), 541-556. Bennett, C. L., Ferreira, M. R., & Davis, T. C. (1998). Relation between literacy, race, and stage of presentation among low-
income patients with prostate cancer. Journal of Clinical Oncology, 16, 3101-3104. Bennett, D. S. (1994). Depression among children with chronic medical problems: A meta-analysis. Journal of Pediatric
Psychology, 19(2), 149-169. Berkman, L., & Kawachi, I. (2000). Social epidemiology. Oxford; New York: Oxford University Press. Bibi, H., Shoseyov, D., Feigenbaum, D., Genis, M., Friger, M., Peled, R., et al. (2004). The relationship between asthma and
obesity in children: Is it real or a case of over diagnosis? The Journal of Asthma, 41(4), 403-410. Bicego, G. T., & Boerma, J. T. (1993). Maternal education and child survival: A comparative study of survey data from 17
countries. Social Science & Medicine, 36(9), 1207-1227. Birmaher, B., Ryan, N. D., Williamson, D. E., Brent, D. A., Kaufman, J., Dahl, R. E., et al. (1996). Childhood and adolescent
depression: A review of the past 10 years. Part I. Journal of the American Academy of Child and Adolescent Psychiatry, 35(11), 1427-1439.
Bonner, M. J., Gustafson, K. E., Schumacher, E., & Thompson, R. J., Jr. (1999). The impact of sickle cell disease on cognitive functioning and learning. School Psychology Review, 28(2), 182-193.
Botero, D., & Wolfsdorf, J. I. (2005). Diabetes mellitus in children and adolescents. Arch Med Res, 36(3), 281-290. Bray, G. A. (1992). Obesity increases risk for diabetes. Int J Obes Relat Metab Disord, 16 Suppl 4, S13-17. Breuner, C. C., Smith, M. S., & Womack, W. M. (2004). Factors related to school absenteeism in adolescents with recurrent
headache. Headache, 44(3), 217-222. Brown, R. T., Buchanan, I., Doepke, K., Eckman, J. R., Baldwin, K., Goonan, B., et al. (1993). Cognitive and academic
functioning in children with sickle-cell disease. Journal of Clinical Child Psychology, 22(2), 207-218. Brown, R. T., Davis, P. C., Lambert, R., Hsu, L., Hopkins, K., & Eckman, J. (2000). Neurocognitive functioning and magnetic
resonance imaging in children with sickle cell disease. Journal of Pediatric Psychology, 25(7), 503-513. Buor, D. (2003). Mothers' education and childhood mortality in Ghana. Health Policy, 64(3), 297-309.
E-56
Burne, K., & Walker, G. (1991). The differential effect of mother's education on mortality of boys and girls in India. Population Studies, 45, 203-219.
Burstrom, B., & Fredlund, P. (2001). Self rated health: Is it as good a predictor of subsequent mortality among adults in lower as well as in higher social classes? Journal of Epidemiology & Community Health, 55(11), 836-840.
Caldwel, J. (1979). Education as a factor in mortality decline: An examination of Nigerian data. Population Studies, 33(3), 395-413.
California Department of Education, & Standards and Assessment Division. (2002). California physical fitness testing 2002: Report to the Governor and Legislature. Retrieved 2004/05/05, from http://www.cde.ca.gov/ta/tg/pf/documents/rptgov2002.pdf
Case, R., & Griffin, S. (1991). Rightstart: An early intervention program for insuring that children's first formal learning of arithmetic is grounded in their intuitive knowledge of numbers. St. Louis, MO: Report to the James S. McDonnell Foundation.
Center on Hunger and Poverty and Nutrition Policy. (1998). Statement on the link between nutrition and cognitive development in children. Tufts University.
Centers for Disease Control and Prevention. (2005). Behavioral Risk Factor Surveillance System: Prevalence Data, Nationwide 2000: How is your general health? Retrieved 2005/05/31, from http://apps.nccd.cdc.gov/brfss/education.asp?cat=HS&yr=2000&qkey=1100&state=US
Chen, J., Fair, M., Wilkins, R., & Cyr, M. (1998). Maternal education and fetal and infant mortality in Quebec. Fetal and Infant Mortality Study Group of the Canadian Perinatal Surveillance System. Health Reports, 10(2), 53-64 (Eng); 57-70 (Fre).
Christiansen, S. C., Martin, S. B., Schleicher, N. C., Koziol, J. A., Mathews, K. P., & Zuraw, B. L. (1997). Evaluation of a school-based asthma education program for inner-city children. Journal of Allergy and Clinical Immunology, 100(5), 613-617.
Clark, N. M., Brown, R., Joseph, C. L., Anderson, E. W., Liu, M., & Valerio, M. A. (2004). Effects of a comprehensive school-based asthma program on symptoms, parent management, grades, and absenteeism. Chest, 125(5), 1674-1679.
Coburn, D., & Pope, C. R. (1974). Socioeconomic status and preventive health behavior. Journal of Health and Social Behavior, 15(2), 67-78.
Cohen, F., Kemeny, M. E., Kearney, K. A., Zegans, L. S., Neuhaus, J. M., & Conant, M. A. (1999). Persistent stress as a predictor of genital herpes recurrence. Archives of Internal Medicine, 159(20), 2430-2436.
Coleman, K. J., Tiller, C. L., Sanchez, J., Heath, E. M., Sy, O., Milliken, G., et al. (2005). Prevention of the epidemic increase in child risk of overweight in low-income schools: The El Paso coordinated approach to child health. Archives of Pediatrics and Adolescent Medicine, 159(3), 217-224.
Comstock, G. W., & Tonasica, J. A. (1977). Education and mortality in Washington County, Maryland. Journal of Health and Social Behaviour, 18, 54-61.
Crimmins, E. M., & Saito, Y. (2001). Trends in healthy life expectancy in the United States, 1970-1990: Gender, racial, and educational differences. Social Science & Medicine, 52, 1629-1641.
Crum, R. M., Ensminger, M. E., Ro, M. J., & McCord, J. (1998). The association of educational achievement and school dropout with risk of alcoholism: A twenty-five-year prospective study of inner-city children. Journal of Studies on Alcohol, 59(3), 318-326.
Dahl, R. E., Holttum, J., & Trubnick, L. (1994). A clinical picture of child and adolescent narcolepsy. Journal of the American Academy of Child and Adolescent Psychiatry, 33(6), 834-841.
Darrow, S. L., Russell, M., Cooper, M. L., Mudar, P., & Frone, M. R. (1992). Sociodemographic correlates of alcohol consumption among African American and White women. Women & Health, 18(4), 35-51.
Datar, A., Sturm, R., & Magnabosco, J. L. (2004). Childhood overweight and academic performance: National study of kindergartners and first-graders. Obesity Research, 12(1), 58-68.
Deaton, A., & Paxton, C. (1999). Mortality, education, income, and inequality among American cohorts. Strengthening Head Start: What the evidence shows. Cambridge, MA.
Dietz, W. H. (2005). Physical activity recommendations: Where do we go from here? [editorial]. Journal of Pediatrics, 146, 719-720.
Drake, C., Nickel, C., Burduvali, E., Roth, T., Efferson, C., & Ietro, B. (2003). The pediatric daytime sleepiness scale (PDSS): Sleep habits and school outcomes in middle-school children. Sleep, 26(4), 455-458.
Dunn, A. L., Trivedi, M. H., & O'Neal, H. A. (2001). Physical activity dose-response effects on outcomes of depression and anxiety. Medicine and Science in Sports and Exercise, 33(6 Suppl), S587-S597.
Dwyer, T., Coonan, W. E., Worsley, L. A., & Leitch, D. R. (1979). An assessment of the effects of two physical activity programs on coronary heart disease risk factors in primary school children. Community Health Studies, 3, 196-202.
Edelsohn, G., Ialongo, N., Werthamer-Larsson, L., Crockett, L., & Kellam, S. (1992). Self-reported depressive symptoms in first-grade children: Developmentally transient phenomena? Journal of the American Academy of Child and Adolescent Psychiatry, 31(2), 282-290.
Eliasson, A., Eliasson, A., King, J., Gould, B., & Eliasson, A. (2002). Association of sleep and academic performance. Sleep & breathing (Schlaf & Atmung), 6(1), 45-48.

E-57
Elo, I. T., & Preston, S. H. (1996). Educational differences and mortality: United States 1979-1985. Social Science and Medicine, 42, 47-57.
Epilepsy Foundation. Epilepsy and seizure statistics. Evans, D., Clark, N. M., Feldman, C. H., Rips, J., Kaplan, D., Levison, M. J., et al. (1987). A school health education program
for children with asthma aged 8-11 years. Health Education Quarterly, 14(3), 267-279. Evans, R. G., Barer, M. L., & Marmor, T. R. (1994). Why are some people healthy and others not? The determinants of health of
populations. Hawthorne, New York: Aldine de Gruyter. Falkner, N. H., Neumark-Sztainer, D., Story, M., Jeffery, R. W., Beuhring, T., & Resnick, M. D. (2001). Social, educational, and
psychological correlates of weight status in adolescents. Obesity Research, 9(1), 32-42. Fayers, P. M., & Sprangers, M. A. (2002). Understanding self-rated health. Lancet, 359(9302), 187-188. Feldman, J. J., Makuc, D. M., Kleinman, J. C., & Cornoni-Huntley, J. (1989). National trends in educational differentials in
mortality. American Journal of Epidemiology, 129(5), 919-933. Field, T., Diego, M., & Sanders, M. R. (2001). Exercise is positively related to adolescents' relationships and academics.
Adolescence, 36(141), 105-110. Fleming, J. E., & Offord, D. R. (1990). Epidemiology of childhood depressive disorders: A critical review. Journal of the
American Academy of Child and Adolescent Psychiatry, 29(4), 571-580. Floud, R., & Harris, B. (1996). Health, height and welfare: Britain 1700-1980: NBER Historical Working papers 0087. National
Bureau of Economic Research, Inc. Ford, E. S., Merritt, R. K., Heath, G. W., Powell, K. E., Washburn, R. A., Kriska, A., et al. (1991). Physical activity behaviors in
lower and higher socioeconomic status populations. American Journal of Epidemiology, 133(12), 1246-1256. Fowler, M. G., Davenport, M. G., & Garg, R. (1992). School functioning of U.S. children with asthma. Pediatrics, 90(6), 939-
944. Fowler, M. G., Johnson, M. P., & Atkinson, S. S. (1985). School achievement and absence in children with chronic health
conditions. Journal of Pediatrics, 106(4), 683-687. Fowler, M. G., Whitt, J. K., Lallinger, R. R., Nash, K. B., Atkinson, S. S., Wells, R. J., et al. (1988). Neuropsychologic and
academic functioning of children with sickle cell anemia. Journal of Developmental and Behavioral Pediatrics, 9(4), 213-220.
Fredriksen, K., Rhodes, J., Reddy, R., & Way, N. (2004). Sleepless in Chicago: Tracking the effects of adolescent sleep loss during the middle school years. Child Development, 75(1), 84-95.
Freedman, V. A., Martin, L. G., & Schoeni, R. F. (2002). Recent trends in disability and functioning among older adults in the United States: A systematic review. JAMA, 288(24), 3137-2146.
Fremont, A. M., & Bird, C. E. (2000). Social and psychological factors, physiological process, and physical health. In C. E. Bird, P. Conrad & A. M. Fremont (Eds.), The handbook of medical sociology. (5th ed., pp. 334-352). Upper Saddle River, NJ: Prentice-Hall.
Freudenberg, N., Feldman, C. H., Clark, N. M., Millman, E. J., Valle, I., & Wasilewski, Y. (1980). The impact of bronchial asthma on school attendance and performance. Journal of School Health, 50(9), 522-526.
Fuchs, V. (1982). Time preference and health: An exploratory study. In V. Fuchs (Ed.), Economic Aspects of Health. Second NBER Conference on Health, Stanford, CA: University of Chicago Press.
Fuchs, V. R. (1979). Economics, health, and post-industrial society. Milbank Memorial Fund Quarterly - Health & Society, 57(2), 153-182.
Fuchs, V. R., & Reklis, D. M. (1997). Adding up the evidence on readiness to learn. Jobs and Capital(Summer), 27-29. Gall, G., Pagano, M. E., Desmond, M. S., Perrin, J. M., & Murphy, J. M. (2000). Utility of psychosocial screening at a school-
based health center. Journal of School Health, 70(7), 292-298. Gath, A., Smith, M. A., & Baum, J. D. (1980). Emotional, behavioural, and educational disorders in diabetic children. Archives
of Disease in Childhood, 55(5), 371-375. Geierstanger, S. P., Amaral, G., Mansour, M., & Walters, S. R. (2004). School-based health centers and academic performance:
Research, challgenges, and recommendations. Journal of School Health, 74(9), 347-352. Gillham, J. E., Reivich, K. J., Jaycox, L. H., & Seligman, M. E. P. (1995). Prevention of depressive symptoms in schoolchildren:
Two-year follow-up. Psychological Science, 6(6), 343-351. Gisselmann, M. D. (2005). Education, infant mortality, and low birth weight in Sweden 1973-1990: Emergence of the low birth
weight paradox. Scandinavian Journal of Public Health, 33(1), 65-71. Glaser, R., Rabin, B., Chesney, M., Cohen, S., & Natelson, B. (1999). Stress-induced immunomodulation: Implications for
infectious diseases? JAMA, 281(24), 2268-2270. Glied, S., & Pine, D. S. (2002). Consequences and correlates of adolescent depression. Archives of Pediatrics and Adolescent
Medicine, 156, 1009-1014. Golden, M. P., Ingersoll, G. M., Brack, C. J., Russell, B. A., Wright, J. C., & Huberty, T. J. (1989). Longitudinal relationship of
asymptomatic hypoglycemia to cognitive function in IDDM. Diabetes Care, 12(2), 89-93. Goonan, B. T., Goonan, L. J., Brown, R. T., Buchanan, I., & Eckman, J. R. (1994). Sustained attention and inhibitory control in
children with sickle cell syndrome. Archives of Clinical Neuropsychology, 9(1), 89-104.

E-58
Gortmaker, S. L., Cheung, L. W., Peterson, K. E., Chomitz, G., Cradle, J. H., Dart, H., et al. (1999a). Impact of a school-based interdisciplinary intervention on diet and physical activity among urban primary school children: Eat well and keep moving. Archives of Pediatrics and Adolescent Medicine, 153(9), 975-983.
Gortmaker, S. L., Peterson, K., Wiecha, J., Sobol, A. M., Dixit, S., Fox, M. K., et al. (1999b). Reducing obesity via a school-based interdisciplinary intervention among youth: Planet Health. Archives of Pediatrics and Adolescent Medicine, 153(4), 409-418.
Gozal, D. (1998). Sleep-disordered breathing and school performance in children. Pediatrics, 102(3), 616-620. Gozal, D., & Pope Jr, D. W. (2001). Snoring during early childhood and academic performance at ages thirteen to fourteen years.
Pediatrics, 107(6), 1394. Grey, M., Whittemore, R., & Tamborlane, W. (2002). Depression in type 1 diabetes in children: Natural history and correlates.
Journal of Psychosomatic Research, 53(4), 907-911. Grissom, J. B. (2005). Physical fitness and academic achievement. Journal of Exercise Physiology online, 8(1), 11-25. Grossman, M., & Kaestner, R. (1997). Effects of education on health. In J. R. Berhman & N. Stacey (Eds.), The social benefits of
education. Ann Arbor, MI: University of Michigan Press. Gubhaju, B. B. (1991). Child mortality and survival in South Asia: Nepalese perspectives. New Delhi: Daya Publishing House. Guilleminault, C., Winkle, R., Korobkin, R., & Simmons, B. (1982). Children and nocturnal snoring: Evaluation of the effects of
sleep related respiratory resistive load and daytime functioning. European Journal of Pediatrics, 139(3), 165-171. Gutin, B., Islam, S., Manos, T., Cucuzzo, N., Smith, C., & Stachura, M. E. (1994). Relation of percentage of body fat and
maximal aerobic capacity to risk factors for atherosclerosis and diabetes in black and white seven to eleven-year-old children. J Pediatr, 125(6 Pt 1), 847-852.
Gutstadt, L. B., Gillette, J. W., Mrazek, D. A., Fukuhara, J. T., LaBrecque, J. F., & Strunk, R. C. (1989). Determinants of school performance in children with chronic asthma. American Journal of Diseases of Children, 143(4), 471-475.
Haan, M., Kaplan, G. A., & Camacho, T. (1987). Poverty and health. Prospective evidence from the Alameda County Study. American Journal of Epidemiology, 125(6), 989-998.
Haan, M. N., & Kaplan, G. (1986). The contribution of socieconomic position to minority health. In Report of the Secretary's Task Force on Black and Minority Health (Vol. 2, pp. 69-103). Washington, DC: U.S. Department of Health and Human Services.
Hagen, J. W., Barclay, C. R., Anderson, B. J., Feeman, D. J., Segal, S. S., Bacon, G., et al. (1990). Intellective functioning and strategy use in children with insulin-dependent diabetes mellitus. Child Development, 61(6), 1714-1727.
Hawkins, J. D., Catalano, R. F., Kosterman, R., Abbott, R., & Hill, K. G. (1999). Preventing adolescent health-risk behaviors by strengthening protection during childhood. Archives of Pediatrics and Adolescent Medicine, 153(3), 226-234.
Helmert, U., Herman, B., Joeckel, K. H., Greiser, E., & Madans, J. (1989). Social class and risk factors for coronary heart disease in the Federal Republic of Germany. Results of the baseline survey of the German Cardiovascular Prevention Study (GCP). Journal of Epidemiology and Community Health, 43(1), 37-42.
Hertzman, C. (1999). Population health and human development. In D. P. Keating & C. Hertzman (Eds.), Developmental Health and Wealth of Nations (pp. 21-40). New York: Guilford Press.
Hoelscher, D. M., Day, R. S., Lee, E. S., Frankowski, R. F., Kelder, S. H., Ward, J. L., et al. (2004). Measuring the prevalence of overweight in Texas school children. American Journal of Public Health, 94(6), 1002-1008.
Hoelscher, D. M., Kelder, S. H., Murray, N., Cribb, P. W., Conroy, J., & Parcel, G. S. (2001). Dissemination and adoption of the Child and Adolescent Trial for Cardiovascular Health (CATCH): A case study in Texas. Journal of Public Health Management and Practice, 7(2), 90-100.
Holmes, C. S., Dunlap, W. P., Chen, R. S., & Cornwell, J. M. (1992). Gender differences in the learning status of diabetic children. Journal of Consulting and Clinical Psychology, 60(5), 698-704.
Huberty, T. J., Austin, J. K., Harezlak, J., Dunn, D. W., & Ambrosius, W. T. (2000). Informant agreement in behavior ratings for children with epilepsy. Epilepsy and Behavior, 1(6), 427-435.
Ialongo, N. S., Edelsohn, G., & Kellam, S. G. (2001). A further look at the prognostic power of young children's reports of depressed mood and feelings. Child Development, 72(3), 736-747.
Idler, E. L., & Angel, R. J. (1990). Self-rated health and mortality in the NHANES-I epidemiologic follow-up study. American Journal of Public Health, 80(4), 446-452.
Jacobsen, B. K., & Thelle, D. S. (1988). Risk factors for coronary heart disease and level of education. The Tromso Heart Study. American Journal of Epidemiology, 127(5), 923-932.
Jimerson, S., Egeland, B., Sroufe, L. A., & Carlson, B. (2000). A prospective longitudinal study of high school dropouts examining multiple predictors across development. Journal of School Psychology, 38(6), 525-549.
Joint Interim Committee on Nutrition and Health in Public Schools. (2004). Interim report to the 79th Legislature: Available at: http://www.agr.state.tx.us/.
Joseph, C. L., Foxman, B., Leickly, F. E., Peterson, E., & Ownby, D. (1996). Prevalence of possible undiagnosed asthma and associated morbidity among urban schoolchildren. Journal of Pediatrics, 129(5), 735-742.

E-59
Kaemingk, K. L., Pasvogel, A. E., Goodwin, J. L., Mulvaney, S. A., Martinez, F., Enright, P. L., et al. (2003). Learning in children and sleep disordered breathing: Findings of the Tucson Children's Assessment of Sleep Apnea (TuCASA) Prospective Cohort Study. Journal of the International Neuropsychological Society, 9(7), 1016-1026.
Kaplan, G. A., & Kiel, J. E. (1993). Socioeconomic factors and cardiovascular disease: A review of the literature. Circulation, 88(4), 1973-1998.
Kashani, J. H., Carlson, G. A., Beck, N. C., Hoeper, E. W., Corcoran, C. M., McAllister, J. A., et al. (1987). Depression, depressive symptoms, and depressed mood among a community sample of adolescents. American Journal of Psychiatry, 144(7), 931-934.
Kaufman, F. R., Epport, K., Engilman, R., & Halvorson, M. (1999). Neurocognitive functioning in children diagnosed with diabetes before age 10 years. Journal of diabetes and its complications, 13(1), 31-38.
Keating, D. P., & Hertzman, C. (1999). Developmental health and the wealth of nations. New York: The Guilford Press. Kelder, S. H., Osganian, S. K., Feldman, H. A., Webber, L. S., Parcel, G. S., Luepker, R. V., et al. (2002). Tracking of physical
and physiological risk variables among ethnic subgroups from third to eighth grade: The Child and Adolescent Trial for Cardiovascular Health Cohort Study. Preventive Medicine, 34(3), 324-333.
Kennedy, S. (2003). The relationship between education and health in Australia and Canada (Research Paper No. 93). Hamilton, Ontario, Canada.: McMaster University, Program for Research on Social and Economic Dimensions of an Aging Population. SEDAP Research Program.
Kessler, R. C., Foster, C. L., Saunders, W. B., & Stang, P. E. (1995). Social consequences of psychiatric disorders, I: Education attainment. American Journal of Psychiatry, 152(7), 1026-1032.
Kitagawa, E., & Hauser, P. (1973). Differential mortality in the United States: A study of socio-economic epidemiology. Cambridge, Mass: Harvard University Press.
Kleinman, R. E., Hall, S., Green, H., Korzec-Ramirez, D., Patton, K., Pagano, M. E., et al. (2002). Diet, breakfast, and academic performance in children. Annals of Nutrition and Metabolism, 46 Suppl 1, 24-30.
Koivusilta, L. K., Rimpela, A. H., & Rimpela, M. K. (1999). Health-related lifestyle in adolescence-origin of social class differences in health? Health Education Research, 14(3), 339-355.
Kovacs, M., Goldston, D., & Iyengar, S. (1992). Intellectual development and academic performance of children with insulin dependent diabetes mellitus: A longitudinal study. Developmental Psychology, 28(4), 676-684.
Krieger, N. (2001). Theories for social epidemiology in the twenty-first century: An ecosocial perspective. International Journal of Epidemiology, 30(4), 668-677.
Kuczmarski, R. J., Ogden, C. L., Grummer-Strawn, L. M., Flegal, K. M., Guo, S. S., Wei, R. et al. (2000). CDC growth charts: United States. Adv.Data, 1-27.
Kunst, A., Looman, C., & Mackenbach, J. (1990). Socioeconomic mortality differences in the Netherlands in 1950-1984: A regional study of cause-specific mortality. Social Science & Medicine, 31(2), 141--152.
Kunst, M., & Mackenbach, J. (1994). The size of mortality differences associated with educational level in nine industrialized countries. American Journal of Public Health, 84(6), 932-937.
Landers, D. M., & Petruzzello, S. J. (1994). Physical activity, fitness, and anxiety. In C. Bouchard, R. J. Shephard & T. Stephens (Eds.), Physical activity, fitness and health: International proceedngs and consensus statement (pp. 868-882). Champaign, IL: Human Kinetics Publisher.
Lawrence, E. C. (1991). Poverty and the rate of time preference: Evidence from Panel data. The Journal of Political Economy, 99, 54-77.
Lebowitz, M. D. (1977). The relationship of socio-environmental factors to the prevalence of obstructive lung diseases and other chronic conditions. Journal of Chronic Diseases, 30(9), 599-611.
Leigh, J. P. (1983). Direct and indirect effects of education on health. Social Science & Medicine (1982), 17(4), 227-234. Lerner, M. (1975). Social differences in physical health. In J. Kosa, A. Antonovsky & I. K. Zola (Eds.), Poverty and Health. A
Sociological Analysis (2nd ed., pp. 80-134). Cambridge: Harvard University Press. Lewinsohn, P. M., Clarke, G. N., Seeley, J. R., & Rohde, P. (1994). Major depression in community adolescents: Age at onset,
episode duration, and time to recurrence. Journal of the American Academy of Child and Adolescent Psychiatry, 33(6), 809-818.
Lewinsohn, P. M., Hops, H., Roberts, R. E., Seeley, J. R., & Andrews, J. A. (1993). Adolescent psychopathology: I. Prevalence and incidence of depression and other DSM-III--R disorders in high school students. Journal of Abnormal Psychology, 102(1), 133-144.
Liberatos, P., Link, B. G., & Kelsey, J. L. (1988). The measurement of social class in epidemiology. Epidemiologic Reviews, 10, 87-121.
Lindgren, S., & Lokshin, B. (1992). Does asthma or treatment with theophylline limit children's academic performance? New England Journal of Medicine, 327(13), 926.
Liu, K., Cedres, L. B., Stamler, J., Dyer, A., Stamler, R., Nanas, S., et al. (1982). Relationship of education to major risk factors and death from coronary heart disease, cardiovascular diseases and all causes. Circulation, 66(6), 1308-1314.
Low, M. D., Low, B. J., Baumler, E. R., & Huynh, P. T. (Dec. 2005). Can education policy be health policy? Implication of research on the social determinants of health. Journal of Health Politics, Policy and Law. Forthcoming. (30.6).
E-60
Luepker, R. V., Perry, C. L., McKinlay, S. M., Nader, P. R., Parcel, G. S., Stone, E. J., et al. (1996). Outcomes of a field trial to improve children's dietary patterns and physical activity: The Child and Adolescent Trial for Cardiovascular Health. JAMA, 275(10), 768-776.
Lynch, J., Kaplan, G. A., Pamuk, E. R., Cohen, R. D., Heck, K. E., Balfour, J. L., et al. (1998). Income inequality and mortality in metropolitan areas of the United States. American Journal of Public Health, 88(7), 1074-1080.
Macintyre, S. (1997). The Black Report and beyond: What are the issues? Social Science & Medicine (1982), 44(6), 723-745. Maier, W. C., Arrighi, H. M., Morray, B., Llewllyn, C., & Redding, G. J. (1998). The impact of asthma and asthma-like illness in
Seattle school children. Journal of Clinical Epidemiology, 51(7), 557-568. Manton, K. G., Stallard, E., & Corder, L. (1997). Education-specific estimates of life expectancy and age-specific disability in
the US elderly population: 1982 to 1991. Journal of Aging & Health, 9(4), 419-450. Marmot, M., Kogevinas, M., & Elston, M. (1987). Social/economic status and disease. Annual Review of Public Health, 8, 111-
135. Marmot, M., & Shipley, M. (1996). Do socioeconomic differences in mortality persist after retirement? 25 year follow up of civil
servants from the first Whitehall study. British Medical Journal, 313, 1177-1180. Marmot, M. G. (1986). Social inequalities in mortality: The social environment. In R. G. Wilkinson (Ed.), Class and Health:
Research and Longitudinal Data. London: Tavistock Publishers. Marmot, M. G., Bobak, M., & Davey Smith, G. (1995). Explanations for social inequalities in health. In B. C. Amick & et al.
(Eds.), Society and health (pp. 172-210). New York: Oxford University Press. Marmot, M. G., Smith, G. D., Stansfeld, S., Patel, C., North, F., Head, J., et al. (1991). Health inequalities among British civil
servants: The Whitehall II study. Lancet, 337(8754), 1387-1393. Mathematica Policy Research Inc. (2002). Making a difference in the lives of infants and toddlers and their families: The impacts
of early Head Start. June. Princeton, NJ: Mathematica Policy Research Inc. Available on-line at: http://www.mathematica-mpr.com/3rdLevel/ehstoc.html.
Matthews, K. A., Kelsey, S. F., Meilahn, E. N., Kuller, L. H., & Wing, R. R. (1989). Educational attainment and behavioral and biologic risk factors for coronary heart disease in middle-aged women. American Journal of Epidemiology, 129(6), 1132-1144.
Mayer, S. E. (1997). What money can't buy: Family income and children's life chances. Cambridge, MA: Harvard University Press.
McCarthy, A. M., Lindgren, S., Mengeling, M. A., Tsalikian, E., & Engvall, J. (2003). Factors associated with academic achievement in children with Type 1 diabetes. Diabetes Care, 26(1), 112.
McCarthy, A. M., Lindgren, S., Mengeling, M. A., Tsalikian, E., & Engvall, J. C. (2002). Effects of diabetes on learning in children. Pediatrics, 109(1), E9.
McEwen, B. S. (1998). Protective and damaging effects of stress mediators. New England Journal of Medicine, 338(3), 171-179. McGee, D. L., Liao, Y., Cao, G., & Cooper, R. S. (1999). Self-reported health status and mortality in a multiethnic US cohort.
American Journal of Epidemiology, 149(1), 41-46. McGroder, S. M. (1990). Head Start: What do we know about what works? (Technical Analysis Paper). Office of the Assistant
Secretary for Planning and Evaluation. US Department of Health and Human Services. Available on-line at: http://aspe.hhs.gov.
McKenzie, F. D., & Richmond, J. B. (1998). Linking health and learning: An overview of coordinated school health programs. In E. Marx, S. F. Wooley & D. Northrop (Eds.), Health Is Academic: A Guide to Coordinated School Health Programs (pp. 1-14). New York: Teachers College Press.
McKenzie, T. L., Sallis, J. F., Prochaska, J. J., Conway, T. L., Marshall, S. J., & Rosengard, P. (2004). Evaluation of a two-year middle-school physical education intervention: M-SPAN. Medicine and Science in Sports and Exercise, 36(8), 1382-1388.
McKeown, T. (1979). The direction of medical research. Lancet, 2, 1281-1284. McKewen, M., Neatherlin, J., Millard, M. W., & Lawrence, G. (1998). School-based management of chronic asthma among
inner-city African-American schoolchildren in Dallas, Texas. Journal of School Health, 68, 196-200. McKinlay, J. B., & McKinlay, S. M. (1977). The questionable contribution of medical measures to the decline of mortality in the
United States in the twentieth century. The Milbank Memorial Fund Quarterly Health and Society, 55(3), 405-428. Merry, S., McDowell, M. S., Hetrick, S., Bir, J., & Muller, N. (2004). Psychological and/or educational interventions for the
prevention of depression in children and adolescents. The Cochrane Database of Systematic Reviews, Art. No.: CD003380.pub2. DOI: 10.1002/14651858.CD003380.pub2(Issue 2), 1-140.
Meyers, A. F., Sampson, A. E., Weitzman, M., Rogers, B. L., & Kayne, H. (1989). School Breakfast Program and school performance. American Journal of Diseases of Children, 143(10), 1234-1239.
Midanik, L. T., Klatsky, A. L., & Armstrong, M. A. (1990). Changes in drinking behavior: Demographic, psychosocial, and biomedical factors. The International Journal of the Addictions, 25(6), 599-619.
Millar, W. J., & Wigle, D. T. (1986). Socioeconomic disparities in risk factors for cardiovascular disease. Canadian Medical Association Journal, 134(2), 127-132.
E-61
Miller, D. S., & Miller, T. Q. (1997). A test of socioeconomic status as a predictor of initial marijuana use. Addictive Behaviors, 22(4), 479-489.
Miller, J., Rosenbloom, A., & Silverstein, J. (2004). Childhood obesity. J Clin Endocrinol Metab, 89(9), 4211-4218. Miller, M. K., & Stokes, C. S. (1978). Health status, health resources, and consolidated structural parameters: Implications for
public health care policy. Journal of Health and Social Behavior, 19(3), 263-279. Mirowsky, J., & Ross, C. E. (1986). Social patterns of distress. Annual Review of Sociology, 12, 23-45. Mirowsky, J., & Ross, C. E. (1989). Social causes of psychological distress. Hawthorne: Aldine de Gruyter. Mirowsky, J., & Ross, C. E. (2003). Education, social status, and health. New York: Aldine de Gruyter. Mitchell, W. G., Chavez, J. M., Lee, H., & Guzman, B. L. (1991). Academic underachievement in children with epilepsy.
Journal of Child Neurology, 6(1), 65-72. Morgan, W. P. (1994). Physical activity, fitness, and depression. In C. Bouchard, R. J. Shephard & T. Stephens (Eds.), Physical
activity, fitness and health: International proceedings and consensus statement (pp. 851-867). Champaign, IL: Human Kinetics Publisher.
Morgenstern, H. (1980). The changing association between social status and coronary heart disease in a rural population. Social Science & Medicine, 14A(3), 191-201.
Mossey, J. M., & Shapiro, E. (1982). Self-rated health: A predictor of mortality among the elderly. American Journal of Public Health, 72(8), 800-808.
Munoz, K. A., Krebs-Smith, S. M., Ballard-Barbash, R., & Cleveland, L. E. (1997). Food intakes of US children and adolescents compared with recommendations. Pediatrics, 100(3 Pt 1), 323-329.
Murphy, J. M., Pagano, M. E., Nachmani, J., Sperling, P., Kane, S., & Kleinman, R. E. (1998). The relationship of school breakfast to psychosocial and academic functioning: Cross-sectional and longitudinal observations in an inner-city school sample. Archives of Pediatrics and Adolescent Medicine, 152(9), 899-907.
Nabors, N. A., & Freymuth, A. K. (2002). Attention deficits in children with sickle cell disease. Perceptual and Motor Skills, 95(1), 57-67.
Nader, P. R., Stone, E. J., Lytle, L. A., Perry, C. L., Osganian, S. K., Kelder, S., et al. (1999). Three-year maintenance of improved diet and physical activity: The CATCH cohort. Archives of Pediatrics and Adolescent Medicine, 153(7), 695-704.
National Association of State Boards of Education. (2005/05/16). State-level school health policies: Texas. Retrieved 2005/07/26, from http://www.nasbe.org/HealthySchools/States/states.asp?Name=Texas
National Center for Chronic Disease Prevention and Health Promotion. (2005). Diabetes public health resource: Diabetes projects. from http://www.cdc.gov/diabetes/projects/cda2.htm
National Health Interview Survey. (2002). Summary Health Statistics for U.S. Children. Series 10, Number 221. Newacheck, P. W., Butler, L. H., Harper, A. K., Piontkowski, D. L., & Franks, P. E. (1980). Income and illness. Medical Care,
18(12), 1165-1176. Newland, K. (1981). Infant mortality and the health of the societies (Vol. 47). Worldwatch paper. Washington, DC: Worldwatch
Institute. Nicklas, T., & Johnson, R. (2004). Position of the American Dietetic Association: Dietary guidance for healthy children ages 2 to
11 years. Journal of the American Dietetic Association, 104(4), 660-677. Norris, R., Carroll, D., & Cochrane, R. (1992). The effects of physical activity and exercise training on psychological stress and
well-being in an adolescent population. Journal of Psychosomatic Research, 36(1), 55-65. O'Neil, S. L., Barysh, N., & Setear, S. J. (1985). Determining school programming needs of special population groups: A study
of asthmatic children. Journal of School Health, 55(6), 237-239. Office of the Surgeon General. (1996). Physical activity and health: A report of the Surgeon General. In (pp. 300). Atlanta, GA:
Centers for Disease Control and Prevention, National Center for Chronic Disease Prevention and Health Promotion. Olsen, O., & Madsen, M. (1999). Effects of maternal education on infant mortality and stillbirths in Denmark. Scandinavian
Journal of Public Health, 27(2), 128-136. Owens, J. A., Spirito, A., McGuinn, M., & Nobile, C. (2000). Sleep habits and sleep disturbance in elementary school-aged
children. J Dev Behav Pediatr, 21(1), 27-36. Pappas, G., Queen, S., Hadden, W., & Fisher, G. (1993). The increasing disparity in mortality between socioeconomic groups in
the United States, 1960 and 1986. New England Journal of Medicine, 329, 103-109. Parcel, G. S., Gilman, S. C., Nader, P. R., & Bunce, H. (1979). A comparison of absentee rates of elementary schoolchildren
with asthma and nonasthmatic schoolmates. Pediatrics, 64(6), 878-881. Pearlin, L. I., Lieberman, M. A., Menaghan, E. G., & Mullan, J. T. (1981). The stress process. Journal of Health and Social
Behavior, 22(4), 337-356. Pena, R., Wall, S., & Persson, L. A. (2000). The effect of poverty, social inequity, and maternal education on infant mortality in
Nicaragua, 1988-1993. American Journal of Public Health, 90(1), 64-69. Peterson, J. L., & Marin, G. (1988). Issues in the prevention of AIDS among black and Hispanic men. American Psychologist,
43(11), 871-877.
E-62
Pierce, J. P., Fiore, M. C., Novotny, T. E., Hatziandreu, E. J., & Davis, R. M. (1989). Trends in cigarette smoking in the United States. Educational differences are increasing. JAMA, 261(1), 56-60.
Pincus, E. (1998). Social conditions and self-management are more powerful determinants of health than access to health. Annals of Internal Medicine, 129, 406-411.
Pinhas-Hamiel, O., Dolan, L. M., Daniels, S. R., Standiford, D., Khoury, P. R., & Zeitler, P. (1996). Increased incidence of non-insulin-dependent diabetes mellitus among adolescents. J Pediatr, 128(5 Pt 1), 608-615.
Pollitt, E. (1995). Does breakfast make a difference in school? Journal of the American Dietetic Association, 95(10), 1134-1139. Pollitt, E., Leibel, R. L., & Greenfield, D. (1981). Brief fasting, stress, and cognition in children. American Journal of Clinical
Nutrition, 34(8), 1526-1533. Pollitt, E., Lewis, N. L., Garza, C., & Shulman, R. J. (1982). Fasting and cognitive function. Journal of Psychiatric Research,
17(2), 169-174. Porter, R. (1997). The greatest benefit to mankind: A medical history of humanity. New York and London: Norton. Possel, P., Horn, A. B., Groen, G., & Hautzinger, M. (2004). School-based prevention of depressive symptoms in adolescents: A
6-month follow-up. Journal of the American Academy of Child and Adolescent Psychiatry, 43(8), 1003-1010. Powell, C. A., Walker, S. P., Chang, S. M., & Grantham-McGregor, S. M. (1998). Nutrition and education: A randomized trial of
the effects of breakfast in rural primary school children. American Journal of Clinical Nutrition, 68(4), 873-879. Preston, S. H., & Elo, I. T. (1995). Are educational differentials in adult mortality increasing in the United States? Journal of
Aging & Health, 7(4), 476-496. Puczynski, M. S., Puczynski, S. S., Reich, J., Kaspar, J. C., & Emanuele, M. A. (1990). Mental efficiency and hypoglicemia. J
Dev Behav Pediatr, 11, 170-174. Puczynski, S., Puczynski, M. S., & Ryan, C. M. (1992). Hypoglycemia in children with insulin-dependent diabetes mellitus.
Diabetes Educator, 18(2), 151-153. Rampersaud, G. C., Pereira, M. A., Girard, B. L., Adams, J., & Metzl, J. D. (2005). Breakfast habits, nutritional status, body
weight, and academic performance in children and adolescents. Journal of the American Dietetic Association, 105(5), 743-760.
Randazzo, A. C., Muehlbach, M. J., Schweitzer, P. K., & Walsh, J. K. (1998). Cognitive function following acute sleep restriction in children ages 10-14. Sleep, 21(8), 861-868.
Reich, J. N., Kaspar, J. C., Puczynski, M. S., Puczynski, S., Cleland, J. W., Dell'Angela, K., et al. (1990). Effect of a hypoglycemic episode on neuropsychological functioning in diabetic children. Journal of Clinical and Experimental Neuropsychology, 12(4), 613-626.
Rhodes, S. K., Shimoda, K. C., Waid, L. R., O'Neil, P. M., Oexmann, M. J., Collop, N. A., et al. (1995). Neurocognitive deficits in morbidly obese children with obstructive sleep apnea. The Journal of Pediatrics, 127(5), 741-744.
Richard, H. W., & Burlew, A. K. (1997). Academic performance among children with sickle cell disease: Setting minimum standards for comparison groups. Psychological Reports, 81(1), 27-34.
Roberts, R. E., Roberts, C. R., & Chen, Y. R. (1997). Ethnocultural differences in prevalence of adolescent depression. American Journal of Community Psychology, 25(1), 95-110.
Roberts, R. E., Solari, A. C., Hernandez, M., Arambula, M. C., & Lee, E. S. (2002). The health of Valley youths: Findings from the 2001 Lower Rio Grande Valley Texas Youth Risk Behavior Survey.
Robinson, T. N. (1999). Reducing children's television viewing to prevent obesity: A randomized controlled trial. JAMA, 282(16), 1561-1567.
Rogers, R. G., Hummer, R. A., & Nam, C. B. (1999). Living and dying in the USA: Behavioral, health, and social forces of adult mortality. New York: Academic.
Rogot, E., Sorlie, P. D., & Johnson, N. J. (1992). Life expectancy by employment status, income, and education in the National Longitudinal Mortality Study. Public Health Reports, 107, 457-461.
Romelsjo, A., & Diderichsen, F. (1989). Changes in alcohol-related inpatient care in Stockholm County in relation to socioeconomic status during a period of decline in alcohol consumption. American Journal of Public Health, 79(1), 52-56.
Ross, C. E., & Bird, C. E. (1994). Sex stratification and health lifestyle: Consequences for men's and women's perceived health. Journal of Health and Social Behavior, 35(2), 161-178.
Ross, C. E., & Mirowsky, J. (1983). Social epidemiology of overweight: A substantive and methodological investigation. Journal of Health and Social Behavior, 24(3), 288-298.
Ross, C. E., & Mirowsky, J. (1992). Household, employment, and the sense of control. Social Psychology Quarterly, 55, 217-235.
Ross, C. E., & Mirowsky, J. (1999). Refining the association between education and health: The effects of quantity, credential, and selectivity. Demography, 36(4), 445-460.
Ross, C. E., & Van Willigen, M. (1997). Education and the subjective quality of life. Journal of Health & Social Behavior, 38(3), 275-297.
Ross, C. E., & Wu, C. L. (1995). The links between education and health. American Sociological Review, 60, 719-745.
E-63
Ross, C. E., & Wu, C. L. (1996). Education, age, and the cumulative advantage in health. Journal of Health & Social Behavior, 37(1), 104-120.
Ross, N. A., Wolfson, M. C., Dunn, J. R., Berthelot, J. M., Kaplan, G. A., & Lynch, J. W. (2000). Relation between income inequality and mortality in Canada and the United States: A cross-sectional assessment using census data and vital statistics. British Medical Journal, 320, 898-902.
Rotter, J. B. (1966). Generalized expectancies for internal versus external control of reinforcement. Psychological Monographs, 80(1), 1-28.
Rovet, J. F., Ehrlich, R.M., Hoppe, M. (1987). Intellectual deficits associated with early onset of insulin-dependant diabetes mellitus in children. Diabetes Care, 10, 510-515.
Rowentree, B. (2001). Poverty: A study of town life (1901). In G. D. Smith, D. Dorling & M. Shaw (Eds.), Poverty, Inequality, and Health in Britain, 1800-2000: A Reader (pp. 97-106). Bristol, England: Policy Press.
Rudolph, K. D., Lambert, S. F., Clark, A. G., & Kurlakowsky, K. D. (2001). Negotiating the transition to middle school: The role of self-regulatory processes. Child Development, 72(3), 929-946.
Ryan, C., Longstreet, C., & Morrow, L. (1985a). The effects of diabetes mellitus on the school attendance and school achievement of adolescents. Child: Care, Health and Development, 11(4), 229-240.
Ryan, C., Vega, A., & Drash, A. (1985b). Cognitive deficits in adolescents who developed diabetes early in life. Pediatrics, 75(5), 921.
Ryan, C., Vega, A., Longstreet, C., & Drash, A. (1984). Neuropsychological changes in adolescents with insulin-dependent diabetes. Journal of Consulting and Clinical Psychology, 52(3), 335-342.
Sallis, J. F., McKenzie, T. L., Alcaraz, J. E., Kolody, B., Faucette, N., & Hovell, M. F. (1997). The effects of a 2-year physical education program (SPARK [Sports, Play and Active Recreation for Kids]) on physical activity and fitness in elementary school students. American Journal of Public Health, 87(8), 1328-1334.
Sallis, J. F., McKenzie, T. L., Alcaraz, J. E., Kolody, B., Hovell, M. F., & Nader, P. R. (1993). Project SPARK. Effects of physical education on adiposity in children. Annals of the New York Academy of Science, 699, 127-136.
Sallis, J. F., McKenzie, T. L., Kolody, B., Lewis, M., Marshall, S., & Rosengard, P. (1999). Effects of health-related physical education on academic achievement: Project SPARK. Research Quarterly for Exercise and Sport, 70(2), 127-134.
Sapolsky, R. M. (1997). Why zebras don't get ulcers: An updated guide to stress, stress-related diseases, and coping. New York: W.H. Freeman.
Schatz, J. (2004). Brief report: Academic attainment in children with sickle cell disease. Journal of Pediatric Psychology, 29(8), 627-633.
Schoenfeld, J., Seidenberg, M., Woodard, A., Hecox, K., Inglese, C., Mack, K., et al. (1999). Neuropsychological and behavioral status of children with complex partial seizures. Developmental Medicine and Child Neurology, 41(11), 724-731.
Schweinhart, L. J. (1993). Significant benefits: The High/Scope Perry Preschool Study through age 27. Ypsilanti: The High Scope Press.
Seeman, M. (1983). Alienation motifs in contemporary theorizing: The hidden continuity of the classic themes. Social Psychology Quarterly, 46, 171-184.
Seeman, T. E., & Crimmins, E. (2001). Social environment effects on health and aging: Integrating epidemiologic and demographic approaches and perspectives. Annals of the New York Academy of Sciences, 954, 88-117.
Seeman, T. E., Crimmins, E., Huang, M. H., Singer, B., Bucur, A., Gruenewald, T., et al. (2004). Cumulative biological risk and socio-economic differences in mortality: MacArthur studies of successful aging. Social Science & Medicine, 58(10), 1985-1997.
Seeman, T. E., Singer, B. H., Rowe, J. W., Horwitz, R. I., & McEwen, B. S. (1997). Price of adaptation-allostatic load and its health consequences. MacArthur studies of successful aging. Archives of Internal Medicine, 157(19), 2259-2268.
Seeman, T. E., Singer, B. H., Rowe, J. W., & McEwen, B. S. (2001). Exploring a new concept of cumulative biological risk-allostatic load & its health consequences: MacArthur studies of successful aging. Proceedings of the National Academy of Sciences of the United State of America, 98(8), 4770-4775.
Seidenberg, M., Beck, N., Geisser, M., Giordani, B., Sackellares, J. C., Berent, S., et al. (1986). Academic achievement of children with epilepsy. Epilepsia, 27(6), 753-759.
Seligman, M. E. P. (1975). Helplessness: On depression, development and death. San Francisco, CA: Freeman. Sen, A. (1997). Editorial: Human capital and human capability. World Development, 25(12), 1959-1961. Shakotko, R. S., Edwards, L. N., & Grossman, M. (1980). An exploration of the dynamic relationship between health and
cognitive development in adolescence (NBER Working Paper No. W0454). National Bureau of Economic Research, Inc.
Shapiro, S., McCormick, M. C., Starfield, B. H., Krischer, J. P., & Bross, D. (1980). Relevance of correlates of infant deaths for significant morbidity at 1 year of age. American Journal of Obstetrics & Gynecology, 136(3), 363-373.
Sharp, K., Ross, C. E., & Cockerham, W. C. (1983). Symptoms, beliefs, and the use of physician services among the disadvantaged. Journal of Health and Social Behavior, 24(3), 255-263.
E-64
Shea, S., Stein, A. D., Basch, C. E., Lantigua, R., Maylahn, C., Strogatz, D. S., et al. (1991). Independent associations of educational attainment and ethnicity with behavioral risk factors for cardiovascular disease. American Journal of Epidemiology, 134(6), 567-582.
Shoham-Yakubovich, I., & Barell, V. (1988). Maternal education as a modifier of the association between low birthweight and infant mortality. International Journal of Epidemiology, 17(2), 370-377.
Sibley, B. A., & Etnier, J. L. (2003). The relationship between physical activity and cognition in children: A meta-analysis. Pediatric Exercise Science, 15, 243-256.
Silverstein, M. D., Mair, J. E., Katusic, S. K., Wollan, P. C., O'connell, E. J., & Yunginger, J. W. (2001). School attendance and school performance: A population-based study of children with asthma. Journal of Pediatrics, 139(2), 278-283.
Sorlie, P., Backlund, E., & Keller, J. (1995). US mortality by economic, demographic, and social characteristics: The National Longitudinal Mortality Study. American Journal of Public Health, 85(7), 949-956.
Spence, S. H., Sheffield, J. K., & Donovan, C. L. (2003). Preventing adolescent depression. Journal of Consulting and Clinical Psychology, 71(1), 3-13.
Spence, S. H., Sheffield, J. K., & Donovan, C. L. (2005). Long-term outcome of a school-based, universal approach to prevention of depression in adolescents. Journal of Consulting and Clinical Psychology, 73(1), 160-167.
Strong, W. B., Malina, R. M., Blimkie, C. J. R., Daniels, S. R., Dishman, R. K., Gutin, B., et al. (2005). Evidence based physical activity for school-age youth. Journal of Pediatrics, 146(6), 732-737.
Swift, A. V., Cohen, M. J., Hynd, G. W., Wisenbaker, J. M., McKie, K. M., Makari, G., et al. (1989). Neuropsychologic impairment in children with sickle cell anemia. Pediatrics, 84(6), 1077-1085.
Taylor, H. L. (1967). Occupational factors in the study of coronary heart disease and physical activity. Canadian Medical Association Journal, 96(12), 825-831.
Texas Children's Sickle Cell Center, & Texas Children's Hospital. (2005). Sickle cell disease in children. Retrieved 2005/06/16, from http://www.texaschildrenshospital.org/carecenters/cancer/Presentations/SickleinChildren.pdf
Texas Department of Agriculture. (2004). Texas school meal statistics. Retrieved 2005/07/29, from http://www.squaremeals.org/fn/render/channel/items/0,1249,2348_2368_0_0,00.html
Texas Health Care Information Council. (2003). Preventable hospitalizations in Texas 2001. Retrieved 2005/03/17, from http://www.dshs.state.tx.us/thcic/publications/hospitals/pqireport2001/cover.pdf
Tinkelman, D., & Schwartz, A. (2004). School-based asthma disease management. Journal of Asthma, 41(4), 455-462. Tortolero, S. R., Taylor, W. C., & Murray, N. G. (2001). Physical activity, physical fitness and social, psychological and
emotional health. In N. Armstrong & W. van Mechelen (Eds.), Paediatric Exercise Science and Medicine. Oxford: Oxford University Press.
Trevino, R. P., Yin, Z., Hernandez, A., Hale, D. E., Garcia, O. A., & Mobley, C. (2004). Impact of the Bienestar school-based diabetes mellitus prevention program on fasting capillary glucose levels: A randomized controlled trial. Archives of Pediatrics and Adolescent Medicine, 158(9), 911-917.
Tyroler, H. A., Knowles, M. G., Wing, S. B., Logue, E. E., Davis, C. E., Heiss, G., et al. (1984). Ischemic heart disease risk factors and twenty-year mortality in middle-age Evans County black males. American Heart Journal, 108(3 Pt 2), 738-746.
UNICEF. (2003). Social monitor 2003. Special feature: Infant mortality. Florence: UNICEF Innocenti Research Centre. Avaiable at: http://www.unicef-icdc.org/publications/pdf/monitor03/monitor2003.pdf.
Wagenknecht, L. E., Perkins, L. L., Cutter, G. R., Sidney, S., Burke, G. L., Manolio, T. A., et al. (1990). Cigarette smoking behavior is strongly related to educational status: The CARDIA study. Preventive Medicine, 19(2), 158-169.
Wagstaff, A., Bustreo, F., Bryce, J., Claeson, M., & WHO-World Bank Child Health and Poverty Working Group. (2004). Child health: Reaching the poor. American Journal of Public Health, 94(5), 726-736.
Wagstaff, A., Paci, P., & van Doorslaer, E. (1991). On the measurement of inequalities in health. Social Science & Medicine (1982), 33(5), 545-557.
Wang, W., Enos, L., Gallagher, D., Thompson, R., Guarini, L., Vichinsky, E., et al. (2001). Neuropsychologic performance in school-aged children with sickle cell disease: A report from the Cooperative Study of Sickle Cell Disease. The Journal of Pediatrics, 139(3), 391-397.
Wasserman, A. L., Wilimas, J. A., Fairclough, D. L., Mulhern, R. K., & Wang, W. (1991). Subtle neuropsychological deficits in children with sickle cell disease. The American Journal of Pediatric Hematology/Oncology, 13(1), 14-20.
Weil, W. B., Jr., & Ack, M. (1964). School achievement in juvenile diabetes mellitus. Diabetes, 13, 303-306. Weiss, B. D. (1999). 20 common problems in primary care. New York: McGraw-Hill. Westlund, K., & Nicolaysen, R. (1972). Ten-year mortality and morbidity related to serum cholesterol. A follow-up of 3,751
men aged 40-49. Scand J Clin Lab Invest Suppl, 127, 1-24. Wheaton, B. (1980). The sociogenesis of psychological disorder: An attributional theory. Journal of Health and Social Behavior,
21(2), 100-124. Wilkinson, R. G. (2001). Mind the gap: Hierarchies, health and human evolution. New Haven: Yale University Press. Williams, D. R. (1986). Socioeconomic differentials in health: The role of psychosocial factors. Unpublished
Dissertation/Thesis, Department of Sociology, University of Michigan.

E-65
Williams, D. R. (1990). Socioeconomic differentials in health: A review and redirection. Social Psychology Quarterly, 53, 81-99. Williams, M. V., Baker, D. W., Honig, E. G., Lee, T. M., & Nowlan, A. (1998a). Inadequate literacy is a barrier to asthma
knowledge and self-care. Chest, 114, 1008-1015. Williams, M. V., Baker, D. W., Parker, R. M., & Nurss, J. R. (1998b). Relationship of functional health literacy to patients'
knowledge of their chronic disease: A study of patients with hypertension or diabetes. Archives of Internal Medicine, 158, 166-172.
Winkleby, M. A., Jatulis, D. E., Frank, E., & Fortmann, S. P. (1992). Socioeconomic status and health: How education, income, and occupation contribute to risk factors for cardiovascular disease. American Journal of Public Health, 82(6), 816-820.
Wolfson, A. R., & Carskadon, M. A. (1998). Sleep schedules and daytime functioning in adolescents. Child Development, 69(4), 875-887.
Wolfson, M., Kaplan, G., Lynch, J., Ross, N., & Backlund, E. (1999). Relation between income inequality and mortality: Empirical demonstration. British Medical Journal, 319, 953-957.
Wolfson, M., Rowe, G., Gentleman, J. F., & Tomiak, M. (1993). Career earnings and death: A longitudinal analysis of older Canadian men. Journal of Gerontology, 48(4), S167-179.
Yeatts, K. B., & Shy, C. M. (2001). Prevalence and consequences of asthma and wheezing in African-American and White adolescents. The Journal of Adolescent Health, 29(5), 314-319.
Young, T. L., & Rogers, K. D. (1986). School performance characteristics preceding onset of smoking in high school students. American Journal of Diseases of Children, 140(3), 257-259.
Yu, S. L., Kail, R., Hagen, J. W., & Wolters, C. A. (2000). Academic and social experiences of children with insulin-dependent diabetes mellitus. Children's Health Care, 29(3), 189-207.

E-66
Education and Health: A Review and Assessment
APPENDIX I: Extended Summary of Studies Linking Chronic Conditions and Academic Achievement
SAMPLE, DESIGN, & INTERVENTION ACHIEVEMENT MEASURE OUTCOME
OBESITY Datar (2004) Sample: N = 11,192 first time kindergartners from the
Early Childhood Longitudinal Study (a nationally representative sample of kindergarteners in the U.S. in 1998) Weight Measures: Measured height and weight (1) fall of kindergarten, (2) spring of kindergarten, (3) spring of 1st grade Study Design: Longitudinal
Standardized Item Response Theory scale scores in reading and mathematics
Controlled for SES, parent-child interaction, birth weight, physical activity, and TV watching Baseline: Overweight boys (1.42 pts, p<.05) and girls (1.66 pts, p<.05) scored lower in reading than non-overweight children Overweight boys (1.99 pts, p<.05) and girls (1.21 pts, p<.05) scored lower in math than non-overweight children. After controlling for variables listed above, only boys’ math test scores remained statistically significant. (Effect sizes were between SDs of 0.06 and 0.12.) When baseline scores were also controlled for, there was no difference in test score gains during the first 2 years between overweight and non-overweight children.
Falkner (2001) Sample: N = 9,943 Connecticut public schools students in the 7th, 9th, and 11th grades who responded to a 1995 to 1996 statewide survey of adolescent health Weight Measures: Students reported height and weight on a questionnaire administered in the classroom Study Design: Cross-sectional
6 Items: Measures of liking school, getting along with teachers and students, self-assessment of academic performance, expectations of finishing high school, and whether students had ever repeated a grade
Controlled for grade level, race, and parental SES Obese girls were 1.51 times more likely to report being held back a grade (95% CI: 1.09, 2.10) and 2.09 times more likely to consider themselves poor students (95% CI: 1.35, 3.24) than average weight girls. Obese boys were 1.46 times more likely to consider themselves poor students (95% CI: 1.05, 2.03) and 2.18 times more likely to report that they expect to quit school (95% CI: 1.45, 3.30) than average weight boys. Overweight boys were 1.36 times more likely to consider themselves poor students (95% CI: 1.05, 1.76) and 1.54 times more likely to report that they expect to quit school (95% CI: 1.07, 2.22) than average weight boys.
ASTHMA Freudenberg (1980)
Sample: N = 200 families (children with asthma who had experienced at least 1 episode of wheezing in the past year and parents). Mean age = 10yrs. 60% Hispanic, 36% Black; 60% males, 40% females.
Questions regarding school attendance and performance (including problems in school and participation in physical
Parents reported that average absence from school was 3 days a month. 20% reported six days a month or more. In the sub sample of 50 children with asthma the absence rate was 26 days per year compared to 21 days per year of the overall school absence rate.
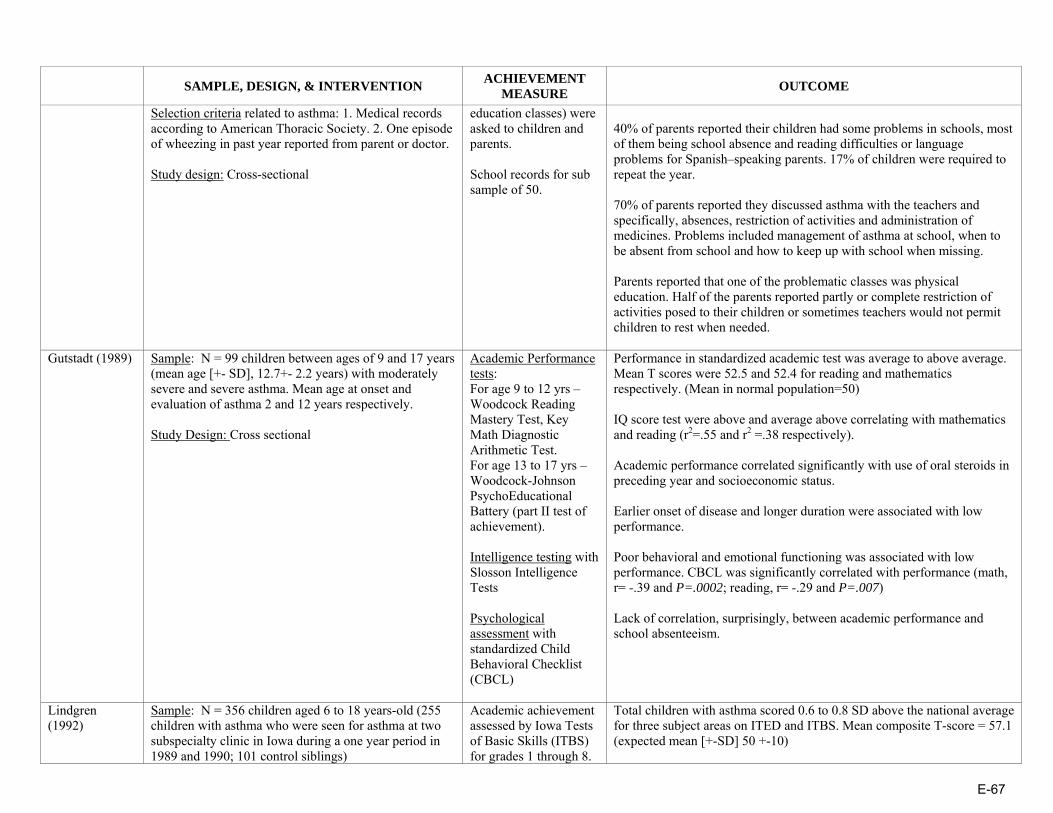
E-67
SAMPLE, DESIGN, & INTERVENTION ACHIEVEMENT
MEASURE OUTCOME
Selection criteria related to asthma: 1. Medical records according to American Thoracic Society. 2. One episode of wheezing in past year reported from parent or doctor. Study design: Cross-sectional
education classes) were asked to children and parents. School records for sub sample of 50.
40% of parents reported their children had some problems in schools, most of them being school absence and reading difficulties or language problems for Spanish–speaking parents. 17% of children were required to repeat the year. 70% of parents reported they discussed asthma with the teachers and specifically, absences, restriction of activities and administration of medicines. Problems included management of asthma at school, when to be absent from school and how to keep up with school when missing. Parents reported that one of the problematic classes was physical education. Half of the parents reported partly or complete restriction of activities posed to their children or sometimes teachers would not permit children to rest when needed.
Gutstadt (1989) Sample: N = 99 children between ages of 9 and 17 years (mean age [+- SD], 12.7+- 2.2 years) with moderately severe and severe asthma. Mean age at onset and evaluation of asthma 2 and 12 years respectively. Study Design: Cross sectional
Academic Performance tests: For age 9 to 12 yrs – Woodcock Reading Mastery Test, Key Math Diagnostic Arithmetic Test. For age 13 to 17 yrs – Woodcock-Johnson PsychoEducational Battery (part II test of achievement). Intelligence testing with Slosson Intelligence Tests Psychological assessment with standardized Child Behavioral Checklist (CBCL)
Performance in standardized academic test was average to above average. Mean T scores were 52.5 and 52.4 for reading and mathematics respectively. (Mean in normal population=50) IQ score test were above and average above correlating with mathematics and reading (r2=.55 and r2 =.38 respectively). Academic performance correlated significantly with use of oral steroids in preceding year and socioeconomic status. Earlier onset of disease and longer duration were associated with low performance. Poor behavioral and emotional functioning was associated with low performance. CBCL was significantly correlated with performance (math, r= -.39 and P=.0002; reading, r= -.29 and P=.007) Lack of correlation, surprisingly, between academic performance and school absenteeism.
Lindgren (1992)
Sample: N = 356 children aged 6 to 18 years-old (255 children with asthma who were seen for asthma at two subspecialty clinic in Iowa during a one year period in 1989 and 1990; 101 control siblings)
Academic achievement assessed by Iowa Tests of Basic Skills (ITBS) for grades 1 through 8.
Total children with asthma scored 0.6 to 0.8 SD above the national average for three subject areas on ITED and ITBS. Mean composite T-score = 57.1 (expected mean [+-SD] 50 +-10)

E-68
SAMPLE, DESIGN, & INTERVENTION ACHIEVEMENT
MEASURE OUTCOME
Study design: Cross sectional and matched case-control study for a sub sample????
Iowa Tests of Educational Development (ITED) for grades 9 through 12. Academic subject areas tested were: reading, mathematics, and composite achievement score.
Solely 4.8 % of 255 children had low scores in at least one achievement area. Achievement scores (composite scores on ITED or ITBS) were correlated with parental education, (correl.coef. 0.27 and p<0.001 with mother’s education; c.c. 0.29, p<0.001 with father’s education). 101 matched children with asthma (T-score 58.3) did not differ from their siblings (T-score 57.5) in academic achievement scores, with score ranges similar to total sample. No differences were found between children in boys groups, girls group, for younger or older children. Use of theophylline for at least 3months at time of testing did not have any affect on the academic achievement of children in matched group. Stratified analysis for sex, age, and parental education level yield the same results. No differences were seen in academic achievement between matched children with asthma that used inhaled steroids, even the number was a small one. 23% of parents of children with asthma believed asthma was causing learning problems and 18% thought mediation was the problem. Parents’ convictions were not supported by objective data
O’Neil (1985) Sample: N = 4,036 students aged 5 to 15 years-old (102 children diagnosed with asthma, 139 with chronic bronchitis, and 45 with both (total=286)). Study design: Cross-sectional Asthma Measures: 21- items survey based on a questionnaire related to asthma and chronic bronchitis by Connecticut Lung Association
School records on children’ school performance.
Average absences number for 286 students was 9.5 days per year. 61 out of 286 had 7 or more absences per year during the past years. Absenteeism was significantly correlated with grades (rxy (-.368), p=.01). But majority of grades for these student were average or higher. Reading and math achievements were not affected by the absenteeism. The higher the IQ scores the higher the score in math, reading and general grades.
Padur (1995) Sample: N = 100 children, aged 8 to 16 yrs, (mean = 11.5 yrs, SD =2.5), 52 girls and 48 boys. 75 Caucasian, 13 African-American, 12 other. 25 children with asthma; 25 children with cancer, 25 with diabetes and 25 healthy children served as control groups. Time since chronic disease diagnosis was 6 months or more.
Child Behavior Checklist (CBCL) for behavior problems and social competence. Child Depression Inventory – 27 item questionnaire self-
Affective adjustment: The asthma group scored significantly higher and thus had more depression in CDI-parents score, (F(3,97)=3.57, p=<.02). No differences between groups on CDI and PH anxiety scores. Differences were found for CBCL internalizing scores between groups (p=<.01) with asthma group scoring more severe behavioral problems. Conduct, social and school adjustment:
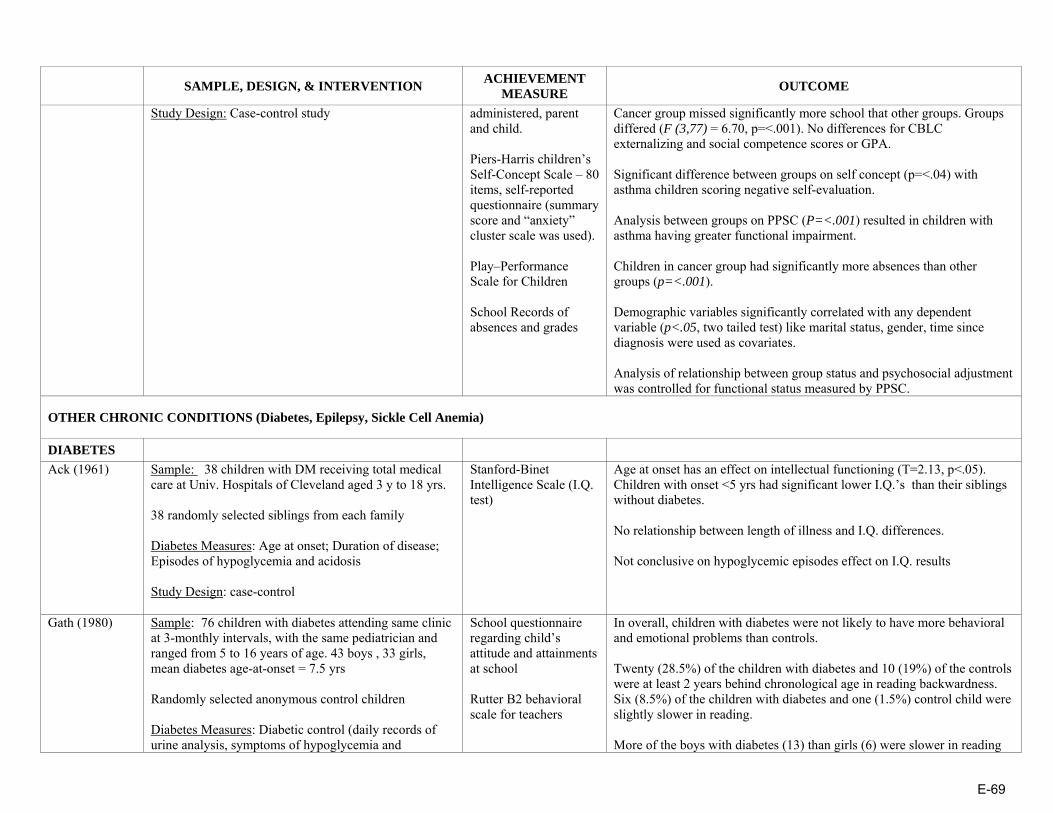
E-69
SAMPLE, DESIGN, & INTERVENTION ACHIEVEMENT
MEASURE OUTCOME
Study Design: Case-control study
administered, parent and child. Piers-Harris children’s Self-Concept Scale – 80 items, self-reported questionnaire (summary score and “anxiety” cluster scale was used). Play–Performance Scale for Children School Records of absences and grades
Cancer group missed significantly more school that other groups. Groups differed (F (3,77) = 6.70, p=<.001). No differences for CBLC externalizing and social competence scores or GPA. Significant difference between groups on self concept (p=<.04) with asthma children scoring negative self-evaluation. Analysis between groups on PPSC (P=<.001) resulted in children with asthma having greater functional impairment. Children in cancer group had significantly more absences than other groups (p=<.001). Demographic variables significantly correlated with any dependent variable (p<.05, two tailed test) like marital status, gender, time since diagnosis were used as covariates. Analysis of relationship between group status and psychosocial adjustment was controlled for functional status measured by PPSC.
OTHER CHRONIC CONDITIONS (Diabetes, Epilepsy, Sickle Cell Anemia)
DIABETES
Ack (1961)
Sample: 38 children with DM receiving total medical care at Univ. Hospitals of Cleveland aged 3 y to 18 yrs. 38 randomly selected siblings from each family Diabetes Measures: Age at onset; Duration of disease; Episodes of hypoglycemia and acidosis Study Design: case-control
Stanford-Binet Intelligence Scale (I.Q. test)
Age at onset has an effect on intellectual functioning (T=2.13, p<.05). Children with onset <5 yrs had significant lower I.Q.’s than their siblings without diabetes. No relationship between length of illness and I.Q. differences. Not conclusive on hypoglycemic episodes effect on I.Q. results
Gath (1980)
Sample: 76 children with diabetes attending same clinic at 3-monthly intervals, with the same pediatrician and ranged from 5 to 16 years of age. 43 boys , 33 girls, mean diabetes age-at-onset = 7.5 yrs Randomly selected anonymous control children Diabetes Measures: Diabetic control (daily records of urine analysis, symptoms of hypoglycemia and
School questionnaire regarding child’s attitude and attainments at school Rutter B2 behavioral scale for teachers
In overall, children with diabetes were not likely to have more behavioral and emotional problems than controls. Twenty (28.5%) of the children with diabetes and 10 (19%) of the controls were at least 2 years behind chronological age in reading backwardness. Six (8.5%) of the children with diabetes and one (1.5%) control child were slightly slower in reading. More of the boys with diabetes (13) than girls (6) were slower in reading

E-70
SAMPLE, DESIGN, & INTERVENTION ACHIEVEMENT
MEASURE OUTCOME
hyperglycemia); Profound hypoglycemic episodes (notes of the child) Study Design: case-control
backwardness but the difference was not significant. No relation between diabetes duration and psychiatric disorders or reading. Children with poor diabetes control had more psychiatric problems (p<0.02) and backwardness in reading (P<0.02) Hypoglycemic attacks were not related to backwardness in reading. The influence of psychosocial factors on reading problems was evident only when the diabetes was well controlled.
Golden (1989)
Sample: 23 children with IDDM with age-at onset <5 yrs, who were treated at James Whitcomb Riley Hospital for Children Duration of diabetes was 36±20 mo, mean age of diagnosis, mean age at testing = 71±21 mo. Diabetes Measures: HbA1 level; mean daily dose of insulin per kilogram; severe hypoglycemic episodes; total number of self-monitoring blood glucose measurements (SMBG) reported; number of SMBG measurements <2.8 mM. Asymptomatic hypoglycemia was calculated. Study Design: Partially longitudinal (only 17 followed from time of diagnosis and neurocognitive functions not followed longitudinally)
Stanford-Binet Intelligence Scale (Verbal and Quantitative Reasoning, Abstract and Visual Reasoning, Short-term Memory, Composite IQ)
Sever hypoglycemia was not correlated with cognitive scores Age at onset of IDDM correlated (r = -0.43, P = 0.024) with short-term memory, The relationship between frequency of asymptomatic hypoglycemia and intellectual performance appeared to be concentrated within abstract/visual reasoning (r = -.39, p = .037). The copying subscale (r = -.42, p = .022) contributed to the relationship Abstract reasoning score were not correlated with metabolic control (HbA1)
Hagen (1990) Sample: 30 children with IDDM [15 early-onset (EOD) (diagnosed before age 4), 15 late-onset (LOD)(diagnosed after age 4)], 30 children without diabetes all ranging in age from 8.0 to 16.6 yrs Diabetes duration = 10 yrs for EOD; 4 yrs fro LOD. All children were Caucasian Comparisons matched on CA (?), grade level, and families’ SES. Age used as covariate Diabetes Measures: Metabolic control (HbA1) Study Design: Case-control
Peabody Individual Achievement Test (reading, comprehension and mathematics) WISC-R (intelligence; vocabulary and block design subtests) Information processing (forced-choice recall task, pause-time memory task)
Significant main effects for the groups were found for 3 subtests of WISC-R: vocabulary, F(2,57) = 7.30, p<.01; digit span, F(2, 57) = 3.73, p<.05; and information F(2, 57) = 5.33, p<.01. Significant differences were found between: EOD & Controls on vocabulary, F(1,43)= 4.7, p<.05; digit span, F(1,43)= 8.06, p<.01; information, F(1,43)= 4.45, p<.05; and block design, F(1,43)= 4.7, p<.05 LOD & Controls on vocabulary, F(1, 43)= 12.90, p<.01; information, F(1, 43)= 9.62, p<.01; and reading comprehension, F(1,43)= 3.97, p = .05 Children with EOD appear to be less selective in their short-term recall, perhaps indicating an attention deficit and showed less evidence of strategy use.

E-71
SAMPLE, DESIGN, & INTERVENTION ACHIEVEMENT
MEASURE OUTCOME
Harter Perceived Competence Scale for Children (perceived self-competence) Parent interview on child academic, development and medical functioning. Questionnaires on family environment and child behavior.
For primacy recall (information processing), the performance of the EOD group was still significantly below that of either of the groups, F(1, 34)= 9.88, p<.01; F(1,24)= 5.32, p<.05. No difference between groups in Math scores; LOD below than controls (F(1.43)=3.97, p=.05) on reading comprehension. No significant differences between groups in perceived self-competence. Parents of EOD children reported their child had repeated a grade and received remedial or “resource” services at school significantly more often than parents of children in the control group. EOD parents reported more severe hypoglycemic episodes and hospitalization.
Holmes (1992)
Sample: 95 children with IDDM recruited during their regular visit to a diabetes clinic at a Midwestern university hospital. 53 girls and 42 boys, age between 8 and 16 yrs Diabetes age at onset = 7.3 yrs old, all White, middle SES Possessed a full-scale IQ score of 80 or above; 97 controls matched on grade, similar on age, gender, and SES. All White Diabetes Measure: Average metabolic control (HgA1c) Study Design: case-control
School records for absences Parent interview regarding child’s learning history Wechsler Intelligence Scale for Children-Revised (Verbal Comprehension, Perceptual Organization and Freedom from Distractibility
A significant effect of disease status was found for school attendance, F(1, 104) = 17.46, p<.0001; children with diabetes missed more school (M=14.9 days) than control children (M=6.7 days). No relationship was found between Intelligence scores and –age at onset, disease duration and degree of metabolic control. Those with diabetes did not differ from the controls in overall IQ tests. Boys with diabetes had significantly lower Freedom From Distractibility scores (M=95.4) compared with scores of girls with diabetes (M=109.5) and controls and lower Perceptual Organization scores (109.0) compared with scores of control boys (114.3). Children with diabetes experienced more learning difficulties (24%) than controls (13%) (p<0.043) and boys had more problems (24%) than girls (12%). More children with diabetes (19%) had remedial or resource room instruction than controls (6%) and boys more than girls. More boys (21%) had repeated a grade than girls (4%) and controls (5%) Parents reported that more children with diabetes (16%) had behavior problems at school than the controls. (5%)

E-72
SAMPLE, DESIGN, & INTERVENTION ACHIEVEMENT
MEASURE OUTCOME
Kaufman (1999) Sample: 55 children with IDDM, 5 to 10 years of age, followed at Children’s Hospital Los Angeles who were primarily English-speaking. Age at diagnosis = 4.5 ± 2.2 yrs; 27 children were <5 yrs old at diabetes onset. No other diseases 15 age-matched siblings Diabetes Measure: Mean HbA1c level for the preceding year prior to entry into the study, Blood glucose levels, and logbook records for the previous year, Lifetime history of severe hypoglycemia Study Design: case-control
Woodcock-Johnson Test of Cognitive Ability Woodcock-Johnson Test of Achievement (broad reading , mathematics, written language, and knowledge overall skills); Beery Developmental Test of Visual Motor Integration; Finger Tapping and Grooved Pegboard (fine motor speed and coordination); Verbal Selective Reminding (sustained attention and the storage and retrieval of verbal information)
Overall neurocognitive scores of children with diabetes were within normal range. Age at diagnosis was negatively correlated with visual-perceptual measures (analysis-synthesis: p<.004) and specific measures of memory (verbal selective reminding retrieval: p<.04; numbers reversed: p<.0004) and positively correlated with mean test scores (finger tapping: p<.006; memory for words: p<.013). No relationship with verbal comprehension, broad cognition and academic achievement HbA1c or metabolic control was negatively associated with: two measures of memory (long-term memory p<0.04, memory for names p<0.03) and some of academic achievement (reading p<0.019, mathematics p<0.014, written languages p<0.017, basic academic skills p<0.006. Duration of diabetes did not correlate with neurocognitive results. Number of events with blood glucose less than 70 was positively associated with: Memory/Attention: Visual-auditory Learning (p<0.006); Long-term memory (p<0.004); Memory for names (p<0.04) Verbal Comprehension: Picture Vocabulary (p<0.03) Academic Achievement: Reading (p<0.04); Passage Comprehension (p<0.018) Knowledge (p<0.02); Science (p<0.05); Humanities (p<0.03) Patients with 10 or more hypoglycemic events/mo compared to subjects with fewer than 10 events/mo, had a significant difference in three measures of memory, verbal comprehension, and broad cognition on two tests of academic achievement (reading and comprehension). Patients with a history of seizures scored statistically lower on two measures of memory (short-term memory, p<0.03; memory for words, p<0.03) than those without a history.
Kovacs (1992) Sample: 95 children, 8 to 13 years of age with newly diagnosed IDDM and their parents. Admitted to the Pediatric Endocrinology inpatient unit of the Children’s Hospital of Pittsburgh (CHP) at study entry. No mental retardation and systemic diseases. 94% White, 6% Black; 45 girls and 42 boys Results based on 87 children
Yearly grade point averages GPA computed from school report cards; Number of days absent obtained from report cards or school records
Initial result show children with higher SES, White, boys performed better that respectively lower SES, Black, and girls, in vocabulary and nonvocabulary tests Over time, verbal performance and school grades declined, whereas nonverbal intellectual performance improved slightly. Vocabulary scores declined (coefficient = -0.471, p<.0005) while Block design score increased over time (coeff. = 0.376, p<.0005.

E-73
SAMPLE, DESIGN, & INTERVENTION ACHIEVEMENT
MEASURE OUTCOME
Follow-up ranged: for 56.3% for 6 yrs, 28.7% for 5 yrs and 14.9% for 3 yrs or less. Follow-up as the same like diabetes duration. Diabetes Measures: Duration of IDDM, metabolic control, and rehospitalization Covariates: SES, Gender, Race age-at onset, depression and anxiety scores Study Design: prospective cohort study over 6 years
The Vocabulary and the Block Design tests of the WISC-R The Children’s Depression Inventory and Revised Children Manifest Anxiety Scale
Degree of metabolic control did not seem to have any effect on the results. With increasing duration of IDDM, grades slightly declined (coefficient = -0.082, p = .005), more so for non-White children. Absenteeism was negatively related to GPA (coefficient= -.218, p<.0005), more so for girls than boys and for non-White children. Higher WISC-R Vocabulary scores were consistently associated with better grades (coefficient= .090, p<.0005).
McCarthy (2003)
Sample: 244 children followed for IDDM at five clinics in a rural Midwestern state, ages 8 to 18 years, who had been diagnosed with diabetes for at least 1 year. They had no other health conditions. 113 boys, 114 girls. Diabetes onset age = 8.3±3.7 yrs old . Mean duration = 7.1±3.9yrs. Middle/High SES 60% response rate. Controlled for SES Diabetes Measures: Metabolic control (mean HbA1c values for current year), number of hospitalizations, and age at onset of diabetes (All obtained from medical charts) Study Design: Cross-sectional
Grade point averages (GPA); Math, Reading, and Core Scores on the Iowa Tests of Basic Skills (grades 3 to 8) or the Iowa Tests of Educational Development (high school). Parent information on school data; Pediatric Behavioral Scale (PBS-50d)
Age at onset did not correlate with academic scores or with absences. Children with hospitalizations due to hyperglycemia and hypoglycemia performed worse in math and core total respectively than those with no hospitalization. Children in the poor control group (HbA1c>10%) performed significantly worse than those in the good-control group (HbA1c<8%) on reading, core total, and GPA and than the average control group (HbA1c = 8% to 10%) on reading and GPA. Absences did not show any impact on academic results (<10 days /year versus >10days/year. Socioeconomic status and parent ratings of behavior problems were significantly correlated with academic achievement. All PBS-50d correlated with GPA (p<.05) The relationships between academic achievement and HbA1c did not show an inverse U-shaped relationship as was hypothesized (R2 = 0.03, P<0.06).
McCarthy (2002)
Sample: 244 children with IDDM from 5 pediatric diabetes clinics in a primarily rural Midwestern state. 8-18 yrs old. No other chronic conditions. 110 siblings control group within 4 years of age of the child with diabetes. 209 anonymous matched classmate control group on age, gender and ITBS scores All groups similar on age, SES and current grade
School Data (Number of days absent, school years repeated, and grade point averages for reading, language and math; Math, Reading, and Core Scores on the Iowa Tests of Basic Skills (ITBS) (grades 3
Current academic performance on the ITBS/ITED did not show lower performance by children with diabetes; in fact, children with diabetes performed statistically better than their siblings on math (mean: 115.0 vs. 111.1) and core total scores (mean: 113.9 vs. 110.5) and better than their matched classmates on reading (mean: 108.9 vs. 106.8). Poorer academic performance tended to occur in children with poorer diabetic control.

E-74
SAMPLE, DESIGN, & INTERVENTION ACHIEVEMENT
MEASURE OUTCOME
Diabetes measures: age at onset, number of hospitalizations, diabetic control (HbA1c) Study Design: Case-control
to 8) or the Iowa Tests of Educational Development (ITED) (high school) Parent questionnaire and Pediatric behavioral scale (PBS-50d)
Children with diabetes had significantly more school absences (mean = 7.3 per year) than their siblings (M = 5.3) and more behavioral problems on items: compliance (p<.01), mood variability (p<.01), fatigue (p<.01), but not learning (p<.09). They did not differ with their siblings and matched controls in GPA, repeated grades or educational support.
Puczynski (1990)
Sample: 24 out of 47 IDDM children , age = 7-15 yrs From the American Diabetes Association summer camp in West Virginia. Info taken from parents for age of the onset, duration, seizure episodes, use of medication and other medical problems. Groups similar in age at onset and duration No medication use other than insulin, no other diseases, no seizures. Sample from low SES Experimental group =14 – blood glucose (bG) ≤60.g/dl, and Euglycemic group =10 children Diabetes measures: blood glucose Study Design: Cross-sectional
Halstead-Reitan neuropsychological test battery for children, WISC-R, and Klove-Matthews Motor steadiness Battery Interview to the parents
Experimental group: After the mild hypoglycemic episode (MHE) no differences were found in scores between children with bG≤40 mg/dl and bG≥40 ml/dl Children with 2 or more symptoms during MHE and those with early onset spend more time in completing the dominant and non dominant name writing test The experimental group scored lower in 5 of 12 measures vs. comparative group (in tap number right, maze4 time right, maze error right, digit forward and digit backward.
Reich (1990)
Sample: 24 children with diabetes recruited from 56 children, ages 6-to-14 years, who were attending a 2 week residential camp sponsored by the American Diabetes Association (10 children who were euglycemic at the time of entry to camp and later experienced a hypoglycemic episode were part of the Baseline Group; 14 children who were not euglycemic at the time of entry and later experienced a mild hypoglycemic episode within the parameters of the study were part of the Experimental Group); 14 Controls Diabetes Measures: Blood glucose levels; Study Design: cross-sectional with repetitive measurements.
Finger Oscillation Test/Finger Tapping Test, Trail Making Test, Parts A and B, and the Name Writing Test (taken from the Halstead-Reitan Neuropsychological Test Battery for Children); Wechsler Intelligence Scale for Children-Revised; Klove-Matthews Motor
On the first scores, the Experimental Group performance was lower on: • Finger Tapping Test: Right, F(2,34) = 6.22, p <.05; • Klove-Matthews Motor Steadiness Battery: Maze Test-Errors-Right, F(2,35) = 4.37, p=<.020 and Maze Test-Time Right, F(2,35) = 6.81, p=<.003; • And on WISC-R Digit Span: Total, F(2,35) = 5.55, p=<.008.
Additionally, the Baseline Group performed worse than the Control Group on the Name Writing Task: Right Hand, F(2,34) = 4.22, p=<.023. Between Trials 1 and 2 the Experimental Group displayed greater performance gains on the: • Klove-Matthews Motor Steadiness Battery: Maze Test – Time-Right, F(2,31) = 4.10, p=<.026 than did the Baseline or Control Groups. •WISC-R Digit Span: Forward, F(2,35)= 3.43, p=<0.44 than the Control

E-75
SAMPLE, DESIGN, & INTERVENTION ACHIEVEMENT
MEASURE OUTCOME
Steadiness Battery Group •on the Trail Making Task: Part A, F(2,35) = 3.72, p=<.034, while the Baseline Group displayed a performance decrement On the second scores, Neuman-Keuls analyses demonstrated that the Experimental Group again scored significantly lower on several tasks than did the Baseline and Control Groups. There is a significant decrease in performance on neuropsychological tasks by children with diabetes who had recovered from physical symptoms after a mild hypoglycemic episode as compared to children with and without diabetes assessed out of the context of a hypoglycemic episode.
Ryan (1985)
Sample: 33 children with IDDM, age 12 to 19 yrs from the Diabetes Clinic at the Children’s Hospital of Pittsburgh; all White Controls matched on age and education level, 83% were siblings Diabetes Measure: Glycosylated hemoglobin Study Design: Case-control
School Attendance: Parent Questionnaire Visuomotor tests: Trail Making, Digit Symbol Substitution, Grooved Pegboard Intelligence: Wechsler Adult Intelligence Scale or Wechsler Intelligence Scale for Children (Revised) Achievement Tests: Wide Range Achievement Test (Reading, Spelling, Math)
Teenagers with diabetes missed significantly more school each year than did control subjects. This difference is due to a greater number of days missed because of illness. Children with diabetes spent an average of 2.2 days in hospital during the preceding 2 years compared to 0 days for the controls. Those with diabetes earned significantly lower scores than those without diabetes on the three measures of school achievement, and performed significantly more slowly on the three visuomotor tasks. Scores on the 3 school achievement tests were best predicted by the School Absences variable, which accounted for between 5.7% and 17.9% of the total variance.
Ryan (1985) Sample: 125 IDDM adolescents, in treatment at the Diabetes Clinic at Children’s Hospital of Pittsburg , age 10 and 19 yrs, all White. Diabetes duration for at least 3 years; 83 controls (80% of them siblings) demographically similar in age, education, sex ratio, handedness and parent’s level of education of children with diabetes
Wechsler Intelligence Scale for Children (Information, Comprehension, Similarities, Vocabulary, and Picture Completion) or WAIS); Boston Embedded
Subjects in the early onset group (diabetes onset before 5) scored significantly worse than those in the late onset group (diagnosed after age 5) in respect to: Intelligence (vocabulary (p<0.05)); Visuospatial Ability (Block Design, Embedded Figures, Road Map); Learning and Memory (Delayed Visual Recall, Immediate Visual Recall, Incidental Memory); Attention and School Achievement (Reading); Mental and Motor Speed (Grooved Pegboard Dominant Hand, Digit Symbol). Significant differences between subjects in the EO group and control
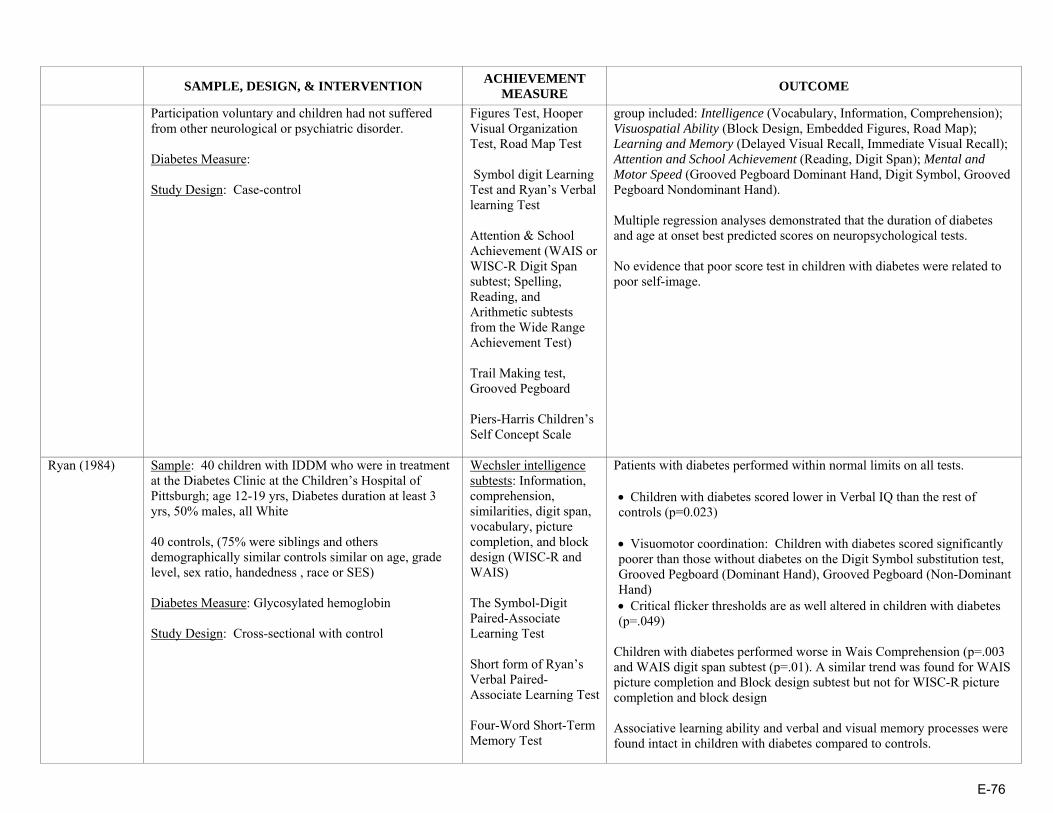
E-76
SAMPLE, DESIGN, & INTERVENTION ACHIEVEMENT
MEASURE OUTCOME
Participation voluntary and children had not suffered from other neurological or psychiatric disorder. Diabetes Measure: Study Design: Case-control
Figures Test, Hooper Visual Organization Test, Road Map Test Symbol digit Learning Test and Ryan’s Verbal learning Test Attention & School Achievement (WAIS or WISC-R Digit Span subtest; Spelling, Reading, and Arithmetic subtests from the Wide Range Achievement Test) Trail Making test, Grooved Pegboard Piers-Harris Children’s Self Concept Scale
group included: Intelligence (Vocabulary, Information, Comprehension); Visuospatial Ability (Block Design, Embedded Figures, Road Map); Learning and Memory (Delayed Visual Recall, Immediate Visual Recall); Attention and School Achievement (Reading, Digit Span); Mental and Motor Speed (Grooved Pegboard Dominant Hand, Digit Symbol, Grooved Pegboard Nondominant Hand). Multiple regression analyses demonstrated that the duration of diabetes and age at onset best predicted scores on neuropsychological tests. No evidence that poor score test in children with diabetes were related to poor self-image.
Ryan (1984)
Sample: 40 children with IDDM who were in treatment at the Diabetes Clinic at the Children’s Hospital of Pittsburgh; age 12-19 yrs, Diabetes duration at least 3 yrs, 50% males, all White 40 controls, (75% were siblings and others demographically similar controls similar on age, grade level, sex ratio, handedness , race or SES) Diabetes Measure: Glycosylated hemoglobin Study Design: Cross-sectional with control
Wechsler intelligence subtests: Information, comprehension, similarities, digit span, vocabulary, picture completion, and block design (WISC-R and WAIS) The Symbol-Digit Paired-Associate Learning Test Short form of Ryan’s Verbal Paired-Associate Learning Test Four-Word Short-Term Memory Test
Patients with diabetes performed within normal limits on all tests. • Children with diabetes scored lower in Verbal IQ than the rest of controls (p=0.023)
• Visuomotor coordination: Children with diabetes scored significantly poorer than those without diabetes on the Digit Symbol substitution test, Grooved Pegboard (Dominant Hand), Grooved Pegboard (Non-Dominant Hand) • Critical flicker thresholds are as well altered in children with diabetes (p=.049)
Children with diabetes performed worse in Wais Comprehension (p=.003 and WAIS digit span subtest (p=.01). A similar trend was found for WAIS picture completion and Block design subtest but not for WISC-R picture completion and block design Associative learning ability and verbal and visual memory processes were found intact in children with diabetes compared to controls.

E-77
SAMPLE, DESIGN, & INTERVENTION ACHIEVEMENT
MEASURE OUTCOME
Boston Embedded Figures Test, Hooper Visual Organization Test, Road Map Test Piers-Harris Children’s Self Concept Scale
No deficits on visuospatial test, no left-right confusion, performed well in Road Map test. Neuropsychological test score did not correlate neither with duration of disease, nor with metabolic control.
Weil (1964)
Sample: 39 children with diabetes & 26 siblings without diabetes who had previous intelligence testing in the Pediatric Diabetes Clinic of the University Hospitals of Cleveland Study Design: Case-control
California Achievement Tests in Reading & Arithmetic – administered in small groups homogenous to age Stanford-Binet Intelligence Scale (Form M) – administered individually in a previous study
Children with diabetes performed no better or no worse than their siblings, each evaluated with regard to their own mental age. Age at onset played no significant role in the academic performance of children with diabetes. Duration of disease did not affect the sibling with diabetes differences in any specific manner.
Yu (2000) Sample: 66 IDDM children, mean age=12 yrs, Early onset diabetes (<5) EOD = 31 and LOD = 35. Ethnicity = White and no other diseases 36 healthy controls matched in age and similar in gender, race, SES, family status Diabetes Measure: Blood glucose levels Study Design: Case-control
Vocabulary and Block Designs subtests of the WISC-III Peabody Individual Achievement Test-Revised (Reading comprehension, Spelling, and Mathematics) Parent interview that inquired about “academic and school information”
About 17% of children with diabetes had repeated a grade; none of the comparison children had been retained. (p<.01) Children with diabetes sores lower in Vocabulary (p<.05) than the controls. The LOD group was significantly lower than the comparison group on Vocabulary (p<.05), with means of 10.5 and 12.4 respectively. Children with diabetes received lower grades in English and language arts, F(1,85) = 5.20, p<.05. The effect remained significant when the children with diabetes were divided into early- and late-onset. Children with diabetes missed days from school than controls (10.6 days/year and to 2.3 days/year respectively, F(1,90) = 6.77, p<.05. The EOD group had more absences (mean = 11.92) than the LOD group (mean = 2.23). Significantly fewer parents of children with diabetes were satisfied with their child’s school performance than were parents of controls, χ2(1, N=97) = 4.81, p<.05. Poorer management of diabetes was associated with poorer attendance
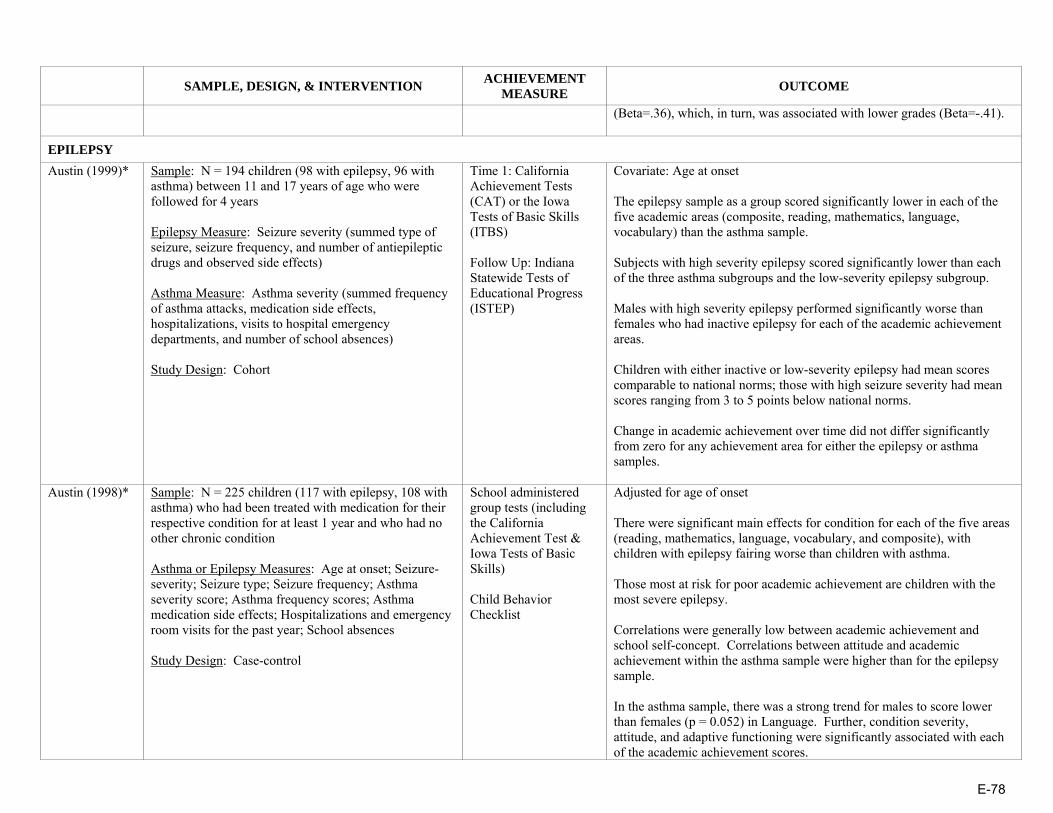
E-78
SAMPLE, DESIGN, & INTERVENTION ACHIEVEMENT
MEASURE OUTCOME
(Beta=.36), which, in turn, was associated with lower grades (Beta=-.41).
EPILEPSY Austin (1999)* Sample: N = 194 children (98 with epilepsy, 96 with
asthma) between 11 and 17 years of age who were followed for 4 years Epilepsy Measure: Seizure severity (summed type of seizure, seizure frequency, and number of antiepileptic drugs and observed side effects) Asthma Measure: Asthma severity (summed frequency of asthma attacks, medication side effects, hospitalizations, visits to hospital emergency departments, and number of school absences) Study Design: Cohort
Time 1: California Achievement Tests (CAT) or the Iowa Tests of Basic Skills (ITBS) Follow Up: Indiana Statewide Tests of Educational Progress (ISTEP)
Covariate: Age at onset The epilepsy sample as a group scored significantly lower in each of the five academic areas (composite, reading, mathematics, language, vocabulary) than the asthma sample. Subjects with high severity epilepsy scored significantly lower than each of the three asthma subgroups and the low-severity epilepsy subgroup. Males with high severity epilepsy performed significantly worse than females who had inactive epilepsy for each of the academic achievement areas. Children with either inactive or low-severity epilepsy had mean scores comparable to national norms; those with high seizure severity had mean scores ranging from 3 to 5 points below national norms. Change in academic achievement over time did not differ significantly from zero for any achievement area for either the epilepsy or asthma samples.
Austin (1998)* Sample: N = 225 children (117 with epilepsy, 108 with asthma) who had been treated with medication for their respective condition for at least 1 year and who had no other chronic condition Asthma or Epilepsy Measures: Age at onset; Seizure-severity; Seizure type; Seizure frequency; Asthma severity score; Asthma frequency scores; Asthma medication side effects; Hospitalizations and emergency room visits for the past year; School absences Study Design: Case-control
School administered group tests (including the California Achievement Test & Iowa Tests of Basic Skills) Child Behavior Checklist
Adjusted for age of onset There were significant main effects for condition for each of the five areas (reading, mathematics, language, vocabulary, and composite), with children with epilepsy fairing worse than children with asthma. Those most at risk for poor academic achievement are children with the most severe epilepsy. Correlations were generally low between academic achievement and school self-concept. Correlations between attitude and academic achievement within the asthma sample were higher than for the epilepsy sample. In the asthma sample, there was a strong trend for males to score lower than females (p = 0.052) in Language. Further, condition severity, attitude, and adaptive functioning were significantly associated with each of the academic achievement scores.
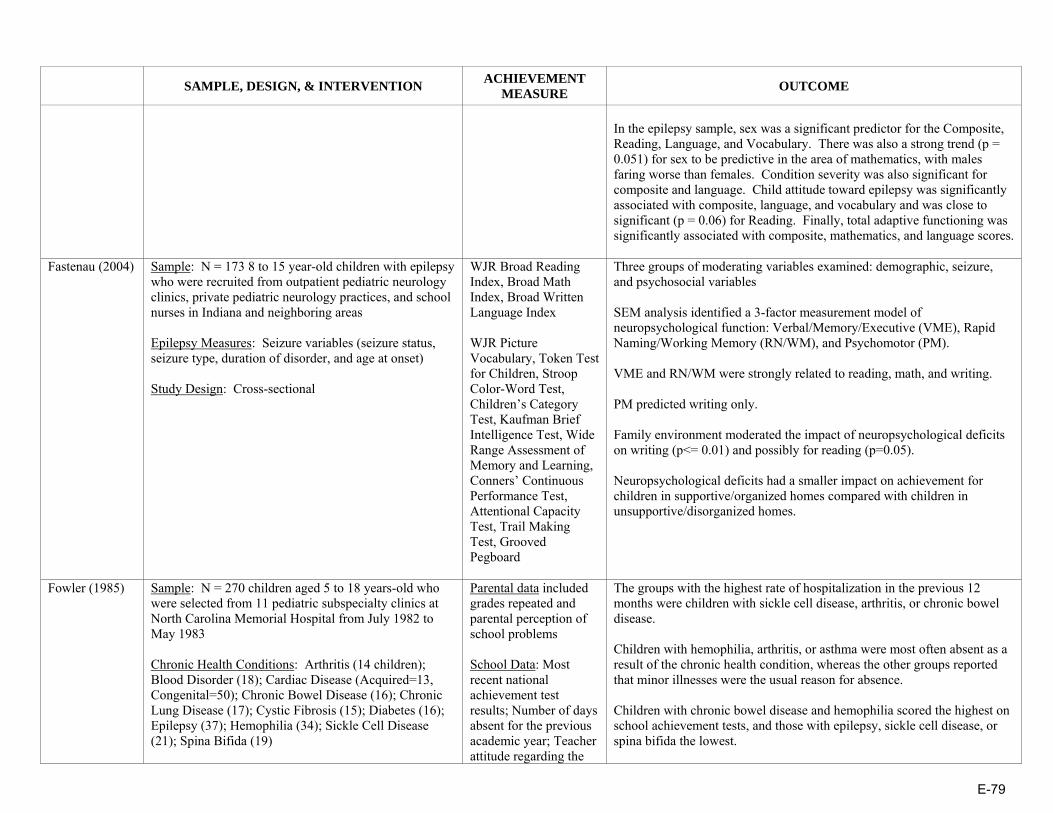
E-79
SAMPLE, DESIGN, & INTERVENTION ACHIEVEMENT
MEASURE OUTCOME
In the epilepsy sample, sex was a significant predictor for the Composite, Reading, Language, and Vocabulary. There was also a strong trend (p = 0.051) for sex to be predictive in the area of mathematics, with males faring worse than females. Condition severity was also significant for composite and language. Child attitude toward epilepsy was significantly associated with composite, language, and vocabulary and was close to significant (p = 0.06) for Reading. Finally, total adaptive functioning was significantly associated with composite, mathematics, and language scores.
Fastenau (2004) Sample: N = 173 8 to 15 year-old children with epilepsy who were recruited from outpatient pediatric neurology clinics, private pediatric neurology practices, and school nurses in Indiana and neighboring areas Epilepsy Measures: Seizure variables (seizure status, seizure type, duration of disorder, and age at onset) Study Design: Cross-sectional
WJR Broad Reading Index, Broad Math Index, Broad Written Language Index WJR Picture Vocabulary, Token Test for Children, Stroop Color-Word Test, Children’s Category Test, Kaufman Brief Intelligence Test, Wide Range Assessment of Memory and Learning, Conners’ Continuous Performance Test, Attentional Capacity Test, Trail Making Test, Grooved Pegboard
Three groups of moderating variables examined: demographic, seizure, and psychosocial variables SEM analysis identified a 3-factor measurement model of neuropsychological function: Verbal/Memory/Executive (VME), Rapid Naming/Working Memory (RN/WM), and Psychomotor (PM). VME and RN/WM were strongly related to reading, math, and writing. PM predicted writing only. Family environment moderated the impact of neuropsychological deficits on writing (p<= 0.01) and possibly for reading (p=0.05). Neuropsychological deficits had a smaller impact on achievement for children in supportive/organized homes compared with children in unsupportive/disorganized homes.
Fowler (1985) Sample: N = 270 children aged 5 to 18 years-old who were selected from 11 pediatric subspecialty clinics at North Carolina Memorial Hospital from July 1982 to May 1983 Chronic Health Conditions: Arthritis (14 children); Blood Disorder (18); Cardiac Disease (Acquired=13, Congenital=50); Chronic Bowel Disease (16); Chronic Lung Disease (17); Cystic Fibrosis (15); Diabetes (16); Epilepsy (37); Hemophilia (34); Sickle Cell Disease (21); Spina Bifida (19)
Parental data included grades repeated and parental perception of school problems School Data: Most recent national achievement test results; Number of days absent for the previous academic year; Teacher attitude regarding the
The groups with the highest rate of hospitalization in the previous 12 months were children with sickle cell disease, arthritis, or chronic bowel disease. Children with hemophilia, arthritis, or asthma were most often absent as a result of the chronic health condition, whereas the other groups reported that minor illnesses were the usual reason for absence. Children with chronic bowel disease and hemophilia scored the highest on school achievement tests, and those with epilepsy, sickle cell disease, or spina bifida the lowest.

E-80
SAMPLE, DESIGN, & INTERVENTION ACHIEVEMENT
MEASURE OUTCOME
Study Design: Cross-sectional impact of the health condition on the child’s school functioning
Three groups that appeared at particular risk for academic difficulties: children with epilepsy, sickle cell disease, or spina bifida, were the most likely to receive special services, repeat a grade, or score more poorly on achievement test, compared with other clinic groups. The variable log of days absent was related to sex, number of clinic visits, physician rating of activity limitation, and acquired cardiac disease or sickle cell disease conditions (R2 = 0.17, p = 0.001). National achievement scores were mainly related to SES factors and arthritis, cystic fibrosis, diabetes, epilepsy, or hemophilia chronic health conditions (R2 = 0.44, p = 0.001), but were unrelated to school absence.
Huberty (2000)*
Sample: N = 227 children (117 with epilepsy, 110 with asthma) drawn from four outpatient clinics in two large Midwestern medical facilities and from the private practices of neurologists and pediatricians who were followed for 4 years Epilepsy Measure: Severity Score (sum of type of seizure, frequency of seizures, and the number of antiepileptic medications and the presence of side effects) Asthma Measure: Severity Score (sum of yearly frequency of episodes, side effects of medication, hospitalizations for asthma, emergency room visits for asthma attacks, and school absences) Study Design: Longitudinal
Teacher Report Form (TRF) of the Child Behavior Checklist (academic performance, working hard, happy, behaving appropriately, and learning) Piers-Harris Self-Concept Scale for Children
Controlled for baseline TRF score and age at onset On average, the asthma sample improved more than the epilepsy sample for each of the TRF scores, with the exception of the change in Behaving Appropriately. At follow-up, the epilepsy sample was performing at the 28th percentile on Academic performance and at the 39th percentile on Total Adaptive Functioning. The asthma sample was performing slightly above the population mean on both of these TRF scales. Among the epilepsy sample, there was no effect of gender for any of the change scores. Change in condition severity was significantly related to change in mean Academic performance. Among the asthma sample, change in condition severity was related to changes in Academic performance, happy, learning, and total adaptive functioning.
Mitchell (1991) Sample: N = 78 children with epilepsy between 5 and 13 years-old who visited the Children’s Hospital Los Angeles Neurology Service Epilepsy Measures: Seizure severity; Duration of seizure disorder; Total medications Study Design: Cross-sectional
Cognitive Measures: •Children <7 years-old: McCarthy Scales of Children’s Abilities (General Cognitive Index—GCI) •Children >7 years-old: Wechsler Intelligence Scale for Children-Revised (WISC-R) •Spanish-speaking children: Escela
In the group as a whole, academic achievement was poor, if not adjusted for IQ. For example, 55% were below the 25th percentile and 40% were below the 10th percentile for reading comprehension. Median IQ was 95, with a range of 80 to 114. After adjusting expected achievement for IQ, 16% to 50% of the subjects were underachieving for each subscale of the PIAT, using criteria of a ½ standard deviation difference between the PIAT and IQ. Achievement versus underachievement in reading recognition, reading comprehension, general knowledge, and spelling was unrelated to seizure

E-81
SAMPLE, DESIGN, & INTERVENTION ACHIEVEMENT
MEASURE OUTCOME
Inteligencia por Ninos Wechsler (EINW) Academic Achievement: Peabody Individual Achievement Test (PIAT) (Subtests: Reading, Reading Comprehension, Spelling, Mathematics, & General Knowledge) Behavior: Parent’s perception of the child’s attention, activity level, conduct, coordination, and sleep problems
and medication variables. Underachievement in mathematics was slightly more frequent in the group with longer duration of seizure disorder, but this barely reached statistical significance (p = .05). Major determinants of achievement included subscales of the HOME scale, age (older children more likely to be underachieving)), and parental education. An equal proportion of newly diagnosed and/or untreated subjects were underachieving compared to those with longstanding epilepsy and anticonvulsant drug treatment.
Seidenberg (1986)
Sample: N = 122 children with epilepsy who were routinely referred for neuropsychological evaluations at the Behavioral Studies Section of the Epilepsy Center of the University of Virginia Medical Center and who were between 7 and 15 years of age Study Design: Cross-sectional
Intelligence: Wechsler Intelligence Scale for Children-Revised (WISC-R) Academic Achievement: subtests of the Wide Range Achievement Test (WRAT) including measures of word recognition, spelling, and arithmetic; reading comprehension subtest from the Peabody Individual Achievement Test
As a group, the children made less academic progress than expected for their IQ level (difference scores) and age level (percentile scores). There was a significant effect for academic area (F = 20.04, df = 3, p<.001) with deficiencies most pronounced for arithmetic and spelling, followed by reading comprehension and word recognition. There was no main effect for sex. There was a substantial percentage of children who were experiencing significant academic deficiencies (i.e., academic difference scores at least 1 SD below expectations based on their IQ level) in the four academic areas. Academic achievement levels were examined with multiple-regression using age, sex, seizure type, age of seizure onset, lifetime seizure frequency total, and number of anticonvulsant medications: Word recognition: Multiple correlation co-efficient =.24; All variables accounted for a statistically nonsignificant 6% of the variance. None of the individual predictors were significant. Spelling: Multiple correlation co-efficient =.33; All variables accounted for an 11% of the variance. Age was the most highly predictive variable, with older children performing more poorly. Reading comprehension: Multiple correlation co-efficient =.28; All
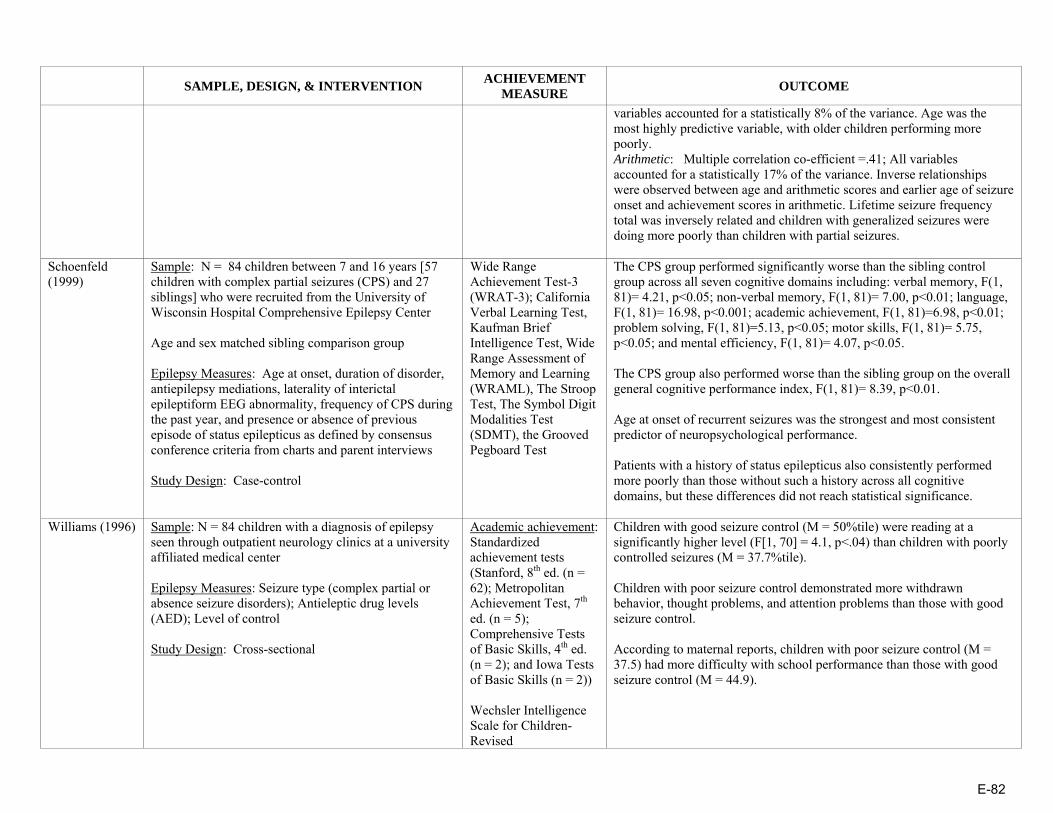
E-82
SAMPLE, DESIGN, & INTERVENTION ACHIEVEMENT
MEASURE OUTCOME
variables accounted for a statistically 8% of the variance. Age was the most highly predictive variable, with older children performing more poorly. Arithmetic: Multiple correlation co-efficient =.41; All variables accounted for a statistically 17% of the variance. Inverse relationships were observed between age and arithmetic scores and earlier age of seizure onset and achievement scores in arithmetic. Lifetime seizure frequency total was inversely related and children with generalized seizures were doing more poorly than children with partial seizures.
Schoenfeld (1999)
Sample: N = 84 children between 7 and 16 years [57 children with complex partial seizures (CPS) and 27 siblings] who were recruited from the University of Wisconsin Hospital Comprehensive Epilepsy Center Age and sex matched sibling comparison group Epilepsy Measures: Age at onset, duration of disorder, antiepilepsy mediations, laterality of interictal epileptiform EEG abnormality, frequency of CPS during the past year, and presence or absence of previous episode of status epilepticus as defined by consensus conference criteria from charts and parent interviews Study Design: Case-control
Wide Range Achievement Test-3 (WRAT-3); California Verbal Learning Test, Kaufman Brief Intelligence Test, Wide Range Assessment of Memory and Learning (WRAML), The Stroop Test, The Symbol Digit Modalities Test (SDMT), the Grooved Pegboard Test
The CPS group performed significantly worse than the sibling control group across all seven cognitive domains including: verbal memory, F(1, 81)= 4.21, p<0.05; non-verbal memory, F(1, 81)= 7.00, p<0.01; language, F(1, 81)= 16.98, p<0.001; academic achievement, F(1, 81)=6.98, p<0.01; problem solving, F(1, 81)=5.13, p<0.05; motor skills, F(1, 81)= 5.75, p<0.05; and mental efficiency, F(1, 81)= 4.07, p<0.05. The CPS group also performed worse than the sibling group on the overall general cognitive performance index, F(1, 81)= 8.39, p<0.01. Age at onset of recurrent seizures was the strongest and most consistent predictor of neuropsychological performance. Patients with a history of status epilepticus also consistently performed more poorly than those without such a history across all cognitive domains, but these differences did not reach statistical significance.
Williams (1996) Sample: N = 84 children with a diagnosis of epilepsy seen through outpatient neurology clinics at a university affiliated medical center Epilepsy Measures: Seizure type (complex partial or absence seizure disorders); Antieleptic drug levels (AED); Level of control Study Design: Cross-sectional
Academic achievement: Standardized achievement tests (Stanford, 8th ed. (n = 62); Metropolitan Achievement Test, 7th ed. (n = 5); Comprehensive Tests of Basic Skills, 4th ed. (n = 2); and Iowa Tests of Basic Skills (n = 2)) Wechsler Intelligence Scale for Children-Revised
Children with good seizure control (M = 50%tile) were reading at a significantly higher level (F[1, 70] = 4.1, p<.04) than children with poorly controlled seizures (M = 37.7%tile). Children with poor seizure control demonstrated more withdrawn behavior, thought problems, and attention problems than those with good seizure control. According to maternal reports, children with poor seizure control (M = 37.5) had more difficulty with school performance than those with good seizure control (M = 44.9).
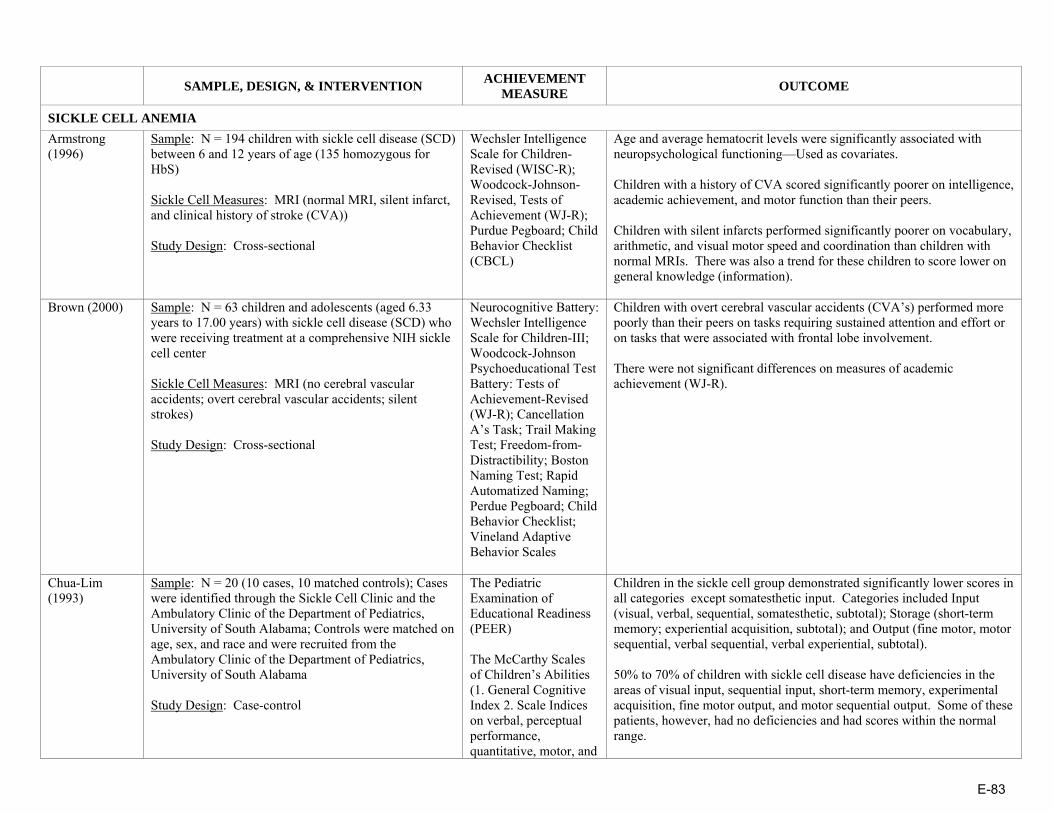
E-83
SAMPLE, DESIGN, & INTERVENTION ACHIEVEMENT
MEASURE OUTCOME
SICKLE CELL ANEMIA Armstrong (1996)
Sample: N = 194 children with sickle cell disease (SCD) between 6 and 12 years of age (135 homozygous for HbS) Sickle Cell Measures: MRI (normal MRI, silent infarct, and clinical history of stroke (CVA)) Study Design: Cross-sectional
Wechsler Intelligence Scale for Children-Revised (WISC-R); Woodcock-Johnson-Revised, Tests of Achievement (WJ-R); Purdue Pegboard; Child Behavior Checklist (CBCL)
Age and average hematocrit levels were significantly associated with neuropsychological functioning—Used as covariates. Children with a history of CVA scored significantly poorer on intelligence, academic achievement, and motor function than their peers. Children with silent infarcts performed significantly poorer on vocabulary, arithmetic, and visual motor speed and coordination than children with normal MRIs. There was also a trend for these children to score lower on general knowledge (information).
Brown (2000) Sample: N = 63 children and adolescents (aged 6.33 years to 17.00 years) with sickle cell disease (SCD) who were receiving treatment at a comprehensive NIH sickle cell center Sickle Cell Measures: MRI (no cerebral vascular accidents; overt cerebral vascular accidents; silent strokes) Study Design: Cross-sectional
Neurocognitive Battery: Wechsler Intelligence Scale for Children-III; Woodcock-Johnson Psychoeducational Test Battery: Tests of Achievement-Revised (WJ-R); Cancellation A’s Task; Trail Making Test; Freedom-from-Distractibility; Boston Naming Test; Rapid Automatized Naming; Perdue Pegboard; Child Behavior Checklist; Vineland Adaptive Behavior Scales
Children with overt cerebral vascular accidents (CVA’s) performed more poorly than their peers on tasks requiring sustained attention and effort or on tasks that were associated with frontal lobe involvement. There were not significant differences on measures of academic achievement (WJ-R).
Chua-Lim (1993)
Sample: N = 20 (10 cases, 10 matched controls); Cases were identified through the Sickle Cell Clinic and the Ambulatory Clinic of the Department of Pediatrics, University of South Alabama; Controls were matched on age, sex, and race and were recruited from the Ambulatory Clinic of the Department of Pediatrics, University of South Alabama Study Design: Case-control
The Pediatric Examination of Educational Readiness (PEER) The McCarthy Scales of Children’s Abilities (1. General Cognitive Index 2. Scale Indices on verbal, perceptual performance, quantitative, motor, and
Children in the sickle cell group demonstrated significantly lower scores in all categories except somatesthetic input. Categories included Input (visual, verbal, sequential, somatesthetic, subtotal); Storage (short-term memory; experiential acquisition, subtotal); and Output (fine motor, motor sequential, verbal sequential, verbal experiential, subtotal). 50% to 70% of children with sickle cell disease have deficiencies in the areas of visual input, sequential input, short-term memory, experimental acquisition, fine motor output, and motor sequential output. Some of these patients, however, had no deficiencies and had scores within the normal range.
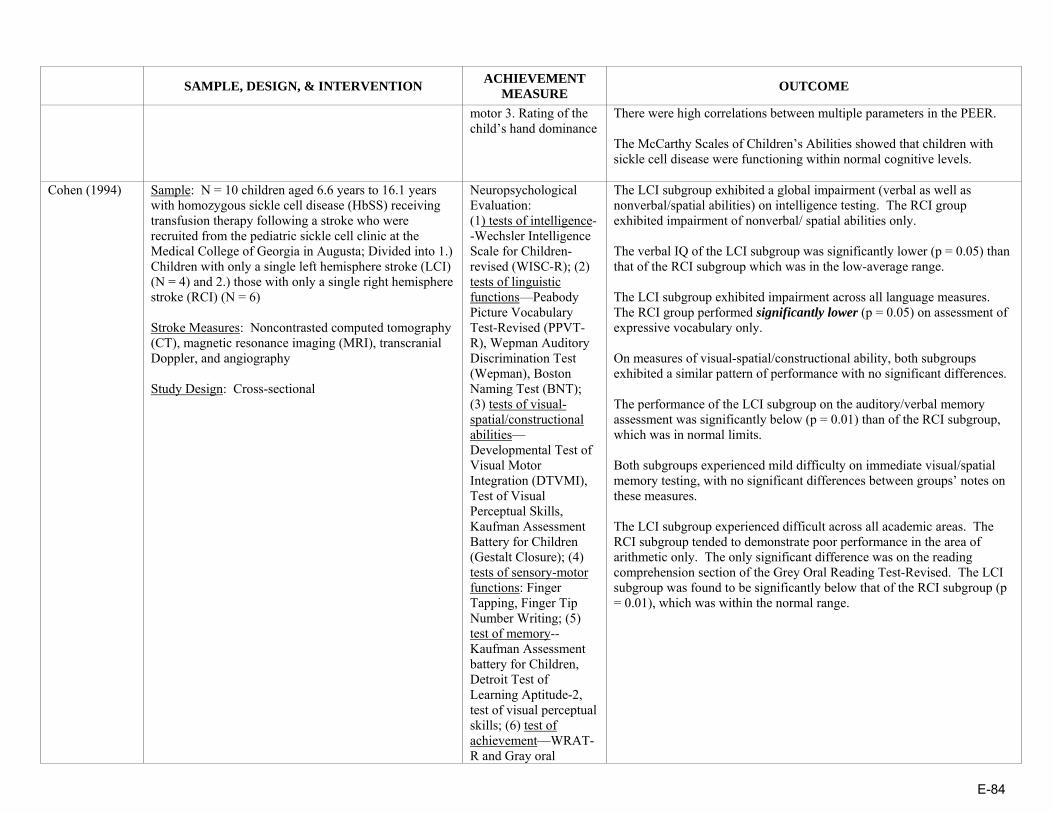
E-84
SAMPLE, DESIGN, & INTERVENTION ACHIEVEMENT
MEASURE OUTCOME
motor 3. Rating of the child’s hand dominance
There were high correlations between multiple parameters in the PEER. The McCarthy Scales of Children’s Abilities showed that children with sickle cell disease were functioning within normal cognitive levels.
Cohen (1994) Sample: N = 10 children aged 6.6 years to 16.1 years with homozygous sickle cell disease (HbSS) receiving transfusion therapy following a stroke who were recruited from the pediatric sickle cell clinic at the Medical College of Georgia in Augusta; Divided into 1.) Children with only a single left hemisphere stroke (LCI) (N = 4) and 2.) those with only a single right hemisphere stroke (RCI) (N = 6) Stroke Measures: Noncontrasted computed tomography (CT), magnetic resonance imaging (MRI), transcranial Doppler, and angiography Study Design: Cross-sectional
Neuropsychological Evaluation: (1) tests of intelligence--Wechsler Intelligence Scale for Children-revised (WISC-R); (2) tests of linguistic functions—Peabody Picture Vocabulary Test-Revised (PPVT-R), Wepman Auditory Discrimination Test (Wepman), Boston Naming Test (BNT); (3) tests of visual-spatial/constructional abilities—Developmental Test of Visual Motor Integration (DTVMI), Test of Visual Perceptual Skills, Kaufman Assessment Battery for Children (Gestalt Closure); (4) tests of sensory-motor functions: Finger Tapping, Finger Tip Number Writing; (5) test of memory-- Kaufman Assessment battery for Children, Detroit Test of Learning Aptitude-2, test of visual perceptual skills; (6) test of achievement—WRAT-R and Gray oral
The LCI subgroup exhibited a global impairment (verbal as well as nonverbal/spatial abilities) on intelligence testing. The RCI group exhibited impairment of nonverbal/ spatial abilities only. The verbal IQ of the LCI subgroup was significantly lower (p = 0.05) than that of the RCI subgroup which was in the low-average range. The LCI subgroup exhibited impairment across all language measures. The RCI group performed significantly lower (p = 0.05) on assessment of expressive vocabulary only. On measures of visual-spatial/constructional ability, both subgroups exhibited a similar pattern of performance with no significant differences. The performance of the LCI subgroup on the auditory/verbal memory assessment was significantly below (p = 0.01) than of the RCI subgroup, which was in normal limits. Both subgroups experienced mild difficulty on immediate visual/spatial memory testing, with no significant differences between groups’ notes on these measures. The LCI subgroup experienced difficult across all academic areas. The RCI subgroup tended to demonstrate poor performance in the area of arithmetic only. The only significant difference was on the reading comprehension section of the Grey Oral Reading Test-Revised. The LCI subgroup was found to be significantly below that of the RCI subgroup (p = 0.01), which was within the normal range.

E-85
SAMPLE, DESIGN, & INTERVENTION ACHIEVEMENT
MEASURE OUTCOME
Reading Test-Revised (GORT-R)
Fowler (1988) Sample: N = 56 (28 school-aged children with hemoglobin SS sickle cell anemia enrolled in the Comprehensive Sickle Cell Program at North Carolina Memorial Hospital (NCMH) between Sept 1984 and Dec 1985 who had no history or overt physical evidence of stroke; 28 controls matched for sex, race, age, and SES recruited from the NCMH Well Child Continuity and Pediatric Walk-in Clinics; All children were Black Sickle Cell Measures: Illness severity Study Design: Case-control
Neuropsychological Evaluation: Wechsler Intelligence Scale for Children-Revised (WISC-R) to test general cognitive, language, visual-motor, and attentional functioning; Developmental Test of Visual-Motor Integration (VMI) to test fine-motor coordination and visual-perceptual organization Visual attention: Kagan Matching Familiar Figures School functioning: WRAT (grade equivalents and standard scores for reading, spelling, and arithmetic; Teacher questionnaire for number of days absent in the previous year, number of grades repeated, special services received, number of grades repeated, and results from the most recent California Achievement Test (CAT)
No significant differences between the children with sickle cell anemia and the well comparison group on the neurologic/neurodevelopmental exam The control children performed significantly better on the WISC-R Coding subset which assesses visual motor skill and speed. Children with sickle cell anemia (N = 22) completed the Matching Familiar Figures Test more quickly than their healthy peers (N = 20), but with less accuracy, performing as a group in the fast/inaccurate (impulsive) performance category. Children with sickle cell anemia: o Averaged 3 ½ years behind expectations based on chronological age on visual motor integration.
o scored significantly lower on the WRAT Reading and Spelling tests than the controls
o Scored at the 38th percentile on the CAT total battery while the controls scored at the 54th percentile
o Were more likely to have repeated a grade (54%) than the controls (43%) although this difference was not statistically significant
o Were more likely to be receiving academic special services (63%) than the controls (22%)
Significant age by illness group interactions were noted in the Wechsler Intelligence Scale for Children-Revised (WISC-R) Digit Span (F = 5.31, p<0.05) and Coding (F = 5.48, p<0.05) scores after considering any effects due to SES. There was also a significant illness group main effect; the younger sickle cell children had higher average scores than either age group of control children, whereas the older sickle cell children had overall much lower scores than any of the controls. Achievement and neuropsychological scores for children with sickle cell anemia were positively related with a number of demographic factors, including increased SES, maternal education, female sex, and younger age of the child. WISC-R Similarities and Information subtests correlated with FACES II Family Cohesion, whereas arithmetic was directly related to Social Support.
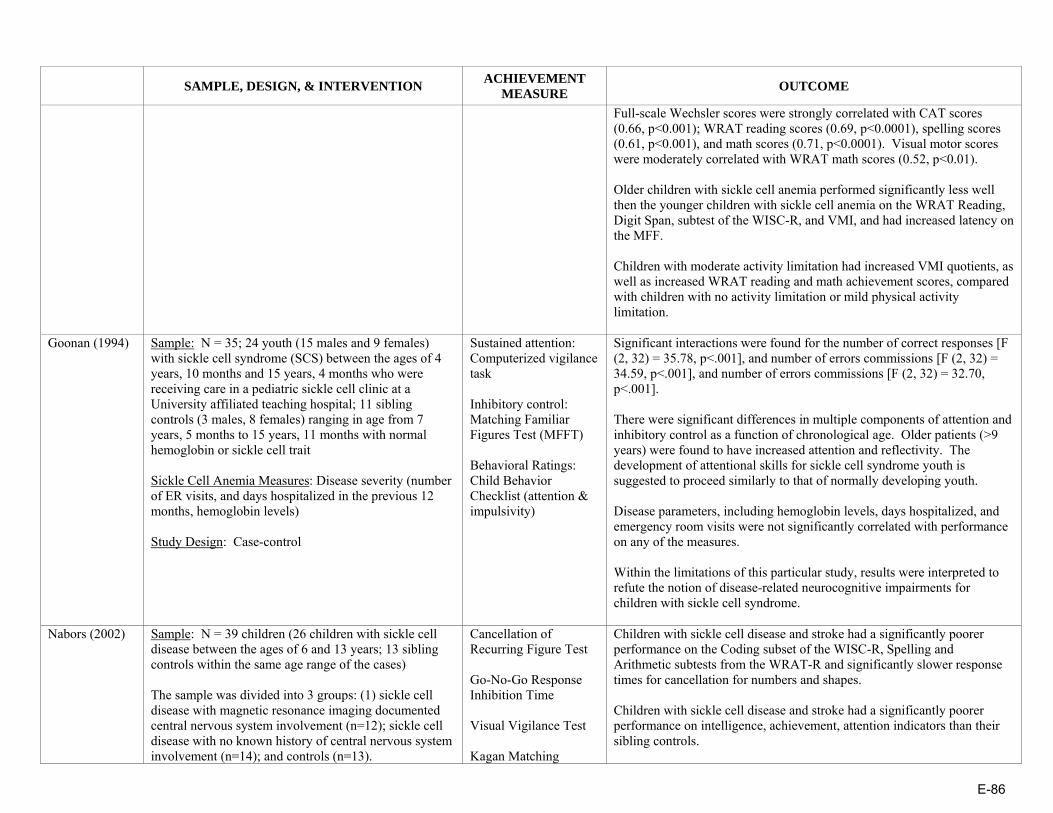
E-86
SAMPLE, DESIGN, & INTERVENTION ACHIEVEMENT
MEASURE OUTCOME
Full-scale Wechsler scores were strongly correlated with CAT scores (0.66, p<0.001); WRAT reading scores (0.69, p<0.0001), spelling scores (0.61, p<0.001), and math scores (0.71, p<0.0001). Visual motor scores were moderately correlated with WRAT math scores (0.52, p<0.01). Older children with sickle cell anemia performed significantly less well then the younger children with sickle cell anemia on the WRAT Reading, Digit Span, subtest of the WISC-R, and VMI, and had increased latency on the MFF. Children with moderate activity limitation had increased VMI quotients, as well as increased WRAT reading and math achievement scores, compared with children with no activity limitation or mild physical activity limitation.
Goonan (1994) Sample: N = 35; 24 youth (15 males and 9 females) with sickle cell syndrome (SCS) between the ages of 4 years, 10 months and 15 years, 4 months who were receiving care in a pediatric sickle cell clinic at a University affiliated teaching hospital; 11 sibling controls (3 males, 8 females) ranging in age from 7 years, 5 months to 15 years, 11 months with normal hemoglobin or sickle cell trait Sickle Cell Anemia Measures: Disease severity (number of ER visits, and days hospitalized in the previous 12 months, hemoglobin levels) Study Design: Case-control
Sustained attention: Computerized vigilance task Inhibitory control: Matching Familiar Figures Test (MFFT) Behavioral Ratings: Child Behavior Checklist (attention & impulsivity)
Significant interactions were found for the number of correct responses [F (2, 32) = 35.78, p<.001], and number of errors commissions [F (2, 32) = 34.59, p<.001], and number of errors commissions [F (2, 32) = 32.70, p<.001]. There were significant differences in multiple components of attention and inhibitory control as a function of chronological age. Older patients (>9 years) were found to have increased attention and reflectivity. The development of attentional skills for sickle cell syndrome youth is suggested to proceed similarly to that of normally developing youth. Disease parameters, including hemoglobin levels, days hospitalized, and emergency room visits were not significantly correlated with performance on any of the measures. Within the limitations of this particular study, results were interpreted to refute the notion of disease-related neurocognitive impairments for children with sickle cell syndrome.
Nabors (2002) Sample: N = 39 children (26 children with sickle cell disease between the ages of 6 and 13 years; 13 sibling controls within the same age range of the cases) The sample was divided into 3 groups: (1) sickle cell disease with magnetic resonance imaging documented central nervous system involvement (n=12); sickle cell disease with no known history of central nervous system involvement (n=14); and controls (n=13).
Cancellation of Recurring Figure Test Go-No-Go Response Inhibition Time Visual Vigilance Test Kagan Matching
Children with sickle cell disease and stroke had a significantly poorer performance on the Coding subset of the WISC-R, Spelling and Arithmetic subtests from the WRAT-R and significantly slower response times for cancellation for numbers and shapes. Children with sickle cell disease and stroke had a significantly poorer performance on intelligence, achievement, attention indicators than their sibling controls.

E-87
SAMPLE, DESIGN, & INTERVENTION ACHIEVEMENT
MEASURE OUTCOME
Sickle Cell Anemia Measures: Hemoglobin concentration, history of vaso-occlusive episodes, and hospitalizations Study Design: Case-control
Familiar Figures Test Wechsler Intelligence Scale for Children-Revised (WISC-R) (Comprehension, Block Design, Mazes, Arithmetic, & Coding subtests) Wide Range Achievement Test-Revised (WRAT-R) Pediatric Neurobehavioral Inventory (Parent report)
Children with sickle cell disease without stroke did not significantly differ from the controls. Children with sickle cell disease and stroke had a significantly poorer performance on the Coding subsets of the WISC-R, Spelling, Arithmetic subtests from the WRAT-R, and significantly slower response time for cancellation for numbers and shapes than those with sickle cell disease without stroke.
Richard (1997) Sample: N = 68 African American children who were 7 to 11 years of age (42 children with sickle cell disease who were patients in a comprehensive sickle cell clinic; 26 children who did not have any chronic illness and who were selected from a list of patients who attended a general medical clinic at the same hospital during the same period) Study Design: Case-control
School Records were used to assess grades during the previous year in mathematics and reading, percentile scores on the California Achievement Test (CAT), grade retention, and attendance
Controlled for sex and age The two groups did not differ on grades in mathematics or reading, scores on standardized tests, or grade retention. Both the sickle cell and comparison groups had high rates of absenteeism and the mean percentile scores in mathematics and reading were below the national average for their ages.
Schatz (2004) Sample: N = 86 children (50 children with sickle cell disease, ages 7 to 17 years who were selected at random from local pediatric hematology Clinics; 36 comparison children recruited from the same community and were matched on age, gender distribution, ethnicity, and socioeconomic status Sickle Cell Anemia Measures: Anemia severity/hematocrit; Frequency of illness Study Design: Case-control
Academic attainment: parent report of whether the child was receiving special services at school & history of repeating a grade Academic achievement: Wide Range Achievement Test, third edition (WRAT-3); tests of single-word reading ability; and written calculations
Those with sickle cell disease (SCD) had a higher rate of academic attainment problems than peers (Fisher’s exact test, p<.05). Children with SCD also had more frequent instances of multiple grade repetitions compared to controls (15 versus 3 cases; two-tailed Fisher’s exact test, p <.05). There was a significant relationship between Attainment problems and academic achievement delays according to a Fisher’s exact test, p < .01 (80% with similar classification); however, 10 of 50 cases (20%) showed only one of the two types of deficits (5 with attainment problems only and 5 with achievement delays only). Univariate predictors of attainment problems were lower achievement scores, more school days missed due to illness, lower cognitive ability, and
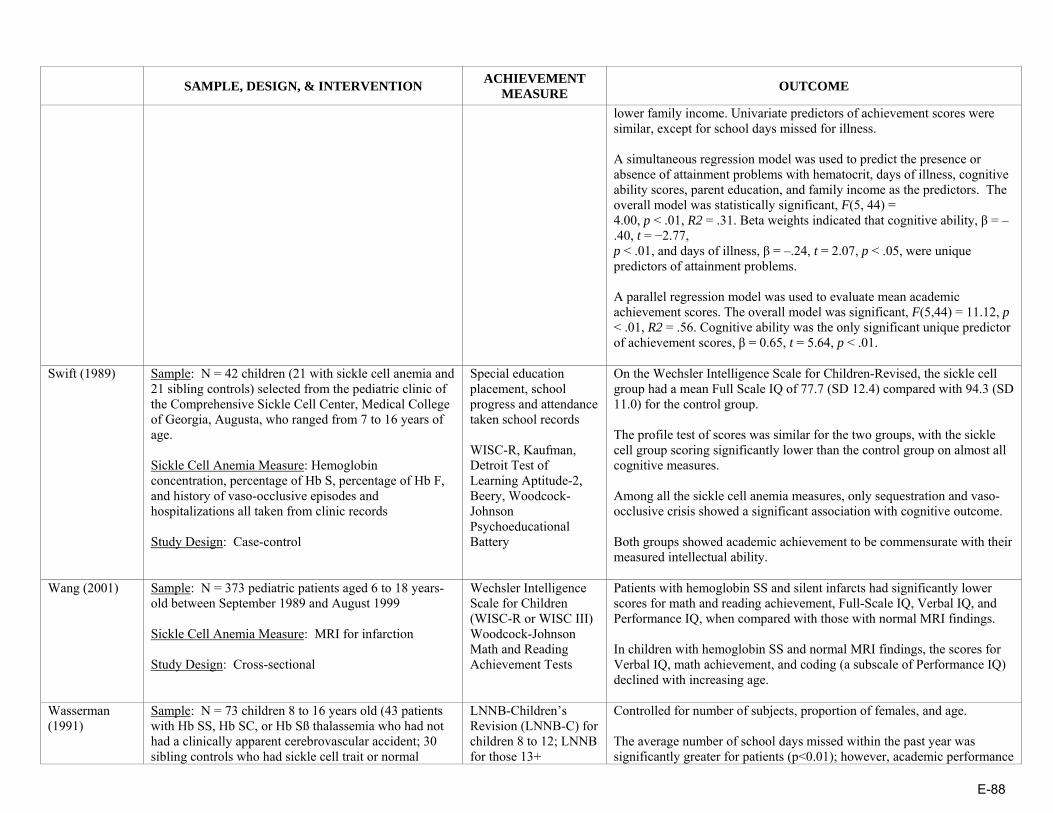
E-88
SAMPLE, DESIGN, & INTERVENTION ACHIEVEMENT
MEASURE OUTCOME
lower family income. Univariate predictors of achievement scores were similar, except for school days missed for illness. A simultaneous regression model was used to predict the presence or absence of attainment problems with hematocrit, days of illness, cognitive ability scores, parent education, and family income as the predictors. The overall model was statistically significant, F(5, 44) = 4.00, p < .01, R2 = .31. Beta weights indicated that cognitive ability, β = –.40, t = −2.77, p < .01, and days of illness, β = –.24, t = 2.07, p < .05, were unique predictors of attainment problems. A parallel regression model was used to evaluate mean academic achievement scores. The overall model was significant, F(5,44) = 11.12, p < .01, R2 = .56. Cognitive ability was the only significant unique predictor of achievement scores, β = 0.65, t = 5.64, p < .01.
Swift (1989) Sample: N = 42 children (21 with sickle cell anemia and 21 sibling controls) selected from the pediatric clinic of the Comprehensive Sickle Cell Center, Medical College of Georgia, Augusta, who ranged from 7 to 16 years of age. Sickle Cell Anemia Measure: Hemoglobin concentration, percentage of Hb S, percentage of Hb F, and history of vaso-occlusive episodes and hospitalizations all taken from clinic records Study Design: Case-control
Special education placement, school progress and attendance taken school records WISC-R, Kaufman, Detroit Test of Learning Aptitude-2, Beery, Woodcock-Johnson Psychoeducational Battery
On the Wechsler Intelligence Scale for Children-Revised, the sickle cell group had a mean Full Scale IQ of 77.7 (SD 12.4) compared with 94.3 (SD 11.0) for the control group. The profile test of scores was similar for the two groups, with the sickle cell group scoring significantly lower than the control group on almost all cognitive measures. Among all the sickle cell anemia measures, only sequestration and vaso-occlusive crisis showed a significant association with cognitive outcome. Both groups showed academic achievement to be commensurate with their measured intellectual ability.
Wang (2001) Sample: N = 373 pediatric patients aged 6 to 18 years-old between September 1989 and August 1999 Sickle Cell Anemia Measure: MRI for infarction Study Design: Cross-sectional
Wechsler Intelligence Scale for Children (WISC-R or WISC III) Woodcock-Johnson Math and Reading Achievement Tests
Patients with hemoglobin SS and silent infarcts had significantly lower scores for math and reading achievement, Full-Scale IQ, Verbal IQ, and Performance IQ, when compared with those with normal MRI findings. In children with hemoglobin SS and normal MRI findings, the scores for Verbal IQ, math achievement, and coding (a subscale of Performance IQ) declined with increasing age.
Wasserman (1991)
Sample: N = 73 children 8 to 16 years old (43 patients with Hb SS, Hb SC, or Hb Sß thalassemia who had not had a clinically apparent cerebrovascular accident; 30 sibling controls who had sickle cell trait or normal
LNNB-Children’s Revision (LNNB-C) for children 8 to 12; LNNB for those 13+
Controlled for number of subjects, proportion of females, and age. The average number of school days missed within the past year was significantly greater for patients (p<0.01); however, academic performance
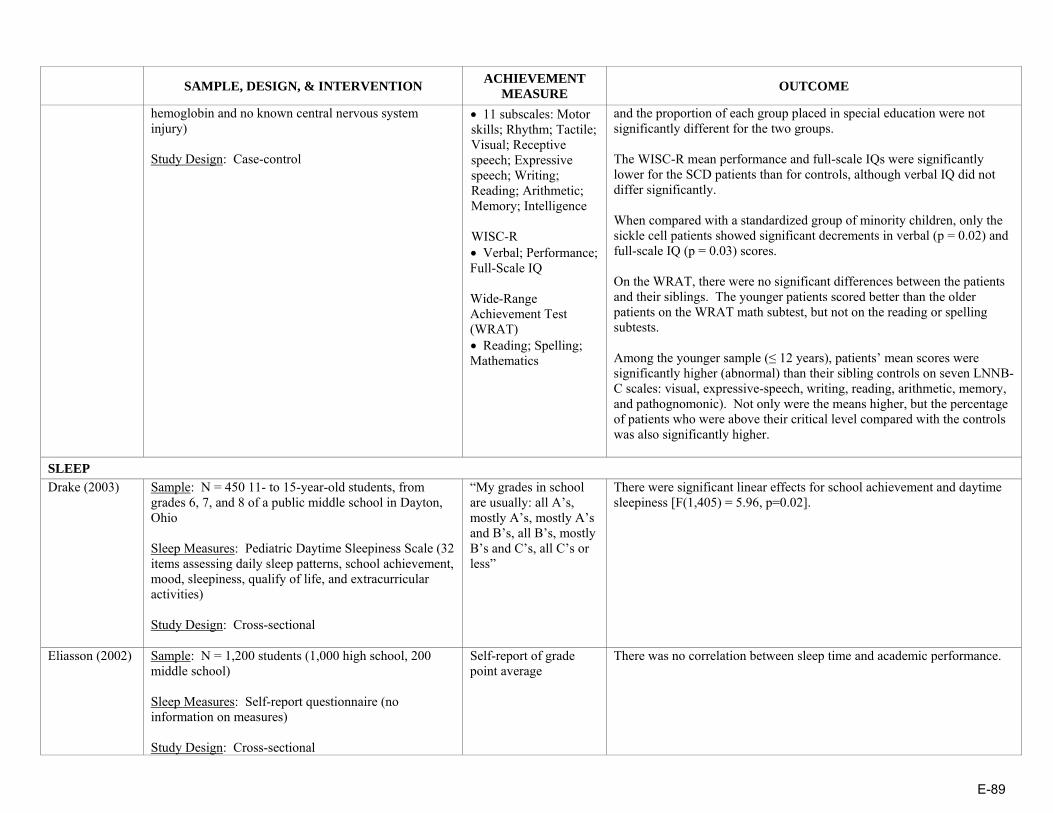
E-89
SAMPLE, DESIGN, & INTERVENTION ACHIEVEMENT
MEASURE OUTCOME
hemoglobin and no known central nervous system injury) Study Design: Case-control
• 11 subscales: Motor skills; Rhythm; Tactile; Visual; Receptive speech; Expressive speech; Writing; Reading; Arithmetic; Memory; Intelligence WISC-R • Verbal; Performance; Full-Scale IQ Wide-Range Achievement Test (WRAT) • Reading; Spelling; Mathematics
and the proportion of each group placed in special education were not significantly different for the two groups. The WISC-R mean performance and full-scale IQs were significantly lower for the SCD patients than for controls, although verbal IQ did not differ significantly. When compared with a standardized group of minority children, only the sickle cell patients showed significant decrements in verbal (p = 0.02) and full-scale IQ (p = 0.03) scores. On the WRAT, there were no significant differences between the patients and their siblings. The younger patients scored better than the older patients on the WRAT math subtest, but not on the reading or spelling subtests. Among the younger sample (≤ 12 years), patients’ mean scores were significantly higher (abnormal) than their sibling controls on seven LNNB-C scales: visual, expressive-speech, writing, reading, arithmetic, memory, and pathognomonic). Not only were the means higher, but the percentage of patients who were above their critical level compared with the controls was also significantly higher.
SLEEP Drake (2003) Sample: N = 450 11- to 15-year-old students, from
grades 6, 7, and 8 of a public middle school in Dayton, Ohio Sleep Measures: Pediatric Daytime Sleepiness Scale (32 items assessing daily sleep patterns, school achievement, mood, sleepiness, qualify of life, and extracurricular activities) Study Design: Cross-sectional
“My grades in school are usually: all A’s, mostly A’s, mostly A’s and B’s, all B’s, mostly B’s and C’s, all C’s or less”
There were significant linear effects for school achievement and daytime sleepiness [F(1,405) = 5.96, p=0.02].
Eliasson (2002) Sample: N = 1,200 students (1,000 high school, 200 middle school) Sleep Measures: Self-report questionnaire (no information on measures) Study Design: Cross-sectional
Self-report of grade point average
There was no correlation between sleep time and academic performance.
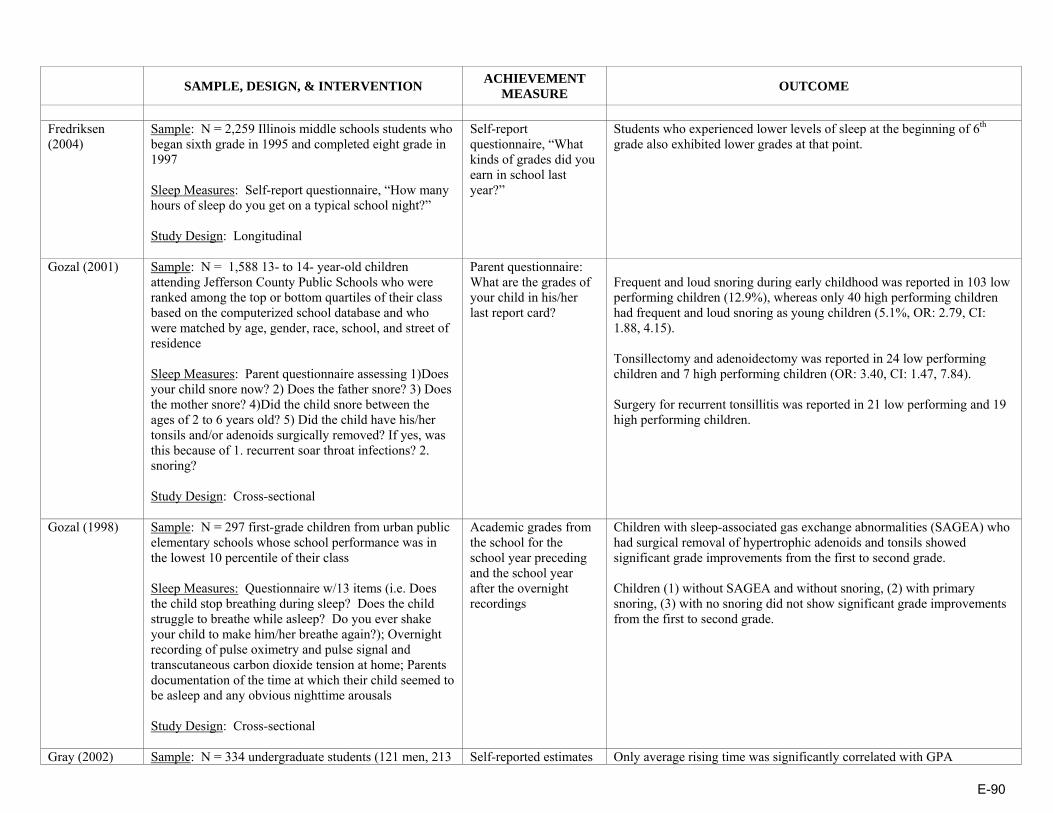
E-90
SAMPLE, DESIGN, & INTERVENTION ACHIEVEMENT
MEASURE OUTCOME
Fredriksen (2004)
Sample: N = 2,259 Illinois middle schools students who began sixth grade in 1995 and completed eight grade in 1997 Sleep Measures: Self-report questionnaire, “How many hours of sleep do you get on a typical school night?” Study Design: Longitudinal
Self-report questionnaire, “What kinds of grades did you earn in school last year?”
Students who experienced lower levels of sleep at the beginning of 6th grade also exhibited lower grades at that point.
Gozal (2001) Sample: N = 1,588 13- to 14- year-old children attending Jefferson County Public Schools who were ranked among the top or bottom quartiles of their class based on the computerized school database and who were matched by age, gender, race, school, and street of residence Sleep Measures: Parent questionnaire assessing 1)Does your child snore now? 2) Does the father snore? 3) Does the mother snore? 4)Did the child snore between the ages of 2 to 6 years old? 5) Did the child have his/her tonsils and/or adenoids surgically removed? If yes, was this because of 1. recurrent soar throat infections? 2. snoring? Study Design: Cross-sectional
Parent questionnaire: What are the grades of your child in his/her last report card?
Frequent and loud snoring during early childhood was reported in 103 low performing children (12.9%), whereas only 40 high performing children had frequent and loud snoring as young children (5.1%, OR: 2.79, CI: 1.88, 4.15). Tonsillectomy and adenoidectomy was reported in 24 low performing children and 7 high performing children (OR: 3.40, CI: 1.47, 7.84). Surgery for recurrent tonsillitis was reported in 21 low performing and 19 high performing children.
Gozal (1998) Sample: N = 297 first-grade children from urban public elementary schools whose school performance was in the lowest 10 percentile of their class Sleep Measures: Questionnaire w/13 items (i.e. Does the child stop breathing during sleep? Does the child struggle to breathe while asleep? Do you ever shake your child to make him/her breathe again?); Overnight recording of pulse oximetry and pulse signal and transcutaneous carbon dioxide tension at home; Parents documentation of the time at which their child seemed to be asleep and any obvious nighttime arousals Study Design: Cross-sectional
Academic grades from the school for the school year preceding and the school year after the overnight recordings
Children with sleep-associated gas exchange abnormalities (SAGEA) who had surgical removal of hypertrophic adenoids and tonsils showed significant grade improvements from the first to second grade. Children (1) without SAGEA and without snoring, (2) with primary snoring, (3) with no snoring did not show significant grade improvements from the first to second grade.
Gray (2002) Sample: N = 334 undergraduate students (121 men, 213 Self-reported estimates Only average rising time was significantly correlated with GPA
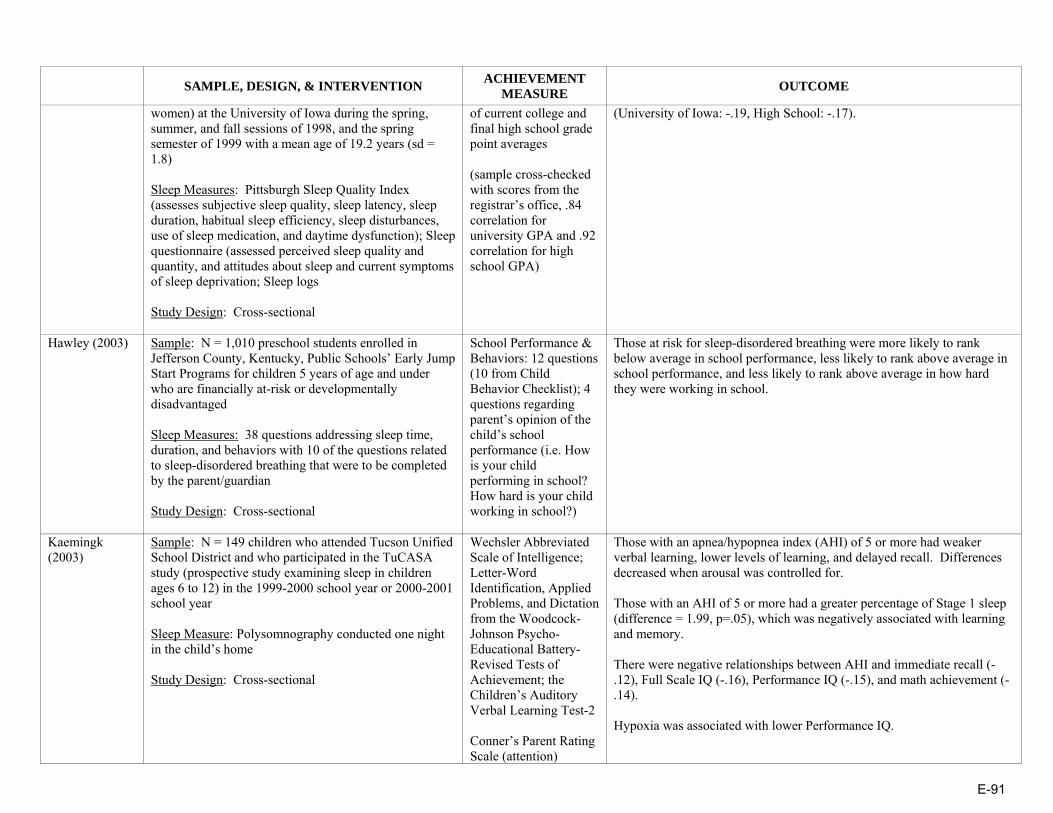
E-91
SAMPLE, DESIGN, & INTERVENTION ACHIEVEMENT
MEASURE OUTCOME
women) at the University of Iowa during the spring, summer, and fall sessions of 1998, and the spring semester of 1999 with a mean age of 19.2 years (sd = 1.8) Sleep Measures: Pittsburgh Sleep Quality Index (assesses subjective sleep quality, sleep latency, sleep duration, habitual sleep efficiency, sleep disturbances, use of sleep medication, and daytime dysfunction); Sleep questionnaire (assessed perceived sleep quality and quantity, and attitudes about sleep and current symptoms of sleep deprivation; Sleep logs Study Design: Cross-sectional
of current college and final high school grade point averages (sample cross-checked with scores from the registrar’s office, .84 correlation for university GPA and .92 correlation for high school GPA)
(University of Iowa: -.19, High School: -.17).
Hawley (2003) Sample: N = 1,010 preschool students enrolled in Jefferson County, Kentucky, Public Schools’ Early Jump Start Programs for children 5 years of age and under who are financially at-risk or developmentally disadvantaged Sleep Measures: 38 questions addressing sleep time, duration, and behaviors with 10 of the questions related to sleep-disordered breathing that were to be completed by the parent/guardian Study Design: Cross-sectional
School Performance & Behaviors: 12 questions (10 from Child Behavior Checklist); 4 questions regarding parent’s opinion of the child’s school performance (i.e. How is your child performing in school? How hard is your child working in school?)
Those at risk for sleep-disordered breathing were more likely to rank below average in school performance, less likely to rank above average in school performance, and less likely to rank above average in how hard they were working in school.
Kaemingk (2003)
Sample: N = 149 children who attended Tucson Unified School District and who participated in the TuCASA study (prospective study examining sleep in children ages 6 to 12) in the 1999-2000 school year or 2000-2001 school year Sleep Measure: Polysomnography conducted one night in the child’s home Study Design: Cross-sectional
Wechsler Abbreviated Scale of Intelligence; Letter-Word Identification, Applied Problems, and Dictation from the Woodcock-Johnson Psycho-Educational Battery-Revised Tests of Achievement; the Children’s Auditory Verbal Learning Test-2 Conner’s Parent Rating Scale (attention)
Those with an apnea/hypopnea index (AHI) of 5 or more had weaker verbal learning, lower levels of learning, and delayed recall. Differences decreased when arousal was controlled for. Those with an AHI of 5 or more had a greater percentage of Stage 1 sleep (difference = 1.99, p=.05), which was negatively associated with learning and memory. There were negative relationships between AHI and immediate recall (-.12), Full Scale IQ (-.16), Performance IQ (-.15), and math achievement (-.14). Hypoxia was associated with lower Performance IQ.
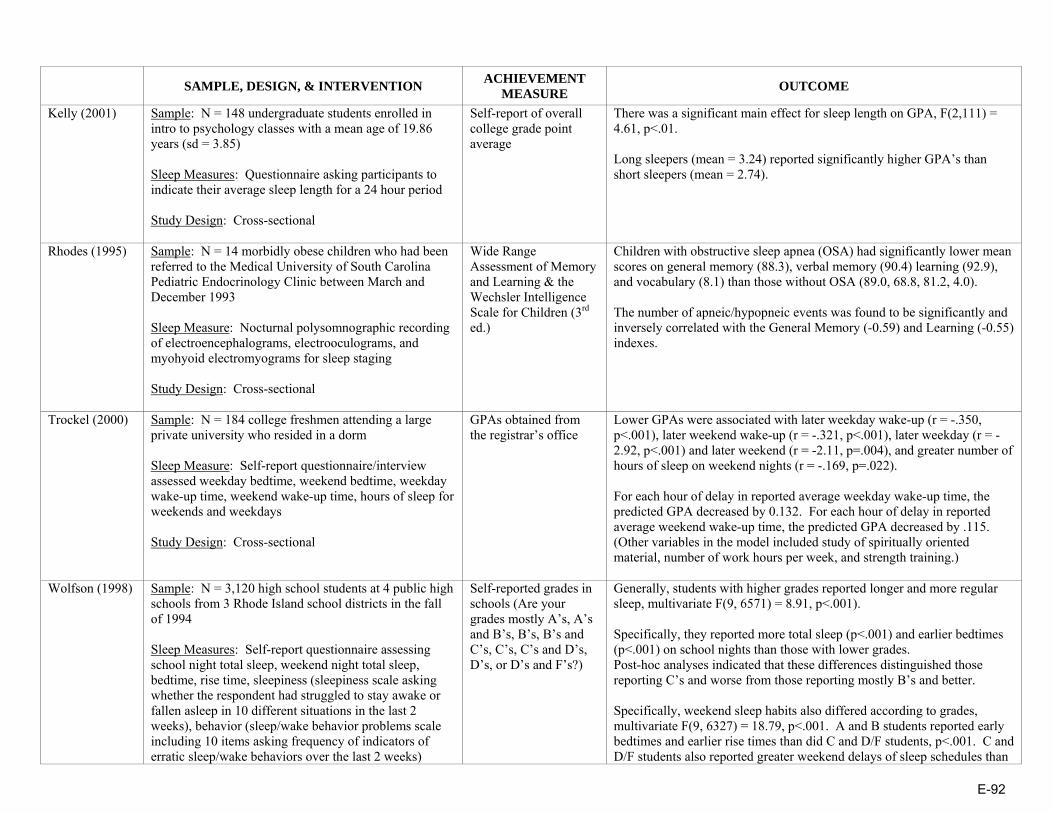
E-92
SAMPLE, DESIGN, & INTERVENTION ACHIEVEMENT
MEASURE OUTCOME
Kelly (2001) Sample: N = 148 undergraduate students enrolled in intro to psychology classes with a mean age of 19.86 years (sd = 3.85) Sleep Measures: Questionnaire asking participants to indicate their average sleep length for a 24 hour period Study Design: Cross-sectional
Self-report of overall college grade point average
There was a significant main effect for sleep length on GPA, F(2,111) = 4.61, p<.01. Long sleepers (mean = 3.24) reported significantly higher GPA’s than short sleepers (mean = 2.74).
Rhodes (1995) Sample: N = 14 morbidly obese children who had been referred to the Medical University of South Carolina Pediatric Endocrinology Clinic between March and December 1993 Sleep Measure: Nocturnal polysomnographic recording of electroencephalograms, electrooculograms, and myohyoid electromyograms for sleep staging Study Design: Cross-sectional
Wide Range Assessment of Memory and Learning & the Wechsler Intelligence Scale for Children (3rd ed.)
Children with obstructive sleep apnea (OSA) had significantly lower mean scores on general memory (88.3), verbal memory (90.4) learning (92.9), and vocabulary (8.1) than those without OSA (89.0, 68.8, 81.2, 4.0). The number of apneic/hypopneic events was found to be significantly and inversely correlated with the General Memory (-0.59) and Learning (-0.55) indexes.
Trockel (2000) Sample: N = 184 college freshmen attending a large private university who resided in a dorm Sleep Measure: Self-report questionnaire/interview assessed weekday bedtime, weekend bedtime, weekday wake-up time, weekend wake-up time, hours of sleep for weekends and weekdays Study Design: Cross-sectional
GPAs obtained from the registrar’s office
Lower GPAs were associated with later weekday wake-up (r = -.350, p<.001), later weekend wake-up (r = -.321, p<.001), later weekday (r = -2.92, p<.001) and later weekend (r = -2.11, p=.004), and greater number of hours of sleep on weekend nights (r = -.169, p=.022). For each hour of delay in reported average weekday wake-up time, the predicted GPA decreased by 0.132. For each hour of delay in reported average weekend wake-up time, the predicted GPA decreased by .115. (Other variables in the model included study of spiritually oriented material, number of work hours per week, and strength training.)
Wolfson (1998) Sample: N = 3,120 high school students at 4 public high schools from 3 Rhode Island school districts in the fall of 1994 Sleep Measures: Self-report questionnaire assessing school night total sleep, weekend night total sleep, bedtime, rise time, sleepiness (sleepiness scale asking whether the respondent had struggled to stay awake or fallen asleep in 10 different situations in the last 2 weeks), behavior (sleep/wake behavior problems scale including 10 items asking frequency of indicators of erratic sleep/wake behaviors over the last 2 weeks)
Self-reported grades in schools (Are your grades mostly A’s, A’s and B’s, B’s, B’s and C’s, C’s, C’s and D’s, D’s, or D’s and F’s?)
Generally, students with higher grades reported longer and more regular sleep, multivariate F(9, 6571) = 8.91, p<.001). Specifically, they reported more total sleep (p<.001) and earlier bedtimes (p<.001) on school nights than those with lower grades. Post-hoc analyses indicated that these differences distinguished those reporting C’s and worse from those reporting mostly B’s and better. Specifically, weekend sleep habits also differed according to grades, multivariate F(9, 6327) = 18.79, p<.001. A and B students reported early bedtimes and earlier rise times than did C and D/F students, p<.001. C and D/F students also reported greater weekend delays of sleep schedules than

E-93
SAMPLE, DESIGN, & INTERVENTION ACHIEVEMENT
MEASURE OUTCOME
Study Design: Cross-sectional
the better students, multivariate F(6, 5060)= 18.22, p<.001.
* These articles also provide insight to the relationship of asthma and academics. Source: Nancy Murray, Dr.P.H., The University of Texas School of Public Health
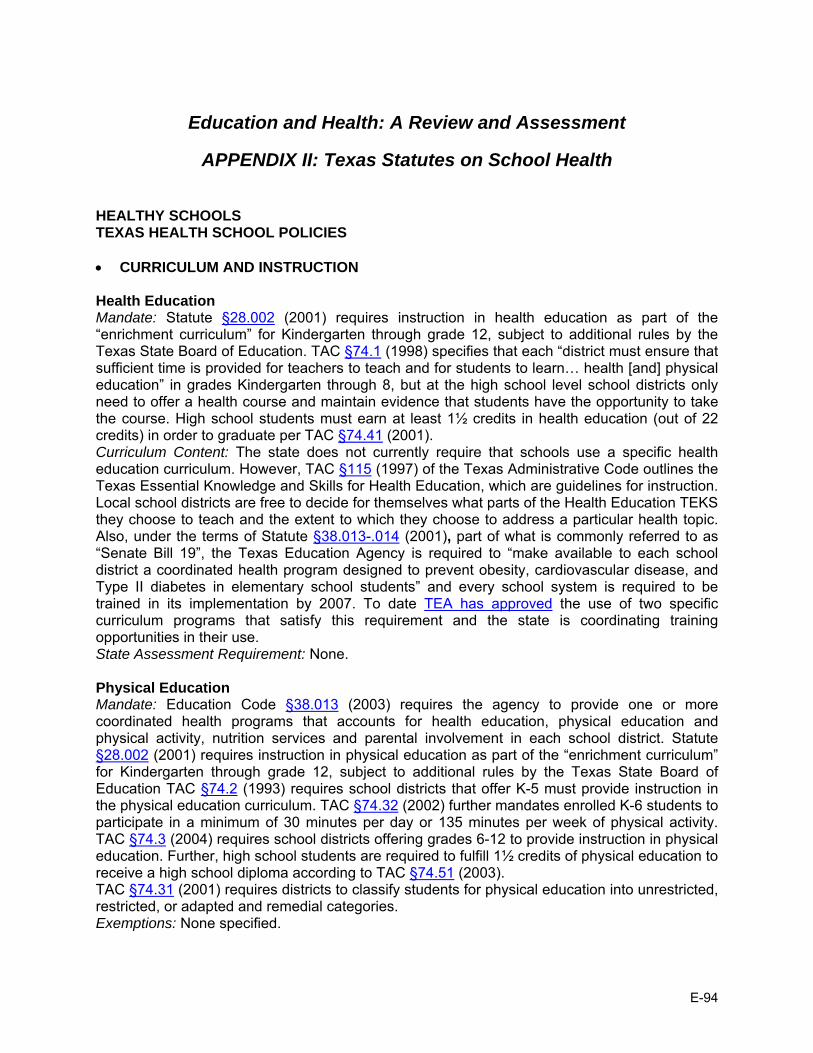
E-94
Education and Health: A Review and Assessment
APPENDIX II: Texas Statutes on School Health
HEALTHY SCHOOLS TEXAS HEALTH SCHOOL POLICIES • CURRICULUM AND INSTRUCTION Health Education Mandate: Statute §28.002 (2001) requires instruction in health education as part of the “enrichment curriculum” for Kindergarten through grade 12, subject to additional rules by the Texas State Board of Education. TAC §74.1 (1998) specifies that each “district must ensure that sufficient time is provided for teachers to teach and for students to learn… health [and] physical education” in grades Kindergarten through 8, but at the high school level school districts only need to offer a health course and maintain evidence that students have the opportunity to take the course. High school students must earn at least 1½ credits in health education (out of 22 credits) in order to graduate per TAC §74.41 (2001). Curriculum Content: The state does not currently require that schools use a specific health education curriculum. However, TAC §115 (1997) of the Texas Administrative Code outlines the Texas Essential Knowledge and Skills for Health Education, which are guidelines for instruction. Local school districts are free to decide for themselves what parts of the Health Education TEKS they choose to teach and the extent to which they choose to address a particular health topic. Also, under the terms of Statute §38.013-.014 (2001), part of what is commonly referred to as “Senate Bill 19”, the Texas Education Agency is required to “make available to each school district a coordinated health program designed to prevent obesity, cardiovascular disease, and Type II diabetes in elementary school students” and every school system is required to be trained in its implementation by 2007. To date TEA has approved the use of two specific curriculum programs that satisfy this requirement and the state is coordinating training opportunities in their use. State Assessment Requirement: None. Physical Education Mandate: Education Code §38.013 (2003) requires the agency to provide one or more coordinated health programs that accounts for health education, physical education and physical activity, nutrition services and parental involvement in each school district. Statute §28.002 (2001) requires instruction in physical education as part of the “enrichment curriculum” for Kindergarten through grade 12, subject to additional rules by the Texas State Board of Education TAC §74.2 (1993) requires school districts that offer K-5 must provide instruction in the physical education curriculum. TAC §74.32 (2002) further mandates enrolled K-6 students to participate in a minimum of 30 minutes per day or 135 minutes per week of physical activity. TAC §74.3 (2004) requires school districts offering grades 6-12 to provide instruction in physical education. Further, high school students are required to fulfill 1½ credits of physical education to receive a high school diploma according to TAC §74.51 (2003). TAC §74.31 (2001) requires districts to classify students for physical education into unrestricted, restricted, or adapted and remedial categories. Exemptions: None specified.
E-95
Curriculum Content: Statute §28.002 (2003) and TAC §74.1 (2004) requires each school district offering K-12 to mandate a physical education curriculum. TAC §116.1 to §116.52 (1998) describe the Texas Essential Knowledge and Skills for Physical Education. Physical Fitness Assessment: None. Asthma Awareness Education Not specifically required. Emotional, Social, and Mental Health Education The Texas Essential Knowledge and Skills for Health Education recommends personal and interpersonal skills be taught, including healthy expression of emotions and self-control in grades 1-12. Stress management skills and the various aspects of mental and social health are recommended for grades 3-10. Character Education: Statute §29.906 (2003) allows school districts to provide character education programs, stressing positive character traits, using integrated teaching strategies. Teaching specific religious or political beliefs are not authorized. Nutrition Education Education Code §38.013 (2003) requires the agency to provide one or more coordinated health programs that accounts for health education, physical education and physical activity, nutrition services and parental involvement in each school district. The Texas Essential Knowledge and Skills for Health Education recommends instruction in nutrition that includes identifying healthy and unhealthy foods, examining food labels, and healthy and unhealthy dietary practices be taught in grades K-6. Tobacco Use Prevention Education Tobacco use prevention education is recommended, not required. Texas Essential Knowledge and Skills for Health Education includes this topic throughout.
• STAFF
Requirements for All Educators (regarding Health Topics) Professional Development: The state does not require teachers to participate in professional development covering health education or violence prevention topics. Requirements for Health Educators Pre-service Requirement: The minimum requirement for prospective health teachers in elementary, middle and high school grades prior to licensure is a bachelor’s degree, with an academic major; however, health coursework is not specified. The specific details of initial licensure are outlined in Statute §21.050 (2001). Professional Development: The state does not require health education teachers to participate in on-going professional development covering health education topics. Requirements for Physical Educators Pre-service Requirement: None specified. Professional Development: None specified.

E-96
Requirements for School Nurses Pre-service Requirement: Statute §21.003 (1995) requires a school nurse to be certified by the proper state agency. Professional Development: None specified. Student-to-Nurse Ratio: None specified. Requirements for Non-Certified Personnel to Administer Medication Pre-service Requirement: None specified. Professional Development: None specified. Requirements for School Counselors Pre-service Requirement: Statute §21.003 (1995) requires a school counselor to be certified by the state. TAC §230.307 (2000) requires a minimum of a bachelor’s degree. A school counselor must also have coursework as follows: at least three semester hours covering guidance programming, six semester hours covering serviced pupils, and 21 semester hours in resource areas as part of a planned individual program detailed in TAC §239.15 (2001). A counselor is also required to have a valid professional teaching certificate and three creditable years of classroom teaching experience. TAC §230.315 (2000) requires special education counselors to have an additional six credit hours of courses in education for exceptional children. Professional Development: TAC §239.15 (2001) requires that mandated school counselor continuing professional education activities follow the foundation laid forth in detail within this statute. TAC §239.25 (2001) requires 150 hours of continuing professional education to be completed during the first 5 year renewal period. Student-to-Counselor Ratio: Statute §33.002 (2003) requires school districts, which receive certain funding for programs, provide at least 1 counselor for every 500 students at the elementary level. Those school districts with fewer than 500 students at the elementary level must provide a part-time counselor. Requirements for School Psychologists Pre-service Requirement: Statute §21.003 (1995) requires a school psychologist to be certified by the proper state agency. Professional Development: None specified. Student-to-Psychologist Ratio: None specified. Requirements for School Social Workers Pre-service Requirement: Statute §21.003 (1995) requires a school social worker to be certified by the proper state agency. Professional Development: None specified. Student-to-Social Worker Ratio: None specified. Requirements for Food Service Personnel Pre-service Requirement: None specified. Professional Development: None specified. Requirements for Athletic Coaches Pre-service Requirement: None specified. Professional Development: None specified.
E-97
• HEALTH PROMOTING ENVIRONMENT
School Food Services Food Services: The Department of Agriculture’s Policy on Foods of Minimal Nutritional Value (FMNV) (2003) [no link available] prohibits elementary schools from serving or giving access to students to FMNV at any time on school property during the school day. Middle schools must also deny access for students to FMNV anywhere on school property during meal periods and may not serve or give access to prohibited carbonated beverages in containers larger than 12 ounces anywhere on school property during the school day. Special Populations: No state policy. Vending Machines/School Stores: Statute §28.004 (2003) requires school districts to make available for inspection a statement of whether local policies were adopted that ensure compliance with agency vending machine and food service guidelines and restricting student access to vending machines. Other Food Sales: No state policy. Physical Activity (Non-curricular) Interscholastic Athletics: TAC §76.1001 (2003) states that an extracurricular activity is an activity sponsored by the school district that is not necessarily directly related to instruction of the essential knowledge and skills but may have an indirect relation to some areas of the curriculum. Further provisions of extracurricular activities are provided in the code. Recess: No state policy. Tobacco Use Texas Education Code §38.006 (1995) prohibits smoking or tobacco use or possession at a school-related activity on or off school property. Air Quality Texas Health and Safety Code §385.002 (2001) requires the State Board of Health to establish voluntary guidelines for ventilation and indoor air pollution control systems in government buildings, which includes school districts according to Code §385.001 (2001). Pesticide Use Structural Pest Control Board Law §595.11 (no date available) prohibits the application of pesticides in school buildings or on school grounds if it will expose students to unacceptable levels of pesticides. The law also requires each school district to develop a written pest management policy based on the tenets of integrated pest management.
• STUDENT SERVICES
Screening for Health Conditions Statute §38.003 (1995) requires students enrolling in public schools to be tested at appropriate times for dyslexia and related disorders. Asthma: No state policy. Body Mass Index (BMI) Screening: No state policy. Administration of Medications The Guidelines for Administering Medications in Schools (no date available) requires students who have a chronic illness or disability to receive medication during the school day. Texas Education Code §38.012 (1999) requires a school district or school to hold a public hearing
E-98
before health care services are available in the schools. At the hearing, the board will disclose all information regarding proposed health care services. Self-Administration of Medications: Texas Education Code §38.015 (2001) entitles students with asthma to possess and self-administer prescription medication while on school property or at school-related activities, provided that the medication was prescribed for the student, administration is given in compliance with the physician’s instructions, and a parent submits a written statement from the physician stating that the student is capable of self-administering the medication, and the time and dosage of the medication. Psychotropic Medications: Education Code §38.016 (2003) states school district employees may not recommend that a student use a psychotropic drug. However, this statute does not prohibit school medical staff from recommending that a child be evaluated by an appropriate medical practitioner. Storage and Record-Keeping: No state policy. Counseling and Mental Health Services Requirement to Provide Services: Code of Education §33.005 (2001) requires school counselors, working with the school and broader community, to plan, implement, and evaluate a developmental guidance program. This program is to include a responsive services component to intervene on behalf of any at-risk student and an individual planning system component to provide guidance for each student. A Model Comprehensive, Developmental Guidance and Counseling Program for Texas Public Schools: A Guide for Program Development Pre-K-12th Grade (2004) provides a model for schools to follow when developing their developmental guidance programs. Statute §29.312 (1995) also requires appropriate psychological counseling services to be made available for those students who are deaf or hard of hearing. Suicide Prevention: Texas has no specific state policy addressing suicide prevention services; however, the responsive services requirement of the Code of Education §33.005 (2001) implies suicide prevention be addressed. Identification of Students with Mental or Emotional Disorders: Statute §38.057 (2001) requires the school medical staff, along with the parental guardian, to jointly identify any health-related concerns of a student which may be interfering with their well-being or ability to succeed in school. Referrals for mental health services require notification of the parental guardian in writing, whose authorization is needed for potential treatment. Statutes §26.009 (1997) and §29.0041 (2003) require parental consent before conducting a psychological examination, test, or treatment on a child. Immunity of Liability: Education Code §22.0511 (2003) grants immunity of personal liability to all professional school employees for any act incident to or within the scope of their duties that involves the exercise of judgment or discretion. Only the use of excessive force or negligence resulting in bodily harm voids their immunity of liability. Individual Health Plan for Students No state policy.
E-99
• COORDINATION/IMPLEMENTATION
Coordinating or Advisory Councils State-level: Statute §33.084 (1995) establishes the interscholastic league advisory council composed of various state education officials and legislators who are instructed to study student eligibility to participate according to University Interscholastic League policy, the geographic distribution of UIL programs, and gender equity. Local-level: Texas Education Code §28.004 (2001), part of Senate Bill 19, requires each school district to “establish a local school health education advisory council to assist the district in ensuring that local community values are reflected in the district's health education instruction.” A majority of the members must be persons who are parents of students enrolled in the district and who are not employed by the district. In addition, Texas Education Code §38.058 (2001) allows a school district to establish a local health education and health care advisory council to make recommendations on establishing school-based health centers. School Health Program Coordinators State-level: No state policy. Local-level: No state policy. Confidentiality Student Health-Related Records: Statute §38.009 (1995) gives administrators, nurses, or teachers access to a student’s medical record maintained by the school district. Any who view these records must maintain confidentiality. More generally, Statute §28.058 (1995) requires that all information received by the commissioner concerning an individual student must be kept confidential. Student Health-Related Services: No state policy. Limitations on Student Surveys No state policy. Source: National Association of State Boards of Education. State-level school health policies: Texas. Available at: http://www.nasbe.org/HealthySchools/States/states.asp?Name=Texas

E-100
Education and Health: A Review and Assessment APPENDIX III: Texas State Policy on Asthma
• Texas is not within states with written policies on education for asthma awareness for
students and school staff. It does not recommend or require that students receive instruction in asthma education. (2005)
• Texas does not have written policies on asthma and general health examination for
students. • Texas does not have written policies requiring schools to document medical conditions of
students with asthma in an individual education plan (IEP) or individual student health plan (ISHP).
• Texas has a statewide policy that requires all schools to designate staff who will administer
medication to students during the school day. The policy requires written authorization from a parent or guardian and the prescribing physician.
• Texas has statewide policies that allow students to both possess and self-administer approved medication during the school day.
• Texas has state written policies on three environmental triggers: tobacco use, air quality, and/or pesticide use (2005)
CDC requires school to have a policy prohibiting cigarette, cigar and pipe smoking and smokeless tobacco use by students, faculty, staff and visitors; the policy prohibits tobacco use in school buildings, on school grounds, in school buses or other vehicles used to transport students, and at off-campus school-sponsored events. Texas has a written policy that prohibition of tobacco use to include all school-sponsored activities on or off the school campus, but not on school transportation vehicles.
Texas is one of the states that specifically address indoor air quality in schools. State
policy provides voluntary IAQ policies or other air quality measures in schools.
Texas requires schools to implement an integrated pest management program that includes procedural guidelines for pesticide application, education of building occupants, and inspection and monitoring of pesticide applications. The policy addresses management limiting pesticide application, requiring integrated pest management, but not notifying staff & parents and placement of posting signs.
Source: Lee, P.H. (2005) State school health policy issue brief: Summary and analyses of state policies on asthma education, medications, and triggers. National Association of State Boards of Education. Available at: http://www.nasbe.org/HealthySchools/

E-101
Education and Health: A Review and Assessment APPENDIX IV: Texas Legislative Information for Nutrition and
Physical Activity Texas bills related to children's health
Bill # Year Status (per CDC)
Status (per Texas Legislature
Online)
Date Introduced (if in committee) Notes Author/Sponsor Summary
HB55 2004 Expired in committee
Expired in committee
5/3/2004 Referred to Public School Finance, Select
Howard To place a tax on certain snack foods and beverages, and to use this tax revenue as a source of funding for public schools.
HB3283 2005 Pending Expired in committee
3/21/2005 Referred to Ways & Means
Guillen The department shall develop and administer community-based and school-based childhood obesity prevention programs. The programs must encourage children to: (1) increase their physical activities and decrease their sedentary activities; and (2) increase their consumption of nutritious foods and decrease their consumption of minimally nutritive foods; (3) educate children and parents regarding nutrition; and (4) identify and implement other methods of preventing childhood obesity and related illnesses. (5) A community-based program must include media campaigns, including public service announcements or other means, to disseminate nutrition information for and promote increased physical activity by children. (6) The childhood obesity prevention program account is an account in the general revenue fund.
HB517 2005 Pending Expired in committee
5/3/2005 No action taken in committee
Guillen, Escobar To ensure that time spent by a student for walking from one classroom to another, walking to or from school, bus, or engaging in other routine activities associated with the school day is not included in determining compliance with the daily physical activity requirement.
HB764 2003 Expired in committee
Expired in committee
5/9/2003 Left pending in committee
Wohlgemuth, Wise A bill to increase the physical activity requirements, physical activity education and nutrition education in schools to help fight the growing epidemic of childhood obesity.
HCR223 2001 Enacted Enacted Coleman Directs the Texas Department of Health to prepare a list of foods and beverages fortified with calcium for use by each primary and secondary school in Texas.
SB1357 2003 Enacted Enacted Nelson Relates to health education and physical education in schools. Establishes a health advisory council.
SB1379 2005 Pending Expired in committee
5/22/2005 Sent to Calendar committee
Lucio Relating to a statewide initiative regarding the prevention and treatment of obesity-related health concerns enacting the following obesity-related treatment and prevention initiatives: an interagency obesity council, public awareness campaigns, research to include evidence-based obesity treatment recommendations and insurance plans, nutrition and physical activity local capacity analysis, nutrition in public schools, beverage program, and mentorship program.
SB205 2005 Pending Expired in committee
2/3/2005 Referred to Education
Van de Putte The requirement of school districts to measure the body mass index of students and include the information in regular report cards.
SB29 2005 Pending Expired in committee
1/31/2005 Referred to Education
Zaffirini In regards to the school district reporting of compliance with certain health guidelines including a statement of policies adopted ensuring that students engage in at least 30 minutes per school day or 135 minutes per week of physical activity.
SB343 2003 Pending Expired in committee
2/11/2003 Referred to Education
Shapleigh For better use of schools for the education of children regarding obesity. Include the study of nutrition, fitness and the causes and effects of obesity.
SB42 2005 Pending Enacted Nelson Regarding health education in public schools and the improvement of children's health through daily physical activity in public schools.
SB474 2003 Enacted Enacted Lucio A committee formed for the establishment of a nutrition education and physical activity program in all public schools.
SB877 2001 Enacted Enacted Van de Putte, Zaffirini
Relates to the creation of an advisory committee for the special supplemental nutrition program for women, infants, and children. Provides for the committee’s membership, duties and responsibilities.
Source: CDC http://www.cdc.gov/nccdphp/states/texas.htm and Texas Legislature Online http://www.capitol.state.tx.us/
Related Documents