TECHNICAL MEMORANDUM Kinder Morgan Linnton Terminal – LNAPL Mobility Analysis PREPARED FOR: Oregon Department of Environmental Quality PREPARED BY: CH2M HILL DATE: August 2015 1.0 Introduction The purpose of this Technical Memorandum is to evaluate the LNAPL mobility in the vicinity of the barrier wall and extraction system and the behavior of the LNAPL based on water level and system operational fluctuations at the Kinder Morgan Liquids Terminals (KMLT) Linnton Terminal (the Site), located at 11400 NW Saint Helens Road in Portland, Oregon (Figure E‐1). The analysis includes evaluation of LNAPL thicknesses, elevations, and baildown testing results conducted in 2014 and 2015 in the vicinity of the barrier wall. The barrier wall and extraction system includes a 216‐foot‐long, 30‐foot deep, impermeable barrier wall and associated hydraulic gradient control system (CH2M HILL, 2011a) intended to prevent LNAPL migration to the river within the interim action target area identified in the interim action feasibility study (CH2M HILL, 2011b) and shown in Figure E‐1. The extraction wells in operation in the barrier wall vicinity include (EW‐1, EW‐2, EW‐3, EW‐ 5, EW‐6, EW‐7 and MW‐19). A network of piezometers (PZ‐1 through PZ‐9) were installed between 2012 and 2014 to aid in monitoring conditions in the vicinity of the barrier wall. Details on the barrier wall system are included in CH2M HILL (2011a, 2013a, 2013b, 2014a, and 2014b). Construction completion diagrams for the barrier wall, extraction wells and piezometers are included in Appendix F of the Groundwater Source Control Evaluation (SCE). Tables E‐1 – Parameters for Calculation of LNAPL Transmissivity in Vicinity of Barrier Wall E‐2 ‐ LNAPL Transmissivity Estimates in Vicinity of Barrier Wall Figures E‐1 – Site Layout and Interim Action Area E‐2a – Groundwater and LNAPL Elevations – North End Barrier Wall E‐2b – Groundwater and LNAPL Elevations – Middle of Barrier Wall E‐2c – Groundwater and LNAPL Elevations – South End Barrier Wall E‐3 – LNAPL Transmissivity in Vicinity of Barrier Wall Attachments E‐1 – LNAPL Transmissivity Model Fits – EW‐1 E‐2 – LNAPL Transmissivity Model Fits – EW‐6 E‐3 – LNAPL Transmissivity Model Fits – PZ‐3 E‐4 ‐ LNAPL Transmissivity Model Fits – PZ‐8 E‐4 ‐ LNAPL Transmissivity Model Fits – PZ‐1

Welcome message from author
This document is posted to help you gain knowledge. Please leave a comment to let me know what you think about it! Share it to your friends and learn new things together.
Transcript

T E C H N I C A L M E M O R A N D U M
Kinder Morgan Linnton Terminal – LNAPL Mobility Analysis PREPARED FOR: Oregon Department of Environmental Quality
PREPARED BY: CH2M HILL
DATE: August 2015
1.0 Introduction The purpose of this Technical Memorandum is to evaluate the LNAPL mobility in the vicinity of the barrier wall and extraction system and the behavior of the LNAPL based on water level and system operational fluctuations at the Kinder Morgan Liquids Terminals (KMLT) Linnton Terminal (the Site), located at 11400 NW Saint Helens Road in Portland, Oregon (Figure E‐1). The analysis includes evaluation of LNAPL thicknesses, elevations, and baildown testing results conducted in 2014 and 2015 in the vicinity of the barrier wall.
The barrier wall and extraction system includes a 216‐foot‐long, 30‐foot deep, impermeable barrier wall and associated hydraulic gradient control system (CH2M HILL, 2011a) intended to prevent LNAPL migration to the river within the interim action target area identified in the interim action feasibility study (CH2M HILL, 2011b) and shown in Figure E‐1. The extraction wells in operation in the barrier wall vicinity include (EW‐1, EW‐2, EW‐3, EW‐5, EW‐6, EW‐7 and MW‐19). A network of piezometers (PZ‐1 through PZ‐9) were installed between 2012 and 2014 to aid in monitoring conditions in the vicinity of the barrier wall. Details on the barrier wall system are included in CH2M HILL (2011a, 2013a, 2013b, 2014a, and 2014b). Construction completion diagrams for the barrier wall, extraction wells and piezometers are included in Appendix F of the Groundwater Source Control Evaluation (SCE).
Tables
E‐1 – Parameters for Calculation of LNAPL Transmissivity in Vicinity of Barrier Wall
E‐2 ‐ LNAPL Transmissivity Estimates in Vicinity of Barrier Wall
Figures
E‐1 – Site Layout and Interim Action Area
E‐2a – Groundwater and LNAPL Elevations – North End Barrier Wall
E‐2b – Groundwater and LNAPL Elevations – Middle of Barrier Wall
E‐2c – Groundwater and LNAPL Elevations – South End Barrier Wall
E‐3 – LNAPL Transmissivity in Vicinity of Barrier Wall
Attachments
E‐1 – LNAPL Transmissivity Model Fits – EW‐1
E‐2 – LNAPL Transmissivity Model Fits – EW‐6
E‐3 – LNAPL Transmissivity Model Fits – PZ‐3
E‐4 ‐ LNAPL Transmissivity Model Fits – PZ‐8
E‐4 ‐ LNAPL Transmissivity Model Fits – PZ‐1

2
2.0 Site Overview The Conceptual Site Model is discussed in detail in Section 2.5 of the Groundwater Source Control Evaluation (SCE), with cross‐sections of the hydrogeology in the vicinity of the barrier wall presented in Figures 2‐2, 2‐3 and 2‐9 of the Groundwater SCE. A summary of previous LNAPL studies on‐site is presented in Section 3.1.2 of the Groundwater SCE. As shown in Figure E‐1, the extent of LNAPL in the barrier wall vicinity extends parallel to the Willamette River from MW‐3 to MW‐20 and upgradient of the river from the barrier wall and piezometers (PZ‐1 to PZ‐9) to MW‐27 and MW‐28. As described in the 2010 LNAPL mobility study at the site (CH2M HILL, 2011b), LNAPL in the vicinity of the barrier wall was not found to be present above residual saturations.
3.0 Evaluation of LNAPL Mobility To facilitate an evaluation of LNAPL elevations and transmissivity in the vicinity of the barrier wall, monthly product recovery in the barrier wall vicinity was temporarily discontinued starting in April 2014. To update the current understanding of LNAPL behavior and mobility in the vicinity of the barrier wall, the following data was evaluated:
LNAPL thicknesses and elevations (2012 to 2014)
LNAPL recovery data from the barrier extraction system (2012 to 2014)
LANPL baildown testing results (2014 and 2015)
3.1 LNAPL Elevations A pattern of increased LNAPL thicknesses in the vicinity of the barrier wall during times of low water levels has been observed since monitoring of the barrier wall piezometers began in 2012. Several diagnostic gauge plots of groundwater elevation vs. LNAPL elevation were developed for the north end, middle and south ends of the barrier wall (Figures E‐2a, E‐2b, and E‐2c). The increased LNAPL thickness in the wells is directly related to occurrence of seasonally low aquifer water levels between 10 and 13 feet NAVD 88. This elevation corresponds to the zone where LNAPL was observed during previous investigations along the bank (CH2M HILL, 2011b). During low‐water conditions, the lower water levels in the piezometers allow residual LNAPL in this area to drain from the pore spaces and accumulate within the piezometers. The mobility of this LNAPL was evaluated by measuring LNAPL transmissivity and is discussed in the following sections.
3.2 LNAPL Transmissivity To evaluate LNAPL mobility trends over time, water and LNAPL recovery data from the barrier extraction system was used to calculate an approximation over time of the average LNAPL transmissivity near barrier wall. The LNAPL transmissivity (Tn) is estimated via the following equation (ASTM, 2012):
Where:
= NAPL extraction rate in gallons per day
= water extraction rate in gallons per day
= transmissivity of water in feet squared per day = K*b, where
K = hydraulic conductivity in feet per day and
b = saturated thickness of the aquifer in feet
= LNAPL‐to‐water density ratio
= Skimming drawdown in feet of NAPL
= Water drawdown in feet of NAPL
KINDER MORGAN LINNTON TERMINAL – LNAPL MOBILITY ANALYSIS
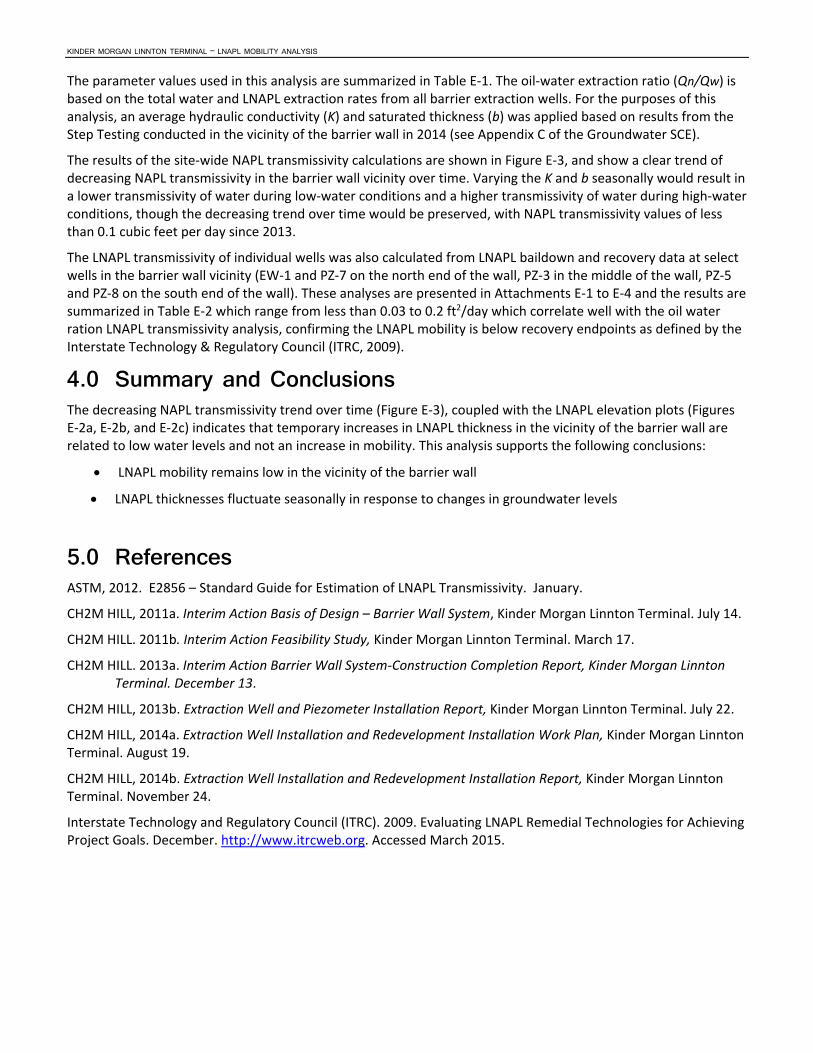
The parameter values used in this analysis are summarized in Table E‐1. The oil‐water extraction ratio (Qn/Qw) is based on the total water and LNAPL extraction rates from all barrier extraction wells. For the purposes of this analysis, an average hydraulic conductivity (K) and saturated thickness (b) was applied based on results from the Step Testing conducted in the vicinity of the barrier wall in 2014 (see Appendix C of the Groundwater SCE).
The results of the site‐wide NAPL transmissivity calculations are shown in Figure E‐3, and show a clear trend of decreasing NAPL transmissivity in the barrier wall vicinity over time. Varying the K and b seasonally would result in a lower transmissivity of water during low‐water conditions and a higher transmissivity of water during high‐water conditions, though the decreasing trend over time would be preserved, with NAPL transmissivity values of less than 0.1 cubic feet per day since 2013.
The LNAPL transmissivity of individual wells was also calculated from LNAPL baildown and recovery data at select wells in the barrier wall vicinity (EW‐1 and PZ‐7 on the north end of the wall, PZ‐3 in the middle of the wall, PZ‐5 and PZ‐8 on the south end of the wall). These analyses are presented in Attachments E‐1 to E‐4 and the results are summarized in Table E‐2 which range from less than 0.03 to 0.2 ft2/day which correlate well with the oil water ration LNAPL transmissivity analysis, confirming the LNAPL mobility is below recovery endpoints as defined by the Interstate Technology & Regulatory Council (ITRC, 2009).
4.0 Summary and Conclusions The decreasing NAPL transmissivity trend over time (Figure E‐3), coupled with the LNAPL elevation plots (Figures E‐2a, E‐2b, and E‐2c) indicates that temporary increases in LNAPL thickness in the vicinity of the barrier wall are related to low water levels and not an increase in mobility. This analysis supports the following conclusions:
LNAPL mobility remains low in the vicinity of the barrier wall
LNAPL thicknesses fluctuate seasonally in response to changes in groundwater levels
5.0 References ASTM, 2012. E2856 – Standard Guide for Estimation of LNAPL Transmissivity. January.
CH2M HILL, 2011a. Interim Action Basis of Design – Barrier Wall System, Kinder Morgan Linnton Terminal. July 14.
CH2M HILL. 2011b. Interim Action Feasibility Study, Kinder Morgan Linnton Terminal. March 17.
CH2M HILL. 2013a. Interim Action Barrier Wall System‐Construction Completion Report, Kinder Morgan Linnton Terminal. December 13.
CH2M HILL, 2013b. Extraction Well and Piezometer Installation Report, Kinder Morgan Linnton Terminal. July 22.
CH2M HILL, 2014a. Extraction Well Installation and Redevelopment Installation Work Plan, Kinder Morgan Linnton Terminal. August 19.
CH2M HILL, 2014b. Extraction Well Installation and Redevelopment Installation Report, Kinder Morgan Linnton Terminal. November 24.
Interstate Technology and Regulatory Council (ITRC). 2009. Evaluating LNAPL Remedial Technologies for Achieving Project Goals. December. http://www.itrcweb.org. Accessed March 2015.

TABLE E‐1
Parameters for Calculation of LNAPL Transmissivity in Vicinity of Barrier Wall
Kinder Morgan Liquids Terminals, Linnton Terminal
Parameter Value Source ReferenceNAPL extraction rate (combined
from all extraction wells)
Combined rate from all extraction
wellsData from Oil‐water separator
NAPL extraction rate (combined
from all extraction wells)
Combined rate from all extraction
wellsCalculated from totalizer readings
Hydraulic Conductivity (K in ft/dy) 22 Average hydraulic conductivity [1]
Saturated Thickness (b in ft) 15Average saturated thickness from Step Test Memo
[1]LNAPL‐to‐water density ratio (ρr) 0.85 [2]
S skim 0.2 [2]
S w 2 [2]
References:
[2] ASTM, 2012. E2856 – Standard Guide for Estimation of LNAPL Transmissivity . January.
[1] Step Drawdown Testing Results are presented in Appendix C of the Groundwater and Bank Soil Source Control
Evaluation Report, Kinder Morgan Linnton Terminal
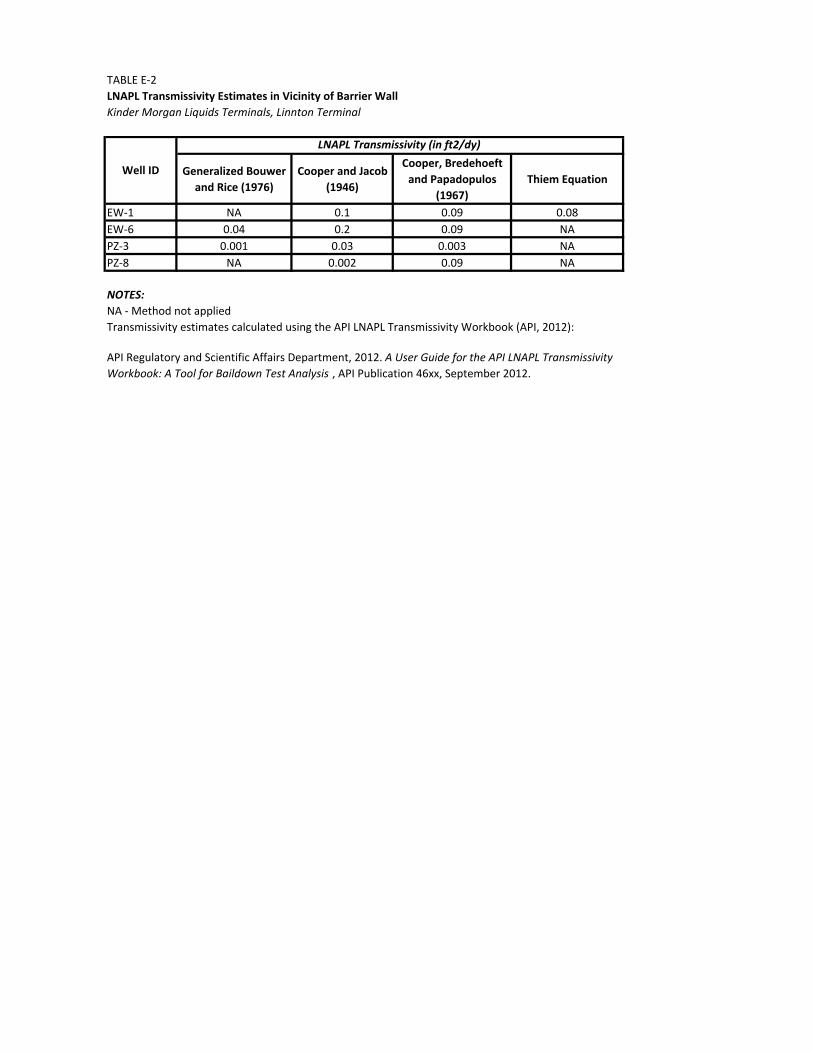
TABLE E‐2
LNAPL Transmissivity Estimates in Vicinity of Barrier Wall
Kinder Morgan Liquids Terminals, Linnton Terminal
Generalized Bouwer
and Rice (1976)
Cooper and Jacob
(1946)
Cooper, Bredehoeft
and Papadopulos
(1967)
Thiem Equation
EW‐1 NA 0.1 0.09 0.08
EW‐6 0.04 0.2 0.09 NA
PZ‐3 0.001 0.03 0.003 NA
PZ‐8 NA 0.002 0.09 NA
NOTES:
NA ‐ Method not applied
Transmissivity estimates calculated using the API LNAPL Transmissivity Workbook (API, 2012):
LNAPL Transmissivity (in ft2/dy)
Well ID
API Regulatory and Scientific Affairs Department, 2012. A User Guide for the API LNAPL Transmissivity
Workbook: A Tool for Baildown Test Analysis , API Publication 46xx, September 2012.

FIGURE D-1Site Layout and Interim Action AreaKinder Morgan Liquid Terminals LLCLinnton Terminal11400 NW St. Helens RoadPortland, Oregon
<ACP> \\rosa\Proj\HoneywellInc\326958\GIS\MapFiles\2015\FigureD-1_SiteLayout&IAA_v3.mxd JSAGER 8/21/2015 3:50:38 AM</ACP>
VICINITY MAP
<
< <
<
A
A
A
A
R
R
A
A
A
A
A
AA
A
A
A
A
A
R
A
AR
A
*
*
*
*
**
**
*** *
5
55
**
<
< <
Approximate Location of Historic Trench Systems1Approximate Location of Historic Trench Systems
Former Rail Car Loading Area
S.P.P.L. & Olympic Pipeline Manifold
Former Truck Loading AreaOlympic Pipeline Pump Station
Former Heating Oil Tank
Former Boiler and Pump House
Warehouse A
Office
Warehouse B
Warehouse D
Warehouse C
ElectricalHouse
MaintainenceShop
EW-1
EW-2 EW-3
EW-4
MW-1
MW-10
MW-11
MW-19
MW-20
MW-21
MW-22
MW-27
MW-28
MW-3
MW-4
MW-4B
MW-8MW-8B
MW-9
P-3
P-4
PZ-1
PZ-2
PZ-3
PZ-4
PZ-5
PZ-6PZ-7 PZ-8
PZ-10PZ-9
EW-5EW-6
EW-7
0 16080Feet
LEGENDBarrier WallHistorical Trench SystemApproximate Area Where Sheen was ObservedApproximate Extent of Sand Channel/FillApproximate Extent of LNAPL in Wells (2012 to 2014)Interim Action AreaRailroad
Linnton Terminal Wells< Hydraulic Control Well A Shallow Monitoring Well/Extraction WellA Monitoring Well - ShallowR Monitoring Well - Deep* Piezometer5 3-Foot Diameter Cistern
$
Sources: Esri, HERE,DeLorme, USGS, Intermap,increment P Corp., NRCAN,
Approximate Extent of Paleo Sand Channel
Approximate Extent of Fill for Lower Tank Farm
jsager
Text Box
FIGURE E-1
JSAGER
Text Box
Liquids Terminals, LLC
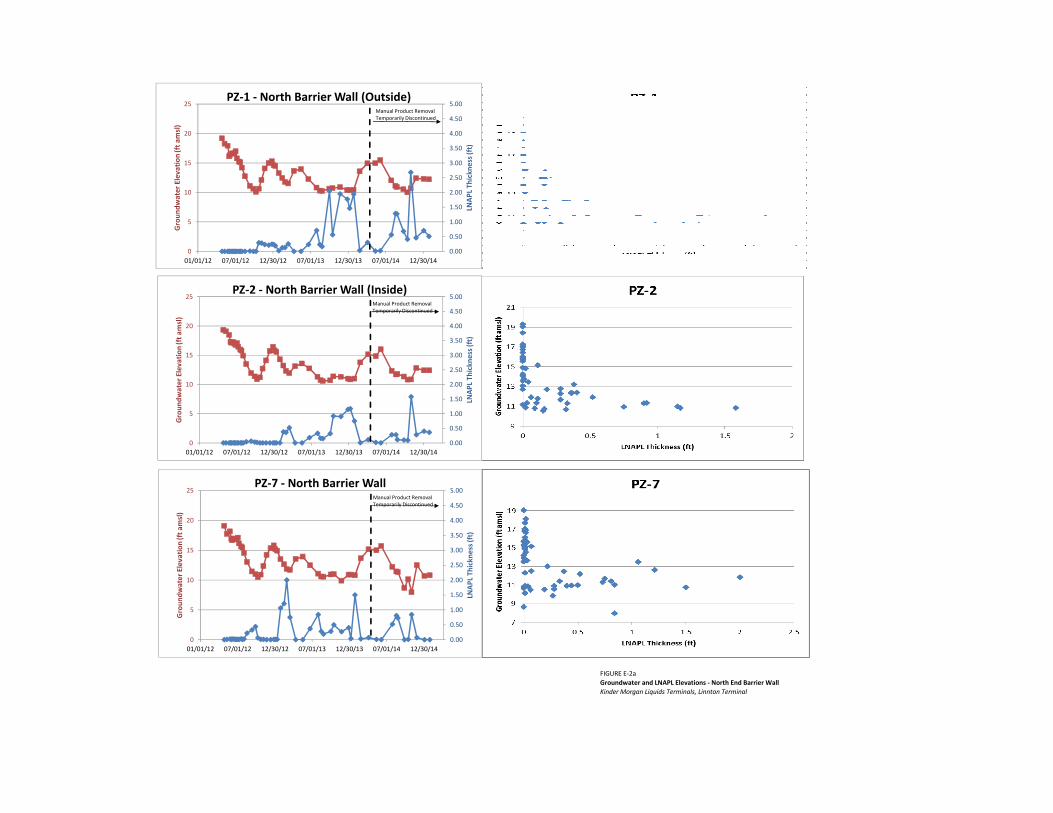
FIGURE E‐2a
Groundwater and LNAPL Elevations ‐ North End Barrier Wall
Kinder Morgan Liquids Terminals, Linnton Terminal
0.00
0.50
1.00
1.50
2.00
2.50
3.00
3.50
4.00
4.50
5.00
0
5
10
15
20
25
01/01/12 07/01/12 12/30/12 07/01/13 12/30/13 07/01/14 12/30/14
LNAPL Th
ickn
ess (ft)
Groundwater Elevation (ft amsl)
PZ‐1 ‐ North Barrier Wall (Outside)Manual Product RemovalTemporarily Discontinued
0.00
0.50
1.00
1.50
2.00
2.50
3.00
3.50
4.00
4.50
5.00
0
5
10
15
20
25
01/01/12 07/01/12 12/30/12 07/01/13 12/30/13 07/01/14 12/30/14
LNAPL Th
ickn
ess (ft)
Groundwater Elevation (ft amsl)
PZ‐2 ‐ North Barrier Wall (Inside)Manual Product RemovalTemporarily Discontinued
0.00
0.50
1.00
1.50
2.00
2.50
3.00
3.50
4.00
4.50
5.00
0
5
10
15
20
25
01/01/12 07/01/12 12/30/12 07/01/13 12/30/13 07/01/14 12/30/14
LNAPL Th
ickn
ess (ft)
Groundwater Elevation (ft amsl)
PZ‐7 ‐ North Barrier WallManual Product RemovalTemporarily Discontinued
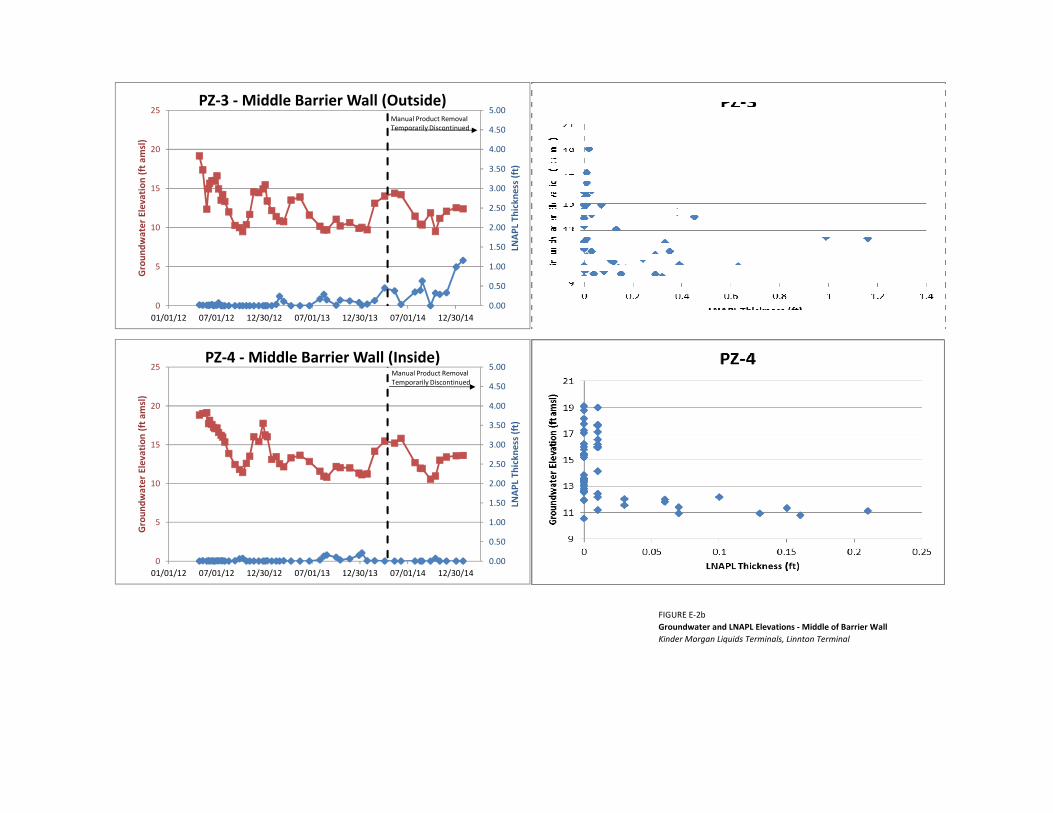
FIGURE E‐2b
Groundwater and LNAPL Elevations ‐ Middle of Barrier Wall
Kinder Morgan Liquids Terminals, Linnton Terminal
0.00
0.50
1.00
1.50
2.00
2.50
3.00
3.50
4.00
4.50
5.00
0
5
10
15
20
25
01/01/12 07/01/12 12/30/12 07/01/13 12/30/13 07/01/14 12/30/14
LNAPL Th
ickn
ess (ft)
Groundwater Elevation (ft amsl)
PZ‐3 ‐Middle Barrier Wall (Outside)Manual Product RemovalTemporarily Discontinued
0.00
0.50
1.00
1.50
2.00
2.50
3.00
3.50
4.00
4.50
5.00
0
5
10
15
20
25
01/01/12 07/01/12 12/30/12 07/01/13 12/30/13 07/01/14 12/30/14
LNAPL Th
ickn
ess (ft)
Groundwater Elevation (ft amsl)
PZ‐4 ‐Middle Barrier Wall (Inside)Manual Product RemovalTemporarily Discontinued

FIGURE E‐2c
Groundwater and LNAPL Elevations ‐ South End Barrier Wall
Kinder Morgan Liquids Terminals, Linnton Terminal
0.00
0.50
1.00
1.50
2.00
2.50
3.00
3.50
4.00
4.50
5.00
0
5
10
15
20
25
01/01/12 07/01/12 12/30/12 07/01/13 12/30/13 07/01/14 12/30/14
LNAPL Th
ickn
ess (ft)
Groundwater Elevation (ft amsl)
PZ‐5 ‐ South Barrier Wall (Outside)Manual Product RemovalTemporarily Discontinued
0.00
0.50
1.00
1.50
2.00
2.50
3.00
3.50
4.00
4.50
5.00
0
5
10
15
20
25
01/01/12 07/01/12 12/30/12 07/01/13 12/30/13 07/01/14 12/30/14
LNAPL Th
ickn
ess (ft)
Groundwater Elevation (ft amsl)
PZ‐8 ‐ South Barrier Wall Manual Product RemovalTemporarily Discontinued
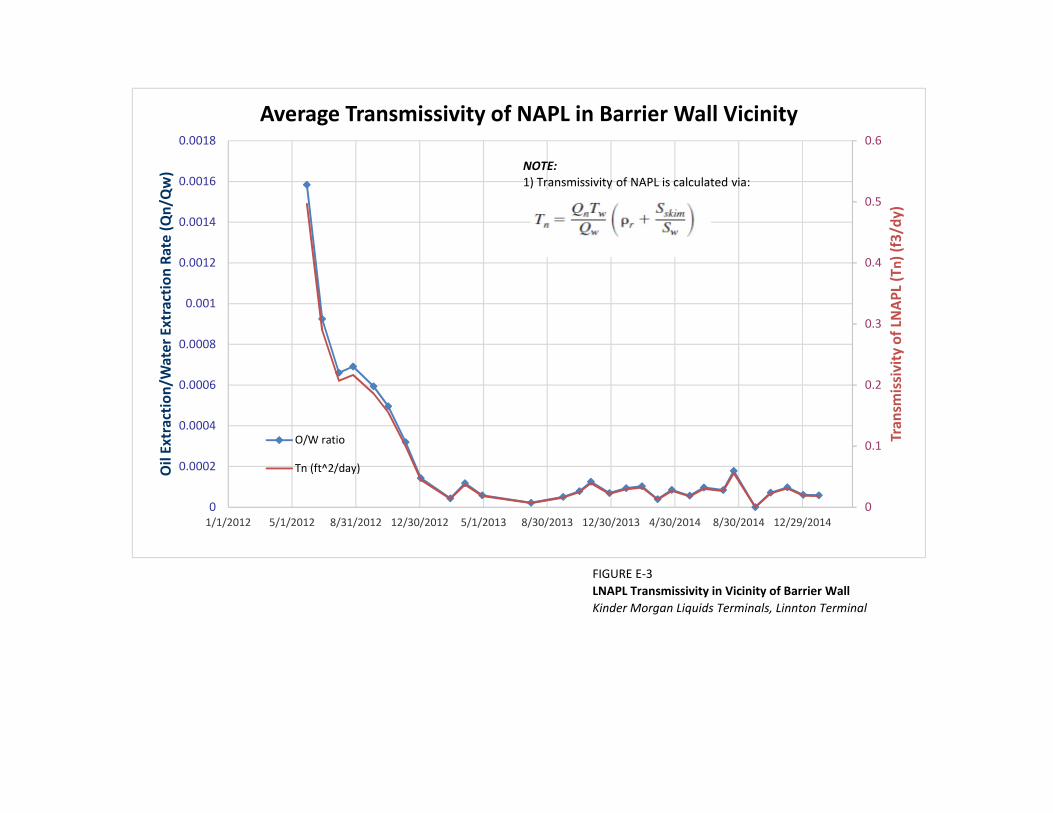
FIGURE E‐3
LNAPL Transmissivity in Vicinity of Barrier Wall
Kinder Morgan Liquids Terminals, Linnton Terminal
0
0.1
0.2
0.3
0.4
0.5
0.6
0
0.0002
0.0004
0.0006
0.0008
0.001
0.0012
0.0014
0.0016
0.0018
1/1/2012 5/1/2012 8/31/2012 12/30/2012 5/1/2013 8/30/2013 12/30/2013 4/30/2014 8/30/2014 12/29/2014
Tran
smissivity of LN
APL (Tn) (f3/dy)
Oil Extraction/W
ater Extraction Rate (Qn/Q
w)
Average Transmissivity of NAPL in Barrier Wall Vicinity
O/W ratio
Tn (ft^2/day)
NOTE: 1) Transmissivity of NAPL is calculated via:
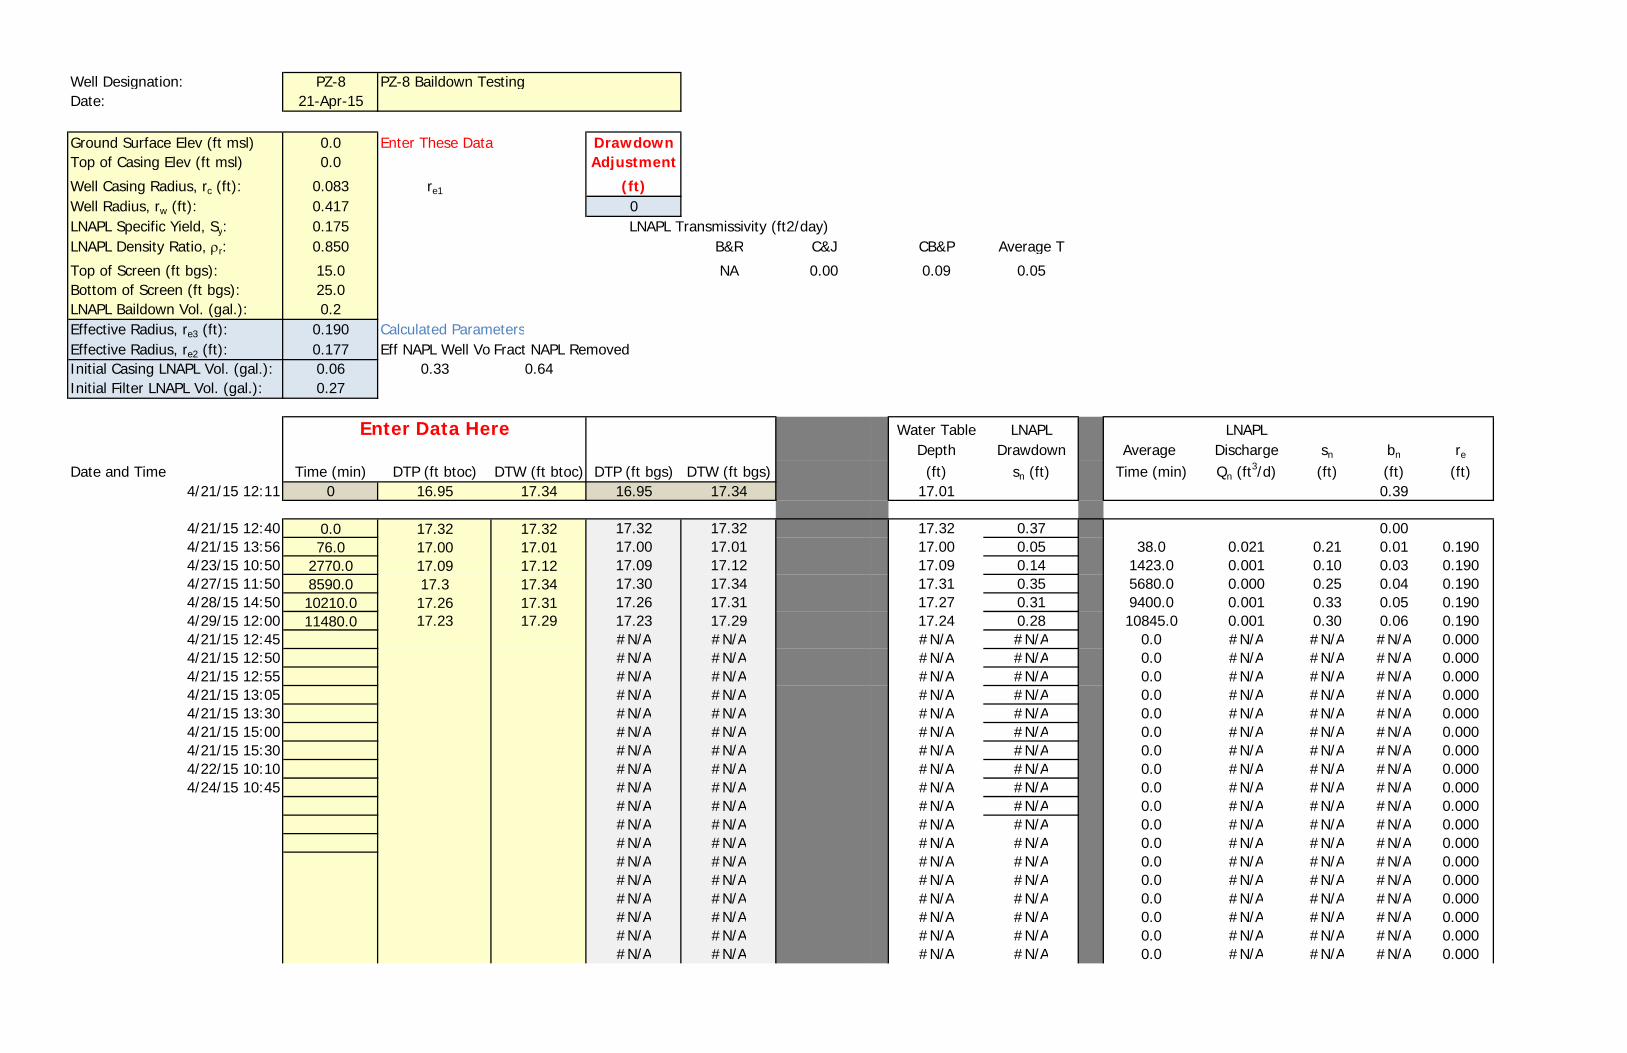
Well Designation: PZ-8 PZ-8 Baildown TestingDate: 21-Apr-15
Ground Surface Elev (ft msl) 0.0 Enter These Data DrawdownTop of Casing Elev (ft msl) 0.0 Adjustment
Well Casing Radius, rc (ft): 0.083 re1 (ft)Well Radius, rw (ft): 0.417 0LNAPL Specific Yield, Sy: 0.175 LNAPL Transmissivity (ft2/day)LNAPL Density Ratio, r: 0.850 B&R C&J CB&P Average T
Top of Screen (ft bgs): 15.0 NA 0.00 0.09 0.05Bottom of Screen (ft bgs): 25.0LNAPL Baildown Vol. (gal.): 0.2Effective Radius, re3 (ft): 0.190 Calculated ParametersEffective Radius, re2 (ft): 0.177 Eff NAPL Well Vo Fract NAPL RemovedInitial Casing LNAPL Vol. (gal.): 0.06 0.33 0.64Initial Filter LNAPL Vol. (gal.): 0.27
Enter Data Here Water Table LNAPL LNAPLDepth Drawdown Average Discharge sn bn re
Date and Time Time (min) DTP (ft btoc) DTW (ft btoc) DTP (ft bgs) DTW (ft bgs) (ft) sn (ft) Time (min) Qn (ft3/d) (ft) (ft) (ft)
4/21/15 12:11 0 16.95 17.34 16.95 17.34 17.01 0.39
4/21/15 12:40 0.0 17.32 17.32 17.32 17.32 17.32 0.37 0.004/21/15 13:56 76.0 17.00 17.01 17.00 17.01 17.00 0.05 38.0 0.021 0.21 0.01 0.1904/23/15 10:50 2770.0 17.09 17.12 17.09 17.12 17.09 0.14 1423.0 0.001 0.10 0.03 0.1904/27/15 11:50 8590.0 17.3 17.34 17.30 17.34 17.31 0.35 5680.0 0.000 0.25 0.04 0.1904/28/15 14:50 10210.0 17.26 17.31 17.26 17.31 17.27 0.31 9400.0 0.001 0.33 0.05 0.1904/29/15 12:00 11480.0 17.23 17.29 17.23 17.29 17.24 0.28 10845.0 0.001 0.30 0.06 0.1904/21/15 12:45 #N/A #N/A #N/A #N/A 0.0 #N/A #N/A #N/A 0.0004/21/15 12:50 #N/A #N/A #N/A #N/A 0.0 #N/A #N/A #N/A 0.0004/21/15 12:55 #N/A #N/A #N/A #N/A 0.0 #N/A #N/A #N/A 0.0004/21/15 13:05 #N/A #N/A #N/A #N/A 0.0 #N/A #N/A #N/A 0.0004/21/15 13:30 #N/A #N/A #N/A #N/A 0.0 #N/A #N/A #N/A 0.0004/21/15 15:00 #N/A #N/A #N/A #N/A 0.0 #N/A #N/A #N/A 0.0004/21/15 15:30 #N/A #N/A #N/A #N/A 0.0 #N/A #N/A #N/A 0.0004/22/15 10:10 #N/A #N/A #N/A #N/A 0.0 #N/A #N/A #N/A 0.0004/24/15 10:45 #N/A #N/A #N/A #N/A 0.0 #N/A #N/A #N/A 0.000
#N/A #N/A #N/A #N/A 0.0 #N/A #N/A #N/A 0.000#N/A #N/A #N/A #N/A 0.0 #N/A #N/A #N/A 0.000#N/A #N/A #N/A #N/A 0.0 #N/A #N/A #N/A 0.000#N/A #N/A #N/A #N/A 0.0 #N/A #N/A #N/A 0.000#N/A #N/A #N/A #N/A 0.0 #N/A #N/A #N/A 0.000#N/A #N/A #N/A #N/A 0.0 #N/A #N/A #N/A 0.000#N/A #N/A #N/A #N/A 0.0 #N/A #N/A #N/A 0.000#N/A #N/A #N/A #N/A 0.0 #N/A #N/A #N/A 0.000#N/A #N/A #N/A #N/A 0.0 #N/A #N/A #N/A 0.000

Figure 1 Figure 2
Figure 3 Figure 4
Figure 5 Figure 6
Figure 7 Figure 8
15.5
16.0
16.5
17.0
17.5
18.0
18.5
0 2000 4000 6000 8000 10000 12000 14000
Depth (ft)
Time (minutes)
DTW (blue), Water Table (green), DTP (red)
0.0
0.0
0.0
0.0
0.0
0.0
0.0 2000.0 4000.0 6000.0 8000.0 10000.0 12000.0
Discharge (ft3/d)
Time (minutes)
LNAPL Discharge ‐ Time Relation
0.00
0.05
0.10
0.15
0.20
0.25
0.30
0.35
0.0 0.0 0.0 0.0 0.0 0.1LN
APL Drawdown (ft)
LNAPL Discharge (ft3/d)
LNAPL Drawdown ‐ Discharge Relation
15.5
16.0
16.5
17.0
17.5
18.0
18.5
0.0 0.0 0.1 1.0 10.0 100.0 1000.0 10000.0 100000.0
Depth (ft)
Time (minutes)
DTW (blue), Water Table (green), DTP (red)
0.00
0.01
0.02
0.03
0.04
0.05
0.06
0.07
0.0 2000.0 4000.0 6000.0 8000.0 10000.0 12000.0 14000.0
LNAPL Th
ickness bn(ft)
Time (min)
17.00
17.05
17.10
17.15
17.20
17.25
17.30
0.0 0.0 0.0 0.0 0.0 0.0
DTP
(ft bgs)
Discharge (ft3/d)
Depth to Product vs. LNAPL Discharge
17.1
17.1
17.2
17.2
17.3
17.3
17.4
0.0 0.0 0.0 0.0 0.0 0.0
DTW
(ft bgs)
Discharge (ft3/d)
Depth to Water vs. LNAPL Discharge
0.00
0.05
0.10
0.15
0.20
0.25
0.30
0.35
0.40
0.00 0.20 0.40 0.60 0.80 1.00 1.20 1.40 1.60
LNAPL Drawdown sn(ft)
LNAPL Thickness bn (ft)
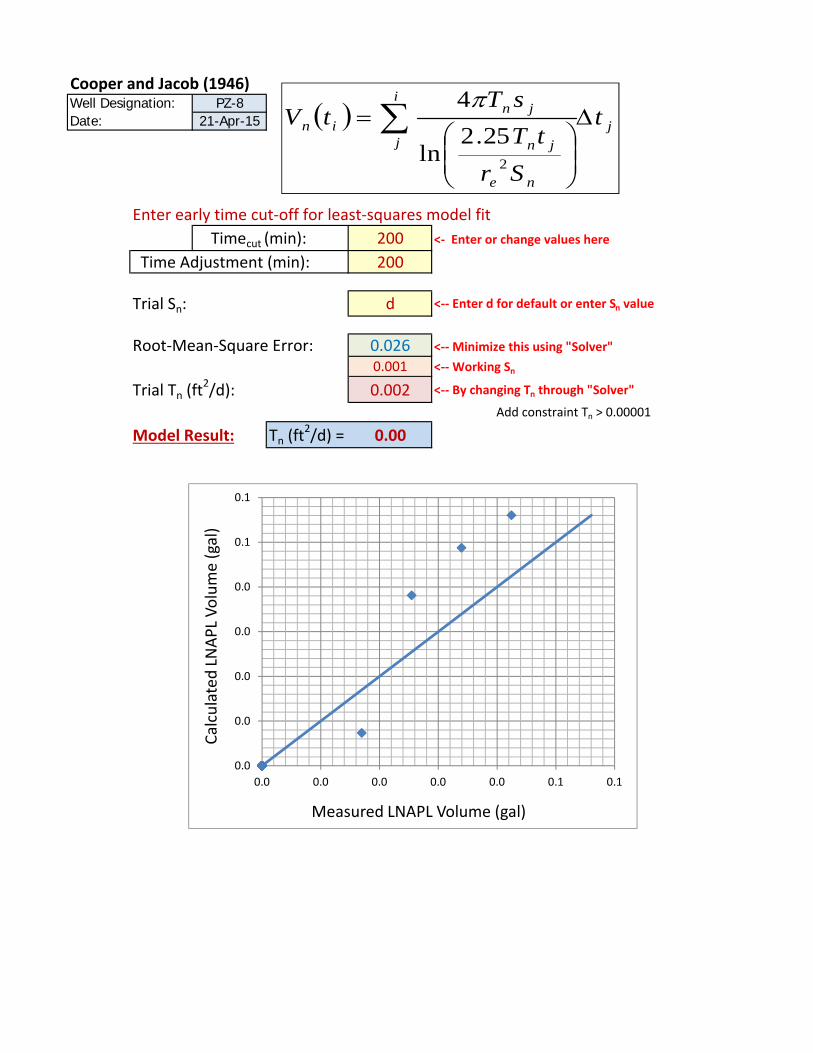
Cooper and Jacob (1946)Well Designation: PZ-8Date: 21-Apr-15
Enter early time cut‐off for least‐squares model fit
Timecut (min): 200 <‐ Enter or change values here
Time Adjustment (min): 200
Trial Sn: d <‐‐ Enter d for default or enter Sn value
Root‐Mean‐Square Error: 0.026 <‐‐ Minimize this using "Solver"
0.001 <‐‐ Working Sn
Trial Tn (ft2/d): 0.002 <‐‐ By changing Tn through "Solver"
Add constraint Tn > 0.00001
Model Result: Tn (ft2/d) = 0.00
0.0
0.0
0.0
0.0
0.0
0.1
0.1
0.0 0.0 0.0 0.0 0.0 0.1 0.1
Calculated LNAPL Volume (gal)
Measured LNAPL Volume (gal)
j
i
j
ne
jn
jnin t
Sr
tT
sTtV
2
25.2ln
4

Cooper, Bredehoeft and Papadopulos (1967)Well Designation: PZ-8Date: 21-Apr-15
Enter early time cut‐off for least‐squares model fit
Timecut (min): 200 <‐ Enter or change values here
Initial Drawdown sn (ft): 0.25
Trial Sn: d <‐‐ Enter d for default
Root‐Mean‐Square Error: 1.818 <‐‐ Minimize this using "Solver"
Trial Tn (ft2/d): 0.090 <‐‐ By changing Tn through "Solver"
0.008 <‐‐ Working Sn Add constraint Tn > 0.00001
Model Result: Tn (ft2/d) = 0.09 Tmin 0.2
Tmax 11000
J‐Ratio
‐0.167
0
0.1
0.2
0.3
0.4
0.5
0.6
0.7
0.8
0.9
1
0.0 2000.0 4000.0 6000.0 8000.0 10000.0 12000.0
s n/s
n0
Time (min)

Well Designation: PZ-3 PZ-3 Baildown TestingDate: 21-Apr-15
Ground Surface Elev (ft msl) 0.0 Enter These Data DrawdownTop of Casing Elev (ft msl) 0.0 Adjustment
Well Casing Radius, rc (ft): 0.083 re1 (ft)Well Radius, rw (ft): 0.417 0LNAPL Specific Yield, Sy: 0.175 LNAPL Transmissivity (ft2/day)LNAPL Density Ratio, r: 0.909 B&R C&J CB&P Average T
Top of Screen (ft bgs): 15.0 0.00 0.03 0.00 0.01Bottom of Screen (ft bgs): 25.0LNAPL Baildown Vol. (gal.): 1.1Effective Radius, re3 (ft): 0.190 Calculated ParametersEffective Radius, re2 (ft): 0.098 Eff NAPL Well Vo Fract NAPL RemovedInitial Casing LNAPL Vol. (gal.): 0.21 1.11 1.02Initial Filter LNAPL Vol. (gal.): 0.90
Enter Data Here Water Table LNAPL LNAPLDepth Drawdown Average Discharge sn bn re
Date and Time Time (min) DTP (ft btoc) DTW (ft btoc) DTP (ft bgs) DTW (ft bgs) (ft) sn (ft) Time (min) Qn (ft3/d) (ft) (ft) (ft)
4/21/15 9:30 0 16.17 17.48 16.17 17.48 16.29 1.31
4/21/15 10:10 0.0 18.00 18.00 18.00 18.00 18.00 1.83 0.004/21/15 10:40 30.0 16.79 16.80 16.79 16.80 16.79 0.62 15.0 0.054 1.23 0.01 0.1904/21/15 11:00 50.0 16.67 16.70 16.67 16.70 16.67 0.50 40.0 0.163 0.56 0.03 0.1904/21/15 12:00 110.0 16.53 16.66 16.53 16.66 16.54 0.36 80.0 0.272 0.43 0.13 0.1904/21/15 13:00 170.0 16.41 16.61 16.41 16.61 16.43 0.24 140.0 0.191 0.30 0.20 0.1904/21/15 13:58 228.0 16.52 16.73 16.52 16.73 16.54 0.10 199.0 0.028 0.17 0.21 0.1904/21/15 15:00 290.0 16.57 16.81 16.57 16.81 16.59 0.10 259.0 0.079 0.10 0.24 0.1904/21/15 15:35 325.0 16.58 16.87 16.58 16.87 16.61 0.09 307.5 0.233 0.10 0.29 0.1904/23/15 10:50 2920.0 16.68 17.05 16.68 17.05 16.71 0.09 1622.5 0.005 0.09 0.37 0.1904/24/15 10:45 4355.0 16.83 17.22 16.83 17.22 16.87 0.08 3637.5 0.002 0.08 0.39 0.1904/28/15 14:50 10360.0 17.34 17.80 17.34 17.80 17.38 0.08 7357.5 0.002 0.08 0.46 0.190
42123.5 11630.0 17.55 18.09 17.55 18.09 17.60 0.07 10995.0 0.010 0.07 0.54 0.1904/21/15 10:15 #N/A #N/A #N/A #N/A 0.0 #N/A #N/A #N/A 0.0004/21/15 10:20 #N/A #N/A #N/A #N/A 0.0 #N/A #N/A #N/A 0.000

Figure 1 Figure 2
Figure 3 Figure 4
Figure 5 Figure 6
Figure 7 Figure 8
Figure 9 Figure 10
0.0
2.0
4.0
6.0
8.0
10.0
12.0
14.0
16.0
18.0
20.0
0 2000 4000 6000 8000 10000 12000 14000
Depth (ft)
Time (minutes)
DTW (blue), Water Table (green), DTP (red)
0.0
0.1
0.1
0.2
0.2
0.3
0.3
0.0 2000.0 4000.0 6000.0 8000.0 10000.0 12000.0
Discharge (ft3/d)
Time (minutes)
LNAPL Discharge ‐ Time Relation
0.00
0.20
0.40
0.60
0.80
1.00
1.20
1.40
1.60
1.80
2.00
0.0 2000.0 4000.0 6000.0 8000.0 10000.0 12000.0 14000.0
LNAPL Drawdown (ft)
Time (minutes)
LNAPL Drawdown ‐ Time Relation
0.00
0.20
0.40
0.60
0.80
1.00
1.20
1.40
0.0 0.1 0.1 0.2 0.2 0.3 0.3 0.4LN
APL Drawdown (ft)
LNAPL Discharge (ft3/d)
LNAPL Drawdown ‐ Discharge Relation
0.0
2.0
4.0
6.0
8.0
10.0
12.0
14.0
16.0
18.0
20.0
0.0 0.0 0.1 1.0 10.0 100.0 1000.0 10000.0 100000.0
Depth (ft)
Time (minutes)
DTW (blue), Water Table (green), DTP (red)
0.00
0.10
0.20
0.30
0.40
0.50
0.60
0.0 2000.0 4000.0 6000.0 8000.0 10000.0 12000.0 14000.0
LNAPL Th
ickn
ess b
n(ft)
Time (min)
16.40
16.60
16.80
17.00
17.20
17.40
17.60
0.0 0.1 0.1 0.2 0.2 0.3 0.3
DTP
(ft bgs)
Discharge (ft3/d)
Depth to Product vs. LNAPL Discharge
16.4
16.6
16.8
17.0
17.2
17.4
17.6
17.8
18.0
18.2
0.0 0.1 0.1 0.2 0.2 0.3 0.3
DTW
(ft bgs)
Discharge (ft3/d)
Depth to Water vs. LNAPL Discharge
0.0
0.1
0.1
0.2
0.2
0.3
0.3
0.4
0.4
0.5
0.5
0.0 2000.0 4000.0 6000.0 8000.0 10000.0 12000.0 14000.0
LNAPL Well Inflow Volume (gal)
Time (min)
0.00
0.20
0.40
0.60
0.80
1.00
1.20
1.40
1.60
1.80
2.00
0.00 0.10 0.20 0.30 0.40 0.50 0.60
LNAPL Drawdown sn(ft)
LNAPL Thickness bn (ft)
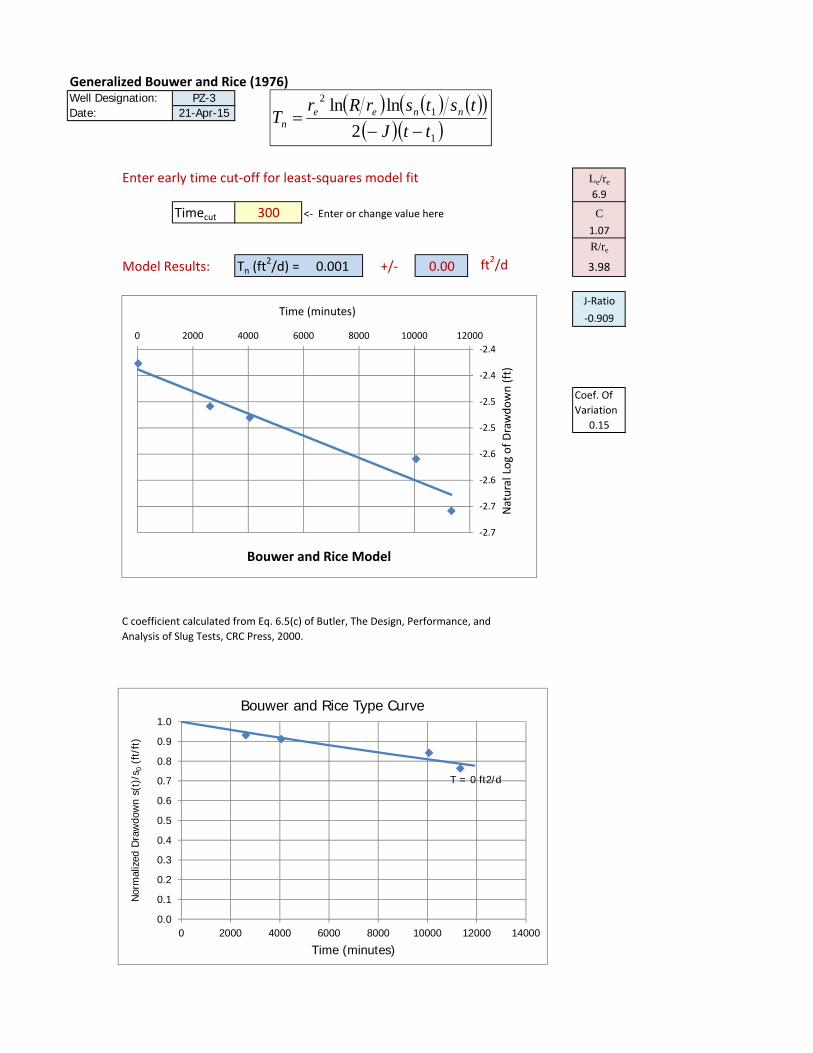
Generalized Bouwer and Rice (1976)Well Designation: PZ-3Date: 21-Apr-15
Enter early time cut‐off for least‐squares model fit Le/re
6.9
Timecut 300 <‐ Enter or change value here C
1.07
R/re
Model Results: Tn (ft2/d) = 0.001 +/‐ 0.00 ft2/d 3.98
J‐Ratio
‐0.909
Coef. Of
Variation
0.15
C coefficient calculated from Eq. 6.5(c) of Butler, The Design, Performance, and
Analysis of Slug Tests, CRC Press, 2000.
‐2.7
‐2.7
‐2.6
‐2.6
‐2.5
‐2.5
‐2.4
‐2.4
0 2000 4000 6000 8000 10000 12000
Natural Log of Drawdown (ft)
Time (minutes)
Bouwer and Rice Model
T = 0 ft2/d
0.0
0.1
0.2
0.3
0.4
0.5
0.6
0.7
0.8
0.9
1.0
0 2000 4000 6000 8000 10000 12000 14000
Nor
mal
ized
Dra
wdo
wn
s(t)
/s0
(ft/
ft)
Time (minutes)
Bouwer and Rice Type Curve
1
12
2
lnln
ttJ
tstsrRrT nnee
n

Cooper and Jacob (1946)Well Designation: PZ-3Date: 21-Apr-15
Enter early time cut‐off for least‐squares model fit
Timecut (min): 300 <‐ Enter or change values here
Time Adjustment (min): 300
Trial Sn: d <‐‐ Enter d for default or enter Sn value
Root‐Mean‐Square Error: 0.072 <‐‐ Minimize this using "Solver"
0.004 <‐‐ Working Sn
Trial Tn (ft2/d): 0.030 <‐‐ By changing Tn through "Solver"
Add constraint Tn > 0.00001
Model Result: Tn (ft2/d) = 0.03
0.0
0.1
0.1
0.2
0.2
0.3
0.3
0.0 0.1 0.1 0.2 0.2 0.3 0.3
Calculated LNAPL Volume (gal)
Measured LNAPL Volume (gal)
j
i
j
ne
jn
jnin t
Sr
tT
sTtV
2
25.2ln
4

Cooper, Bredehoeft and Papadopulos (1967)Well Designation: PZ-3Date: 21-Apr-15
Enter early time cut‐off for least‐squares model fit
Timecut (min): 300 <‐ Enter or change values here
Initial Drawdown sn (ft): 0.1
Trial Sn: d <‐‐ Enter d for default
Root‐Mean‐Square Error: 0.102 <‐‐ Minimize this using "Solver"
Trial Tn (ft2/d): 0.003 <‐‐ By changing Tn through "Solver"
0.001 <‐‐ Working Sn Add constraint Tn > 0.00001
Model Result: Tn (ft2/d) = 0.00 Tmin 0.2
Tmax 11000
J‐Ratio
‐0.909
0
0.1
0.2
0.3
0.4
0.5
0.6
0.7
0.8
0.9
1
0.0 2000.0 4000.0 6000.0 8000.0 10000.0 12000.0
s n/s
n0
Time (min)

Figure 1 Figure 2
Figure 3 Figure 4
Figure 5 Figure 6
Figure 7 Figure 8
Figure 9 Figure 10
14.5
15.0
15.5
16.0
16.5
17.0
17.5
18.0
0 1000 2000 3000 4000 5000 6000 7000 8000 9000
Depth (ft)
Time (minutes)
DTW (blue), Water Table (green), DTP (red)
0.0
0.5
1.0
1.5
2.0
2.5
3.0
0.0 1000.0 2000.0 3000.0 4000.0 5000.0 6000.0 7000.0
Discharge (ft3/d)
Time (minutes)
LNAPL Discharge ‐ Time Relation
0.00
0.02
0.04
0.06
0.08
0.10
0.12
0.14
0.16
0.18
0.20
0.0 2000.0 4000.0 6000.0 8000.0 10000.0
LNAPL Drawdown (ft)
Time (minutes)
LNAPL Drawdown ‐ Time Relation
0.00
0.02
0.04
0.06
0.08
0.10
0.12
0.14
0.16
0.18
0.20
0.0 0.5 1.0 1.5 2.0 2.5 3.0LN
APL Drawdown (ft)
LNAPL Discharge (ft3/d)
LNAPL Drawdown ‐ Discharge Relation
14.5
15.0
15.5
16.0
16.5
17.0
17.5
18.0
0.0 0.0 0.1 1.0 10.0 100.0 1000.0 10000.0
Depth (ft)
Time (minutes)
DTW (blue), Water Table (green), DTP (red)
0.00
0.20
0.40
0.60
0.80
1.00
1.20
1.40
1.60
0.0 2000.0 4000.0 6000.0 8000.0 10000.0
LNAPL Th
ickn
ess b
n(ft)
Time (min)
15.00
15.10
15.20
15.30
15.40
15.50
15.60
15.70
0.0 0.5 1.0 1.5 2.0 2.5 3.0
DTP
(ft bgs)
Discharge (ft3/d)
Depth to Product vs. LNAPL Discharge
15.0
15.2
15.4
15.6
15.8
16.0
16.2
16.4
16.6
16.8
0.0 0.5 1.0 1.5 2.0 2.5 3.0
DTW
(ft bgs)
Discharge (ft3/d)
Depth to Water vs. LNAPL Discharge
0.0
0.5
1.0
1.5
2.0
2.5
0.0 2000.0 4000.0 6000.0 8000.0 10000.0
LNAPL Well Inflow Volume (gal)
Time (min)
0.00
0.02
0.04
0.06
0.08
0.10
0.12
0.14
0.16
0.18
0.20
0.00 0.20 0.40 0.60 0.80 1.00 1.20 1.40 1.60
LNAPL Drawdown sn(ft)
LNAPL Thickness bn (ft)
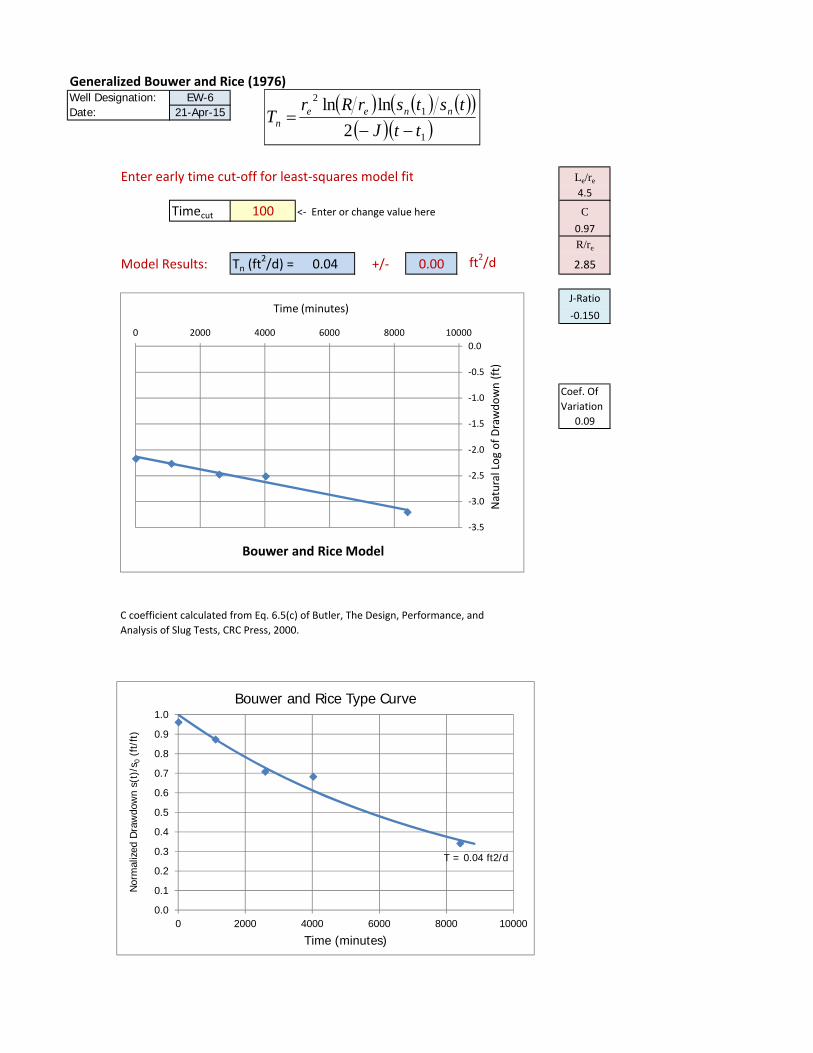
Generalized Bouwer and Rice (1976)Well Designation: EW-6Date: 21-Apr-15
Enter early time cut‐off for least‐squares model fit Le/re
4.5
Timecut 100 <‐ Enter or change value here C
0.97
R/re
Model Results: Tn (ft2/d) = 0.04 +/‐ 0.00 ft
2/d 2.85
J‐Ratio
‐0.150
Coef. Of
Variation
0.09
C coefficient calculated from Eq. 6.5(c) of Butler, The Design, Performance, and
Analysis of Slug Tests, CRC Press, 2000.
‐3.5
‐3.0
‐2.5
‐2.0
‐1.5
‐1.0
‐0.5
0.0
0 2000 4000 6000 8000 10000
Natural Log of Drawdown (ft)
Time (minutes)
Bouwer and Rice Model
T = 0.04 ft2/d
0.0
0.1
0.2
0.3
0.4
0.5
0.6
0.7
0.8
0.9
1.0
0 2000 4000 6000 8000 10000
Nor
mal
ized
Dra
wdo
wn
s(t)
/s0
(ft/
ft)
Time (minutes)
Bouwer and Rice Type Curve
1
12
2
lnln
ttJ
tstsrRrT nnee
n

Cooper and Jacob (1946)Well Designation: EW-6Date: 21-Apr-15
Enter early time cut‐off for least‐squares model fit
Timecut (min): 100 <‐ Enter or change values here
Time Adjustment (min): 100
Trial Sn: d <‐‐ Enter d for default or enter Sn value
Root‐Mean‐Square Error: 1.355 <‐‐ Minimize this using "Solver"
0.011 <‐‐ Working Sn
Trial Tn (ft2/d): 0.200 <‐‐ By changing Tn through "Solver"
Add constraint Tn > 0.00001
Model Result: Tn (ft2/d) = 0.20
Height
70
0.0
0.2
0.4
0.6
0.8
1.0
1.2
1.4
1.6
1.8
2.0
0.0 0.5 1.0 1.5 2.0
Calculated LNAPL Volume (gal)
Measured LNAPL Volume (gal)
j
i
j
ne
jn
jnin t
Sr
tT
sTtV
2
25.2ln
4
‐20
‐10
0
10
20
30
40
50
60
70
80
0 1000 2000 3000 4000 5000 6000 7000
Qn
/sn
(ft
2/d)
Time (min)
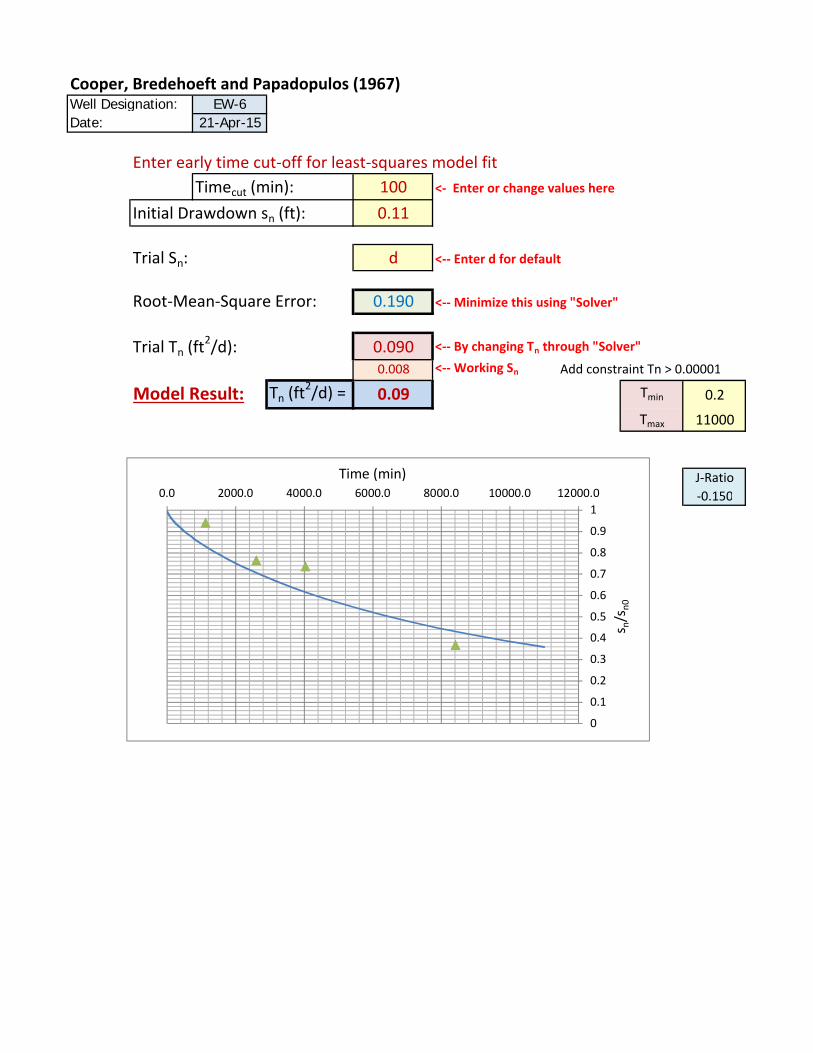
Cooper, Bredehoeft and Papadopulos (1967)Well Designation: EW-6Date: 21-Apr-15
Enter early time cut‐off for least‐squares model fit
Timecut (min): 100 <‐ Enter or change values here
Initial Drawdown sn (ft): 0.11
Trial Sn: d <‐‐ Enter d for default
Root‐Mean‐Square Error: 0.190 <‐‐ Minimize this using "Solver"
Trial Tn (ft2/d): 0.090 <‐‐ By changing Tn through "Solver"
0.008 <‐‐ Working Sn Add constraint Tn > 0.00001
Model Result: Tn (ft2/d) = 0.09 Tmin 0.2
Tmax 11000
J‐Ratio
‐0.150
0
0.1
0.2
0.3
0.4
0.5
0.6
0.7
0.8
0.9
1
0.0 2000.0 4000.0 6000.0 8000.0 10000.0 12000.0
s n/s
n0
Time (min)

Well Designation: EW-6 EW-6 Baildown TestingDate: 21-Apr-15
Ground Surface Elev (ft msl) 0.0 Enter These Data DrawdownTop of Casing Elev (ft msl) 0.0 AdjustmentWell Casing Radius, rc (ft): 0.167 re1 (ft)Well Radius, rw (ft): 0.500 0LNAPL Specific Yield, Sy: 0.175 LNAPL Transmissivity (ft2/day)LNAPL Density Ratio, r: 0.850 B&R C&J CB&P Average T
Top of Screen (ft bgs): 15.0 0.04 0.20 0.09 0.11Bottom of Screen (ft bgs): 30.0LNAPL Baildown Vol. (gal.): 1.6Effective Radius, re3 (ft): 0.258 Calculated ParametersEffective Radius, re2 (ft): 0.247 Eff NAPL Well Vo Fract NAPL RemovedInitial Casing LNAPL Vol. (gal.): 0.79 1.84 0.87Initial Filter LNAPL Vol. (gal.): 1.05
Enter Data Here Water Table LNAPL LNAPLDepth Drawdown Average Discharge sn bn re
Date and Time Time (min) DTP (ft btoc) DTW (ft btoc) DTP (ft bgs) DTW (ft bgs) (ft) sn (ft) Time (min) Qn (ft3/d) (ft) (ft) (ft)
4/21/15 13:10 0 14.94 16.15 14.94 16.15 15.12 1.21
4/21/15 13:55 0.0 15.11 15.11 15.11 15.11 15.11 0.18 0.004/21/15 14:00 5.0 15.10 15.14 15.10 15.14 15.11 0.18 2.5 2.418 0.18 0.04 0.2584/21/15 14:05 10.0 15.09 15.16 15.09 15.16 15.10 0.17 7.5 1.810 0.17 0.07 0.2584/21/15 14:10 15.0 15.09 15.18 15.09 15.18 15.10 0.17 12.5 1.206 0.17 0.09 0.2584/21/15 14:20 25.0 15.10 15.25 15.10 15.25 15.12 0.16 20.0 1.810 0.16 0.15 0.2584/21/15 14:30 35.0 15.10 15.31 15.10 15.31 15.13 0.15 30.0 1.810 0.15 0.21 0.2584/21/15 14:40 45.0 15.11 15.40 15.11 15.40 15.15 0.14 40.0 2.413 0.14 0.29 0.2584/21/15 14:50 55.0 15.12 15.44 15.12 15.44 15.17 0.13 50.0 0.905 0.14 0.32 0.2584/21/15 15:00 65.0 15.12 15.47 15.12 15.47 15.17 0.13 60.0 0.905 0.13 0.35 0.2584/21/15 15:30 95.0 15.13 15.54 15.13 15.54 15.19 0.12 80.0 0.603 0.12 0.41 0.2584/21/15 15:45 110.0 15.14 15.59 15.14 15.59 15.21 0.11 102.5 0.804 0.12 0.45 0.2584/22/15 10:10 1215.0 15.08 15.60 15.08 15.60 15.16 0.10 662.5 0.019 0.11 0.52 0.2584/23/15 10:50 2695.0 15.23 15.88 15.23 15.88 15.33 0.08 1955.0 0.026 0.09 0.65 0.2584/24/15 10:45 4130.0 15.33 16.00 15.33 16.00 15.43 0.08 3412.5 0.004 0.08 0.67 0.2584/27/15 11:50 8515.0 15.95 17.39 15.95 17.39 16.17 0.04 6322.5 0.053 0.06 1.44 0.258

Well Designation: EW-1 EW-1 Baildown TestingDate: 21-Apr-15
Ground Surface Elev (ft msl) 0.0 Enter These Data DrawdownTop of Casing Elev (ft msl) 0.0 Adjustment
Well Casing Radius, rc (ft): 0.250 re1 (ft)Well Radius, rw (ft): 0.500 0LNAPL Specific Yield, Sy: 0.175 LNAPL Transmissivity (ft2/day)LNAPL Density Ratio, r: 0.909 B&R C&J CB&P Average T
Top of Screen (ft bgs): 16.0 NA 0.10 0.09 0.10Bottom of Screen (ft bgs): 31.0LNAPL Baildown Vol. (gal.): 2.3Effective Radius, re3 (ft): 0.309 Calculated ParametersEffective Radius, re2 (ft): 0.304 Eff NAPL Well Vo Fract NAPL RemovedInitial Casing LNAPL Vol. (gal.): 2.47 1.23 1.86Initial Filter LNAPL Vol. (gal.): -1.23
Enter Data Here Water Table LNAPL LNAPLDepth Drawdown Average Discharge sn bn re
Date and Time Time (min) DTP (ft btoc) DTW (ft btoc) DTP (ft bgs) DTW (ft bgs) (ft) sn (ft) Time (min) Qn (ft3/d) (ft) (ft) (ft)
4/21/15 10:32 12.72 14.4 12.72 14.4 12.87 1.68
4/21/15 11:35 0.1 12.96 12.96 12.96 12.96 12.96 0.24 0.004/21/15 15:40 245.0 13.00 13.02 13.00 13.02 13.00 0.28 122.6 0.023 0.26 0.02 0.2504/22/15 10:10 1355.0 12.88 13.01 12.88 13.01 12.89 0.16 800.0 0.028 0.22 0.13 0.2504/23/15 10:50 2835.0 12.91 13.34 12.91 13.34 12.95 0.19 2095.0 0.057 0.18 0.43 0.2504/24/15 10:45 4270.0 12.94 13.81 12.94 13.81 13.02 0.22 3552.5 0.087 0.20 0.87 0.2504/27/15 11:50 8655.0 13.14 14.10 13.14 14.10 13.23 0.42 6462.5 0.006 0.32 0.96 0.250
#N/A #N/A #N/A #N/A 0.0 #N/A #N/A #N/A 0.000#N/A #N/A #N/A #N/A 0.0 #N/A #N/A #N/A 0.000
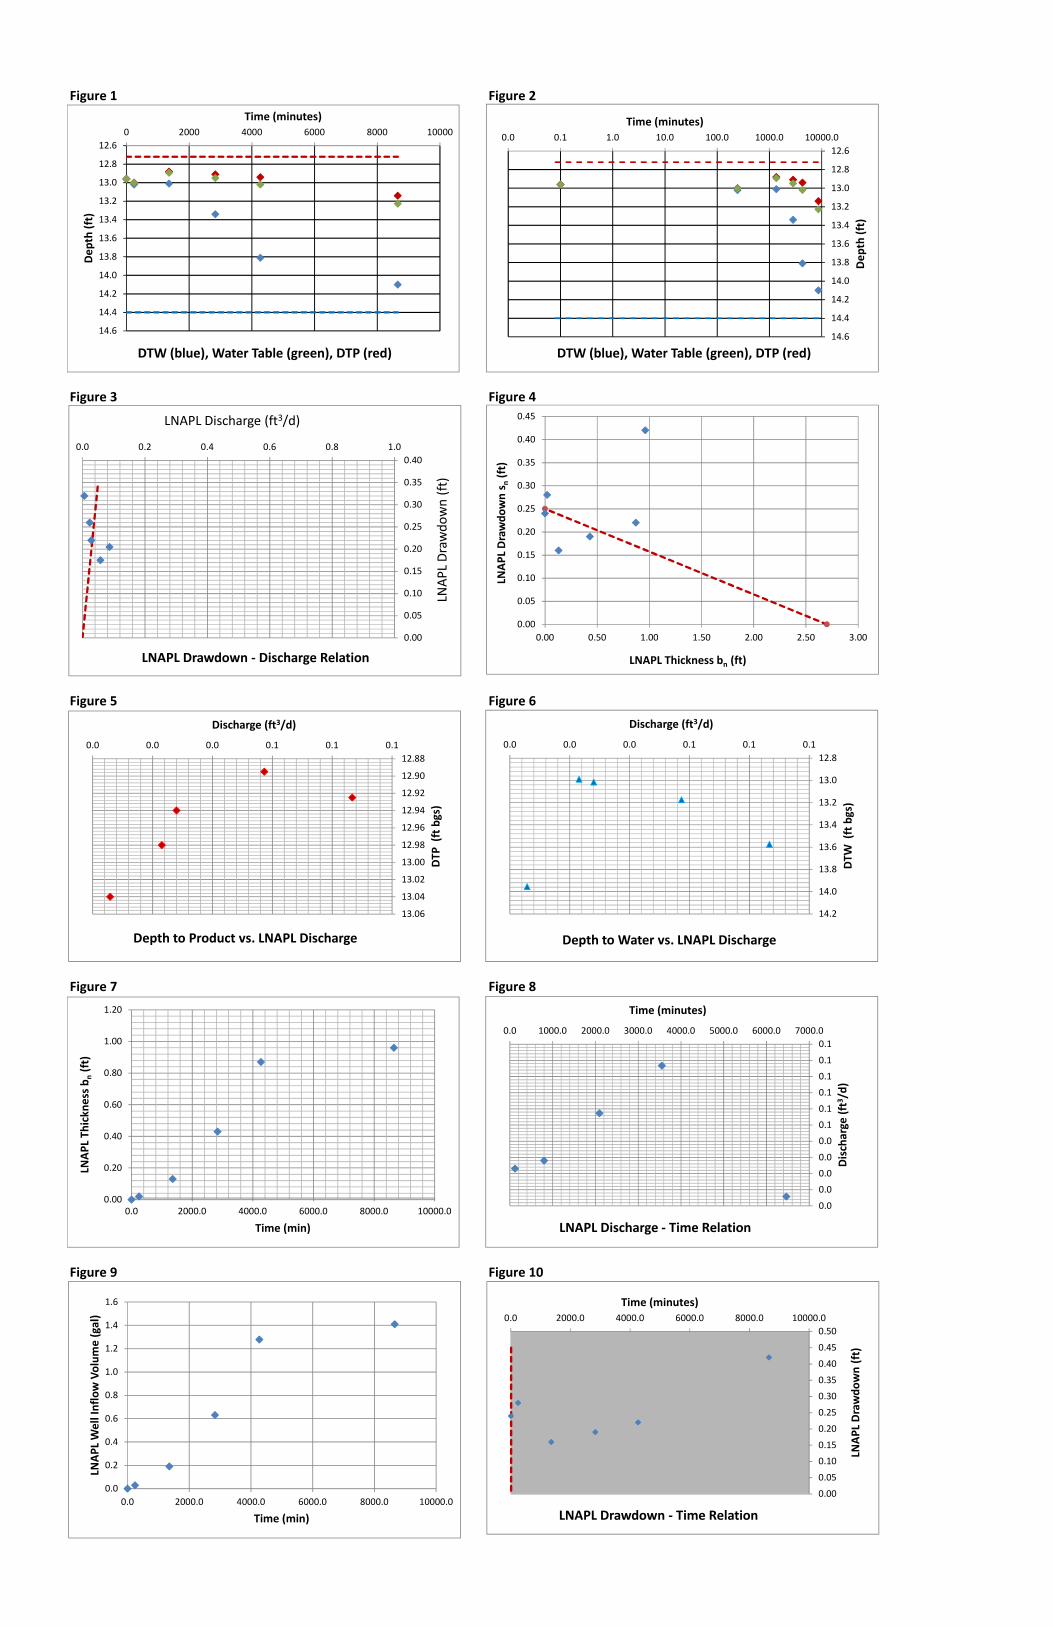
Figure 1 Figure 2
Figure 3 Figure 4
Figure 5 Figure 6
Figure 7 Figure 8
Figure 9 Figure 10
12.6
12.8
13.0
13.2
13.4
13.6
13.8
14.0
14.2
14.4
14.6
0 2000 4000 6000 8000 10000
Depth (ft)
Time (minutes)
DTW (blue), Water Table (green), DTP (red)
0.0
0.0
0.0
0.0
0.0
0.1
0.1
0.1
0.1
0.1
0.1
0.0 1000.0 2000.0 3000.0 4000.0 5000.0 6000.0 7000.0
Discharge (ft3/d)
Time (minutes)
LNAPL Discharge ‐ Time Relation
0.00
0.05
0.10
0.15
0.20
0.25
0.30
0.35
0.40
0.45
0.50
0.0 2000.0 4000.0 6000.0 8000.0 10000.0
LNAPL Drawdown (ft)
Time (minutes)
LNAPL Drawdown ‐ Time Relation
0.00
0.05
0.10
0.15
0.20
0.25
0.30
0.35
0.40
0.0 0.2 0.4 0.6 0.8 1.0LN
APL Drawdown (ft)
LNAPL Discharge (ft3/d)
LNAPL Drawdown ‐ Discharge Relation
12.6
12.8
13.0
13.2
13.4
13.6
13.8
14.0
14.2
14.4
14.6
0.0 0.1 1.0 10.0 100.0 1000.0 10000.0
Depth (ft)
Time (minutes)
DTW (blue), Water Table (green), DTP (red)
0.00
0.20
0.40
0.60
0.80
1.00
1.20
0.0 2000.0 4000.0 6000.0 8000.0 10000.0
LNAPL Th
ickn
ess b
n(ft)
Time (min)
12.88
12.90
12.92
12.94
12.96
12.98
13.00
13.02
13.04
13.06
0.0 0.0 0.0 0.1 0.1 0.1
DTP
(ft bgs)
Discharge (ft3/d)
Depth to Product vs. LNAPL Discharge
12.8
13.0
13.2
13.4
13.6
13.8
14.0
14.2
0.0 0.0 0.0 0.1 0.1 0.1
DTW
(ft bgs)
Discharge (ft3/d)
Depth to Water vs. LNAPL Discharge
0.0
0.2
0.4
0.6
0.8
1.0
1.2
1.4
1.6
0.0 2000.0 4000.0 6000.0 8000.0 10000.0
LNAPL Well Inflow Volume (gal)
Time (min)
0.00
0.05
0.10
0.15
0.20
0.25
0.30
0.35
0.40
0.45
0.00 0.50 1.00 1.50 2.00 2.50 3.00
LNAPL Drawdown sn(ft)
LNAPL Thickness bn (ft)

Cooper and Jacob (1946)Well Designation: EW-1Date: 21-Apr-15
Enter early time cut‐off for least‐squares model fit
Timecut (min): 200 <‐ Enter or change values here
Time Adjustment (min): 200
Trial Sn: d <‐‐ Enter d for default or enter Sn value
Root‐Mean‐Square Error: 0.796 <‐‐ Minimize this using "Solver"
0.008 <‐‐ Working Sn
Trial Tn (ft2/d): 0.100 <‐‐ By changing Tn through "Solver"
Add constraint Tn > 0.00001
Model Result: Tn (ft2/d) = 0.10
0.0
0.5
1.0
1.5
2.0
2.5
0.0 0.5 1.0 1.5 2.0 2.5
Calculated LNAPL Volume (gal)
Measured LNAPL Volume (gal)
j
i
j
ne
jn
jnin t
Sr
tT
sTtV
2
25.2ln
4
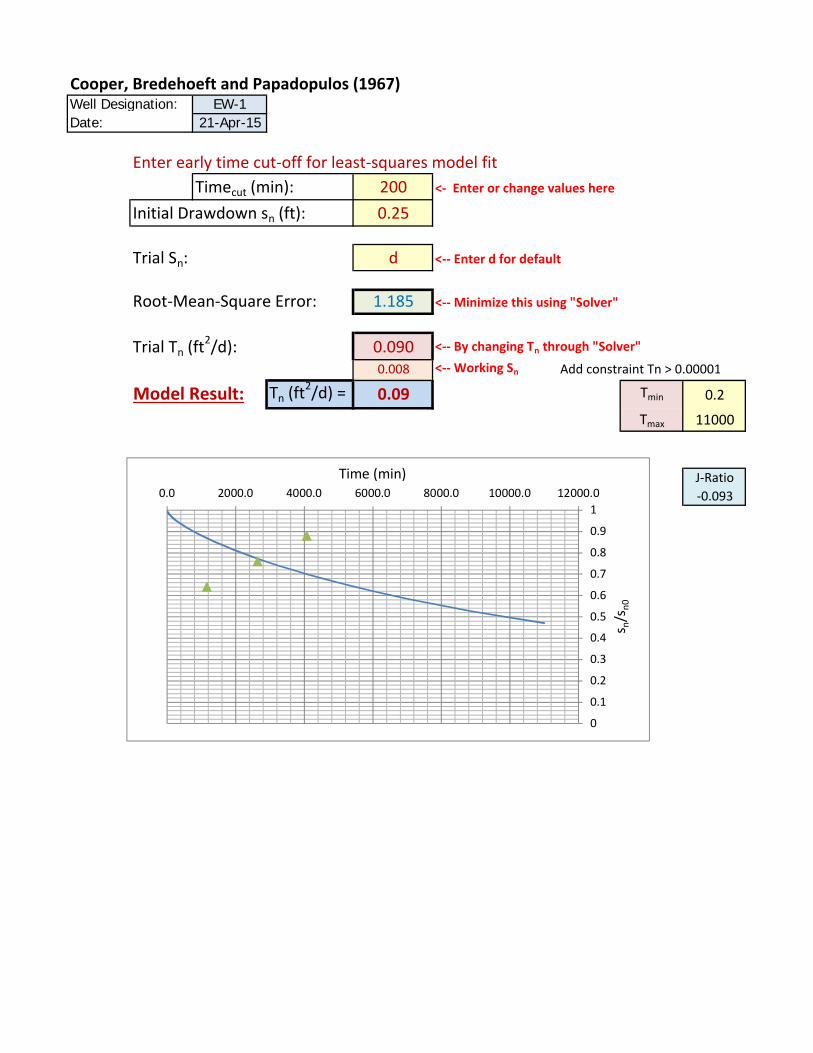
Cooper, Bredehoeft and Papadopulos (1967)Well Designation: EW-1Date: 21-Apr-15
Enter early time cut‐off for least‐squares model fit
Timecut (min): 200 <‐ Enter or change values here
Initial Drawdown sn (ft): 0.25
Trial Sn: d <‐‐ Enter d for default
Root‐Mean‐Square Error: 1.185 <‐‐ Minimize this using "Solver"
Trial Tn (ft2/d): 0.090 <‐‐ By changing Tn through "Solver"
0.008 <‐‐ Working Sn Add constraint Tn > 0.00001
Model Result: Tn (ft2/d) = 0.09 Tmin 0.2
Tmax 11000
J‐Ratio
‐0.093
0
0.1
0.2
0.3
0.4
0.5
0.6
0.7
0.8
0.9
1
0.0 2000.0 4000.0 6000.0 8000.0 10000.0 12000.0
s n/s
n0
Time (min)

Thiem Equation: Well Designation: EW-1Date: 21-Apr-15
Depth to base of confining bed (ft bgs) [from boring log]: 14
Constant LNAPL discharge to well (ft3/d): 0.040184
LNAPL drawdown, snW (ft): 0.25
Initial LNAPL thickness, bnR (ft): 1.7
Radius of influence ratio (from Bouwer and Rice), R/rw: 25.0
LNAPL Transmissivity, Tn (ft2/d): 0.08
0.00
0.10
0.20
0.30
0.40
0.50
0.60
0.0 0.1 0.1 0.2 0.2
LNAPL Drawdown (ft)
LNAPL Discharge (ft3/d)
LNAPL Drawdown ‐ Discharge Relation
nWnRr
wnn bb
rRQT
12
lnAverageSn
Related Documents